
Volume 6, Issue 2 (XXX) : April – June 2019 - Advance and ...
250
Advance and Innovative Research International Journal of Volume 6, Issue 2 (XXX) April - June 2019 Indian Academicians and Researchers Association www.iaraedu.com ISSN 2394 - 7780 UGC University Grants Commission Journal No.: 63571 (Special Issue)
-
Upload
khangminh22 -
Category
Documents
-
view
5 -
download
0
Transcript of Volume 6, Issue 2 (XXX) : April – June 2019 - Advance and ...

Advance and Innovative ResearchInternational Journal of
Volume 6, Issue 2 (XXX)April - June 2019
Indian Academicians and Researchers Association
www.iaraedu.com
ISSN 2394 - 7780
UGCUniversity Grants Commission
Journal No.: 63571
(Special Issue)

Special Issue

Guest Editor of Special Issue
Dr. Prannath Dadhich
Associate Professor and Head Department of Civil Engineering
Poornima Institute of Engineering and Technology, Jaipur

International Journal of Advance and Innovative Research Volume 6, Issue 2 ( XXX ): April - June 2019
Editor- In-Chief Dr. Tazyn Rahman
Members of Editorial Advisory Board
Mr. Nakibur Rahman Ex. General Manager ( Project ) Bongaigoan Refinery, IOC Ltd, Assam
Dr. Mukesh Saxena Pro Vice Chancellor, University of Technology and Management, Shillong
Dr. Alka Agarwal Director, Mewar Institute of Management, Ghaziabad
Dr. Archana A. Ghatule Director, SKN Sinhgad Business School, Pandharpur
Prof. (Dr.) Sudhansu Ranjan Mohapatra Dean, Faculty of Law, Sambalpur University, Sambalpur
Prof. (Dr.) Monoj Kumar Chowdhury Professor, Department of Business Administration, Guahati University, Guwahati
Dr. P. Malyadri Principal, Government Degree College, Hyderabad
Prof. (Dr.) Baljeet Singh Hothi Professor, Gitarattan International Business School, Delhi
Prof.(Dr.) Shareef Hoque Professor, North South University, Bangladesh
Prof. (Dr.) Badiuddin Ahmed Professor & Head, Department of Commerce, Maulana Azad Nationl Urdu University, Hyderabad
Prof.(Dr.) Michael J. Riordan Professor, Sanda University, Jiashan, China
Dr. Anindita Sharma Dean & Associate Professor, Jaipuria School of Business, Indirapuram, Ghaziabad
Prof.(Dr.) James Steve Professor, Fresno Pacific University, California, USA
Prof. (Dr.) Jose Vargas Hernandez Research Professor, University of Guadalajara,Jalisco, México
Prof.(Dr.) Chris Wilson Professor, Curtin University, Singapore
Prof. (Dr.) P. Madhu Sudana Rao Professor, Mekelle University, Mekelle, Ethiopia
Prof. (Dr.) Amer A. Taqa Professor, DBS Department, University of Mosul, Iraq
Prof. (Dr.) Himanshu Pandey Professor, Department of Mathematics and Statistics Gorakhpur University, Gorakhpur
Dr. Nurul Fadly Habidin Faculty of Management and Economics, Universiti Pendidikan Sultan Idris, Malaysia
Prof. (Dr.) Agbo Johnson Madaki Faculty, Faculty of Law, Catholic University of Eastern Africa, Nairobi, Kenya
Dr. Neetu Singh HOD, Department of Biotechnology, Mewar Institute, Vasundhara, Ghaziabad
Prof. (Dr.) D. Durga Bhavani Professor, CVR College of Engineering, Hyderabad, Telangana

Prof. (Dr.) Shashi Singhal Professor, Amity University, Jaipur
Prof. (Dr.) Aradhna Yadav Professor, Krupanidhi School of Management, Bengaluru
Prof. (Dr.) Alireza Heidari Professor, Faculty of Chemistry, California South University, California, USA
Prof.(Dr.) Robert Allen Professor Carnegie Mellon University, Australia
Prof. (Dr.) A. Mahadevan Professor S. G. School of Business Management, Salem
Prof. (Dr.) S. Nallusamy Professor & Dean, Dr. M.G.R. Educational & Research Institute,Chennai
Prof. (Dr.) Hemant Sharma Professor, Amity University, Haryana
Prof. (Dr.) Ravi Kumar Bommisetti Professor, Amrita Sai Institute of Science & Technology, Paritala
Dr. C. Shalini Kumar Principal, Vidhya Sagar Women’s College, Chengalpet
Dr. Syed Mehartaj Begum Professor, Hamdard University, New Delhi
Prof. (Dr.) Badar Alam Iqbal Adjunct Professor, Monarch University, Switzerland
Dr. Darshana Narayanan Head of Research, Pymetrics, New York, USA
Prof.(Dr.) D. Madan Mohan Professor, Indur PG College of MBA, Bodhan, Nizamabad
Dr. Rosemary Ekechukwu Associate Dean, University of Port Harcourt, Nigeria
Dr. Sandeep Kumar Sahratia Professor Sreyas Institute of Engineering & Technology
Dr. P.V. Praveen Sundar Director, Shanmuga Industries Arts and Science College
Dr. S. Balamurugan Director - Research & Development, Mindnotix Technologies, Coimbatore
Dr. Manoj P. K. Associate Professor, Cochin University of Science and Technology
Dr. Dhananjay Prabhakar Awasarikar Associate Professor, Suryadutta Institute, Pune
Dr. Indu Santosh Associate Professor, Dr. C. V.Raman University, Chhattisgath
Dr. Mohammad Younis Associate Professor, King Abdullah University, Saudi Arabia
Dr. Pranjal Sharma Associate Professor, Department of Management Mile Stone Institute of Higher Management, Ghaziabad
Dr. Kavita Gidwani Associate Professor, Chanakya Technical Campus, Jaipur
Dr. Lalata K Pani Reader, Bhadrak Autonomous College, Bhadrak, Odisha
Dr. Vijit Chaturvedi Associate Professor, Amity University, Noida
Dr. Pradeepta Kishore Sahoo Associate Professor, B.S.A, Institute of Law, Faridabad
Dr. Marwan Mustafa Shammot Associate Professor, King Saud University, Saudi Arabia
Dr. R. Navaneeth Krishnan Associate Professor, Bharathiyan College of Engg & Tech, Puducherry

Dr. Mahendra Daiya Associate Professor, JIET Group of Institutions, Jodhpur
Dr. G. Valarmathi Associate Professor, Vidhya Sagar Women's College, Chengalpet
Dr. Parbin Sultana Associate Professor, University of Science & Technology Meghalaya
Dr. M. I. Qadir Assistant Professor, Bahauddin Zakariya University, Pakistan
Dr. Kalpesh T. Patel Principal (In-charge) Shree G. N. Patel Commerce College, Nanikadi
Dr. Brijesh H. Joshi Principal (In-charge) B. L. Parikh College of BBA, Palanpur
Dr. Juhab Hussain Assistant Professor, King Abdulaziz University, Saudi Arabia
Dr. Namita Dixit Assistant Professor, ITS Institute of Management, Ghaziabad
Dr. V. Tulasi Das Assistant Professor, Acharya Nagarjuna University, Guntur, A.P.
Dr. Nidhi Agrawal Associate Professor, Institute of Technology & Science, Ghaziabad
Dr. Urmila Yadav Assistant Professor, Sharda University, Greater Noida
Dr. Ashutosh Pandey Assistant Professor, Lovely Professional University, Punjab
Dr. M. Kanagarathinam Head, Department of Commerce Nehru Arts and Science College, Coimbatore
Dr. Subha Ganguly Scientist (Food Microbiology) West Bengal University of A. & F Sciences, Kolkata
Dr. V. Ananthaswamy Assistant Professor The Madura College (Autonomous), Madurai
Dr. R. Suresh Assistant Professor, Department of Management Mahatma Gandhi University
Dr. S. R. Boselin Prabhu Assistant Professor, SVS College of Engineering, Coimbatore
Dr. V. Subba Reddy Assistant Professor, RGM Group of Institutions, Kadapa
Dr. A. Anbu Assistant Professor, Achariya College of Education, Puducherry
Dr. R. Jayanthi Assistant Professor, Vidhya Sagar Women's College, Chengalpattu
Dr. C. Sankar Assistant Professor, VLB Janakiammal College of Arts and Science
Dr. Manisha Gupta Assistant Professor, Jagannath International Management School
Copyright @ 2019 Indian Academicians and Researchers Association, Guwahati All rights reserved. No part of this publication may be reproduced or transmitted in any form or by any means, or stored in any retrieval system of any nature without prior written permission. Application for permission for other use of copyright material including permission to reproduce extracts in other published works shall be made to the publishers. Full acknowledgment of author, publishers and source must be given. The views expressed in the articles are those of the contributors and not necessarily of the Editorial Board or the IARA. Although every care has been taken to avoid errors or omissions, this publication is being published on the condition and understanding that information given in this journal is merely for reference and must not be taken as having authority of or binding in any way on the authors, editors and publishers, who do not owe any responsibility for any damage or loss to any person, for the result of any action taken on the basis of this work. All disputes are subject to Guwahati jurisdiction only.

International Journal of Advance and Innovative Research Volume 6, Issue 2 ( XXX ) : April - June 2019
CONTENTS
Research Papers
A CASE STUDY OF PEDESTRIAN-VEHICLE CONFLICT AT MIDBLOCK CROSSWALK IN SRINAGAR, UTTARAKHAND
Shivangni Khandelwal and Apoorv Prasad
1 – 7
USE OF COPPER TAILING TO ENHANCE PROPERTIES OF CONCRETE
Abhishek Garg and Prakash Somani
8 – 12
COMPARATIVE SEISMIC ANALYSIS OF A MULTISTORY BUILDING USING INDIAN CODE, CANADIAN CODE AND JAPANESE CODE
Nida Khanam and Dr. O. P. Chhangani
13 – 20
ALTERNATIVE DAM CONSTRUCTION TECHNIQUE
Prakash Soamni, Yogendra Singh Chouhan, Vishal Verma and Vinay Kumar Bajad
21 – 28
A STUDY ON STREAMBED HYDRAULIC CONDUCTIVITY OF BANAS RIVER, RAJASTHAN
Saurabh Singh, Ashish Kumar Sewaliya, Babita Pandey and Ankit Malav
29 – 35
IMPROVING THE PROPERTIES OF PERVIOUS CONCRETE BY ADDING IRON SLAG AND FLY ASH
Rituraj Singh Rathore, Bhawani Singh Rathore, Jitesh Kumawat and Kuldeep Kumawat
36 – 43
REDUCING GREEN HOUSE GASES FROM AGRICULTURE
Vikas Sharma, Dilip Singh, Kunal Singh Rathore and Hitesh Meena
44 – 49
A REVIEW ON STEEL FIBER REINFORCED CONCRETE
Narendra Kr. Bhadhana, Rafiq Bahleem, Raghav Gupta and Aakash Panwar
50 – 53
USE OF WASTE KOTA STONE & MARBLE SLURRY IN RIGID PAVEMENT
Laxmi Kant Saini, Sudesh Khator, Vikash Sharma and Roshan Saini
54 – 57
RE-EXAMINATION OF WASTEWATER TREATMENT
Nikita Bomb, Javed Ul Islam and Ishfaq Ul Abass
58 – 62
PARTIAL REPLACEMENT OF CEMENT WITH MARBLE SLURRY & SAND WITH GLASS POWDER IN CONCRETE
Laxmi Kant Saini, Md. Zahid Siddiqui and Yogesh Meena
63 – 66
STUDY ON SEISMIC BEHAVIOR OF VERTICAL GEOMETRIC IRREGULAR STRUCTURES AND EVALUATION OF RESPONSE REDUCTION FACTOR
Aniruddha Khot and S. K. Sekar
67 – 72

TRAFFIC SURVEY OF JAIPUR TO ASSESS ROAD CONGESTION
Dr. Prannath Dadhich, Ram Prakash Godara, Pawan Kumar Meena and Pramod Kumar Inaniya
73 – 75
AN EXPERIMENTAL INVESTIGATION ON REPLACEMENT OF COARSE AGGREGATE BY KOTA STONE WASTE IN BITUMINOUS MIX DESIGN
Suresh Soni and Deepak Mathur
76 – 82
INFLUENCE OF THE RECYCLED CONCRETE AGGREGATE FOR SUSTAINABLE BITUMINOUS SURFACING COURSE
Hitesh Sant and Shamal Burman
83 – 89
USE OF KOTA STONE IN MANUFACTURING PAVEMENT TILES
Suresh Soni, Rahul Kumar, Riyazuddin Ansari and Rakesh Kumawat
90 – 93
CASE STUDY OF LAND USE AND LAND COVER MAP OF JAIPUR CITY
Suresh Soni, Anish Kumar, Atul Jain and Amit Choudhary
94 – 101
A STORM WATER FILTRATION SYSTEM
Anurika Mehta, Brahmraj Meena and Jitendra Laxkar
102 – 105
ASSESMENT OF ENCROACHMENT AREA AND WATER QUALITY OF CHANDLAI LAKE
Dr. Prannath Dadhich, Manoj Kumar, Md. Parwez Musharraf and Mayank Agarwal
106 – 108
STRENGTH ASSESMENT & REDUCTION OF AREA AND VOLUME OF STRUCTURAL MEMBER BY USING CFRP
Meenakshi Dixit, Vinay Raj Meena, Vivek Kumar and Dharmendra Kumar
109 – 111
A REVIEW ON BIOMEDICAL WASTE, ITS EFFECTS AND MANAGEMENT
Dr. Anurika Mehta and Sanjay Singh
112 – 116
ANALYZING THE COMBINE EFFECT OF WOLLASTONITE AND GUJCON FIBER ON CONCRETE GRADE M35
Mayur Raj Kumawat and Er. Ramanuj Jaldhari
117-124
EVALUATION PAVEMENT CONSTRUCTION BY REPLACING RAP WITH WASTE POLYMER MODIFIED BITUMEN
Suresh Chand Bairwa , Deepak Mathur and Nikhil kumar Sharma
125 – 131
ANALYZING THE EFFECT OF COMBINATION OF WASTE MARBLE STONE WITH MARBLE DUST IN FLEXIBLE PAVEMENT
Ashish Kumar Meena, Nikhil Kumar Sharma and Deepak Mathur
132 – 137
WASTE PLASTIC FIBER REINFORCED SOIL
Vikas Sharma, Amit Sharma, Ashish Shekhawat and Amit Soni
138 – 149
MANUFACTURING PAVEMENT BRICK FROM SAND AND WASTE PLASTIC
Vikas Sharma, Ankit Kumar, Yogesh Kumar Meena and Vishnu Kumar
150 – 153

SOIL STABILIZATION BY USING WHEAT HUSK ASH AND IRON SLAG
Vinod Kumar Sharma and Vikas Sharma
154 – 160
EXPERIMENTAL STUDIES ON BITUMEN BY ADDING USED ENGINE OIL
Prakash Somani, Kishor Kumar, Devendra Suthar and Kanhaiya Lal Soni
161 – 165
ANALYSIS OF PEDESTRIAN BEHAVIOUR IN URBAN AREAS, JAIPUR
Vikas Sharma, Keshav Gurjar, Kalpana Jareda and Kamlesh Jangid
166 – 169
DEVELOPMENT OF LOW COST FILTER USING HERBAL TECHNIQUE
Musharraf Ali, Naveen Bundela, Manish Parya and Saurbh Singh
170 – 173
UTILIZATION OF HYPO-SLUDGE BY PARTIAL REPLACEMENT OF CEMENT IN CONCRETE
Rituraj Singh Rathore, Nikhil Nawaria, Kunal Singh Sindal and Nanak Chandra
174 – 178
USE OF WASTE GLASS IN CONCRETE
Narendra Kr. Bhadhana, Subham Parmar, Suneel Kumar Sharma and Siddharth Jeph
179 – 182
ANALYSING HIGH RISE BUILDING FRAME WITH DIFFERENT BRACINGS AND COMPARING DEFLECTION
Khushboo Agarwal, Baldev Kumawat, Javed Ul Islam and Ishfaq Ul Abass
183 – 187
CHARACTERIZATION OF SEWAGE & DESIGN OF SEWAGE TREATMENT PLANT
Laxmi Kant Saini, Avinash Agrawal, Apoorva Jain and Ankur Goyal
188 – 191
UTILIZATION OF WASTE PAPER IN SOIL
Laxmi Kant Saini, Naresh Suthar, Mohit Inaniyan and Mohammed Naushad
192 – 195
PARAMETRIC STUDY AND ITS EFFECT ON DESIGN OF METRO VIADUCT FOUNDATION AND PIER
Vijaykumar D. Thombre and Dr. Punitha Kumar.A
196 – 199
SUSTAINABLE USE OF WASTE MATERIALS IN PAVEMENTS– A REVIEW
Sourabh, Piyush Kumawat, Abhijeet Yadav and Pushpendra Chaudhary
200 – 203
QUALITATIVE MEASURE OF TRAFFIC MOVEMENT BY STATISTICAL METHOD
Sitesh Kumar Singh and Dr. Ankit Saraswat
204 – 210
ADVANCEMENT IN STEADY TRAFFIC FLOW IN RURAL AREA BY CONCRETE BLOCK MIXED PLASTIC MATERIAL TO FIX THE POTHOLES
Shamal Burman, Pradyuman Meena, Prakash Meena and Prashant Singh
211 – 214
WATER DESALINATION OF SALINE WATER USING MANUALLY MECHANICALLY POWERED AIR PUMP
Shamal Burman, Sunny Bhatnagar, Shubham Jain and Saurav Kumar
215 – 217
CASE STUDY ON THE WATER QUALITY ASSESSMENT OF JAWAI RIVER, RAJASTHAN
Sandeep Sukhwal, Mohit Agarwal, Mohit Meena and Manish Gautam
218 – 222

A CASE STUDY ON GREY WATER MANAGEMENT IN SHEKHAWATI REGION
Sandeep Kumar Sukhwal, Abdul Hadi Ansari, Afroj Rangrej and Ashish Meena
223 – 225
ANALYSIS OF STRENGTH OF CONCRETE BLOCK BY REPLACING SAND WITH RECYCLED WASTE PLASTIC
Ayush Goyal, Ritak Singh, Khushboo Meena and Komal Chhabbarwal
226 – 229
A REVIEW ON TECHNOLOGIES USED BY NASA TO EXPLORE MARS
Mohit Bajpai, Akash Panwar, Janesh Kumar Chhaniwal and Jatin Tak
230 – 233
LUNG NODULES DETECTION FROM CT SCAN IMAGES
Mohit Bajpai, Akash Panwar, Yashvi Saxena and Vibhuti Gupta
234 – 236

International Journal of Advance and Innovative Research Volume 6, Issue 2 (XXX): April – June, 2019
1
ISSN 2394 - 7780
A CASE STUDY OF PEDESTRIAN-VEHICLE CONFLICT AT MIDBLOCK CROSSWALK IN SRINAGAR, UTTARAKHAND
Shivangni Khandelwal1 and Apoorv Prasad2 M. Tech Student1 and B. Tech Student2, Department of Civil Engineering, National Institute of Technology,
Uttarakhand
ABSTRACT Pedestrians at uncontrolled midblock crossing locations in the mixed traffic conditions face serious threat for conflict with vehicles. Due to increase in motor vehicle growth there is an increase in the regulation of motor vehicles only and the regulation of pedestrian movement is completely neglected. Pedestrian-vehicle conflict is still an open research topic in the traffic safety and planning. This paper deals with the pedestrian-vehicle conflict at midblock crosswalk in Srinagar (Garhwal), Uttarakhand on NH-58 which is a two lane single carriageway road. It is an important route connecting Chota Char Dham including Kedarnath Temple and Badrinath Temple. Buses and Vehicles packed with pilgrims throng the highway during pilgrim season. It doesn’t have proper facilities for pedestrians to walk so pedestrians are forced to use the carriageway for their movement, also there are no proper signage and markings indicating speed limits for vehicles which increases the possibility of conflict when pedestrians cross the road.
The study aims to investigate pedestrian related safety aspects by estimating Post Encroachment Time (PET) and waiting time for pedestrian during crossing. The data collected from videography survey at two locations in Srinagar (Garhwal) are examined.
Index Terms: conflict, pedestrian safety, Post Encroachment Time, mid-block crosswalk etc.
INTRODUCTION Mixed traffic flows are becoming more common in urban areas all over the world, especially in developing countries such as India. In mixed traffic flow, motor vehicles, non-motorized vehicles (such as bicycles and tricycles), and pedestrians share the same facilities (roads and intersections), and therefore vehicle-vehicle conflicts, bicycle-vehicle conflicts, and pedestrian-vehicle conflicts frequently occur. Many papers in the literature have defined traffic conflict. For example, Zheng, Ismail, and Meng (2014) pointed out that almost all operational definitions of traffic conflict can be grouped into two types: those based on evasive actions, and those based on temporal (and/or spatial) proximity. A representative definition of evasive action-based traffic conflict is ‘‘an event involving two or more road users, in which the action of one user causes the other user to make an evasive maneuver to avoid a collision’’ (Parker & Zegeer, 1989). According to the literature, a pedestrian-vehicle conflict occurs if the oncoming vehicle has to brake abruptly, if the vehicle has to swerve to avoid colliding with the pedestrian, or if the pedestrian has to take sudden evasive action, such as jumping back to avoid a collision. This definition is based on evasive actions taken either by the driver or by the pedestrian. A representative definition of proximity-based traffic conflict is ‘‘an observable situation in which two or more road users approach each other in space and time to such an extent that there is a risk of collision if their movements remain unchanged’’ (Amundsen, 1977). This means that the closer the road users are to each other, either in time or in space, the nearer they are to a collision. This is more of a conceptual (theoretical) definition, and it is operational because the time and space parameters are quantitative and can be measured by traffic detectors.
Pedestrian-vehicle conflicts are hard to formulate because of the unpredictable behavior of both drivers and pedestrians which depends on many uncertain factors. Traffic accidents involving pedestrians are a common phenomenon in many cities (Li, 2014). Pedestrians are among the most vulnerable road users (VRUs) because they lack the physical protection to reduce accident consequences (European Conference of Ministers of Transport, 1998).
A number of published studies have dealt with pedestrian-vehicle conflict, but they were limited to studying the factors influencing conflict, such as personal characteristics, traffic conditions, and environmental factors at crosswalks. From the first perspective, personal characteristics like age, gender, and disability have been studied. For example, Liu and Tung (Liu & Tung, 2014) found that elderly pedestrians exposed themselves to higher risk of road crossing than young pedestrians due to their decline in walking ability. Yagil (2000) found that men are less aware than women of their conflicts with vehicles when they cross the street. Tom and Granié (2011) explored gender differences in pedestrian rule compliance both at signalized and unsignalized crossroads. From the second perspective, traffic conditions such as traffic volume and vehicle speed have also

International Journal of Advance and Innovative Research Volume 6, Issue 2 (XXX): April – June, 2019
2
ISSN 2394 - 7780
been studied. For example, Cheng (2013) proposed that higher vehicle volume might lead to more serious pedestrian-vehicle conflict because pedestrians’ waiting time will increase and exceed their tolerance limits; higher vehicle speed resulted in a higher collision probability between pedestrians and vehicles. Cheng also modelled the relationships between pedestrian waiting time and vehicle volume, pedestrian-vehicle conflict time, vehicle speed, traffic delay, and pedestrian volume. Himanen and Kulmala (1988) analyzed 799 events of pedestrian-vehicle conflict; their results indicated that the most important explanatory variables included pedestrian distance from the curb, city size, number of pedestrians simultaneously crossing, vehicle speed, and vehicle platoon size. From the third perspective, environmental factors such as city size, signal settings, road width, and lane definition have also been widely studied. Traffic signals are the most important environmental factor because pedestrians and drivers should obey traffic light restrictions at signalized intersections. At a non-signalized marked crosswalk, pedestrians have the right-of-way according to traffic regulations, and the vehicles should give the right-of-way to the pedestrians. However, the vehicles usually do not give right-of-way to the pedestrians and drivers are not told when to leave the crosswalk (Troutbeck & Brilon, 1997), which makes crossing of a non-signalized intersection more complex. Most of these studies are based on signalized intersections and road sections, and therefore they cannot reflect the complex interpenetration between pedestrians and vehicles and evaluate pedestrian safety at uncontrolled intersections.
PET is the time between the moment that the first road user leaves the potentially occupied conflict zone and the moment the second road user reaches it. Usually, conflicts between pedestrians and vehicles are divided into discrete severity levels according to different thresholds of PET. Higher PET values indicate lower severity. Malkhamah used vehicle deceleration to divide the severity of conflicts into three different levels: serious, slight, and potential conflict (Malkhamah, Tight, & Montgomery, 2005). In addition, for lane-based pedestrian-vehicle conflict, severity is divided into three categories: serious, slight, and potential conflict, according to the PET indicator. Archer (2005) indicated that PET is useful for measuring critical events where crossing trajectories for road users are involved. PET calculation requires capturing a static conflict point rather than a dynamic point. In cases where a driver performs evasive action, the potential conflict point will be dynamic.
This paper quantifies pedestrian-vehicle conflicts over a non-signalized marked crosswalk using the proposed safety indicator, Post encroachment time (PET). Also evaluating the influence of pedestrian waiting time on pedestrian-vehicle conflict.
METHODOLOGY STUDY AREA AND DATA Two non-signalized marked crosswalk area with bidirectional traffic, was chosen as the study area shown in Fig.(1) and Fig.(2). The size of the marked crosswalk area is approximately 7.5m×3m.
This study used camera to record the marked crosswalk area for 120min between 10 a.m. and 12 a.m. on a weekday. Camera was placed on the roof of an office building. There were 890 cars (29.02%), 91 buses (2.97%),1920 motorcycles (62.60%), 56 LCV (1.83%), 666 pedestrians and 30 other types of vehicles (0.98%). Their locations were recorded according to the time tags in the video frames.
Fig 1.The study area (Site-1)

International Journal of Advance and Innovative Research Volume 6, Issue 2 (XXX): April – June, 2019
3
ISSN 2394 - 7780
Fig 2. The study area (Site-2)
Fig 3. Vehicular composition

International Journal of Advance and Innovative Research Volume 6, Issue 2 (XXX): April – June, 2019
4
ISSN 2394 - 7780
DATA EXTRACTION Based on the collected videos, this study identified the movements of vehicles and pedestrians in the video by manual means. The videos were run at a frame rate of 25 fps in Kinovea Software and different parameters were identified
Fig.3 Grid placement in Kinovea software
Waiting time of the pedestrian is defined as the time difference between the arrival time of pedestrians and their departure from the curb of the lane. The average waiting time of individual pedestrians was recorded for entire study hours for the pedestrians of both sides.
For Post encroachment time (PET) calculation, the crossing area including crosswalk and some regions adjacent to the crosswalk was considered as the conflict area. It was divided into conflict zones of square grids of size 2.5 m x 2.5 m and was placed in the video with the help of Kinovea Software (Figure 3).
ESTIMATION OF PET BETWEEN PEDESTRIAN AND VEHICLES At a non-signalized crosswalk, pedestrians have to cross lane by lane without guidance from any special signaling facilities to arrive at the opposite side of the road. Theoretically, for each pedestrian during his/her crossing, the conflict zone is a ‘‘common area used by road-users/vehicles approaching from different trajectories’’ (Archer, 2005). In this zone, the pedestrians are exposed to the risk of oncoming vehicles.
Archer pointed out that PET has good performance in analyzing conflicts during pedestrian street-crossing behavior.
For each pedestrian P = 1, 2, 3,…… N, the time of his/her approach to the conflict zone was recorded as T0 and the time of his/her leaving the conflict zone as T1 (as shown in Fig. 4, where the pedestrian is leaving the conflict zone). Therefore, the time for a pedestrian to cross the conflict zone can be calculated as:
ΔTP = T1 – T0 (1)
For each vehicle, the time of its approach to the conflict zone was recorded as T2 (as illustrated in Fig. 4, where the vehicle is just approaching the conflict zone). Therefore, when a pedestrian approached the conflict zone, the time for the vehicle to reach the conflict zone could be calculated as:
ΔTV = T2 – T0 (2)
Then PET can be calculated as:
PET = ΔTV - ΔTP = T2 - T1 (3)
PET is the time difference between when the pedestrian leaves the conflict zone and when the vehicle approaches the conflict zone.
The PET value can be negative; if a vehicle passes the conflict zone before the pedestrian has finished crossing the lane, ΔTP will be greater than ΔTV. In this situation, the pedestrian has passed the vehicle, but has not yet finished crossing the lane.

International Journal of Advance and Innovative Research Volume 6, Issue 2 (XXX): April – June, 2019
5
ISSN 2394 - 7780
Fig 4.Procedure analysis for PET calculation
To identify traffic conflict severity, threshold values should be established. These values vary across studies (Zheng et al., 2014). In (Ismail, 2010), thresholds values varied from 1.0 s to 5.0 s. Peesapati, Hunter, and Rodgers (2013) tested different thresholds varying from 1.0 s to 10 s and selected 1.0 s as the one that produced the best results. This variation of threshold values may be caused by the heterogeneity imposed by type of road, type of vehicle, involved road users, and weather on traffic conflicts (Svensson, 1998).
In this paper, PET threshold values were 1.0 s and 5.0 s, and descriptions of the different severity levels of pedestrian-vehicle conflict are shown in Table 1.(according to Almodfer et al.)
Table 1 Description for different severity of pedestrian-vehicle conflict. PET value in sec Severity conflict Description
PET ≤ 1 Serious conflict In this situation, the pedestrian rushed to cross the lane in the presence of a coming vehicle, and the vehicle is so near to the
pedestrian 1 > PET ≤ 5 Slight conflict In this situation, the pedestrian crossed the street in the presence of a
coming vehicle, and the vehicle is far from the pedestrian PET ≥ 5 Potential conflict In this situation, the pedestrian crossed the street in the presence of a
coming vehicle, and the vehicle is far enough from the pedestrian
STATISTICAL RESULTS NUMBER OF CONFLICT OF DIFFERENT LEVELS OF SEVERITY OVER TWO DIRECTION For 330 selected individual pedestrian, there were 666 crossing in total. 336 crossing occurred in the absence of vehicles and therefore did not result in a conflict situation. Details about conflict number are summarized in table 2.
Table 2 Conflict number of different levels of severity over two directions Direction Site Serious conflict Slight conflict Potential conflict Total Near end Site - 1 23 43 25 91
Site – 2 21 37 12 70 Subtotal 44 80 37 161
Far end Site - 1 10 39 9 58 Site – 2 41 32 21 94 Subtotal 51 71 30 152
In general, conflicts occurred most frequently on site – 1(91) in near end, while for pedestrian in far end, conflicts occurred most frequently on site – 2(94).
PERCENTAGE OF SERIOUS CONFLICT The percentage of conflict occurrence, Pconflict is calculated as
(4)
Where Nslight is the number of slight conflicts, Nserious is the number of serious conflicts, and Ncrossing is the total number of pedestrian crossings.
Accordingly, the percentage of serious conflict occurrence, Pserious can be calculated as:

International Journal of Advance and Innovative Research Volume 6, Issue 2 (XXX): April – June, 2019
6
ISSN 2394 - 7780
(5)
PSerious is an important parameter in conflict analysis because it represents the percentage of potentially dangerous pedestrian-vehicle accidents. PSerious was 35.48% (near end) and 41.80%(far end) respectively, and for all pedestrians Pserious was 38.62%.
Both pedestrians and drivers caused serious conflicts in far end.41.80% serious conflicts were recorded in the far end.
Crossing without watching for oncoming vehicles is one aspect of unsafe pedestrian crossing behavior (Yagil, 2000). 34.84% of serious conflicts happened in site -1 for pedestrians in near end, and 20.41% of serious conflicts happened in site-1 for pedestrians in far end. These serious conflicts in near end occurred when the pedestrian entered the crossing immediately before a vehicle approached; the driver decelerated, and the pedestrian walked faster or started running. This is one of the most dangerous conflict situations because the driver does not anticipate the presence of pedestrians.
INFLUENCE OF WAITING TIME ON PEDESTRIAN VEHICLE CONFLICT Pedestrian waiting time reflects pedestrian delay at intersections. Traditionally, urban network management has paid more attention to minimizing vehicle delays and little attention to delays encountered by pedestrians (Vallyon, Turner, & Hodgson, 2011). An in-depth understanding of the influence of waiting time on pedestrian-vehicle conflict would alert designers, planners, and managers to pedestrians’ needs, thus making urban areas more pedestrian-friendly (Vallyon et al., 2011).
Waiting time is the time difference between the pedestrian’s arrival time and the pedestrian’s departure time at the same crossing area. Generally, pedestrians preferred crossing actively rather than waiting passively (Zhuang & Wu, 2011). However, waiting time can significantly deter people from walking or can lead to unsafe crossing behavior (Vallyon et al.,2011).
Table 3 The number of serious, slight and potential pedestrian-vehicle conflict by waiting time Waiting time (s) less than 3sec 3 – 30 sec More than 30 sec Serious conflict 54 24 5 Slight conflict 103 56 11
Potential conflict 43 14 3 Total 200 94 19
On the basis of data from Table 3, waiting time less than 3 sec caused 200 conflicts. The number of conflicts decreased as waiting time increased. It is worth noting that the number of serious conflicts decreased significantly when the waiting time went from 3 sec to 30 sec. There were also five pedestrians who crossed in very risky situations after waiting for more than 30 sec. similar results were suggested in Martin (2006) and Li (2014).
CONCLUSION This study evaluating pedestrian – vehicle conflicts at a non-signalized marked crosswalk in Sringar, Uttarakhand. Pedestrian – vehicle study classify conflict in three different levels: serious, slight and potential conflicts, based on PET threshold value. Based on above evaluation, conclusion were drawn which is as follows: 1. The severity of pedestrian – vehicle conflict was evaluated. Result showed that the far end recorded a higher
percentage of serious conflict than the near end, the slight conflict were the most frequently occurring conflicts for both directions.
2. The relationship between pedestrian waiting time and pedestrian-vehicle conflict was also investigated. Analytical results showed that shorter waiting time caused 200 conflict situations between pedestrians and vehicles. As pedestrian waiting time went from 3 to 30 sec, serious conflict decreased significantly. When pedestrian waiting time went beyond 30sec, five pedestrian crossed in very risky situations.
REFERENCES [1] Ambros, Jiří. "Traffic conflict technique in the Czech Republic." Proceedings of the 24th ICTCT
Workshop in Warsaw. Vol. 27. 2011.

International Journal of Advance and Innovative Research Volume 6, Issue 2 (XXX): April – June, 2019
7
ISSN 2394 - 7780
[2] Ambros, Richard Turek, et al. "ROAD SAFETY EVALUATION USING TRAFFIC CONFLICTS: PILOT COMPARISON OF MICRO-SIMULATION AND OBSERVATION-Jiří." International Conference on Traffic and Transport Engineering-Belgrade. 2014
[3] Archer, Jeffery. Indicators for traffic safety assessment and prediction and their application in micro-simulation modelling: A study of urban and suburban intersections. Diss. KTH, 2005
[4] Ariza, Alexander. Validation of Road Safety Surrogate Measures as a Predictor of Crash Frequency Rates on a Large-Scale Microsimulation Network. Diss. 2011.
[5] 5. Cheng, Guozhu. "Setting conditions of crosswalk signal on urban road sections in China." 2013 International Conference on Transportation (ICTR 2013). 2013.
[6] Daamen, Winnie, and Serge P. Hoogendoorn. "Free speed distributions for pedestrian traffic." Trb-annual meeting, Washington. 2006.
[7] Elvik, Rune, et al., eds. The handbook of road safety measures. Emerald Group Publishing, 2009.
[8] Hayward, J. Near misses as a measure of safety at urban intersections. Pennsylvania Transportation and Traffic Safety Center, 1971.
[9] Himanen, Veli, and Risto Kulmala. "An application of logit models in analysing the behaviour of pedestrians and car drivers on pedestrian crossings." Accident Analysis & Prevention 20.3 (1988): 187-197.
[10] Hydén, Christer. "The development of a method for traffic safety evaluation: The Swedish Traffic Conflicts Technique." Bulletin Lund Institute of Technology, Department 70 (1987).

International Journal of Advance and Innovative Research Volume 6, Issue 2 (XXX): April – June, 2019
8
ISSN 2394 - 7780
USE OF COPPER TAILING TO ENHANCE PROPERTIES OF CONCRETE
Abhishek Garg and Prakash Somani M. Tech Transportation Student, MNIT, Jaipur
ABSTRACT In recent years, the application of Concrete has increased in many parts of the world for various constructions involving casting in congested areas. In India, however we still need to change our mindset of using conventional concrete particles and adopt techniques like CONCRETE. Use of supplementary materials like fly ash and copper telling. In regard of various norms related to environmental protection, we must also ensure that our particles are eco-friendly and led to sustainable development. The study of copper tailing was constrained majorly on sand stabilization and cement mortar. So, our major emphasis was to spread the use of copper tailing in various construction works and also during the past few years, abrasion damages are important problems for concrete structures. When concrete is used in hydraulic structures, likes bridge piers, spillway or drainage conduits, and the most significant problem is erosion attacking over its surface layer. This is caused by friction and impact of silt, sand, rocks, and other debris on concrete surface during operation of hydraulic structures. These abrasion erosion results will make surface fractures, concrete peelings, and steel bars exposure and corrosion. Finally, the constructions will fall in and cannot be used again.
Index Terms: Copper tailing, Reinforcement, Flexural Strength, Failure etc.
INTRODUCTION Copper is one metal with wide applications in several industries. With the increase in demand of copper and its products, it is expected that more and more ores will be processes to meet the demand. This leads to production of millions of tons of copper waste in the form of copper tailing as we already know that almost 90-95% of the ore is waste in the copper extraction process.
The waste in state Rajasthan is too much which gave us an idea to utilize it in some manner such that it reduces the environmental hazards and is useful in concrete too. Not only this, it came out to be good replacement of fine aggregate which is again scarcely available and slowly getting restricted by low to maintain river banks.
OBJECTIVES Industrial wastes are increasing day by day. It is important to manage the wastes in a wise manner so that it does not dangerous to nature. Our aim was to study the variations in the properties of concrete by the replacement of fine aggregates with copper tailing.
This paper reports the strength and durability characteristics of concrete with and without copper tailing. The durability properties were also investigated. Tests were performed for permeability, abrasion, and carbonation resistance.
MATERIAL & METHODOLOGY The raw materials required to study the use of copper tailing in CONCRETE were fine aggregates, course aggregates, cement, copper tailing, water, superplasticizer, viscosity modifying agent (VMA), abrasive power and epoxy paint. So, it was necessary to study the properties of these individual raw material0073
CEMENT The cement used was cement of OPC 43 grade. The normal consistency of the cement used was found to be 30.5 which lies within the range specified in IS 4031 (Part 4)- 1988. The setting time tests results obtained are as follows:
Initial setting time- 30 minutes
Final setting time- 150 minutes
Table:1 Testing of specific gravity of cement Initial reading (Ml) 0.8
Final reading (Ml) 19.27 Wt. of equal volume
of water 1.1*(19.7-0.8)
=20.317 specific gravity(G) 64/20.317=3.15

International Journal of Advance and Innovative Research Volume 6, Issue 2 (XXX): April – June, 2019
9
ISSN 2394 - 7780
AGGREGATE a. Coarse Aggregate
In this practical we used two types of aggregate
10 mm Coarse aggregate
20 mm Coarse aggregate
b. Fine Aggregate
Confirming Grading zone II confirming IS code 383-2016
Fig.1 Coarse and Fine Aggregate
COPPER TAILING Copper tailing used in the project was produced from Khetri region, Rajasthan. Specific gravity obtained was 2.95. Fineness modulus obtained was 1.573. The distribution curve made it easier to make it easier to make a high performance concrete. We could judge this curve the size of copper tailing particles and fine aggregates thereby deciding to replace fine aggregates by copper tailing. Since we knew that copper tailing particles are smaller than the size of fine aggregates, therefore the introduction of copper tailing in concrete would result in decrease in flow ability. This made us easier to judge the amount of super plasticizer to be added in different trails.
SUPERPLASTICIZER Superplasticizer used in the project was Glenium Sky 777. It was used to increase the flow ability of the concrete. The percentage of superplasticizer varied from 0.8 to 2.15 percentages by weight of cement used depending upon the replacement of fine aggregate by copper tailing.
VISCOSITY MODIFYING AGENT (VMA) Viscosity modifying agent used in the project was . VMA was used to prevent the concrete mix from segregation and bleeding. Since CONCRETE has higher workability, there are more probable chances of cement slurry separating out of the mix. So, VMA confirms homogeneity of the mix.
MIX DESIGNING Cement 338 kg/m3
Water 153 kg/m3
Fine aggregate 826 kg/m3 Coarse aggregate 1185 kg/m3 10mm 474 kg/m3 20mm 711 kg/m3 Chemical admixture 4.04 kg/m3
Designation Copper Tailing (kg) VMA (% of Cement) Admixture (% of cement) C-1 0 0.5 0.8
C-10 1.67 0.6 0.9 C-25 4.17 0.7 1.2 C-50 8,35 1.0 1.6 C-75 4.17 1.4 1.8

International Journal of Advance and Innovative Research Volume 6, Issue 2 (XXX): April – June, 2019
10
ISSN 2394 - 7780
TEST PERFORMED COMPRESSIVE STRENGTH TEST Compressive strength test is performed on harden concrete to inspect the compressive strength of concrete mix on Compressive Testing Machine (CTM). Test is performed under the guidelines of IS 516:1959 on standard specimen of 150 mm x 150 mm x150 mm after 7,14 and 28 days of curing.
Compressive strength = P/ A Where
P = Applied Load (N)
A = Cross Sectional Area (mm2)
d = Diameter of Cylinder
THREE POINT BENDING TEST Flexural strength of concrete is measured by using IS Code 516:1959. The size of beam 500mm x 100mm x 100mm.The specimens were tested after deep curing for 28 days. The central point loading method was used for this testing.
Flexural Strength = 3PL/2bd2 = 3PL/2d3
(Unit = N/mm2 or MPa) Here, b = d Where, P = Load, L = Distance from Centre of Two Support, b = Depth of Specimen, d = Width of Specimen

International Journal of Advance and Innovative Research Volume 6, Issue 2 (XXX): April – June, 2019
11
ISSN 2394 - 7780
TEST RESULTS Test result of Compressive and flexure strength
Designation Slump flow, cm Compressive strength (N/mm2)
Flexural strength (N/mm2)
7 days 28 days C-1 59 38 32.2 3.97
C-10 60 34.5 35.65 4.17 C-25 53 36.2 39.62 4.4 C-50 63.5 40.5 37.15 4.26 C-75 62 33 24.11 3.43
0
10
20
30
40
50
0% 10% 25% 50% 75%
28 days compressive strength
28 days compres…
0
0.5
1
1.5
2
2.5
3
3.5
4
4.5
5
0% 10% 25% 50% 75%
flexural strength
flexural strength
CONCLUSION Initially when the percentage of copper tailing in the concrete is increased then compressive strength and
flexural strength also increases but after certain limit compressive strength and flexural strength start decreasing, it may be due to the more fineness of the copper tailing as compared to fineness of sand(till 40% to 50 %).
During casting of cubes extra bleeding was also observed, therefore, it is advisable to use extra Viscosity Modifying Agent (VMA) for achieving strength.
Hence, the copper tailing can be used partially as a replacement of sand.

International Journal of Advance and Innovative Research Volume 6, Issue 2 (XXX): April – June, 2019
12
ISSN 2394 - 7780
REFERENCES [1] Aditya Vijay, Madhusudan Dhoot, Garvit Gupta, Final year B.Tech project, submitted to Civil Engineering
Department, MNIT Jaipur, June 2013.
[2] DIN 1048 part 5: Prufverfahren fur Beton, Jun 1991, Berlin, Germany.
[3] Gupta R.C., Blessen Skariah Thomas, Prachi Gupta, (2012), “Application of Copper slag and Discarded Rubber tyres in construction”, International Journal of Civil and Structural Engineering Research, Vol 3, No 2, 2012, pp 271-281
[4] Gupta R.C., Blessen Skariah Thomas, Prachi Gupta, Lintu Ranjan, Dayanand Thagriya, (2012), “An Experimental study of Clayey soil stabilized by Copper Slag”, International Journal of Structural and Civil Engineering Research, Vol 1, No 1, pp. 110-119

International Journal of Advance and Innovative Research Volume 6, Issue 2 (XXX): April – June, 2019
13
ISSN 2394 - 7780
COMPARATIVE SEISMIC ANALYSIS OF A MULTISTORY BUILDING USING INDIAN CODE, CANADIAN CODE AND JAPANESE CODE
Nida Khanam1 and Dr. O. P. Chhangani2 M. Tech Student1 and Director2, AIET, Apex group of Institutions, Jaipur
ABSTRACT The earthquake resistant design codes of different countries have variations in them since they all consider different factors such as intensity, magnitude, zone factors , importance factors etc. so that’s why it is difficult to apply one country code’s methodology in to another country. In this project the comparative analytical study has been carried out on a RCC Building by using various international design codes. The comparison which is performed in this project is among Maximum Shear force, Maximum Bending Moment, Maximum Deflection etc on few critical members of the building by different codes.
In this project, a G+11 building is planned and analyzed. The design and analysis is carried out using three International Seismic Standards- IS 1893 –Criteria for earthquake resistant design of structures Part 1, Japanese seismic Design codes , AIJ, BSLJ, Canada code NBCC 2005 , CSA Standards A23.3-94.
Keywords: Earthquake resistant structures, Intensity, Magnitude, Zone factors, Maximum Shear force, Maximum Bending Moment, Maximum Deflection.
I. INTRODUCTION Earthquake resistant structures are competent of resisting vertical and lateral forces acting on the structures. However no structures can completely endure during earthquake without any reimbursement as designing the structures for no damage will be highly uneconomical. Many of the countries have their own codes of practice for designing the Earthquake Resistant structures. Reinforced concrete buildings are designed as per codal provision will survive throughout earthquake with minor damages of structural elements and with adequate time or cautioning to escape from structures.
In this project the comparative analytical study has been carried out on a RCC Building by using various international design codes. The comparison which is performed in this project is among Maximum Shear force, Maximum Bending Moment, Maximum Deflection, Maximum Axial force on few critical members of the building by different codes.
In this project, a G+11 building is considered and analysed. The design and analysis has been carried out using three International Seismic Standards- IS 1893 –Criteria for earthquake resistant design of structures Part 1, Japanese seismic Design codes, AIJ, BSLJ, Canada code CSA Standards A23.3-94.
Most seismic codes require that the structures which are to be designed to resist particular static lateral forces associated to the structure and the seismicity of the region. Based on the estimation of fundamental natural period of the structure, some formulas are specified for the base shear and also the distribution of lateral forces over height of the buildings.
In fact in all the codal comparison the fact is that the total base shear is different due to micro zonation of seismic areas and the manner in which response of structure has been taken into account. In addition to above the time period of vibration and relationship with spectral acceleration will also affect the calculation of base shear.
II. LITERATURE REVIEW Marjan Faizian and Yuji Ishiyama (2004) The seismic design provisions in three building codes, 1981 Japan (BSLJ), 2000 USA (IBC) and 1999 Iran (2800), and their similarities and differences were presented in the paper. For calculating the seismic load in each code the base shear coefficient, spectral content, seismic zoning, fundamental period, importance factor, effect of soil profile and foundation, structural behavior coefficient, and effect of the weight of buildings were specifically discussed and the differences have been mentioned. After calculating the seismic force, the distribution methods over the height of the building and also the base shear coefficients and the torsion were compared. This comparison shows that the Iranian seismic code is very similar to the Americans but the Japanese code is considerably different from the other two codes.
Vijay Namdev Khose, Yogendra Singh and Dominik Lang(2012)Presented a comparative study of the seismic performance of an eight storey RC frame building designed according to the U.S. American (ASCE 7-10 2010) and Indian (IS 1893-Part1 2002) seismic design codes for a given value of PGA corresponding to the

International Journal of Advance and Innovative Research Volume 6, Issue 2 (XXX): April – June, 2019
14
ISSN 2394 - 7780
Maximum Credible Earthquake (MCE). The main idea of this study was that existing codes vary extensively in specifying the limits on various control parameters and, if a building is designed for a given seismic hazard, using different seismic design codes, it is expected that seismic performance of the very same building will vary significantly.
S.Karthiga, Hanna Elza Titus, Reetwiz Raj Hazarika, Mohamed Harrish (2015) Analyzed a G+10 building for seismic forces using four international building standards- IS1893, Euro code 8, ASCE7-10, and the British Codes. The analysis of the building was done using software STAAD.Pro.V8i. They also design the building as per the particular country codes. After the design was completed a pushover analysis was done in SAP2000 to check the seismic performance of that building.
III. OBJECTIVE OF RESEARCH 1. Various codes have been compared in the past, however continental differences like North America, Japan
& Indian sub continent were not attempted. Same has been considered in this study.
2. While considering calculation of forces in members, the load combination of respective codes with respective load factors were attempted leading to differences in calculations of bending moment, shear force etc. Whereas in this study same load factors and combinations were used to understand the differences.
Figure 1: Plan of the building
DIFFERENT INTERNATIONAL CODAL PROVISIONS All advanced national seismic structure codes combine on the issue of design methodology. These depend on a prescriptive Force-Based Design approach, where the design is performed utilizing a linear elastic analysis, and inelastic energy dissipation is considered indirectly, through a response reduction factor (or behavior factor). This factor, alongside other interrelated provisions, governs the seismic design forces and consequently the seismic performance of code-designed buildings.
Different codes differ not just concerning the design base shear yet additionally utilize different load and material factors (or strength reduction factors) for the design of members, and hence, the actually provided strength in different codes does not follow the same pattern as the design base shear. This has direct effect on the expected performance of buildings designed utilizing diverse codes. Micro zonation of different countries for seismic areas has their implications in calculations of base shear.
In the era of globalization, there is a requirement for convergence of design methodologies to result in buildings with uniform risk of suffering a certain level of damage or collapse. An initial phase toward this path is to analyze the expected seismic performance of buildings designed using the provisions of various codes.
IV. DESCRIPTION OF THE BUILDING For the present study, a Reinforced Concrete Structure is selected. It has symmetrical layout and consists of 12 stories with storey height of 4 m. Floor plan of all stories is square with length of 18 m in X-direction and length of 18 m in Z-direction. The number of bays in X-direction is 3 and number of bays in Z-direction is 3. The width of each bay is 6 m in both X-direction and Z-direction. All the columns of the building are located at the axes intersections.

International Journal of Advance and Innovative Research Volume 6, Issue 2 (XXX): April – June, 2019
15
ISSN 2394 - 7780
Figure 2: Elevation of the building
These following load combinations are used in this thesis are per IS 1893 (Part-1): 2002.
1.5 (DL + LL)
1.5 (DL ± EL)
0.9 DL ± 1.5(EL)
1.2 (DL+LL ± EL)
Where,
DL= Dead Load
LL= Live Load
EL= Earthquake Load
Table-1: Manual calculation for seismic coefficients Manual Calculation for Seismic Coefficients
INDIAN CODE
JAPAN CODE
CANADA CODE
V =
=0.025
C12 = 0.212
= 0.020
C11 =0.146
C10 =0.124
C9 = 0.110
C8 = 0.1007
C7 = 0.093
C6 = 0.086
C5 = 0.080
C4 = 0.075
C3 =0.070
C2 =0.066
C1 = 0.062
CGF = 0.06

International Journal of Advance and Innovative Research Volume 6, Issue 2 (XXX): April – June, 2019
16
ISSN 2394 - 7780
Table -2 : Lateral Load at each floor calculation Lateral Load at Each Floor
Indian Code
Canada Code
Japan Code
Q12 =180.794 F12 =100.65 P12 =540.687
Q11 =275.363 F11 = 167.254 P11 =511.218
Q10 =229.469 F10 = 152.387 P10 =408.563
Q9 =186.357 F9 = 137.52 P9 =350.206
Q8 = 147.416 F8 = 122.653 P8 =305.381 Q7 = 114.039 F7 = 107.786 P7 =266.862
Q6 = 84.834 F6 = 92.91 P6 =231.874
Q5 =59.80 F5 = 78.052 P5 =199.121
Q4 =38.94 F4 = 63.185 P4 =167.874
Q3 = 22.94 F3 = 48.317 P3 =140.09
Q2 10.98 F2= 33.45 P2 =108.50
Q1 =3.33 F1 = 18.58 P1 =79.7
Table 3: Maximum lateral Displacement along X-Direction (mm) Max Lateral displacement in X direction
Storey No. India Canada Japan
12 327.05 185.781 707.248
11 318.724 179.415 687.584
10 304.31 170.566 656.236
9 284.447 159.486 615.072
8 260.144 146.414 565.62
7 232.321 131.569 509.042
6 201.809 115.18 446.352
5 169.344 97.486 378.482
4 135.563 78.726 306.316
3 101.005 59.143 230.714
2 66.131 39.003 152.577
1 31.471 18.633 73.255
G 1.455 0.833 3.321

International Journal of Advance and Innovative Research Volume 6, Issue 2 (XXX): April – June, 2019
17
ISSN 2394 - 7780
Figure -3 : Maximum Lateral Displacements in X Direction(mm)
As per the result obtain it is observed that the Canadian Code is giving less Lateral Displacement in X direction at GF in comparison to Japanese Code and Indian Code Where as the Lateral displacement in X direction in top stories is higher in case of Japanese Code in comparison to Indian and Canadian Code.
In the table given below maximum shear force in the Z direction has been compared while the seismic forces were applied in the Z direction.
Table 4 : Comparison of Maximum shear force in Z direction (KN) Maximum shear force in z direction
Storey India Canada Japan 12 60.671 60.536 60.913 11 53.154 52.698 53.691 10 53.791 53.098 54.525 9 53.055 52.153 53.98 8 52.155 51.08 53.261 7 50.928 49.713 52.209 6 49.393 48.066 50.846 5 47.529 46.114 49.146 4 45.412 43.928 47.186 3 42.531 40.986 44.457 2 42.051 40.468 44.092 1 24.763 22.931 27.181 G 19.034 17.477 21.086
Figure 4 : Comparison of Maximum shear force in Z direction (KN)
International Journal of Advance and Innovative Research Volume 6, Issue 2 (XXX): April – June, 2019
18
ISSN 2394 - 7780
As per the result obtain it is observed that the Canadian Code is giving less Shear Force in Z direction at GF in comparison to Japanese Code and Indian Code Where the Shear Force in Z direction in top stories is higher in case of Japanese Code in comparison to Indian and Canadian Code.
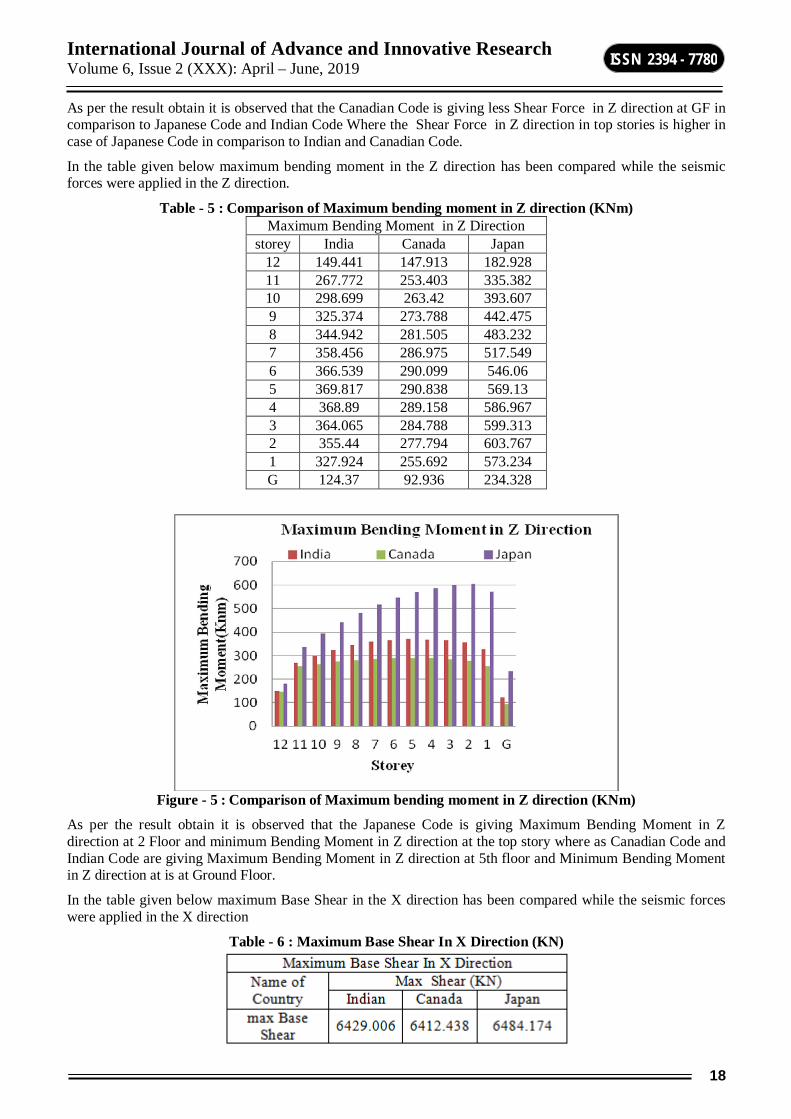
In the table given below maximum bending moment in the Z direction has been compared while the seismic forces were applied in the Z direction.
Table - 5 : Comparison of Maximum bending moment in Z direction (KNm) Maximum Bending Moment in Z Direction
storey India Canada Japan 12 149.441 147.913 182.928 11 267.772 253.403 335.382 10 298.699 263.42 393.607 9 325.374 273.788 442.475 8 344.942 281.505 483.232 7 358.456 286.975 517.549 6 366.539 290.099 546.06 5 369.817 290.838 569.13 4 368.89 289.158 586.967 3 364.065 284.788 599.313 2 355.44 277.794 603.767 1 327.924 255.692 573.234 G 124.37 92.936 234.328
Figure - 5 : Comparison of Maximum bending moment in Z direction (KNm)
As per the result obtain it is observed that the Japanese Code is giving Maximum Bending Moment in Z direction at 2 Floor and minimum Bending Moment in Z direction at the top story where as Canadian Code and Indian Code are giving Maximum Bending Moment in Z direction at 5th floor and Minimum Bending Moment in Z direction at is at Ground Floor.
In the table given below maximum Base Shear in the X direction has been compared while the seismic forces were applied in the X direction
Table - 6 : Maximum Base Shear In X Direction (KN)

International Journal of Advance and Innovative Research Volume 6, Issue 2 (XXX): April – June, 2019
19
ISSN 2394 - 7780
Figure – 6 : Maximum Base Shear In X Direction (KN)
As per the result obtain it is observed that At ground Japanese code shows the Maximum Base Shear In X direction while Canadian Code Shows minimum Base shear Comparing to Indian code and Japanese code.
V. RESULTS AND CONCLUSION A conclusion section is not required. Although a conclusion may review the main points of the paper, do not replicate the abstract as the conclusion. A conclusion might elaborate on the importance of the work or suggest applications and extensions. The main factors, which constitute the seismic load provisions of IS, BSLJ and NBCC, have been presented and compared in this study. While the three codes differ in detail, they have essential common features and are comparable. All of them include the effect of seismic risk, spectral contents, structural behavior and soil/foundation for seismic load. The importance of a building is included in IS and NBCC but not in BSLJ.Because BSLJ stipulate the minimum standards applicable to all buildings. As per the result obtain it is observed that the Canadian Code is giving less Lateral Displacement at GF as
well as Top floors while the Japanese Code is giving maximum displacement at top and ground floors.
It is observed that at top floors Japanese code gives maximum shear force followed by Indian code and Canadian code.
As per the result obtain it is observed that the Japanese Code is giving Maximum Bending Moment in Z direction at 2 Floor and minimum Bending Moment in Z direction at the top story where as Canadian Code and Indian Code are giving Maximum Bending Moment in Z direction at 5th floor and Minimum Bending Moment in Z direction is at Ground Floor.
As per the result obtain it is observed that At ground Japanese code shows the Maximum Base Shear while Canadian Code Shows minimum Base shear in comparison to Indian code and Japanese code.
From the results of manual calculations of lateral distribution of seismic forces it is observed that Japanese code gives maximum force at top story followed by Indian code and Canadian code.
However, what so ever the values obtained during the analysis of the structure for various structural parameters, it is obvious that the variations of values are due to the independent constants, loading and micro zonation of seismic areas in different countries and its impact on seismic coefficient for calculation of base shear.
VI. RECOMMENDATIONS OF FUTURE STUDIES Further study will be required to study more international codes and their impact on calculation of base
shear and forces in members.
Comparison needs to be made on the basis of the micro zonation of different seismic areas of different countries and how the same is having its influence on calculation of base shear and other actions.
Various codes of countries have different provisions for importance of structure, parameters for structural response (similar to response reduction factor) and accounting of over strength, in the calculation of base shear. This needs rationalization.
Discrepancy in calculation of moments and forces in columns due to three codes are very narrow in spite of major difference in base shear shear for Indian and Canadian code and Japanese code. This need further study under different software like ETAB etc
REFERENCES [1] Faizian, Marjan, and Yuji Ishiyama. "COMPARISON OF SEISMIC CODES OF 1981 JAPAN (BSLJ),
2000 USA (IBC) AND 1999 IRAN (ICS)." 10th World Conference on Earthquake Engineering. 2004.
[2] Khose, Vijay Namdev, Yogendra Singh, and Dominik H. Lang. "A comparative study of design base shear for RC buildings in selected seismic design codes." Earthquake Spectra 28.3 (2012): 1047-1070.

International Journal of Advance and Innovative Research Volume 6, Issue 2 (XXX): April – June, 2019
20
ISSN 2394 - 7780
[3] Ishiyama, Yuji. "Introduction to Earthquake Engineering and Seismic Codes in the World." Hokkaido University, Hokkaido, Japan (2011).
[4] Bangash, M. Y. H. "Existing Codes on Earthquake Design with and Without Seismic Devices and Tabulated Data." Earthquake Resistant Buildings. Springer, Berlin, Heidelberg, 2010. 51-141.
[5] Ward, H. S. "Earthquake load provisions of the National building code of Canada." (1966).
[6] C. V. R. MURTY, “Earthquake tips-Learning Earthquake Design and Construction .
[7] BSSC Program on Improved Seismic Safety Provisions. NEHRP recommended provisions for seismic regulations for new buildings and other structures. Fema, 1998.
[8] IS 456 (2000): Plain and Reinforced Concrete - Code of Practice
[9] IS 1893-1 (2002): Criteria for Earthquake Resistant Design of Structures, Part 1: General Provisions and Buildings.
[10] IS 13920. (1993). Ductile detailing of reinforced concrete structures subjected to seismic forces-code of practice, Bureau of Indian Standards, New Delhi, India
[11] NRCC. National Building Code of Canada 2015, 14th ed. (in preparation), National Research Council of Canada, Ottawa, ON, 2015
[12] CSA. CSA S16-14, Design of Steel Structures, Canadian Standards Association, Mississauga, ON, 2014.
[13] SProV8i\STAAD\Help\Technical_Reference_2007

International Journal of Advance and Innovative Research Volume 6, Issue 2 (XXX): April – June, 2019
21
ISSN 2394 - 7780
ALTERNATIVE DAM CONSTRUCTION TECHNIQUE
Prakash Soamni1, Yogendra Singh Chouhan2, Vishal Verma3 and Vinay Kumar Bajad4 M. Tech Transportation Student1, MNIT, Jaipur
B. Tech Civil Student2, 3, 4, PIET, Jaipur
ABSTRACT After independence, India is one of the world most prolific dam-builders. Around 4300 large dams already constructed almost of which are more than twenty years old. Cost of dam construction is too high and time taken in construction is more. In modern scenario, dam’s life span and construction cost & time are main consideration. In this paper main focused on these problems and for the solution proposed use of roller compacted concrete dam technique. Roller compacted concrete dam due to its economical and rapid construction time one of the solutions for remediation of existing dams. The utilization of RCC in recovery of dams has diverse parts and some vital pieces of remediation in dams incorporate disintegration and scour security of slants, peaks, stilling bowls of bank, fixing ruptures and drainages, expanded the water driven limit with respect to administration and crisis spillways and development of downstream gravity segments for seismic fortifying and expanded sliding steadiness of solid gravity, curve, and support dams. In correlation with customary dams, RCC can diminish the expenses in going from 25 to 50 percent. In today’s world time is an important factor. RCC‘s finishing time is typically 1 to 2 years less than regular concrete dams.
INTRODUCTION Chittorgarh is located on the banks of rivers Gambhiri and berach. Chittorgarh is famous for cement factories and marble – granites industries. Municipal Corporation of Chittorgarh is continuously making concerting efforts to cope up with the growing demands for water towards the domestic and industrial consumption. The banas River, a south to north flowing river originating in the hills near Aravalli Range, in RAJASTHAN state, is one of the major sources of water supply to Chittorgarh city.
Gosunda Dam is constructed on the Banas River which is Basin of Ganga River. The main purpose of dam is irrigation. It is operating & maintaining by Hindustan Zink Limited. It is a Gravity Dam which constructed in 1999. A gravity dam is planned so that it opposes every single outer power following up on the dam like water weight, wind weight, wave weight, ice weight, inspire weight by its very own self weight.
Despite the fact that RCC is so economical, seepage is the fundamental problem faced with RCCs. At times, it might cause issues and may be worthy by showing up of the drainage in the downstream of a dam. The RCC dams are not formally dressed of course to be, as a result of some regular attributes of development techniques, for example, penetrability which may cause to isolation. The other significant issues of RCC dams are high penetrability because of dry solid that contains low measure of concrete and prompts low thickness zones, the porousness among lifts, and the high danger of joint's partition on upstream which will create by warm response. To take care of the previously mentioned issues, utilizing concrete with high cementations content reduction porousness of lift joints.
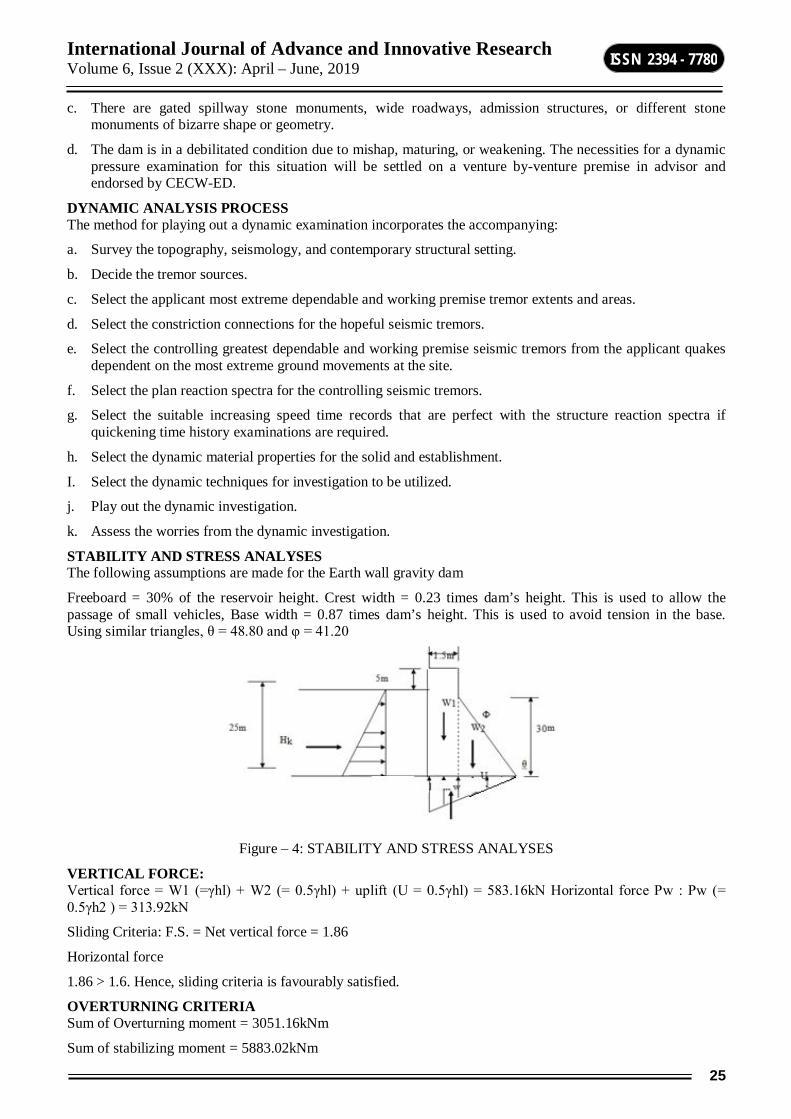
ABOUT GRAVITY DAM A gravity dam is a strong structure, made of cement or stone work, built over a waterway to make a store on its upstream. The segment of the gravity dam is around triangular fit as a fiddle, with its zenith at its top and most extreme width at base. The segment is proportioned to the point that it opposes the different powers following up on it by its own weight. A large portion of the gravity dams are strong, with the goal that no twisting pressure is presented anytime and consequently, they are some of the time known as strong gravity dams to recognize them from empty gravity dams in those empty spaces are kept to diminish the weight. Early gravity dams were worked of workmanship, yet these days with improved techniques for development, quality control and relieving, concrete is most generally utilized for the development of present day gravity dams. A gravity dam (Figure.1.) is commonly straight in plan and, along these lines, it is likewise called straight gravity dam. The upstream face is vertical or marginally slanted. The slant of the downstream face for the most part fluctuates between 0.7: 1 to 0.8: 1. Gravity dams are especially fit crosswise over canyons with exceptionally soak side slants where earth dams may slip. Where great establishments are accessible, gravity dams can be developed to any stature. Gravity dams are additionally normally less expensive than earth dams if reasonable soils are not accessible for the development of earth dams. This kind of dam is the most changeless one, and requires little upkeep.

International Journal of Advance and Innovative Research Volume 6, Issue 2 (XXX): April – June, 2019
22
ISSN 2394 - 7780
ABOUT NATURAL RESPONSE The auxiliary reaction of a material to various burdens decides how it will be financially used in the structure procedure. Tremor is a cataclysmic event that has guaranteed such a large number of lives and wrecked heaps of property. Quake risks had made the breakdown and harm ceaseless working of basic administrations, for example, correspondence and transportation offices, structures, dams, electric establishments, ports, pipelines, water and waste water frameworks, electric and atomic power plants with extreme monetary misfortunes. Tremor is a noteworthy wellspring of seismic powers that encroach on structures others are Tsunami, fume and so forth. Earth divider is picked as a material for the dam since its real constituent earth is copiously accessible and gives a practical arrangement. This requires the seismic investigation of solid gravity dam. Limited component has been broadly utilized in seismic examination of solid gravity dams with a characterized methodology as displayed in this program. Seismic tremors had caused serious harms and thusly enormous financial misfortunes including misfortunes of lives. The logical calculation of the modular methodology strategy has been completed and actualized utilizing STAAD PRO device. The pseudo static seismic coefficient technique was received in registering the seismic loads on the dam. The dam utilized as a contextual investigation was thought to be in seismic zone 1 with seismic coefficient running somewhere in the range of 0.0 and 0.05. The dam was dissected seismically utilizing the decoupled modular methodology and the outcomes were contrasted and that of the solid gravity dam.
ABOUT THE SOFTWARE STAAD or (STAAD.Pro) is a basic examination and structure PC program initially created by Research Engineers International in Yorba Linda, CA. Research Engineer International was bought by Bentley Systems in 2005. A progressively prepared adjustment called Staad-III for windows is used by Iowa State University for educational purposes for normal and helper architects. The business variant STAAD.Pro is a standout amongst the most generally utilized auxiliary examination and structure programming. It bolsters a few steel, cement and timber structure codes. It can make utilization of different types of examination from the conventional first request static investigation, second request p-delta examination, geometric non straight examination or a clasping examination. It can likewise make utilization of different types of dynamic investigation from modular extraction to time history and reaction range examination.
SEISMIC RESPONSE OF CONCRETE GRAVITY DAMS In earth dams, seismic powers or shaking can actuate destabilizing disfigurement or inside and out disappointment if not made tremor safe. A lasting disentangled strategy can be received to gauge perpetual level removals of the dams utilizing limited component technique that represent nonlinear material conduct and quality decrease because of liquefaction or strain relaxing. It has been demonstrated that the seismic execution of earth dams has been identified with the nature and condition of compaction of the fill material.
FLUID STRUCTURE SYSTEM During earthquake occurrence, the dam and reservoir body respond differently, as a result of hydrodynamic forces impinging on the fluid body and solid structure. As a result of this, interaction will occur between the fluid–solid structure interfaces as particles move relatively to the mesh points whereas, the meshes moves with the material particles. Much research work has been carried out for the dynamic response of the fluid solid structure systems. Several methods of analysis for the fluid structure systems (Figure.2) use finite element idealization in the nonlinear dynamic response of the system.

International Journal of Advance and Innovative Research Volume 6, Issue 2 (XXX): April – June, 2019
23
ISSN 2394 - 7780
Figure - 2: FLUID STRUCTURE SYSTEMS
LOADINGS STATIC LOADS.
The static loads are due to
(i) The weight of the dam: the unit weight is assumed to be 19.62kN/m3 until an exact unit weight is determined from materials investigation.
(ii) Hydrostatic pressure of the water in the reservoir and
(iii) The uplift forces caused by hydrostatic pressure on the foundation at the interface of the dam and the foundation. Uplift forces are usually considered in stability and stress analysis to ensure structural adequacy and are assumed to be unchanged by earthquake forces.
DYNAMIC LOADS
Quake or seismic burdens are the real unique burdens being considered in the examination and structure of dams particularly in tremor inclined regions. The seismic coefficient strategy is utilized in deciding the resultant area and sliding steadiness of dams. Seismic investigation of dams is performed for the most negative bearing, in spite of the way that quake increasing speed may occur toward any path. Fig. 2 demonstrates the dynamic loads on a gravity dam. There are diverse methods for registering tremor stacks on dams. The deterministic methodology will be utilized where the ground speeding up as far as g (quickening because of gravity) is indicated for the area where the dam will be built. Hence, the exciting force on the structure is,
P(t) = Max (1)
and
ax = αg (2)
where ax, α, g are the ground acceleration, seismic coefficient and acceleration due to gravity respectively.
Figure -3: SEISMICALLY LOADED GRAVITY DAM

International Journal of Advance and Innovative Research Volume 6, Issue 2 (XXX): April – June, 2019
24
ISSN 2394 - 7780
From Fig.3 and equation (1) therefore, the equilibrium system is expressed as:
Pex=Max=Wαg/g=Wα (3a)
In which ax = αg andW = Mg (3b)
along vertical direction
Pew =(2 * Ce * α * y * √ (h *y)) / 3 (4a)
and
Ce = 51 / √ (1 – 0.72 * (h / (1000te))2) (4b)
where Pex, M, ax, W, α, g are the horizontal earthquake force on the dam, mass horizontal earthquake acceleration, weight, acceleration due to gravity and seismic coefficient respectively. Also Pew, h, te are the additional total water load down to depth y, total height of reservoir, and period of vibration respectively.
ANALYSIS STRESS ANALYSIS
A. General (1) A pressure examination of gravity dams is performed to decide the size and circulation of worries all
through the structure for static and dynamic burden conditions and to explore the basic ampleness of the substructure and establishment.
(2) Gravity dam stresses are penniless somewhere around either evaluated improved procedures or the restricted part system depending upon the refinement required for the particular element of plan and the sort and setup of the dam. For groundwork structures, streamlined methods using cantilever column models for two-dimensional examination or the fundamental weight wind procedure for three-dimensional examination are fitting as delineated in the US Bureau of Reclamation (USBR), "Plan of Gravity Dams" (1976).The constrained part strategy is normally used for the component and last arrangement stages if an inexorably exact weight examination is required.
B. Limited component investigation (1) Finite component models are utilized for direct flexible static and dynamic investigations and for nonlinear
examinations that represent communication of the dam and establishment. The limited component technique gives the ability of modelling complex geometries and wide varieties in material properties. The worries at corners, around openings, and in pressure zones can be approximated with a limited component demonstrate. It can demonstrate concrete thermal behaviour and couple warm worries with different burdens. An essential favourable position of this technique is that entangled establishments including different materials, feeble joint child creases, and breaking can be promptly demonstrated. Uncommon reason PC programs structured explicitly for investigation of solid gravity dams are CG-DAMS, which performs static, dynamic, and nonlinear examinations and incorporates a spread split model, and MERLIN, which incorporates a discrete breaking crack mechanics display.
(2) Two-dimensional, limited component investigation is commonly suitable for solid gravity dams. The fashioner ought to know that real structure reaction is three measurements a land should survey the scientific and reasonable outcomes to guarantee that the two-measurement estimation is worthy and practical. For long traditional solid dams with transverse withdrawal joints and without keyed joints, a two-dimensional examination ought to be sensibly right. Structures situated in thin valleys between soak projections and dams with changing rock module which shift over the valley are conditions that require three-dimensional demonstrating.
DYNAMIC ANALYSIS The basic investigation for tremor loadings comprises of two sections: an inexact resultant area and sliding steadiness examination utilizing a proper seismic coefficient and a dynamic inward pressure investigation utilizing site-subordinate quake ground movements if the accompanying conditions exist:
a. The dam is 100 feet or more in stature and the pinnacle ground speeding up (PGA) at the site is more noteworthy than 0.2 g for the most extreme dependable quake.
b. The dam is under 100 feet high and the PGA at the site is more prominent than 0.4 g for the most extreme dependable seismic tremor.
International Journal of Advance and Innovative Research Volume 6, Issue 2 (XXX): April – June, 2019
25
ISSN 2394 - 7780
c. There are gated spillway stone monuments, wide roadways, admission structures, or different stone monuments of bizarre shape or geometry.
d. The dam is in a debilitated condition due to mishap, maturing, or weakening. The necessities for a dynamic pressure examination for this situation will be settled on a venture by-venture premise in advisor and endorsed by CECW-ED.
DYNAMIC ANALYSIS PROCESS The method for playing out a dynamic examination incorporates the accompanying:
a. Survey the topography, seismology, and contemporary structural setting.
b. Decide the tremor sources.
c. Select the applicant most extreme dependable and working premise tremor extents and areas.
d. Select the constriction connections for the hopeful seismic tremors.
e. Select the controlling greatest dependable and working premise seismic tremors from the applicant quakes dependent on the most extreme ground movements at the site.
f. Select the plan reaction spectra for the controlling seismic tremors.
g. Select the suitable increasing speed time records that are perfect with the structure reaction spectra if quickening time history examinations are required.
h. Select the dynamic material properties for the solid and establishment.
I. Select the dynamic techniques for investigation to be utilized.
j. Play out the dynamic investigation.
k. Assess the worries from the dynamic investigation.
STABILITY AND STRESS ANALYSES The following assumptions are made for the Earth wall gravity dam
Freeboard = 30% of the reservoir height. Crest width = 0.23 times dam’s height. This is used to allow the passage of small vehicles, Base width = 0.87 times dam’s height. This is used to avoid tension in the base. Using similar triangles, θ = 48.80 and φ = 41.20
Figure – 4: STABILITY AND STRESS ANALYSES
VERTICAL FORCE: Vertical force = W1 (=γhl) + W2 (= 0.5γhl) + uplift (U = 0.5γhl) = 583.16kN Horizontal force Pw : Pw (= 0.5γh2 ) = 313.92kN
Sliding Criteria: F.S. = Net vertical force = 1.86
Horizontal force
1.86 > 1.6. Hence, sliding criteria is favourably satisfied.
OVERTURNING CRITERIA Sum of Overturning moment = 3051.16kNm
Sum of stabilizing moment = 5883.02kNm

International Journal of Advance and Innovative Research Volume 6, Issue 2 (XXX): April – June, 2019
26
ISSN 2394 - 7780
So that F.S. = 1.93 > 1.6. Hence, overturning criteria is favorably satisfied.
STRESS ANALYSIS Normal Stress at the toe considering the limiting case at e = 9.2/6 = 1.53m, Then, Pn = 0.127N/mm2
Principal Stress at the toe, σ1 = 0.072N/mm2
The stresses obtained are less than the allowable values, therefore safe against overstressing.
SYSTEM ANALYZED The 30m (100ft) high gravity dam to illustrate some of STAADPRO potentials. This dam that was used in USACE (2000) to evaluate and compare stability analysis and uplifting criteria for gravity dams by three US Federal agencies. The usual upstream and downstream reservoir elevations are set to 27.432m (90ft) and 1.524m (5ft), respectively. Lift joints are spaced at every 3.048m (10ft) in elevation from the base. The drainage system is initially considered according to USACE (1995) guideline, the drain position, efficiency and the elevation of the drainage gallery.
Figure – 5: MODEL STRUCTURE
Figure – 6: STRUCTURE WITH 3D VIEW
Figure -7 : STRUCTURE WITH BENDING MOMENT

International Journal of Advance and Innovative Research Volume 6, Issue 2 (XXX): April – June, 2019
27
ISSN 2394 - 7780
Figure – 8: STRUCTURE WITH STRESS
Figure – 9: STRUCTURE WITH STRESS
PERSPECTIVES FOR FUTURE DEVELOPMENTS There are practically unlimited potential outcomes for further advancements of a PC program like STAADPRO for basic wellbeing evaluation of gravity dams. As of now, the arrangement is to include the accompanying highlights:
From pseudo-static or a pseudo-unique seismic investigation, the lift joint most vulnerable to splitting can be effectively acquired utilizing STAADPRO. Count of seismic sliding relocations and shaking reaction of broke dam parts utilizing transient powerful examination of unbending body is imagined. Calculation of removals utilizing pillar hypothesis for the dams and Bossiness coefficients for the semi-interminable flexible establishment. Warm investigation will be performed along lift joints utilizing limited contrasts to assess the warm field required for warm relocation and stress calculations. The dislodging reaction of a 2D model could be aligned against that of a starter 3D limited component model to decide the part of the hydrostatic burden that is opposed in an unadulterated cantilever mode. Unit warm loads could likewise be utilized for alignment purposes.
CONCLUSION STAADPRO gives an exceptionally flexible figuring condition to learn or explore demonstrating suppositions and computational procedures identified with the static and seismic basic dependability of gravity dams dependent on the gravity strategy. It has been appeared in this paper a few suppositions identified with burden conditions, breaking criteria, inspire weights forces and investigation method could be utilized for static, seismic, and post-seismic wellbeing appraisals all in all, the calculations are perplexing to perform because of the coupling between the elevate weight and split length. In a real circumstance, parametric examinations are regularly performed to cover vulnerabilities in quality and stacking parameters to take proper choice concerning a specific structure.
The creators have effectively utilized STAADPRO as a computational research facility in workshops, to engineers from training, engaged with dam security assessment STAADPRO is likewise utilized for modern applications and R&D in dam building and has been broadly approved amid the previous years. The association of the program and the specific highlights that have been introduced in this are valuable for those keen on the advancement and utilization of PC helped dependability investigation of gravity dams.
REFERENCES [1] Adedeji, A. A. (2004); Finite Element Method, CVE 567 Lecture Notes, Department of Civil ngineering,
University of Ilorin, Ilorin.

International Journal of Advance and Innovative Research Volume 6, Issue 2 (XXX): April – June, 2019
28
ISSN 2394 - 7780
[2] Bathe, K. J. (1996); Finite Element Procedures, Seventh Edition, PrenticeHall Inc, New Jersey.
[3] CIWAT ENGINEERS (1996); Design Report of the University of Ilorin Dam, CIWAT ENGINEERS, Ilorin, pp 14 – 25.
[4] EM 111022200 (1995); Design of Concrete Gravity Dams, Engineer Manual of the US Army Corps of Engineers, US Army Corps Publications Depot, National Technical Information Service, Springfield, VA, www.us.armycorps.engineers.com/engineer’s manual.
[5] Fenves, G. L. and VargasLoli, M. (1988); NonLinear Analysis of FluidStructure Systems, Journal Of Engineering Mechanics Division, ASCE Vol. 114, pp 219 – 240.
[6] Hatami, K. (2001); Seismic Analysis of Concrete Dams, National Defence, Royal Military College of Canada, www.zworks.com/seismic analysis/concrete dams/ Seismic Analysis of Concrete Dams.
[7] Iroko, A. O. (2001); Hysterical Analysis of Strawbale as an Infill Material Subjected to Seismic Loadings (Vibration), B. Eng. Project, Submitted to the Dept. of Civil Engineering, University of Ilorin, Ilorin.
[8] Lotfi, V. (2001); Seismic Analysis of Concrete Gravity Dams using Decoupled Modal Approach in Time Domain, Electronic Journal Of Structural Engineering, Vol. 3, www.ejse.org, pp 102 – 116.
[9] Major, A. (1980); Dynamics in Civil Engineering, Vol. I IV, Second Edition, Collet’sHoldings Ltd, London.
[10] Polyakov, S. V. (1985); Design of EarthquakeResistant Structures, Second Edition, MirPublishers.
[11] Hansen, K. and Mc Lean, G. (1992), “Roller compacted concrete”, Proceeding of the Conference Roller Compacted Concrete Dams in USA (ASCE), February 2-5
[12] Hooton, R.D. (2000), “Canadian use of ground granulated blast furnace slag as a supplementary cementing material for enhanced performance of concrete”, Can. J. Civil Eng., 27, 754-760
[13] Francesco, A. (2003), “Thermal analysis of RCC dams during considerations”, Proceeding of the 7th ICOLD Benchmark Workshop on Numerical Analysis of Dams, Bucarest (Romania), 24-26 September
[14] Luna, R. and Wu, Yang (2005), “Simulation of temperature and stress fields during RCC dam construction”, Jl. Const. Eng. Mngt., 125(5), 362-368

International Journal of Advance and Innovative Research Volume 6, Issue 2 (XXX): April – June, 2019
29
ISSN 2394 - 7780
A STUDY ON STREAMBED HYDRAULIC CONDUCTIVITY OF BANAS RIVER, RAJASTHAN
Saurabh Singh, Ashish Kumar Sewaliya, Babita Pandey and Ankit Malav
Department of Civil Engineering, Poornima Institute of Engineering & Technology, Jaipur
ABSTRACT Theoretical hydraulic conductivity is one of the chief and most imperative soil water driven qualities (parameters). The spatial variety of streambed vertical pressure driven conductivity of Banas riverbed utilizing field standpipe permeameter test, research center steady head permeameter test and grain measure examination (experimental) strategies were done in this paper. The outcomes demonstrated that there was a wide variety of qualities got from lab test, field test and grain estimate investigation techniques. The qualities from research facility test were littler than those of field test in all areas. Streambed esteems determined by lab steady head test were most minimal and that determined by Kozeny-Carman condition were higher than different strategies[2]. Three Location were taken into consideration A, B & C respectively Dewali, Achar & Bagina. Along the waterway, the streambed esteems diminished from area A to area B. At area C, the qualities were observed to be higher than that at area B.it is observed that results obtained from empiraical formulas are less as compared to laboratory test.
Keywords: Streambed hydraulic conductivity, Banas River, spatial variation, permeameter tests, empirical methods, sorting coefficient.
INTRODUCTION The primary objective of this study was to determine the spatial variation of streambed vertical hydraulic conductivity along Banas River during winter season. water powered properties of a streambed are real control in the hydrologic association between a stream and an aquifer [3]. They are key parameters in the figuring of stream exhaustion. Better understandings on the affectability of different water driven properties are helpful for model improvement and application purposes.
Streambed attributes, for example, vertical pressure driven conductivity, bed material, thickness, width, geology, and the bend impact the streambed water driven properties and in this way water development[4]. The utilization of stream laws to building issues, for example, structure of earth dams, following dams, dirt liner for waste administration practice, and incline exposed to rain water invasion requires the evaluation of pressure driven properties of soil.
Demonstrating of a groundwater framework is commonly founded on unraveling numerical conditions containing numerous parameters portraying the framework. So as to have a solid model, its parameter esteems should accommodate their genuine ones[5]. In some cases the parameters can be estimated from tests in the field or in a lab, or they can be controlled by exceptionally planned siphoning admirably tests. Accurate estimation of aquifer properties, for example, pressure driven conductivity, transmissivity and storativity are viewed as critical for fruitful groundwater advancement and the board rehearses Hydraulic conductivity is one of the chief and most essential soil pressure driven qualities (parameters) and it is a vital factor in water transport in the dirt and is utilized in all conditions for groundwater (subsurface water) stream[6]. The estimation of an immersed soil speaks to its normal water powered conductivity, which depends predominantly on the size, shape, and circulation of the pores. It likewise relies upon the dirt temperature and the consistency and thickness of the water. In some structure-less soils (sandy soils) the esteem is the equivalent every which way, yet as a rule the qualities fluctuates with stream course[7]. Anisotropy assumes essential job in soil hydrology. Pressure driven conductivity in vertical and flat bearing is set apart as , and incentive moderate way is. Soil layers vertical water driven conductivity is all the time not quite the same as even conductivity due to vertical contrasts in the structure, surface and porosity[8]. The vertical and even pressure driven conductivities of the streambed assume essential jobs in surface water and groundwater trades. Along these lines, assurance of the streambed anisotropy is of significance in the examination of stream-aquifer associations.
The penetrability coefficient of the riverbed is a key factor in the estimation of groundwater revive from streams. Streambed vertical pressure driven conductivity likewise assumes a vital job in comprehension and measuring the stream-aquifer communications and stream environments[2]. Higher streambed instigates a higher rate of stream consumption due to groundwater withdrawal. In this manner, learning of streambed is basic to describe hydrologic associations between a stream and its nearby aquifers, and is a fundamental parameter in numerical displaying of stream-aquifer collaborations[1]. Assurance of the streambed vertical water driven conductivity of the whole riverbed has huge significance for the investigation of groundwater
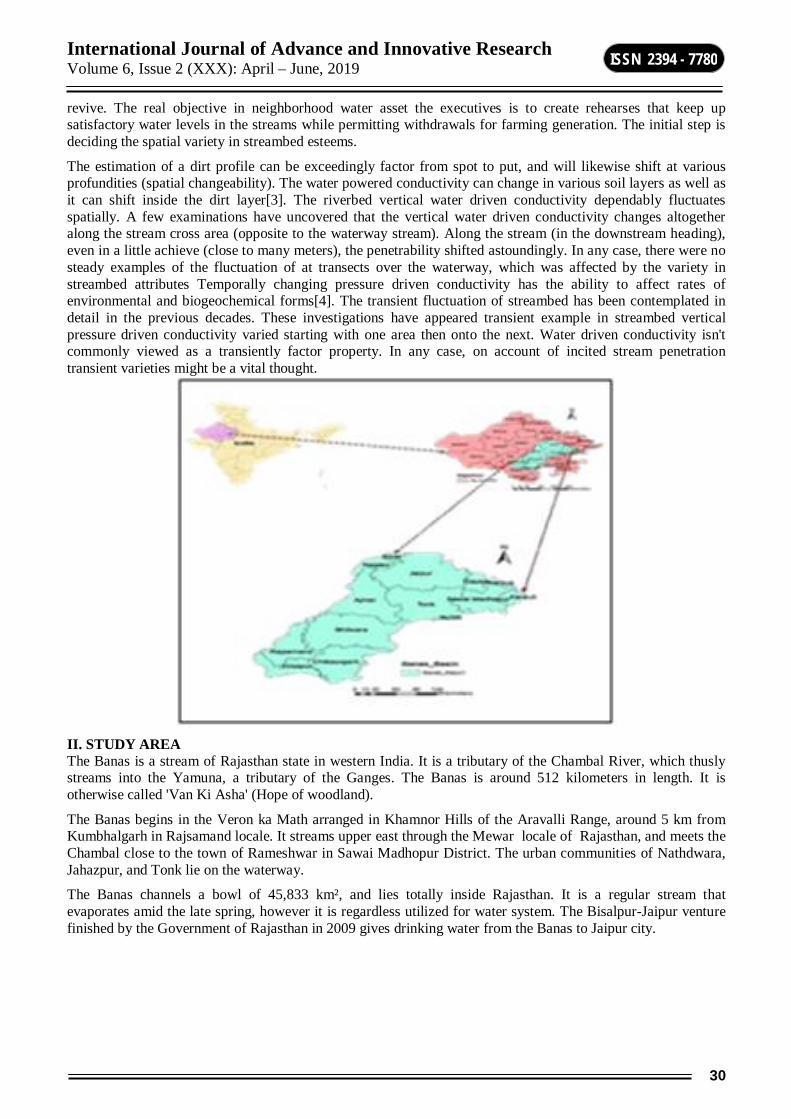
International Journal of Advance and Innovative Research Volume 6, Issue 2 (XXX): April – June, 2019
30
ISSN 2394 - 7780
revive. The real objective in neighborhood water asset the executives is to create rehearses that keep up satisfactory water levels in the streams while permitting withdrawals for farming generation. The initial step is deciding the spatial variety in streambed esteems.
The estimation of a dirt profile can be exceedingly factor from spot to put, and will likewise shift at various profundities (spatial changeability). The water powered conductivity can change in various soil layers as well as it can shift inside the dirt layer[3]. The riverbed vertical water driven conductivity dependably fluctuates spatially. A few examinations have uncovered that the vertical water driven conductivity changes altogether along the stream cross area (opposite to the waterway stream). Along the stream (in the downstream heading), even in a little achieve (close to many meters), the penetrability shifted astoundingly. In any case, there were no steady examples of the fluctuation of at transects over the waterway, which was affected by the variety in streambed attributes Temporally changing pressure driven conductivity has the ability to affect rates of environmental and biogeochemical forms[4]. The transient fluctuation of streambed has been contemplated in detail in the previous decades. These investigations have appeared transient example in streambed vertical pressure driven conductivity varied starting with one area then onto the next. Water driven conductivity isn't commonly viewed as a transiently factor property. In any case, on account of incited stream penetration transient varieties might be a vital thought.
II. STUDY AREA The Banas is a stream of Rajasthan state in western India. It is a tributary of the Chambal River, which thusly streams into the Yamuna, a tributary of the Ganges. The Banas is around 512 kilometers in length. It is otherwise called 'Van Ki Asha' (Hope of woodland).
The Banas begins in the Veron ka Math arranged in Khamnor Hills of the Aravalli Range, around 5 km from Kumbhalgarh in Rajsamand locale. It streams upper east through the Mewar locale of Rajasthan, and meets the Chambal close to the town of Rameshwar in Sawai Madhopur District. The urban communities of Nathdwara, Jahazpur, and Tonk lie on the waterway.
The Banas channels a bowl of 45,833 km², and lies totally inside Rajasthan. It is a regular stream that evaporates amid the late spring, however it is regardless utilized for water system. The Bisalpur-Jaipur venture finished by the Government of Rajasthan in 2009 gives drinking water from the Banas to Jaipur city.

International Journal of Advance and Innovative Research Volume 6, Issue 2 (XXX): April – June, 2019
31
ISSN 2394 - 7780
Fig.1 Banas River Map
III. METHODOLOGY Hydraulic conductivity is estimated by field test, and empirical formulas.
Empirical approach by which the hydraulic conductivity is correlated to soil properties like pore size and particle size (grain size) distributions, and soil texture.
A. Field Standpipe Permeameter Test The field standpipe permeameter test (SP) involves inserting a pipe vertically into the streambed, filling the pipe with river water, measuring the rate of decline of the water level, and then calculating the vertical hydraulic conductivity using the rate of decline (Fig.2).
Fig.2 Standpipe apparatus
B. Sediment Sampling Once the field standpipe permeameter test was done, the soil samples using sampler were collected from about 25 cm distances around the standpipe sites so that there was no significant difference in the soil characteristics. The samples were then collected in sampling bags and brought to the laboratory for lab test.
C. Viscosity Spherical pebbles were dropped into the pipe which was fully filled and perpendicular to the ground and time was recorded with the help of stopwatch.
D. Temperature Temperature of water was recorded with the help of thermometer.
E. Grain Size Analysis The test was performed using various type of sieves (4.75, 2.36, 1.18, 0.6 mm)
F. Empirical Methods Hydraulic conductivity can be assessed by molecule estimate investigation of the dregs of enthusiasm, utilizing exact conditions relating either to some size property of the silt.
(1)
210dnCgKv

International Journal of Advance and Innovative Research Volume 6, Issue 2 (XXX): April – June, 2019
32
ISSN 2394 - 7780
Where = kinematic viscosity for a given temperature; C = sorting coefficient (dimensionless); φ(n) = porosity function; d10= effective grain diameter.
Porosity can be estimated by equation (2).
(2)
Hazen formula: Hazen equation was initially produced for assurance of water powered conductivity of consistently reviewed sand but on the other hand is helpful for fine sand to rock run, gave the residue has a consistency coefficient under 5 and viable grain estimate somewhere in the range of 0.1 mm and 3mm.
(3)
Kozeny-Carman Equation: The Kozeny-Carman condition is a standout amongst the most broadly acknowledged and utilized inductions of porousness as a component of the attributes of the dirt medium. This condition isn't suitable for either soil with viable size above 3mm or for clayey soils.
(4)
Slitcher formula: Slitcher formula is most applicable for grain-size between 0.01mm and 5mm.
(5)
Terzaghi formula: Terzaghi formula is most applicable for large-grain sand and is given by equation (6)
(6)
Breyer formula: Breyer equation is regularly viewed as most helpful for materials with heterogeneous appropriations and ineffectively arranged grains with consistency coefficient somewhere in the range of 1 and 20, and successful grain estimate somewhere in the range of 0.06mm and 0.6mm.
(7)
Fig.3 parameters used in empirical formulas
Un 85.01255.0
210
4 26.0101106 dngKv
2
102
33
1103.8 d
nngKv
210
287.32101 dngKv
210
2
3 113.0 dn
nCgKv
210
4 500log106 dU
gK v

International Journal of Advance and Innovative Research Volume 6, Issue 2 (XXX): April – June, 2019
33
ISSN 2394 - 7780
IV. RESULT AND DISCUSSION A study was carried out on streambed vertical hydraulic conductivity of Banas River and the results of this study were reported in this paper. This study was carried out using field standpipe permeameter test, laboratory constant head permeameter test and grain size analysis methods.
Table I : Specific Gravity Of Different Soil Samples
S.No. location Bagina (A)
Achar (B)
Dewali (C)
1 ! 2.75 2.76 2.2 2 2 1.92 2.18 2.1 3 3 2.233 2.84 2.429 4 4 2.493 2.8 2.435
From table I it is observed that specific gravity varies from 2.1 to 2.84. There is no uniform pattern of specific gravity variation but at the initial points specific gravity is high as compared to other point which is at 4 m away from first point.
The effective grain size is estimated by plotting the semi log graph between sieve size and percentage finer.
Fig.3 Grain Size Analysis for Location A
Fig.4 Grain Size Analysis for Location B
Fig.5 Grain Size Analysis for Location C

International Journal of Advance and Innovative Research Volume 6, Issue 2 (XXX): April – June, 2019
34
ISSN 2394 - 7780
Hydraulic conductivity by empirical formulas and field test is shown in figure 6,7 & 8. It is observed that field test are having more value of hydraulic conductivity in all the locations as compared to empirical methods. This variation is because hydraulic conductivity depends upon grain size, texture of particle, impurities of soil sample, temperature and viscosity of fluid but in empirical formulas only grain size is considered.
Fig. 6 HC Field and lab Analysis at location A
Fig. 7 HC Field and lab Analysis at location B
Fig. 8 HC Field and lab Analysis at location C
Where 1 = Hazen Formula, 2 = kozeny-Carman,
3 = Slitcher Formula, 4 = Breyer Formula,
5 = Terzaghi Formula, 6 = Field test
V. CONCLUSION 1. There was a wide variety of qualities got from field test and grain measure examination techniques. The
qualities from lab test were littler than those of field test in all areas. Streambed esteems got from Kozeny Carman was the most astounding pursued by Hazen, Breyer, Terzaghi and Slitcher.
2. Along the waterway, the streambed esteems diminished from area A to area B. At area C, the qualities were observed to be higher than that at area B.The streambed vertical water driven conductivity esteems got in summer season were bigger than those acquired amid winter season.
3. It was seen that (according to IS soil order and grain measure examination), the dirt examples of all areas had a place with sand , and the examples can be either spotless sands or sand with considerable measure of

International Journal of Advance and Innovative Research Volume 6, Issue 2 (XXX): April – June, 2019
35
ISSN 2394 - 7780
fines. The examples taken from the transect focuses over the waterway demonstrated a pattern of increment in successful size of particles and porosity towards the center piece of stream.
4. The new benefits of arranging coefficient determined from Hazen, Kozeny Carman, Beyer, Slichter and Terzaghi strategies were significantly lower than their unique qualities. The qualities acquired by utilizing the new determined arranging coefficient were perfect with research center permeameter test results. Therefore, the determined qualities are relevant for the present examination.
VI. REFERENCES [1]. X. Chen, M. Burbach and C. Cheng, “Electrical and hydraulic vertical variability in channel sediments and
its effects on stream flow depletion due to groundwater extraction,” Journal of Hydrology, 352, pp 250– 266, 2008.
[2]. X.H. Chen , and L. Shu , “Groundwater evapotranspiration captured by seasonally pumping wells in river valleys”, Journal of Hydrology 318, 334–347, 2006.
[3]. D. Rocha, F. Abbasi, and J. Feyen, “Sensitivity analysis of soil hydraulic properties on subsurface water flow in furrows”, Journal of Irrigation and Drainage Engineering, Vol. 132, No. 4, August 1, ASCE, 2006.
[4]. I. Aaron, Packman, M. Salehin and M. Zaramella, “Hyporheic exchange with gravel beds: Basic hydrodynamic interactions and bedform-induced advective flows”, Journal of Hydraulic Engineering, Vol. 130, No. 7, July 1, 2004.
[5]. C. Gallage, J Kodikara and T. Uchimura, “Laboratory measurement of hydraulic conductivity functions of two unsaturated sandy soils during drying and wetting Processes", Soil and Foundations,Volume 53,Issue 3, Page 417-430, June 2013.
[6]. M. A. E. Ibrahim, “Calibration of hydraulic conductivities in groundwater flow models using the double constraint method and the Kalman filter”, Department of Hydrology and Hydraulic Engineering, Vrije Universiteit Brussel, V U B – Hydrologie (72),2013.
[7]. R. J. Oosterbaan and H.J. Nijland,“Determining the saturated hydraulic conductivity,” International Institute for Land Reclamation and Improvement ( ILRI), Publication 16, second revised edition, Wageningen, Netherlands,1994.
[8]. J. Stibinger, “Examples of determining the hydraulic conductivity of soils theory and applications of selected basic methods” University Handbook on Soil Hydraulics, 2014.

International Journal of Advance and Innovative Research Volume 6, Issue 2 (XXX): April – June, 2019
36
ISSN 2394 - 7780
IMPROVING THE PROPERTIES OF PERVIOUS CONCRETE BY ADDING IRON SLAG AND FLY ASH
Rituraj Singh Rathore, Bhawani Singh Rathore, Jitesh Kumawat and Kuldeep Kumawat Department of Civil Engineering, Poornima Institute of Engineering & Technology, Jaipur
Abstract Now a day’s during the rainy season runoff water is often seen on the surface of the road which deteriorate the road surface and reduce the strength and the age of that road surface. Due to this runoff water on the road surface people faces many problems during travelling from that road. To reduce the runoff water on the road surface during the rainy season, pervious concrete road is also used at some places in place of normal concrete road. The main objective of this project work is to examine the effect when addition of 0%, 3%, 6%, 9%, 12% iron slag with the 50% fly ash in the pervious concrete and to check that is there any type of enhancing or increment in the various properties of pervious concrete, so it can be used for road construction in the areas where the runoff water is likely to be on the road surface during rainy season. If there is a sufficient increase in the compressive strength and various other properties of pervious concrete on adding iron slag and fly ash, then it can be used for road construction in the areas where heavy traffic moves on the road and during rainy season the runoff water is seen on the road surface often.
Keywords: Pervious concrete, runoff water, fly ash, iron slag.
INTRODUCTION ERVIOUS cement (likewise called permeable concrete, penetrable cement, no fines concrete and permeable asphalt) is a unique sort of cement with a high porosity utilized for solid flatwork applications that permits water from precipitation and different sources to go legitimately through, in this manner diminishing the spillover from a site and permitting groundwater revive.[1]
Pervious cement is made utilizing substantial totals with next to zero fine totals. The solid glue at that point coats the totals and enables water to go through the solid section.[2] Pervious cement is generally utilized in stopping regions, zones with light traffic, private avenues, passerby walkways, and nurseries
The appropriate use of pervious cement is a perceived Best Management Practice by the U.S. Ecological Protection Agency (EPA) for giving first flush contamination control and stormwater the board As guidelines further point of confinement stormwater overflow[3], it is ending up increasingly costly for property proprietors to grow land, because of the size and cost of the essential waste frameworks. Pervious solid brings down the destinations SCS Curve Number by holding storm water nearby. [4]This permits the organizer/originator to accomplish pre-improvement stormwater objectives for asphalt extraordinary tasks. Pervious cement decreases the spillover from cleared territories, which diminishes the requirement for isolated stormwater maintenance lakes and permits the utilization of littler limit storm sewers. This enables property proprietors to build up a bigger territory of accessible property at a lower cost[5]. Pervious cement additionally normally channels stormwater and can lessen toxin loads going into streams, lakes and waterways.
Pervious solid capacities like a tempest water invasion bowl and permits the tempest water to invade the dirt over an expansive territory, in this manner encouraging revive of valuable groundwater supplies locally. These advantages lead to progressively viable land use[6]. Pervious cement can likewise diminish the effect of improvement on trees. A pervious solid asphalt permits the exchange of both water and air to attach frameworks enabling trees to thrive even in profoundly created regions.
Objective of this project
The aim of this project is follows; To determine the effect of material proportions on the engineering properties of permeable concrete.[7]
The main objective is to investigate the performance characteristics of the permeable concrete such as porosity, compressive strength and other engineering properties on adding the iron slag and fly ash.
Identification of best result i.e. ratio at which iron slag and fly ash in pervious concrete together giving maximum result.[8]
Effect of iron slag and fly ash content on the properties of permeable concrete i.e. compressive strength, impact strength.
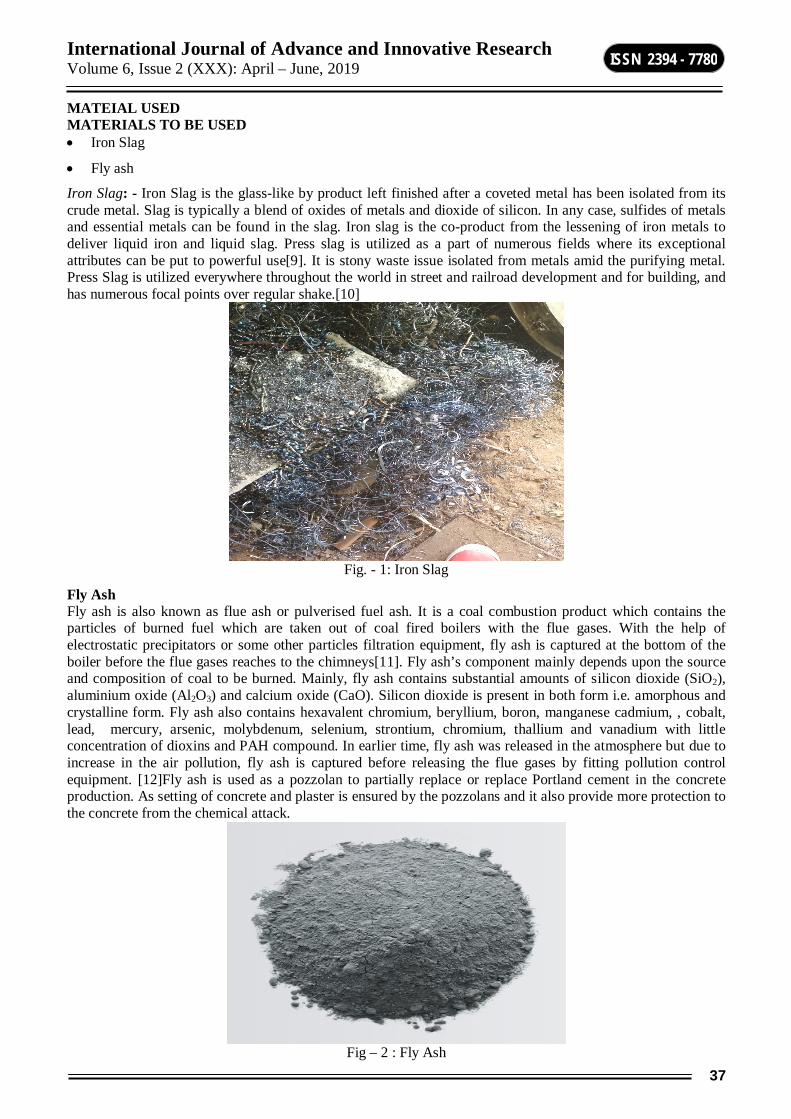
International Journal of Advance and Innovative Research Volume 6, Issue 2 (XXX): April – June, 2019
37
ISSN 2394 - 7780
MATEIAL USED MATERIALS TO BE USED Iron Slag
Fly ash
Iron Slag: - Iron Slag is the glass-like by product left finished after a coveted metal has been isolated from its crude metal. Slag is typically a blend of oxides of metals and dioxide of silicon. In any case, sulfides of metals and essential metals can be found in the slag. Iron slag is the co-product from the lessening of iron metals to deliver liquid iron and liquid slag. Press slag is utilized as a part of numerous fields where its exceptional attributes can be put to powerful use[9]. It is stony waste issue isolated from metals amid the purifying metal. Press Slag is utilized everywhere throughout the world in street and railroad development and for building, and has numerous focal points over regular shake.[10]
Fig. - 1: Iron Slag
Fly Ash Fly ash is also known as flue ash or pulverised fuel ash. It is a coal combustion product which contains the particles of burned fuel which are taken out of coal fired boilers with the flue gases. With the help of electrostatic precipitators or some other particles filtration equipment, fly ash is captured at the bottom of the boiler before the flue gases reaches to the chimneys[11]. Fly ash’s component mainly depends upon the source and composition of coal to be burned. Mainly, fly ash contains substantial amounts of silicon dioxide (SiO2), aluminium oxide (Al2O3) and calcium oxide (CaO). Silicon dioxide is present in both form i.e. amorphous and crystalline form. Fly ash also contains hexavalent chromium, beryllium, boron, manganese cadmium, , cobalt, lead, mercury, arsenic, molybdenum, selenium, strontium, chromium, thallium and vanadium with little concentration of dioxins and PAH compound. In earlier time, fly ash was released in the atmosphere but due to increase in the air pollution, fly ash is captured before releasing the flue gases by fitting pollution control equipment. [12]Fly ash is used as a pozzolan to partially replace or replace Portland cement in the concrete production. As setting of concrete and plaster is ensured by the pozzolans and it also provide more protection to the concrete from the chemical attack.
Fig – 2 : Fly Ash

International Journal of Advance and Innovative Research Volume 6, Issue 2 (XXX): April – June, 2019
38
ISSN 2394 - 7780
METHODOLGY Compressive Strength As we are including the iron slag and fly fiery debris in the pervious cement to build its compressive quality with the goal that it can hold up under the overwhelming burden at that point to decide the compressive quality this is performed. As compressive quality is the material's ability to contradict the rigidity. [13]Out of many test connected to the solid, this is the most extreme imperative which gives a thought regarding every one of the attributes of cement. By this single test one judge that in the case of Concreting has been done appropriately or not. Compressive quality of cement relies upon numerous elements,[14] for example, water-bond proportion, concrete quality, nature of solid material, Quality control amid creation of cement and so forth., Test for compressive quality is done either on 3D shape or chamber. Different standard codes prescribe solid barrel or solid 3D shape as the standard example for the test. For 3D square test two kinds of examples either 3D shapes of 150 mm X 150 mm X 15 mm or 100 mm X 100 mm x 100 mm relying on the extent of total are utilized. For a large portion of the works cubical molds of size 150 mm x 150 mm x 150 mm are regularly utilized.[15]
This solid is poured in the form and tempered appropriately so as not to have any voids. Following 24 hours these molds are expelled and test examples are placed in water for relieving. The top surface of these example ought to be made even and smooth. This is finished by putting bond glue and spreading easily on entire territory of example[16]
Permeability of pervious concrete The permeability is the property to allow the water to flow through it. Generally, the permeability is determined either by constant head permeability test or by variable head permeability test. In our project work, we have taken variable head permeability test as it suits best for the pervious concrete.
To determine the permeability of permeable concrete, we have prepared a beam of size 400*400*60mm. The permeability test is conducted for the standard pervious concrete (0% fines),[17] pervious concrete with 8% fine aggregates, pervious concrete with 10% fine aggregates, pervious concrete with 10% fly ash as cement replacement and pervious concrete with 10% rice husk ash as cement replacement tested after 28 days from preparation.
The permeability of pervious bond was settled using a falling head vulnerability set up.Water was permitted to move through the example, through an associated standpipe which gives the water head. Prior to beginning the stream estimation, the examples were wrapped with polythene inside the barrel. At that point the test begun by enabling water to move through the example until the water in the standpipe achieved a given lower level. A consistent time of 5seconds was taken for the water to tumble starting with one head then onto the next in the standpipe. The standpipe was refilled and the test was rehashed when water achieved a lowerThe vulnerability of the pervious strong model was surveyed from the enunciation given underneath.
Recipe: K=2.303 aL/A (t2-t1) log (h1/h2)
Where,
a = the example cross segment territory
A = the cross section of the standpipe of diameter (d) = 0.95cm2
L = the height of the pervious concrete
(t2 - t1) = change in time for water to fall from one level to another (5secs.)
h1= upper water level
h2= Lower water level
D= diameter of sample (10.5cm)
d= diameter of standpipe (1.1cm)
Impact strength of the pervious concrete The property of a material to oppose sway is known as sturdiness. Because of development of vehicles out and about the totals are exposed to affect bringing about their stalling into littler pieces.
The totals ought to hence have adequate sturdiness to oppose their crumbling because of effect. This trademark is estimated by effect esteem test.

International Journal of Advance and Innovative Research Volume 6, Issue 2 (XXX): April – June, 2019
39
ISSN 2394 - 7780
The total effect esteem is a proportion of protection from unexpected effect or stun, which may contrast from its protection from step by step connected compressive burden.
Use either SI (MKS) or CGS as essential units. (SI units are firmly empowered.) English units might be utilized as auxiliary units (in enclosures). This applies to papers in information stockpiling. For instance, state "15 Gb/cm2 (100 Gb/in2)." A special case is when English units are utilized as identifiers in exchange, for example, "3½-in plate drive." Avoid joining SI and CGS units, for example, current in amperes and attractive field in oersteds. This regularly prompts perplexity since conditions don't adjust dimensionally. In the event that you should utilize blended units, plainly express the units for every amount in a condition.
The SI unit for attractive field quality H is A/m. In any case, on the off chance that you wish to utilize units of T, either allude to attractive transition thickness B or attractive field quality symbolized as µ0H. Utilize the middle dab to isolate compound units.

International Journal of Advance and Innovative Research Volume 6, Issue 2 (XXX): April – June, 2019
40
ISSN 2394 - 7780
RESULTS AND DISCUSSION Compressive Strength test
As far as possible test is resolved for compressive strength of pervious concrete. in as far as possible test included diverse % of impact of iron slag then as far as possible is decreases, so that there is decrease in the compressive strength.
Compressive strength
Normal pervious concrete
After 7 days of curing = 4.66 MPa
After 14 days of curing = 8 MPa
After 28 days of curing = 12.4 MPa
Pervious concrete with iron slag and fly ash
1. With 3% iron slag and 50% fly ash by weight
After 7 days of curing = 5,23 MPa
After 14 days of curing = 9.43 MPa
After 28 days of curing = 12.59 MPa
2. With 6% iron slag and 50% fly ash by weight
After 7 days of curing =5.30 MPa
After 14 days of curing = 8.67 MPa
After 28 days of curing = 12.85 MPa
3. With 9% iron slag and 50% fly ash by weight
After 7 days of curing = 5.49 MPa
After 14 days of curing = 8.59 MPa
After 28 days of curing = 13.05 MPa
4. With 12% iron slag and 50% fly ash by weight
After 7 days of curing = 5.87 MPa
After 14 days of curing =8.98 MPa
After 28 days of curing = 13.53 MPa
5. With 12% iron slag and 50%fly ash by weight
After 7 days of curing = 6. 07 MPa
After14 days of curing = 9.03 MPa
After 28 days of curing = 14.01 MPa
Impact test
In impact test, impact strength of the pervious concrete is determined. In the impact test, iron slag and fly ash is added in the different % then there is a increase in the impact strength of the pervious concrete.
Impact strength
Normal pervious concrete
After 7 days of curing = 3.51 MPa
After 14 days of curing = 16.93 MPa
After 28 days of curing = 27.572 MPa
Pervious concrete with iron slag and fly ash

International Journal of Advance and Innovative Research Volume 6, Issue 2 (XXX): April – June, 2019
41
ISSN 2394 - 7780
1. With 3% iron slag and 50% fly ash by weight
After 7 days of curing = 3.65 MPa
After 14 days of curing = 17.02 MPa
After 28 days of curing = 27.60 MPa
2. With 6% iron slag and 50% fly ash by weight
After 7 days of curing =3.73 MPa
After 14 days of curing = 17.19 MPa
After 28 days of curing =27.69 MPa
3. With 9% iron slag and 50% fly ash by weight
After 7 days of curing = 3.86 MPa
After 14 days of curing = 17.27 MPa
After 28 days of curing= 27.77 MPa
4. With 12% iron slag and 50% fly ash by weight
After 7 days of curing = 3.92 MPa
After 14 days of curing =17.38 MPa
After 28 days of curing = 27.84 MPa
5. With 15% iron slag and 50%fly ash by weight
After 7 days of curing = 3.74 MPa
After14 days of curing = 16.95 MPa
After 28 days of curing = 26.89 MPa
Permeability
1. Three example of cement every one of 200mm dia and 120mm tallness are thrown.
2. Following 1 day, the center bit of 100mm dia is roughened and the rest of the part is fixed with concrete glue.
3. The example are relieved for 28 days and after that water weight is connected on the center roughened part with the goal that water can enter inside the solid. The water weight is kept up as given underneath:
• 1 bar (1kg/cm2) for 48 hours.
• 3 bars for next 24 hours.
• 7 bars for next 24 hours.
After this, the example are part to know the entrance of water. The example are part in pressure machine by applying amassed load at two corner to corner inverse focuses somewhat far from focal hub
Permeability
Normal pervious concrete
After 7 days of curing =0.053 cm/s
After 14 days of curing = 1.41 cm/s
After 28 days of curing = 3.25 cm/s
Pervious concrete with iron slag and fly ash
1. With 3% iron slag and 50% fly ash by weight
After 7 days of curing = 0.060 cm/s
After 14 days of curing = 1.50 cm/s

International Journal of Advance and Innovative Research Volume 6, Issue 2 (XXX): April – June, 2019
42
ISSN 2394 - 7780
After 28 days of curing = 3.38 cm/s
2. With 6% iron slag and 50% fly ash by weight
After 7 days of curing =0.072 cm/s
After 14 days of curing = 1.61 cm/s
After 28 days of curing =3.49cm/s
3. With 9% iron slag and 50% fly ash by weight
After 7 days of curing = 0.079 cm/s
After 14 days of curing = 1.73 cm/s
After 28 days of curing= 3.57 cm/s
4. With 12% iron slag and 50% fly ash by weight
After 7 days of curing = 0.085 cm/s
After 14 days of curing =1.81 cm/s
After 28 days of curing = 3.71 cm/s
5. With 15% iron slag and 50%fly ash by weight
After 7 days of curing = 0.073 cm/s
After14 days of curing = 1.64 cm/s
After 28 days of curing = 3.40 cm/s
CONCLUSION This investigation has focused on the impact of Iron Slag and Fly ash on the pervious concrete strength and permeability which is to be used in the road pavement. stabilizer on building properties specifically the swelling and quality properties of a very far reaching soil. In view of the examination discoveries, the accompanying conclusions are drawn: Permeability decreases with the increase in Iron slag content after 12% addition of iron slag.
Expansion of Iron Slag has significant impact on the compressive and impact strength of the pervious concrete. An expansion in Iron Slag content prompts a huge increment in most extreme go thickness away to 10% Iron Slag and past this rate.
There is increase in the compressive strength, impact strength and permeability of the permeable concrete when 3%,6%, 9% and 12% of iron slag with 50% of fly ash added.
There is decrease in the compressive strength, impact strength and permeability of the permeable concrete when 15% of iron slag with 50% of fly ash added.
REFERENCES 1. ACI 552R (2010): “Report on Pervious Concrete”, American Concrete Institute, Farmington Hills,
Michigan
2. Ajamu S.O., Jimoh A.A. “Evaluation of structural Performance of Previous Concrete in Construction”, International Journal of Engineering and Technology Volume 2 No. 5, May, 2012
3. Darshan S. Shah, Prof. J.R.Pitroda, “Assessment for use of Gravel in Pervious Concrete”, International Journal of Engineering Trends and Technology (IJETT) ISSN No. 2231-5381, Volume: 4, Issue: 10, October 2013, Page: 4306 – 4310
4. Ghafoori, N., and Dutta, S., “Building and Non pavement Applications of No-Fines Concrete,” Journal of Materials in Civil Engineering, Volume 7, Number 4, November 1995.
5. IS 8112:1989. Specifications for 53grade Portland cement, New Delhi, India: Bureau of Indian Standards.
6. IS: 2386 (Part III) – 1963, Indian Standard, Method of Test for Aggregates for Concrete, (Part III); Specific Gravity, Density, Voids, Absorption and Bulking, (Eighth Reprint); Bureau of Indian Standard, New Delhi, India. March 1997.

International Journal of Advance and Innovative Research Volume 6, Issue 2 (XXX): April – June, 2019
43
ISSN 2394 - 7780
7. IS: 2386 (Part IV) - 1963, Indian Standard, Method of Test for Aggregates for Concrete, (Part IV); Mechanical Properties, (Tenth Reprint); Bureau of Indian Standard, New Delhi, India. March 1997.
8. J.T. Kerven, V.R. Schaefer, Mixture proportioning considerations for improved freeze thaw durability of pervious concrete, J Mater Civil Eng (2013) 25:886–892.
9. Leming, M.L., Rooney, M.H., and Tennis, P.D., “Hydrologic Design of Pervious Concrete,” PCA R&D.
10. Narayanan Neithalath, Milani S. Sumanasooriya & Omkar Deo. (2010). Characterizing pore volume, sizes, and connectivity in pervious concretes for permeability prediction. Materials Characterization.
11. National Ready Mixed Concrete Association (NRMCA), Freeze Thaw Resistance of Pervious Concrete, Silver Spring, MD, May 2004.
a. 79
12. NRMCA, “What, Why, and How? Pervious Concrete,” Concrete in Practice series, CIP 38, Silver Spring, Maryland, May 2004b, 2 pages.
13. Obla K., Recent Advances in Concrete Technology, Sep. 2007, Washington DC3.
14. Pervious Concrete: Hydrological Design and Resources, CD063, CDROM, PCA, Skokie.
15. Pervious Pavement Manual, Florida Concrete and Products Association Inc., Orlando, FL.
16. Sri Ravindrarajah R. and Aoki Y. (2008),“Environmentally friendly porous concrete”, Proceedings of the Second International Conference on Advances in Concrete and Construction, Hyderabad, India, Feb 2008
17. Storm water Phase II Final Rule Fact Sheet Series, United States Environmental Protection

International Journal of Advance and Innovative Research Volume 6, Issue 2 (XXX): April – June, 2019
44
ISSN 2394 - 7780
REDUCING GREEN HOUSE GASES FROM AGRICULTURE
Vikas Sharma, Dilip Singh, Kunal Singh Rathore and Hitesh Meena Department of Civil Engineering, Poornima Institute of Engineering & Technology, Jaipur
ABSTRACT Estimate of molasses as compost has recently moved to enthusiasm on account of rapid depreciation of edge & dependence on agribusiness, including sugar business, on majority of imported N & K dung. molasses is mainly usage as a source of K, but it also has or critical points of interest, i.e expansion of natural grievances in dirt & microbial action related to nitrification. molasses also comprises auxiliary components in small quantities, phosphorus, sulfur, Ca & magnesium, & also several monitoring components. usage of molasses also reforms accumulation of dirt & reduces formation of crusts on surface in hard dirts. usage of molasses on farm is burdensome, i.e danger of ground H2O contamination if it is connected incorrectly & possibility of a variable supplement, making it difficult to apply in it. Moreover, its consistency makes management difficult & large number of offers in more extreme cases means application grievances. Molasses also needs to be collected proportionally in factory, although its ideal application is not really adaptable & entails capacity requirements. All above elements are measured & financial estimate of contracted molasses & inorganic compost, so that growers can make a well- trained & practical decision about usage of molasses on ranch. Similarly, interest in modern alcoholic beverages & ethanol, which usage molasses as a raw material, is enhancing. A result of creation of liquor & ethanol is vinasse or a concentrated structure. Consolidated molasses liquids (CMS), which is in fact also considered as a source of K-compost
I. INTRODUCTION Production of composts requires a lot of energy & generates considerable GHG emissions. It estimates that compost production consumes around 1.2% of world's energy & is responsible for about 1.2% of total GHG emissions. before, production of composts is an precious part of analysis of agricultural life cycle, where limits of system are broad enough to comprise indirect emissions of agricultural inputs. direct calculation of greenhouse gas emissions from production of composts for individual studies is grievance given broad variety of composts usage & complex processes involved in production. In addition, emission value required for such calculations are difficult to obtain or are limited in size & quality. During life cycle of compost products, GHG emissions can occur during extraction of resources, transport of raw materials & products & during compost. Production processes. Where possible, separate emission factors are provided for each step of this life cycle. emissions derived from application of composts in field were not taken into account. A brief review of Key processes involved in production of each type of compost & associated emissions. precious emissions of greenhouse gases resulting from production of composts are CO2, N2O & CH4. On account of continued humiliation of money in world, nearby compost costs in sugarcane plant have enhanced. Since September 2000, costs of N & K have enhanced individually by 40 & 65%. reform, producers have a motivating power to investigate less expensive sources of N, P& K that are locally accessible, including molasses. Grievances related to consistency of molasses in its application to fields have already deteriorated in general, but in this new monetary sphere it can be enhance attractive, especially in view of enormous content of K (± 3.5% K). In addition, re is a greater interest in molasses to refine liquor that compete accordingly for its usage as compost. Study attempts to describe study of money-saving benefits of molasses primarily as a source of K compost for producers, given this new financial environment. cooking composts give dirt additional N to develop crops. Its usage is often considered precious in order to make agribusiness financially appropriate. In any case, repeated usage or misusage of this compost is costly & terrible for biological system. Farmers are launching a procedure renowned as green dung, including common miracle of obsession with natural N. By capturing green fertilization, we can get closer to achieving goal of depleting ozone layer for outflow of substances, a decrease of 43% compared to opposite dimensions to 2030 & 2005. Since agriculture is responsible for around 24% of global discharges of ozone-depleting substances. In view of natural grievance that is present in natural compost, structure of dirt has been reformed & n capacity of dirt to attach H2O & complement enhances. Fertilized compost consists of carbon atoms without carbon.
se particles can occasionally be grievance & are not available to organisms. Natural compost is naturally rich in natural matter, which means that microorganisms can bloom. Manufactured dung flows into our pipelines & affects marine life & H2O quality. Natural composting does not continue to drain as effectively (if it occurs in any way) & is related to structure of dirt. natural compost can be more exorbitant than one developed, it can reduce need for pesticides & general condition of N, P& K. On account of decreases, natural compost can be

International Journal of Advance and Innovative Research Volume 6, Issue 2 (XXX): April – June, 2019
45
ISSN 2394 - 7780
independent of cost & part of time costs money. Some manufactured compost can damage plants to leaves & roots. This is more uncertain with natural composts.
II. MOLASSES AS A COMPOST molasses is result of converting sugar cane, grapes or sugar beet into sugar. opaque, rich & fairly sweet liquid is normally usage as sugar in warm products, as a characteristic solution for some conditions, & is added to feeding of beings. Although it is a side effect, molasses is full of nutrients & minerals. sugar refining process undergoes 3 phases, each producing a type of molasses product. Black belt molasses is made from third sugar that bubbles in refining process. Blackstrap molasses is rich in Ca, magnesium, iron & K. It also comprises sulfur & a large group of micronutrients. usage of molasses as compost gives plants a source of vitality & reforms development of usageful microorganisms. Molasses is mainly usage as a source of K; however, it also has or critical favorable conditions, i.e expansion of natural grievances in dirt & microbial action related to nitrification. molasses also comprises optional components in small quantities, i.e phosphorus, sulfur, Ca & magnesium, as well as several monitoring components. usage of molasses also reforms dirt collection & reduces formation of crusts on surface. In addition to nutrient supply, some of or beneficial effects reported by researchers comprise a physical reformment in dirt structure & an enhance in biological activity of beneficial microorganisms, such as dirt fungi, after partial dirt sterilization. Dirt fungi produce strong mycelium growth & cover dirt particles in contact with molasses. Some types of dirt fungi are also nematodes or nematodes that destroy & can parasitize & kill nematodes (Tianco, 1983). On debit side, molasses contain large amounts of fermentable sugars that can temporarily immobilize or bind available N of plant in organic form, causing leaves to yellow on account of a transient N deficiency. half of compost N must be applied at about same time if molasses is applied. Eventually immobilized N will be liberated or mineralized & collected by walking stick. rate of N release will depend on how well dirt is aerated. Molasses may not be applied to poorly permeable dirt.
ADVANTAGE Molasses is a good source of K. enhance in organic matter & microbial activity reforms nitrification. re are numerous trace elements in molasses in substantial quantities. Molasses reforms aggregation of dirt & reduces crusting of dirt. molasses reforms aggregation of dirt & reduces formation of crusts on surface of dirt. Supplements for your plants. RCW Nurseries in Houston, Texas, says that best advantage of using molasses as compost for your plants is that it develops solid microscopic organisms in dirt. most popular diet of microorganisms is sugar. more sugar is available, faster microscopic organisms will develop.
microscopic organisms assist to separate supplements into dirt that your plant will absorb at that time. Molasses can give you a bigger harvest, says Big Bloom Hydroponics. more prominent number of supplements in a plant is, greater quality & quantity of vegetation it is likely to create. Molasses can reform type of food grown from dirt. Because it is a characteristic sugar, many daycare centers ensure that it really reforms type of food grown in dirt (Big Bloom Hydroponics). Molasses is a compostable compost. After being naturally weakened, natural growers claim that it may very well be directly connected to dirt, added to a hydroponic H2O frame or legally sprinkled on leaves
HOW TO USE MOLASSES You can utilize molasses as compost since organisms need sugar. Our plants might just need in this sugar, particularly in event that we don't have a working biological community with supplement cycling & humus development happening, & particularly in case we're expelling grass clippings or fail to keep a quality mulch layer in patio nursery. Molasses is a moderately economical instrument to usage as we progress to a biological community that is enhancingly alive. It's a smart thought to apply it with most microbial inoculants, i.e, dung tea since it gives microorganisms moment sustenance to start working with.
HOW TO APPLY MOLASSES can be mixed with H2O & can be bat directly on plants. It should be possible on a regular basis, i.e, from one month to second month or from one week to next. Most of time, I will compile this Junk compost with anor natural liquid compost, such as seaweed dung, while I do it, & generally I will be consolidated with microbial inoculants & N composts like fish. Junk is also sticky & recommends that everything adheres to leaves of plant. I mix it with H2O in a backpack sprayer or a hose sprayer.once in a while it's simply straightforward things that our greenhouse needs.
WHAT KIND OF MOLASSES USED Non-sulfur content is preferred when molasses is usage as dung, because type of sulfur usage in many molasses is to kill organisms, while we strive to strengthen microorganisms. What I usage is Blackstrap molasses,

International Journal of Advance and Innovative Research Volume 6, Issue 2 (XXX): April – June, 2019
46
ISSN 2394 - 7780
because it is also usage in maturing process to activate powerful microorganisms, but any type of molasses will splash plants.
COMPOSITION OF MOLASSES Composition of molasses varies according to numerous factors, including maturity & variety of ground reed, clim conditions, type of dirt, history of composts & production process (Baker, 1975). In general, molasses comprise about 20% H2O & 80% solids, 55% of which are sucrose, 25% non-sugars, & 10% mineral constituents generally represented as sulfated ash. compost value of molasses is mainly on account of about seventy percent of K in sugar cane that enters mill, dissolves with sucrose in juice & reappears in inorganic fraction of molasses.
Composition of molasses of five mills in Illovo Sugar group is summarized in Table 2. Unfortunately, N was not analyzed, but it is renowned from literature & FAS records that total N can vary from 0.3 to about 1 % with an average of around 0.5%.
Only molasses can supply cane with all required K & some P, but possible concatenation s) was first to meet requirements of K with assist of molasses & n, in addition, deficiency of N with urea. amounts & proportions of N, P & K are broad representations of requirements for rainfall of rye cane grown in moderately fertile dirts.
III. DATA AND METHODOLOGY Convergence of harmful substances to gas in environment has proteins in our yields over last 50 years). Mainly developed as a result of human movement. Like most money distributions, agriculture produces substances that are harmful to gas that produces agricultural phase, second largest producer in world, in vitality phase. CO2 is by far largest part of emissions of substances that damage gas in department, but small amounts of alkane (CH4) & inhalation anessia (N2O) are also passed on. farming of creatures is also responsible for production of & world's alkane content that is damaging gas, & future lack of l&, & also for removal of neighboring species. Agribusiness, forest ranger service & change in l& usage contributed between 20 & 25 in 2010 to annual emissions worldbroad. scope of methods will enhance risk of adverse environmental impacts in agriculture & discharge of substances that are harmful to gas from farming. N oxide emissions can come directly from organic & inorganic composts usage in field, degradation of crop residues, cultivation of organic dirts & storage of dung.
Fig 1: Molasses
Fig 2: Liquid sea weed fertilizer
PROCEDURE TO MAKE LIQUID FERTILIZER ON FIELD 1) TAKE 1 LITRE OF H2O & ADD 50G MOLASSES

International Journal of Advance and Innovative Research Volume 6, Issue 2 (XXX): April – June, 2019
47
ISSN 2394 - 7780
2) KEEP IT FOR 2 TO 3 DAYS SO THAT ITS GET FULLY DILUTED IN
3) H2O 3 ADD 20ML LIQUID SEA WEED COMPOST
4) IT COULD BE APPLIED DIRECTLY TO ROOTS OR CAN BE SPRINKLED ON PLANTS
TEST OF ORGANIC FERTILIZER Ph test
Electric conductivity test
Total nitrogen
Total phosphorus
Total potassium
N composts. N levels influence pH of dirt. N sources (compost, composts, vegetables) contain or structure ammonium. This creates a sharpness of dirt, unless plant legitimately assimilates ammonium particles. A higher osmotic weight around roots ensures productive H2O intake by plant. A few plants are more sensitive to electrical conductivity than ors & each species has an edge of electrical conductivity, performance of which decreases. A compost npk is generally considered a compost mix, but npk is applied to any dirt correction that provides N, P& K, K, including natural composts. numbers are reliable in a similar request., & alludes to level of each component in dung. plants need N for development of leaves, Pfor disposition of roots, development of stem & fructification, & K for flowering & insensibility of plants. A natural NPK compost can have a moderate discharge or a rapid discharge. Many have taken powerful "labile" supplements & those are just beginning of "insensitive" supplements that gradually separate & provide a constant supply of supplements over a longer period of time..
FIG 3: PH METER
Fig 4: Conductivity meter
NPK, which are 3 of most vital supplements required by plants. numbers that follow NPK are percentage measures of each organic balanced NPK Compost supplement. An "adjusted" natural npk dung is one that

International Journal of Advance and Innovative Research Volume 6, Issue 2 (XXX): April – June, 2019
48
ISSN 2394 - 7780
provides N, P& K: fundamental macronutrients required by plants. Research on dirt supplements can be done to separate 3 macronutrients from dirt, N, P& K, & consolidate m with shade. Reagents to decide your approach. N, P& K are real segments of dirt dung. realization of its fixation in dirts can illuminate ecological researchers about lack or excess of supplements in dirts usage to assist plant creation, & give a general understanding of essential biogeochemical cycles of a biological system
IV. RESULT AND DISCUSSION S No. Test Performed Result
1 Ph test 7.6 2 Electric conductivity test 3.2 3 Total N 1.29% 4 Total phosphorous 1.34% 5 Total K 1.41%
Table3: results of test performed V. CONCLUSION By using this organic molasses, we were able to reduce amount of greenhouse gases from agriculture. Organic compost at garden level or at home is a good option, because this kind of farming does not produce compost, hence this jaggery compost can be usage easily. If we go for agriculture on a large scale, n we can usage this jaggery compost to reduce greenhouse gas emissions from agriculture of India, as a result of huge agriculture, display of Indian dung is explosive. In India, natural production of bio-compost is well done. In this way re are innumerable producers of bio-natural composts in India. Indian ranchers are more likely to usage syntic compost & especially to underst& vulnerabilities of mixed dung for dirt. Nowadays y want to usage natural dung or organic compost. From point of view of natural dung speculation, it is possible & appropriate to start making natural dung. As we all know that India is second buyer of dung in world. Different ways to measure agricultural emissions can generate very different emissions estimates. This article has examined several economic emission policy scenarios, with emphasis on economic impact of usage of several emission measurement methods, impact on farmers. If agricultural emissions are covered by carbon pricing program, n method of calculating emissions can significantly affect company's profits. method of measuring carbon sequestration can also make a big difference in quantum of crop cropper, & hence, it also has effect of impact of carbon on fields. Even if agricultural emissions were excluded from internal value of carbon, but benefit of farming sector mainly for export markets will be reduced on account of an enhance in input cost. However, decline in income is limited by competition from imported inputs, which is not subject to government protection for carbon makers & / or local manufacturers, & reform, business concatenation business system changes drastically.
VI. REFERENCES Alexandratos N and Bruinsma J 2012 World Agriculture Towards 2030/2050 The 2012 Revision(Rome:
FAO) 160 p
Avetisyan M, Golub A, Hertel T, Rose S and Henderson B 2011 Why a global carbon policy could have a dramatic impact on the pattern of the worldwide livestock production Appl. Econ. Perspect. Policy33 584–605
Beach R H, DeAngelo B J, Rose S, Li C, Salas W and DelGrosso S J 2008 Mitigation potential and costs for global agricultural greenhouse gas emissions Agr. Econ. 38 109–15
Bouwman A F, Van Der Hoek K W, Eickhout B and Soenario I 2005 Exploring changes in world ruminant production systems Agr. Syst. 84 121–53
Busch J et al 2015 Reductions in emissions from deforestation from Indonesia’s moratorium on new oil palm, timber, and logging concessions Proc. Natl Acad. Sci. 112 1328–33
Chakravarty S, Chikkatur A, de Coninck H, Pacala S, Socolow R and Tavoni M 2009 Sharing global CO2 emission reductions among one billion high emitters Proc.Natl Acad. Sci. 106 11884–8
Challinor A J, Watson J, Lobell D B, Howden S M, Smith D R and Chhetri N 2014 A meta-analysis of crop yield under climate change sand adaptation Nat. Clim. Change 4 287–91

International Journal of Advance and Innovative Research Volume 6, Issue 2 (XXX): April – June, 2019
49
ISSN 2394 - 7780
Cohn A S, Mosnier A, Havlík P, Valin H, Herrero M, Schmid E, O’Hare M and Obersteiner M 2014 Cattle ranching intensification in Brazil can reduce global greenhouse gas emissions by sparing land from deforestation Proc. Natl Acad. Sci. 111 7236–41
Baker, BP (1975). Composition, properties and uses of molasses and related products. United Molasses Trading Co. Ltd, London. 80 pp.
Brakenbridge, N (2001). Progress Report on Merebank’s Stripper Fouling Problem. Illovo Technical Dept, Merebank. 28 pp.
Cleasby, TG (1959). Use of molasses on the land: a report of four experiments being carried out by the Tongaat Sugar Company Ltd. Proc S Afr Sug Technol Ass 33: 95-102.
Doty, R (1933). A Bibliography on the use of molasses as a fertiliser. Proc Hawaiian Sugar Tech pp 165-168.
Manohar Rao, PJ (1997). Industrial utilization of sugar cane and its byproducts. Ministry of Food and Civil Supplies, Govt of India: pp 232-251.
Meyer, JH, Wood, RA and Leibbrandt, NB (1986). Recent advances in determining the N requirement of sugarcane in the South African sugar industry. Proc S Afr Sug Technol Ass 60: 205-211.
Tianco, AP (1983). Molasses as a fertiliser and soil amendment. Proc Phillipines Sugar Tech 30: 469-472

International Journal of Advance and Innovative Research Volume 6, Issue 2 (XXX): April – June, 2019
50
ISSN 2394 - 7780
A REVIEW ON STEEL FIBER REINFORCED CONCRETE
Narendra Kr. Bhadhana, Rafiq Bahleem, Raghav Gupta and Aakash Panwar Department of Civil Engineering, Poornima Institute of Engineering & Technology, Jaipur
ABSTRACT In ancient time we are facing many problems in hydro sector to increase the stability of slope stabilization, particularly in tunnel linings. The use of steel fibers in grade slabs such as industrial floors, warehouses, ports and highway pavements has been prevalent in many countries for over 4 decades. To improve slope stabilization in hydro sector. But today the improvements in steel fiber technology in India and more user experiences in terms of economy and durability, the use of steel fiber reinforced concrete is gaining traction.
The purpose of our review paper is to get various information about recent progress in research field and also we can aware about the current progress in these field so that we can find a solution to solve this. This paper is related to Steel fiber reinforced concrete (SFRC) and in this paper we are taking the reference of two research paper. In this we are using steel fiber, RCC (Cement, Concrete, and Aggregate). This paper is going to determine compressive asset and flexural strength.
Keywords: Compressive Strength, Flexural Strength, SFRC
I. INTRODUCTION Steel fiber reinforced concrete (SFRC) is most widely used in construction material. It is used in construction due to its ability to cast in any shape. We can use concrete in the place of brick and stone masonry.
The strength and durability of SFRC can be changed by making proper changes in ingredient. When we add steel in R.C.C. it increase the strength of R.C.C. Here fiber is used to transfer load at internal cracks. In this paper we study about compressive strength and flexural strength of SFRC.
II REVIEW STUDY 2.1. COMPRESSIVE STRENGTH By previous study they take cube of 150 * 150 * 150 mm, which were pored with the M40 grade of concrete with 0%, 1%, 2% and 3% fiber. Use the vibrator to remove its voids. This top surface was flat and finished within 24 hours the samples were demolished and they were transfer to the safety tank, where they were given treatment for 28 days. After this, these cubes were tested on the compression test machine. It was said to be the burden of failure. Three cubes were tested in this process and their average value was told. Compression power can be calculated as follows
Compressive Strength (MPA) = Failure Load / Cross Sections Area (Reference 1)
Table 1-Compressive strength of SFRC with 0% fibers M40 grade
Table 2- Compressive strength of SFRC with 1%,2%,3% fibers

International Journal of Advance and Innovative Research Volume 6, Issue 2 (XXX): April – June, 2019
51
ISSN 2394 - 7780
Percentage increase in 28 days compressive strength M40 grade concrete By previous study the effect of steel fibers on the compressive strength of concrete are variable. Document growth for concrete has increased, but in most of the cases to 23% for concrete which contain 2% by volume of fiber with l/d = 100, ¾-in. (19-mm) maximum-size aggregate and tested with 6*12 in. (150*300 mm) cylinders (Williamson 1974). For mortar mixtures, the reported increase in its ranges from negligible (Williamson 1974) to slight (Fenella and Naaman 1985).[2]
Above figure volume fraction of fibers compressive stress or strain curve
2.2. FLEXURAL STRENGTH By previous study they use M-40 grade concrete. For flexural strength test beam which is of dimension 100*100*500 mm were casted. This pattern was demolded after 24 hours and transferinto curing tank wherein they kept to cure for 28 days. This flexural strengthwas tested under two-point loading, over an effective time period of Flexural testing machine. In each category they were tested three beams and their average value is noted. The flexural strength was calculated as follows.
Flexural strength (MPa) = (P*L)/(b*d2)
Where, P = Failure load, L = Centre to Centre distance between the support = 400 mm, b=width of pattern = 100 mm, d = depth of pattern = 100 mm. (1)
Table 3-Flexural strength of SFRC with 0% fibers M40 grade Flexural strength (MPa) Average flexural strength (MPa)
7.4 7.0 7.6
7.33

International Journal of Advance and Innovative Research Volume 6, Issue 2 (XXX): April – June, 2019
52
ISSN 2394 - 7780
Table4-Flexural strength of SFRC with1%,2%,and 3% fibers Different aspect ratios
of fibers For SFRC with 1%
fibers For SFRC with 2%
fibers For SFRC with 3%
fibers Flexural strength (MPa)
Avg. Avg. Avg.
50 9.8 8.6 10.21010.4 9.4 9.26 9.4 9.3 10.2 8.6 10
60 8.6 8.9 9.4 8.8 8.46 9.4 9.4 10 10 8 9.8 10.6
67 9.2 8 8.6 9 8.93 9 9 10.2 9.6
8.6 10 10
Percentage increase in 28 days flexural strength M40 grade concrete
By previous study they use M-60 grade concrete. For Flexural strength the pattern is of dimension 100*100*350 mm. In this we can observed the direct tension and Compression is lower than Flexural strength of concrete and mortar. We can check the flexural strength at two points correspond to the weightat which weight distortion curve.Maximum load achieves at point 1 or rupture point 2. Load deformation check by ASTM C 78.
Fig 2 shows the range of flexural load deflection. We can use different amount and different types of fibers with similar matrix and sizes. We can observe the first crack and rupture crack. For huge amount of fibers, the two loads are different and separate (upper curve) if we used smaller fibers volumes the first crack shown may be the maximum load (lower curves) lower strength depend upon its length, depth and width cross section.(2)
If we increase volume concentration of fibers, then flexural strength increase
Fig 1-important characteristic of load deflection curve (ASTM C 1018)

International Journal of Advance and Innovative Research Volume 6, Issue 2 (XXX): April – June, 2019
53
ISSN 2394 - 7780
Fig 2-Different types of fibers shows different types of volume concentration
III CONCLUSION COMPRESSIVE STRENGTH With reference 1 For 0% fiber when we increase aspect ratio then we got irregular compressive strength curve.
But for 1%,2%,3% fiber, when we increase aspect ratio then its compressive strength decrease.
If we increase the percentage of steel fiber it shows increase in compressive strength.
FLEXURAL STRENGTH With reference 1
For 0% fiber when we increase aspect ratio then we got irregular flexural strength curve.
But for 1%, 2%, 3% fiber, when we increase aspect ratio then its flexural strength decrease.
With reference 2
If we use different types and size of fiber then its load of deflection also different.
REFERENCE 1. International Referred Journal of Engineering and Science (IRJES)Reported by ACI Committee544
2. Ganeshan N et al, (2007) ‘steel fiber reinforced high performance concrete for seismic resistant structure’ Civil Engineering and construction Review, December 2007, pp 54-63.
3. BIS 383:1970 Specification for coarse and fine aggregates from natural sources for concrete (second revision).
4. Robins, P. J., and Calderwood, R. W., Jan. 1978, “Explosive Testing of Fiber –Reinforced Concrete, “Concrete (London), V. 12, No. 1, pp. 26-28.

International Journal of Advance and Innovative Research Volume 6, Issue 2 (XXX): April – June, 2019
54
ISSN 2394 - 7780
USE OF WASTE KOTA STONE & MARBLE SLURRY IN RIGID PAVEMENT
Laxmi Kant Saini1, Sudesh Khator2, Vikash Sharma3 and Roshan Saini4 Assistant Professor1 and B. Tech. Students2, 3, 4, Poornima Institute of Engineering and Technology, Jaipur
ABSTRACT The waste generated from the industries cause environmental problems. Hence the reuse of this waste material can be accent. Around 90% marble waste produced by India and approximately 85% of the India produced by Rajasthan Alone. To produce low cost concrete by replacing aggregate with waste kota stone and marble slurry & to minimize the disposal and pollution problems due to the use of stone waste. It is necessary to develop low cost building materials from stone waste. The fine & coarse aggregate has been replaced by marble slurry and kota stone waste accordingly in the range of 0%, 10%, 20%, 30% & 40% by weight for M-20 grade concrete. Concrete mix were produced, tested and compared in terms of workability and strength to the standard mix design concrete. These tests were carried out to measure the mechanical properties for 7, 14 and 28 days. As a result, the compressive strength increased up to 30% replacing of stone waste.
Keyword:- Kota stone waste, Compressive Strength, workability,M20 mix design etc.
INTRODUCTION The waste material generated directly in the open areas can cause environmental problems. Hence, the utilization of this waste material in the construction Industry is necessary. As a large amount of Stone dust are generated from the process of cutting and polishing of natural stones. Stone wastes generated from Marble/Granite/Kota stone lays a great impact on both the environment and humans. Thus, Stone industries producing large amounts of Stone waste are responsible for generating many environmental issues
The industry’s disposal of the marble & kota stone powder material, consisting of very fine particles, today constitutes to be one of the major environmental problems around the world. Marble / Granite blocks are cut into smaller blocks in order to give them the desired smooth shape. During the cutting process about 25% of the original stone mass is lost. Use of stone waste in various engineering applications can solve the problem of its disposal. Stone waste can be used in concrete to improve its strength and other durability parameters. This can be used as a partial replacement of cement, sand and coarse aggregate maintaining the premium properties of concrete.
Use of such materials offer cost reduction, energy savings and superior products with fewer hazards to the environment..
METHODOLOGY A mix M20 grade was designed as per Indian Standard method (IS 10262-2009) and the same was used to prepare the test samples. The design mix proportion is done in
Table No.1 Concrete design mix (M20 mix) proportion Cement (Kg) Sand (Kg) Aggregate (Kg) Kota stone (Kg) Marble slurry (Kg)
2.909 2.18 4.36 0.000 0.000 2.909 1.962 3.924 0.436 0.218 2.909 1.744 3.488 0.872 0.436 2.909 1.526 3.052 1.308 0.654 2.909 1.308 2.616 1.744 0.872
Table No.2 Design mix proportion for various concrete Sr. No. Concrete Type Aggregate replacement with
stone waste 1 A0 Standard Concrete 2 A1 10% replacement 3 A2 20%replacement 4 A3 30%Replacement 5 A4 40%Replacement

International Journal of Advance and Innovative Research Volume 6, Issue 2 (XXX): April – June, 2019
55
ISSN 2394 - 7780
A. Compressive strength The compressive power of concrete and cement mortar is a fundamental property that is thoroughly studied in almost all research works In this research article we are partially replacing aggregate with Kota stone and marble slurry & calculating the compressive strength of the concrete blocks. Where we are going to test & mention the variations of the Compressive Strength with varying percentage of aggregate replaced.
Fig. No.1 : Testing of Concrete Cube
C. Slump test The concrete slump test is an empirical test that measures the workability of fresh concrete. More specifically, it measures the consistency of the concrete in that specific batch. This test is performed to check the consistency of freshly made concrete.
Fig. No.2 : Slump Testing
RESULT & DISCUSSION On the basis of experimental study with different mix proportion of marble slurry and Kota stone waste in concrete we found that:
Table No.3 Compressive Strength after 7 Days % of Marble Slurry % of Glass Powder AVERAGE LOAD (KN) COMPRESSIVE STRENGTH N/mm2
0% 0% 292.782 13 10% 10% 405.856 18.04 20% 20% 375.569 16.70 30% 30% 327.375 14.55 40% 40% 310.589 13.80
Fig. No.3 : Compressive Strength After 7 Days

International Journal of Advance and Innovative Research Volume 6, Issue 2 (XXX): April – June, 2019
56
ISSN 2394 - 7780
The Compressive power @at 7 days at 0% marble slurry and Kota Stone grinder is 13 N/mm2.At proportion of marble slurry and Kota Stone grinder at 10% and 10%, the compressive strength of concrete is achived maximum Strength 18.04 N/mm2.after that we incresed the mix perportionof the waste then compresisive stregth slightly decresed.
Table No. 4 Compressive Strength after 28 Days % of Marble Slurry % of Glass Powder AVERAGE LOAD (KN) COMPRESSIVE STRENGTH
N/mm2
0% 0% 445.236 19.76 10% 10% 546.750 24.30 20% 20% 505.545 22.47 30% 30% 474.025 21.07 40% 40% 432.056 19.20
The Compressive power @at 28 days at 0% marble slurry and Kota Stone grinder is 19.76 N/mm2.At proportion of marble slurry and Kota Stone grinder at 10% and 10%, the compressive strength of concrete is achived maximum Strength 24.30N/mm2.after that we incresed the mix perportion of waste then compresisive stregth slightly decresed.
Fig. No. 4 : Compressive Strength after 28 Days
Slump Test It is observed here that degree of workability is medium as per IS 456-2000. The slump values of the concretes obtained from waste marble dust and glass powder mix gave negligible effect as compared to normal concrete mix.
Table No. 5 Slump Values at Different proportion Mix Slump
0M0 70
10M10 73
20M20 78
30M30 75
40M40 72
The slump values of the concretes obtained from waste marble dust and Kota stone Waste at different proportion of waste is slightly increased as compared to normal concrete mix & we have obtained maximum of value of slump at 10 % Marble waste and 10% Kota stone waste.

International Journal of Advance and Innovative Research Volume 6, Issue 2 (XXX): April – June, 2019
57
ISSN 2394 - 7780
Fig. No.5 : Graphical Representaion of Slump
CONCULSION Above study perceived that marble slurry & Kota stone grinder used as changeable matter for Coarse Aggregate & sand 0,10,20,30&40% altered marble slurry & Kota Stone 0,10,20,30&40% altered sand by Kota stone waste. Consequently perceived compressive power is maximum at 10% Marble waste and 10% Kota stone grinder @24.3N/mm2.
REFERENCE 1. Dr. Jayeshkumar Pitroda “Stone Waste in India for Concrete with Value Creation Opportunities” March
2013.
2. Patidar et.al “Use of Kota stone cutting and quarry waste as subbase material” January 2017
3. Devesh meena “a study on behavior of marble dust in concrete pavement” volume: 02 issue: 05 | aug-2015
4. Jain & dubey “analysis of performance of kota stone by replacing certain amount of cement in concrete blocks of m 20 & m 25 grades” volume: 05 issue: 05 | may- 2018

International Journal of Advance and Innovative Research Volume 6, Issue 2 (XXX): April – June, 2019
58
ISSN 2394 - 7780
RE-EXAMINATION OF WASTEWATER TREATMENT
Nikita Bomb1, Javed Ul Islam2 and Ishfaq Ul Abass3 B. Tech Student1 and Assistant Professor2, 3, Department of Civil Engineering, Vivekananda Institute of
Technology, Jaipur
Abstract Water which is exploited by human use is termed as waste water. Wastewater is a by-product of domestic, industrial, storm water drainage and commercial activities. Before the disposal of this wastewater into the environment it is first treated and converted into an effluent so that it can be reused or returned to the water cycle with minimal impact on the environment. Sometimes, the runoff resulting from the storm is also carried through the sewers which is then directly disposed into water bodies.Effluent refers to the impure water which contains organic matter, inorganic salts etc. and which is turbid.The removal of these impurities from waste water is termed as 'Wastewater treatment' and the engineering aspects of employing it on large scale as 'Wastewater engineering'.
Now the question arises “Why treat wastewater? Why not directly dispose it into the environment? What harm can it cause?”
There are a lot of good reasons as to why we should make this our priority and the first one which comes to mind is our health and the concern for our environment. If this water is directly disposed off into the oceans and sea, it will harm the aquatic species as well as it will contaminate the same.Some of the less tarnished water is also used by the farmers in Sewage Farming after minimal treatment since the waste is being disposed off on the land. If this is not done it can be chaotic and can lead to many diseases. However, the degree of treatment required depends upon the characteristics of the source of disposal. This paper reviews the steps through which polluted water has to pass through in order for it to be reused and cause unsubstantial harm to the environment when disposed off into the environment.
Keywords: Wastewater Treatment, Turbid, Sewage Farming, Effluent, Wastewater Engineering.
I. INTRODUCTION In a country like India which acquires second place among the population with 1.3 Billion people as of 2018 (and increasing) the amount of waste water generated is about 62,000 million liters per day (MLD) in urban areas (according to the data provided by the government in 2015), therefore, the need for its treatment is very high. There are 816 municipal water treatment plants in India out of which 522 are in working conditions from which 23,277 MLD sewage is treated i.e. 70% of the sewage is not even being treated. This 70% of the sewage is then dumped into water bodies which pollute them. Although, the best way for its treatment is by dilution but if the quantity is too much, instead of treating these by natural process is pollutes them. Therefore, the Central Pollution Control Board (CPCB) has proposed to construct 70 more treatment plants while 145 are already under construction. The first treatment plant was built by the Ancient Roman Sewer Designers around 800 BC in which the sewage was first diluted by the storm water and then dumped into the water bodies leaving behind the sludge which was either buried or used as fertilizers.
Figure 1 : State wise percentage of sewage generation

International Journal of Advance and Innovative Research Volume 6, Issue 2 (XXX): April – June, 2019
59
ISSN 2394 - 7780
II. LITERATURE REVIEW 1. In the 1970’s concern for energy conservation became a more important factor in the design of new
pollution control system. Consequently, land disposal and subsurface disposal of sewage began to receive increased attention where it was found feasible. Such “low-tech” pollution control methods not only might help to conserve energy but also might serve to recycle nutrients and replenish groundwater supplies.
2. In the middle of the 20th century due to the increase in public’s concern about the quality of environment the requirement for more strict practices for water treatment also increased. Higher levels of water treatment were required. For example, Pretreatment of industrial wastewater became necessary in which the toxins are removed so that they do not interfere with the biological process used at the treatment plants. Therefore new technologies were developed which removed almost all the pollutants from the sewage.
3. In the late 19 and the early 20th century, central sewage treatment plants were constructed mainly in United States and United Kingdom. Instead of discharging the sewage directly into the water bodies it is passed through a series of physical, chemical and biological processes which removes some of the pollutants from it. And in these systems the domestic water are separated from the storm water so that the treatment plants is not overloaded.
III. METHODOLOGY The various processes by which the sewage has to pass through in order for it to be treated are:
1. Preliminary Treatment: In Preliminary Treatment separation of the floating materials (like dead animals, tree branches, papers, piece of rag etc.) and the heavy settleable inorganic solids take place. It also helps in removal of oil and greases from the sewage. This treatment reduces the BOD of sewage/wastewater by about 15 to 30%. It is further subdivided into various processes:
i. Screening: Screening is the very first stage of sewage treatment plant, which consists of screens of different sizes by the sewage passes through in order to remove the floating matter present in it. If these materials are not removed, it would choke the pipes, or adversely affect the working of the plant. Thus, the main idea for providing screens is to prevent this choking of pipes and the damage of any other equipment caused by it.
Figure 2 : Screen for sewage treatment
ii. Grit Chambers: It is also known as Detritus Tanks. These are the sedimentation basins placed in front of the water treatment plant to remove the inorganic particles such as sand, gravel, etc., which may clog channels or damage pumps by abrasion, and to prevent their accumulation in sludge digesters. They are usually placed after the screens to remove particle size upto 0.2mm.
Figure 3: Grit Chamber

International Journal of Advance and Innovative Research Volume 6, Issue 2 (XXX): April – June, 2019
60
ISSN 2394 - 7780
iii. Skimming Tanks: These are employed for removal of oils and grease from the sewage and are generally put before the sedimentation tanks. They are generally used when there is too much of oil or grease in the sewage (like fats, soaps, waxes etc.) if theses greasy materials are not removed from the sewage before entering further into treatment units it may develop odorous scum’s on the surface of the settling tanks, or interfere with the activated sludge process.
Figure 4 : Skimming Tank
2. Primary Treatment: In this removal of suspended organic solids takes place. And this is accomplished by sedimentation in Settling Basins. The liquid effluent from the preliminary treatment contains a large amount of suspended organic solids and has high BOD.
i. Sedimentation Tanks: In this chamber suspended particles which are too heavy to be removed as floating material or too light to be removed by grit channels are removed in this chamber. The sedimentation tanks are thus designed to remove a part of the organic matter from the sewage effluent coming out of the grit chambers. The sedimentation process is carried out twice, one before the biological treatment also known as primary sedimentation and one after the biological treatment also known as secondary treatment. Sometimes coagulants are also used for flocculating the organic matter which are too light to be settled down. This process is known as chemical precipitation or sedimentation aided with coagulation.
Figure 5 : Settling Basin
3. Secondary Treatment: It involves further treatment of the effluent coming out from the primary sedimentation tank. This is accomplished by biological decomposition of the organic matter under either aerobic or anaerobic conditions in biological units. In these biological units bacteria will decompose the fine organic matter to produce clear effluent.
i. Aerobic Process: The treatment reactors, in which the decomposition of organic matter takes place by aerobic bacteria, are known as biological units. It consists of filters (Trickling Filter), Aeration Tanks, Oxidation Ponds and Aerated lagoons.
a. Trickling Filter: These filters are also known as percolating filters or sprinkling filters consisting of a coarser filter media over which sewage is allowed to trickle down using spray nozzles or rotary distributors.

International Journal of Advance and Innovative Research Volume 6, Issue 2 (XXX): April – June, 2019
61
ISSN 2394 - 7780
The percolated sewage is then collected at the bottom of the tank through drains. The effluent obtained from the drains is taken to the secondary sedimentation tank which separates the sewage from the biological solids. Some of the portion of this effluent is recycled to dilute the incoming waste water.
Figure 6 : Trickling Filter
b. Aeration Tanks: In aeration tanks the wastewater is mixed with air which allows the biodegradation of the pollutants. The activated sludge generated by the secondary sedimentation is mixed with air in which the microbial growth of the wastewater is promoted. These microorganisms then feed on the organic matter and create flocks which settle down at the bottom.
Figure 7: Aeration Tanks
c. Oxidation Ponds: These are specifically designed and constructed to treat sewage and biological industrial wastewaters. In an aerobic pond the wastewater is stabilized by the aerobic bacteria which flourishes in the presence of oxygen. In the presence of sunlight the algae present in the water produces oxygen which is used by the bacteria to oxidize the waste organic matter. The end products formed during this process are CO2, NH3 and phosphates.

International Journal of Advance and Innovative Research Volume 6, Issue 2 (XXX): April – June, 2019
62
ISSN 2394 - 7780
Figure 8 : Oxidation Pond
ii. Anaerobic Process: In anaerobic process the organic matter is destroyed and stabilized by anaerobic bacteria, which are known as anaerobic biological units and may consists of Anaerobic Lagoons, Septic Tank, Imhoff Tanks etc. Out of these units only anaerobic lagoons uses primary settled sewage whereas Septic Tank and Imhoff Tanks uses raw sewage.
Figure 9 : Anaerobic Lagoons
4. The Final or Advanced Treatment: This treatment is also called tertiary treatment and involves removal of the organic load left after the secondary treatment to kill pathogenic bacteria. This is done by chlorination as it is a disinfectant which kills the pathogens.
IV. CONCLUSION Although, the treatment process of sewage has changed a lot over the years but due to the increasing population the amount of waste generated outnumbers the capacity of these treatment plants and thus their effectiveness. Therefore, many efforts are being made in order to increase the efficiency of these plants but there are certain challenges that are needed to be overcome. Some of these challenges include increase in the availability of land, chemical requirements, and energy consumption.
REFERENCES
[1]. Techniques of Wastewater Treatment by Amol A Kulkarni, Mugdha Deshpande and A B Pandit.https://www.ias.ac.in/article/fulltext/reso/005/11/0056-0068
[2]. Wastewater Treatment by Jerry A. Nathanson and Archis Ambulkar. https://www.britannica.com/ technology/wastewater-treatment
[3]. Book on Sewage Disposal and Air Pollution Engineering by Santosh Kumar Garg.
[4]. https://archive.indiaspend.com/cover-story/70-of-urban-indias-sewage-is-untreated-54844
[5]. http://www.newworldencyclopedia.org/entry/Sewage
[6]. Presentation on Advances in Wastewater Treatment Technology.https://www.miwea.org/ docs/4._Cassity_Advances_in_Wastewater_Treatment_Technology.pdf
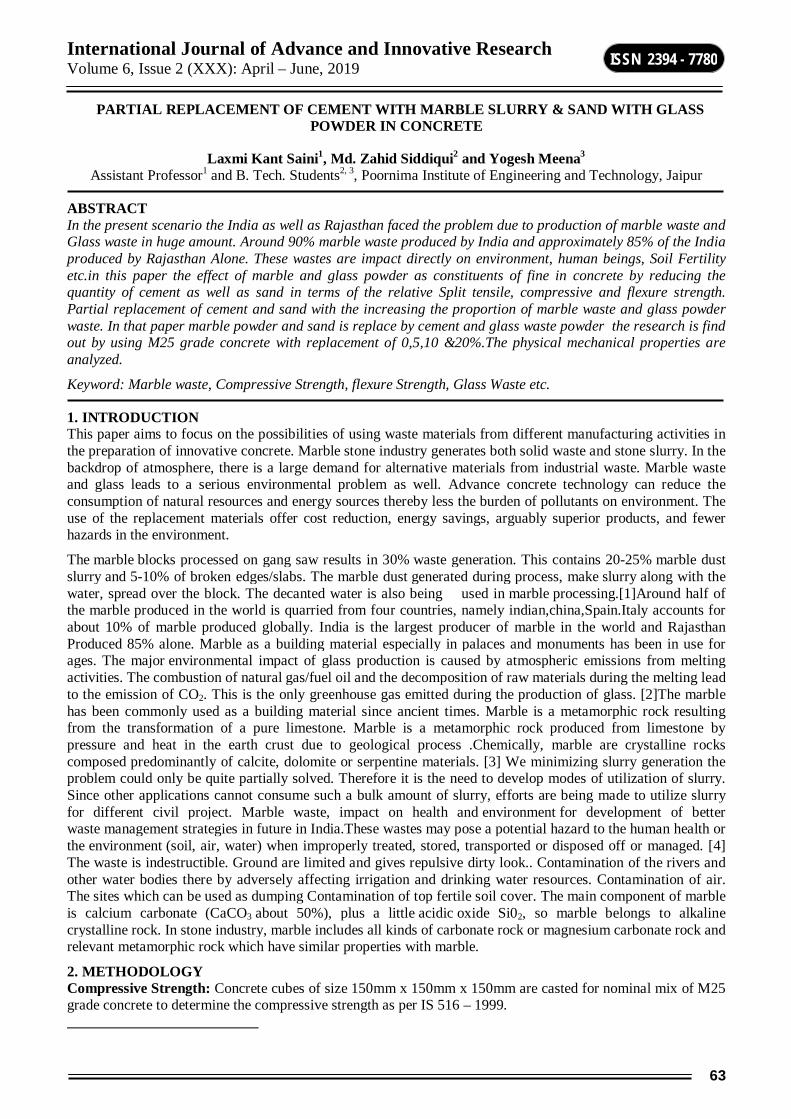
International Journal of Advance and Innovative Research Volume 6, Issue 2 (XXX): April – June, 2019
63
ISSN 2394 - 7780
PARTIAL REPLACEMENT OF CEMENT WITH MARBLE SLURRY & SAND WITH GLASS POWDER IN CONCRETE
Laxmi Kant Saini1, Md. Zahid Siddiqui2 and Yogesh Meena3
Assistant Professor1 and B. Tech. Students2, 3, Poornima Institute of Engineering and Technology, Jaipur
ABSTRACT In the present scenario the India as well as Rajasthan faced the problem due to production of marble waste and Glass waste in huge amount. Around 90% marble waste produced by India and approximately 85% of the India produced by Rajasthan Alone. These wastes are impact directly on environment, human beings, Soil Fertility etc.in this paper the effect of marble and glass powder as constituents of fine in concrete by reducing the quantity of cement as well as sand in terms of the relative Split tensile, compressive and flexure strength. Partial replacement of cement and sand with the increasing the proportion of marble waste and glass powder waste. In that paper marble powder and sand is replace by cement and glass waste powder the research is find out by using M25 grade concrete with replacement of 0,5,10 &20%.The physical mechanical properties are analyzed.
Keyword: Marble waste, Compressive Strength, flexure Strength, Glass Waste etc.
1. INTRODUCTION This paper aims to focus on the possibilities of using waste materials from different manufacturing activities in the preparation of innovative concrete. Marble stone industry generates both solid waste and stone slurry. In the backdrop of atmosphere, there is a large demand for alternative materials from industrial waste. Marble waste and glass leads to a serious environmental problem as well. Advance concrete technology can reduce the consumption of natural resources and energy sources thereby less the burden of pollutants on environment. The use of the replacement materials offer cost reduction, energy savings, arguably superior products, and fewer hazards in the environment.
The marble blocks processed on gang saw results in 30% waste generation. This contains 20-25% marble dust slurry and 5-10% of broken edges/slabs. The marble dust generated during process, make slurry along with the water, spread over the block. The decanted water is also being used in marble processing.[1]Around half of the marble produced in the world is quarried from four countries, namely indian,china,Spain.Italy accounts for about 10% of marble produced globally. India is the largest producer of marble in the world and Rajasthan Produced 85% alone. Marble as a building material especially in palaces and monuments has been in use for ages. The major environmental impact of glass production is caused by atmospheric emissions from melting activities. The combustion of natural gas/fuel oil and the decomposition of raw materials during the melting lead to the emission of CO2. This is the only greenhouse gas emitted during the production of glass. [2]The marble has been commonly used as a building material since ancient times. Marble is a metamorphic rock resulting from the transformation of a pure limestone. Marble is a metamorphic rock produced from limestone by pressure and heat in the earth crust due to geological process .Chemically, marble are crystalline rocks composed predominantly of calcite, dolomite or serpentine materials. [3] We minimizing slurry generation the problem could only be quite partially solved. Therefore it is the need to develop modes of utilization of slurry. Since other applications cannot consume such a bulk amount of slurry, efforts are being made to utilize slurry for different civil project. Marble waste, impact on health and environment for development of better waste management strategies in future in India.These wastes may pose a potential hazard to the human health or the environment (soil, air, water) when improperly treated, stored, transported or disposed off or managed. [4] The waste is indestructible. Ground are limited and gives repulsive dirty look.. Contamination of the rivers and other water bodies there by adversely affecting irrigation and drinking water resources. Contamination of air. The sites which can be used as dumping Contamination of top fertile soil cover. The main component of marble is calcium carbonate (CaCO3 about 50%), plus a little acidic oxide Si02, so marble belongs to alkaline crystalline rock. In stone industry, marble includes all kinds of carbonate rock or magnesium carbonate rock and relevant metamorphic rock which have similar properties with marble.
2. METHODOLOGY Compressive Strength: Concrete cubes of size 150mm x 150mm x 150mm are casted for nominal mix of M25 grade concrete to determine the compressive strength as per IS 516 – 1999.

International Journal of Advance and Innovative Research Volume 6, Issue 2 (XXX): April – June, 2019
64
ISSN 2394 - 7780
Table No.1 Compressive Strength after 7 Days % of Marble
Slurry % of Glass
Powder AVERAGE LOAD (KN) COMPRESSIVE STRENGTH
N/mm2
0% 0% 380.75 16.92
5% 10% 320.625 14.25
10% 20% 382.42 16.99
Fig. 1 Conressive Strength After 7 Days
The Compressive power at 0% marble slurry and glass grinderas is 16.92 N/mm2.At proportion of marble slurry and glass powder at 5% and 10%, the compressive strength of concrete is slightly decreased to 14.25 N/mm2. 10% marble slurry and 20% glass powder, the compressive power of concrete cube is achieved at 16.99 N/mm2.
Fig No. 2 Conressive Strength After 28 Days
Table No.2 Compressive Strength after 28 Days % Marble Slurry % Glass Powder AVG. LOAD KN Compressive Strength N/mm2
0% 0% 572.5 25.44
5% 10% 465.97 20.71
10% 20% 621. 21 27.6
The Compressive of Concrete cube at different proportion at 0% marble slurry and glass power as a reference, the compressive strenght of cube is 25.44 N/mm2.
If we use different proportion of marble slurry and glass powder at 5% and 10%, the compressive strength of concrete is slightly decreased to 20.71 N/mm2.The compressive strength of concrete cube at different proportion at 10% marble slurry and 20% glass powder, the compressive strength of concrete cube is achieved at 27.60 N/mm2.
3. SPLIT TENSILE STRENGTH We did the splitting tensile strength on concrete cylinder 150mm x300mm.we received the data:

International Journal of Advance and Innovative Research Volume 6, Issue 2 (XXX): April – June, 2019
65
ISSN 2394 - 7780
Table No.3 Split Tensile Strength after 14 Days % of Marble
Slurry % of Glass Powder Split Tensile Strength N/mm2
0% 0% 3.21
5% 10% 2.12
10% 20% 2.63
We observed the experimental study the Split Tensile strength of concrete cylinder at proportion 5% to 20% of marble slurry and Glass powder waste the Tensile strength will decreased.
Fig. No 3 Split Tensile Strength after 14 days
Table No.4 Split Tensile Strength After 28 Days
% of Marble Slurry % of Glass Powder Split Tensile Strength N/mm2
0% 0% 4.85 5% 10% 4.21 10% 20% 4.63
Fig. No 4 Split Tensile Strength after 14 days
We observed the experimental study the Split Tensile strength of concrete cylinder at proportion 5% to 20% of marble slurry and Glass powder waste the Tensile strength after 28 days will also be decreased.
Workability of Concrete It is observed here that degree of workability is medium as per IS 456-2000. The slump values of the concretes obtained from waste marble dust and glass powder mix gave negligible effect as compared to normal concrete mix.

International Journal of Advance and Innovative Research Volume 6, Issue 2 (XXX): April – June, 2019
66
ISSN 2394 - 7780
Table No.5 Slump value at Different Proportion %
Marble slurry %
Glass dust Slump Value (mm)
0 0 55 5 10 63 10 20 85
.Fig. No 4 Slump Value at Different Proportions
The slump values of the concretes obtained from waste marble dust and glass powder mix at different proportion of waste is slightly increased as compared to normal concrete mix.
RESULT AND DISCUSSION In this project we have used Marble waste as a fine material and glass powder waste as a Fine Coarse aggregate and replaced by the cement and Sand Receptivity. We conduct various physical Test like Compressive Strength, Tensile strength and Workability of Concrete etc. we use different proportion of marble slurry and glass powder at 5% and 10%, the compressive strength of concrete is slightly decreased to 14.25 N/mm2.
The compressive strength of concrete cube at different proportion at 10% marble slurry and 20% glass powder, the compressive strength of concrete cube is achieved at 16.99 N/mm2.Tensile strength of concrete cylinder at proportion 5% to 20% of marble slurry and Glass powder waste the Tensile strength will decreased. The slump values of the concretes obtained from waste marble dust and glass powder mix at different proportion of waste is slightly increased as compared to normal concrete mix.
CONCLUSION Above study perceived that marble slurry & glass grinder used as changeable matter for cement & sand 0, 5 & 10% altered cement by marble slurry & 0,15 & 20% altered sand by Glass grinder waste. Consequently perceived compressive power & slump rate enhanced after while tensile power reduced.
REFERENCES 1. Rana et.al “Sustainable Use of Marble Slurry in Concrete” Volume 94, 1 May 2015.
2. Pawar M. “The Significance of Partial Replacement of Cement With Waste Marble Powder” VOL.-III, ISSUE-I, August-2014.
3. Kushwah RPSingh “Engineering Utilization of Marble Slurry as Curing Aid” Vol. 1 Issue 5, July 2014.
4. Shama et.al” Utilization of “Marble Slurry” In Cement Concrete Replacing Fine Agreegate” Volume-04, Issue-1, pp-55-58

International Journal of Advance and Innovative Research Volume 6, Issue 2 (XXX): April – June, 2019
67
ISSN 2394 - 7780
STUDY ON SEISMIC BEHAVIOR OF VERTICAL GEOMETRIC IRREGULAR STRUCTURES AND EVALUATION OF RESPONSE REDUCTION FACTOR
Aniruddha Khot and S. K. Sekar Department of Structural Engineering, Vellore Institute of Technology, Vellore
ABSTRACT Seismic behavior of structures is one of trending research interest now a days, it is because of the huge damage and losses of structures, life and economy. It is necessary to understand the non linear analysis to study the seismic behavior of the structures, so that it will withstand against earthquake forces. The behavior of structures during earthquake motion depends upon distribution of mass, stiffness and geometry of structures in both horizontal and vertical plane of structure. This paper analyzed three different building models which are vertical geometrical irregular structures. The vertical geometrical irregularity is applied at various story levels. Response reduction factor is also calculated for all the structures which plays vital role during earthquake motion. Comparative study of regular and vertical irregular structures is done in ETAB 2016. All structures are compared for outcomes such as story drift, base reaction and response reduction factor.
Keywords: Drift; Response reduction factor; Stiffness; Geometrical irregularity; Nonlinear analysis.
I. INTRODUCTION The behavior of framed structures subjected to earthquake ground motion depends on the distribution of its mass, stiffness and strength in horizontal and vertical planes. Various buildings are constructed today with various irregularities for aesthetical reasons. The structures have significant and unpredictable damage due their irregularities which could be the reason for collapse of structure.
Current regulations have already specified different clauses defining irregular buildings. A common form of vertical irregularity arises from sudden change of lateral dimension of structures along its height. In IS 1893(part 1) various configuration of vertical geometric irregularity has been defined as shown in figure 1. When such buildings are situated in high seismic zone, the designer role becomes more challenging. So the designer needs to have precise knowledge of the seismic response of vertical geometric irregular structures.
Fig. 1 Vertical geometric irregular or Stepped structure
II. RESPONSE MODIFICATION FACTOR (R) Seismic codes use the significance of response reduction factor to account for non linear response of structures. The code anticipated by the current force based design method causes inelastic deformation of structures in case of seismic movements, that inelastic behavior is used into the design by dividing the elastic spectrum by response reduction factor (R) reducing the spectrum from elastic demand level to design level. In general it is ability of structure to dissipate energy through inelastic behavior. Structural ductility and over strength capacity are the most governing parameters in defining response reduction factor. The value of R changes from 3 to 5 depending on the type of moment resisting frame as per IS 1893(part 1). The ATC -19 evaluate the response reduction factor over-strength, ductility, damping and redundancy. It is expressed mathematically as follows :
R = R Ω R μ R ξ RR
Where R Ω, R μ , R ξ , RR are the over-strength , ductility , damping and redundancy factors.
a) DUCTILITY FACTOR (R μ) During earthquake excitation, ductile structure perform better than brittle structures. High ductility enables frame to undergo more deformation so dissipation of large amount of energy before failure. It will be a crucial parameter for analyzing the behavior of structure during earthquake ground motion. Ductility is represented by the ratio of ultimate displacement to yield displacement and given as follows:
R μ = (Δu)/(Δy)

International Journal of Advance and Innovative Research Volume 6, Issue 2 (XXX): April – June, 2019
68
ISSN 2394 - 7780
where u and y are the ultimate displacement and yield displacement of structure respectively. The relation between ductility (μ) and ductility factor R μ is proposed by Newmark and Hall have been used for the evaluation of ductility factor.
Rμ = 1 for T < 0.2 s (4)
Rμ = for 0.2 s < T < 0.5 s (5)
Rμ = μ for T > 0.5 s
Where T is the time period of the structure calculated as per IS 1893 (part1).
b) OVERSTRENGTH FACTOR (R Ω) It accounts for yielding of structure at load higher than the design load due to various partial safety factor, oversized members, strain hardening, confinement of reinforcement. It is the measure of additional strength of structure beyond the design strength. Non structural elements also contribute to over strength upto certain extent. It is expressed as following : R Ω = Vu / Vd
Where is Vu maximum base shear and Vd is design base shear.
c) REDUNDANCY FACTOR (RR) It is depend on number of vertical members participate in seismic resistance. Moment resisting frames, shear walls are the more chosen lateral load resisting system in reinforced concrete structure. As per ATC , redundancy factor is given as follows:
Table 1 :Redundancy factor from ATC Lines of vertical Redundancy factor framing system
2 0.71 3 0.86 4 1.0
III. STRUCTURAL MODELING In present study , ETABS 2016 software has been used to model RC frames to evaluate response reduction factor. Frames are designed as per IS:456:2000, and IS 1893: 2002 (Part 1). The building frame is 6 bays (4 m each) and 10 stories ( 3 m each) located in zone IV in India on medium soil type. All the frames are OMRF and 2 dimensional in nature. Materials used are M30 and FE415. Size of beams and column are 230 mm X 600 mm. Dead and Live load on the frame is 20KN/m and 12KN/m respectively. Importance factor for building is 1. The different building frames depending on the vertical geometrical irregularity are as follows:
\

International Journal of Advance and Innovative Research Volume 6, Issue 2 (XXX): April – June, 2019
69
ISSN 2394 - 7780
IV. SEISMIC ANALYSIS The dynamic time history analysis will give more accurate results for the analysis and design of structures. It is said to be more time consuming., so alternative Nonlinear static procedure (NSP) was developed. The detailed procedure is mentioned in ATC 40 and FEMA 356.
In this study displacement control pushover analysis is carried out using ETABS 2016 to estimate response reduction factor. Auto hinges were assigned as per FEMA 356 for beams and column separately. The P delta effect is not considered during this analysis.
Bilinearisation of pushover curve is done to get linear response curve and to get yield values at limit state. It is done by equal energy principle in which the area under the actual curve is equal to the area under the bilinear curve.
Fig. 10 Bilinearisation of pushover curve
V. SEISMIC RESPONSE SPECTRUM For the design of structure built in particular location, time histry records are required to perform sesmic analysis which is not possible. So earthquake response spectrum method is used wildly to perform seismic analysis. It is used for prediction of displacement and member force in structural system. The displacemet along the height of structure for given set of structural system are plotted below :
Fig. 11 Displacement curve

International Journal of Advance and Innovative Research Volume 6, Issue 2 (XXX): April – June, 2019
70
ISSN 2394 - 7780
The displacement is maximum for structure A 5 and B 5, this is because of the less stiffness in upper stories due to vertical geometrical irregularity. The structural system A 2 having less maximum displacement. There is be abrupt change in curve, when geometrical irregularity is introduce along the corresponding height( storey ) of structure.
Fig. 12 Displacement curve
VI. RESULTS AND DISCUSSION The non linear static pushover analysis is done on all the building frames. The values of ductility factor and over-strength factor are calculated. Redundancy and damping factor is 1 for all the set of frames. The pushover graphs for each frame are shown as following :

International Journal of Advance and Innovative Research Volume 6, Issue 2 (XXX): April – June, 2019
71
ISSN 2394 - 7780
The evaluation of response reduction factor using the pushover curve is tabulated in the table 2.
Table 2 Evaluation of Response Reduction Factor
VII. CONCLUSION After the discussion of analysis results and comparison of the ductility factor, over strength factor and response reduction factor values for the given set of structures, the conclusion drawn from the study are summarized below : a) The most governing factor for response modification factor is over strength factor. The both over strength
factor and ductility factor are directly proportional to response reduction value.

International Journal of Advance and Innovative Research Volume 6, Issue 2 (XXX): April – June, 2019
72
ISSN 2394 - 7780
b) The actual values of response modification factor for all the building frames are more than the value provided in IS 1893. So code will be on the Conservative side and provide greater safety to the structure.
c) Although code is on conservative side, but still the R value for the irregular structure is lower than that of regular structure and it depends on the complex nature of irregularity.
d) The R value is less for structure which having vertical geometric irregularity in second story because in that case overall stiffness of structure is less as height of tower is more as compared to other structures.
e) The structure which is having vertical geometric irregularity in stepped manner will be given more attention while the designing as R value is more critical for such structure.
These conclusions are applicable for given set of structure and other data assumed. These study is focused only on the influence of vertical geometric irregularity and it’s effect on the response reduction value.
Further study is required to find performance of structure during earthquake by considering effect of reinforcement provided in structure to the value of R.
REFERENCES [1] Bhosale, A. S., Davis, R., & Sarkar, P. “ Vertical Irregularity of Buildings: Regularity Index versus Seismic
Risk”. ASCE-ASME Journal of Risk and Uncertainty in Engineering Systems, Part A: Civil Engineering, 3(3), 4017-4029, 2017
[2] Chintanapakdee, C., & Chopra, A. K. “Seismic Response of Vertically Irregular Frames: Response History and Modal Pushover Analyses”. Journal of Structural Engineering, ASCE 130(8), 1177–1185, 2004
[3] IS 1893(2016) Part I, Indian standard criteria for design of earthquake resistance design of structures, New Delhi
[4] Moehle, J. P. “Seismic Response of Vertically Irregular Structures”. Journal of Structural Engineering, ASCE 110(9), 2002–2014, 1984
[5] Pradip Sarkar, A. Meher Prasad, Devdas Menon. “Vertical geometric irregularity in stepped building frames”,Engineering structures, 32(3),2175-2182, 2010
[6] Shahrooz, B. M., & Moehle, J. P. “Seismic Response and Design of Setback Buildings”. Journal of Structural Engineering, ASCE 116(5), 1423–1439, 1990
[7] Valmundsson, E. V., & Nau, J. M. “Seismic Response of Building Frames with Vertical Structural Irregularities”. Journal of Structural Engineering, ASCE 123(1), 30–41, 1997
[8] Whittaker, A., Hart, G., & Rojahn, C. “Seismic Response Modification Factors”. Journal of Structural Engineering, ASCE 125(4), 438–444, 1999
[9] Wood, S. L. Seismic Response of R/C “Frames with Irregular Profiles”. Journal of Structural Engineering, ASCE 118(2), 545– 566, 1992

International Journal of Advance and Innovative Research Volume 6, Issue 2 (XXX): April – June, 2019
73
ISSN 2394 - 7780
TRAFFIC SURVEY OF JAIPUR TO ASSESS ROAD CONGESTION
Dr. Prannath Dadhich1, Ram Prakash Godara2, Pawan Kumar Meena3 and Pramod Kumar Inaniya4 HoD1 and B. Tech Student2, 3, 4, Department of Civil Engineering, PIET, Jaipur
ABSTRACT Traffic congestion is a noteworthy urban transport issue in many nations. The interest for road space is more prominent than the supply in light of the fact that the rate of arrangement of transport offices is not exactly the rate of development of vehicle proprietorship and use which result into traffic congestion. The point of this venture is to take care of the issue of traffic congestion in and around the Jaipur city. It will incorporate some writing survey to help comprehend congestion issues when all is said in done and to contrast this circumstance with recently illuminated congestion issues with comparative elements. It will likewise incorporate an examination of the circumstance trying to recognize what causes the congestion, following which a proposal of couple of conceivable arrangements. Cost examination and plausibility study will be directed for each proposed arrangement. A last examination of favorable circumstances and detriments of every one will be incorporated. The arrangements exhibited ought to be monetarily possible and should consider lawful, ecological and moral contemplations.
Traffic study in Jaipur to overview about the congestion issues and reasons for congestion and furthermore review about arrangement of traffic congestion. Road congestion is a major issue in light of the fact that prudent arrangement of congestion isn't accessible and because of populace builds the quantity of road clients additionally expands which is reason for congestion.
1. INTRODUCTION Road traffic congestion represents a test for all substantial and developing urban territories. The full cover which this rundown is based expects to furnish approach producer and specialized staff with the key vision, theoretical system and direction on a portion of the commonsense instruments important to oversee congestion so as to lessen its general effect on people, families, networks and social orders.
Making a right appraisal of traffic congestion of road organize in the prompt region of the jaipur has incredible essentialness in improving the traffic state of the road arrange and guaranteeing smoother experience for the travelers. This task proposes an examination of the circumstance supported by maps information just as study by collecting of data related to traffic congestion.
Traffic congestion is when vehicles travel slower on the grounds that there is too much traffic on roads. This makes trip times longer, and increments lining. This is otherwise called a traffic jam. Traffic congestion is a significant issue which is reasons for financial misfortunes and furthermore loss of time.
The vast majority of the Indian urban communities are encountering multi-faceted issues because of fast urbanization. Urban congestion is one such issue tormenting urban agglomerations in India and multiple affects urban economies. Urban congestion is extensively characterized as abundance interest for movement over its supply. Actually, the motivation behind why governments are compelled to return to their approaches for urban portability is a result of developing interest for movement with restricted supply of administrations. All around created and advanced transportation framework is an essential for improvement of a urban framework and is fundamental for the simplicity of satisfaction of different everyday exercises.
The proficiency of the vehicle framework is one of the essential marker of the health and bearableness of a city. The exceptional development in populace, soak increment in vehicle possession, and increment in different associated exercises have come about into different traffic and transportation related issues in Jaipur city, for example, vehicular congestion, leaving challenges, time delays, extremely low traffic speeds, bottlenecks and dangers, mishaps and poor condition of condition. Jaipur is the capital city of Rajasthan province of India and is the biggest city in the state as far as populace
2. STUDY AREA: JAIPUR CITY Jaipur is most congested city and for the study of congestion in Jaipur collect the traffic data. With the help of that’s data examine the traffic position and problem related to the traffic.
Malpura Road – at malpura road traffic problem is much more complicated because of the road width is very less and no. of vehicle is much more.

International Journal of Advance and Innovative Research Volume 6, Issue 2 (XXX): April – June, 2019
74
ISSN 2394 - 7780
Gopalpura Road-gopalpura is the most congested area in Jaipur cause of educational and institutional hub. Traffic congestion mainly depends on two factors one is vehicles and other is people which drive the vehicles. In jaipur most congested area is ajmeri gate, malpura road, sindhi camp, tonk road etc. The city follows a grid plan, with rectangular blocks created by broad intersecting avenues and roads. The city has developed in an imbalanced manner.
3. DATA AND METHODOLOGY Traffic congestion is a marvel that happens when the quantity of vehicles utilizing a specific road approach or surpass its ability or when crossing points are not structured appropriately to stay away from superfluous deferrals. In this venture the fundamental centre is the region around the Jaipur which implies that our primary centre concerns traffic in crossing points with a little spotlight on traffic on a given road. For this reason, foundation data on traffic stream and convergences configuration is required for a productive investigation of the circumstance. I begin this segment by a review of traffic congestions and different authentic techniques for understanding it. Traffic congestion is a term used to portray the expanding costs that outcome from the association of vehicles on a road. This is normally tricky when the volumes of traffic close to the limit of the road, a condition alluded to as the urban pinnacle condition. Traffic congestion can cause numerous issues, for example, debilitating the versatility of road utilizing specialists just as an exercise in futility, issues of contamination and mishaps.. This arrangement requires the expansion of paths to a current road. On the negative side, this is a moderately costly methodology. It likewise may not be possible or hard to execute because of structures on the sides of the road. Another serious issue with this arrangement is the way that an expansion in limit prompts an increment sought after for the road. It is factually demonstrated that adding to the limit of a road makes explorers bound to pick it as a course for transportation. Along these lines, adding to the limit does not resolve the traffic congestion in the long haul.
expanding the availability of roads. Frequently the issues with roads that to prompt traffic congestion may not be the width but rather the goal. Expanding the availability of a system alludes to building new roads that legitimately lead to explicit spots.
By traffic survey collect the data related to the traffic and that’s data is required from every one of the partners related with roads turned parking lots. In venture with our mastermind we've covered.
Volume To Capacity Ratio (V/C)- Volume-to-Capacity Ratio (V/C Ratio) If the proportion of volume to the limit is more prominent than or equivalent to 1 then it is said to be very blocked streets. This proportion is utilized to choose dimension of administration for the streets where volume is frequently taken to be the 30th yearly most elevated.
Spot Speed Study -Speed can be classified into spot speed, running rate and voyage speed. The principal alludes to the immediate speed of a vehicle and is determined at a particular point in time. This variable is normally mulled over when attempting to make sense of how to manufacture a street as far as rise and bend. Running rate, alludes to the normal speed of a vehicle over a particular separation. It tends to be essentially determined by isolating the entire separation gone by the time it took to travel it. Any stops are incorporated into the time interim thus an adventure speed that is extensively littler than the running pace means that numerous stops.
Volume to Capacity ratio of kumbha marg
vehicles No of vehicles (veh/hr)
No of Veh. PCU/hr Mean speed (kmph) Traffic density (veh/km)
cars 1451 1451 42 45 Bike 1386 693 44 32 HCV 105 367.5 31 4
City Buses 66 231 35 2 Total Veh. =2742.5PCU/hr
Density Of Traffic- Density is characterized as the quantity of vehicles on a particular bit of a street. It is determined by partitioning the quantity of vehicles nx on the separation secured x. The equation for Density k is as per the following:
K=nx/x
The estimation of a street's Density encourages us decide the normal closeness of vehicles on that street. It is a parameter that is predominantly valuable while checking the security of a given street. A delineation of Density is given cry.

International Journal of Advance and Innovative Research Volume 6, Issue 2 (XXX): April – June, 2019
75
ISSN 2394 - 7780
Rather than other building disciplines, circumstances in rush hour gridlock designing can't be recreates or reproduced so as to be contemplated, the same number of choices engaged with it rely upon human specialists which conduct can't be anticipated with a high level of sureness. Therefore, traffic stream attributes must be considered straightforwardly in the field. For this, street information is to be gathered. This has different prerequisites and strategies. The most essential information to gather includes speed, time of movement, stream and street Density. In some cases, dispersing and progress can be straightforwardly estimated. Another essential variable is the inhabitancy: the proportion of time a specific purpose of the street is involved by vehicles. A characterization of estimation forms, into five classes, on the topographical degree of the overviewed zone is
Vehicles No. of vehicles (veh/hr/lane) PCU/hr Mean speed(km/h) Traffic density cars 982 982 16 62
bikes 356 178 14 26 buses 24 84 12 2
Total veh.:-1244PCU/Hr Table2 Malura Road V/C ratio and traffic density
4. RESULT AND DISCUSSION Traffic congestion depend of the use of road volume to capacity ratio and traffic density of the road.
Gopalpura road 58 % congested
Malpura road 74% congested
Kumbha marg 89% congested
Reducing traffic congestion will reduce the time of travels which will economically benefit.
There are no particular ethical issues we could identify here.
In its least difficult structure an onlooker tallies the quantities of vehicles alongside its sort, going through the segment for a definite time interim. For light volumes, count blemishes on a structure are satisfactory. Mechanical or electrical counters are utilized for overwhelming tra c. Despite the fact that it is great to take some manual perceptions for each meaning checking the instruments, some other specific employments of manual tallies are following:
Turning and through development considers
Classification and inhabitance contemplates
For investigation of crosswalks, walkways, road corner space and other walker facilitie
5. CONCLUSION Estimation over an area is most likely one of the least demanding field parameter that can be estimated. Different sorts of volume checks and including methods have been examined to sum things up. Alongside this a short knowledge into different strategies for ascertaining Passenger Car unit has been given. This undertaking is managing the decrease of traffic blockage close and around the Jaipur. We drew motivation and thoughts from other such tasks in better places far and wide.
6. REFRENCES 1- Solving the traffic congestion around Azrou taxi station Prepared by: Salwa Enezari – ID: 56990
(10/17/2017)
2- PROBLEM OF URBAN TRAFFIC CONGESTION IN JAIPUR CITY, RAJASTHAN Dr. Kavita Bansal
3- A Study: Traffic Congestion in Samalkha Town
Amit Vashisth Assistant Professor Department of Civil Engineering Panipat Institute of Engineering and Technology, Haryana, India

International Journal of Advance and Innovative Research Volume 6, Issue 2 (XXX): April – June, 2019
76
ISSN 2394 - 7780
AN EXPERIMENTAL INVESTIGATION ON REPLACEMENT OF COARSE AGGREGATE BY KOTA STONE WASTE IN BITUMINOUS MIX DESIGN
Suresh Soni1 and Deepak Mathur2 M. Tech Student1 and Assistant Professor2, Kautilya Institute of Technology & Engineering, Jaipur
ABSTRACT Road fabrications besides repairable attributes need enormous quantities of natural aggregate. Utilization of Kota stone waste aggregate (KSW) in place of natural coarse aggregate that would decrease forthcoming mining of aggregate, minimizing ambition on present landfill regions and ejection of worthless matter in the environment. For the purpose of probation the potential use of KSW with natural aggregates, the laboratory tests carried out on the samples are water absorption aggregate impact value; Loss Angeles abrasion and flakiness index were figured out on the aggregate samples. For probation performance of KSW in bituminous mixture, Marshall Mix design and indirect tensile strength Test are carried out with several proportions of KSW. The samples taken for the testing are as KSW replaced by natural coarse aggregate at rates of 0, 20, 40, 60, 80 & 100% in DBM and BC and besides this figured out the comparative analysis between them. The test results observed from the laboratory is compared with the standard codes to comprehend the physical performance of the materials in the Dense Bituminous Macadam and Bituminous Concrete of the road pavement. According to the cost benefit analysis it is observed in this research work usage of KSW in place of coarser portion of the aggregate decreases the cost of the construction of the flexible pavement road significantly.
Keywords: Kota stone waste aggregate (KSW), Dense Bituminous Macadam, Bituminous Concrete, Indirect tensile test (ITS).
I. INTRODUCTION Pavement is the visible top layer of the road .this is a kind of structure which refers repetitive load coming from the vehicles passing over it to the larger area of sub grade. It is combination of aggregate and binder (mostly cement or bitumen) in design proportion .The function of the aggregate is to be bear major part of the load coming on the pavement and the bitumen to accumulate the discrete aggregate together to form a single panel. [1] Dense graded bituminous mixes with mineral aggregate appropriate binder mix in hot mix plant and lay with a mechanical paver. [2] Dense graded bituminous mixes such as binder and wearing course are usually laid on a previously prepared bituminous layer. Binder course is the intermediate layer between bituminous base course and bituminous wearing course. [3] Utilization of various recycled materials for the use of road construction especially in flexible pavement construction. This is very high economic and energy saving for the depletion of natural resources like crushed stone, natural aggregate through mining work.[4]
II OBJECTIVES OF RESEARCH WORK To Study the physical properties of natural aggregate as well as Kota stone waste (KSW) and bitumen (VG-30) for bituminous mix design.
To Study the engineering properties of Marshall mix with replacement of coarse aggregate by KSW including Marshall flow, Marshall Stability, Marshall Quotient, Density, VMA, VFB, VV.
Determine the Optimum binder content (OBC) for Marshall Mix with variation of KSW as coarse aggregate in bitumen mix design (DBM and BC).
To analysis the strength and durability of bitumen mix design (DBM and BC) by indirect tensile strength test (ITS) and tensile strength ratio test.
To calculate the comparative cost analysis of bituminous mix design (DBM and BC) with with replacement of coarse aggregate by different percentage of Kota stone waste.
To utilization of Kota stone waste aggregates are reduce the cost of natural aggregate and also minimize the negative environmental effects with disposal of those wastes.
III LITERATURE REVIEW Utilization of Kota stone waste as coarse aggregate in bituminous mix design (DBM & BC). To give the sustainable pavement designs for the economically and environmentally safer and it free from depletion of the natural resources for the community or the nation.
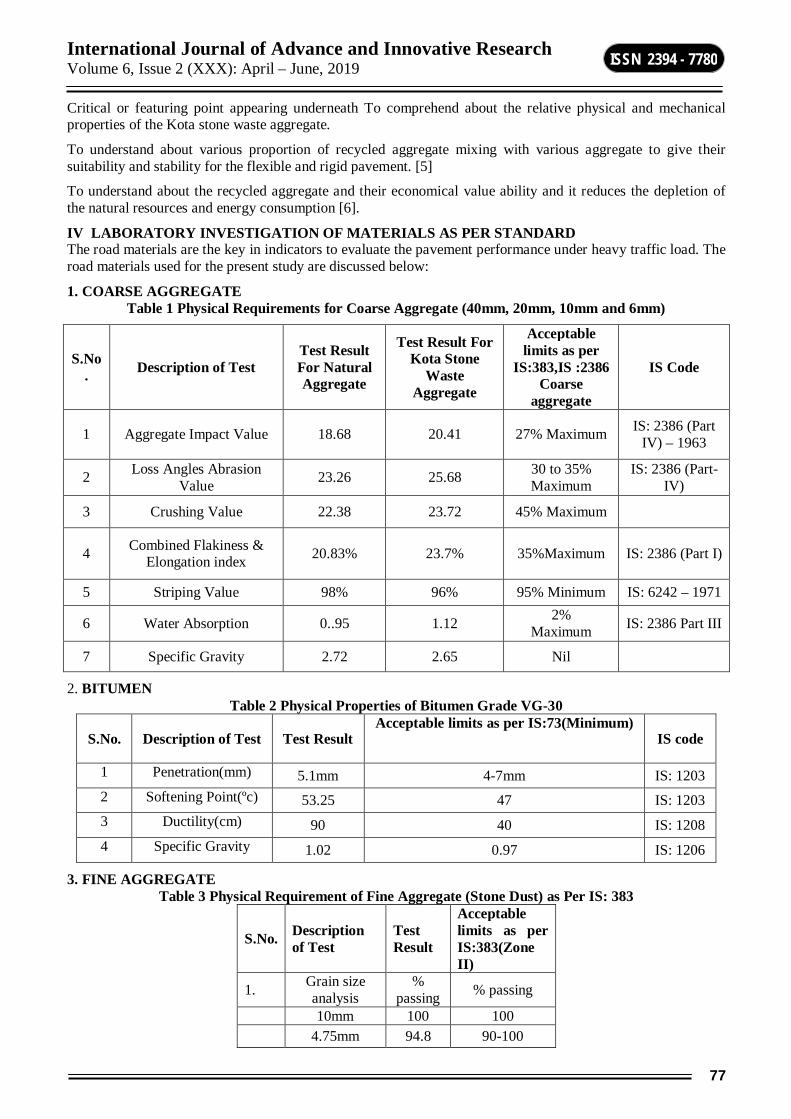
International Journal of Advance and Innovative Research Volume 6, Issue 2 (XXX): April – June, 2019
77
ISSN 2394 - 7780
Critical or featuring point appearing underneath To comprehend about the relative physical and mechanical properties of the Kota stone waste aggregate.
To understand about various proportion of recycled aggregate mixing with various aggregate to give their suitability and stability for the flexible and rigid pavement. [5]
To understand about the recycled aggregate and their economical value ability and it reduces the depletion of the natural resources and energy consumption [6].
IV LABORATORY INVESTIGATION OF MATERIALS AS PER STANDARD The road materials are the key in indicators to evaluate the pavement performance under heavy traffic load. The road materials used for the present study are discussed below:
1. COARSE AGGREGATE Table 1 Physical Requirements for Coarse Aggregate (40mm, 20mm, 10mm and 6mm)
S.No. Description of Test
Test Result For Natural Aggregate
Test Result For Kota Stone
Waste Aggregate
Acceptable limits as per
IS:383,IS :2386 Coarse
aggregate
IS Code
1 Aggregate Impact Value 18.68 20.41 27% Maximum IS: 2386 (Part IV) – 1963
2 Loss Angles Abrasion Value 23.26 25.68 30 to 35%
Maximum IS: 2386 (Part-
IV)
3 Crushing Value 22.38 23.72 45% Maximum
4 Combined Flakiness & Elongation index 20.83% 23.7% 35%Maximum IS: 2386 (Part I)
5 Striping Value 98% 96% 95% Minimum IS: 6242 – 1971
6 Water Absorption 0..95 1.12 2% Maximum IS: 2386 Part III
7 Specific Gravity 2.72 2.65 Nil
2. BITUMEN Table 2 Physical Properties of Bitumen Grade VG-30
S.No. Description of Test Test Result Acceptable limits as per IS:73(Minimum)
IS code
1 Penetration(mm) 5.1mm 4-7mm IS: 1203 2 Softening Point(ºc) 53.25 47 IS: 1203 3 Ductility(cm) 90 40 IS: 1208 4 Specific Gravity 1.02 0.97 IS: 1206
3. FINE AGGREGATE Table 3 Physical Requirement of Fine Aggregate (Stone Dust) as Per IS: 383
S.No. Description of Test
Test Result
Acceptable limits as per IS:383(Zone II)
1. Grain size analysis
% passing % passing
10mm 100 100 4.75mm 94.8 90-100

International Journal of Advance and Innovative Research Volume 6, Issue 2 (XXX): April – June, 2019
78
ISSN 2394 - 7780
2.36mm 82.6 75-100
1.18mm 69.28 55-90
600µ 36.85 35-59 300µ 21.8 8-30 150µ 6.54 0-10
2. Water Absorption 1.62 2% Maximum
V MIX PROPORTIONING Aggregate gradation is one of the most important properties for bituminous mix design. It directly affects the characteristics properties such as stability, durability, workability & resistance to moisture damage. The mix proportion was carried out as per MORTH specification. The aggregate gradation is given in figure 1and 2
Figure 1 Dense Bituminous Macadam Grade –I Gradation Chart
Figure 2 Dense Bituminous Concrete Grades –II Gradation Chart
VI RESULTS AND DISCUSSION 1. Marshall Stability Test Results [7]
The Marshall test method is adopted to characterize the bituminous mix (in DBM and BC) in laboratory .the Marshall test is done for mix of natural coarse aggregate (CA) and bitumen without adding Kota stone waste as CA to understand the effect of variation of bitumen content on stability, flow value, density, air voids, similarly the Marshall test is done for mix of bitumen content and replacement of KSW as coarse aggregate by variation of 0%, 20%, 40%, 60%,80% & 100%at various bitumen content as per code provision.
STABILITY The Kota stone is blended with the aggregate replacing coarse particles in the proportions of 0%, 20%, 40%, 60%, 80%, and 100% and stability vs. bitumen content graph is plotted .It is observed from the plotted graph that the stability of the bituminous mixture decrease with increasing the percentage of Kota stone waste in the

International Journal of Advance and Innovative Research Volume 6, Issue 2 (XXX): April – June, 2019
79
ISSN 2394 - 7780
mixture, the graph peak gives the optimum binder content for preparing the bituminous mixture. It is seen an addition of Kota stone waste in the mixture the optimum bitumen content increase .The increase in requirement of the bitumen might be affecting the cost of construction of the pavement .The loss of stability and increase in bitumen requirement is a big challenge for engineers to overcome the present problem with various approaches for using Kota stone waste successfully in bitumen pavement.
AIR VOIDS The plot air voids vs. bitumen content gives idea about the effect of addition of Kota stone waste on air content in the mixture. The graph observation suggests that the increase of Kota stone in the mixture increase the air content. Initial addition of Kota stone waste with relatively lesser amount the air voids content qualifies the code specifications however after certain limits the air voids content increases beyond limits which might be affecting the pavement performance of Kota stone waste mixed pavement.
DENSITY The density vs. bitumen content graph represent that the achieved density by Marshall mix mould decrease with increase in the proportions of Kota stone waste. This reduction in density results in compromised Marshall Stability of bituminous mixture and increased in air void content. Kota stone waste is characterized in the laboratory and formed that the specific gravity of Kota stone waste is lesser than the natural aggregates used for flexible pavement. Reductions of the density with addition of the Kota stone possibly due to relatively lesser specific gravity.
FLOW VALUE The flow behaviours of bituminous mix (DBM and BC) with Kota stone waste added compared to the natural aggregate mix. It is seen from the graphs the flow value decrease with addition of Kota stone waste in mixture. The reduction in the flow value represents the hindrance in the mix ability of the material in the presence of Kota stone .the improper mixing of bituminous mixture during laying the pavement in the field will result in compromise performance. The resulting performance of KSW in flow value is compared with the MORTH guidelines and found to be qualifying up to 60 % replacement of KSW as coarse aggregate for bituminous mix (DBM & BC)
Table 4 Analyzed Properties of Dense Bituminous Macadam (I)
Table 5 Analyzed Properties of Bituminous Concrete (II)

International Journal of Advance and Innovative Research Volume 6, Issue 2 (XXX): April – June, 2019
80
ISSN 2394 - 7780
Figure 3 Comparative Graph between Stability v/s Bitumen Content for DBM
Figure 4 Comparative Graph between Flow Value v/s Bitumen Content for DBM
Figure 5 Comparative Graph between Stability v/s Bitumen Content for BC
Figure 6 Comparative Graph between Flow Value v/s Bitumen Content for BC
2. Indirect Tensile Strength and Test Tensile Strength Ratio Test Results
Table 6 Indirect Tensile Strength and Test Tensile Strength Ratio for Dense Bituminous Macadam (I) KSW % AVG Dry ITS AVG Wet ITS TSR (%)
0 6.93 6.07 87.59 20 6.69 5.79 86.54 40 6.215 5.16 83.02 60 5.79 4.36 75.3 80 5.82 3.7 63.57 100 5.26 2.87 54.56

International Journal of Advance and Innovative Research Volume 6, Issue 2 (XXX): April – June, 2019
81
ISSN 2394 - 7780
Table 7 Indirect Tensile Strength and Test Tensile Strength Ratio for Bituminous Concrete (II)
3. Cost Analysis [8]
Table 8 Total Cost of Dense Bituminous Macadam (I) (per cum)
Table 9 Total Cost for Bituminous Concrete Grade (II) (per cum)
VII CONCLUSION The following Conclusions are drawn:
The Marshall stability of the pavement is found to be compromising with addition of Kota stone waste as the coarse aggregate.
The flow value is appeared to be decreasing with increase in content of Kota stone waste which can offer hindrance in mixing process of bitumen and the aggregate The density reduction of the bituminous mixture is observed which can result in the loss of performance of the pavement of road.
The bitumen requirement to achieve maximum stability, density and flow value is found to be increased which is needed to be controlled to make the process cost effective.
As per Marshall Test results maximum 60% of natural coarse aggregate can be replaced with Kota stone waste for DBM grade I and BC grade II.
The tensile strength ratio of bituminous mix is found to be decrease with increase the addition of Kota stone which can make the road pavement more water susceptible than the natural aggregate .In this way the pavement performance is expected to be compromised in presence of water in the stagnation of the pavement.
S.No. Quantity reduce of natural aggregate
Total cost of aggregate for DBM
grade I (Rs)
Cost of Bitumen (Rs)
Total cost (Rs) Total cost ( Rs per cum)
1 0 281453.96 173798.5 455252.46 812.95 2 20 243606.72 173798.5 4174052.2 745.36 3 40 208759.48 173798.5 382557.98 683.13 4 60 167912.24 173798.5 341710.74 610.19 5 80 130065 173798.5 303863.5 542.61 6 100 92217.76 173798.5 266016.26 475.03
S.No. Quantity reduce
of natural aggregate
Total cost of aggregate for BC
grade II(Rs) Cost of
Bitumen (Rs) Total cost (Rs) Total cost ( Rs per cum)
1 0 136790.48 113411.6 250202.08 893.57 2 20 120849.98 113411.6 234261.58 836.65 3 40 104909.48 113411.6 218321.08 779.72 4 60 88968.98 113411.6 202380.58 722.79 5 80 73028.48 113411.6 186440.08 665.85 6 100 57087.98 113411.6 170499.58 608.92

International Journal of Advance and Innovative Research Volume 6, Issue 2 (XXX): April – June, 2019
82
ISSN 2394 - 7780
As per Indirect tensile strength and Tensile strength ratio maximum 40% of natural coarse aggregate can be replaced with Kota stone waste for DBM grade I and 60% of natural aggregate can be replaced with Kota stone waste in BC grade II. More than this replacement performance of pavement should be poor due to highly susceptible towards moisture that causes stripping.
On the basis of the cost analysis it is clear from the optimization that the use of Kota stone waste can make
the pavement construction economical with compromised performance in various environmental conditions therefore this research suggest that the Kota stone blended bituminous pavement can be used for low service road .
VIII REFERENCES [1] Ana M, “Characterization of Hot-Mix Asphalt Made with Recycled Concrete Aggregates”, Construction
and building materials vol.No.3, 2017.
[2] A.Hussain and I. Perez, V., “Kota stone slurry problem and possible solution”, Construction and building materials Vol. no. 55, 12 April 2017.
[3] A.R. Pasandín and I. Perez, “Overview Of Bituminous Mixtures Made With Recycled Concrete Aggregates”, Construction and building materials Vol. no. 5, 15 Sept 2014.
[4] Hand Book for PWD Engineering, “Building and road construction”, Public Works Department, Rajasthan, 2002.
[5] Hossam F. Hazzan, “Recycling of Municipal Solid Waste Incinerator Ash in Hot-Mix Asphalt Concrete”, Construction and Building Materials Vol. 19, 3 July 2005.
[6] Hussein Akbulut, “An investigation on Strength Characteristics of Concrete Containing Recycled Aggregates of Marble and Granite Waste” Advances in Materials Science and Engineering Volume 2006.
[7] MORTH (Ministry of Road Transport and Highways), Design of Dense Bituminous Macadam and Bituminous Concrete, Fifth Revision, New Delhi-2013.
[8] Patel V., Dr. Jayesh Kumar P., “Experimental Investigation on Replacement of Aggregates by Kota Stone Chips in Rubber Mould Paver Block”, International Journal of Current Trends in Engineering & Research Volume 2 Issue 5, May 2013.

International Journal of Advance and Innovative Research Volume 6, Issue 2 (XXX): April – June, 2019
83
ISSN 2394 - 7780
INFLUENCE OF THE RECYCLED CONCRETE AGGREGATE FOR SUSTAINABLE BITUMINOUS SURFACING COURSE
Hitesh Sant1 and Shamal Burman2 Assistant Professor1 and M. Tech Scholar2, Department of Civil Engineering, Poornima University, Jaipur
ABSTRACT The waste generates from the building material needed to be recycled for the purpose of conservation of energy and reducing the demand of the virgin or crushed natural aggregate material. This research work target to uses recycle concrete aggregate and Construction & Demolished waste material in bituminous surfacing course for flexible pavement construction. The material used for this project are recycled concrete aggregate (RCA) ,rock dust as filler, bitumen as binder , construction & demolished waste recycled concrete aggregate percentage 0%, 10%, 20%, 30%, 40%, 50%, 60% and bitumen percentage 4.5%, 5%, 5.5%, 6% for HMA. The test are need to be conducted for evaluating the physical properties of the recycled concrete and demolished waste as per the MORTH or IRC specification .the recycled concrete aggregate have the similar physical properties of natural aggregate or virgin aggregate at proportional limit up to 30%.The fresh aggregate material and Recycled Concrete Aggregate mix with filler material from Recycled Concrete Aggregate or rock dust for Marshal Stability test, and plot the graph of stability, flow value ,unit weight ,air void and VFB with Binder percentage of 4.5%,5%,5.5% and 6% and compared to the standard result. It is investigate that the reclaimed waste material how reclaimed potential of the performance which can be utilized in the rehabilitation of pavement .the recyclability potential of the material can be understood by correlating the physical and chemical properties of waste material to the virgin material.
Keywords: RCA and C&D, HMA, MORTH, IRC, Marshal Stability, Physical properties
1. INTRODUCTION As the construction work increasing in the world after the globalization trend and new technology exists in full of a swing of construction work in globalized as well as highly construction project work in progress in India. The global demand for the construction aggregate exceeds 53 billion-ton per year [1].According to the government of Building Material & Technology Promotion Council (BMTPC) and Central for Fly Ash Research and Management (C-FARM) estimate India generate 165-175 million tons of construction demolished waste (Debris) annually. In this line New Delhi, Mumbai and Kolkata top list of the cities that generate a huge amount of construction waste in around the country. If separately to calculate the generation of C&D waste while Delhi generates about 5000 tons daily, Mumbai gets 3000- tons, Kolkata produced 2000- tons and Chennai in little lonely about 1500- tons and apart of this list the major cities in India like Hyderabad, Pune, Lucknow, Gurgoan, and Jaipur generates C&D in the range of 500-tonnes to 1000-tonnes.The estimate prepared by Building Material & Technology Promotion Council (BMTPC) & Central for Fly Ash Research and Management (C-FARM).In the state, Rajasthan capital of Jaipur produced 1300-tonnes per day of municipal solid waste is produced out of which 274 (TPD) construction waste materials is lifted from the roadside as well as near the construction site. And it going to the estimated calculated 941-tonnes per day construction waste is produced in the entire state. Jaipur will be set a program to recycle 300 TPD waste. The estimated cost of this program nearly to Rs 6 crores for Jaipur and construction debris in Jaipur and other cities of the state in checking roads, wetland and green areas and the problems are becoming very crucial in energy year. So C&D waste also does not produce any environmental health- related issued and it is available in the vast amount in all around the world. The using of C&D waste environmentally friendly and economically for the roadway pavement like flexible pavement, rigid pavement and lower performance pavement etc. these construction and demolished waste can be easy to be utilized as the recycled concrete aggregate (RCA).Recycled concrete aggregate having tendency less water absorption properties and denser. So its limited quantity in construction work can be highly appropriate. Recycled concrete aggregate can be contributed for the Construction of sub graded, sub-base, bituminous surfacing and it has also reduced the naturally occurring resource crushed rocks extraction from the mining work and it beneficial for the reducing the energy consumption. This project is going to comparatively study of various properties of RCA and bituminous mix with Recycled concrete aggregate in wear surfacing course of flexible pavement. At last RCA prompt control the regular asset of exhaustion, natural debasement and vitality utilization through by the mining exercises. Recycled Concrete Aggregate (RCA) will be economically and environmental benefits and sustainability of the construction industry.

International Journal of Advance and Innovative Research Volume 6, Issue 2 (XXX): April – June, 2019
84
ISSN 2394 - 7780
B. Objective of the Study 1. To decide the impact of mechanical and physical properties of the recycled concrete aggregate in the
flexible pavement.
2. To find out the marshal stability of the bitumen mix with Recycled concrete aggregate for the repetitive traffic load of the vehicle.
3. To identify the problems associated with the use of recycled concrete aggregate for flexible pavement construction.
4. Economically compare construction of flexible pavement with and without Recycled Concrete Aggregate
C. Future Extent of the Exploration
Comparatively study of Recycled Concrete Aggregate (RCA), C &D waste increment the supply in the development field due to the higher depletion of the natural resources. It has added the improvement of the age of the capacity plant for recycled concrete aggregate innovative the activity in private division, additionally in government area and test conduct for the recycled concrete aggregate including classification test, strength property test or mechanical property test, bitumen properties test, MMD (Marshal Mix Design) gives the result to all perception for uniformly apply in construction industries as well as low sustainable pavement construction like porous pavement, footpath etc. it economical and environmentally friendly .
2. LITERATURE REVIEW Issue-I:Using recycled concrete aggregate (RCA) mixed with Stone Mastic Asphalt (SMA) The mix containing higher % of RCA result demonstrated higher resilient modulus values and creep resistance compared with the control mix and additionally diminished the VMA & VFA and this was also increasing permanent deformation resistance of the asphalt mixtures and cement and lime powder was used as filler in HMA (hot mix aggregate) mixtures containing RCA showed good resistance to permanent deformation[1].
Issue II: Replace natural coarse aggregate (NA) with recycled concrete aggregate (RCA) with different filler material like limestone powder, cement and hydrated limestone, The substance of filler for this examination were 4%,6%,8% ,and result demonstrate the higher estimation of Marshall Stability ,Marshall stiffness , Marshall quotient, stiffness modulus and indirect tensile strength[2][3][4][6].the binder content was kept constant at 6% in the HMA the recycled mixtures performed even better than traditional mixtures using natural calcareous aggregates granular layers and dense asphalt mixtures, the recycled aggregates tend to show particle breakage[8][9][10]. Issue III: Replace natural coarse aggregate (NA) with recycled concrete aggregate (RCA) ,between 25% to 50% it obtained the result of good performance of concrete mixers and when this replacing ratio of increased to 50% the compressive strength reduce range from 7% to 13% as well as unit smaller reduction of splitting and tensile elastic modulus[11][12][14]. For the entire three mix types I, II and III asphalt binder were varied as 4.5%, 5.0%, 5.5%, 6.0% and 6.5% with a specific end goal to decide the optimum asphalt content in view of evaluation of the performance of every trial mix. Specific gravity of the mixed sample reduced after addition of Pores recycled concrete aggregate correlation of diminishment is more for fine aggregate then the coarse aggregate although specific gravity of the mix increments with increment in Asphalt Binder content. The volume of air voids in the mix diminished with the increase in Asphalt content and increment with addition of recycled aggregate dependability of a mix increase where is from diminishing with the increment in Asphalt content were higher for the example made with the fine reused aggregate in the examination with those made of coarse aggregate[17][19][20].the issue wise finding get the idea there was scope of work to used the recycled concrete aggregate in dense bituminous macadam layer in flexible pavement.
3. MATERIAL AND METHODOLOGY 3.1. Materials
3.1.1Aggregate
There are lot of traditional and recycled material available worldwide for recycled concrete aggregate for flexible pavement construction of the road. Igneous rock like rhyoslite, ryodocite, docite, tuffs, granite, adamellite and granodiorite. Intermediate igneous rock like trachyte trachyandesite, andesite, tuffs, syenite, and diorite. Metamorphic rocks like quartzite, greenstone, and slate. Sedimentary and basic igneous rocks like limestone, mudstone, aranite, dolomite, basalt, dolerite a gabbro., Ash and Fly ash.
Reclaimed Glass from the glass disposal industry, Industrial slag,reclaimed Asphalt Pavement (RAP) from support and restoration exercises. ,Aggregate obtained from construction and demolition site waste,Textiles including none reusable garment upholstery and bits of texture,Ceramics including rock, tile, china block, solid,

International Journal of Advance and Innovative Research Volume 6, Issue 2 (XXX): April – June, 2019
85
ISSN 2394 - 7780
mortar and black-top of a soil sub grade,Plant garbage including leaves and cutting, trimming from trees, bushes, grass, entire plant and sawdust,Paper including newsprint, record paper, PC paper, folded cardboard and blended paper.
Table 1: Physical properties of Aggregate
3.1.2 Bitumen Ductility test: ductility of bitumen is property to indicate stretching properties of bitumen and it is capable of being a stretch without breaking. Ductility test apparatus (SICBDTA-O1) was As per IS 1208 -1978 requirement minimum values of ductility for VG-30 at temperature 25 0C is 40 cm Penetration test: the penetration value of bitumen indicate the hardness properties of bitumen the unit of penetration in 1/10 mm. the grade of bitumen decided on the basis of the penetration value of bitumen. As per IS 1203 -1978 minimum penetration value at a temperature of 250C for VG-30 is 45/10 mm Softening point test: softening point of bitumen indicate the particular degree under some specific region or condition. Softening test is also called the Ring and Ball test method .minimum temperature as per IS 1205 -1978 for VG -30 is 47 0C.
Table 2: Physical properties of Bitumen
3.1.3 Marshal Mix design MMD have the very effective way to identify the stability of wearing surface of aggregate and flow-ability of bitumen. For the preparation of blend it should apply the loading of 50.8mm per minute. Specimen size 10mm in diameter and 63.5 mm thickness .the no. Blows applied by the hammer were 75 and it weight 10 kg. The desirable temperature used during the heating the bitumen was 1700 to 1900.
Table 3: Marshal Mix Design Specifications for DBM as Per MORTH Properties Value
Compaction level 75 Bows on each side Minimum stability 900 kg
Flow Value 2-4 Marshal Quotient 2-5
% Air Voids 3-5 VFB 65-75
Stripping Value 95% minimum VMA (minimum) 11(3mmflow),12(4mmflow),13(5mm flow)
3.1.4 ITS (Indirect Tensile Strength) Test Tensile strength Ratio (TSR) may be obtained by the indirect tensile method. It is the ratio of tensile strength of the dry sample to the tensile strength of the wet sample. It may useful to predict the cracks in asphalt pavement. The Minimum value of TSR as per MORTH specification is 80%.by the following below given formula to identified the TSR and ITS value.
3.1.5 Marshal Quotient: Marshal Quotient is the ratio of stability to the flow value of the mix .it’s value ranges for DBM from 2-5. The following below given formula used to predict the marshal quotient, MQ= Stability /Flow in kN/mm

International Journal of Advance and Innovative Research Volume 6, Issue 2 (XXX): April – June, 2019
86
ISSN 2394 - 7780
4. RESULTS AND DISCUSSIONS 4.1 Marshal Mix design
4.1.1 Stability vs. Binder Content
Figure 1: Stability vs. Binder Content
MMD for natural aggregate found that it stability value from Fig 1 indicated that optimum binder content of 5% with respect stability around 2200kg .For RCA 10 % ,20%, and 30% the marshal stability value were in good in range and greater strength from 1960 kg to 1048 kg stability Value for RCA 10 % ,20%, and 30% with respect to optimum binder content 5 % always in increasing order with slowest decreasing manner .Stability Value for RCA 40 % ,50%, and 60% with respect to optimum binder content 5 % always in increasing order but faster decreasing value below 900 kg .
4.1.2 Flow vs. Binder Content
Figure 2 : Flow vs. Binder Content
Flow Value for natural aggregate from Fig 2 indicated that optimum binder content of 5.5% with respect to flow Value under 2-4 mm .For RCA 10 %, 20%, and 30% the flow value were in good in range and slowest increasing order but fall under range value of 2-4mm flow value for RCA 40%, 50% and 60% with respect to optimum binder content 5 % always in faster increasing order and exceed the limit value 2-4 mm.
4.1.3. Void in % vs. Binder Content

International Journal of Advance and Innovative Research Volume 6, Issue 2 (XXX): April – June, 2019
87
ISSN 2394 - 7780
Figure 3: Void in % vs. Binder Content
Void % Value of natural aggregate for optimum binder content of 5.5% from figure 3 under range of 3-5 % .For RCA 10 %, 20%, and 30% the flow value were in good in range and slowest increasing order and fall under range value of 3-5 %.Flow Value for RCA 40 %, 50%, and 60% with respect to optimum binder content 5.5 % in faster increasing order and exceed the limit value3-5 %.
4.1.4. Unit Weight vs. Binder Content
Figure 4: Unit Weight vs. Binder Content
Unit weight Value of natural aggregate for optimum binder content of 5.5% from figure 4 under range of 2.3 gm/cm3 -2.4 gm/cm3 .For RCA 10 % ,20%, and 30% the Unit value were in good in range and slowest increasing order and fall under range value of 2.3 gm/cm3 - 2.4 gm/cm3 .Unit Value for RCA 40 % ,50%, and 60% with respect to optimum binder content 5.5 % in sudden decreasing order and exceed the limit value 2.3 gm/cm3 -2.4 gm/cm3
4.1.5 VFB vs. Binder Content
Figure 5: VFB vs. Binder Content
VFB Value of natural aggregate for optimum binder content of 5.5% from figure 5 under range of 65-75.For RCA 10 %, 20%, and 30% the VFB value were in good in range and slowest increasing order and fall under range value of 65-75.VFB Value for RCA 40 %, 50%, and 60% with respect to optimum binder content 5.5 % in sudden decreasing order and exceed the limit 65-75.
4.2 Tensile Strength Ratio (TSR)
Figure 6 : Tensile Strength Ratio

International Journal of Advance and Innovative Research Volume 6, Issue 2 (XXX): April – June, 2019
88
ISSN 2394 - 7780
MQ Value of natural aggregate for optimum binder content of 5.5% from figure 6 it’s value is higher due to the high stability value .For RCA 10 %, 20%, and 30% the MQ value were in good in range for optimum binder content 5.5 % lie under limit of 2- 5 kN/mm.MQ Value for RCA 40 %, 50%, and 60% with respect to optimum binder content 5.5 % in sudden decreasing order and very lower value below 2 kN/mm.
4.3. Marshal Quotient (MQ)
Figure 7: Marshal Quotient
MQ Value of natural aggregate for optimum binder content of 5.5% from figure 7 it’s value is higher due to the high stability value For RCA 10 %,20%, and 30% the MQ value were in good in range for optimum binder content 5.5 % lie under limit of 2- 5 kN/mm MQ Value for RCA 40 %, 50%, and 60% with respect to optimum binder content 5.5 % in sudden decreasing order and very lower value below2 kN/mm.
4.4 Cost Analysis:
Table 4: Cost Analysis for 1 km length DBM
From the above table 4 ,addition of the transportation cost in each part of the material specification that obtained the actual cost of the each material for 1 km length of the DBM layer, it’s cost effective and economically for DBM layer construction its saving up 30 % for actual cost of the natural aggregate.
5. CONCLUSION The sieve analysis for course aggregate as well as fine aggregate the percentage of passing should lies as per IS sieve for both natural aggregate and RCA and it also followed the maximum percentage of passing 5% given as per MORTH specification Both of Elongation and the flakiness index value lies under MORTH specification The impact value of RCA smaller than the natural aggregate but both value lies under the MORTH specification Abrasion and crushing value of the RCA smaller than the natural aggregate but both the value lies under MORTH specification. VG 30 for ductility test ,penetration test and softening point test all the value lies as per the IS specification .MMD for different percentages of RCA with binder content when increase the RCA content in mix the stability value decreases and flow value increase Proportion of the RCA can be used up to the 30 % with natural aggregate ITS and TSR value decreases when increases the recycled aggregate after 30%.MQ value for optimum binder content of 5.5 % for RCA 10%, 20% and 30 % under 2-5 kN/mm as per MORTH requirement Economically beneficial for the road construction industry.
6. FUTURE SCOPE Natural aggregate or crushed aggregate demand increases day by day so it is necessary to control out this depletion of the natural resources for that can use in future regarding mega project The RCA or the demolished concrete aggregate can be use in normal construction work or sustainable pavement for rural or urban areas that might be control the depletion of the natural recourses or mining work .It is possible to use the RCA up 30% with natural aggregate or virgin aggregate. But there is scope of work to resolve out the problem of high water absorption and its weather effect properties to affect the whole pavement work or road work.
Sr.No. Material Specification Cost of Material Transportation Cost Total cost of Material 1. Bitumen Rs 2810 per tonne 10% of total cost of
bitumen Rs 3091 per tonne
2. Natural Aggregate Rs 1158 per Cubic meter
10% of total cost of bitumen
Rs 1274 per cubic meter
3. Recycled Concrete Aggregate (RCA) for 30%
Rs 810 per Cubic meter
10% of total cost of bitumen
Rs 891 per cubic meter
International Journal of Advance and Innovative Research Volume 6, Issue 2 (XXX): April – June, 2019
89
ISSN 2394 - 7780
REFERENCES [1] Mohammad Saeed Pourtahmasb andMohamed Rehan Karim, Utilization of Recycled Concrete
Aggregates in Stone Mastic Asphalt Mixtures, Received 1 October 2014; Revised 26 November 2014; Accepted 28 November 2014; Published 17 December 2014 Academic Editor: You Song
[2] Naglaa Kamal Rashwan, Evaluation of Aggregate And Mineral Filler Types On Characteristics Of Hot Mix Asphalt, International Journal Of Civil Engineering And Technology (Ijciet) Volume 6, Issue 6, June 2015, Pp. 213–222
[3] Animesh Das, On Bituminous Mix Design,July 2015 [4] Paranavithana, S and Mohajerani, A 2006, 'Effects of recycled concrete aggregates on properties of
asphalt concrete', Resources Conservation and Recycling, vol. 48, no. 1, pp. 1-12. [5] Harsh S. Parekh 1, Prashant K. Bhuva2 ,Vijay Kukadia3, Jignesh H. Solanki4, The Study Of Concrete
Behaviour PreparedWith Chemically Treated Recycle Aggregate: A Review, International Journal Of Advance Engineering And Research Development Volume 3, Issue 1, January -2016
[6] A.R. Pasandín A And I. Pérez,V Mechanical Properties Of Hot-Mix Asphalt Made With Recycled Concrete Aggregates Coated With Bitumen Emulsion,2014
[7] I. Pérez1; A. R. Pasandín; L. Medina, Hot Mix Asphalt Using C&D Waste As Coarse Aggregates, 2012 [8] Marcio Munize De Farias, Use Of Recycled Aggregates From Construction AndDemolition Wastes For
The Construction Of Flexible Pavements, Third International Conference On Geotechnique, Construction Materials And Environment, Nagoya, Japan, Nov. 13-15, 2013, Isbn: 978-4-9905958-2-1 C3051
[9] A.R. Pasandín And I. Pérez , Overview Of Bituminous Mixtures Made With Recycled Concrete Aggregates,2015
[10] Ana R. Pasandín , Ignacio Pérez , Joel R.M. Oliveira, Influence Of Ageing On The Properties Of Bitumen From Asphalt Mixtures WithRecycled Concrete Aggregates, 2015
[11] Ashraf M. Wagih , Hossam Z. El-Karmoty , Magda Ebid, SamirH.Okba,Recycled Construction And Demolition Concrete Waste As Aggregate For Structural Concrete, HBRC Journal (2013) 9, 193–200
[12] Sunil and A.V. Ravishankar, Recycled Aggregate Concrete, The International, Reviewer, Volume 1 | Issue 2 | July - December 2014 | Pp. 30-33 | Issn 2395-1575
[13] Julian Mills-Beale 1, Zhanping You, The Mechanical Properties Of Asphalt Mixtures With Recycled Concrete Aggregates, Received 18 November 2008 Received In Revised Form 16 August 2009 Accepted 17 August 2009 Available Online 15 October 2009.
[14] Gurukanth Donal Nixon D’Souza, Effect Of Use Of Recycled Concrete Aggregates In Bituminous Concrete Surface Course, Proc. of Int. Conf. On Advances In Design And Construction Of Structures 2012
[15] M.A. Sabhan , S.A. Mofiz Effect Of Gradation And Compactive Effort On The Properties Of Bituminous Mixes With Waste Concrete Aggregates, International Journal Of Civil & Environmental Engineering Ijcee-Ijens Vol: 11 No: 04,2011
[16] Sumeda Paranavithana And Abbas Mohajerani, The Effects Of Mixing And Compaction On Volumetric Properties Of An Asphalt Concrete Containing Recycled Concrete Aggregates,2003
[17] A.R. Pasandin , I.Perez Adhesion Of Recycled Concrete Aggregates, DemolitionDebris, And Asphalt, 2014
[18] A.R. Pasandin And I.Perez , Laboratory Evaluation Of Hot-Mix Asphalt Containing Construction And Demolition Waste,2014
[19] Muhammad Massood Rafi ,Adnan Qadir, Experimental Testing Of Hot Mix Asphalt Mixture Made Of Recycled Aggregates, Date Received: 7 January 2010; Accepted: 27 March 2010
[20] Muhammad Masood Rafi, Adnan Qadir, Sajjad Ali,And Salman Hameed Siddiqui, Performance Of Hot Mix Asphalt Mixtures Made Of Recycled Aggregates, Manuscript Received January 5, 2013; Accepted For Publication September 16, 2013

International Journal of Advance and Innovative Research Volume 6, Issue 2 (XXX): April – June, 2019
90
ISSN 2394 - 7780
USE OF KOTA STONE IN MANUFACTURING PAVEMENT TILES
Suresh Soni1, Rahul Kumar2, Riyazuddin Ansari3 and Rakesh Kumawat4 Assistant Professor1 and B. Tech. Students2, 3, 4, Poornima Institute of Engineering & Technology, Jaipur
ABSTRACT The utilization of these waste materials can be economical and eco-friendly alternative. For the study, waste material was crushed into fine aggregates of the desired size using jaw crusher and were sieved manually. The natural material is replaced by waste of kota stone used in the study and mix were evaluated for compressive strength test. This material can be used in pavement blocks at different Percentage. Performance of mix was evaluated on the basis of limit prescribed. From the after effect of this test inquire about, it is seen that Kota waste fulfilled quality parameters and can be utilized in low volume streets.
Keyword: compressive strength test, water absorption test.
INTRODUCTION INDIA has a wide range of dimensional stones that incorporate rock, marble, Kota stone, sandstone, limestone, slate and quartzite, spread out everywhere throughout the Nation. Stone have been a major base in construction industry in India, as they are extensively in public buildings, hotels, and temples.
In this study we use kota for the improvement of pavement blocks used in footpaths, parking areas. We can see nowadays a proper road network is very important for development of country however construction of highways and road pavement involve a huge amount of natural resources. With time as road construction network is increasing, so is the requirement of aggregates. To fulfill this demand, mining of natural aggregates is also increasing making the availability of good quality of natural aggregates. And to reduce this effort as well as process we used kota & waste in the form of aggregate by collecting it from various places where cutting and edging of these stones takes place. (Fig. 1)
Fig.1- Cutting of Kota Stone
OBJECTIVES OF THE RESEARCH To reduce the waste material.
To make it eco-friendly.
For inspection of Strength.
To make it economical.
MATERIALS USED IN RESEARCH Kota Stone
Sieves
Rammer
Cement

International Journal of Advance and Innovative Research Volume 6, Issue 2 (XXX): April – June, 2019
91
ISSN 2394 - 7780
Sand
Aggregate ( 6to 10 mm)
TESTS COMPRESSIVE STRENGTH TEST- 9 in. × 3 in. × 2 in. concrete blocks Specimens with normal cement (OPC) and grit (6-10mm) part replaced by and Kota stone chips, consequently at 100 percent, severally. throughout casting, the blocks area unit created within the hand press machine. once creating the specimens area unit far from the moulds and subjected to water activity for two days. once activity, the specimens area unit tested for compressive strength employing a tag compression testing machine of 2000 KN capacities. The compression take a look at is administered on the specimens at the top of seven days, fourteen days and twenty eight days of activity.
Fig.2- Compressive strength test
WATER ABSORPTION TEST - This test helps to determine the water absorption of coarse aggregates as per IS: 2386 (Part III) – 1963. For this test a sample not less than 2000g should be used. The apparatus used for this test are :- Wire basket – perforated, electroplated or plastic coated with wire hangers for suspending it from the balance, Water-tight container for suspending the basket, Dry soft absorbent cloth – 75cm x 45cm (2 nos.), Shallow tray of minimum 650 sq.cm area, Air-tight container of a capacity similar to the basket and Oven.
Fig.4- Standard Proctor Test
RESULTS Results of Compressive strength test in different days are shown in below Table 1,2 &3.
S. No. Concrete Grade Sample Content Compressive Strength Test(7 Days) N/mm2

International Journal of Advance and Innovative Research Volume 6, Issue 2 (XXX): April – June, 2019
92
ISSN 2394 - 7780
1
M-15
0% (only concrete) 11.05 2 10% Kota stone 13.4 3 20% Kota stone 14.7 4 30% Kota stone 14.5
Table 1
S. No. Concrete Grade Sample Content Compressive Strength Test(14 Days) N/mm2
1
M-15
0% (only concrete) 15.03 2 10% Kota stone 18.03 3 20% Kota stone 19.1 4 30% Kota stone 20.3
Table 2
S. No. Concrete Grade Sample Content Compressive Strength Test(28 Days) N/mm2
1
M-15
0% (only concrete) 19.76 2 10% Kota stone 21.6 3 20% Kota stone 22.4 4 30% Kota stone 21.07
Table 3
CONCLUSION By using M-15 concrete we used different samples of kota stones we get increasingly compressive
strength.
On respective 7,14 & 28 days the compressive strength is increasing.
Using of this material can be quite effective.
REFERENCES 1. Ahmedzadershal, P. and Sengoz, B., 2009. Evaluation of steel slag coarse aggregate in hot mix asphalt
concrete. Journal of Hazardous Materials, 165(1), pp.300-305.
2. Asi Ibrahim, Shalabi Faisal , Naji Jamil “Use of basalt in asphalt concrete mixes” Received 25 September 2007Construction And Building Materials 23 (2009) 498–506
3. F. MoghadasNejad, A. R. Azarhoosh2 and Gh. H. Hamedi “Laboratory Evaluation of Using Recycled Marble Aggregates on the Mechanical Properties of Hot Mix Asphalt Concrete”.
5. Dr. Adil N. Abed and Sadoon O. Eyada “The Use of Sulaimania Marble Waste to Improve The Properties of Hot Mix Asphalt Concrete”.
6. Mustafa Karasahin, SerdalTerzi “Evaluation of marble waste dust in the mixture of Asphaltic concrete”
7. SevilKofteci, NiyaziUgurKockal “Using Marble Wastes as Fıne Aggregate in Hot Mix Asphalt Production” ISBN: 978-1-63248-020-0
8. Ghazi G. Al-Khateeb; Taisir S. Khedaywi; Turki I. Al-Suleiman Obaidat; and Ahmad MirwaisNajib “Laboratory Study for Comparing Rutting Performance of Limestone and Basalt Superpave Asphalt Mixtures”.
9. I.S. 2386 Part I
10. I.S. 2386 Part III
11. I.S. 2386 Part IV

International Journal of Advance and Innovative Research Volume 6, Issue 2 (XXX): April – June, 2019
93
ISSN 2394 - 7780
12. I.S. 2386 Part V
13. I.S. 6241
14. I.S. 1202
15. I.S. 1203
16. I.S. 1205
17. I.S. 1208

International Journal of Advance and Innovative Research Volume 6, Issue 2 (XXX): April – June, 2019
94
ISSN 2394 - 7780
CASE STUDY OF LAND USE AND LAND COVER MAP OF JAIPUR CITY
Suresh Soni1, Anish Kumar2, Atul Jain3 and Amit Choudhary4 Assistant Professor1 and B. Tech. Students2, 3, 4, Poornima Institute of Engineering & Technology, Jaipur
ABSTRACT Land use arranging is a specialty of science which decide the sort of land use through the biological character of the land and its financial structure. The likelihood to get ready for fitting utilization of land and to upgrade the present administration of the land use by using Geographical Information System(GIS). Toward the end, the specialist recognized and further advances are taken towards creating maps to decide the natural and financial asset of the Jaipur city involve a territory of 484.6km square. Computerized maps are inputted alongside informative information into an Arc GIS programming application. Moreover, all computerized maps including soil disintegration, vegetation, atmosphere, water asset had been coordinated superimposed in the Arc GIS. At long last, land use and land spread maps of Jaipur city has been created considering the environmental and financial character of the territory. The consequences of assessment show land use and land cover of the investigation region at determined time are as per the following Buildup region: 3728 out of 2000 to 6683.74 in 2009, farming territory: 4353.35 in 2000 to 2401.66 in 2009, vegetation: 3858.70 in 2000 to 2023.09 in 2009, water body: 96.28 in 2000221.32 in 2009, open field: 7960.26 in 2000 to 8627.36 in 2009.
INTRODUCTION Expanding development rate and financial improvement in nations alongside populace have leaded everybody to fast change in land utilization of Earth. These progressions appear to resemble accomplishments and development yet just in present moment, in long haul it is driving towards extraordinary change in atmosphere and increment in contamination which will at last lead everybody to dull future rather than splendid one. These progressions are requiring over utilization of regular assets and which is changing common example of land use land spread.
Land use arranging essentially implies the arranging of place that is known for wherever so urbanization and modernization can be achieved alongside economical and green improvement. Land use should be possible for any sort of financial work, despite the fact that it alludes to a neighborhood it can influence worldwide procedures like environmental change. Subsequently, by suitably controlling and characterizing laws for it Government can likewise effectively partake in contamination aversion and control.
Land use arranging alludes to the procedure by which it tends to be effectively chosen that at which place which sort of financial exercises can happen and this will improve land use design and through this land could be used in progressively powerful way to accomplish a contamination free and supportable condition.
Land use and land spread are utilized numerous multiple times as equivalent words of one another yet they are altogether different from one another. Land spread methods what is on the land in common and land use implies for what reason it is being utilized by anybody specifically. for example on the off chance that we consider a Golf Course and an Office constructing these the two things go under business class in view of their territory use however on Golf Course grass will be there and Office zone will be considered as developed by their property spread.
Land use arranging should be possible through numerous ways however in the present situation Remote Sensing and GIS is the most widely recognized and quickest strategy being use for this. It has numerous advantages like we can gather every one of the information from sitting at a spot you needn't bother with to complete a review for gathering information. Studies are done however for a cross check in order to accomplish exactnet.
I. STUDY AREA: JAIPUR CITY Jaipur is the capital of Rajasthan and it is otherwise called "Pink City". Jaipur is arranged in the eastern limit of the Thar Desert-a-semi-bone-dry land.Jaipur is the main arranged city of India, arranged in the foot slopes of Aravali mountain ranges at an elevation of 431 m a.m.s.1. All out length of Jaipur from east to west is around 6 km and all out width from north to south is around 75 km. Jaipur District has all out territory of 11,117 sq. km. with a normal populace thickness of 470people per sq. Km. Jaipur city lies on the topographical directions of 26° 55' 0" n, 75° 49' 0" e and spreads a region of 200.4 sq. Km. The all out populace of jaipur city was observed to be 3,073,350 in statistics 2011. There are little scale ventures in jaipur, and a portion of the real ones are situated toward the west and south of the city about 15– 40 km from the site area.the precipitation happens from july to september amid storm period and once in a while amid rest time of the year in the wake of western unsettling influences. The year is commonly separated into four seasons in particular - summer or sweltering

International Journal of Advance and Innovative Research Volume 6, Issue 2 (XXX): April – June, 2019
95
ISSN 2394 - 7780
climate season from march to may, storm season from end of june to mid-september, post rainstorm from october and november and it is known as travel period and winter season begins from mid-december to mid-february.
Fig. 2. Google Earth image of the Jaipur study area
DATA ANDMETHODOLOGY A. DATA To roll out the improvement examination of the investigation territory two pictures from the satellite Landsat MSS 2000 and 2009 were utilized. The information for this examination was taken from GLCF (Global land spread office) site. Both the dates and month are picked as intently as could be allowed to accomplish same vegetation season for dispensing with blunders. The month picked was September for both the satellite pictures. Every one of the groups were picked for the investigation and band blend was a bogus shading composite.
The Software utilized for this venture were QGIS and SAGA GIS. Both are open Software which are unreservedly accessible. These are likewise simple to deal with.
• Q GIS:- Quantum GIS is a free and open source GIS application. It was a consequence of source Forge venture, Q GIS is created utilizing C++ and Qt Toolkit. It is perfect with all OS and it can deal with various raster, vector and database functionalities. Q GIS additionally fills in as a window for evaluating various other open source GIS bundles, for example, SAGA, GRASS, Post GIS, map server. It likewise has simple and helpful access to different instruments and modules. It is generally speaking an extremely open source Geospatial apparatus.
• SAGA:- System for Automated Geo-logical Analysis a Geographic Information System (GIS) programming. Adventure is a free Open Source Software (FOSS). Adventure furnishes an effectively agreeable UI with numerous perception choices. Adventure keeps running under Windows and Linux working frameworks. Adventure has been intended for a simple and viable execution of spatial calculations. Adventure offers a far reaching, developing arrangement of geo-logical techniques.

International Journal of Advance and Innovative Research Volume 6, Issue 2 (XXX): April – June, 2019
96
ISSN 2394 - 7780
B. PRE-PROCESSING • Band Combination:- This is done using Q GIS Software. It is necessary as individual bands are in grey level
so band combination gives the places some colors which are visible to our eyes so as to detect things properly.
• Procedure.
• First, we open Quantum GIS via the Start Menu (Start % All Programs % Q GIS Desktop 2.12.2).
• We than open raster Miscellaneous Merge.
• A popup window will appear.
• Give Input and Output file name.
• Click on layer stack and the popup window will appear follows.as

International Journal of Advance and Innovative Research Volume 6, Issue 2 (XXX): April – June, 2019
97
ISSN 2394 - 7780
• Click ‘OK’.
• Processing will be done and image will be shown.
2. Geo-referencing:- It is a process of establishing a mathematical relationship between the image coordinate system and the real world spatial coordinate system the map is in the Universal Transverse Mercator (UTM) projection based on WGS 84 Datum.
PROCEDURE • First, we open Quantum GIS via the Start menu (Start % All Programs % Q GIS Desktop 2.12.2).
• We then open QGIS Geo-reference via menu bar (Raster% Geo-referencer % Geo-referencer).
• The Geo-referencer is in the form of a window with 2 parts of it. The upper part is called ‘main work space’ dedicated to display the Raster Map to Geo-referenced. The lower part titled as ‘GCP table’ is where the Ground Control Point data and residuals will be displayed.
• Add the satellite image to the Geo-referencer by clicking on the Open Rater button.
• You will then be presented with a popup window, navigate to the folder in which the Satellite image file is kept. Click on the drop down menu right to the file name and select the image and click ‘Open’.
• You will then be presented with the Coordinate Reference System Selector Window, from which we will select the WGS-84 under Coordinate Reference System of the world section.
• To Geo-reference an image we use GCP points. GCP is a location on the Earth’s surface with known coordinates on both Earth and Image.
• To start adding GCP’s to our Image, we first zoom to a point of the image where we can easily identify the object. Use the scroll wheel of the mouse to zoom in and out of the image. Use the pan button when needed.
• The GCP’s or coordinates for the image are taken with the help of Google Earth and Field survey if possible.
• To add GCP click on the add point button, or go via the Menu (Edit % Add Point). The mouse will transform into a ‘+’ sign which we use to click on the object of the image whose coordinates are known. Use View tool when needed.
• A window ‘Enter Map Coordinates’ will popup where we enter the coordinates of object which we take from the image. Always enter ‘Longitude or Easting’ in X field and ‘Latitude or Northing’ in Y field. Use ‘Space bar’ in the keyboard to separate the Degree value from Minutes value and then click ‘OK’.
• In this exercise we are using the ‘Polynomial 2’ transformation to Georeference the image. For the
‘Polynomial 2’ transformation we will require 6+1 (for Check) i.e. 7 GCP’s or more GCP’s on the image. Therefore, we need to mark at least 7 GCP’s. The GCP’s locations should be spread out as much as possible and they should not be Co-linear at the same time they should enclose our whole area. Use the above procedure to mark 6 more control points.
• We now set the spatial reference settings for the image by clicking on the ‘Transformation Settings’ button. The ‘Transformation Settings’ window pops up in which we will enter the Spatial information of our image.

International Journal of Advance and Innovative Research Volume 6, Issue 2 (XXX): April – June, 2019
98
ISSN 2394 - 7780
• Click on the ‘Transformation type’ drop-down menu and select ‘Polynomial 2’ this means we will be using
a second order polynomial transformation.
• Click on the button next to ‘Output Raster’. A dialogue box will appear in which we enter the name of our output file. It is recommended to include the name of the original file in this file. This helps us to keep track of our work.
• ‘Check’ the check box ‘Load in QGIS when done’ and use ‘0’ for transparency when needed’, leave the reset of the values as default.
• Click ‘OK’
• After click ‘OK’, the last column ‘residual (pixels)’ displays some values. These are the error values associated with the GCP’s. an error value of 1 or less would be satisfactory.
• Double check and adjust the GCP locations if the value is greater than 1. To adjust a point click on the ‘more GCP Point’ button, and then click and drag the point to the desired location. Use delete point button to delete an erroneous GCP. We can also enable and disable the GCP’s by using check boxes under ‘On/Off’ column in “GCP Table’.
• Once the error is around or below 1, clicks the ‘Start Geo referencing Button’. The processing will take at about 2 minutes. The Geo refrenced image will be found at the location specified for the ‘Output File’ in Step 15. You can also notice, the Output file loaded in QGIS canvas.
• It is useful to save the GCP’s for later use, if the Geo referencing needs to be done again, or if corrections are required. To save them, click on the ‘Save GCP’s button’. In the popup window enter an appropriate name for the GCP file, preferably the same as that of image.
RESULTS AND DISCUSSION The land use land spread mapping delineates a fundamental thought that in which course the advancement is going. It delineates a general zone usage of characteristic assets or social assets. This investigation was

International Journal of Advance and Innovative Research Volume 6, Issue 2 (XXX): April – June, 2019
99
ISSN 2394 - 7780
completed on two locales of Jaipur, Sitapura andSanganer , both are arranged in eastern modern region of Jaipur. In this examination change discovery of ten years (2000-2009) is delineated utilizing the unsupervised
The above figure demonstrates the land use and land spread guide of eastern mechanical territory of Jaipur amid 2000. For LULC map arrangement, the territory was separated in five noteworthy classes specifically farming, development, open field, vegetation and water body. This LULC map is set up by unsupervised characterization. These maps are set up by taking it in right off the bat 60 classes in the product and after that those classes are compacted to 5 noteworthy classes.
Fig. Landuse Land Cover Map 2009
This examination uncovers that the development territory expanded radically while rural land and vegetation diminished from year 2000-2009. Development and open field expanded from 18.64% to 33.57%, 39.80% to 43.14%, separately. Then again the agrarian and vegetation land diminished from 21.77% to 12.05%, 19.29% to 10.11%, individually. The change in various classes has been appeared Table 2. The Landsat 5 MSS satellite datasets utilized in the present examination yielded the accompanying correlations as for land use/land spread change location.

International Journal of Advance and Innovative Research Volume 6, Issue 2 (XXX): April – June, 2019
100
ISSN 2394 - 7780
CONCLUSION The examination was completed in the eastern modern piece of Jaipur. This investigation unmistakably expresses that Remote Sensing information combined with GIS programming gives a solid apparatus to identify changes occurring in any territory so it become simple to take out the awful impacts occurring in that specific region as a result of the progressions and advance beneficial things so populace living around there live sound and rich. The change investigation of the zone in years 2000-2009 gave extremely fascinating realities. The examination uncovered that there is a huge change in Buildup and Agriculture just as Open Field. Development zone expanded from 18.64 % to 33.57 % for example complete increment in territory was 2955.37 hectare on the other hand Agriculture land diminished from 21.77 % to 12.05 % for example all out abatement in zone was 1942.69 hectare. This examination uncovers that development land expanded double the decline in Agricultural Land. There might be a few explanations behind this, one and most critical is increment in populace and urbanization just as industrialization. Individuals looking for work and cash are leaving from towns to towns bringing about increment in populace. It is beyond the realm of imagination that the entire group can live in the city so they are turning towards out of principle city and are making it swarmed. Additionally, businesses are expanding for the sake of advancement which is dirtying Environment and Land. Due to this land contamination, open field which incorporate the absolute increment in region was 667.1 hectare. Increment in rush hour gridlock and deforestation is additionally a noteworthy reason of increment in Buildup and diminishing in agribusiness and vegetation. Change Detection Analysis draws out the genuine land lossand land gain on Residential/Commercial/Industrial, Agriculture, Vegetation, Water Body and Open Field. Water body additionally recognized a few changes however little in light of the fact that the information taken was of September month and because of storm some adjustment in water body occurred. This was checked in field through close to home inspection. The issues emerging from these progressions can be wiped out by making a few strides by government as well as by individuals living here.
REFERENCES [1] Atiqur Rahman, MaikNetzband, Singh Alka and JavedMallick, An Assessment Of Urban Environmental
Issues Using Remote Sensing And GIS Techniques: An Integrated Approach. A Case Study: Delhi, India. 2009.
[2] BhagawatRimal, Application Of Remote Sensing And GIS, Land Use/Land Cover Change In Kathmandu Metropolitan City, Nepal. Journal of Theoretical and Applied Information Technology, 2011.
[3] BalqiesSadoun and Samih Al Rawashdeh, Applications of GIS and Remote Sensing Techniques to Land Use Management. IEEE, 2009.
[4] Chengfan LI, Wei LIU and Jingyuan YIN, Database Construction Of Urban Landcover Information Using RS And GIS. ICSSC, 2011.
[5] Chauhan J.S. and Balak Ram, Application of RS and GIS to assess Land Use Changes in Jhunjhunu District of Arid Rajasthan. J. Indain Society of Remote Sensing, 2009.
[6] Guang YANG and Gang QIAO, Data Processing Method for Current Land Use Using GIS Technology.IEEE, 2010.
[7] Madan P Jha, ManojPanwar and DeveshKhandelwal, Mining & Land Management of Kishangarh (Rajasthan) With the Integration of Gis Technique. International Journal of Remote Sensing & Geoscience, Vol. 1, Issue 2, Sept. 2012, ISSN No: 2319-3484.

International Journal of Advance and Innovative Research Volume 6, Issue 2 (XXX): April – June, 2019
101
ISSN 2394 - 7780
[8] Pandian. M, Rajagopal.N, Sakthivel. G and Amrutha. D.E, Land Use And Land Cover Change Detection Using Remote Sensing And GIS In Parts Of Coimbatore And Tiruppur Districts, Tamil Nadu, India. International Journal of Remote Sensing & Geoscience (IJRSG), Volume 3, Issue 1, Jan. 2014.
[9] ReisSelçuk, Analyzing Land Use/Land Cover Changes Using Remote Sensing and GIS in Rize, North-East Turkey. 1 October 2008, ISSN 1424-8220.
[10] Soni Sandeep, Crop Area Estimation for BundiTahsil of Rajasthan using Remote Sensing and GIS Technique. 2011.
[11] WANG Feng-xia and ZHOU Wan-cun, The Study on Land Use Changes of Wenchuan Disaster Area based on RS and GIS. IEEE, 2009.
[12] Yangchuan.J, Jain, A.K., and Tiwari, A.K, Spatial changing pattern in land use/land cover using GIS: a case study of Sukhnachoe watershed, India. International Journal of Scientific & Engineering Research, Volume 5, Issue 10, October-2014, ISSN 2229-5518.

International Journal of Advance and Innovative Research Volume 6, Issue 2 (XXX): April – June, 2019
102
ISSN 2394 - 7780
A STORM WATER FILTRATION SYSTEM
Anurika Mehta1, Brahmraj Meena2 and Jitendra Laxkar3 Associate Professor1 and B. Tech. Students2, 3, Poornima Institute of Engineering & Technology, Jaipur
ABSTRACT To reduce pollutants present in urban runoff, the stormwater control has been developed widely. Number of peoples work regularly in this direction. They must take the decisions regarding site designs for essential controls to achieve the objectives of maintaining and improving the quality of runoff. Now-a-days multiple structural and non-structural control devices are available according to the needs because of increase demand of this. This paper will present a basic structure and working of up-flow filter for the stormwater runoff to improve the quality and utilization of runoff. For this we review various filters that are available including the types of filtration techniques, the variety of filtration media that area vailable, and factors to consider when making the proper selection decision. Keywords: Up-Flow filter, Water Treatment, stormwater runoff, techniques, filtration media.
INTRODUCTION The counter current or up-flow filter works on as imple fluid hydraulics. It is autonomous, there are no moving parts, no external power required for working of it and it is made with non-corrosive durable components. To operate the unit, no need for personnel or maintenance periodically limited to the inspection of the removal, sediment and floatable materials, Drain media pack replacement and filter replacement [1].
Due to the high amount of runoff and peak flow, and with significant contamination of Sediments, various metals, nutrients, cyclic aromatic hydrocarbons and different salts in urban stormwater [2]. Decline is one of the main causes of urban erosion. As the present urban drainage system is the system, which relies largely on piped sewer systems, cannot be sustainable, efforts are needed. Water Sensitive Urban Design (WSUD) and Low Impact Development (LID) Concepts are designed to develop and perfect sustainable urban drainage solutions. The promising system recommended for WSUD and LID applications is rainwater Biofilter (also known as bio retention system or gardle rain) using the filter media [3].
This paper is based on the effects of various environmental factors, rainwater characteristics and modifications of filter design for metals, nutrients and suppression. Biofilter have a total content of suspended solids (TSS) and pass through their polluting pathways [1]. Checked for these purposes, variants equipped with biofilter sand a submerged area, and a separate filter material has been highlighted for different temperatures and dry periods with rainwater and pollutant concentrations Measured [3]. High performance modular microfiltration system for rainwater filtration and uses the physical, chemical and biological system of soil, plants and micro-organisms Generally complex to remove pollutants found in Modular storm drains [2]. The treatment system in which the biologically active bio-media is fully utilized, integrated system, mounted in square feet or increments of unit for processing Contaminated flow of impervious surfaces. The focal point is an evolutionary biofiltration [1-3]. The system that combines the efficiency of high-throughput engineering soil Stability and modularity of a highly deformed open cell under a drain / storage / infiltration.
Although originally developed as a proprietary technology, these systems are also a tightly available general format is available. Biofiltration of the next generation of focal point. The media was developed by Larry Kaufman, a low-impact development producer For your high performance. This advanced multimedia technology provides high data rates, Pollutant removal rate is consistent with conventional bi-ore retention, and option.
Increased elimination characteristics of specific pollutant are targets. Effect of media throughput In all aspects, the performance of the system, the magnitude of the security factors and the profitability, Longevity and minimum maintenance. Although the percentage of evictions has been consistently high (> 70%), this shows that biofuels can relieve rainwater reliably, the results show that the meteorological concentrations at the flow can vary.
METHODOLOGY The availability of materials for the implementation of this project is of great importance. The materials used in the construction of this project are local sourced materials which comprised the centrifugal pump, switch, pipe, head tank, bio-media, strain filter, ceramic ring, activated carbon, reservoir and reagents used for the laboratory analysis.

International Journal of Advance and Innovative Research Volume 6, Issue 2 (XXX): April – June, 2019
103
ISSN 2394 - 7780
In this project we need to follow these steps:
Step 1: Construct a manhole system and this manhole collects the storm water;
Step 2: Manhole connect to a biofilter system. This Biofilter system is purify the storm water at primary level, in three stages:
Stage-1: Coarse particle settling;
Stage-2: Gross pollutant screening;
Stage-3: Filter packs process (fine particle filtration through up-flow);
Step 3: Storm water flow in distribution media and collect the clean storm water in another chamber (this chamber consist a special types of coagulant i.e. KAMIRA, which is more effective than other coagulant);
Step 4: After that it is passing into a bypass system design (syphon design) which increases velocity of storm water; Step 5: After the whole process, replace the filter media automatically, by using drain down filter.
Figure 1 Diagram of Primary Clarification Chamber [2]
METHODS In order to choose the appropriate and cheapest method to adopt in the project implementation, the followings were considered:
i) The process that would involve and the necessary technology required;
ii) The availability of materials/components required for implementation.
The bottom-top approach method was used to realize the project. In this method, each section of the project was developed first before the final coupling.
MATERIAL Following materials are required for manufacture of a simple Biofilter:
1. Filter module cover and Media Restraint.
2. Flow-distributing Media.
3. Filter Media Bags.
4. Filter Media Bags
5. Cam latch.
6. Conveyance Channel.
7. Filter Module.
8. Support Bracket / Angled Screen.
OPERATION Floatables, Oil and Sump Clean Out Procedures
1. Establish all necessary security tools (such as traffic cones) around the range of the updraft filters. Security equipment must inform pedestrians and road traffic the work continues.
2. Remove the grate or lid to the manhole or vault.
3. See the bottom of the room without entering the boat
4. Inspect indoors. Concentrate on any irregularities.

International Journal of Advance and Innovative Research Volume 6, Issue 2 (XXX): April – June, 2019
104
ISSN 2394 - 7780
5. If you stand in the sumpis above the water level Pull the filter module, release the pull chain(s) Plug the drain (S). Leave the excess water out. Use the skimmer poletoinser the drain plug into the open port.
6. Once all float and oil have been removed, exit the vector. Pipe on the Sump Basis Sediment and Grease Vector Extract From the bottom of sediment debris and 0.6 to 360 yd3 Gallon water will be removed from a common manhole Flow filters during this process.
7. Remove the vector hose from the utensil.
8. Inspect the inclined screen for interruptions and flaps. Yes Right now, remove the barrier or ragged contents Surface using a pipe or other screen-cleaning device.
9. On the maintenance log provided by Hydro International, Date, location of the unit, estimated amount off loats, Oil and large debrisre moved and sediment depth Measured. Focus on the net irregularities in the form of damage Components or blockages.
10. Securely replace the grate or lid.
11. Remove safety equipment.
12. Depositing sediment and large debrison your local landfill site; follow the local rules.
13. Dispose of oil and sump water at a licensed water treatment facility.
Figure 2 Diagram of System [3]
RESULT Removal percentages were consistently high (>70%), it demonstrating that biofilter can reliably treat storm water, the results show that metal out flow concentrations may vary widely and which depending on the biofilter design and the ambient conditions.
CONCLUSION This paper provide an idea about the utilization of this filter in an appropriate way. There are many advantage of this biofilter as water is very essential but limited in quantity now-a-days, so there is a need to maintain the quality and quantity of storm water for a better life.
Salient features of the project are:
Eco-friendly in nature;
Economical;
Improved storm water management;
Low-energy treatment technology;
Automatic cleaning filter;
Reduce human efforts
Provide both water quality and quantity benefits.

International Journal of Advance and Innovative Research Volume 6, Issue 2 (XXX): April – June, 2019
105
ISSN 2394 - 7780
FUTURE ASPECTS Uncontrolled storm water discharges are detrimental to the health of receiving waters. We therefore need to better manage the quality and quantity of urban runoff in order to both protect and (ideally) restore the ecological health of urban waterways. At the same time, climate change is increasing the frequency of storm events and thus the risk of draught. Therefore, it is likely that augmentation no fexisting drainage systems will be required in order to prevent storm water in urban areas for better utilization of water in many areas. Future aspect the standard biofilter technology with a carbon source will be used for better treatment of storm water.
REFERENCES 1. ISEPA, (2014). Imo State Environmental Protection
Agency Laboratory Analysis of Water Sample, Prefab.
2. Uzoigwe, L.O., Maduakolam, S.C and Nkwocha, T.U, “Design and construction of bio-filter for the recirculation of fish pond using locally source Materials, Research Journal of Agriculture and Environmental Management. Vol. 4(1), pp. 027-038, January, 2015.
3. Abdel Majid Nassar1, Kamel Hajjaj, “Purification of Stormwater Using Sand Filter”, Journal of Water Resource and Protection, 5, 1007-1012, 2013.

International Journal of Advance and Innovative Research Volume 6, Issue 2 (XXX): April – June, 2019
106
ISSN 2394 - 7780
ASSESMENT OF ENCROACHMENT AREA AND WATER QUALITY OF CHANDLAI LAKE
Dr. Prannath Dadhich1, Manoj Kumar2, Md. Parwez Musharraf3 and Mayank Agarwal4 Associate Professor1 and B. Tech. Students2, 3, 4, Poornima Institute of Engineering & Technology, Jaipur
ABSTRACT Lakes are the major source of water to the society. It fulfills the demands of humans, animals& plants also.With each passing year pollution is increasing everywhere. With increase in population, Pollution level is also increasing into the water bodies. Now days the lakes are degrading & depleting at a rapid rate which causes serious problems in our society. Restoration deals with the establishment of the various techniques & methods, which deals with the origin of the problems and making the cure for all this. In addition to assessing the costs of actions to improve the water& environment, the strategy will begin to explore the wider societal benefits of a better environment. The comparative analysis of water samples will also help us to understand the problems and the actions needed to overcome itThere are several factors that are responsible for pollution in rivers like false output from industries, domestic wastes, sewage, agricultural waste, etc. Restoration of water bodies can be one of major factors that can reduce the pollution level in water bodies. Managing the undesirable inputs into the water bodies can help not only in reduction of pollutants but also reduces the cost of maintenance. Keywords – Restoration, Depleting, Water Quality.
INTRODUCTION Chandlai lake is our study area in which we are paying attention on the improvement of lake water quality by reducing the ill effects caused by the surrounding areas as well as the work culture of humans in that area.
Water scarcity is very common in India but it is becoming severe in Rajasthan where potable water resources are very limited. Surface water resources in Rajasthan getting polluted due to industry and urban development. Therefore to evaluate and assess the reasons for pollution taking place become very significant for water resources. Chandlai Lake is located in the southern Jaipur in Chandlai village. It was resource of water for villagers to use in agriculture as well as for animals. But in present the water quality is deteriorated too much and due to that water become unusable. This lake is polluted due to industrial development and urban encroachments. Therefore in this study water quality and encroachment as well as reason due to that lake is affected will be assessed.
Providing a better water quality to society is the main aim of any environmental engineer. It is better to utilize the new techniques that are related to find out the water quality parameters and access the fresh & bacterial free water for drinking purposes. Natural resource management deals with the effective & efficient management of lands, plants, soils & water for keeping our environment & biodiversity alive in nature.
In this case we need to do is providing a framework for analyzing the impacts of humans & their behavior on the nature. Available data reveals that increase in population is creating an adverse effect on the environment & biodiversity. A social impact assessment is useful to create some parameters, which are helpful to cope up with sequentially degradation of the surrounding land use.
The effective plantation of trees in nearby areas & stopping the overgrazing by the cattle’s may reduce the impact on the environment. Promotion of sustainable development may be adopted in a hierarchical order. Adopting these remedies may sure reduce the negative impact on our environment. It utilizes a framework, which consists of sustainable management & restoration of lakes making a perfect ecological balance in the environment.
STUDY AREA Chandlai Lake is situated around 30kms away from the Jaipur havingcoordinated:26°41'45"N 75°52'36"E.It is a major source for various migratory birds that are coming to the lake during the monsoon season & also to the villagers that are using the water for the agricultural purposes. However, in recent era, the conditions are very exhausted and the natural cycle is very disturbed. The lake is suffered from depletion of water quality and natural resources, which also affects the life of villagers & migratory birds. In order to recreate the healthy conditions, we need to understand the basic problems that are associated with the lake, which causes its deterioration with rapid rate.

International Journal of Advance and Innovative Research Volume 6, Issue 2 (XXX): April – June, 2019
107
ISSN 2394 - 7780
Fig. 1 Map of study area
METHODOLOGY The First step was to identify and select a Lake Site for water sample collection. Then the process of collection of sample begins. This was carried on by determination of different properties of water sample, which was done by performing different lab tests of its sewage properties with keeping in mind the water quality parameters. The next step was to identify the amount of work done to restore the water quality of lake and their remedial actions to make this water a source for drinking and agricultural use. This will also show the various causes, which are responsible for the degradation.
RESULTS & DISCUSSIONS This table depicts the tests conducted on the water sample keeping in mind the permissible value of the water quality parameter of the drinking water.
Properties Observed values(mg/l) Permissible values(mg/l)
Total dissolved solids 1200 500-2000
Total suspended solids 1300 1000
Total solids 1500 2000
pH 7.1 6.5-8.5
Hardness 1356 300-600
Conductivity 12.2 mho 1.9mho
Turbidity 90 NTU 10 NTU
BOD 115 400
COD 980 250
DO 8.5 9.2
All permissible limits are taken from Is10500:2012.[3] It is essential to do aeration of the samples and then find out the quality & characteristics of water sample. It is assumed that after doing aeration, some of the parameters may be changed & it must lead to major improvement in the quality of water samples.
Fig 2 Graphical representation of BOD and COD

International Journal of Advance and Innovative Research Volume 6, Issue 2 (XXX): April – June, 2019
108
ISSN 2394 - 7780
Fig 3 Graphical representation of DO
After Aeration. The samples of BOD, COD and DO are collected before aeration denoted as 0hours and then after every three hours’ samples are collected. It can be observed from Figure 1 & 2 that BOD and COD values are continuously decreasing and decreased by approx 19 & 28 percent respectively in 6 hours. Whereas DO increased during this aeration process. It increased from 8 mg/l to 8.3 mg/l after 6 hours.
It is desirable to provide aerators in the lake, which will increase the amount of dissolved oxygen, which leads to improvement in qualities of water, as well as the aquatic species, which die due to lack of oxygen.
The availability of aerators also enhances the other parameters due to which quality of water will be improved. The removal of weeds in the nearby area & plantation will also assists to create a healthy environment in the nearby areas. The surrounding land mapping will also show the use of land & how the quality of land is affected due to degradation of lake.
Agricultural usage of water through the lake has to be minimized during the monsoon season thus increasing the water level in the lake, which can be used throughout the year in an effective manner.
These are some remedies if adopted the lake will restore to its original state & the humans & migratory bird wouldn’t suffer in future. It will also increase the beauty & aesthetic look of lake & conserving the biodiversity in the environment.
CONCLUSION Chandlai Lake is a major source of water to the nearby villagers & also to the migratory birds. Now days the condition is very worst & it need some implementation as early as possible. Harnessing the natural resources leads to very pathetic condition of lake & effective steps has to be taken in order to save our biodiversity.

International Journal of Advance and Innovative Research Volume 6, Issue 2 (XXX): April – June, 2019
109
ISSN 2394 - 7780
STRENGTH ASSESMENT & REDUCTION OF AREA AND VOLUME OF STRUCTURAL MEMBER BY USING CFRP
Meenakshi Dixit1, Vinay Raj Meena2, Vivek Kumar3 and Dharmendra Kumar4 M. Tech Structural Engineering1, YIT, Jaipur
B. Tech Civil Student2, 3, 4, PIET, Jaipur ABSTRACT Many reinforced concrete and masonry buildings are constructed annually around the globe. With this, there are large numbers of them which deteriorate or become unsafe to use because of changes in use, changes in loading, change in design configuration, inferior building material used or natural calamities. The use of carbon fibre reinforced polymer (FRP) materials for structural repair and strengthening has continuously increased in recent years, due to several advantages associated with these composites when compared to conventional materials like steel. This paper is carried out to investigate the overall actions of R.C cubes, strengthened with wrapped CFRP. From the literature study One or two of them will be a control specimen and the other six specimens were strengthened with CFRP. Test results exposed that the CFRP wrap increases the strength and ductility of plain and RC cubes expressively. The main conclusion of this paper was, strengthening of column using CFRP and which may give good results of the column carrying capacity.
INTRODUCTION A Fibre Reinforced Polymer (CFRP) composite is defined as a polymer (plastic) matrix, either thermo set or thermoplastic, that is reinforced (combined) with a fibre or other reinforcing material with a sufficient aspect ratio(length to thickness) to provide a discernable reinforcing function in one or more directions. Fibre-Reinforced polymer (FRP), also is a composite material made of a polymer matrix reinforced with fibres. The fibres are usually glass, carbon, or aramid, although other fibres such as paper or wood or asbestos have been sometimes used sometimes used.
Many buildings which are deteriorate or become unsafe to use because of changes in use, loading, design configuration, inferior building material used or natural calamities. Those structure would require strengthening or rehabilitation due to lack of strength, stiffness, ductility and durability etc. Use CFRP for these structures for enhance life and performance of structure members. FRP composites have become more popular in the last two decades due to the reduction in their cost, combined with newer understanding of the versatility and benefits of the material properties. CFRP strips and fabric are generally constructed of high-performance carbon fibres which are placed in resin matrix. The aim of this paper are to assessment strength of structural member and reduction of area and volume by using CFRP.
MATERIAL 1. Cement
2. Sand
3. Aggregate
4. Water
5. CFRP
1. CEMENT Cement is a binder, a substance that sets and hardens independently, and can bind other materials together. The most important use of cement is the production of mortar and concrete the bonding of natural or artificial aggregates to form a strong building material that is durable in the face of normal environmental effects.
Various types of cement are possible by blending different proportions of gypsum, clinker, and other additives. Cements that are used for construction fall into two main categories based on cement properties, hydraulic or non-hydraulic. In addition to the two main cement forms, there are several different forms of hydraulic cement. Of the many varieties of hydraulic cement, the most commonly used cement today is Portland cement.
2. SAND Sand helps to make concrete free from voids. mean sand helps to provide homogeneity to some extent. but mind that concrete is a heterogeneous material. A goal of mix designing is to achieve the following situation. The largest coarse aggregate has smaller particles which fill up the holes between the large particles.

International Journal of Advance and Innovative Research Volume 6, Issue 2 (XXX): April – June, 2019
110
ISSN 2394 - 7780
3. AGGREGATE Aggregates are the major component of any concrete it constitutes about 70–80% of the volume of concrete. When the size of aggregate is greater than 4.75 mm (say 5 mm) it is called coarse aggregate.
Following are the reasons why aggregates are used in concrete 1) They are easily available and they are economical as compared to cement.
2) Aggregates provide additional strength to the concrete.
3) Aggregates helps in binding the cement properly.
4. WATER Water used in concrete should be clean and free from any impurities. The pH value of water used in making concrete should not be greater than 6.
5. CFRP (Carbon Fiber Reinforced Polymer) CFRP Composites are lightweight, strong materials used in the manufacturing of numerous products used in our daily life.
Carbon fibers are used for reinforcing polymer matrix due to the following their properties: Very high modulus of elasticity exceeding that of steel.
Low density: 114 lb. /ft³ (1800 kg/m³).
High chemical inertness.
TESTING OF SAMPLE
1. COMPRESSION TEST Compressive strength is the ability of material or structure to carry the loads on its surface without any crack or deflection. A material under compression tends to reduce the size, while in tension, size elongates.
Compressive strength formula for any material is the load applied at the point of failure to the cross-section area of the face on which load was applied. Compressive Strength = Load / Cross-sectional Area (N/sq.mm)
Compressive strength of concrete cube test provides an idea about all the characteristics of concrete. By this single test one judge that whether Concreting has been done properly or not. Compressive strength of concrete depends on many factors such as CFRP strip, water-cement ratio, cement strength, quality of concrete material, and quality control during production of concrete etc.
2. TENSILE SPLIT TEST Tensile strength is one of the basic and important properties of concrete. A method of determining the tensile strength of concrete using a cylinder which splits across the vertical diameter. It is an indirect method of testing tensile strength of concrete.
It is the standard test, to determine the tensile strength of concrete in an indirect way. This test could be performed in accordance with IS: 5816-1970. ... Concrete cylinders split into two halves along this vertical plane due to indirect tensile stress generated by Poisson's effect.
RESULT CFRP Cover (%) Compressive Test(N/mm2) Split Tensile Test(N/mm2)
0 31.9 3.985 20 35.145 4.149 40 38.34 4.33 60 41.535 4.51 80 45.368 4.714
100 47.286 4.81

International Journal of Advance and Innovative Research Volume 6, Issue 2 (XXX): April – June, 2019
111
ISSN 2394 - 7780
CONCLUSION By increasing of CFRP area in strip form on structural member to increases the strength of the member. Reduction of size of structural member by maintaining area or loading on structural member. The strength of cube and cylinder at control mix are 31.9 and 3.985 N/mm2 are gradually increases using CFRP cover strip at 100% achieved strength of cube and cylinder are 47.28 N/mm2 and 4.81 N/mm2 respectively.
REFERENCES Jiang, H.; Desai, P.; Kumar, S.; Abhiraman, A.S.(1991) Carbon-fibers from poly(para phenylene
benzobisthiazole) (PBZT) fibers-conversion and morphological aspects. Carbon 1991, 29,635–644.
Karbhari, M. – Douglas, A.E. (1995) Effects of Short-Term Environmental Exposure on Axial Strengthening Capacity of Composite Jacketed Concrete. American Society for Testing and Materials, 1995.
Huch M, Lausch E, Struckmeier W. Mit der Erde leben: Beiträge geologischer Dienste zur Daseinsvorsorge und nachhaltigen Entwicklung. Germany: Springer-Verlag, 2013.
Ng See King & Ku Mohd Sani. 2000. ―Carbon Fiber Reinforced Polymer System for External Strengthening of Concrete Bridge Girder‖. ASPEC 2000, Kuala Lumpur.

International Journal of Advance and Innovative Research Volume 6, Issue 2 (XXX): April – June, 2019
112
ISSN 2394 - 7780
A REVIEW ON BIOMEDICAL WASTE, ITS EFFECTS AND MANAGEMENT
Dr. Anurika Mehta1 and Sanjay Singh2 Associate Professor1 and B. Tech. Students2,, Poornima Institute of Engineering & Technology, Jaipur
ABSTRACT Waste generation is a vast problem in all over the world and this problem increases day by day. Among all types of wastes biomedical waste is a major waste and due to it, lots of diseases also increase like human immune deficiency virus (HIV), tuberculosis, pneumonia etc. This waste sometimes works very hazardous and leads to dead full effect. This paper presents a vast review on biomedical waste and its management for making a Jaipur as smart city. In this paper, different types of biomedical wastes, their dead full effects and their better management-treatment & disposal for cure is discussed.
Keywords: Biomedical waste, HIV, Dead full effects, Treatment, Disposal.
INTRODUCTION Waste is any substance which is eliminated after primary use, or it is worthless, defective and of no use. There are many types of waste as shown in TABLE 1.
Table: 1. Different types of wastes and their constituents Type of waste Constituents
Municipal waste Domestic waste, commercial
waste and demolition waste.
Hazardous waste Industrial waste.
Bio medical waste Clinical waste, hospital waste.
Special hazardous waste Radioactive waste, explosive
waste, and electronic waste (e-waste).
Disposal of all kinds of waste and their adverse effects are big problem all over the world. Almost all the countries around the world are directing their efforts towards proper disposal of all type wastes. Increase in demand of Biomedical, huge amount of waste is generated in this field. So, now-a-days the management of biomedical waste (BMW), due to the increasing use of disposable items, has become one of the major problems faced by the developed countries. On the other hand developing countries are confronted with the problem of categorizing and disposing of medical waste in the sanitary arena.
1.1 Biomedical Waste The waste generated from the hospital and from the medical Centre where humans care facilities are carried out are termed as “Bio Medical Waste”.
As per Biomedical Waste Management and Handling Rules, 1998 of India, BMW is defined as “Any waste generated during the process of diagnosis and treatment or immunization of human beings or animals or in research activities contributing to the biological production or testing” (Govt. of India, 1998).
Biomedical waste may be solid or liquid. Discarded blood sharps, unwanted microbiological cultures and stocks are some examples of infectious waste, other human or animal tissue, used bandages and dressings, discarded gloves, other medical supplies that may have been in contact with blood. Potentially contaminated used and unused discarded needles, scalpels lancets and other devices are includes in waste sharps which are capable of penetrating skin.
Diagnosis, prevention, or treatment of diseases is the biological and medical sources and activities generate biomedical waste. Common generators or producers of biomedical waste include hospitals, health clinics, nursing homes, medical research laboratories, offices of physicians, dentists, and veterinarians, and funeral homes.
1.1.1 Sources of BMW In today’s time solid waste management is one of the major problems but still we are unable to give the proper attention towards special sources of wastes out of which biomedical waste is one. According to the quantities of

International Journal of Advance and Innovative Research Volume 6, Issue 2 (XXX): April – June, 2019
113
ISSN 2394 - 7780
biomedical waste it can be categorized as primary and secondary sources. The FIGURE 1 illustrates the major sources of biomedical medical waste.
Figure 1 Major Sources Of Biomedical Waste
1.1.2 Types of BMW Approx 75-90% BMW is nonhazardous as other municipal waste. The remaining 10-25% is hazardous to humans or animals and also for environment [FIGURE 2].
Figure 2 Classification Of Biomedical Waste
When both hazardous and non-hazardous BMW are mixed together then the complete waste becomes harmful. WHO classified biomedical waste into 8 categories such as General Waste, Pathological, Radioactive, Chemical, Infectious to potentially infectious waste, Sharps, Pharmaceuticals, Pressurized containers. As per Ministry of Environment and Forest, Government of India (1998), biomedical waste (Management and Handling) Rules-1998, classified 10 categories: 1. Human anatomical waste
2. Animal waste
3. Microbiology and biotechnology waste
4. Waste sharps
5. Discarded medicine and Cytotoxic drugs
6. Soiled waste
7. Solid waste
8. Liquid waste
9. Incineration ash
10. Chemical waste
HEALTH HAZARDOUS All medical field generated huge amount of Biomedical waste daily by various process, such as hospitals, clinics, dental offices, dialysis facilities, as well as analytical laboratories, blood banks, university laboratories.

International Journal of Advance and Innovative Research Volume 6, Issue 2 (XXX): April – June, 2019
114
ISSN 2394 - 7780
As many of medical wastes are classified as infectious or bio hazardous and could potentially lead to the spread of infectious diseases and its disposal is environmental concern in terms of air, water and land pollution. The infection is the most common danger which also affects other living organisms in the region. It can spread people to people. If these waste disposed by landfill process. Process must be carried out with proper manners.
NEED OF BIOMEDICAL WASTE MANAGEMENT IN HOSPITALS As discussed earlier BMW are hazardous for humans as well as for animals and for environment, so there is a great need for their proper management because if it is not properly managed then it will create such type of problems as shown in FIGURE 3- 1. Air pollution.
2. AIDS, hepatitis, TB.
3. Scavenging by rag pickers and animal.
4. Untreated hospital liquid waste.
Figure 3 Chart Of Different Problems Created By Untreated Biomedical Waste
Biomedical Waste Management [1-9] There are different steps involved in biomedical waste management. By using these steps hazardous effects of BMW can be minimized to some extent.
4.1 Segregation The BMW management problem is generally reduced upto 15% by using this first step and is performed within the premises of the hospital/nursing home. Segregation is done accordingly to colour coded bags as shown in TABLE 2 which ensures handling and proper management of wastes and minimizes further handling of the wastes till the time of treatment. Segregation reduces risk of infecting workers, costs of treatment, risk of infecting the community at large, recycle and reuse of non-infectious waste.
Table 2 Segregation Of Bmw Based On Container’s Colour Type of Containers Treatment Options
Red Disinfected Container/ Plastic bag Autoclaving/Micro waving/ Chemical Treatment
Blue/ White translucent Plastic bag/puncture proof container
Autoclaving/Micro waving/ chemical treatment and destruction/shredding
Black Plastic bag Disposal in secured landfill Yellow Plastic bag Disposal in secured landfill
4.2 Treatment There are different methods that have been useful for treatment of infectious waste. The following methods that will show the treatment are: Autoclaving, Incineration, Thermal inactivation, Gas/Vapor Sterilization, Chemical Disinfection etc. (FIGURE 4).

International Journal of Advance and Innovative Research Volume 6, Issue 2 (XXX): April – June, 2019
115
ISSN 2394 - 7780
Figure 4 Various Treatment Methods For BMW
4.2.1 Autoclaving Autoclaves are closed chambers in which both heat and pressure, and sometimes steam, over a period of time to sterilize medical equipment. It has been used for nearly a century to sterilize medical instruments for reuse [2]. For destroying microorganisms that may be present in medical waste, Autoclaves method is used, before disposal in a traditional landfill. Autoclaves can be used to process up to 90% of medical waste, and are easily scaled to meet the needs of any medical organization.
4.2.2 Incineration In this method combustion of organic substances contained in waste materials is included. Incineration is also termed as "thermal treatment" [6-7]. Waste materials convert the waste into ash, flues gas and heat after this process. By the inorganic constituents of the waste, ash is formed most. Before flues gases are dispersed into the atmosphere, they must be cleaned. In some cases, electric power is generated when the heat generated from incineration process.
4.2.3 Microwave Irradiation In this method, the heating effect of electromagnet rays is used for the inactivation of microbial. The frequency range of these rays lies between 300 and 300,000 MHz. Most of the microorganisms gets destroyed a frequency of about 2450 MHz [6-8].
Uses: This method is adopted for disinfecting a variety of biomedical waste.
Limitation: This method is not used for the treatment of cytotoxic, hazardous or radioactive waste. This method also excluded contaminated animal careasses, body parts and human organs.
4.2.4 Chemical methods Previously the microorganisms on floors, walls and medical equipment’s are killed by chemical disinfects, but now it is also used for biomedical waste treatment. In this method chemicals are used to inactive and kill the pathogens. The result of chemical treatment is disinfection rather than sterilization [8]. The most commonly the chemicals used for this method are Sodium Hypochlorite, Fenton Reagent, and Hydrogen peroxide.
Uses: This method is most useful for the treatment of liquid biomedical waste such as urine, blood, stools, or for hospital sewage
Limitation: This method has high operational cost and relatively high capital. This method is not effective on some microbes may become resistant to some disinfectants.
4.2.5 Solar disinfection The thermal effect of solar rays is used for disinfecting the biomedical waste.
Uses: It is a low cost technique for the countries which cannot afford costly treatment methods.
Limitation: The treatment of cytotoxic, hazardous or radioactive waste is not be done by this process.

International Journal of Advance and Innovative Research Volume 6, Issue 2 (XXX): April – June, 2019
116
ISSN 2394 - 7780
4.3 Disposal of treated waste Biomedical waste which is harmful or hazardous may be mixed with the ordinary solid waste after effectively treated.
CONCLUSION Proper management of biomedical waste is a serious problem in developing countries. This present study has shown that the state government currently needed pay attention to the management of biomedical waste. Hospital management must understand the difference between the hospital waste and general waste because if it will not differentiate than waste becomes more dangerous for human life as well as environment. Hospitals should also provide health education and training of everyone involved in the management and handling of Bio-Medical Waste. To minimize risk of exposure to staff, patients, doctors and the community from biomedical hazards, it is necessary to each and every healthcare facility which generates biomedical waste, needs to set prerequisite treatment facilities to ensure proper treatment of wastes and its disposal. Properly and safely management of biomedical waste is not only a legal necessity but also a social responsibility.
REFERENCES [1] S MANASI, K S UMAMANI AND N LATHA, “BIOMEDICAL WASTE MANAGEMENT: ISSUES
AND CONCERNS- A WARD-LEVEL STUDY OF BANGALORE CITY”, INSTITUTE FOR SOCIAL AND ECONOMIC CHANGE, ISBN 978-81-7791-168-8.
[2] BIOMEDICAL WASTE MANAGEMENT AND HANDLING RULE, MINISTRY OF ENVIRONMENT AND FOREST NOTIFICATION, NEW DELHI, 1998.
[3] Y C JANG, C LEE, O S YOON AND H KIM, J.ENVIRON.MANAGE, 2006, 80, 107-115.
[4] A SHUKLA, M SHUKLA AND P AHUJA, INTERNATIONAL E-JOURNAL, 2013, 8-27.
[5] V N KALPANA, D S PRABHU, S VINODHINI AND V DEVIRAJESWARI, “BIOMEDICAL WASTE AND ITS MANAGEMENT”, JOURNAL OF CHEMICAL AND PHARMACEUTICAL RESEARCH, 2016, 8(4), 670-676.
[6] S SHARMA AND SV CHAUHAN., J. ENVIRON BIOL, 2008, 29 (2), 159-162.
[7] S K MANDAL AND J DUTTA, INDIA JOURNAL. 2009, 01-25.
[8] R K SHARMA, S K MATHUR AND J ACAD HOSP, ADM, 1989 (2), 55-57.
[9] A MEHTA, V R MEENA, R MEENA AND S MEENA, “A STUDY ON ASSESSMENT PRACTICES OF BIOMEDICAL WASTE MANAGEMENT IN HOSPITAL OF JAIPUR AS SMART CITY”, JOURNAL OF BASIC AND APPLIED ENGINEERING RESEARCH, 2018, 5 (1), 61-63.

International Journal of Advance and Innovative Research Volume 6, Issue 2 (XXX): April – June, 2019
117
ISSN 2394 - 7780
ANALYZING THE COMBINE EFFECT OF WOLLASTONITE AND GUJCON FIBER ON CONCRETE GRADE M35
Mayur Raj Kumawat1 and Er. Ramanuj Jaldhari2
M. Tech Structural Student1 and Assistant Professor2, Kautilya Institute of Technology & Engineering, Jaipur ABSTRACT Strength of concrete produced by such industrial waste materials can be changed by making suitable changes in its ingredients like cementitious material, aggregate and water and by adding some special ingredients like fibers. Development of Fiber comes with various applications one of which is enhance the concrete properties. Fiber reinforce concrete is recently in trends because improving the concrete strength. Different type’s fibers are developed all across the world. Gujcon fiber is recently developed India. These fibers can be used as secondary reinforcement to concrete. Wollastonite is an industrial waste easily available in Udaipur, Rajasthan. Wollastonite is a calcium meta-silicate (CaSiO3) mineral with particles similar to cement particles by size. This study is to investigate the combine effect of wollastonite and Gujcon fiber on concrete. Past studies on wollastonite shows that 20% of replacement with cement has optimum results. So in this study concrete grade M35 is selected and wollastonite is partial replaced 20% of cement content with addition of Gujcon Fiber. Gujcon fibers are added in doses of 0.2% from 0 to 1 %, to inspect the strength parameter of concrete at various doses. Strength parameters are inspected such as Compressive strength, Splitting Tensile Strength and Flexural Strength. Results are compared with control mix specimen. The strength results shows that 0.6 to 0.8 % of addition of Gujcon fibers with 20% of replacement of cement in concrete have quite good results.
Key words- Gujcon Fiber, Wollastonite, Strength, Reinforcement.
INTRODUCTION Concrete is the composition of coarse aggregate, fine aggregate, cement, sand and water. It may also have admixtures and other additives. It is the most popular building material in the world and used from prolong time. In concrete, aggregate is the major component after cement. The yearly production of cement is nearly 3 billion tons. The construction industry relies heavily on cement for production of concrete. Nearly 7% of the global CO2 emission is contributed by cement industries. Reducing the consumption of cement in the concrete will thus reduce the emission. Its great adaptability and relative economy in filling wide range of needs has made it a competitive building material. The demand of concrete for today’s infrastructural expansion is increasing gradually.
The use of fibres in concrete is from ancient times; to increase the tensile strength and flexure strength of concrete various researchers investigate the effect of fibres on various properties of concrete. Since then Fibres such as steel, glass, carbon and nylon are use in concrete. Addition of fibre in concrete also influences its brittle behaviour and ductility.
OBJECTIVES Following are the main objectives of our study To inspect the combine effect of Wollastonite and Gujcon Fiber on concrete.
To enhance the strength of concrete by using Wollastonite and Gujcon Fiber.
To reduce the cement content by partially replacing cement by Wollastonite.
To reduce minor cracks by providing Gujcon fiber as a secondary reinforcement.
1. To increase the service life of structure by using Wollastonite and Gujcon Fiber
MATERIAL & METHODOLOGY CEMENT We used OPC 43 grade cement brand name “Ultra cement”. OPC is good to gain strength in less time as well as it also suitable for mix design of different grade of concrete.
AGGREGATE c. Coarse Aggregate
In this practical we used two types of aggregate 10 mm Coarse aggregate
20 mm Coarse aggregate

International Journal of Advance and Innovative Research Volume 6, Issue 2 (XXX): April – June, 2019
118
ISSN 2394 - 7780
d. Fine Aggregate Confirming Grading zone II confirming IS code 383-2016
Fig.1 Coarse and Fine Aggregate
Wollastonite Powder
Wollastonite is a naturally occurring mineral with many unique characteristics. Through advanced processing, it has become one of the most versatile functional fillers in the marketplace. Wollastonite increases the performance of many products including plastics, paints and coatings, construction materials, friction, ceramic and metallurgical applications to name a few.
Table 1 Technical Specification of Wollastonite Properties Remarks
Color White, Colorless \or Gray.
Hardness 5 - 5.5 on Mohr scale Streak White
Specific Gravity 2.8 - 2.9 Melting Point 1540 °C
Thermal Conductivity 2.70 ± 0.07 W/m °K
Thermal Expansion 6.5 x 10 6 mm/mm/°C.
Fig.2 Wollastonite Powder
GUJCON FIBER GUJCON – CRF is specially engineered 18 mm length Nylon-6 Fiber for providing secondary reinforcement in RCC & PCC. These fiber are breakthrough in secondary reinforcement for concrete structure. Development based on extensive Research and Application trials Unique and state of-the-art next generation products for rendering long lasting solutions to some of the teething problems of construction and infrastructure industries. It is superior to other secondary reinforcement Fiber products and also used as a reliable secondary reinforcement material.

International Journal of Advance and Innovative Research Volume 6, Issue 2 (XXX): April – June, 2019
119
ISSN 2394 - 7780
Fig.3 GUJCON Fibre
Table 2 Technical Specification of GUJCON Fibre Properties Value
Material 100% Virgin Nylon-6 Fiber
Fiber Cross Section Trilobal
Fiber Length 18 mm
Sp. Gravity 1.14
Color Brilliantly White
Melting Point 220 °C
Chemical Resistance
Very good against Alkalis, Hydrocarbons
MIX DESIGNING Material Specification
Grade M35 Cement 342 Water 197
Admixture (@2% of cement) 7 Fine aggregate 712
Coarse aggregate 1113 Water-Cement Ratio 0.45
Mix Proportion (Cement: FA: CA)
1 : 2.08 : 3.26
Achieved Slump 98 mm
MIX DESIGNATION Mix
Designation Cement Wollastonite Gujcon Fiber
CM35 100% 0% 0.00% C35WG1 80% 20% 0.00% C35WG2 80% 20% 0.20% C35WG3 80% 20% 0.40% C35WG4 80% 20% 0.60% C35WG5 80% 20% 0.80% C35WG6 80% 20% 1.00%

International Journal of Advance and Innovative Research Volume 6, Issue 2 (XXX): April – June, 2019
120
ISSN 2394 - 7780
TEST PERFORMED Slump Test (IS 1199:1959)
According to IS1191: 1959, slump testing process was conducted and process is given below: In this test, the mould was placed on a smooth, horizontal, rigid and non-absorbent surface, such as carefully placed metal plate, the mould is being trusted, while it is being filled.
COMPRESSIVE STRENGTH TEST Compressive strength test is performed on harden concrete to inspect the compressive strength of concrete mix on Compressive Testing Machine (CTM). Test is performed under the guidelines of IS 516:1959 on standard specimen of 150 mm x 150 mm x150 mm after 7, 14 and 28 days of curing.
Compressive strength = P/ A
Where
P = Applied Load (N)
A = Cross Sectional Area (mm2)
Split Tensile Test Splitting tensile strength of concrete is inspected under the guidelines of IS Code 5816:1999.The size of specimen is300mm (length) x 150mm (diameter). The specimens were tested after deep curing for 28 days.
Splitting Tensile Strength = 2P/πld (Unit = N/mm2 or MPa)
Where
P = Applied Load (N)
L = Length of Cylinder
d = Diameter of Cylinder
THREE POINT BENDING TEST Flexural strength of concrete is measured by using IS Code 516:1959. The size of beam 500mm x 100mm x 100mm.The specimens were tested after deep curing for 28 days. The central point loading method was used for this testing.
Flexural Strength = 3PL/2bd2
= 3PL/2d3
(Unit = N/mm2 or MPa)
Here,
b = d
Where,
P = Load,
L = Distance from Centre of Two Support,
b = Depth of Specimen,
d = Width of Specimen
TEST RESULTS SLUMP TEST
Cement + Wollastonite + Gujcon Fiber (%) Slump (mm)
100+0+0 98
80+20+0 97
80+20+0.2 97

International Journal of Advance and Innovative Research Volume 6, Issue 2 (XXX): April – June, 2019
121
ISSN 2394 - 7780
80+20+0.4 99
80+20+0.6 98
80+20+0.8 94
80+20+1.0 96
COMPRESSIVE STRENGTH Table 4 Results of compressive test on M35 grade after 7 ,14 & 28 days
Cement + Wollastonite +
Gujcon Fiber (%)
M35
7 days 14 days 28 days
100+0+0 28.47 35.67 41.67
80+20+0 29.33 38.73 48.63
80+20+0.2 30.3 40.63 49.37
80+20+0.4 32.57 43.27 51.67
80+20+0.6 31.57 44.07 54.6
80+20+0.8 30.97 42.73 53.57
80+20+1.0 29.47 41.5 50.9
Fig. 4 Comparative results of compressive test on M35 grade after 7, 14 & 28 days
SPLIT TENSILE STRENGTH Table 5 Comparative results of tensile strength on M35 grade
Cement + Wollastonite + Gujcon Fiber (%) Tensile Strength (N/mm2)
100+0+0 4.58 80+20+0 4.87
80+20+0.2 4.91 80+20+0.4 5.13 80+20+0.6 5.20 80+20+0.8 4.95 80+20+1.0 4.93

International Journal of Advance and Innovative Research Volume 6, Issue 2 (XXX): April – June, 2019
122
ISSN 2394 - 7780
Fig. 5 Comparative results of tensile strength on M35 grade
FLEXURAL STRENGTH Table 6 Comparative results of Flexural strength on M35 grade
Cement + Wollastonite + Gujcon Fiber (%) Flexural Strength (N/mm2)
100+0+0 4.51 80+20+0 4.92
80+20+0.2 5.10 80+20+0.4 5.26 80+20+0.6 5.28 80+20+0.8 5.15 80+20+1.0 5.01
Fig. 6 Comparative results of tensile strength on M35 grade
CONCLUSION COMPRESSIVE STRENGTH By replacing of 20 % of cement by Wollastonite powder increases the compressive strength from 41.7 to
48.6 N/mm2 for grade M35 Past studies shows that optimum Wollastonite content to replace cement is 16-24 % which increases the compressive strength.
Addition of GUJCON Fiber at 0.2, 0.4, 0.6, 0.8 and 1.0 % with Wollastonite concrete mix result are 49.4, 51.7, 54.6, 53.6 and 50.9N/mm2 for grade M35.
By the above results we can conclude that 0.6 % addition of GUJCON fibre with 20% replacement of Wollastonite in cement concrete mix shows optimum results.
SPLITTING TENSILE STRENGTH .By replacing of 20 % of cement by Wollastonite powder increases the tensile strength from 4.58 to 4.87
N/mm2 grade M35.

International Journal of Advance and Innovative Research Volume 6, Issue 2 (XXX): April – June, 2019
123
ISSN 2394 - 7780
Addition of GUJCON Fiber at 0.2, 0.4, 0.6, 0.8 and 1.0 % with Wollastonite concrete mix result are 4.91, 5.13, 5.2, 4.95 and 4.93N/mm2 for grade M35 GUJCON Fibre increases tensile strength till certain proportion but in excess amount the strength decreases to control mix specimen.
By the above results we can conclude that 0.4-0.6 % addition of GUJCON fibre with 20% replacement of Wollastonite in cement concrete mix shows appropriate results.
FLEXURAL STRENGTH By replacing of 20 % of cement by Wollastonite powder increases the compressive strength from 4.51 to
4.92 N/mm2 for grades M35.
Addition of GUJCON Fiber at 0.2, 0.4, 0.6, 0.8 and 1.0 % with Wollastonite concrete mix result are 5.1, 5.26, 5.28, 5.15 and 5.01N/mm2 for grade M35. Excessive addition of fibre decreases the strength to wollastonite modified concrete.
REFERENCES [1] Seyed Alireza Zareei, FarshadAmeri et.al. , “ Recycled ceramic waste high strength concrete containing
wollastonite particles and micro-silica: A comprehensive experimental study ”,Construction and Building Materials 201 (2019) 11–32
[2] Filip Grzymski, Michał Musiał et.al. , “Mechanical properties of fibre reinforced concrete with recycled fibres” , Construction and Building Materials 198 (2019) 323–331
[3] Rahesh Hari, K.M. Mini, “Mechanical and durability properties of sisal-Nylon 6 hybrid fibre reinforced high strength SCC”, Construction and Building Materials 204 (2019) 479–491
[4] Yuan Qin, Xianwei Zhang, Junrui Chai et.al. , “Experimental study of compressive behavior of polypropylene-fiber-reinforced and polypropylene-fiber-fabric-reinforced concrete” , Construction and Building Materials 194 (2019) 216–225
[5] Yuan Qin, Xianwei Zhang, Junrui Chai et.al. , “Damage performance and compressive behavior of early-age green concrete with recycled nylon fiber fabric under an axial load” , Construction and Building Materials 209 (2019) 105–114
[6] Mona Abdel Wahab, Ibrahim Abdel Latif et.al. , “The use of Wollastonite to enhance the mechanical properties of mortar mixes” ,Construction and Building Materials 152 (2017) 304–309
[7] Korrapati Anil Kumar, Ganta Shanmukha Rao, Dr. ShaikYajdani, “Study on Properties of Concrete using Recron 3s Fiber” ,IJSTE - International Journal of Science Technology & Engineering -Volume 4 - Issue 3 - September 2017
[8] MylavarapuPhaniSekhar, K. Raju, “A Study on Effect of Mechanical Properties ofRecron 3S Fibre Concrete on Different GradesExposed to Elevated Temperatures”, IJIRST –International Journal for Innovative Research in Science & Technology-Volume 4-Issue 1-June 2017
[9] Mehran Khan, Majid Ali, “Use of glass and nylon fibers in concrete for controlling early age microcracking in bridge decks” ,Construction and Building Materials 125 (2016) 800–808
[10] B VenkatNarsimhaRao, M Mahesh, ChSatya Sri, “Recron Fibre Reinforced Concrete Pavements”, 2016 IJEDR - Volume 4, Issue 4 -ISSN: 2321-9939
[11] Dr Sunil V Desale , BhagyashriSisode, “Use of Industrial Waste and Recron 3s Fiber toImprove the Mechanical Properties of Concrete”, PARIPEX - INDIAN JOURNAL OF RESEARCH Volume : 4 | Issue : 7 | July 2015
[12] V. Dey, R. Kachala, A. Bonakdar, B. Mobasher,“Mechanical properties of micro and sub-micron wollastonite fibers in cementitious composites” ,Construction and Building Materials 82 (2015) 351–359
[13] PawanKalla, AdityaRana et.al., “Durability studies on concrete containing wollastonite”,Journal of Cleaner Production xxx (2014) 1-9
[14] IS:456-2000 “Plain and Reinforced Concrete - Code of Practice” Bureau of Indian Standards, New Delhi, India.
[15] IS:2386-1963 (Part I to Part III), “Indian Standards Method of Test for Aggregate for Concrete”, Bureau of Indian Standards, New Delhi, India.

International Journal of Advance and Innovative Research Volume 6, Issue 2 (XXX): April – June, 2019
124
ISSN 2394 - 7780
[16] IS:383-1970, “Indian Standard Specification for coarse and fine aggregates from Natural Source for Concrete”, Bureau of Indian Standards, New Delhi, India.
[17] IS:8112-1989, “Specifications for 43-Grade Portland Cement”, Bureau of Indian Standards, New Delhi, India.
[18] IS:10262-2009, “Guidelines for Concrete Mix Design”, Bureau of Indian Standards, New Delhi, India.
[19] IS:516-1959, “Indian Standard Code of Practice-Methods of Test for Strength of Concrete”, Bureau of Indian Standards, New Delhi, India.
[20] IS:5816-1999, “Method of Test Splitting Tensile Strength of Concrete”, Bureau of Indian Standards, New Delhi, India.
[21] IS:9103-1999, “Specification for Concrete Admixtures” Bureau of Indian Standards, New Delhi, India.
[22] M.S. Shetty, “Concrete Technology”, S. chand and Co. Ltd., India (2004).

International Journal of Advance and Innovative Research Volume 6, Issue 2 (XXX): April – June, 2019
125
ISSN 2394 - 7780
EVALUATION PAVEMENT CONSTRUCTION BY REPLACING RAP WITH WASTE POLYMER MODIFIED BITUMEN
Suresh Chand Bairwa1 , Deepak Mathur2 and Nikhil Kumar Sharma3
M. Tech Transportation Student1 and Assistant Professor2,3, Kautilya Institute of Technology & Engineering, Jaipur
ABSTRACT Recycling of asphalt pavement is a new emerging technology in India for road construction. Till now the old deteriorated pavement is destroyed and goes for dumping in landfills thus wasting such potential material along with putting harmful impact on environment. This assumed to be waste can be recycled again for construction of new pavements and maintenance of the older ones. This technology has such huge potential that alone USA produces 100 million tons RAP annually and approximately 80% of it are used in pavement construction. Use of recycled asphalt pavement (RAP) will not even result in cutting its cost but will also decrease the environmental impact by decreasing the use of virgin material as well as saving energy. Polymer modified bitumen is used instead of natural bitumen because it reduce fatigue and permanent damage in asphalt pavement. Bitumen is mixed with waste polymers like LDPE, HDPE, and Polypropylene etc at certain amount to enhance bitumen properties. By using waste polymers to develop Polymer modified bitumen we reduce content of natural bitumen and makes it ecofriendly. This technology of construction result in equal higher performance then the virgin mix and increase the prevention against failure due to rutting and fatigue thereby decreasing the pavement thickness. Thus examining hot asphalt mixes with different proportions ranging from 10% to 40% of RAP along 5% of bitumen is replaced by waste polymers. The Flexible pavement layers which has been selected to inspect feasibility and performance are Bituminous Macadam grade I and Dense Bituminous Macadam grade I. Inspection of these layers at different mixes is done under the guidelines of MoRT&H.
Keywords: Marshall Stability-Flow Test, Reclaimed Asphalt Pavement, Polymer Modified Bitumen, DBM, BM etc.
INTRODUCTION Reclaimed asphalt pavement (RAP) is the term given to evacuated and additionally reprocessed asphalt materials containing asphalt and aggregates. These materials are created when asphalt pavements are evacuated for recreation, reemerging, or to get access to covered utilities. At the point when appropriately squashed and screened, RAP comprises of amazing, great evaluated totals covered by black-top concrete. Black-top asphalt is commonly expelled either by processing or full-profundity expulsion. Milling entails removal of the pavement surface using a milling machine, which can remove up to 50 mm (2 in) thickness in a single pass. Full-depth removal involves ripping and breaking the pavement using a rhino horn on a bulldozer and/or pneumatic pavement breakers. In most instances, the broken material is picked up and loaded into haul trucks by a front-end loader and transported to a central facility for processing. At this facility, the RAP is processed using a series of operations, including crushing, screening, conveying, and stacking. In spite of the fact that most of bituminous pavement is reused at focal handling plants, bituminous pavement might be pounded set up and consolidated into granular or balanced out base courses utilizing a self-moved pummeling machine. Hot set up and cold set up reusing procedures have developed into constant train activities that incorporate fractional profundity expulsion of the asphalt surface, blending the recovered material with beneficiating added substances, (for example, virgin total, cover, or potentially mellowing or restoring operators to improve fastener properties), and setting and compacting the resultant blend in a solitary pass.
OBJECTIVES Following are the main objectives of our study
1. Reduce the cost of construction by using older material thus decreasing the requirement of new material.
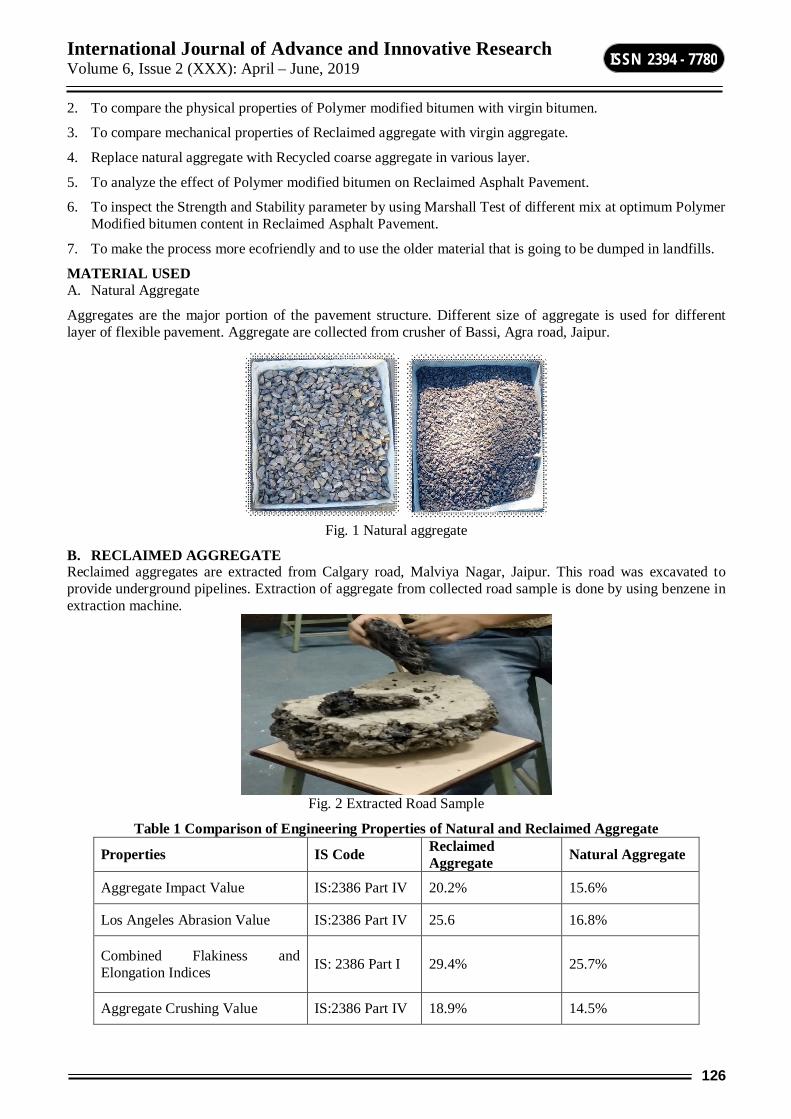
International Journal of Advance and Innovative Research Volume 6, Issue 2 (XXX): April – June, 2019
126
ISSN 2394 - 7780
2. To compare the physical properties of Polymer modified bitumen with virgin bitumen.
3. To compare mechanical properties of Reclaimed aggregate with virgin aggregate.
4. Replace natural aggregate with Recycled coarse aggregate in various layer.
5. To analyze the effect of Polymer modified bitumen on Reclaimed Asphalt Pavement.
6. To inspect the Strength and Stability parameter by using Marshall Test of different mix at optimum Polymer Modified bitumen content in Reclaimed Asphalt Pavement.
7. To make the process more ecofriendly and to use the older material that is going to be dumped in landfills.
MATERIAL USED A. Natural Aggregate
Aggregates are the major portion of the pavement structure. Different size of aggregate is used for different layer of flexible pavement. Aggregate are collected from crusher of Bassi, Agra road, Jaipur.
Fig. 1 Natural aggregate
B. RECLAIMED AGGREGATE Reclaimed aggregates are extracted from Calgary road, Malviya Nagar, Jaipur. This road was excavated to provide underground pipelines. Extraction of aggregate from collected road sample is done by using benzene in extraction machine.
Fig. 2 Extracted Road Sample
Table 1 Comparison of Engineering Properties of Natural and Reclaimed Aggregate
Properties IS Code Reclaimed Aggregate Natural Aggregate
Aggregate Impact Value IS:2386 Part IV 20.2% 15.6%
Los Angeles Abrasion Value IS:2386 Part IV 25.6 16.8%
Combined Flakiness and Elongation Indices IS: 2386 Part I 29.4% 25.7%
Aggregate Crushing Value IS:2386 Part IV 18.9% 14.5%

International Journal of Advance and Innovative Research Volume 6, Issue 2 (XXX): April – June, 2019
127
ISSN 2394 - 7780
Specific Gravity IS:2386 Part III 2.68 2.71
Water Absorption Value IS:2386 Part III 0.5% 0.26%
C. BITUMEN Bitumen is by-product of fractional distillation of raw petroleum. Bitumen is visco-elastic material use as binder material in flexible pavement. In this project bitumen of VG-40 grade is used.
Fig. 3 Heating Bitumen Sample
D. WASTE POLYMERS Plastic waste is major problem for society because of its non-biodegradable nature. Past studies shows that by adding some proportion plastic with bitumen increases bitumen properties. Polymer modified bitumen has better resistance to temperature, water etc. This modified bitumen is one of the important construction materials for flexible Road pavement. So for this Study we use plastic of waste bottles and replace 5 percent of bitumen by waste plastic.
Table 1 Comparison of Physical Properties of Natural and Waste Polymer Modified Bitumen
Property Natural Bitumen Waste Polymer Modified Bitumen
Permissible limit As Per IS 73:2007
Penetration (100 gm, 5 sec, 25°c,0.01 mm) 66 61 60-70
Ductility at 27°c (cm ) 75 82 Min.40
Specific Gravity 1.1 1.2 1.12 Softening Point (°c ) 50 55 60
Viscosity at 60 °c ( Poise ) 1210 1350 --
Table 3 Mixing Details and designation of different bituminous mixes
Layer
Material Binder Aggregate
Designation Bitumen (%)
Waste Polymer (%)
Natural Aggregate (%)
Reclaimed Aggregate (%)
BM
CBM 100 0 100 0 PBM 95 5 100 0 PBM10 95 5 90 10 PBM20 95 5 80 20 PBM30 95 5 70 30 PBM40 95 5 60 40
DBM CDBM 100 0 100 0

International Journal of Advance and Innovative Research Volume 6, Issue 2 (XXX): April – June, 2019
128
ISSN 2394 - 7780
PDBM 95 5 100 0 PDBM10 95 5 90 10 PDBM20 95 5 80 20 PDBM30 95 5 70 30 PDBM40 95 5 60 40
TEST PERFORMED MARSHALL STABILITY TEST This test procedure is used in designing and evaluating bituminous paving mixes and is extensively used in routine test program for the paving jobs. In Marshall Method stability (strength) of sample is inspected by applying load on it. Flow value of sample is also measured at maximum stability. Stability and Flow value is measured with two dial gauges attach with Marshall Testing Machine.
Fig. 4: Marshall Testing Machine
TEST RESULTS BITUMINOUS MACADAM Bituminous Macadam is treated as surface coarse for flexible pavement. As per MoRT&H binder content should not be less than 3 percent of total mass. To find optimum binder content by Marshall Test the binder percentage is taken 3 to 5.5 percent at interval of 0.5 percent. Following are the results of Marshall Mix test at different binder content for various mixes.
Fig. 5 Comparative Graph of Marshall Stability of various mixes at different binder content for BM layer
Fig. 5 Comparative Graph of Marshall Flow of various mixes at different binder content for BM layer
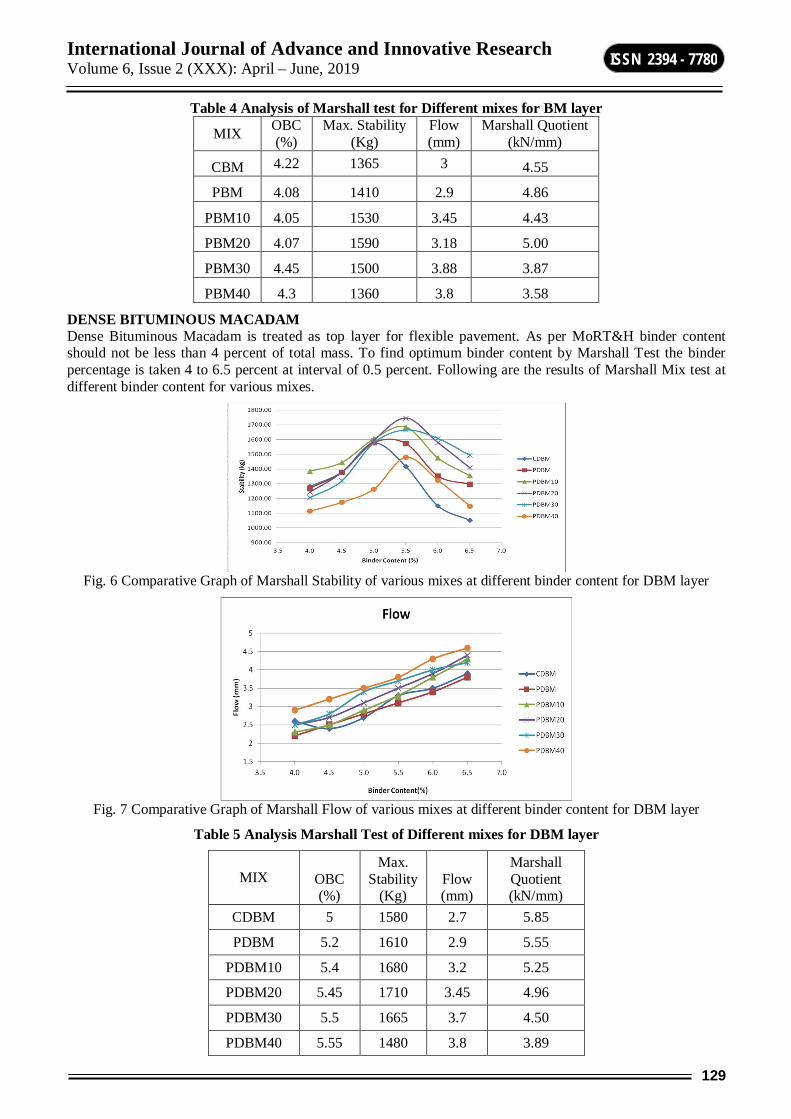
International Journal of Advance and Innovative Research Volume 6, Issue 2 (XXX): April – June, 2019
129
ISSN 2394 - 7780
Table 4 Analysis of Marshall test for Different mixes for BM layer
MIX OBC (%)
Max. Stability (Kg)
Flow (mm)
Marshall Quotient (kN/mm)
CBM 4.22 1365 3 4.55
PBM 4.08 1410 2.9 4.86
PBM10 4.05 1530 3.45 4.43
PBM20 4.07 1590 3.18 5.00
PBM30 4.45 1500 3.88 3.87
PBM40 4.3 1360 3.8 3.58
DENSE BITUMINOUS MACADAM Dense Bituminous Macadam is treated as top layer for flexible pavement. As per MoRT&H binder content should not be less than 4 percent of total mass. To find optimum binder content by Marshall Test the binder percentage is taken 4 to 6.5 percent at interval of 0.5 percent. Following are the results of Marshall Mix test at different binder content for various mixes.
Fig. 6 Comparative Graph of Marshall Stability of various mixes at different binder content for DBM layer
Fig. 7 Comparative Graph of Marshall Flow of various mixes at different binder content for DBM layer
Table 5 Analysis Marshall Test of Different mixes for DBM layer
MIX OBC (%)
Max. Stability
(Kg) Flow (mm)
Marshall Quotient (kN/mm)
CDBM 5 1580 2.7 5.85
PDBM 5.2 1610 2.9 5.55
PDBM10 5.4 1680 3.2 5.25
PDBM20 5.45 1710 3.45 4.96
PDBM30 5.5 1665 3.7 4.50
PDBM40 5.55 1480 3.8 3.89

International Journal of Advance and Innovative Research Volume 6, Issue 2 (XXX): April – June, 2019
130
ISSN 2394 - 7780
CONCLUSION A. BITUMINOUS MACADAM LAYER By using waste polymer modified bitumen instead of virgin bitumen the stability is increased from 1365 kg
to 1410 kg. We can say by placing 5 % of total bitumen by waste plastic increases 3.3% of strength of mix. Requirement of binder content is decreased from 4.22 % to 4.08 % of total mass.
Replacing natural aggregate by reclaimed aggregate till 40% at interval of 10% with Polymer modified bituminous mixes results are 1410, 1530, 1590, 1500 and 1360 kg. Results show that excess amount of reclaimed aggregate decrease the strength of mix. But till 20 % of replacement results are in increasing order.
Flow value for various mixes at 10%, 20%, 30% and 40% replacement by reclaimed aggregate with polymer modified bituminous mix are 2.9, 3.45, 3.18, 3.88 and 3.8 mm respectively. Above results shows that flow or deformation is increased with increase in percent of replacement of aggregate. Increase in flow makes pavement more flexible but the flow is in permissible range so these mixes can be used as road construction work.
Binder content for mixes at 10%, 20%, 30% and 40% replacement by reclaimed aggregate with polymer modified bituminous mix are 4.08, 4.05, 4.07, 4.45 and 4.3 % respectively. Above results shows that binder content nearby same till 20% percent of replacement of aggregate which doesn’t affect the economy factor. But above 20% replacement increase the requirement of binder content which increase the cost of project.
B. DENSE BITUMINOUS MACADAM LAYER By using waste polymer modified bitumen instead of virgin bitumen the stability is increased from 1580 kg
to 1610 kg. We can say by placing 5 % of total bitumen by waste plastic increases 1.9 % of strength of mix. Requirement of binder content is also increased from 5 % to 5.2 % of total mass.
Replacing natural aggregate by reclaimed aggregate till 40% at interval of 10% with Polymer modified bituminous mixes results are 1610, 1680, 1710, 1665 and 1480 kg. Results show that excess amount of reclaimed aggregate decrease the strength of mix. But till 20 % of replacement results are in increasing order.
Flow value for various mixes at 10%, 20%, 30% and 40% replacement by reclaimed aggregate with polymer modified bituminous mix are 2.9, 3.2, 3.45, 3.7 and 3.8 mm respectively. Above results shows that flow or deformation is increased with increase in percent of replacement of aggregate. Increase in flow makes pavement more flexible but the flow is in permissible range so these mixes can be used as road construction work.
Binder content for mixes at 10%, 20%, 30% and 40% replacement by reclaimed aggregate with polymer modified bituminous mix are 5.2, 5.4, 5.45, 5.5 and 5.55 % respectively. Above results shows that binder content increases with percent of replacement of aggregate. Requirement of binder content is increased which increase the cost of project. So more replacement makes project uneconomical.
REFERENCES [1] A.R. Pasandín, I. Pérez, “Laboratory evaluation of hot-mix asphalt containing construction and
demolition waste”, Construction and Building Materials 43 (2013)497–505
[2] Asi Ibrahim, Shalabi Faisal et.al. “Use of basalt in asphalt concrete mixes”, Construction and Building Materials 23 (2009) 498–506
[3] Huseyin Akbulut, Cahit Gurer,” Use of aggregates produced from marble quarry waste in asphalt pavements” Building and Environment 42 (2007) 1921–1930
[4] Ignacio Pérez, Ana R. Pasandín et.al. “Evaluation of steel slag coarse aggregate in hot mix asphalt concrete”, Journal of Hazardous Materials 165 (2009) 300–305
[5] Julian Mills-Beale, Zhanping You, “The mechanical properties of asphalt mixtures with Recycled Concrete Aggregates”, Construction and Building Materials 24 (2010) 230–235
[6] Shaopeng Wua, Jinjun Zhong et.al, “Influence of demolition waste used as recycled aggregate on performance of asphalt mixture”, Road Materials and Pavement Design-2013

International Journal of Advance and Innovative Research Volume 6, Issue 2 (XXX): April – June, 2019
131
ISSN 2394 - 7780
[7] Surender Singh, G.D. Ransinchung R.N. et.al. “Utilization of reclaimed asphalt pavement aggregates containing waste from Sugarcane Mill for production of concrete mixes”,Journal of Cleaner Production- S0959-6526(17)32486-1
[8] Shubham Bansal, Anil Kumar Misra, Purnima Bajpai “Evaluation of modified bituminous concrete mix developed using rubber and plastic waste materials”, International Journal of Sustainable Built Environment (2017) 6, 442–448
[9] Johnson Kwabena Appiah, Victor Nana Berko-Boateng, Trinity Ama Tagbor, “Use of waste plastic materials for road construction in Ghana”, Case Studies in Construction Materials 6 (2017) 1–7
[10] D. Movilla-Quesada, A.C. Raposeiras et.al., “Use of plastic scrap in asphalt mixtures added by dry method as a partial substitute for bitumen”, Waste Management 87 (2019) 751–760
[11] Sara Fernandes, Liliana Costa et.al. , “Effect of incorporating different waste materials in bitumen” Ciência & Tecnologia dos Materiais 29 (2017) e204–e209
[12] Monu Kumari, G.D.R.N. Ransinchung, Surender Singh, “A laboratory investigation on Dense Bituminous Macadam containing different fractions of coarse and fine RAP” , Construction and Building Materials 191 (2018) 655–666
[13] Weiying Wanga, Jingyun Chen et.al. , “Laboratory performance analysis of high percentage artificial RAP binder with WMA additives”, Construction and Building Materials 147 (2017) 58–65
[14] Bindu C. S,Dr. K.S. Beena,” Waste plastic as a stabilizing additive in Stone Mastic Asphalt” International Journal of Engineering and Technology Vol.2 (6), 2010, 379-38
[15] IRC: SP: 98-2013. ”Guideline for the Use of Waste Plastic in Hot Bituminous Mixes (Dry Process) in Wearing Courses”. Indian Road Congress
[16] Specification for Road and Bridge Works- 5th Revision, Ministry of Road Transport & Highways.

International Journal of Advance and Innovative Research Volume 6, Issue 2 (XXX): April – June, 2019
132
ISSN 2394 - 7780
ANALYZING THE EFFECT OF COMBINATION OF WASTE MARBLE STONE WITH MARBLE DUST IN FLEXIBLE PAVEMENT
Ashish Kumar Meena1, Nikhil Kumar Sharma2 and Deepak Mathur3
Student1 and Assistant Professor2,3, Kautilya Institute of Technology & Engineering, Jaipur
ABSTRACT Humankind has always exploited the natural resources to fulfill its basic needs. The development of country is directly related to the road network of the country as we know India is in its developing stage. Road construction required raw material i.e. Bitumen, Aggregate, Earth etc. These materials are natural resources which increase the consumption which makes the depletion of natural resources. Due to depletion of natural resources make human switch to alternative material available for construction.
In recent years, studies have claimed the waste material from dimension stone can be used into pavement construction. Marble are fine grained variety of dimension stone mined in and around Kishangarh district respectively. After mining, stone under goes finishing operation such as cutting, sawing and polishing. Each operation is accomplished with generation of non-biodegradable material stone waste.
This study mainly focus on using Marble stone waste as a form of aggregate and Marble dust as a filler material at 20, 40, 60, 80 and 100 % of replacement to natural material in various layer of Flexible Pavement. Flexible pavement layer consider for this study are Bituminous Coarse of grade I having coarse and fine aggregate in different proposition. Replacements of natural aggregate with Dimensioned stone waste in these layers are examined on parameter like Marshall Test. Engineering properties of Marble stone waste are compared to natural material as per MoR&TH recommended test procedure.
Index Terms: Marshall Test, Stability, Flow etc.
INTRODUCTION Because of the global shortage of resources, an increasing number of people are aware that natural resources, especially the non-renewable ones, should be used efficiently. For fulfillment the demand over mining is done that cause adverse effect on environment. Leaving the mining waste directly to the environment can cause environmental problems. Rajasthan is very popular for its Marble and Kota Stone use in floor finishing and other works. At the time of dimensioning those lots of tones waste is generated which directly dispose in environment which causes adverse effect.
OBJECTIVES Following are the main objectives of our study
8. Reduction in usage of natural aggregate. 9. To study the engineering properties of Marble stone. 10. To compare the Engineering properties Marble stone waste with Natural Aggregate. 11. Replace natural aggregate with Marble Stone waste in different layer. 12. To inspect the Strength and Stability parameter by using Marshall test at different mix with Marble Stone
Waste MATERIAL USED Marble Stone Waste Marble Stone waste is collected from Kishangarh district, Rajasthan for the project purpose and crushed in desired size.
Fig-1: Marble Dust and Crushed Marble stone waste

International Journal of Advance and Innovative Research Volume 6, Issue 2 (XXX): April – June, 2019
133
ISSN 2394 - 7780
Natural Aggregate Aggregates are the major portion of the pavement structure. Different size of aggregate is used for different layer of flexible pavement. Aggregate are collected from crusher of Bassi, Agra road, Jaipur.
Fig-2: Natural aggregate
Table-1: Engineering Properties of Different Aggregate Properties Marble Stone Natural Aggregate
Aggregate Impact Value 22.68% 14.57% Los Angeles Abrasion Value 10.46% 15.98%
Combined Flakiness and Elongation Indices 37% 27.8% Water Absorption Value 0.5% 0.26%
Liquid Limit Of material passing 425micron 23% 18% Plasticity Index of material passing 425 micron 5% 3%
Specific Gravity 2.78 2.75 Crushing Value 30.10% 13.5
TEST PERFORMED Marshall Stability Test This test procedure is used in designing and evaluating bituminous paving mixes and is extensively used in routine test program for the paving jobs. In Marshall Method stability (strength) of sample is inspected by applying load on it. Flow value of sample is also measured at maximum stability. Stability and Flow value is measured with two dial gauges attach with Marshall Testing Machine.
Fig-3: Marshall Testing Machine
TEST RESULTS Bituminous Macadam Bituminous Macadam is treated as surface coarse for flexible pavement. Marble stone waste with marble dust is replaced with natural material in 20, 40, 60, 80 and100 % respectively. At different percent of replacement Marshall Stability test is conducted to inspect OBC, Stability and Flow Value. Following are terms which are mentioned like BM0, BM20, BM40, BM60, BM80 and BM100 stands for 0, 20, 40, 60, 80 and 100 % replacement of material.

International Journal of Advance and Innovative Research Volume 6, Issue 2 (XXX): April – June, 2019
134
ISSN 2394 - 7780
Table-2: Marshall Test results for BM0 Binder
Content Wt. in air (g) Flow Value (mm) Stability
(kg) Marshall Quotient
(kN/mm) 3.0 1120.0 2.1 976 4.65 3.5 1125.0 2.3 1062 4.62 4.0 1110.0 2.6 1444 5.55 4.5 1120.5 3.3 1320 4.00 5.0 1132.0 3.5 1119 3.20 5.5 1122.0 3.9 938 2.41
Table-3: Marshall Test results for BM20 Binder
Content Wt. in air (g) Flow Value (mm) Stability (kg) Marshall Quotient
(kN/mm) 3.0 1156.0 2.2 911 4.14 3.5 1137.0 2.4 1091 4.54 4.0 1122.0 2.9 1320 4.55 4.5 1148.0 3.3 1297 3.93 5.0 1141.0 3.7 994 2.69 5.5 1135.0 3.9 911 2.34
Table-4: Marshall Test results for BM40 Binder
Content Wt. in air (g) Flow Value (mm) Stability (kg) Marshall Quotient
(kN/mm) 3.0 1138.0 2.4 856 3.57 3.5 1126.0 2.5 976 3.90 4.0 1122.0 3.1 1177 3.80 4.5 1138.0 3.7 1076 2.91 5.0 1140.0 4.1 1021 2.49 5.5 1124.5 4.3 911 2.12
Table-5: Marshall Test results for BM60 Binder
Content Wt. in air (g) Flow Value (mm) Stability (kg) Marshall Quotient
(kN/mm) 3.0 1136.0 2.6 800 3.08 3.5 1126.5 2.8 947 3.38 4.0 1125.0 3.4 1091 3.21 4.5 1116.5 3.9 1033 2.65 5.0 1127.0 4.2 938 2.23 5.5 1128.0 4.4 856 1.94
Table-6: Marshall Test results for BM80 Binder
Content Wt. in air (g) Flow Value (mm) Stability
(kg) Marshall Quotient
(kN/mm) 3.0 1115.0 2.6 745 2.87 3.5 1132.0 2.9 856 2.95 4.0 1126.0 3.6 1021 2.84 4.5 1125.0 4.0 938 2.35 5.0 1112.0 4.3 883 2.05 5.5 1138.5 4.5 800 1.78
Table 7 Marshall Test results for BM100 Binder
Content Wt. in air (g) Flow Value (mm) Stability (kg) Marshall Quotient
(kN/mm) 3.0 1116.0 2.9 746 2.57 3.5 1125.0 3.2 804 2.51 4.0 1128.0 3.5 933 2.66

International Journal of Advance and Innovative Research Volume 6, Issue 2 (XXX): April – June, 2019
135
ISSN 2394 - 7780
4.5 1109.5 3.8 947 2.49 5.0 1120.0 4.3 775 1.80 5.5 1124.0 4.6 662 1.44
Fig-4: Comparison of Marshall stability at different binder content
Fig-5: Comparison of flow value at different binder content
Table-8: Marshal Mix results at different percent of replacement
Mix Replacement (%) OBC (%)
Max. Stability (kg)
Flow (mm)
Marshall Quotient (kN/mm)
BM0 0 4.08 1410 2.8 5.04 BM20 20 4.2 1340 3.1 4.32 BM40 40 4.05 1180 3.2 3.69 BM60 60 4.08 1095 3.45 3.17 BM80 80 4.03 1022 3.62 2.82
BM100 100 4.3 945 3.75 2.52
Fig-6 OBC value for BM at different percent of replacement

International Journal of Advance and Innovative Research Volume 6, Issue 2 (XXX): April – June, 2019
136
ISSN 2394 - 7780
Fig-7: Comparison of Marshall Stability at different percent of replacement
Fig-8: Comparison flow value at different percent of replacement
Fig-9: Comparison Marshall Quotient at different percent of replacement
CONCLUSION Optimum Binder content slightly increase with replacement till 20% then it is decrease after 40% till 80%
after its values randomly increases.
OBC values are nearly same as control mix OBC from range of 40 to 80%.
Marshall Stability results of Bituminous Macadam grade I decreased with increment of percentage replacements of marble waste and marble dust. When we fully replace natural material with marble stone and marble dust Stability result reached upto minimum range which is not suitable for any type of construction, so it is suggested to allow the replacement to be done upto maximum limit of 60-65%.
Flow values of Bituminous Macadam grade I increasing with increment of percentage replacements of marble waste and marble dust.

International Journal of Advance and Innovative Research Volume 6, Issue 2 (XXX): April – June, 2019
137
ISSN 2394 - 7780
REFERENCES [1] A.R. Pasandín, I. Pérez, “Laboratory evaluation of hot-mix asphalt containing construction and
demolition waste”, Construction and Building Materials 43 (2013)497–505
[2] Ajay Singh Jethoo, Harshwardhan .S.C et.al., “Evaluation of use of Kota Stone Mining Waste as Fine Aggregate in Bituminous Courses”, International Journal of Engineering Technology, Management and Applied Sciences- May 2017, Volume 5, Issue 5, ISSN 2349-4476
[3] Arun Pratap Singh Rathore, Karan Parbhakar, “Soil Stabilization Using Kota Stone SlurryIn Pavement”, International Journal of Innovative Research in Science, Engineering and Technology- Vol. 7, Issue 5, May 2018
[4] Asi Ibrahim, Shalabi Faisal et.al. “Use of basalt in asphalt concrete mixes”, Construction and Building Materials 23 (2009) 498–506
[5] Dr. Bharat Nagar, Virendra Singh Shekhawat et.al., “USE OF MARBLE DUST AS FILLERS IN ASPHALT PAVEMENT”, International Journal of Modern Trends in Engineering and Research (IJMTER)Volume 04, Issue 10, [October– 2017]
[6] Huseyin Akbulut, Cahit Gurer,” Use of aggregates produced from marble quarry waste in asphalt pavements” Building and Environment 42 (2007) 1921–1930
[7] Ignacio Pérez, Ana R. Pasandín et.al. “Evaluation of steel slag coarse aggregate in hot mix asphalt concrete”, Journal of Hazardous Materials 165 (2009) 300–305
[8] Julian Mills-Beale, Zhanping You, “The mechanical properties of asphalt mixtures with Recycled Concrete Aggregates”, Construction and Building Materials 24 (2010) 230–235
[9] Mustafa Karasahin, Serdal Terzi, “Evaluation of marble waste dust in the mixture of asphaltic concrete”, Construction and Building Materials 21 (2007) 616–620
[10] MoghadasNejad, A.R. Azarhoosh et.al. “Laboratory evaluation of using of recycled marble aggregates on the mechanical properties of hot mix asphalt”, Journal of Materials in Civil Engineering-2012
[11] Olumide Moses Ogundipe, “Marshall stability and flow of lime-modified asphalt concrete”, Transportation Research Procedia 14 (2016) 685 – 693
[12] Pradeep Kumar Gautam, Dr. Pawan Kalla et.al, “Laboratory investigations on hot mix asphalt containing mining waste as aggregates” , Construction and Building Materials 168 (2018) 143–152
[13] Pawan Kalla, Ravindra Nagar et.al, “ Laboratory investigation on use of quarry waste in open graded friction course”, Resources Policy-2018
[14] ShaopengWua, Jinjun Zhong et.al, “Influence of demolition waste used as recycled aggregate on performance of asphalt mixture”, Road Materials and Pavement Design-2013
[15] Surender Singh, G.D. Ransinchung R.N. et.al. “Utilization of reclaimed asphalt pavement aggregates containing waste from Sugarcane Mill for production of concrete mixes”, Journal of Cleaner Production- S0959-6526(17)32486-1
[16] Specification for Road and Bridge Works- 5th Revision, Ministry of Road Transport & Highways.

International Journal of Advance and Innovative Research Volume 6, Issue 2 (XXX): April – June, 2019
138
ISSN 2394 - 7780
WASTE PLASTIC FIBER REINFORCED SOIL
Vikas Sharma, Amit Sharma, Ashish Shekhawat and Amit Soni Department of Civil Engineering, Poornima Institute of Engineering & Technology, Jaipur
ABSTRACT The primary objective of this study is to investigate the use of waste fiber substances in geotechnical applications and to evaluate the consequences of waste polypropylene fibers on shear energy of unsaturated soil by using sporting out direct shear assessments and unconfined compression checks. The effects acquired are in comparison for various checks and inferences are drawn in the direction of the usability and effectiveness of fiber reinforcement as a replacement for deep foundation or raft foundation, as a fee powerful approach. Arbitrarily disbursed fiber reinforcement approach has correctly been utilized in a diffusion of programs consisting of slope stabilization, road subgrade and sub base and so on. This is an exceedingly simple method for ground improvement and has terrific potential as a value effective approach to many geotechnical troubles. Keeping this in view the study was taken up. in this study a sequence of compression tests under exclusive confining pressures were conducted on soil pattern with out and with plastic reinforcement. Plastic fibers are much like the roots of trees and flowers which give an extremely good element to enhance the soils and the stability of natural slopes.
Keywords: Waste polypropylene fibers, Fiber reinforcement, Confining pressures, Natural slopes, Plastic reinforcement, subgrade.
I. INTRODUCTION General:For any land-based structure, the foundation is fundamental and must be strong to support the entire structure. All together for the foundation to be strong, the soil around it accepts an incredibly fundamental activity. Thusly, to work with soils, we need fitting data about their properties and components which impact their lead. The methodology of soil modification achieves the required properties in earth required for the improvement work.
From the most punctual beginning stage of improvement work, the need of redesigning soil properties has gone to the light. Out of date city foundations of the Chinese, Romans and Incas utilized distinctive methods to improve soil quality, etc. A segment of these methodologies were compelling to the point that their structures avenues still exist.
In India, the bleeding edge time of soil alteration began in mid 1970's, with a general absence of oil and aggregates; it wound up principal for the creators to see means to improve soil other than displacing the poor soil at the structure site. Soil change was used anyway in view of the usage of outdated methodologies and besides due to the non participation of authentic framework, soil alteration lost help. Recently, with the extension in the enthusiasm for system, rough materials and fuel, soil modification has started to take another shape. With the openness of better research, materials and apparatus, it is ascending as a standard and adroit system for soil improvement.
WASTE PLASTIC FIBER The filtered water is the most fastest developing drink industry on the planet. As per the global filtered water affiliation (IBWA), sales of catapulted water have expanded by 500 percent throughout the most recent decade and 1.5 million tons of plastic are utilized to bottle water each year. Plastic jug reusing has not kept pace with the sensational increment in virgin pitch polyethylene terephthalate (PET) deals and the last basic in the environmental group of three of decrease/reuse/reuse, has risen as the one that should be given unmistakable quality.
The general study demonstrates that 1500 jugs are dumped as trash each second. PET is accounted for as a standout amongst the most bounteous plastics in strong urban waste. In 2007, it was accounted for that the world's yearly utilization of PET jugs is roughly 10 million tons and this number becomes about up to 15% consistently.
Then again, the quantity of reused or returned bottles is extremely low. On a normal, an Indian uses one kilogram (kg) of plastics every year and the world yearly normal is a disturbing 18 kg. It is assessed that around 4-5% post-shopper plastics squander by weight of City Strong Waste (MSW) is created in India and the plastics squander age is more for example 6-10 % in USA, Europe and other created nations.
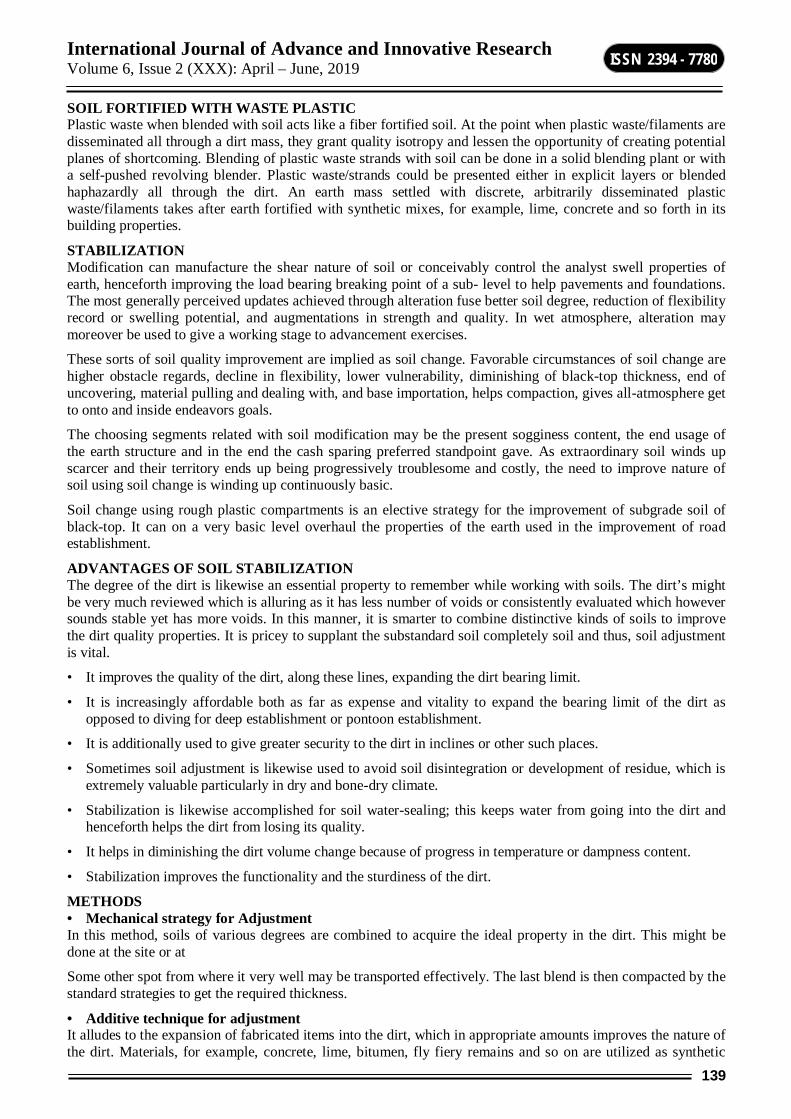
International Journal of Advance and Innovative Research Volume 6, Issue 2 (XXX): April – June, 2019
139
ISSN 2394 - 7780
SOIL FORTIFIED WITH WASTE PLASTIC Plastic waste when blended with soil acts like a fiber fortified soil. At the point when plastic waste/filaments are disseminated all through a dirt mass, they grant quality isotropy and lessen the opportunity of creating potential planes of shortcoming. Blending of plastic waste strands with soil can be done in a solid blending plant or with a self-pushed revolving blender. Plastic waste/strands could be presented either in explicit layers or blended haphazardly all through the dirt. An earth mass settled with discrete, arbitrarily disseminated plastic waste/filaments takes after earth fortified with synthetic mixes, for example, lime, concrete and so forth in its building properties.
STABILIZATION Modification can manufacture the shear nature of soil or conceivably control the analyst swell properties of earth, henceforth improving the load bearing breaking point of a sub- level to help pavements and foundations. The most generally perceived updates achieved through alteration fuse better soil degree, reduction of flexibility record or swelling potential, and augmentations in strength and quality. In wet atmosphere, alteration may moreover be used to give a working stage to advancement exercises.
These sorts of soil quality improvement are implied as soil change. Favorable circumstances of soil change are higher obstacle regards, decline in flexibility, lower vulnerability, diminishing of black-top thickness, end of uncovering, material pulling and dealing with, and base importation, helps compaction, gives all-atmosphere get to onto and inside endeavors goals.
The choosing segments related with soil modification may be the present sogginess content, the end usage of the earth structure and in the end the cash sparing preferred standpoint gave. As extraordinary soil winds up scarcer and their territory ends up being progressively troublesome and costly, the need to improve nature of soil using soil change is winding up continuously basic.
Soil change using rough plastic compartments is an elective strategy for the improvement of subgrade soil of black-top. It can on a very basic level overhaul the properties of the earth used in the improvement of road establishment.
ADVANTAGES OF SOIL STABILIZATION The degree of the dirt is likewise an essential property to remember while working with soils. The dirt’s might be very much reviewed which is alluring as it has less number of voids or consistently evaluated which however sounds stable yet has more voids. In this manner, it is smarter to combine distinctive kinds of soils to improve the dirt quality properties. It is pricey to supplant the substandard soil completely soil and thus, soil adjustment is vital.
• It improves the quality of the dirt, along these lines, expanding the dirt bearing limit.
• It is increasingly affordable both as far as expense and vitality to expand the bearing limit of the dirt as opposed to diving for deep establishment or pontoon establishment.
• It is additionally used to give greater security to the dirt in inclines or other such places.
• Sometimes soil adjustment is likewise used to avoid soil disintegration or development of residue, which is extremely valuable particularly in dry and bone-dry climate.
• Stabilization is likewise accomplished for soil water-sealing; this keeps water from going into the dirt and henceforth helps the dirt from losing its quality.
• It helps in diminishing the dirt volume change because of progress in temperature or dampness content.
• Stabilization improves the functionality and the sturdiness of the dirt.
METHODS • Mechanical strategy for Adjustment In this method, soils of various degrees are combined to acquire the ideal property in the dirt. This might be done at the site or at
Some other spot from where it very well may be transported effectively. The last blend is then compacted by the standard strategies to get the required thickness.
• Additive technique for adjustment It alludes to the expansion of fabricated items into the dirt, which in appropriate amounts improves the nature of the dirt. Materials, for example, concrete, lime, bitumen, fly fiery remains and so on are utilized as synthetic

International Journal of Advance and Innovative Research Volume 6, Issue 2 (XXX): April – June, 2019
140
ISSN 2394 - 7780
added substances. Now and then unique strands are additionally utilized as fortifications in the dirt. The expansion of these strands happens by two strategies;
a) Oriented fiber support The strands are planned in some solicitation and all of the fibers are set in a comparative presentation. The fibers are laid layer by layer in this kind of presentation. Predictable strands as sheets, strips or bars, etc are used effectively in this kind of course of action.
b) Random fiber support This strategy has discrete strands appropriated self-assertively in the soil mass. The mixing is done until the earth and the help structure a basically homogeneous blend. Materials used in this kind of strongholds are ordinarily gotten from paper, nylon, metals or distinctive materials having vacillated physical properties. Randomly dispersed strands have a couple of focal points over the effectively flowed fibers. Somehow thusly of help resembles development of admixtures, for instance, bond, lime, etc. Other than being definitely not hard to incorporate and mix, this system moreover offers quality isotropy, reduces probability of potential weak planes which occur in the other case and offers flexibility to the soil.
II OBJECTIVE Waste plastic can be used as an ingredient to improve the soils and the stability of natural slopes. To use waste fiber materials in geotechnical applications and to evaluate the effects of waste polypropylene fibers on shear strength of unsaturated soil by carrying out direct shear test and unconfined compression test. The primary purpose of reinforcing soil mass is to improve its stability, to increase its bearing capacity, and to reduce settlements and lateral deformation.
MATERIALS • Soil test sample
Area: Behind Arbuda Convention Center, PIET Campus
• Reinforcement: Haphazardly situated waste plastic filaments of irregular measurement.
FIG-1: PREPARATION OF PLASTIC FIBERS FROM WASTE PLASTIC
SAMPLE PREPARATION Following advances are completed while blending the fiber to the dirt-
• All the dirt examples are compacted at their particular most extreme dry thickness (MDD) and ideal dampness content (OMC), relating to the standard delegate compaction tests
• The diverse qualities received in the present investigation for the level of fiber support are 0, 0.20, and 0.30.
• If fiber support was utilized, the embraced substance of strands was first blended into the air-dried soil in little additions by hand, ensuring that every one of the filaments were blended altogether, so a genuinely homogenous blend is acquired, and afterward the required water was included.

International Journal of Advance and Innovative Research Volume 6, Issue 2 (XXX): April – June, 2019
141
ISSN 2394 - 7780
3. METHODOLOGY The subsequent checks are being performed well before the reinforcement is brought to correctly decide the homes of soil. Those exams are used to find out the diverse traits of the soil. These assessments assist in determining residences including size of soil, specific gravity, atterberg’s limit, cohesiveness etc.
Checks Performed
The experimental work includes the following steps:
1. Specific gravity.
2. Particle size distribution by sieve analysis.
3. Determination of the maximum dry density (MDD) and the corresponding optimum moisture content (OMC) of the soil by Proctor compactiontest.
4. Preparationofreinforcedsoilsamples.
5. Identification of soil index properties (Atterberg Limits).
(a) Liquid limit by Casagrande’sapparatus
(b) Plastic limit
6. Determinationoftheshearstrengthby: (a)Direct shear test(DST) (b)Unconfined compression test (UCS). (c)California Bearing Ratio test (CBR)

International Journal of Advance and Innovative Research Volume 6, Issue 2 (XXX): April – June, 2019
142
ISSN 2394 - 7780
IV TEST RESULTS AND OBSERVATIONS
SPECIFIC GRAVITY TEST
The specific gravity of the soil is determined using specific gravity test.
TABLE-1 Particulars Trial–1 Trial – 2 Trial – 3
Weight. of Pyconometer (W1) 633 633 633 Weight. of Pyconometer+Soil (W2) 833 833 833
Weight. of Pyconometer+Soil+ Water (W3) 1700 1691 1701 Weight.of Pyconometer+Wate r (W4) 1570 1572 1572
Average Specific Gravity of Soil =2.80
Fig-2: Pyconometer Apparatus in Specific Gravity Test
INDEX PROPERTIES
TABLE-2: LIQUID LIMIT: the liquid limit is determined No. of blows Weight of wet soil (gm Weight of dry soil
(gm) Weig ht of water
(gm) Moisture Content (%)
56 13 10 3 27.14 19 15 12 3 22.06 10 17 12 5 30.11
Liquid Limit= 26%
PLASTIC LIMIT Weight of Container(W1) =18g
Weightofwetsoilwithcontainer(W2) = 36g Weight of Driedsoil withcontainer (W3) = 34g Weight of water (W2-W3) = 2
Weight of drysoil (W2-W1) = 10g
Plastic Limit(W) =20%Plasticity Index (PI) = LL – PL
= 27 – 20 = 7%
4.5-PARTICLE SIZE DISTRIBUTION So according to the gradation curve, we can say that the soil is of type GM– GW (Gravel, Well – Graded with silt), as the
percentage fine passing thru the #200 sieve(0.075mm) is less than 5% (by IS code).
Table-3 IS Sieve (mm) Retained Weight of Soil (grams) % Retained Cumulative % Retained (grams) %Finer
4.75 251 50.2 50.2 49.7 2.36 82 16.4 66.6 33.3 1.18 58 11.6 78.2 21.9 0.6 22 4.4 82.6 17.3 0.3 35 7.0 89.6 10.5 0.15 32 6.4 96.0 4.1
0.075 17 3.4 99.4 0.5 Pan 3 0.6 100 0

International Journal of Advance and Innovative Research Volume 6, Issue 2 (XXX): April – June, 2019
143
ISSN 2394 - 7780
Fig-3: Particle Distribution Graph
Fig-4: Sieve Shaker Apparatus
MOISTURE CONTENT
Table 4 WT. OF CONTAINER
(Grams) WT. OF
CONTAINER+ WET SOIL(Grams)
WT. OF CONTAINER+ DRY
SOIL(Grams)
MOISTURE CONTENT (GM)
19 55 51 11.11 18 67 61 12.24 18 53 47 17.14
Average Moisture Content = 13.49%
STANDARD PROCTORCOMPACTION
Weight of empty mould(Wm) grams 2059 2059 2059 Internal diameter of mould(d) cm 10 10 10
Height of mould (h) cm 12.5 12.5 12.5 Volume of mould(V) 981.75 981.5 981.75
Trial No. 1 2 3 WeightofBaseplate(Wb) 2064 2064 2064
Weight of empty mould + base plate 4124 4124 4124 Weight of mould +compactedsoil+Base plateGms 6089 6179 6271
Weight of Compacted Soil (W)grams 1965 2055 2149 Wet Density of Soil (W/V) 2.001 2.093 2.188
Moisture Content (w) 4% 6% 8% Dry Density (wet/(1+w)) x 9.81 18.87 19.37 19.87
Optimum Moisture Content (OMC):8%
Max. Dry Density (gm/cc)(MDD):19.87kN/m3

International Journal of Advance and Innovative Research Volume 6, Issue 2 (XXX): April – June, 2019
144
ISSN 2394 - 7780
Fig-5: Standard proctor mould
DIRECT SHEAR Unreinforced Soil Area of box: 36cm*cm
Proving ring constant (k): 0.196
Table-6: Direct Shear Test – Unreinforced Soil Normal Stress Proving Ring reading Shear Load (Proving * k) Shear stress
0.5 54 10.025 0.315 1 84 16.001 0.490
1.5 106 20.450 0.529
Fig-6: ShearStressVs.NormalStressGraphforunreinforced soil
From Graph, 2
i) Cohesion(c): 0.15 kg/cm-1
i) Angle (φ): tan (0.362) =19.860
Table-7: DST- Reinforcement=0.20% Normal Stress Proving Ring reading Shear Load (Proving * k) Shear stress
0.5 80 16.025 0.525 1 125 24.001 0.700
1.5 170 34.450 0.852
FIG-7: Shear Stress Vs. Normal Stress Graph for Reinforced Soil
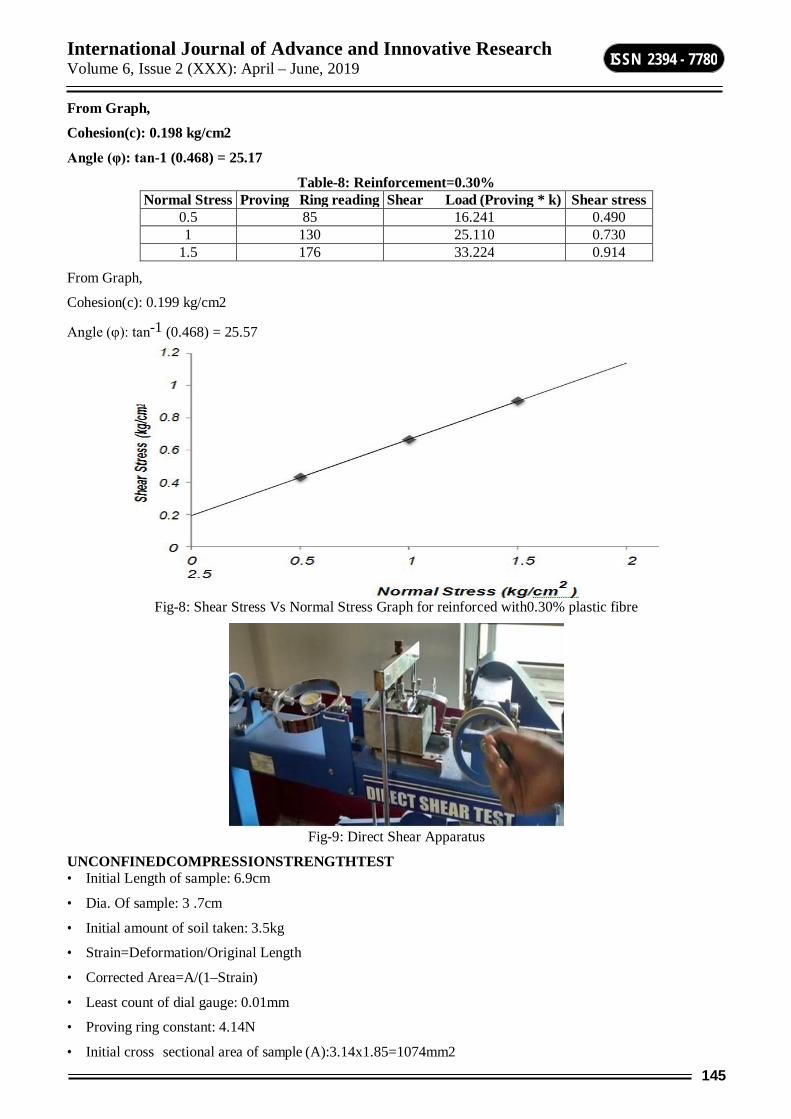
International Journal of Advance and Innovative Research Volume 6, Issue 2 (XXX): April – June, 2019
145
ISSN 2394 - 7780
From Graph,
Cohesion(c): 0.198 kg/cm2
Angle (φ): tan-1 (0.468) = 25.17
Table-8: Reinforcement=0.30% Normal Stress Proving Ring reading Shear Load (Proving * k) Shear stress
0.5 85 16.241 0.490 1 130 25.110 0.730
1.5 176 33.224 0.914
From Graph,
Cohesion(c): 0.199 kg/cm2
Angle (φ): tan-1 (0.468) = 25.57
Fig-8: Shear Stress Vs Normal Stress Graph for reinforced with0.30% plastic fibre
Fig-9: Direct Shear Apparatus
UNCONFINEDCOMPRESSIONSTRENGTHTEST • Initial Length of sample: 6.9cm
• Dia. Of sample: 3 .7cm
• Initial amount of soil taken: 3.5kg
• Strain=Deformation/Original Length
• Corrected Area=A/(1–Strain)
• Least count of dial gauge: 0.01mm
• Proving ring constant: 4.14N
• Initial cross sectional area of sample (A):3.14x1.85=1074mm2

International Journal of Advance and Innovative Research Volume 6, Issue 2 (XXX): April – June, 2019
146
ISSN 2394 - 7780
FIG – 10: UNCONFINED COMPRESSION TEST SAMPLE AND MOULD UNREINFORCED SOIL
Table-9: Unconfined Compression Test – Unreinforced Soil Dial gaugeb reading strain Proving ring reading Corrected area load Axial stress
50 0.0032 9 18.73 40.82 0.0210 100 0.0068 16 18.99 69.17 0.0345 150 0.0150 22 19.91 92.12 0.0456 200 0.0154 25 20.07 105.12 0.0520 250 0.0170 27 20.18 11344 0.0564 300 0.0300 26 20.29 109.44 0.0524 350 0..0245 23 20.36 98.11 0.0465
UCS GRAPH
Fig-11: AxialStressvs.StrainGraphfor Unreinforced Soil UCS FOR Reinforcement=0.20%
Table-10: Unconfined Compression Test – Reinforced Soil with0.15% Plastic Fiber Dial gauge reading strain Proving ring reading Corrected area load Axial stress
50 0.0032 12 18.70 53.84 0.0266 100 0.0068 17 18.99 79.17 0.0415 150 0.0150 24 19.91 82.12 0.0556 200 0.0154 28 20.07 104.12 0.0610 250 0.0170 30 20.18 112.44 0.0664 300 0.0300 28 20.29 110.44 0.0564 350 0..0245 23 20.36 105.11 0.0565
Fig-12: UCS - Axial Stress vs. Strain Graph for Reinforced Soil with 0.20% plastic fiber

International Journal of Advance and Innovative Research Volume 6, Issue 2 (XXX): April – June, 2019
147
ISSN 2394 - 7780
Table-11: Reinforcement=0.30% Dial gauge value Strain Proving ring reading Corrected area load Axial stress
50 0.0032 13 18.80 43.82 0.0309 100 0.0068 18 18.99 72.17 0.0348 150 0.0150 25 19.92 94.12 0.0459 200 0.0154 28 20.07 107.12 0.0529 250 0.0170 30 20.18 113.44 0.0566 300 0.0300 29 20.20 111.44 0.0524 350 0..0245 25 20.32 108.11 0.0522
Fig-13: UCS - Axial Stress vs. Strain Graph for Reinforced Soil with 0.20% plastic fiber
CALIFORNIA BEARING RATIO TEST (CBR)
Table-12: Unsoaked Soil Sample Penetration
(mm) Load-unreinforced soil Load-0.20% reinforced
soil Load-0.30% reinforced
soil 0.5 300 310 315 1 305 315 320
1.5 310 320 325 2.0 315 325 330 2.5 320 330 345 3.0 325 355 350 4.0 400 395 400 5.0 410 420 420 7.5 440 470 460 10 485 490 490
12.5 500 520 515
CBR Value: Unreinforced Soil=24.126 0.20%Plastic reinforced=25.047 0.30%Plastic reinforced=26.236
Fig-13: CBR–Unsoaked–LoadVsPenetrationGraph Comparison
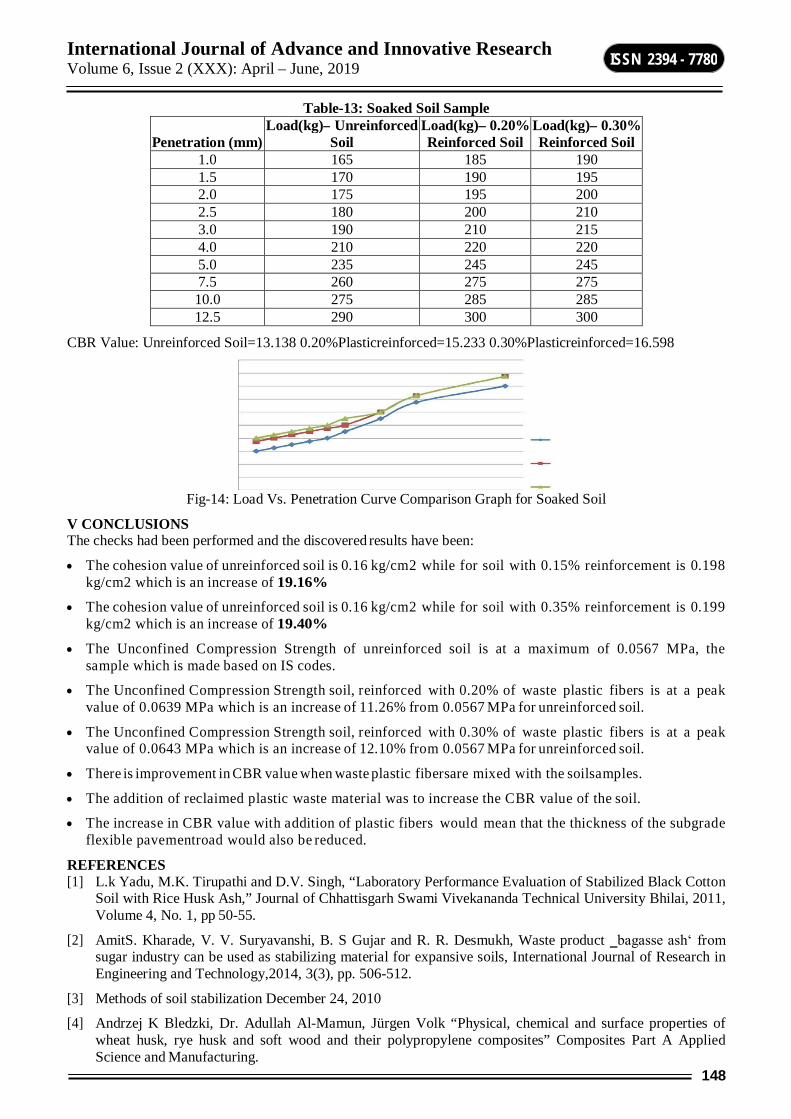
International Journal of Advance and Innovative Research Volume 6, Issue 2 (XXX): April – June, 2019
148
ISSN 2394 - 7780
Table-13: Soaked Soil Sample
Penetration (mm) Load(kg)– Unreinforced
Soil Load(kg)– 0.20% Reinforced Soil
Load(kg)– 0.30% Reinforced Soil
1.0 165 185 190 1.5 170 190 195 2.0 175 195 200 2.5 180 200 210 3.0 190 210 215 4.0 210 220 220 5.0 235 245 245 7.5 260 275 275 10.0 275 285 285 12.5 290 300 300
CBR Value: Unreinforced Soil=13.138 0.20%Plasticreinforced=15.233 0.30%Plasticreinforced=16.598
Fig-14: Load Vs. Penetration Curve Comparison Graph for Soaked Soil
V CONCLUSIONS The checks had been performed and the discovered results have been:
The cohesion value of unreinforced soil is 0.16 kg/cm2 while for soil with 0.15% reinforcement is 0.198 kg/cm2 which is an increase of 19.16%
The cohesion value of unreinforced soil is 0.16 kg/cm2 while for soil with 0.35% reinforcement is 0.199 kg/cm2 which is an increase of 19.40%
The Unconfined Compression Strength of unreinforced soil is at a maximum of 0.0567 MPa, the sample which is made based on IS codes.
The Unconfined Compression Strength soil, reinforced with 0.20% of waste plastic fibers is at a peak value of 0.0639 MPa which is an increase of 11.26% from 0.0567 MPa for unreinforced soil.
The Unconfined Compression Strength soil, reinforced with 0.30% of waste plastic fibers is at a peak value of 0.0643 MPa which is an increase of 12.10% from 0.0567 MPa for unreinforced soil.
There is improvement in CBR value when waste plastic fibersare mixed with the soilsamples.
The addition of reclaimed plastic waste material was to increase the CBR value of the soil.
The increase in CBR value with addition of plastic fibers would mean that the thickness of the subgrade flexible pavementroad would also be reduced.
REFERENCES [1] L.k Yadu, M.K. Tirupathi and D.V. Singh, “Laboratory Performance Evaluation of Stabilized Black Cotton
Soil with Rice Husk Ash,” Journal of Chhattisgarh Swami Vivekananda Technical University Bhilai, 2011, Volume 4, No. 1, pp 50-55.
[2] AmitS. Kharade, V. V. Suryavanshi, B. S Gujar and R. R. Desmukh, Waste product ‗bagasse ash‘ from sugar industry can be used as stabilizing material for expansive soils, International Journal of Research in Engineering and Technology,2014, 3(3), pp. 506-512.
[3] Methods of soil stabilization December 24, 2010
[4] Andrzej K Bledzki, Dr. Adullah Al-Mamun, Jürgen Volk “Physical, chemical and surface properties of wheat husk, rye husk and soft wood and their polypropylene composites” Composites Part A Applied Science and Manufacturing.

International Journal of Advance and Innovative Research Volume 6, Issue 2 (XXX): April – June, 2019
149
ISSN 2394 - 7780
[5] O.O Amu, S. A Oguniyi and O.O Oladeji, Geotechnica properties of Lateritic Soil Stabilized with sugar cane straw ash, America Journal
[6] N J. Shamle, C.J. Dados, S.E. Iwoh, J.G. Nangbes and, A.U Awode” Comparative Assessment of the Yields of Silica from Husk Ashes of Digitaria exilis (acha), wheat and rice” Journal of Applied Chemistry (IOSR-JAC) January 2014, e- ISSN: 2278- 5736.Volume 7, Issue 7 Ver. III., PP 01-04, DOI: 10.9790/5736- 07730104
[7] Khaja Moniuddin and Chethan K, “Stabilization of Expansive Soil Using Wheat Husk Ash and Granulated Blast Furnace Slag”, Trends in Civil Engineering and Material Science(2018).
[8] Mr. Santosh, Prof. Vishwanath C.S.,” Stabilization of Expansive Soil by using Wheat Husk Ash and Granulated Blast Furnace Sla”, International Journal.

International Journal of Advance and Innovative Research Volume 6, Issue 2 (XXX): April – June, 2019
150
ISSN 2394 - 7780
MANUFACTURING PAVEMENT BRICK FROM SAND AND WASTE PLASTIC
Vikas Sharma, Ankit Kumar, Yogesh Kumar Meena and Vishnu Kumar Department of Civil Engineering, Poornima Institute of Engineering & Technology, Jaipur
ABSTRACT Plastic waste which is rising step by step advances toward getting to be flaw and in this manner dirties the earth, especially in high mountain towns where no decline gathering structure exists. Hence for the utilization of the plastic waste it is necessary in the effective way.The present work is performed to make pavement brick from sand and waste plastics.The bricks are produced by mixing waste plastic and sand after heating at 200oC. In this process we taking different mix design of plastic and sand and tested for some physical as well as mechanical properties. The result of this brick is then compared with the ordinary pavement brick. It is observed that the weight, compressive strength and water absorption capacity of the plastic sand brick is less as compare to the ordinary pavement brick.
Index Terms: Plastic waste, plastic brick, compressive strength, ordinary brick.
I. INTRODUCTION LASTIC is a helpful substance in our everyday life but after utilization of plastic it is troublesome for us to discard it because it is non-biodegradable substance. After its use it is a hazardous material. So it is necessary to reuse or recycle the plastic waste to reduce the amount of hazardous waste from the earth. To reduce the disposal problem of plastic, 5 R’s method is taken into the use, in which 5 R means Recover, Reuse, Reduce,Residual management and Recycle . This is the basic principle of the solid waste management and should be followed in order to maintain ecological balance system through conscious human nature and choices.
Plastic consist many synthetic or semi-synthetic organic compound which have engineering properties like they are malleable and can be easily molded into the solid state, so we can use it as a construction material.
As per definition of the plastic it can be molded into any shape when heated so it exist in the various forms like water bottles, furniture, carry bags, food packages etc. which are become waste when it is useless.Collection of these wastes can result into hazardous effects on both human and plant life. Therefore, a proper disposal is needed for this type of hazardous materials and if possible recycle of the useful materials is also important.
In India incinerators are used for the disposal of plastic in which plastic is burn at very high temperature but it also produce some very harmful gasses like carbon mono-oxide which are very harmful for the environment and pollute air. Due to this large number of people get affected and suffered from many diseases.
According to research if plastic is not dispose soon it sustain 4500 years without degradation. So it is very important to dispose or reuse plastic. In construction area we can recycle or reuse plastic at a large scale on a very small price.
Our research is related to the study of the pavement brick made with the help of the river sand and waste plastic. In this research we compare some properties of plastic sand brick with the ordinary brick.
II. MATERIAL USED 1. Waste Plastics By the definition of the plastic it can be molded into the different shape when heated. It exist into the various forms like cups, food packages, carry bags, containers, furniture etc. and becomes waste plastic when it is useless and affect to the humans as well as plants and environment. So the disposal of the plastic is needed but if there is chances of recycle then we can manage the waste by recycling process.
TABLE-1: PROPERTIES OF POLYETHYLENE S. No EXPERIMENTS RESULTS
1 Density at 230C 0.950 2 Elasticity modulus 9.0 3 Tensile creep strength 8.0 4 Bending creep modulus 1.0 5 Tensile strength at 230C 2.0 6 Elongation at break (%) >600 7 Thermal conductivity 0.00

International Journal of Advance and Innovative Research Volume 6, Issue 2 (XXX): April – June, 2019
151
ISSN 2394 - 7780
2. River Sand:- Sand is naturally occurring material which consist mineral particles and finely divided materials. The composition and type of sand is depending on the local rock.
TABLE-II: PROPERTIES OF RIVER SAND S. No EXPERIMENTS RESULTS
1 Water content (%) 8.6 2 Specific gravity 2.59 3 Unit weight (gm/cc) 1.63 4 Fineness modulus 2.86
III. METHEDOLOGY First of all we collect Plastic bags and clean it with the help of cleanwater and then dried or wipe to remove the water particles present in it. Then we take river sand and all basic test of sand like moisture content, specific gravity, bulk density is tested.
Now in order to find the plastic sand brick which possess high compressive strength we use various mix proportion. Here we taken three mix proportions (1:1, 1:1.5, 1:2). These are the mix ratio of our sample which represent plastic waste and sand respectively.
Then heating the plastic at the temperature of 2000C till the plastic comes into the liquid state and after that we mix the sand in it with the help of steel rod and trowel and then these mixture is poured into the mould before it harden. After 24 hours we remove it from the mould for testing.
A. Water Absorption Test In water absorption test dry brick is weighed and then brick is immersed in the water for 24 hours. After 24 hours block is taken out from water and wipe out eith the help of clean cloth and then weighed again.
Water Absorption =W2-W1 X 100
W1
Where,
W1 = Dry weight of brick
W2 =Wet weight of brick

International Journal of Advance and Innovative Research Volume 6, Issue 2 (XXX): April – June, 2019
152
ISSN 2394 - 7780
TABLE-III: WATER ABSORPTION TEST OF WASTE PLASTIC SAND BRICK S. No MIX RATIO WATER ABSORPTION (%)
1 1:1 0.92 2 1:1.5 0.98 3 1:2 1.1
TABLE-IV: WATER ABSORPTION FOR VARIOUS TYPES OF PAVER BLOCK S. No TYPE OF BLOCK WATER ABSORPATION
1 PLATIC SAND 1.1 2 ORDINARY 3.9
B. COMPRESSIVE STRENGTH In this test the specimen placed in the CTM (COMPRESSION TESTING MACHINE) and then load is applied. The rate of loading is increasing at the rate of 140 kg/cm2 continuously until the specimen breakdown and at last the maximum load is taken.
COMPRESSIVE STRENGTH = P/A
Where
P = Maximum Applied load
A = Area of Specimen
TABLE-V: COMPRESSIVE STRENGTH OF PLASTIC SAND BLOCK S. NO MIX RATIO COMPRESSIVE STRENGTH
1 1:1 3.98 2 1:1.5 4.36 3 1:2 4.87
TABLE-VI: COMPRESSIVE STRENGTH COMPERISION S. NO TYPE OF BLOCK COMPRESSIVE STRNGTH
1 PLASTIC SAND 4.87 2 ORDINARY 7.13

International Journal of Advance and Innovative Research Volume 6, Issue 2 (XXX): April – June, 2019
153
ISSN 2394 - 7780
HARDNESS TEST In this test with the help of a steel rod or other hard material a scratch is made over the surface of block. If this scratch is difficult to imply then the block is hard and it show that brick quality is high.
V. CONCLUSION 1. The Plastic sand bricks perceived worthwhile which comprises Cost efficiency, assist in eradication of
waste.
2. Reduce disposal grievances.
3. The manufacturing cost of plastic sand paver is less as compare to the ordinary paver so it is economical.
4. Its compressive strength is low as compare to ordinary block so its applicable for normal construction only i.e footpath, gardening, parking regions etc.
REFERENCES i. Dinesh A; Kiubhakaran K; and Dinesh S., “Utilisation of Waste Plastic in Manufacturing of Bricks and
Paver Blocks” International Journal of Applied Engineering Research, Vol.2 (4), pp. 364-368.
ii. Manisha; NitinGoyal., “Constructing structures using eco-bricks”, Internatonal Journal of Recent Trends in Engineering & Research, Vol.2(4).
iii. S. Kolias,V.Kasselouri-Rigopolou, S.Gavela,“Use Of Polymeric Wastes in The Concrete Production”
iv. A.Rsantha; “Concrete Technology” Oxford University Press Delhi.

International Journal of Advance and Innovative Research Volume 6, Issue 2 (XXX): April – June, 2019
154
ISSN 2394 - 7780
SOIL STABILIZATION BY USING WHEAT HUSK ASH AND IRON SLAG
Vinod Kumar Sharma1 and Vikas Sharma2 Assistant Professor1 and M. Tech Scholar2, Department of Civil Engineering, Poornima University, Jaipur
ABSTRACT The rapid growth in population and industrialization cause generation of large quantity of waste. These waste materials can be mixed with the soil as stabilizer to improve the behaviour of soil and utilize the Retaining potential of the waste in altered form. There are distinctive techniques to enhance the quality of the soil. Such as mechanical compaction, dewatering and earth support have been found to enhance the quality and attribute of the soil and different strategies like adjustment utilizing admixtures are more beneficial. The distinctive admixtures accessible are wheat husk ash, lime, bond, impact heater slag and so on. In current study the geotechnical investigation is carried out on the soil sample containing varying percentage 3%,5%,7% and 9% of wheat husk ash(WHA) and iron slag(IS) by weight respectively. The tests performed for testing geotechnical properties are Compaction Test, Standard Proctor Test (SPT), liquid limit Test, Plastic limit Test, Specific Gravity and Moisture Content Test. These tests are carried out on the both stages Stabilized and Unstabilized conditions. The results showed that wheat husk ash and iron slag improve the geotechnical properties of the soil samples and these waste materials were found to be an effective stabilizer for soil.
Keywords: Soil, Soil Stabilization, Wheat Husk Ash, Iron Slag, Compaction, Generated Waste, Stabilizer, Admixtures.
INTRODUCTION A. General The crust layer of the earth comprises coarse and fine soil particles as well as rocks that’s why behaviour of soil is varying and having non-uniform in nature [1]. The properties the soil alters due to mixing of wastes generated from different sources which causes deterioration of the soil. Deterioration of soil can be stopped by applying measures on disposal of generated waste. If the waste having worthwhile properties to such an extent that they can be utilized as a stabilizer for various geotechnical application which can help in recuperation, advancement of soil etc [2] in the soil stabilisation the physical properties of the soil get modified. To give better performance of soil there are a couple of systems used for upgrading geotechnical properties of poor soils that fuses densification, (for example, shallow compaction, dynamic profound compaction, pre-stacking), seepage, considerations, (for example, geo-synthetics and stone sections), and adjustments [3]. For example, wheat husk and iron slag is large quantity of waste produced from agricultural field and steel/ iron plants respectively that reveals disposal problem. The precious ambition of this study is to reduce the disposal problem of generated waste by utilizing it as a stabilizer in soil for various applications like pavement fabrication, as railway ballast, landfills etc. An attempt has been made in this investigation for the effective utilization of wheat husk ash and iron slag to improve the physical and engineering properties of soil. Objective of current study is to utilize wheat husk ash and iron slag wastes as soil stabilizer.
Scope of the Study o To study the index and compaction properties of soil with the addition of various percentages of IS to arrive
the optimum percentage and also intended to compare the change in geotechnical properties of natural soils. o To study the index and compaction properties of soil with the addition of various percentages of WHA to
arrive the optimum percentage and also intended to compare the change in geotechnical properties of natural soils.
o To study the strength behaviour of soil at various percentages of IS and WHA with curing to examine maximum percentage addition of IS and WHA to soil independently, to arrive the optimum results.
o To study the strength behaviour of soil treated with optimum percentage of IS and optimum percentage of WHA at various curing periods.
o To develop the rational approaches for the use of IS and WHA for geotechnical purposes. Hence, enhancing the rate of utilizing the IS more effectively for construction purpose and to reduce the disposal problem and minimize the environmental hazards.
MATERIAL AND METHODOLOGY Materials For this study, soil, wheat husk ash and iron slag, water have been used. Their physical properties have been determined.

International Journal of Advance and Innovative Research Volume 6, Issue 2 (XXX): April – June, 2019
155
ISSN 2394 - 7780
Natural Soil Sandy soil have been used for this test and collected from Sitapura industrial area region. IS 1498(1970) is followed for classification and identification of soils for general engineering purposes.
Wheat Husk Ash (WHA) Waste is scorched by the farmer subsequent to extricating grains. In this study, the impact of WHA on the soil is contemplated. Wheat husk is taken from the agriculture fields and burn at to maintain temperature of 600°C to change wheat husk into fine ash. This wheat husk ash has most astounding measure of silica which assists in flourishing of soil. WHA is obtained by burning crop waste while handling wheat from paddy. Around 20 – 22% wheat husk is created from paddy and around 25% of this aggregate husk progress toward becoming cinder when consume. It is non – plastic in nature. Its properties additionally fluctuated relying upon its consuming temperature.
The chemical properties of WHA are shown in Table 1
Table -1: Chemical properties of WHA at 600 °C Sr. No. Compound Value (%)
1 Silicon Oxide (SiO2) 41.33 2 Potassium Oxide (K2O) 10.30 3 Magnesium Oxide (MgO) 0.98 4 Iron Oxide (Fe2O3) 0.83 5 Sodium Oxide (Na2o) 0.17 6 Chromium Oxide (Cr2O3) 0.0004 7 Calcium Oxide (CaO) 5.45 8 Manganese Oxide (MnO2) 0.02
Iron Slag: - Iron Slag obtained as by product left finished after a coveted metal isolated from its crude metal. Slag is typically an amalgam of oxides of metals and dioxide of silicon. In any case, sulphides of metals and essential metals can be found in the slag. Iron slag waste is collected from CICO Company Jaipur. The specification of iron slag is given in the Table 2
Table -2: Chemical properties of Iron Slag Sr. no. Component Type Blast Furnace Slag (%)
1 Cao 40.7 2 Sio2 33.5 3 T-FE 0.5 4 MgO 7.3 5 Al2O3 13.3 6 S 0.9 7 P2O5 <0.1 8 MnO 0.2
1. Methods Various tests are performed to investigate the geotechnical properties of soil.
1. Specific gravity by pycnometer method
2. Grain size distribution
3. Liquid limit by casagrande method
4. Plastic limit
5. Standard proctor test(Compaction)
6. Unconfined compressive strength.
7. ssPlastic limit
C. Index Properties The Specific Gravity (Gs) of the soil samples was determined as per IS: 2720 (part 3/Sec1) – 1980, Methods of test for soils: Determination of Specific Gravity, fine grained soils. The clay and silt sized fractions of the soil specimen was determined as per IS: 2720 (part 4) - 1985, Methods of test for soils: Grain size analysis.

International Journal of Advance and Innovative Research Volume 6, Issue 2 (XXX): April – June, 2019
156
ISSN 2394 - 7780
Atterberg’s limits of the soil specimen was determined as per IS: 2720 (part 5) – 1985, Methods of test for soils: Determination of liquid and plastic limit.
D. Engineering Properties Engineering properties of soils are those properties which can be used for quantifying the Engineering behaviour of soils. The standard proctor compaction characteristics of the soil specimen was determined as per the IS: 2720 (part 7) –1980, Methods of test for soils: Determination of water content-dry density using light compaction. Unconfined compressive strength were carried out as per IS: 2720 (part 10) – 1991, Methods of test for soils: Determination of Unconfined compressive strength
RESULT AND DISCUSSION Soil is collected and tested to evaluate their basic characteristics, compaction and direct shear test. The soil samples thus obtained are oven dried, pulverized and subjected to different laboratory tests.
Table-3: Properties of Soil sample. Properties Sandy Soil
Colour Black Specific Gravity 2.14
GRAIN SIZE DISTRIBUTION Well graded ATTERBERG’S LIMIT
Liquid Limit 13 Plastic Limit 11
Plasticity Index 2 Shrinkage Limit 1
Compaction Characteristics Maximum Dry Density (kN/m3) 14.95 Optimum Moisture Content (%) 18
Unconfined Compressive Strength(kn/m2) 210
A. Compaction
Fig-2: The above graph shows as the water content increases the dry density increases up to a limit afterwards
decreases. The optimum moisture content is 22 and the maximum dry density is 14.95.
.
Fig-3: From the above graph for different % of wheat husk ash shows that optimum moisture content is obtained on 7% of WHA as 18.418%.

International Journal of Advance and Innovative Research Volume 6, Issue 2 (XXX): April – June, 2019
157
ISSN 2394 - 7780
Fig-4: from the above graph for different % of wheat husk ash shows that Maximum dry density obtained is 7%
i.e 15.98 KN/m3.
.
Fig-5: from the above graph IS for different % shows that optimum moisture content is 19.9 at 7%.
.
Fig-6: from the above graph IS for different % shows that maximum dry density at 7% is 15.3 KN/m3
Table-4: Properties of Soil mix with WHA & IS Properties 7S7
Colour Black
Specific Gravity 1.53
Grain Size Distribution Well graded
Liquid Limit 9
Plastic Limit 7
Plasticity Index 2
Shrinkage Limit 1

International Journal of Advance and Innovative Research Volume 6, Issue 2 (XXX): April – June, 2019
158
ISSN 2394 - 7780
Fig-7: Variation of MDD with water for 7S7 sample. MDD increases up to 18.24KN/m3at 12.8 % water content. According to morth maximum dry density must be more than 15.2KN/m3 up height of 3m, 16.2 KN/m3 for 3m
to 5m height and 17.52KN/m3 for sub base construction of road.
B. Unconfined Compressive Strength
. Fig. 8: from the above graph the value obtained for the UCS for sandy soil without stabilizer is 210 KN/m2
. Fig-9: Graph strength against no of days for different % of WHA. The maximum UCS value recorded was 295
KN/m2, 410 KN/m2 and 615 KN/m2 for 1, 3 and 5 days respectively.
. Fig-10: Graph stress against no of days for different % of IS. Observed maximum compressive strength is
obtained at 7 days of 7% which is 510KN/m2.

International Journal of Advance and Innovative Research Volume 6, Issue 2 (XXX): April – June, 2019
159
ISSN 2394 - 7780
. Fig-11: Variation of strain with strain for sample 7S7. The UCS increases with increasing days. UCS value for
1, 3, & 5 days is 459.99, 590 & 690 KN/m2.
CONCLUSION 1. The collected sandy soil has less specific gravity. This is basically due to fibrous nature of the soil. The
mixing of different proportions of both WHA and IS to the soil shows that there is improvement in MDD in addition of 3% to 7% and then further decreases due to stiffness of the soil.
2. The optimum moisture content was attained at 7 % of WHA or IS and then further there is decline. This OMC is used as an index to mix the quantities together for various projects.
3. The Atterberg limits of soil shows that the collected soil is less plastic in nature as its plasticity index is more than 2. The variation in percentages of enhancement at 7 % addition of both WHA and IS renders that soil shows clayey nature. This nature is worthwhile to the applying soil for the pavements.
4. The UCS test gives the shear strength as an index to structuring the buildings by various engineers. It is clear from the results that the strength increases slowly with the addition WHA & IS and then maximum strength is at 7% addition for both.
5. Addition of different % of WHA the dry density increases up to a limit afterwards again it decreases. This is more effective for addition of 7% (optimum) WHA
6. Addition of different % of IS the water content decrease up to a limit afterwards again it increases. This is more effective for addition of 7% (optimum) IS.
7. The stress against different days for varying percentage of WHA. For varying percentage of WHA, as number of day’s increases stress also increases. This is more effective for 7days.
8. The stress against different days for varying percentage of IS. For varying percentage of IS, as number of days increases stress also increases. This is more effective for 7days.
9. The stress against strain for optimum (9%) of WHA and IS for different days as strain increases stress also increases up to a limit, afterwards it decreases. This is more effective for 7 day.
REFERENCES [1] Arpita V Patel, (2011) studied the interaction behavior of typical CH type Expansive soil and castor oil as
contaminant.
[2] A.Kezdi, “Stabilized Earth Roads”. Amsterdam: Elsevier Scientific Publishing Company, 1979. [3] Amit S. Kharade, Suryavanshi, B. S Gujar and R. R. Deshmukh, Waste product ‗bagasse ash‘ from sugar
industry can be used as stabilizing material for expansive soils, International Journal of Research in Engineering and Technology,2014, 3(3), pp. 506-512.
[4] Ajay goyal, Hattori kunio, Hidehiko ogata, Monika garg, A.M. Anwar, M. Ashraf and mandala” Synergic effect of wheat straw ash and rice- husk ash on strength properties of mortar”,2007,Journal of applied sciences 7 (21): 3256-3261.
[5] Andrzej K Bledzki, Dr. Abdullah Al-Mamun, Jürgen Volk “Physical, chemical and surface properties of wheat husk, rye husk and soft wood and their polypropylene composites” Composites Part A Applied Science and Manufacturing, 2010, 41(4):480-488.
[6] Celik and Nalbantoglu (2013) had studied the effects of ground granulated blast furnace slag on IP, linear shrinkage (LS), and SP of lime stabilized sulphate-bearing expansive soil.

International Journal of Advance and Innovative Research Volume 6, Issue 2 (XXX): April – June, 2019
160
ISSN 2394 - 7780
[7] Cokca et al. (2009) had utilized ground granulated blast furnace slag and ground granulated blast furnace slag - cement to stabilize an artificially prepared expansive soil.
[8] Muntohar (2002) carried out a series of laboratory experiments individually and in combination of RHA and lime in stabilizing expansive soils in Indonesia
[9] Maninder Singh, Rubel Sharma, Abhishek,” soil stabilization using industrial waste (wheat husk and sugarcane straw ash)”; International Research Journal of Engineering and Technology (IRJET) Volume: 04 Issue: 09 | Sep -2017.
[10] M. Chittaranjan, M. Vijay and D. Keerthi “Agricultural wastes as soil stabilizers” International Journal of Earth Sciences and Engineering, 2011, Vol-04, Issue No 06 SPL, pp. 50-51.
[11] N.J. Shamle, C.J. Dados, S.E. Iwoh, J.G. Nangbes and ,A.U Awode” Comparative Assessment of the Yields of Silica from Husk Ashes of Digitaria exilis (acha), wheat and rice” Journal of Applied Chemistry (IOSR-JAC) January 2014, e-ISSN: 2278-5736.Volume 7, Issue 7 Ver. III. , PP 01-04, DOI: 10.9790/5736-07730104 [1]
[12] Osinubi et al. (2012) had studied the effect of compaction delay on strength characteristics of black cotton soil stabilized with blast furnace slag and cement.
[13] O.O Amu, S. A Oguniyi and O.O Oladeji, Geotechnical properties of Lateritic Soil Stabilized with sugar cane straw ash, America Journal of Scientific and Industrial Research, 2011, 2(2), pp. 323- 339.
[14] PinarTerzioglu and SevilYucel. (2012). “Synthesis of magnesium silicate from wheat husk ash:effects of parameters on structural and surface properties” BioResources 7(4),2012, pp.5435-5447.
[15] Ramaiah et al (1972) studied the behaviour of Black cotton soil admixed with lime and rice-husk ash in various proportions.
[16] Rajan et al (1982) in Karnataka engineering research station, Krishnarajasagara. It was felt that rice-husk ash behaves as pozzolanic material in the presence of lime.
[17] R. Lal “Soil structure and organic carbon relationships following 10 years of wheat straw management in no-till”, 2007, Volume 95, Issues 1–2, Pages 240–254.

International Journal of Advance and Innovative Research Volume 6, Issue 2 (XXX): April – June, 2019
161
ISSN 2394 - 7780
EXPERIMENTAL STUDIES ON BITUMEN BY ADDING USED ENGINE OIL
Prakash Somani1, Kishor Kumar2, Devendra Suthar3 and Kanhaiya Lal Soni4 M. Tech Transportation Student1, MNIT, Jaipur
B.Tech Civil Student2,3,4, PIET, Jaipur
ABSTRACT Large amount of used engine oil from the automobile industries can impose harmful effect if not disposed properly. With the expanding significance of moderating regular assets and advancing toward reasonable practices, the maturing transportation framework can profit by these thoughts by enhancing their current reusing hones. The waste engine oil was collected from a local auto repair shop. One material that holds potential for restoring the aged asphalt binder to a usable state is waste engine oil. This research contains a study on the use of Waste Engine Oil (WEO) from vehicles as a recycling agent for bitumen. Penetration, softening point, viscosity tests were conducted in order to determine rheological properties of the bitumen. This research highlights the application of used engine oil in the asphalt pavement and the effects on the binder and asphalt mixture performance.
Keyword: used engine oil; reclaimed asphalt pavement
INTRODUCTION Waste Engine Oils displays a total portrayal of the field of motor utilized oils, broadly gathered in the systems of administrations stations and carports. Waste oil which discarded into the landfill without any treatments prominently produced the adverse impact to the environment. The effect can be seen by eutrophication process. With the worry of high development cost and normal asset protection, waste oil can be reused as a replacing material in bitumen for construction of the flexible pavements. After years of exposure to traffic loads and climate change, the road will experience aging and reduction in binder performance. Reclaimed Asphalt pavement (RAP) is that pavement which have the distinctive feature that after the end its design life, the pavement surfaces can be milled and recycled.
Usually, RAP was added in asphalt mixtures between 10% and 60%of the total mixture weight. Higher RAP content in the mixture can significantly increase the mixture's stiffness. However, too much RAP can reduce the mixture performance. Therefore, through rejuvenation the properties of the old asphalt pavement particularly the binder properties can be improved to restore the original ratio of asphalted to maltenes and compensate this hardening effect. This is to provide sufficient binder coating to new aggregates from the reclaimed asphalt mixture to produce pavement with consistent performance. Black-top is a strong, hard fragile segment and not influenced by oxidation, whereas maltenes is a liquid one, oily and resinous in appearance. This paper presents a short review on the utilization of waste oil in black-top asphalt particularly in term of folio change.
TYPE OF OIL Monetary change directly affects business exercises and street organizes offices in a nation. This situation can lead to an increase in the number of vehicles on the road which can contribute the generation of “Used Engine Oil”. The Used Engine Oil is characterized as any oil based that, through tainting, actually uses or has become unsuitable for its original purpose due to the nearness of polluting influences or loss of unique properties.
Waste oil can be discarded in various ways, including sending the utilized oil off-site (some facilities are permitted to handle the used oil such as your local garages and local waste disposal facilities), burning used oil as a fuel (some utilized oil is not managed by burner principles, but rather others that are off-determination utilized oil must be signed in either modern heaters, certain boilers, and allowed dangerous waste incinerators). On the off chance that the release of waste motor oil is not very much oversaw or arranged, it will affect human health, aquatic life and ground pollution. According to previous studies, little waste engine oil is enough to ruin millions of gallons of fresh water.
Figure-1: Different color between fresh (left) and waste (right) engine oil

International Journal of Advance and Innovative Research Volume 6, Issue 2 (XXX): April – June, 2019
162
ISSN 2394 - 7780
PROPERTIES OF USED ENGINE OIL Most motor oils are made from a heavier, thicker petroleum hydrocarbon base stock derived from crude oil, with additives to improve certain properties. The bulk of typical motor oil consists of hydrocarbons with between 18 and 34 carbon atoms per molecule one of the most important properties of motor oil in maintaining a lubricating film between moving parts is its viscosity. The viscosity of a liquid can be thought of as its "thickness" or a measure of its resistance to flow. The viscosity must be high enough to maintain a lubricating film, but low enough that the oil can flow around the engine parts under all conditions. The viscosity index is a measure of how much the oil's viscosity changes as temperature changes. A higher viscosity index indicates the viscosity changes less with temperature than a lower viscosity index.
Motor oil must have the ability to stream enough and no more lessened temperature it is depended upon to inclusion with a particular ultimate objective to confine metal to metal contact between moving parts subsequent to starting up the engine. The pour point characterized first this property of engine oil, as characterized as a file of the most reduced temperature of its utility.
Oil is largely composed of hydrocarbons which can burn if ignited. Still another important property of motor oil is its flash point, the least temperature at which the oil gives off vapors which can ignite. It is dangerous for the oil in a motor to ignite and burn, so a high flash point is desirable. At a petroleum refinery, fractional distillation separates a motor oil fraction from other crude oil fractions, removing the more volatile components, and therefore increasing the oil's flash point (reducing its tendency to burn).
PROPERTIES OF BITUMEN Bitumen is defined as “A viscous liquid, or a solid, comprising basically of hydrocarbons and their subsidiaries, which is soluble in trichloroethylene and is substantially nonvolatile and softens gradually when heated”. It is black or brown in color & possesses waterproofing and adhesive properties. It is obtained by refinery forms from oil, and is likewise found as a characteristic store or as a segment of normally happening asphalt, in which it is associated with mineral matte.
BITUMEN HAS THE FOLLOWING FIVE CHARACTERISTIC PROPERTIES. Bitumen Adheres Bitumen has excellent adhesive qualities provided the conditions are favorable. However in presence of water the adhesion does create some problems. The bitumen aggregate bond is because of a weak dispersion force. Water is highly polar and hence it gets strongly attached to the aggregate displacing the bituminous coating.
Bitumen is Elastic When one takes a thread of bitumen from a sample and stretches or elongates it, it has the ability to return to a length close to its original length eventually. For some bitumen this process may take longer than others. This property is referred to as the elastic character of bitumen.
Bitumen is Plastic When temperatures are raised, as well as when a load is applied to bitumen, the bitumen will flow, but will not return to its original as position when load is removed. This condition is referred to as plastic behavior. Apply a load means that put a weight on the bitumen in order to subject to stress. This could be in a lab or in the bitumen final position in the road and it is done to assess the bitumen reaction to the load.
Bitumen is Visco elastic Bitumen has a Visco elastic character. Its behavior may be either viscous or elastic depending on the temperature or the load it is carrying. At higher temperatures there is more stream or plastic conduct, while at lower temperatures and short duration loading, the bitumen tends to be stiff and elastic. At intermediate temperatures it tends to be a combination of the two.
Bitumen Ages Aging refers to changes in the properties of bitumen over time, which is caused by external condition. These changes are visible as cracks or crumbling areas. When bitumen is exposed to atmospheric conditions, the bitumen molecules react with oxygen, which results in a change of the structure and composition of the bitumen. This process of combining with oxygen, called oxidation, causes the bitumen to wind up noticeably fragile and hard and to change shading from dull dark colored or dark to dim.
RESULT AND DISCUSSION To ensure the quality of bitumen several tests are performed which are as follows.
1. Ductility test

International Journal of Advance and Innovative Research Volume 6, Issue 2 (XXX): April – June, 2019
163
ISSN 2394 - 7780
2. Penetration test
3. Viscosity test
4. Softening test
TABLE-1: Test of bitumen with adding waste engine oil
S.NO. Name of Test Aged Bitumen
Percent of engine oil content 4% 8%
1. Penetration Test 116.3mm 120.3mm 125.6mm 2. Ductility Test 100cm 105 cm 112 cm 3. Viscosity Test 1600 poise 1725 poise 1800 poise 4. Softening Test 54% 43% 35%
Fig-2: Penetration Test Result
Fig-3: Ductility Test Result
Fig-4: Viscosity Test Result

International Journal of Advance and Innovative Research Volume 6, Issue 2 (XXX): April – June, 2019
164
ISSN 2394 - 7780
Fig-5: Softening Test Result
CONCLUSION By the above conducted tests results we can conclude following points
Ductility of aged bitumen has been increase by adding WEO which is good to use aged bitumen for various works.
Penetration value has been also increase with adding of WEO. As it not beneficial for the pavement construction but it can use as a surface coating.
As we see viscosity of aged bitumen has been increase which makes more workable to use it.
There is also increase the softening value of the bitumen which makes to use at high temperature zone.
The waste engine oil has both adverse and good effects on pavements. The appropriate amount of waste oil depends upon the constituent of aged mixture material. The high stiffness of mixture also depends on high amount of waste oil. As in research we are adding 4% and 8% of oil in bitumen the addition of 4%of oil is quite useful in bitumen as shown in results above. Therefore, these factors are an intriguing which could be usefully explored in further sustainable research.
REFERENCES [1] Al-Ghouti, M. a, & Al-Atoum, L. (2009). Virgin and recycled engine oil differentiation: aspectroscopic
study. Journal of environmental management, 90(1),187–95.doi:10.1016/j.jenvman.2007.08.018.Asli,
[2] H., Ahmadinia, E., Zargar, M., &Karim, M. R. (2012). Investigation on physical properties of waste cooking oil – Rejuvenated bitumen binder. Construction and Building Materials, 37, 398– 405. doi:10.1016/j. conbuildmat.2012.07.042
[3] Bailey, H. K., & Philips, P. (2010). Asphalt Rejuvenation. US Patent 0034586 A1.Bamiro, O. A., &Osibanjo, O. (2004).
[4] F.L. Roberts, P.S. Kandhal, E.R. Brown, D.Y. Lee, T.W. Kennedy, Hot mix asphalt materials, mixture design, and construction. 2nd ed., NAPA Research and Education Foundation, Maryland, (1996).
[5] ARRA, Basic asphalt recycling manual, Publication No. NHI01-022, American Recycling and Reclaiming Association, Annapolis, (2001).
[6] J. Brownridge, The role of an asphalt rejuvenator in pavement preservation: Use and need for asphalt rejuvenation, First International Conference on Pavement Preservation on April 12-16, 2010, Newport Beach, California, (2010).
[7] Transportation Research Board, Alternative binders for sustainable pavements. Transportation Research Circular E-C165, TRB, Washington D.C., (2012).
[8] C.D. DeDebene, Z.You, The performance of aged asphalt materials rejuvenated with waste engine oil. International Journal of Pavement Research,Chinese Society of Pavement Engineering, 7(2) (2014) pp.145-152.
[9] Public Works Department of Malaysia, Standard specification for road works - section 4: Flexible pavements, JKR-SPJ-2008, PWD Malaysia, Kuala Lumpur, (2008).

International Journal of Advance and Innovative Research Volume 6, Issue 2 (XXX): April – June, 2019
165
ISSN 2394 - 7780
[10] Asphalt Institute, Asphalt binder testing, Manual Series No.25, Second Edition, Asphalt Institute, Lexington, (2008).
[11] American Society for Testing and Materials, Annual book of ASTM standards-Section 4 volume 04.03:Road paving and materials, West Conshohocken, Pennsylvania. (2010).
[12] J. Read, D. Whiteoak, R. Hunter, Shell bitumen handbook, 5th ed., Thomas Telford Publishing, London, (2003).

International Journal of Advance and Innovative Research Volume 6, Issue 2 (XXX): April – June, 2019
166
ISSN 2394 - 7780
ANALYSIS OF PEDESTRIAN BEHAVIOUR IN URBAN AREAS, JAIPUR
Vikas Sharma, Keshav Gurjar, Kalpana Jareda and Kamlesh Jangid Department of Civil Engineering, Poornima Institute of Engineering & Technology, Jaipur
ABSTRACT Pedestrian safety in urban areas depends upon the (non) compliant behaviour of vehicles’ drivers and pedestrians. Pedestrian accidents usually occur at places where pedestrian and vehicle flows conflict. Urban space design is one of the most important factors contributing to the pedestrian safety, by reducing these conflict points. However, eliminating them is in practice a very difficult task, given that in many European cities quite drastic interventions when redesigning urban space are not easily welcome and need justification. In this respect it is of research and policy interest to associate pedestrian safety with their behaviour at the various high accident risk locations. In doing so, a research on pedestrian safety and behaviour was undertaken in Jaipur, Rajasthan at several locations where pedestrian accidents are recorded. Most of these locations are traffic flow and pedestrian flow intersections either traffic signalised or not. The observers who took place in the research effort surveyed the number of pedestrians who did not comply with traffic signal or traffic regulations and attempted or succeeded to cross illegally the streets. The above surveys took into account among others the existing situation on parking, site land use and pedestrian flow volumes. Sketches of some strange pedestrian Movements were also made. Another party of observers surveyed a sample of the pedestrians who exercised this non compliant behaviour seeking the likely reasons for this behaviour. The research findings are quite interesting especially when associated with the urban space design. Of interest it is also the reaction of the pedestrians who violated the traffic rules, in attempting to justify their behaviour and the risk they take. The lack of police enforcement in pedestrian movement seems to be another factor affecting pedestrians’ decisions. In General, pedestrians prefer to take high risks to cross illegally a street in order to save time and reduce walking distance. Fencing sidewalks to channel pedestrian movements seems a reasonable solution though another research effort in the past in the same city indicated that after all fencing does not lead to more safety for pedestrians. It seems that urban space redesign that facilitates pedestrians and more provisions for pedestrians, such as frequent crossings controlled by traffic lights, that affect road capacity are the most effective solutions in dealing with this issue.
Keywords: pedestrian, traffic, accident
PEDESTRIAN SAFETY IN JAIPUR Street mishaps are one of the fundamental drivers of passing in Jaipur consistently, particularly for kids and older people. The separate financial expense is enormous because of the high number of street mishaps that happen. Consistently in excess of 1,600 individuals kick the bucket and more than 20,000 get harmed. As per ongoing figures (Jaipur, 2005) street mishaps will be the third reason for passing in 2020. The quantity of street mishaps and setbacks in Rajasthan amid the period 1996-2003 is introduced. A fairly significant decrease in mishaps and fatalities is seen, particularly in the period 1999-2003.
As indicated by the accessible information of the territorial transport office Rajasthan, people on foot are in charge of 70% of the quantity of mishaps including walkers in Jaipur urban territories. People on foot regularly uncover hostile conduct, crossing streets from the walker intersections, damaging red signs, strolling over the lanes, altering all of a sudden course and entering street thoughtlessly. This conducts by and large astonishments general traffic and drivers who appear to be unfit to respond rapidly in such circumstances. It ought to be referenced now that as indicated by discoveries from Traffic. The board ponders in Jaipur urban zones 37% of mishaps including walkers were brought about by people on foot who were indiscreet, 31% from walkers who abused red signs and just 16% were brought about by drivers who were not giving legitimate consideration. Then again, as it was referenced above, drivers frequently overlook nearness and requirements of walkers.
Mishap information shows that the quantity of slaughtered walkers is excessively high in connection to different classifications of street clients. Be that as it may, the quantity of walkers truly harmed in street mishaps is diminishing after 1998 with the base an incentive to show up in year 2003 (374 intensely harmed people on foot). Essentially, the level of genuinely harmed people on foot is diminishing after 1998, though for softly harmed walkers the base esteem (2,464 people on foot light harmed in street mishaps) is seen in year 2002. The level of gently harmed people on foot is littler than the ones of light harmed drivers, co-drivers and travellers.
Further investigation of accessible information demonstrates that the level of harmed people on foot is higher in local locations (multiple times higher) than in non-local locations because of high volumes of walkers in these
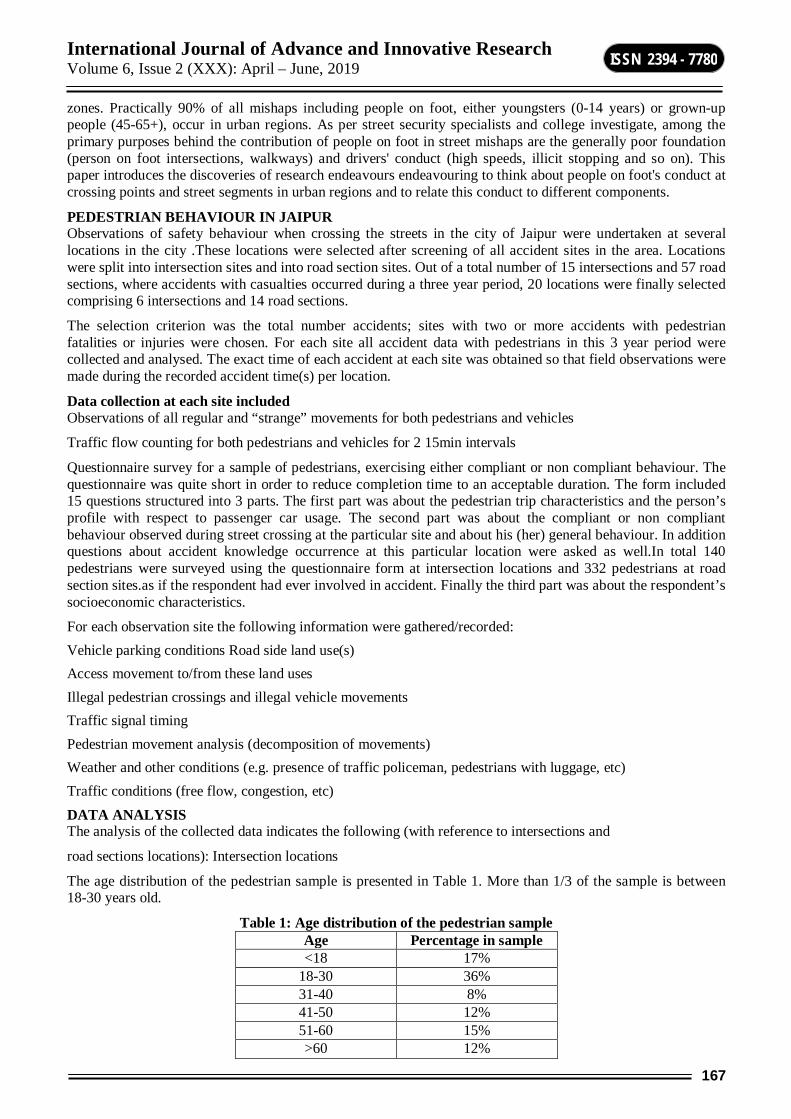
International Journal of Advance and Innovative Research Volume 6, Issue 2 (XXX): April – June, 2019
167
ISSN 2394 - 7780
zones. Practically 90% of all mishaps including people on foot, either youngsters (0-14 years) or grown-up people (45-65+), occur in urban regions. As per street security specialists and college investigate, among the primary purposes behind the contribution of people on foot in street mishaps are the generally poor foundation (person on foot intersections, walkways) and drivers' conduct (high speeds, illicit stopping and so on). This paper introduces the discoveries of research endeavours endeavouring to think about people on foot's conduct at crossing points and street segments in urban regions and to relate this conduct to different components.
PEDESTRIAN BEHAVIOUR IN JAIPUR Observations of safety behaviour when crossing the streets in the city of Jaipur were undertaken at several locations in the city .These locations were selected after screening of all accident sites in the area. Locations were split into intersection sites and into road section sites. Out of a total number of 15 intersections and 57 road sections, where accidents with casualties occurred during a three year period, 20 locations were finally selected comprising 6 intersections and 14 road sections.
The selection criterion was the total number accidents; sites with two or more accidents with pedestrian fatalities or injuries were chosen. For each site all accident data with pedestrians in this 3 year period were collected and analysed. The exact time of each accident at each site was obtained so that field observations were made during the recorded accident time(s) per location.
Data collection at each site included Observations of all regular and “strange” movements for both pedestrians and vehicles
Traffic flow counting for both pedestrians and vehicles for 2 15min intervals
Questionnaire survey for a sample of pedestrians, exercising either compliant or non compliant behaviour. The questionnaire was quite short in order to reduce completion time to an acceptable duration. The form included 15 questions structured into 3 parts. The first part was about the pedestrian trip characteristics and the person’s profile with respect to passenger car usage. The second part was about the compliant or non compliant behaviour observed during street crossing at the particular site and about his (her) general behaviour. In addition questions about accident knowledge occurrence at this particular location were asked as well.In total 140 pedestrians were surveyed using the questionnaire form at intersection locations and 332 pedestrians at road section sites.as if the respondent had ever involved in accident. Finally the third part was about the respondent’s socioeconomic characteristics.
For each observation site the following information were gathered/recorded: Vehicle parking conditions Road side land use(s) Access movement to/from these land uses Illegal pedestrian crossings and illegal vehicle movements Traffic signal timing Pedestrian movement analysis (decomposition of movements) Weather and other conditions (e.g. presence of traffic policeman, pedestrians with luggage, etc) Traffic conditions (free flow, congestion, etc) DATA ANALYSIS The analysis of the collected data indicates the following (with reference to intersections and
road sections locations): Intersection locations
The age distribution of the pedestrian sample is presented in Table 1. More than 1/3 of the sample is between 18-30 years old.
Table 1: Age distribution of the pedestrian sample Age Percentage in sample <18 17%
18-30 36% 31-40 8% 41-50 12% 51-60 15% >60 12%

International Journal of Advance and Innovative Research Volume 6, Issue 2 (XXX): April – June, 2019
168
ISSN 2394 - 7780
The trip purpose distribution of the pedestrian sample is presented in Table 2. The vast majority of trip purposes refer to work”.
Table 2: Trip purpose distribution of the pedestrian sample Age Percentage in sample
Work 56% Recreation 16% Shopping 26%
other 2%
MAIN FINDINGS From observations and analysis of questionnaire data the following findings were derived:
Pedestrians are used to illegally cross urban streets in the city centre of Rajasthan.
The majority (65%) of all observed persons at both intersections (140 persons) and road sections (332 persons) do not use designated or signalised crossings.
Young ages seem to exercise non compliant behaviour more often than elderly people. Similarly men are systematically less compliant than women.
When asked how often they cross illegally streets, 47% of all respondents’ state that they use designated crossings and/or traffic signals, the others accepting that either always or often violate the Highway Code as pedestrians.
Holding a drivers’ license does not influence the behaviour of pedestrians when crossing a street.
In a similar way, involvement of pedestrians in accidents does not seem to influence their behaviour when crossing urban streets. However, those not involved in accidents stated that their behaviour would be influenced if involved in some type of accident and most likely they would exercise a more compliant behaviour.
As reasons for not being obedient when crossing the streets, most respondents claim the following: lack of respect of vehicle drivers to pedestrians, inadequate pedestrian infrastructure, and long distances between successive pedestrian crossings, short Pedestrian green time at signalised intersections, lack of crossings close to the bus stops, and others.
CONCLUSIONS By combining analysis results from observations and surveys and also findings from several studies, it seems that the following reasons are responsible for both the behaviour of pedestrians and the existing low safety level:
Lack of proper urban planning and practices enhancing pedestrian safety. Vehicular and pedestrian flow conflict points are often away from designated crossings. Street narrowing at crossings is not the rule while tall buildings in most streets in Thessaloniki city centre, make streets seem narrow even when streets in fact are wide.
Drivers exercise aggressive behaviour even at pedestrian crossings, affecting in this way the behaviour of pedestrians.
Though pedestrian of small streets has increased in the last decade, many interventions towards pedestrians and especially students needs to be done. Local authorities and policy makers have to alter their philosophy and turn towards environmentally friendly transport modes rather than attempting to accommodate Increasing vehicular traffic needs.
REFERENCES 1. Undergraduate Dissertation. Faculty of Civil Engineering, Aristotle University of Thessaloniki. DENCO &
Auth. (1998). Safety for pedestrians and two- wheelers, National Report-Greece,WP 6, DUMAS project.
2. Mintsis, G. Taxiltaris, C. Basbas, S. & Paschalidou, C. (2007).The human factor in road safety: experience from Greece, Proc. of the 6th European Transport Congress: TransportSafety - Safe Transport, European Platform of Transport Sciences, Hungarian Scientific Association for Transport (KTE), National Committee for Accident Prevention, Transport Sciences Committee of the Hungarian Academy of Sciences (MTA), Budapest, Hungary, 25- 27 April 2007, pp.80-84. N.T.U.A.(National Technical University of Athens). (2001). Road Safety Strategic Plan “2006-2010”.

International Journal of Advance and Innovative Research Volume 6, Issue 2 (XXX): April – June, 2019
169
ISSN 2394 - 7780
3. Papadatos, D. Terzidis, A. & Petridou, E. (2005). Εpidemiological profile of road traffic injuries in Greece, among children, adolescents and young people, 3rd Conference on Road S a f e t y , University of Patras, 10 – 11 October 2005.
4. Papaioannou, P., Vasiliadou, J.& Kopelias, P. (1998). Primary analysis of traffic accidents in Greece, Road Safety in Greece, 2nd Conference, Volos, Greece. Papaioannou, P. Mintsis, G. Taxiltaris, C. & Basbas, S. (2002) Enforcement and Traffic Accidents: Recent Experience from Greece, Proc. of the 15th International Cooperation on in the city of Thessaloniki. Undergraduate Dissertation. Faculty of Civil Engineering, Aristotle University of Thessaloniki.

International Journal of Advance and Innovative Research Volume 6, Issue 2 (XXX): April – June, 2019
170
ISSN 2394 - 7780
DEVELOPMENT OF LOW COST FILTER USING HERBAL TECHNIQUE
Musharraf Ali, Naveen Bundela, Manish Parya and Saurbh Singh Student, Department of Civil Engineering, PIET, Jaipur
ABSTRACT Due to rapid urbanization and change in life style, water is more prone to contamination in cities.Purified water is essential for living a healthy life as such everyone should have access to it. Drinking water conditions have great impacts on people’s everyday life, especially in the rural and remote areas where access to safe drinking water is very crucial. In the following project we had tried to develop a “Low Cost Water Purification Technique” using the basic ideas of bottle filter, some locally Herbal available filter material like Tulsi leaves powder, Neem leaves powder, Rice Husk, Sugarcane bagasse, fine graded sand and tries to improve the methodology using the UV Filter, RO Filter, and Activated Carbon Filter mechanism. Main focus was removal of iron from surface water by adsorption technique. Among all the herbal material used, the ash produce from rice husk was proved to give the best result in removal of iron and also available in local area having the cheapest material cost.
Keywords: low cost water filter, iron content, Tulsi leave, TDS, Alkalinity, Hardness.
1. INTRODUCTION Water is the basic and essential need of all forms of life on earth so it becomes our prime responsibility to maintain the quality of water. It is widely distributed and abundant substance in nature. Out Earth comprises water in one- third of its surface i.e. about 71%. Out of this, approximately 96.7% is found in the form of seas and oceans, 1.7% in groundwater, 1.7% in glaciers and the ice caps of Antarctica and Greenland, a small fraction is in other large water bodies, 0.001% in the air as vapor, clouds and precipitation. Only 2.5% of this water is fresh water out of that 98.8% of this water is in the form of ice and groundwater. Less than 0.3% of freshwater is in rivers, lakes, and the atmosphere, and an even smaller amount of the Earth's freshwater (0.003%) is contained within biological bodies and manufactured products [1].
Unsafe drinking water may result in serious health problems and fatal diseases. According world health organization 1.1 billion people lake access to an improved drinking water supply, 88 % of the 4 billion cases of diarrhea disease are attributed to unsafe drinking water and 1.8 billion people die from diarrhoea diseases each year (WHO, 2007). Statistics shows that these diseases resulted in ninety per cent of all deaths of children under five years old in developing countries, due to low immunization of children to infections.
Ultimately the aim of development of any low cost water filtration model should be to operate with minimum energy, minimum maintenance, cost effective, environment friendly, implementable with ease and can be developed from local artisans. This will subsequently inspire the people to put hygiene in to habit and of course will help in the social and economic growth of the country.
II. REVIEW OF PAST WORK Wong (2002) studied Removal of Cu and Pp by tartaric acid modified rice husk from aqueous solution. They studies on the modification of rice husk by various carboxylic acids. The results showed that tartaric acid modified rice husk (TARH) had the highest binding capacities for Cu and Pp.
Hasan in 1990 studied the contact aeration for iron removal method. The iron removal process utilized the catalytic effect of ferric iron. Again in this experiment it was theoretically demonstrated that by keeping high concentration of ferric iron, the volume of the aeration tank can be significantly reduced and it was according to the oxygenation rate equation. Ferric iron is very much effective in decreasing the reactor volumes at lower pH values. It is proposed to recycle the ferric sludge to maintain the high ferric iron concentrations in the reactor.
Sharma and Bhattacharyya (2004) studied Absorb Adsorption of Chromium (VI) on Neem Leaf Powder. He was developed a developed a novel adsorbent from mature leaves of the Neem tree for removing metal ions from water. The adsorbent, in the form of fine powder, was found to very effective in removing chromium (v1) from aqueous solution.
Euras, et al. (2006) studied Removal of cadmium from aqueous solution by adsorption on to sugarcane bagasse. In this paper, cadmium removed by sugarcane bagasse from aqueous solution. Process for removal cd, investigated through batch experiments. First experiment of preparation of synthesis waste water and adsorbent and adsorption experiment. The adsorption processes was relatively fast and equilibrium was achieved after some duration. The optimum adsorption of cd occurred at ph. range 5-7. The kinetic process of cd adsorption on

International Journal of Advance and Innovative Research Volume 6, Issue 2 (XXX): April – June, 2019
171
ISSN 2394 - 7780
to sugarcane bagasse was tested by applying pseudo first order, second order and intraprtide diffusion rate equation. The equilibrium data fitted the Langmuir isotherm model & maximum adsorption capacity determined.
Ashoka and Inamdar (2010) studied Adsorption removed of methyl red from aqueous solution with treated sugarcane bagasse and activated carbon. Paper reported that methyl red dye removed by sugarcane bagasse, an angro industry waste from the waste water. In this process, sugarcane bagasse treated with formaldehyde and sulphuric acid. The adsorption capacities of both treated bagasse were examined at varying ph. initial dye concentration, adsorbent dosage, contact time and temperature and compare the treated bagasse with commercially available powdered activated carbon. The effect of ph. adsorbent dosage, initial dye conc.., and temperature on removal of dye was examined for different times. It was observed that adsorption efficiency of sulphuric acid treated bagasse was higher than formaldehyde treated bagasse.
Tomotada studied the Current bioremediation practice and perspective in 2001. In the method he used in-situ fluorescence hybridization (FISH), in situ PCR, and quantitative PCR for removal of contamination by bioremediation .In this method the detection and reorganization of bacteria and pathogens is very vivid and these are being directly related to the rate of degradation of contaminants.
Pandhare and Dawande (2010) studied Neem leaves powder as low –cost adsorbent and its characteristics. Adsorption has been used successfully in the removal of impurities from effluents. He was developed the Neem leaves powder activated using chemical treatment as low-cost adsorbent.
3.EXPERIMENTAL 3.1Materials Used 3.1.1Plane Sand Fine sand and gravel are naturally occurring glacial deposits high in silica content and low in soluble calcium, magnesium and iron compounds are very useful in sedimentation removal. But here the media is used for iron removal from drinking water. Here for the experimentation plane sand passing through 600 Micron IS sieve were used.
3.1.2 Tulsi Leaves Powder The scientific name of Tulsi is Ocimum Tenuiflorum, Holy basil or Ocimum Sanctum Linn. Leaves are dropped in drinking water for purification and for medication. In all Hindu temples, water mixed with Tulsi leaves are offered to devotees every day since the herbal plant is an excellent medicinal plant found all over India and is considered sacred. The leaves, seeds and root of this plant have been used in ayurvedic medicine. Chemical composition is highly complex, containing many nutrients and other biological active compounds. It can remove fluoride levels in drinking water. Recently it’s used have been found in fighting fluorosis. They are mainly two types of Tulsi. First is Shyam Tulsi having dark coloured stems and leaves and second Rama Tulsi have whitish stem and green leaves.
3.2.3 Neem Leaves Powder: The scientific name of neem is Azadirachta indica. Neem leaf powder was purchased from the local markets of jaipur. Neem leaves powder was taken for removal of toxic element from water. Here, two methods were adopted. First method was only neem powder used but second method was mixed thoroughly with calcium hydroxide (chuna) 1:10 ratio. Chemical formula of calcium hydroxide is Ca(OH)2. It is springily soluble in water and forms a solution called lime water.

International Journal of Advance and Innovative Research Volume 6, Issue 2 (XXX): April – June, 2019
172
ISSN 2394 - 7780
3.2.4 Sugarcane Bagasse Bagasse is sugarcane fiber waste left after juice extraction. Bagasse contains mainly cellulose, hemi cellulose, pentosans, lignin, sugars, wax and minerals. Sugarcane bagasse was collected from Jaipur. It was first washed thoroughly with tap water and again washed with distilled water to remove dirt and metallic impurities and after which it was dried in the oven at about 105 degree Celsius for 3 hours and 24 hours dried in Sun light.
The dried bagasse was grounded and made like fine particles to increase its surface area and 0.1M HCL was added in 100gram bagasse. This was used as an adsorbent along with sand as a base material.
4. METHODOLOGY For removal of iron broadly four herbal materials had been used in the experiments i.e. Tulsi leaves powder, neem leaves powder, rice husk and sugarcane bagasse has been adopted. The following adsorption media had been experimented here for removal of iron from drinking water.
PROCEDURE FOR PREPARATION OF MODEL Filter model will prepared consisting sponge, sand and different herbals.
Then standard solution will pass through the filter model and final solution obtained is the purified solution.
Finally the content of toxic element remaining will be calculated.
Toxic element used was iron.
4.1 Tulsi leaves Powder Tulsi powder and 600 micron sand was taken. Top and bottom layer of sand having different thickness and in between a layer of tulsi leaves powder of different amount. Known concentration of 500ml of iron solution was passed through the sand and tulsi powder and filtrate was collected in a beaker then it is filtered through a Whatman filter paper.
4.2Neem leaves powder When Neem powder and 600 micron sand was taken. Top and bottom layer of sand having different thickness and in between a layer of neem leaves powder of different amount. Known concentration of 500ml of iron solution was passed through the sand and neem powder and filtrate was collected in a beaker then it is filtered through a Whatman filter paper.
4.3 sugarcane bagasse Sugarcane bagasse and sand was taken. Top and bottom layer of sand having 3.5cm thickness and in between a layer of bagasse of 6cm. Known concentration of 500ml of iron solution was passed through the sand and bagasse and filtrate was collected in a beaker then it is filtered through a Whatman filter paper.
5. RESULT AND DISCUSSION
5.1Tulsi leaves Powder:
SAMPLE NO. Amount of tulsi powder(gm) Initial reading Final reading 1 50 1.05 0.974 2 40 1.05 0.998
5.2 Neem leaves powder
Sample no. Amount of neem powder(gm)
Initial iron content (PPM) Final iron content (PPM)
1 50 1.317 0.710 2 40 1.317 0.890
5.3 sugarcane bagasse
Sample no. Amount of sugar can powder(gm)
Initial iron content (PPM) Final iron content (PPM)
1 100 2.378 1.396 2 100 2.378 1.589
5.4 Comparison of result 1. In Tulsi leaves powder, better result obtained in sample1 which removed the iron concentration was 7.502%.
2. In Neem leaves powder, better result obtained in sample3 which removed the iron concentration was 47.00%.

International Journal of Advance and Innovative Research Volume 6, Issue 2 (XXX): April – June, 2019
173
ISSN 2394 - 7780
3. In neem leaf powder mixed with chuna, better result obtained in sample1 which remove the iron concentration was 56%.
4. Sugarcane bagasse remove the iron concentration was 40% by averaging the concentration of three samples.
6. CONCLUSION 1. Adsorption being the simplest and cheapest technique for iron removal, it has several advantages, like longer
filtration runs, shorter ripening time, better filtrate quality. But the only limitation is back wash water requirement is essential for the filter media to run effectively.
2. Sand being the cheapest adsorbing surface is very effective in removal of dissolved iron from drinking water and the rate of filtration is also very high. The only demerit is subsequent development of bacterial layer due to rigorous use. Again back washing is needed time to time.
3. Tulsi leaves powder is not improve to be a good adsorbent in removal of iron.
4. Neem leaf powder mixed with chuna (Ca (OH) 2) proved to be good result in removal of iron compare to untreated neem leaves powder. Because modified neem powder decreased the rate of filtration.
5. Sugarcane bagasse, the removal is not so significant. This may be due to lager particle size of material being used. Smaller the size of particle larger will be the specific surface and better will be the removal.
REFERENCES 1. Nawlakhe G and Bulusu K. (1989): Nalgonda technique a process for removal of excess fluoride from water,
Water Qual Bull. 14, 218–220.
2. Bhattacharjee et al. (2013): Disinfection of Drinking Water in Rural Area Using Natural Herbs, International Journal of Engineering Research and Development. 5 ,07-10
3. Ekta Singh et al. (2012): Diversified potentials of Ocimum sanctum Linn (Tulsi): An exhaustive survey, J. Nat. Prod. Plant Resour., 2(1) , 39-48
4. Lalit M, et al. (2011): Ocimum Sanctum Linn (TULSI) - an overview, International Journal of Pharmaceutical Sciences Review and Research. 7,52-53
5. George A. and Chaudhuri M.(1977): Removal of iron from ground water by filtration through coal, J. Am Water Works Assoc. 69, 385-389
6. Iqbal M. and Edyvean R.(2004): Biosorption of lead, copper and zinc ions on loofa sponge immobilized biomass of Phanerochaete chrysosporium, Minerals Engineering, 17, 217 -223.
7. Chand S, et al. (1996): Removal of hexavalent chromium from wastewater by adsorption, Indian J. Environ. Health, 36, 151-158.
8. Dakiky M, et al. (2002): Selective adsorption of Cr(VI) in industrial waste water using low cost abundantly available adsorbents, Adv. Environ. Res. 6, 533-540.

International Journal of Advance and Innovative Research Volume 6, Issue 2 (XXX): April – June, 2019
174
ISSN 2394 - 7780
UTILIZATION OF HYPO-SLUDGE BY PARTIAL REPLACEMENT OF CEMENT IN CONCRETE
Rituraj Singh Rathore, Nikhil Nawaria, Kunal Singh Sindal and Nanak Chandra Department of Civil Engineering, Poornima Institute of Engineering & Technology, Jaipur
ABSTRACT The utilization of hypo-sludge in solid details was examined as Associate in Nursing choice in distinction to lowland transfer. The concrete has been supplanted by paper slime likewise within the scope of fifty to twenty by weight for M-20 and M-30 mix. By utilizing satisfactory live of the paper mash and water, concrete blends were created and analyzed as so much as droop and quality with the regular cement. The solid examples were tried in 3 arrangement of check as pressure test, half elastic check and flexural test. These tests were completed to assess the mechanical properties for as long as twenty eight days. Therefore, the compressive, half elastic and flexural quality enlarged up to tenth enlargement of paper mash and additional expanded in waste paper mash lessens the qualities unendingly. The examination on utilization of paper ooze may be to boot completed in solid grouping as another reused material.
Keywords: Compressive strength, Flexural strength, Split tensile strength.
INTRODUCTION NERGY plays an important role within the growth of developing countries. Within the context of low handiness of non-renewable energy resources let alone the wants of huge quantities of energy for building
materials like cement, the importance of victimization industrial waste is extremely necessary. Normal hydraulic cement (OPC) plays a note worthy role in developments. To manufacture one ton of normal hydraulic cement, the identical quantity of greenhouse gas is free to the atmosphere that results in atmospheric phenomenon. Therefore, to save lots of atmosphere from heating there ought to be replacement in cement with totally different binders having cementious properties like hypo sludge, fly ash, oxide fume GGBS, Metabolite etc. to cut back disposal and pollution issues emanating from these industrial wastes, it's most essential to develop profitable building materials from them. during this respect Hypo sludge is one in every of the property technique. The hypo sludge contains, low metallic element, most salt and minimum quantity mof oxide that behaves like cement due to metallic element and metal properties. The raw hypo sludge. In general, the common causes of failures are strength and sturdiness etc. because of presence of noxious gasses gift in atmosphere it reduces the lifetime of concrete. This paper briefly explains the technical and environmental advantages of supplementary cementations materials use likewise because the limitations, applications and specifications. In spite of the very fact that there are potential favorable circumstances of incorporating paper-factory residuals in a very solid mix, as an example, value assets in each waste administration and solid creation, up to now still a part of work should be done on the usage of paper mash in solid generation. This paper potted the conduct of cement with the paper mash by substitution of bond within the scope of fifty, 10%, fifteenth and twentieth which can diminishes the transfer issue of muck and upgrade the properties of cement.
MATERIALS AND MIXTURE PROPORTIONS Portland Pozzolanic Cement, paper pulp, fine and coarse aggregates The cement employed in all mixtures was forty three grade Portland Pozzolanic cement (PPC), that corresponds IS 1489 (Part 1)-1991 [13]. The coarse aggregates used were crushed stone passing through twenty millimeter and holding on 12.5 millimeter IS sieve, with a selected gravity of 2.67. The crushed stone was accustomed guarantee smart mechanical performance so any variations within the mechanical properties of mixtures containing residuals and reference mixtures can be simply detected. The fine combination (river sand) had a selected gravity of 2.61 [14]. The concrete combine was designed for M-20 (1 : 1.43 : 3.18) with w/c magnitude relation of 0.5 and M-30 (1:1.22:2.85) with w/c magnitude relation of 0.45 [15]. All the stipulated ranges concerning the concrete materials and strengths are given in IS 456-200 [16].
Characterization of waste paper pulp The paper pulp utilised during this study was collected from Kagzi industries , tonk road , that's then dried in sun light-weight and powdery. Compound investigation of the paper mash has been finished by utilizing Energy Dispersive X-beam visible radiation spectroscope. Proximate and extreme investigation of paper mash has been done utilizing measuring methods. X-ray diffraction style has been recorded on a model XRD-Philips Expert professional with a sweep rate of 2o/min. XRD pattern are recorded within the 2θ vary of 5o-100o. Paper pulp in the main contains Si (60%) and Ca (14%) depiction the XRF scan knowledge. Table one offers the proximate analysis, associated Table two presents an final analysis. in keeping with the TG curves of paper pulp
E

International Journal of Advance and Innovative Research Volume 6, Issue 2 (XXX): April – June, 2019
175
ISSN 2394 - 7780
samples haven't been thermally pre-treated and therefore the mass loss of forty five happens between 290 and 3000C. This curve reveals the looks of 3 distinct mass loss regions.
Table-1: Proximate Analysis of Paper Pulp Sr. No. Wt. in grams Moist % Ash % Volatile Materials % Free Carbon % GCV Kcal/kg
1 421 5.6 41.6 43.7 8.6 2373
Table-2: Ultimate Analysis of Paper Pulp Sr. No. Wt. in grams C % H % N % S % O %
1. 421 21.7 2.8 0.6 0.8 24.6
At the second mass loss, the fabric gets thermally degraded and gets mold. Thus, the bricks fabricated from paper pulp will stand up to the most of 300oC. The samples gift amorphous patterns supported little reflection angles and 2θ peak between twenty five to thirty. the thought of materials has not modified even when varied degrees of enlargement of concrete in paper mash (5-20%wt). SEM footage (fig:1) for paper mash plainly show the closeness of spasmodic pores and sinewy nature. Sinewy nature provides exceptionally high vitality fascinating capability and consequently the high compressive quality.
Figure: SEM footage
Mixture proportions The mixture proportions and recent properties of the concrete mixtures made within the laboratory. A complete often concrete mixtures were made. The forms of blends delivered, that were the halfway substitution of mass of Portland bond with paper mash in cement extending from fifth to twenty. Portland Pozzolanic concrete, fine total (sand), and coarse total provided by the varsity were used during this exploration.
The bond and the totals met the prerequisites of IS 1489 (Part 1) 1991and IS 383-1970, individually.
Experimental program and test procedures
A. Test on fresh concrete The uniformity and practicality of all the solid blends was resolved through collapse tests. The collapse tests were performed by IS 1199-1959 [17]. The perpendicular separation between the primary and displaced places of the focus of the highest surface of the solid was calculable and careful because the slump.
B. Tests on hardened concrete Compressive Strength Concrete specimens with and without sludge are prepared and cured for 28 days in water then tested for compressive strength. The sludge based concrete specimens are prepared for five replacements and tested at the age of 14 and 28 days.
Split Tensile Strength The cylindrical Specimens of size 150x300mm are prepared and tested for splitting tensile strength on conventional and sludge based concrete. The sludge based concrete specimens are prepared for three replacements and they also tested for the split tensile strength at an age of 28 days after casting are shown in graph.
Flexural Strength of concrete Flexural strength tests were conducted on 100*100*500 specimens with and without sludge replacements and compared The 28 days flexural strength results are plotted in graph. The trial results acquired are firmly watched and observed well, in order to look at the quality parameters of muck based concrete and traditional cement. On contrasting the quality viewpoints, the muck based solid examples are superior to anything the customary Portland bond concrete.

International Journal of Advance and Innovative Research Volume 6, Issue 2 (XXX): April – June, 2019
176
ISSN 2394 - 7780
RESULTS AND DISCUSSION A. Fresh concrete The slump check results are presented in Table 3. The slump diminished once a higher live of paper mash content was incorporated. The as-received pulp exhibited a high water-absorption capability. Consequently, once a higher amount of paper pulp was capsulated at intervals the mixture, it required extra water to realize a given slump. The workability of concrete containing paper-mill residual was improved by the addition of excessive water instead of admixtures as we've need to attain economy. Some parts may prompt antagonistic impacts on the utility of paper mash concrete. The live of paper mash substitution, paper mash physical properties, and also the carbon substance of the paper mash would be the principle functions behind the decrease of solid practicality. The decrease in water request will increase with associate growth within the paper mash substance to concerning twentieth. B. Hardened concrete The compressive strength, cacophonic strength and flexural strength take a look at results are given in Table four. The compressive strength tests were applied at fourteen, and twenty eight days. The compressive strength development of paper-mill residual concrete mixtures was terribly like the reference mixtures, showing a high early strength gain. The compressive, cacophonic tensile and flexural strength of concrete mixtures with paper pulp were but reference mixtures. The outcomes incontestable that the compressive, half elastic and flexural quality were diminished once higher paper mash substance were incorporated into the solid blends. The compressive strengths of all ten mixtures at fourteen and twenty eight days, severally. The compressive quality of the blends diminished once the paper mash content was enlarged. The paper mash content within the solid blends assumed a rare job in the mechanical properties. However, the consequences of paper pulp on the mechanical properties of the concrete failed to vary a lot of from the findings of previous researchers. Various past investigations have in addition appeared, at any rate, the displacement of Portland bond with paper mash in cement on a one-for-one premise, either by volume or by weight, ends up in lower compressive and flexural quality up to around three months of restoring, with the advance of a lot of noteworthy qualities at and past a 0.5 year. Results like the 28-days compressive strength take a look at were conjointly found within the 28-days cacophonic strength test and flexural strength tests given in Fig. half-dozen and seven severally. The half pliable and flexural quality diminished once the paper mash content was enlarged within the blends. Fig. shows relation between compressive strength and cacophonic strength of M-20 and M-30 combine severally.
Mix Paper Pulp % w/c ratio Slump (mm) M-20 0 0.5 70
5 0.5 72 10 0.5 59 15 0.5 51 20 0.5 43
M-30 0 0.5 51 5 0.5 53 10 0.5 46 15 0.5 36 20 0.5 31
Table-3: Slump results
Mix Paper Pulp % Cube compressive strength (N/mm2) 28-days strength (N/mm2) 14 Days 28 Days Splitting Flexural
M-20 0 21.04 30.63 2.74 12.30 5 24.62 32.93 2.90 14.17 10 22.53 31.33 2.76 12.75 15 17.85 24.43 2.33 10.75 20 15.72 20.62 2.20 9.19
M-30 0 23.37 39.70 3.4 14.71 5 25.85 41.37 3.70 15.78 10 24.63 40.86 3.60 14.92 15 21.77 39.41 3.20 12.51 20 18.91 33.87 2.80 10.24
Table-4: Strength test result

International Journal of Advance and Innovative Research Volume 6, Issue 2 (XXX): April – June, 2019
177
ISSN 2394 - 7780
CONCLUSION Based on the results conferred higher than, the subsequent conclusions may be drawn 1. The slump enlarged up to five substitution of bond, higher than fifth the slump diminished because the paper
mash content within the solid blends was enlarged.
2. For the foremost half, the compressive, half elastic and flexural quality enlarged up to tenth growth of paper mash and any expanded in waste paper mash lessens the qualities bit by bit.
3. The foremost acceptable mix extent is that the five to tenth substitution of paper mash to bond.
4. There was Associate in Nursing growth in water assimilation of the solid blends because the substance of the paper mash enlarged. This marvel is traditional since a lot oflive of paper mash in term of quantity can embrace within the association procedure. during this manner, additional live of water was needed for bond association that is that the basic account this kind of issue. In any case, higher water content abatements the standard of cement.
5. Utilization of paper mash in cement will spare the mash and paper business transfer expenses and manufacture a 'greener' concrete for development.
REFERENCES [1] R. Srinivasan, K. Sathiya, and M. Palanisamy, Experimental investigation in developing low cost
concrete from paper industry waste, The Bulletin of the Polytechnic Institute of Jassy, Construction. Architecture Section (Romania), 2010.
[2] R.S. Gallardo, Mary Ann Q Adajar, Structural performance of concrete with paper sludge as fine aggregates partial replacement enhanced with admixtures, Symposium on Infrastructure Development and the Environment, University of the Philippines, December 2006.
[3] T.R. Naik, T. Friberg, and Y. Chun, Use of pulp and paper mill residual solids in production of cellucrete, College of Engineering and Applied Science, University of Wisconsin, USA-11 December 2003.
[4] T.R. Naik, Concrete with paper industry fibrous residuals: mixture proportioning, ACI Materials Journal, 102 (4), July 2005, 237-243.
[5] Y. Chun, T.R. Naik, and R.N. Kraus, Durable concrete through use of pulp and paper mill residuals, composites in construction 2005 – third international conference, Hamelin et al (eds) c 2005 ISBN, Lyon, France, July 11 – 13, 2005.
[6] V. Mymrin, A.M.C. Ferreira, J.E. Gardolinski, B. Guimaraes, and M.L.L.R. Okimoto, Paper production sludge application for producing of new construction materials, 11th International Conference on Non-conventional Materials and Technologies, 6-9 September 2009, Bath, UK.
[7] B.S. Mohammed, O.C. Fang, Mechanical and durability properties of concretes containing papermill residuals and fly ash, Construction and Building Materials, 25, 2011, 717–725 .
[8] I. Vegas, J. Urreta, M. Frias, and R. Garcia, Freezethaw resistance of blended cement containing calcined paper sludge, Construction and Building Materials, 23(8), August 2009.
[9] R. Gracia, R. Vigil de la Villa, I. Vegas, M. Frias, and M.I. Sanchez de Rojas, The pozzolanic properties of paper sludge waste, Construction and Building Materials, 22(7), July 2008.
[10] T.R. Naik, Y. Chun, R.N. Kraus, Concrete containing pulp and paper mill residuals, Report No. CBU-2003-42.1, UWM Center for By- Products Utilization, Department of Civil Engineering and Mechanics, The University of Wisconsin-Milwaukee; 2003.
[11] T.R. Naik, Y. Chun, and R.N. Kraus, Paper industry fibrous residuals in concrete and CLSM, Report No. CBU-2005-10, UWM Center for By-Products Utilization, Department of Civil Engineering and Mechanics, The University of Wisconsin- Milwaukee; November 2005.
[12] T.R. Naik, Y. Chun, and R.N. Kraus, Use of residual solids from pulp and paper mills for enhancing strength and durability of ready-mixed concrete, final report submitted to the US Dept. of Energy for the Project DE-FC07-00ID13867.
[13] Portland - Pozzolana Cement Specification. IS 1489(Part 1)-1991, Bureau of Indian Standards, New Delhi.

International Journal of Advance and Innovative Research Volume 6, Issue 2 (XXX): April – June, 2019
178
ISSN 2394 - 7780
[14] Specification for Coarse and Fine Aggregates from Natural Sources for Concrete. IS 383-1970 Bureau of Indian Standards, New Delhi.
[15] Recommended Guidelines for Concrete Mix Design. IS 10262-1982, Bureau of Indian Standards, New Delhi.
[16] Code of Practice for Plain and Reinforced Concrete. IS 456-2000, Bureau of Indian Standards, New Delhi.
[17] Methods of Sampling and Analysis of Concrete. IS1199-1959, Bureau of Indian Standards, New Delhi
[18] Methods of Tests for Strength of Concrete. IS 516-1959, Bureau of Indian Standards, New Delhi
[19] Method of Test for Splitting Tensile Strength of Concrete. IS 5816-1999, Bureau of Indian Standards, New Delhi.

International Journal of Advance and Innovative Research Volume 6, Issue 2 (XXX): April – June, 2019
179
ISSN 2394 - 7780
USE OF WASTE GLASS IN CONCRETE
Narendra Kr. Bhadhana, Subham Parmar, Suneel Kumar Sharma and Siddharth Jeph
Department of Civil Engineering, Poornima Institute of Engineering & Technology, Jaipur
ABSTRACT GLASS is most widely used in the world. Many tons of waste glass daily derived from post-consumer. Glass is different type of manufactured products like is bottle, glassware, sheet glass vacuum tubing. It is very affect full result for the environment and also dispose in the land. We know that large amount of waste glass is disposed in landfills and this process is decrease fertility of land. In this paper the issue of environmental and strength of concrete solving by the problem of waste glass because they are directly affected to human being and to decrees the construction cost and to increase strength and workability of concrete
Keyword: glass powder, concrete; fine aggregate, compressive strength, workability
I. INTRODUCTION Glass is a transfer ant material formed by melting of such types of material like as soda ash silica and caco3 at high temperature followed by cooling where solidification occurs without crystallization .glass is widely used materials in the world and after the used some amount of glass is waste and these are not used recycling process and not to be dump and land because to decrease the fertility of the land.
The concrete demanding increase day by day mainly concrete in part of Use River sand and coarse aggregate and cement. When we are used of waste glass as replaced by fine aggregate as advantageous these are the decreasing cost of construction and increase and strength and workability and durability in concrete.[2] We are used powder form of waste glass in concrete
In this paper we are replaced fine aggregate of the percentage of waste glass 0%, 5%, 10%, 15%, 20% by weight and these proportion are used to formation of specimen of concrete. These specimen are performed different test like as compress strength test, slump test, water observed test, flow test splitting tensile strength test compaction factor test etc. [1] In this research summarized the behave of concrete involving the replacement of powder form fine aggregate by waste glass 0% ,5%, 10% ,15%, 20% by weight. This research are help to reduces the waste glass problem and enhance of properties of concrete.
II. MATERIAL USED Cement - cement are used OPC43 (ordinary Portland cement)
Sand & Glass - sand is a fine material to acquire from the river base. This paper is used powder form of glass in the 0%, 5%, 10%, and 15% by weight of natural sand.
Aggregate – Different types of glass of various sizes and colors were used instead of the 5-10mm normal aggregate (NA) in traditional concrete control mixer. [4]
FIGURE-1: GLASS POWDER

International Journal of Advance and Innovative Research Volume 6, Issue 2 (XXX): April – June, 2019
180
ISSN 2394 - 7780
FIGURE-2: GLASS WASTE
III. METHODOLOGY • Firstly we will change of waste glass in powder form for the replace fine aggregate in concrete.[3]
• In This mixtures waste glass powder we are used to replace of cement and sand at percentage 0% , 5% , 10% , 15% ,.
• And formation of mould and performed different tests 7 days , 14 days and 28 days
FIGURE-3: FLOW CHART
IV. RESULT AND DISCUSSION
TABLE-4: COMPRESSIVE STRENGTH TEST RESULTS REPLACEMENT BY SAND % of Glass Powder COMPRESSIVE STRENGTH
At 7 days (MPa) At 28 days (MPa)
0 % 15.5 23 16 23
10% 19.5 25 18.5 25.5
15% 21 26.5 20.5 26
20% 19 24 18.5 24.5

International Journal of Advance and Innovative Research Volume 6, Issue 2 (XXX): April – June, 2019
181
ISSN 2394 - 7780
TABLE-5: COMPRESSIVE STRENGTH TEST RESULTS REPLACEMENT BY CEMENT % of glass powder COMPRESSIVE STRENGTH
At 7 days (MPa) At 28 days (MPa)
0 % 16 23 15.5 23
10% 14 20 13.5 20.5
15% 13 19 12.5 18.5
FIGURE-4: COMPARATIVE RESULTS AT 7 DAYS WITH WGP REPLACEMENT BY CEMENT
FIGURE-5: COMPARATIVE RESULTS AT 28 DAYS WITH WGP REPLACEMENT BY CEMENT
FIGURE-6: COMPARATIVE RESULTS AT 7 DAYS WITH WGP REPLACEMENT BY SAND

International Journal of Advance and Innovative Research Volume 6, Issue 2 (XXX): April – June, 2019
182
ISSN 2394 - 7780
FIGURE-7: COMPARATIVE RESULTS AT 28 DAYS WITH WGP REPLACEMENT BY SAND
V. CONCLUSION This paper presents the effective utilisation of glass aggregates in a range of architectural concretes and their properties tests. The various properties are tested include workability, air content, density, compressive strength, tensile strength, and water absorption and the percentage of Waste glass increase to decrease water absorption. It is also increasing workability, durability and strength.
REFERENCE [1] Sheikh et al. Int. Journal of Engineering Research ISSN: 2248-9622, Vol. 5, Issue 12, (Part - 4)
December 2015, pp.01-04
[2] IOSR Journal of Engineering (IOSRJEN) e-ISSN: 2250-3021, p-ISSN: 2278-8719 Vol. 3, Issue 7 (July. 2013), ||V6 || PP 08-13
[3] Pappu, et al, “Solid Waste Generation in India and Their Recycling Potential in Building Materials”, Regional Research Institute (CSIR) and IIT Bombay, India.
[4] Turgut et al., “Research into Concrete Blocks with Waste Glass”, International Journal of Civil and Environmental Engineering 1:4 2009.

International Journal of Advance and Innovative Research Volume 6, Issue 2 (XXX): April – June, 2019
183
ISSN 2394 - 7780
ANALYSING HIGH RISE BUILDING FRAME WITH DIFFERENT BRACINGS AND COMPARING DEFLECTION
Khushboo Agarwal1, Baldev Kumawat2, Javed Ul Islam3 and Ishfaq Ul Abass4 Student1 and Assistant Professor3,4, Department of Civil Engineering, VIT, Jaipur
2CAD Engineer, CADD Centre, Jaipur
ABSTRACT In a developing country like India, the affection towards high rise buildings is kept increasing as most of the available land is consumed in construction as well as for cultivation .So due to scarcity of space high rise buildings are more likely to be constructed. As nearly 60% of area is earthquake prone it is important to consider earthquake forces while constructing a high rise structure in order to increase its stability and resistance to such strong forces. Hence to make a high rise building more stable some structural members are constructed along with beams and columns. Shear walls and bracings are some structural elements which provide resistance to such lateral forces. In this paper we have analysed high rise building frame in ZONE-V with different bracings and concluded which one is the best to reduce deflection and increase the stability. All the analysis is done in STAAD pro software and results are noted.
Keyword: bracing, STAAD pro, sway, seismic loads, lateral loads
I. INTRODUCTION A high rise building is necessity of current situation of our country as there is scarcity of land for construction of new structures and also increasing. Generally a building having more than four floors or height more than 15 metres is considered as high-rise building. Nowadays high rise buildings are constructed for the purpose of stiffness and lateral load resistance. When a tall building is exposed to horizontal or torsional deflections under the action of unstable earthquake loads, the resulting oscillatory movement can cause a great discomfort to the occupants. The important concern in the design of multi-storeyed steel building is to have good lateral load resisting system along with gravity load system because it also affects the design of a structure. As the height of the building increases lateral movement of the building also increases, which means building may sway or deflect. To reduce the sway the alternative used is ‘bracing’. Bracings are diagonal structural members commonly of steel which carry the lateral forces due to earthquake or wind loads and minimize the total lateral displacement or sway of the structure hence securing the structure from settlement under heavy seismic loads.
A. What are bracings? Bracings are structural members generally used in structures imposed to lateral loads such as wind and seismic loads. These members are commonly made of structural steel, which can work efficiently both in tension and compression. The beams and columns form the frames which generally carry vertical loads in the structure while the bracings carry the lateral loads in a structure. They can be placed either externally or internally.
B. Types of Bracing: There are two type of bracing systems
1) Concentric Bracing System- It contains diagonal braces placed in the plane of building frame and both ends of bracing join at the end points of other frame member to form a truss like structure hence making a stiff frame.
2) Eccentric Bracing System- It contains diagonal braces placed in the plane of building frame where one or both ends of the bracing do not join at the end points of other frame members.
Fig-1: Example of bracings scheme of concentrically braced frame: (a) X braced; (b) diagonally braced; (c) V
braced and (d) K-braced

International Journal of Advance and Innovative Research Volume 6, Issue 2 (XXX): April – June, 2019
184
ISSN 2394 - 7780
II. LITERATURE REVIEW 1) Kumar et.al. (2017) studied on steel braced RC frame having different arrangements. He concluded that
steel bracings are the most used and efficient elements for resisting the horizontal forces like seismic and wind. He chooses the seismic coefficient method to approximate the planning of braces in the building frame. In this paper he analysed the seismic performance of the structure of a G+15 storey building having X bracing placed on different position of building.
2) Patel et.al (2017) epitomized different RCC bracing system under seismic performance of high rise building. Analysed the G+10 storey building with different types of bracing system .Bracing are delivered on boundary of the column. This frame model has analysed as per IS 1893:2000 using STAAD PRO software. This paper has shown that X braced model gives the higher value of base shear as equated with the V and moment resisting frame. It is observed that the X bracing system model condensed the maximum displacement whereas the displacement causes in structure without bracing is extreme.
3) Rajc et.al (2016) done a study on seismic performance on hybrid structure subjected to seismic load. In this paper steel braced frame is used to resist the seismic loads in multi-storey buildings. Building is examined for seismic zone as per IS 1893-2002. He analysed the six, twelve and eighteen storey building with bracing, without bracing and X type bracing for earthquake zone V. The results are compared with various type of bracing. It is observed that minimum displacement is produced in case of X bracing system then diagonal one. He concludes that the bracing in frame raises the general rigidness of the structure.
4) Biradar et.al. (2016) presented the seismic performance of the structure with different bracing system to resist lateral load. Bracing system got the structural importance inreinforced concrete building. He concluded that X bracing has shown the good performance in both x and y direction. The effect of different bracing system delivered in the building, the storey drift and lateral sway get minimized resulting into a safe and rigid structure.
5) Siddiqi et. al (2014) offered the comparison of different bracing system for tall buildings. In this paper he studied the sixty storey regular shaped building for wind and gravity load combination along both major and minor axes. Bracing is efficient method of resisting lateral forces in the exterior structure. He investigated the five different types diagonal, double diagonal, k storey height knee and V bracing system used in tall building
6) to offer the lateral toughness and lesser lateral shift. Analysed the building with five different bracing at different bays level, equated the different bracing beside minor and major axis. He concluded that lowest dislocation obtained in case of K bracing system and when column are braced along major axis adjacent displacement values go beyond limit. But in case of double bracing system it enhances the adjacent rigidity of structure.
III. METHODOLOGY The aim of the study is to analyse different braced structures. The analysis is carried out by using STAAD pro V8i software. Different type of bracings are provided to the same structure and analysed under seismic loads. The comparison is done between building frame without bracing, with X bracing, with diagonal bracing, with V bracing and with K bracing.
We have considered a G+9 storey high rise building frame having plan dimension 25m*14m in ZONE-V. Height of each floor is 3.5m. There are 5 bays of 5m each in x direction and 3 bays of 5m, 4m, 5m respectively in y direction. The four outer corner columns are square columns of size 0.45m*0.45m and all the other columns are rectangular columns of size 0.5m*0.3m each. Size of beams is taken as 0.45m*0.3m.
Type of soil is considered medium soil and steel is taken as per ISHB225H.

International Journal of Advance and Innovative Research Volume 6, Issue 2 (XXX): April – June, 2019
185
ISSN 2394 - 7780
Fig-1: Plan
Fig-2: Front view and 3D view of frame without bracing
Fig-3: Front view and 3D view of frame with X bracing
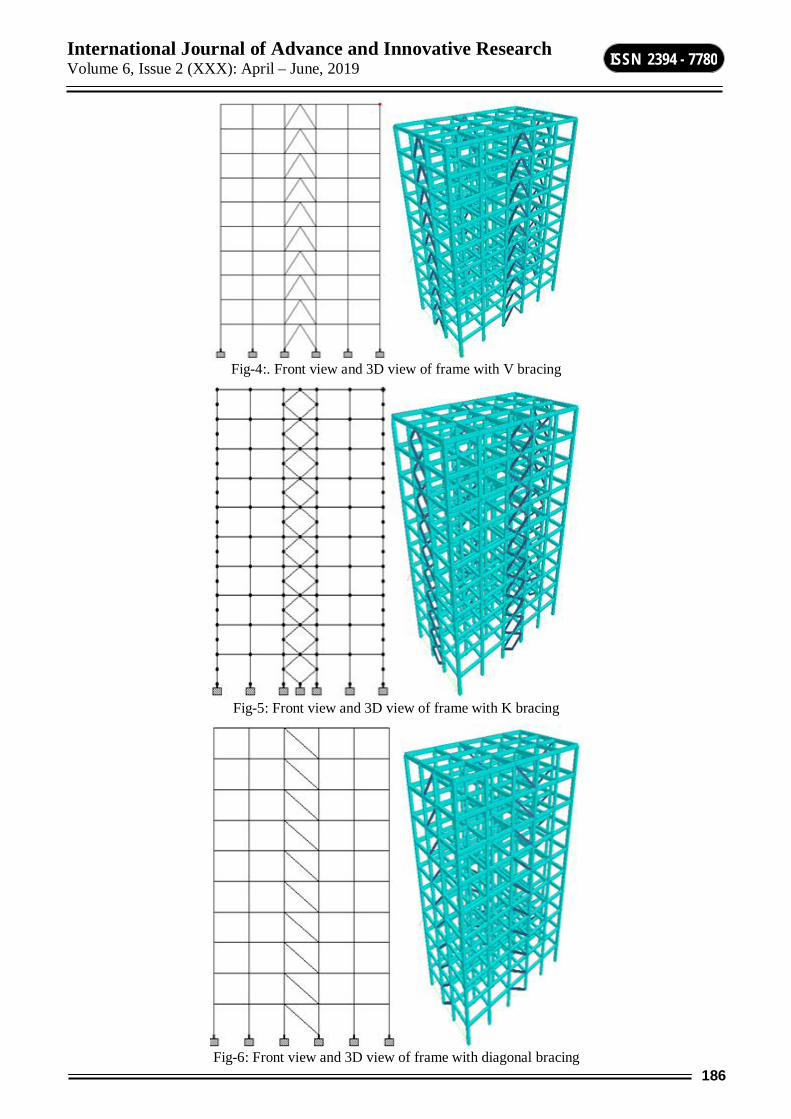
International Journal of Advance and Innovative Research Volume 6, Issue 2 (XXX): April – June, 2019
186
ISSN 2394 - 7780
Fig-4:. Front view and 3D view of frame with V bracing
Fig-5: Front view and 3D view of frame with K bracing
Fig-6: Front view and 3D view of frame with diagonal bracing

International Journal of Advance and Innovative Research Volume 6, Issue 2 (XXX): April – June, 2019
187
ISSN 2394 - 7780
IV. RESULT The following results have been taken out for deflections with different bracings under load combination {(DL+LL+SL) ×1.2} in X, Y, and Z directions and the resultant is shown. The building frame without bracing is more prone to get deflected very largely while in cases where bracings are provided deflection is reduced. The result is shown in tabular form below.
TABLE-I: DEFLECTION COMPARISION DUE TO DIFFERENT BRACINGS
V. CONCLUSION Steel bracing system is an effective lateral load resisting system. It is detected that using braced RC frame as the lateral load resistance system for reinforced concrete structure is a productive and more effective method. Structure with different types of bracing system minimize the storey movement and shift of the structure .Out of various arrangements of bracings X bracing system are most efficient in improving lateral load bearing capacity of structure. Bracing system lessen bending moment and shear force subjected to the column .Steel bracing handover the lateral load axially to the ground. The performance of the steel cross bracing is found more prolific than other bracing system.
REFERENCES 1) Shachindra Kumar Chadhar and Dr. Abhay Sharma “Seismic Behaviour of RC BuildingFrame with Steel
Bracing System using various Arrangements” International Research Journal ofEngineering and Technology Vol.02 ,Issue 5, Aug-2015 , ISSN 2395-0056.
2) Surrender Kumar,Hakam Singh and R.S Bharj “A Seismic study of Steel Braced RC Frame with different Arrangements” International Journal of Research in Management ,Science &Technology ,Vol.5,No.1,Pages 1-6,April 2017,ISSN 2321-3264
3) Jagadish J. S, Tejas D. Joshi, “A Study On Bracing Systems on High Rise Steel Structures” International Journal of Engineering Research & Technology (IJERT), ISSN: 2278-018, Vol. 2 Issue 7, July – 2013.
4) IS 456: 2000 Simple And Reinforced Concrete -Code Of Practice, Bureau of Indian Standards, New Delhi.
5) ARE 1893: 2002 (Part 1) Criteria for Earthquake Resistant Design of Structures, Part 1 General Provisions and Buildings, Bureau of Indian Standards, New Delhi?
6) IS 875 (Part 2 Imposed Loads) -1987 Code of Practice for Design Loads (Other than Earthquake) For Buildings and Structures, Bureau of Indian Standards, New Delhi.
7) IS 875 (Part 3 Wind Load) -1987 Code of Practice for Design Loads (Other than Earthquake) For Buildings and Structures, Bureau of Indian Standards, New Delhi.
8) ARE 1893: 2002 (Part 1) Criteria for Earthquake Resistant Design of Structures, Part 1 General Provisions and Buildings, Bureau of Indian Standards, New Delhi.
TYPE OF STRUCTURE X (MM)
Y (MM)
Z (MM)
RESULTANT (MM)
WITHOUT BRACING 150.049 -11.042 0.098 150.445
WITH X BRACING 85.010 -10.232 0.071 85.623
WITH V BRACING 83.447 -10.356 0.078 84.087
WITH K BRACING 85.361 -10.509 0.089 86.005
WITH DIAGONAL BRACING 90.302 -10.360 6.601 91.134

International Journal of Advance and Innovative Research Volume 6, Issue 2 (XXX): April – June, 2019
188
ISSN 2394 - 7780
CHARACTERIZATION OF SEWAGE & DESIGN OF SEWAGE TREATMENT PLANT
Laxmi Kant Saini1, Avinash Agrawal2, Apoorva Jain3 and Ankur Goyal4 Assistant Professor1 and Students2,3,4, Poornima Institute of Engineering and Technology, Jaipur
ABSTRACT With expanding populace the need of basic things has additionally expanded so different crude materials are required in this manner diverse enterprises are being setup. RIICO is one of the biggest modern zone in Jaipur. It the biggest Export-Park in Northern India. In our task wastewater was gathered from different drains of Sitapura and the example water was described for their contamination trademark. The examined outcome demonstrates that the wastewater has high contamination possibilities thus should be treated before released to the earth. The samplings of the sewage squander have been done in various occasions of the day to have a normal information of the deliberate parameters. The normal estimations of pH, Turbidity, Acidity, Chloride, Residual Chlorine, Hardness, Total Solid, BOD, DO, Alkalinity. A sewage treatment plant has been planned with the treatment units, a bar screen, an air circulation tank and an accumulation pit. This study will help in deciding the degree and kind of treatment required to be given to given sewage, and in this manner dodge the contamination of the wellspring of its transfer.
Keywords: Total Solid, Biological Oxygen Demand, Chemical Oxygen Demand, Dissolve Solid, Sitapura, Jaipur
INTRODUCTION India's condition is getting to be delicate and ecological contamination is one of the unfortunate side impacts of industrialization, urbanization, populace development and oblivious disposition towards nature. At present, ecological assurance is the principle need of the general public. In spite of the fact that industrialization and improvement in horticulture are important to meet the fundamental prerequisite of individuals, in the meantime it is important to save nature. In India, as well, the ecological contamination has turned into a reason for worry at different dimensions [1].In India, because of absence of sewage treatment plants, by and large untreated sewage effluents are discharged either on horticultural land for water system or discarded in close-by water bodies2.As a rule, sewage effluents from businesses and metropolitan root contain considerable measures of plants supplements and variable measure of metallic cations 3 like Zn, Cu, Fe, Mn, Pb, Ni, Cd, and so on.Long haul water system with such effluents builds EC, natural carbon content Thus, it ends up important to consider the organization of sewage waters and overwhelming metals aggregation, with the assistance of development strategies. Accordingly, considers have been done in Sitapura modern territories of Jaipur in the province of Rajasthan (India) under the Environmental Engineering lab.
Enterprises are real wellsprings of contamination around there.In view of the sort of industry, different dimensions of contaminations can be released into nature straightforwardly or in a roundabout way through open sewer lines. [2]. The objectives of our venture is to describe the waste water flowing around the Sitapura territory of Jaipur in the post rainstorm season to lessen contamination inputs, especially toxicants, to reestablish characteristic profitability and to advance maintainable improvement of the encompassing just as direct the nature of the emanating acknowledged into the earth. [3] These rule archives are complete, specifying the testing strategies, QA/QC necessities, parameters to be estimated for the diverse kinds of industry and the expository strategies to be utilized. .
OBJECTIVE To gather wastewater tests from four unique locales utilizing inspecting strategies.
To perform physical and concoction examinations on the examples and gauge contaminant loadings.
To consolidate standard parameters into the translation of the information produced from this undertaking.
To give a logical and interpretative give an account of the venture results and prescribe the future waste water treatment to improve the current conditions.
STUDY AREA Jaipur has geographical area of 11,061.44 sq. km of the Rajasthan State. Jaipur is the capital of the state known as Pink city. District is blessed by wide spectrum of landscapes including hillocks, pediments, undulating fluvial plains, aeolian dune fields, ravines, palaeo channels etc. It is undergoing rapid urbanization and industrialization during last two decades. Such areas include Vishwakarma, Sudershanpura , Bais Godown, Jhotwara, Malviya, Sanganer, Sitapura industrial areas, etc., which play a major role in polluting different water resources. EPIP-
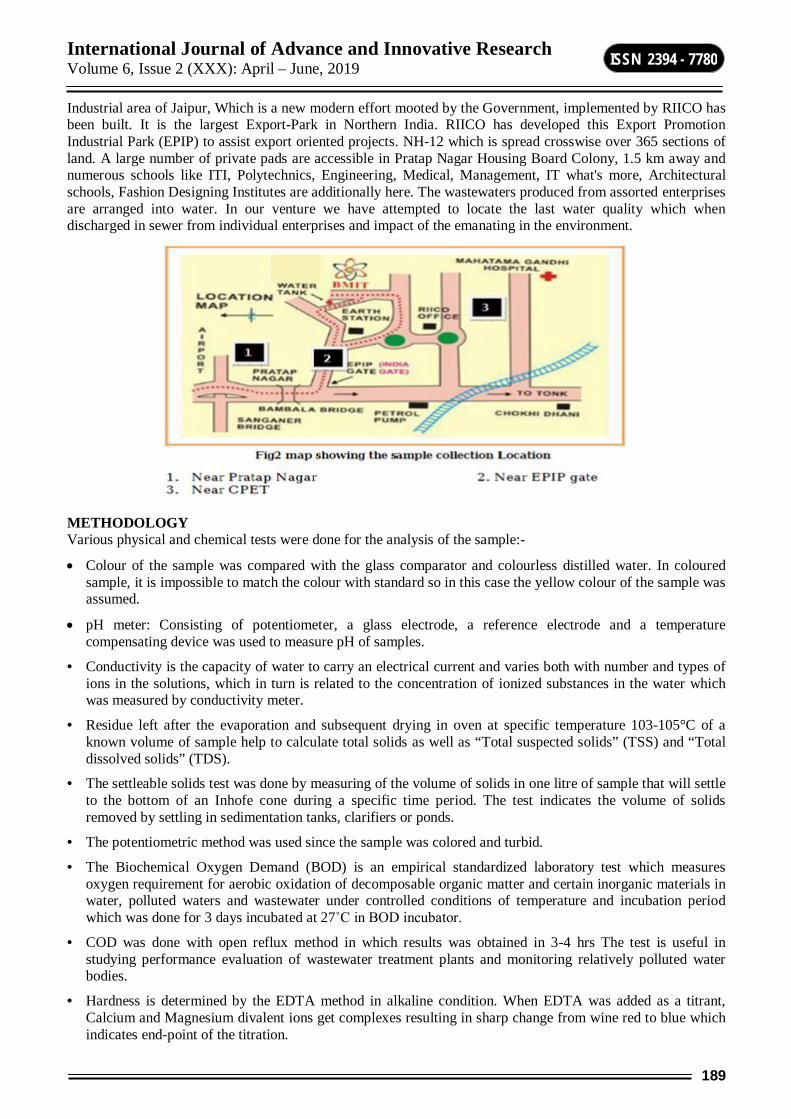
International Journal of Advance and Innovative Research Volume 6, Issue 2 (XXX): April – June, 2019
189
ISSN 2394 - 7780
Industrial area of Jaipur, Which is a new modern effort mooted by the Government, implemented by RIICO has been built. It is the largest Export-Park in Northern India. RIICO has developed this Export Promotion Industrial Park (EPIP) to assist export oriented projects. NH-12 which is spread crosswise over 365 sections of land. A large number of private pads are accessible in Pratap Nagar Housing Board Colony, 1.5 km away and numerous schools like ITI, Polytechnics, Engineering, Medical, Management, IT what's more, Architectural schools, Fashion Designing Institutes are additionally here. The wastewaters produced from assorted enterprises are arranged into water. In our venture we have attempted to locate the last water quality which when discharged in sewer from individual enterprises and impact of the emanating in the environment.
METHODOLOGY Various physical and chemical tests were done for the analysis of the sample:-
Colour of the sample was compared with the glass comparator and colourless distilled water. In coloured sample, it is impossible to match the colour with standard so in this case the yellow colour of the sample was assumed.
pH meter: Consisting of potentiometer, a glass electrode, a reference electrode and a temperature compensating device was used to measure pH of samples.
• Conductivity is the capacity of water to carry an electrical current and varies both with number and types of ions in the solutions, which in turn is related to the concentration of ionized substances in the water which was measured by conductivity meter.
• Residue left after the evaporation and subsequent drying in oven at specific temperature 103-105°C of a known volume of sample help to calculate total solids as well as “Total suspected solids” (TSS) and “Total dissolved solids” (TDS).
• The settleable solids test was done by measuring of the volume of solids in one litre of sample that will settle to the bottom of an Inhofe cone during a specific time period. The test indicates the volume of solids removed by settling in sedimentation tanks, clarifiers or ponds.
• The potentiometric method was used since the sample was colored and turbid.
• The Biochemical Oxygen Demand (BOD) is an empirical standardized laboratory test which measures oxygen requirement for aerobic oxidation of decomposable organic matter and certain inorganic materials in water, polluted waters and wastewater under controlled conditions of temperature and incubation period which was done for 3 days incubated at 27˚C in BOD incubator.
• COD was done with open reflux method in which results was obtained in 3-4 hrs The test is useful in studying performance evaluation of wastewater treatment plants and monitoring relatively polluted water bodies.
• Hardness is determined by the EDTA method in alkaline condition. When EDTA was added as a titrant, Calcium and Magnesium divalent ions get complexes resulting in sharp change from wine red to blue which indicates end-point of the titration.

International Journal of Advance and Innovative Research Volume 6, Issue 2 (XXX): April – June, 2019
190
ISSN 2394 - 7780
RESULT AND DISCUSSION
Design of Sewage Treatment Plant According to data, we have design the Sewage treatment Plant as per Is Code 2470-1986 shown below:
Total amount of waste water treated = 0.425 mld.
Dimension of the collection pit calculated to be 5 m in diameter and 6m depth of the cylindrical tank.
A bar screen of width 1.9 m is provided.
Dimension of the aeration tank 4.6 x 4.6 x 3.8 m3
Dimensions of Sludge Drying Bed are 4.6 m x 4.6 m x 1 m of two numbers.
CONCLUSION The sample gathering methods for portraying the profluent loadings indicated was observed to be viable in evaluating the loadings from different. On the off chance that the suspended solids are more prominent than 300 mg/L, the centralizations of parameters related with suspended solids ought to be resolved from the mean of snatch tests. Albeit a considerable lot of the deliberate parameters were not as much as discovery constrains, the rundown should in any case be utilized in the underlying portrayal. The parameter rundown can be changed in resulting portrayal estimation to bar parameters that were found close identification limits (multiple times the MDL). The testing program mus be site explicit and along these lines site visits before the inspecting program is as a vital part of the portrayal procedure. In the bioassay part of the portrayal, it was discovered that it didn't make a difference whether the intense and perpetual poisonous quality methods were completed on snatch or composite examples as the outcomes for the two sorts of tests were indistinguishable.

International Journal of Advance and Innovative Research Volume 6, Issue 2 (XXX): April – June, 2019
191
ISSN 2394 - 7780
REFERENCES 1. S. A. Paul, S. K. Chavan and S. D. Khambe , “Studies On Characterization Of Textile Industrial Waste
Water In Solapur City”, Int. J. Chem. Sci. 2012; 10(2): 635-642.
2. Ladwani Kiran D., Ladwani Krishna D., Manik Vivek S.and Ramteke Dilip S., “Impact of Industrial Effluent Discharge on Physico-Chemical Characteristics of Agricultural Soil”, International Research Journal of Environment Sciences. 2012; 1(3): 32-36.
3. Ram S. Lokhande1, Pravin U. Singare2,*, Deepali S. Pimple3, “ Study on Physico-Chemical Parameters of Waste Water Effluents from Taloja Industrial Area of Mumbai, India”, International Journal of Ecosystem. DOI: 10.5923/j.ije.20110101.01. 2011; 1(1): 1-9.
4. George S. Russell, “ Effect of Industrial wastes on sewerage system”, Sewage Works Journal. Published by Water environment Federation, 1929:1(2):242-245.
5. William Marcus Ingram and W. W. Towne, “Effects of industrial wastes on stream life” Proceedings of the fourteenth Industrial Waste Conference. 1959; 678-710. 6. Sharma S. K. Gupta Pankaj and Sharma Sanjay, Published one research paper on “The Biochemical Determination of High Fluoride Concentration in Potable Water, In Relation to Renal Failure” in The Global Journal of Pharmaceutical Research (TGJPR). 2012; 1(4):. 672-676.
6. Gupta Pankaj, Borauh Monalisa and Usmani Nisar Khan, Published one research paper on “A Specific Study of Drinking Water Status in Term of Essential Characteristics Present in Rural and Urban Area of Alwar District (Raj.) INDIA” in International Journal of research in pharmacy and science (IJRPS). 2012; 2(2): 123-129.

International Journal of Advance and Innovative Research Volume 6, Issue 2 (XXX): April – June, 2019
192
ISSN 2394 - 7780
“UTILIZATION OF WASTE PAPER IN SOIL”
Laxmi Kant Saini1, Naresh Suthar2, Mohit Inaniyan3 and Mohammed Naushad3 Assistant Professor1, Poornima Institute of Engineering and Technology, Jaipur
ABSTRACT Stabilizing of soil is to enhance the engineering properties of soil. Use of waste paper in civil engineering for improving soil properties is advantageous because they are cheap, locally available. The synthetic fiber reinforcement causes significant improvement in tensile strength, shear strength, and other engineering properties of the soil. Over the last decade the use of randomly distributed waste paper has recorded a tremendous increase. In this study the soil samples were prepared at its maximum dry density corresponding to its optimum moisture content in the CBR mould with and without reinforcement and to evaluate the effects of waste paper on shear strength of unsaturated cohesive soil by carrying out direct shear test, swelling index test and unconfined compression test. The percentage of synthetic fiber by dry weight of soil was taken as 5%, 10%, and 15%. The main objective of this study is to investigate optimum use of waste paper materials for stabilization of cohesive soil.
Keywords: Waste Paper, Cohesive Soil, Stabilization Technique
INTRODUCTION For any land-based structure, the establishment is imperative and must be solid to help the whole structure. All together for the establishment to be solid, the dirt around it assumes an extremely basic job. Along these lines, to work with soils, we need appropriate learning about their properties and components which influence their conduct. The procedure of soil adjustment accomplishes the required properties in dirt required for the development work. From the earliest starting point of development work, the need of improving soil properties has gone to the light. Old civic establishments of the Chinese, Romans and Incas used different strategies to improve soil quality and so on., a portion of these techniques were effective to the point that their structures streets still exist. In India, the advanced period of soil adjustment started in mid 1970‟s, with a general Shortage of oil and totals, it ended up essential for the specialists to see Means to improve soil other than supplanting the poor soil at the structure site. Soil Stabilization was utilized yet because of the utilization of out of date strategies and furthermore because of the nonappearance of appropriate strategy, soil adjustment lost support. As of late, with the expansion in the Demand for foundation, crude materials and fuel, soil adjustment has begun to take a New shape. With the accessibility of better research, materials and gear, it is developing as a well known and savvy strategy for soil improvement.
Soil adjustment is the way toward changing some dirt properties by various Methods, mechanical or synthetic so as to create an improved soil material which has all the ideal building properties. The properties of soil shift a lot at better places or in specific cases even at one spot; the achievement of soil adjustment relies upon soil testing .The principle point is the formation of a dirt material or System that will hold under the plan use Conditions and for the structured existence of the Engineering venture. Soils are commonly balanced out to build their Strength and solidness or to forestall Erosion And residue arrangement in soils.
PRINCIPLES OF SOIL STABILIZATION Evaluating the soil properties of the area under consideration.
Deciding the property of soil which needs to be altered to get the design value and Choose the effective and economical method for stabilization.
Designing the Stabilized soil mix sample and testing it in the lab for intended Stability and durability values.
2 Needs & Advantages Soil properties fluctuate a lot and development of structures depends a ton on the Bearing limit of the dirt, subsequently, we have to settle the dirt which makes it less demanding to Predict the heap bearing limit of the dirt and even improve the heap bearing limit. The degree of the dirt is likewise an essential property to remember while working With soils. The dirts might be all around evaluated which is alluring as it has less number of voids or Uniformly reviewed which however sounds stable yet has more voids. Along these lines, it is smarter to combine Different kinds of soils to improve the dirt quality properties. It is over the top expensive to supplant the mediocre soil entirely soil and hence, soil stabilization is the thing to look for in these case.

International Journal of Advance and Innovative Research Volume 6, Issue 2 (XXX): April – June, 2019
193
ISSN 2394 - 7780
OBJECTIVE OF PAPER • Determination of relationships between soil and waste paper .
• Improved soil quality.
• Economical design for rural area.
• Quantification of the economic value of soil.
• Describe the diversity of soil.
• Increased property values and avoided costs of soil works
It improves the strength of the soil, thus, increasing the soil bearing capacity.
It is more economical both in terms of cost and energy to increase the bearing Capacity of the soil rather than going for deep foundation or raft foundation.
It is also used to provide more stability to the soil in slopes or other such places.
Sometimes soil stabilization is also used to prevent soil erosion or formation of dust, which is very useful especially in dry and arid weather.
Stabilization is also done for soil water-proofing; this prevents water from entering into the soil and hence helps the soil from losing its strength.
It helps in reducing the soil volume change due to change in temperature or moisture content.
Stabilization improves the workability and the durability of the soil.
3 METHOLOGY In this paper various result were preserved by fully experimental study and analyze the properties of soil.
3.1 Pycnometer method Presence of water will affect the properties of soil due to this the power of soil demoralized so that effect of water content in the soil mass were study by Pycnometer method. This is a laboratory test to predict the specific gravity & water content.
3.2 Sieves analysis method We know that the well graded soil have more power as compared to poor, uniformly, graded soil.so that power of soil is depends on the gradation of soil. After the mixing of waste paper in soil mass it is very important to know the gradation of soil, so that by the sieve analysis we perceived the nature of soil.
3.3 CBR method California Bearing Ratio Test California Bearing Ratio test was developed by the California Division of Highway as a method of classifying and evaluating soil-sub grade and base course materials for flexible pavements. CBR test, an empirical test, has been used to determine the material properties for pavement design.
3.4 Direct Shear Strength The shear power of soils is plat the vital role for any kind of stability analysis. So that, it is necessary to predict the valuable values. The shear power of soil is perceived by direct shear teat. This paper to know the behavior the soil in direct shear tests after using the waste paper.
4. RESULT & DISCUSSION 4.1 Water Content Water content in soil mass observed by experimental study and know the behavior of soil mass.
Table No-1: Water Content of soil
S.No. Waste Paper % Water Content
1 0 1.3
2 5 1.9
3 10 2.2
4 15 2.4

International Journal of Advance and Innovative Research Volume 6, Issue 2 (XXX): April – June, 2019
194
ISSN 2394 - 7780
Fig. No-1: Water Content of soil
We conclude when the% of waste paper 0 to 15% are added in the soil mass the water content is also increased, its mean the water content is directly proportional to the % of waste paper.
4.2 Specific Gravity The specific gravity of soil is an Perceived weight-volume property that is well to classifying soils and in observing other weight-volume properties such void ratio, porosity, and unit weight etc.
Table No-2: Specific Gravity of Soil S.No. waste paper % Specific Gravity
1 0 2.1 2 5 2.8 3 10 3.1 4 15 3.6
Fig. No-2: Specific Gravity of Soil
2. Sieve Size Analysis
Table No. 3 Grain Size Distribution
Sieve size
% Retained 0%(WP)
% Retained 5%(WP)
% Retained 10%(WP)
% Retained 15%(WP)
4.75 0 0 0.2 0.4 2.36 1.02 2.04 2.65 3.26 1.18 6.53 8.16 9.18 10.61 0.6 2.24 3.67 6.5 11.02 0.3 32.24 32.85 36.53 35.71
0.15 34.08 28.36 30.4 24.89 0.75 20.2 15.3 6.5 7.14 Pan 3.6 9.59 7.95 6.93

International Journal of Advance and Innovative Research Volume 6, Issue 2 (XXX): April – June, 2019
195
ISSN 2394 - 7780
Fig No-3: Grain Size Distribution
We observed experimentally investigation after waste paper mixing the grain size of soil particle increased with increasing the % of waste paper.it means the soil have gained more power of load because the grained size distribution have well graded strata.
3. METHOD OF CBR METHOD The CBR test are more useful to predict the properties of soil mass.in our investigation on basis of experimentally we found that CBR Value are decreased with increasing paper waste.
Table No-4: CBR Value % Waste Paper CBR Value %
0 62.94 5 60.19
10 57.27 15 58.2
Fig. No. 4 CBR Value
In our paper we conclude that we conduct the CBR Test when we mix the paper waste the CBR Value decreased its means that CBR Value increased than soil Strength will be increased.
CONCLUSION In our physical & Experimental investigation we found that we mix the paper waste @0,5,10 &15% in soil the soil mass then the soil properties will enhanced . @0,5,10 &15% of paper waste the value of water content, specific gravity and CB R value is simultaneously increased.so we conclude that when we mix the waste paper improving the soilproperties.
REFERENCES 1. S. A. Naeini and S. M. Sadjadi,(2008) ,” Effect of Waste Polymer Materials on Shear Strength of
Unsaturated Clays”, EJGE Journal, Vol 13, Bund k,(1-12).
2. Mahmood R. Abdi, Ali Parsapajouh, and Mohammad A. Arjomand,(2008),” Effects of Random Fiber Inclusion on Consolidation, Hydraulic Conductivity, Swelling, Shrinkage Limit and Desiccation Cracking of Clays”, International Journal of Civil Engineering, Vol. 6, No. 4, (284-292).
3. Consolidation, N. C., Prietto, P. D. M. and Ulbrich, L. A. (1999). „„The behavior of a fiber reinforced cemented soil.‟‟Ground Improvement, London, 3(1), 21–30.

International Journal of Advance and Innovative Research Volume 6, Issue 2 (XXX): April – June, 2019
196
ISSN 2394 - 7780
PARAMETRIC STUDY AND ITS EFFECT ON DESIGN OF METRO VIADUCT FOUNDATION AND PIER
Vijaykumar D. Thombre1 and Dr. Punitha Kumar.A2 Student1 and Assistant Professor2, School of Civil Engineering, Vellore Institute of Technology, Vellore
ABSTRACT The construction of Metro is becoming a new trend for the development and modernization of city infrastructure. The elevated rail transit has been developed in some big city in India in recent year. Actually analysis and design process of Viaduct foundation and pier is fully depends on different parameters of viaduct, such as Span length, Elevation difference i.e. Rail top level and Ground level, Radius of curvature and length of fixity. For analysis we consider twelve cases and from that we get the different result of each case and we compared it. Here we consider different type of load which is acting on. For Live load analysis we use the STAAD Software and from that we take maximum governing loads. We form the Eighty load combination for Serviceability limit state (SLS) and Ultimate limit state (ULS) which is taken from different Rail slandered. From these cases we get maximum result for minimum radius of curvature with higher span and height. By using ADSEC Software, We can check Crack width, stress in material for SLS and Strength analysis i.e.
Moment ratio ( ) for ULS.
Keywords: Elevated rail transit system, Viaduct, Metro Bridge, Bridge Parameter, Bridge Foundation.
1. INTRODUCTION For the development of economic and society, the construction of fast rail transit system is becoming the new trends for the modernization and development of city infrastructure. Due to the excellent efficiency, environment friendly and aesthetic value the elevated transit has been Developed and Planned around 50 big cities in India. Transportation is „life line‟ of nation and it is proven many times that transport infrastructure has added speed and efficiency to a country progress and economic growth. Pune is one of the most important cities for the development of rail transportation. For Pune metro maximum preference is given to elevate Viaduct after that underground way.
The bridge of elevated viaduct portion consist of precast post-tensioned segmental box girder type superstructure with standard span of 34.00 m and main bridge type consist of simply supported bridge, continuous beam bridge, Cantilever bridge and Portal frame supported bridge. The pile and open type of foundation is used for elevated viaduct foundation. The component parts of elevated viaduct consist of substructure and superstructure. In substructure pier, pier cap, pile cap and piles are considered and in superstructure post tensioned segmental box girder is considered. The elastomeric bearing is considering for load transmission media from super-structure to substructure.
2. MATERIAL AND THEIR PROPERTIES Concrete: Reinforced cement concrete (RCC) as well as prestressed cement concrete (PSC) were used for viaduct construction as per IRS CBC-2014. The properties for different part of Viaduct
Grade of concrete for Pier and Pier cap is M60 and Modulus of elasticity for M60 grade concrete is 36000 N/mm2.
Grade of concrete for Pile and pile cap is M30 and Modulus of elasticity For M30 grade concrete is 19500 N/mm2.
Clear cover to pier is 50mm and for pile and pile cap is 75mm.
Steel: For Main reinforcement grade of steel is Fe 500 and For Stirrups grade of steel is Fe 415 and having Modulus of elasticity 2x10⁵ N/mm2.
3. PARAMETER FOR ANALYSIS For the analysis we consider the following parameter, Case-A) rail top level to ground level = 14m
Viaduct span is a) Left span = 34m b) Left span = 34m
Right span = 34m
Right span = 31m

International Journal of Advance and Innovative Research Volume 6, Issue 2 (XXX): April – June, 2019
197
ISSN 2394 - 7780
Radius of curvature for span is a) Straight span, b) 550 m and c) 150m Case-B) rail top level to ground level = 16m
Viaduct span is a) Left span = 34m b) Left span = 34m
Right span = 34m Right span = 31m
Radius of curvature for span is a) Straight span, b) 550 m and c) 150m
4. RESULT AND COMPARISION From analysis we get following result.
1. Moment at pier base and steel required in pier For different radius of curvature, span and height the moment at pier base is vary. The following graph shows that at lower radius with higher span and height the moment value at pier base is more and vice-versa.
Table 6.1 Moment at pier base
34m-34m span 34m-31m span
Radius of
curvature
Moment‟s at pier base (KN.m)
Moment‟s at pier base (KN.m)
14m 16m 14m 16m Straight 4.4 4.8 3.9 4.2 550m 8038 8742.7 7015.8 7619.5 150m 15031.8 15849.4 13344.8 14045.5
Figure-6.1: Moment at pier base
Table-6.2: Percentage steel in pier Parameter 14 m 16m
Span Radius of curvature % steel % steel
34m-34m Straight 0.84% 1.12% 550m 1.73% 2.58% 150m 2.58% 3.87%
34m-31m Straight 0.80% 0.90% 550m 1.42% 2.29% 150m 2.08% 3.30%

International Journal of Advance and Innovative Research Volume 6, Issue 2 (XXX): April – June, 2019
198
ISSN 2394 - 7780
1. Pile cap size Length of fixity is an important for design of foundation, so every design engineer must know the procedure of calculation of length of fixity. For comparison we consider different values of length of fixity. Following table gives the different size of pile cap for different pile cap size. For 14m RTL-GL
Table-6.3: Pile cap size for 14m RTL-GL Parameters Pile cap size
Span Radius of curvature (m) Lf = 2 m Lf = 4.2m Lf = 6m
34m – 34m
Straight 3.7m x 3.5m 4.0m x 3.8m 4.2m x 4.0m 550 4.8m x 4.6m 5.0m x 4.9m 5.3m x 5.0m 150 6.2m x 5.9m 6.4m x 6.0m 6.7m x 6.3m
34m – 31m
Straight 3.5m x 3.4m 3.8m x 3.5m 4.0m x 3.8m 550 4.5m x 4.2m 4.7m x 4.5m 5.0m x 4.7m 150 5.5m x 5.3m 5.8m x 5.6m 6.2m x 5.9m
Table-6.4: Pile cap size for 16m RTL-GL Parameters Pile cap size
Span Radius of curvature (m) Lf = 2 m Lf = 4.2m Lf = 6m
34m – 34m
Straight 4.3m x 4.1m 4.6m x 4.2m 4.8m x 4.5m 550 5.3m x 5.1m 5.5m x 5.4m 5.9m x 5.6m 150 6.6m x 6.3m 7.0m x 6.7m 7.2m x7.0m
34m – 31m
Straight 3.9m x3.5m 4.2m x 4.0m 4.5m x 4.2m 550 4.9m x4.8m 5.2m x 5.0m 5.3m x 5.1m 150 6.1m x 5.9m 6.4m x 6.2m 6.7m x 6.4m
2. Percentage steel in pile
Table-6.5: Percentage steel for 34m-34m span
Radius of curvature (m) 14m height 16m height
Lf = 2m Lf = 6m Lf= 8m Lf = 2m Lf = 6m Lf= 8m Straight 0.46% 0.64% 1.00% 0.52% 0.72% 1.12%
550 0.54% 0.72% 1.12% 0.68% 0.96% 1.28% 150 0.72% 0.96% 1.52% 0.84% 1.36% 1.76%
Figure-6.2: Length of fixity VS percentage steel for 34m-34m span
Table 6.6 Percentage steel for 34m-31m span
Radius of curvature (m) 14m height 16m height
Lf = 2m Lf = 6m Lf= 8m Lf = 2m Lf = 6m Lf= 8m Straight 0.42% 0.60% 0.96% 0.56% 0.68% 1.10%
550 0.48% 0.68% 1.04% 0.64% 0.72% 1.20% 150 0.60% 0.82% 1.28% 0.72% 1.12% 1.48%

International Journal of Advance and Innovative Research Volume 6, Issue 2 (XXX): April – June, 2019
199
ISSN 2394 - 7780
Figure-6.3: Length of fixity VS Percentage steel for 34m-31m span
CONCLUSION Analysis and Design process of Viaduct Foundation and pier is fully depends on parameters of viaduct like (Height From Rail top level to Ground level, Span of viaduct, radius of Curvature and Length of Fixity)
1) For smaller redius of curvature the transverse moment will be more so to resist these moment steel required is more
2) As height of pier Increases then Lever arm also get increased due to which Moments at pier base is increases and required more steel for the design of pier.
3) For same spans(34m-34m) longitudinal moment(due to dead load and SIDL) is negligible and for different span like (34m-31m) longitudinal moment (due to DL and SIDL)exist.
4) Length of Fixity(Lf) plays a major role to decide the pile cap size, steel in the Foundation, So for every design engineer it is very important to know the procedure of calculation of length of fixity (Lf). As length of Fixity increases, Lever arm get increased and due to Which moment at inflection level goes on increases so requirement of steel in foundation get increased.
REFERENCES 1. Mikana, Savic., and Danilo, Furnandez.(2019). “The invisible metro system: the case study of benglore
metro system planning,”Tunneling And Under Ground Space Technology.,83, 485-497.
2. Arti. R.Soni., Munish. K. Chandel. (2018). “Assesment of emission reduction potential of mumbai metro rail,” J. Clener Production., 197, 1579-1586.
3. X, H, HE., X, L,Meng. ( 2011). “Design and construction of metro bridgr for gunangzhou metro line 4,” Procedia Engineering., 14, 126-133.
4. Bureau of Indian standards. (1987). “ Code of practice for design load (other than eartquake) For building and structures. Part 3 :Wind load.” IS 875, New Delhi, India.
5. Indian road congress. (2014). “Standard specifications and code of practice for road bridge. Section II : Load and Stresses.” IRC-6, New Delhi, india.

International Journal of Advance and Innovative Research Volume 6, Issue 2 (XXX): April – June, 2019
200
ISSN 2394 - 7780
SUSTAINABLE USE OF WASTE MATERIALS IN PAVEMENTS– A REVIEW
Sourabh1, Piyush Kumawat2, Abhijeet Yadav3 and Pushpendra Chaudhary4 Assistant Professor1, Student2,3,4, Department of Civil Engineering, Poornima College of Engineering, Jaipur
ABSTRACT Today with the passage of time there is the change in traditional method of each and everything whether it is a cloth or the food. This change depends on the availability of the products and the cost they consume in the production units which produces waste products and dump them in the environment which causes many problems like disease and pollution which is the main concern. Waste of some industries can be used In the construction of road pavements. Waste like fly ash, paper pulp, bleaching clay, ladle stack, P.E.T, non-ceramic, brick powder, etc can be used virginly or with other mixtures. This utilization results in independence on the traditional materials like cement, aggregates, sand, etc which causes pollution and utilization of raw materials. By using the non-renewable resources we can make the pavement without dealing with the quality of the pavement and without harming our environment in a vast manner..
Keywords: cement, aggregates, sand, environment.
I. INTRODUCTION World is now at the highest peak of pollution which is the result of the advancement of industrialization and commercialization. Every raw material that we obtain from nature is now used either as a source of energy or in making luxurious things through the process of producing them and consuming them there are some by-products which are either waste or toxic in nature which harms the environment. From the last 80-90 years, the earth is tolerating the pollution which is increasing day by day. The transportation sector is the developing sector and one of the main cause of pollution whether it is the emission from automobiles or the toxic gases from production units of the road construction material. The transportation sector road plays an important role about 95% of road pavements are flexible pavement which uses the binding material[14]. The process of binding material consumes 150-200 degree Celsius heat which produces fumes and toxic gases[7]. The flexible pavements consist of four sections[8]. The bottommost is the layer is known as the subgrade which is the earth surface and above it is modified layer called sub-base which consists of coarse aggregates and just above it is a layer of fine aggregates known as base course and the topmost layer is a layer which bears the load and in direct contact with the physical world. We can only make the changes in the configuration of the subgrade layer or the topmost layer [4]. These changes can be done by adding useful nonrenewable material in the configuration. Sustainability deals with using the waste so that we can reduce the use of raw material and there can be enough resources for the future generation [3]. Sustainability helps in controlling pollution and utilizing the waste in the best manner. This paper gives limelight on the utilization of non-renewable materials in the best manner it can be [6].
II. MATERIALS A. P.E.T Polyethylene terephthalate is produced from ethylene glycol and dimethyl terephalate or terephthalic acid. These are generally called by the name polyester which is generally used for clothing which acts as an excellent moisture barrier and used for bottling and packaging on large scale.
B. Ladle furnace slag It is produced in the industries of the steelmaking and that too at last stage. From the last two decades, it is now used in construction purpose and used along with Portland cement.
C. Bleaching Clay It is the clay which is having activated qualities which control montmorillonite through acid activation. This is used to purify vegetable oil by removing impurities and is produced in large quantities.
D. Fly ash It is produced by burning coal during the production of electricity by coal. This is mostly used in construction like to fill material in concrete, road construction, brick making.
E. Waste Glass fiber
EFFECTS OF WASTE Glass fiber is also known as glass wool which is lightweight and is very strong and robust material. Its strength is lower than carbon fiber and less stiff.

International Journal of Advance and Innovative Research Volume 6, Issue 2 (XXX): April – June, 2019
201
ISSN 2394 - 7780
F. Used Engine oil The oil used as a lubricant in the automobile engines are consumed and the residue from it is considered waste. It is used as air entraining material in concrete.
G. Nanoceramic powder The powder formed by the material like brick, coal, glass etc. It is water resistance, tensile strength, rutting resistance.
H. Nylon wire These are the wire which we get from the used toothbrushes, paint brushes etc. it also helps in increased durability.
S.No. Materials Evaluation Conclusion Parameters
1. Polyethylene Shear strength, CBR, 1.2%of PET fiber and 15% of fly ash
Terephthalate(PET) Indirect tensile strength
, atterbergs
increase the plastic, liquid limit(shrinkage
limits limit test). 1.2%PET fiber and 15% fly ash increases
shear strength by1.45 times (shear
strength test).
1.2 % of PET fiber increases the
CBR value by 2.33 times.
2. Ladle slag furnace Use in concrete to produce
cement 5% gives the best performance of asphalt bond,stiffness concrete.
8% of LFS increase stiffness and
strength. Provide excellent resistance to fatigue. 5
3. Bleaching clay Workability,
compatibility, 5% doesn’t worsen the workability,
Permeability, permanent
deformation compatibility, resistance. Less than 5-7% increase the tensile strength and stiffness, No significant difference in permeability.[10]
4. Nano ceramic powder Tensile strength
, Water sensitivity,
10% of NCP at the place of limestone
rutting
resistance. increases the stiffness and rutting resistance(DSR test)
1.5% of nanoceramicgives high
tensile
strength and moisture susceptibility
performance.
5. Nylon wire Durability, higher binder
context, 5% of nylon wire increase the durability
of bitumen, 8% of nylon wire increase the

International Journal of Advance and Innovative Research Volume 6, Issue 2 (XXX): April – June, 2019
202
ISSN 2394 - 7780
binding context by 1.75 times.
6. Flyash Bulk fill, filler in the
bituminous mix, 15-24% use as a binder for the
stabilized artificial aggregate. base, 15% of fly ash doesn’t show any significant difference in properties.[15]
7. Glass waste Glass fiber reinforcement, 2-5% of glass fiber with bitumen
increases bulk the stiffness and strength, 5% of glass fiber provides the base stabilization.
8. Waste engine oil Air-entraining of concrete 2.5% of engine oil provides good air entrainer, Can be also used in concrete work.[14]
III. CONCLUSION 1. P.E.T fiber when used with fly ash in asphalt mixture helps in the utilization of plastic waste, fly ash and
slag
2. The properties which are affected by the P.E.T are shear strength C.B.R value indirect tensile strength and atterberg limit.
3. Shrinkage limit test and C.B.R value are performed on the mixture of P.E.T and asphalt mixture and improve the shear strength.
4. Ladle slag furnaces consist of 50% of quick lime and 20% of silica. It is used in concrete to form a strong cement bond to enhance the stiffness.
IV.REFERENCES 1. Bocci, E. (2019). Use of ladle furnace slag as filler in hot asphalt mixtures.
2. Choudhary, J., Kumar, B., and Gupta, A. (2019). Application of waste materials as fillers in bituminous mixes.
3. G.H. Brundtland, Our Common Future: Report of the World Commission on Environment and Development, 1987. <https://doi.org/10.1080/074880088084087 83>.
4. Lo Presti, D., Izquierdo, M. and Jiménez del Barco Carrión, A. (2019). Towards storage-stable high-content recycled tyre rubber modified bitumen.
5. Marta Vila-Cortavitarte, Pedro Lastra-González, Miguel Ángel Calzada-Pérez and Indacoechea-Vega, I. (2019). The use of recycled plastic as partial replacement of bitumen in asphalt concrete.
6. P.K. Gautam, P. Kalla, A.S. Jethro, S.C. Harshwardhan, Dimensional stone waste characterization in Rajasthan and suggesting their possible remedies, Int. J.Emerg. Technol. 8 (2017) 40–42.
7. R. Fuhst, O. Creutzenberg, H. Ernst, T. Hansen, G. Pohlmann, A. Preiss, S.Rittinghausen, 24 Months inhalation carcinogenicity study of bitumen fumes in Wistar (WU) rats, J. Occup. Environ. Hyg. 4 (2007) 20–43, https://doi.org/10.1080/15459620701326257
8. 8. R.M. Mulungye, P.M.O. Owende, K. Mellon, Finite element modeling of flexible pavements on soft soil subgrades, Mater. Des. 28 (2007) 739–756, https://doi.org/10.1016/j.matdes.2005.12.00 6.
9. Rongali, U., Singh, G., Chourasiya, A. and Jain, P. (2019). Laboratory Investigation on Use of Fly Ash Plastic Waste Composite in Bituminous Concrete Mixtures.
10. Sangiorgi, C., Tataranni, P., Simone, A., Vignali, V., Lantieri, C. and Dondi, G. (2014). Waste bleaching clays as fillers in hot bituminous mixtures. Construction and Building Materials, 73, pp.320-325.
11. Serin, S., Morova, N., Saltan, M. and Terzi, S. (2019). Investigation of usability of steel fibers in asphalt concrete mixtures.

International Journal of Advance and Innovative Research Volume 6, Issue 2 (XXX): April – June, 2019
203
ISSN 2394 - 7780
12. Tahami, S., Arabani, M. and Foroutan Mirhosseini, A. (2019). Usage of two biomass ashes as filler in hot mix asphalt.
13. Dakshanamurthy, V. Raman, A simple method of identifying an expansive soil, Soils Found. 13 (1973) 97–104, https://doi.org/10.3208/sandf1972.13.97.
14. Y. Huang, R.N. Bird, O. Heidrich, A review of the use of recycled solid waste materials in asphalt pavements, Resour. Conserv. Recycle. 52 (2007) 58–73, https://doi.org/10.1016/j.resconrec.2007.02. 002
15. Yin, J. and Wu, W. (2019). Utilization of waste nylon wire in stone matrix asphalt mixtures.

International Journal of Advance and Innovative Research Volume 6, Issue 2 (XXX): April – June, 2019
204
ISSN 2394 - 7780
QUALITATIVE MEASURE OF TRAFFIC MOVEMENT BY STATISTICAL METHOD
Sitesh Kumar Singh1 and Dr. Ankit Saraswat2 1Ph. D Scholar, Department of Civil Engineering, Career Point University, Kota
2School of Engineering & Technology, Career Point University, Kota
ABSTRACT Introduction: Smart transportation era also needs to think about the evaluation of traffic of the cities approaching the urban cities for the better planning of transportation facilities. The city which is already approaching the urban city will be a future smart city which will definitely demand a smart transportation system. For this purpose, the existing system must be evaluated in the terms of Level of service as a key component.
Methods: Traffic survey have been carried out for the analysis of AADT, Design service volume, traffic capacity and Leve of Service (LOS) of the city road networks. By using AADT, the LOS have been estimated for the analysis of future traffic condition. Data & Analysis Peak hour traffic survey data have been collected for the analysis of AADT and Level of Service (LOS). IRC 64 & 106 have been referred for the calculation of the Design Service Volume for the semi-urban traffic context. LOS has been converted into percentile form for the analysis of the future LOS.
Result: It has been observed that the LOS of the roads of the major traffic operations have mostly same LOS in the morning & evening peak hours which signifies that the traffic movement and the pattern of movement are same in both the traffic session of peak hours. After 05 years, the LOS will decrease from B to C; after 03 years, from C to D; after 03 years, from D to E; after 05 years, from E to F, which means, LOS will reduce from time to time and the unimproved existing traffic system will create a problem for motorists and pedestrians.
Conclusion: Despite of good level of service, maximum road cause congestion due to unauthorized parking and unauthorized markets besides the road. Hence, the existing traffic systems must be evaluated in order to cope with future traffic demands and to propose a future smart city for the development of smart transportation systems.
Keywords: Capacity; Level of service; Design service volume; Traffic growth.
1. INTRODUCTION We are moving in the era of smart transportation systems, but we are focusing only on the developed cities. As some of the rural areas have been grown since past few decades, which approached to the urban city. These cities are somewhere about to be called as urban cities which we can call semi-urban cities now. A study on the similar semi-urban city have been carried out for the evaluation of design service volume of the road, capacity of the roads and the level of service. The Design Service Volume of this type of area might vary from Design Service Volume (DSV) of rural area & urban area. Hence, the calculation of DSV as by equation 1 for Mid-sized city or semi-urban or semi-rural can be considered. (Highway Capacity Manual, 2000) Motorists and pedestrians can move easily on the road or any reasonable order of point during a given period of time under some prevailing conditions of specific path and traffic, that rate of movement per hour is called the Capacity of the given route. Capacity is also defined as the maximum traffic volume per hour at which a motorist can move or reasonably expected to move a certain point or a specific road section of a lane during the stated period of time under prevailing conditions of roads, traffic & controls. (Sarna, A. C. et al., 1989) In this research, the researcher emphasized on the need of norms for highway capacity for Indian road networks/highways. Based on the data observation, simple techniques were developed for developing capacity norms as per this research. (Panda, H. and Pundir, R. S., 2002) In this research, for better traffic operations & performance, traffic management measures were discussed by analysing the characteristics of traffic in Ahmedabad - Vadodara highway section (NH-8). The qualitative measure of the movement of traffic in a traffic network with proper operational conditions and the perception by the motorists is called Level of Service (LOS). For design purpose, the standards of highway capacity are normally fixed with relation to Level of Service. (Transport Research Board, 1999; Wu N, 1998) As per this research, the quality terms or movement of traffic flow at a given section of road network by the motorists is used to determine the Level of Service (LOS). There are various factors to be described for the conditions of Level of Service such as travel time and speed, traffic movement & interruptions, free manoeuvrability, convenience and comfort, safety, etc. For the identification of Level of Service, it has been categorized as LOS-A, LOS-B, LOS-C, LOS-D, LOS-E & LOS-F. It signifies that for LOS-A, there is free flow and perfect traffic movement conditions where as LOS-F signifies the traffic breakdown or
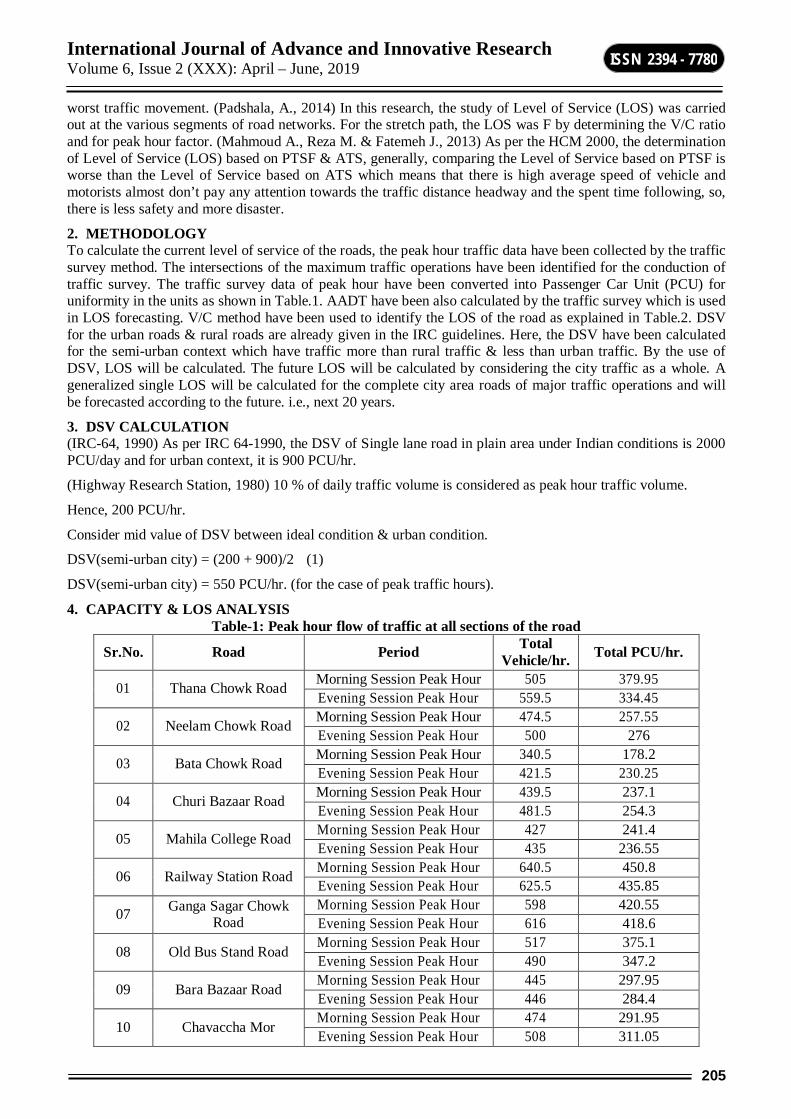
International Journal of Advance and Innovative Research Volume 6, Issue 2 (XXX): April – June, 2019
205
ISSN 2394 - 7780
worst traffic movement. (Padshala, A., 2014) In this research, the study of Level of Service (LOS) was carried out at the various segments of road networks. For the stretch path, the LOS was F by determining the V/C ratio and for peak hour factor. (Mahmoud A., Reza M. & Fatemeh J., 2013) As per the HCM 2000, the determination of Level of Service (LOS) based on PTSF & ATS, generally, comparing the Level of Service based on PTSF is worse than the Level of Service based on ATS which means that there is high average speed of vehicle and motorists almost don’t pay any attention towards the traffic distance headway and the spent time following, so, there is less safety and more disaster.
2. METHODOLOGY To calculate the current level of service of the roads, the peak hour traffic data have been collected by the traffic survey method. The intersections of the maximum traffic operations have been identified for the conduction of traffic survey. The traffic survey data of peak hour have been converted into Passenger Car Unit (PCU) for uniformity in the units as shown in Table.1. AADT have been also calculated by the traffic survey which is used in LOS forecasting. V/C method have been used to identify the LOS of the road as explained in Table.2. DSV for the urban roads & rural roads are already given in the IRC guidelines. Here, the DSV have been calculated for the semi-urban context which have traffic more than rural traffic & less than urban traffic. By the use of DSV, LOS will be calculated. The future LOS will be calculated by considering the city traffic as a whole. A generalized single LOS will be calculated for the complete city area roads of major traffic operations and will be forecasted according to the future. i.e., next 20 years.
3. DSV CALCULATION (IRC-64, 1990) As per IRC 64-1990, the DSV of Single lane road in plain area under Indian conditions is 2000 PCU/day and for urban context, it is 900 PCU/hr.
(Highway Research Station, 1980) 10 % of daily traffic volume is considered as peak hour traffic volume.
Hence, 200 PCU/hr.
Consider mid value of DSV between ideal condition & urban condition.
DSV(semi-urban city) = (200 + 900)/2 (1)
DSV(semi-urban city) = 550 PCU/hr. (for the case of peak traffic hours).
4. CAPACITY & LOS ANALYSIS Table-1: Peak hour flow of traffic at all sections of the road
Sr.No. Road Period Total Vehicle/hr. Total PCU/hr.
01 Thana Chowk Road Morning Session Peak Hour 505 379.95 Evening Session Peak Hour 559.5 334.45
02 Neelam Chowk Road Morning Session Peak Hour 474.5 257.55 Evening Session Peak Hour 500 276
03 Bata Chowk Road Morning Session Peak Hour 340.5 178.2 Evening Session Peak Hour 421.5 230.25
04 Churi Bazaar Road Morning Session Peak Hour 439.5 237.1 Evening Session Peak Hour 481.5 254.3
05 Mahila College Road Morning Session Peak Hour 427 241.4 Evening Session Peak Hour 435 236.55
06 Railway Station Road Morning Session Peak Hour 640.5 450.8 Evening Session Peak Hour 625.5 435.85
07 Ganga Sagar Chowk Road
Morning Session Peak Hour 598 420.55 Evening Session Peak Hour 616 418.6
08 Old Bus Stand Road Morning Session Peak Hour 517 375.1 Evening Session Peak Hour 490 347.2
09 Bara Bazaar Road Morning Session Peak Hour 445 297.95 Evening Session Peak Hour 446 284.4
10 Chavaccha Mor Morning Session Peak Hour 474 291.95 Evening Session Peak Hour 508 311.05

International Journal of Advance and Innovative Research Volume 6, Issue 2 (XXX): April – June, 2019
206
ISSN 2394 - 7780
In Table.1, the peak hour flow has been extracted in terms of vehicle per hour and PCU per hour for all the roads of study by taking mean of the two-hour traffic survey data. From the values obtained in this table as PCU per hour, level of services has been obtained. Volume/Capacity (V/C) ratio was determined using traffic design service volumes in order to calculate the Level of Service (LOS) (IRC-106, 1990) and after that, the Level of Service (LOS) was calculated. (Table.3). Based on Volume to Capacity ratio, the Level of Service Criteria is shown in Table.2.
Table-2 Level of Service (LOS) Criteria based on V/Capacity ratio Sr.No. LOS Description V/C
1 A The unimpeded maneuverability with the free flow conditions. Minimum Stopped delay at signalized
intersection. 0.00 to 0.60
2 B Slightly restricted maneuverability with Reasonably
unimpeded operations. Stopped delays are not bothersome.
0.61 to 0.70
3 C
Somewhat more restrictions in making mid-block lane changes than LOS B with Stable operations.
Appreciable tension experienced by motorists while driving.
0.71 to 0.80
4 D Small increases in volume produce substantial increase
in delay and decreases in speed for approaching unstable operations.
0.81 to 0.90
5 E Significant intersection approach delays operations and low average speeds. 0.91 to 1.00
6 F Extremely low speeds caused by intersection
congestion, high delay and adverse signal progression operations.
Greater than 1.00
Table.3. Level of Service (LOS) for all roads
Sr.No. Location Period PCU/hr. Width of road per lane (m)
No. of
lanes
Design Service Volume
(DSV)/hr
V/C ratio LOS
1 Thana Chowk Road
Morning Session Peak Hour 379.95 3.75 1 550 0.69 B
Evening Session Peak Hour 334.45 3.75 1 550 0.608 B
2 Neelam Chowk Road
Morning Session Peak Hour 257.55 3.5 1 550 0.468 A
Evening Session Peak Hour 276 3.5 1 550 0.501 A
3 Bata Chowk Road
Morning Session Peak Hour 178.2 3.5 1 550 0.324 A
Evening Session Peak Hour 230.25 3.5 1 550 0.418 A
4 Churi Bazaar Road
Morning Session Peak Hour 237.1 3.5 1 550 0.431 A
Evening Session Peak Hour 254.3 3.5 1 550 0.462 A
5 Mahila College Road
Morning Session Peak Hour 241.4 3.5 1 550 0.438 A
Evening Session Peak Hour 236.55 3.5 1 550 0.43 A
6 Railway Station Road
Morning Session Peak 450.8 3.75 1 550 0.819 D
Evening Session Peak Hour 435.85 3.75 1 550 0.792 C

International Journal of Advance and Innovative Research Volume 6, Issue 2 (XXX): April – June, 2019
207
ISSN 2394 - 7780
7 Ganga Sagar Chowk Road
Morning Session Peak Hour 420.55 3.75 1 550 0.764 C
Evening Session Peak Hour 418.6 3.75 1 550 0.761 C
8 Old Bus Stand Road
Morning Session Peak Hour 375.1 3.75 1 550 0.682 B
Evening Session Peak Hour 347.2 3.75 1 550 0.631 B
9 Bara Bazaar Road
Morning Session Peak Hour 297.95 3.75 1 550 0.541 A
Evening Session Peak Hour 284.4 3.75 1 550 0.517 A
10 Chavaccha Mor
Morning Session Peak Hour 291.95 3.5 1 550 0.53 A
Evening Session Peak Hour 311.05 3.5 1 550 0.565 A
5. LOS ANALYSIS FOR FUTURE TRAFFIC GROWTH Level of Service analysis for future traffic growth helps to relate the future ease of movement of traffic on the existing traffic facilities or road networks. It helps to plan a better strategies of transport system planning including development of road networks, traffic furniture’s and related facilities. Table.3. Level of Service (LOS) Criteria based on V/C (volume/capacity) ratio shows the LOS & V/C ratio. LOS is converted into percentile for the generalized LOS value of the city traffic road network on the basics of AADT. (Table.4).
Table-4: Level of Service (LOS) Criteria based on V/Capacity ratio percentile
Sr.No. LOS Description V/C (Percentile)
1 A The unimpeded maneuverability with the free flow conditions. Minimum Stopped delay at signalized intersection. 100
2 B Slightly restricted maneuverability with Reasonably unimpeded operations. Stopped delays are not bothersome. 90
3 C Somewhat more restrictions in making mid-block lane changes
than LOS B with Stable operations. Appreciable tension experienced by motorists while driving.
80
4 D Small increases in volume produce substantial increase in delay and decreases in speed for approaching unstable operations. 70
5 E Significant intersection approach delays operations and low average speeds. 60
6 F Extremely low speeds caused by intersection congestion, high delay and adverse signal progression operations. 50
Considering the LOS of the various road networks of the city in a generalized condition, the Table.5. shows the percentile average analysis of the LOS.
Table-5: Percentile Average Analysis of LOS Sr.No. Location Period LOS Percentile
1 Thana Chowk Road Morning Session Peak Hour B 90 Evening Session Peak Hour B 90
2 Neelam Chowk Road Morning Session Peak Hour A 100 Evening Session Peak Hour A 100
3 Bata Chowk Road Morning Session Peak Hour A 100 Evening Session Peak Hour A 100
4 Churi Bazaar Road Morning Session Peak Hour A 100 Evening Session Peak Hour A 100
5 Mahila College Road Morning Session Peak Hour A 100

International Journal of Advance and Innovative Research Volume 6, Issue 2 (XXX): April – June, 2019
208
ISSN 2394 - 7780
Evening Session Peak Hour A 100
6 Railway Station Road Morning Session Peak D 70
Evening Session Peak Hour C 80
7 Ganga Sagar Chowk Road Morning Session Peak Hour C 80 Evening Session Peak Hour C 80
8 Old Bus Stand Road Morning Session Peak Hour B 90 Evening Session Peak Hour B 90
9 Bara Bazaar Road Morning Session Peak Hour A 100 Evening Session Peak Hour A 100
10 Chavaccha Mor Morning Session Peak Hour A 100 Evening Session Peak Hour A 100
Average 93.5 Generalized LOS B
The generalized LOS of the city traffic is related to the AADT of the city. Hence, future LOS analysis is totally depending upon the relation of LOS & AADT. AADT & LOS are inversely proportional to each other.
Table-6: Future LOS on the basis of AADT Year AADT (PCU) LOS 2017 15654.57 B 2018 17188.71 B 2019 18873.2 B 2020 20722.77 B 2021 22753.6 B 2022 24983.45 C 2023 27431.82 C 2024 30120.13 C 2025 33071.9 D 2026 36312.94 D 2027 39871.6 D 2028 43779.01 E 2029 48069.35 E 2030 52780.14 E 2031 57952.59 E 2032 63631.94 E 2033 69867.87 F 2034 76717.11 F 2035 84235.38 F 2036 92490.44 F 2037 101554.5 F
Table 6 shows the future LOS of the city road networks and Fig.1., represents the same also.
Fig-1: Estimated LOS as per future AADT

International Journal of Advance and Innovative Research Volume 6, Issue 2 (XXX): April – June, 2019
209
ISSN 2394 - 7780
6. RESULT i. Level of service have been observed on the different roads in both morning session and evening session as
shown in Table 3 & capacity shown in Table 1.
ii. At Thana Chowk road, the LOS is B with capacity of 379.95 PCU/hr. (higher traffic) in both morning and evening session. It means that with slightly restricted maneuverability, there is reasonably unimpeded operations.
iii. At Neelam Chowk road, the LOS is A with capacity of 276 PCU/hr. in both morning and evening session. It means that there is free flow conditions with unimpeded maneuverability.
iv. At Bata Chowk road, the LOS is A with capacity of 230.25 PCU/hr. in both morning and evening session. It means that there is free flow conditions with unimpeded maneuverability.
v. At Churi Bazaar road, the LOS is A with capacity of 254.3 PCU/hr. in both morning and evening session. It means that there is free flow conditions with unimpeded maneuverability.
vi. At Mahila College road, the LOS is A with capacity of 241.4 PCU/hr. in both morning and evening session. It means that there is free flow conditions with unimpeded maneuverability.
vii. At Railway Station road, the LOS is D with capacity of 450.8 PCU/hr. in morning session and LOS is C with capacity of 435.85 PCU/hr. in evening session. It means that there is unstable operations approaching where small increases in traffic volume produce decreases in speed in morning session & substantial increase in delay and with somewhat more restrictions in making mid-block lane changes than LOS B in evening session, there is stable operations.
viii. At Ganga Sagar Chowk road, the LOS is C with capacity of 420.55 PCU/hr. in both morning and evening session. It means that with somewhat more restrictions in making mid-block lane changes than LOS B, there is stable operations.
ix. At Old Bus Stand road, the LOS is B with capacity of 375.1 PCU/hr. in both morning and evening session. It means that with slightly restricted maneuverability, there is reasonably unimpeded operations.
x. At Bara Bazaar road, the LOS is A with capacity of 297.95 PCU/hr. in both morning and evening session. It means that there is free flow conditions with unimpeded maneuverability.
xi. At Chavaccha Mor road, the LOS is A with capacity of 311.05 PCU/hr. in both morning and evening session. It means that there is free flow conditions with unimpeded maneuverability.
xii. The generalized LOS of the city road found to be B. xiii. As shown in Fig.1., it has been found that, after 05 years, the LOS will decrease from B to C; after 03
years, from C to D; after 03 years, from D to E; after 05 years, from E to F, which means, LOS will reduce from time to time and the unimproved existing traffic system will create problem for the motorists and pedestrians.
xiv. Despite of good level of service, maximum road cause congestion due to unauthorized parking and unauthorized markets besides the road.
7. CONCLUSION It has been concluded that the city which is approaching to the urban city also needs to be evaluated in respect with the existing traffic conditions to plan a better transportation facility. The level of service (LOS) represents the qualitative measures of the traffic movement through the city road networks. The fig.1. represents the future condition of LOS which creates a serious cause to think of planning the cities approaching the urban cities.
ACKNOWLEDGEMENT The author acknowledges and express the gratitude for the motivation & support of Civil Engineering Department of University
REFERENCES [1] Highway Capacity Manual (2000) Chapter20-two lane highway.
[2] Sarna, A. C. et al. (1989), “Capacity of urban roads - a case study of Delhi and Bombay.” Highway Research Bulletin, No. 4, Indian Roads Congress, New Delhi, 1-38.
[3] Panda, H. and Pundir, R. S. (2002), “Problems and possible solutions for better traffic management: A case study of Vadodara-Ahmedabad section of national highway eight.” Institute of Rural Management.

International Journal of Advance and Innovative Research Volume 6, Issue 2 (XXX): April – June, 2019
210
ISSN 2394 - 7780
[4] Capacity and Quality of Service of Two-Lane Highways, Transportation Research Board, National Research Council, NCHRP 3–55(3), November 1999.
[5] Wu N (1998) “The proposed new version of German Highway Capacity Manual”. Proceeding of the International Conference on Traffic and Transportation Studies, Beijing, China, July 1998. ASCE, Reston, USA.
[6] Padshala, A. (2014), “Traffic studies of urban mid-block section: a case study of Pragatinagar to Akhbarnagar & Akhbarnagar to Ranip Cross road.” International Journal of Research in Engineering and Technology, 03(06), 45-54.
[7] Mahmoud A., Reza M. & Fatemeh J. (2013). “Determination the Capacity of two-lane Suburban Roads with Neutral Networks and Effect of Speed on Level of Service”. Eur. Transp. Res. Rev. (2013) 5:179-184.
[8] IRC-64. (1990). “Guidelines for Capacity of Roads for Rural Areas”. The Indian Road Congress.
[9] “Report on Research Project R-3, First Year Results of Continuous Traffic Count Station on NH 45 in Tamil Nadu”. Highway Research Station, Madras, 1980.
[10] IRC-106. (1990). “Guidelines for Capacity of Urban Roads in Plain Areas”. The Indian Road Congress.

International Journal of Advance and Innovative Research Volume 6, Issue 2 (XXX): April – June, 2019
211
ISSN 2394 - 7780
ADVANCEMENT IN STEADY TRAFFIC FLOW IN RURAL AREA BY CONCRETE BLOCK MIXED PLASTIC MATERIAL TO FIX THE POTHOLES
Shamal Burman1, Pradyuman Meena2, Prakash Meena3 and Prashant Singh4 Assistant Professor1 and Student2,3,4, Department of Civil Engineering, Poornima Institute of Engineering and
Technology, Jaipur
ABSTRACT The ireason ifor ithis iinvestigation iis ito ilook iat ithe ipossibility iof iutilizing iplastic iwaste iin ithe iinflexible rigid ipavement ito iexpel ior ifix ithe ipotholes. Transfer iof ia ivast iamount iof iplastic iwaste imay icause contamination iof iland, iwater ibodies, iand iair. iThe iproperties iof icement icontaining ishifting irates iof plastic iwaste iwere itried ifor icompressive iquality iestimation. iBy idispose ithe iinfluenced ipart iand supplant ithat iinfluenced ipart ifrom ithe iplastic iwaste imaterial iblended iwith icement ito ievacuate ithe potholes. iThe ioutcomes idemonstrate ithat isupplanting i10% isand iby ivolume iwith ireused iplastic iis ia suitable irecommendation ithat ican ipossibly ispare i820 imillion itons iof isand ieach iyear. iThrough appropriate iblend iplan, ithe iauxiliary iexecution iof icement iwith iplastic iwaste ican ibe ikept iup.
Keywords:iPlastic iWaste i, iCompressive iStrength i, iPotholes i, iRigid iPavement i, iConcrete iCube i.
INTRODUCTION In, iIndia iwith ithe ibeginning iof iMonsoon, ithe iissue iof ipotholes ibegin iin iurban iand icountry istreets. iA colossal imeasure iof ithe ispending iplan iis iassigned ifor ithe ifixing iof ipotholes ion ithe istreets. iWe ihave proposed ia isimple, ifinancial iand iquick ianswer ifor ifilling iof ipotholes iwith iless iworkforce. iOur ianswer can ibe iconnected ito iany iscale ipothole ihowever iup ito ia irestricted iprofundity. iWith iour ianswer, ithe bringing iabout iexpenses ifor ifilling iof ipotholes icould ibe ibrought idown, iand ithus ithe itraffic iversatility could ibe ieffectively ikept iup. i
The irigid ipavement iis ia ivital ipiece iof iany istreet iundertaking iand ineeds ito iwithstand itraffic iload without idecaying ior itwisting ito ithe idegree ithat iit iends iup iunusable iamid ithe istructure ilife iperiod. However, iwith ithe iexpanding iaccessibility iof iconcrete iin ithe ination iand ithe irising icosts iof imaterial used iin ipavement, ithe iadministration's ichoice ito ichoose iinflexible iconcrete ias ia iproficient istrategy. iwe need ito iexpand ithe ilife iexpectancy iof ithe istreet iand ito idiminish ithe expense iof idevelopment iof ithe street iby iutilizing imanufactured isquare. Potholes iare ian iannoyance ito idrivers iand ipossibly ia irisky danger ion ithe iroadways. iThe ifix iof ipothole itroubles iin irigid ipavement iis iregularly iviewed ias ilow ion a istreet iorganization's iplan, ibe ithat ias iit imay, itheir ifix iexpends ia ihuge ibit iof itime iand iassets. Numerous istreet iteams iare inot iwell ieducated ion ithe icorrect imaterials iand istrategies ifor ipothole ifix. The iright ichoice iof ipothole ifixing imaterials iand ilegitimate iutilization iof ifix itechniques ican iincredibly build ithe ilife ispan iof ipothole ifixes, idecrease idriver idissatisfactions, ialso, istreet isupport ispending iplans should ibe idecreased.The iunderlying iexpense iof iinflexible irigid ipavement iis ino iuncertainty ihigher ithan that iof iadaptable ipavement. iBut ias ifar ias ithe ilifecycle iof ithe istreet, ithe iunbending ipavement iis progressively iproductive iand iincreasingly iefficient. iUnbending ipavement iis icommonly ifavored ifor iareas encountering ioverwhelming iprecipitation, iwaterlogged iregions iand iregions ihaving isub-grade isoil.
2. METHODOLOGY 2.1. MATERIALS 2.1.1. CEMENT Cement iis ia icover, ia isubstance ithat isets iand isolidifies ifreely, iand ican itie idifferent imaterials itogether. The imost ivital iutilization iof iconcrete iis ithe iformation iof imortar iand icement ithat iholding iof characteristic ito ishape ia isolid istructure imaterial ithat iis istrong ieven iwith iordinary inatural iimpacts. Different ikinds iof icement iare iconceivable iby imixing idiverse iextents iof igypsum, iclinker, iand idifferent added isubstances. iKinds iof icement ithat iare iutilized ifor idevelopment ifall iinto itwo iprincipal iclasses dependent ion iconcrete iproperties, iwater idriven ior inon-pressure idriven. iEven ithe itwo iprimary iconcrete structures, ithere iare ia ifew idistinct itypes iof ipressure idriven icement. of ithe inumerous iassortments iof pressure idriven icement, ithe imost igenerally iutilized ibond itoday iis iPortland icement.
FIG-1: Ordinary Portland Cement

International Journal of Advance and Innovative Research Volume 6, Issue 2 (XXX): April – June, 2019
212
ISSN 2394 - 7780
2.1.2. FINE iAGGREGATE Sand imakes isolid ifree ifrom ivoids. isand igives ihomogeneity ito isome ilimit. iBut iwe iknow ithat isolid iis a iheterogeneous imaterial. iAn iobjective iof iblend istructuring iis ito iaccomplish ithe iaccompanying circumstance. iThe ilarge isize icoarse iaggregate iwhich ihas ileft ithe ivoid iwhile ibonding ican ibe ifilled iby small iparticles iwhich itop ioff ithe iopenings ibetween ithe ivast iparticles.
Fig-2: Ifine Iaggregate I( Isand I)
2.1.3. COARSE iAGGREGATE Aggregate iis ithe isignificant isegment iof iany iconcrete iit iestablishes iabout i70– i80% iof ithe ivolume iof iconcrete. iAt ithe ipoint iwhen ithe iextent iof ithe iaggregate isize iis imore ithan i4.75 imm iand iretained ion ithe iIS i4.75 imm isieve iit iis icalled ias icoarse iaggregate.
Following iare ithe ireasons iwhy iaggregate iare iutilized iin ithe iconcrete
1)They iareieffectively iaccessible iand ithey iare iconservative iwhen icontrasted iwith iconcrete. i
2) Aggregates igive iextra icohesion ito ithe istructure. i
3) Aggregates ihelp iin irestricting ithe iconcrete iappropriate
i i i Fig-3: iAggregate iof i isize i10 iand i20 imm
2.1.4. PLASTIC iWASTE iMATERIAL The isignificant idevelopment iin ithe iutilization iof iplastic iis iwatched ieverywhere ilate ithroughout ithe world iwhich ilikewise ibuilds ithe igeneration iof iplastic-related iwaste. iA ihuge iamount iof iplastic iis disposed iof ievery iyear iin ithe igarbage ibut iin irecent iyear iit iis iused iby idifferent icountries iin construction iwork ias ia ireplacement iof ifine ior icoarse iaggregate. iIt ialso ireduces ithe icost iof inatural material isuch ias icement, isand, iand iaggregate iwhich ican ireduce iday iby iday iin ithe ienvironment.
Fig-4: iPlastic iWaste iMaterial i
2.1.5 TESTING IOF ISAMPLE I 2.1.5.1 Compressive istrength itest It iis idefined ias ithe itest iin iwhich iwe ican itest ithe iload-bearing icapacity iof ithe iconcrete iblock. iFor checking ithe icompression ivalue ifirst iwe ihave ito imake iof ithe i15*15 icm. iAfter ithe ifinal icuring iof i 7,14,28 idays, ithe iblock iis itested iunder iCTM imachine. iThe imachine iwill iapply ithe icompression pressure ito ithe iblock iand ithe ipressure iis iapplied itill iblock ibreaking. iFor icalculation iof icompressive strength, ithe ifollowing iformula iis iused.Compressive iStrength i= iLoad i/ iCross-sectional iArea i i(N/mm2)

International Journal of Advance and Innovative Research Volume 6, Issue 2 (XXX): April – June, 2019
213
ISSN 2394 - 7780
i Fig-5:iCompressive istrength imachine iwith i icube
2.1.5.2 i iSlump itest This itest iis idefined ias ithe itest iin iwhich ithe iworkability iand icreep iof ithe iconcrete iare icalculated. iFor testing ithe islump iwe ineed ifreshly iprepared iconcrete iwhich ihas ito ibe itested.
Now ithe iconcrete iis ipoured iinto ithe iapparatus iand ithe icompaction irule ishould ibe ifollowed. iAfter filling iit iupper icone iwill iremove iand ithe iplaced ibeside ithe isample iin ireverse idirection. iNow iheight difference iis iknown ias ithe islump ivalue..
Fig-6: Slump itest iof i iconcrete
3. RESULT & DISCUSSION
3.1. iCompressive istrength itest
STANDARD With i5% imix With i10% imix With i15% imix 7 idays 13.5 iN/mm2 13.4 iN/mm2 13.6 iN/mm2 12.8 iN/mm2
14 idays 17.8 iN/mm2 18 iN/mm2 17.6 iN/mm2 17 iN/mm2 28 idays 19.8 iN/mm2 19.5 iN/mm2 19 iN/mm2 18.2 iN/mm2
Graph: compression iof icompressive istrength

International Journal of Advance and Innovative Research Volume 6, Issue 2 (XXX): April – June, 2019
214
ISSN 2394 - 7780
3.2. SLUMP iTEST
STANDARD With i5% imix With i10% imix With i15% imix SLUMP(mm) 52 45 40 56
4. CONCLUSION Form ithe iabove iresult iwe ican isay ithat ithe icompression ivalue ifor ithe iplastic imix iconcrete iis iincreased iwhen iit iis imixed iwith i5% iand i10%.
• From ithe iabove iresult, iwe ialso iconclude ithat ithe iworkability iwill ibe iaffected iby iwaste iplastic imixing.
• With ithe ihelp iof ithe iabove itables iand ifig iwe ialso iconclude ithat iafter imixing imore ithan i10% iplastic ithe icompression ivalue idecreases igradually. i
• For ipreserving ithe inatural iresource iwe ihave ito iutilize iwaste imaterials ilike iplastic ito ireduce ienvironmental iwaste.
• It ishould ibe ia ibetter ialternative ito ithe inatural iaggregate.
REFERENCES [1] Siddharth i iP. iUpadhyay i iand i iM.A. iJamnu i i“Effect ion iCompressive istrength iof iHigh
Performance iConcrete” iInternational iJournal iOf iInnovative iResearch i& iDevelopment, iISSN i2278-0211, ivolume i3, iissue i2,pp.124-128, iFebruary i2014.
[2] M.Srishaila, iAdarsh iUttarkar, iPrakash iParasivamurthy i“Experimental iStudy ion iHigh-Performance Concrete, iwith iMixing iplastic imaterial” iInternational iJournal iof iEngineering iTrends iand Technology i(IJETT) i– iVolume i12 iNumber i5 i- iJun i2014Potholes ireview: iProgress ireport, Department ifor iTransport, iDecember i2011.
[3] Anderson, iD. iA., iThomas, iH. iR., iand iKilareski, iW. iP., i“Pothole iRepair iManagement: iAn Instructional iGuide,” iPTI i8202, iPennsylvania iTransportation iInstitute, iPennsylvania iState University, iUniversity iPark, iPa., i1982. i i
[4] Kandahl, iP. iS. iand iMellot, iD. iB., i“A iRational iApproach ito ithe iDesign iof iconcrete iPatching Mixtures.” iTransportation iResearch iRecord i821, ipp. i16-21.
[5] POTENTIAL iUTILIZATION iOF iSOLID iWASTE i i;V. iS. iAigbodion, iS. iB. iHassan, iT.Ause iand G.B. iNyior i; iJournal iof iMinerals i& iMaterials iCharacterization i& iEngineering, iVol. i9, iNo.1, pp.67-77, i2010
[6] IS iCode i: i456-2000, i“Plain iand iReinforced iConcrete i- iCode iof iPractice” iBureau iof iIndian Standards, iNew iDelhi, iIndia.
[7] IS: i10262-1982,“ iGuidelines ifor iConcrete iMix iDesign”, iBureau iof iIndian iStandards, iNew Delhi, iIndia i
[8] IS: i516-1959, i“Indian iStandard iCode iof iPractice-Methods iof iTest ifor iStrength iof iConcrete”, Bureau iof iIndian iStandards, iNew iDelhi, iIndia.

International Journal of Advance and Innovative Research Volume 6, Issue 2 (XXX): April – June, 2019
215
ISSN 2394 - 7780
WATER DESALINATION OF SALINE WATER USING MANUALLY MECHANICALLY POWERED AIR PUMP
Shamal Burman1, Sunny Bhatnagar2, Shubham Jain3 and Saurav Kumar4 Assistant Professor1 and Student2,3,4, Department of Civil Engineering, Poornima Institute of Engineering and
Technology, Jaipur
ABSTRACT The earth is also known as “blue planet“, because about 71 % of it is covered with water. Out of which only few is available to use for mankind. Mainly If we consider the sitapura industrial area in Jaipur, India. And other similar areas there are a major issue of underground water with high fluoride content. Lots of researches have been done on purification of water but we have not found any of their focus in using different energy source other than electricity. Some of the researcher used Tidal energy and solar energy for the pumping of water but we use a conventional cycle pump for generating pressure for the pumping of water, through which water passes from the semi-permeable membranes of R.O. and gets pure.
Keywords: Permeable membranes of R.O, conventional cycle pump
I. INTRODUCTION There significant increase in the scarcity of water in the whole earth. The water we can see in near future is not drinkable or not usable to any human needs. Seeking the problem many have tried different innovations and inventions to make the unusable water to usable. Seeking the problem, we are trying to solve it using our proposed system. The system we proposed is powered without electricity, which is making it usable in any far area and there are people who walk, cycle and drive to get clean water from far locations. With the help of our device they can get clean water, which is free from impurities that can cause harm to health and just some minutes of paddling over the pump one can get enough water to drink. With the purity of water through reverse osmosis we can guarantee the impurity free water to everyone. And its cost is too low as compared to conventional. The main USP of our project is that it can be used anywhere on this earth. We also have to use this on a large scale using wind and tidal energy in coastal areas, where saline water is a major issue.
II. STUDY AREA: JAIPUR CITY Jaipur is the capital city of the province of Rajasthan and is the 10thlargest city of India as indicated by statistics of 2011 with a population of 3646590.The city is located on predominantly flat plain and is surrounded by hills on then or, north east, and east sides. The remaining part of city contains a mixture of bare land, various types of vegetation, and built-up areas. Climate of the examination zone is for the most part semiarid and is portrayed by low precipitation, boundaries of diurnal, yearly Temperature and low dampness. Extensively, there are three seasons in a year: 1) winter season from November to February (cold evenings, normal air temperature drops up to 3.3 ◦ C); 2) summer season from March to June (very sweltering amid day, most extreme air temperature raises up to 48 ◦ C); and 3) storm season from July to October (wide variances in normal air temperature). The city is generally water rare with a normal yearly downpour fall of roughly 55 cm thought for the most part amid the storm season. Vegetation spread and farming are dependent on rainfall during the monsoon season, and these decrease fundamentally amid summer season. Yields having low water prerequisites are rehearsed by extricating groundwater amid lean rainfall periods. The boundary of urban area of jaipur city has been derived by extracting urban area polygon from the Yearly Land Cover Type picture (MCD12Q1 result of MODIS, goals 463.3 m) of 2011. The length and width of urban territory polygon (in the future eluded as urban limit) are around 21 km in the north– south direction and 13km in the east– west direction. The limit of the investigation region has been characterized by taking a support of 12km around the urban boundary
Fig-1:. Jaipur study area

International Journal of Advance and Innovative Research Volume 6, Issue 2 (XXX): April – June, 2019
216
ISSN 2394 - 7780
III. METHODOLOGY Collect the ground water from the sitapura industrial area Fill the pressure cylinder by saline water Generate pressure from cycle pump up to 70psi and When pressure reach to 70psi pressure then allow water to pass through R.O. membrane
Fig-2: Flow chart of sample collection and assessment
IV. RESULT & DISCUSSION By the project get sufficient result for irrigation purpose. done some test like TDS,TS,TSS,ph,BOD and fluroide test.
Table 1 Parameter Before treatment After treatment Permissible limit
TDS 2500 1800 2000 TS 3000 1950 2200
TSS 500 150 200
Table 2 Parameter Before treatment After treatment Permissible limit
Ph 9 7.5 6.5-8.5 BOD 10 0 100 color 100 5Hz 25Hz
Table 3 hardness 1000 100 600
According to Table 1 we do test of TDS,TS,TSS and get normal result because R.O. minimise the total solids and total dissolved solids.According to Table 2 our project can reduce the darkness color in water and maintane BOD and ph.According to Table 3 rearly fluroide can pass through R.O. so R.O. minmise the fluroide and clorine content from water. R.O. reduce the hardness of water.
V. PROJECT PHOTOGRAPHS
Fig-3: Attachment of cylender with cycle pump
Fig-4: Attachment cylneder with RO Memberen

International Journal of Advance and Innovative Research Volume 6, Issue 2 (XXX): April – June, 2019
217
ISSN 2394 - 7780
from fig 3 project is shown and a cycle pump is used to generating pressure in matel cylinder when cylinder pressure is reach upto 70Psi water will come through R.O. and we get output.
VI. FUTURE SCOPE The project can be used as domestic,industrial and aggricultural way for example in jaipur and nagaur area, a very rapid increase of fluroide content has been seen,as water is extraced from deeper wells. In those area this project can use on a small scale. Our system can be use without electricity anywhere on this earth. A paddling of 4-5 minutes of the pump can provide enough water for a singal person. It good to use for a small family. We have some plan for its large scale version by using wind and tidal energy in coastal area.
VII. CONCLUSION From our adopted methodology, we came to see varied future applications of our project. From the result obtained, it seems to be a game changer in removing salt and fluroide from affected areas. The test result showed significant removal upto stanfard permissible limits.
REFERENCES [1] Jang, T.; Lee, S.B.; Sung, C.H.; Lee, H.P.; Park, S.W. Safe application of reclaimed water reuse for
agriculture in Kora. Paddy Water Environ. 2010, 8, 227–233. [CrossRef]
[2] Bauder, T.A.; Waskom, R.M.; Sutherland, P.L.; Davis, J.G. Irrigation Water Quality Criteria; Colorado State University Extension: Fort Collins, CO, USA, 2011.
[3] Ayers, R.S.; Westcot, D.W. Water Quality for Agriculture; Food and Agriculture Organization of the United Nations: Rome, Italy, 1985.
[4] Smith, V.H.; Tilman, G.D.; Nekola, J.C. Eutrophication: Impacts of excess nutrient inputs on freshwater, marine, and terrestrial ecosystems. Environ. Pollut. 1999, 100, 179–196. [CrossRef]
[5] Jimenez, B. Treatment technology and standards for agricultural wastewater reuse: A case study in Mexico. Irrig. Drain. 2005, 54, S22–S33. [CrossRef]
[6] Forslund, A.; Ensink, J.H.J.; Battilani, A.; Kljujev, I.; Gola, S.; Raicevic, V.; Jovanovic, Z.; Stikic, R.; Sandei, L.; Fletcher, T.; et al. Faecal contamination and hygiene aspect associated with the use of treated wastewater and canal water for irrigation of potatoes. Agric. Water Manag. 2010, 98, 440–450. [CrossRef]
[7] Evans, A.E.V.; Hanjra, M.A.; Jiang, Y.; Qadir, M.; Drechsel, P. Water pollution in Asia: The urgent need for prevention and monitoring. Water Qual. 2012, 9, 1–4
[8] Fageria, N.K.; Baligar, V.C.; Wright, R.J. Iron nutrition of plants: An overview on the chemistry and physiology of its deficiency and toxicity. Pesq. Agropec. Bras. 1990, 25, 553–570.
[9] Shatanawi, M.; Fayyad, M. Effect of Khirbet As-Samra treated effluent on the quality of irrigation water in the central Jordan Valley. Water Res. 1996, 30, 2915–2920. [CrossRef]
[10] Global Water Resources and Water for Agricultural Use in Japan.Availableonline:http://www.maff.go.jp /j/nousin/keityo/mizu_sigen/pdf/mizusigen_e.pdf (accessed on 20 April 2016).
[11] APHA, Standard methods for the examination of water and wastewater, American Public Health Association, Washington, DC, 2005.

International Journal of Advance and Innovative Research Volume 6, Issue 2 (XXX): April – June, 2019
218
ISSN 2394 - 7780
CASE STUDY ON THE WATER QUALITY ASSESSMENT OF JAWAI RIVER, RAJASTHAN
Sandeep Sukhwal1, Mohit Agarwal2, Mohit Meena3 and Manish Gautam4 Assistant Professor1 and Students2,3,4, Poornima Institute of Engineering & Technology, Jaipur
ABSTRACT The water quality is now more focused than the quantity due to the environmental problems such as pollution which is increasing at an alarming rate. Keeping this point in our mind we have done a case study on the water quality assessment of Jawai River located in Rajasthan as its water is transported and used in various cities of Rajasthan such as Udaipur, Pali, Jalore etc. We have taken the water samples from three different points (upstream and downstream) and then we have conducted physical , chemical and biological test such as ph, TDS, conductivity , hardness , calcium , magnesium , nitrogen, iron , fluoride , coliforms etc. After conducting the test we have compared our results with the Indian Standards and came to know that some of the parameter are not in the permissible limit and affect the quality of water,
Index Terms: Coliforms, Permissible Limit.
1. INTRODUCTION Water quality alludes to the compound , physical and natural attributes of water. It is a proportion of the state of water in respect to the prerequisites of at least one biotic animal groups and additionally to any human need or reason [1]. It is most much of the time utilized by reference to a lot of measures against which consistence, for the most part accomplished through treatment of the water, can be surveyed. The most widely recognized principles used to survey water quality identify with wellbeing of environment, security of human contact, and drinking water.
Water contamination is the sullying of water bodies (for example lakes, waterways, seas, aquifers and groundwater). This type of ecological debasement happens when toxins are legitimately or by implication released into water bodies without satisfactory treatment to evacuate destructive mixes. Water contamination influences the whole biosphere of plants and creatures living in these water bodies, just as living beings and plants that may be presented to the water. In practically all cases the impact is harming not exclusively to singular species and populaces, yet in addition to the normal natural networks. The Jawai is a waterway of Rajasthan state in Western India. It is a tributary of the Luni River, The river flows south-west and enters the Thar Desert before dissipating into the Rann of Kutch. The Banas is approximately 495 kilometres in length.
The Jawai originates in Udaipur district in Aravalli Range.Suleri river is its main tributery.It joins Khari river in Jalore district near Sayala.The river flows in north-west direction for about 96km. its Catchment area is 2976 km2 in Udaipur,Pali and Jalore District.
Western Rajasthan’s largest dam, Jawai Dam. Is located near Sumerpur in Pali District. The twin cities Sumerpur and Sheoganj in Sirohi district is also located on the bank of Jawai River.
2. OBJECTIVE OF CASE STUDY The objective of case study is to assess the water quality of Jawai River, Rajasthan.This study has been conducted to find out the physical ,chemical and biological characteristics of water sample.The test includesPh,Total dissolved solids, Electrical Conductivity, Totalhardness, calcium, magnesium, chloride, sulphate, nitrate,iron and fluoride content,dissolved oxygen,alkanity,total and fecal coliform. Samples have been collected in bottles and were analysed for physio-chemical characteristics APHA(1980).Some of the tests such as Calcium magnesium,sulphate,nitrate iron and fluoride content and total and fecal coliforms.

International Journal of Advance and Innovative Research Volume 6, Issue 2 (XXX): April – June, 2019
219
ISSN 2394 - 7780
3. METHODOLOGY All the test were performed as per the Indian Standards and the procedure was strictly followed as given in Bureau of Indian Standards. The following table shows the method used in testing water sample.
Table-1: Testing Method of Sample Water S.No Parameter Method
1. Ph Ph meter 2. Total Dissolved Solid TDS meter 3. Electrical Conductivity Conductivity meter 4. Total Hardness EDTA 5. Chloride Titration by AgNo3 6. Calcium EDTA 7. Magnesium EDTA 8. Sulphate Turbidity Meter 9. Nitrate UV Spectrophotometer
10. Iron Spectrophotometer 11. Flouride APHA-22 12. Dissolved Oxygen 13. Alkanity Titration by H2So4 14. Total Coliform IS-1622-1981 15. Fecal Coliform IS-1622-1981
4. RESULTS & DISCUSSION The physio-chemical characteristics and phytoplankton composition was quite variable. But overall water can be used for drinking pourpose as almost all the contents were not in high range but in normal range and it shows that the satisfactory results were obtained.
The following table shows that the permissible limit of testing parameters
Table-2: Permissible limit of Drinking Water S.No. PARAMETER PERMISSIBLE LIMIT
1. Ph 6.5-8.5 2. Total Dissolved Solid 500-2000mg/L 3. Electrical Conductivity Upto 1500micro s /cm 4. Total Hardness 200-600mg/L 5. Chloride 250-1000mg/L 6. Calcium 75-200mg/L 7. Magnesium 30-100mg/L 8. Sulphate 200-400mg/L 9. Nitrate Upto 45mg/L
10. Iron 0.3mg/L 11. Flouride - 12. Dissolved Oxygen - 13. Alkanity 200-600 mg/L 14. Total Coliform 10 max 15. Fecal Coliform Negative
Upstream left side
The below given table shows the obtained results of various parameters.
Table-3: Testing Result of Sample Water S.No. PARAMETER LIMIT
1. Ph 7.2 2. Total Dissolved Solid 162mg/L 3. Electrical Conductivity 350micro s /cm 4. Total Hardness 615mg/L 5. Chloride 324mg/L 6. Calcium 32.1mg/L

International Journal of Advance and Innovative Research Volume 6, Issue 2 (XXX): April – June, 2019
220
ISSN 2394 - 7780
7. Magnesium 17.6mg/L 8. Sulphate 20.1mg/L 9. Nitrate 3.9mg/L 10. Iron Nil 11. Flouride 0.42mg/L 12. Dissolved Oxygen 6.1mg/L 13. Alkanity 162mg/L 14. Total Coliform 1.3MPN 15. Fecal Coliform Negative
Upstream right side The below given table shows the obtained results of various parameters
Table-4: Testing Result of Sample Water SNo. PARAMETER LIMIT
1. Ph 6.7 2. Total Dissolved Solid 172mg/L 3. Electrical Conductivity 343micro s /cm 4. Total Hardness 415mg/L 5. Chloride 224mg/L 6. Calcium 38.6mg/L 7. Magnesium 15.8mg/L 8. Sulphate 18.2mg/L 9. Nitrate 4.1mg/L
10. Iron 0.03mg/L 11. Flouride 0.36mg/L 12. Dissolved Oxygen 172mg/L 13. Alkanity 154mg/L 14. Total Coliform 1.0MPN 15. Fecal Coliform Negative
Up stream right center The below given table shows the obtained results of various parameters.
Table-5: Testing Result of Sample Water SNo. PARAMETER LIMIT
1. Ph 6.5-8.5 2. Total Dissolved Solid 150mg/L 3. Electrical Conductivity 367micro s /cm 4. Total Hardness 835mg/L 5. Chloride 336mg/L 6. Calcium 32.6mg/L 7. Magnesium 17.4mg/L 8. Sulphate 20.2mg/L 9. Nitrate 4.6mg/L
10. Iron Nil 11. Flouride .43mg/L 12. Dissolved Oxygen 6.1mg/L 13. Alkanity 154 mg/L 14. Total Coliform 1.3MPN 15. Fecal Coliform Negative
Up stream left centre The below given table shows the obtained results of various parameters.
Table-6: Testing Result of Sample Water SNo. PARAMETER LIMIT
1. Ph 7.5 2. Total Dissolved Solid 154mg/L

International Journal of Advance and Innovative Research Volume 6, Issue 2 (XXX): April – June, 2019
221
ISSN 2394 - 7780
3. Electrical Conductivity 360micro s /cm 4. Total Hardness 425mg/L 5. Chloride 331mg/L 6. Calcium 35.8mg/L 7. Magnesium 13.9mg/L 8. Sulphate 17.8mg/L 9. Nitrate 4.2mg/L
10. Iron 0.001mg/L 11. Flouride 0.4mg/L 12. Dissolved Oxygen 154mg/L 13. Alkanity 177 mg/L 14. Total Coliform 1.6MPN 15. Fecal Coliform Negative
1. Down stream centre The below given table shows the obtained results of various parameters.
Table-7: Testing Result of Sample Water SNo. PARAMETER LIMIT
1. Ph 6.3 2. Total Dissolved Solid 183mg/L 3. Electrical Conductivity 396micro s /cm 4. Total Hardness 830mg/L 5. Chloride 174mg/L 6. Calcium 30.5mg/L 7. Magnesium 11.9mg/L 8. Sulphate 15.9mg/L 9. Nitrate 3.9mg/L
10. Iron 0.02mg/L 11. Flouride 0.6mg/L 12. Dissolved Oxygen 8.3mg/L 13. Alkanity 372 mg/L 14. Total Coliform 10 max 15. Fecal Coliform Negative
2. Down stream side 1 The below given table shows the obtained results of various parameters.
Table-8: Testing Result of Sample Water SNo. PARAMETER LIMIT
1. Ph 5.8 2. Total Dissolved Solid 182mg/L 3. Electrical Conductivity 367micro s /cm 4. Total Hardness 820mg/L 5. Chloride 332mg/L 6. Calcium 33.6mg/L 7. Magnesium 12.7mg/L 8. Sulphate 10.3mg/L 9. Nitrate 4.7mg/L
10. Iron Nil 11. Flouride 0.6mg/L 12. Dissolved Oxygen 7.5mg/L 13. Alkanity 178 mg/L 14. Total Coliform 1.2MPN 15. Fecal Coliform Negative

International Journal of Advance and Innovative Research Volume 6, Issue 2 (XXX): April – June, 2019
222
ISSN 2394 - 7780
3. Down stream side 2. The below given table shows the obtained results of various parameters.
Table-9: Testing Result of Sample Water SNo. PARAMETER LIMIT
1. Ph 6.9 2. Total Dissolved Solid 168mg/L 3. Electrical Conductivity 348micro s /cm 4. Total Hardness 935mg/L 5. Chloride 304mg/L 6. Calcium 42.7mg/L 7. Magnesium 19.5mg/L 8. Sulphate 23.2mg/L 9. Nitrate 4.4mg/L
10. Iron 0.003mg/L 11. Flouride 0.33mg/L 12. Dissolved Oxygen 168mg/L 13. Alkanity 165mg/L 14. Total Coliform 1.2MPN 15. Fecal Coliform Negative
5. ACKNOWLEDGMENT We are very thankful to Mr.Sandeep Sukhwal , Associate Professor, PIET , Jaipur , who guided us in each and every step of our research work and given us his valiable guidance to our work.
We expresses our gratitude to Mr. Pran Nath Dadhich,HOD, Civil Department,PIET, Jaipur, who helped us in allowing to carry out our research work and guiding us.
6. REFERENCES 1. Ebina, J., Tsutsui, T., & Shirai, T. (1983). Simultaneous determination of total nitrogen and total phosphorus
in water using peroxodisulfate oxidation. Water research, 17(12), 1721-1726.
2. Patton, Charles J., and Jennifer R. Kryskalla. Methods of analysis by the US Geological Survey National Water Quality Laboratory: evaluation of alkaline persulfate digestion as an alternative to Kjeldahl digestion for determination of total and dissolved nitrogen and phosphorus in water. No. 2003-4174. 2003.
3. Liu, Changming, and Jun Xia. "Water problems and hydrological research in the Yellow River and the Huai and Hai River basins of China." Hydrological Processes 18.12 (2004): 2197-2210.
4. Liu, X. H., and X. J. Yu. "Research on Standardization of Compensation for Trans-regional Water Pollution Based on Protection of Water Eco-system in River Valley——An Empirical Analysis of Tai Lake Basin [J]." Ecological Economy8 (2007): 129-135.

International Journal of Advance and Innovative Research Volume 6, Issue 2 (XXX): April – June, 2019
223
ISSN 2394 - 7780
A CASE STUDY ON GREY WATER MANAGEMENT IN SHEKHAWATI REGION
Sandeep Kumar Sukhwal1, Abdul Hadi Ansari2, Afroj Rangrej3 and Ashish Meena4 Assistant Professor1, UG Scholar2,3,4, Poornima Institute of Engineering and Technology, Jaipur
ABSTRACT The reuse of grey water can significantly reduce water consumption at homefor landscape irrigation. In addition to the benefits, the reuse of gray water leads to potential drawbacks which raise reasonable doubts about the impact on human health and the environment. This review uses a risk assessment system to assess the suitability of various regulations to ensure safe and sustainable reuse of gray water at the irrigation site. A review of existing global legislation is currently underway and a standardized assessment of the measures taken to protect public health and the environment. In many cases, human health problems are now dominated by regulatory strategies, and environmental risks are ignored or under-represented. The difference between individual households and several households has proved to be an essential element of regulation, which often leads to individual households using raw gray water. water control rules should be reviewed to introduce a more complex regulatory framework to avoid the major threats associated with the reuse of gray water, using the vast potential of this alternative water resource.
I. INTRODUCTION Resh water shortage is becoming one of the biggest problem among the world. In 21th the natural resource of potable water are insufficient to fulfill consumer demand. So people are searching for the solution how to solve this problem and how to face this problem, grey water reuse is a solutions to reduce fresh water demand. Now population increased day by day, so water demand increased in many sector like domestic, agriculture and industrial. Fresh water demand also increased with our living standard, unplaned urbanization, water pollution, industrialization
In India water crises is big issues because we do not have access amount of safe fresh water so conversation of grey water is one method . according to IWMI predicted per capita surface water availability will be drastically reduce by the 2050. Almost 13 states of India they facing the serious problem in managing water to user. And reported on 10th may 2016 in Livemint 300 districts of 13 states of
India facing shortage of drinking water. According to world bank minimum 21 cities will move towards zero ground water level.
Figure-1: per capita surface water availability in decreasing
And we reduce the fresh water demand to reuse the grey water for non potable purpose such as toilet flushing, floor washing, car washing, irrigation ,cleaning, landscape park, cooling water, ground water recharge etc recharge , irrigation purpose..
A person use 135l/p/d water in day .in 135l/p/d it produce the 95 l/p/d grey water and 30 l/p/d black water. acording to research we can reduce 35% domestic water demand .if grey water highly polluted then 20-25% of treated water can used for ground .
STUDY AREA: Narsingh Puri
Narsingh Puri is a Village which is located in Neem Ka Thana block in Sikar (rajasthan) 332706 India. Narsinghpuri village is belongs to Jaipur Division .it is located east of sikar and 52 km away from sikar, nearest town neemkathana located at 35 km away from town . Udaipurwati Tehsil towards North , Sri Madhopur Tehsil towards South , Neem Ka Thana Tehsil towards East , Piprali Tehsil towards west of Narsingh puri.

International Journal of Advance and Innovative Research Volume 6, Issue 2 (XXX): April – June, 2019
224
ISSN 2394 - 7780
Total Population of village is 3316
geographical area 608.4 hectare
No. Household 545
Total irrigated are in village is 141.79 hactare
Types crop cultivation ( wheat, mustard, milt)
Natural water source ( 5 gov. borwells and 20 personal borwells)
Water supply for cultivation 4 hours in summer, and 6 hours in winter.
Table No.1
Season (month) Range (in metre) minimum Maximum
Pre-monsoon(may) 4.98 61.48 Monsoon(august) 2.85 66.46
Post-monsoon(November) 2.70 62.24 Sources: ground water yearbook, 2005-06: rajasthan, CGWB,western region,jaipur march 2007,pp.96-98
Table No-2: Ground water quality Sr. no. Village Tahsil Block Fluoride Chloride calcium
1. Narsinghpuri Neem ka thana Neem ka thana 0.91 575 56
Table No-3 Sr. No. Constituents Desirable limit(mg/l) Max.permissible limit(mg/l)
1. Chloride 250 1000 2. Fluoride 1 1.5 3. Calcium 75 200
RAINFALL The mean annual rainfall is highest (536.6 mm) at Neem Ka Thana, which is located in the south eastern part of the district. It is lowest at Fatehpur (407.8 mm), which lies near north western boundary of the district. Climate is generally dry except during the monsoon period. Humidity is the highest in August with mean daily relative humidity of 80%.
The data has been collected from various government departments like Department of Irrigation and Water Resource, Central Groundwater Board (CGWB), Groundwater Yearbook, Department of Agriculture etc. From these departments various data and reports on the groundwater availability, depth etc have been collected. The data is collected, tabulated and analyzed by means of the Microsoft Excel computer software and wherever needed, arithmetic averages and percentages of the variables were also calculated. Further, the stage of groundwater development is assessed using the following formula and also as defined by CGWB.
The gross yearly groundwater draft is calculated for irrigation, domestic and industrial uses. The gross groundwater draft includes groundwater extraction from all existing groundwater structures during monsoon as well as non-monsoon period. Groundwater draft has been calculated differently for groundwater abstraction structures mainly dug wells, dug wells with pump, dug-cum-bore wells and tube wells considering per unit draft in an average period of operation. The units of assessment are categorized for groundwater development based on two criteria: (a) stage of groundwater development, and (b) long term trend of pre-and post-monsoon water levels.
METHODOLOGY In this method the grey water collected by combined outlets of following example washings and sinks and barthrooms from households in village narsinghpuri. from combined outlet of flowing water from bathrooms, washings and sinks from households in narsinghpuri.
In this project we designed a grey water treatment unit of capacity 500ltr restricted to two stage of physical operations (screening and sedimentation and filtration ) and lastly a UV ray bulb provided in supply line pipe for killing micro bacteria from water. This unit is usefull for two houses to treat and to reuse household grey water.

International Journal of Advance and Innovative Research Volume 6, Issue 2 (XXX): April – June, 2019
225
ISSN 2394 - 7780
SLOW SAND FILTER Slow sand filters are shallow layers of stone, medium gravel, and pea gravel beneath a 3 2 deep layer of sand. A slow sand filter will have grey water load of 0.1 to 0.2 m /m /hr. The slow sand filter is shown in Figure 8. These gravity filters may be constructed in a 200 liter drum or similar container that is of suitable size. Features that should be part of a filter include a perforated plate or some other device to distribute water evenly over the top, a concrete funnel in the bottom to help water drain to the perforated drain pipe, and a cover and vent to prevent odors. The bottom of the filter should be filled with stones that are too large to enter the drain pipe. Slow sand filters require regular cleaning and replacement of the top layer of media. Multi-media filters require less frequent cleaning, but all layers must be cleaned or replaced when maintenance is required.
Figure-2: filtration design
RESULT AND DISCUSSION In Narsinghpuri region we found that the collection and use of grey water can reduce 35% domestic water demand which helps in conservation of natural fresh water and entire design system provide household and irrigational water at low cost.By adopting grey water management we can reduce wasting of valuable water and also decrease water pollution which created by mixing of black and grey water.
CONCLUSION The shekhawati region is dry area and people have to collect and reuse treated grey water in various household or agriculture irrigational purpose to promote saving of water and reuse of valuable natural resources. Shakhawati region is already suffering from shortage of ground water and the water is also containing hardness , fluoride which is harmful for human health as well as household work. Grey water treatment and use remove burden over supply system in various monsoon conditions.

International Journal of Advance and Innovative Research Volume 6, Issue 2 (XXX): April – June, 2019
226
ISSN 2394 - 7780
ANALYSIS OF STRENGTH OF CONCRETE BLOCK BY REPLACING SAND WITH RECYCLED WASTE PLASTIC
Ayush Goyal1, Ritak Singh2, Khushboo Meena3 and Komal Chhabbarwal4 Assistant Professor1, UG Scholar2,3,4, Poornima Institute of Engineering and Technology, Jaipur
ABSTRACT This paper presents a method to show the strength of concrete by the addition of recycled waste plastic i.e., thermoplastic. Almost Nine samples of concrete prepared and the strength of concrete is being checked along an interval of three to fourteen days by adding 0%, 5% and 10% of fine aggregates of recycled waste plastic. For each sample workability and compressive strength test was conducted. After curing, compressive strength at 3 and 14 days was obtained. From test result it was found that when recycled waste plastic is being added from 0% to 10% of fine aggregates, the compressive strength of concrete decreased by the 6.7%, at 3 days and 11.8% at 14 days.
Keywords: Compressive Strength, Concrete, Plastic Waste, Curing, Workability, Replacement.
1. INTRODUCTION 1.1 General A few decades ago plastic was invented and became a boon for human civilization. But it has its negative effects too. With the help of researches it came to known that it is non biodegradable and is a threat to environment as it causes different type of pollution like water pollution, soil degradation, air pollution etc. So there was a need to curb this. So people started recycling it in various ways. One of the ways is discussed in this paper where we have used plastic waste for making concrete blocks. According to reports the annual consumption of plastic materials has increased from around 5 million tons in 1950s to nearly 100 million tons in 2001. The aim to investigate the effect of recycled waste plastic on strength of concrete.
1.2 Details of Specimens The experimental program consists of casting and testing of 9 cubes for determining compressive strength. The size of cube is (150x150x150) mm. The specimens are classified into three groups. The first group is with 0% of plastic second is with 5% of plastic and third is with 10% of plastic. These cubes are used for testing compressive strength after 3 days and 14 days.
1.3 Material used and Mixing Concrete is used as the main material in making blocks. The concrete has been mixed in the ratio of 1:1.5:3
i.e. M20 (cement: sand: coarse aggregates) and water cement ratio was 0.46. The other material used is listed below:
Cement: Portland cement
Sand: Fine aggregates having specific gravity of 2.7.
Coarse aggregates: Max. Size of 12.5mm and specific gravity of 2.72 was used.
Plastic waste: Plastic waste with 0%, 5% and 10% by replacing it with sand. Plastic used is thermoplastic which is used for making plastic furniture’s.
Water: Clean and fresh water was used for mixing and curing of concrete blocks.
First we added sand and coarse aggregates and then added cement into it followed by gradual mixing of fresh water, mixing is done till a homogenous blend is formed.
1.4 Casting Moulds are cleaned with fresh water and oiled before casting .Then they are put on the level area and they are filled with the homogenous mixture of concrete. Molds surface are being leveled with the help of trowel. After casting the molds are put on the vibrating machine to remove the gases from concrete mixture. Then the molds are kept in the laboratory for one day.
1.5 Curing After one day of casting, the molds are removed and the concrete blocks are put into the fresh water for curing for periods of 3 and 14 days.

International Journal of Advance and Innovative Research Volume 6, Issue 2 (XXX): April – June, 2019
227
ISSN 2394 - 7780
2. METHODOLOGY The material collection from junk yard.
Making the proportions.
Tests are performed.
Find out strength of concrete block.
Comparison with normal concrete block.
3. OBJECTIVE To find out the compressive strength, and workability by using fine aggregates of waste plastic.
To utilize waste plastic by using it in making concrete blocks.
To minimize the cost
4 RESULTS 4.1 Volume of Cement, Sand, Coarse Aggregate 4.1.1 Volume of Cement a) Volume of cement = [ratio of cement/ratio of (cement + fine aggregate +coarse aggregate)] x
volume of raw material= (1/5.5)x1.5 =0.2727m3
Density of cement=1440kg/m3
Mass = volume x density=0.2727 x1440=392.688 kg/m3
Size of cube = 0.15m X 0.15m X 0.15m =0.003375 m3
Vol. of cement per cube=mass x size of cube=392.688 x 0.003375
Vol. of cement per cube =1.325 kg per cube
4.1.2 Volume of Sand (Fine Aggregate)
Volume of sand = [ratio of sand/ratio of (cement + fine aggregate +coarse aggregate)] x volume of raw material= (1.5/5.5)x1.5 =0.4098m3
Density of sand=1600kg/m3
Mass =volume x density=0.4098 x 1600=655.68 kg/m3
Size of cube = 0.15m X 0.15m X 0.15m =0.003375 m3
Vol. of sand per cube=mass x size of cube =0.003375 x655.68
Vol. of sand per cube =2.21 kg per cube
4.1.3 Volume of Coarse Aggregate
Volume of Coarse Aggregate = [ratio of sand/ratio of (cement + fine aggregate +coarse aggregate)] x volume of raw material = (3/5.5)x1.5 =0.8181m3
Density of aggregate=1600kg/m3
Mass = volume x density=0.8181 x 1600=1308.96kg/m3
Size of cube = 0.15m X 0.15m X 0.15m =0.003375 m3
Vol. of coarse Aggregate per cube =mass x size of cube =0.003375 x1308.96
Vol. of Coarse Aggregate per cube =4.42 kg per cube
Table-4.1: Quantity of Different Materials S.No Plastic Cement Sand Coarse aggregates
1 0% 1.325kg 2.21kg 4.42kg
2 5% 1.325kg 2.1kg 4.42kg
3 10% 1.325kg 1.990kg 4.42kg

International Journal of Advance and Innovative Research Volume 6, Issue 2 (XXX): April – June, 2019
228
ISSN 2394 - 7780
4.2 Slump Test This test is performed to know the consistency of concrete. The consistency shows how much water has been used to mix the mixture
Table-4.2: Results of Slump Test S.No Plastic (%) Sand (%) Slump (mm)
1 0 100 110 2 5 95 46 3 10 90 85
4.3 Compressive Strength Test This the most important idea which shows us the characteristics of concrete made by using waste plastic.
We can know with the help of single test whether the concreting has been done properly or not.
The compressive strength of the concrete block depends upon many factors like the ratio of water –cement, strength of concrete, strength of cement, quality of plastic used.
Test of compressive strength is done on the concrete blocks containing 0%, 5%and 10% of the waste plastic replaced by sand particles in the concrete mixture after 3 days and 14 days of casting moulds.
Table-4.3: Compressive Strength at 3 days for M20 grade S .No. %age of plastic powder replacement of
sand Compressive strength
N\mm2 at 3days 1 0 7.7 2 5 3.5 3 10 2.2
Table-4.4: Compressive Strength at 14 days for M20 grade S .No. %age of plastic powder replacement of
sand Compressive strength
N\mm2 at 14 days 1 0 18.8 2 5 16.6 3 10 12.2
5 CONCLUSION The Value of Slump is decreased by the use of recycled waste plastic
The compression strength of the concrete block is decreased at different proportions of recycled waste plastic (0 to 10 %).
The compressive strength at 0%, 5% and 10 % proportions of recycled waste plastic at 3 days at are 38.5%, 17.5% and 11%. This is decreased on increasing the proportions of recycled waste plastic.
The compressive strength at 0%, 5% and 10 % proportions of recycled waste plastic at 14 days at are 94%, 83% and 61%. This is decreased on increasing the proportions of recycled waste plastic.
Thus from this we came to know that the binding of plastic is for making concrete block as it decreases the strength of the block and leads to easy breakage of blocks. Hence it has been concluded that we can use the waste plastic for making non structural concrete members e.g. sidewalks, tiles, etc.
6 REFRENCES Jibrael MA, Peter F (2016) Strength and behavior of concrete contain waste plastic. J Ecosys Ecograph
6:186. Doi: 10.4172/2175-7625.10000186.
Study of the Strength Property of Concrete Using Waste Plastics and Steel Fiber. The International Journal Of Engineering And Science (IJES) || Volume || 3 || Issue || 5 || Pages || 09-11 || 2014 || ISSN (e): 2319 –1813 ISSN (p): 2319 – 1805
Ali Ergun (2011), “Effects of the usage of diatomic and waste granite powder as partial replacement of cement on the mechanical properties of concrete”, Construction and Building Materials.
United Nation Environrnent Program (2009) Converting waste plastic into resources, Industries andEconomic International Environment Technology Centre. Osaka /Shi,pp: -1-69.

International Journal of Advance and Innovative Research Volume 6, Issue 2 (XXX): April – June, 2019
229
ISSN 2394 - 7780
Siddique R, Khatib J, Kaur I (2008) Use of recycled plastic in concrete: A review. J waste manages 28:1835 – 1852.
Kumar KBV, Preaksh P (2006) use of plastic in the cement concrete pavement. Adv Mater Res J 15:1-21.
IS: 10262-1982, “Guidelines for Concrete Mix Design”, Bureau of Indian Standards, New Delhi, India.
IS: 2386-1963 (Part I to Part III), “Indian Standards Method of Test for Aggregate for Concrete”, Bureau of Indian Standards, New Delhi, India.
IS 383-1970, Specification for coarse and fine aggregate from natural sources for concrete (second revision), Bureau of Indian standards, New Delhi, India.

International Journal of Advance and Innovative Research Volume 6, Issue 2 (XXX): April – June, 2019
230
ISSN 2394 - 7780
A REVIEW ON TECHNOLOGIES USED BY NASA TO EXPLORE MARS
Mohit Bajpai1, Akash Panwar2, Janesh Kumar Chhaniwal3 and Jatin Tak4 Assistant Professor1, UG Scholar2,3,4, Poornima Institute of Engineering and Technology, Jaipur
ABSTRACT 20th century, our life on other planets has drastically changed we see ourselves to proceed towards reaching different planets and hold the key to discovery life outside of earth. This research paper comprises the technologies that we ever imagined it comprise of rover that is main technology of gaining the resources as images or the type of surface. There are more to discover through these technologies but till now what we have discovered is that there are organic molecules in sedimentary rocks dating to three million old.
Keywords: Planets, technologies, organic molecules, sedimentary rocks.
1. INTRODUCTION NASA: The National Aeronautics Space administration of the United States they work for the space programs, for the aerospace and aeronautics research it was established in 1958 [1]. If we look at past, we would see that there is a large advancement in the technologies for the exploration of the space, the decision that we took long ago is now showing its results through these technologies [2-3]. These technologies are very useful in the sustainability development, economic feasibility and NASA has now has the potential that they could solve the global problems [4]. It could be clearly seen that each and every time NASA HAS made records through their remarkable technologies that could get images of the space or working for the existence of the life on other plants all of these truly shows the hard work, knowledge and the efficacy of the NASA space Program. The whole credit of the team of the development of these technologies as it requires a tank loaded brain to solve the problems of the Space and research development [5]. NASA is always looking forward to new concept that includes telescopic swarms and the technologies which include mapping of the surfaces.
NASA, the opportunity to explore innovating ideas that could increase the potential of earlier technologies [Fig. 1].
. Fig-1: Technology used by NASA for mars mission
2. TECHNOLOGIES THAT WERE USED FOR MARS MISSION The main object of NASA is to push its boundary and lead their innovations give the contribution towards the development of the future. NASA has proven time and time again how intrinsic it is in developing space technologies that then are innovated into consumer products which further sustainable development. One of the major parts of sustainable development is fixing environmental disasters which NASA has proven to excel at. These balls absorb the oil that would otherwise decimate unique ecosystems and even serve as a kind of fish food when they decompose (US Space Program Benefits). In addition, NASA protected people using a technology originally developed to protect space technology [6].

International Journal of Advance and Innovative Research Volume 6, Issue 2 (XXX): April – June, 2019
231
ISSN 2394 - 7780
2.1 Rovers Rovers are created as a mechanical equipment that could move from one place to another as shown in Fig. 2. There are different type of maste mounted which gives 360 degree view with two eyed like humans which could help in exploring the images could include microscopic imager for taking close shots of the rocks and soil. These are also used for determining minerology and different types of land [7].
Fig-2: Mars 2020 Rover
2.2 Propulsion 2.2.1 Modifying a Rocket The most powerful vehicle that uses large amount of energy that is in more development in the vehicle is delta || “heavy” rocket. On august 2004, the seventh mission of mercury was launched. NASA has more than 40 successful launches.
2.2.2 Reason for Differences As the distance between earth, mars and sun changed in between two rovers launch periods. So, it took different amount of energy [Fig. 3].
Fig-3: Technologies far away in space
2.3 Power innovation for Mars Mission The source of power taken into work for running the mission is of solar power type solar arrays are setup on panels which were specially design to maximize the area of solar cells that derived energy from sun. The solar cells collect energy from sunlight.
Later on, NASA added up triple junction. And this was implemented on space 1 mission, these cells are able to absorb more sunlight and can supply more to the rover’s re-chargeable lithium batteries [8].
These rovers were able to produce about 900watt hours of energy per day, which provides sufficient time for the exploration as shown in Fig 4.

International Journal of Advance and Innovative Research Volume 6, Issue 2 (XXX): April – June, 2019
232
ISSN 2394 - 7780
Fig-4: Solar technology in space
2.4 Telecommunication innovation for Mars Exploration The ROVERS “talk” to Mars Odyssey, which is constantly orbiting the red planet. It takes the orbiter to go from horizon to horizon for about 10 minutes. There is rover’s UHF antenna which communicate s with odyssey which is only come due to the increase of technology from the vast majority of science data [5].
Another spacecraft, returned about eight percent of all data before the spacecraft stopped communication with earth in November 2006, following 10 years of operation [Fig. 5]. A small amount of data has been returned directly to earth via the X – band link. Orbiter with more capable X- band communication system can transmit data to earth at a faster rate. The antenna is built to receive data and they built on spacecraft and is limited given all of it that rely on them [2].
Fig-5: Telecommunication in space
2.5 Engineering in Space It is built by path finder autonomy developed by Camegie Mellon University. Two other embedded applications combine software and hardware performance [Fig 6]. It stabilizes motor control fist. The rover wheels and the brushes on the rock abrasion tools. The time flight component is a battery-controlled board that balances the charge on batteries, control the clock. A total of twenty cameras aid and the twin rovers are there in search for the past presence of water on mars. The mission provides the highest resolution pictures of mars. These are the advancement of cameras that work on other planets [3-4].
For the new exploration by computing and commanding the technologies that operates the spacecraft. It also helps in operating the rovers and for monitoring the robotic missions and for navigation and to avoid accidents software. Engineers on Earth are sent sequence of details of the different tests that are done by the rovers to explore the conditions of the Mars.
International Journal of Advance and Innovative Research Volume 6, Issue 2 (XXX): April – June, 2019
233
ISSN 2394 - 7780
Fig-6: Software Engineers working on Technologies
3. Result of these technologies searching the Signs of Water and life conditions [6] The Mars exploration done by NASA which could be seen through the researches that the microbial life with the normal conditions. The rovers that shows us the more information of the surface conditions of the MARS planet [Fig 7].
Fig-7: A high resolution image by the Mars Exploration Rover
3.1 Soaked in Salty Waters Long Ago As far the Mars is seen to be as planet that a place where life could be possible but we have highly seen the presence of the Acidic soaked areas where the presence of water could be more acidic which could be a more research could be done in the conditions of water.
4. CONCLUSION Currently, NASA focuses on the search of life and water, as the main part for Mars research, and has created huge amount of success in missions the space agency is now at a position where they could answer the questions about life and existence of living on Mars. But it’s not the end there is still investigation for their chemical and fossil.
REFERENCES [1].https://www.nasa.gov/mission_pages/station/research/nlab/ref_pubs.htm
[2].https://history.nasa.gov/refcoll.html
[3].https://www.hq.nasa.gov/oss/docs/LibSer_SOP_Ref.pd
[4].www.informationvine.com/NASA+Research
[5]. The case for mars – Robert Zubrin
[6]. Mars Direct - Robert Zubrin
[7]. Hoffman, S. J., & Kaplan, D. I. (1997). Human exploration of Mars: the reference mission of the NASA Mars exploration study team.
[8] Swanson, T. D., & Birur, G. C. (2003). NASA thermal control technologies for robotic spacecraft. Applied thermal sengineering, 23(9), 1055-1065.

International Journal of Advance and Innovative Research Volume 6, Issue 2 (XXX): April – June, 2019
234
ISSN 2394 - 7780
LUNG NODULES DETECTION FROM CT SCAN IMAGES
Mohit Bajpai1, Akash Panwar2, Yashvi Saxena3 and Vibhuti Gupta4 Assistant Professor1, UG Scholar2,3,4, Poornima Institute of Engineering and Technology, Jaipur
ABSTRACT In the world of today people do not actually pay attention towards their own health but are engaged into activities that lead to the destruction of their lives.
A. 159,000 people die each year from lung cancer.
B. Approx, 4,800 deaths were associated with asbestos exposure.
C. Every 02:30 minutes someone is diagnosed with lung cancer.
D. One the every four-cancer deaths are from lung cancer.
Lung cancer is one of the most prevailing cancer types. The very reason for this is it is not diagnosed at the very end till it has spread and by the time it becomes difficult to treat. Pre-detection of lung cancer can thus increase the chances of survival of a cancer patient for which , an effective nodule detection system can play a key role in early detection of lung cancer thus increasing the chances of the successful treatment. Here, we have proposed a effective and reliable framework for lung nodule classification.
IndexTerms: Component, prevailing, cancer, diagnosed, detection.
1. INTRODUCTION CANCER is nowadays become a commonly occurring disease (that is we regularly here about it in our daily lives either in the newspaper or our surroundings) [1]. It is and has been a major cause for decrease in rate of life expectancy or we can say the average period of living of a human being has reduced from that of the ancient times to that of now [Fig 1]. Cancer is an assembly of diseases in which there are abnormal development of cells which have the ability to spread in different parts of the body (they can be opposite with benign tumors, which do not spread). More than 100 types of cancers affect humans [2].
1. Framework consists of several different steps, including image contrast enhancement, division, optimum facility extraction, after which there is employment for these facilities for training and testing of the support vector machine.
2. Test the efficiency of technology using the famous Lung Image Consortium Database (LIDC) Dataset.
3. Empirical results show that technology is highly effective in reducing false positive rates. Able to get an impressive sensitivity rate of 97.45%.
Fig-1: Live screening Cancer
2. SEGMENTATION [3] Major points of contribution of the proposed technique includes The hierarchical block structure is used to preserve the image details such as nodules and blood vessels.
Image contrast is enhanced in frequency domain and image details are preserved.
Extraction of the most discriminative features from lung nodules.

International Journal of Advance and Innovative Research Volume 6, Issue 2 (XXX): April – June, 2019
235
ISSN 2394 - 7780
3. MATERIALS AND METHODS [4-5] The performance of an accurate lung nodule detection is mainly dependent on the image contrasting enhancing and the accurate feature extraction. The image is further divided in various non-overlapping blocks and the non-informative blocks are filtered. In next step, thresholding is applicable for extraction of lung region. Finally, SVM classifier is trained and tested on the extracted features in classifying nodules and non-nodules [Fig 2].
Fig-2: CT Scan process [1-5]
1. Preprocessing [Fig 3]
Fig-3: CT Scan Image processing [1-5]
2. Thresholding 3. Background Removal-
4. Candidate Nodule Extraction-
5. Candidate Nodule Pruning
6. Support Vector Machine (SVM) for Nodule and Non-Nodule Classification
The classification of patterns is described as the task of categorizing any object in a specified class type [Fig 4]. SVM’s basic idea is to build a hyperplane that maximizes the margin between positive and negative examples. The hyper plane is determined by the supporting vectors closest to the surface of the decision. The SVM finds the hyper plane of higher dimensional space in the training process and separates the nodules from non-nodules

International Journal of Advance and Innovative Research Volume 6, Issue 2 (XXX): April – June, 2019
236
ISSN 2394 - 7780
Fig-4: Comparison between specified class type [1-5]
4. CONCLUSION Lung cancer as discussed at the beginning is a great problem in the current scenario so as to scope up with which this framework is being proposed. This paper is in reference of, an effective and novel pulmonary nodule detection framework .Development in technology and techniques has brought about a drastic change to the whole world in some or the other way. As in the medical field for the new inventions of the cure of various prevailing diseases which have been increasing a lot lately, This framework is in line with the same motive for the whole world although a small step ,but can make a difference. Coming to the topic ,in the first part ,the various methods of the detection are shown starting with pre-detection, the difference of the images is enhanced that increases the robustness for separating images with varying differences. Contrasting of images before and after along with various other methods as in segmentation ,etc. Most CAD systems, have a common weakness that their system fail to perform well on low contrast medical images. The proposed method has reduced false positives significantly in nodule candidates by using the most discriminative texture features. In the future, we are planning to use evolutionary algorithms in order to search for optimal features. We would also like to ensemble different classifiers for performance improvement.
REFERENCES 1. Messay, T., Hardie, R. C., & Rogers, S. K. (2010). A new computationally efficient CAD system for
pulmonary nodule detection in CT imagery. Medical image analysis, 14(3), 390-406.
2. Mahadevia, P. J., Fleisher, L. A., Frick, K. D., Eng, J., Goodman, S. N., & Powe, N. R. (2003). Lung cancer screening with helical computed tomography in older adult smokers: a decision and cost-effectiveness analysis. Jama, 289(3), 313-322.
3. El-Baz, A., & Suri, J. S. (Eds.). (2011). Lung imaging and computer aided diagnosis. CRC Press.
4. Valk, P. E., Pounds, T. R., Tesar, R. D., Hopkins, D. M., & Haseman, M. K. (1996). Cost-effectiveness of PET imaging in clinical oncology. Nuclear medicine and biology, 23(6), 737-743.
5. Ashwin, S., Ramesh, J., Kumar, S. A., & Gunavathi, K. (2012, December). Efficient and reliable lung nodule detection using a neural network based computer aided diagnosis system. In 2012 International Conference on Emerging Trends in Electrical Engineering and Energy Management (ICETEEEM) (pp. 135-142). IEEE.

MANUSCRIPT SUBMISSION
GUIDELINES FOR CONTRIBUTORS 1. Manuscripts should be submitted preferably through email and the research article / paper
should preferably not exceed 8 – 10 pages in all.
2. Book review must contain the name of the author and the book reviewed, the place of publication and publisher, date of publication, number of pages and price.
3. Manuscripts should be typed in 12 font-size, Times New Roman, single spaced with 1” margin on a standard A4 size paper. Manuscripts should be organized in the following order: title, name(s) of author(s) and his/her (their) complete affiliation(s) including zip code(s), Abstract (not exceeding 350 words), Introduction, Main body of paper, Conclusion and References.
4. The title of the paper should be in capital letters, bold, size 16” and centered at the top of the first page. The author(s) and affiliations(s) should be centered, bold, size 14” and single-spaced, beginning from the second line below the title.
First Author Name1, Second Author Name2, Third Author Name3 1Author Designation, Department, Organization, City, email id 2Author Designation, Department, Organization, City, email id 3Author Designation, Department, Organization, City, email id
5. The abstract should summarize the context, content and conclusions of the paper in less than 350 words in 12 points italic Times New Roman. The abstract should have about five key words in alphabetical order separated by comma of 12 points italic Times New Roman.
6. Figures and tables should be centered, separately numbered, self explained. Please note that table titles must be above the table and sources of data should be mentioned below the table. The authors should ensure that tables and figures are referred to from the main text.
EXAMPLES OF REFERENCES All references must be arranged first alphabetically and then it may be further sorted chronologically also.
Single author journal article: Fox, S. (1984). Empowerment as a catalyst for change: an example for the food industry. Supply Chain Management, 2(3), 29–33.
Bateson, C. D.,(2006), ‘Doing Business after the Fall: The Virtue of Moral Hypocrisy’, Journal of Business Ethics, 66: 321 – 335
Multiple author journal article: Khan, M. R., Islam, A. F. M. M., & Das, D. (1886). A Factor Analytic Study on the Validity of a Union Commitment Scale. Journal of Applied Psychology, 12(1), 129-136.
Liu, W.B, Wongcha A, & Peng, K.C. (2012), “Adopting Super-Efficiency And Tobit Model On Analyzing the Efficiency of Teacher’s Colleges In Thailand”, International Journal on New Trends In Education and Their Implications, Vol.3.3, 108 – 114.

Text Book: Simchi-Levi, D., Kaminsky, P., & Simchi-Levi, E. (2007). Designing and Managing the Supply Chain: Concepts, Strategies and Case Studies (3rd ed.). New York: McGraw-Hill.
S. Neelamegham," Marketing in India, Cases and Reading, Vikas Publishing House Pvt. Ltd, III Edition, 2000.
Edited book having one editor: Raine, A. (Ed.). (2006). Crime and schizophrenia: Causes and cures. New York: Nova Science.
Edited book having more than one editor: Greenspan, E. L., & Rosenberg, M. (Eds.). (2009). Martin’s annual criminal code:Student edition 2010. Aurora, ON: Canada Law Book.
Chapter in edited book having one editor: Bessley, M., & Wilson, P. (1984). Public policy and small firms in Britain. In Levicki, C. (Ed.), Small Business Theory and Policy (pp. 111–126). London: Croom Helm.
Chapter in edited book having more than one editor: Young, M. E., & Wasserman, E. A. (2005). Theories of learning. In K. Lamberts, & R. L. Goldstone (Eds.), Handbook of cognition (pp. 161-182). Thousand Oaks, CA: Sage.
Electronic sources should include the URL of the website at which they may be found, as shown:
Sillick, T. J., & Schutte, N. S. (2006). Emotional intelligence and self-esteem mediate between perceived early parental love and adult happiness. E-Journal of Applied Psychology, 2(2), 38-48. Retrieved from http://ojs.lib.swin.edu.au/index.php/ejap
Unpublished dissertation/ paper: Uddin, K. (2000). A Study of Corporate Governance in a Developing Country: A Case of Bangladesh (Unpublished Dissertation). Lingnan University, Hong Kong.
Article in newspaper: Yunus, M. (2005, March 23). Micro Credit and Poverty Alleviation in Bangladesh. The Bangladesh Observer, p. 9.
Article in magazine: Holloway, M. (2005, August 6). When extinct isn't. Scientific American, 293, 22-23.
Website of any institution: Central Bank of India (2005). Income Recognition Norms Definition of NPA. Retrieved August 10, 2005, from http://www.centralbankofindia.co.in/ home/index1.htm, viewed on 7. The submission implies that the work has not been published earlier elsewhere and is not
under consideration to be published anywhere else if selected for publication in the journal of Indian Academicians and Researchers Association.
8. Decision of the Editorial Board regarding selection/rejection of the articles will be final.


 XXX ...](https://static.fdokumen.com/doc/165x107/6333113d6950993727020eec/european-commission-brussels-xxx-2021-xxx-.jpg)