Visualization of 3-D digital elevation model for landslide assessment and prediction in mountainous...
11
Visualization of 3-D digital elevation model for landslide assessment and prediction in mountainous terrain: A case study of Chandmari landslide, Sikkim, eastern Himalayas }
Transcript of Visualization of 3-D digital elevation model for landslide assessment and prediction in mountainous...

Geosciences Journal
Vol. 9, No. 4, p. 363 − 373, December 2005
Visualization of 3-D digital elevation model for landslide assessment and
prediction in mountainous terrain: A case study of Chandmari landslide,
Sikkim, eastern Himalayas
ABSTRACT: Techniques for recognizing and mapping of land-
slides are complex in mountainous terrains. Most of the methods
applied to landslide identification and prediction involves assign-
ment of different contributing factors in landslide hazard zonation;
however, it is difficult to observe the main causes of landslides. 3-D
digital elevation modeling capabilities and Guided Visual Program
(GVP) module of Datamine Software is utilized to successfully
enumerate the various contributing factors for causing the land-
slide in Sikkim, Eastern Himalaya in the case study of Chandmari
Landslide. A landslide warning system is discussed for the site-
specific Chandmari landslide area.
Key words: Landslides-3D Modelling-Chandmari-Sikkim-Eastern
Himalaya
1. INTRODUCTION
India has about 25% of its geographical area under moun-tainous terrain and being the youngest mountain chain isgeologically/tectonically very unstable and seismically active.The high population density, rapid increase in the develop-mental activities, the loss of human life and enormous eco-nomic loss of the order of US$500 million per year due tolandslides. Chandmari landslide, Sikkim with a loss of 38lives in 1997 and the Malpa landslide, Pittoragarh district,Uttranchal with a loss of 200 lives in 1998 are the knownexample in the Himalaya. The Government of India has setup a National Steering committee (DST, 1999) to co-ordi-nate activities related to landslides and to review the knownexamples of landslide in the Himalaya, the methodology ofthe landslide zonation, geotechnical investigations, land usezoning and regulation is the focal responsibilities of Min-istry of Mines, Ministry of Science and Technology andMinistry of Environment and Forest respectively.
The site-specific studies were initiated by Department ofScience and Technology, Govt. of India with a maximumLandslide Hazard Evaluation Factor (LHEF) rating for
zonation with contributing factors such as lithology, slope,relief (Table 1) and landslide hazard zonation on the basisof Total Estimated Hazard (TEHD) have been created (Table2). LHEF and TEHD are closely related to their approachfollowed by Anbalagan (1992); Lee and Choi (2003) andDST (1994). However, such TEHD does not include the useof qualified risk analysis (QRA) such as increase in lifefatalities with respective number of years for risk reductionoptions. The above LHEF and TEHD do not quantify thehazard in relation to factor of safety (R7815, SWK & Co.Ltd and University of Durham, 2002).
Factor of Safety (FS)=sum of restoring forces/sum of dis-
tributing forces =1 is the limit of safety>1 is safe; whereas<1 is unsafe. The risk involved is also quantified on the basis of factors
of hazard and vulnerability where the hazard could be esti-mated by TEHD or LHEF in relation to settlements orinfrastructures.
In case of shallow landslide occurrence (Burton et al.,1998) the factor of safety (FS) can be derived as;
FS =
This is significant when only geotechnical and quantitativeapproach is taken into consideration (Tables 1, 2).
The landslide and slope instability problems are quitecommon in Sikkim Himalaya (Fig. 1a). The Chandmarilandslide of Eastern Himalaya falls between 27°10’-27°30’
N latitude and 88°25’-88°40’E longitudes (Fig. 1b), whichis one of the major landslides, occurred in the year 1997.The heavy rainfall (cloudburst) on June 9, 1997 i.e. 211mmin 4 hours and poor drainage system led to saturation andincrease in pore pressure in highly fractured and foliatedrocks of the area. Apart from these the heavy concretestructures and poor maintenance of road is also responsible
Resistance of soil to shearing
Down slope component of soil weight
Chandra Shekhar Dubey*Manoj ChaudhryBraj Kishore SharmaArvind Chandra Pandey †
Bhoop Singh
} Department of Geology, University of Delhi, Delhi-110007, India
Haryana Remote Sensing Agency, Chandigarh, India
Department of Science and Technology, Technology Bhawan, New Delhi, India
*Corresponding author: [email protected]†Now at Birla Institute of Technology, Mesra, Ranchi, Jhakhand, India

364 Chandra Shekhar Dubey, Manoj Chaudhry, Braj Kishore Sharma, Arvind Chandra Pandey and Bhoop Singh
for disaster. It covered an area of 200 sq. mt. The extensive
damages in Chandmari-Tathangchen area were reported
debris flow, which has swept away houses and buried many
people alive 38 persons were killed and more than 50
injured due to unprecedented and consequent landslides on
the night of June 8/morning of June 9, in a number of
places in and around Gangtok City.
2. METHODOLOGY
Chi-square test is a popular statistical procedure by which
dichotomous or non-dichotomous data can be easily ana-
lyzed (Gurung and Iwao, 2001). The contour intervals on
1:5000 scale toposheet and cross slope distances were mea-
sured and the data was used to construct a frequency dis-
tribution histogram. These histograms were used to interpret
whether the area is a stable one or not.
Toposheet (Survey of India sheet no. 6, 78 A/11, 1972, at
1:5,000) of the area has scanned and vectorized by using
Winpro Professional and AutoCAD Map software. The
Table 1. Maximum Landslide Hazard Evaluation Factor (LHEF) rat-
ings (DST, 1994)
Contributory factor Maximum LHEF ratings
Lithology
Relationship of structural discontinuities
with slope
Slope morphometry
Relative relief
Land use and land cover
Ground water conditions
2.0
2.0
2.0
1.0
2.0
1.0
Total 10.0
Table 2. Landslide hazard zonation based on Total Estimated Haz-ard (TEHD; DST, 1994)
Zone TEHD value Description of zone
I
II
III
IV
V
<3.5
3.5–5.0
5.1–6.0
6.1–7.5
>7.5
Very low hazard (VLH) zone
Low hazard (LH) zone
Moderate hazard (MH) zone
High Hazard (HH) zone
Very high hazard (VHH) zone
Fig. 1. Regional Geological map of Sikkim, Eastern Himalaya.
Visualization of 3-D digital elevation model for landslide assessment and prediction in mountainous terrain 365
contours were created and transferred as strings to Data-
mine studio software for 3D geological modeling and mine
planning to the scale. The software is virtual, 3-dimensional
software, which provides a live demonstration of the sur-
face and sub-surface using actual 3-dimensional coordi-
nates. The contours were then converted into a Digital
terrain model using wire frame technique. The Digital ter-
rain model can be visualized from any side using user
guided visualizer program at any angle. Profiles/sections
could be generated along any two designated points.
Geological fieldwork was carried out in Chandmari-
Tathangchen near Gangtok and proper attention has been
given to major, minor structures, orientation of joints and
their relation to drainage pattern in various litho units. The
geomorphic and geological features such as drainage pat-
tern, landslide stability map and geological contacts were
also digitized and imported in Datamine software as sepa-
rate strings. These layers/features are later draped to exact
scale and superimposed on Digital terrain model to visual-
ize them on the topography.
3. GENERAL GEOLOGY
Stratigraphically, the rocks around Chandmari area have
been classified into a) Darjeeling Formation, b) Daling For-
mation, and c) Lingtse Gneiss (Acharyya, 1989). Darjeeling
Formation comprises of gneiss, Kyanite-sillimanite schist,
Kyanite gneiss, Kyanite staurolite schist, Staurolite-garnet
schist and Garnet schist associated with bands of amphib-
olite. The Staurolite-garnet schist and Garnet schist form
the lower members of the Darjeeling Formation.
Daling Formation consists of chloritoid schist and phyl-
lites intercalated with quartzite belonging to green schist
facies. The contact between the medium to high-grade gneisses
and migmatites overlying the staurolite and garnet bearing
schists at Deorali near Gangtok is a sheared one and the rocks
are highly mylonitized along the contact. The gneisses are
highly fractured and are covered by thick soil in Chandmari
Tathangchen area. The streaky biotite gneiss (Lingtse gneiss)
occurs in the form of bands, which are present within the low
grade Daling and medium to high grade Darjeeling Forma-
tions. The Lingtse gneiss is characterized by sheared con-
tacts with Darjeeling and Daling Formations (Table 3). The
regional strike of all the mentioned lithological units near
Gangtok is NW-SE dipping 20-65° towards NE. Local vari-
ations in the strike trend are attributed to several phases of
deformation.
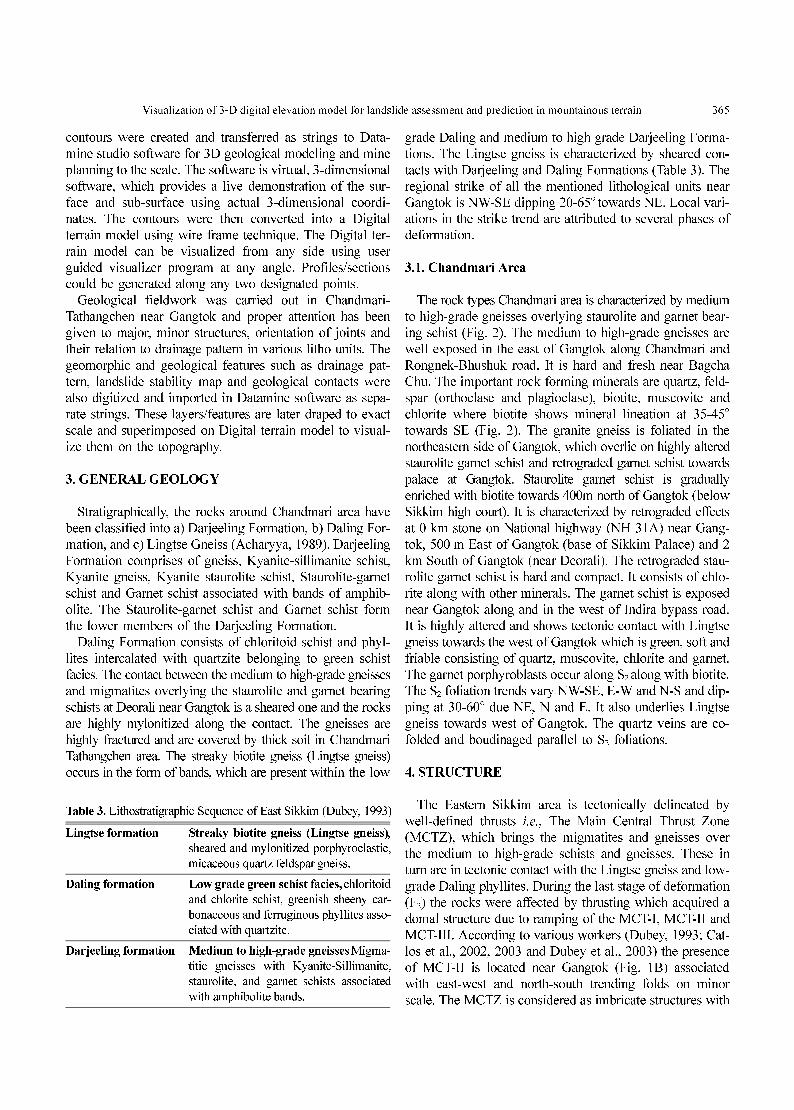
3.1. Chandmari Area
The rock types Chandmari area is characterized by medium
to high-grade gneisses overlying staurolite and garnet bear-
ing schist (Fig. 2). The medium to high-grade gneisses are
well exposed in the east of Gangtok along Chandmari and
Rongnek-Bhushuk road. It is hard and fresh near Bagcha
Chu. The important rock forming minerals are quartz, feld-
spar (orthoclase and plagioclase), biotite, muscovite and
chlorite where biotite shows mineral lineation at 35-45°
towards SE (Fig. 2). The granite gneiss is foliated in the
northeastern side of Gangtok, which overlie on highly altered
staurolite garnet schist and retrograded garnet schist towards
palace at Gangtok. Staurolite garnet schist is gradually
enriched with biotite towards 400m north of Gangtok (below
Sikkim high court). It is characterized by retrograded effects
at 0 km stone on National highway (NH 31A) near Gang-
tok, 500 m East of Gangtok (base of Sikkim Palace) and 2
km South of Gangtok (near Deorali). The retrograded stau-
rolite garnet schist is hard and compact. It consists of chlo-
rite along with other minerals. The garnet schist is exposed
near Gangtok along and in the west of Indira bypass road.
It is highly altered and shows tectonic contact with Lingtse
gneiss towards the west of Gangtok which is green, soft and
friable consisting of quartz, muscovite, chlorite and garnet.
The garnet porphyroblasts occur along S2 along with biotite.
The S2 foliation trends vary NW-SE, E-W and N-S and dip-
ping at 30-60° due NE, N and E. It also underlies Lingtse
gneiss towards west of Gangtok. The quartz veins are co-
folded and boudinaged parallel to S2 foliations.
4. STRUCTURE
The Eastern Sikkim area is tectonically delineated by
well-defined thrusts i.e., The Main Central Thrust Zone
(MCTZ), which brings the migmatites and gneisses over
the medium to high-grade schists and gneisses. These in
turn are in tectonic contact with the Lingtse gneiss and low-
grade Daling phyllites. During the last stage of deformation
(F2) the rocks were affected by thrusting which acquired a
domal structure due to ramping of the MCT-I, MCT-II and
MCT-III. According to various workers (Dubey, 1993; Cat-
los et al., 2002, 2003 and Dubey et al., 2003) the presence
of MCT-II is located near Gangtok (Fig. 1B) associated
with east-west and north-south trending folds on minor
scale. The MCTZ is considered as imbricate structures with
Table 3. Lithostratigraphic Sequence of East Sikkim (Dubey, 1993)
Lingtse formation Streaky biotite gneiss (Lingtse gneiss),
sheared and mylonitized porphyroclastic,
micaceous quartz feldspar gneiss.
Daling formation Low grade green schist facies, chloritoid
and chlorite schist, greenish sheeny car-
bonaceous and ferruginous phyllites asso-
ciated with quartzite.
Darjeeling formation Medium to high-grade gneisses Migma-
titic gneisses with Kyanite-Sillimanite,
staurolite, and garnet schists associated
with amphibolite bands.
366 Chandra Shekhar Dubey, Manoj Chaudhry, Braj Kishore Sharma, Arvind Chandra Pandey and Bhoop Singh
multiple thrust sheets. The signatures of post-metamorphic
thrusting are evidenced in the field by strong retrograde
metamorphic effects (chloritization), which took place after
the F3 folding movements. The P-T-t results indicate that
the shear zone experienced a complicated slip history and
has implications for the understanding of the mid crustal
extrusion and the role of out-of-sequence thrusts in conver-
gent plate tectonic settings (Catlos et al., 2004).
The general strike of the beds in the area is along NW-SE
dipping mainly due NE (Fig. 2). On the basis of plotting of
about 200 dips, foliation and cleavage planes (parallel to
each other) inferred that there is an eccentric axial symme-
try of fabric along SW direction (Turner and Weiss, 1963).
In the present area a single maximum of S1 foliation with
irregular contours is noticed. A faulted contact between high-
grade gneisses, staurolite and garnet bearing schist has been
observed (Bhattacharyya et al., 1987) trending ENE–WSW.
There are three sets of joints observed in the area, which
shows parting in the rocks without displacement and per-
pendicular to each other. The prominent set is in east west
directions while other is in north south directions. The
mesoscopic planner fabric data (S-surface) and linear struc-
tures (fold axis) plotted on the stereonet for structural anal-
ysis depicted variation in the orientation and geometry of
the p2 axis of F2 folds. The girdle passing through the max-
imum shows p2 axis with a plunge of 40° NE indicating a
variation F2 in the folds. In Gangtok-Ranikund area the p2
axis plunges at low angles towards NW.
5. GEOMORPHOLOGY AND RAINFALL
Nearly two-third of Sikkim consists of very high moun-
tains partially covered with snow from which descends gla-
ciers like Zemu, Changsang, Lonak and Tanum. The glaciers
are the sources of major rivers in Sikkim such as Teesta,
which arises from Zemu glacier. The Teesta and Rangit,
which originate from the Western portion of the State merge
together and flow down to West Bengal. The State’s cli-
matic condition is determined almost exclusively by the dif-
ference in altitudes.
Most of the rivers and streams in this area are in the boul-
der stage and have not attained a permanent regime even
before entering the plains. While regular meandering courses,
deep well defined beds and wide flood plains are the char-
acteristics of stable rivers in the plains, the boulder rivers
are having shallow beds and shifting braided and interlaced
channels. Urbanization in the road vicinity and also in the
catchment areas is one of the major causes inducing unsta-
ble conditions, especially surface scour and thereby allow-
ing water to percolate and create pore pressure conditions that
Fig. 2. Geological map of Gangtok–Chandmari area.
Visualization of 3-D digital elevation model for landslide assessment and prediction in mountainous terrain 367
cause movement of large scale debris creating blockage.
The drainage basin of the present area is fan-shaped and
has a greater run-off rate. The chief component of vegeta-
tion of the present area is subtropical broad-leaved hill for-
est. While at the upper reaches above 1800 m it consists of
temperate coniferous forest (Sudhakar et al., 1994). The ter-
rain in the source area of landslide has an average slope of
30°-35°. The top soil in the area consists of mainly sandy
loam to clayey type of soil followed at the down slope by
mixed boulder beds and soil with clay followed by boulder
beds and weak jointed rock exposures along with mainly
boulder beds at the toe of the landslide. The uppermost part
of the soil (about 2 m thick) is fine grained and humus rich.
Boreholes carried out at the site (for the purpose of install-
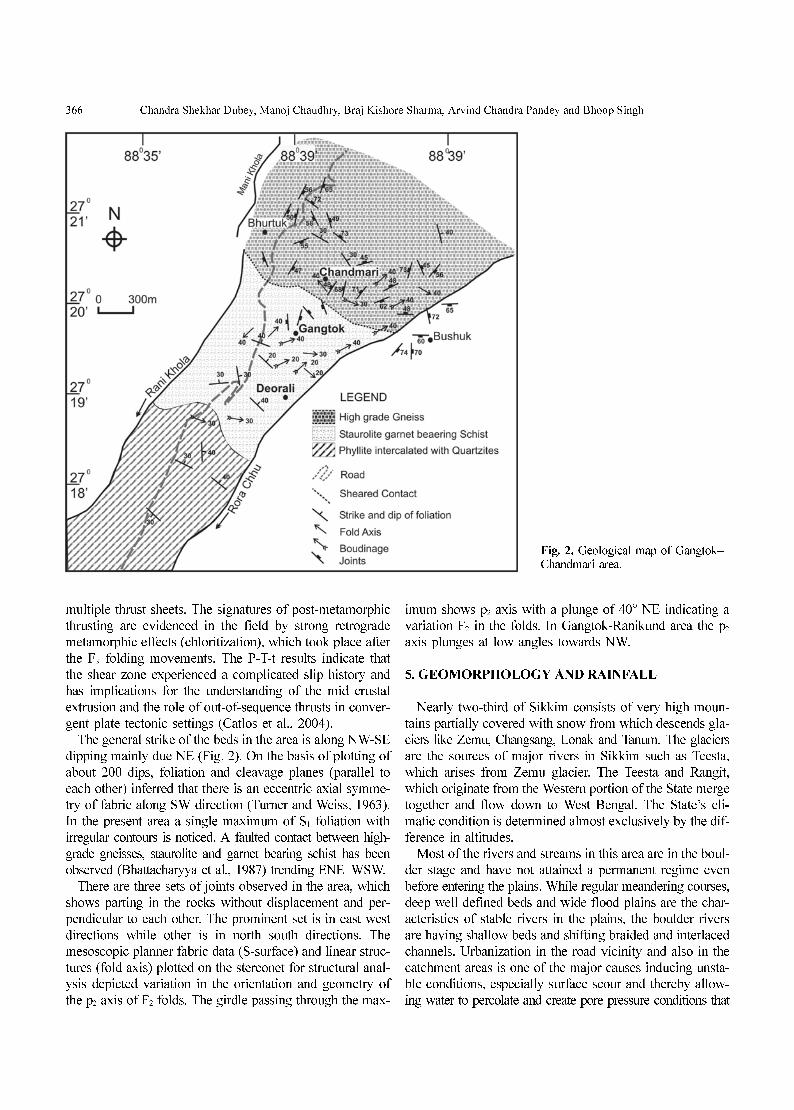
Fig. 3. Rainfall data by months.
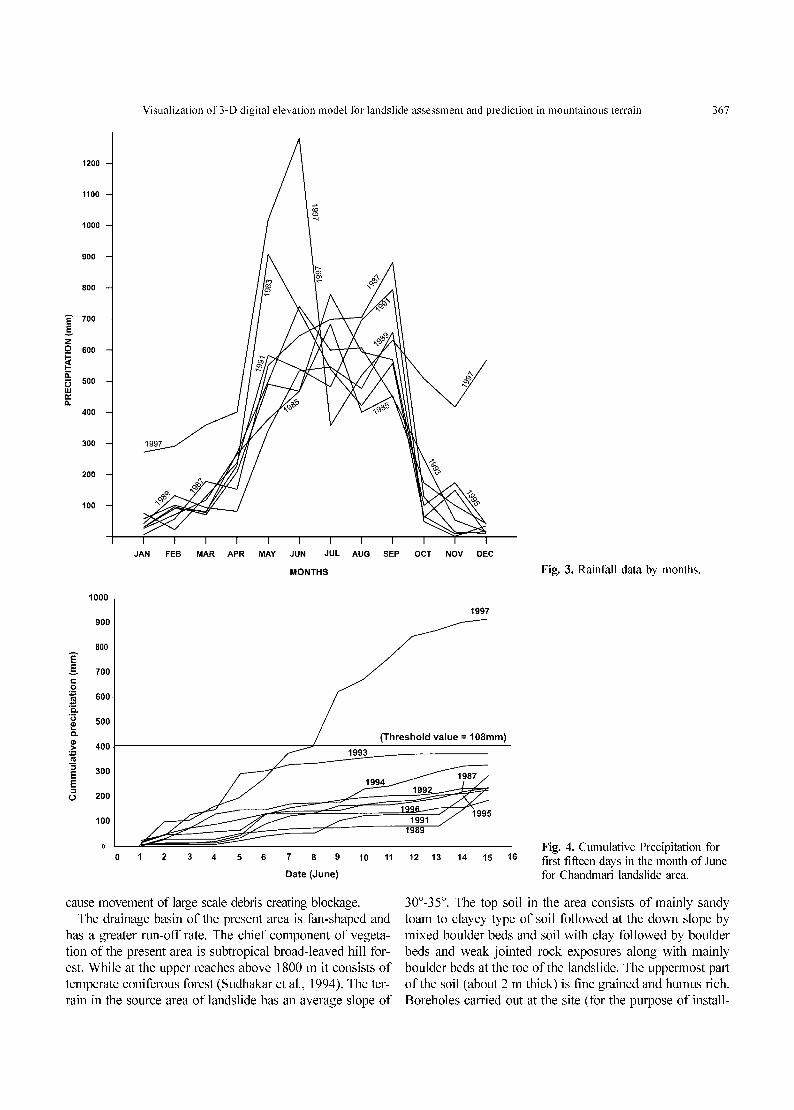
Fig. 4. Cumulative Precipitation for first fifteen days in the month of June for Chandmari landslide area.

368 Chandra Shekhar Dubey, Manoj Chaudhry, Braj Kishore Sharma, Arvind Chandra Pandey and Bhoop Singh
ing peizometers) have indicated that the bedrock at various
places is at a depth of more than 20 m. Weathering has pre-
sumably altered and broken down the upper part of the bed-
rock in the region by chemical decomposition and physical
disintegration (Bhasin et al., 2002).
The annual average rainfall is about 3,540 mm and the
average for the month of June varies from 330 to a maxi-
mum of 1,280 mm in the year 1997 (the year of landslide)
(Figs. 3 and 4). The heavy rainfall (cloudburst) on June 9,
1997 i.e. 211 mm in 4 hours (the limit of cloudburst is above
200 mm in day or so) and poor drainage system along with
the heavy structure like concrete buildings and poor road
maintenance lead to over saturation and further loading on
already unstable, highly jointed and foliated rocks in this area.
6. CHI-SQUARE TEST AND PROBABILISTIC
APPROACH
Evaluation of slope stability at first instance needs con-
sideration of historic record of landslide. The use of a prob-
abilistic framework can be significant improvement over
the deterministic framework but its role may be limited to
handling only some of the main uncertainties (Chowdhury
and Flentje, 2003). The chi square test based on the contour
intervals and cross slope distances (Gurung and Iwao, 2001)
provides an uncertainty when used for the entire area while
it is more certain and deterministic when applied to local
areas already identified as stable or unstable in the landslide
hazard zonation.
Methodology to draw graphs for Chi-Square test is sim-
ple. The inter distance between two adjoining contours are
measured radially in all the directions and frequency for dif-
ferent intercepts is calculated. Graph is drawn between various
contour intervals and their respective frequency percentages.
Once the graph is generated, inference can be drawn on the
basis of smoothness or ruggedness of the frequency curve.
Frequency curves with multiple peaks indicate an unstable
area whereas a smooth single peak suggests a relatively sta-
ble area. On the x-axis of the graph, contour interval as
measured on map in mm is provided whereas the y-axis, fre-
quency percentage of various contour intervals is provided.
The Chi-square test was applied on whole area, which
gave an uncertain answer whereas when applied to Chand-
mari and Tathangchen areas multiple-peaks were witnessed
signifying unstable areas (Fig. 5). Another area which falls
under stable zone was also tested which provided single peak
and hence was found stable. Therefore, it can be concluded
that this test cannot be used in isolation for prediction of the
stability of the area but is used as a supportive test.
7. LANDSLIDE HAZARD MAP
A landslide hazard map has been created taking into
account a number of parameters (Table 1). These parame-
ters include slope, lithology, drainage, relief, land use and
land cover, hydrogeology and structure. The area has been
classified in 5 zones based on the stability quotient as very
low hazard zone through moderate hazard zone to very high
hazard zone (Anbalagan, 1992; Fig. 6). These are broad
zones only and indicate probabilities of landslide hazards.
The maps are prepared on scales of 1: 5,000 and based on
a combination of desk and field investigations.
8. 3-D MODELLING AND APPLICATION OF SOFTWARE
The contours drawn from existing toposheet were imported
Fig. 5. Graph showing chi-square dis-tribution.

Visualization of 3-D digital elevation model for landslide assessment and prediction in mountainous terrain 369
in Datamine software to create a Digital elevation model.
Datamine is software that deals in geological applications,
exploration and mine planning. It also provides a visual-
ization facility for user to visualize and assess the stability
of the area in 3-dimensions from desired angle/direction by
superimposing various layers e.g. DTM, slope, lithology,
structure etc. as well as to understand their inter-relationship.
The geomorphic features such as drainage, landslide hazard
zones and lithology were imported in the software as sep-
arate strings. These features as different layers were then
draped on to Digital elevation model to see the interrela-
tionship of these layers with the topography.
Borga et al. (1998) have discussed a model that delineates
areas prone to shallow landsliding due to surface topo-
graphic effects on hydrological response based on high- res-
olution digital data. However, the digital recent elevation
Fig. 6. Landslide stability map of Chandmari-Tathangchen area.
370 Chandra Shekhar Dubey, Manoj Chaudhry, Braj Kishore Sharma, Arvind Chandra Pandey and Bhoop Singh
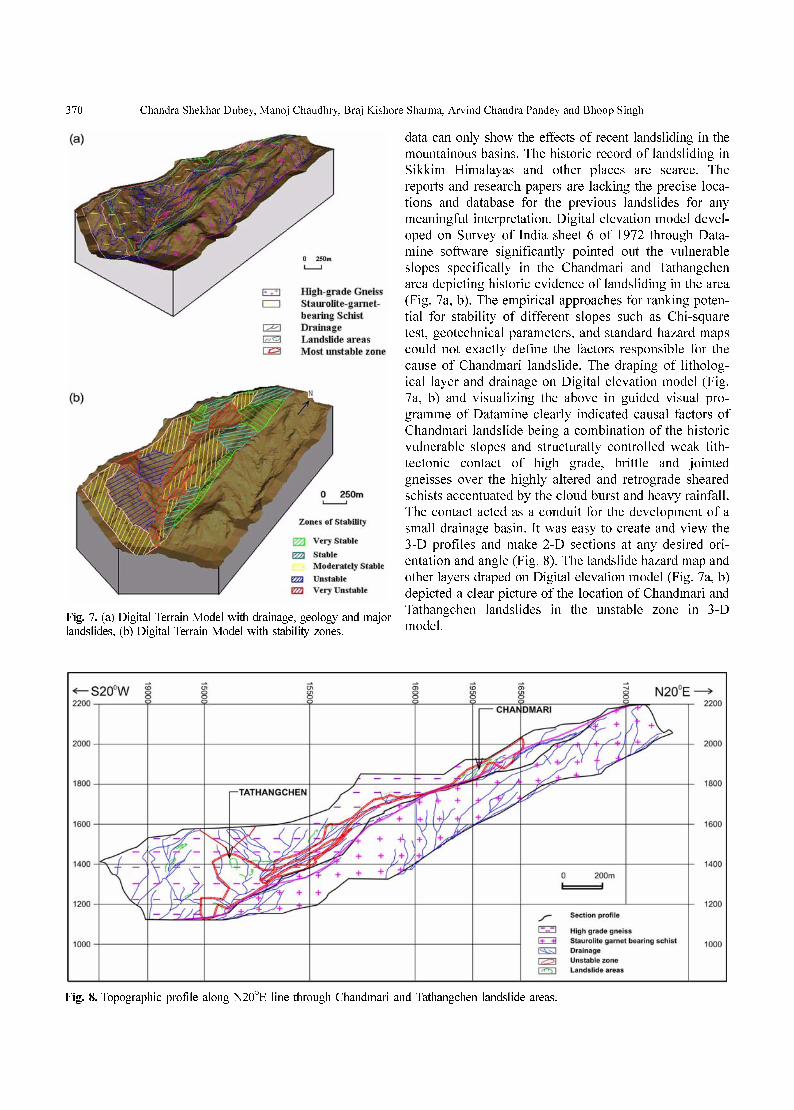
data can only show the effects of recent landsliding in the
mountainous basins. The historic record of landsliding in
Sikkim Himalayas and other places are scarce. The
reports and research papers are lacking the precise loca-
tions and database for the previous landslides for any
meaningful interpretation. Digital elevation model devel-
oped on Survey of India sheet 6 of 1972 through Data-
mine software significantly pointed out the vulnerable
slopes specifically in the Chandmari and Tathangchen
area depicting historic evidence of landsliding in the area
(Fig. 7a, b). The empirical approaches for ranking poten-
tial for stability of different slopes such as Chi-square
test, geotechnical parameters, and standard hazard maps
could not exactly define the factors responsible for the
cause of Chandmari landslide. The draping of litholog-
ical layer and drainage on Digital elevation model (Fig.
7a, b) and visualizing the above in guided visual pro-
gramme of Datamine clearly indicated causal factors of
Chandmari landslide being a combination of the historic
vulnerable slopes and structurally controlled weak lith-
tectonic contact of high grade, brittle and jointed
gneisses over the highly altered and retrograde sheared
schists accentuated by the cloud burst and heavy rainfall.
The contact acted as a conduit for the development of a
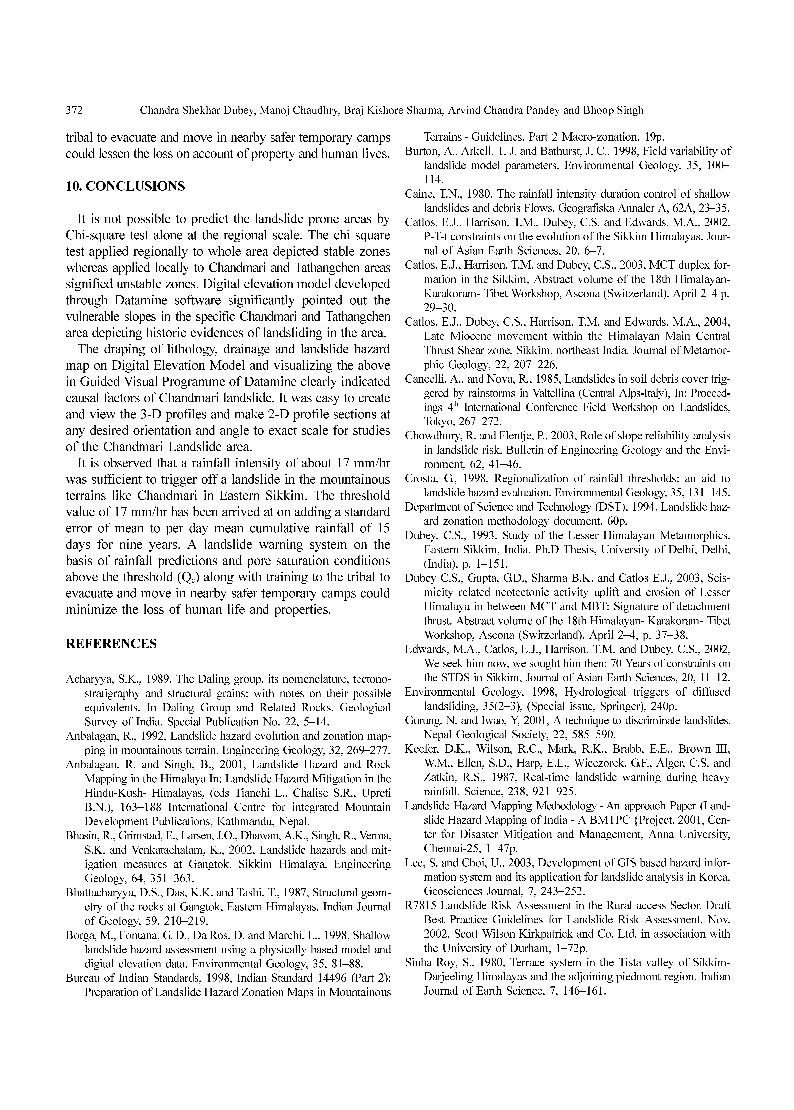
small drainage basin. It was easy to create and view the
3-D profiles and make 2-D sections at any desired ori-
entation and angle (Fig. 8). The landslide hazard map and
other layers draped on Digital elevation model (Fig. 7a, b)
depicted a clear picture of the location of Chandmari and
Tathangchen landslides in the unstable zone in 3-D
model. Fig. 7. (a) Digital Terrain Model with drainage, geology and majorlandslides, (b) Digital Terrain Model with stability zones.
Fig. 8. Topographic profile along N20°E line through Chandmari and Tathangchen landslide areas.

Visualization of 3-D digital elevation model for landslide assessment and prediction in mountainous terrain 371
9. REAL TIME LANDSLIDE WARNING SYSTEM
DURING HEAVY RAINFALL
Several workers have discussed various models based on
parameters responsible for landsliding and their work has
been summarized in a special volume (Env. Geol., 1998).
The rainfall data is important in triggering the landslides
in the mountainous terrains and could be used as a real time
system for issuing warnings of landslides during heavy rainfalls.
Prediction of landslides in mountainous terrain (e.g. Chand-
mari landslide) requires historical observations of rainfall,
landslide occurrence and certain assumptions concerning
slope, lithology, drainage and flow of water through hillside
soils as well as historic rainfall data. Several relationships
between rainfall and debris flow/rockslide have been devel-
oped from world wide historical and regional data. Keefer
et al., (1987) made simplified assumptions that 1) all of the
rainfall that falls infiltrates initially into a saturated zone
above the potential slide plane, and, 2) total rate of drainage
is proportional to the thickness of the saturated zone. Under
these assumptions, the drainage rate would increase as the
rain accumulates reaching a maximum when the slope fails.
The equation for rainfalls with the combination of intensity
and duration required to emplace the critical quantity of
water to initiate landslide on a given hill slope is given by:
(Ir – I0)D = Qc
Where Ir=14.82D-0.39; Ir is intensity of rainfall in mm per
hour and D is in hours, I0 is drainage by average rate and Qc
is critical volume of water retained in the saturated zone.
The Ir is calculated to be 8.62 for four-hour duration (Fig. 9).
According to Keefer et al., (1987), the value of threshold
parameters I0 and Qc depends upon the geometry of hill
slopes, position of the slip surface and mechanical and
hydrological properties of the slope material. In the case of
Chandmari and Tathangchen landslides, the hydrological
properties of the slope material are a function of the lithol-
ogies and gravity-pull of the burden of high-grade jointed
gneisses over sheared schist with low shear strength and
weak folia. So the relationship for abandoned debris flow
can be approximated by an expression with I0=3.7 mm (for
4 hour duration) and Qc=19.68 cu mm by various curves
and figures.
Statistically, the rainfall-triggering threshold is not con-
stant and is variable with respect to soil moisture conditions.
Terlien (1998) calculated rainfall duration and intensity for
various wet and dry initial soil moisture conditions that lead
to saturation of topsoil profile. He observed that when the
rainfall intensity exceeds a certain level (14 mm/h), the
maximum infiltration capacity of the soil is exceeded and
overland flow occurs and if it is less than 5 mm/h, the max-
imum pore-water pressures that are reached significantly
lower than zero even when rainfall duration is very long. This
is because of the fact that vertical percolation rate exceeds
the rainfall intensity.
Crosta (1998) stressed that the relationships between intensity
versus rainfall duration becomes particularly important when
related to soil permeability and thickness, and demonstrate
the role of antecedent precipitation.
Therefore, the rainfall intensity of about 17 mm/hour has
been estimated to be sufficient to trigger off a landslide in
the study area based on deterministic rainfall triggering
thresholds (Terlien, 1998). The threshold value of 17 mm/hour
has been arrived at on adding a standard error of mean to
per day mean cumulative rainfall of 15 days for nine years.
The definition of cloud burst in mountainous terrains is con-
sidered to be a rainfall of more than 204 mm in 24 hours. Thus,
a threshold rainfall of over 200 mm in 24 hours may trigger
a landslide in this area in the present set up. Generally, in
mountainous regions like Chandmari area the tribal popu-
lation has a tendency to continue with their dwellings even
in the worst natural disasters. A landslide warning system
on the basis of rainfall predictions and pore saturation con-
ditions above the threshold (Qc) along with training to the
Fig. 9. Rainfall intensity/duration threshold for shallow landslidesdeveloped after Caine, 1980; Weiczorek, 1987; Cancelli and Nova,1985).
372 Chandra Shekhar Dubey, Manoj Chaudhry, Braj Kishore Sharma, Arvind Chandra Pandey and Bhoop Singh
tribal to evacuate and move in nearby safer temporary camps
could lessen the loss on account of property and human lives.
10. CONCLUSIONS
It is not possible to predict the landslide prone areas by
Chi-square test alone at the regional scale. The chi square
test applied regionally to whole area depicted stable zones
whereas applied locally to Chandmari and Tathangchen areas
signified unstable zones. Digital elevation model developed
through Datamine software significantly pointed out the
vulnerable slopes in the specific Chandmari and Tathangchen
area depicting historic evidences of landsliding in the area.
The draping of lithology, drainage and landslide hazard
map on Digital Elevation Model and visualizing the above
in Guided Visual Programme of Datamine clearly indicated
causal factors of Chandmari landslide. It was easy to create
and view the 3-D profiles and make 2-D profile sections at
any desired orientation and angle to exact scale for studies
of the Chandmari Landslide area.
It is observed that a rainfall intensity of about 17 mm/hr
was sufficient to trigger off a landslide in the mountainous
terrains like Chandmari in Eastern Sikkim. The threshold
value of 17 mm/hr has been arrived at on adding a standard
error of mean to per day mean cumulative rainfall of 15
days for nine years. A landslide warning system on the
basis of rainfall predictions and pore saturation conditions
above the threshold (Qc) along with training to the tribal to
evacuate and move in nearby safer temporary camps could
minimize the loss of human life and properties.
REFERENCES
Acharyya, S.K., 1989, The Daling group, its nomenclature, tectono-
stratigraphy and structural grains: with notes on their possible
equivalents. In Daling Group and Related Rocks. Geological
Survey of India, Special Publication No. 22, 5−14.
Anbalagan, R., 1992, Landslide hazard evolution and zonation map-
ping in mountainous terrain. Engineering Geology, 32, 269−277.
Anbalagan, R. and Singh, B., 2001, Landslide Hazard and Rock
Mapping in the Himalaya In: Landslide Hazard Mitigation in the
Hindu-Kush- Himalayas, (eds Tianchi L., Chalise S.R., Upreti
B.N.), 163−188 International Centre for integrated Mountain
Development Publications, Kathmandu, Nepal.
Bhasin, R., Grimstad, E., Larsen, J.O., Dhawan, A.K., Singh, R., Verma,
S.K. and Venkatachalam, K., 2002, Landslide hazards and mit-
igation measures at Gangtok, Sikkim Himalaya. Engineering
Geology, 64, 351−363.
Bhattacharyya, D.S., Das, K.K. and Tashi, T., 1987, Structural geom-
etry of the rocks at Gangtok, Eastern Himalayas. Indian Journal
of Geology, 59, 210−219.
Borga, M., Fontana, G. D., Da Ros, D. and Marchi, L., 1998, Shallow
landslide hazard assessment using a physically based model and
digital elevation data. Environmental Geology, 35, 81−88.
Bureau of Indian Standards, 1998, Indian Standard 14496 (Part 2):
Preparation of Landslide Hazard Zonation Maps in Mountainous
Terrains - Guidelines, Part 2 Macro-zonation, 19p.
Burton, A., Arkell, T. J. and Bathurst, J. C., 1998, Field variability of
landslide model parameters. Environmental Geology, 35, 100−
114.
Caine, T.N., 1980, The rainfall intensity duration control of shallow
landslides and debris Flows. Geografiska Annaler A, 62A, 23−35.
Catlos, E.J., Harrison, T.M., Dubey, C.S. and Edwards, M.A., 2002,
P-T-t constraints on the evolution of the Sikkim Himalayas. Jour-
nal of Asian Earth Sciences, 20, 6−7.
Catlos, E.J., Harrison, T.M. and Dubey, C.S., 2003, MCT duplex for-
mation in the Sikkim, Abstract volume of the 18th Himalayan-
Karakoram- Tibet Workshop, Ascona (Switzerland), April 2−4 p.
29−30.
Catlos, E.J., Dubey, C.S., Harrison, T.M. and Edwards, M.A., 2004,
Late Miocene movement within the Himalayan Main Central
Thrust Shear zone, Sikkim, northeast India. Journal of Metamor-
phic Geology, 22, 207−226.
Cancelli, A., and Nova, R., 1985, Landslides in soil debris cover trig-
gered by rainstorms in Valtellina (Central Alps-Italy), In: Proceed-
ings 4th International Conference Field Workshop on Landslides,
Tokyo, 267−272.
Chowdhury, R. and Flentje, P., 2003, Role of slope reliability analysis
in landslide risk. Bulletin of Engineering Geology and the Envi-
ronment, 62, 41−46.
Crosta, G., 1998, Regionalization of rainfall thresholds: an aid to
landslide hazard evaluation. Environmental Geology, 35, 131−145.
Department of Science and Technology (DST), 1994, Landslide haz-
ard zonation methodology document. 60p.
Dubey, C.S., 1993, Study of the Lesser Himalayan Metamorphics,
Eastern Sikkim, India. Ph.D Thesis, University of Delhi, Delhi,
(India), p. 1−151.
Dubey C.S., Gupta, G.D., Sharma B.K. and Catlos E.J., 2003, Seis-
micity related neotectonic activity uplift and erosion of Lesser
Himalaya in between MCT and MBT: Signature of detachment
thrust. Abstract volume of the 18th Himalayan- Karakoram- Tibet
Workshop, Ascona (Switzerland), April 2−4, p. 37−38.
Edwards, M.A., Catlos, E.J., Harrison, T.M. and Dubey. C.S., 2002,
We seek him now, we sought him then: 70 Years of constraints on
the STDS in Sikkim, Journal of Asian Earth Sciences, 20, 11−12.
Environmental Geology, 1998, Hydrological triggers of diffused
landsliding, 35(2−3), (Special issue, Springer), 240p.
Gurung, N. and Iwao, Y, 2001, A technique to discriminate landslides.
Nepal Geological Society, 22, 585−590.
Keefer, D.K., Wilson, R.C., Mark, R.K., Brabb, E.E., Brown III,
W.M., Ellen, S.D., Harp, E.L., Wieczorek, G.F., Alger, C.S. and
Zatkin, R.S., 1987, Real-time landslide warning during heavy
rainfall. Science, 238, 921−925.
Landslide Hazard Mapping Methodology - An approach Paper (Land-
slide Hazard Mapping of India - A BMTPC {Project, 2001, Cen-
ter for Disaster Mitigation and Management, Anna University,
Chennai-25, 1−47p.
Lee, S. and Choi, U., 2003, Development of GIS based hazard infor-
mation system and its application for landslide analysis in Korea.
Geosciences Journal, 7, 243−252.
R7815 Landslide Risk Assessment in the Rural access Sector. Draft
Best Practice Guidelines for Landslide Risk Assessment, Nov.
2002, Scott Wilson Kirkpatrick and Co. Ltd. in association with
the University of Durham, 1−72p.
Sinha Roy, S., 1980, Terrace system in the Tista valley of Sikkim-
Darjeeling Himalayas and the adjoining piedmont region. Indian
Journal of Earth Science, 7, 146−161.

Visualization of 3-D digital elevation model for landslide assessment and prediction in mountainous terrain 373
Sudhakar, S., Kumar, A., Arrawatia, M. L. and Sengupta, S., 1994,
Forest cover mapping of East Sikkim using IRS-1A LISS II sat-
ellite data. Journal of Indian Society of Remote Sensing, 22, 155−
168.
Terlien, M.T. J., 1998, The determination of statistical and determin-
istic hydrological landslide-triggering thresholds. Environmental
Geology, 35, 124−130.
Turner, F.J. and Weiss, L.E., 1963, Structural analysis of metamor-
phic tectonites. McGraw Hills, New York, 545p.
Wieczorek, G.F., 1987, Effect of rainfall intensity and duration on
debris flows in the central Santa Cruz Mountains, California, in
Debris Flows/Avalanches: Process, Recognition, and Mitigation,
(eds Costa, J.E. and Wieczorek, G.F.) Reviews in Engineering
Geology, vol. 7, Geological Society of America, Boulder, Co,
93–104.
Manuscript received April 15, 2004
Manuscript accepted October 6, 2005