An approach for GIS-based statistical landslide susceptibility zonation—with a case study in the...
9
Original Articles Landslides 1 · 2005 Landslides (2005) 2:61–69 DOI 10.1007/s10346-004-0039-8 Received: 31 July 2004 Accepted: 9 October 2004 Published online: 2 February 2005 # Springer-Verlag 2005 Ashis K. Saha · Ravi P. Gupta · Irene Sarkar · Manoj K. Arora · Elmar Csaplovics An approach for GIS-based statistical landslide susceptibility zonation—with a case study in the Himalayas Abstract Landslide susceptibility zonation (LSZ) is necessary for disaster management and planning development activities in mountainous regions. A number of methods, viz. landslide dis- tribution, qualitative, statistical and distribution-free analyses have been used for the LSZ studies and they are again briefly reviewed here. In this work, two methods, the Information Value (InfoVal) and the Landslide Nominal Susceptibility Factor (LNSF) methods that are based on bivariate statistical analysis have been applied for LSZ mapping in a part of the Himalayas. Relevant thematic maps representing various factors (e.g., slope, aspect, relative relief, lithology, buffer zones along thrusts, faults and lineaments, drainage density and landcover) that are related to landslide activity, have been generated using remote sensing and GIS techniques. The LSZ derived from the LNSF method, has been compared with that produced from the InfoVal method and the result shows a more realistic LSZ map from the LNSF method which appears to conform to the heterogeneity of the terrain. Keywords Landslide susceptibility zonation · GIS · Remote sensing · Himalayas Introduction Landslides are amongst the most damaging natural hazards in the mountainous terrain such as the Himalayas. The study of land- slides has drawn worldwide attention mainly due to increasing awareness of the socio-economic impact of landslides, as well as the increasing pressure of urbanization on the mountain envi- ronment (Aleotti and Chowdhury 1999). Malpa landslide (August 1998), Uttarkashi landslide (September–October 2003) and Badrinath landslide (July 2004) in the Himalayas are the burning examples that have caused large-scale human tragedies, material damage and associated environmental and social hazards. Although it is yet difficult to predict a landslide event in space and time, an area may be divided into near-homogeneous do- mains and ranked according to degrees of potential hazard due to mass movements (Varnes 1984). Such maps are called Landslide Hazard Zonation (LHZ) or Landslide Susceptibility Zonation (LSZ) maps. In the last four decades, several qualitative and quantitative studies have been carried out to prepare landslide hazard maps. The availability of remote sensing and GIS tech- nologies has tremendously helped the preparation of suscepti- bility maps with greater efficiency and accuracy than before. This is primarily due to the fact that through these technologies, it is possible to collect, manipulate and analyze a variety of spatial and non-spatial data about the causative factors (such as lithology, tectonic structures, landcover, geomorphology, etc.) responsible for the landslide activity in a region (Varnes 1984; Carrara et al. 1991; Nagarajan et al. 1998; Saha et al. 2002). A number of methodologies for landslide susceptibility zona- tion have been proposed which can be grouped into six categories (Table 1). The simplest of all, the distribution analysis only de- picts direct mapping of landslide locations from field surveys or aerial photographic interpretation and thus do not provide in- formation on predictive behavior of future landslide activity. In this type of analysis, GIS is used to digitize landslides prepared from field survey maps, aerial photographs and remote sensing images. In qualitative analysis, subjective decision rules are ap- plied to define weights and ratings based on the experience of experts (Saha et al. 2002). The logical analytical method proposed by Bughi et al. (1996) is a variation of the above, where the field survey data on slope deformation helps to decide the numerical weights. Remote sensing and GIS techniques may be utilized here for thematic map preparation and overlay analysis. To remove subjectivity in qualitative analysis, various statis- tical methods have been employed for LSZ studies. These meth- ods can broadly be classified into three types: bivariate, multi- variate and probabilistic prediction models. The bivariate models consider each individual thematic map in terms of landslide distribution and can be easily implemented in GIS (van Westen 1997). The Information Value InfoVal) Yin and Yan 1988 and Landslide Nominal Risk Factor (LNRF) method (Gupta and Joshi 1990) are bivariate statistical analyses used to prepare landslide susceptibility maps. Multivariate methods consider various the- matic at once into a complex and time-consuming data analysis processes (Carrara et al. 1991). The probabilistic prediction models (Chung and Fabbri 1999) provide quantitative estimates of future landslide activity based on prediction from past events. The (weight of evidence) approach is also a kind of bivariate analysis utilizing Bayesian probability model (Lee et al. 2002a). During the last 5 years, distribution-free methods such as neural network (Arora et al. 2004) and neuro-fuzzy analysis (Elias and Bandis 2000) have also been implemented for LSZ studies. In addition to this, deterministic and landslide frequency analysis methods have also been reported for site-specific studies on landslides. For medium-scale regional LSZ studies, the methods based on qualitative and statistical analysis have been more commonly used. Qualitative methods have the disadvantage of utilizing opinion-based weights. Therefore, to introduce objectivity in weight assignment and landslide susceptibility zoning, statistical analysis appropriate. The aim of this paper is to discuss the ap- plication of two bivariate statistical methods, namely InfoVal and LNSF for landslide susceptibility mapping in a raster-based GIS environment in a part of the Himalayas. The InfoVal and LNSF methods van Westen (1997) proposed the Information Value (InfoVal) method for Landslide Hazard Zonation, which considers the probability of landslide occurrence within a certain area of each class of a thematic. This method is regarded as the simplification 61
-
Upload
independent -
Category
Documents
-
view
0 -
download
0
Transcript of An approach for GIS-based statistical landslide susceptibility zonation—with a case study in the...

Original Articles
Landslides 1 · 2005
Landslides (2005) 2:61–69DOI 10.1007/s10346-004-0039-8Received: 31 July 2004Accepted: 9 October 2004Published online: 2 February 2005� Springer-Verlag 2005
Ashis K. Saha · Ravi P. Gupta · Irene Sarkar · Manoj K. Arora · Elmar Csaplovics
An approach for GIS-based statistical landslidesusceptibility zonation—with a case study in theHimalayas
Abstract Landslide susceptibility zonation (LSZ) is necessary fordisaster management and planning development activities inmountainous regions. A number of methods, viz. landslide dis-tribution, qualitative, statistical and distribution-free analyseshave been used for the LSZ studies and they are again brieflyreviewed here. In this work, two methods, the Information Value(InfoVal) and the Landslide Nominal Susceptibility Factor (LNSF)methods that are based on bivariate statistical analysis have beenapplied for LSZ mapping in a part of the Himalayas. Relevantthematic maps representing various factors (e.g., slope, aspect,relative relief, lithology, buffer zones along thrusts, faults andlineaments, drainage density and landcover) that are related tolandslide activity, have been generated using remote sensing andGIS techniques. The LSZ derived from the LNSF method, hasbeen compared with that produced from the InfoVal method andthe result shows a more realistic LSZ map from the LNSF methodwhich appears to conform to the heterogeneity of the terrain.
Keywords Landslide susceptibility zonation · GIS · Remotesensing · Himalayas
IntroductionLandslides are amongst the most damaging natural hazards in themountainous terrain such as the Himalayas. The study of land-slides has drawn worldwide attention mainly due to increasingawareness of the socio-economic impact of landslides, as well asthe increasing pressure of urbanization on the mountain envi-ronment (Aleotti and Chowdhury 1999). Malpa landslide (August1998), Uttarkashi landslide (September–October 2003) andBadrinath landslide (July 2004) in the Himalayas are the burningexamples that have caused large-scale human tragedies, materialdamage and associated environmental and social hazards.
Although it is yet difficult to predict a landslide event in spaceand time, an area may be divided into near-homogeneous do-mains and ranked according to degrees of potential hazard due tomass movements (Varnes 1984). Such maps are called LandslideHazard Zonation (LHZ) or Landslide Susceptibility Zonation(LSZ) maps. In the last four decades, several qualitative andquantitative studies have been carried out to prepare landslidehazard maps. The availability of remote sensing and GIS tech-nologies has tremendously helped the preparation of suscepti-bility maps with greater efficiency and accuracy than before. Thisis primarily due to the fact that through these technologies, it ispossible to collect, manipulate and analyze a variety of spatial andnon-spatial data about the causative factors (such as lithology,tectonic structures, landcover, geomorphology, etc.) responsiblefor the landslide activity in a region (Varnes 1984; Carrara et al.1991; Nagarajan et al. 1998; Saha et al. 2002).
A number of methodologies for landslide susceptibility zona-tion have been proposed which can be grouped into six categories
(Table 1). The simplest of all, the distribution analysis only de-picts direct mapping of landslide locations from field surveys oraerial photographic interpretation and thus do not provide in-formation on predictive behavior of future landslide activity. Inthis type of analysis, GIS is used to digitize landslides preparedfrom field survey maps, aerial photographs and remote sensingimages. In qualitative analysis, subjective decision rules are ap-plied to define weights and ratings based on the experience ofexperts (Saha et al. 2002). The logical analytical method proposedby Bughi et al. (1996) is a variation of the above, where the fieldsurvey data on slope deformation helps to decide the numericalweights. Remote sensing and GIS techniques may be utilized herefor thematic map preparation and overlay analysis.
To remove subjectivity in qualitative analysis, various statis-tical methods have been employed for LSZ studies. These meth-ods can broadly be classified into three types: bivariate, multi-variate and probabilistic prediction models. The bivariate modelsconsider each individual thematic map in terms of landslidedistribution and can be easily implemented in GIS (van Westen1997). The Information Value InfoVal) Yin and Yan 1988 andLandslide Nominal Risk Factor (LNRF) method (Gupta and Joshi1990) are bivariate statistical analyses used to prepare landslidesusceptibility maps. Multivariate methods consider various the-matic at once into a complex and time-consuming data analysisprocesses (Carrara et al. 1991). The probabilistic predictionmodels (Chung and Fabbri 1999) provide quantitative estimates offuture landslide activity based on prediction from past events.The �weight of evidence� approach is also a kind of bivariateanalysis utilizing Bayesian probability model (Lee et al. 2002a).During the last 5 years, distribution-free methods such as neuralnetwork (Arora et al. 2004) and neuro-fuzzy analysis (Elias andBandis 2000) have also been implemented for LSZ studies. Inaddition to this, deterministic and landslide frequency analysismethods have also been reported for site-specific studies onlandslides.
For medium-scale regional LSZ studies, the methods based onqualitative and statistical analysis have been more commonlyused. Qualitative methods have the disadvantage of utilizingopinion-based weights. Therefore, to introduce objectivity inweight assignment and landslide susceptibility zoning, statisticalanalysis appropriate. The aim of this paper is to discuss the ap-plication of two bivariate statistical methods, namely InfoVal andLNSF for landslide susceptibility mapping in a raster-based GISenvironment in a part of the Himalayas.
The InfoVal and LNSF methodsvan Westen (1997) proposed the Information Value (InfoVal)method for Landslide Hazard Zonation, which considers theprobability of landslide occurrence within a certain area of eachclass of a thematic. This method is regarded as the simplification
61

of the method in Yin and Yan (1988), in which the weights of aparticular class in a thematic are determined as:
Wi ¼ lnDensclasDensmap
� �¼ ln
NpixðSiÞ=NpixðNiÞPni¼1
NpixðSiÞ=Pni¼1
NpixðNiÞð1Þ
where Wi is the weight given to the ith class of a particular the-matic layer (e.g., granite or limestone in the thematic layer �li-thology�), Densclas is the landslide density within the thematicclass, Densmap is the landslide density within the entire thematiclayer, Npix(Si) is the number of landslide pixels in a certainthematic class, Npix(Ni) is the total number of pixels in a certainthematic class, and n is the number of classes in a thematic map.The natural logarithm is used to take care of the large variation inthe weights.
Thus, the weight is calculated for various classes in each the-matic. The thematic are then overlaid and added to prepare aLandslide Hazard Index (LHI) map. Near-equal subdivision ofLHI cumulative frequency curve into five classes yields zones ofdifferent landslide hazards (i.e., very high, high, moderate, lowand very low) such that the boundaries may be adjusted subjec-tively to refine the suitable landslide hazard map (van Westen1997).
In the Landslide Nominal Risk Factor (LNRF) method (Guptaand Joshi 1990), the nominal risk factor is determined and relatedto the weight of each class of thematic considered for the prep-aration of LSZ, as follows:
LNRFi ¼NpixðSiÞPn
i¼1NpixðSiÞ
� �=n
ð2Þ
where Npix(Si) is the number of pixels containing landslides in iththematic class, and n is the number of classes present in theparticular thematic map.
An LNRF value greater than 1 implies high susceptibility tolandslides. When the LNRF value is less than 1, it indicates lowsusceptibility. An LNRF value equal to 1 is a sign of average
landslide susceptibility. Gupta and Joshi (1990) regrouped theLNRF values broadly into three classes for each thematic, andassigned weights 0, 1 and 2 for LNRF <0.67 (low risk), 0.67<LNRF <1.33 (moderate susceptibility) and LNRF > 1.33 (highrisk), respectively. The thematic were overlaid and aggregated toprepare a LHI map. The LHI map is then classified into threesusceptibility zones: low, moderate and high, keeping equal in-terval of LHI values.
It is observed that regrouping the LNRF values into ordinalnumbers (0, 1, 2 as done by Gupta and Joshi 1990) leads tocoarsening of the analytical approach and reduction in the rela-tive importance of various thematic classes. Therefore, in thiswork we modify the above LNRF method, such that we directlyuse the computed values in further computations. Further, theterm �susceptibility� is considered here more appropriate than�risk� or �hazard�, and therefore we call it as �Landslide NominalSusceptibility Factor (LNSF) method�. Another methodologicalimprovement in this study is aimed at removing the subjectivityin segmenting the Landslide Susceptibility Index (LSI) values,which has been done using a new statistical procedure.
Study areaThe study area covers a region of about 550 km2 in the GarhwalHimalayas (Fig. 1). The terrain is highly rugged with elevationsranging from about 920 to 4,250 m above mean sea level. Theriver Alaknanda flowing through the south-eastern part of thestudy area and its tributaries constitute the drainage network inthe area. Geologically, the region comprises the Lesser Himalayasand the Higher Himalayas (Valdiya 1980). Structurally, the regionis complex due to the presence of various thrusts, faults andintense deformations. Historically, the region has experiencednumerous landslides of different dimensions, some of which havebeen reactivated during an earthquake on 29 March 1999 inChamoli district (Ravindran and Philip 1999).
Table 1 Methodologies for various landslide hazard/susceptibility zonation (after van Westen 1994; Mantovani (1996)
LHZ/LSZ method Main feature For example
Qualitative 1. Distribution analysis Direct mapping of mass movement features resulting in a map, whichgives information only for those sites where landslides have occurredin the past
Wieczorek (1984)
2. Qualitative analysis Direct or semi-direct methods in which the geomorphological map isrenumbered to a hazard / susceptibility map or in which several mapsare combined into one using subjective decision rules based on theexperience of the earth scientist
Saha et al. (2002)
Quantitative 3. Statistical analysis Indirect method in which statistical analysis are used to obtain predictionsof the mass-movement from a number of parameter maps
Yin and Yan (1988),Gupta and Joshi (1990),Lee et al. (2002b),Ayalew, et al. (2004),Carrara et al. (1991),Chung and Fabbri (1999)
4. Distribution-freemethods
Neural networks and neuro-fuzzy methods, which do not depend ondistributional assumptions of the data. Here, the weights are computed inan objective manner
Arora et al. (2004),Elias and Bandis (2000)
5. Deterministicanalysis
Indirect methods in which parameters are combined in slope stabilitycalculation
Okimura and Kawatani(1986)
6. Landslidefrequency analysis
Indirect methods in which earthquakes and/or rainfall records or hydrologicalmodels are used for correlation with known landslide dates to obtain thresholdvalues with a certain frequency
Capecchi and Focardi(1988)
Landslides 1 · 200562
Original Articles

Data layer preparationA number of thematic maps (referred to as data layers in GIS) onspecific factors or parameters related to the occurrence of land-slides, viz. slope, aspect, relative relief, tectonic structures, li-thology, landcover and drainage density have been generated. Alandslide distribution map has also been prepared. The basic datasources that have been used to generate these layers are Survey ofIndia topographic maps (1:50,000 scale), geological and structuralmaps prepared by Valdiya (1980), satellite IRS-1C-LISS-III mul-tispectral data (in green, red, near-infrared and shortwave-in-frared wavelength bands at 23.5-m spatial resolution) and IRS-1C-
PAN data (broad-band 0.50–0.75 mm wavelength region at 5.8-mspatial resolution). Besides, field surveys have been carried outfor verification of landslides, landcover, geology and structuralfeatures. The above data sources have been used to generatevarious thematic data layers that have been resampled to 6�6 m2
grid size to match the nominal spatial resolution of IRS-PANimage. A brief description of each data layer preparation is givenhere. More details on methodology can be found in Gupta et al.(1999).
Landslide distribution mapThe identification and mapping of existing landslides is a pre-requisite to perform statistical analysis on the relation betweenthe distribution of landslides and influencing parameters. Since, itis not possible to reach all places to locate every landslide inmountainous region such as the Himalayas, the remote sensingimages are usually great source of information as they providesynoptic view of the landscape.
The high-resolution PAN image mentioned above for examplecan be used to identify and map existing landslides. On thisimage, landslides generally show scar and very light tones. Ingeneral, landslides in barren area can also be distinguished easilyon raw images. Sometimes a simple digital image contraststretching operation may be useful to highlight the landslides inbarren areas. Besides, old landslides can be delineated on thebasis of shape, landform characteristics and drainage. Moreover,PAN-sharpened multispectral image products are very useful toidentify landslides, as they sharpen the boundary between stableand unstable slopes (for PAN-sharpening, see e.g., Welch andEhlers 1987; Gupta 2003).
A total of 190 landslides of various dimensions (150 m2 2 km2)have been identified in the area using both PAN and the PAN-sharpened-LISS images. Many of the landslides have also beenverified in the field. Figure 2 shows one of these landslides oc-curred near Gopeshwar (Fig. 1) in the eastern part of the study
Fig. 1 Location of the study area
Fig. 2 A typical landslide as identifiedfrom a IRS-PAN image and b thecorresponding field photo (indicatedby arrow)
Landslides 1 · 2005 63

area. Each landslide identified on the image has been digitizedand later rasterized for further analyses.
DEM-based derivativesA Digital Elevation Model (DEM) representing the terrain is a keyto generate various topographic parameters, which influence thelandslide activity in an area. Here, DEM has been prepared bydigitizing contours at 40 m interval from the topographic map,interpolated and resampled to 6�6 m2 pixel size. From this DEM,slope, aspect and relative relief thematic data layers have beenprepared. Slope data layer, an important parameter in slope sta-bility considerations, comprises of five classes (after Anbalagan1992). Aspect is referred to as the direction of maximum slope ofthe terrain surface. It is divided into nine classes, namely, N, NE,E, SE, S, SW, W, NW and Flat (<5�). Relative relief data layer isformed from the difference in maximum and minimum elevationand is sliced into five classes at 30-m elevation difference.
LithologyLithology plays an important role in landslide activity. In thiswork, various rock formations in the study area have beengrouped into five classes to prepare the lithology data layer. Thefive classes correspond to (a) schists and gneisses, (b) granite–granodiorite–gneiss, (c) quartzites with slates, (d) limestone withgreywacke and (e) granites. The boundaries have been digitizedfrom the geological map prepared by Valdiya (1980).
Tectonic structureIt is a common observation that landslide occurrence increaseswith proximity to tectonic structures (Fig. 3). Structurally, thestudy area is quite complex. Two major thrusts that pass throughthe area are the Main Central Thrust and the Vaikrita Thrust.Additionally, several faults and shear zones are known to traversethe area. IRS-LISS image interpretation indicates the presence of anumber of lineaments in the region, which appear to have tec-tonic or neotectonic significance. These lineaments have beenmapped and digitized to form a vector layer. On this vector layer,the traces of various tectonic structural features, viz. thrusts andfaults have been superimposed, after which the vector layer hasbeen converted into a raster layer. Subsequently, a distancefunction has been applied to define a buffer zone (0.5 km wide) torepresent the area of influence of the structural tectonic featureson the occurrence of landslides.
Drainage densityIn mountainous regions, drainage density provides an indirectmeasure of groundwater conditions, which have an important roleto play in landslide activity (Sarkar and Kanungo 2004). For thisreason, the drainage map (scale 1:50,000) has been digitized,computed on a larger grid size of 252�252 m2 and classified intothree classes (low, medium and high) to generate the drainagedensity data layer.
Fig. 3 Landslide distribution map andthe tectonic structural features
Landslides 1 · 200564
Original Articles

LandcoverLandcover is also one of the key factors responsible for the oc-currence of landslides, since, barren slopes are more prone tolandslides. In contrast, vegetative areas tend to reduce the actionof climatic agents such as rain etc. thereby preventing the erosion
due to the natural anchorage provided by the tree roots and, thus,are less prone to landslides. Based on the variation in the spectralresponse of various landcover classes as depicted on LISS image,nine classes have been considered that may have an impact onlandslide activity in the region. These classes are dense forest,
Table 2 Computed weights for classes of various thematic data layers based on landslide occurrences
Classes Landslide (Pixel) Area (Pixel) LNSF weight InfoVal weight (ln)
(a) Slope�15� 1166 1899852 0.488 �0.219
16—25� 2462 4182712 1.031 �0.26126—35� 3307 4286079 1.384 0.01036—45� 2686 2821437 1.124 0.220
>45� 2325 2441452 0.973 0.220(b) AspectFlat 51 48558 0.038 0.318NE 2188 2156835 1.648 0.283E 1520 1794493 1.145 0.103SE 2509 1986783 1.890 0.502S 2532 2003484 1.908 0.503SW 2015 2274792 1.518 0.148W 563 1957136 0.424 �0.978NW 274 1796658 0.206 �1.609N 294 1612793 0.222 �1.431(c) Relative relief�30 m 2853 4557614 1.194 �0.200
31–60 m 5632 7753369 2.357 �0.05161–90 m 2476 2318962 1.036 0.33491–120 m 935 822424 0.391 0.397
>20 m 50 179163 0.021 �1.008(d) LithologySchist and gneiss 0 377411 0 �3.00a
Granite–granodiorite–gneiss 3847 8763837 1.610 �0.555Quartzite with slates 7066 4508249 2.957 0.718Limestone and greywacke 0 64767 0 �3.00a
Granite 1033 1917268 0.432 �0.350(e) Tectonic structure buffer<504 m 9541 8156560 5.591 0.426
505–1,008 m 1984 4554560 1.163 �0.5621,009–1,512 m 299 1996254 0.175 �1.6301,513–2,016 m 122 724353 0.071 �1.5142,017–2,520 m 0 149956 0 �3.00a
2,521–3,024 m 0 49466 0 �3.00a
3,025–3,528 m 0 383 0 �3.00a
(f) Drainage densityLow (�310 m/m2) 10421 12654934 2.617 0.075Medium (311–620 m/m2) 1236 2844048 0.310 �0.564High (>620 m/m2) 289 132550 0.073 1.048(g) LandcoverAgricultural land 1830 1658013 1.379 0.367Sparse vegetation 2082 2071261 1.569 0.274Dense forest 685 9342146 0.516 �2.343Settlements 861 232903 0.649 1.576Water body 27 32679 0.020 0.078Snow 2 39350 0 �2.703Barren and fallow land 3806 2239843 2.867 0.799Landslide debris 2608 10515 1.965 5.782River sediments 45 4822 0.034 2.502
a Arbitrary value as filler
Landslides 1 · 2005 65

sparse vegetation, agricultural land, fallow-barren land, landslidedebris, settlements, river sediments, water bodies and snow cover.The landcover data layer has been generated by employing multi-source image classification approach using four spectral bands(Green, Red, NIR and SWIR) of LISS image, Normalized Differ-ence Vegetation Index (NDVI) image (generated from Red andNIR bands of LISS image) and the Digital Elevation Model. TheMaximum Likelihood Classify has been used to classify the abovedata layers in a logical channel approach. The detailed metho-dology for the preparation of landcover map has been explainedin Saha et al. (2004).
Data integration and analysis for LSZTo evaluate the contribution of each factor towards landslidehazard, the existing landslide distribution data layer has beencompared with various thematic data layers separately. Thenumber of landslide pixels falling on each class of the thematicdata layers has been recorded and weights have been calculatedon the basis of both InfoVal (Eq. 1) and LNSF method (Eq. 2).These weights are given in Table 2. The weights are assigned to theclasses of each thematic, respectively, to produce weighted the-matic maps, which have been overlaid and numerically addedaccording to Eq. (3) to produce a Landslide Susceptibility Index(LSI) map.
LSI ¼ Slþ Asþ Rrþ Liþ Stþ Ddþ Lu ð3Þ
where Sl, As, Rr, Li, St, Dd and Lu are distribution-derived weightsfor slope, aspect, relative relief, lithology, tectonic structure,drainage density and landcover respectively. Thus, two LSI mapscorresponding to the InfoVal and LNSF methods have been pre-pared.
Segmentation of LSI values and generation of LSZ map
Information value methodThe LSI values from the InfoVal method are found to lie in therange from �10.6643 to 8.1220. The cumulative frequency curve ofLSI values has been segmented into five classes representing near-equal distribution to yield five landslide susceptibility zones, viz.very low, low, moderate, high and very high (Fig. 4).
LNSF methodThe conventional method employed to segment the LSI values forthe demarcation of various susceptibility zones is often subjec-tive. Since, the variations in weights and the respective centraltendencies in thematic data layers are often large and random, weemploy in this particular study, a new probabilistic approach forsuch segmentation. On the basis of the normalized frequencydistribution of LSI values (that vary between 2.0319 and 19.6808),the probability of landslide occurrence attached to each value hasbeen generated and depicted in Fig. 5a.
Figure 5a shows that in terms of their probability distribution,the LSI values can be classified into distinct clusters. We note thatthe clusters are randomly interspersed by spikes. These possiblyare due to random errors in the raw data although the larger onescould represent outliers of the classes. To smoothen the effect ofthis randomness, the data has been sub-grouped into small andequal class-intervals and fitted to a best-fit curve (Fig. 5b). Thecurve is unimodal, negatively skewed and distinctly binomial. Themean (mp) and standard error (sp) predicted from this best-fitprobability distribution curve are given in Table 3. It is note-worthy that the predicted mean is equal to the observed meanand the predicted standard error is significantly less than theobserved standard error. This implies that the best-fit curve de-rived from the proposed statistical procedure is quite reliable andaccurate.
The LSI values have been segmented into five distinct classeswith boundaries fixed at (mp� 1:5 msp), ( mp � 0:5msp), (mpþ 0:5msp) and ( mpþ 1:5msp) where m is a positive, non-zerovalue. Based on a given LSZ map, the cumulative percentage oflandslide occurrences in various susceptibility zones orderedfrom very high to very low can be plotted against the cumulativepercentage of the area of the hazard zones. This curve, referred toas the success rate curve in the literature (Chung and Fabbri 1999;Lu and An 1999; Lee et al. 2002b), may be used to select theappropriate value of m decide the suitability of a particular LSZmap.
In this study, several LSZ maps and the corresponding successrate curves have been prepared for different m values. For thesake of brevity, we show here, in Fig. 6, three representativesuccess rate curves corresponding to m=1.3, 1.4 and 2.0. The
Fig. 4 Segmentation of LSI-values inInfoVal method (VHS very high sus-ceptibility; HS high susceptibility; MSmoderate susceptibility; LS low sus-ceptibility; VLS very low susceptibility)
Landslides 1 · 200566
Original Articles

success of any LSZ operation can be judged by the measure thatmore number of landslides should fall in the very high LSZ ascompared to other zones.
It can be seen from Fig. 6 that for 10% of the area, (i.e., in thevery high susceptibility zone) the curves corresponding to m=1.3,1.4 and 2.0 show the landslide occurrences of 45.5%, 46% and32%, respectively; therefore for the first 10% of the area, the curvecorresponding to m=1.4 has the highest success rate. Consideringfurther for 20% of the area, the corresponding landslide occur-rences for these curves are 63%, 62% and 54%, respectively. Basedon this analysis, the LSZ map corresponding to m=1.35€0.05 ap-pears to be most appropriate for the study area.
Results and discussionFigure 7a and b show the LSZ maps developed using the InfoValand the LNSF methods, respectively. The following discussionprovides a comparison of two methods, on the methodology ofdata processing, visual appearance of LHZ maps and their ap-plicability in planning and developmental activities. The threemajor observations are:
1. The LSZ map is a result of a combination of various factorsresponsible for landslide susceptibility, where each factor hasrelative importance to a probable landslide activity. Thestructural discontinuities such as major faults, thrusts andlineaments have in general the most dominant impact onlandslide occurrence along which landslide activity is likely topreferentially occur (Fig. 3). Owing to this susceptibility of theterrain, the buffer zones of structural discontinuities ought toleave some traces, called here as �ghost-effect�, on the LSZ map.These �ghost-effects� can be clearly seen in LNSF method de-rived LSZ map (Fig. 7b). On the other hand, the LSZ mapgenerated using InfoVal method does not show any �ghost ef-fect� and appears relatively homogeneous throughout the area
Fig. 5 a Frequency distribution curve of LSI values computed by LNSF method. b Curve fitting in LNSF method
Table 3 Statistical results for LSI-value segmentation in LNSF method
Observed mean (mo ¼ 12:26)Observed standard error (so ¼ 3:22)Number of classes made on probability distribution curve = 18According to binomial distribution:Predicted mean (mp ¼ 12:26)Predicted standard error (sp ¼ 1:98)
Fig. 6 Success rate curves for choos-ing the best LSZ map in LNSF method
Landslides 1 · 2005 67
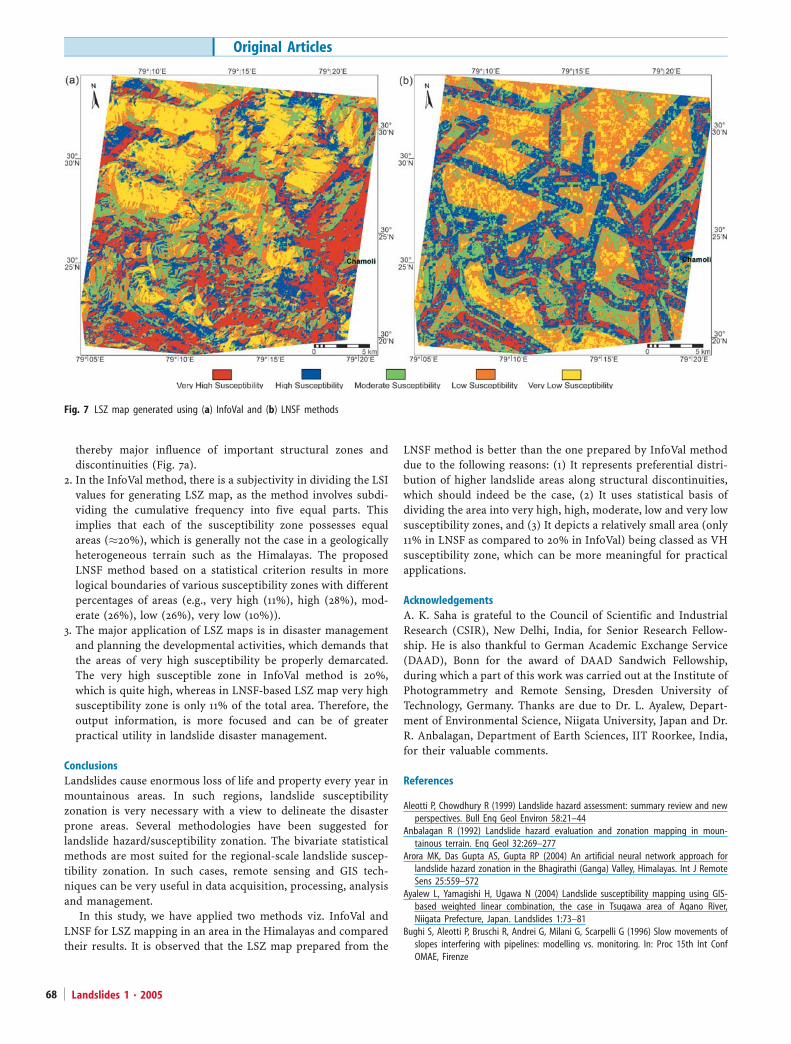
thereby major influence of important structural zones anddiscontinuities (Fig. 7a).
2. In the InfoVal method, there is a subjectivity in dividing the LSIvalues for generating LSZ map, as the method involves subdi-viding the cumulative frequency into five equal parts. Thisimplies that each of the susceptibility zone possesses equalareas (�20%), which is generally not the case in a geologicallyheterogeneous terrain such as the Himalayas. The proposedLNSF method based on a statistical criterion results in morelogical boundaries of various susceptibility zones with differentpercentages of areas (e.g., very high (11%), high (28%), mod-erate (26%), low (26%), very low (10%)).
3. The major application of LSZ maps is in disaster managementand planning the developmental activities, which demands thatthe areas of very high susceptibility be properly demarcated.The very high susceptible zone in InfoVal method is 20%,which is quite high, whereas in LNSF-based LSZ map very highsusceptibility zone is only 11% of the total area. Therefore, theoutput information, is more focused and can be of greaterpractical utility in landslide disaster management.
ConclusionsLandslides cause enormous loss of life and property every year inmountainous areas. In such regions, landslide susceptibilityzonation is very necessary with a view to delineate the disasterprone areas. Several methodologies have been suggested forlandslide hazard/susceptibility zonation. The bivariate statisticalmethods are most suited for the regional-scale landslide suscep-tibility zonation. In such cases, remote sensing and GIS tech-niques can be very useful in data acquisition, processing, analysisand management.
In this study, we have applied two methods viz. InfoVal andLNSF for LSZ mapping in an area in the Himalayas and comparedtheir results. It is observed that the LSZ map prepared from the
LNSF method is better than the one prepared by InfoVal methoddue to the following reasons: (1) It represents preferential distri-bution of higher landslide areas along structural discontinuities,which should indeed be the case, (2) It uses statistical basis ofdividing the area into very high, high, moderate, low and very lowsusceptibility zones, and (3) It depicts a relatively small area (only11% in LNSF as compared to 20% in InfoVal) being classed as VHsusceptibility zone, which can be more meaningful for practicalapplications.
AcknowledgementsA. K. Saha is grateful to the Council of Scientific and IndustrialResearch (CSIR), New Delhi, India, for Senior Research Fellow-ship. He is also thankful to German Academic Exchange Service(DAAD), Bonn for the award of DAAD Sandwich Fellowship,during which a part of this work was carried out at the Institute ofPhotogrammetry and Remote Sensing, Dresden University ofTechnology, Germany. Thanks are due to Dr. L. Ayalew, Depart-ment of Environmental Science, Niigata University, Japan and Dr.R. Anbalagan, Department of Earth Sciences, IIT Roorkee, India,for their valuable comments.
References
Aleotti P, Chowdhury R (1999) Landslide hazard assessment: summary review and newperspectives. Bull Eng Geol Environ 58:21–44
Anbalagan R (1992) Landslide hazard evaluation and zonation mapping in moun-tainous terrain. Eng Geol 32:269–277
Arora MK, Das Gupta AS, Gupta RP (2004) An artificial neural network approach forlandslide hazard zonation in the Bhagirathi (Ganga) Valley, Himalayas. Int J RemoteSens 25:559–572
Ayalew L, Yamagishi H, Ugawa N (2004) Landslide susceptibility mapping using GIS-based weighted linear combination, the case in Tsugawa area of Agano River,Niigata Prefecture, Japan. Landslides 1:73–81
Bughi S, Aleotti P, Bruschi R, Andrei G, Milani G, Scarpelli G (1996) Slow movements ofslopes interfering with pipelines: modelling vs. monitoring. In: Proc 15th Int ConfOMAE, Firenze
Fig. 7 LSZ map generated using (a) InfoVal and (b) LNSF methods
Landslides 1 · 200568
Original Articles

Capecchi F, Focardi P (1988) Rainfall and landslides: research into a critical precipitationcoefficient in an area of Italy. In: Proc 5th Int Symp on Landslides, Lausanne,Switzerland 2:1131–1136
Carrara AM, Cardinali M, Detti R, Guzzetti F, Pasqui V, Reichenbach P (1991) GIStechniques and statistical models in evaluating landslide hazard. Earth Surf ProcessLandforms 16:427–445
Chung C-JF, Fabbri AG (1999) Probabilistic prediction models for landslide hazardmapping. Photo Eng Remote Sens 65:1389–1399
Elias PB, Bandis SC (2000) Neurofuzzy systems in landslide hazard assessment. In: Proc4th Int Symp Spatial Accuracy Assessment in Natural Resources and Environ Sci, pp199–202
Gupta RP (2003) Remote sensing geology. Springer, Berlin Heidelberg New York, 655 ppGupta RP, Joshi BC (1990) Landslide hazard zonation using the GIS approach – a case
study from the Ramganga Catchment, Himalayas. Eng Geol 28:119–131Gupta RP, Saha AK, Arora MK, Kumar A (1999) Landslide hazard zonation in a part of
the Bhagirathi Valley, Garhwal Himalayas, using integrated remote sensing- GIS.Himalayan Geol 20:71–85
Lee S, Choi J, Chwae U, Chang B, (2002a) Landslide susceptibility analysis using weightof evidence. In: Proc IEEE Int Geosci Remote Sens Symp, Toronto (CD-ROM)
Lee S, Choi J, Min K (2002b) Landslide susceptibility analysis and verification using theBayesian probability model. Environ Geol 43:120–131
Lu PF, An P (1999) A metric for spatial data layers in favorability mapping for geologicalevents. IEEE Tran Geosci Remote Sens 37:1194–1198
Mantovani F, Soeters R, van Westen CJ (1996) Remote sensing techniques for landslidestudies and hazard zonation in Europe. Geomorph 15:213–225
Nagarajan R, Mukherjee A, Roy A, Khire MV (1998) Temporal remote sensing data andGIS application in landslide hazard zonation of part of Western Ghat, India. Int JRemote Sens 19:573–585
Okimura T, Kawatani T (1986) Mapping of the potential surface-failure sites on granitemountain slopes. In: Gardiner V (ed) Int Geomorp Part I. Wiley, New York, pp 121–138
Ravindran KV, Philip G (1999) 29 March 1999 Chamoli earthquake: a preliminary reporton earthquake-induced landslides using IRS-1C/1D data. Current Sc 77:21–25
Saha AK, Gupta RP, Arora MK (2002) GIS-based landslide hazard zonation in theBhagirathi (Ganga) Valley, Himalayas. Int J Remote Sens 23:357–369
Saha AK, Arora MK, Csaplovics E, Gupta RP (2004) Land cover classification using IRSLISS III imagery and DEM in a rugged terrain: a case study in Himalaya. GeoCarto Int(revised and sent)
Sarkar S, Kanungo DP (2004) An integrated approach for landslide susceptibilitymapping using remote sensing and GIS. Photo Eng Remote Sens 70:617–625
Valdiya KS (1980) Geology of Kumaun Lesser Himalaya. Wadia Inst of Himalayan Geol,Dehra Dun, 292 pp
van Westen CJ (1997) Statistical landslide hazard analysis. In: Application guide, ILWIS2.1 for Windows. ITC, Enschede, The Netherlands, pp 73–84
van Westen CJ (1994) GIS in landslide hazard zonation: a review, with examples fromthe Andes of Colombia. In: Price M, Heywood I (eds) Mountain environments andgeographic information system. Taylor and Francis, Basingstoke, UK, pp 135–165
Varnes DJ (1984) Landslide hazard zonation: a review of principles and practice.UNESCO, Paris, pp 1–63
Welch R, Ehlers M (1987) Merging multiresolution SPOT HRV and Landsat TM data.Photo Eng Remote Sens 53:301–303
Wieczorek GF (1984) Preparing a detailed landslide-inventory map for hazard evalu-ation and reduction. Bull Assoc Eng Geol 21:337–342
Yin KL, Yan TZ (1988) Statistical prediction model for slope instability of metamor-phosed rocks. In: Proceedings of 5th Int Symp on Landslides, Lausanne, Switzerland2:1269–1272
A. K. Saha · R. P. Gupta ()) · I. SarkarDepartment of Earth Sciences,Indian Institute of Technology Roorkee,Roorkee, 247667, Indiae-mail: [email protected]: +91-1332-273560
M. K. AroraDepartment of Civil Engineering,Indian Institute of Technology Roorkee,Roorkee, 247667, India
E. CsaplovicsInstitute of Photogrammetry and Remote Sensing,Dresden University of Technology,01062 Dresden, Germany
Landslides 1 · 2005 69