Landslide hazard zonation of Tawaghat-Jipti route corridor, Pithoragarh, Uttaranchal State: using...
12
Landslide Hazard Zonation of Tawaghat – Jipti Route Corridor, Pithoragarh, Uttaranchal State: Using Gis And Probabilistic Technique Approach. Krishna Chandra Tiwari* a , Sanker Ganapathi a , Anand Mehta* a , Suresh Sharma a , D.Ramakrishnan b a Dept. of Geology, Faculty of Science, M.S.University of Baroda, Vadodara – 390002. India. b Dept. of Earth Sciences, I.I.T. Powai, Mumbai – 400076. India. ABSTRACT The stratigraphically important Tawaghat – Jipti Route corridor along Kali River Valley in Pithoragarh district of Uttaranchal State is characterized by formidable physical features. The lofty hill ranges, steep valleys, cliffs, gorges and huge accumulation of scree and debris mass owe their origin to complex physical, geologic and tectonic processes. Being a part of the active Himalayan orogenic belt, the natural hazards viz. landslides and earthquakes forms an integral part of the study area. In the investigated area, landslides are by far the most significant natural hazard in terms of damage caused to lives and properties. Landslides in the study area are triggered both due to natural phenomena (high rainfall, seismicity) and anthropogenic activities (road development and deforestation). Commonly observed slope failures include block slide, debris slide and earth creep. The presented study aims to develop a methodology that could produce a hazard map over a large area with higher degree of accuracy in a GIS environment; incorporating utility of information theory in landslide hazard zonation. In all, 37 variables are identified as conditioning and triggering factors and accordingly probabilistic prediction map is prepared by this method. On the basis of histogram distribution, the polygon elements are classified into five hazard classes viz. very low (Ij <= -0.02), Low (-0.02 < Ij < 0.103) moderate (0.10 <Ij <0.23), high (0.23 < Ij < 0.40) and very high (Ij > 0.40) landslide hazard prone zones. Further, this probabilistic prediction map is compared with the actual landslide map generated from recent satellite data (IRS ID LISS-III+PAN, December 2002) for the accuracy of prediction. The generated hazard maps agree with the observed landslide incidences. Thus, this adopted approach effectively proves its efficacy in deriving a reliable landslide hazard zonation. Keywords: Uttaranchal, Landslides, Information Theory, Landslide Hazard Zonation, Probabilistic Hazard Map, GIS 1. INTRODUCTION The Eastern Kumaun Himalayan segment of the Uttaranchal State attains great significance due to its stratigraphic situation and prolonged history of Seismicity. Owing to active tectonic environment coupled with geological conditions, bulk of its highway segments are chronically affected by the landslide hazards. Tawaghat – Jipti Route Corridor along Kali River Valley is one such highway segment representing one of the severest landslide regions/belts of India. This route corridor along Kali River Valley in Pithoragarh district of Uttaranchal State is characterized by formidable physical features. The lofty hill ranges, steep valleys, cliffs, gorges and huge accumulation of scree and debris mass owe their origin to complex physical, geologic and tectonic processes. In the investigated area, landslides are by far the most significant natural hazard in terms of damage caused to lives and properties. Landslides in the study area are triggered both due to natural phenomena (high rainfall, seismicity) and anthropogenic activities (road development and deforestation). The catastrophic event of cloud burst that led to massive landslide of 1998 at Malpa village, claiming lives of 200 pilgrims enroute to the famous pilgrimage of Kailash – Manasarovar in Tibet – China is a testimony to this fact (Paul et. al. 2000). Commonly observed slope failures include block slide, debris slide and earth creep. The Factors that contribute to slope failures are site specific with respect to conditioning and triggering factors (Harp and Jibson, 1996; Jibson, et al., 1994; 1998; 1999). Therefore, Landslide Hazard Zonation (LHZ) maps representing the susceptibility of slope failures due to different conditioning and triggering factors (variables) provide better options for preparing hazard zonation maps. * Corresponding author. e-mail addresses: [email protected] (K. C. Tiwari); [email protected] (A. H. Mehta) Disaster Forewarning Diagnostic Methods and Management, edited by Felix Kogan, Shahid Habib, V. S. Hegde, Masashi Matsuoka, Proc. of SPIE Vol. 6412, 64120Q, (2006) 0277-786X/06/$15 · doi: 10.1117/12.694247 Proc. of SPIE Vol. 6412 64120Q-1
-
Upload
independent -
Category
Documents
-
view
0 -
download
0
Transcript of Landslide hazard zonation of Tawaghat-Jipti route corridor, Pithoragarh, Uttaranchal State: using...
Landslide Hazard Zonation of Tawaghat – Jipti Route Corridor, Pithoragarh, Uttaranchal State: Using Gis And Probabilistic
Technique Approach. Krishna Chandra Tiwari*a, Sanker Ganapathi a, Anand Mehta* a, Suresh Sharma a, D.Ramakrishnan b
a Dept. of Geology, Faculty of Science, M.S.University of Baroda, Vadodara – 390002. India. b Dept. of Earth Sciences, I.I.T. Powai, Mumbai – 400076. India.
ABSTRACT The stratigraphically important Tawaghat – Jipti Route corridor along Kali River Valley in Pithoragarh district of Uttaranchal State is characterized by formidable physical features. The lofty hill ranges, steep valleys, cliffs, gorges and huge accumulation of scree and debris mass owe their origin to complex physical, geologic and tectonic processes. Being a part of the active Himalayan orogenic belt, the natural hazards viz. landslides and earthquakes forms an integral part of the study area. In the investigated area, landslides are by far the most significant natural hazard in terms of damage caused to lives and properties. Landslides in the study area are triggered both due to natural phenomena (high rainfall, seismicity) and anthropogenic activities (road development and deforestation). Commonly observed slope failures include block slide, debris slide and earth creep. The presented study aims to develop a methodology that could produce a hazard map over a large area with higher degree of accuracy in a GIS environment; incorporating utility of information theory in landslide hazard zonation. In all, 37 variables are identified as conditioning and triggering factors and accordingly probabilistic prediction map is prepared by this method. On the basis of histogram distribution, the polygon elements are classified into five hazard classes viz. very low (Ij <= -0.02), Low (-0.02 < Ij < 0.103) moderate (0.10 <Ij <0.23), high (0.23 < Ij < 0.40) and very high (Ij > 0.40) landslide hazard prone zones. Further, this probabilistic prediction map is compared with the actual landslide map generated from recent satellite data (IRS ID LISS-III+PAN, December 2002) for the accuracy of prediction. The generated hazard maps agree with the observed landslide incidences. Thus, this adopted approach effectively proves its efficacy in deriving a reliable landslide hazard zonation. Keywords: Uttaranchal, Landslides, Information Theory, Landslide Hazard Zonation, Probabilistic Hazard Map, GIS
1. INTRODUCTION The Eastern Kumaun Himalayan segment of the Uttaranchal State attains great significance due to its stratigraphic situation and prolonged history of Seismicity. Owing to active tectonic environment coupled with geological conditions, bulk of its highway segments are chronically affected by the landslide hazards. Tawaghat – Jipti Route Corridor along Kali River Valley is one such highway segment representing one of the severest landslide regions/belts of India. This route corridor along Kali River Valley in Pithoragarh district of Uttaranchal State is characterized by formidable physical features. The lofty hill ranges, steep valleys, cliffs, gorges and huge accumulation of scree and debris mass owe their origin to complex physical, geologic and tectonic processes. In the investigated area, landslides are by far the most significant natural hazard in terms of damage caused to lives and properties. Landslides in the study area are triggered both due to natural phenomena (high rainfall, seismicity) and anthropogenic activities (road development and deforestation). The catastrophic event of cloud burst that led to massive landslide of 1998 at Malpa village, claiming lives of 200 pilgrims enroute to the famous pilgrimage of Kailash – Manasarovar in Tibet – China is a testimony to this fact (Paul et. al. 2000). Commonly observed slope failures include block slide, debris slide and earth creep. The Factors that contribute to slope failures are site specific with respect to conditioning and triggering factors (Harp and Jibson, 1996; Jibson, et al., 1994; 1998; 1999). Therefore, Landslide Hazard Zonation (LHZ) maps representing the susceptibility of slope failures due to different conditioning and triggering factors (variables) provide better options for preparing hazard zonation maps. * Corresponding author. e-mail addresses: [email protected] (K. C. Tiwari); [email protected] (A. H. Mehta)
Disaster Forewarning Diagnostic Methods and Management, edited by Felix Kogan, Shahid Habib, V. S. Hegde, Masashi Matsuoka, Proc. of SPIE Vol. 6412, 64120Q, (2006)
0277-786X/06/$15 · doi: 10.1117/12.694247
Proc. of SPIE Vol. 6412 64120Q-1
M\CHINA
(TIBET)
J1!gkg\
BAITJNEPAL
TUD
The presented study aimed at developing a methodology capable to produce hazard map over a large area with higher degree of accuracy in GIS environment. Several probabilistic methods namely; quantification theory, multiple regression, discriminate analysis, monte-carlo simulation, etc. were attempted in the past (Hayashi, 1952; Carrara, 1983; Haruyama and Kitamura, 1984; Kawakami, 1984; Yin and Yan, 1988; Jade and Sarkar, 1993; Jibson et. al. 1999, Luzi et.al. 2000) to derive a probabilistic zonation map for landslide hazard. However, this LHZ study has been carried out using Information Theory. This method is preferable over other methods by virtue of its accuracy and field applicability. The generated probabilistic hazard map is cross validated with recent satellite data for accuracy.
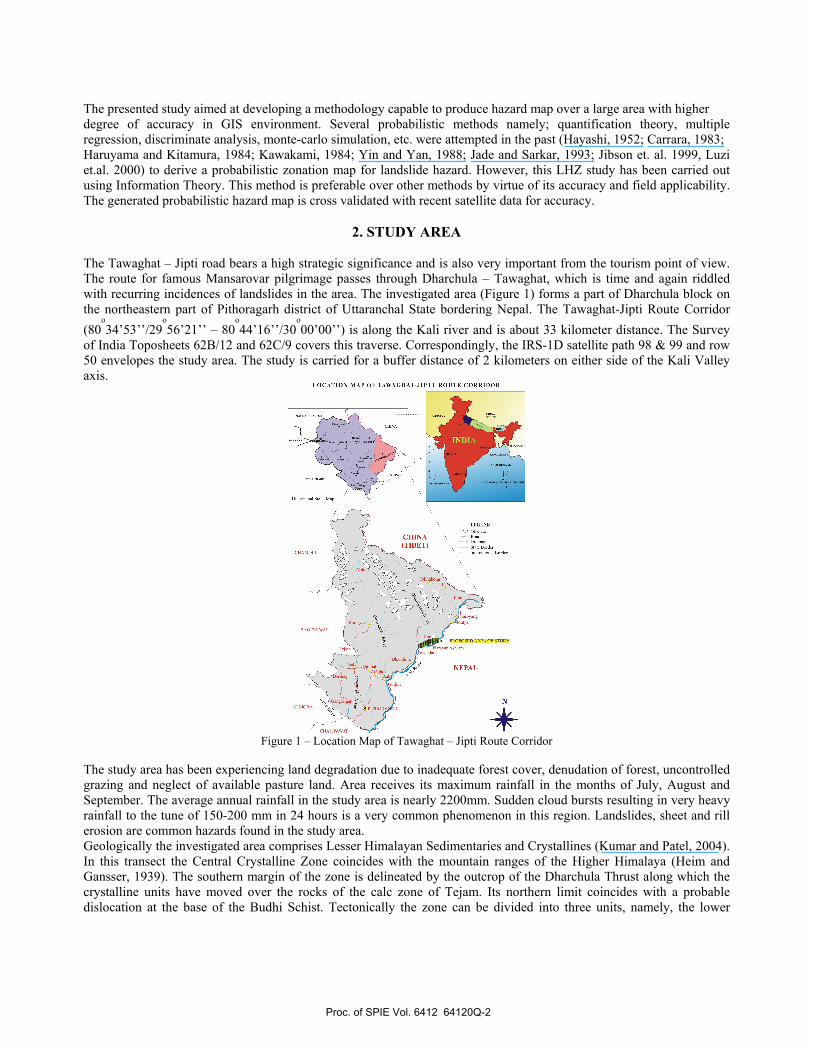
2. STUDY AREA The Tawaghat – Jipti road bears a high strategic significance and is also very important from the tourism point of view. The route for famous Mansarovar pilgrimage passes through Dharchula – Tawaghat, which is time and again riddled with recurring incidences of landslides in the area. The investigated area (Figure 1) forms a part of Dharchula block on the northeastern part of Pithoragarh district of Uttaranchal State bordering Nepal. The Tawaghat-Jipti Route Corridor (80
ο34’53’’/29
ο56’21’’ – 80
ο44’16’’/30
ο00’00’’) is along the Kali river and is about 33 kilometer distance. The Survey
of India Toposheets 62B/12 and 62C/9 covers this traverse. Correspondingly, the IRS-1D satellite path 98 & 99 and row 50 envelopes the study area. The study is carried for a buffer distance of 2 kilometers on either side of the Kali Valley axis.
Figure 1 – Location Map of Tawaghat – Jipti Route Corridor
The study area has been experiencing land degradation due to inadequate forest cover, denudation of forest, uncontrolled grazing and neglect of available pasture land. Area receives its maximum rainfall in the months of July, August and September. The average annual rainfall in the study area is nearly 2200mm. Sudden cloud bursts resulting in very heavy rainfall to the tune of 150-200 mm in 24 hours is a very common phenomenon in this region. Landslides, sheet and rill erosion are common hazards found in the study area. Geologically the investigated area comprises Lesser Himalayan Sedimentaries and Crystallines (Kumar and Patel, 2004). In this transect the Central Crystalline Zone coincides with the mountain ranges of the Higher Himalaya (Heim and Gansser, 1939). The southern margin of the zone is delineated by the outcrop of the Dharchula Thrust along which the crystalline units have moved over the rocks of the calc zone of Tejam. Its northern limit coincides with a probable dislocation at the base of the Budhi Schist. Tectonically the zone can be divided into three units, namely, the lower
Proc. of SPIE Vol. 6412 64120Q-2
Chipplakot Crystalline mass, the middle Sirdang Sedimentary Zone (SSZ) and the upper Rungling Crystalline Mass (RCM); all being thrust bounded (Heim and Gansser 1939, Valdiya 1980, 1988, Powar 1972). The Chipplakot Crystallines constitutes of well bedded augen gneisses showing a surprisingly uniform dip of about 300
between N and NE. Within the augen gneisses there is a considerable variation in the grain size and relative proportion of the constituent minerals. Intercalations of schists and quartzites of varying thickness are present. The Chipplakot Crystallines terminate to Sirdang Sedimentaries, demarcated by northernly dipping North Chipplakot Thrust. The Sirdang Sedimentary Zone comprises of a fairly thick sequence of intercalated slates, sometimes graphitoid, limestones, quartzites and chlorite schists with occurrence of amphibolites at base and top of the sedimentary zone. The Main Central Thrust (MCT) at Mangti village marks the contact of SSZ and the Higher Himalayan Crystallines (Powar, 1972). The lithology of the Rungling mass is much more varied. Within it augen, banded and porphyroblastic gneisses occur intimately associated with quartzites, chlorite schists, calc-silicate rocks and amphibolites. The rocks exposed at Jipti consists of interbedded garnet-mica schists and augen gneisses with development of porphyroblastic augen gneisses at many places along the route near Gala village. The position of the SSZ is of considerable tectonic interest and is best explained as a tectonic wedge between the two thrust bounded crystalline masses. The detailed litho-tectonic sequence is shown in Table 1. Physiographically, this part of Himalayas rises to an elevation of 1500-2500m and exhibits a rugged and mature topography. Kali is the major river that drains through the study area and flows in deeply dissected valley.
Tectonic Unit Sub – Tectonic Unit Lithology Higher Himalayan Crystalline
Rocks Higher Himalayan Crystalline
Rocks Augen gneiss, banded gneiss, amphibolite, schist, tourmaline granite
Main Central Thrust Sirdang Sedimentaries Carbonaceous phyllite, schistose
quartzite, amphibolite, arenaceous marble, calc-schist, marble
North Chiplakot Thrust Chiplakot Crystalline Mylontie gneiss, augen gneiss, quartz
veins South Chiplakot Thrust
Lesser Himalayan Rocks
Calc Zone of Tejam Massive quartzites, schistose quartzite, schist, slate, massive and bedded marble, carbonaceous slate and phyllite
(Kumar and Patel, 2004) Table 1 – Lithotectonic Succession of Tawaghat – Jipti Route Corridor
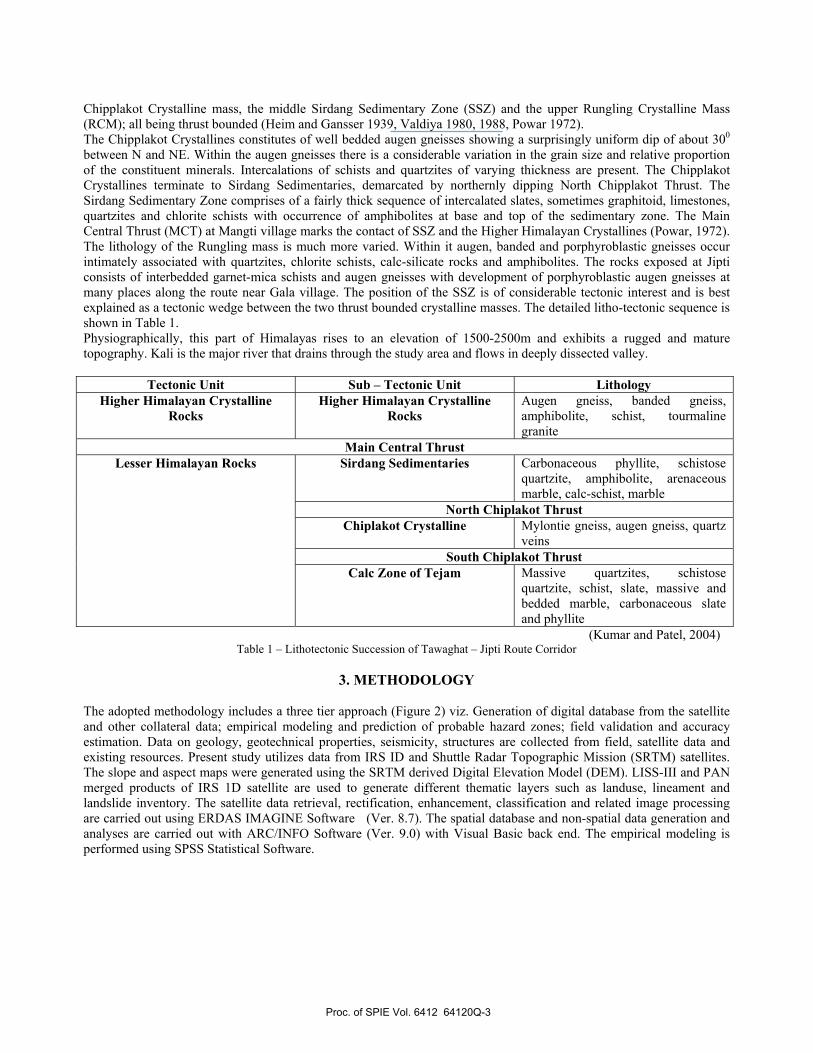
3. METHODOLOGY
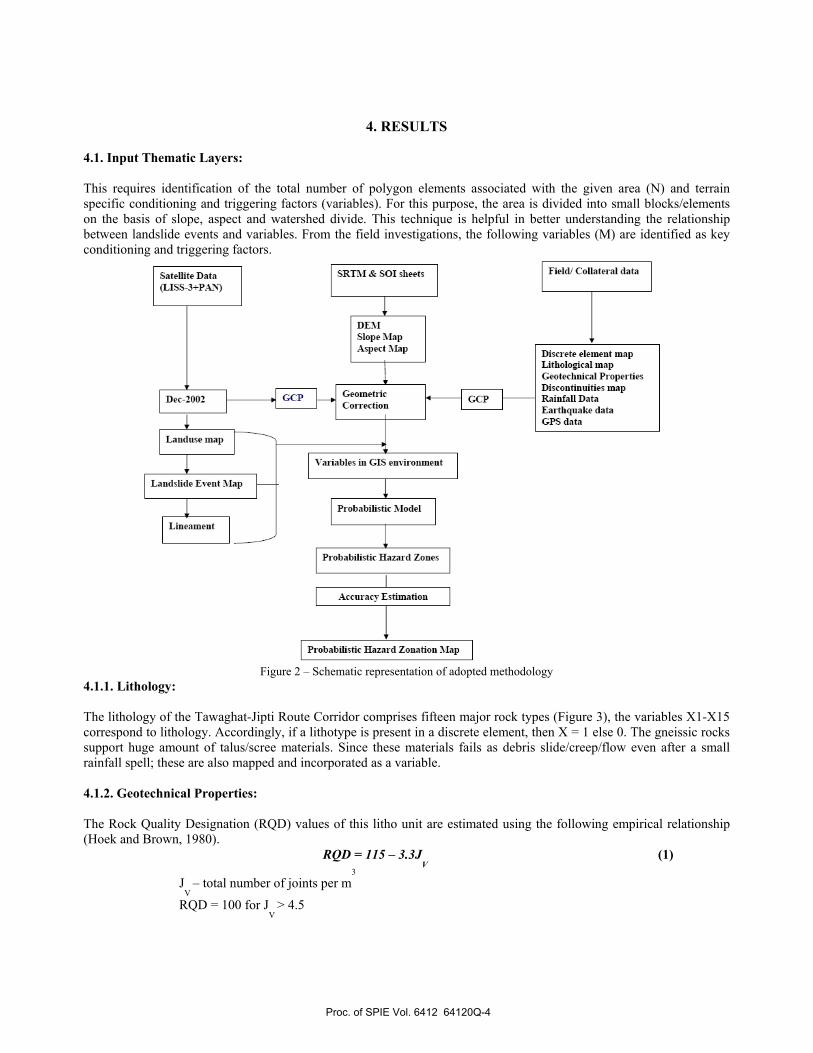
The adopted methodology includes a three tier approach (Figure 2) viz. Generation of digital database from the satellite and other collateral data; empirical modeling and prediction of probable hazard zones; field validation and accuracy estimation. Data on geology, geotechnical properties, seismicity, structures are collected from field, satellite data and existing resources. Present study utilizes data from IRS ID and Shuttle Radar Topographic Mission (SRTM) satellites. The slope and aspect maps were generated using the SRTM derived Digital Elevation Model (DEM). LISS-III and PAN merged products of IRS 1D satellite are used to generate different thematic layers such as landuse, lineament and landslide inventory. The satellite data retrieval, rectification, enhancement, classification and related image processing are carried out using ERDAS IMAGINE Software (Ver. 8.7). The spatial database and non-spatial data generation and analyses are carried out with ARC/INFO Software (Ver. 9.0) with Visual Basic back end. The empirical modeling is performed using SPSS Statistical Software.
Proc. of SPIE Vol. 6412 64120Q-3
SRTM & SO! sheetsSatellite Data(LLSS-3+PAS)
or"Slope MapAspect Map
c-2OO1 GCP Geometric GcP__________I Correction __________
Landuse map IVariables in CIS environment
Landslide Event thp
Probabilistic 'lodel
I
rield/ Collateral data
I
Probabilistic Hazard Zones
Accurac' Estimation
Probabilistic Hazard Zonation Map
Discrete element mapLitliological mapGeotechnical ProperfiesDiscondnuifies mapRainfall DataEarthquake dataGPS data
ILineament
4. RESULTS
4.1. Input Thematic Layers: This requires identification of the total number of polygon elements associated with the given area (N) and terrain specific conditioning and triggering factors (variables). For this purpose, the area is divided into small blocks/elements on the basis of slope, aspect and watershed divide. This technique is helpful in better understanding the relationship between landslide events and variables. From the field investigations, the following variables (M) are identified as key conditioning and triggering factors.
Figure 2 – Schematic representation of adopted methodology
4.1.1. Lithology: The lithology of the Tawaghat-Jipti Route Corridor comprises fifteen major rock types (Figure 3), the variables X1-X15 correspond to lithology. Accordingly, if a lithotype is present in a discrete element, then X = 1 else 0. The gneissic rocks support huge amount of talus/scree materials. Since these materials fails as debris slide/creep/flow even after a small rainfall spell; these are also mapped and incorporated as a variable. 4.1.2. Geotechnical Properties: The Rock Quality Designation (RQD) values of this litho unit are estimated using the following empirical relationship (Hoek and Brown, 1980).
RQD = 115 – 3.3JV
(1)
JV
– total number of joints per m3
RQD = 100 for JV
> 4.5
Proc. of SPIE Vol. 6412 64120Q-4
The RQD values estimated from six field observations vary from 64 –80%. The competence of the rock expressed as tunneling quality of rock mass (Q) is derived using the following relationship (Barton et al.1974).
Q = (RQD/Jn) * (J
r/J
a) * (J
w/SRF) (2)
(RQD/Jn) measure of block size
(Jr/J
a) measure of inter-block shear strength
(Jw/SRF) measure of active stress
RQD- rock quality designation Jn – joint set number Jr- joint roughness number Ja – joint alteration number Jw – joint water reduction factor SRF – stress reduction factor.
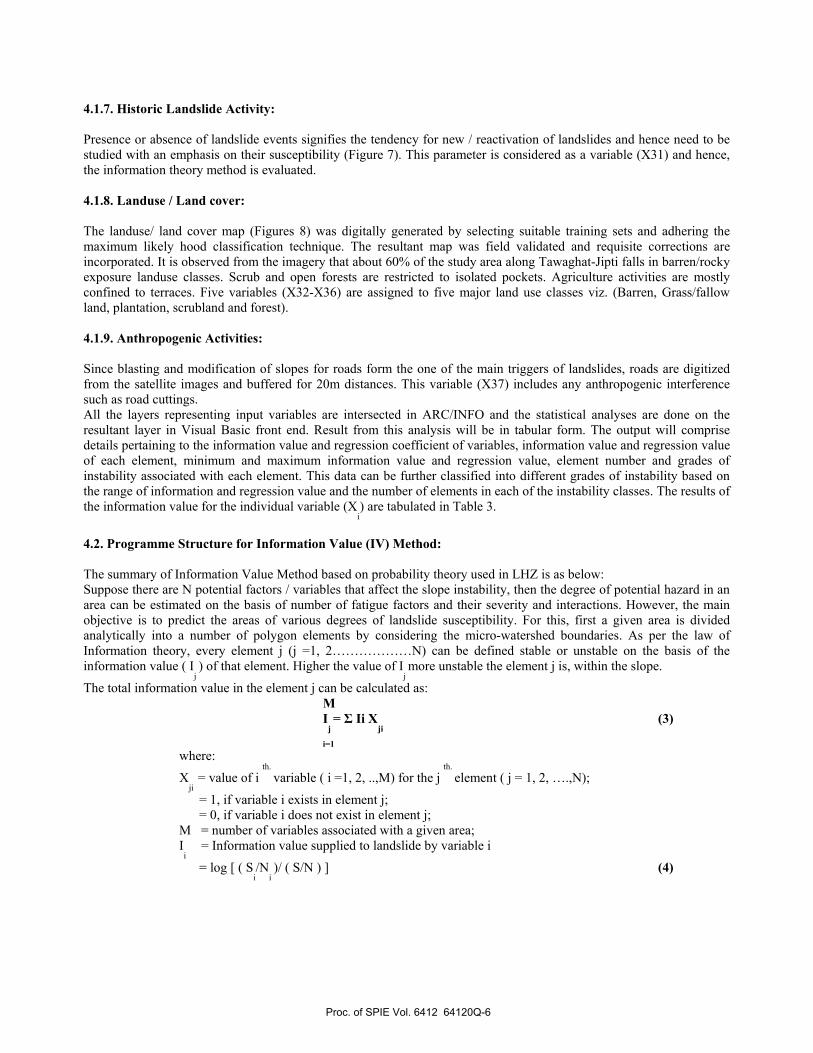
The geotechnical properties (RQD and Q) are shown in Table 2. These values are classified into three classes and assigned the binary values of 0 and 1 depending on their presence or absence.
.if X16 = RQD <40 & Q < 3 then 1 else 0
.if X17 = RQD = 40-60 & Q = 3-7 then 1 else 0
.if X18 = RQD >60 & Q >7 then 1 else 0
4.1.3. Structure: On the basis of presence or absence of a structural element such as Thrust / fault / prominent joints (Figure 4), three variables (X19 – X20) are assigned as 0 or 1. 4.1.4. Seismicity: In the investigated area, available occurrences of seismic events are so far confined to South Chiplakot Thrust, which lies south of the study area. Further, the intensity of these shocks seldom exceeds 6 on the Richter scale. Hence, buffer zones up to 50 kms from the epicenter was made and uniformly assigned the variable (X21) as vulnerable to seismic shaking. 4.1.5. Slope Angle: The classification of the slope is made as per Integrated Mission for Sustainable Development (IMSD) guidelines (NRSA, 1995). Five classes are made on the basis of field observation between slope amount and incidence of landslides (Figure 5). Accordingly,
. if slope > 460 then X22=1 else 0
. if slope 35 - 450 then X23=1 else 0
. if slope 25 - 340 then X24=1 else 0
. if slope 15 - 240 then X25=1 else 0
. if slope < 150 then X26=1 else 0
4.1.6. Aspect: The slope (Figure 5) and aspect map (Figure 6) are generated and classified from the DEM derived from SRTM data. On the basis of Aspect four classes are made. Accordingly,
. if aspect is 0 – 90o then X27=1 else 0
. if aspect is 91-180o then X28=1 else 0
. if aspect is 181-270o then X29=1 else 0
. if aspect is 270-360o then X30 =1 else 0
Proc. of SPIE Vol. 6412 64120Q-5
4.1.7. Historic Landslide Activity: Presence or absence of landslide events signifies the tendency for new / reactivation of landslides and hence need to be studied with an emphasis on their susceptibility (Figure 7). This parameter is considered as a variable (X31) and hence, the information theory method is evaluated. 4.1.8. Landuse / Land cover: The landuse/ land cover map (Figures 8) was digitally generated by selecting suitable training sets and adhering the maximum likely hood classification technique. The resultant map was field validated and requisite corrections are incorporated. It is observed from the imagery that about 60% of the study area along Tawaghat-Jipti falls in barren/rocky exposure landuse classes. Scrub and open forests are restricted to isolated pockets. Agriculture activities are mostly confined to terraces. Five variables (X32-X36) are assigned to five major land use classes viz. (Barren, Grass/fallow land, plantation, scrubland and forest). 4.1.9. Anthropogenic Activities: Since blasting and modification of slopes for roads form the one of the main triggers of landslides, roads are digitized from the satellite images and buffered for 20m distances. This variable (X37) includes any anthropogenic interference such as road cuttings. All the layers representing input variables are intersected in ARC/INFO and the statistical analyses are done on the resultant layer in Visual Basic front end. Result from this analysis will be in tabular form. The output will comprise details pertaining to the information value and regression coefficient of variables, information value and regression value of each element, minimum and maximum information value and regression value, element number and grades of instability associated with each element. This data can be further classified into different grades of instability based on the range of information and regression value and the number of elements in each of the instability classes. The results of the information value for the individual variable (X
i) are tabulated in Table 3.
4.2. Programme Structure for Information Value (IV) Method: The summary of Information Value Method based on probability theory used in LHZ is as below: Suppose there are N potential factors / variables that affect the slope instability, then the degree of potential hazard in an area can be estimated on the basis of number of fatigue factors and their severity and interactions. However, the main objective is to predict the areas of various degrees of landslide susceptibility. For this, first a given area is divided analytically into a number of polygon elements by considering the micro-watershed boundaries. As per the law of Information theory, every element j (j =1, 2………………N) can be defined stable or unstable on the basis of the information value ( I
j ) of that element. Higher the value of I
j more unstable the element j is, within the slope.
The total information value in the element j can be calculated as: M I
j = Σ Ii X
ji (3)
i=1
where:
Xji
= value of i th.
variable ( i =1, 2, ..,M) for the j th.
element ( j = 1, 2, ….,N);
= 1, if variable i exists in element j; = 0, if variable i does not exist in element j; M = number of variables associated with a given area; I
i = Information value supplied to landslide by variable i
= log [ ( Si/N
i )/ ( S/N ) ] (4)
Proc. of SPIE Vol. 6412 64120Q-6

LITHOLOGY MAP OF TAWAGHAT - JIPTI ROUTE CORRIDOR
N
/'7
LegendnIngn C '- — LINEAMENT MAP
LITHOLOGY nQOT) NJ
\I
Chdtsthit
p'r
FGphh
_______________ ::Fig. S Fig. 4
SLOPEASPECT MAP
4,Fig. 6
580
2220180.225 <45
A
LANDUSE MAP
GAD
.<;--': <<NGTI_s_ '
SCALE
1<4 44222 1104142 40454550 >5l
LANDSLIDE DISTRIBUTION MAP
- %AGAD77/ MGT
—
TAWAATr ::.-.-.7 ./ KALII&ER - - -
9 Legend
• t — Stb,knd LndId•3. ncALn
Fig. Fig. 8
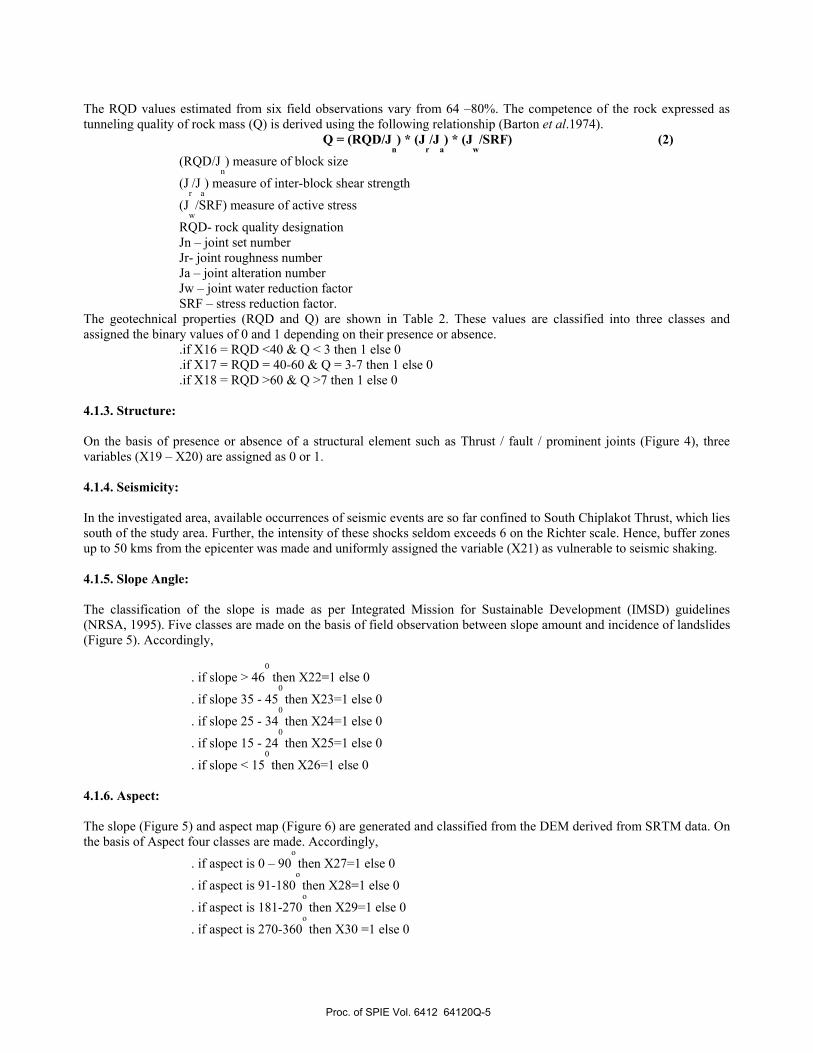
Figure 3 – 8 Thematic Maps of Tawaghat – Jipti Route Corridor used for analysis in GIS; Fig. 3 – Lithological Map; Fig. 4 – Lineament Map; Fig. 5 – Slope Map; Fig. 6 – Aspect Map; Fig.7 – Landslide Distribution Map; Fig. 8 – Landuse Map.
Proc. of SPIE Vol. 6412 64120Q-7
Lithology R.Q.D (%) Q Chiplakot Crystallines 64-80 3-4Amphibolite 49-69 4-7 Biotite schist 45-50 2-3 Calc schist 60-65 3 Calc silicate 59-62 4-6 Carbonaceous phyllite 45-55 2-3 Chlorite schist 45-48 2-4 Flaggy quartzite 36-42 3-4 Garnet mica schist 56-60 4 Garnet schist 60-65 4 Graphite schist 55-60 4 Migmatized gneiss 50-60 3-6 Phyllite 40-45 4 Quartzite 65-80 5-8 Talc chlorite schist 40-45 2 Rungling Crystallines 60-65 4-5
Table 2 – Major Litho Types and their Geotechnical Characteristics along Tawaghat – Jipti Route Corridor
Variable Information Value
(Tawaghat – Jipti) X1 0.115 X2 0.009 X3 0.004 X4 0.388 X5 -0.007 X6 0.004 X7 0.017 X8 -0.008 X9 0.285 X10 -0.007 X11 -0.014 X12 0.004 X13 0.005 X14 -0.058 ---------------------------------------------- X37 0.003
Table 3 – Derived Information Values of the Variables
Proc. of SPIE Vol. 6412 64120Q-8

where: N = total number of elements; S = number of elements with history of landslide occurrence; S
i = number of elements with history of landslide occurrence involving variable i;
Ni = number of elements involving variable i.
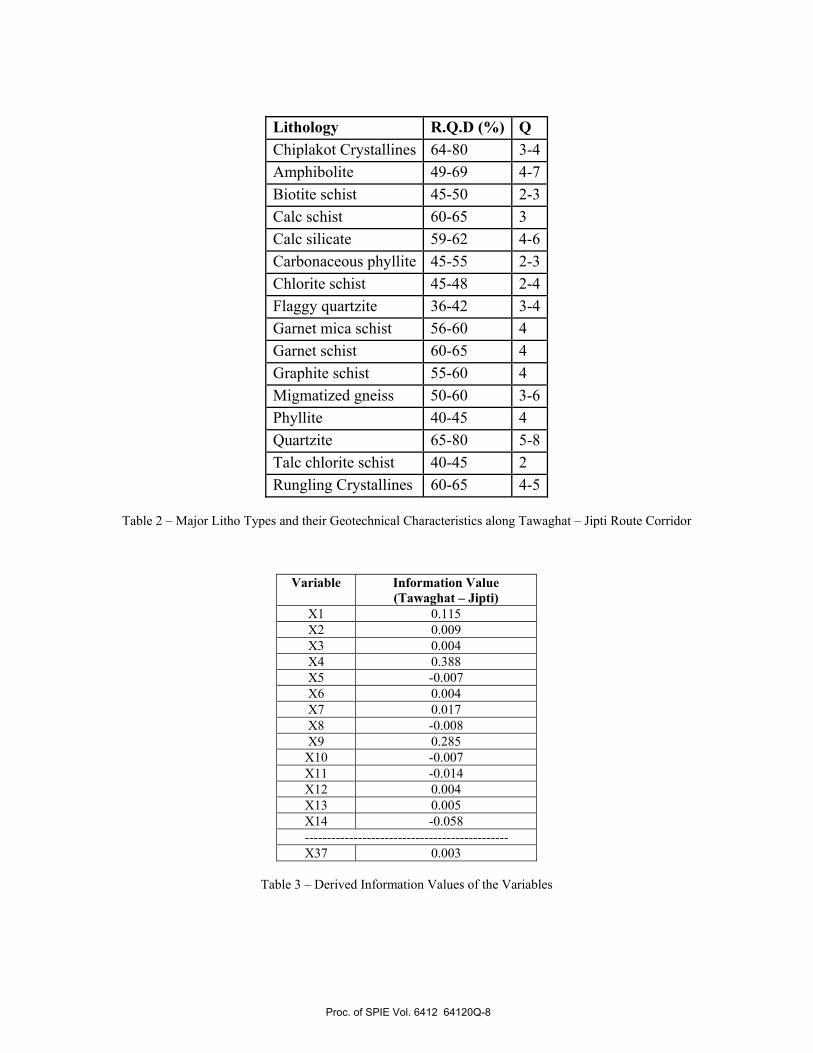
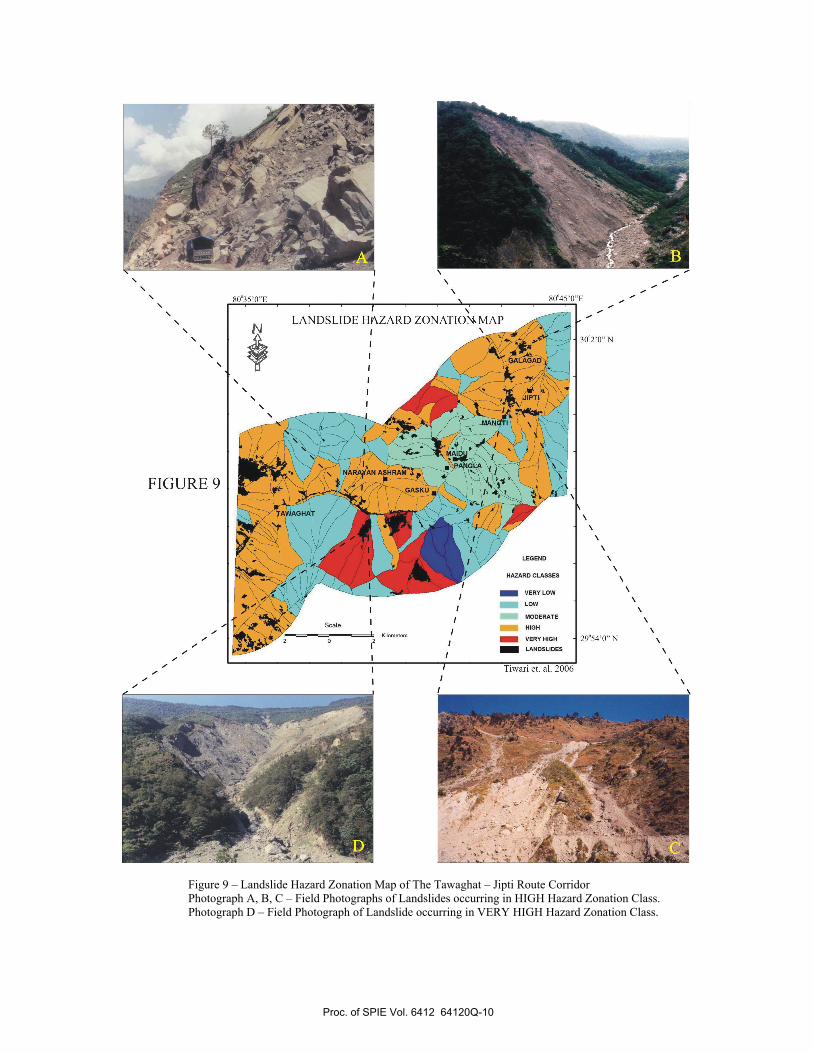
Accordingly, the information value of the element j with respect to above tables will be Ij = -0.003Xj1+0.001Xj2+0.009Xj3……………..+ 0.003Xj37 (5) The information values of all the polygon elements are found using these equations for the respective areas. On the basis of histogram distribution, the polygon elements are classified into five hazard classes viz. very low (Ij <= -0.02), Low (-0.02 < Ij < 0.103) moderate (0.10 <Ij <0.23), high (0.23 < Ij < 0.40) and very high (Ij > 0.40) landslide hazard prone zones. On the basis of this information, Probable Landslide Hazard Zonation Map is prepared for this area (Figure 9) in ARC/INFO. The resultant probable landslide hazard zonation map has been compared with the landslide activity map (Figure 7) generated using IRS 1D LISS-III and PAN merged data product for the period December 2002 and has been cross validated with field incidences of landslides in subsequent years of 2003, 2004 and 2005 for its accuracy. 4.3. Accuracy of Prediction: The experimental probability of prediction is evaluated using the following equation
P = KS/ S * (1- (K-KS) / N-S) 1/3
(6) Where: N = Total no of elements S = No. of elements containing landslides K = No. of elements falling into High and Moderate classes KS = No. of elements falling into High and Moderate classes containing Landslides
The accuracy of information theory in predicting the slope stability is evaluated by the experimental probability equation - 6. Thus, the derived accuracy of slope instability prediction for the Tawaghat-Jipti Route Corridor is 78%.
5. DISCUSSION AND CONCLUSION
Discretization of the area into polygon elements is advantageous as they have been classified depending on the slope and aspect category and thus, assess the instability of each element independently. The information value of each polygon element unit has been determined using the equation no 5 and evaluated the accuracy by using equation 6. The accuracy estimation is 78% for Tawaghat-Jipti Route Corridor. On the basis of histogram distribution, they are classified into five major classes. These five grades of instability are defined as very low, low, medium, high and very high depending upon ranges of information values. From the overlay analysis of landslide incidences and hazard zones, it is apparent that the hazard maps generated correlate well with the landslide event map. There is high degree of conformity among the hazard zones vis-à-vis the event map in terms of both landslide incidences and magnitude of an event expressed in terms of area (Table 4). However, the medium and high classes derived from information theory method do not commensurate well with the landslide event map.
Tawaghat - Jipti Route Corridor Hazard Class Number of Landslides
(Incidences) Area (km2)
Very High 6 1.49 High 26 5.7
Moderate 15 0.81 Low 15 0.27
Very Low 1 0.10
Table 4 – Area and Incidences Statistics of Landslides in the Investigated Area
Proc. of SPIE Vol. 6412 64120Q-9
80°35'Q"E I 80°45'O"E
LANDSLIDE HAZARD ZONATION. MAP I.-N
3O02ON
TfTTr)r? nriuuicj i
HAZARD CLASSES
VERY LOW
LOWI I
MODERATE IScale — HIGH I
—___.—---____—-----—________L KiIon,eoe IVERY HIGH -I 29°54'O" N2 0
12 I — LANDSLIDES
I I
/////
;L .
Figure 9 – Landslide Hazard Zonation Map of The Tawaghat – Jipti Route Corridor Photograph A, B, C – Field Photographs of Landslides occurring in HIGH Hazard Zonation Class.
Photograph D – Field Photograph of Landslide occurring in VERY HIGH Hazard Zonation Class.
Proc. of SPIE Vol. 6412 64120Q-10

This discrepancy may be attributed to the following reasons- 1. Certain polygon elements with a given landslide can fall within a low to medium grades of instability; these polygon elements, however, are assigned a high grade of slope instability. This discrepancy of grades arises when factors considered in the analysis have a low weightage in that particular element. 2. The landslide in that element might have occurred due to a factor, which has not been considered in analysis because; it does not have a significant influence on the overall landslide occurrences in the area under study.
Acknowledgements: The authors are grateful to the Department of Science and Technology, Ministry of Science & Technology, Government of India for funding the studies vide its project DST/ESS/11/092(33)/(2001). The authors are also thankful to Indian Meteorological Department, National Hydel Power Corporation and Border Roads Organization for providing necessary data and logistic support.
REFERENCES A. Carrara, “Multivariate models for landslide hazard evaluation,” Math. Geol., vol. 15, no3, pp 403 – 425 (1983) A. Gansser, Geology of the Himalayas. 289p. Interscience publ., London, (1964) A. Heim, and A. Gansser, “Central Himalaya, Geological observations of the Swiss Expedition, 1936.” In
Mem.Soc.Helv.Sci.Nat.73(1),1-245 (1939) A. Karnieli, A. Meisels, L. Fiesher, and Y. Arkin, “Automatic extraction and evaluation of Geological linear features
from Digital Remote Sensing Data using Hough Transform.” Photogrammetric Engineering and Remote Sensing, vol. 62(5), pp525-531 (1996)
C. Hayashi, “On the prediction of phenomena from qualitative data and quantification of qualitative data from the
mathematico-statistical point of view,” Ann. Inst. Statist. Math., vol.3, pp 69 -98 (1952) E. L. Harp, and R.W. Jibson, “Landslides triggered by the 1994 Northridge, California earthquake.” Bull. of
Seismological Soc. of America, vol. 86 (1B),pp.s319-s332 (1996) G. Fuch, and W. Frank, “The geology of the Nepal between the rivers Kali Gandaki and Thulo Bheri. Jahrbuch der
Geologischen Bundesanstalt, Sonderband, v, 18, p103 (1970) H. Kawakami, Y. Saito, “Landslide risk mapping by quantification method.” Int. Symp. Landslides, Toronto, Ont., pp
535-540 (1984) IMSD (1995). Integrated Mission for Sustainable Development, Technical Guidelines. pp 74, National Remote Sensing
Agency, Department of Space, Government of India, Hyderabad. K.L. Yin, and T.Z. Yan, “Statistical prediction models for slope instability of metamorphosed rocks.” Intl. Symp.
Landslides, lausanne, pp.1269 - 1272 (1988) K.S. Valdiya, Geology of Kumaun Lesser Himalaya, 291p, Publ.: Wadia Institute of Himalayan Geology, Dehradun,
India, (1980) K.S. Valdiya, “Tectonics and evolution of the central sector of the Himalaya,” Phil. Trans. R. Soc. London, A326, pp
151-175 (1988) Luzi,L. Pergalani,F. and Terlien, M.T.J. “Slope vulnerability to earthquakes at subregional scale, using probabilistic
techniques and geographic information systems.” Int. Jour. Engineering Geology, vol. 58, pp. 313-336 (2000)
Proc. of SPIE Vol. 6412 64120Q-11
M. Haruyama, and R. Kitamura, “An evaluation method by the quantification theory for the risk degree of landslide caused by rainfall in active volcanic area.” Int. Symp. Landslides, Toronto, Ont., pp.435-440 (1984)
N. Barton, R. Lien, and J. Lunde, “Engineering classification of rock masses for design of tunnel support.” Rock
mechanics, vol. 6 pp189-236 (1977) P. Srivastava, and G. Mitra, “Thrust geometries and deep structure of the outer and lesser Himalayas,Kumaon and
Garhwal(India): Implications for the evolution of the Himalayan fold and thrust belt.” Tectonics. vol.13, pp89-109 (1994)
R.W. Jibson, C.S. Prentice, B.A. Borissoff, E.A. Rogozhin, and C.J. Langer, “Some observations of landslides triggered
by 29th April 1991 Racha earthquake, Republic of Georgia.” Bulletin of the Seismological Society of America, vol. 84(4), pp. 963-973 (1994)
R.W. Jibson, E.L. Harp, and J.A. Michael, “A method for producing digital probabilistic seismic landslide hazard maps:
An example from the Los Angeles, California, area.” U.S. Department of interior, open file report 98-113, pp.1-17 (1998)
R.W.Jibson, E.L. Harp, and J.A. Michael, “A method for producing digital probabilistic seismic landslide hazard maps.”
Int. Jour. Engineering Geology, vol 58, pp. 271-289 (1999) S. Jade, and S. Sarkar, “Statistical models for slope instability classification,” Intl. Jour. of Engineering Geology, vol. 36,
pp 91 – 98 (1993) S. K. Paul, S. K. Bartarya, P. Rautela, A. K. Mahajan, “Catastrophic mass movement of 1998 monsoons at Malpa in Kali
Valley, kumaun Himalaya (India),” Geomorphology 35, 169 – 180 (2000) Y. Kumar, and R. C. Patel, “Deformation mechanism in the Chiplakot crystalline belt (CCB) along Kali-Gori valleys
(Kumaon), NW-Himalaya.” Geol. Soc., India, Vol.64, pp76-91 (2004)
Proc. of SPIE Vol. 6412 64120Q-12