INTERSTATE-5 CORRIDOR - Mulholland Institute
66
San Fernando Valley - Santa Clarita Valley INTERSTATE-5 CORRIDOR Economic and Community Development Strategy 5121 Van Nuys Blvd. Ste 202 Sherman Oaks, CA 91403 818-377-6387 Fax 818-379-7077 September 2007 Report: MI-2007A
-
Upload
khangminh22 -
Category
Documents
-
view
0 -
download
0
Transcript of INTERSTATE-5 CORRIDOR - Mulholland Institute

San Fernando Valley - Santa Clarita Valley
INTERSTATE-5 CORRIDOR
Economic and Community Development Strategy
5121 Van Nuys Blvd. Ste 202Sherman Oaks, CA 91403
818-377-6387 Fax 818-379-7077
September 2007Report: MI-2007A

INTERSTATE-5 CORRIDOR Economic and Community Development Strategy
September 2007 Report: MI-2007A
San Fernando Valley - Santa Clarita Valley
Page 2 Vision2020 - Interstate-5 Corridor
Credits and Participants Produced by Mulholland Institute, Sherman Oaks, California
Sponsors Economic Alliance of the San Fernando Valley San Fernando Valley Economic Research Center
Cal State University Northridge CivicCenter Group Palmer Investments, Inc. Project Team Joel Kotkin Robert L. Scott LLB Michael A. Shires PhD Daniel R. Blake PhD Contributors Dinah Dzogbenya Galley Bruce D. Ackerman President/CEO Economic Alliance of the San Fernando Valley Wayne Adelstein President/CEO North Valley Regional Chamber of Commerce William Allen President/CEO Los Angeles Economic Development Corp. Roberto Barragan President/CEO Valley Economic Development Center James Brewer Vice President, Spiegel Development Paul Brotzman Director of Community Development, City of Santa Clarita Martin M. Cooper Chairman, Cooper Beavers Marketing and Public Relations Paul Deibel AICP Community Development Director, City of San Fernando David W. Fleming Chairman, Los Angeles Area Chamber of Commerce Rob Gilmore Vice President, Newhall Land & Farming Ken Hitts Regional Manager Los Angeles Economic Development Corp. Jerry Hirneise Partner, D.S. Honda Construction Co. David S. Honda President, L.A. City Area Planning Commission, Northeast Valley Brendan Huffman President, Valley Industry & Commerce Association Coby King Coby King Communications Phillip Lanzafame Development Services, City of Glendale Victor Lindenheim Executive Director, Golden State Gateway Coalition Henry Leyva Regional Manager Los Angeles Economic Development Corp. Sean McCarthy Public Affairs, Bob Hope/Burbank Airport, United Chambers Robert Newman Public Works Director, City of Santa Clarita Hilary Norton Orozco Palmer Investments, Inc., Las Lomas Jerry L. Pollak Architect, American Institute of Architects, SFV Tom Rath City of Los Angeles Planning Dept., Sun Valley UDAT Brad Rosenheim Rosenheim & Associates Brad Ward Small Manufacturers Association of California Connie Worden-Roberts Civic Leader, Santa Clarita Valley
Mulholland Institute Page 3
Table of Contents Table of Contents ....................................................................................................................... 3
The Emergence of Southern California’s Opportunity Region ......................................................... 5
Key Findings ............................................................................................................................. 6
Executive Summary .................................................................................................................... 7
Industrial and Commercial – a Region of Opportunity ............................................................... 7
Interstate-5 Corridor Cities and Regions ...................................................................................... 9
Interstate-5 Corridor Synergy ................................................................................................... 12
Developing an Economic Strategy ............................................................................................. 21
Visioning for “Quality” in Growth and Redevelopment: Building on Success ................................. 25
Industrial and Commercial Opportunities ................................................................................... 32
Housing Opportunities ............................................................................................................. 35
Strategy for the Interstate-5 Corridor ......................................................................................... 39
A Vision for Community and Economic Development .............................................................. 41
Strategy – Tactics for Implementation ..................................................................................... 41
Conclusion: Seizing Opportunities ............................................................................................ 46
Appendix One: Demographics of the Corridor ....................................................................... 47
Appendix Two: Income ......................................................................................................... 50
Appendix Three: Educational Institutions ................................................................................ 52
Appendix Four: Workforce Attributes .................................................................................... 55
Appendix Five: Employment ................................................................................................. 57
Appendix Six: Business Sectors ............................................................................................. 59
Appendix Seven: Geography North Los Angeles County I-5 Corridor ...................................... 60
Endnotes ............................................................................................................................. 62
Page 4 Vision2020 - Interstate-5 Corridor
5121 Van Nuys Blvd. Ste. 302, Sherman Oaks, CA 91403
818-377-6387 Fax: 818-379-7077 www.MulhollandInstitute.org
© Copyright 2007, Mulholland Institute
Mulholland Institute Page 5
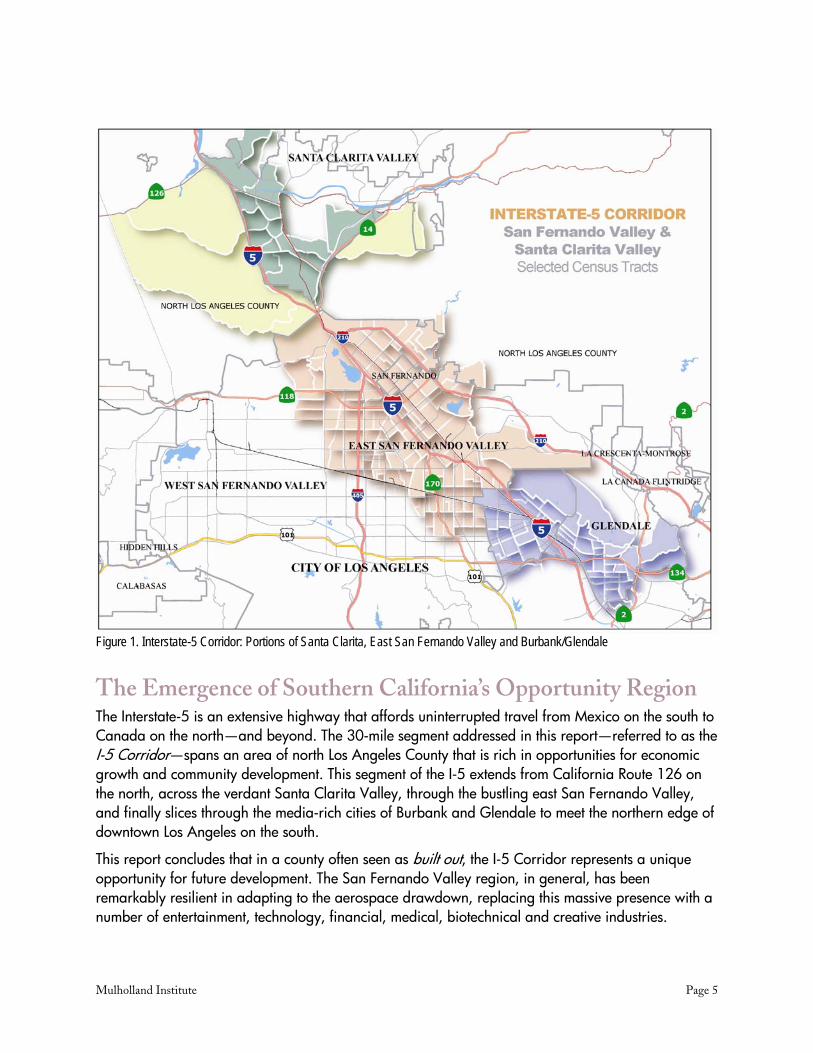
Figure 1. Interstate-5 Corridor: Portions of Santa Clarita, East San Fernando Valley and Burbank/Glendale
The Emergence of Southern California’s Opportunity Region The Interstate-5 is an extensive highway that affords uninterrupted travel from Mexico on the south to Canada on the north—and beyond. The 30-mile segment addressed in this report—referred to as the I-5 Corridor—spans an area of north Los Angeles County that is rich in opportunities for economic growth and community development. This segment of the I-5 extends from California Route 126 on the north, across the verdant Santa Clarita Valley, through the bustling east San Fernando Valley, and finally slices through the media-rich cities of Burbank and Glendale to meet the northern edge of downtown Los Angeles on the south.
This report concludes that in a county often seen as built out, the I-5 Corridor represents a unique opportunity for future development. The San Fernando Valley region, in general, has been remarkably resilient in adapting to the aerospace drawdown, replacing this massive presence with a number of entertainment, technology, financial, medical, biotechnical and creative industries.

Page 6 Vision2020 - Interstate-5 Corridor
Key Findings The Interstate-5 Corridor has exceptional capacity for economic development when compared to
other regions across the United States and around the world. There are a number of reasons:
Los Angeles is the largest manufacturing center in the United States.
The corridor is adjacent to an internationally renowned cluster of institutions of higher education and technical facilities, including Caltech, NASA’s Jet Propulsion Laboratory, UCLA, USC, Claremont Colleges, California Institute of the Arts, American Film Institute, Fashion Institute of Design and Merchandising, and one of the world’s largest networks of occupational centers and community colleges.
Southern California enjoys an exceptional Mediterranean climate allowing for year-round outdoor activities, production and mobility.
The I-5 Corridor is situated in one of the most desirable lifestyle regions in the world, which is an important consideration for CEOs, and for companies’ ability to attract high-demand talent and a highly-skilled workforce.
The I-5 Corridor is supported by the fifth-largest harbor complex in the world, as well as a constellation of half a dozen regional and international commercial airports.
In addition to the cluster of regional Los Angeles World Airports, the San Fernando Valley is served directly by two local airports: Van Nuys Airport (the world’s busiest general aviation airport) and Bob Hope/Burbank Airport (commercial carriers).
With less than two percent industrial vacancy rate, the east San Fernando Valley will be experiencing a renaissance as much of its current heavy industry becomes obsolete, and its mining and landfill activities phase out in 2007-2010.
The cost of land and labor is generally less in the northeast Valley than in Glendale-Burbank and Santa Clarita presenting an opportunity for certain industry-specific uses.
Santa Clarita—at the north end of the I-5 Corridor study area—has a vision for industrial and commercial growth, and a well-developed entertainment cluster, one that complements the regional entertainment cluster centered in Burbank and Glendale.
The east San Fernando Valley is situated between Glendale-Burbank and Santa Clarita, offering complementary opportunities for economic expansion of these growth clusters, particularly entertainment and technology.
Improved strategies, communication and coordination among I-5 Corridor cities will enhance opportunities for regional economic growth.
In the northeast Valley redevelopment of underdeveloped and polluted properties needs to be addressed through creative planning, zoning and permitting policies, tax incentives, and implementation of other tools to encourage the acquisition and redevelopment of distressed properties now being used for obsolete and deleterious purposes.
Glendale, Burbank and Santa Clarita are considered business-friendly cities.
Mulholland Institute Page 7
Excessive local burdens such as Los Angeles’ substantial Gross Receipts Tax drive away economic growth and quality jobs.
The twin ports of Los Angeles and Long Beach handle more than $290 billion in cargo annually.
The Los Angeles Metropolitan Area ranks ninth—when compared to national economies around the world—with a $650 billion Gross Domestic Product.
Because of the region’s exponential growth, housing stock is unable to keep pace with demand, requiring new strategies for areas closer to the core to minimize impacts on transportation and infrastructure.
Executive Summary Industrial and Commercial – a Region of Opportunity The Interstate-5 Corridor represents a unique opportunity for future residential and economic development.
There are few places on the globe better situated to access resources, opportunities and quality-of-life options than L.A.’s I-5 Corridor. From snow-capped mountains to balmy surf and seas, the region boasts an array of industry-cluster-serving institutions such as: Caltech, NASA/JPL, UCLA, USC, Cal Poly Pomona and San Luis Obispo, California Institute of the Arts, the five Claremont Colleges, Pepperdine University, Fashion Institute, American Film Institute, and a workforce-oriented community college and occupational training system.
Global giants in the entertainment, technology and business services sectors are gradually replacing the older, obsolete industries. Biomedical is ubiquitous and spread out along the US-101 and I-5 corridors. The Biomedical Park at Cal State Northridge has the potential to evolve into a hub for this growing sector.1
These industries produce serious returns to the local economy as they provide stable, high-paying jobs, well suited to the characteristics of the Valley’s educated and upwardly mobile labor force. Additionally, even though there is decreasing availability of easily buildable parcels, Los Angeles still has far more places to build new commercial and industrial space along the I-5 Corridor than in most other, more congested locales.2
The general theme of this report is to highlight the opportunities presented by viewing the selected stretch of the I-5 as a geographic-economic cluster (see Appendix Seven). Present conditions are important, but potential for the future and opportunities for synergy are the main thrust. How can the area evolve; what will make it happen; why is it a good investment; what attributes make it attractive to major national firms, manufacturers and headquarters operations? How can the demographic, economic, and social diversity best be capitalized on?
Entertainment, technology and business services are gradually replacing the older, obsolete industries.
Page 8 Vision2020 - Interstate-5 Corridor
This opportunity is borne out by statistics that reveal continuous improvement for five years running. At a time when the California economy has been growing at a modest rate, and Los Angeles County struggles to recover the jobs lost in the last recession, the region along the I-5 Corridor has continued to surge ahead.
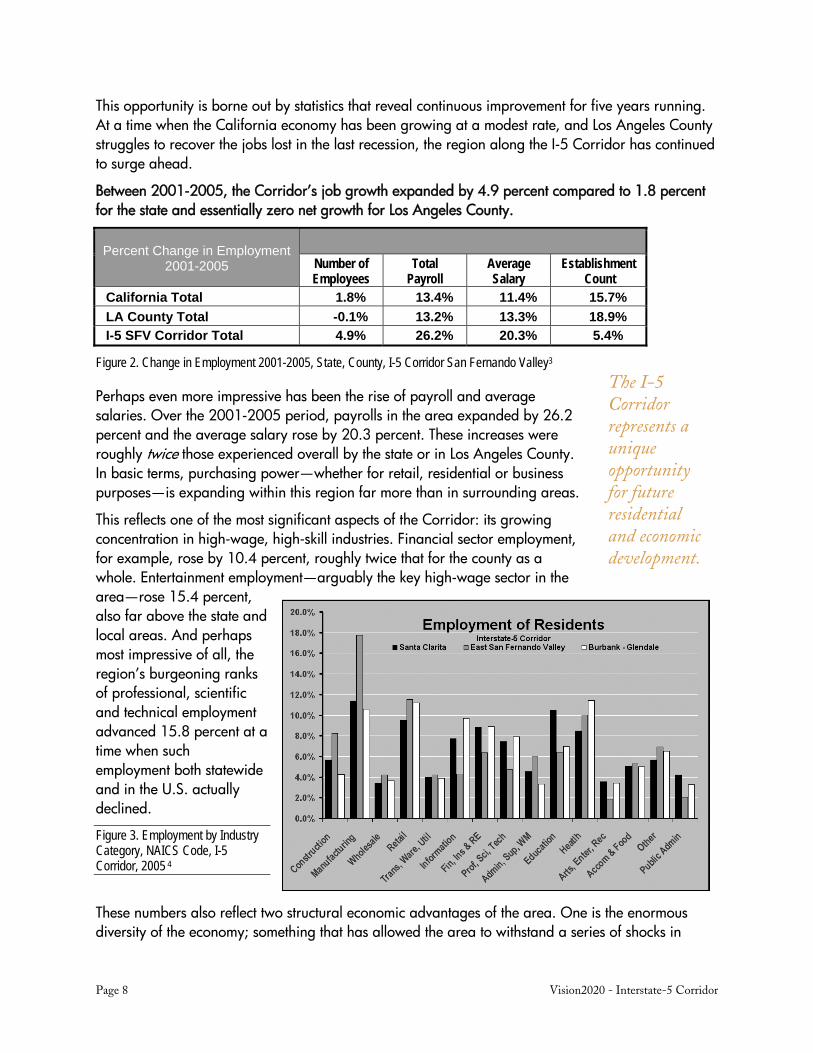
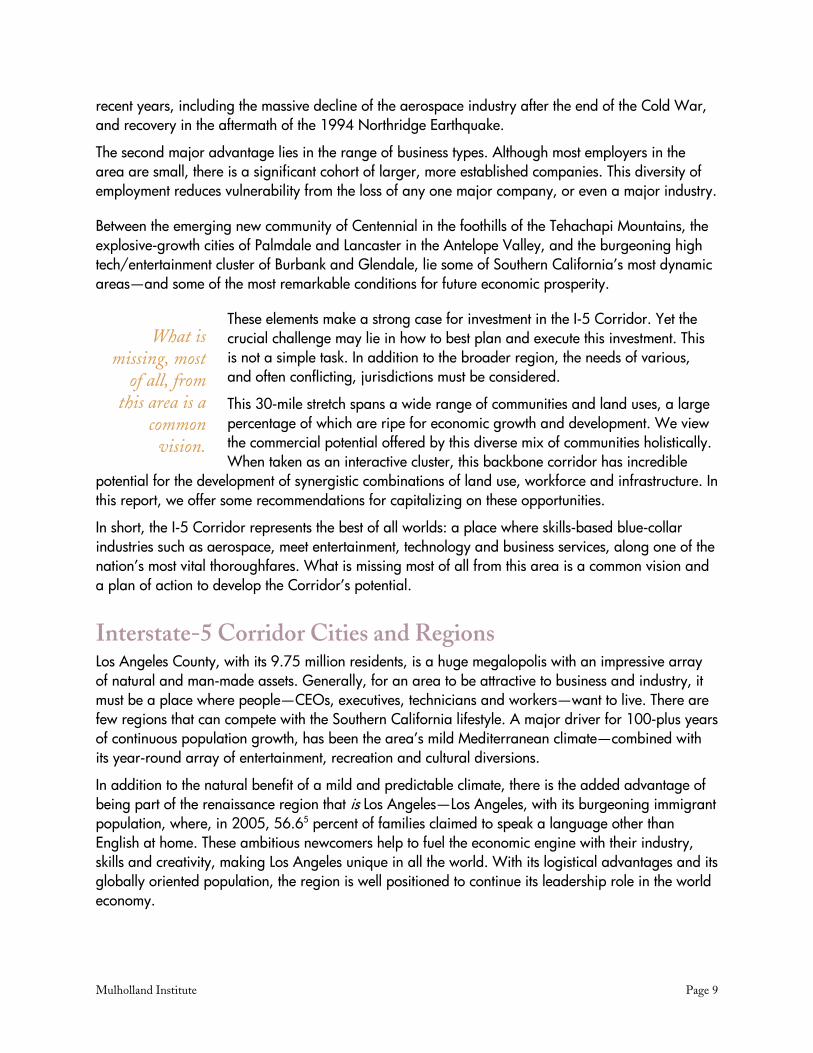
Between 2001-2005, the Corridor’s job growth expanded by 4.9 percent compared to 1.8 percent for the state and essentially zero net growth for Los Angeles County.
Percent Change in Employment 2001-2005
Number of Employees
Total Payroll
Average Salary
Establishment Count
California Total 1.8% 13.4% 11.4% 15.7% LA County Total -0.1% 13.2% 13.3% 18.9% I-5 SFV Corridor Total 4.9% 26.2% 20.3% 5.4%
Figure 2. Change in Employment 2001-2005, State, County, I-5 Corridor San Fernando Valley3
Perhaps even more impressive has been the rise of payroll and average salaries. Over the 2001-2005 period, payrolls in the area expanded by 26.2 percent and the average salary rose by 20.3 percent. These increases were roughly twice those experienced overall by the state or in Los Angeles County. In basic terms, purchasing power—whether for retail, residential or business purposes—is expanding within this region far more than in surrounding areas.
This reflects one of the most significant aspects of the Corridor: its growing concentration in high-wage, high-skill industries. Financial sector employment, for example, rose by 10.4 percent, roughly twice that for the county as a whole. Entertainment employment—arguably the key high-wage sector in the area—rose 15.4 percent, also far above the state and local areas. And perhaps most impressive of all, the region’s burgeoning ranks of professional, scientific and technical employment advanced 15.8 percent at a time when such employment both statewide and in the U.S. actually declined.
Figure 3. Employment by Industry Category, NAICS Code, I-5 Corridor, 2005 4
These numbers also reflect two structural economic advantages of the area. One is the enormous diversity of the economy; something that has allowed the area to withstand a series of shocks in
The I-5 Corridor represents a unique opportunity for future residential and economic development.
Mulholland Institute Page 9
recent years, including the massive decline of the aerospace industry after the end of the Cold War, and recovery in the aftermath of the 1994 Northridge Earthquake.
The second major advantage lies in the range of business types. Although most employers in the area are small, there is a significant cohort of larger, more established companies. This diversity of employment reduces vulnerability from the loss of any one major company, or even a major industry.
Between the emerging new community of Centennial in the foothills of the Tehachapi Mountains, the explosive-growth cities of Palmdale and Lancaster in the Antelope Valley, and the burgeoning high tech/entertainment cluster of Burbank and Glendale, lie some of Southern California’s most dynamic areas—and some of the most remarkable conditions for future economic prosperity.
These elements make a strong case for investment in the I-5 Corridor. Yet the crucial challenge may lie in how to best plan and execute this investment. This is not a simple task. In addition to the broader region, the needs of various, and often conflicting, jurisdictions must be considered.
This 30-mile stretch spans a wide range of communities and land uses, a large percentage of which are ripe for economic growth and development. We view the commercial potential offered by this diverse mix of communities holistically. When taken as an interactive cluster, this backbone corridor has incredible
potential for the development of synergistic combinations of land use, workforce and infrastructure. In this report, we offer some recommendations for capitalizing on these opportunities.
In short, the I-5 Corridor represents the best of all worlds: a place where skills-based blue-collar industries such as aerospace, meet entertainment, technology and business services, along one of the nation’s most vital thoroughfares. What is missing most of all from this area is a common vision and a plan of action to develop the Corridor’s potential.
Interstate-5 Corridor Cities and Regions Los Angeles County, with its 9.75 million residents, is a huge megalopolis with an impressive array of natural and man-made assets. Generally, for an area to be attractive to business and industry, it must be a place where people—CEOs, executives, technicians and workers—want to live. There are few regions that can compete with the Southern California lifestyle. A major driver for 100-plus years of continuous population growth, has been the area’s mild Mediterranean climate—combined with its year-round array of entertainment, recreation and cultural diversions.
In addition to the natural benefit of a mild and predictable climate, there is the added advantage of being part of the renaissance region that is Los Angeles—Los Angeles, with its burgeoning immigrant population, where, in 2005, 56.65 percent of families claimed to speak a language other than English at home. These ambitious newcomers help to fuel the economic engine with their industry, skills and creativity, making Los Angeles unique in all the world. With its logistical advantages and its globally oriented population, the region is well positioned to continue its leadership role in the world economy.
What is missing, most
of all, from this area is a
common vision.
Page 10 Vision2020 - Interstate-5 Corridor
Business Clusters Business clusters have special allure to the economic community. They cultivate common pools of specialized labor and robust supply lines, assuring ready access to the ingredients needed for global competitiveness. The $651 billion6 Los Angeles Metropolitan area Gross Domestic Product exceeds all but eight nations in the world. If a product, service or resource exists, it can very likely be found in Los Angeles.
In 2005, the County of Los Angeles had a population of 9,758,886 spread over 4,060 square miles, for a density of 2,404 per square mile. The City of Los Angeles had a 2005 population of 3,819,951 living in 469 square miles, for a density of 8,145 per square mile. These figures compare favorably with New York City with a density of 26,258 per square mile and Chicago with a density of 12,758 per square mile.7 This also helps to explain Los Angeles’ car culture, and residents’ dependence on the automobile.
The leading industry cluster employers in Los Angeles are: 1) direct international trade with 290,300 jobs; 2) tourism with 263,500 jobs; 3) motion picture and television production with 241,100 jobs; 4) technology with 207,300 jobs; and 5) business and professional services with 165,100 jobs. Highly represented in the technology category are: biomedical, digital information and environmental technologies.8
Los Angeles is the largest manufacturing center in the United States with 470,400 manufacturing employees. The largest among these are: 1) apparel with 61,500 jobs; 2) computer and electronic products with 60,500 jobs; 3) transportation products with 51,900 jobs; 4) fabricated metal products with 48,200 jobs; 5) food products with 43,400 jobs; and 6) furniture with 25,500 jobs. The “Los Angeles Customs District” combined sea and airport trade totaled $293.9 billion in 2005, compared with $267.5 billion for the New York district.9
Companies Located in San Fernando/Santa Clarita Valleys
Leading Publicly-Traded Firms Amgen, Walt Disney, Countrywide Financial, Public Storage, Health Net, Blue Cross, Cheesecake Factory, ValueClick, THQ, Zenith National Insurance, 21st Century Insurance Group, Guitar Center, Semtech, Digital Insight, Mannkind, Minimed, Diodes, K-Swiss, Homestore, IHOP, United Online, Ixia, Power-One, Superior Industries, Electro Rent, MRV Communications, Vitesse Semiconductor, DTS, Salem Communications, Cherokee, On Assignment, Capstone Turbine, 3D Systems, Panavision, IRIS International, Optical Communications Products, Beverly Hills Bancorp, Electronic Clearing House, Image Entertainment, Shoe Pavilion, Unico American, Interlink Electronics, Qualstar, North American Scientific, Chad Therapeutics, Aspyra, HemaCare and Earl Scheib
Leading Manufacturing Firms Anheuser-Busch, Medtronics, Advanced Bionics, Futuremed America, Northrop Grumman Corp., Lockheed Martin Aeronautics Co., The Boeing Company, Sierracin Sylmar, Anthony International, Micro Solutions Enterprises, Superior Industries, OPI Products, Precision Dynamics, Acoustic Authority, The Wella Corporation, Vast1Resources, Pepsi Bottling Group, Panavision, Remo, Thibiant International, Okami, Aerospace Dynamics, American Honda, Catalina Yachts, Chocolates A La
Los Angeles is the largest manufacturing center in the United States.

Mulholland Institute Page 11
Carte, Marfred Industries, Magnetek, Moore Industries, SDI Industries, JMR Electronics, Natrol, Industrial Electronic Engineers, Hydro Systems, Alcatel, Crane Aerospace & Electronics, Triumph Group, Klune Industries, Esterline Mason, Crissair, Pharmavite, HR Textron, ITT Industries, Silgan Plastics Corporation, Wesco Aircraft, Western Filter, Natel Engineering, Ontic Engineering & Manufacturing and Electro Adapter
Leading Private Companies Dole Foods, Princess Cruises, Newmark Merrill, Acco Engineered Systems, PCL Construction Services, Allen Lund Company, Mobile Storage Group, Larwin Company, Anthony International, Munchkin, Regency Lighting, Key Information Systems, Aquafine, B&B Manufacturing, Bergen Brunswick Drug, Micro Solutions, California Millworks, Bertelsmann, BAE Systems, M.S. Aerospace, Aerospace Dynamics, Cardinal Health, Deluxe Media, Harte Hanks Communications, Future Media, Maly’s, Oasis Corporation, Santa Clarita Studios, Valencia Entertainment, SGL Carbon Group, and California Home Builders
Transportation and Goods Movement
The Interstate-5 The I-5 is the westernmost interstate highway in the continental United States—more than that, it is actually an international thoroughfare connecting with highways in Mexico and Canada.
With a proliferation of automobiles and a sprawling urban form, Southern California is continually challenged to improve its transportation infrastructure. In the Santa Clarita Valley, it is estimated that 75 percent of the traffic on the I-5 is pass-through regional traffic. It affects planning and growth, forcing developers “to step out and create some sort of regional solutions.”10 Even though parallel Route 99 is still in operation, most through traffic opts for I-5, including those making the non-stop express run between Los Angeles and San Francisco.11
Goods Movement Transportation is critical to successful enterprise; business and industry rely heavily on goods movement. Ready access to resources and raw materials is critical in markets where in-process inventories are a tactical liability and just-in-time production is the order of the day. The twin ports of Los Angeles and Long Beach, handling more than $290 billion in cargo annually, make up the busiest seaport complex in the nation, and the fifth busiest in the world, after Singapore, Hong Kong, Shanghai, and Shenzhen. Approximately half the cargo—including everyday consumer products such as electronics, apparel and shoes—is transported by train outside of Southern California to destinations across the country.
In 2005, the twin ports handled a volume of more than 240 million metric tons of freight in 14 million TEUs (Twenty Foot Equivalent Units/containers). U.S./foreign trade imbalances become obvious at the ports, with only two percent of the containers arriving empty, and over 65 percent departing empty. This does, however, indicate considerable unused export capacity.
The twin ports of Los Angeles and Long Beach, handle more than $290 billion in cargo annually.
Page 12 Vision2020 - Interstate-5 Corridor
The Alameda Corridor Operations on the Alameda Corridor freight rail expressway began in April 2002, speeding cargo to and from the nation's two busiest seaports and L.A.’s transcontinental rail yards, dramatically enhancing goods movement, while easing traffic congestion. Some 10,000 containers per day make their way by train up the 20 miles of the Alameda Corridor, northward into downtown Los Angeles.
The Corridor is made up of a series of bridges, underpasses, overpasses and street improvements that separate freight rail, passenger rail and street traffic. By consolidating branch rail lines into a single expressway, the Alameda Corridor eliminates more than 200 at-grade crossings where rail and street traffic would conflict, thereby easing traffic congestion and significantly reducing air and noise pollution from idling trains, trucks and cars.
Air Travel and Freight Los Angeles World Airports comprises a cluster of commercial and general aviation facilities. The largest is Los Angeles International with a regional impact of over $60 billion, serving over 61 million passengers and accommodating 2.1 million tons of freight in 2006. In the same period LA/Ontario Airport processed seven million passengers and 602,000 tons of cargo. LA/Palmdale Airport is located in the rapidly growing Antelope Valley and, while its operations are just now getting started, it has an enormous future capacity, particularly for the northern San Fernando and Santa Clarita Valleys. Van Nuys Airport, located in the San Fernando Valley, is the nation’s busiest general aviation facility with over 450,000 operations per year and a $1.25 billion regional impact.
Bob Hope/Burbank Airport is also located in the Valley. It is operated under a joint powers authority by the cities of Burbank, Glendale and Pasadena. Bob Hope served 5.6 million passengers in 2006 and accommodated 57,500 tons of cargo. Commercial airports to the south include Long Beach with a 2006 passenger count of 2.8 million and a freight tally of 50,000 tons, and John Wayne Airport with 9.6 million passengers and 24,000 tons of freight in the same period.
Interstate-5 Corridor Synergy There is substantial ongoing demand for office, production and storage space along the I-5 Corridor, space that would complement the existing higher-rent commercial uses to the north and south. As the east San Fernando Valley becomes more and more hospitable for community-friendly clean industry and commerce, many of the less attractive uses—uses that consume large tracts of land—will be replaced. In some of the east Valley areas, this is already happening. New industrial, campus-style centers are being developed to accommodate and expand the forward-looking industries that are being attracted.
The Valley’s economic base shifted in the 1990s with the share of total employment made up by durable goods manufacturing shrinking from 13.6 percent in 1991 to 9.3 percent in 1999. The loss of durable goods-producing jobs hurt, with high-wage activities such as aircraft and missile production being difficult to replace. Over the same timeframe, the largest job sector—services—increased its share from an already strong 37.6 percent to 44.9 percent. The service sector is leading the transition to resilient wealth–producing industries in which the U.S. can remain competitive. The Valley is a leading region in this category.

Mulholland Institute Page 13
All service businesses are not the same. The service category includes a number of high-skill, high-wage activities such as motion picture and television production, software development, and health sciences, as well as some traditional business and financial sectors. It also includes some lower-wage industries such as tourism, hospitality and food service.12
The 1990s also brought a moderate decline in the retail sector, from 17.0 percent to 15.5 percent of the Valley’s job base. Since retail should track somewhat with population, which is growing, such
slowdowns may be the result of consumer belt-tightening. In part this may also be the outcome of permanent changes in shopping patterns and an increase in online shopping with out-of-state retailers.
Employment in the San Fernando Valley is spread over thousands of small to medium-sized firms. The business base in Los Angeles County is comprised almost entirely of smaller firms. Firms with fewer than 20 employees account for 94.4 percent of all establishments in the county (95 percent in the Valley), and firms with 50-249 employees accounted for a further five percent (4.4 percent in the Valley). Countywide, there are 204 firms with 1,000 or more employees, and of these 45 (or 21.9 percent) are located in the Valley.13
Figure 4. Number of Firms in Each Revenue Category, I-5 Corridor 200614
This critical edge has evolved from, and depends upon, a thriving, extremely entrepreneurial and diverse economy. It is anchored on three relatively high-wage main industries. Two of these, entertainment and aerospace, represent classic “export” industries, shipping products out to the rest of the nation and the world. As when a nation ships goods to another country, with domestic exports, a region gains wealth when it adds value, selling a product or service to customers outside the local area.15 This is in contrast to self-serving industries that merely recycle existing dollars within the region.
Another area—even more exciting, particularly for the future—has been the evolution of business service sectors—notably in the insurance and financial fields—where the Valley increasingly performs high-end work, not only for locally based companies, but for others located outside the region.16 In some cases, these represent what the urbanist Jane Jacobs defined as import-replacing activities, that is, services in this region that in the past, had been done in other areas. A typical example would be a local individual or firm that used to secure legal or accounting services from firms on the Westside or downtown, but now contracts for these services within the Valley.17 The growth of business services in the Corridor is an important indicator of the maturation of the region’s economy, from its earlier roots as an agricultural—and then a bedroom—community.
These industries, with their large payrolls and relatively high salaries, provide the essential economic bases upon which the rest of the Valley depends. They help stimulate other important sectors of the
Page 14 Vision2020 - Interstate-5 Corridor
economy such as real estate, construction and retail sales. This is a classic example of dependency, where the state of the export industries sets the stage for economic progress and sends capital into the other sectors. This benefits the workforce, and in turn, increases prosperity in the region’s communities.18
Santa Clarita Valley and the City of Santa Clarita Until 1987 the Santa Clarita Valley was comprised of a cluster of unincorporated communities in the northern part of the County of Los Angeles: Newhall, Saugus, Valencia, Castaic, Canyon Country, Val Verde and Sand Canyon. When the City of Santa Clarita was incorporated, it took in much of the territory of its predecessor communities: Valencia, Saugus, Newhall and Canyon Country.
According to Paul Brotzman, Director of Community Development for the city, Santa Clarita is positioned as a Valley of Villages, with livable communities built around centers of activity. Those centers need to offer a full range of local-serving amenities. Part of the strategy is to create at least two local jobs for every new residential unit constructed, promoting a healthy jobs-housing balance. However, the city has no control over development outside its boundaries, raising some concerns over the impacts such projects have on the city’s roads and infrastructure.
Because the flow of traffic knows no bounds, no single jurisdiction can effectively mitigate or accommodate the impacts of its development. The outlying communities of Los Angeles need to redouble efforts to seek regional solutions, particularly in matters of long-term transportation planning.
The I-5 Corridor portion of the City of Santa Clarita had a 2005 population of 86,72819 residing in 73.14 square miles, for a density of 1,186 per square mile. This area grew by a dramatic 12.3 percent in 2005. Its residents are generally well to do, with a 2005 median income of $75,88220 compared to $53,431 for Los Angeles County and a U.S. median of $55,832. The area is slightly above average in white-collar employees.
FBI statistics ranked Santa Clarita the safest city in the nation in 2002.21 Santa Clarita has consistently ranked in the top five safest cities in the U.S., and the unemployment rate continues at under three percent. Santa Clarita's over-25 population is highly educated. This setting of safety along with a highly qualified workforce continually attracts and retains world-class corporations.
The Film Industry An important economic engine for Santa Clarita is entertainment production. Motion picture sound stages, back lots and support industries abound. The area provides a diverse natural backdrop and wide range of facilities able to simulate virtually any location in the world—past, present or future—just minutes from the major Hollywood studios and their talent base.
The Santa Clarita portion of the regional entertainment cluster has its own film office and boasts over 750 days of filming and over $16 million in annual production revenues generated by local businesses. The film industry is one of the top four targeted industries in Santa Clarita. According to an analysis performed by Alfred Gobar and Associates in 2006, an estimated five percent of the eligible workforce in Santa Clarita is employed by the film industry. Approximately half of these
Santa Clarita has consistently
ranked in the top five safest
cities in the U.S.

Mulholland Institute Page 15
residents must commute outside Santa Clarita to work, while the other half are able to work in film industry jobs in Santa Clarita.22
Santa Clarita is home to over 20 soundstages, approximately a dozen movie ranch/backlots, and numerous production-related businesses that generate dozens of movies, music videos, television shows and commercials annually. A highlight of the movie industry is the Melody Ranch Motion Picture Studio Western Back Lot, which has served as a backdrop for over 2,000 productions since it opened in 1915.
Planning and Land Use The original Valencia Master Plan was drafted in the early 1960s with the creative guidance of the renowned urban planner Victor Gruen, and with significant help from the Planning Director of Los Angeles County. Most of modern Santa Clarita is the result of a decades-long development plan of the Newhall Land & Farming Company.
The Newhall Land & Farming Company owns 51,620 acres devoted to real estate and agricultural operations. Its primary business is developing master-planned communities. Newhall Ranch—its next new town—and the community of Valencia, together form one of the nation's most valuable land holdings—36,000 acres, a mere 30 miles north of downtown Los Angeles.23
The Newhall Ranch project is located west of Interstate-5 and south of State Highway-126. Development is expected to begin in early 2008, with the first homes for sale by 2009. It is anticipated that this 21,000 home, 12,000-acre development will take nearly 25 years to complete.
The first phase will include up to one million square feet of commercial space divided between mixed-used, neighborhood-oriented sites on the east side of the development, and more regionally-oriented sites on the west side. With the on-site commercial development and the still-expanding Valencia Commerce Center, Newhall Ranch is projecting the creation of 20,000 permanent jobs.24
Santa Clarita Commercial and Industrial Commercial properties are being developed in Santa Clarita at an astounding rate. Valencia Gateway, encompassing more than 5,000 acres, 23 million square feet, 1,430 companies, and 45,000 employees, is recognized as the largest master-planned center for business, technology and industry in Los Angeles County. At "build-out," Valencia Gateway and Newhall Ranch will include over 54 million square feet, 120,000 employees and 4,000 companies. 25
To the northeast of the I-5 junction with CA-14, the 584-acre Gate King project is planned—a subdivision of 60 commercial and industrial sites. The development will accommodate up to 4.45 million square feet of space, and at the same time establish over 350 acres of open space.
Existing industrial centers include the Valencia Commerce Center (1,600 acres), Valencia Industrial Center (1,117 acres), Rye Canyon Business Park (377 acres) and the Centre Pointe Business Park, a 240-acre master plan now under construction. Planned industrial centers include Needham Ranch (160 acres), Valencia Spectrum (75 acres) and Homestead Business Park (55 acres).
Office properties currently on line include Valencia Corporate Center (68 acres), Gateway Corporate Point (49 acres), and Town Center Drive (23 acres). Planned office centers include Valencia Spectrum (25 acres) and Homestead Business Park (16 acres).26
Page 16 Vision2020 - Interstate-5 Corridor
The development around Santa Clarita represents a potential role model, particularly for the undeveloped parts of the I-5 Corridor. In 2006 CNN/Money Magazine rated Santa Clarita the number one best place to live in California and number 18 nationally. The rating is based on finance, affordability of housing, education, job growth, cultural and leisure options, weather, short commutes, and access to healthcare. The neighboring community of Simi Valley ranked a respectable number 35 in the same assessment.
Union Bank of California rated Santa Clarita one of Los Angeles’ strongest economies, and it was ranked in the top five of Money Magazine's Best Places to Live in California for 2006. Santa Clarita was named—along with Burbank—in the top five of business-friendly cities in 2006 by the Los Angeles Economic Development Corporation (LAEDC):27
Among the benefits of doing business in the city of Santa Clarita is that the city does not have a business license fee, nor does it assess a utility user tax. Santa Clarita offers its businesses and residents a highly educated workforce, available land for development, site location assistance, expedited plan reviews and permit processing, and high quality of life. It is also the thriving center for industry clusters such as aerospace manufacturing, bio-medical, entertainment and technology.
Although the City of Santa Clarita continues to invest heavily in its municipal infrastructure to support double-digit growth and economic expansion, it does so without any regular business taxes. Santa Clarita has no gross receipts tax and no payroll tax, earning it a Kosmont-Rose Institute Cost of Doing Business Survey overall rating of: “$$$” (medium), compared to “$$$$$” (very high) for nearby Los Angeles.28 The survey also named it one of the ten most business-friendly cities in California. Santa Clarita has recently been granted a California State Enterprise Zone providing Sales and Use Tax credits, Hiring Tax Credits of $30,000 or more per qualifying employee, and other inducements. The city is supplementing the zone incentives with fast track permitting, development fee concessions and assistance with employee placement and recruitment.
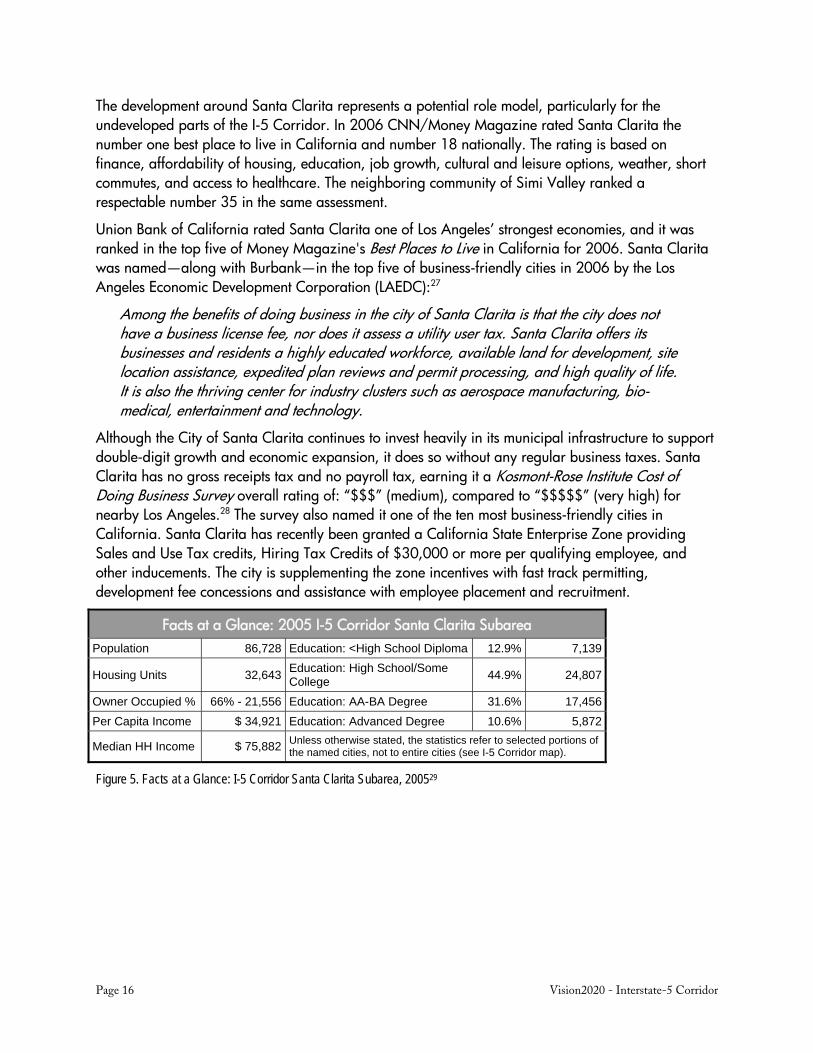
Facts at a Glance: 2005 I-5 Corridor Santa Clarita Subarea Population 86,728 Education: <High School Diploma 12.9% 7,139
Housing Units 32,643 Education: High School/Some College 44.9% 24,807
Owner Occupied % 66% - 21,556 Education: AA-BA Degree 31.6% 17,456 Per Capita Income $ 34,921 Education: Advanced Degree 10.6% 5,872
Median HH Income $ 75,882 Unless otherwise stated, the statistics refer to selected portions of the named cities, not to entire cities (see I-5 Corridor map).
Figure 5. Facts at a Glance: I-5 Corridor Santa Clarita Subarea, 200529
Mulholland Institute Page 17
The East San Fernando Valley The I-5 Corridor portion of Los Angeles in the east San Fernando Valley comprises a 2005 estimated population of 592,000,30 residing in 85.18 square miles with a density of 6,542 people per square mile. The population is not only ethnically diverse, but also heavily concentrated in the middle class. With a 2005 annual growth rate of five percent, it is more stable than expansion areas to the north and east. It boasts higher rates of both home ownership and self-employment than the rest of the county, particularly the City of Los Angeles. Its minority populations tend to be far more affluent than those situated elsewhere in Los Angeles County.31 In short, it has been a place where people find opportunity and achieve their dreams.32
The Valley’s economy is quite diverse, with major concentrations in technology medical, biotechnical, entertainment production, tourism and aerospace. There are, by design, multiple centers of activity in the Valley. In 2005, the entertainment industry accounted for more than 106,000 jobs and nearly $8.5 billion in local payroll. Over 19,000 people were employed in biotechnology fields with annual payroll of nearly $1.2 billion. The Valley’s 75,000 manufacturing jobs add workforce diversity, providing employment opportunities for the skilled and semi-skilled with median incomes in the $44,000-$54,000 range.
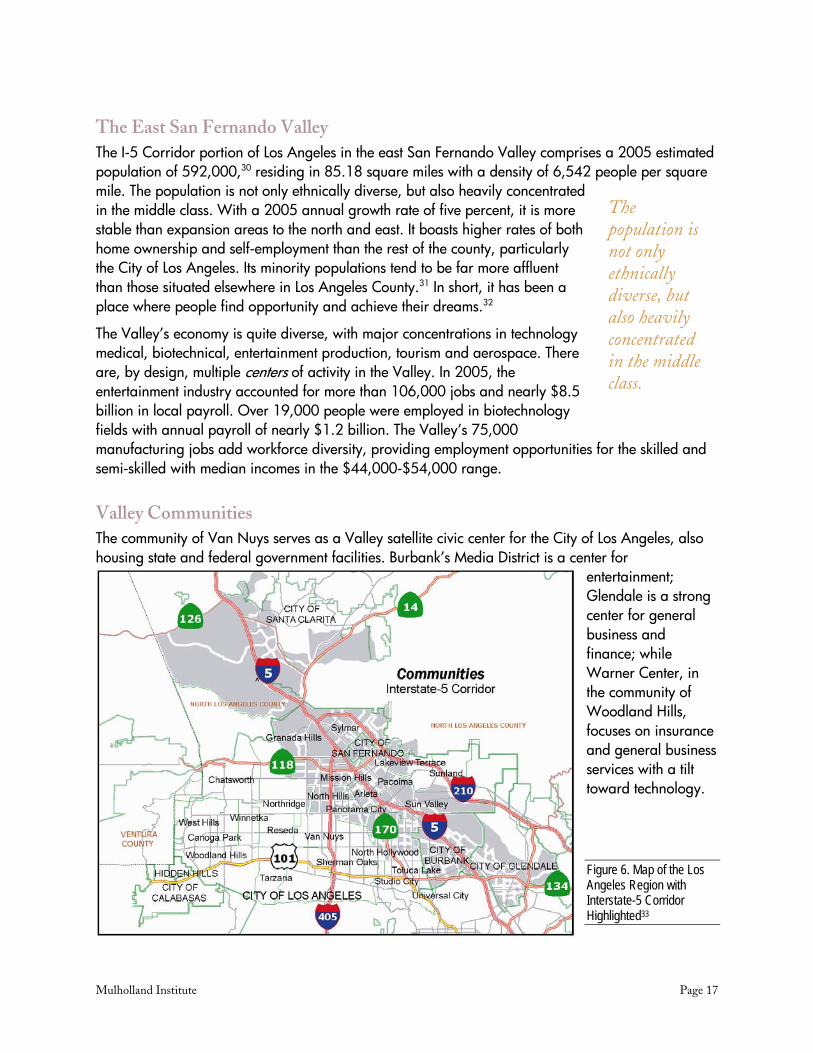
Valley Communities The community of Van Nuys serves as a Valley satellite civic center for the City of Los Angeles, also housing state and federal government facilities. Burbank’s Media District is a center for
entertainment; Glendale is a strong center for general business and finance; while Warner Center, in the community of Woodland Hills, focuses on insurance and general business services with a tilt toward technology.
Figure 6. Map of the Los Angeles Region with Interstate-5 Corridor Highlighted33
The population is not only ethnically diverse, but also heavily concentrated in the middle class.

Page 18 Vision2020 - Interstate-5 Corridor
The northeast Valley communities of Sylmar, Pacoima and Sun Valley have been the traditional home of heavy industry in the area. Everything from sand and gravel pits to landfills and auto wreckers have occupied this strategically important area. As the sand and gravel are depleted in the next few years, and landfill activities halt in 2007, the character of the community will evolve. Some properties will become more environmentally friendly open spaces, and commercial/industrial properties should experience a surge in values.
This transition will take some time, but with a vision that accommodates smart planning principles and balanced growth, it presents a real opportunity for simultaneously improving the quality of life and prosperity of the area. Data gathered from focus groups indicate that, because they lack basic amenities, residents of the northeast Valley shop and patronize entertainment and recreation facilities in Burbank, Northridge, and Santa Clarita. This needlessly drains income, jobs, and tax revenues from the northeast San Fernando Valley and the City of Los Angeles.34
The City of Los Angeles The City of Los Angeles is at something of a disadvantage, being rated: “$$$$$” (very high) in the Kosmont-Rose survey for cost of doing business. The city’s Gross Receipts Tax remains unpopular, although it has been reformed in recent years, both in rates and applicability. Complexity has been reduced along with the number of tax categories. Nonetheless L.A. leads the pack in cost of doing business with a categorical gross receipts tax that ranges from $1.14 per thousand in wholesale trades to $5.73 per thousand for professionals and general office.
Facts at a Glance: 2005 I-5 Corridor - East San Fernando Valley Subarea
Population 591,649 Education: <High School Diploma 43.6% 152,119
Housing Units 162,829 Education: High School/Some College 37% 129,046
Owner Occupied % 53.4% - 86,999 Education: AA-BA Degree 15.1% 52,770 Per Capita Income $ 16,228 Education: Advanced Degree 4.3% 14,872
Median HH Income $ 48,420 Unless otherwise stated, the statistics refer to selected portions of the named cities, not to entire cities (see I-5 Corridor map).
Figure 7. Facts at a Glance: I-5 Corridor, East San Fernando Valley Subarea, 200535
The east Valley portion of Los Angeles does have some unique advantages and special program areas:
Enterprise Zone: Credits on state income, sales and use taxes
Empowerment Zone: Credits on federal taxes, waivers on business taxes and other city rate concessions
Community Redevelopment Agency Project Area: Subsidies to developers, affordable housing and revitalization projects
Business Improvement Districts: Property owner and business assessment districts enabling area improvement and programming
Targeted Neighborhood Initiatives: Use of Block Grant funding to improve neighborhoods
Mulholland Institute Page 19
The City of San Fernando Nestled in the middle of the northeast Valley, and completely surrounded by the City of Los Angeles, is the City of San Fernando. A demographically moderate and well-run community, San Fernando can easily serve as a model for other Valley communities.
San Fernando has long been a remarkable exception to the less-focused communities in the Los Angeles section of the San Fernando Valley. Decidedly blue collar—at least demographically—this diminutive city of 23,56436 has gone through many changes over the years, creating a downtown mall in the early seventies, and reinventing itself again since 1994, with smart-growth pedestrian-oriented areas in its commercial hub. Its Spanish flavor and architecture derives from the nearby San Fernando Mission, which joins a number of other historic sites to establish the cultural roots of the city. San Fernando’s 2005 estimated population is 24,77137 living in 2.39 square miles yielding a
density of 10,364 per square mile.
With a Kosmont-Rose rating of: “$$$$,” San Fernando offers a better business tax environment than most with a range of $ .53 per thousand for wholesale trades, up to $1.32 per thousand for professionals and general office. They do have a unique Residential Property category with a $3.00 per thousand rate.38
At just under 2.5 square miles, the biggest limitation in San Fernando is lack of space for development. They are constrained almost entirely to redevelopment, which is widespread. They have adopted smart-growth strategies in order to
improve commercial areas and augment housing stock without encroaching on stable single-family neighborhoods.
The Cities of Burbank and Glendale The City of Glendale, with a 2005 estimated population of 194,620 and Burbank with 100,053,39 have a combined population (294,673) of less than ten percent of that of the City of Los Angeles. The population of the I-5 Corridor portion of these two cities totals 276,020. Through visioning and careful stewardship, both of these cities have been able to strike a better economic and social balance than has Los Angeles. Both have done well at attracting high-paying jobs and clean, wealth-producing industries.
Because of their strategic location—just ten minutes from downtown Los Angeles—and their immediate access to Bob Hope/Burbank Airport, Burbank and Glendale provide an ideal location for major corporations, the entertainment industry in particular. These two cities are relatively compact. They have limited buildable space, and must rely heavily on redevelopment and re-purposing of existing properties. By developing an extended I-5 Corridor strategy, they can play off of the substantial entertainment cluster in Santa Clarita. They can also avail themselves of the more spacious and less expensive east Valley industrial areas in between. With this approach, the overall economic mix can be enhanced.
They have limited buildable space, and must rely heavily on redevelopment.
San Fernando can easily serve as a model for
other Valley communities.
Page 20 Vision2020 - Interstate-5 Corridor
In naming Burbank among the top five business-friendly cities in Los Angeles County, the Los Angeles Economic Development Corporation states:
Burbank offers numerous business entry and expansion programs. They also actively market their city services to key decision makers and major corporations. The city has made a major commitment to supplying high capacity fiber optics to commercial users and free Wi-Fi service in their downtown area. No city income tax, no gross receipts tax, and competitive utility user taxes are additional benefits of doing business in Burbank. Their fees are among the lowest in the region and are simple and highly competitive.
The City of Burbank has no gross receipts tax or payroll tax, thus giving it a significant advantage over the City of Los Angeles and other neighboring municipalities. Businesses are taxed on categorical employee counts up to 3,000 in a range of $4.30 to $8.75 per employee. Those in the commercial rental property business are taxed at $71.75 base plus $1.45 per hundred square feet over 5,000, and $7.15 per residential unit over three. Kosmont-Rose rating: “$$$$.” Burbank was named—along with Santa Clarita—in the top five of business-friendly cities in 2006 by the Los Angeles Economic Development Corporation (LAEDC).40 The I-5 Corridor portions of the City of Burbank had a 2005 population of 100,01141 in 17 square miles for a density of 5,883 per square mile.
Glendale leads the pack in the Kosmont-Rose survey—considered business friendly—with no gross receipts, employee or other tax except for a one-time Use and Occupancy Permit fee of $140.42 Kosmont-Rose rating: “$$” (low cost) Although there is some sentiment from the public to impose a gross receipts tax, Glendale can benefit from the lessons of Los Angeles, where the tax has inhibited economic growth and, in turn, reduced city revenues in amounts that economists believe more than offsets the tax revenue. The broader implications of the tax are the loss of quality jobs and the attendant losses to community prosperity.
In 2005 the I-5 Corridor portion of the City of Glendale had a population of 176,00943 in 19.3 square miles for a density of 9,120 people per square mile.
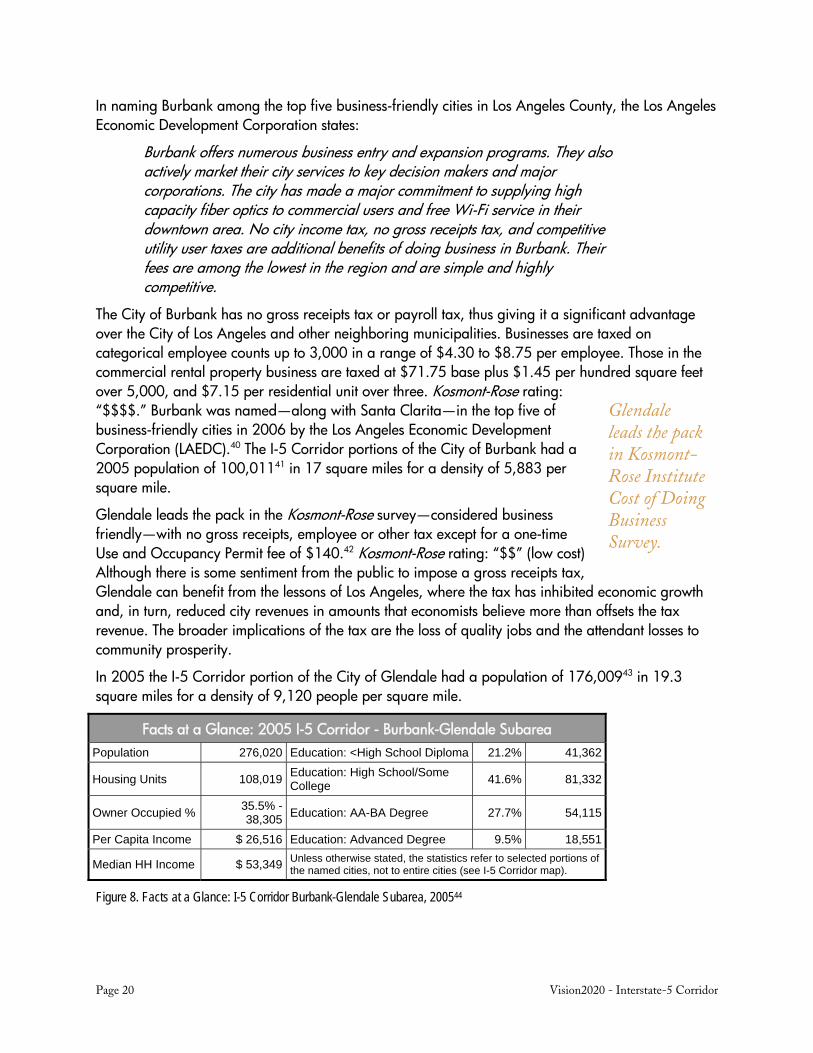
Facts at a Glance: 2005 I-5 Corridor - Burbank-Glendale Subarea Population 276,020 Education: <High School Diploma 21.2% 41,362
Housing Units 108,019 Education: High School/Some College 41.6% 81,332
Owner Occupied % 35.5% - 38,305 Education: AA-BA Degree 27.7% 54,115
Per Capita Income $ 26,516 Education: Advanced Degree 9.5% 18,551
Median HH Income $ 53,349 Unless otherwise stated, the statistics refer to selected portions of the named cities, not to entire cities (see I-5 Corridor map).
Figure 8. Facts at a Glance: I-5 Corridor Burbank-Glendale Subarea, 200544
Glendale leads the pack in Kosmont-Rose Institute Cost of Doing Business Survey.
Mulholland Institute Page 21
Burbank and Glendale both benefit from unique programming and special zones: Community Redevelopment Agency Project Area: Subsidies to developers, affordable housing
and revitalization projects Targeted Neighborhood Initiatives: Use of Block Grant funding to improve neighborhoods
Unincorporated Areas Several areas of the I-5 Corridor include census tracts that overlap between cities and adjacent unincorporated areas of Los Angeles County. These generally mountainous areas are commonly known as Newhall Pass, Sylmar Island (2 areas), Lopez Canyon, and Oat Mountain. They contain little or no population or commerce. The Newhall Pass area is made up mostly of obsolete commercial, accessory and utility land uses. This unincorporated county area is sandwiched between the cities of Santa Clarita and Los Angeles. Plans are under way to create a community of up to 2.3 million square feet of commercial space, a complementary mix of amenities and 5,500 homes in the transit-oriented, mixed-use community of Las Lomas.
Developing an Economic Strategy The Interstate-5 Corridor slices through one of the richest and most productive regions in the world. The Los Angeles Metropolitan Area45 ranked ninth in comparisons to national economies in 2001, behind the U.S., Japan, Germany, UK, France, China, Italy and Canada—but ahead of Mexico, Spain, India, Brazil and South Korea—with more than double the GDP of the entire country of Russia.46
Although much of the region is considered built out, there remains a huge unrealized potential within the study area. Until recently, these areas had largely been viewed as simple extensions of the sprawl that is Los Angeles. As the entertainment, technology and service clusters expand, the demand for commercial/industrial space increases. With the phasing out of landfills and gravel pits in the northeast Valley, the area now stands squarely in the path of progress. Taken as a contiguous cluster, the I-5 Corridor offers something unique in the region: a diversity of workforce, housing and development opportunities rarely found in other parts of the southland.
Housing The jobs-housing balance of the I-5 Corridor is crucial to its future economic optimization. The Regional Housing Needs Assessment 47 generated by the Southern California Association of Governments (SCAG) mandates that each city plan for a specified fair share of additional housing units, in a range of formats and levels of affordability. Faced with this statewide mandate, local cities can no longer wall-off growth. Reasonable efforts have to be made to accommodate an ever-growing population.
The I-5 Corridor provides an extremely well rounded array of lifestyle amenities. As a consequence, there is high demand for housing, and the housing that is available tends to be more costly than other areas further inland and further from the Los Angeles core. March 2007 single-family
The Los Angeles Metropolitan Area ranked ninth in comparisons to national economies.

Page 22 Vision2020 - Interstate-5 Corridor
residences median prices were: northeast SFV $520K, southeast SFV $583K, Glendale $631K, Burbank $625K and Santa Clarita $575K.48 Even with anticipated “corrections,” this robust market affords an excellent opportunity for additional housing investment and development.
Any number of synergistic relationships can be established by capitalizing on the diversity of this 30-mile corridor. Businesses need housing for employees at all levels, from entry level to executives. There is a regional need and a ready market for increased housing. Demand ranges across a broad spectrum of styles, from executive homes, to denser, luxury townhouses, from affordable multi-family rentals to the area’s mainstay: moderate single-family residences. Unlike many built-out or gridlocked areas of Southern California, the I-5 Corridor still has some capacity for planned, community-friendly growth, and more importantly, for much-needed redevelopment.
Industrial Properties The diverse industrial base creates a demand for a wide range of site and space configurations. Each of the leading clusters: entertainment, technology, manufacturing and business services, has specialized needs. Some of the denser, more built-out areas can afford to be selective in attracting specific industries; others need to be more accommodating.
Companies with executive and administrative offices in high-rent districts often need less expensive facilities for production, storage and ancillary support services. The entertainment industry is a good example of this with headquarters offices in Glendale and Burbank, larger more affordable space for storage and shop operations in the northeast Valley, and a growing cluster of supplemental sound stages and facilities in the Santa Clarita Valley, all paralleling the I-5 Corridor.
Commercial/industrial developments coming on line tend to be more campus-like, with walkable areas and a range of amenities. This requires more land—a rapidly disappearing commodity—especially in the region’s more desirable areas.
Before there was an I-5 freeway, San Fernando Road served as the corridor’s major north-south artery. Active still, it runs parallel to the I-5 for most of its course. In the mid-20th century, highway-oriented business and industry sprang up all along this venerable route. As a result, the road still serves as a town center providing walkable main street retail for several communities, including the San Fernando Mall and Old Town Newhall in Santa Clarita. Many of the remaining stretches are lined with aging commercial and industrial structures that could ultimately benefit from renewal and redevelopment. There are hundreds of opportunities for the assembly of smaller parcels and obsolete facilities into larger, more modern configurations. This could help meet the considerable demand for industrial properties in the region.
The Corridor should be seen as a system—with differing attributes and areas—that together allow for a full range of economic development. By working toward a common vision, looking beyond jurisdictional boundaries of cities and the psychological boundaries of the Newhall Pass,49 the region will be better able to provide the goods, services, amenities, workforce and opportunities for enhanced prosperity.
Mulholland Institute Page 23
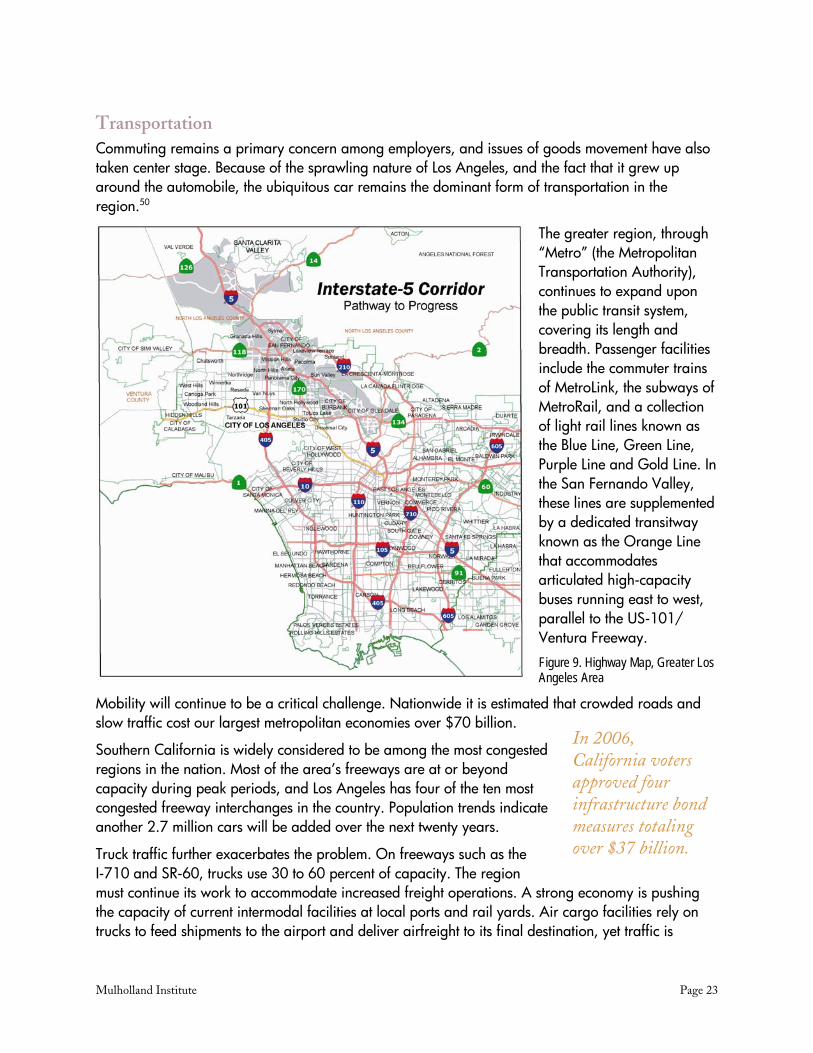
Transportation Commuting remains a primary concern among employers, and issues of goods movement have also taken center stage. Because of the sprawling nature of Los Angeles, and the fact that it grew up around the automobile, the ubiquitous car remains the dominant form of transportation in the region.50
The greater region, through “Metro” (the Metropolitan Transportation Authority), continues to expand upon the public transit system, covering its length and breadth. Passenger facilities include the commuter trains of MetroLink, the subways of MetroRail, and a collection of light rail lines known as the Blue Line, Green Line, Purple Line and Gold Line. In the San Fernando Valley, these lines are supplemented by a dedicated transitway known as the Orange Line that accommodates articulated high-capacity buses running east to west, parallel to the US-101/ Ventura Freeway.
Figure 9. Highway Map, Greater Los Angeles Area
Mobility will continue to be a critical challenge. Nationwide it is estimated that crowded roads and slow traffic cost our largest metropolitan economies over $70 billion.
Southern California is widely considered to be among the most congested regions in the nation. Most of the area’s freeways are at or beyond capacity during peak periods, and Los Angeles has four of the ten most congested freeway interchanges in the country. Population trends indicate another 2.7 million cars will be added over the next twenty years.
Truck traffic further exacerbates the problem. On freeways such as the I-710 and SR-60, trucks use 30 to 60 percent of capacity. The region must continue its work to accommodate increased freight operations. A strong economy is pushing the capacity of current intermodal facilities at local ports and rail yards. Air cargo facilities rely on trucks to feed shipments to the airport and deliver airfreight to its final destination, yet traffic is
In 2006, California voters approved four infrastructure bond measures totaling over $37 billion.
Page 24 Vision2020 - Interstate-5 Corridor
heavily congested in the vicinity of Los Angeles International Airport. Congestion poses a threat both to our quality of life and our regional competitiveness.
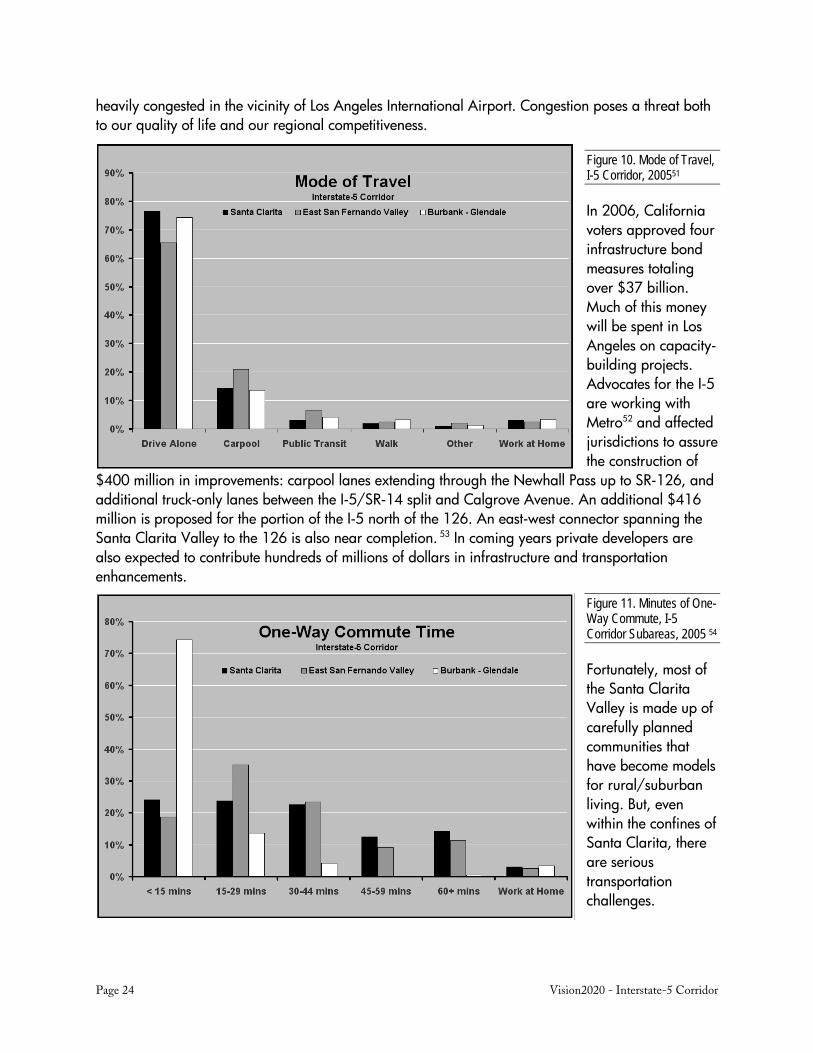
Figure 10. Mode of Travel, I-5 Corridor, 200551
In 2006, California voters approved four infrastructure bond measures totaling over $37 billion. Much of this money will be spent in Los Angeles on capacity-building projects. Advocates for the I-5 are working with Metro52 and affected jurisdictions to assure the construction of
$400 million in improvements: carpool lanes extending through the Newhall Pass up to SR-126, and additional truck-only lanes between the I-5/SR-14 split and Calgrove Avenue. An additional $416 million is proposed for the portion of the I-5 north of the 126. An east-west connector spanning the Santa Clarita Valley to the 126 is also near completion. 53 In coming years private developers are also expected to contribute hundreds of millions of dollars in infrastructure and transportation enhancements.
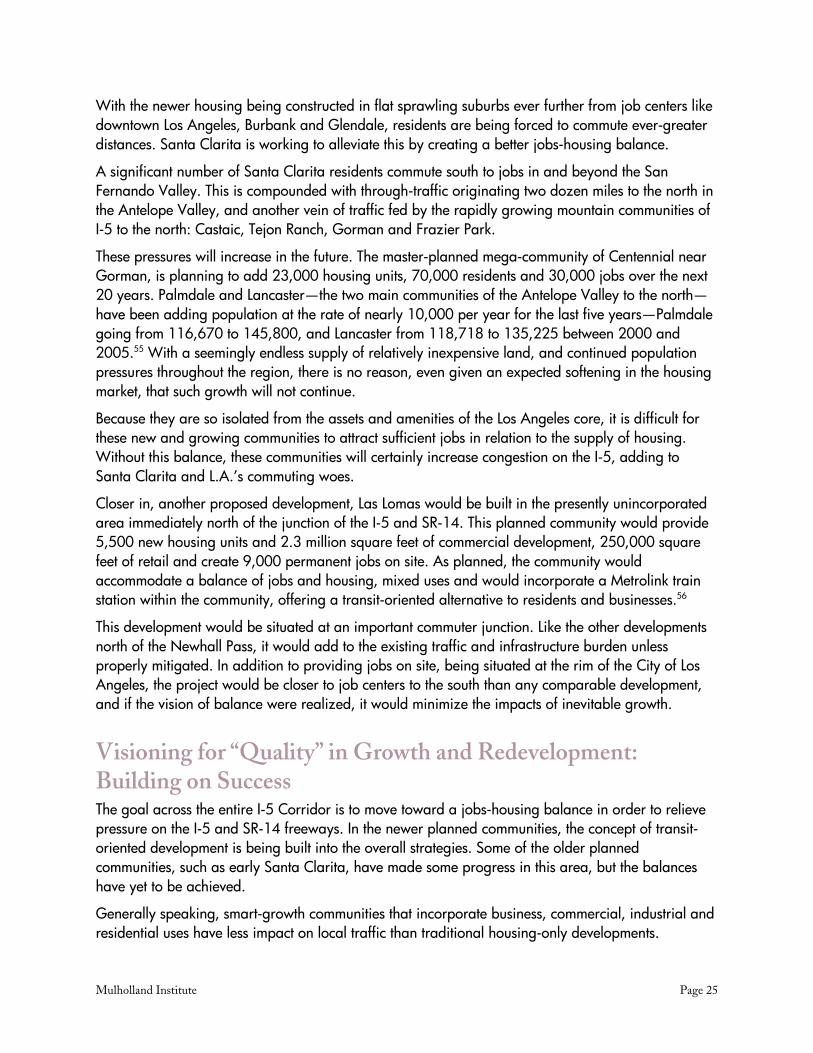
Figure 11. Minutes of One-Way Commute, I-5 Corridor Subareas, 2005 54
Fortunately, most of the Santa Clarita Valley is made up of carefully planned communities that have become models for rural/suburban living. But, even within the confines of Santa Clarita, there are serious transportation challenges.
Mulholland Institute Page 25
With the newer housing being constructed in flat sprawling suburbs ever further from job centers like downtown Los Angeles, Burbank and Glendale, residents are being forced to commute ever-greater distances. Santa Clarita is working to alleviate this by creating a better jobs-housing balance.
A significant number of Santa Clarita residents commute south to jobs in and beyond the San Fernando Valley. This is compounded with through-traffic originating two dozen miles to the north in the Antelope Valley, and another vein of traffic fed by the rapidly growing mountain communities of I-5 to the north: Castaic, Tejon Ranch, Gorman and Frazier Park.
These pressures will increase in the future. The master-planned mega-community of Centennial near Gorman, is planning to add 23,000 housing units, 70,000 residents and 30,000 jobs over the next 20 years. Palmdale and Lancaster—the two main communities of the Antelope Valley to the north—have been adding population at the rate of nearly 10,000 per year for the last five years—Palmdale going from 116,670 to 145,800, and Lancaster from 118,718 to 135,225 between 2000 and 2005.55 With a seemingly endless supply of relatively inexpensive land, and continued population pressures throughout the region, there is no reason, even given an expected softening in the housing market, that such growth will not continue.
Because they are so isolated from the assets and amenities of the Los Angeles core, it is difficult for these new and growing communities to attract sufficient jobs in relation to the supply of housing. Without this balance, these communities will certainly increase congestion on the I-5, adding to Santa Clarita and L.A.’s commuting woes.
Closer in, another proposed development, Las Lomas would be built in the presently unincorporated area immediately north of the junction of the I-5 and SR-14. This planned community would provide 5,500 new housing units and 2.3 million square feet of commercial development, 250,000 square feet of retail and create 9,000 permanent jobs on site. As planned, the community would accommodate a balance of jobs and housing, mixed uses and would incorporate a Metrolink train station within the community, offering a transit-oriented alternative to residents and businesses.56
This development would be situated at an important commuter junction. Like the other developments north of the Newhall Pass, it would add to the existing traffic and infrastructure burden unless properly mitigated. In addition to providing jobs on site, being situated at the rim of the City of Los Angeles, the project would be closer to job centers to the south than any comparable development, and if the vision of balance were realized, it would minimize the impacts of inevitable growth.
Visioning for “Quality” in Growth and Redevelopment: Building on Success The goal across the entire I-5 Corridor is to move toward a jobs-housing balance in order to relieve pressure on the I-5 and SR-14 freeways. In the newer planned communities, the concept of transit-oriented development is being built into the overall strategies. Some of the older planned communities, such as early Santa Clarita, have made some progress in this area, but the balances have yet to be achieved.
Generally speaking, smart-growth communities that incorporate business, commercial, industrial and residential uses have less impact on local traffic than traditional housing-only developments.

Page 26 Vision2020 - Interstate-5 Corridor
Residents of the planned communities—for example, Irvine, California or Reston, Virginia—in general enjoy commutes significantly shorter than those in surrounding areas. In the case of Reston, it was 14 minutes less, a nearly one-third reduction.57
In the early 1960s, Robert E. Simon, Jr. based the new town of Reston, Virginia on the following principles:
A wide choice in housing to accommodate all income and age levels; the ability to work and live in the same community; the proximity of commerce and culture; the importance of recreation and leisure activity; privacy in the midst of public space; walkability and convenience with a minimal role for the automobile; preservation of trees and woodland; a minimization of lawns that require maintenance; and underground utility lines.58
In rural areas of the northeast San Fernando Valley, large tracts of land exist that have historically been used for everything from sand and gravel pits, and auto dismantling facilities, to landfills. The pits are playing out, and the landfills have reached capacity. As the community re-tools, many of the area’s properties will be redeveloped for higher-end purposes. With industrial demand, the land has becomes too valuable for high-acreage low-employment uses such as auto wrecking. If private redevelopment is implemented with vision, the property owners and workforce of the area will be the beneficiaries.
Some of the lowest-income households in the region are situated in the northeast Valley, along with some of the least expensive housing and some of the biggest environmental challenges. This heavily blue-collar area offers a ready and accessible mid-level workforce to fuel industry and commerce along the expanse of the Corridor. Glendale, Burbank and Santa Clarita can all benefit from this pool of talent. For specialized industries, inexpensive customized training programs are readily available from Santa Clarita’s College of the Canyons, Los Angeles and Glendale Community Colleges, and from nearby occupational centers.
The region’s education infrastructure is one of its major strengths. Globally recognized institutions such as UCLA, Caltech and USC churn out legions of highly educated and workforce-ready graduates annually bolstering the region’s human capital. Specialty institutions such as The American Film Institute, Pasadena Design Center, CalArts, The Fashion Institute and an array of trade schools and occupational centers, add to the area’s tremendous capacity for workforce development, for the cultivation of knowledge workers and for development of future industry leaders.
New Models for Growth & Development Fortunately, the I-5 Corridor has some excellent examples of enlightened and successful development that can serve as role models. In Santa Clarita, the community of Valencia clearly is an outgrowth of the San Fernando Valley, and from its earliest times drew companies and people from that vast suburban area. Yet its pattern of development has been far more environmentally successful, and has created, as seen above, a very affluent community and lifestyle.
Planned communities… enjoy commutes significantly shorter than those in surrounding areas.
Mulholland Institute Page 27
Valencia has benefited from its own visionary planner, the renowned urbanist Victor Gruen. Vienna-born, Gruen declared that suburban America constituted “an avenue of horrors” that were “flanked by the greatest collection of vulgarity—billboards, motels, gas stations, shanties, car lots, hot dog stands, wayside stores—ever collected by man.”59
Gruen’s notion of suburbia was distinctly European; he saw it more as a “middle landscape” that combined both access to nature and what he considered “the advantages of urban life.” His notion was to build a new American town, with mixed housing organized into neighborhoods, a well-preserved natural environment and a thriving town center.
The Valencia story has two other critical lessons for future development along the I-5 Corridor. Even before Valencia was developed into a housing community, Newhall Land & Farming was actively engaged in promoting industrial and office development in the area. Valencia did this by luring businesses that initially had been located in the San Fernando Valley to their new office and industrial parks. The idea was to appeal to these companies by offering a location in a coherent, safe and well-planned community, with plenty of open space and recreational facilities nearby.60
Over time, Santa Clarita—the city spanning Valencia and its environs—has attracted a broad array of businesses including aerospace, specialty manufacturing, financial services and entertainment. The Town Center also lured the headquarters of one large corporation: Princess Cruises.61 Total employment in Santa Clarita is nearly 80,000 in a labor force of 84,000.62 The area also attracts a high proportion of self-employed people, constituting almost one for every six adult residents. “Newhall Land & Farming is particularly keen on incubating smaller companies,” notes Steve Zimmer, Newhall’s Executive Vice President, “what we have are people who are starting companies, and we want to see them grow up here too.”63
Suburban Villages The other critical lesson is more political. Successful mega-developments need to be careful to stay in scale with surrounding areas, and public opinion. Valencia’s original model stressed single-family homes. In contrast, the ambitious Laguna West development outside Sacramento fell into trouble when it became too committed to high density, retreating back to a greater emphasis on single-family houses.64 With new thinking and better planning, elegant density can be achieved through the balanced development of quaint, walkable suburban villages, creating a different utopia.
Newhall Land’s Valencia strategy has paid off. Its town center, paseos, and housing stock have evolved beyond any sense of a suburban bedroom community. Instead it can be seen as the heart of a new city—Santa Clarita—with a population of over 160,000 that has emerged as the regional center of a huge section of north Los Angeles County. It is virtually certain to benefit enormously from the evolution of the I-5 Corridor.65
To the south, another, and very different, model for development has occurred in the City of San Fernando, a small city of 23,564 that epitomizes many of the older parts of the Corridor. Once solidly white and middle class back in the 1950s, the city is now overwhelmingly Hispanic66 and is undergoing a significant redevelopment process that focuses on reviving the city’s historic downtown and residential districts, many of which date to the early 1900s.
Page 28 Vision2020 - Interstate-5 Corridor
A new library, coffee shop and some new restaurants are the first signs of the city’s transformation, along with the restored fronts of many Victorian-era houses. Although the redevelopment focuses on the area as a Latino cultural center, San Fernando’s predominately Latino leadership is attempting, more than anything, to recreate a suburban village atmosphere with a small town feel. Developer Severyn Aszkenazy, who grew up in the area, suggests:
People here are not different than people elsewhere. They don’t want to be a dumping ground. We want to be a town where people shop here and are proud to be here. We want people to come here and say, “Hey, San Fernando is not just a part of the Valley—it’s unique. We think the appeal can be huge.” 67
A recent Latino New Urbanism Conference study68 revealed that a significant percentage of Latino families are willing to sacrifice a single-family home with a backyard for more community space.
Like San Fernando, many of the areas along the Corridor, notably Burbank and Glendale, have well-defined community centers and healthy pedestrian-oriented districts. The coming challenge will be to cultivate more centers within the already-developed portions of the Corridor. The less developed areas north on the I-5 often comprise little more than a hodgepodge of old roadside, industrial, and rural misuses. The proposed Las Lomas development aspires to replace this array of blight with a large planned community, with campus-like industrial and commercial, jobs-housing balance and access to regional public transit.
Fundamentally, the development of urban villages or, if you will, suburban villages can do much to attract and retain workers. For key opportunity industries this is especially important, as is relief from housing shortages and the preservation of quality-of-life amenities such as open space. The villages also serve as a means to address the enormous transportation problem, by encouraging workers to live, shop and play closer to where they work.69
Business people and developers believe there is a considerable market incentive to construct the kinds of denser, more village-like environments—the very kind that prospective residents would like to see.
This requires vision, changes in thinking and revisions to public policy.70
Perhaps the best engine for driving such developments outside of San Fernando and Santa Clarita can be seen in the growth of Business Improvement Districts (BIDs) throughout the Corridor. In theory, the creation of BIDs only deals with one aspect of village building, the cultivation of a commercial core, extending out into the public spaces. But this does represent a powerful first step. The existence of thriving commercial villages, such as Sherman Oaks or Studio City, suggests that area residents appreciate and enjoy clustered, pedestrian-friendly development. At the same time, it can, and we believe will, lay the foundation for the future evolution of housing alternatives close to, or adjacent to, these thriving areas.
Burbank and Glendale, have well-defined community centers.
There is a considerable
market incentive to construct the kinds
of denser, more village-like
environments.
Mulholland Institute Page 29
Now, even at this early stage of village development, it is critical to note that one size does not fit all. The efforts underway to create centers for communities and neighborhoods, while sharing some basic implementation strategies in common (e.g., signage, facade improvements, security and community festivals) are varied according to the type of identity the community would like to create. The City of Los Angeles has a useful tool with its Community Design Overlay Districts, which, over time promise to harmonize aesthetics in areas where blight and abuse have resulted in visual clutter: a cacophony of random shapes and aggressive colors, unpleasant to the eye and confusing to the mind.
Creating community identity is tricky business. Throughout the San Fernando Valley, those responsible for managing the BIDs are faced with developing an understanding of the history, and a vision for the future of their districts. The vision has then to be communicated to others: residents, desired businesses, realtors and developers. In speaking with BID managers one can detect a present, but often unspoken apprehension, as they seek to unearth or create an identity, often where none had existed before.
Individual communities within the San Fernando Valley are trying to create identities and at the same time better understand themselves in the context of the larger picture of the Los Angeles area. This includes the ethnically- and culturally-based historical aesthetics and values of each area. The key to understanding these efforts lies in appreciating their diversity.
An area such as the Burbank Village BID has natural advantages, being located close to major entertainment industry employment centers. “The resources here,” suggests BID manager Stephanie Pillard, “would be used to show that this is a funky, fun area to live in . . . and attract young professionals with some upscale housing, and to resume festivals in an actual downtown.”71
Developing urban villages, and addressing the region’s future needs, will require more ambitious steps. The biggest challenges continue to confront communities within the jurisdiction of the City of Los Angeles. These communities generally lack the essential sense of place enjoyed by smaller cities and towns. The communities within a large city tend to be amorphous, with no real sense of where one begins and the other leaves off.
Places like Burbank and San Fernando do well with their urban villages. As relatively compact cities, they are able to focus on micro-level planning issues. Local governance gives them distinct advantages when compared with the difficulties of working through the maze of bureaucracy found in a vast and sprawling Los Angeles. “In San Fernando you can make an impact,” notes developer Severyn Aszkenazy.“ I usually stay out of L.A.”
Yet, market pressures and consumer tastes may be working to promote local centers, even in Los Angeles. “The Valley is becoming an urban area,” suggests developer Jerry Katell, who recently constructed 300 apartment units near Warner Center. “It’s an urban area whose growth can be accommodated by increasing density along the key corridors. You can do that without taking out a single family unit.”72
Quality of life is enriched when each community has its own unique identity and the ability to provide goods and services sought by its residents. Public transportation is also made more practical when activity centers are clustered, making it easier to maintain supportive infrastructure.73
Responsible developers now acknowledge the need to engage the community at the earliest possible stage.
Page 30 Vision2020 - Interstate-5 Corridor
Planning and the Entitlement Process Burdensome entitlement processes—securing permits, zone changes and variances—often discourage needed private-sector investment and quality development. Most smart-growth and mixed-use developments require some re-allocation of uses within the project in order to maximize the efficiencies of land use, open space and amenities. This is where good community-friendly projects can bog down, often being edged out in favor of by-right projects,74 many of which are even more unacceptable.
Because the process is frequently abused—in blind opposition to all forms of development—officials tend to grow calloused, and the public cynical. Developers are often discouraged and stop investing in troublesome cities. This hostile environment rarely serves the needs of the communities, and has been known to kill otherwise good projects. The economic impacts can be great and add to the ultimate cost of the project. In a residential development, this means a higher cost for the consumer of the housing.
Resistance to Development The southern and middle portions of the I-5 Corridor are substantially built-out, with vacant land being nearly non-existent. Acknowledging the certainty of growth, communities need to participate in how it occurs. A plan for infrastructure development is also critical, hopefully without adding burdensome taxes.
Although most enlightened residents are open to well-planned development, they often see their communities as under siege, enduring an unrelenting flood of variances, conditional uses, and deviations from the general plan. Misdirected resistance nearly always has a negative economic impact, is disruptive to the planning process, and can jumble the best of visions. There are a handful who view all growth as negative, but most will support projects if they understand how they are in harmony with the community’s master plan.
Responsible developers now acknowledge the need to engage the community and its leaders at the earliest possible stage, working to enhance existing neighborhoods while building new ones. This approach has proven useful in speeding up the entitlement process.
In a dynamic region like Southern California, growth is inevitable; population in the region will continue to increase for the foreseeable future. Those concerned about that future can either participate in shaping a vision, or have one thrust upon them.
Political Support for Changes Clearly there is a sizable element of the population that is inclined to support denser development and more mixed uses if it also improves the area’s quality of life. According to a survey of Valley residents taken in 2003, adding more “shops and restaurants in neighborhoods” garnered a 57 percent level of support, 39 percent were against it. A majority of respondents, 64 percent, also favored stronger sign and design regulations, with only 26 percent opposing.75
Those concerned about the future can either participate in shaping a vision, or have one thrust upon them.
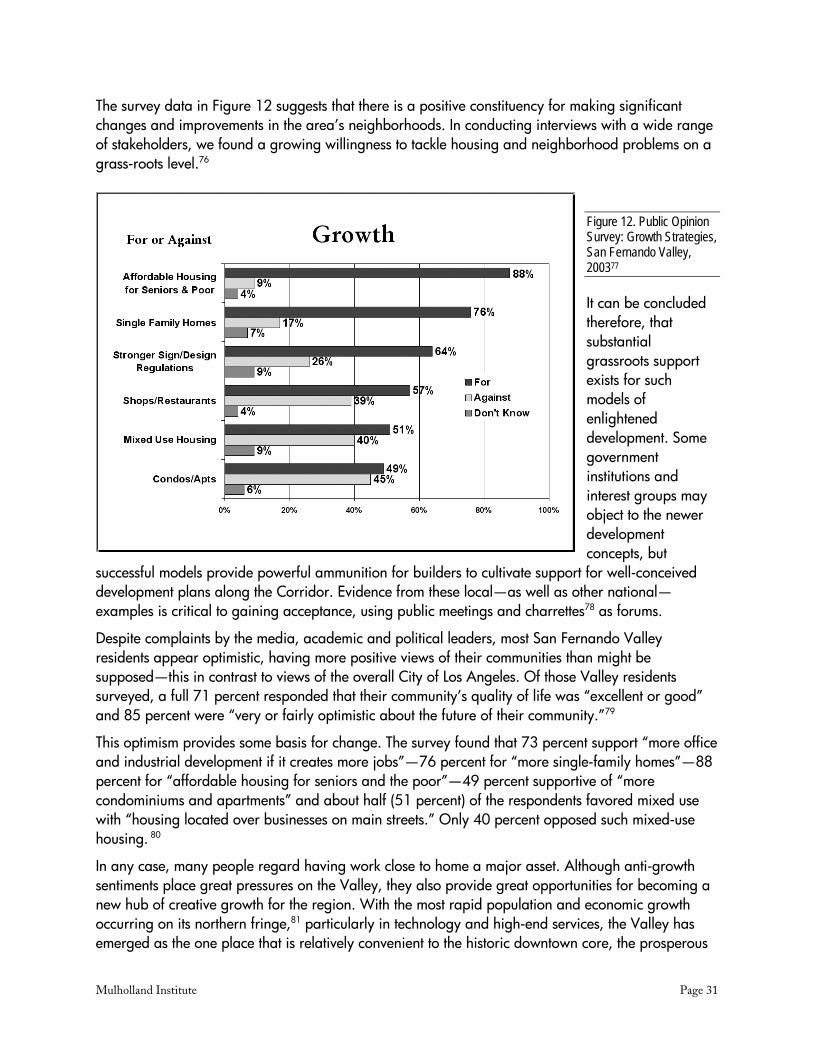
Mulholland Institute Page 31
The survey data in Figure 12 suggests that there is a positive constituency for making significant changes and improvements in the area’s neighborhoods. In conducting interviews with a wide range of stakeholders, we found a growing willingness to tackle housing and neighborhood problems on a grass-roots level.76
Figure 12. Public Opinion Survey: Growth Strategies, San Fernando Valley, 200377
It can be concluded therefore, that substantial grassroots support exists for such models of enlightened development. Some government institutions and interest groups may object to the newer development concepts, but
successful models provide powerful ammunition for builders to cultivate support for well-conceived development plans along the Corridor. Evidence from these local—as well as other national—examples is critical to gaining acceptance, using public meetings and charrettes78 as forums.
Despite complaints by the media, academic and political leaders, most San Fernando Valley residents appear optimistic, having more positive views of their communities than might be supposed—this in contrast to views of the overall City of Los Angeles. Of those Valley residents surveyed, a full 71 percent responded that their community’s quality of life was “excellent or good” and 85 percent were “very or fairly optimistic about the future of their community.”79
This optimism provides some basis for change. The survey found that 73 percent support “more office and industrial development if it creates more jobs”—76 percent for “more single-family homes”—88 percent for “affordable housing for seniors and the poor”—49 percent supportive of “more condominiums and apartments” and about half (51 percent) of the respondents favored mixed use with “housing located over businesses on main streets.” Only 40 percent opposed such mixed-use housing. 80
In any case, many people regard having work close to home a major asset. Although anti-growth sentiments place great pressures on the Valley, they also provide great opportunities for becoming a new hub of creative growth for the region. With the most rapid population and economic growth occurring on its northern fringe,81 particularly in technology and high-end services, the Valley has emerged as the one place that is relatively convenient to the historic downtown core, the prosperous
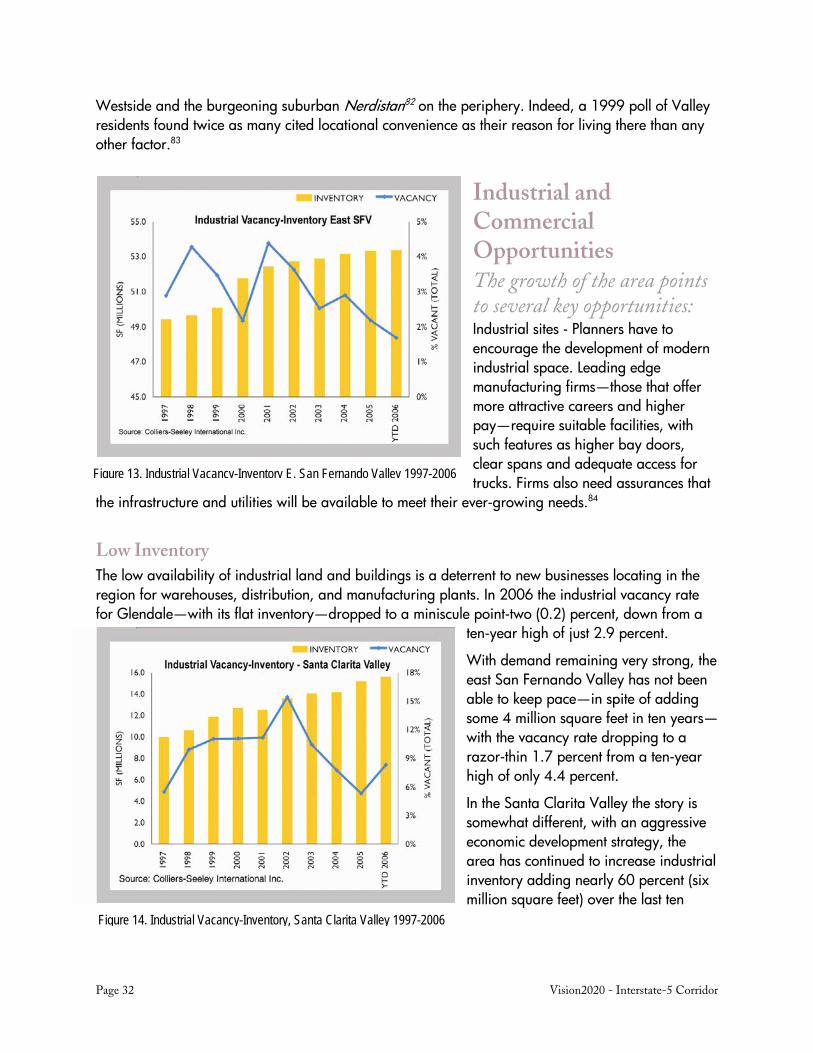
Page 32 Vision2020 - Interstate-5 Corridor
Westside and the burgeoning suburban Nerdistan82 on the periphery. Indeed, a 1999 poll of Valley residents found twice as many cited locational convenience as their reason for living there than any other factor.83
Industrial and Commercial Opportunities The growth of the area points to several key opportunities: Industrial sites - Planners have to encourage the development of modern industrial space. Leading edge manufacturing firms—those that offer more attractive careers and higher pay—require suitable facilities, with such features as higher bay doors, clear spans and adequate access for trucks. Firms also need assurances that
the infrastructure and utilities will be available to meet their ever-growing needs.84
Low Inventory The low availability of industrial land and buildings is a deterrent to new businesses locating in the region for warehouses, distribution, and manufacturing plants. In 2006 the industrial vacancy rate for Glendale—with its flat inventory—dropped to a miniscule point-two (0.2) percent, down from a
ten-year high of just 2.9 percent.
With demand remaining very strong, the east San Fernando Valley has not been able to keep pace—in spite of adding some 4 million square feet in ten years—with the vacancy rate dropping to a razor-thin 1.7 percent from a ten-year high of only 4.4 percent.
In the Santa Clarita Valley the story is somewhat different, with an aggressive economic development strategy, the area has continued to increase industrial inventory adding nearly 60 percent (six million square feet) over the last ten
Figure 13. Industrial Vacancy-Inventory E. San Fernando Valley 1997-2006
Figure 14. Industrial Vacancy-Inventory, Santa Clarita Valley 1997-2006

Mulholland Institute Page 33
years. Although Santa Clarita has only half the area of the east Valley, it has more than doubled the net absorption85 rate for most of the last ten years. This advances Santa Clarita’s goal of jobs-housing balance and allows room to accommodate new and growing industries.
Incentives In areas of the north and east San Fernando Valley, redevelopment of obsolete and polluted properties needs to be addressed through creative planning, zoning and permitting policies, tax incentives, and implementation of other tools to encourage the acquisition and redevelopment of distressed properties now being used for obsolete and disagreeable purposes.
“Public awareness must be heightened about this shortage of industrial space—what it means for jobs and the prosperity of the region,” stresses Roberto Barragan, President of the Valley Economic Development Center. Barragan contends that many productive industries and jobs are leaving the region because of their inability to maintain leases. This is mostly due to the per-square-foot economic competition from commercial and residential uses.
Office Opportunities Abound Since the height of the recession, the east Valley has experienced a steady drop in its office vacancy rate, a drop that seems to have withstood the dot-com slide. While not as compelling as the low level of the industrial inventory, this suggests that the region continues to attract and retain business at an extraordinary rate.
Developing New Centers Newer developments, such as those proposed by Newhall Land & Farming Company and by Las Lomas, are focused on self-contained communities with thoughtful integration of commercial, retail and residential. They offer highly complementary alternatives and a potential new breakthrough for the Corridor. They are to be centered around commercial and industrial campuses, feature a full range of quality-of-life amenities and jobs-housing balance. Because they are able to work with a clean slate, they have the opportunity to incorporate
all of the latest concepts in rural- and urban-suburban development—to provide a setting that is at once enjoyable and efficient.
Figure 15. Industrial Vacancy/Inventory, Glendale 1997-2006
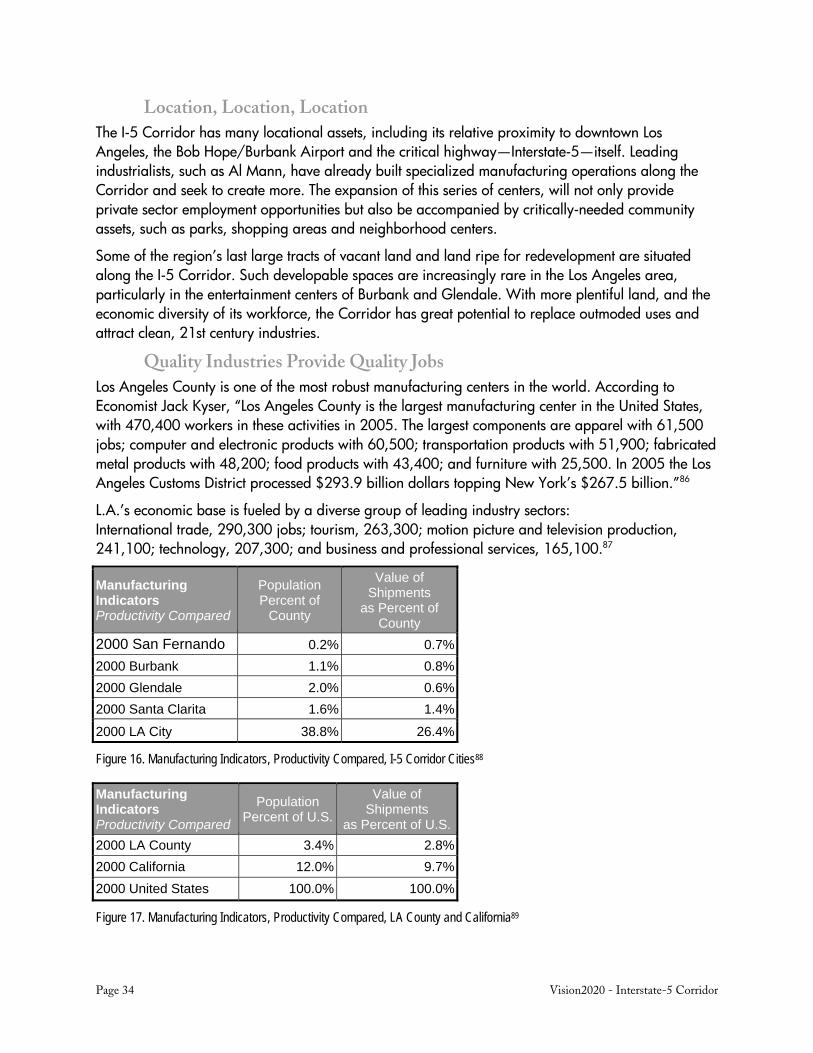
Page 34 Vision2020 - Interstate-5 Corridor
Location, Location, Location The I-5 Corridor has many locational assets, including its relative proximity to downtown Los Angeles, the Bob Hope/Burbank Airport and the critical highway—Interstate-5—itself. Leading industrialists, such as Al Mann, have already built specialized manufacturing operations along the Corridor and seek to create more. The expansion of this series of centers, will not only provide private sector employment opportunities but also be accompanied by critically-needed community assets, such as parks, shopping areas and neighborhood centers.
Some of the region’s last large tracts of vacant land and land ripe for redevelopment are situated along the I-5 Corridor. Such developable spaces are increasingly rare in the Los Angeles area, particularly in the entertainment centers of Burbank and Glendale. With more plentiful land, and the economic diversity of its workforce, the Corridor has great potential to replace outmoded uses and attract clean, 21st century industries.
Quality Industries Provide Quality Jobs Los Angeles County is one of the most robust manufacturing centers in the world. According to Economist Jack Kyser, “Los Angeles County is the largest manufacturing center in the United States, with 470,400 workers in these activities in 2005. The largest components are apparel with 61,500 jobs; computer and electronic products with 60,500; transportation products with 51,900; fabricated metal products with 48,200; food products with 43,400; and furniture with 25,500. In 2005 the Los Angeles Customs District processed $293.9 billion dollars topping New York’s $267.5 billion.”86
L.A.’s economic base is fueled by a diverse group of leading industry sectors: International trade, 290,300 jobs; tourism, 263,300; motion picture and television production, 241,100; technology, 207,300; and business and professional services, 165,100.87
Manufacturing Indicators Productivity Compared
Population Percent of
County
Value of Shipments
as Percent of County
2000 San Fernando 0.2% 0.7%2000 Burbank 1.1% 0.8%2000 Glendale 2.0% 0.6%2000 Santa Clarita 1.6% 1.4%
2000 LA City 38.8% 26.4%
Figure 16. Manufacturing Indicators, Productivity Compared, I-5 Corridor Cities88
Manufacturing Indicators Productivity Compared
Population Percent of U.S.
Value of Shipments
as Percent of U.S.2000 LA County 3.4% 2.8%2000 California 12.0% 9.7%2000 United States 100.0% 100.0%
Figure 17. Manufacturing Indicators, Productivity Compared, LA County and California89
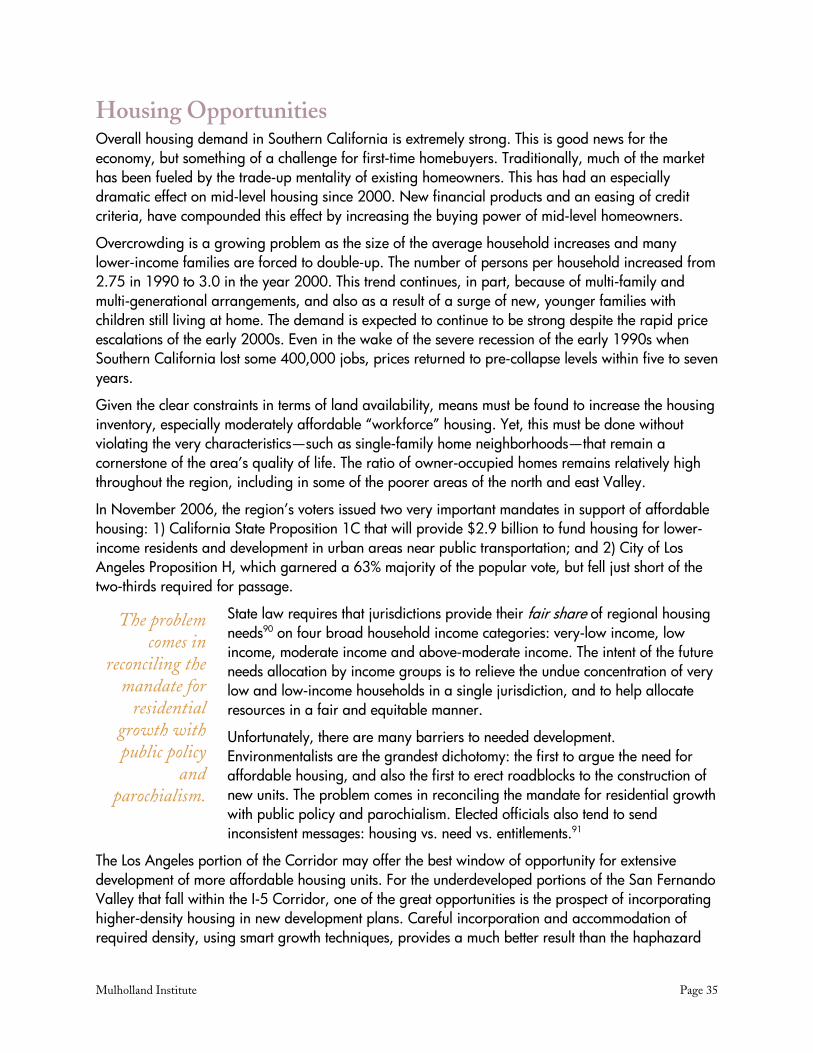
Mulholland Institute Page 35
Housing Opportunities Overall housing demand in Southern California is extremely strong. This is good news for the economy, but something of a challenge for first-time homebuyers. Traditionally, much of the market has been fueled by the trade-up mentality of existing homeowners. This has had an especially dramatic effect on mid-level housing since 2000. New financial products and an easing of credit criteria, have compounded this effect by increasing the buying power of mid-level homeowners.
Overcrowding is a growing problem as the size of the average household increases and many lower-income families are forced to double-up. The number of persons per household increased from 2.75 in 1990 to 3.0 in the year 2000. This trend continues, in part, because of multi-family and multi-generational arrangements, and also as a result of a surge of new, younger families with children still living at home. The demand is expected to continue to be strong despite the rapid price escalations of the early 2000s. Even in the wake of the severe recession of the early 1990s when Southern California lost some 400,000 jobs, prices returned to pre-collapse levels within five to seven years.
Given the clear constraints in terms of land availability, means must be found to increase the housing inventory, especially moderately affordable “workforce” housing. Yet, this must be done without violating the very characteristics—such as single-family home neighborhoods—that remain a cornerstone of the area’s quality of life. The ratio of owner-occupied homes remains relatively high throughout the region, including in some of the poorer areas of the north and east Valley.
In November 2006, the region’s voters issued two very important mandates in support of affordable housing: 1) California State Proposition 1C that will provide $2.9 billion to fund housing for lower-income residents and development in urban areas near public transportation; and 2) City of Los Angeles Proposition H, which garnered a 63% majority of the popular vote, but fell just short of the two-thirds required for passage.
State law requires that jurisdictions provide their fair share of regional housing needs90 on four broad household income categories: very-low income, low income, moderate income and above-moderate income. The intent of the future needs allocation by income groups is to relieve the undue concentration of very low and low-income households in a single jurisdiction, and to help allocate resources in a fair and equitable manner.
Unfortunately, there are many barriers to needed development. Environmentalists are the grandest dichotomy: the first to argue the need for affordable housing, and also the first to erect roadblocks to the construction of new units. The problem comes in reconciling the mandate for residential growth with public policy and parochialism. Elected officials also tend to send inconsistent messages: housing vs. need vs. entitlements.91
The Los Angeles portion of the Corridor may offer the best window of opportunity for extensive development of more affordable housing units. For the underdeveloped portions of the San Fernando Valley that fall within the I-5 Corridor, one of the great opportunities is the prospect of incorporating higher-density housing in new development plans. Careful incorporation and accommodation of required density, using smart growth techniques, provides a much better result than the haphazard
The problem comes in
reconciling the mandate for
residential growth with public policy
and parochialism.
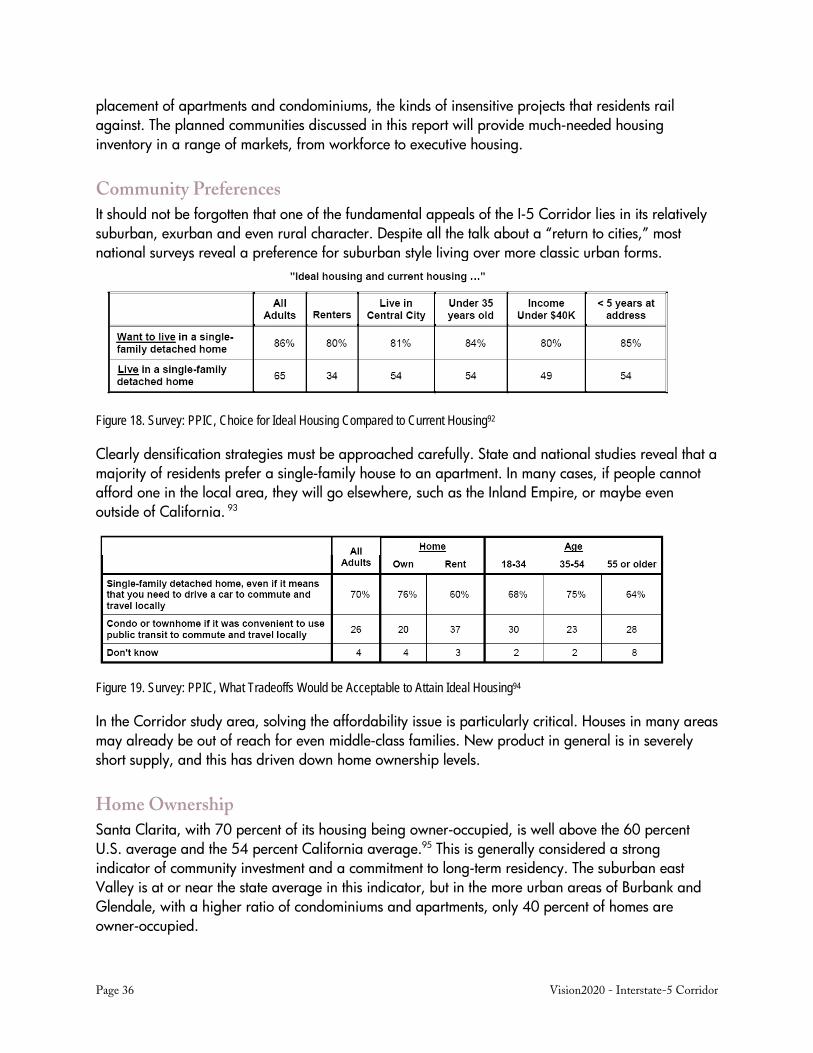
Page 36 Vision2020 - Interstate-5 Corridor
placement of apartments and condominiums, the kinds of insensitive projects that residents rail against. The planned communities discussed in this report will provide much-needed housing inventory in a range of markets, from workforce to executive housing.
Community Preferences It should not be forgotten that one of the fundamental appeals of the I-5 Corridor lies in its relatively suburban, exurban and even rural character. Despite all the talk about a “return to cities,” most national surveys reveal a preference for suburban style living over more classic urban forms.
Figure 18. Survey: PPIC, Choice for Ideal Housing Compared to Current Housing92
Clearly densification strategies must be approached carefully. State and national studies reveal that a majority of residents prefer a single-family house to an apartment. In many cases, if people cannot afford one in the local area, they will go elsewhere, such as the Inland Empire, or maybe even outside of California. 93
Figure 19. Survey: PPIC, What Tradeoffs Would be Acceptable to Attain Ideal Housing94
In the Corridor study area, solving the affordability issue is particularly critical. Houses in many areas may already be out of reach for even middle-class families. New product in general is in severely short supply, and this has driven down home ownership levels.
Home Ownership Santa Clarita, with 70 percent of its housing being owner-occupied, is well above the 60 percent U.S. average and the 54 percent California average.95 This is generally considered a strong indicator of community investment and a commitment to long-term residency. The suburban east Valley is at or near the state average in this indicator, but in the more urban areas of Burbank and Glendale, with a higher ratio of condominiums and apartments, only 40 percent of homes are owner-occupied.
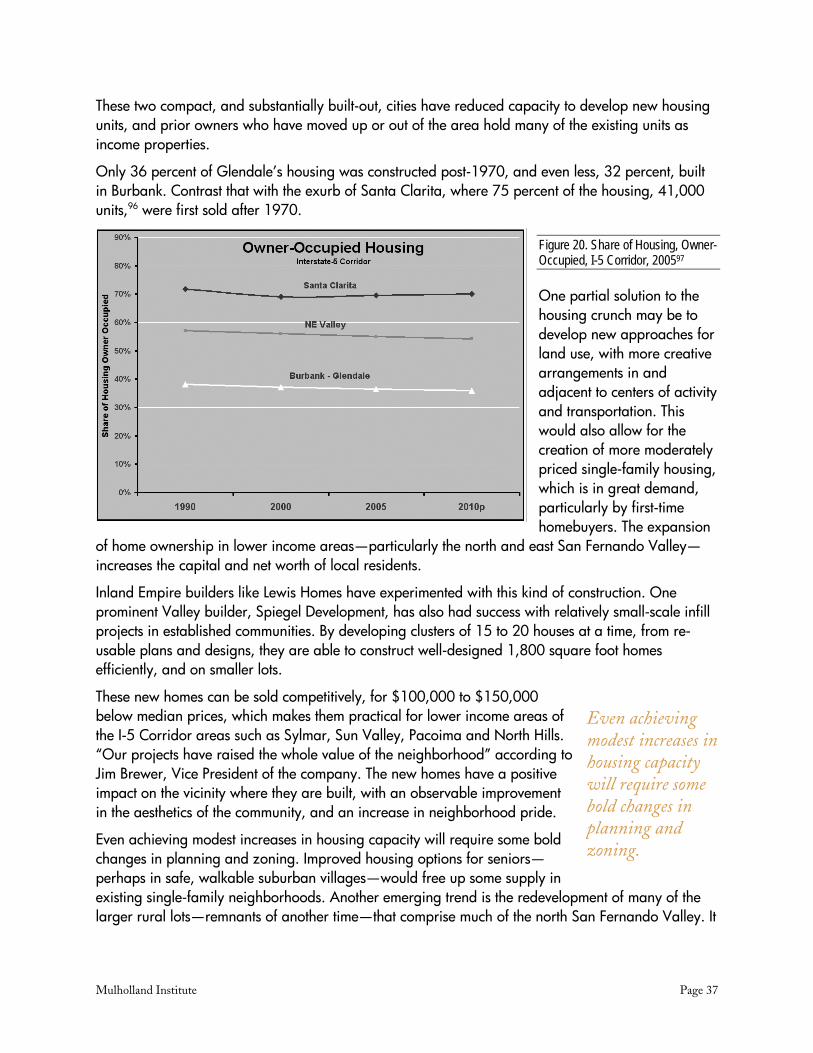
Mulholland Institute Page 37
These two compact, and substantially built-out, cities have reduced capacity to develop new housing units, and prior owners who have moved up or out of the area hold many of the existing units as income properties.
Only 36 percent of Glendale’s housing was constructed post-1970, and even less, 32 percent, built in Burbank. Contrast that with the exurb of Santa Clarita, where 75 percent of the housing, 41,000 units,96 were first sold after 1970.
Figure 20. Share of Housing, Owner-Occupied, I-5 Corridor, 200597
One partial solution to the housing crunch may be to develop new approaches for land use, with more creative arrangements in and adjacent to centers of activity and transportation. This would also allow for the creation of more moderately priced single-family housing, which is in great demand, particularly by first-time homebuyers. The expansion
of home ownership in lower income areas—particularly the north and east San Fernando Valley—increases the capital and net worth of local residents.
Inland Empire builders like Lewis Homes have experimented with this kind of construction. One prominent Valley builder, Spiegel Development, has also had success with relatively small-scale infill projects in established communities. By developing clusters of 15 to 20 houses at a time, from re-usable plans and designs, they are able to construct well-designed 1,800 square foot homes efficiently, and on smaller lots.
These new homes can be sold competitively, for $100,000 to $150,000 below median prices, which makes them practical for lower income areas of the I-5 Corridor areas such as Sylmar, Sun Valley, Pacoima and North Hills. “Our projects have raised the whole value of the neighborhood” according to Jim Brewer, Vice President of the company. The new homes have a positive impact on the vicinity where they are built, with an observable improvement in the aesthetics of the community, and an increase in neighborhood pride.
Even achieving modest increases in housing capacity will require some bold changes in planning and zoning. Improved housing options for seniors—perhaps in safe, walkable suburban villages—would free up some supply in existing single-family neighborhoods. Another emerging trend is the redevelopment of many of the larger rural lots—remnants of another time—that comprise much of the north San Fernando Valley. It
Even achieving modest increases in housing capacity will require some bold changes in planning and zoning.
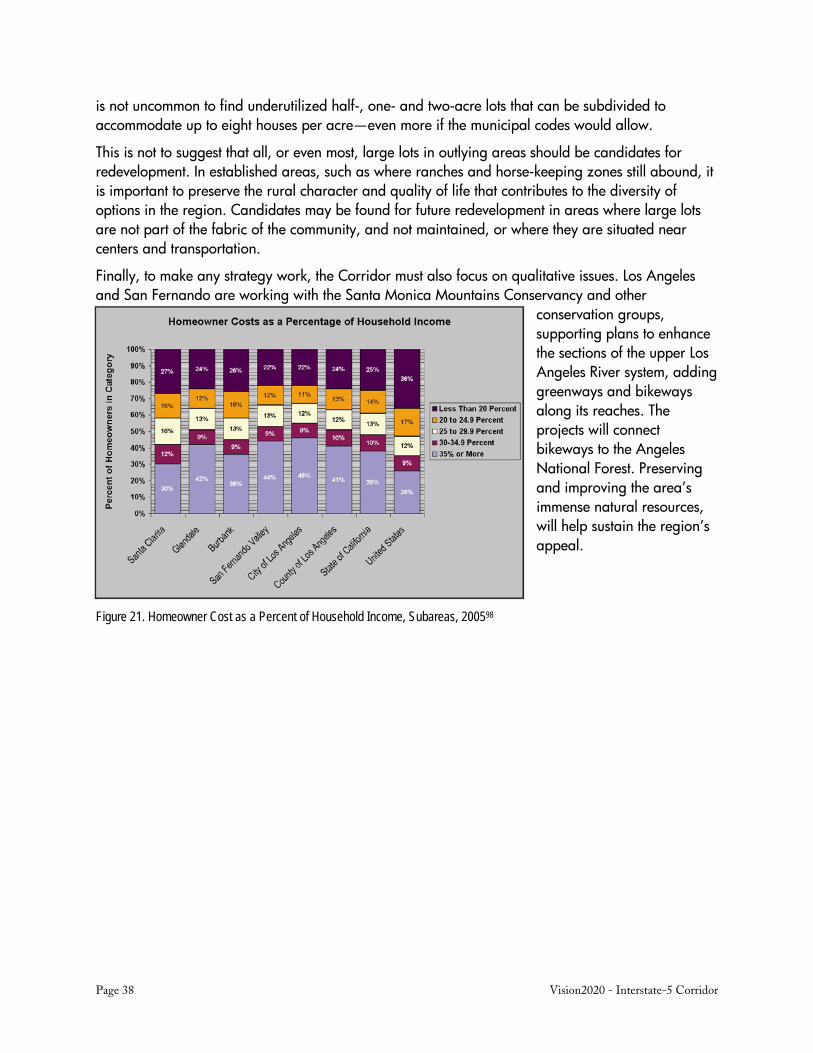
Page 38 Vision2020 - Interstate-5 Corridor
is not uncommon to find underutilized half-, one- and two-acre lots that can be subdivided to accommodate up to eight houses per acre—even more if the municipal codes would allow.
This is not to suggest that all, or even most, large lots in outlying areas should be candidates for redevelopment. In established areas, such as where ranches and horse-keeping zones still abound, it is important to preserve the rural character and quality of life that contributes to the diversity of options in the region. Candidates may be found for future redevelopment in areas where large lots are not part of the fabric of the community, and not maintained, or where they are situated near centers and transportation.
Finally, to make any strategy work, the Corridor must also focus on qualitative issues. Los Angeles and San Fernando are working with the Santa Monica Mountains Conservancy and other
conservation groups, supporting plans to enhance the sections of the upper Los Angeles River system, adding greenways and bikeways along its reaches. The projects will connect bikeways to the Angeles National Forest. Preserving and improving the area’s immense natural resources, will help sustain the region’s appeal.
Figure 21. Homeowner Cost as a Percent of Household Income, Subareas, 200598

Mulholland Institute Page 39
Strategy for the Interstate-5 Corridor Toward Coherent Development
Clearly, the development of the I-5 Corridor requires a coherent strategy, one embraced by both public and private sectors. The strategy must take advantage of the area’s leading economic clusters and diversity of industries as well as fully utilizing its human capital, with its culture, creativity and wide variety of skills and income levels.
In order to fully exploit the region’s potential, its residents must have reasonable and ready access to their places of employment. Commute times are a major issue in virtually all public polls. “As an employment agency, we cannot find people in Valencia to work Valencia jobs. We have to find people in the San Fernando Valley. These jobs range from $40,000 to $90,000 to start, for a first-year manager. They can’t afford to live there, unless they already do,” notes community leader Sean McCarthy. He stresses, “In some areas . . . the price escalation in housing makes it difficult to bring even midrange workers in to jobs.”
As firms and employers look to new places to expand or shift production, several key issues come to the forefront. More and more, factors such as land availability, quality the of utility and transit infrastructure, tax burdens, appropriately skilled labor forces, and the potential quality of life for employees, are weighing heavily on corporate decision makers.
Creating a Desirable Home for Business – Strategic Overview Looking at rankings such as Inc. magazine’s99 “Boomtowns ‘06” or Forbes magazine’s100 “Best Places for Business and Careers,” both show a proliferation of new job opportunities in communities that rank well in each of these areas. The Corridor brings a powerful potential for the right mix of these attributes, both to keep firms that are feeling increasingly priced out of the region from leaving the area and to attract firms looking for an entrée into the expansive Southern California region. Currently employers of both types find themselves in Riverside, San Bernardino and Tehachapi. With a commitment to new opportunity and development, the Corridor can become a popular alternative to these areas. To be successful, however, the strategy needs to not only build on the successful commercial initiatives in Santa Clarita, Glendale and Burbank, but it needs to mobilize the under-utilized and vacant parcels in the northeast San Fernando Valley.
One of the primary purposes of the ongoing Vision2020 process is to identify these opportunities and to initiate a dialogue for change that will allow the Corridor to become that place.
Clearly, business-as-usual will not produce the optimum results for the San Fernando and Santa Clarita Valleys, and will not allow the region to serve as the critical outlet for growth needed by the entire region. The two valleys need to expand, and at the same time, work to maintain their intrinsically suburban character. This suburbanism, however, cannot follow traditional lines of development. It needs to incorporate thoughtful, cutting-edge concepts that will allow for the maximum preservation of accessible open space, create a broad range of housing and develop economically to provide employment opportunities.
Page 40 Vision2020 - Interstate-5 Corridor
A careful balance must be maintained in order for businesses and residents to prosper and maximize their opportunities: 1) Infrastructure to support business and housing, 2) housing to accommodate the appropriate workforce, and 3) transportation to bridge the gap between the two, and to facilitate the movement of goods.
To reach this goal several critical approaches are necessary:
Continue with a careful expansion of housing, with a focus on increasing the stock of moderately affordable units—while avoiding over-densification that could lead to gridlock.
Expand investment in transit infrastructure, such as new freeway capacity, rail and dedicated busways.
Create a parallel economic development strategy to expand employment options near new housing, allowing at least some of the new residents to live closer to work, or adjacent to transit corridors. Urban and suburban villages have been helpful in implementing such strategies.
Make better use of existing space resources, using underutilized lots, redeveloping open space and housing in new community-friendly formats, and reviving the Los Angeles River as a kind of greenway connecting various Valley communities.
Preserve reasonable amounts of open space where it is practical to do so—with particular attention to lower-income communities in the Corridor, where open space is at an even greater premium.101
Support investment in new infrastructure, including new and improved roads and highways. Implement user-fee-supported alternatives for trucks and other commercial traffic. Continue to expand public transit to serve the Corridor, and make certain that utilities and telecommunications structures are sufficient to support the region’s capacity for growth.
Much of Los Angeles is a wasted resource. Two major improvements in the Corridor’s business climate are essential. Independent surveys continually point out the perceived-hostile business climate and high cost of doing business in the City of Los Angeles. This makes it difficult for any Corridor-based strategy to reach its full potential. There is a great disparity between the cities in this respect: The cities of Burbank, Glendale, San Fernando and Santa Clarita are far more attractive, and have far more effective community/economic develop departments. These differences do much to explain the location of certain major companies in key industries, who specifically choose not to place facilities, or do business in the City of Los Angeles. Although it creates a windfall for the smaller cities, one could conclude that the City of Los Angeles sections cannot be left out of the strategic mix if the I-5 Corridor is to reach its full potential.102
Develop new models for community centers that are physically more vertical—more three-dimensional—and at the same time more self-sufficient.
Work to make some areas of communities more affordable, and at the same time offer increased open spaces though shared facilities, community centers and common areas.
Mulholland Institute Page 41
A Vision for Community and Economic Development The following tactics and strategies combine recommendations from stakeholder roundtables, leadership interviews and the project team, as well as these foundational documents:
Prosperity Tomorrow: San Fernando Valley, Report, Mulholland Institute, Sherman Oaks CA, 2004
Our Future Neighborhoods: Housing and Urban Villages in the San Fernando Valley, Report, Economic Alliance of the San Fernando Valley, July 2003
Northeast Valley Study: Economic Assessment and Redevelopment Strategy, Report, Los Angeles CA: Los Angeles Economic Development Corporation, City of Los Angeles, Economic Alliance of the San Fernando Valley and the Northeast San Fernando Valley Economic Development Action Collaborative, May 2003
Vision2020: San Fernando Valley, Report, Economic Alliance of the San Fernando Valley, 2002
Strategy – Tactics for Implementation
ASSETS
Promote the Corridor’s key assets:
Climate
Locational benefits for certain industries and clusters
Access to markets
Goods movement capabilities
Transportation and infrastructure bond commitment by the people of California
Capacity of the ports of Long Beach and Los Angeles
A superior pool of vendors for materials and supplies
Ethnically, economically and educationally diverse workforce
Educational assets, schools, colleges, universities and training facilities
Research and development, scientific and medical institutions
Wealth of regional cultural, recreational and entertainment resources
Capitalize on the benefits of the overall Los Angeles area economy.
Increase access to the burgeoning Latino market.

Page 42 Vision2020 - Interstate-5 Corridor
INDUSTRY CLUSTERS
Identify and track important clusters and larger employers by sector and size.
Implement a carefully targeted campaign to recruit businesses that will complement and benefit from existing business clusters—businesses in which the Corridor already demonstrates unique competencies, such as entertainment, technology, aerospace, business services and resilient production.103
Pursue organizations and firms that will compound the economic advantages of the existing entertainment cluster.
Monitor and maintain competitive incentives for the entertainment industry.
Rein in runaway production in the motion picture and television industry.
Identify and develop new centers to anchor clusters (e.g., Warner Center).
Develop supplier and service provider links among local companies.
CAPACITY FOR ECONOMIC GROWTH
Utilize the diversity of the I-5 Corridor in economic strategies to enhance overall economic development, offering:
Workforce housing of moderate affordability
Increased regional housing needs capacity
Supplemental soundstage facilities
Industrial and entertainment industry shops and crafts
High-end storage to support clusters
Spin-off industries and ongoing development capacity
Create new capacity for growth: critical to expand both the physical space for growing companies and also to prepare a workforce for the opportunities presented by 21st-century companies.
Utilize market trend data and survey results to demonstrate and anticipate future industrial demand.
WORKFORCE
Encourage the creation of quality jobs and careers.
Implement training programs to increase the skill sets of potential and current employees to meet the needs of current and future manufacturers.
Monitor and, as needed, revise education and training systems to assure that the workforce and job market are synchronized and relevant.

Mulholland Institute Page 43
Continue seeking jobs-housing balance and housing opportunities throughout the Corridor to relieve commuting burdens on residents and reduce strain on existing infrastructure.
INFRASTRUCTURE
Expand infrastructure to accommodate regional growth and prosperity.
Participate in the allocation of 2006 California infrastructure bond funds.
Enhance local infrastructure through Revenue Development Areas (RDAs).104
Provide electric power guarantees.
TRANSPORTATION
Expand dedicated rail, bus lines and transit ways.
Improve freeway access and capacity.
Substantially increase vehicle capacity on the I-5 and other regional highways, adding high occupancy vehicle (HOV) lanes and high occupancy toll (HOT) lanes.
Improve the semi-exclusive network of truck lanes in north Los Angeles to enhance goods movement and minimize the difficulties of mixed-traffic.
Repair and improve major arterials and controls to increase mobility and expedite goods movement.
Pursue rail-based strategies for freight and for the disposal of solid waste.
Upgrade regional multi-modal access to Los Angeles/Palmdale Airport.
ECONOMIC DEVELOPMENT
Attract, expand and retain leading edge, wealth-producing companies.
Focus on a “preservation” strategy for existing key industries.
Track economic issues and business climate—educate the community and government officials on the importance of economic development in the region.
Undertake collaborative special redevelopment initiatives and partnerships.
Increase the use and effectiveness of federal, state and local incentives and programs to offset high cost of doing business.
Create city, state and federal incentives to encourage manufacturing retention, expansion, and attraction, including enterprise and empowerment zones.
Provide information on other incentives such as job training, investment tax credits, research and development credits and trade adjustments.
Page 44 Vision2020 - Interstate-5 Corridor
Utilize zoning, specific plans and envelope pre-entitlements to incentivize private investment in redevelopment.
Develop a contact program to identify retention/expansion opportunities.
Establish an early warning system to continually track important clusters and larger employers, including annual surveys, site visits and media monitoring.
Provide direct technical assistance to companies considering relocation or expansion.
Facilitate the specific retention or expansion needs of key employers, including permits, licensing, utilities, incentives, manufacturing, supplies, financing, workforce, etc.
TECHNICAL ASSISTANCE
Package and promote the various federal, state and local incentives that support a range of employers.
Provide direct facilitation to developers and employers seeking to establish operations in the area.
Facilitate and support quality projects, assisting with permits, licensing, utility needs, incentives, suppliers, workforce and financing.
PUBLIC POLICY
Convene economic development dialogues to inform and update community leaders, city, state and federal officials, improving their understanding of the business community’s importance to the local economy.
Inform the public debate with facts on economic threats that reduce the region’s global competitiveness.
Conduct orientations with community groups and chambers of commerce underscoring the importance of identification, retention and expansion key companies.
Bring together consultants, investors, real estate experts, government and regulatory officials to determine potential solutions
Build an economic development consensus within the region that includes business, government and non-profit sectors in order to reduce unnecessary barriers to desired economic development and growth.105
North and East San Fernando Valley Strategies Cultivate the critical resources of the east San Fernando Valley:
Proximity to neighboring high-growth areas and industries
Employment base
Labor base
Mulholland Institute Page 45
Diverse human capital
Land resources
Infrastructure
Transit access
Redevelopment sites
Develop new—and redevelop existing—properties into modern industrial space to accommodate the expansion potential of key employers, thereby retaining and creating manufacturing jobs.
Identify and assemble large redevelopment sites for a variety of new uses.
Work with large property owners to reclaim, remediate and redevelop mining and landfill sites where, and to the extent, practical.
Assist in identifying Brownfield mitigation funding and indemnification strategies, potentially through agencies such as the Community Redevelopment Agency.
Identify parcels and potential industrial park sites, and work to preserve industrially zoned properties.
Create and support specific policies that facilitate the development and redevelopment process.
Create planning policies that encourage and empower those who would invest in the redevelopment of obsolete and underutilized industrial space.
Encourage municipal investment in 21st century infrastructure technologies to accommodate solid waste, including upgrading access-routes to transfer stations and materials recovery facilities (MRFs) to minimize effects on adjacent communities.
Offer incentives such as business license tax waivers and special districts.
Improve the quality of life and amenities, so that high-skilled residents and high-end businesses can be attracted to, and retained in, the area.
Identify and evaluate town center development sites.
Conduct research to determine feasibility and challenges of potential town center sites in Pacoima, Sylmar and Sun Valley, with supporting implementation strategies.
Encourage, incentivize and empower investors to develop needed amenities in the east Valley: shopping centers, libraries, movie theatres, sports venues, restaurants, concert halls, community centers, and museums.
Conduct briefings to encourage desirable development.
Streamline the planning and building approval process in City of Los Angeles.106
Resolve anti-business policies, such as the City of Los Angeles Gross Receipts Tax, that place the Corridor at a competitive disadvantage in seeking and retaining quality companies.107

Page 46 Vision2020 - Interstate-5 Corridor
Conclusion: Seizing Opportunities This report is an extension of the Vision2020 process, which has involved dozens of experts and community leaders, as well as over 1,000 volunteer participants over a period of five years.
The value of this process can only manifest itself with implementation. It is incumbent upon the region’s leaders to use these findings to inform themselves, to take a measure of the community, and assist them in their creative process and their deliberations. The concepts, steps and strategies we have presented here are not mutually exclusive, and are not intended to provide a one-size-fits-all solution—but rather to comprise a tool kit of ideas and supportive rationales to be carefully administered and applied.
It is clear that the I-5 Corridor is one of the region’s few remaining areas of developable and under-developed properties. Developments can either reflect a commitment to raising the quality of life and opportunity for all within the area, or developments can haphazardly advance the negative processes of decay that eat at the heart of great metropolitan areas like Los Angeles. Underutilized areas of the City of Los Angeles offer tremendous opportunities to the newer, better-defined areas of the Corridor, in terms of support, workforce and other complementary attributes.
Now is a critical time in the development of the Corridor as rising land values have once again turned attention to the opportunities for investment. The solutions and the eventual direction of the area, and its role in the region will be determined by the success of the partnership between private, public and local interests that hold the reins in this race for success. Now is the time for bold leadership from all three to ensure that the next steps will be in the right direction.
A final review of the proposals introduced in this document will show that they challenge, in some important ways, conventional wisdom about the I-5 Corridor. While portions are affected by densification and traffic congestion, these are not necessarily seen as indicators of inevitable decline. Rather, we see them as an opportunity to build off this scarce resource and create a new center of prosperity in a burgeoning region filled with opportunity.
Preservation of quality of life and economic progress and prosperity are critical to the process of growth. The key conclusion is not whether the region should grow—but how it will grow.

Mulholland Institute Page 47
Appendix One: Demographics of the Corridor Figure 22. Population, I-5 Corridor Subareas, 2005108
Figure 22 shows the robust population growth across the Corridor. It also shows the dominance of the Los Angeles portion of the Corridor. When compared with job growth in the region, however, it is important to note that this is concentrated in the Santa Clarita,
Burbank and Glendale subareas—thereby demonstrating the potential of these portions of the Corridor. The surge in Hispanic residents in the northeast San Fernando reflects the general demographic pattern across southern California.
Figure 23. Hispanic Share of Population, I-5 Corridor Subareas, 2005109
Burbank, Glendale and Santa Clarita have experienced less of this shift in their communities—reflecting in part the effects of recent housing price increases, and the limited housing stock and turnover in Burbank and Glendale.
Page 48 Vision2020 - Interstate-5 Corridor
San Fernando Valley At 1.74 million people, the San Fernando Valley is larger than the metropolitan areas of Milwaukee-Racine, Wisconsin (1.67 million), Cincinnati, Ohio (1.64 million), or Orlando, Florida (1.55 million). Once a predominately white, middle-class suburb, the Valley has, since the 1970s, been transformed by multi-racial immigration from such diverse places as Mexico, El Salvador, Iran, Israel, Armenia, Vietnam, Korea, India and China. Mirroring a nationwide trend that has seen middle-class minorities and upwardly mobile recent immigrants replace Caucasians in inner suburbs, today fewer than half of the Valley’s residents are white/Anglo.
The area covered by the I-5 Corridor is demographically diverse in two ways. First, it has a high percentage of minorities overall. Second the demography varies widely within the Corridor, with extensive diversity in the greater San Fernando Valley, a highly homogeneous Hispanic section in the northeast Valley, Glendale as host to the second-largest Armenian population of any city in the U.S., and a predominately white/Anglo population in the Santa Clarita area.
Los Angeles has emerged as the nation’s modern-day Ellis Island, attracting nearly one in four of all immigrants coming to the United States, and these changes have been felt in the San Fernando Valley as well. Over 40 percent of all residents are foreign born, compared to 12 percent nationally. The Los Angeles portions of the Valley contain not only the city’s most heavily Hispanic district, but also those that have the largest percentages of mixed-race households. This diverse and racially intermixed region is united by a common geography, economy, and, to a large extent, by traditional middle-class values and aspirations.
Santa Clarita Santa Clarita, as a newer community populated by commuting suburbanites, continues to see a population that is more affluent and more reliant on the automobile to get to their place of employment. The city’s current redevelopment strategy emphasizes an increase in the ratio of jobs to housing, but recent demographic trends still reflect its history as a bedroom community to Los Angeles and in recent decades to the San Fernando Valley.
Northeast Valley Compared to the rest of the City of Los Angeles, residents of the northeast Valley are disproportionately younger and Hispanic. The median age in the area is 28.2 years compared to a countywide median of 32 years and in the U.S. of 35.3 years. The northeast Valley contains just 5.4 percent of the population of the City of Los Angeles, yet is home to 8.6 percent of the city’s Hispanics. Education levels also are lower than in the city at large. The three-community area contains a mere 3.6 percent of the city’s high school graduates and only 1.8 percent of the city’s holders of four-year college degrees.
There is considerable variation within the northeast Valley portion of the Corridor. Sylmar is predominantly middle class, with pockets of affluence. Sun Valley and Pacoima, on the other hand, are comprised of middle-class areas surrounded by neighborhoods struggling to join the middle class. The average per capita income for those living in the northeast Valley was $16,228 in 2005, about 66 percent of the entire city’s per capita income level of $24,587. This may be explained in

Mulholland Institute Page 49
part by larger families with non-wage-earning children inflating the per capita count. On the other hand, the typical household income reached $48,420 in 2005, more than 13 percent above the city’s median income, which was $42,667. This apparent difference might also be explained by noting that households there are larger (averaging 3.88 persons versus 2.91 for Los Angeles) and often include multiple wage earners.110
The northeast Valley has been unfairly stigmatized as a “high crime area” and crime statistics support residents’ claims that the reputation is undeserved. Yes, there are concentrated pockets of high crime, particularly in and around government housing developments, but in general, reported crime rates are roughly half the rate for the city as a whole. The number of violent crimes per 1,000 residents ranges from 4.64 in Sylmar to 8.49 in Pacoima—this compared to 13.59 citywide in Los Angeles.111
Glendale/Burbank The Glendale/Burbank portion of the Corridor has continued to serve as a fairly stable demographic pool. The local populations tend toward urban-cosmopolitan and because of their central location in the region, enjoy shorter commutes than most other areas. These cities tend to form alliances with their neighbors based on common interests. They are part of the Arroyo-Verdugo SCAG Planning Subregion, strategic partners in the Economic Alliance of the San Fernando Valley, participate the Crescenta Valley cities, and are engaged in joint powers arrangements such as the operations of Bob Hope Airport with the City of Pasadena.
While there has been some overall population growth in the area, Burbank and Glendale tend to have a stable profile and population over time. The employment base supports the finance and entertainment industries, which are very specialized in their skill needs. Slower housing turnover and historically strong prices, have contributed to the cities’ demographic stability.
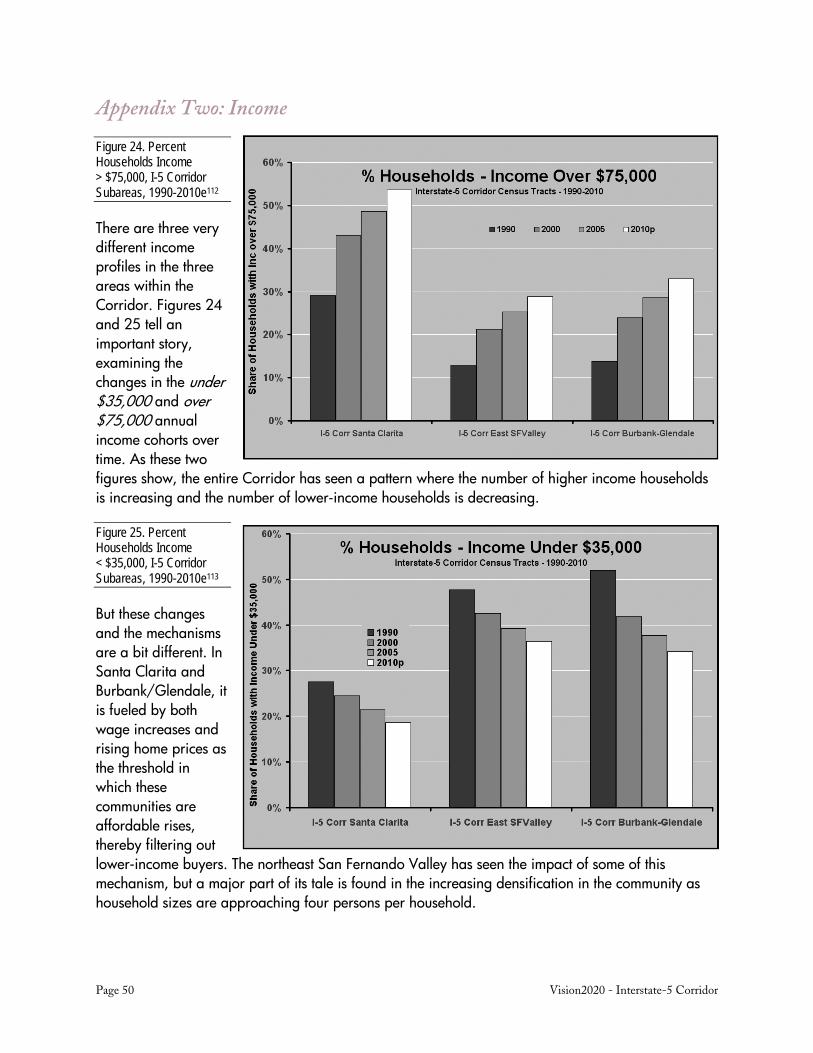
Page 50 Vision2020 - Interstate-5 Corridor
Appendix Two: Income
Figure 24. Percent Households Income > $75,000, I-5 Corridor Subareas, 1990-2010e112
There are three very different income profiles in the three areas within the Corridor. Figures 24 and 25 tell an important story, examining the changes in the under $35,000 and over $75,000 annual income cohorts over time. As these two figures show, the entire Corridor has seen a pattern where the number of higher income households is increasing and the number of lower-income households is decreasing.
Figure 25. Percent Households Income < $35,000, I-5 Corridor Subareas, 1990-2010e113
But these changes and the mechanisms are a bit different. In Santa Clarita and Burbank/Glendale, it is fueled by both wage increases and rising home prices as the threshold in which these communities are affordable rises, thereby filtering out lower-income buyers. The northeast San Fernando Valley has seen the impact of some of this mechanism, but a major part of its tale is found in the increasing densification in the community as household sizes are approaching four persons per household.
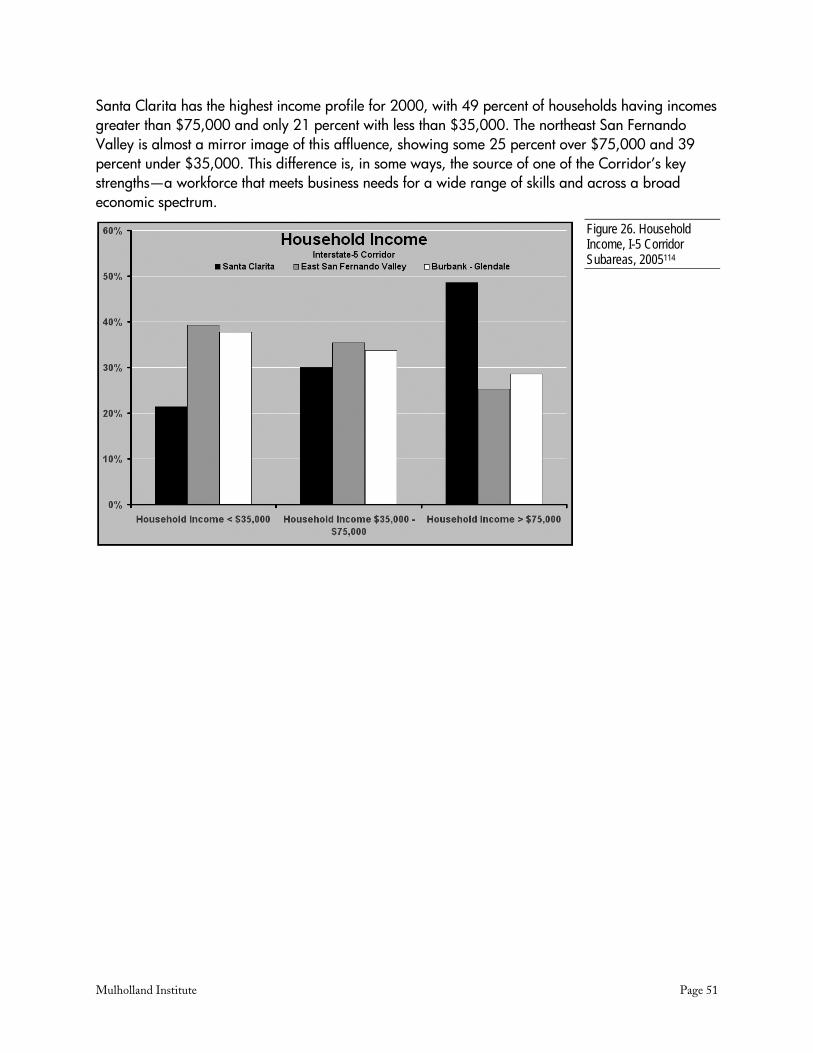
Mulholland Institute Page 51
Santa Clarita has the highest income profile for 2000, with 49 percent of households having incomes greater than $75,000 and only 21 percent with less than $35,000. The northeast San Fernando Valley is almost a mirror image of this affluence, showing some 25 percent over $75,000 and 39 percent under $35,000. This difference is, in some ways, the source of one of the Corridor’s key strengths—a workforce that meets business needs for a wide range of skills and across a broad economic spectrum.
Figure 26. Household Income, I-5 Corridor Subareas, 2005114

Page 52 Vision2020 - Interstate-5 Corridor
Appendix Three: Educational Institutions
Figu
re 2
7. M
ap, E
duca
tiona
l Ins
titut
ions
Sup
porti
ng t
he I-
5 W
orkf
orce
Mulholland Institute Page 53
Colleges and Universities The Interstate-5 Corridor is served by a broad array of colleges and universities befitting a region as dynamic as Metropolitan Los Angeles. Specialty schools provide a wide range of world-class technical, professional and artistic disciplines.
California Institute of Technology (Caltech) and its NASA/Jet Propulsion Laboratory (JPL) anchor the southern end of the Corridor. JPL is the lead center for robotic exploration of the solar system and manages the worldwide Deep Space Network. Caltech is known for its numerous scientific milestones—investigating the most challenging problems in science and technology. Its faculty, alumni and students have garnered over thirty Nobel Prizes. The facilities represent unparalleled standards and achievements in the physical sciences. Given the area’s huge concentration of technical firms, the higher education cluster plays a vital role in providing a world-class pool of scientists, engineers, and technology workers.
To the north, in Valencia, California Institute of the Arts (CalArts), established in 1961 by Walt and Roy Disney through the merger of two professional schools, the Los Angeles Conservatory of Music, and the Chouinard Art Institute, provides artists, composers, animators and other special skills to the entertainment and creative community of Hollywood, and to the many studios and production facilities located in the region. The entertainment industry is served by the American Film Institute as well as the television, film and production schools at the University of Southern California (USC) and University of California, Los Angeles (UCLA). USC was recently ranked by Time Magazine and the Princeton Review as the “College of the Year.”
USC and UCLA also have top-tier law and medical schools, providing the area with a ready supply of professionals, healthcare workers and researchers. Cal State University Northridge (CSUN) is located in the north San Fernando Valley and is a member of the 20-campus California State University system. It is one of the largest institutions of higher learning in California. It is the third-largest college or university in Los Angeles County, after UCLA and CSU Long Beach.
Glendale Community College prepares students for successful careers as well as transfers to the region’s four-year institutions. Offerings include adult education, specialized job-training programs, and customized instruction under agreements with private employers. Neighboring Santa Monica College is the number one campus in the state in transfers to the University of California and the California State University system, with over 2,000 per year. It also offers extensive creative, design and theatrical programming and is the home of the internationally renowned public broadcasting station: KCRW-FM.
The Valley also hosts three of the nine Los Angeles Community College campuses, part of the largest district in the world: Los Angeles Pierce College, Los Angeles Mission College, and Los Angeles Valley College. Since their founding, Pierce and Valley College have developed sound academic records and are among the top-ranked colleges in transferring students to UCLA, UC Irvine, USC, Pepperdine University, and CSUN. This system is unparalleled in offering a pathway for any student with the desire to bootstrap their way into four-year university degrees and beyond.
The region is served by an array of smaller private schools and several highly regarded research and educational institutions, including: Pepperdine University, in Malibu, and the Claremont Colleges in Claremont. The San Gabriel Valley is immediately adjacent to the I-5 Corridor. The region rivals
Page 54 Vision2020 - Interstate-5 Corridor
education clusters throughout the world. Thirty-one colleges, universities and graduate schools build upon a vast array of school districts, vocational schools and training institutions. Three of the top liberal arts schools in the country are located in the San Gabriel Valley: Pomona College, Claremont McKenna College and Harvey Mudd College. Harvey Mudd College also ranks among the best undergraduate engineering programs. The San Gabriel Valley is home to the largest and third-largest community colleges in the nation: Mt. San Antonio College, and Pasadena City College, respectively.
The Rose Institute of State and Local Government provides research on politics, economics, social science and governmental affairs. Developing technology to diagnose and treat illnesses, the Huntington Medical Research Institute works to enhance knowledge of life processes and disease. Specialties include molecular oncology, molecular neurology, cytogenetics research, neural engineering, and magnetic resonance. Keck Graduate Institute at Claremont McKenna College is the only American graduate school dedicated to the emerging field of applied life sciences.
In addition to offering a full complement of medical services, the City of Hope National Medical Center is engaged in the quest for prevention and cures for cancer, HIV/AIDS, diabetes, and other life-threatening diseases. The center’s Beckman Research Institute is one of the nation’s premier centers for pioneering biomedical research, supporting innovative and creative research, and preparing students for careers in the biological sciences.
San Marino’s Huntington Library is one of the largest and most complete research libraries in the United States in its fields of specialization. Collections include rare books and manuscripts principally in the areas of British and American history and literature, fifteenth-century European books, history of science, maritime history, and Renaissance exploration and cartography. Altogether, there are nearly five million volumes and documents available for research use.
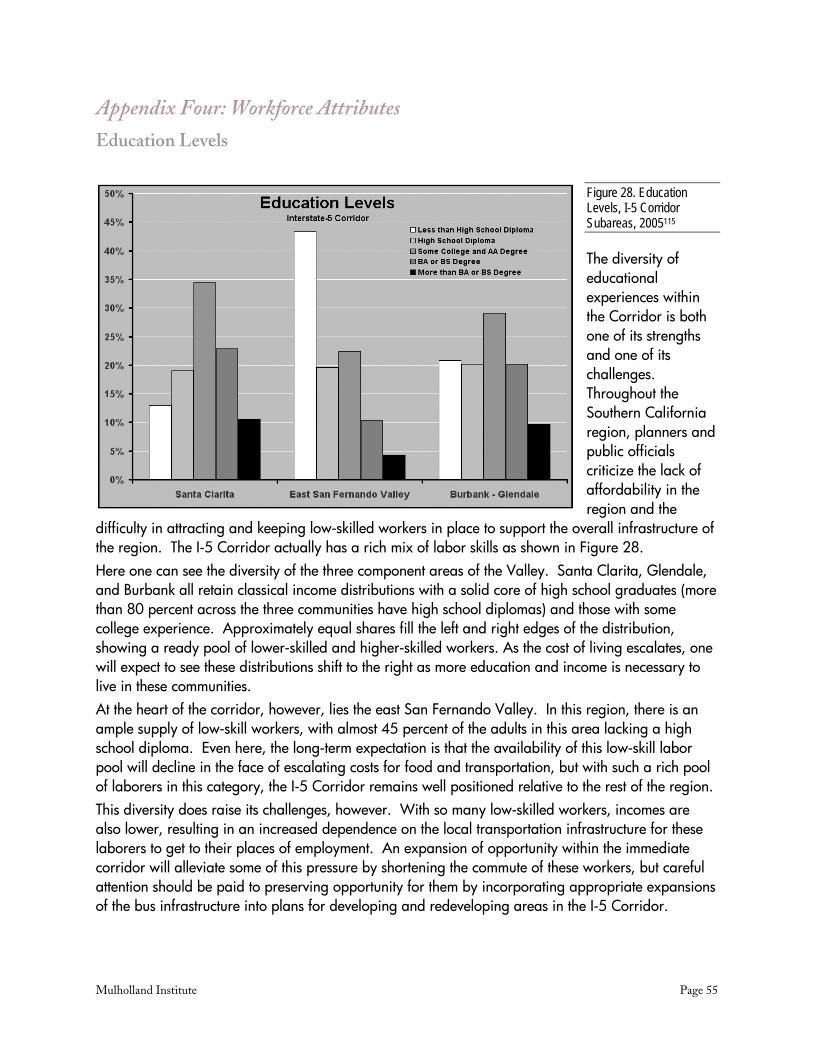
Mulholland Institute Page 55
Appendix Four: Workforce Attributes
Education Levels
Figure 28. Education Levels, I-5 Corridor Subareas, 2005115
The diversity of educational experiences within the Corridor is both one of its strengths and one of its challenges. Throughout the Southern California region, planners and public officials criticize the lack of affordability in the region and the
difficulty in attracting and keeping low-skilled workers in place to support the overall infrastructure of the region. The I-5 Corridor actually has a rich mix of labor skills as shown in Figure 28. Here one can see the diversity of the three component areas of the Valley. Santa Clarita, Glendale, and Burbank all retain classical income distributions with a solid core of high school graduates (more than 80 percent across the three communities have high school diplomas) and those with some college experience. Approximately equal shares fill the left and right edges of the distribution, showing a ready pool of lower-skilled and higher-skilled workers. As the cost of living escalates, one will expect to see these distributions shift to the right as more education and income is necessary to live in these communities. At the heart of the corridor, however, lies the east San Fernando Valley. In this region, there is an ample supply of low-skill workers, with almost 45 percent of the adults in this area lacking a high school diploma. Even here, the long-term expectation is that the availability of this low-skill labor pool will decline in the face of escalating costs for food and transportation, but with such a rich pool of laborers in this category, the I-5 Corridor remains well positioned relative to the rest of the region. This diversity does raise its challenges, however. With so many low-skilled workers, incomes are also lower, resulting in an increased dependence on the local transportation infrastructure for these laborers to get to their places of employment. An expansion of opportunity within the immediate corridor will alleviate some of this pressure by shortening the commute of these workers, but careful attention should be paid to preserving opportunity for them by incorporating appropriate expansions of the bus infrastructure into plans for developing and redeveloping areas in the I-5 Corridor.
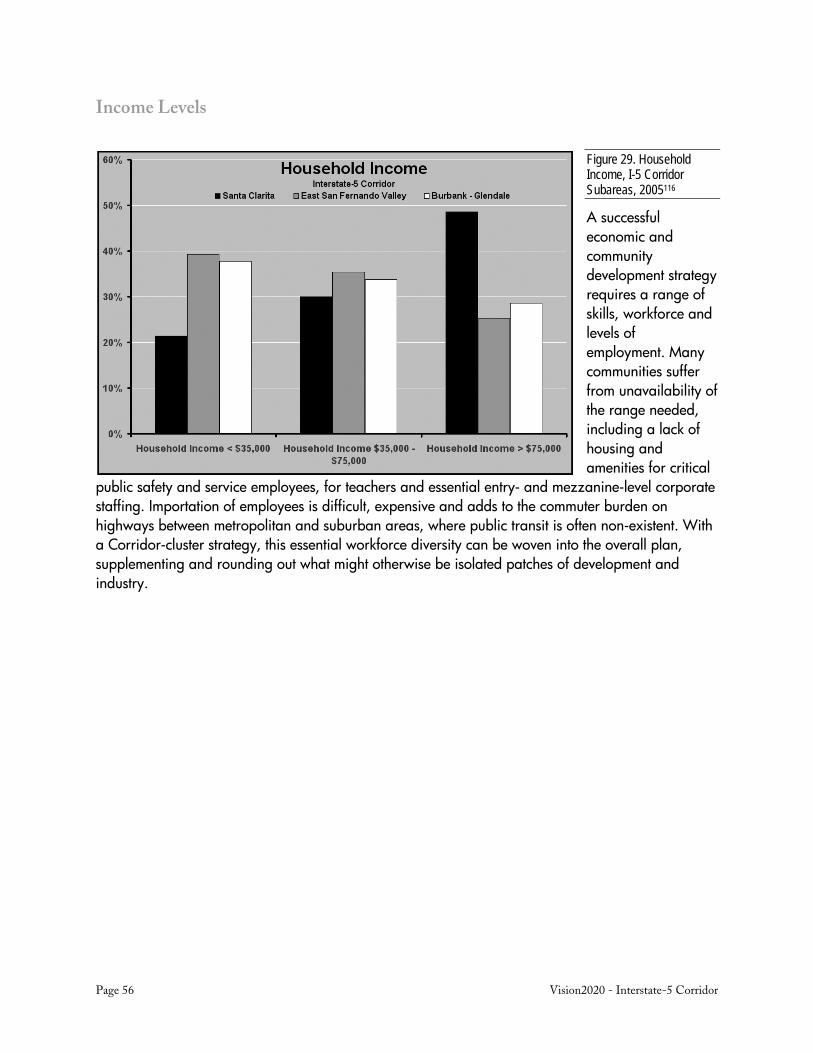
Page 56 Vision2020 - Interstate-5 Corridor
Income Levels
Figure 29. Household Income, I-5 Corridor Subareas, 2005116
A successful economic and community development strategy requires a range of skills, workforce and levels of employment. Many communities suffer from unavailability of the range needed, including a lack of housing and amenities for critical
public safety and service employees, for teachers and essential entry- and mezzanine-level corporate staffing. Importation of employees is difficult, expensive and adds to the commuter burden on highways between metropolitan and suburban areas, where public transit is often non-existent. With a Corridor-cluster strategy, this essential workforce diversity can be woven into the overall plan, supplementing and rounding out what might otherwise be isolated patches of development and industry.
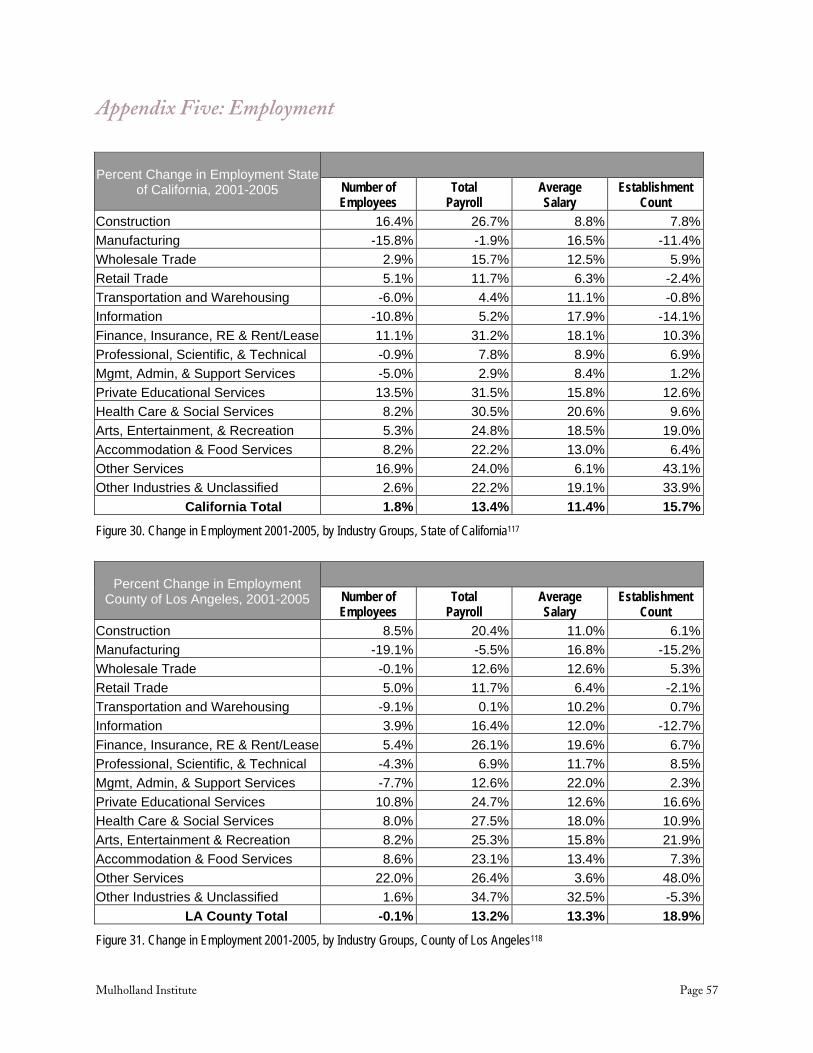
Mulholland Institute Page 57
Appendix Five: Employment
Percent Change in Employment State of California, 2001-2005
Number of Employees
Total Payroll
Average Salary
Establishment Count
Construction 16.4% 26.7% 8.8% 7.8%Manufacturing -15.8% -1.9% 16.5% -11.4%Wholesale Trade 2.9% 15.7% 12.5% 5.9%Retail Trade 5.1% 11.7% 6.3% -2.4%Transportation and Warehousing -6.0% 4.4% 11.1% -0.8%Information -10.8% 5.2% 17.9% -14.1%Finance, Insurance, RE & Rent/Lease 11.1% 31.2% 18.1% 10.3%Professional, Scientific, & Technical -0.9% 7.8% 8.9% 6.9%Mgmt, Admin, & Support Services -5.0% 2.9% 8.4% 1.2%Private Educational Services 13.5% 31.5% 15.8% 12.6%Health Care & Social Services 8.2% 30.5% 20.6% 9.6%Arts, Entertainment, & Recreation 5.3% 24.8% 18.5% 19.0%Accommodation & Food Services 8.2% 22.2% 13.0% 6.4%Other Services 16.9% 24.0% 6.1% 43.1%Other Industries & Unclassified 2.6% 22.2% 19.1% 33.9%
California Total 1.8% 13.4% 11.4% 15.7%
Figure 30. Change in Employment 2001-2005, by Industry Groups, State of California117
Percent Change in Employment County of Los Angeles, 2001-2005
Number of Employees
Total Payroll
Average Salary
Establishment Count
Construction 8.5% 20.4% 11.0% 6.1%Manufacturing -19.1% -5.5% 16.8% -15.2%Wholesale Trade -0.1% 12.6% 12.6% 5.3%Retail Trade 5.0% 11.7% 6.4% -2.1%Transportation and Warehousing -9.1% 0.1% 10.2% 0.7%Information 3.9% 16.4% 12.0% -12.7%Finance, Insurance, RE & Rent/Lease 5.4% 26.1% 19.6% 6.7%Professional, Scientific, & Technical -4.3% 6.9% 11.7% 8.5%Mgmt, Admin, & Support Services -7.7% 12.6% 22.0% 2.3%Private Educational Services 10.8% 24.7% 12.6% 16.6%Health Care & Social Services 8.0% 27.5% 18.0% 10.9%Arts, Entertainment & Recreation 8.2% 25.3% 15.8% 21.9%Accommodation & Food Services 8.6% 23.1% 13.4% 7.3%Other Services 22.0% 26.4% 3.6% 48.0%Other Industries & Unclassified 1.6% 34.7% 32.5% -5.3%
LA County Total -0.1% 13.2% 13.3% 18.9%
Figure 31. Change in Employment 2001-2005, by Industry Groups, County of Los Angeles118
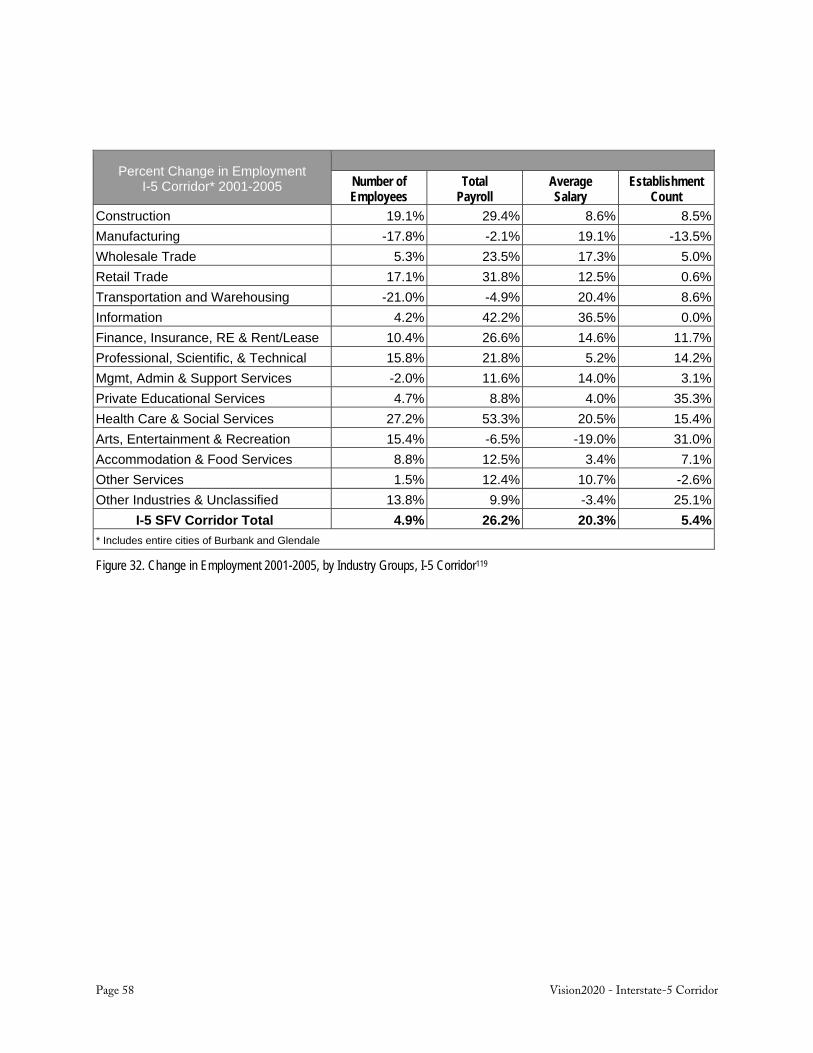
Page 58 Vision2020 - Interstate-5 Corridor
Percent Change in Employment I-5 Corridor* 2001-2005
Number of Employees
Total Payroll
Average Salary
Establishment Count
Construction 19.1% 29.4% 8.6% 8.5%Manufacturing -17.8% -2.1% 19.1% -13.5%Wholesale Trade 5.3% 23.5% 17.3% 5.0%Retail Trade 17.1% 31.8% 12.5% 0.6%Transportation and Warehousing -21.0% -4.9% 20.4% 8.6%Information 4.2% 42.2% 36.5% 0.0%Finance, Insurance, RE & Rent/Lease 10.4% 26.6% 14.6% 11.7%Professional, Scientific, & Technical 15.8% 21.8% 5.2% 14.2%Mgmt, Admin & Support Services -2.0% 11.6% 14.0% 3.1%Private Educational Services 4.7% 8.8% 4.0% 35.3%Health Care & Social Services 27.2% 53.3% 20.5% 15.4%Arts, Entertainment & Recreation 15.4% -6.5% -19.0% 31.0%Accommodation & Food Services 8.8% 12.5% 3.4% 7.1%Other Services 1.5% 12.4% 10.7% -2.6%Other Industries & Unclassified 13.8% 9.9% -3.4% 25.1%
I-5 SFV Corridor Total 4.9% 26.2% 20.3% 5.4%* Includes entire cities of Burbank and Glendale
Figure 32. Change in Employment 2001-2005, by Industry Groups, I-5 Corridor119
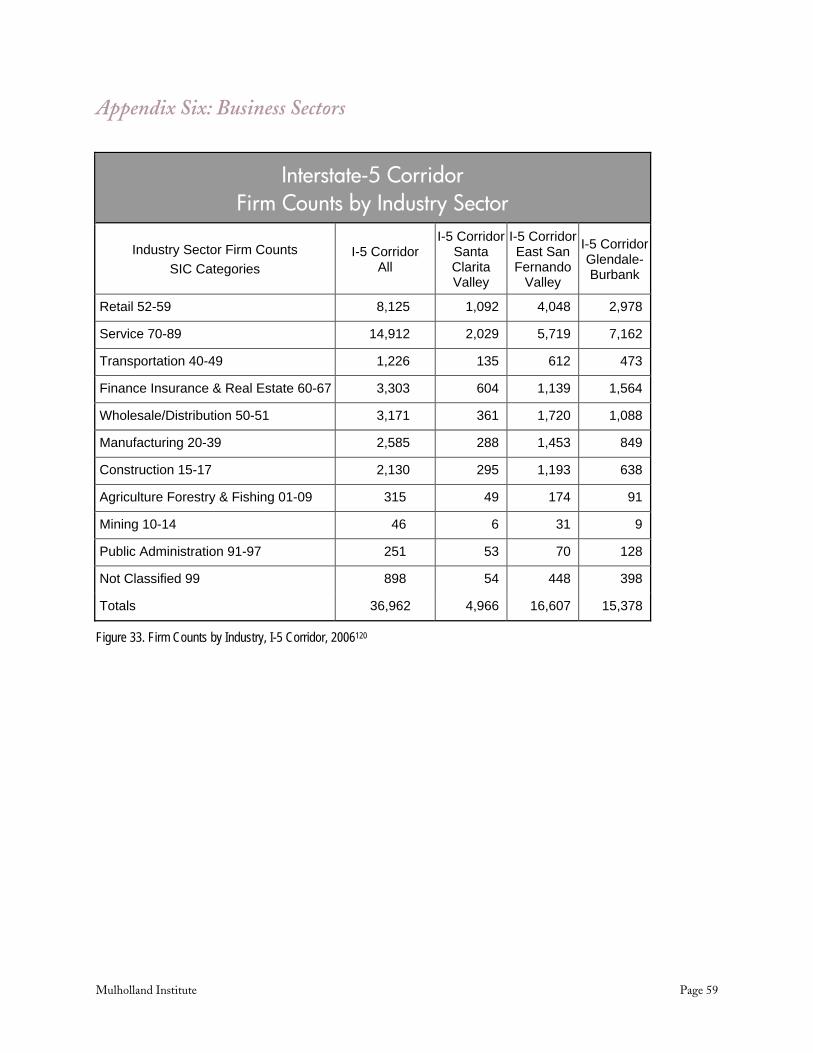
Mulholland Institute Page 59
Appendix Six: Business Sectors
Interstate-5 Corridor Firm Counts by Industry Sector
Industry Sector Firm Counts SIC Categories
I-5 Corridor All
I-5 Corridor Santa Clarita Valley
I-5 Corridor East San Fernando
Valley
I-5 Corridor Glendale-Burbank
Retail 52-59 8,125 1,092 4,048 2,978
Service 70-89 14,912 2,029 5,719 7,162
Transportation 40-49 1,226 135 612 473
Finance Insurance & Real Estate 60-67 3,303 604 1,139 1,564
Wholesale/Distribution 50-51 3,171 361 1,720 1,088
Manufacturing 20-39 2,585 288 1,453 849
Construction 15-17 2,130 295 1,193 638
Agriculture Forestry & Fishing 01-09 315 49 174 91
Mining 10-14 46 6 31 9
Public Administration 91-97 251 53 70 128
Not Classified 99 898 54 448 398
Totals 36,962 4,966 16,607 15,378
Figure 33. Firm Counts by Industry, I-5 Corridor, 2006120

Page 60 Vision2020 - Interstate-5 Corridor
Appendix Seven: Geography North Los Angeles County I-5 Corridor
Census Tracts
Figure 34. “Interstate-5 Corridor” Census Tracts Included in Study, Map, Mulholland Institute
I-5 Corridor Census Tracts 920326 106402 109200 120102 104610 123301 310300 301501 920327 106010 111100 120010 104401 123304 310600 301701 920328 106020 111201 120020 104402 123303 310100 301300 920107 106112 111202 120030 109500 123420 300702 301203 920113 106111 111301 120300 104310 123410 301400 301204 920329 106604 111400 120400 104320 123700 310200 301100 920330 106520 117302 122000 104702 123900 310702 301000 920334 107010 117301 119900 104701 123800 310701 300901 920331 107020 117303 120101 104105 123204 310900 300902 920322 106403 117404 119340 104106 122410 311000 302001 920335 106404 117200 119320 104104 122420 311100 301900 920332 106114 109800 119330 121100 123203 311200 301800 920031 106113 109700 119310 121210 123205 311300 301702 920042 104202 109300 119200 121220 124101 311500 302002 920043 104107 109602 119100 102101 124201 311400 302301 920312 104103 109400 119000 102102 123104 311600 302302 920313 104201 109601 119400 122200 123103 311700 302400 106603 320100 117100 119800 122110 123206 310800 302502 106643 320200 117405 119700 121900 123010 311800 302501 106642 320300 117406 104820 121800 123020 310703 302202 106602 106605 117530 104810 121010 122120 301502 302201 106641 106606 117520 104500 121600 310500 301601 302103 106510 109100 117510 104620 121020 310400 301602 302104
301202 302102

Mulholland Institute Page 61
ZIP Codes
Figure 35. “Interstate-5 Corridor” ZIP Codes Included in Study, Map, Mulholland Institute
I-5 Corridor Selected ZIP Codes 91202 Glendale 91345 Mission Hills 91203 Glendale 91352 Sun Valley 91204 Glendale 91355 Valencia 91205 Glendale 91381 Stevenson Ranch 91206 Glendale 91402 Panorama City 91207 Glendale 91501 Burbank 91321 Newhall 91502 Burbank 91331 Pacoima 91504 Burbank 91340 San Fernando 91505 Burbank 91342 Sylmar 91506 Burbank 91343 North Hills 91605 North Hollywood 91344 Granada Hills 91606 North Hollywood

Page 62 Vision2020 - Interstate-5 Corridor
Endnotes 1 Northeast Valley Study: Economic Assessment and Redevelopment Strategy, Report, Los Angeles CA: Los Angeles
Economic Development Corporation, City of Los Angeles, Economic Alliance of the San Fernando Valley and the Northeast San Fernando Valley Economic Development Action Collaborative, May 2003 p.3.
2 Prosperity Tomorrow: San Fernando Valley, Report, Mulholland Institute, Sherman Oaks CA, 2004, p.25. 3 Source: California Dept. of Finance, San Fernando Valley Economic Research Center, Cal State Northridge. 4 Source: Claritas, Mulholland Institute, 2005. 5 Source: U.S. Census Bureau, American Community Survey, 2005. 6 Source: Data from the United States Conference of Mayors, U.S. Metro Economies: The Engines of America’s Growth,
Lexington Mass: DRI/WEFA, 2001, Table 5, p.9; See Steven P. Erie, Globalizing L.A., Stanford CA: 2004, p.4. 7 Source: Claritas, Mulholland Institute, 2005. 8 Source: Los Angeles Economic Development Corporation (LAEDC), 2005. 9 Ibid. 10 Stakeholder Roundtable, Interview: Rob Gilmore, Newhall Land & Farming, September 2006. 11 Source: WestCoastRoads.com. 12 Economic descriptions are drawn from the LAEDC “Economic Overview and Forecast” for the San Fernando Valley,
February 2000 (updated March 2002). Northeast Valley Study, p.3. 13 Ibid. 14 Source: InfoUSA, Mulholland Institute, 2006. 15 Prosperity Tomorrow, p.5. 16 Ibid. 17 Ibid p.7. 18 Ibid p.5. 19 Source: U.S. Census Bureau, American Community Survey, Margin of Error: up to 8 percent. 20 Ibid. 21 Cities with a population over 150,000, Federal Bureau of Investigation (FBI) statistics, 2002 22 Source: Film Office, City of Santa Clarita, 2007. 23 Source: Newhall Land & Farming 2006. 24 Josh Premako, Newhall Ranch Taking Shape, “Newhall Signal,” November 21, 2006. 25 Source: Newhall Land & Farming 2006. 26 Source: Santa Clarita Valley Economic Alliance, City of Santa Clarita, Los Angeles Economic Development Corporation
and CBRE Commercial Real Estate. 27 Cities located in Los Angeles County, from a total of 88, based upon the award finalists were selected based on the
following criteria: commitment to economic development; programs to facilitate business entry, expansion and retention; activity over past 3 years; business tax rates and fee structures; economic incentives; communication with and about business clients.
28 Cost of Doing Business Survey, Report, Claremont CA: Kosmont-Rose Institute, 2006, jointly published by Kosmont Companies of Los Angeles and the Rose Institute of State and Local Government at Claremont McKenna College.
29 Source: Claritas/Mulholland Institute; estimates based on U.S. Census 2000. 30 Source: Claritas, Mulholland Institute, 2005. 31 The Changing Face of the San Fernando Valley, report, 2002, Economic Alliance of the San Fernando Valley, Sherman
Oaks, CA, p. 16; Prosperity Tomorrow, p.5. 32 Ibid. 33 Source: Mulholland Institute. 34 Northeast Valley Study, p.8. 35 Source: Claritas/Mulholland Institute; estimates based on U.S. Census 2000. 36 Source: U.S. Census Bureau, Census 2000. 37 Source: Claritas, Mulholland Institute, 2005. 38 Cost of Doing Business Survey, 2006. 39 Source: U.S. Census Bureau, American Community Survey, 2005, Margin of Error: up to 8 percent. 40 Cities located in Los Angeles County, from a total of 88. 41 Source: U.S. Census Bureau, American Community Survey, 2005, Margin of Error: up to 8 percent.
Mulholland Institute Page 63
42 Cost of Doing Business Survey, 2006. 43 Source: U.S. Census Bureau, American Community survey, 2005, Margin of Error: up to 8 percent 44 Source: Claritas/Mulholland Institute; estimates based on U.S. Census 2000. 45 Los Angeles, Orange, Ventura, San Bernardino, and Riverside counties. 46 Source: Data from United States Conference of Mayors, U.S. Metro Economies: the Engines of America’s Growth
Lexington, Mass: DRI/WEFA, 2001, Table 5, p.9. 47 Regional Housing Needs Assessment (RHNA) of the Southern California Association of Governments; California
Government Code Section 65583 et seq. 48 Source: DataQuick Real Estate News 49 Also known as Fremont Pass and San Fernando Pass. 50 Journey to Work: 2000, U.S. Census Bureau, March 2004,p. 5; Kenneth A. Small, Urban Transportation, from web
publication in David R. Henderson, ed, Concise Encyclopedia of Economics, 2nd edition, Indianapolis: Liberty Fund. 51 Source: Claritas, Mulholland Institute, 2005. 52 Metro: Los Angeles Metropolitan Transportation Authority. 53 North County Combined Highway Corridors Study, Report, Metro, 2004, p.ES-6. 54 Source: Claritas, Mulholland Institute, 2005. 55 Source: Estimated, U.S. Census Bureau, American Community Survey, 2005. 56 Source: Las Lomas 57 Eric Pryne, “Despite planners best efforts, many people choose the commute”, Seattle Times, September 10, 2006; Robert
Cevero, “Planned Communities, Self Containment and Commuting: A Cross National Perspective”, Urban Studies, volume 32, No. 7, 1995, 1135-1161.
58 http://www.restonmuseum.org. 59 Malcolm Gladwell, “The Terrazzo Jungle”, The New Yorker, March 15, 2004. 60 Patrick Wirtz, Valencia, California: From New Town to Regional Center, University of Southern California, School of
Policy, Planning and Development, USC Lusk Center for Real Estate, June 1999, pp.15-18. 61 Ibid pp.117-118. 62 Source: U.S. Census Bureau, American Community Survey, margin of error 7 percent. 63 Santa Clarita Valley Market Study, Al Gobar and Associates, 2005. Interview with author and Colin Drukker, Planning
Center. 64 Randal O’Toole, “New Urbanism”, Reason, January 1999; Wirtz, op.cit. p.87; Robert Simon, “Genesis of Reston”, 1966
www.restonmuseum.org/historyandphilosophy.html. 65 Wirtz, Valencia, California. 66 89.3 percent Census 2000. The term “Hispanic” is a broad technical reference used by the U.S. Census Bureau and
other government agencies encompassing all Spanish-speaking peoples in both hemispheres and emphasizing the common denominator of language among communities that sometimes have little else in common. “Latino” refers more exclusively to persons or communities of Latin American origin. Usage is often mixed, and it is not uncommon to find both terms used by the same writer or speaker.
67 Interview, Severyn Aszkenazy, 2005. 68 Michael Anthony Mendez, Latino Lifestyle & the New Urbanism: Synergy Against Sprawl, Thesis, Latino Issues Forum,
Massachusetts Institute of Technology, 2002. 69 See Our Future Neighborhoods: Housing and Urban Villages in the San Fernando Valley, Report, Economic Alliance of
the San Fernando Valley, July 2003 p.15, Prosperity Tomorrow, p.28. 70 Our Future Neighborhoods, p.16. 71 All information related to Burbank Village BID: Interview, Stephanie Pillard, BID Manager, May 9, 2003; Our Future
Neighborhoods, p.17. 72 Our Future Neighborhoods, p.17. 73 Prosperity Tomorrow, p.28. 74 By-right projects: Projects that comply with existing zoning and regulations; projects that do not require variances or
special concessions from the planning authority; projects where the public has no right to a hearing process. 75 San Fernando Valley Quality of Life, Survey, Rose Institute/Economic Alliance of The San Fernando Valley, 2003 p.5. 76 Ibid. 77 Our Future Neighborhoods, p.16.
Page 64 Vision2020 - Interstate-5 Corridor
78 Charrette: In urban planning, the charrette has become a technique for consulting with all stakeholders: municipal
officials, developers and local residents. [Wikipedia] 79 San Fernando Valley Quality of Life, Survey. 80 Ibid. 81 Robert Monroe, “101 Business Paces L.A. Area Houses,” Daily News, August 1, 2000. 82 Nerdistan: An upscale and largely self-contained suburb or town with a large population of high-tech workers. 83 San Fernando Valley Almanac, Report, Economic Alliance of the San Fernando Valley, 2000, p.20. 84 Northeast Valley Study, p.i. 85 Net Absorption: Square feet leased in a particular area during a specific time period after deducting space vacated, or
otherwise becoming available. 86 Source: Los Angeles Economic Development Corporation, Overview, Jim Kyser 87 Ibid. 88 Source: U.S. Census Bureau, Economic Census, 2002, Mulholland Institute. 89 Ibid. 90 Regional Housing Needs Assessment (RHNA) of the Southern California Association of Governments. California
Government Code Section 65583 et seq. 91 Stakeholder Roundtable, Interview: Rob Gilmore, Newhall Land & Farming, September 2006. 92 Mark Baldassare, Special Survey on Land Use, San Francisco: Public Policy Institute of California, November 2002, p.1;
Special Survey on Californians and Their Housing, November 2004, p.10. 93 Ibid. 94 Ibid. 95 Source: San Fernando Valley Economic Research Center, Mulholland Institute, Claritas, U.S. Census Bureau, American
Community Survey, 2005. 96 Ibid. 97 Source: Claritas, Mulholland Institute, 2005. 98 Source: U.S. Census Bureau, 2005. 99 See Joel Kotkin, “Boomtowns ’06,” Inc. Magazine, May 2006. 100 “Best Places for Business and Careers,” Forbes Magazine, ed. by Kurt Badenhausen, May 2006. 101 According to a recent analysis by The Trust for Public Land, Los Angeles is more than 50 percent below the parks-to-
people ratio of 10 acres per thousand residents, as recommended by the National Recreation and Park Association. 102 Cost of Doing Business Survey, 2004. 103 Resilient Production: Business sectors where the study area can maintain its strength in the manufacture of goods and
provision of services, despite global trends and global competition. Mulholland Institute, 2007. 104 Revenue Development Areas (RDAs) allow selected local governments to take advantage of tax revenue generated by
private investment in given jurisdiction to make payments on bonds used to finance public infrastructure improvements. 105 Prosperity Tomorrow, p.24. 106 The City of City of San Diego has developed a Corporation model. 107 Northeast Valley Study. 108 Source: Claritas, Mulholland Institute. 109 Ibid. 110 Source: U.S. Census Bureau, American Community Survey, 2005; Claritas, Mulholland Institute. 111 Ibid. 112 Ibid. 113 Ibid. 114 Source: Claritas, Mulholland Institute. 115 Ibid. 116 Ibid. 117 Source: California Dept. of Finance, San Fernando Valley Economic Research Center, Cal State Northridge 118 Ibid. 119 Ibid. 120 Source: InfoUSA, Mulholland Institute.