Visual enhancement of digital ultrasound images using multiscale wavelet domain
13
ISSN 10546618, Pattern Recognition and Image Analysis, 2010, Vol. 20, No. 3, pp. 303–315. © Pleiades Publishing, Ltd., 2010. 1. INTRODUCTION The rapid development of medical imaging tech nology and the introduction of new imaging modali ties, such as endoscopy, ultrasound imaging, func tional magnetic resonance imaging (fMRI), etc., call for new image processing methods including special ized noise filtering, enhancement, classification and segmentation techniques. In case of ultrasound imag ing, the major shortcoming is the presence of speckle noise [1]. Speckle is a random interference pattern present in all images obtained using coherent radiation in a medium containing subresolution scatterers. Speckle has a negative impact on ultrasound images because the speckle pattern does not correspond to the underlying organ structure in the image. Speckle occurs especially in images of the liver and kidney whose underlying structures are too small to be resolved by large wavelength ultrasound [2–4]. Work by Bamber and Daft [5] suggests that speckle may reduce the detectability of a lesion by approximately a factor of eight. Speckle is ultimately responsible for the poorer effective resolution of an ultrasound image when compared to other medical imaging modalities. Therefore, speckle reduction has become an active area of research [6]. Several methods of speckle reduction have been proposed. Nikhil Gupta and M.N. Swamy [7] have proposed a novel technique for despeckling the medi cal ultrasound images using lossy compression. S.G. Chang and Martin Vetterli [8] have proposed an adaptive datadriven threshold for image denoising via wavelet softthresholding. Several other wavelet domain techniques have been proposed over the years, which utilize lossy compression for denoising of Syn thetic Aperture Radar (SAR) images corrupted with speckle noise [9, 10] and can be easily adopted for medical ultrasound images via the use of homomor phic transform [11–23]. Visual Enhancement of Digital Ultrasound Images Using Multiscale Wavelet Domain 1 P. S. Hiremath a , Prema T. Akkasaligar b , and Sharan Badiger c a Dept. of P.G. Studies and Research in Computer Science, Gulbarga University, Gulbarga585106, Karnataka, India b B.L.D.E.A’s Dr P.G.H. Engineering College, Bijapur586103, Karnataka, India c Sri.B.M.Patil Medical College, BLDE University, Bijapur586103, Karnataka, India email: [email protected]. [email protected], [email protected] Abstract—Ultrasonography has been considered as one of the most powerful techniques for imaging organs and soft tissue structures in the human body. The main disadvantage of medical ultrasonography is the poor quality of images, which are affected by multiplicative speckle noise. In this paper, we present a novel method for despeckling medical ultrasound images. The primary goal of speckle reduction is to remove the speckle without losing much detail contained in an image. To achieve this goal, we make use of the wavelet transform and apply multiresolution analysis to localize an image into different frequency components or useful sub bands and then effectively reduce the speckle in the subbands according to the local statistics within the bands. The main advantage of the wavelet transform is that the image fidelity after reconstruction is visually lossless. The objective of the paper is to investigate the proper selection of wavelet filters and thresholding schemes which yields optimal visual enhancement of ultrasound images, in particular. We employ the wavelet shrinkage denoising techniques with different wavelet bases and decomposition levels on the individual sub bands to achieve the best acceptable speckle reduction while maintaining the fidelity of the image and also examine the effects of different thresholding techniques as well as shrinkage rules for denoising ultrasound images. The proposed method consists of the log transformed original ultrasound image being subjected to wavelet transform, which is then denoised by a thresholding technique using a shrinkage rule. Experimental results show that the subband decomposition of ultrasound images, using Bior6.8 and level 3 with soft thresh olding based on Bayes shrinkage rule, performs better than other techniques. The performance is measured in terms of Variance, Mean Square Error (MSE), SignaltoNoise Ratio (SNR), Peak SNR (PSNR) and Correlation Coefficient (CC). The results of wavelet shrinkage techniques are compared with common speckle filters. We observe that the proposed method achieves better visual enhancement of ultrasound images which would lead to more accurate image analysis by the medical experts. Key words: despeckling, ultrasound image, wavelet transform, thresholding, shrinkage rule. DOI: 10.1134/S1054661810030065 Received March 1, 2010 REPRESENTATION, PROCESSING, ANALYSIS, AND UNDERSTANDING OF IMAGES 1 The article is published in the original.
-
Upload
independent -
Category
Documents
-
view
7 -
download
0
Transcript of Visual enhancement of digital ultrasound images using multiscale wavelet domain
ISSN 1054�6618, Pattern Recognition and Image Analysis, 2010, Vol. 20, No. 3, pp. 303–315. © Pleiades Publishing, Ltd., 2010.
1. INTRODUCTION
The rapid development of medical imaging tech�nology and the introduction of new imaging modali�ties, such as endoscopy, ultrasound imaging, func�tional magnetic resonance imaging (fMRI), etc., callfor new image processing methods including special�ized noise filtering, enhancement, classification andsegmentation techniques. In case of ultrasound imag�ing, the major shortcoming is the presence of specklenoise [1]. Speckle is a random interference patternpresent in all images obtained using coherent radiationin a medium containing subresolution scatterers.Speckle has a negative impact on ultrasound imagesbecause the speckle pattern does not correspond to theunderlying organ structure in the image. Speckleoccurs especially in images of the liver and kidneywhose underlying structures are too small to be
resolved by large wavelength ultrasound [2–4]. Workby Bamber and Daft [5] suggests that speckle mayreduce the detectability of a lesion by approximately afactor of eight. Speckle is ultimately responsible forthe poorer effective resolution of an ultrasound imagewhen compared to other medical imaging modalities.Therefore, speckle reduction has become an activearea of research [6].
Several methods of speckle reduction have beenproposed. Nikhil Gupta and M.N. Swamy [7] haveproposed a novel technique for despeckling the medi�cal ultrasound images using lossy compression.S.G. Chang and Martin Vetterli [8] have proposed anadaptive data�driven threshold for image denoising viawavelet soft�thresholding. Several other waveletdomain techniques have been proposed over the years,which utilize lossy compression for denoising of Syn�thetic Aperture Radar (SAR) images corrupted withspeckle noise [9, 10] and can be easily adopted formedical ultrasound images via the use of homomor�phic transform [11–23].
Visual Enhancement of Digital Ultrasound Images Using Multiscale Wavelet Domain1
P. S. Hirematha, Prema T. Akkasaligarb, and Sharan Badigerc
a Dept. of P.G. Studies and Research in Computer Science, Gulbarga University, Gulbarga�585106, Karnataka, Indiab B.L.D.E.A’s Dr P.G.H. Engineering College, Bijapur�586103, Karnataka, India
c Sri.B.M.Patil Medical College, BLDE University, Bijapur�586103, Karnataka, Indiae�mail: [email protected]. [email protected], [email protected]
Abstract—Ultrasonography has been considered as one of the most powerful techniques for imaging organsand soft tissue structures in the human body. The main disadvantage of medical ultrasonography is the poorquality of images, which are affected by multiplicative speckle noise. In this paper, we present a novel methodfor despeckling medical ultrasound images. The primary goal of speckle reduction is to remove the specklewithout losing much detail contained in an image. To achieve this goal, we make use of the wavelet transformand apply multi�resolution analysis to localize an image into different frequency components or useful sub�bands and then effectively reduce the speckle in the subbands according to the local statistics within thebands. The main advantage of the wavelet transform is that the image fidelity after reconstruction is visuallylossless. The objective of the paper is to investigate the proper selection of wavelet filters and thresholdingschemes which yields optimal visual enhancement of ultrasound images, in particular. We employ the waveletshrinkage denoising techniques with different wavelet bases and decomposition levels on the individual sub�bands to achieve the best acceptable speckle reduction while maintaining the fidelity of the image and alsoexamine the effects of different thresholding techniques as well as shrinkage rules for denoising ultrasoundimages. The proposed method consists of the log transformed original ultrasound image being subjected towavelet transform, which is then denoised by a thresholding technique using a shrinkage rule. Experimentalresults show that the subband decomposition of ultrasound images, using Bior6.8 and level 3 with soft thresh�olding based on Bayes shrinkage rule, performs better than other techniques. The performance is measuredin terms of Variance, Mean Square Error (MSE), Signal�to�Noise Ratio (SNR), Peak SNR (PSNR) andCorrelation Coefficient (CC). The results of wavelet shrinkage techniques are compared with commonspeckle filters. We observe that the proposed method achieves better visual enhancement of ultrasound imageswhich would lead to more accurate image analysis by the medical experts.
Key words: despeckling, ultrasound image, wavelet transform, thresholding, shrinkage rule.
DOI: 10.1134/S1054661810030065
Received March 1, 2010
REPRESENTATION, PROCESSING, ANALYSIS, AND UNDERSTANDING OF IMAGES
1The article is published in the original.
304
PATTERN RECOGNITION AND IMAGE ANALYSIS Vol. 20 No. 3 2010
HIREMATH et al.
In ultrasound images, the noise content is multipli�cative and non�gaussian. Such noise is generally moredifficult to remove than additive noise, because theintensity of the noise varies with the image intensity. Amodel of multiplicative noise is given by
(1)
where the speckle image y(i, j) is the product of theoriginal image x(i, j), and the non�gaussian noise n(i,j). The indices i, j represent the spatial position overthe image. In most applications involving multiplica�tive noise, the noise content is assumed to be station�ary with unitary mean and unknown noise variance σ2.To obtain an additive noise model as given in Eq. (2),we have to apply a logarithmic transformation on thespeckle image y(i, j). The noise component n(i, j) isthen approximated as an additive zero mean gaussianprocess.
(2)
The DWT is then applied to ln y(i, j). After applyingthe Inverse DWT (IDWT), the processed image is sub�jected to an exponential transformation to reverse thelogarithmic operation.
In the present paper, our objective is to investigatethe effects of different wavelet filters in order to findthe optimal wavelet filter and filter level. Also, we eval�uate the performance of different thresholding func�tions and shrinkage rules in order to find an optimalthresholding technique with reference to despecklingof a medical ultrasound image. The analysis of theresults is done using statistical measures such as Vari�ance, Mean Square Error (MSE), Signal�to�NoiseRatio (SNR), Peak SNR (PSNR), Correlation Coef�ficient (CC). The experimental results show that theproposed scheme performs better than the commonspeckle filters in terms of these statistical measures.
2. PROPOSED METHOD
The noise commonly manifests itself as finegrained structure in an image. The discrete wavelettransform (DWT) provides the scale based decomposi�tion. The DWT of an image translates the image con�tent into an approximation subband and a set of detailsubbands at different orientations and resolutionscales. Typically, the band�pass content at each scale isdivided into three orientation subbands characterizedby horizontal (H), vertical (V) and diagonal (D) direc�tions. The approximation subband consists of the so�called scaling coefficients and the detail subbands arecomposed of the wavelet coefficients. Here, we con�sider a non�decimated wavelet transform, where thenumber of the wavelet coefficients is equal at eachscale. Thus, most of the noise tends to be representedby wavelet coefficients at the finer scales. Discardingthese coefficients would result in a natural filtering ofthe noise on the basis of the scale. Because the coeffi�cients at such scales also tend to be the primary carrier
y i j,( ) x i j,( )n i j,( ),=
y i j,( )ln x i j,( )ln n i j,( ).ln+=
of the edge information, this method sets the DWTcoefficients to zero if their values are below a thresh�old, which is calculated using shrinkage rule. Thesecoefficients are mostly those corresponding to noise.The edge relating coefficients on the other hand, areusually above the threshold. The inverse DWT of thethresholded image is the denoised image. The stepsinvolved in the proposed method are given in the
Algorithm 1.Algorithm 1: Despeckling of an ultrasound imageInput: Medical ultrasound image.Output: Despeckled image.StartStep 1: Input medical ultrasound image X.Step 2: Apply log transformation to the input
image.Step 3: Apply wavelet decomposition using a wave�
let filter to the log transformed image upto n levels,where n depends on the image size.
Step 4: Perform thresholding of the wavelet trans�formed image.
Step 5: Perform inverse wavelet transform of thethresholded image. The reconstructed image is thedenoised image Y (Output image).
Step 6: Compute the performance parameters,namely, Variance, MSE, SNR, PSNR, CorrelationCoefficient for the despeckled image of Step 5.
StopIn the Step 3, the wavelet decomposition can be
done using different wavelet filters upto n levels, wheren depends on the image size. In the Step 4, the wavelettransformed image can be thresholded by
(i) Selecting either global or subband thresholdingfunction,
(ii) Selecting shrinkage rule (Bayes or Universal),and
(iii) Selecting shrinkage scheme (Hard, Soft orSemi soft).
3. WAVELET TRANSFORM
Wavelet transform (WT) represents an image as asum of wavelet functions (wavelets) with differentlocations and scales [24]. Any decomposition of animage into wavelets involves a pair of waveforms, oneto represent the high frequencies corresponding to thedetailed parts of an image (wavelet function ψ) andone for the low frequencies or smooth parts of animage (scaling function φ). High frequencies aretransformed with short functions (low scale). Theresult of WT is a set of wavelet coefficients, whichmeasure the contribution of the wavelets at differentlocations and scales.
The WT performs multiresolution image analysis[25]. The result of multiresolution analysis is simulta�neous image representation on different resolution(and quality) levels [26]. The scaling function for mul�
PATTERN RECOGNITION AND IMAGE ANALYSIS Vol. 20 No. 3 2010
VISUAL ENHANCEMENT OF DIGITAL ULTRASOUND IMAGES 305
tiresolution approximation can be obtained as thesolution to a two�scale dilational equation
(3)
for some suitable sequence of coefficients aL(k). Onceφ has been found, an associated mother wavelet isgiven by a similar looking formula
(4)
Wavelet analysis leads to perfect reconstruction filterbanks using the coefficient sequences aL(k) and aH(k).The input sequence x is convolved with high�pass(HPF) and low�pass (LPF) filters aH(k) and aL(k) andeach result is downsampled by two, yielding the trans�form signals xH and xL. The signal is reconstructedthrough upsampling and convolution with high andlow synthesis filters sH(k) and sL(k). By cascading theanalysis filter bank with itself a number of times, digi�tal signal decomposition with dyadic frequency scalingknown as DWT can be formed.
The DWT for an image as a 2�D signal can bederived from 1�D DWT. The easiest way for obtainingscaling and wavelet functions for two dimensions is bymultiplying two 1�D functions. The scaling functionfor 2�D DWT can be obtained by multiplying two 1�Dscaling functions: φ(x, y) = φ(x)φ(y) representing theapproximation subband�image (LL). The analysis fil�ter bank for a single level 2�D DWT structure producesthree detailed subband�images (HL, LH, HH) corre�sponding to three different directional�orientations(Horizontal, Vertical and Diagonal) and a lower reso�lution subband�image LL. The filter bank structurecan be iterated in a similar manner on the LL channelto provide multilevel decomposition.
The separable wavelets are also viewed as tensorproducts of one�dimensional wavelets and scalingfunctions. If ψ(x) is the one�dimensional wavelet asso�ciated with one�dimensional scaling function φ(x),then three 2�D wavelets associated with three subbandimages, called as vertical (V), horizontal (H) and diag�onal (D) details, are given by
(5)
(6)
(7)
which correspond to the three subbands LH, HL andHH, respectively [27].
3.1. Choice of Wavelet Function
Important properties of wavelet functions in imagecompression application are compact support (leadsto efficient implementation), symmetry (useful in
φ x( ) aL k( )φ 2x k–( ),
k
∑=
ψ x( ) aH k( )φ 2x k–( ).
k
∑=
ψV x y,( ) φ x( )ψ y( ),=
ψH x y,( ) ψ x( )φ y( ),=
ψD x y,( ) ψ x( )ψ y( ),=
avoiding dephasing in image processing), orthogonal�ity (allow fast algorithm), regularity, and degree ofsmoothness (related to filter order or filter length). Inour experiments, five types of wavelet families areexamined: Haar Wavelet (HW), Daubechies Wavelet(DW), Coiflet Wavelet (CW), Symlet Wavelet (SW)and Biorthogonal Wavelet (BW). Each wavelet familycan be parameterized by integer that determines filterorder (N). Biorthogonal wavelets can use filters withsimilar or dissimilar orders for decomposition (Nd)and reconstruction (Nr). Different filter orders areused within each wavelet family. We have used the fol�lowing sets of wavelets: HW, DW�5; CW–N with N =2, 5; SW–N with N = 1, 3, 5; and BW�Nr�Nd with (Nr,Nd) = (2, 2), (6, 8). Daubechies and Coiflet waveletsare families of orthogonal wavelets that are compactlysupported. Compactly supported wavelets correspondto finite�impulse response (FIR) filters and thus, leadto efficient implementation [28]. A major disadvan�tage of DW and CW is their asymmetry, which cancause artifacts at borders of the wavelet subbands. DWis asymmetrical while CW is almost symmetrical.Symmetry in wavelets can be obtained only if we arewilling to give up either compact support or orthogo�nality of wavelet (except for HW, which is orthogonal,compactly supported, and symmetric). If we wantboth symmetry and compact support in wavelets, weshould relax the orthogonality condition and allownonorthogonal wavelet functions. An example is thefamily of biorthogonal wavelets that contains com�pactly supported and symmetric wavelets [29].
3.2. Filter Order and Filter Length
The filter length is determined by filter order, butrelationship between filter order and filter length is dif�ferent for different wavelet families. For example, thefilter length is L = 2N for the DW family and L = 6Nfor the CW family, where N = number of filter coeffi�cients. HW is the special case of DW with N = 1 (DW�1) and L = 2. Filter lengths are approximately, L ={max(2Nd, 2Nr) + 2}, but effective lengths are differentfor LPF and HPF used for decomposition (Nd) andreconstruction (Nr) and should be determined foreach filter type. Different filters have different coeffi�cients [28, 30]. Filter with a high order can be designedto have good frequency localization, which increasesthe energy compaction. Wavelet smoothness alsoincreases with its order. Filters with lower order have abetter time localization and preserve important edgeinformation. Wavelet�based image compression pre�fers smooth functions (that can be achieved using longfilters) but complexity of calculating DWT increasesby increasing the filter length. Therefore, in imagecompression application, we have to find balancebetween filter length, degree of smoothness, and com�putational complexity. Within each wavelet family, wecan find wavelet function that represents optimal solu�

306
PATTERN RECOGNITION AND IMAGE ANALYSIS Vol. 20 No. 3 2010
HIREMATH et al.
tion related to filter length and degree of smoothness,but this solution depends on image content.
3.3. Number of Decompositions
The quality of denoised image depends on thenumber of decompositions. The number of decompo�sitions determines the resolution of the lowest level inwavelet domain. If we use larger number of decompo�sitions, we will be more successful in resolving impor�tant DWT coefficients from less important coeffi�cients. The human visual system (HVS) is less sensitiveto removal of smaller details. The larger number ofdecomposition causes loss of the coding algorithmefficiency. The adaptive decomposition is required toachieve balance between image quality and computa�tional complexity. Hence, the optimal number ofdecompositions, which depends on filter order, needsto be determined.
4. THRESHOLDING
There are two approaches to perform the thresh�olding after computation of the wavelet coefficients,namely, subband thresholding and global thresholding[31]. In subband thresholding, we compute the noisevariance of the horizontal, vertical and diagonal subbands of each decomposition level, starting from theouter spectral bands and moving towards inner spec�tral bands (decomposition from higher levels towardslower levels) and calculate threshold value using Bayesshrinkage or universal shrinkage rule. In global thresh�olding, we determine the threshold value from only thediagonal band but we apply this threshold to the hori�zontal, vertical and diagonal sub bands. This approachassumes, that diagonal band contains most of the highfrequencies components, hence the noise content indiagonal band should be higher than the other bands.Thresholding at the coarsest level is not done becauseit contains the approximation coefficients that repre�sent the translated and scaled down version of the orig�inal image. Thresholding at this level will cause thereconstruction image to be distorted.
4.1. Shrinkage Scheme
The thresholding approach is to shrink the detailedcoefficients (high frequency components) whoseamplitudes are smaller than a certain statistical thresh�old value to zero while retaining the smoother detailedcoefficients to reconstruct the ideal image withoutmuch loss in its details. This process is sometimescalled wavelet shrinkage, since the detailed coeffi�cients are shrunk towards zero. There are threeschemes to shrink the wavelet coefficients, namely, thekeep�or�kill hard thresholding, shrink�or�kill softthresholding introduced by Donoho [32] and therecent semi�soft or firm thresholding. Shrinking of thewavelet coefficient is most efficient if the coefficients
are sparse, that is, the majority of the coefficients arezero and a minority of coefficients with greater magni�tude that can represent the image. The criterion ofeach scheme is described as follows. Given that λdenotes the threshold limit, Xw denotes the inputwavelet coefficients and Yt denotes the output waveletcoefficients after thresholding, we define the followingthresholding functions:
(i) Hard�Thresholding
(8)
(ii) Soft�Thresholding
(9)
(iii) Semi�Soft Thresholding
(10)
where λ1 = 2λ.The hard thresholding procedure removes the noise
by thresholding only the wavelet coefficients of thedetailed sub bands, while keeping the low�resolutioncoefficients unaltered. The soft thresholding schemeshown in Eq. (9) is an extension of the hard threshold�ing. It avoids discontinuities and is, therefore, morestable than hard thresholding. In practice, soft thresh�olding is more popular than hard thresholding,because it reduces the abrupt sharp changes thatoccurs in hard thresholding and provides more visuallypleasant recovered images. The aim of semi�softthreshold is to offer a compromise between hard andsoft thresholding by changing the gradient of the slope.This scheme requires two thresholds, a lower thresholdλ and an upper threshold λ1 where λ1 is estimated to betwice the value of lower threshold λ.
4.2. Shrinkage Rule
A very large threshold λ will shrink almost all thecoefficients to zero and may result in over smoothingthe image, while a small value of λ will lead to thesharp edges with details being retained but may fail tosuppress the speckle. We use the shrinkage rules,namely, the universal shrinkage rule and Bayes shrink�age for thresholding.
Yt Thard Xw( )=
= Xw, where Xw λ≥
0, Xw λ<⎩ ⎭⎨ ⎬⎧ ⎫
Yt Tsoft Xw( )=
= Xw{ } Xw λ–( ), where Xwsgn λ≥
0, Xw λ<⎩ ⎭⎨ ⎬⎧ ⎫
,
Yt Tsemi–soft xw( )=
=
0, where Xw λ,≤
xw{ }λ1 xw λ–( )
λ1 λ–�����������������������, where λsgn Xw λ1≤<
Xw, where Xw λ1>⎩ ⎭⎪ ⎪⎪ ⎪⎨ ⎬⎪ ⎪⎪ ⎪⎧ ⎫
,

PATTERN RECOGNITION AND IMAGE ANALYSIS Vol. 20 No. 3 2010
VISUAL ENHANCEMENT OF DIGITAL ULTRASOUND IMAGES 307
(ii) Universal shrinkage ruleAn approach introduced by Donoho [32] to
denoise in the wavelet domain is known as universalthresholding as given in Eq. (11). The idea is to obtaineach threshold λi to be proportional to the square rootof the local noise variance σ2 in each subband of aspeckle image after decomposition. If M is the blocksize in the wavelet domain,
(11)
The estimated local noise variance, σ2, in each sub�band is obtained by averaging the squares of the empir�ical wavelet coefficients at the highest resolution scaleas
(12)
The threshold of Eq. (11) is based on the fact that,for a zero mean independent identically distributed(i.i.d.) Gaussian process with variance σ2, there is ahigh probability that a sample value of this process willnot exceed λ. Thus, the universal threshold is applica�ble to applications with white Gaussian noise and inwhich most of the coefficients are zero. In such cases,there is a high probability that the combination of(zero) coefficients plus noise will not exceed thethreshold level λ.
(iii) Bayes shrinkage ruleThis shrinkage rule uses a Bayesian mathematical
frame work for images to derive subband dependentthresholds [28]. The formula for the threshold on agiven subband s for the model, with zero mean variableX, is given by
(13)
where σn, the estimated noise variance found as themedian of the absolute deviation of the diagonal detailcoefficients on the finest level (sub band HH1), is givenby
(14)
σx, the estimated signal variance on the subband con�sidered, is given by
(15)
and , an estimate of the variance of the observa�tions, is given by
(16)
in which Ns is the number of the wavelet coefficientsWk on the subband considered. In the Eq. (14), thevalue 0.67452 is the median absolute deviation of nor�
λ σ 2 M( )log .=
σ2 1N��� Xj( )2
.
j 0=
N 1–
∑=
λsσn
2
σx
����,=
σnmedian Xij HH1∈{ }( )
0.67452�����������������������������������������������,=
σx Max σy2 σn
2– 0,( ),=
σy2
σy2 1
Ns
���� Wk2,
k 1=
Ns
∑=
mal distribution with zero mean and unit variance.When (σn/σx) � 1, the signal is much stronger than thenoise. The normalized threshold is chosen to be smallin order to preserve most of the signal and remove thenoise. When (σn/σx) � 1, the noise dominates the sig�nal. The normalized threshold is chosen to be large toremove the noise more aggressively.
5. IMAGE QUALITY EVALUATION
Image quality is important when evaluating or seg�menting ultrasound images, where speckle obscuressubtle details [33] in the image. Speckle, which is amultiplicative noise, is the major performance�limit�ing factor in visual lesion detection in ultrasoundimaging, which makes the signal or lesion difficult todetect. In a recent study [34, 35], we have shown thatspeckle reduction improves the visual perception ofthe expert in the assessment of ultrasound imaging ofhuman organs. Differences between the original imageX and the denoised image Y were evaluated using thefollowing image quality and evaluation metrics, whichwere used as statistical measures. The basic idea is tocompute a single number that reflects the quality ofthe denoised image [33]. The following measures,which are easy to compute and have clear physicalmeaning, were computed.
Noise Variance: It determines the contents of thespeckle in the image. A lower variance gives a cleanerimage as more speckles are reduced. The formula forcalculating the variance σ is
(17)
Mean Square Error (MSE): The MSE measuresthe quality change between the original image (X) anddenoised image (Y) and is given by
(18)
The MSE has been widely used to quantify imagequality and, when used alone, it does not correlatestrongly enough with perceptual quality. It should beused, therefore, together with other quality metricsand visual perception.
Signal�to�Noise Ratio (SNR): The SNR comparesthe level of desired signal to the level of backgroundnoise. The higher the ratio, the less obtrusive the back�ground noise is. It is expressed in decibels (dB) as
(19)
where, is the variance of the original image and
is the variance of error (Difference between theoriginal and denoised image). Brighter regions have a
σ 1N��� Xj
2.
j 0=
N 1–
∑=
MSE 1N��� Yj Xj–( )2
.
j 0=
N 1–
∑=
SNR 10σg
2
σe2
����⎝ ⎠⎜ ⎟⎛ ⎞
,10log=
σg2
σe2

308
PATTERN RECOGNITION AND IMAGE ANALYSIS Vol. 20 No. 3 2010
HIREMATH et al.
stronger signal due to more light, resulting in higheroverall SNR.
Peak Signal�to�Noise Ratio (PSNR): The PSNR iscomputed as
(20)
where S is the maximum intensity in the originalimage. The PSNR is higher for a better�transformedimage and lower for a poorly transformed image. Itmeasures image fidelity, that is, how closely the trans�formed image resembles the original image.
Correlation Coefficient (CC): It represents thestrength and direction of a linear relationship betweentwo variates. The best known is the Pearson productmoment correlation coefficient, which is obtained bydividing the covariance of the two variables by theproduct of their standard deviation, as given in
PSNR 10 S2
MSE����������⎝ ⎠
⎛ ⎞ ,10log=
CC = (21)
If the correlation coefficient is near to +1, thenthere exists stronger positive correlation between theoriginal and despeckled image.
6. EXPERIMENTAL RESULTSAND DISCUSSION
The experimentation is carried out on 52 ultra�sound images of size 512 × 512, of kidney, using pro�posed despeckling method based on wavelet transformand common speckle filters like Kuan, Lee, andWiener filter. These images are acquired using theinstrument GE LOGIQ 3 Expert system with 5�MHztransducer frequency, in JPEG format. Some sampleimages of kidney are shown in the Fig. 1.
N XiYi Xi Yi∑∑–∑N Xi
2 Xi∑( )2–∑ N Yi
2 Yi( )2–∑������������������������������������������������������������������������ .
Lt Kidney
Rt Kidney
(a) (b)
Fig. 1. Sample ultrasound images (a) and (b) Kidney.
0.04
0.03
0.02
0.01
0
db1
db5
coif
1
coif
2
coif
5
sym
1
sym
3
sym
5
bio
r2.2
bio
6.8
Var
Variance
Fig. 2. Statistical features Variance for different wavelet fil�ters.
77.00
db1
db5
coif
1
coif
2
coif
5
sym
1
sym
3
sym
5
bio
r2.2
bio
6.8
PSNR
PSNR
76.99
76.90
76.85
76.80
76.75
76.70
76.65
Fig. 3. Statistical feature PSNR for different wavelet filters.
PATTERN RECOGNITION AND IMAGE ANALYSIS Vol. 20 No. 3 2010
VISUAL ENHANCEMENT OF DIGITAL ULTRASOUND IMAGES 309
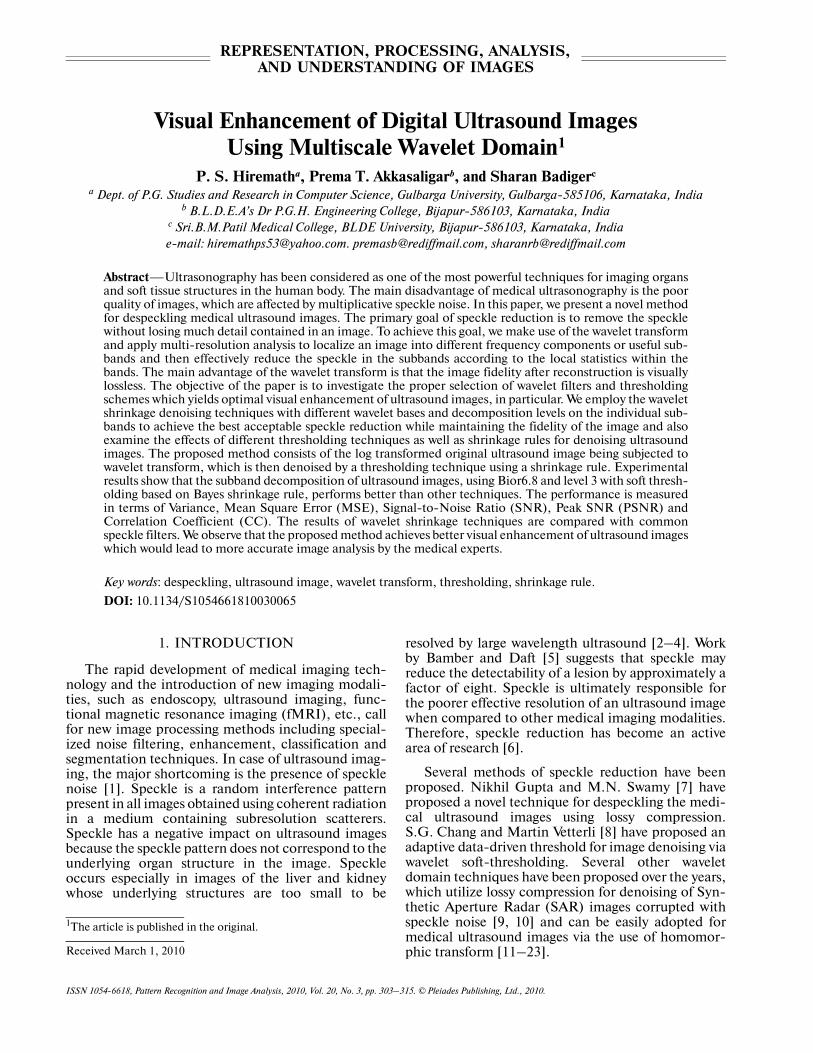
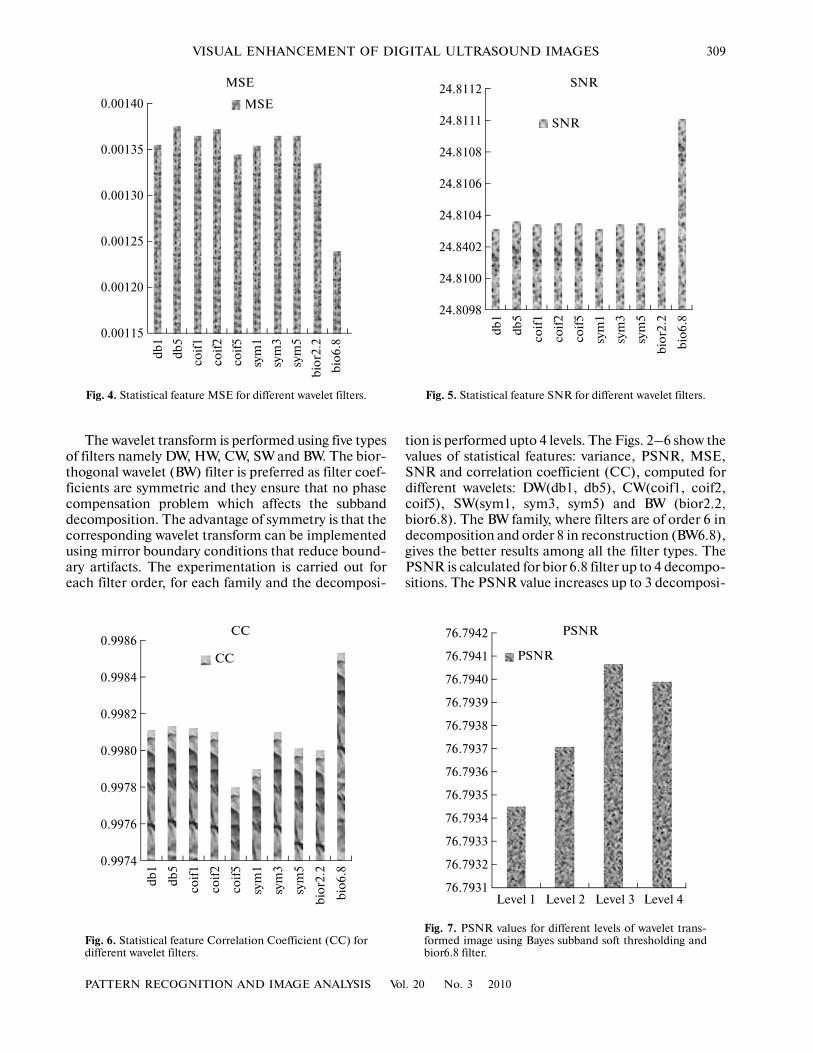
The wavelet transform is performed using five typesof filters namely DW, HW, CW, SW and BW. The bior�thogonal wavelet (BW) filter is preferred as filter coef�ficients are symmetric and they ensure that no phasecompensation problem which affects the subbanddecomposition. The advantage of symmetry is that thecorresponding wavelet transform can be implementedusing mirror boundary conditions that reduce bound�ary artifacts. The experimentation is carried out foreach filter order, for each family and the decomposi�
tion is performed upto 4 levels. The Figs. 2–6 show thevalues of statistical features: variance, PSNR, MSE,SNR and correlation coefficient (CC), computed fordifferent wavelets: DW(db1, db5), CW(coif1, coif2,coif5), SW(sym1, sym3, sym5) and BW (bior2.2,bior6.8). The BW family, where filters are of order 6 indecomposition and order 8 in reconstruction (BW6.8),gives the better results among all the filter types. ThePSNR is calculated for bior 6.8 filter up to 4 decompo�sitions. The PSNR value increases up to 3 decomposi�
0.00140
db1
db5
coif
1
coif
2
coif
5
sym
1
sym
3
sym
5
bio
r2.2
bio
6.8
MSE
0.00135
0.00130
0.00125
0.00120
0.00115
MSE
Fig. 4. Statistical feature MSE for different wavelet filters.
24.8112
db1
db5
coif
1
coif
2
coif
5
sym
1
sym
3
sym
5
bio
r2.2
bio
6.8
SNR
SNR
24.8111
24.8108
24.8106
24.8104
24.8402
24.8100
24.8098
Fig. 5. Statistical feature SNR for different wavelet filters.
0.9986
db1
db5
coif
1
coif
2
coif
5
sym
1
sym
3
sym
5
bio
r2.2
bio
6.8
CC
0.9984
0.9982
0.9980
0.9978
0.9976
0.9974
CC
Fig. 6. Statistical feature Correlation Coefficient (CC) fordifferent wavelet filters.
76.7942
PSNR76.7941
76.7940
76.7939
76.7938
76.7937
76.7936
76.7935
76.7934
76.7933
76.7932
76.7931Level 1 Level 2 Level 3 Level 4
PSNR
Fig. 7. PSNR values for different levels of wavelet trans�formed image using Bayes subband soft thresholding andbior6.8 filter.

310
PATTERN RECOGNITION AND IMAGE ANALYSIS Vol. 20 No. 3 2010
HIREMATH et al.
tions and thereafter reduces (Fig. 7). Hence, the opti�mal level of decomposition is 3. Higher filter orderdoes not imply better image quality, since the filterlength becomes the limiting factor for decomposition.The results obtained for the different thresholdingschemes are given in the table. In the Figs. 8, 9, thevarious images of the same object are represented tocompare the results of all possible combinations of
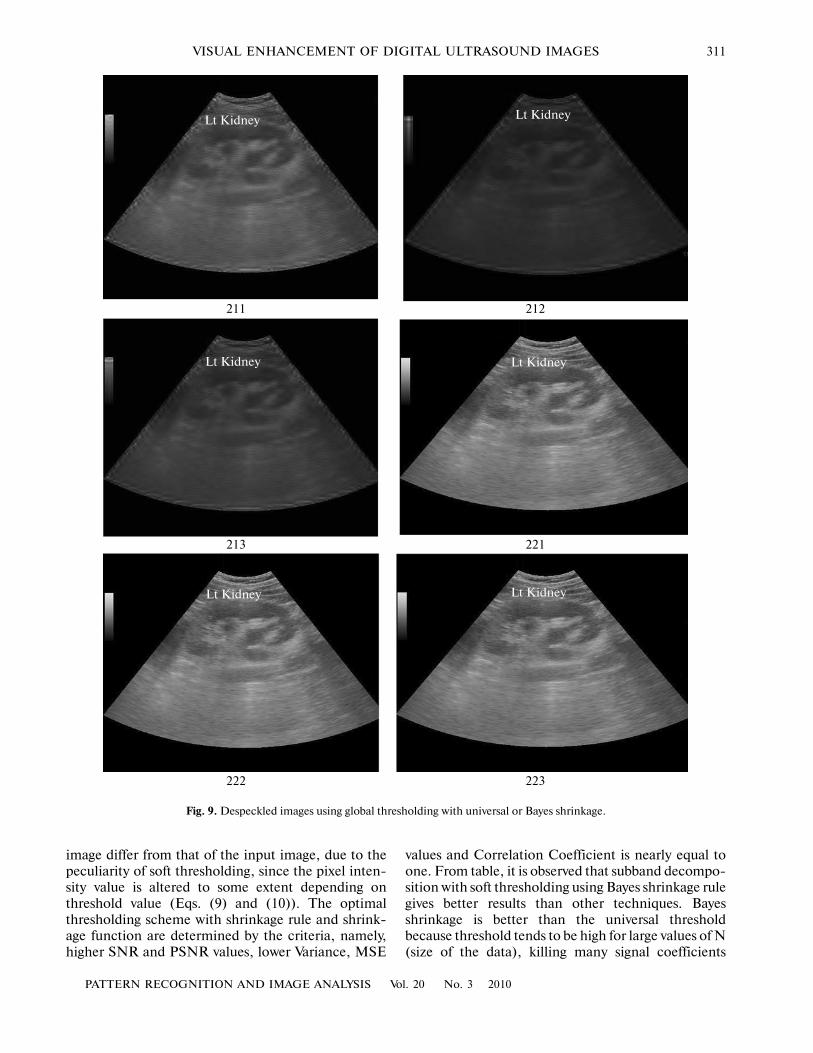
subband thresholding and global thresholding, respec�tively. The image label pqr in the Figs. 8 and 9 indicatesthe global and subband thresholding (p), Bayes or uni�versal shrinkage rule (q) and the hard, soft or semisoftthresholding function (r) employed to generate thatimage. The values of p, q, r are indicated in paranthe�ses against each of these schemes in the table. In theFigs. 8, 9, the brightness and contrast of the output
Lt Kidney Lt Kidney
Lt Kidney Lt Kidney
Lt Kidney Lt Kidney
111 112
113 121
122 123
Fig. 8. Despeckled images using subband thresholding with universal or Bayes shrinkage.
PATTERN RECOGNITION AND IMAGE ANALYSIS Vol. 20 No. 3 2010
VISUAL ENHANCEMENT OF DIGITAL ULTRASOUND IMAGES 311
image differ from that of the input image, due to thepeculiarity of soft thresholding, since the pixel inten�sity value is altered to some extent depending onthreshold value (Eqs. (9) and (10)). The optimalthresholding scheme with shrinkage rule and shrink�age function are determined by the criteria, namely,higher SNR and PSNR values, lower Variance, MSE
values and Correlation Coefficient is nearly equal toone. From table, it is observed that subband decompo�sition with soft thresholding using Bayes shrinkage rulegives better results than other techniques. Bayesshrinkage is better than the universal thresholdbecause threshold tends to be high for large values of N(size of the data), killing many signal coefficients
Lt Kidney
211 212
Lt Kidney
Lt Kidney Lt Kidney
Lt Kidney Lt Kidney
213 221
222 223
Fig. 9. Despeckled images using global thresholding with universal or Bayes shrinkage.

312
PATTERN RECOGNITION AND IMAGE ANALYSIS Vol. 20 No. 3 2010
HIREMATH et al.
along the noise. The magnitude of the signal relatedwavelet coefficient would increase with lower levels ofwavelet decomposition as energy is compact to a fewlarger coefficients. The energy of the speckle noise willalso increase with these coefficients as the noise vari�ance varies to adapt to the fast growing coefficients.
Hence, the threshold level must increase gradually toremove the speckle while retaining the larger coeffi�cients intact (Fig. 11). The Fig. 10 shows the perfor�mance comparison of proposed method based onwavelet filter with other common speckle filters,namely, Kuan, Lee and Wiener filters. The statistically
Lt Kidney Lt Kidney
Lt Kidney Lt Kidney
Lt Kidney
(a) (b)
(c) (d)
(e)
Fig. 10. (a) Original image. The despeckled images using different filters (b) Kuan, (c) Lee, (d) Wilner (3X3), and (e) Waveletfilter (bior6.8 with level 3).

PATTERN RECOGNITION AND IMAGE ANALYSIS Vol. 20 No. 3 2010
VISUAL ENHANCEMENT OF DIGITAL ULTRASOUND IMAGES 313
analyzed results are shown in Figs. 12–14. It isobserved that the wavelet filter (bior6.8 with level 3)yields better visualization effect and denoised imagethan the other common speckle filters.
7. CONCLUSIONS
In this paper, we have proposed a wavelet basedmethod for denoising medical ultrasound images. Theexperimentation is carried out on ultrasound images ofkidney. The experimental results show that wavelettransforms can denoise the speckle images more effec�
tively. The main advantage of the wavelet transform isthat the image fidelity after reconstruction is visuallylossless. Further, it is found that the wavelet filter bior6.8 with level 3 yields better results than other filters.The performance evaluation of the proposed methodis done in terms of Variance, MSE, SNR, PSNR andCC values computed from the despeckled image. It isobserved that subband threshold function, using Bayesshrinkage rule and soft thresholding technique, givessuperior results than other thresholding techniques.The reconstruction using Bayes shrink is smoother andmore visually enhanced than the one obtained using
0.00006
0.00005
0.00004
0.00003
0.00002
0.00001
0
db1
db5
coif
1
coif
2
coif
5
sym
1
sym
3
sym
5
bio
r2.2
bio
6.8
L1L2L3L4
Fig. 11. Threshold value for wavelet coefficients of differ�ent wavelet filter upto 4 levels.
90
Weiner Kuan Lee WT
80
70
60
50
40
30
20
10
0
SNRPSNR
Fig. 12. Statistical features PSNR and SNR for commonspeckle filters (Wiener, Lee, Kuan) and Wavelet filter(bior6.8 with level 3) (WT).
0.06
Weiner Kuan Lee WT
MSE
Variance
0.05
0.04
0.03
0.02
0.01
0
Fig. 13. Statistical features Variance, MSE for commonspeckle filters (Wiener, Lee, Kuan) and Wavelet filter(bior6.8 with level 3) (WT).
1
Weiner Kuan Lee WT
СС
0.998
0.996
0.994
0.99
0.988
0
Fig. 14. Statistical features Correlation Coefficient(CC)for common Speckle filters (Wiener, Lee, Kuan) andWavelet filter (bior6.8 with level 3) (WT).
314
PATTERN RECOGNITION AND IMAGE ANALYSIS Vol. 20 No. 3 2010
HIREMATH et al.
universal threshold. The results of proposed methodare compared with common speckle filters, namelythe Kuan, Wiener and Lee filters. The proposed meth�odology, based on despeckling using wavelet domain inultrasound systems, is expected to be more useful inwireless telemedicine systems.
ACKNOWLEDGMENTS
The authors are grateful to the reviewers for theirhelpful comments which improved the quality of thepaper to a greater extent. Further, authors are thankfulto Dr. Ramesh Mankare, Radiologist, SangameshwarScanning Centre, Bijapur, Karnataka, for providingthe ultrasound images of liver and kidney, and also forhelpful discussions.
REFERENCES
1. Paul Suetens, Fundamentals of Medical Imaging, 1st ed.(Cambridge university, U.K., 2002), pp. 145–182.
2. J. W. Godman, “Some Fundamental Properties ofSpeckle,” J. Opt. Soc. Am. 66 (11), 1145–1149 (1976).
3. C. B. Burckhardt, “Speckle in Ultrasound B�ModeScans,” IEEE Trans. Sonics Ultrasonics 25, 1–6(1978).
4. R. F. Wagner, S. W. Smith, J. M. Sandrik, and H.Lopez, “Statistics of Speckle in Ultrasound B�Xcans,”IEEE Trans. Sonics Ultrasonics 30, 156–163 (1983).
5. J. C. Bamber and C. Daft, “Adaptive Filtering forReduction of Speckle in Ultrasound Pulse�Echoim�ages,” Ultrasonics, 41–44 (1986).
6. T. Iwai and T. Asakura, “Speckle Reduction in Coher�ent Information OP,” Proc. IEEE 84 (5) (1996).
7. Nikhil gupta and M.N. Swamy, “Despeckling of Medi�cal Ultrasound Images Using Data and Rate AdaptiveLossy Compression,” IEEE Trans. Med. Imaging 24(6), 682–695 (2005).
8. S. G. Chang Bin Yu and Martin Vetterli, “AdaptiveWavelet Thresholding for Image Denoising and Com�
pression,” IEEE Trans. Image Processing 9 (9), 1532–1546 (2000).
9. M. Mastriani and A. E. Giraldez, “Smoothing of Coef�ficients in Wavelet Domain for Speckle Reduction inSynthetic Aperture Radar images,” in GVIP SpecialIssue on Denoising, 2007, pp. 1–8.
10. Sofia Ben Jebara, Zied Bel Hadj, and Hedi Maatar,“Combined Predictive and Multiresolution Schemesfor Speckle Reduction in Radar Images,” in 6th IEEEInternational Conference on Electronics, Circuits andSystems, 1999, Vol. 2, pp. 965–968.
11. S. G. Chang et al., “Bridging Compression to WaveletThresholding as a Denoising Method,” in Proc. Conf,Information Sciences System, Baltimore, MD., 1997,pp. 568–573.
12. Liu and P. Moulin, “Complexity—Regularized ImageDenoising,” in Proc. IEEE Int. Conf. Image Processing,1997, Vol. 2, pp. 370–373.
13. Mohamad Forouzanfar and Hamid Abirshami Moghad�dam, “Ultrasound Speckle Suppression Using Heavy�Tailed Distributions in the Dual�Tree Complex WaveletDomain,” in Waveform Diversity and Design, 2007,pp. 65–68.
14. Ali S. Saad, “Simultaneous Speckle Reduction andContrast Enhancement for Ultrasound Images: Wave�let Versus Laplacian Pyramid,” Pattern RecognitionImage Analysis 8 (1) (2008).
15. H. Rabbani, M. Vafadust, et al., “Speckle NoiseReduction of Medical Ultrasound Images in ComplexCavelet Domain Using Mixture Priors,” IEEE Trans.Biomed. Eng. 55 (9) (2008).
16. Alin Achim Anastasios Bezerianos and PanagiotisTsakalides, “Novel Bayesian Multiscale Method forSpeckle Removal in Medical Ultrasound Images,”IEEE Trans. Med. Imaging 20 (8), 772–783 (2001).
17. Xuli Zong et al., “Speckle Reduction and ContrastEnhancement of Echocardiograms via MultiscaleNonlinear Processing,” IEEE Trans. Med. Imaging 17(8), 332–540 (1998).
18. Hui Cheng and Wei Tang, “A Robust Denoising forMedical Ultrasound Image Based on SVR Estimationin Wavelet Domain,” 2nd International Conference on
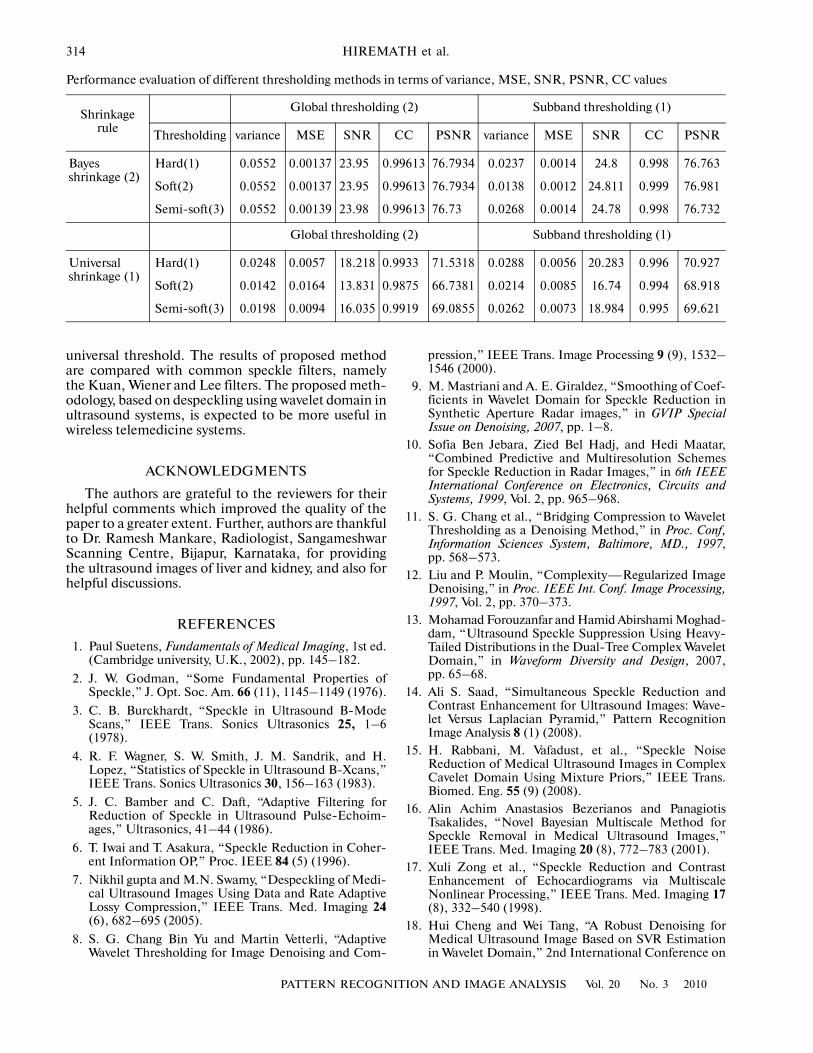
Performance evaluation of different thresholding methods in terms of variance, MSE, SNR, PSNR, CC values
Shrinkage rule
Global thresholding (2) Subband thresholding (1)
Thresholding variance MSE SNR CC PSNR variance MSE SNR CC PSNR
Bayesshrinkage (2)
Hard(1) 0.0552 0.00137 23.95 0.99613 76.7934 0.0237 0.0014 24.8 0.998 76.763
Soft(2) 0.0552 0.00137 23.95 0.99613 76.7934 0.0138 0.0012 24.811 0.999 76.981
Semi�soft(3) 0.0552 0.00139 23.98 0.99613 76.73 0.0268 0.0014 24.78 0.998 76.732
Global thresholding (2) Subband thresholding (1)
Universal shrinkage (1)
Hard(1) 0.0248 0.0057 18.218 0.9933 71.5318 0.0288 0.0056 20.283 0.996 70.927
Soft(2) 0.0142 0.0164 13.831 0.9875 66.7381 0.0214 0.0085 16.74 0.994 68.918
Semi�soft(3) 0.0198 0.0094 16.035 0.9919 69.0855 0.0262 0.0073 18.984 0.995 69.621
PATTERN RECOGNITION AND IMAGE ANALYSIS Vol. 20 No. 3 2010
VISUAL ENHANCEMENT OF DIGITAL ULTRASOUND IMAGES 315
Bioinformatics and Biomedical Engeneering (ICBBE�2008), May, 2008, pp. 2624–2627.
19. P. S. Hiremath, T. A. Prema, and Sharan Badiger, “Per�formance Evaluation of Wavelet Based Thresholdingfor Despeckling Medical Ultrasound Images,” in Pro�ceedings of the International Conference on Cognitionand Recognition, 2008, pp. 574–579.
20. P. S. Hiremath and T. A. Prema, “Comparison of Wave�let Based Despeckling of Medical Ultrasound Images,”in Proceedings of International Conference ACVIT�07,2007, pp. 1026–1033.
21. P. S. Hiremath, T. A. Prema, and Sharan Badiger, “AnOptimal Wavelet Filter for Despeckling Echocardio�graph Images,” in Proceedings of International Confer�ence ICCIMA�2007, 2007, Vol. 3, pp. 245–249.
22. S. Sudha, G. R. Suridesh, et al., “Speckle NoiseReduction in Ultrasound Images using Context�BasedAdaptive Wavelet Thresholding,” IETE J. Res. 55 (3)(2009).
23. S. Kalaivani, N & R. S. D Wahidabanu, “A View onDespeckling in Ultrasound Imaging,” Int. J. SignalProcessing, Imaging Processing and Pattern Recogni�tion 2 (3), 85–98 (2009).
24. I. Daubechies, Ten Lectures on Wavelets (SIAM, Phila�delphia, PA, 1992).
25. S. Mallat, “A Theory of Multiresolution Signal Decom�position: The Wavelet Representation,” IEEE Trans.Pattern Anal. Machine Intell. 11, 674–693 (1989).
26. S. Mallat, “Multifrequency Channel Decomposition ofImages and Wavelet Models,” IEEE Trans. Acoust.Speech, Signal Processing 37, 2091–2110 (1989).
27. R. C. Gonzalez and R. E. Woods, Digital Image Pro�cessing, 2nd ed. (Prentice Hall, Upper Saddle River,NJ, 2002), pp. 350–402.
28. K. P. Soman and K. I. Ramachandran, Insight intoWavelets from Theory to Practice, 2nd ed. (PHI PrivateLtd, 2005), pp. 48–142.
29. A. Cohen, I. Daubechies, and J. C. Feauveau, “Bior�thogonal Bases of Compactly Supported Wavelets,”Comm. Pure Appl. Math. 45, 485–500 (1992).
30. G. Sonja, G. Mislav, and Z. C. Branka, “PerformanceAnalysis of Image Compression using Wavelets,” IEEETrans., Indust. Elect. 48 (3), 682–695 (2001).
31. Stephane Mallat, A Wavelet Tour of Signal Processing,3rd ed. (Academic press, 2009), pp. 535–606.
32. D. L. Donoho, “Denoising by Soft�Thresholding,”IEEE Trans. Inform. Theory 41, 613–627 (1995).
33. C. P. Loizou, C. S. Pattichis, C. I. Christodoulou,R.S.H. Istepanian, M. Pantziaris, and A. Nicolaides,“Comparative Evaluation of Despeckle Filtering inUltrasound Imaging of the Carotid Artery,” IEEETrans. Ultras. Ferroel. Freq. Control. 52 (10), 653–669(2005).
34. A. N. Netravali and B. G. Haskell, Digital Pictures:Representation, Compression and Standards, 2nd ed.(Plenum, New York, 2000).
35. C. P. Loizou, C. S. Pattichis, M. Pantziaris, T. Tyllis,and A. Nicolaides, “Quality Evaluation of UltrasoundImaging in the Carotid Artery Based on Normalizationand Speckle Reduction Filtering,” in InternationalFederation for Medical and Biological Engineering,2006, pp. 414–426.
Dr. P. S. Hiremath, 1952, 1978Ph.D. in Applied Mathematics, Kar�nataka University, Dharwad, Karna�taka, India. 1973 M. Sci. in AppliedMathematics, Karnataka University,Dharwad, Karnataka, India. He hadbeen in the Faculty of Mathematicsand Computer Science of variousinstitutions in India, namely,National Institute of Technology,Surathkal (1977–1979), CoimbatoreInstitute of Technology, Coimbatore
(1979–1980), National Institute of Technology, Tiruchina�palli (1980–1986), Karnatak University, Dharwad (1986–1993) and has been presently working as Professor of Com�puter Science in Gulbarga University, Gulbarga (1993onwards). His research areas of interest are ComputationalFluid Dynamics, Optimization Techniques, Image Pro�cessing and Pattern Recognition. He has published115 research papers in peer reviewed International Journalsand proceedings of International Conferences.
Prema T. Akkasaligar, 1971, 1999M.E. in Computer Science andEngineering, Gulbarga University,Gulbarga, Karnataka, India. 1995Bachelor of Engineering in Com�puter Science, Karnataka University,Dharwad, Karnataka, India. Pres�ently working as Assistant Professorat BLDEA’s Dr. P.G. Halakatti Engi�neering College, Bijapur, Karnataka,India. Her research area are MedicalImage Processing and Neural Net�
works. 9 publications in International Conferences, Lifemember of Computer Society of India (CSI), The IndianSociety for Technical Education (ISTE), The Institution ofEngineers India (IEI), International Association of Com�puter Science and Information Technology (IACSIT). Sin�gapore.
Dr. Sharan Badiger, 1968, 1994MD in Internal Medicine, GulbargaUniversity, Gulbarga, Karnataka,India. 1989 MBBS, Gulbarga Uni�versity, Gulbarga, Karnataka, India.Presently working as Professor inDepartment of Medicine, Shri. B.M.Patil Medical College, Bijapur, Kar�nataka, India affiliated to RGUHSand BLDE University, Bijapur, Kar�nataka, India. His main researchinterests are in Echocardiography
and Imaging in Medicine. 6 publications in journals andconferences. Life Member of Association of Physicians ofIndia (APl), Cardiological Society of India(CSI), ResearchSociety for Studies Diabetes (RSSDI) India, Indian SocietyCardiology (ISC), International Association of ComputerScience and Information Technology (IACSIT), Singapore.