Village & Townwise Primary Census Abstract, Bathinda, Part XII
474
CE,NS'US OF INDIA 1991 SERIES-20 PUNJAB DISTRICT CENSUS HANDBOOK PART XII-A & B VILLAGE & TOWN DIRECTORY VILLAGE & TOWNWISE PRIMARY CENSUS ABSTRACT DH5T Director of Census Operations Punjab
-
Upload
khangminh22 -
Category
Documents
-
view
0 -
download
0
Transcript of Village & Townwise Primary Census Abstract, Bathinda, Part XII

CE,NS'US OF INDIA 1991 SERIES-20
PUNJAB
DISTRICT CENSUS
HANDBOOK PART XII-A & B
VILLAGE & TOWN DIRECTORY
VILLAGE & TOWNWISE PRIMARY CENSUS
ABSTRACT
DH5T ~CT ATM~N[j)A
Director of Census Operations Punjab

CENSUS OF INDIA-1991
A-CENTRAL GOVERNMENT PUBLICATIONS
The publications relating to Punjab bear Series No. 20 and will be published as follows
Part I-A
Part I-B
Part U-A and
Part U-B
Part HI
Part IV
Part V
Part VI
Part VII
Part VIII
Part IX-A
Part IX-B
Part IX-~C
Part X
Part XI
Part XII·A & n
Administration Report~Enumeration (for official use only).
Administration Report-Tabulation (for oflicial use only).
General Population Tables and
Primary Census Abstract
General Economic Tables
Social and Cultural Tables
Migration Tables
Fertility Tables
I
J Combined Volume
Tables on Houses and Household Amenities
Special Tables on Scheduled, Castes.& Scheduled Tribes
I Town Directory -
Survey Report on selected towns.
Survey Report on selected villages.
Ethnoraphic notes and special studies on Scheduled Castes and Scheduled Tribes.
Census Atlas
B-PUNJAB GOVERNMENT PUBUCATIONS
District Census Handbook for each dist'rict.
Part XII A-Village' and Town Directory.
Part XII B~ViIIage anti Townwise Primary Census Abstract.

CONTENTS
1. Foreword
2. Preface
3. Important statistic,', of t1Je dIstrict
4. Bathinda dlstrict- A 'lhorl profIle;
Location, Origin of name. Area. Ciimate, Topograj)hy, River and drains, Present jUflsdiction, Land utilisation. Agriculture. lrrigation, Animal Husbandry, Tenancy, InJustr}, Electriclt}, Minerals and Mming, Communication, Trade and Commerce, Forestry, Medkal and Public Health. Education, Occu~ation and Other miscelJaneous acttvities, Place of religious, historical and tourist interest
Annexure-Showing jUflsdictionaJ changes.
5. Introduction tv District Census Handbook :-
CONCEPT DEFINITIONS
RuraljUrban classification, Village, [own and l;rban Agg10mrratiol1.
6. Demographic analysis based on. Inset tables -
(a) Upon Primary Census Abstract Analysis based on Inset tables 1-10
(b) Upon Village Directory Analysis based on Inset t?bles 11-16
(e) t..:pon Town Directory AnalYSIS ba'5ed 0n inset tables 17-21
P ART XII A-VILLAGE A~D TOWN DIRECTORY
Section l! Village Directory
7. Note explaining the codes used m the Village Directory
8. Codes used in the A!phabetical1ist ofvilJages 1981 & 1991 Census (Manual & Computer Code<;)
(i) Alphabetical lIst of villages in
Phu! C.D. B:ock
Rampura C.D. Block
Bathinda C.D. Block
Nathana C.D . Block
. Sangat C.D. .B10ck
Talwandi Sabo C.D. Block
Jhumr C.D. B:ock
Budhlada C.D. Block
Mansa C.D. Block
(iii)
Pages
vii
ix
3
19
21
24-33
34-37
38-41
49
55
61
73
83
95
105
117
133
151
167

(ii) Village Directory
Pliul C.D. Block
Rampura C.D. Block
Bathinda C.D. Block
Nathana C.D. Block
Sangat C.D. Block
Talwandi Sabo C.D. Block
Jhunir
Budhlada
Mansa
C.D. Block
C.D. Block
C.D. 'Block
Appendix 1-4 (Village Directory)
Section Ii Town Directory
9. Codes usep in the Town Directory
Statement Status and growth history
Statement 11 Physical aspects and locatIOn of town-1989
Statement iII ... Municipal Finance 1988-89
Statement IV Civic and other amenities-I989
Statement IV(a) Civic and other amenities in notified slums-1989
Statement V '" Medical Education, Recreational and Cultural facilities-1989 ,
Statement VI ... Trade, Commerce, Industry and Banking-l 989
Appendix ... Towns showing their outgrowth with population
Part XU B-VILLAGE AND TOWNWISE PJHMARY CENSUS ABSTRACT
10. Explanatory note on Primary Census Abstract
Bathinda District
Phul C.D. Block
Rampura C.D. Block
Bathinda C.D. Bleok
Nathana C.D. Bleok
Sangat C.D. Block
Tillwandi Sabo C.D. Block
Jhunir C.D. Block
Budhlada C.D. Block
Mansa C.D. Block
11 Urban Prim8.[y Census Abstract
Appendix I : Deta.ils of CD Block included undr.r various I ahsils
12. Tahsilwise Primary Census Abstract
APpendix n: Enumeration Blockwise total population and Scheduled Caste population in urban area.
Annexure to Appendix: District Primary Census Abstract.
(iv)
P4ges
64
76
86
.98
108
122
138
156
112
1"8-2-209
215
220
222
224
226
229.
230
232
235
239 .244
260
270
280
294
304
314
328
346
364
378
405
406
415'
440
Maps:
District Bathinda ; Tahsil and C. D. block boundaries, roads/railway, towns by population SlZ-:, class, important villages, post and telegraph office, degree college and teohnical institution, rest house etc.
Tahsil Rampura Phul : Bo~ndaries of C. D. blocks: Phul and Rampura, village boundary, population size of villages, urban area, amenities, road/nlil way, important village rnandies etc.
Tahsil Bathinda : Boundaries of C. D. blocks Bathinda and Nathana, village boundary, population size of villages, urban areas, amenities, roads/railway, etc.
Tahsil Talwandi Sabo : Boundaries of C. D. Block Sangat and Talwandi Sabo, village boundary, population size of villages, urban areas, amenities, road/raiIwa'y ctc.
T~hsU Mansa : Boundaries of C. D. Blocks Mansa, Budblada and Jhunir, village boundary, population size of villages, urban areas, amenities roads/railway important village mandics etc.
(v)
Pages
Before Inner Title


FOREWORD
Puhli~a~ion OfCl" Di~tr;ct Cens.ls HaI:dhoOAS (DCHs) was mitialed after the 1951 Census and is cO!ltinuing "lnce then W:t:1 ~ome lll:lO\'c!til'l~s!modiflcdt:ons after each decennial Census. This is the most val:lahle district :~v..:: pl.blicatilm (Fought nut hy t:1e Cen~u~ Org&nisation en behalf of each State GO'l,ernment/ lIr..:on T~rri:,)') admin:.,tr J.:ion. It inter alia plo"ides data, :nfonn~t;on on some of the basic demographic an! SllCil)--:CI)flO'l1:c cllRra.:reri~tic,., and nn the availabiltt} of certain Important civic amemt:esJfacilities in each v'!Iage an..! (o~ n of the respecti\e districts. ThIs pubiicatton haS thus proved to be of immense utility to the p.U.lner<;, a.dministrators. academIcians and researd:ers,
fhe <;cope of the DCH waC; :nitially confined to certain important census tables on population, eCOn-3ffilC <ln~l ~~)Cio-cuimral a"rects as al\o the Pr:mmy Censu<; Abstract ,PCA) of each village and town (w,;,;·dv.i\c) nf th..- district. The Deli'> pUblJ"hed ..tft.:r t;le 1961 Ccnsu~ contained a descriptive account of the ,1l,,~riCl ad'1l:ni~,rati,e stclti~tic", .:-:n"(;S table,> and Village and Town Directorie5 including PCA. After t!1e : lI71 Cen"Ll". two parts of t:1C District c.::nsus Handbooks (Part-A comprising Village and Town Directories ,11:3 Palt-B comp::ising VIEagc .md To~n (PCA) 'A-ere released in all the States and Union Territories. The t 1.rd Part (e) of the District CenSuS Handbooks comprising administrative statistics and district cenSus Lblc'), which was also to be brought out could not be published in many States/DTs due to considerable delay III compilation of rei evant material. In 1981, ~ome new featur.'> alongwith the restructuring of the f~lrr.:lats of Village amI Town Directory were introduced in thc Dells. These were published in two parts for eaC1 d,'ltdct after the 19~1 Cens~s. While Part-A comprised Village and Town Directories, the peA of viiI ages and towns (ward-wi<;e) ir.c!uding Scheduled Caste and Scheduled Tribe PCA upto tehsi!jtown level were provided in Part-B. To illu.:>trate, all the amenities except electricity, were brougltt together in the Village Directory and if an J.menit)' was not aVUllab!e in the referrent village, the distance in broad ranges from the ne,irest pldce llavmg such amenity waS given. Information on some new items such as adult lIteracy centres, pr'n1ury health sub-centre'3 and comm].mity health workers in the village were provided so as to meet some of the requireme1ts of the Revised ~inimum ~eeds Programme. Similarly, information on approach 1O the village \'v'd'> also pfCIvidcd for the first time in the Vil!age Directory so as to give an idea about
Lho! n:1mber of maccessible villages in each district. In case uf Town Directorie~ also, keeping in vi fW the rey'u:rement<; of the Minimum Needs Programme, a Statem~nt IV-A on '3lums was provided so as to enable t:1C pJJ.nne~ to chalk out the prugramme,> for providing better civic and other amenities in the slums,. In tl,j\ statement details on c:vic and other amenities \\-ere reported for the slums of class I and Class II towns. Apart frl)m this, one column on tne Scheduled Castes and Scheduled Tribes population and another on adult literacy clJ.sses/ccntre:-. were added in Statements IV and V respecti\'ely.
The manner of prc!>entation of the DClls for the 1991 Census is by and large the Same as followed .n 19~1. rTn\\-cver, the forrnat of peA has been restructured slightly in the 1991 Census for the benefit of .lata :l~er~, ~i:J.e-foIJ lI1du.~trial .:1a;,siflcation of main workers has been given as against four-fold industrial 0lasslf~cation presented in t1e 191{ Census. In addition to this, the sex-wise population in the 0-6 age-group h.ts al'io b~ in.;hhleJ i:1 PC'\ for th~ fint tim: with a view to enabling data u,>ers to compute more realIstic literacy rate as all cnildren b~low 7 yeats of age haw b.:!en treated as illtnlte at the time of the 1991 Cen.,us. it IS expe.;tcd that t!J.~ a!J.:Jv ~ m~ntion:lJ m ):i!fH;ations will help the planners in chalking out mont effective developmental programmes.
One of the most important innovation..; in the 1991 Census is the Community Development Block level prescn~atiol1 of dat.! in the Village Directory and PCA instead of the traditional Tahsll/Taluk/PS level presentation. It is expeded that the presentation of VIllage Directory and PCA data at C. D. Block level will help the planner:-. in formulation of micro-level developmental plans, as the C. D. Block is the lowest Itdministrative unit for developmental planning.
(vii)

tn order to facilitate the task of administrators, planners and researchers intending to uSe Village birectory/PCA data, either from the maganetic tapes/floppies or from the published records, both the computer and manual codes for each village have been provided for the 1991 Census alongwitb the corresponding codes of 1981.
This publication is a joint venture of the State Government/UT administration and the Census Organisation. The data ,have been collect~d and compiled under the direction of Shri D. S. Jaspal 1. A. S., Director of CensuS Operations Punjab on behalf of the State Government which has borne the cost of printing. The task of planning, designing and coordination of the publication waS initiated by Dr. K. P. Ittaman, former Deputy Registrar-General (Social Studies) and Shri M. M. Dua, Joint Director. For the sake qf uniformity in presentation of information/data and for .preparation of analytical note pepicting the salient features emerging from a micro-level analySiS of Census/non-Census data, a model District Census Handbook from each State and Union Territory was thoroughly scrutinised in the Social Studies Division under the guidance of Bhri M. K. Jain, the preseNt Deputy Registrar General (S. S.). Tliis task was carried out by Shri A. K. Singh, Deputy Director who was assisted by Shri N. S. Soaro, Assistant Director and his staff. Technical guidance in the preparation of thy maps was initially provided by Di'. B. K. Roy, former Deputy Registrar General (Map) and later by Mrs. Minati Ghosh, the present Deputy Registrar General (Map).
I am thankful to. all thos.e who- have contributed to this project.
A.R..NANbA,
Registnfr General, India,
New t>elhi :
June. ·11, 199-2.

PREFACE
After completion of 1991 Census Operations in the State, the DCnB series is bemg brought as a compendium of official statistics and demographic profile of a district irl one single volume for easy reference. The publication is a joint venture of the State Government and the State Cen~!l" Organisation. It contains very useful information for u~e of pla'merc;, aJmmi'ltrator5, acade:nicians, re'ie3.r~hers and the public at large. For the district administration especidlIy it is a documentation of variou~ facts and figures of the district and would serve as a limited encyclopedia giving an insight into its social, cultural and demographl~ sl:cnario.
There are 120 towns and 12,795 villages constitutmg urban and rural component of th..: State ,respectively. The collection and compilation of the voluminous ddta presented in this volume was a formiddable task inasmuch as the follow up with the various governmental and n:m-govcrnmental agencies for obtailling the factual data relating to all aspect.:; of the district and the reconciliation itself constrained many a delays.
As a first measure, the schedules designed by the ORGI for collection of information from various agencies in the cural and urhan areas of each district had to b!! translated into Punjahi language and also test c!1ecked tt) asSeSS their acceptability and responsiveness by those who Were to be its uSerS. The data collected for the Town Directory has mostly come from the Chief Executives (Commissioners, Executive Officers/Secretaries) of urban local bodies and BDPOs for rural areas, we had it from the District Revenue agencies. The maps included in this publication give information on location of villages. !'>ize, class of population, urban spread and important infrastructure facilities available therein are based upon district/tahsil maps obtained from Directorate of Land Records, Punjab.
From the very beginning, the collectIon process was given impetus by issuing directions to the officers ahd staff of the Census Directorate, who had been supervising the training programm es for house~ listing and enumeration operations during 1991 Census to have additional responsibility in getting the schedules filled up through personal contacts with the coneerned fieJd officials. The task of collection of most of the information required for this volume had been over by April, 199) whereas, after reconciliatIOn of data, it continued pouring in up to September/October, 1991.
The data obtained from the field waS ')upplemented and cross c~ecked \vith the data of variotlS other departments at the State level, particularly, in relation to amenities and facilities m the field of education, medical, communications and the like, and with tll;:: computerisation of Primary Census Abstract (PCA) in December, 1992, important official statistics having become available for inclusion:n these series, Simultaneously one copy of the VIllage Directory was readied. Th<! data had, however, to be recast for presentation at CD block levels in keeping with the Instructions from RGI which is a novel feature of the 1991 DCHBs and a departure from the past practice. In order to quicken the relt:ase of PCA data to the u<.:ers, the compilation was manually done and later computerised with the help of Nati onal InformatIcs Centre, Punjab. During the course of computerisation of VIllage Directory, the format already prepared had to be revised as the break-up of area irrigated by each source was required to fit in with the computer software programming. This entailed both manual labour and extra time in recompIling and reconciling the data. The process of computerisation was quite a delicate task as it required number of revisions in the light of comparisons carried out with the copy of Village Directory manually prepared and printouts supplied by the NIC. But for this delay, the project would have since been completed.
The DCHB project waS initated under the able and dynamic guidance of Shri D. S. Jaspal. lAS, who assumed the charge of Director, Census Operations, Punjab, at a very crucial juncture, when State Government and district administration was under great pressure, due to critical law and ord er situations prevailing then. The grit and determination shown by the Director, Shri D. S. Jaspal not only galvanised and energised one and all in the CensuS Directorate but provided much needed inspiration to the State Government officials engaged in the census work to do their best to make 1991 Census a complete success. I expresS my deep sense of gratitude to him for having inspired all in this directorate for making us to march ahead in carrying out the arduous task of the field operations jn very difficult times.
(ix)

The collection of data which is being presented in the DCHB series, mainly Primary Census Abstract (PCA), is due to the efforts of thousands of State Government officials, especially teachers who worked at various levels for the twin operations of houselisting and actual census count under very difficult circum~
stances. Wh at is more, the data comprising the village and Town Directory is mainly due to the efforts of Revenue officials, Municipal staff and BDPO offices who took pains in filling up the detailed schedule of each village/town. To all of them, the census organisation owes its deep appreciation.
The computerisation of Village Directory and Primary Census abstract was made possible due to the unstinted cooperation and help of the National Informatics Centre, Punjab State Unit, Chandigarh. Shri A. K. Aggarwal, the State Informatics Officer and his staff members deserve our special thanks.
The Social Studies Division of the office of Registrar General, India provided much needed instant technical guidance in co-ordinating and initiating the project; Dr. K. P. Ittaman, ex-Deputy Registrar General (Social Studies. Division), Shri M. M. Dua, ex-Joint Director and the present DRG (SS), Shri M. K. Jain and his officers provided all along valueable instructions and it was they all who took pains in expeditiously clearing our model District Census Handbook. We owe our profound indebtedness to all of them.
Shri A. R. Nanda, lAS, former Registrar General and Census Commissioner, India was always forthcoming in providing inspiring guidance and leadership in the acompletion of the project in most difficult times. We owe him our deepest gratitude and regards. We are beholden to Dr. M. Vijayanunni, lAS, Registrar General and Census Commissioner of India who has been giving us a lot of encouragement in making it possible to send out the DCHBs quickly for immediate availability of data to all users.
I would resist the temptation of mentioning here any single incumbent at any level of the hierarchy individually for apparent reasonS and would rest content with acknowleding my debt to all of them as appended hereto. However, S/Shri Ajit Singh, Dy. Director, M. L. Sharma, Assistant Director, Mr. Malkiat Singh, lov. worked as a team to complete this project. I deeply appreciate the work done by them seeing through this excellent publication prepared by them.
Chan digarh : H. L. KALLA.
The 30th August, 1995 Deputy Director.
(x)

~aIkit Singh, Investigator
Balbir Singh, Statistical Assistant
Nannder Singh, Statls1ical Assistant
Harbeer Kaur, Statistical Assistant
Bunita Rani, Assi~tant Compiler
Madhav Sbyam, Research Officer (Map)
Tej Pal Singh, Cartographer
Jiwan Singh, Sr, Artist
Kulbir Singh, Artist
Jagjit Singh, Draftsman
Bali Ram, 0.0.
Bhagirath Singh, Investigator
loginder Singh, Statistical As:ristant
Satya Arora. Statistical Assistant
Harbeer KauT. Statistical ASsistant
M. K. Nagpal, Statistical Assistant
Rajpal Pathak, Computor
Joyti Puri ASSistant Compiler
Pawan KUmar, Sr. Steno
Ajit Singh, Daftri
ACKNOWLEDGEMENTS
DATA COMPILATION A~D PROCESSING
M. L. SHARMA, AD
PARS RAM, AD
DRAFTING
M. L. Sharma, Assistant Director
Joginder Singh, StatistIcal Assistant
'Mansha Ram, Statistical ASsistant
H. S. Sudan, Statistical Assistant
Raj Pal Pathak, Computor
Duni Chand, Assistant Compiler
MAPPING AND DATA REPRESENTATION
PROOF READING AND PRINTI~G
TYPING AND PHOTOSTATING
Surinderjit Singh, Sr. Geographer
Rupia Banerjee, Geographer
Usha Kalra, Artist
Hardeep Kaur, Statistical Assistant
Sangeeta Rahi, Draftsman
Meena. Rattan, Investigator
S. P. Goel, Statistical Assistant
H. S. Sudan. Statistical Assistant
Major Ram, Statistical Assistant
Santosh Kumari, Statistical Assistant
Shashi Arora, Assistant Compiler
Bina Garg Assistant Compiler
Viney Kumar, Assistant Compiler


IMPORTANT STATISTICS
STATE DJSTRICf
POPlllation TOTAL Persons 20,281,969 1,559,963
Males 10,778,034 829,849
Females 9,503,93.5 730,114
RURAL Persons 14,288,744 1,208,830
Males 7,569,423 642,590
Females 6,719,321 566,240
URBAN Persons ",993,225 35],133
Males 208,611 ]87,259
Females 784,614 163,874
Decennial Population Growth Rate 1981-91 +20.81 +19.57
Area (Sq. Km~.) 50,362 5,551
Density of Population (Per Sq. Kms.) 403 281
Sex Ratio (Number of Females Per 1000 Males) 882 880
Liter~cy Rate Persons_ i8.51 43.03 (Excluding children in age
65.66 group Q-.6) Males 50.55
Females 50.41 34.51
Percentage of Urban Population 29.55 22.51
to Total Pop,uhUion
Percentage to total population
(i) Main workers Persons .30.07 31.]5
, Males 54.12 56.10
Females 2.79 2.80
(ii) Marginfll workers, Persons Q.81 2.17
Males 0.10 0.17
Females 1.61 4.44
(iii) Non-workers. Persons f>9.12 66.68
Males 45.78 43.73
Females 95..6Q. 92.76
t1dii)
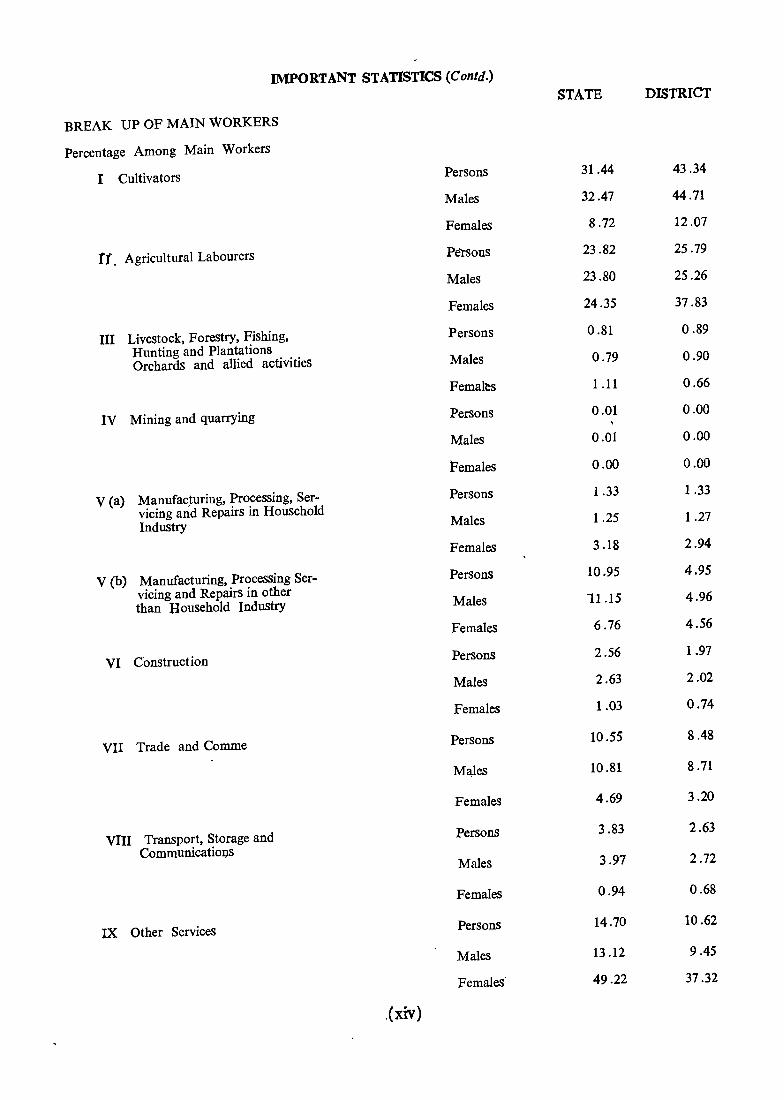
IMPORTANT STATISTICS (Contd.) STATE DISTRICT
BREAK UP OF MAIN WORKERS
Percentage Among Main Workers
I Cultivators Persons 31.44 43.34
Males 32.47 44.71
Females 8.72 12.07
rt. Agricultural Labourers P&sons 23.82 25.79
Males 23.80 25.26
Females 24.35 37.83
III Livestock, Forestry, Fishing, Persons 0.81 0.89
Hunting and Plantations Orchards and allied activities Males 0.79 0.90
Femates 1.11 0.66
IV Mining and quarrying Persons 0.01 0.00
Males 0.01 0.00
Females 0.00 0.00
V (a) Manufac~uring, Processing, Ser- Persons 1.33 1.33
vicing and Repairs in Household Industry Males 1.25 1.27
Females 3.18 2.94
V (b) Manufacturing, Processing Ser- Persons 10.95 4.95
vicing and Repairs in other than Household Industry Males 11.15 4.96
Females 6.76 4.56
VI Construction Persons 2.56 1.97
Males 2.63 2.02
Females 1.03 0.74
VII Trade and Comme Persons 10.55 8.48
Males 10.81 8.71
Females 4.69 3.20
VIII Transport, Storage and Persons 3.83 2.63
CommunicatiOJ~s Males 3.97 2.72
Females 0.94 0.68
IX Other Services Persons 14.70 10.62
Males 13.12 9.45
Females' 49.22 37.32
,(xiv)
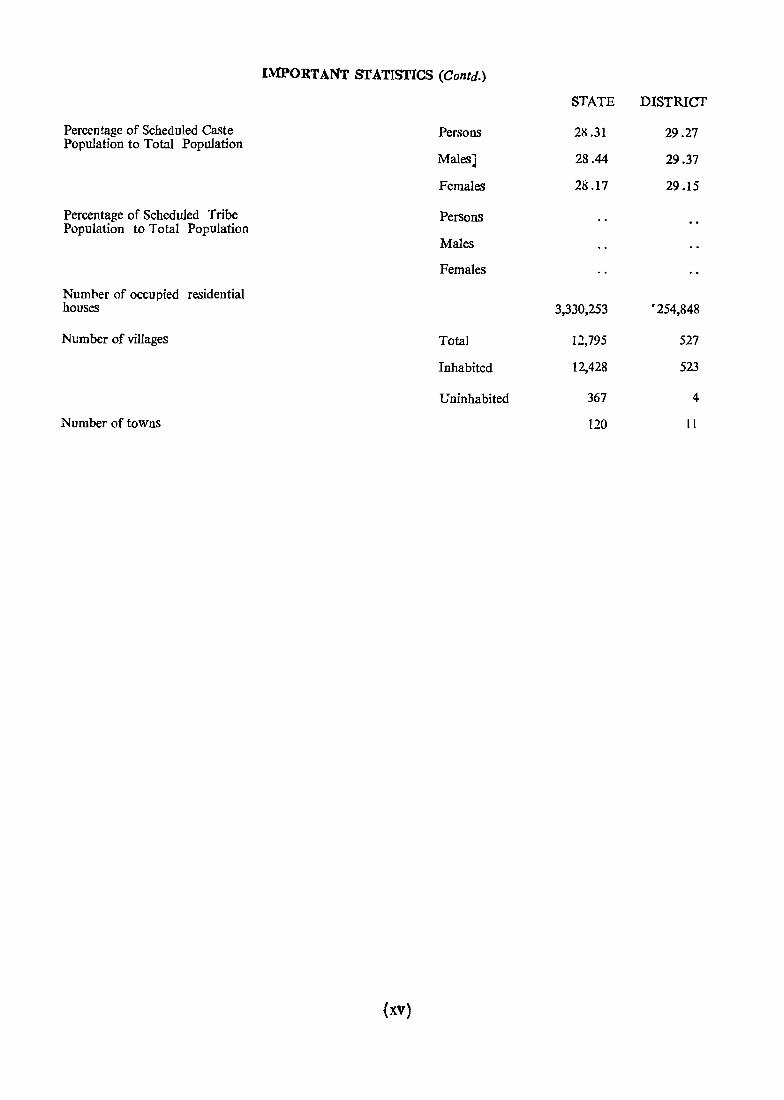
IMPORTANT STATISTICS (Contd.)
STATE DISTRICT
Percentage of Scheduled Caste Persons 28.31 29.27 Population to Total Population
Males) 28.44 29.37
Females 28.17 29.15
Percentage of Scheduled Tribe Persons Population to Total PopUlation
Males
Females
Number of occupied residential houses 3,330,253 r254,848
Number of villages Total 12,795 527
Inhabited 12,428 523
Uninhabited 367 4
Number of towns 120 11
(xv)


A..""lALYTICAL ~OTE

3
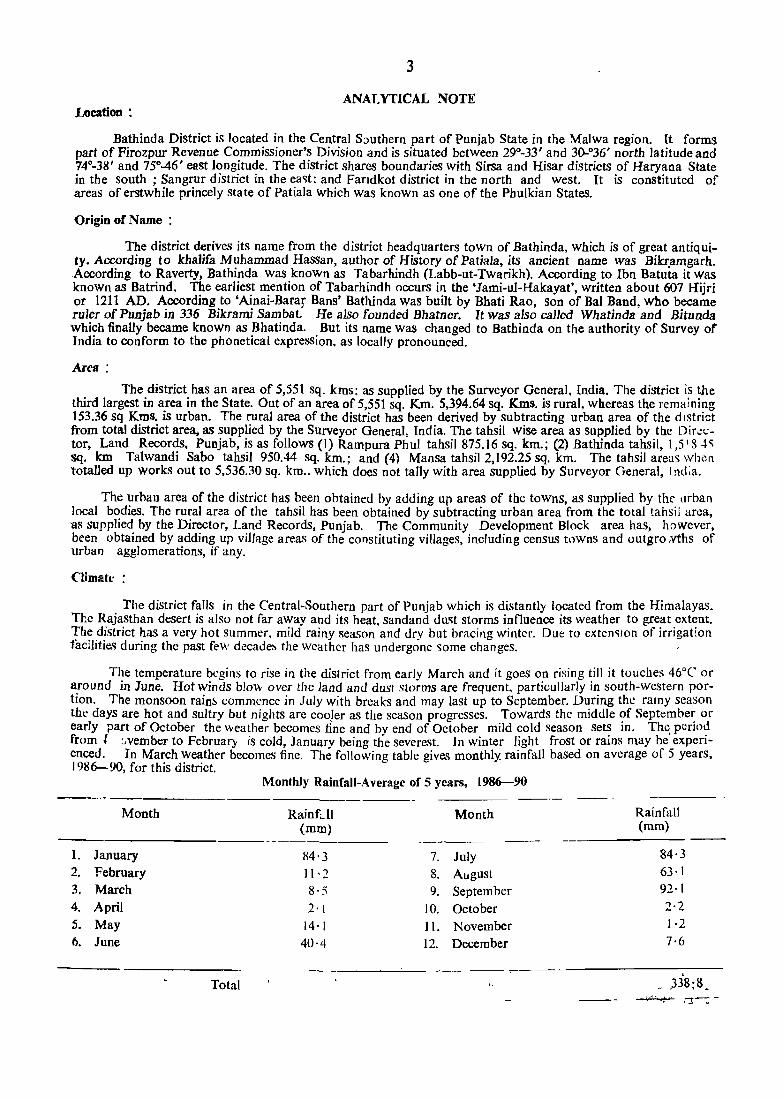
ANAT.YTICAL :SOTE LocatioD :
Bathinda District is located in the Central Southern part of Punjab State in the Malwa region. It forms part of Firozpur Revenue Commissioner's Division and is situated between 29°-33' and 3()...°36' north latitude and 74°-38' and 75°-46' east longitude. The district shares boundaries with Sirsa and Hisar districts of Haryana State in the south ; Sangrur district in the ea<;t; and Fandkot district in the north and west. It is constituted of areas of erstwhile princely state of Patiala which was known as one of the PhuIkian States.
Origin of Name:
The district derives its name from the district headquarters town of Bathinda, which is of great antiqui. ty. According to khaJifa Muhammad Hassan, author of History of Patiala, its ancient name was Bikr.amgach. According to Raverty, Bathinda was known as Tabarhindh (Labb-ut-Twarikh). According to Ibn Batuta it was known as Batrind. The earliest mention of Tabarhindh occurS in the 'Jami-nl-Hakayat', written about 607 Hijri or 1211 AD. According to 'Ainai-Barar Bans' Bathinda was built by Bhati Rao, Son of Bal Band, who became ruler of Punjab in 336 Bikrami Sam bat. He also founded Bhatner. It waS also cal1ed Whatinda and Bitunda which finally became known as Bhatinda. But its name was changed to Bathinda on the authority of Surveyor India to conform to the phonetical expression. as locally pronounced.
Ares:
The district has an area of 5,551 sq. kms; as supplied by the Surveyor General, India. The district is the third largest in area in the State. Out of an area of 5,551 sq. Km. 5,394.64 sq. Kms. is rural, whereas the remaining 153.36 sq Kms. is urban. The rural area of the district has been derived by subtracting urban area of the dIstrict from total district area, a~ supplied by the Surveyor General, India. The tahsil wise area as supplied by tlte Dir.!ctor, Land Records, Punjab, is as follows (1) Rampura Phul tahsil 875.16 sq. km.; (2) Bathinda tahsil, I,S I 8 4, sq. km Talwandi Sabo tahsil 950.44 sq. kID.; and (4) Mansa tahsil 2,192.25 sq. km. The tahsil areas whi!1l totalled up works out to 5,536.30 sq. km .• which does not tally with area supplied by Surveyor General, I nd;a.
The urban area of the district has been obtained by adding up areas of the towns, as supplied by the urban local bodies. The rural area of the tahsil has been obtained by subtracting urban area from the total tahsil area, -as supplied by the Director, Land Records, Punjab. The Community Development Block area has, however, been obtained by adding up village areas of the constituting villages, including census towns and outgro ,vths of urban agglomerations, if any.
Climate:
The district falls in the Central-Southern part of Punjab which is distantly located from the Himalayas. Tl:e Rajasthan desert is also not far away and its heat, sandand du~t stormS influence its weather to great extent. The district has a very hot summer, mild rainy season and dry but hracing winter. Due to exten<;lOn of irrigation facilities during the past few decade~ the weather has undergone 'lome changes. .
The temperature begins to rise in the district from early March and it goes on rising till it touches 46°C or around in June. Hot winds blow over the land and dust storms are frequent. particullarly in south-western portion. The monsoon rain~ commence in July with breaks and may last up to September. During the ramy season the days are hot and sultry but nights arc caoJer as the season progresses. Towards the middle ?f Septembe~ or early part of October the weather becomes fine and by end of Octo her mild cold season se~ m. Th~ peno~ from ~ Jvember to February is cold, January being the severest. In winter light frost or rams may be expenenced. In March weather becomes fine. The following table gives monthly. rainfall based on average of 5 years. 1986-90, for this district.
___ T
Month
1. January 2. February 3, March 4. April 5. May 6. June
Total
Monthly Rainfall-Average of 5 years, 1986-90
Rainfdl Month (rom)
84'3 7. July 1l'2 8. August 8·5 9. Septemher 2'1 10. October
14·1 11. November 40·4 12. December
Rainfall (mm)
84·3 63·1 92·1 2·2 }·2
7·6
, .338:8.
.... -... -
4
Topography * Bath!nda d~s~rict is a par~ of t~e.,Pu~Jab.Malw~ pla~n and. ~s. sub-?i~ide? in~o folJo~ing three micro-regions
on the basIs of sOlIs, topography; elIirl:Ue and naturAl vegetatIOn; whlcli ate bh~f1y descriBed below :-
(i) :Bafh'!1~~ Sahd~ ~Jain : Tlie .hlgidri ~p~ead.s o~eI' flie. paH~ of . ~athihda, Rampura. PhUl,. Talwandi Sabo and Mansa tahsJ\S. ~elhg ~aJ1dyp1~~n ~lie re~lOn IS dotted w~~.h , ~catteted. sand dunes which Have tendency to shift towards eastern side. The gedltigJcal stl:u~t-ure ~f this regIO~ l~ fotmea of <\lluvlUln and tIle main soils are coaro;e sandy loam to loam, grey or red desert sOIls which are Orthlds Fluvents, Ochrepts Psamments and psammentsFluvents-Orthids. The maximu_m height 220 ~etres is located near vill~ge Sooc~ of Rampura Phu1 tahsil and the U1iJlim~p1 hejght of 1. ~9 .met~~s ,l.s f9U~d near vIllage Sardargarh of Bathmda tahsIl. The natural vegetation includes Kikar, Ber; Neem ~n~ thorny bu~nes.
• Tt tas. ~.~r&_h~~~s of Iiiairl canaL namely ~atHitidg Branch, Musa i:lranch and Roila l:irarich (Sirhind camU)
and other dlstTiouiones.
(1) Rjlmpura -Miulsa Plain :tii.e re~tdrl sjjreadS byet t~e Hll:g~ parts <,>f .Rampura Phil!. Bathirldll and Mansa tahsils. this regioti COvers the hort~ and easterrt pbrflon ?f. lh,(!.~ISf~ic1:. ~hls .!~ a plai~ area dbtt'ea \VitIi sand tlunes which are largely conc~ntrated III the ~outh' rlear _g~rern,. Btl(fHIa~a lind MarlM toWiis. Tfie get:Jlogical structure of this region is consisted of AlluvlUm and malO sOils of thiS regIOn are coarse sandy-loam to loam and loam to silty-clay loam, which are classified as Psamments-Fluvents-Orthids and Ochrepts-Psamments. the maximum H.eiglii of 22.3 ro\llr~f, i~ fo.v._nd near, ,village. )lahadurpu: ... a~d . ~injro.um J:\eight. of 209 nit!tres is locrtted n~r vilIag~ BaJawala. of Man~ tahsil: the. na~ural ~e~etatlO.n . meludes, KiKar, Ber, Neem an4 thorny btlslies. It has BaThuida bl1l.nch, Kotla branch, Odat brancn and Blroke branch (Sirhind Canal) and other numerous distributories for irrigation.
(iii) Gha~ar Flood Plain: This r:egi?n extends over e'<.trem~ s?utherl_1 part of,M~nsa ta~sil. The Ohaggar river flows from east to west. The ~eologleal.strucJlIre of thls,regJOn consIsts of AllUVIUm ..tnd main soils are ustalfsOchrepts and Psamments-Fluvents-brthids. This tegion has a serious problem of wind erosion. the maximum height of 2,23 metre is found near "ilIag!:: Kahangarh and the IQwest height of 206 metre is located near village Mirpur Khas of Mansa tahsil. Being a [loQd plain villages are flooded during rainy season. It has Bhakra canal anti new Dhodlll branch (Sirhind canal) for irrigation. The natural vegetation includes Sbisham, Neem, Redes
and Sarka-nda.
Rivers ane Drains :
There is no major river flowing through the district. However, Ghagghr river flows through the dlstrict in Hie Mutl1erh tip of Mansa tahsil. There are some drains and canals which pass through this district. These
are briefly described below :-
Gbaggar: This is the main stream which traverses this district. It rises in the Sirmaur district.of Himacha, Pradesh and is known as Kaushalya in the upper reaches. After flowing through Himachal Pradesh, Ambala district of Ha".ryapa & Patiala & Sangrur districts of Punjab S~ate, it enters this district at village Moda HB No. 175 of tahsil Mansa aJ;d leaves this district at village Rorki, HB No. 188 of tahsil Mansa. After flowing througl} this district it enters Sirsa distrICt, Haryana, whe~e it is known as 'Nali'. Its bed is narrow and banks are lovl' and thus floods easily. Wh'en in flood it causes lot of damage in Mansa tahsil during the rainy season. The stream has been dammed at Dttu in Sirsa district in Haryana before it disappears in Rajasthan desert near Hanumangarh
(Rajasthan State).
Drains: The important drains design~d to control the floods in the district are Bareta Drain, th'e Sirhind Choe, the Bahadar Singh Wala Drain, the.Lasara Nala, the Chander Bhan Drain and the Mudki Golewala Drain.
Canals: The district is served by tWo canal system, the SirhinJ canal and the Bhakra canal. The main source of irrigation in the district is the Sirhind canal. All the three branches namely, the Abohar branch, the Bathinda oran"Cn arid the Kotla branch irrigate the district. The Bhakra canal system also serves the district
but a small area is irrigated.
1- resent Jurisdiction :
Bathinda district is sub-divided intd following four tahsils: (1) Bathinda tahsil, (2) Talwandi Sabo tAhSil.(3) Mansa tahsil and (4) Rampura Phtil Hlhstt. Each of the. above tahsils have since been upgraded as sub-divisions. Besides there are following three sqb:.tal!sits in the district (1) Nathana (Bathinda tahsil), (2) Sardulgarh and (3) Budblada (Mansa tahsil). The district is further sub-divided into following 9 community Jevelopmmt blocks (I) Bathinda (2) Nathana (in Bathinda ~sil), (3). ThlwCindi_ Sabo and (~L~a!}gat (in Ialwandi ~bB tahsil); (5) ManBa; (6) Budhlada; (7) Ihunir (in MaDsa tahsi!), (8) Rampura and -(9) Phul (in Ramputa-
Plll11 Tabsil).
5
Bathillda came into existence as a district with the formation of PEPSU (Punjab and Ea<;t Punj.tb States Union) in 1948. Bathinda and Mansa tahsils tiJJ then constituted part of erstwhile Patiala State, whereas Faridkot tahsil was part of erstwhile Faridkot State. As a result of internal changes affected in PEPSU between 1951-56 i.e. before reorg'lni~.ltion of PU'lj!].b, a p.)"tio'l of Phul tahsil was gained by thilJ district which was merged into Bathinda tahsil. On 6th August, 1959 this district gained Nathana subtahsil from Firozpur tahsil of Firozpur district. On 17th March, 1970 Bathinda tahsil gaim:d 6 villag~s from Muktsar tahsil of Firozpur district, whereas Rampura Phul tahsil ~ained 7 villages from Barnala tail~il of Sangrur district. On 17tb March, 1910., Rampura Phul Tahsil was carved out as the 4th tahsil of the district (It comprised 65 viIJages and Rampt ra Phu} town of Bathinda tahsil) and Bathinda tahsil gained 11 villages from Mansa tahsil. On 2nd June. 1971 the entire tahsil of Faridkot wa., tran~ferred to the neWly formed Faridkot district. One vitIage (Peori Hadbast No.6) wa'i tral1sferreJ f(.)m Bit HajJ tahsil t) Muk star 'tah_, II. Bathinda tahsil lost 9 villages to Mansa tahsil and 4 villages to Rampura Phui tahsil. On 12th April, 1979-Talwandi Sabo was carved out as the 4th tahsil of the district (It comprised sub-tahSil Talwandi Sabo and 28 viIlages of Bathinda tahsil and 17 vWages of Mansa tahsil. However, these sevel1teen villages were retransferred to Mansa tahsil on 12th July, 1979).
No jurisdictional change has been taken place in the district after 198 r Census as revealed by the Annexure given at the end of tbis chapter.
MAJOR CHARACTER1STICS OF THE D1STRI€T :
Land Utilisation :
In the year 1990'-91 against a geographical area of 555 thousand hectares, the area of the district as per village papers is 554 thousand hectares. Tile two sets of areas show difference due to different methods adopted fot measurement by two separate agencies. However, for the purpose of discussion in the succeeding pages we wilf refet to area as per village papers onty. It may be noted (hzt out of a total area of 554 thousand hectares as per viIJage paperS, 10 thousand hectares is under forests, I thousand hectare is barren and unculturable land, 29 thousand hectares is put to non-agricultural use, 15 thousand hectares is current fallow and 8 thousand hectares is other than current fallow. There are 491 thousand hectares 'Net Area Sown' in the district during 1990-91, Which is 88·63 per cent of total area. Further out of 491 thousand hectares of 'Net Area Sown', 347 thousand hectares is soWn more than onCe. Thus the total cropped area works out to 838 thousand hectares in the district duting 1990-91. which gives a crop intenSity of "170'67 per cent in the district.
Agriculture :
Batbinda district is mainly an agricultural district as 77·49 per cent of its popUlation is reported to be resldillg in the rural areaS during 1991 CensuS. Further agricultlt!J) alone engaged 69·13 per cent of its main workers during 199J Census (cultivators 43·34 per cent, agricultural labourers 25·79 per cent) .. The percentage of main workers engaged in agriculture during 1981 and 1971 Censuses was 68 ·92 per cent and 75·33 per cent, reSpectively. Thus it would be seen that agriculture provides the single largest source of employment in the district though decline is noticeable during the last few decade~.
There are two main crop seasons in a year; kharij (sauni) and rabi (hari). In between these two crop seasons additional crops are grown where conditions so permit. These are known as zaid-kharij and zaid-rabi. The kharij crops are, mainly rice, maize, bajra. sugarcane, cotton, oil seeds, pulses, etc. The rabi crops consist of Wheat, grain barley, some oil seeds, fodder crops etc. The principa) cash crops of the distrIct are Wheat, rice~ gtam, cotton, rapeseed and mustard.
Among the two crop sed':>on aTea un: er rabi is higher, as during 1990-91 the district reported an area of 4,62,000 hectares under rabi against 3,76,000 hectares under kharij. Further out of 8,38,000 hectares of total cropped area of district, 4,60,000 hectares and 3,78,000 hectares are reported under food ar..d non-food crops. respectively. Thus 45·1 I per cent of the total cropped area is. reported under non-food crops in the dj.~trict, which is the higheM percentage for any district in the State, the next highest being reported in Faridkot distIict (37'25 per cent) in the year 199()..91. Th,: bredk up of area under \fa:io!),> crops i,) the di5trict du.ring 1930-91 is as follows; (1) wheat 348·0 thousand hectares, (2) cotton 272·9 thousand hectares (American 256·4 thousand hectare DeSt 16·5 thousand hectares). (3) Rice 50' 0 thQusand hectares, (4) Gram 3:,·5 thO usand hectares, (5) Rapseed and Mustard 21 ·5 thousand hectares, (6) Moong 3· 82 thousand hectares, (7) Barely 3·5 thou<,and hectares, (8) Bajra 3 -0 thousand hectares, (9) Sugarcane 1 ·5 thousand hectare~, (10) Maize 1·0 thousand hectares, etc. Other crops of some significance are: groundnut (0· 3 thousand hectares.) Potatoes (0'3 thou'\lnd hec~ares) Dry Chillies (0'1 thousand hectares). etc. Th<;l crops which have reported notable increaSeS in area dUflilg the last decade are (l) Rice (50·0 thousand hect<rres in 1990-91 from 8·0 thousand hectares Wh~at
... (348·0 thous~_nd hectares in 1990-91 from 248'0 thousand hectares in 1980-81). (3) Cotton American (256·4 thousand hecfares in 199D-91 from 189·4 hectares in 1980-81) and (4) Moong (3'82 thousand hectares in 199()"91 fr,om {·54 thousano.heotares in 1980-81). The crops reporting deoJirre-ovel' the last decade are: ("I) Bajta (3 ·0' ~housand hectare in 19"90-9J from 23'6 thoill?3nd hectares)n 19So-g.~J(2) Mai2e (l·O thousand hectares ii, 1990-91 ftom 7-0 thouSand h~tares in 1980-81) (3) BarJey (3- 5 thou$and heCtares in 199t).9l< ftom 16·6 thousand
6
hectare<; in 1980-81),(4) Grams (35·5 lh ,u!!and hectares in 1990-91 fr, ,m 104'4 th lusand h~ctares in 1980-81), (5) Sugarcane (1,5 thousand hectares in 1990-91 from 2·0 thousand hectares in 1980-81) (6) Cotton Desi (16,5 thou<;and hectares in 199~-91 fr0U 2') 'i t~J'.15:l1'j h::c:tares in 1980-81) etc. Thus it would be Seen that whereas some crops have made gains in area others have shown decline due to f'xtension of irrigation faclities on t <' on ... h;·nd and climatic changes :)0 the other during [he Jast decade
I may be interestzng to note tha where< s net are", SOWJ.l shows rna 'ginal decline from 502 thou~and hl:c arr'S in IOiW-81 tn 49 :housand h :ctares in 1 190-91 the total ('ropped rea h s iwrt:ased from 783 tltousand he(; <lres In 1980-< I to 838 thousand Ill-ctares in 1990-9 [ in .he dl ,tricl The canal Irrigation on the one hl1ud and 'I w:ls [n tne Gh:wfTctr In .he other have d ':Cl-otualed t A mer '! Jf wat.:( log, llg Nhich fia .. ,dversly affected large. areaS in the dis.rict. Inspilt: of this the dist ·jct maintain., ~n important 110sition in agriculture il) the State
H"rticu[ture (<; :;uining popularity in tht dl~trict for the la~l tow 'c; 1"" Dl 'lg 1990-9', an arl'a of 3,8 [5 hectan.~ 'Was reo neo under various fruit treeS. The break up of areh uncleI' various fruits is as foil ,ws: (I) k'nnow, 1,462 hectares, (2) ~rapes 1,102 hectares, (3) Orangt: and Malta 51 llectaff's, (4) Ber 226 hectares. (5) Guava 155 h .... -:tars othel' mIscellaneous fruits 359 uectares. Tbe area under orcbards IS very limited due to various fact )"es such as hign temperature, st ,rmy wi..L' c' nditi LS. un'luitabllity f SI b-soii water f .r irrigation '1d inadt-..Juacy of Lilna[ water. Inspite of these limiting factors the district has reported sizeable area under grapes and kilnow. The area under grapes would have been much more had there been efficient arrangements for prOl:U I: nent of gra.oe5. The farmers had to make their own arqmgements for marketing these fruits. The grape farm.;·s have persistently demanded the setting up of some factory to process their produce to bring them rem unerat ve rcrurns from grapes, which require very delicate handling before disposal.
The vegetables are also grown in the djstrict but ,n a limited scale. An area of 2,674 hectare was repl -red under various vegetables during 1990-91. The break up of area is as follows. (1) Potat ·es 300 hectares, (2) S' t.d Potato 4 hectares, (3) Onion 77 hectares, (4) Winter vegetables 956 hectares and Summer vegetable 1337 hee .. r .. s. The dem<1l1o ror vegetables is pIcking up in the district as tbe urban t.entres have grown over the yea)!,. The establishment of variom colonies etc under various central and state projects have mcreased the dem; -1 !'~1 vegetables.
B( sides compost (I)oth urban and ruraI), cattlt. dung and green manures, chemical fertilisers are increas~ in~!ly being used in this district. During 1990·91, 1,07,000 t'mnes of chemical fertilizers, mainly nitrogenous (79,OJO tonnes) and Phosphdic (28,000 tonnes) were consumed in the district for growing improved vaneties of wheat, paddy surgarcane, cotton, etc. The farmers are. however, ·becoming conscious of the deleterious effects of reckless use of the chemical fertilisers in their farms. The fanlllng scientists are required to provide them with some alternative nutriative soil agents so that their crop yidds do not suffer.
Irrigation :
The mam sourceS of irrigatioft a t: the canals as the rains are low and erratic even during the monsoons. Also the sub-soil water is low and brackish, which is considered unsuitable for irrigation. Besides the canals, the government has sunk and energised tubewells (13,377 as on 31st March, 1991) which augment the SO'bln .. es of irriga.lon in the district Irrigation by well is also resorted to but to a limited extent The irrigation is done mainly from Sirhind canal (Bathinda branch, Musa branch, Kolla branch, Odat branch, Biroke branch and New Dhodal branch). But some areas are also also irrigated from Bhakra canal and other distributories (Dhar>ali, Phul, Gumman, Bangi, Bhadaur, Raonta, Joga Bhikhi and Sunam).
During 1980-81, the net area irrigated from all sourceS waS 3,71,000 hectares (govt. canals 3,21,800 hecta t:S, tubewells and wells 49,200 hectares) in the district. The percentage. of net area irrigated to net area sown was 73· 9 per cent. Also out of 7,83,000 hectares gross cropped area the gross irrigated area reported waS 6,51,900 hectares. Thus the percentage of gross irrigated area to gross cropped area worked out to 83·2 per cent for tHt: district during 1980-81.
However, during the year 1990-91 the net irngated area reported was 4,51,600 hectares, out of which 1,68,000 hectares is irrigated from government canals and 83,600 hectares is irrigated from tubewells and "'ells. Thus percentage of net area irrigated to net area SOWn worked out to 92,0 per cent for this district during 1990-91. Also during 1990-91 out of 8,38,000 hectares gross cropped area 7;86,000 hectares was irrigated. Thus tbe percentage of gross irrigated area to gross cropped area worked out to 93·9 per cent for Bathmda during 1990-91.
Thus it would be seen that the district reported an increase from 3,71,000. hectare in 1980-81 to 4,51,600 hectdrc.s in 1990-91 in the net irrigated area, whereas the increase in the gross irrigated area was from 6,51,900 hectare 10 7,86,600 hectares during the corresponding period. The percentage increase in net area irrigated is 21 . n per cent against 20· 66 per cent in gross irrigated area. Further it is revealed that net area irrigated increased more from canals than from tubewells and wells. This had been made possible by extension of canal network. Further the energisation of tubewells was also undertaken in the distric;t during the last decade Which resulted in an increase in the number of energised tubewells from 4,254 (on 31~3~1981) to 13,377 (on 31.~.1 ':J~ ). Howe er, j. .lay ~e noted that the distril. h ~ :he lowe Dlln;h.!r of energ,sed tubewells as compared to other districts of the State. This in a way is a big handicap for expansion of irrigation in the district.

7
Animal Husbandry :
Livestock continues to be a valuable possession of the farmers inspite of the fact that agricultural economy is heading towards mechanisation. The district can boast of a fairly rich cattle wealth. According to the 1990 livestock census there were 2,26,100 cattle, 4,05,300 buffaloes, 4,400 horses and ponies, 4,lOO d onkeys. 400 mules. 1,38,900 sheep, 94,300 goats, 34,400 camels, 4,100 pigs. total 9,12,000 animals. According to 1977 livestock census tIle fugures reported were 2,45,300 cattle; 2,73,900 buffaloes, 7,600 horses and ponies 4,800 donkeys, 500 mules. 1,29,900 sheep, 1,08,100 goats. 37,700 camels, 4,200 pigs, total 8,12,000 animals: A comparative study of the figures of two livestock cenSuses reveals that the total number of animals have increased from 8,12,000 in 1977 to 9,J~,000 in 1990 in the district. Whereas there is decline in the number of cattle from 2,45,300 in 1977 to 2,26,100 in 1990, there is an increase in the number of buffaloes from 2,73,900 in 1977 4,05,300 in 1990 in the district. Thus there is an overall increase from 5,19,200 to 6,31,200 of cattle and buff~loes during the co ·responding period in the district. The decline in the number of cattle is attributable to the mechanisation of agriculture and transportation which makes lesser demand of draught cattle. However, the ever-increasing demand of milk in the urban centres and the state has increased demand of milch buffaloes which are mainly of good breeds (murrah and nili), whereas there is an increase (1,29.000 in 1977 to 1,38,900 i~ 1990) in the number ofshccp, there is a corresponding decline (1,08,100 in 1977 to 94,300 in 1990) in the number of goa ts in the district during the period 1977-90.
The poultry birds have recvrded an IncreaSe from 1,75,300 birds in 1977 to 5,16,400 birds in 1990. The poultry farming is now being practised on "cientific lines, which is evident from the larg.! numher of poultry farms found in the district. This has been made possible due to acceptability of egg as a vegetdfian food.
In 1990-91 there were 74 veterinary hospitals, 73 veterinary dispensaries, 7 sheep wool extension centres and 3 poultry servIce centres in the district, wherein 70 veterinary officers and 185 veterinary ;:>harmacists were posted. In these institutions a total 1,94,082 cases were treated. Also 2,089 castrations were performed. Further 52,310 cows and 22,274 buffaloes were covered under the artificial insemination. As a re<;ult of the"e measures 18,645 (to cows) and 7,729 (to buffaloes) calves were born.
Tn order to pre vide good quality meat to the general public 1 I recognised slaughter houses were functioning in the district during 1990-91 where 30,287 animals (23,268 sheep and goats, 6,659 pigs) were slau_ghteredo
1 ·25 lakh litre capacity milk plant was located at Bathinda during 1990-91. It had 3 chilling centres attached to it. It not only collected milk from the villagers at the remunerative price but also processed and supplied IPilk and various milk products to the general public throughout the year at reasonable prices.
Pisciculture ha~ b.:~n tak.en up in a big way in the district. An area of 211 ·18 hectares wa~ .,tocked with fish wherein 21,53,750 thousand fil:gerlings were raised. An income of Rs. 37.000 accrued to thl.: fisheries department in the district during 1991. One Fish Seed Farm and I Fish Seed Nursery was located in the district. I n these 6· 17 lakh "L'cds were produced for distribution among the fish farmers of the d;stnct.
Tenancy:
The areaS now .:nnslituting this di~trict were earlier in Patiala state, where feudal institutions like Jagirdari and biswedari Y\ ere plcvalent which have since been abolished under various laml reform meawres introduccd after independence. As d result many occupancy tcnants have become proprietors. Similarly tenants at will who were able tv :->urc;mse land under the ldw al~o became proprietors. Also ceilings on land reSJl· ted in surplus lands, whic.l WeI.? distributed among the la,lJles5 cultivators on payment uf compensati'1n. Fx fear of being deprived of their land .ua:1Y landbrJs !11\"~ take:l to self-cultivation <1.1·1 :,ave introduced m.!~~:.ln:sation in agriculture in a big way. The far:nc·,) generally cultivate their land themselves or throug.l I>.:rl antS. This system is known as Khudka~ht (Self-cultivation), In ~ome cases the land is leased out to other marginal farmers or tenants on batai (sl1c.!re Croppillg) or theka (contract). The general rate of batai is one half, depending upon the provision of irrigation, fertilisers, etC. However, the rate of theka (contract) varies from tim.! to time depending upon the quality of land and the period of CO'1tract. AI) large number of farm;!!"; own tractors Some of them offer Sen Ice" for vanouS agricultural operations against cash payment. This ~y:item is gaining popUlarity in the rural area,>.
Agriculture is now being carried on commercial lines as ca<;h crops like cotton, paddy ar.; being raised in the farms with the hl'lr of contractual labour which i<; aVailable locally or from outside. This ha<;
imbibed scientific outlook mnon)! the f~l"mers \\ hich ha-.; resulted i11 1 J...) d-!v.:l. lpmcnt of a~riculture in the disl rieL
8
Indnsfi'I :
_ During the princety times thett! was not ~ueg: in'dustrial activity in the ~iStricti ~ll~~g~ i1tdu8tl i~ like handiooIl) weavrng, oil 'ex!ra~tiorl By' ~oo4en .~ohln~, . manufacture o~ agn~ul:urat I~ple~etf~. jUb makil'lg, ll'an itiaRing, gur ait9 sllakm- l1l1trrtifaetufe, eahco pnl1ting lind nhtllkan ~ak~ng Were In ~ogue In 1:he rnral areas. 'Durries itt. floral siesigns were manufacture<;f. in the urban centres lIke Bathi'nda, ~gmpura Phu), Marrsa,. etc. -Calico printing' was popular in Talwandi Sabo and Sardulgarh. There was a cblo1l1 of pottets ~t.®fiars) attBathinda whO' produced qUality' earthenware, especially surallis, Desi jilties (country shoes} 'of good quality' were ·~roduced at Mansa, nafhittda artd some other centres. Ban maKing was done af Bathh1da.. pbulkarieS. 'were ptdduced at Rampum Phu].
*
Ttre followiflt kinds' of industrial units in small scale sector are now located itt the distrfct ..
(1) CetWrl girtiting and' ptesSing (TIte distri~ is' tlie fargest cotton growing district in ttl ~ Sfmtf).
fly fvgf.ictHtur~< imple~entsr
(3) Sewing machines and parts (at Bathinda).
(4) Steel rerolling mill (at Rampura).
(5) Woo'd and machine screws.
(6} EJ:tcftic giJlJEJs.
(7) Radio transistors and sound equipment.
~&, C(M(iuU P'fI;€.
~} Plastic. go.o0&.
Among the medium and large scale industrial units- there has been quite an expansign. 'the various medium and la,rge scale units located in the district are ~s folIows ;-.
. (1) Fl~}¥ilr.~.A flo!!r. nrjff (l\ys B1ru~if!dta FIOlIr M~l P~iv~tel:td., BathiI1da) is the first larg~ scale- unrt o( art'! distrIct. It IS etigag~d 111' the pr(jceSSitlg of Atttt, MaIda, SfIjl, etc.
(2) • Milk ?1n'3trJ\ ~ilk p;lant _is: loc~e~ ¥.-Bathinda. if! the Jl1lbliG seater., J~ pl!lnt has ~ capa~ity tg pTQC~SS 1: 2.5 1~.l[ [itre of J.U1.~ daily during. 1990-91. It has 3- ehil{ing centres arrd mnnber of.. colleGtlOll centr~g. att.aGRed to.it in tf)(~ distriGtI
-(3) Sugar Mill.-A sugar mill (Budhlada Co-operative Sugar Mills Limited, Budhlada) is located at Budhlada. The mill has a capacity of crUShing 2,500 tonnes of sugarcane daily. It produced 58,000 tonnes. of Silgar in 1~0-9'l durfng a short working period of 58 days.
(4) Chemica) Fe'rtilisers.-A unit of Na'tional Fettilisers Limited is located at ~athittda. 'fIte unitwa'S contmJgsiO'lred on Ist Octobetf 1979 and produces urea. It is fuel-oil based fettillser plan t Wliith produced 4,03,855 tonnes of urea in 1990-91 against its annual rated capacity of 5,11,500 tonnes. In 1992-93, the production was higher '(4,90,205 tonnes). This plant is in the Central Public Sector and is the larges~ unit in tpe district.
(5)' Textile MilIs.-There are two co-operative spinning mills, one each at Batl1inGa and Mansa.. Cotton yarns ofvarions counts are produced in these mills Which give employment to large numbet·ofworkers.
. (6). OU MilIs.- An oil extraction mill is located at Bathirrda (Rosh an Oil Mills Privllte Lhtrited) which produces sars6n C1il and o'ilca:ke, expOli:ted to other areas in the State and outside.
(7) Cement Plant.-~ cement plant is fast coming up (since completed) in the I'rivate sector at Bathinda. It will utilise coal ash. from the Guru Nanak Dev :rhermal Plant for the mamrfactutl! bf cemettt: The' plant is. being installed b~ Gujar~t Am'buja Group of Companies. It will go a long way'it1 meeting demand o( c~ment of southetn dIstricts In the State.
(8) Rice SfreUers-.-There. are large number of rice shellers located In the diSUict whicH meet. the local d.emands for dehuskihg of paddy.
- . (9) 1?~ ~a~u(acturi~g Uruts.-The di~tri~t is ~ big pro?ucer of gram. Hence, number of units are ellgaged Itt tB.<! manUfacture of d'il, etc. to ttfe dlstncf'. ... ,," ~ ~ ..
{1t7J 1tdff*~ "'ot~'. Biultlmllt.--,,--tllc!i'e i!L a ~r(jp<>S1lr (0 S'et IIp an oir tdtnecy at iktt4inda... A pipe line linking :Batbinda with Kandla is under cOllStruction.
9
In the year 1980 there Were total 271 registered factories in the district, out of which 260wereWorking factories, which employed 5,818 workers on an average (the lowest number in the State). Further during the year the district reported 490 workers per lakh population which was the third lOWest figure, next to Sangrul' (422 workers) and Firozpur (486 workers) districts. However, in 1990 the total number of registered factories reported in the district increased to 566, out of which 562 were working factories, which employed 17,703 workers. The number of workers per lakh population in the district in 1990 wac; 1993, which is the third lowest, next to Gurdaspur (674) and Faridkot (903) districts. Thus it is apparent that there IS limited industrial activity in the district.
In the sixties the government established an Industrial Estate at Bathinda, wherein 20 industnal sbeds Were constructed and allotted to various industrial units. A rural Industrial estate was also set up at Rampura Phul. Besides an Industrial Focal Point (old and new) wac; set up at Bathinda which encompassed an area of 90·98 acreS (as on 31st December, 1991). A total of 148 plots were developed at this focal point, out of which 142 were occupied and 6 were lying vacant. Also government provided Rs. 5,59.000 of aid to small scale industrial units in the district during 1990-91. Further the government also set up a !hermal plant at Bathinda (Guru Kanak Dev Thermal Plant, Bathinda) to provide electricity to the various tndustrial units and agricultural tubewells in the district. Another thermal plant is also under execution in the ~istrict which will be commissioned (first unit of Guru Hargobind Sahib Thermal Plant at Lehra M ohabat) In December, 1997.
The government had opened 2 Industrial Training Institutes in the district for certificate courseS in, various trades. In 1980-81 these admitted 757 students. However, in 1990-91 the admissions were restricted tq 575 students only.
. A Government Polytechnic is functioining at Bathinda. It imparts instructions for diploma courSeS In (I) Pharmacy, (2) Industrial Production, (3) Electronics and (4) Architecture.
This polytechnic admitted 60 students during 1985-86, but the admissions have been increased to 120 students in 1990-91.
mic A government Engineering College has been set up at Bathinda which started functioning from the acade
session 1991-92.
Electricity :
The erstwhile rulers were well aware of the technological changes taking place in the world. They, therefore, were the first to introduce electricity in their areas in the beginning of the present century. The private suppliers of electricity were replaced by the state government Public Works Deprtment. However, after Some time the repsonsibilities of supplying electricity was bestowed on the Punjab Statc Electricity Board, Patiala.
Tn the year 1990-91, Bathinda district consumed 460.1 million units of electrcity. The break up by various sectors of electricity consumed in the district is as follows: 1) Domestic 99.8 million units, 2) Gommercial 14.1 million units, 3) Industrial 212.4 million units, 4) Agricultural ] 11.6 million units, 5) Others 22.2 million units. During 1990-91, the district consumed 3.86 percent of the total state's consumption. lfwe study 1980-81 figures We find that Bathinda district consumed 242.39 million units of electricity. The break up by various sectors of electricity consumed is as follows :.1) Domestic 28.80 million units, 2) Commercial 7.46 million units, 3) Industrial 168.61 million units, 4) Agricultural 27.78 million units, 5) Others 9.74 million units. Also the district consumed 5.72 per cent of state's total consumption of electricity during 1980-81.
Thus from the above para We notice that whereas district consumption of electricity has increased from 2.42.39 million units in 1980-81 to 460.1 million units in 1990-91, the district's percentage of consumption to total states consumption has declined from 5.72 per cent to 3.86 per cent during the corresponding period. This implies tbat Bathinda district bas lagged behind other districts in electricity consumption which in other words means th a t there is lesser consumption of electricity in industrial and agricultural sectors.
In the year 1980-81 there were only 43.51 per cent electrified households (86,139 households out of total 1,97,971 households) in tbe district. However, in 1990-91 this percenage increased to 73.22 percent (1,89,761 households out of 2,89,158 households). It is interesting to note that consumption or electricity per consumer during 1980-81 was 2,354 units, which declined to 2,023 units in 1990-91, which is attributable to tardy expansion in the agricultural sector upto natural constraints (lesser expansion in the number of tubeweIls) on the one hand and increase in the number of domestic consumers on the other during the last decade.
The government bas set up a thermal plant (Guru Nanak Dev Thermal Plant) at Bathinda to make available electricity to various types of consumers as the district was distantly located from the hydro power stations of Satluj and Beas river systems. Further thermal power generation was necessitated to avoid fluctuations during the winter months when Jess electricity was generated in the hydro power stations. This plant has come up in three stages. The first stage envisaged setting up of two units (llOx2 MW) of 220 MegaWatt capacity. The second

10
stag~ e!1y~s,!ged lS~tti?g up two more units (200x2MW) 400 ?1e~ Wjltts. The tb.ir~ stage ~nvis~gyd setting up of' tWQ .plOTt: unitb'(5th ang 6th of ?lQ ¥ega Watt catta~ity ~ach)\Yith 420 M~gq. Watt C;!pa9ity.· The ~t two st~ges wt?re compJeteq since long. The tlurd &t{!ge has also ~en compJeteq. Thpl! fl!e G:tiDTP, B!\thipda h~ a total installed capacity of 1040 I'4~gfl W'ltt i? a!l.The average plant load factor achieve9 duri!1g t4e ~~f'198(:j-81 Was 58.82 per cent. The total ¥ener~tion4uring the year lQ86-~7 was 2,21)7.21 MiIFon Units.
It was felt by the Eqergy Planners that to meet eyer increasing demand for yJcctricity another thermal plant should be set up. Consequently work was started on the Guru Hargobind Sahib Thermal Plant at village Lehra Mohabat, in this district., This thermal plant will have a capacity of 429 MW. Its first units scheduled to becommissioned by Decem per, 1997. The work on the project is progressing a~ p~r &chedule. With the completion of this project tne district will ~e !lleading district in elect!"icity 8,eneration in the State.
Minerals ani! Mining : ,,'I' .
The district is poor so far as mineral wealth is concerned. Some Kl,lnkar (calcarious n~dules) is found at some places, particularly in Utar. It is used for road con!!,truction and is also burnt for lime. Black clay frOID wbi~~ bricks are magI! alSo or;curs in sl'9~ll qaunt1ti~s. Fine white clay is ~Jsp found wlli¥h is U&~4 forwlti!~ w.as~Ing. III .!jpple arefls ~bor~ (saltpetre) is e~tr~cted but it is limite9. to only few poc!sets ~orp.eFing Fflr.idkot dIstrIct, where patches of KaUar have appeared.
COl1lm!Wh~lJtiAJIS :
. The means of communication such as roads, railways, waterways, p~ts, telegraph, tl?~1WoH~, ~tc. pll!:Y an Important role in the development of any area. "the district is well served in both roads and railways. The !lathi~da ~,~il.way Ntl~tion ~ qP!? ffi th~ pigg,?s! .i1m£tiop'~ !n t~~ ~tl:).t~. It}~ fr'?!ll p~e lp.l:).t 7 rl}Hway lines fan out In varIOUS dIrections. The seve~ r~llW?y lines p;ls§ing H~~ug4 ibis d,istfict ~re 'IS follows :
(I) .Qat~iJ1dfk¥j#oZJ!p.r fflUWDY J!ne~';"7.:rt sery~s ?atpin9a ta~iI. It is ~ brQa~ ga~~~ lillj;:·
(2) Bathinda-Sriganganagar railway }ine.-It also serves the Bathinda tahsil. It is a broad gauge line.
(3) Bathinda-Jakhal-D'elhi railway line.-It serves Bathinda , Talwantli Sabo and M~!1s~ tah~ils. It is lJ. broad gauge line.
line. (4) Bathinda-Rajpura railway )ine.-It ServeS Bathinda and Rampura Phul tahsils. It is a broad gauge
. (5) I}a!hin~il-~ot ¥~P'!JPl-.F~!Ufa raiJW!1Y lin~lt serv¥~ ~a~irida t~hsil. It ~~ dri&ina~lr fL m~~re g'l-u.pe hne but has R~en recf}!J.tly co~ver!eEi into broad &luge r~ilway hne up.der th~ gallge COJ}ver$10n programm~~
(0 .~l!thin~If-HaIJI}I!lI!"gIlJ~-.QjJHmer rllilway IiJl~-:-;-It setv~ sQuthern part of ~~tQin~a ~ w~~te~ part' ~f T~lwan~h Saba t~psiJs. It was originally a metre gagu~ l!I!:e but has been cOllverteg. tp bfPq.-q g'!-uge ral1w~y hne qnder th~ g~ug~ conversion progrflmm~.
, err B1t~Wd~-~ifl~l!--Rewi'ri r~nWiJY JiJl{l-;'Jt &~rV~S j}atqinqa and ralwa~di Sabp taMils. It W~s o.fj~ip~ly ~ m~tre gfiuge line b1:lt h£tS since k~~ll COlwerteg in!o bf0l!4gaug~ raIlwlJ.Y bqe -qnder the ~u..?-e S!gnyet~lpq. programme uqd~rt~ken by tre raihya,ys.
The fonowing railway stations are located in the district :- (I) Gehri Bhagi, (2) Shergarh, q) Bangi Nipa~si!lgp, (4) ~aqlan, (5) GUl1lsar Sain~wa)~, (6) ~angat, (7) ~ag}Va!i, (8) p!itJlindf!., (9) Kartar Slllgh~ala, (10) Kot fa!~h! (1 n M!li~flr Khanjl, (12) ¥au~, (l~) Balluana, (14) !3~h;Qlan.DeWflna, US) f~p.s Mandl, (16) nhUGflP, (17) aampllra Phul, (18) Lt:hr;:t Mohabat, a~) Srt4asmghwal~, (20) M.l:lQSIl-, (21) NflrillderpUJ:~, (22) ~udhlada, (23) Dattew~s, (24) B'ar~ta aqd (25) K!il].ang~rh.
In the year 1980-81 there were 2,462 km. or roads maintained by PWD (B & R), Punja~, o.ut or which 46 kl1}. w¥ l!l!91lJ' the ~at!Qn~1 Highway (NfHS), wh'Jr~l!S lh<: r~W{li:q.ipg ~,41(~ (an. ~~ P.r~vlnclal hIghway. In 1.99P~91, t.l}~.rpa~ l~ngth iTlCrea~ed to 2,~58 km ; put ohy-PicR 42 k~. was ¥P~~f NatlOna~ Hl~way (Nfl-IS). pesldes! th~r~ were 27$ ·02 km. pf municipal roads maintaiqe~ py !pe cjv~c bq9i~~.
Ta~ing f,~62 km. of road lengt4 intp consiqeffl.!ion, t1"!~Jewere 44 ktp. of roads Rer lQO sq. kpl. of area and 190'12 km. of r.oa~ l{erI.~kh pop~latiop in the qistrict ill the ye~r 1980~81.. :QutIn 1990-91, tq~£e we(.e 59. km. of roads per 100 sq. km. of area and 199 km. of roads per lakh population worked out on tue baSIS of a fpad length of 3,279 kIn. (all types of roags) .
. Th~ important roads in the district pre: (1) B.athin~a-Malc:mt road, m. Batb,.jnd~-f}.<?t ~p!lra roa~1 (3) Bathlllda-Talwandi Sabo rpad, (4) :Qathinpa-Ml1ktsnr [Wid, (5) p'athlOda~Dab)Vah rol.}~, (6) B!tP!l~d!-~,!n~m rp~d) (7) B_athinda-Barnala road, (8) Ma,nsa-:aafll~la road, (9). Man~a~SIrs~ ro~d, (10, BJ.?dplitd~-ratehapa!l road, (11) Budhlada-Munak road, (12) Rampura Phul-Moga road, etc.

11
In the year 1990·91 (31st March, 1991) against 74,191 vehicles registered in the district there were 7.3~936 vehicles on road. The break up of on road vehicles is as follows: 255 buses; 3,770 station wagons ; 758 jeeps; 150 taxi!); 349 three wheelers; 30,166 two wheelers; 35,448 total passenger vehicles; 2,131' four wheelers and above; III three wheelers; 2,248 total goods vehicles ; 36,123 tractors and 117 others. It may be poted that number of tractors was the second highest in the district, next to Firozpur district (42,637), in the State. However, in the year 1980-81 (31st March, 1981) against 29,747 v~hicles registered in the district there were 28,890 vehicles on road. The break up of on road vehicles during 1980-81 is as follows: 88 buses; 719 station wagons; 268 jeeps; 14 taxis; 146 three wheelers ; 8,318 two wheelers ; 9,553 total passenger vehicles 1>p2 four wheelers and above; 45 three wheelers; 1.007 total gbods vehicles; 18,320 tractors and 10 ~thers. The U\lmber of tractors in the district was the second highest next to Firozpur district (21,195).
A comparison of number of different types of vehicles during 1980-81 and 1990-91 reveals that during the decade 1981-91 there is increase in the num ber of on road vehicfes from 28,890 in 1981 to 73,196 ~.p. 1991, the passenger vehicles registering an increase from 9,553 vehicles to 35,448 vehicles, whereas goods vehicles wcreaseq from 1,007 to 2,248 during the corresponding period. Thus it would be noted that passenger vehicles l1~we registered faster growth than goods vehicles, mainly due to the increase in the number of two wheeler~, wilicn repprted an increase from 8,318 in 1981 to 30,166 in 19.91. Further, tractors also recorded an increase from 18,320 lP 1981 to 36,123 in 1991. It may be noted that tractors. besides b~ing used for agricultural operations, <lre used for transportation of passengers and various types of goods (agricultural proquce, building construction material, etc). Though the district has entered the scooter/motor cycle age yet the cycle is the most common mode ot: tnl.(lsportatiQn of passengers as well as goodS. :aesj~es. cycl~-ti~kshaws, rehrlls' (both cattle ~nd horse drawn), t.,.pga~, etc. are e!.tenSively useq in the ~Hstdct. Siqce the construction Qflip~ rpad net work their u~e has greatl), ~~panded. .
The district is well served by the Public Road Transport system. The district being part of erstwhile Pepsu, State the bus routes are mainlywith the Pepsu Road Transpor.t Corpo~ation (PRTC). which has following three depots operating in the district: (D Budhlada (It ha~ a fleet of 62 bQ5es in 1990-91, ~gainst 66 in 19S0-81) ; (~) Bathinda (It has 98 buses in 1990-91, against 74 in 1980-81); and (3) ijatllinda-II (It operated 99 buses in 19,_90-91, against 67 in 1980-8 I). Thus it would be seen that fleet of buseS has increased in the district on t4~ whole during the 1981-91 decade. The other depots of PRTC and Punjab Roa~ways also operate buses oU 'various routes in the district. There are number of private operators aiso, who provide transport services in ·{l.reas not served by Government transport operators.
The increase in vehicles has resulted in increase of accidents in the district. In. 1980 there took place 69 ~ccidents in which 33 persons were killed and 38 injured. But in 1990, 90 accidents took place which resulted Ul loss of 44 precious lives and injuries to 71 personS in the district.
There is a good network of post and telegraph offices in the district. The telephone facilities hav~ also been greatly improved throughout the district barring few pockets here and there. The telephone has reached in many vil1ages of the district.
There is a Relay Station of All india Radio (Akash~ani) at Bathinda which relays programmes of Jalandhar Station and caters to the needs of local residents as well as residents of the adjoining districts.
Trade and Commerce:
. . The areas constituting present day Bathinda district were known as jungle where desert like con-dItIOns prevailed. But Bathinda being an important centre of halt, enroute Delhi, came to assume imporlance as a centre of both administration and trade and commerce. It further developed into an important centr~ of. railways as seven railway lines met here from different directions. The extension of canal irrigation with budding of Sirhind canal and Bhakra canal systems ushered in prosperi1y. The agricultural development resulted in the emergence of grain markets all over the district which gave much needed fillip to the trade and commerce in the district. The position further developed when government built up an excellent road network in the district.
As on 31st March, 1991, there were 14 Agricultural Markets (Regulated), with 36 attached subyards, in the district. These markets are at : (1) Bareta, (2) Bathinda, (3) Bhucho, (4) Budhlada, (5) Goniana, (6) Mansa, (7) Maur, (8) Raman, (9) Rampura Phul, (10) Sangat, (11) Bhagta Bhaika, (12) Sardulgarh, (13) Talwan?i Sabo, and (14) Bhikhi. Bqt on 31st March, 1981, there were only 12 agricultur~l f!larkets (Regulated) WIth 32 attahced sub-yards, in the district. The two new markets (Talwandi Sabo and Bhlkhl) were added in the decade 1981-91.
. In the year 1990-91 there were arrival of 15,69,400 tonnes of agricultural produce in the mandis (markets) of the district. Out of the total arrivals of agricultural commodities, wheat and paddy accounted for 6,5?,OOO tonnes and 2,50,000 tonnes. respectively. There were, however, total arrivals of 5,58,000 tonnes of agricultural commodities in the district during 1980-81, out of which wheat, paddy and maize accounted for 2,6~,000 tonnes, 25,000 tonnes and 400 tonnes, respectively. Thus it would be noticed that the arrival of agncultural commodities in the markets of the district increased many fold during the decade 1981-91.
12
During 1990-9.i under the foodgrains procurement programme the fol1owing purchases were made by various agencies in the district~ Paddy (2,50,000 tonues) State Government~ 11,000 tonnes, Food Corporation of India (Fen, 1,32,000 tonnes, Markfed 7,000 tonnes, Punsup 11,'000 tonnes, Private traders 89,000 tonncs' wheat (6,55,000 tonnes)~~ta.te Government 88,000 tonnes, Fel 2,24,000 tonnes, Marlded 1,50,000 tonnes: Punsup 1,59,000 tonnes, Pf)vate traders 34,000 tonnes. However, in the year 1980-81 various agencies made procurement of 27,000 tonnes of paddy and 2,32,000 tonnes of wheat from various markets of the distr,ict. Thus it would be seen that procurement of paddy and wheat has picked up appreciably. .
. , Though the wholesale and r.etail trade is mostly in the private hands there is a District Wholesale
Cooperative Marketing and Supply Society at Bathinda, which undertake's wholesale supplies of agricultural implements, seeds, fertilisers, pesticides, kerosene oil, sugar, edible oil, etc. to the farmers/plembers,
During i989-90 there were 18 marketing cooperatives,- 371 milk supply cooperatives, 42 weavers coopera~ tives, and 27 consumers cooperatives, in the district, Besides there are number of cooperative consumer store~ in the district. In order to ensure availability of essential commodities, suCh as wneat, wheat flour, rice, sugar, keI;,osene oil and cheap cloth to poorer st!ctions of the society in rural as well as in urban areas at reasonable rates the government has introduced State trading. Under this scheme number of fair price shops are being run either "through cooperative societies or private traders where essential commodities are supplied to general p'ublic. at subsidised rates under the scheme of Public Distribution System (PDS.) .
Goods are also traded at various places in the district on the occasion of fairs participated by large number of visitors. Cattle fairs are also held at "n.rious places in the district 'where cattle/animals change hands. Bathinda being centrally located between Bangar (Haryana), ·Bagar.(Rajasthan) and Punjab attracts large number of cattle traders.
According to 1991 Census thete were 41,20'2 pe{sons (40,548 males, 654 females), who were engaged in trade and commerce in the district, out of these' 11,453 ¢rsons (11,265 males. IS& females were reported fa. rural and 29,749 persons (29,283 males, 466 females}were reported in urban are~s. The·percentage..of workers engaged in Traae and commerce is 8' 48 per cent (8.71 per cent male, 3.20 percent female) in the district which is lower than the state's percentage of 10. 55 (10.81 percent male, 4.69 per cent female),
On 31st December, 1990, there were 185 branches of various banks, operating in the district. The bre~k up of these branches is as follows; State Bank of India (SBI) 17, State Bank of Patiala (SBP) 47, Punjab National Bank (PNB) 19, Cooperative.Banks 51, and Other Commers;ial Banks 51. As against this on last Friday ofJune, 1980,141 bank btanches were functioning in the district (SBI 16, SBP 33, PNB 15, Cooperative Banks 47, Olher commercial banks 30). Thus it would be noted th~fBatbinaa district has made notable progress in the number of bank branches during the decade 1980-90 which has given quite a boost·to the trade and commerce activity'in the district.· .• - .
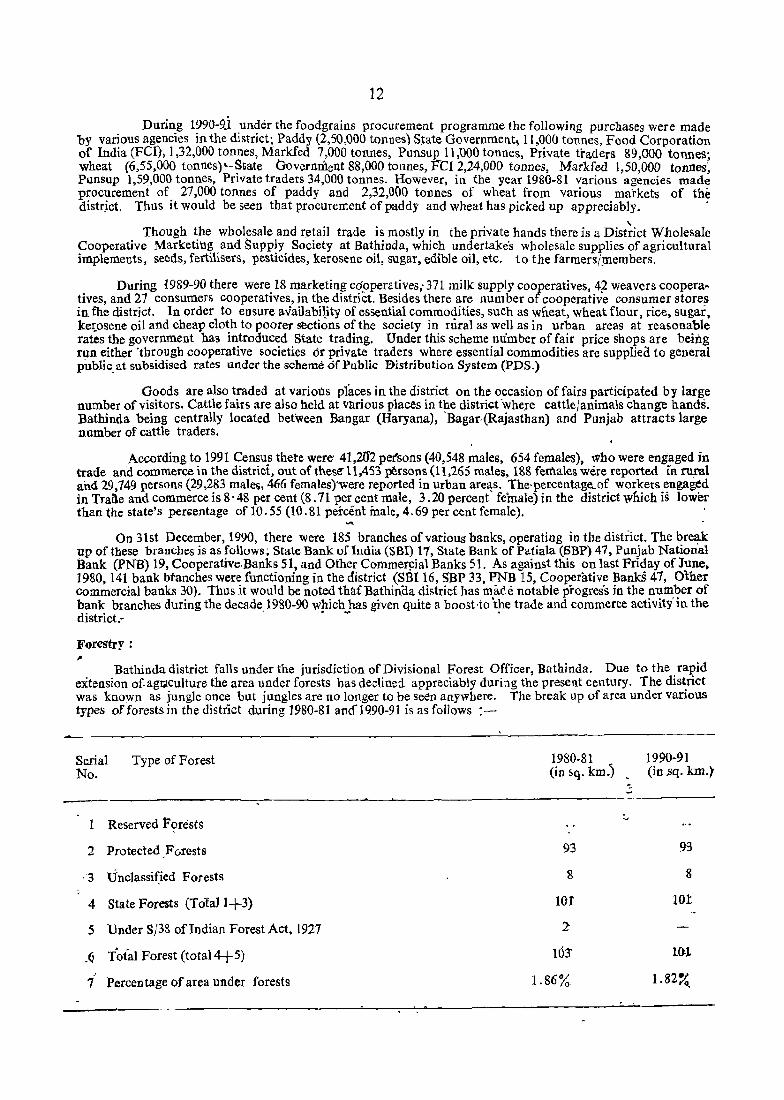
Forestrr: .. Bathinda district falls under the jurisdiction of Divisional Forest Officer, Bathinda. Due to the rapid
extension of,agr.iculture the area under forests has declined appreciably during the present century. The dis~rict was known as jungle once but jungles are no longer to be seen anywhere. The break up of area under vanous types of forests in the district during 1980·81 and'1990-91 is as foHows : _.
Serial Type of Forest 1980-81 1990-91 No. (in sq. km.) . (in.sq. km.}
~
1 Reserved F?rests :...
2 Protected ,Forests 93 93
'3 Unc1assi~ied Forests 8 8
4 State Forests (Tolall+3) lOf lOt
5 Under S/38 ofIndian Forest Act, 1927 2-
,6 Tofal Forest (total4-f-5) 103' 10,1
7 Percentage of area under forests 1.86% 1.82%.

13
The tahle reveals that during the last decade the area under forests has declined from 103 sq. kills. in 1980-81 to 101 sq. kms. in 1990-91. In 1980-81 there was 101 sq. kms. of state forests and 2 sq. km. of private forests in the district, whkh worked out to 1 . 86 percent of the total area of the district: flowe~er, during 1990-~1, no area has been reported under and private forests, whereas the remaining 101 sq. km. I!fe upder State forests. Thus the percentage of area under forest has further dedined to 1· 82 percent, which is far below the norm prescribed for for_cst ~over in the State. Wi~h the shifting over of managment of road sides, panal banJcs and strips of land along railway lines, to the Forest Department for growing and maintaining tree plantation therein, some improvements have taken place duripg last few decades in the district.The plantation of sbisham and kikar trees will not only provide much needed timber to the people but also ensure better returns to the department.
~~fl.4iCJtI and Public Health: "1'"'1:
Ayurvedic and Unani systems of medicine were popular jJefore the introductiol! of A!!opathic syskm by tpe erstwhile rulers, who took pains jn opening hospitals apd dispensaries at various iIpportant plac~s in thy gisfrict.· faith curing and>quackery was also popular w~tb the peopl¢' bpt it has since lost popplarity. In ortllopa~t1ic cases (bolle fracture) village 'sianasi~Wwan9 were cOlliu!ted but their popularity Jlas also declined .app'reciab)y. The h6moeopathic sy-stem· is last to arrive and it has'become nonular in the urban areas in treatment of children and patients of chronic diseases.
In the year 1960-61 tpere were 36 hospitals and dispensaries, in addition to Ayurvedic di~pen~aries in ~ .th~ district, whicn ·has made'appteciable progre~s in the number of roedi.cal institutions: As @n 1 st April, 19.81,
tliere"')"ere 150 medical institutions in the district out of, wlfic)l124 were in rural area and 26 in urban areas. Ellrtherout of 150 medical'institutions, 148 were opened by the State goveniment, 1 by local self dep~rtment and r ~Y others. A)nong the". mcdica~ institutions, 21 were h?spitals .(9 rural, 12'Urban),9 Pritpary .i1eaJ.th ~el:(res ~ rural13 Urban). 120 'dlspensanes (109 rural, 11 Urban)! BeSides there were ~8 other' medICal' Inshtuhons (S6'Ayurvedic,2 Unani) inttbe district. Though there was not much change, the picture of medical institutions as on 1st April, 1991 reveals the position as follows; the allopathic medical institutions increased to 175 (143 rural, ~2 urban) as on !st April, 1991, out of these 174 belonged to government and 1 to voluntary organisation. i'\s:!tegaras~ types'ofmedical institutions; there'were '15 hospltals (5 rural, 10 urban), 38 primary health centres (3S rt\fa.J~,g-urb'llri): :116 dlspeds!lrie~"(99-rural, 17 urban) ahd . 6 'ho-Spitais/CHC j CH(:,l' CHC/PHC (4 i'unn, ~:urbdn:J. Beside~·there we(e'391~YO'rvi:Jdic;2 Unani and 9 Hortloeopathid dispe'nsaries functiohiinlfin the district -ast"on::l'st: April; 199J. .' ., 'l' , ., , . ~,--" I '" .l'- r )- ... ~. ~7 1
In the year 1960-61 ther-e were.only 334 beds (195 male, 139 female) in the medical institutions in the dj~trict. But as:o'n lSt April, 198-1' 'the numberoL oeds ~ncfease~ to 1,274 {663 male, 611 female), out of these 65191300s were report~d in'rhra'l"areffs:ahd~515 in urban areas. "The break up of beds by various medical insti-tu1i6ds is ; hospitals 762 beds, primary health centres 34 beds and dispensaries 478 beds. After a decade i. e. as on 1st April, 1991 the beds increased to 1,397, out of which 'n5 were in rural areas and 622 in urban areas. The d~st~jbution of beds by types of institutions is flS fo}lows ; }1ospi~~ls ~72 beds, primary health centres J 50 beds, 41sp~nsaries 475 beds and hospitals/CRC, eHC, CHC/PHC 200 beds .
• + ~ t
As regards medical and para-medical staff regi~tered in the district III 1990, there were 5XI doctors, 472.midwives, 63 nurses and 2,278 dais, against 264 'doctors, 162 midwives, 28 nurses and 973 dais registered in tbe qistrict during 1980. Thus notable improvement in the strength of medical and para-medical staff could be -s~en in the district during the last decade. .
" In the year 1990 there was a doctor for f,790 persons, a midwife for 3,285 persons and a nurse for 25.322 perions. Also' as on 1 st April, 1991 there was a medical institution for every 8,928 persons'and a bed for 1,118 p~rsons. If VIe look back in years we notice that in 1980 there was a doctor for 4,846 persons, a rnidwifl! lor 3;897 persons and a nurse for 45',686 persons. Also as on 1 st April, 1981 there was a medical -institution for 9,715 persons and a bed for 1,026 persons. J:hus we find that whereas position shows quite an improvement in tp!,! staff, 'there is virtually no'improvement in population served by medical institutionS' or beds.
In the field offamily welfare/planning this district has made quite a progress. In 1990-91 against a target of 9,091 sterlisation operations, tlie achievement was 4,828 operations only, wner~as against a target' of' 9,628 IUD's the achievement was 34,647 IUD's. Besides there were 689 cases ofMTP tMedical Termination df Pregnancies) and 18,047 cases of termination since inception in the district. Thus we ~ee that shortfalls in sterlisation operations have been more than made up in IDU's.
The incidence of flu~rosis is fajrly high in certain parts of the district due to flourine conte11t of water drawn from wells: This pr6quces changes in teeth and bones. In 'acute cases bones thicken and the body becomes stiff resu1ting in par'al-ysis and premature dea1h. 'tben!fore, preventive measures were tequired to be taken for the supply of protected drinkin~ water in problematic villages of the 4istrict. Up to the year 1990, ~11 ~jlJa~es were identifje<f as'problem villages, out of whjcb'protected drinking water schemes were implemented Hi ~~~ vill~g~s. r.~~ s~lie~r has s~n_c~ be-en'imPle~en~e?·i'n'the ~emain!ng'21 vil!~ges also; !t i~ hope4 that tlris wllf go a long way ill cpecklTlg t]1e Ip.cldeIfCe offluot6S1s Jp'the dlstrict" In fUiure. ! ,
• • • • ('. • t t ~

14
Education:
.' . Before t~le introduction of modern. education on the lines of the British, teaching was done on religious lines In the folloWIng three systems ;_ (1). Hllldu sys~em, (2) Sikh system and (3) ,Muslim system. The Hindu ~ystem co snpri~ed. CblltSh~l~s!pllthshalas run. by Pllndits in the dblltamshalas 0'( temples where instructions we-re l.mplrted In £:llndl. The Sikh system comprISed teaching by the Bhai/Granthis in the gurudwarasjdharamshalas 111 Gurmukhl. In the Muslim system Maulvis taught Arabic/Persian /Urdu in the madrassa/maktabs/mosqtles.
. ., In ~he ,post-indepe.n~ence period tremendous progress was made in the opening of.number of educa-.tlOllal 11l~htutt~ns .an~ provlslon of st~ff. As on 30th September, 1980, the district had the following number of educatIOnal lllstltutlOns ; Arts and SCience Colleges 9 (6 boys, 3 girls); Higher Secondary'ScllOols 8 (6 boys 2 girl~); High·Schoo~s.145 (127 boys .. 18 g~r1s).; ~iddle Schools 103 (97 boys, 6 girls); add Primary Schools 624 .(624 DOyS). The position of educattonal11lstltutlons as.on 30th September, 1990, is as follows'; Arts StienceCommerce and Home Science Colleges 9 (6 boys, 3 girls); Senior Secondary Schools 34 (30 boys, 4 girl;)' High S.ch~ols 1~0 (141 boys, 19 gir~s); !\1.iddle. Schools 105 (103 boys, 2 girls); Primary Schools 670 (670 boys); Polytechroc (1 boys); Techmcal lndustnal Art Cr~.ft Schools 6· (3 bdj's, 3 girls). Thus, it woud be noticed that notable increase ha~ taken place in the number of Senior Secondary and Primary Schools in the district during t'he last decade.
The strength of students in various classes'as on 30th September, 1990, in tM district is as fOllows: MA Classes 104 students (82 boys; 22 girls); BArBA (Hon) classes 2,153 students (1,087 boys 1,066 girls); B. ScjB. Sc. (~on) classes,.314 students' (177 boys, 137 girls); ,B. Com./B. Com (Hon) classes 482 students (3'73 boys 109 girls); B. E. [B. Sc (Engg)IB. Arch.classes 409 stud~nts (358 boys, 51 girls) ; S~nior Secondary school classes 29,704 students (19,073 boys, 10,631) girls); High School classes 63,764 students (36,71~ boys, 27,047 girls)' Middle cla_sses 14,435 students (8,633 bo~s, 5,802 girls); Primary classes, 1,44,696 student_s (80,470 boys, 64,226 'girls); Polytecbnic classes 279 students t228 boys, 51 girls) and Technical Industrial Art Craft School classes 984 students (795 boys, 189 girls).
Bathinda is now receiving due attention in the setting up of educatio'nal ~nsti~utions. ~ Tlie. Punjabi University, Patiala, has established Gurll Kashi Institute at Bathinda. It has also started Regional Campus of die University at Damdama Sahib; which has become the nucleus of the'professional courses . .A Government Engineering College has also come up at Bathillda, where instructions in "degree c<nlrses in ~ngineering are imparted: The Government Polytechnic, Bathinda, imparts instructions for diploma courses, It admitfea 6() students during the 1~85-86 academic session but the admissions have been increased to 120 students during 1990-91. There are two industrial Training Institutes functioning in the district. In 1980-81 these (ITIs) admitted 7?7 students for certificate· courses in various trades but in.1990-91 the admissions were restricted to 575 only. As noted in the preceding _paragraphs there is'no B. Ed. College or JBT school in Jhe district. Therefore, students from this district seek admissions in other districts of the State.
In1lpite of large flUlllber of educMional institutions located in the district the district could not make much headway in literacy as it has reported the lowest literacy rate of 43 .03 percent (50.55 percent male, 34· 51 per cent female) during 1991 Census, against 58' 51 per. cent (65 ·66 per cent male 59 ·41 per cent female) of the State. Ifwe refer to 1981 Census literacy rates we notice that the district reported a literacy rate of 27 ·73 percent '(34'16 per cent male, 20· 29 per cent female), against 40. 86 per cent (47 '16 per cent male; 33.69 per ceM female) or the State. On "comparison of 1981 aM 1991 censuses literacy rates we find that during the last decade 1981-9i the li!eracy rate has increased by 15·30 percent points (16.39 percent points male, 14.22'per cent points feQ1ale) in the district against 17 ·65 per cent points of the State (18.50 percent points male, (16 '42 percent points female). Thus It is evident that in growth of literacy the district could not match the state growth even though it had greater' potential to develop and grow. r
1n the year 1990-91 there were 300 Adult Education Centres ip operation in the district, out of which 111 were for males and 189 for females. 'In these centres 8,880 students were. admitted, out of which 3,245 were males and 5,635 females. Indeed it is through such Adult Literacy' Centres that literacy rates cou~d be improved to wash off the stigma of educational backwardness bIthe district. - The facilities of higher education built up in the district over the last few decades has no doubt improved the quality of education appreciably but this has not been successful in washillg off the stigma of educational ba~kwadness, which is partly due to general attitude of the people and partly due to the absence of constructive activities 'Of voluntary orga.nisations in the district. '
Occupations : ,
Bathinda districj:. occupies the te.nth position!n.. the state in urbanisatio!'-, ~s it re~orted 22 '.51 per ~nt urban population during 1991 Census, agalnst 29'?5 p.ercent of the St~te. The. dl.str~ct was ~ec~ared lDdustnally -backward, which boosted industrial activity resultlllg In more occupatIOnal varIeties In the dIstrIct.
According to 1991 Census there were; 4,85,986 main workers in the distri~t"out of these 4,65,552 were males and 20,434 females. The rural and urban break up of main workers shows that J,8i,774 main workers (3,69,183 males, 1),591 females) are in rural areas and 1,03,212 main workers (96,369 males, 6,843 females) are in urban areas. Thus wide sex differentials are obvious bothjn rural and urban areas.

15
The break up of main workers is available for nin0 industrial categories, which shows that there are: 2,10,627 cultivators~ategory .J (2,0? 16~ males, 2,465 feI?a~es); 1,2~,339 agricultur~l labourers-category II (1,17,609 males, 7,730 females) , 4,343 1U hvestock, for~stry,. ~Ishmg, hunting. and plantations, orchards and allied activitiescategory II~ (4,208 ma~es, 135 !c!llales) ; 16 !n .mlllIng and .quarrymg- category IV (15 males, 1 female); 6,485 in ~anufactunn~, processmg,. servlctn~ .and repau'S II?- ho_usehold mdustry~ategory V(a) (5,885 males, 600-females); 24,030 In manufacturmg, p~ocessmg. servlcmg and repairs III other than household industry-category VCb) (23,098 males, 932 females) ;9.552 In constructons-categ~ry VI (9,400 males, 152 females); 41,~02 in trade and commerce-category VII (40,548 males, 654 females); 1,2,784 In transport, storage and communications-category VHI (12,645 males, 139Jemales) ; and 51.608 other sefVlces-category IX (43,982 males. 7,626 female).
If we take into consideration the percentage We notice that in 1991 census there are 3J.15 per cent (56 10 per cent male, 2.80 per .cent female) m,ail) workers in the dist~ict, against ~0.84 per cent (55.75 per cent m~le, 2.03 per cent female) mam workers dunng 1981 Census. Thus It would be notrced that percentage of main workers has increased slightly during the decade 1981-91. Itwould be further seen from the above figures that economic activity is also male dominated in this district like in other districts of the State. [fwe study percentaO'es of main workers by industrial categories we notice that there are: 43.34 per cent cultivators-category I (44:'1 per cent male, 12.07 per cent fe~ale) ; 25.79 per cen~ ~gricultu:al labourers ~category II (25.26 per cent male, 37.83 per cent female) ; 0.89 per cent livestock, forestry, frshln~ .huntlng and p.lant~tl~:ms, orchards ~nd allied actiyities-category III (0.90 per cent male, 0.66 per cent female) :. Negligible per cent m mtnl11g and quarrymg-category IV ; 1.33 per cent manufacturing, processing, servicing and repairs in household industry-category V(a) (1.27 per cent males 2.94 per cent females) ; 4.95 per cent manufacturing, processing, servicing and repairs in other than household induStrycategory V(b)( 4.96 per cent males; 4.56 per cent females l.97 per cent constructions~ategory VI (2.02 per cent male, 0.74 per cent female); 8.48 per cent trade and commerce~ategory VII (8.71 per cent male, 3.20 per cent female) . 2.63 per centt ransport, storage and communications-category VIII (2.72 per cent male, 0.68 per cent female); and 10.62 per cent other services-category IX (9.45 per cent male, 37.32 per cent 'female) .
. . From the above it is revealed that agriculture alone engages 69.13 per cent main workers (43.34 per cent
cultivators, 25.79 per cent agricultural labourers). Next comes other services which employ 10.62 per cent main workers, followed by trade and commerce 8.48 per cent. Manufacturing engaged 6.28 per cent( 1.33 per cent household,4.95 per cent other than household). Transport, etc. (2.63 per cent) and constructions (1.97 per cent) are also of Some consequence. .
As regards female main workers, agriculture alone engages 49.90 per cent females (12.07 per cent cultivators .37.83 per cent agricultural Jabourers), followed by other services (37.32 per cent). Manufacturing etc. (7.50 per -cent) and Trade and Commerce (3.20 per cent) are categories of some consequence. It will be appropriate to point out that an increasing number of females are seeking employment in various types of occupations and professions, such as teaching, medical, banks, offices, industries, commercial estalishments, etc. But sizeable number of females, Who are engaged in household engagements (economic activities), go unreported as workers due to certain biases .and prejUdices inhibiting truthful returns of economic activities of females. This indeed causes dismally low work participation rates of females in the state, which also equally applies to this district. If we look back we find an improvement over the last census. In 1981 CenSUS the percentage offemale main workers was 2.03 per .cent, which increased to 2.80 per cent in 1991 Census .
. MisceJlaneous Activities:
.. The floods have been the bane of this district and have been playing havoc from year to year and caused
extensive damage to property, human beings, crops. cattle, etc. In the year 1990 as many as 133 villages were affected, which caused destruction in an area of 86 sq. kms. There was loss of 7 human lives and 156 beads of cattle. Crops in 8.591 hectares were damaged. The total damage was estimated at more than Re 1.0 trore.
Though this district was declared industrially backward long back but it could not make rapid progress in -industries due to its location. The government has made special efforts to generate sufficient power for supply to industries and agriculture. Besides expanding the Guru Nanak Dev Thermal Plant at Bathinda effort<; are afoot for setting up a second thermal plant at Lehra Mohabat located on Bathinda-Rajpura railway line. With its ~~pletion 'the district will emerge as the biggest centre of power generation in the State, surpassing even Rupnagar Dlstnct.
Special stress is being laid on the development of this district in education. An Engineering C'?llege. has been set up by the State Government at Bathinda. The Punjabi University ha.~aIso opened Guru Kashl1nstltute at Bat~inda and a Regional Campus at Damdama Sahib (Talwandi Sabo). This Regional Campus wil! serv~ as 11 nucf~~ centre for professional courses in the district. There is, however, need that p~ople change t~elr attitude
:towards education as is the case in educationally advanced districts of Jalandhar, Ludhrana and Hoshlarpur.

16
Places of Religions, Historic"al and Tourist Interest
(1) Bathinda.-ltis the seat of the district/sub-division ftahsil htadquarters ofthe same name. The town is an important railway junction as seven railway Iines( from Hindumalkot, Hanumangarh, Fazilka, Firczpur, Rewari, Jakhal and Rajpura) converge at this junction. It is also connected by road with aU important places m the State and outside. The town has an old and chequered history. It is said that this to\,.n take~ its nC'I'Je from the Rajput ruler Binai Pal and his minister Thanda Ram. The town was conquered by Maharaja Ala Singh near about 1754 AD and it remained part of Patiala princely State till the state was merged in PEPSU in 194ft Except for short period after integration, When Faridkot served as district headquarters, it remained seat of distdct administration. In the centrc of the town is located the Bathinda Fort Which is a mammoth structure. 660 X 6UO feet and 118 feet high. The fort is said to be the largest and oldest in the State. Many an invading armies from west made it a point to capture this fort before making an advance towards Delhi. In fact Bathinda was regarded as an important and strategic station between Kandhar (Afghanistan) and Delhi. There is a gurdwara, associated with Guru Gobind Singh inside the Bathinda Fort. The Fort is looked after by the Department (jf Archaeology, Government of India, but is fast crumbling due to neglect. l
The town has made good Progress after independence. A Chemical Fertilizers Plant of National Fertilizers Limited (NFL) engaged in the manufacture of Urea, has been set up here to meet the needs of farmers of'tltis 4l .. Strict and ?tper southern distri.cts oftbe State. A Thermal Plant (9uru ~anak Dev.Thermal Plan9 of 1040 ~\#tta watt capaCIty has been set up here to meet the power needs of mdustnes and agflculture. A n1ITk plant \MIlk Plant, Bathinda) is also located here, with the capacity to process 1.25 lakh litre of mIlk daily. A 50 thousand ~pindles spinning mill engaged in manufacture of cotton yarn of various counts, has also come up which is fP-vlkk direct or indirect employment to large number of people. An oil miJI (Roshah Oil Mills) is located 'here. Beside$, there is a flour miIl (Bhupindera Flour Mills), Which is the oldest industrial unit of the town. There are 1ltrf-ge number of cotton ginning and pressing units located in the town and outside as district has the largest atea under cotton cultivation in the State. Large number of miscelIaneous industries have also came up in old arlp. new industrial focal point of' the town since the declaration of Bathinda as industrially backward. 'FHe industrial units became eligible for subsidies and other facilities of Central and State Governments. In view of its strategic location a big military cantonment has been set up here. The rose garden and (he boating club have added to the recreational side of town. In fact in the arid and desert like landscape of Bathinda these l'acillties provide the oasis of invigorating re,1ief and feast to the eyes. ," ".
It is a municipal town which reported a population of 1,59,042 in 1991 Census, against 1,27,363 reported during 1981 Census. The city has 5 colleges (2 Arts, Science and Commerce, 2 Arts, 1 Other}; a Government Engineering College, a Poly technic, 6 Senior Secondary Schools, 10 High Schools,9 MiddleSchools and 23 Primary Schools. The Punjabi University has also opened here Guru Kashi Institute. There are 5 Hospitals (including 1 Ayurvedic), 12 Dispensaries (including 2 Ayurvedjc, 1 IJomoeopathic), a TB clinic,2 Family Planning Centres and 1 Other. There are 3 stadia, 5 Cinema Houses, 5 Auditoria, 21>ublic Libraries and 3 Public Reading Rooms. Besides there is a modern EI~ctronic Telephone Exchllt'l.ge. The town has an agricultural market which is known for cotton and gram.
2. Talwandi S~bo (HB No. 34).-1t is sub-divisional/tahsil headquarters of the same name and is popularly known as Damdama S'ahib. It is located some 30 kms. south of Bathinda town with which it is connected by a metalled road. The place is associated '''ith Guru Gobind Singh, who residM here for a period of about 9 mOnths after his most fierce battles with Mughals at Anandpur, Chamkaur Sahib and Muktsar. The place became known as Damdama Sahib as the 10th Guru took rest (dam) and preached his mission to the mass..es-. It is also called Guru Ki Kashi. It was here that Guru Gobind Singh redictated the Ad Granth and named it as Khalsa-da-Takht. The Sikhs revere it as one of the 5 Takhts of the Sikhs The Nihangs have their headquarters here. Guru Teg Bahadur, 9th Guru, father of Guru Gobind Singh, also visited this place prior to the visit of Guru Gobind Singh.
The 10 Gurdwaras located here are; Gurdwara Manji Sahib, dedicated to Guru Teg Babadur, Gurdwara Manji Sahib, dedicated to the Guru Gobind Singh, Gurdwara Takht Sri Guru Ka'shi, Gurdwara Likhansar, Gurdwara Jandsar Gurdwara Mata Sahib Kaur and Mata Sundri, Gurdwara Ber Sahib, Gurdwara Chhauni Nihangan, Gurdwara Sant Attar Singh, Gurdwara Guru reg Bahadur and Mahalsar. Among these the tall gurdwara called Takhat Shri Guru Kashi, where Guru Gobind Singh &et up his throne is the most important of all the gurdwaras. Burj of Baba Deop Singh, who was appoij~ted Granthi by Guru Gobind Singh also stands here. The seal of'Guru Gobind Singh, his sword and musket and a m1rror, which were presented to the Guru by his followers and a Khanda belonging to Baba Deep Singh is displayed in this Gurdwara, where non-stop (day and night) recitation of Granth 'Sahib is conducted. Scholars and writers pay obeisance at the shrine of Likhansar, where pens and ink used in writing the Ad Granth were thrown in the tank. Gurdwara Jandsar is the plaae where treasure trove of Guru Gobind Singh was discovered near a jand tree. The Guru used to pay salaries to his soldiers from this. Gurdwara .Mahalsar ha,s come up at the place where guru played Bola Mohalla and displayed feats of martial arts. 'N,'ow N,1hangs play Bola Mohalla at this place. Besi~es, the three tanks are Nanaksar_ Sarovar, Ak~lsar Saroyar and Gurusar Sarovar. These bear association with Guru Nanak (visited this village in 1510[. }tD),.
\

16
Places of Religious, Historical and Tourist Interest :
(1) Bat~Jinda.-ltis the seat ofthedistrict/sub-c!ivisiop. /tahsil headquarters of the same name. The town is. an important railwdY junction as seven railway lines( from J-lindumalk-ot, Hanumangarh, Fazilka, Firozpur, Rcwari; Jakhal and Rajpura) converge at this junction. It is also connected by road with 411 important place:, in,the State and outside. The town has an old and chequered_history. It is said that this town takes its nrr-Ie from the Rajput tuler Binai Pal and his mmlster Thanda Ram. The toWn wa.s conquered by Maharaja Ala Singh near about ] 754 AD and it remained part of Patiala princely State till the state was merged in 'PEPS U in 1945. Except for short period after integratIOn, when Faridkot served as district headquarters, it remained seat of district administration. In the centre of the town is located the Bathiilda Fort which is a mammoth structure. 660 X 660 feet and 118 feet high. The fort is said to'be the largest and oldest in the State. Many an invading armies from west made jt a point to capture this fort before making an advance towards Delhi. In fact Bathinda was regarded as an important and strategic station between KandMr (Afghanistan) and m~IIii: There is'a gurdwara, associated with Guru Gobmd Singh inside the Bathirida Fort. The Fort is looked after by the Departll1ent ljf Archa-eology, Government ofTndia, but is fast crumbling due to neglect. I
The town has made good progress after independence. A Chemical Fertilizers Plant of National Fertilizers Limited (NFL) en~aged in tbe manufacture of Urea, has been set'up here to meet the needs 'of farmers 6fUiis 4i~1r~c! and ?t~er SOUnl?m ~istricts of th~ 'state. A The~mal Plant (9uru ~anak pev .thermal ~la'n9 of I 040 M~1J6. \X;ajt capacIty pas been set up here to meet t~e power needs of mdustnes anq agrIculture. A tmTk plant (Milk. P~~~t, '~at~ind.a) is ~I~o lOCated. here, with the capacity to process .1.25 Jakh litre of milk daily. A?O t~o~an~ ~pmdles spmnmg mIll engaged lD manufacture of cotton yarn of vanous counts, has also come up w!'uch IS tivlHti air~bf or inliirect employment to large number of people. An oil mill (Roshah Oil Mills) IS lOcated here. Besid~, tliere is a ffour miI1'(Bliupindera Flour Mills), which is the oldest industrial unit of the town. There ate 1a1f~e Duniber of cotton ginning'and pressing units located in th'e to'Yn' and outside as district has the largest at~a untler cotton cultivation in the State. Large number of miSceI1aneous industries have also came up in old and new industrial focal point of' the town since the declaration' of Bathinda as industrially backward 1li~ industrial units became eligible for subsidies and other facilities of Central and State Governments. In view of its straregic location a pig military cantonment has been set up here. The, rose garden ang 'he boating club· li~~~ ~dd~(r ~o th~ recr~ationa.l si,de of .to\vn'.. in fact in the a:id and desett 'like landsca~e of Bathinda th~?e tacIlltieS provIde the oaSIS of mVlgonitmg rebef and feast to the eyes. (/.
It is a municipal town which reported a population of 1,59,042 in 1991 Census, against 1,27,363 reported during 1981 Census. The city has 5 colleges (2 Arts, Science and Commerce, 2 Arts, 1 Other}: a Government Engineering College, a Poly technic, 6 Senior Secondary Schools,10 High Schools,9 Middle' Schools and 23 Primary Schools. The J:>unjabi University has also opened here Guru Kashi IUl:;.titute. Tl!ere are 5 Hospitals (including 1 Ayurvedic), 12 Dispensaries (including 2 Ayurvedic, 1 »omoeopa~hic), a .TB clinic,2 Family 'Planning Centres and 1 Other. There are 3 stadia, 5 Cinema Jfouses, 5 Auditoria, :2 RuP~ic. LiQraries and 3 Public Reading Rooms. Besides there is a modern Electronic TeJephone Pxclilfflge. ;The town has an agricultural market which is known for cotion and gram.
2. Tal,valldi ~bo (H.8 No. 34).-It is sub-divisional/tahsil headquarters of the same name and is popularly known as Da"nidama>S'ahib. it is located some 30 knis. south of'Bathinda town with which. it is tSonnected by a metalled road. The place is associated with Guru Gobind Singh, who resided here for a period of about 9 months after his most fierce battles with Mughals at Anandpur., Chamkaur Sahib and Muktsar. The place became known as Damdama Sahib as the 10th Guru took rest (dam) and preaChed his mission to the masses. It is also called Guru Ki Kashi. It was here that Guru Gobind Singh redictated the Ad Granth and named it as Khalsa-da-Takht. The Sikhs revere it as one of1.he 5 Takhts of the Sikhs The Nihangs have their headquarters here. Guru Teg Bahadur, 9th Guru, father of Guru Gobmd Singh, also visited this place prior to the visit of Guru Gobind Singh.
The 10 Gurdwaras located here are; Gurdwara Manji Sahib, dedicated to Guru Tcg Babadur, Gurdwara Manji Sahib, dedicated to the Guru Gobirid Singh, Gurdwara Takht Sri Guru Kashi, Gurdwara Likhansar, Gurdwara Jandsar (]urdwdfa Mata Sahib Kaur and Mata Sundri, Gurdwara Ber Sahib, Gurdwara ehhauni Nihangan, Gurdwara Sant Attar Singh, 9urdwara Guru reg Bahadur and Mahalsar. Among these the tall gordwara called Takhat Shri Guru Kashi, where Guru Gobind Singh set up his throne is the most important of all the gurdwaras. Burj of Baba Deop 'Singh, who was appoi.11ted Grantbi by Guru Gobind Singh also stands here. The seal oflOuru Gobirid SirigJi, his'sword and musket and a mirror, which were presented to the Guru by his followers and a Khanda belongIog to Baba Deep Singh is displayed in this Gurdwara, wflcre non-sfop (day and night) recitation of Urantn Sahib is conducted. Scholars and writers pay obeisance at the shrine of Likhansar, where pens and ink used in writing the Ad Granth were thrown in the tank. Gurdwara Jandsar is the place where treasure trove of Guru Gobind ,Singh wa~ disCovered near a jand tree. The Guru used to pay salaries to his soldiers from this. 'Gurdwara ;M!ll1alsar bas come up at the place where' guru played !lola M ohalla and displayed feats bf ·martial arts. Now N},hangs play Hora ..Mo,halhi at this place. Besi4es, the three tanks are Nanaksar Sarovar, Akalsa: Sarovar and Gurusar Sarovar. These bear association with Guru Nailak (visited this village in 15Hf )If)) •.
1

17
Guru Gbbind Singh and Guru Teg Bahadur, respectively. The legend goes that Gurusar Sarovar is dug out of the place where Devtas (gods) had hidden the pitcher which contained Ainrit (Nectar) from the Asurs (demons) and that pitcher was retrieved on orders of Guru Teg Bahadur and thrown back ip this tank. A bath in this tank is considered very purifyiJ?g.
It is.a village which reported a popUlation of 12,880 during 1991 Census, against 10,454 reported in 1981 Census when it was a notified area commitee (NAC). It has a college, a High School, a Middle School an~ a Primary School. Punjabi University, Patiala, has recently opened Regional Campus at this place which will serve as nucleus for professional courses. It has a hospital, a maternity home, a dispensary, a family planning centre. Post and Telegraph facilities are available in the village, which also enjoys telephone facilities. The Baisakhi ofTalwandi Sabo is an important fair, which is participated by lakhs of pilgrims from all over tbe State. The visitors from all parts of the State visit this place throughout the year.
3. Mansa.-It is Sub-divisional/tahsil headquarter of the same name and is a railway station on Bathinda-Jakhal rail line. It is connected by road with Patiala, Bathinda, Sirsa, Barnala, etc. It is said to have been founded by Bhai Gurdas, whose samadh exists here. A fair is held annually in memory of the saint on his death anniversary.
It is a municipSlI town, which reported a popUlation of 55,089 during 1991 Census, against 43,289 repOl.:ted during 1981 Census. It has 2 Colleges, (one Arts, Science and Commerce, one Arts), 3 Senior Secondary SChools, 3 High Schools, 5 Middle SChools and 10 Primary Schools. It has 2 Hospitals, 2 Dispensa.ries (one Ayurvedic, one Homoeopathic) and a Family Planning Centre. The town has a Stadium, 2 Cinema Houses, a Public Library and a Reading Room. It has number. of cotton ginning and pressing mills. Some dal manufacturing 6nits are also located here. The town is known for manufacture of desi jutics and agricultural implements. The town has an old grain market known for wbeat, gram, cotton, sarson, taramira, etc. Mansa is .also known for good quality Sbakkar.


(fntor District Changes)
;\"~XURE
JURISDICTIONAL CHANGES
Bathinda District
19
No Ohange


11
{NrRODJCflON TO nISTRICT CENSUS HA.NDBOdl{
The District Census Handbdoks have been published for the first time at the 1951 CensuS and contained then mainly data relating to the Census Enumeration. These data were found to have proved very useful with the local officers working in the Community Development Blocks, Tahsil and District Administration and often consulted 111 connection with planning purposes, Public Distribution System, Elections; and other data uSers.
J<..eeping in view good response it had elicIted during the decade 1951-61, District Census Handboo k project was continued in 1961 Census also. The latter were, however, designed to throw data of more comprehensive scale containing useful census data for each village and town (ward-wise) in the district, besides. giving useful information cullected from various Stat'cjCentral Govt. departments arld agencies. It waS combined with Directory of Villages and Towns showing location of educational institutions, hospitals and dispensaries, Posts and Telegraph offices, electrjfic~tion and protected water supply. A beginning was also made to include tahsil maps showing various amenities in the villages constituting a tahsil. Thus, earnest attempt waS made to make them self-contained comprehensive reference book of the district for the handy use.of the district officers and other agencies. The experience revealed that inordinate delays did oCcur in the preparation of the manuscripts and finally their publishing process but somehow, the publication was released in the inter-censal period.
Series Were also continued in the successive censUSeS of 1971 and 1981. The 1991 Census Iiulld books are the happy culmination of this project. The last .3 series i.e., 1971, 1981 and 1991 are different from that of 1961 Census, Census publications on this subject as these included detailed administrative data Which were not included in 1961 series. However, Village and Town Directory continued to form a part of these handbooks together With Primary Census Abstract. Some of the changes in 1991 Census series formats have been introduced, Which are as follows :
(1) The preparation of data both in the Primary Census Abstract (PCA) and Village Directory (YD) will now be Community Development Block-wise and tahsilwise for each district; and
(ii) From the format of VilJage Directory Col. 14 (Staple food) and C.ol. 20 (Remarks) have been deleted.
The contents of the Handbooks !
The 1991 District CenSlls Mandbook has been divided Into tWo parts; l>art A contains villag. and Town Directory whereas Part B contains Primary Census Abstract of villages and Towns wards giving total popUlation and Primary Census Abstract for Scheduled Castes only for District/CD/ Town. Both parts ar~ being pu1.Jlished together in this volume.
The VIllage Directory gives information about each village in Community Development alock iIi tlie ascending order of location Code and contains information relating to total area of the village in heGtares, total population, number of households, amenities available in the village i.e., educational,.n1edical, drinkirtg water; number of Posts and Telegraph offices, communiCfHion and approach to village, neat'est toWn and distance (in kIllS.) and a\alIability of power supply. Besides, it displays information on land use, i.e., area under different types of land use, like forest, irrigated by source and unirrigated, cultivable and un cultivable land.
'the toWn directory presents data on each town in six statements giving the status of .the tOWl1j the decadal population, growth rate since 1901-91, physical and loeational aspects, municipal finance and ayailability of amenities like, medical, educational, banking, trade, commerce and industry.
fhe Primary CenSus Abstract (General) incorporates Community Development Blockwise data for eac~ village and each town/ward under the following heads :
(i) Area in hectares/sq. km.
(ii) Number of occupied tesidentiaI houses
(iii) Number of Households
(iv) Total popUlation (including institutional and Ilouseless population).
(v) Total population in the age group. to-o).
(vi) Scheduled Caste Population.

(vii) Scheduled Tribe population (There is no, Scheduled Tril.le R~tif{ed fQr Punjab).
(viii) Literates.
'(ix) TC)tal Main workerS.
(x) Main workers classified into 9 industrial categories viz., (1) Cultivators, II. Agricuiturat Labourers, III. Live-stock, Forestry, Fishing, Hunting and Plantations, ·Orchards and Allied Activities, IV. Mining and quarrying" V. (a) Manufacturing, processing) servicing and .repairs in household industry, V (b) Manufacturing, processing servicing and repairs in other than household industry ; VI. Constructions, VII. Trade and Commerce, VIII. Transport, Storage and C:omplUnications IX. Other services;
(xi) Marginal Workers
(xii) Non-workers:
However, the Primary Census Abstract (for 'Scheduled Caste only) indIcates data 'reLating to District! Community Development Block/Town' 'with break).lp into total/rural/urban .except the items (i), (ii), (vi)
-and (vii) listed above for General Primary Census Abstract.
Source of Uata :
:rlle Primary Census Abstract contains censuS data on1y. For tne compilation of Village Directory schedule alongwith detailed instructions were,sent to the Tahsildars by Jan. 1990. They were· requestecl that the requisite information will be filled up in the prescribed format and returned to the Census Directo~ rate at the earliest.;rhe matter relating to completion of Village Oirectory and its rc:!turn waS pursued vigorouIsy" with the Tahsildars through staff of this directorate posted in the field during the 1991 Census Houselisting and' Enumeration Operations, The Village Directories duly filled-in were rec,eived in this.directorate in May 1991. Likewise, Town Directory Schedules alongwith detailed instructions were sent to Commissiont!rs of Municipal Corporations and Executive Officers of Municipal Committees. The data required for Town Directories were also received back by May. 1991. However, back references had to be made in some cases Where either certain columns of tlte schedule were left bla'nk or information was incosistent with the previbus data, The position was reconciled, in certain case after protracted correspondence with tlae concerned departments/agencies.
Census Concepts ,
1· Rural Urban Classification :
- As in the previous censuses, the 1991 Census dMA aft! presented foi fura1 and tirbarl areas separately.
lluflil Area-Vilhlgd :
The basit linlt fot tlira! area is revenue village Which, in all cases, has definite -Surveyed DoUndaries. 'This may comprise one or more hamlets but the entire village will normally be one unit for presentation Qf data. The definition of village, as adopted in census is identified with that of'Mauza' given under Section )0) of the Pul\fab 'l~and Revenue Act, 1887. It is the Revenue Estate determined as such for the purpose of levy and collection of land revenu~, The Revenue Estate is defined in Act ibid 'as under:
(a) An area for Which separate records of rights exist; or
(b) ~hich haS' been- separately assessed to land revenue, Or would have lieen so assessed if the land revenue had not been .r~alised, compounded or redeemed ; or
(c) Which the State OOVel'hn1ent may by general rule or specific orders declared to be an Esta,te." , ,,-The Village is, thus, not mel'ely the 'Ab.1di deh' (R'ed'lined area in :'Shajra Aks" or "Latha") for
eensus taking but the entire lan'd coming with in the fixed boundaries of each village in terms of the Act ibid.
Urban Area~ Town ! . Urban arc'as are speciallY ;de/hied tQr the cenS'uS ·purpose'S. hi' the 1991 Cehl.tis the saine criteria
!ilS in 1981 Census has been adopted. The urban area in 1991 Census is defined as follows:
(a) All places with a municipai committee or munic!pal <;lorporatioll -or Cantonment Board of Notified Area Committee;
"

23
(b) All other place> which satisfied the fol!owing creiteria
(i) a minimum population of 5000 ;
(ii) atleast 75 j:, of the male nnin workers '::1ga3cd in n.)n-agricuILlral pllrmit~ ; anJ
(iii) a population densit) of atJeast 400 per sq. km.
Whereas in category 'a' all places will be t'lwns in their own right, ia category 'b' only those places will be treated as towns for the purposes of censuS which Directorat~ of CensJ" Operations, of the State/lJT concerned has so declared as 'Census Town' after )atisfymg the above crit~ria.
The urban criteria for census town under category (h) above varied little fro:n that of 1961 and 1971 Censuses. The males working in activities such as fisIling or Jogging ciC. were treated as enf,aged in nonagricultural activity and, therefore, contributed to the 75°~ critcr:on of 1901 and 1971 Censuses, where L1S in 1981 Census, these activitie~ were treated at par Wlt;l cultIvation and agricultural labour tor the p.ur-
. pose of this criterion, fn 1991 Census. like in 198! (\'nsus, tIle activities of livestock, forestery, fis!ling, hunting plantations and orchards and allied activities have bt:en treated as agr~cultUl al activIties while applying the test of male workmg population. A town with a popUlation of one lac and above is called a 'City' in Census parlance.
Urban Agglomeration
Apart from city/toyvn, the 1971 and 1981 concept of Urban Agglomeration is also adopted for the 1991 Census. Very often, large railway colonies, univer8i~y campuses, pert areas, military camps, etc., etc., come up outside the statutory limits of the city!town but adjoining it. Su.;h areaS may not by themselves qualified to be treated as towns, but if they form a contmuou,> spread with the tov"n, they are treated as Out Growths of the town and deserve to be treated as '..lrban. Such tOWnf> together with their out growths have been treated as one urban unit and called Urban Agglomeration. An Urban Agglomeration may conStitute :
(i) A city or a town v;ith a continuou'i autgruwth, the Ol 1 growth bemg outside the statutory lin:its but falling within the boundaries of the adjoining village/villages) ; Of
Ci) One or more adjoining towns with 1"1:e'r ct'!growtbs, if any, CiS in (i) ab,we. or
(Iii) A city and one or more adjc);nin.p,; town, \vith or Without oL.tgrl)wih, all of which form a continuous, spruad.

24
DEMOGRAPHI€: ANALYSI~ BASEn ON tNSET TABLES
Population by CD Blocks :
Sr. Name ott:. D.l'llock No,
'phul
2 RltmpUI~
3 Ilathi8da
;I Nathalllt
.5 Sabea!
Ii Talflandi Saba
7 Jhunir.
g Blldl1lada
9 Mansa
District
'.
'TA1tLE-l(~)
Population and Numbor 01 Village! A9 par 1991 Censu!
population of Villages
Persons
125.388
80.716
149.873
101,396
114.143
142.350
160:914.
154,76:1
179.380
L208.R30.
Mal~H
66.774
43.185
7~650
7),922
85.~86
82,'165
95.132
642.590
5
5S.614
37.531
1.1).223
49.4n
52.5(\'6
65,428
74.923
72.295
83.2~3
566.240
Number or VilIfljles
Total Inhabitato:l Vilbge. VilIage~
6'
3(J
59
32
48
67
a8
73 I
527
7
45
3')
56
67
83
83
73
523
The abbve table sliows population of the rural area of Bathinda district by CD blocks \vith break
up or popUlation into males and females. It also gives number of villages with break up into 'Total Villages' and 'Inhabited Villages'. From this. it is easy to work out the number of 'uninhabited' villages, CD block-wise.
The table reveals that there are 12,08,830 personS, 6,42,590 males and 5,66,240 females i-ll the rural segment ofthe district. Mansa block (1,79,380 persons) and Jhu_nir bloc,k (1,60,914 persons) report the highest and the second highest population,. respectively, where(ts Ram)mra block (80,716 persons) and Nathana block
(1,01,306 persons) report the IO'Yest and the ,second lowest population, respectively, among the 9 community development blocks in the district. Jhunir block (88 villages) and Budhlada block (84 villages) have the highest and second highest nutnber of villages, respectiv~ly, whereas Rampura block (30 villages) and Nathana block (32 villages) have the lowest and the secocd lowest number of villages in the district. In the matter of of number of inhabited villages, tlie position is the same as is,for total number of villages, Jhunir block (88
inhabited villages). -and Budhlada block (83 inhabited villages) report the highest and the second highest number of inhabited villages, whereas Rampura block (30 inhabited villages) and Nathana block' (32 -inhabited
villages) report the lowest and the ,second lowest number. of inhabited villages, respectively.
The table furthef reveals that out of 527 ~total villages' as many as 523 villages are 'inhabited villages'
whereas only 4 villages, are uninhabited. Bathinda block reports 3 uninhabiteli viUages, where as Budhlada
block has the remaining ~ne inhabited village in the distri<;:t The remainin¥ 7 qlocks !1ave no vninhabitc:4 'Yilla~e, ' ,

Population by Towns .
Sr. No.
~ ;..
3
4
Ii
7
8
9
10
11
Nama and Civil Administration Status of Towns
Bareta (M. C.)
Bathinda (M. C.)
Blm,ho Mandi (M. C.) ,
Audhlada (M. C.)
Goniana (Iv!. (_, )
Kot Falta (M.e.)
MamaCM.e)
Maur (M. C.)
Raman (M. C.)
Ramputa Phu I eM. c. ) Sanga! (M. C.)
AI} Towns
25
TABI,E l(B)
Population and Number of TOl'ln!-1991 Ctn3u,~
2
Populafi(ln
Person> Males Females
---_- ----- ----------4 5
-------------11.537
159.042
10,006
18.717
10,415
5,611
55.089
25,180
17275
35,53('
2,731
351.133
6,092
85,286
5,266
9,836
5,459
2,972
29.401
13,517
9.247
J 8,718
1.415
187,259
5,445
73,756
4,740
8.831
4,956
:!,639
25.688
11.653
8,028
16.812
1.316
163,87 ...
Thc above table presents population by townsjUAs with break up into males and females. The table shows that there are 3,51, J 33 persons, 1.87,259 males and 1,63,874 females. residing in the urban segm~nt of th;! di'itrict. B:lthinda MC (U9,Orl p~f')'.w;) an't M,lu',a MC (55,03~) p :r"o:1, arc th6 highest and the second highest populous civic bodies, wh.:reas Sangat Me (2,731 per<;ons) and Kot Fatta Me (5,61 I persons) are the lowest and the second lowest populous towns, respectively, in the district. S:milarlY for males and females the position is the same as if, for persons.
New Towns/Towns Declassified, Merged
TABLE 2
No~~ Tot?ns/To"ns Declassified. Merged in 19)1 ecnsu~
Name of Towl1
-------------------------- - --~
(a) Added
Nil.
(b) Declas~Hled
(i) TalwandiSabo(N",A.C.l
(c) Wholly l'vfcr~rd
N:l.
----------- -----
-------------~-P0;:)Jla'iJ 1
2
12,880
The above table presents that one town, Talwandl Sabo NAC, was ueclassified in 1991 Census. Thus there is a net loss of 12,880 persons in the urban population of the district. The table further reveals that no \leW town is added/wholly merged in any adjOining town in the district dunng 1991 Census.

Decadal Changes in Population
Tahsil
Total Rural--
2 3
Rampura 210,854 178,964 Phuf
Bat)1inda 409,llSl 258,pO
Ta1wandi 192,263 148,638 Sabo
Mansl 491,638 422,857
District 1 304,606 1 C08-,729
- '-~'- -
26
TABLE 3
i>;cadai Change in Di~tribution 01 Population
Urban
4
31,g90
151,611
43,625
~8,7511
295,877
-. .- -
Population
Total Rural
5 6
241,634 206,104
507,651 319,846
230,281 187,826
580,397 495,054
1,559,963 1.20~,830
Urban
7
35,530
187,805
42,455
Perc(lfitaqe Decadal Variation (19.81-=-1991)
Total Rural
8 9
30,510 27,140 ( +14.59) (+15.17)
97,770 61,576
Urban
10
3,640 (+11.41)
36,194-(+23.85) (+23.84) (+23.87)
38,018 39,188 --.1170 (+19.77) (+26.36) (-2.68)
85,343 88,789 72,197 16,592 (+18.05) (+17.07) (+24 13)
351.133 255,357 200,101 55.256 -(19.57) (+ 19.84) (+ 18.63)
Percentag'! of Urban Poplllation
198t- 1991
11 12
15.12 14.70
36.99 36.99
22.69 18.44
13.98 14.70
22.68 22.51
The above table presents population by tahsils with break up into rural and urban for 1981 and 1991 censuses,- decadaI variation (percentage) with break up into rural and t)rban population (percentage) for 1981 and 1991 censuses. '
The table further reveals that Mansa tahsil (5,80,397 persons) is the most populous tahsil, followed by Bathinda tahsil (5,07,651 persons) at 'the second place, whereas Talwandi Sabo (2,30,281 persons) is the least populous tahsil during 1991 Census. The ranking shows no change in 1981 Census. In rural area, again Mansa tahsil (4,95,054 persons) and Bathinda tahsil (3,19,846 persons) repor.t th~ highest and the second highest population in ~91 Census, whereas Talwandi Sabo tahsil (1;81,826 persons) reports tbe lowest . population, In 1981 Census, the ranking shows no change from 1991 Census. ,
/
In· the matter of urban population, Bathinda tahsil (1,87,805 persons) tops, whereas Rampura Phul _ .. tahsil (3.5,530 persons) is at the. bottom during 1991 Census. In 1981 Census (urban popUlation), the ranking
shows no change from 1991 Census. -
As regards percentage decadal variation during 1981-1991 decade, Bathinda tahsil (23·85 per cent) reports the highest growth rate, whereas Rampura.-Phtll tahsil (14·59 per cent) reports the lowest growth rate. In case of rural area Talwandi Sabo tahsil (26·36 per cent) returns the highest. growth rate, whereas the lowest growth rate is returned by Rampura Phul tahsil (15 ·17 per cent) during the decade 1981-1991. As regards urban area, the highest growth rate is reported'in Bathinda tahsil (23·87 per cent), whereas Talwandi Sab 0 tahsil (-2· 68 .per cent) reports a minus growth rate due to the declassification of Talwandi Saba NAC during 1991 Census.
As regards percentage of urban population, the highest percentage is reported in Bathinda tahsil (36·99 per cent), followed at second place by Talwandi Saba tahsil (18 ·44 per cent), whereas the lowest percentage is reported both by Rampuraphul tahsil and Mansa tahsil (14·70 per cent) during 1991 Census. Again Bathinda tahsil (36·99 per cent) tops and Mansa. tahsil (13·98 per cent) is at the bottol11 in 1981 Census.
As a whole we see that the growth rate in rural area has been 19·84 per cent against 18·68 per cent in urban areas, tllereby giving an overall growth,rate of 19· 57 per cent for the district. Further the percentage of urpan population decreas~d frop:l22' 68 per cent in 1981 Census to 22· 51 per cent in 1991 Census.

27
Distribution of Villages by Population Ranges
C; D.'Block! District'
1. PhuJ
2. Rampura
3. Bathinda
4. Nathana
5. Sangat
6'. Talwandi Sabo
7. Jhunir
8. Budhlada
9. Mansa
District
No. and Percentage 01 Inhabited Villages
2
46(8.79)
30(5 73)
56([0.71)
32(6.12)
48(9.18)
67(12.81)
88(16.83}
83(15.87)
73(13.96)
523(100.00)
TABLE 4
Percentage Distribution of Villa2es by Popul ation Ranges '-
No. and Percentage of Villages in each Range (Figures in Parenthesis Indicate Percenfage of Villages in each Range)
------------------------------------------_---------~ Less than 200 200 ~499 50D-1999
3 4 5
1(2.17) 25(54 '35)
15(50.00)
3(5.36) 18(32.14)
1(3.12) 10(31. 25)
20(41. 67)
2(2.99) 40(59.70)
2(:2.27) 4(4.54) 56(63.64)
1(1.20) 3(3.62) 55(1:6.27)
4(5.48) 32(43.83)
3(0.57) 18(3.44) 271(51.82)
2000-4999 5000-.9999 10.000 and Above
6
- .... - -- ... -~-
14(30.44)
11(36.67)
30(53.57)
14(43.75)
26(54.16)
22(32.83)
24(27.27)
21(25.30)
31(42.47)
193(36.90)
7 -~ ... ..,_ -...
5(10.87)
4(13.33)
5(8.93)
6(18.75)
2(4 17)
2(2.99)
1(1.14)
3(3.61)
5(6.85)
33(6.31)
s
1(2.17)
lC3.H)
1(1 '49)
1(1.14)
1(1.37)
5(0.96)
The above Table shows distribution of inhabited yillages by popUlation ranges by CD blocks. The distribution of inhabited villages is both by number and percentages, with break up into 6 popu1ation ranges by CD blocks. It should be noted that the total for colunln 2 strikes vertically Whereas for ranges it struck horizontally.
The table l'eveats that as per column 2 th~ highest percentage of inhabited villages is in 1hunir block (16·83 per cent) and the lowest percentage is in Rampura block (5' 73 per cent). It would be fUrther seen tliat all the ranges are not of even sizes. The table reveals that two ranges 500-1999' and '2000---4999' together account for 464 villages (88·72 per certt) oat of 523 total inhabited villages. The range 'less than 200} reported only 3 villages (0·57 per cent), whereas '10,000 and above' range reported 5 villages (0·96 per cent) and '5000-9999' range reported 33 villages (6·31 per cent). This shows that Bathinda distriGt has villages of larger size as compared to other districts;
In population range '200-4991 the highest percentage is reported in Mansa block (~'48 pet cent)l Whereas Rampura and Sangat blocks reported 'nii' village in this range. In the next higher population range '50~1999', the highest and the lowest percentages are reported in Budhlada block (66'21 per cent) and Nathana block (31·25 per cent), respectively. In the population range '2000-"4999' the highest percentage is reported in Sangat block (54 ·16 per cent), whereas the lowest percentage is returned in Budhlada block (25·30
jper cent). In the next higher population range '5000-9999' the highest and the lowest percentages are reported in I'jathana block (18 ·75 per cent) and Jhunir block (1 ·14 per cent), respectively. In the population range 10,000 and above', PMl, Nathana, Talwandi Sabo, Thunir qnd Mansa biocks report one village each in this
range, whereaS, Rampura, Bathinda,. Sangat, and Budhlada blocks reported no viIla~e.
The table fu~ther reveals that Nathana block has 66 per cent inhabited villages having population more than 2000', tollowed by Bathinda block with 63 per cent inhabited villages having population 'more than 2000'.

Density (persons per sq. km)
Range 9f Density
-10
It-1B
21-'50
sf.:.-roo 101.!....200-
~91-joo
301-500
501+
n"trict
Distributin of ViUhll:es by Density
total No. ofVi!lages in each Density Ranie
2
2
.,
1
'165
294
56
4
523
Pcrc.:mtage of Vjllages in each Density Range
3
0.38
0.19
0.19
31.55
56:21
10.71
0.16
100.0J
..l , •
tbe above tabie shows ,distribution of villages and their. population by various' density rang~. It may be noted that density ranges are not Qf even size. The. highest number of villages 294 are in the density range '201-300' (56·21 percent), followed by 1"65 villageS in density range '101-209' (31·55 per cent) and 56 villages in the density range '301-500' (10·71 per cent) at the second and third places, respectively, wherers no village iSTeported in the denSity r~nge '21-50'.
Sex_.Ratie {Num'ber...of.f4maleli'·per-1bousand "IDales}
l'A'BLE 6(A).
St. Name ofC. D. Block 1\'0. I
, 2
Number of Fe.na1es pef'lOJO Male!
3 ___ ~'~_~ ______ _'_ _________ __' _____ ._'_-,---'_~ ___ -=""""""""",,~ "'.. ~n eo - .qt_
2- ,R.ampura
3 'BIlthinda
4 Nathana
5 s_angat
( ..TalY.-.andi Saba
7 .J~unil"
"8 ~ BtidhR'ltttt
~ MilliS'!! ~
-District
.813
8(j~
gg2
952
-ili4-
'875
-871
877
&66
881
. _~ ':fhe aQov~ !~~le .. presents s~x ·ra~ion by Cp b19cks. The ~ table r~eals. that. . the th!g~est11lnd the s~d :liihneSt ·sex' ratio ls'reoorted'lU Nathana"blo~k .1952- females per thOi'lSatld ,blales) and .S~i.at blo~

29 (884 fe111n'es per thousand'1u1cF), rcsp<.dvdy However. the lnwest and the second lowest sex ratio is reported in M"l1sa block (866 females per tJ1uU~al1d maics) al,J Kampclra block (tl69 f~males per thsousand males). Th:: sex ratl\) for the r:rral scgment (n1l CD b:ocks) is 881 femaJes per thousand maJes which is very close to state sex ratio of 882 females per thousand males.
TABI~E 6(B)
~ex I~atio for Towm
-- - --- --------Sr. ]\.ame and C:\'i; AJmjni~!ralj, .j1 Statu~ 011'0\\0 S No.
--------- -- ------_._----
B aieta (M. c.)
2 Bathinda (M. C.)
Bhuchn ;"fandi (M. C.)
4 Bud:l1ada (M. C.)
5 Goniana (M.G)
b Kat Fatta(M.C.)
7 Mansa(M.C.)
Maur (M. C.)
9 Raman (M. C.)
10 Rampura Phul (~f. C.)
11 Sang"! (M. C.)
All To\\ Us
N Jm!Jer 01 Female~ per 100J, Male,
3
R94
&65
9JO
893
903
8SR
87-l
863
868
890
93.)
875
The above table presents sex ratio by towns. The figures of the table reveals that the highest and tiJe second highest sex ratil) i'l reported in Sangat Me (930 females per thousand males) and Goniana MC (908 feh1aks per thuusand malc~). resp.:ctively, "":lCrc..ts the lowest and the second lowest sex ratio is returned in Maur Me (863 fema10s per lhoUSUld males) and Ba~hiJ:da Me (865 females per thousand males), respectively. The scx ratio for all the towns is 875 femaks per thousand males.
Scbeduled Caste Population :
TABLE 7
Proportion of Sc:·eduled Caste Population to Total Populaticn in the Vill3ge~
---- - -------~------Percentage Range of Scheduled Caste Population
to Total Population Number of VillageS in each Range
Percentage d Villages in each Range
--------- ~-- - ---------------------------------------------------
0-5
6 10
11- 15
16- 20
21- 3(}
31 and above
District
2
8
7
7
37
173
291
523
3
1.53
1.34
1.34
7.07
33.03
55.64
100.00
. The above table Shows distribution of villages and their percentages by ranges of percentages of Scheduled Caste population to total population. The table reveals that the .('d.nges are not of even sizes.
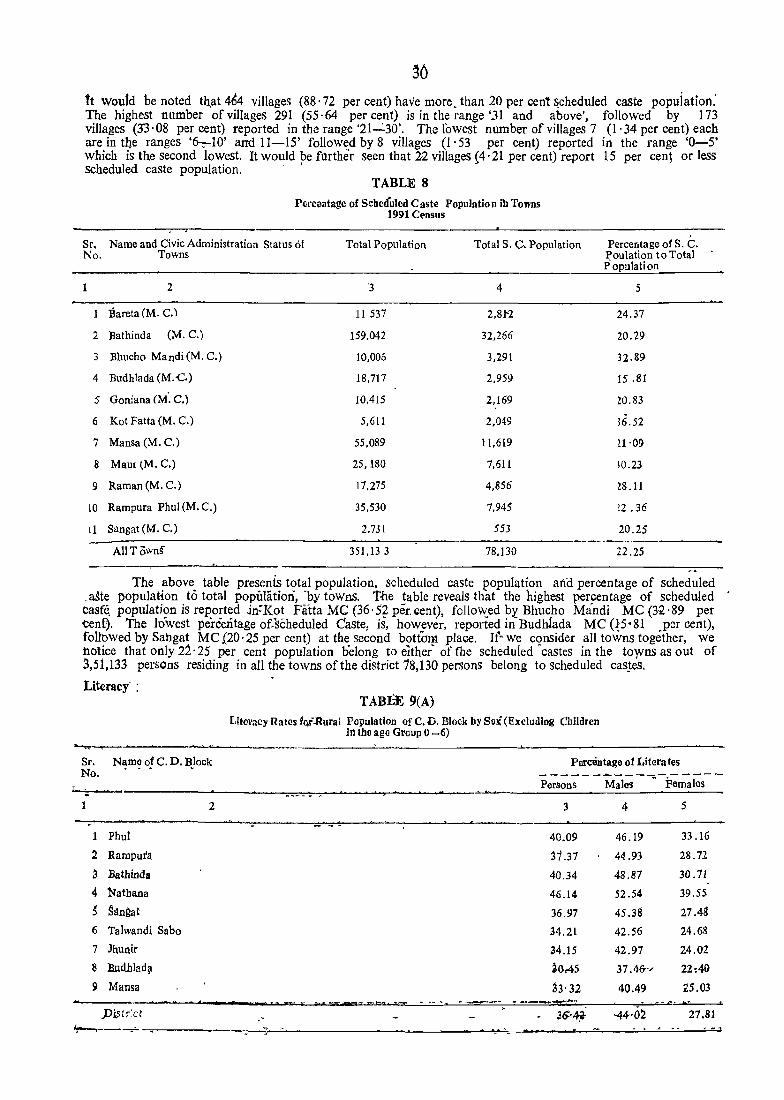
It would he noted tl:J.at 464 villages (88·72 per cent) have more. than 20 per cent ~cheduled caste popuiation: The highest number of villages 291 (55·64 percent) is in the range '.31 and above', followed by 173 villages (33·08 per cent) reported in the range '21__:_30'. The lowest number of villages 7 (1'34 per cent) each are in tije ranges '6c:-IO' and II-IS' followed by 8 villages (1' 53 per cent) reported in the range '0-5' which is the second lowest. It would be further seen that 22 villages (4' 21 per cent) report 15 per cen~ or less scheduled caste population.' -
TABLE 8
Pel'centage of Scheduled Cash! Population ib Towns 1991 Census
Sr. Name and Civic Administration Status 6f Total Population Total S. C Population Percentage 01 S. C. Poulation to Total Population
No. Towns
1 2
Bareta (M. C.)
2 Bathinda (M. C.)
3 Bhucho Mandi (M. C.)
4 Budhlada (M.e.)
5 Goniana (M'. C.)
6 Kot Fatta (M. C.)
7 Mansa (M. C.)
8 Maul (M. C.)
9 Raman (M. C.)
10 Rampura Phu1 (M. C.)
11 Sangat (M. C.)
"3
11 537
159,042
10,006
18,717
10,415
5,611
55,089
25,180
17,275
35,530
2.731
4
2,8t2
32,266
3,291
2,959
2,169
2,049
11,619
7,611
4,856
7,945
553
5
24.37
20.29
32.89
15.81
W.S3
16.52
!1·09
1D.23
~8 .11
!2 .36
20.25 ------------------~--...,.--- ------------_._ ....
All Towns 351.13 3 78,130 22.25
The above table presents total population, scheduled caste l?opulation afia percentage of scheduled _a~te population t6 total populatIon, -by towns. T-he table reveals that the highest percentage of scheduled casfe. populati?n is re~o~t~d in:K?! Fidta Me; (36·~? per, cent), folIo"{,ed?l Bhuc_ho Mandi MC (3:2 ·89 per ·cent). 'The lowest percentage of, scheduled Caste, IS, however, reported 1ll Budhlada MC (15<81 per cent), follbWed by Sahgat MC I20· 25 per cent) at the second bottdm place. If~ We consider all towns together, we hotice that only 22· 25 per cent population belong to eIther- of the scheduled" castes in the toyvns as out of 3,51,133 persOns residing in all the towns of the district 18,130 persons belong to scheduled castes.
Literacy- : TABL~ 9(A)
Litol'acy Rates fci.Rural Population of C. D. Block by Soi (Excluding Chllaren ill tho ago Group 0 -6)
Perc1intage 01 Litera tes -----------------Persons Males ~ Females
3 4 5
40.09 46.19 33.16
31.37 44.93 28.12
40.34 48.87 30.71
46.14 52.54 39.55
36.97 45.3S 27.48
34.21 42.56 24.68
34.15 42.97 24.02
~M5 37.4&'/ 22:4&
33'32 40.49 25.03 wa _ .. - _-.8 ere d"'ie' .... 'e- t:?'1 "'a .. ",--- "" z "=-'" -- _,.;..,..._....._, . -~ 'C • ,
, 36'~ '44-'O~ 27.81 ., -

31
The table presents literacy rates with break up into males and females by C,D blocks. It would be noticed that Nathana block (46, 14 per cent) and Bathinda block (40'34 per cent) report the highest and the second highest literacy rates for pers0ns. The lowest and the second lowest literacy rates are, however, reported in Budhlada block (30·45 per cent) and Mansa block (33·32 per cent), respectively. Again in male literacy rate, Nathana block (52, 54 pe'r cent) and Bathinda block (48·87 per cent) occupy top' and second top positions, respectively, whereas Budhlada block (37, 46 per cent) and Mansa Block
(40·49 per cent) arc at the bottom and next to bottom, respectively. In female literacy, ag'ill Nathana block (39' 55 per cent) and Phul block (33·16 per cent) OCCUpy the top and the second top positions, respectively, whereas, Budhlada block (22·40 per cent) and Jhunir block (24·02 per cent) report the lowest and the second lowest literacy rates. Thus it would be noticed that in total, male and female literacy, Nathana block emerges at the t<;p, whereas Budhiada block occupies the bottom position among all the 10 CD blocks in the district.
TABLE 9(B)
I,itoracy Rato. for Towns 1991 Census (Excluding Chlldroll ill tho Ago,Group 0 -6)
Sr. Nama and Civic Administration Status of Towns PC1col1~ago of Litorates No. -------------------Po/sons Males Females
2 3 4 5
Barcia (M. C.) 52.56 61.45 41.73
2 Bathinda (M. C.) 71.94 19.0'+ 63.18
3 BhllCho Mandi (M. C.) 61.33 70.75 50·90
4 Budhlada (M. C.) 70.84 13.58 62.30
5 Goniana (M. C.) 74.23 82.28 65.62
6 Kot Patta (M. C.) 44.63 52.65 35.57
7 Mansa (M. C.) 63.29 70.65 55.02
8 Malll'(M.C.) 48.82 5~. 76 61.93
9 Raman (M. C.) 56.59 63.85 48.24
10 Rampul'a Phul (M. C.) 63.40 70.15 55.95
11 S angat (M. C.) 60.56 69.36 50.84
All Towns 65.87 73.11 57'67
The above table presents literacy rates with break up into males and females by towns/UA'l. The table reveals that for all towns taken together the literacy rates for persons, males and females are 65· 87 per cent, 73 ·11 per cent and 57·67 per cent, respectively. In case of persons, the highest and the second highest literacy rates are reported in Go niana MC (74·23 per cent) and Bathinda M C (71 . 94 per cent), respectively, whereas the lowest and the second lowest literacy rates are reported in Kot Fatta MC (44'63 per cent) and Maur MC (48·82 per cent). respectively. In male literacy rates, Goniana Me (82·28
• per cent) and Bathinda MC (79'04 per cent) report the highest and the: second highest literacy rates, whereas the lowest and the second lowest literacy rates arc reported in Ko t Fatta MC (52·65 per cent) and Maur MC (54·76 per cent), respectively. In the case of female literacy rates, again Goniana Me (65·62 per cent) and Bathinda MC (63·78 per cent) occupy the top and the second top positions, respectively, whereas Kot Fatta Me (35· 57 per cent) and Bareta Me (42·73 per cent) occupy the bottom and the second from bottom positions, respectively. Thus We notice that in total, male and female literacy, Kot Fatta MC i~ at the bottom among all the 11 civic units in the district,
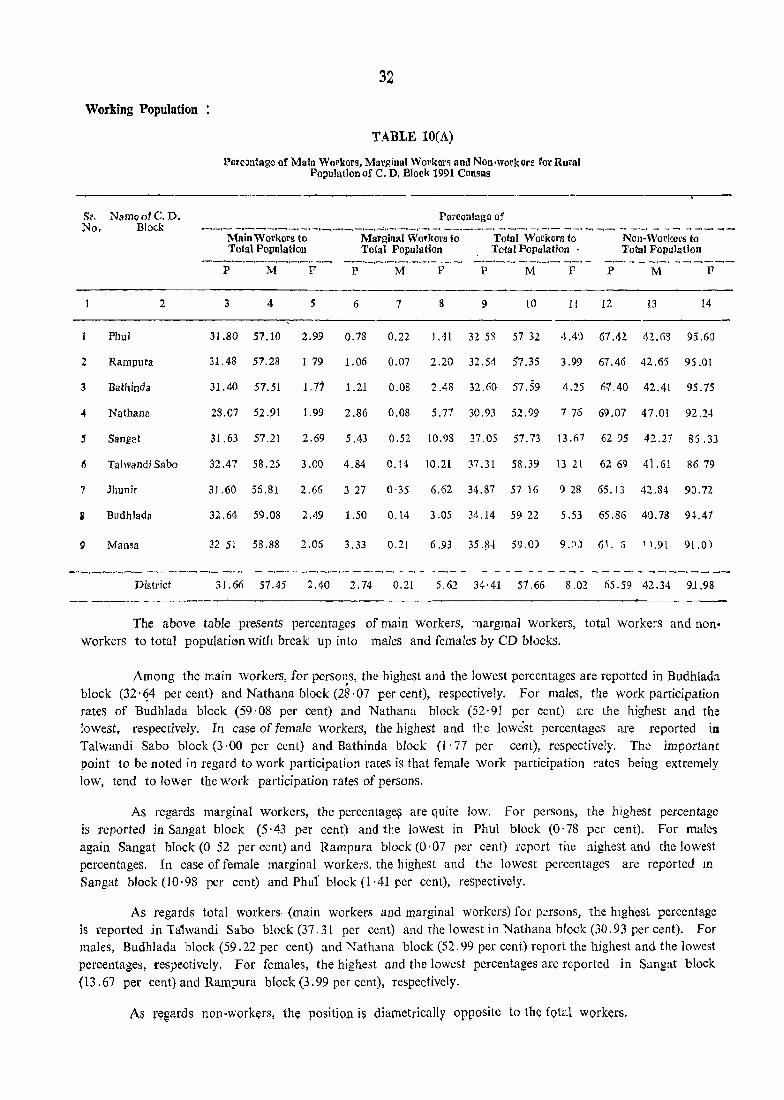
Working Population
Sr. NamoofC. D.
32
TABLE lO(A)
Porcontago of Main Workors, Marginal Workers and Non-workors for Rural Population of C. D, Block 1991 Consus
Porconlago of No. Block -.-,- -~_'-'-~--'-'-~-1-'-'-'-'~'-!'-'-'-1'--' __ '_'_'_ -. __ I -. -._ -.-._. --,:_. -~ _,~_. - -... -. ______
Main W orkllfS to Marginal WorkOl's to Total Work on; to Non-Workers to Total Population Total Population Total Population . Total PopllJation --._.--.-.-. ....--.-.-.-.,...._,. -,_ -·-·_t~._·_·_,_·_·_._ _"-'-- -'-.-.-' -.-.- -.-._--.-. -'-'_-'--
P M F P M F P M F P M F
1 2 3 4 5 6 7 8 9 10 1[ 12 13 14
Phul 31.80 57.10 2.99 0.78 0.22 1.41 32 53 57 32 4.4') 67.'12 42.63 95.60
2 Rampura 31.48 57.28 I 79 1.06 0.07 2.20 32.54 '7.35 3.99 67.46 42.65 95.01
3 Bathinda 31.40 57.51 1. 71 1.21 0.08 2.48 32.(,0 57,59 4.25 (,=7.40 42.41 95.75
04 Nathana 28.07 52.91 1.99 2.86 0.08 5.77 30.93 52.99 7 76 69.07 47.01 92.24
5 Sangat 31.63 57.21 2.69 5.43 0.52 10.98 37.05 57.73 13 .67 6295 42.27 8S.33
6 Talwandi Silbo 32.47 58.25 3.00 4.84 0.14 10.21 37.31 58.39 13 2[ 62 69 4i.6[ 86 79
7 Jhunir 31.60 56.81 2.66 3 27 0'35 6.62 34.87 57 16 9 28 65.13 42.84 9:1.72
Ii Budhlada 32.64 59.08 2.49 1.50 O. [4 3.05 34.14 59 22 5.53 65.86 40.78 9~.47
9 Mansa 32 5! 58.88 2.06 3.33 0.21 6.93 35 .~-1 59.0) 9.0,1 GI. ~ 1'1.91 91.0) ,]
-'-,--.-._,-- -._ --' ....... -._ -,~. - -,_,~ -. -.-._,.-.- - - - -. -. -. - ---------- - - - -- - -. -_-. -----District 31.66 57.45 2.40 2.74 0.21 5.62 34'41 57.66 8.02 65.59 42.34 91.98
The above table presents percentages of main workers, margmaI workers, total workers and nonworkers to total populati<5n with break up into males and females by CD blocks.
Among the main workers, for persons, the highest and the lowest percentages are reported in Budhlada block (32' 94 per cent) and Nathana block (28·07 per cent), respectively. For males, the work participation rates of Budhlada block (59'08 per cent) and Nathana block (52·91 per cent) arc the highest and the lowest, respectively. In case of female workers, the highest and the lowest percentages are reported in Talwandi Sabo block (3 ·00 per cent) and Bathinda block (I. 77 per cent), respectively. The importam: point to be noted in regard to work participation rates is that female work participation rates being extremely low, tend to lower the work participation rates of persons.
As regards marginal workers, the percentage;; are quite low. For person~, the highest percentage is reported in Sangat block (5·43 per cent) and the lowest in Phul block (0'78 per cent). For males again Sangat block (0 52 per cent) and Rampura block (0·07 per cent) report the highest and rhe lowest percentages. In case of female marginal workers, the highest and the lowest percentages are reported m Sangat block (10·98 per cent) and Phu!' block (1·41 per cent), respectively.
As regards total workers (main workers and marginal workers) for persons, the highest percentage is reported in Ta1wandi Saba block (37.31 per cent) and the lowest in Nathana block (30.93 per cent). For males, Budhlada block (59.22 per cent) and Nathana block (52.99 per cent) report the highest and the lowest percentages, respectively. For females, the highest and the lowest percentages arc reported in Sangat block (13.67 per cent) and Rampura block (3.99 per cent), respectively.
As l"t}sards non-workers, the position is diametriCally opposite to the iotal workers.
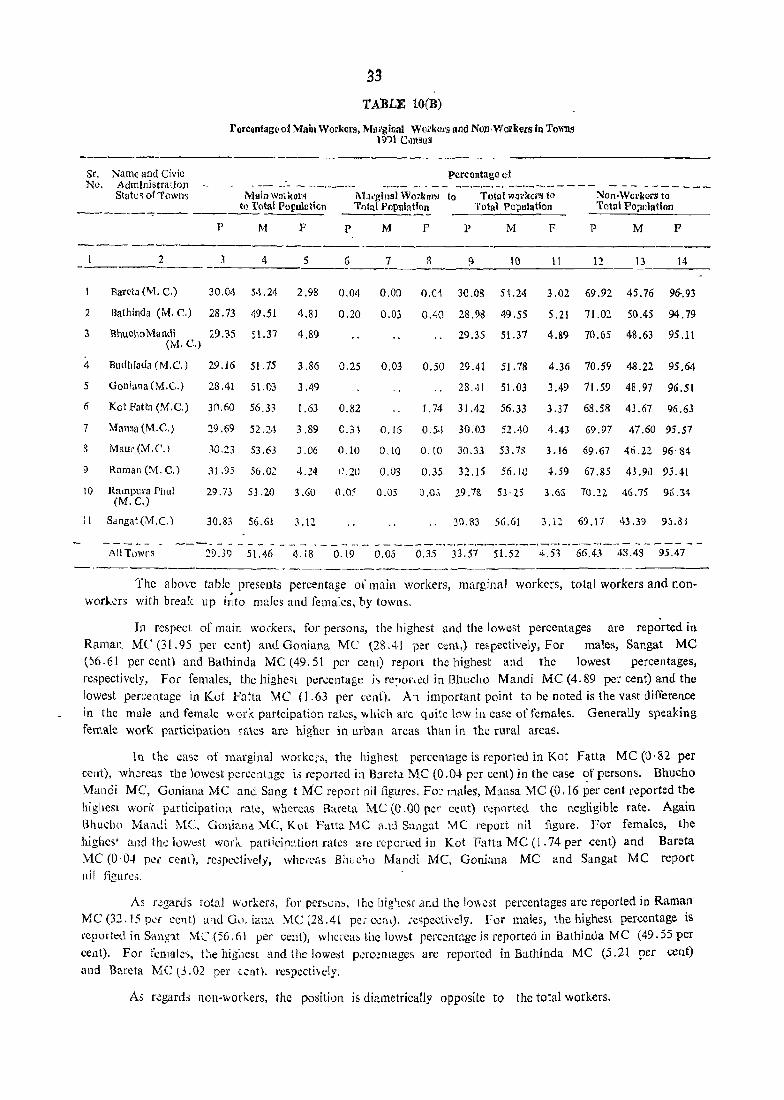
Sr. Name and Civic No. Adm[nistratlo;n
Statt;~ of Towm
33 TABLE 10(B)
Perccnlagc 01 Main Workers, Mal'ginal WOl'kOi's lind Non,WOI'kers in Towns };)?l Cml~1l3
percontage 01 . -.- -.- ~ -.-.-.-.- -.-, __ . - -_ -.-.-.. -.-. _.-.__,--.-----
Main wn,kol's l\iMgillal Woikafs to Toial '\II:Ji'kars to to Total [lopullliion l't)jn.l Population To1al PO-;Julation
----------::'>Ion,Wm'kors to Total PO;lUlation ------,--- ----
P M F P M P P M F P M P -----_. ----_.
2 3 4 5 6 1 S 9 10 11 12 13 14 -Barela (lvl. C.) 30.04 5·L2t! 2.98 0.04 0.00 0.01 30.08 51.24 3.02 69.92 45.76 96-.93
2 Bathil1da (M. C.) 28.73 <\9.51 4.81 0.20 0.03 0.40 28.98 49.55 5.21 71.02 50.45 94.79
3 RhuchoMandi 29.35 51.37 4.89 (M. C.)
29.35 51.37 4.89 70.65 48.63 95.11
4 Buclhlad~ (M.e.) 29.16 51.75 3.86 0.25 0.03 0.50 29.41 51.78 4.36 70.59 48.22 95.64
5 Goniana (M.C.) 28.41 51.03 3.49 28.41 51.03 3,49 71.59 48.97 96.51
Ii Kot Paten (~.C.) 30.60 56.33 1.63 0.82 1.74 31.42 56.33 3.37 68.58 43.67 96.63
7 :Mans" (M.e,) 29.69 52.24 3.89 0.3 \ 0.16 0.5·~ 30.03 52.40 4.43 69.97 47.60 95.57
8 Maur(M.C.\ JO.23 53.63 3.06 0.10 0.10 0,10 30.33 53.73 3.16 69.67 46.22 96'81-') Raman (M. C.) 31.95 56.02 4.24 t).20 0.03 0,35 32.15 56.10 +.59 67.85 43.90 95.4t
10 Rampul'a ['hul 29.73 53.20 3.60 a.Os O.OS 1).0(; 29.78 s}· 2$ 3.66 70.22 46.75 96.34-(M.e.)
II Sangat (M .e,) 30.83 56.61 3.12 30.83 56.61 :; .l~ 69.17 43.39 9;).83
- - - .. ~ - - ___.--~ .... - - - - - .... - - .. - - - -~ - - ------.-. .-~-.-.-._-.. _..-I-.-.-.-·-.-.-- -.. - - - -- ..... -All Towns 29.39 51.46 4.18 0.19 0.05 0.35 33.57 51.52 4.51 66.43 43.43 95.47
The above table presents percentage of main workers, marginal workers, total workers and non
worJ..ers with break up il;to maJes and females, by towns.
In respect of main wo;kers, for persons, the highest and the lowest percentages are reported in
Raman MC(3t.95 pel' e~nt) anuGoniana MC (28.41 per cent,) re&pectively,For males, Sangat Me (56.61 pcr cent) and Bathinda Me (49.51 per cenl) report the highest and the lowest percentages,
respectively, For females, the highesl pcr-:entage i" re:loi',ed in Bhucho Mundi Me (4.89 per cent) and the
lowest percentage in Kut Fatta Me (1.63 per ceni). An important point to be noted is the vast difference in the male and female \'lark partcipation rates, which arc quite low ill ca.se of females. Generally speaking
female work participation rates are higher in urban areas than in the rural areas.
In the cas;: of marginal worker:;, the highest percentage is n:porteu in Kat Fatta Me (0·82 per cent), whereas the lowest pcrccnt.lge is reported in Barctcl Me (0.04 per cent) in the case ~f persons. Bhucho Mundi Me, Goniana Me and Sang t Me report nil figures. For males, M<insa MC (0, 16 per cent reported the highest work participatio:l rat~, W~lCre3.S Barela Me (0.00 per cent) reported thc negligible rate. Again Bhucho Mandi J .... fC, GOi1iana Me, Kot Fatta Me a.ld Sangat ~1C report nil fIgure. For females, the
highc5t ~tI1d tht; lowest worl<.. pariicir~ltjon rates are reported in Kot Fatta MC (1.74 per cent) and Bareta MC (0·0-1 pee cent), respectively, whe,'eas B:1UC:1O Mandi MC, Goniana Me and Sangat Me report nil figur.:s.
As r~ganJs total w0rI;:ers, for per~om, the l1ig'1CS( and the II)'h,st percentages arc reported in Raman Me (32.15 p,'r ce11t) ;J,llU G,). iana Me (28 Ai pc: cenl), ;e~pcctively. For males, the highest percentage is reported in Sang'lt Me (56.61 per ceat), whcrea~ tile low~t percent,~gc is reported in Bathinda Me (49.55 per
cellt). For femak'>, t!le hig:1esL and the lowest p,;ro~nrages are reported in Bathinda Me (5.21 per cent)
and Bareta MC l3. 02 per l.::nt). rcsp.::cthc1y.
As regard" non-workers, the position is diametrically opposite to the total workers.

Amenities in Villages :
- Sr: -Name'OtC. D.~llJock No.
Phul
2 Rampura
<l Nathana
i. "ganga!
.6 TalwMqi Sabo
'1 Jhunir
8 BudhJa~a
9 Mansa
District •
-Distrifiulion oTviIIago! according (iitlio hailabififyolliitfere"nl anWtiiflos"
~o. o.f ])10 (with,pOfQQntago ol.vmagc$.having ono,of.mOl'(l.O! tho fi}Jlowing Amonities) l!lhabJted ---.-___ - ___ . ___ ~ ______ ~ ___ ._"_ __ -_,._. ___ . __ _
village$ I!duca':. Medical Drinking Post & Marketl Commu- Approach- Power ton-- water .Jelegrap1<-Hat ~ niGatioll < ed by. ~ Supply
Pucca R03.d
4 5 8: 9 10 .1:1
46 46 36 46 19 1 41 45 46 (lOO.OO) (78.26) 000.00) (41.30) (2.J,J) (89.13) (97,83). (lOO.OO}
30 30 19 30 11 27 30 30 t!OO.OO) (63 .. 33} (lOJ.OO) «36.67,) (90.00) (100,0;) ..(100.00)
56 55 37 56 31 (98.21) (66.07) (100.00) (5"5.36)
54 56 56 (96' 43) (1'00.00) (100. O)~
32 32 24 32 17 • (l()O,.oO) (75.00) .(100.00) (53~13)
31 '32 ~ n (96.88) (lOO.OO) (100.00)
48' ... 43 23 ·43 U (roo.OO) (47.92) (IOJ.OO) (43.75)
47. - - 'ZI8 < 48 (97 .921 (IO).OO) (10;).0:)) ,
67 65 ~6 67 18 (97 .Oi) (53.73)· (10J .00) (26:8'7/
64 66 _ 67 't. (95.52) (9"3.51) {lO).O:l}
sS 87 46 88 32 (98.86) (52:21)' (100.00) (36':"36T
69 88, 88 (78.41) (l0;).0:l) (10').0:1)
83 . &2 41 83 24 1 .72 83 83 (98.80) _(49.40) (190.00) (28.92) (1.20) (86.75) (100,00). (103.00)
73 7'C; 40 73 32-· (98.63) (S4,79) (100 :00) (4'3.'84)
"67 73 13 (91.78) (100.60) (1~.OO)
523 511 302 523 205 2 472 521 523 (98.85) (57.7~1J (100.00) (39.2Q) to.38) (90.25) (99.62) (10,0.00)
The above table pres~nts distribution of villages (number and percehtages) which avail one or more aIl1enities, .by-CO' blocks.
The 'table reveals that 517 villages (98.85 per cent) avaiithe'amenity of education locally, the highest percentage. (l00. 00 per cent) being in Phu], Rampura, ,Nathana. and Sangat blocks, whereas the lowest percentage being' in Talwandi Sabo block (97.0-1 per cent). There are 3.02 villages (57.74 per Cent) which avail the amenity of medical locally, the highest percentage' being reported in Phul block (78.26 per cent) and the lowest in Sangat ·bfock (47 ·92 per cent) .. The amenities of drinking water and power supply ure available in C,~i1t per .Ci!nt viUages of th; district Bat important points to be noted here. are, firstly 'aU villages do not enjoy the amenity of protected. drinking water and secondly aH househOlds do, not enjoy the amenity of power supply (electricity). The amenity of post and telegraph is available only iIi 205 villages' «39 . 20 p.!r c~.at1, the highest and the lowest • percentages being reported in Bathinda block (55·36 per cent) and Talwandi Sabo block (26·87 per cent), respectivefy.
The amenity of m'arketjhat is available in· only 2 villages (0·38 per cent), one village ~ach in Phul and Budhlada blocks, out of the nine blocks in the district. TJiere. 'are 472 villages (90·25 per cent), where amenity of communication is available locally: the highest and the lowest percentages being reported in Sangat"block (91·92 per cent) and Jhunir block (78 -41 per cent), respectively" The amenity of approaCh
,by pucca road is aVailable in 521 villages (99· 62 per cent), locally .. This ~hows that the position'in regard ~o provision of'pucca road is quite comfortable in the rural areas. Out of nine blocks" seven blocks reporte,d cent per cent villages approachable through pucca road. However, 'Talwandi $abQ plocl.~ and Phul block reporlcd 98· 51 per ceut and 97·?3 per cent villages, respectively.

35
The ab-ve Lb!e ,h"w, perc~nbg, s or PJP Ilation nv.tiling various amenities locally. by C. D. blocks.
Amanities by p!)pulatio~1 seTv;,)d : TAULE 1~
Proportion of Rural population 9crved by diti'oront AiIlonjtie~
Sr. Name of C. D . .Block No.
2 _-_ ---Phul
2 Ramp-ura
3 Bathinda
4 Nathana
5 Sangat
6 Talwandi Sabo
7 Jhunir
8 Budhlada
9 Mausa
District
Total PopuJa-tion of
lnhabitcd VIllages in the C.D.Block
3
125.388
80.716
149,873
101.306
114,143
~~42,350
, 160,914
154,760
179,380
1.208.830
No. (Proportion of Rural Population sernd by the amenity of) - --- -.. ~~ - ~ -,_,--- _-_--_. --------.-.-~---------
Educatioil Medical Drinking Post & Marketl CommlJni- Approach Power Water Telegraph Hat cation by Supply
Pucca ROJd
4 5 6 7 8 9 10 11
100.00 89.78 100.00 62.59 7.00 94.33 98.86 100.00
100.00 82.34 100.00 59.49 92.44 100.00 100.00
99'70 79.76 100.00 72.94 98.02 100.00 100.00
100.00 87.23 100.00 63.38 98.89 100.00 100.00
10n.OO 61.51 100.00 54.35 98.61 100.00 100.Oll
98.14 66.24 100.00 44.06 97.69 99.43 100.00
100.00 67.56 100.00 57.78 86.94 100.00 100.00
99.99 65.46 100.00 51.61 5.16 91.65 100.00 100.00
99,81 73.56 100.00 63.36 93.35 100.00 1(10.00
99.71 73.91 100.00 58.84 1.39 94.37 99.81 100.00
As regards education 99.71 per cent of the rural pJpulation avails this facility locally, the lighest per e,)lltag ~ being reported in Phul, Rampura, Nathana, Sangat and Jhunir blocks (100.00 per cent), whereas the lowest percentage is reported in Talwandi Sabo block (98.14 per cent).
As regards medical facility, 73.91 per cent, population avails it locally, the highest and the lowest being reported in Phu! block (89.78 per 'cent) anJ Sangat block (61.51 per cent), respectively, The facility of drinking water and power supply is available to cent per cent population in alllhe CD blocks in the district.
The post and telegraph. amcnity is ava.ilable to 58.84 per cent population, the highest and the lowest percentages being reported in Bathinda block (72.94 per cent) and Talwandi Sabo block (44.06 per cent)j respectively. The facility of market/hat is av~ilable to only 1.39 per cent population only. This facility is reported in Phul block (7.00 per cent) and Budhlada block (5.16 per cent), out of 9 blocks in the district.
The amenity of communication is availed by 94' 37 per cent population, the highest and the lowest percentage being rep.orted in Nathana block (98' &9 per cent) and Jhunir block (86-94 pel" cent), respectively. The amenity of approach by pucca road is available to 99· 81 per cent population, the highest percentage (100·00 per cent) being reported in Rampura, . Bathinda, Nathana, Sangat, Jhunir BUdhlada and Mansa blocks, whereas the lowest percentage is reported in Phul block (98·86 per cent).
Amenities by distance ranges : TABLE 13
Distrlbution ot Inhabited viiiag"g not having certain nmclJities arranged by Distance ranges from the placu whore those are available
Sr. Villages not having the Amenity of Number of villages where ::menity isnOl No. available and available at a Distance of
----------------------SKms. 5-10 Kms. lO+Kms. Total
2 3 4 5 6
Education 6 6
2 Medical 19() 23 ~ 221
3 Drinking Water .. 4 Post and Telegraph 285 28 5 318
5 Market/Hats 124 215 182 521
6 Commu niea tion 51 51

The above table' presents distribution of viflages, where paiticular amenity is not available focalfy but is available at som~ distanc0 with break up into three rang)s by amenity. A column showif!g totals for villages has also been given.
The reveals that in most villages the ame!1ity is available in distance range '-5 kms '. In regard to ..education, alL6 villages._av_ail this facility. in the distance range '- 5km'. In regard to medical, 190 villages avail it in the distance range'-.5'. kms. whereas 23 villages avail it in the distan~ range '5-10 kms' apd 8 villages in the distance range' 10' -I-kms·. In. regard to post and telegraph, 285 villages avail it iri the distance r~nge'- 5' kms, whereas 28 villages avail it in the distance range '5-10' kms' and 5 villages in the distance range'10'-I-kms', in regard to market/hat, 124 villages avail it in the distance range '- 5kms' whereas 215 villages avail it in the distance range '5-10 kms' and 182 villages avail this facility in the distance range '10~ kms' . In regard to communicafion, all 51 villages avaIl this facility in the distanc;e range ;_. 5 kins'.
Amenities by distance range from Nearest town
TABLE 14'
Di~fribution of ViIlag~9 according t~ the Distance from the Nearest Town and Availabilit, of Dillerent Amenhies
Distance Ranges from the No. of No .. (With Percentage of VlJIages having .0De or more of the following Amenities) Nearest Town Irthabi- --------~--------------------------------(in Kms) tad Educa- Medical Drinking Post & MarKetf- Qommuni- Approach Power
Viflages tion . Water Telegraph Hat cation by Supply Pucca Road
-1 3 4 S 6 7 8 9 lQ
0-5 129 127 :74 129 • 47 -{o~,b 118 129 129 (24.67) (98.45) (57.3'6) (l00 .00) (36.43) (91.47) (l00.00) .(100.00)
6 - 15 282 280 162 282 112 261 281 282 (53.92) (99.29) (57,45) (100.00) (39.72) (94.68) (99.65) (l00.00) ...
16- 50 111 109 65 111 45 1 86 110 111 (21.22)_ (98.20) (58.56) (100.00) (40.54) (0.90) (77.48) (99.10) (100.00)
51+ 1 1 1 1 1 1 1 1 (0.19) (100.00) (100.00) (100.00) (100.00) (lOo.bO) (100.00) (100'00) . _._k------ _~ _.! _ - - ____ _ -L ____ _..,~ _______ - ____________ - ___ -.. _______ "'-:' ____ -
Total 523 ~17' 302 523 205 2 472 521 523 (98.85) (;7.74) (100.00) (39.20) (0.38) (90.25) (99.62) (100.00)
The above table presents distribution of viIlages wIth percentages, availing various _amenities locally by distance ranges from the nearest town. The table reveals that in the distance range. '51-I-kIDs', there is only one Village, which enjoys all the amenities, except market/hat, locally.
In other ranges, as regards education, the. highest percentage ofvi11ages is reportea in the distance range '~IS kms' (99·29 per gent), wh.er~as the Iow~sfpercentage is repor,ted in the distallce range '16-50.kIns (98·20 per -tent). In respect of medical "amenity, the high~s't percentage of' villages is in thedistance range '16-50 knis'" (58·56 per Ceni) wnereas -t1ie~ [ow est percentage is in tne -Ois1ance range (0-5 luns') (57,36 percent). In regard to post and felegraph, the highest percentage is reported in the distance range '16-50 kms' (40·54 per tent). arid the lowest percentage is reported in the distance range '0-5 kms' (36, 43 per cent). In tne _ matter 'oT marKeifhat, the higlieSl: ~ percenfage is feproted ilf tIre distruiC'e r~e 16-50 killS' (0·90 {'er cellt), whereas the lowest percentage is reported in the distance range '60-5 kIDS, (0'78 per cent). The distance range '6"":15 kms' and '51 +kms' report nil figures. In the matter of communication, the highest and the lowest percet1.tages ofviJIages are returned in the distance range '6-15 km's (94·68 per cent) and '16-50 kms' (77·48 per cent) respectively. In respect of approach -by pucca road, the highest percentage is report~d in the distance rang~ '0-5' kms' (100·00 per cent), whereas the- ,iowest percentage is reported in ~he distallce range' 16-50
km~~(99'10 per eent).
In the matter of'drinkinl! Water and power supply. cent per cent v111ages have avail these amenities locally.

TABLE 15
Distribution ot VlIIa'ges Accoldihg to the Population Range lind _Availability ot Different Amenitie. ,
Population Ranges .No. pf No. (WHb Percenhlgc 01 Villagelli4viottoiie)li more.of Ibe following Amenitlc!s) lnhabi- ------~~~-~~~--~-~---~~~--------~--------ted Edbcatjon Medical Drinking Post & f Marketl Cotnmunl- Approach Power Villages Water Telegraph Hat cation by Supply
Pucca Road
1 2 3 4 5 6 7 8 0} 10
-499 2i 17 5 21 2 16 21 2l (4.02) (80.95) (23.81) (100.00) (9.52) (76.19) (100.00) (l00.00)
500-1999 271 269 106 271 43 234 269 271 (51.82) (99.26) (39.11)- (10G.00) (15.87) (86.35) (9~ .26) (100.003
2000-4999 193 193 IS3 - 1.93 123 184 193 193 (36.90) (100.00) (79.27) (lOO.On) (63.73) (95.34) (i00 .00) (100.00)
5000+ 38 38 38 38 37 2 33 38 38 (7.27)' (100.00) (100.00) (100.00) (97.37) (5.26) (IOll.OJ) (IOi).OO) (lOO.On)
~------------~-~-~--~~----~---------~-~-~----~-------------~ Total 523 517 302 523 205 2 472 521 523
(98.85) ( 57.74) (l00.00) (39.ilO) (0.38) (90.25; (99.62) (100.00)
The above table presents distribution of villages by hdrhber aM percentages, where amenities are locally available, and by population ranges. It would be seen that llS the size of the population range increases, the percentage of villages also increases. This applies to all the amenities ex~ejJt approach by pucta road, where poprllation range '...:...49~' has higher percentage (100'00 per cent) of viliages than the population range '50G-l999' (99·26 per «ent). It. is bl.{t obvious that larger·villages have greater chances to avail a particular amenity as compared to smaller'" villages. this however, does not hold good in case of amehities of drinking water and power suppJy as these amenities are availabe to cent per cent villages, iii. all popUlation ranges, in the district.
Land Use: TABLE i6
Distribution of Villages Accordiog to the Land use
Sr. Name of C. D. Block No. of Total Percentage of Percentage of Inhabited' Area Cultivable Irrigated Area Villages
No. in Hectares Area to to Total Culti-
Tolal Area vitbleArea .
1 2 1 4 5 6
1 Phul 46 54,318 90.&6 77.23
2 Rampura 30 33,19.8 91.85 81.71
3 Bathinda 56 64,176 81.22 77.02
4 Natliana 32 39,~54 g7.84~ 77.79
5 Sangat 48 57,761 93.44 74.53
6 talwiin~i SaUd 67 <is,4i9 92.14 72.74
7 Jhunir 88 73,279 90.l3 78.70
8 Btldhlada 83 6iS,oi9 90.6j 74.38
9 Mansa 73 74,976 91.80 78.48
------Distrid 523 53i.1l0 90.96 76.66

38
The table presents total area, percentage of cultivable area an4: percentage- of irrigated area' .. by CD blocks. Mansa block (74,976 hectares) and Jhunjr block (13;279 hectares) report the highest and the second high~t area. whereas Rampura block (33,198 hectare) and Nathalia (block 39,964 hectares) report the lowest and the second lowest area, respectively, in the. district. However, in the case of percentage of cultivable. area. to total area, Sa!1Sat block (93· 44 per c~t) and Tal wandi Sa1:5o block (92 -14 per cent) .report the hIghest and the second hIghest percentages, respectIvely, whereas the"lowest and the second lowest percentages are reported in Nathana block (87, 84 per cent) and Bathinda block (89: 22 per cent), respectively. As regaros perce~tage. of i_rrigateq area to total cultivab)e _area, the liighest and fhe second highest percentages ate ,reported in Ram'pura, block (81, 7.1 per cent) and Jhunir block (78' 70 per cent), respectively, Whereas the lowest and the second lowest percentages are reported in Talwandi Sabo block (72'74 per cent) and Budhlada block '(74· 33 per cent), respectively.
'Per Capita rec~ipts and" expenifftore fn toWns-,:
IV
I
IV
IV
IV
V
11
Class, . Name and Civic Administration Status 01 ToWns
Baleta (M. C.)
Bathinda (M. C.)
Bhucho Mandi (M. C.)
Bhudhla'da (M.C.)·
(jonia~a (M. C.)
Kot Falta (M. C.)
Mansa (M. C.)
III Maur(M.C.)
IV Raman (M. C.)
lfl Rampura P'huf (M. C.) 1
VJ S,1Iltga-' (M. C.)
AU'fowns
TABLE 17 Per Capita -ReceiPt and Expenditure in.Towns. 1988-89
Per Capita
--------~~~t-------~-------~~;~~-------------------~--~-- ~~~-~-~----~------------------Total Receipt Roceipt Total General Expendi'" Public EXpClndi- Other
Reciept Through from AU- Ellpendi- . Adminis- ture on Works ture on . aspeots
2
214.53
4"17.51
264.54
302.46
.243:69
82.98
223.13
163.88
256.10
1!J3.05
~84.06 ,"jo-
308.90 .
Taxes other ture tration Public PUblic
3
84.25
242.23
16.19
142.41
150.65
15.65
129.61
88.74
15.84
15.96
94.29
155.08
Sources Health Institu-
4 5
130.28 157.67
175.29 475.65
.248.35' -260.04
160.20 279.38
9:;.0~ __ ~Z4.~1 _
67.33 7J .48
93.52 219.72
75.14 - 165.25
240.25 259.55
179.09 191.27
89.71 182.86
153.82 332.08
~ Con- lion venience
6 7
48.37 26.00
22.31 151.51
,90.65 85.95
59.20 134.50
66.54 116.18
9.07 •
32.40 104.41
45.15 5.20
llS.98 56.00
41.73 ~6.21
53.97 33.98
38.33 110.04
8
65.53
65.17
41.87
44.77
53.96
56.94
5.30
13.54
48.72
12.97
36.98
43.56
9
2.50
8.02
W7
2.31
0.24
0.32
10
17.77 '
236.65
39.08
32.90
34.66
S.47
75.30
101.11
38.53
44.36
57·93
0.99 137.66
The above table presents per capita receipt and -expex:diture of 11 to~ns 2f the district during the year 1988-89.
. In the matter of per capita total receipts, Bathinda Me tops (Rs.417·51) followed by Budhlada. Me (Rs. 302·46), wheteas the loWeSt and the second lowest r~ceipts are reported by Kot Fatta Me (Rs.82·98 and Maur MC (Rs. 163· 88), respectively.
In respect of per capita 'receipts through taxes' the highest and the second highest receipts .are reported in Bathinda Me (Rs.242·23) and Goniana MC (Rs. 150·65), respectively, whereas the lowest and the second iowest are repoted in Kot Fatta MC (Rs. 15·65 and Raman MC (Rs. 15'84),- respectively. As . regards per capita 'receipJS from all other Sources' Bhucho Mandi Me (Rs.248 ·35) tops, whereas Kot Fatl:a Me (Rs. 67·33) is at bottom.
In the matter of per capita expenditure, the highest is incurred by Bathinda Me (Rs. 475-65) folJowed by Budhlada Me (Rs.279·38), whereas Kot Fatta Me (Rs. 71'48) and Bareta Me (Rs.157·67) retained the bottom and second from bottom positions. In Raman MC (Rs. 115·98) and K;ot Fatta MC (Rs. 9·07), expenditure on iteln 'General Adlllinistration' are at the top and at the bottom pOSitions. respectivel)', As r~ards per capita 'expeps!iture on public health convenienc;es', the highest and the l!)west positions are occupied by Bathinda MC (Rs ... 151· 51) and Maur MC (Rs. 5· 20), resp~ctively Kat Fatta MC reports' nil figure. " .
-'

In the matter of per capita 'expenditure on public works' Bareta MC (Rs, 65· 53) reports the high~st,. whereas the lowest is reported in Mansa MC (Rs. ~. 39) ~s regards, per capita expenditure on other aspoots, the highest and the lowest are reported Bathinda MC (Rs. 236·65) and Kot Fatta MC (Rs. 5 ·47 ), respectively. Per capita expenditure on public institutions, i~ the highest in Budhlada Me (Rs.8· 02) and the lowest in Maur MC..(Rs.0·24). A cursory glance through the different heads of receipt and expenditure reveals that Bathinda
M C is the most prosperous, whereas Kat Fatta is quite backward in the district.
Educational Amenities :
Class. Name and Civic Administration Status of Towns
TABLE 18
Sebools per 10,000 Population in Town.'!
Number per 10,000 Population --------~--------- --- - --- -- - -----
Higher Secondary/ Junior Prima\,}, Secondary( Matriculation Secondary! Inter/PUC! Middle Junior College
2 3 4 5
IV Bareta (M. C.) 0.87
0.38
0.87 2.60 4.33
I
IV
IV
IV
V
II
III
IV
III
VI
Dathinda (M. C.)
Bhucho Mandi (M. C.)
Budhlada (M. C.)
Goniana (M. C.)
Kot Fatta (M. C.)
Mansa (M. C.)
Maur (M. C.)
Raman (M. C.)
Rampura Phul (M. C.)
Sungat (M. C.)
0.54
0.40
0-58
0.63 0.57 1.45
1.99 2.00 3.00
1.07 1.07 2.14
1.92 2.88 1.92
1. 78 7.13
0.54 0.91 1.82
0.79 1.59 2.38
1.74 2.32
2.25 1.97 1..97
3.66 3.66 10.98
------------------------------------------------------------_ All Towns 0.34 1.00 1.03 2.02
The above table shows location of various types of educational institutions per ten thousand of population by towns.
In the first category of Higher Secondary/Inter/PUCfJunior College, 1lareta Me (0·81 school) reports the highest and Bathinda Me (0' 38 school) reports the lowest figure, whereas Bhucho' Mandi Me, Budhlada MC, Goniana Me, Kot Fatta Me, Rampura Phul Me and Sangat Me report nil figures.
r n the second category i.e. Secondary/Matriculation schools, Sangat MC (3· 66 schools) topS, whereas Mansa Me (0'54 school) is at the bottom.
In the third category of Junior Secondary/Middle Schools, again Sangat Me (3, 66 'schools) reports the highest figure, whereas Bathinda MC (0·57 school), reports the lowest figures, whereas Kot Fatta MC and Raman Me report nil figures. .
In the fourth and the last ~ategory of Primary schools, again Sangat MC (10·98 schoolsJJ reports the highest figure, whereas the lowest figure is reported in Bathinda (I ·45 schools). A cursory glance through the table reveals that Sangat MC is far ahead of other MCs in the provisi~n of educational facilities,
except Higher 'Secondary/lnter/PUC/Junior College.
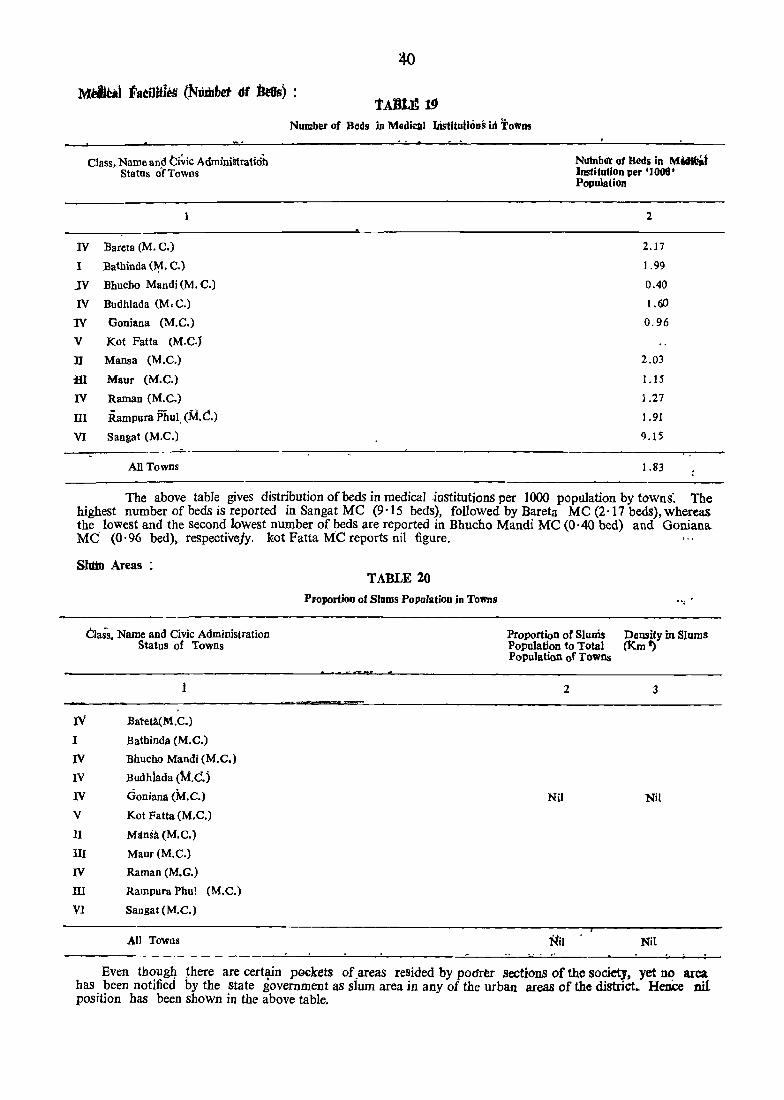
Class, Name and Ci~ic AdminiStratidh Status of Towns
IV Bareta (M. C.)
I Bathinda (¥. C.)
JV Bhucbo Mandi (M. C.)
IV Budhlada (M, C.)
IV Goniana (M.C.)
V Kot Fatta (M.C.J
n Mansa (M.C.)
HI Maur (M.C.)
IV Raman (M.C.)
III Rampura Phul, (M.e.) VI Sangat (M.C.)
All Towns
~o
tADtE 19 Number of Beds in MediCllI lJistitUI!ODS iJJ Towns
Nutnber of Beds in M~t Institution per '1006' Population
2
2.17
1.99
0.40
l.60
0.96
2.03
1.15
1.27
1.91
9.15
1.83
The above table gives distribution of beds in medical .institutions per 1000 population by towns: The highest number of beds is reported in Sangat Me (9 '15 beds), followed by Bareta Me (2 ·17 beds), whereas the lowest and the second lowest number of beds are reported in Bhucho Mandi Me (0·40 bed) and Goniana. Me (0· 96 bed), respectivejy. Not Fatta Me reports nil figure.
Shtin Areas :
1'1 I
IV
IV
IV
V
II
Class, Name and Civic Administration Status of Towns
BatetA(M.C.)
Bathinda (M.C.)
Bhucho Mandi (M.C.)
Budhiada (M.e.) Goniana (M.C.)
Kot Fatta (M.C.)
Mansa (M.C.)
III Maur (M.C.)
IV Raman (M.G.)
ill Rampura Phu] (M.C.)
VI Sangat (M.C.)
All TO'Wns
TABLE 10
Proportion of Slums Population in T01l'lls , .~
Proportion or Sluais Density in Slums Population to Total (Km ~ Population of Towns
2 3
Nil Nil
l'-til Nil
Even thoug~ ~here are certain pG£kets of.areas resided by podrer sections of the society, yet DO area has been notified by the state government as slum area in any of the urban areas of the district~ HenCe nil position has been shown in the above table.

41
Most Important Commodities
TABLE 21
Most Important Commodities Manufacturd, Imported and Expo.ted in Towns
Class, Name and Civic Three Most Important Commodities Administration Status of --------~ ..,___--.-----------Towns Manufactured Exported Imported
---------- ---_. __ ._----JJ III 1 n TIl II III
2 3 4 5 6 7 8 9 10
---IV Bareta (M.C.) Le"ther Mustard Cc'tton Rice aod Cotton Rice Oil Seeds Jaggery Sugar
Sboes Oil Cloth Vegetable Bales Oil
I Bathinda (M.C.) FertIlizer G.I. Pipe Seeds Fc.rtihzer Vanaspati GJ. Pipe Cloth Coal Rice Oil
IV Bbucho Mandi Ice Oil Cakes Agricultural Cotton Oil Agri. Salt Cloth Sugar/ (M.C.) Impleme- Seed Cakes Implements Vanaspait
ments Ghee
IV Budhlada (M.C.) Must~rd Buckets Shoes and Cotton Wheat Rice Mustard Leather Rice Oil Soda
IV Goniana (M.C.) Agei- Furnitue Shoes Raw Furniture Oil Raw Wheat Oil Seeds cultural Cotton Seeds Cotton Imple-ments
V Kot Fatta (M.C.) Agri- Shoes Furniture Cotton Wbe~t Agri, Sugar Rice Gur cultural cultural Imple- Imple-ments ments
II Mansa (M.C.) Tubewell ChappaJ/ Grinding Ginned ChappaI/ Agri- Cottl))} Mustaru Vanaspati apparatus Shoes Marchines Cotton Shoes cultural Ghee
Jmple ments
III Maur(M.C.) Rubber Electrical Hand Processed Mustard Wheatl Cotton Mustared Wheat/ Shoes Material Pump Cotton Oil Gram Gram
accesso-ries
IV Raman (M.C.) Cotton Agri~ Shoes Cotton Oil Mustard Cotton Karyana Ooth Cloth cultural Bales Cakes & Cotton goods
Imple seed oil ments
III Rampura Phul Ginning Agrj- Dog Cottonl Rice Vegetables Cotton Paddy Mustard (M.e.) blade cultural Spikes Cotton Oil
ImPle Seeds ments
VI Sangat (M.C.) Agri- Furniture Shoes Cotton Oil Oil Cakes Wheatl Raw Fertilizer cultural Bal~s Grams Cotton ImPle-ments
The above table presents distribution of three most important commodities manufactured/exportedl imported by towns. A cursory glance with regard to commodities manufactured/exported reveals that Bathinda city which is the largest city of the district, specialises in the manufacture and export of fertilizers and 01 pipes. However, these' products have a wide market and are exported to other parts of the State. Some medium and small scale industrial units engaged in cotton ginning and preSSing, manufacture of agricultural implements, electrical goods, mustard oil and oil cakes, etc. arc located in Budhlada, Goniana, Kot Fatta. Raman, Rampura Phul and Sangat. Cotton bales, cotton seeds are the most important com-modities exported to the other parts of the State and the country from this district.

43
PART-A
VILLAGE AND TOWN DIRECTORY


SECTION-I VILLAGE nmECTORY
45


CODES USED IN THE VILLAGE DIRECTORY
47


49
:SOTE EXPLADNJNG THE CODES t;SED IN THE VILLAGE D'iRECTORY
The village Jircctory containing information about e:tcb vmage ha!'= been prepared for edch Community Development Block in the ascending order of the census lo.;ation code number e.g., }ocat;oll .::ode No. 20/R.'3/22 means village ~o. 22 tahsil ~o. 3 of district ;--:0.8 of the State ~o. 20. Jt contams information relating to total area of the villages in hectares, total population, ~o. C'[ household,;, an.;m.ics avaiiable In the village i.e., educational, medical, drinking water, posts and telegraphs, communication. approach to village. nearest town and distan.:e (in kms.) a:1d power supply. Besides it gives bformation regarding, land-use i.e., area under different types of land usc like forest, irrigated and un-irrigated, cultiva!1le and uncuItivahle land.
Information about the amenities avaiiab:e ha~ been given in columns 5 to 10 of the directory.
(i) Educational facilities have been ,>hown by adopting t:1C following abbreviation;; :-
P - Primary School
M - Junior Secondary or Middle School
H - Matriculation or Secondary School
PT.;C - Higher Secondary 'Interm.::diate, Pre-University 'Junior College
C - - College (graduate level alld above) like Art!>, Science, Commerce, etc.
1 - Industrial
Tr. - Training School
AC - Adult Literacy Clal>s, Centre
o - Other Educational Institutions. These may include Sanskrit Pathshalas, Semor BasIc School, Mukhtab, etc.
Where figures like P(3), M(2), H(l), etc. occur, these donote that the village has three primar), two middle and one matriculation or secondary school.
(ii) Medical facilities have been shown by the use of the following abbreviation., :-
H - Ho'>pital
MCW - Maternity and Child Welfare Centre
MH - Maternity Home
cwe - Child Welfare Centre
He - - Health Centre
PHe - Primary Health Centre
PHS - Primary Health Sub-Centre
D - Dispensary
FPC - Family Planning Centre
T B - TB Clinic
J'.JH - Nursing Home
RP - Registered Private Practitioner
SMP - Subsidised Medical Practitioner
CHW - Community Health Worker
CHe - Child Health Clinic
o - Others
Number of institutions, if more than one jn any vj]Jage, have been given in brackets against each.

(iii) The types of the potable drinking water.sU})ply and the sources available in the village have been indicated by the following codes :-
T - Tap Water
W - Well Water
TK. - Tank Water
TW - Tubewell Water
HP - Hand Pump
R - River Water
F - Fountain
C - Canal
"L - Lake
S - Spring
N - Nullah
o - Others
NA - Information not available
(iv): Post and telegraph facilities have been shown by adopting the"following abbreviations :
PO - Post Office
TO - Telegraph Office
PTO - Post and Telegraph Office
Phone - Telepbone Connection
r (v) Communication facilities have been indicated by the following codes :
BS - Bus Stop
RS "- Railway Station
NW - Navigable Waterway (including river, canal, backwaters etc.)
Only Public transport like bus, rail and waterway have been considered for this purllose.
(vi) Apprnach to village. This refers to the state of road etc. leading to the village.
This has been indicated by the following codes ;-
PR - Pucca Road
~R - Kachcha Road
NR - Navigable River
NC - Navigable Canal
NW - Navigable Waterway (other than river or cana!),
(vii) Nearest Town and distance.-J:he distance in kIns of the nearest town (whether located in t9-E state or it another State) bas been given in brackets under column 12.

51
(viii) Power Supply : For this purpose, the following codes have been used under column 13 :
ED - Electricity for Domestic Purpose
EAg - Electricity for Agriculture
EO - Electricity for other purpose like Industrial, Commercial, etc.
EA - Electricity for all purposes listed above
(be) Irrigated by Sonrce.-For this purpose the .following codeS have been used under column 15
GC Government Canal
PC Private Canal
W Well (without electricity)
WE Well (with electricity)
TW Tubewell (witbout electricity)
TWE TubeweU (with electricity)
TK Tank
T Total
0 Other
.-
(x) Land use.-Break-up of area under different type of land use viz. forest irrigated area, unirrigated area culturable waste and areas not available for cultivation has been furnished under columns 15-19. '
(a) Forest.-This includes all lands classed .as forest under any legal enactment dealing with forests or administered as forests, whet~er .state-owned or pnvate, and whether wooded or maintained as potential forest land. The area of crops raIsed 1U the forest and grazing lands or areas open for grazing within the forest should remain included under the forest area. if any portion of such land is not actually wooded but put to some agricultural use, that p.ortion is included under the appropriate heading of cultivated or uncultivated land. In some cases there are Instances where patches of land put to agricultural use within statutorily notified forests are considered as forests by the revenue agency. These are treated as forests.
(b) Irrigated. by source and unirriga~ed (Land use).-These two columns (cols. 16 and 17) over all agricultural land and lllclude net area sown With crops and orchards or net cropped area and also current and other fallows. The .later implied lands which were taken uJ? for cultivation, but are temporarily out of cultivation for a penod of not less than a year and more than fIve years. The columns do not include gross areas sown or gross cropped area. Net area Sown thus represents the area sown with crops and orchards counting areas sown more than once in the same year only once. '
(c) Culturablc wa~te.-This includes all lands available for cultivation whether not taken ~p for cultivation or taken up for cultivation once, but not cultivated during the five years or more in succession. Such
'lands are eigher fallow or covered with shrubs and jungles which are not put to any use. These have been assessed or unassessed and are in isolated blocks or within cultivated holdings. Lands under thatching grasses bamboo bushes and other groves for fuel, etc. which are not included under orchards or forests also come unde: this head. All grazing lands, whether these are permanent pastures and meadows or not, village common and grazing lands within forest area have been included in this column. .
(d) Area not available for cultivation.-This column (Col. 19) includes land not available for cultivation such as barren, unculturable land and land put to non-agricultural use.
Land put to non-agricultural use stands for alUands occupied by buildings, roads and railways or under water, e.g., rivers and canals and other lands put to uses other than agricultural.
Barren and unculturable lands cover all barren and uncuturable lands, like mountains, deserts, etc. Land which cannot be brought under cultivation, except at a very high <rost, has been classified as unculturable whether such land is in isolated blocks or within cultivated holdings.


CODES USED IN THE ALPHABETICAL LISTS
53


55
CODES USED IN THE ALPHABEtICAL LISTS
CODE LIST-1981 CENSUS
state/Districts/Tahsil Manual Codes Computer Codes
1 2 3
PUNJAB 17 17
1. Gurdaspur 1 01
1. Pathankot 1 0010
2. Gurdaspur 2 0020
3. Batala 3 0030
2. Amritsar 2 02
l. Ajnala 1 0010
2. Amritsar 2 0020
3. Baba Bakala 3 0030
4. Tarn Taran 4 0040
5. Patti 5 0050
3. Firozpur 3 03
1. Zira 1 0010
2. Firozpur 2 0020
3. Fazilka 3 0030
·4. Ludhiana 4 04
1. Jagraon 1 0010
2. Ludhiana 2 0020
3. Samrala 3 0030
4. Khanna 4 0040
5. Jalandhar 5 05
1. Nawanshahr 0010
2. PbiIaur 2 0020
3. Nakodar 3 0030
4. Jalandhar 4 0040
6. Kapurthala 6 06
1. Kapurtha1a 0010
2. Sultan pur 2 0020
3. Phagwara 3 '()030

~~
, ::CO»E~ USED _Ii'jr .THE:~ETl.CAI,c~JSTS
.ceDE~LlST~l~l' CENStiS .... ""_. '" ~" ..... ".. ~""''''''''''
- , __ o
~~atateJDis~~tf!absil "".' Manual:Codes ,€omputer Codes: "'... ..,. ,- ~... .... . . ......
--- -- ----~-----
2 3
7. Hoshiarpur 7 07
1.' Dasua 1 0010 ."
2. Hosbiarpur I 2 0020 . 3:, Garhsbnkar 3 0036 4,,_ }3aJachaur 4 0'040 . .
8. Rupnagar 8 08.
1. Anandpur Salub 1 0010
2 .• RUpnagar 2 0020 . 3. Kharar 3 0030
9. PatiaIa~ 9 .09' ." h .. Fatehgarh Sahl"b 0010
2·,," Rajpura 2 002Q
3. Patiaia 3 0030
4. Samana 4 0040
S. Nabha S 00;50
10. Sattgrur 10 -10.
1. Malerkotla 1 0010
2:'" Sa;grur 2 oo.tO
).~ Sunam 3 0030 -.<}. ,Barnala 4 ' 0040
11. BatJiinda 11 11:
1. Rampura Phu} 1 ' QOI0
2. Bathinda 2 0020
3.. Talwanai Sabo ~ 0030
4~ Mansa 4 0040
12. Fafidkot ,12 12'
1. Moga 1 OQIO
2. Faridkot 2 0020
3. Muktsar 3 - 0030 . .. , . ~-"" - ~ .. !!:"'~"!I ".
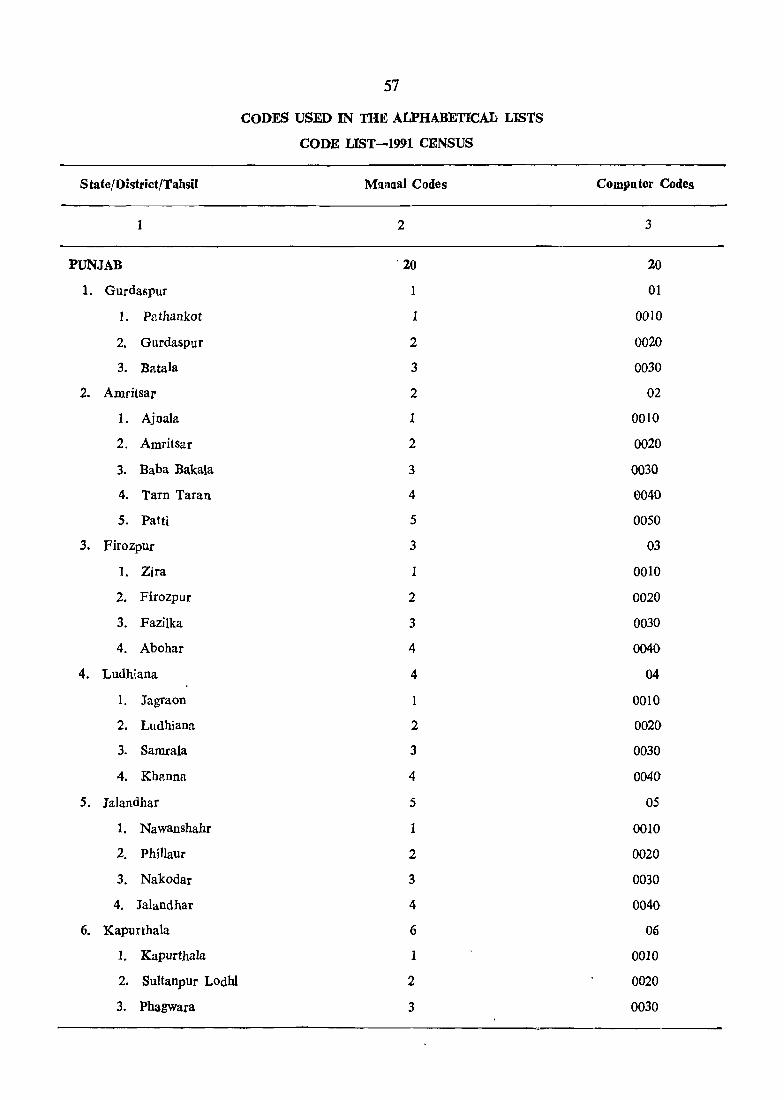
57
CODES USED IN THE ALPHABETICAL LISTS
CODE LIST-1991 CENSUS
State/District/Tabsil Manllal Codes Computer Codes
1 2 3
PUNJAB . 20 20
1. GUrdaspuf 1 01
1. Pathankot 1 0010
2. Gurdaspur 2 0020
3. Batala 3 0030
2. Amritsar 2 02
1. Ajnala 1 0010
2. Amritsar 2 0020
3. Baba Bakala 3 0030
4. Tarn Taran 4 e040
5. Patti 5 0050
3. Firozpur 3 03
1. Zjra 1 0010
2. Flrozpur 2 0020
3. FaziIka 3 0030
4. Abohar 4 0040
4. Ludhiana 4 04
1. Jagraon 1 0010
2. Ludhiana 2 0020
3. Samrala 3 0030
4. Khanna 4 0040
5. Ja]andhar 5 05
1. Nawanshahr 1 0010
2. PhilIaur 2 0020
3. Nakodar 3 0030
4. Jalandhar 4 0040
6. Kapurthala 6 06
1. Kapurthala 1 0010
2. Su]tanpur LOdhl 2 0020
3. Phagwara 3 0030

58
CQDES, uSED IN THE ALPHABET.JCAJ,. LISTS , ,
.CODE UST-1991 CENSpS
State/District/Tahsil Manual ,Codes C;:omputer Codes'
1 2 3
7. Hoshiatpur 7 Of.
1. Dasua 1 OOlO-
2. Hoshlarpur 2 _"0020
3, Oarhshankar 3 1)039
4- Balachaur 4 D040
8. RUpnagar 8 'Oif·
1. Ananclpur Sahib 1 0010
2. Rupnagar 2 0020
3. Kharar 3 t)()30
9. Patiaru .9 -09
1. .FatehgHh Sahib OOlt)
2. Rajpura 2 002()._
3. Patiala 3 1)()30
4. Samana 4 . 0040
5. Nnbha 5 l)OSO
f 10. Sangrur 10 10
L Malerkotla 0010 -
2, Sangrur 2 0020
3' . , SUll?m 3 '0030
% Barnala 4 0049
11. BathiJlda. .11 " 11
1. Rampura Phul 1 0010
2. Bathinda 2' 0020
3, T2Iwar.di Sabo 3 .(}O30
4. Mansa 4 0040
12. Faridkot 12 12
J, Moga 1 0010
2. Faridkot 2 0020 -3. Muktsar 3 ~03Q '.


z
o
C.o. BLOCKS A PHUL B RAMPURA
BOUNDARV, DISTRICT .
TAHSIL
C D. BLOCK
VILLAGE WITH LOCATION CODE NUMBER.
HEAOQUARTERS: TAHSIL . . •... VILLAGES WITH POPULATION SIZE: BELOW 200,200-499,
500-999; 1000-4999, 5000 AND ABOVE
URBAN AREA WITH LOCATION CODE .
STATE HIGHWAY
IMPORTANT METALLED ROAD
.......... ....., It .... 1ft" with the plrmiu lor of th . Surv. yor General of India.
R
~ -= 12=-:_-:'1 @
0 ••••
w4'IWdl SH 12
()
PUNJAB C. D. BLOCKS RAMPURA
ANDPHUL TAHSIL RAMPURA PHUL
DISTRICT BA THINDA
RAILWAY LINE WITH STATION, BROAD GAUGE
POST OFFICE/ POST AND TELEGRAPH OFFiCE
HIGH/SECONDARY SCHOOL HIGHER SECONDARY SCHOOL HOSPITAL.HEALTH CENTRE, PRIMARY HEALTH CENTRE, DISPENSARY, MATERNITY AND C JILO WELFARE CENTRE
IMPORTANT VILLAGE MANDIES
I All baundom:s ~ re updot~d upto 1st Dtcember,1989. 2, C. D. bl ock boundary I )(chtdes Slatutory town.
8 Km
~s
~ PO/!,TO
"5
© Gov.rnm.nt of Indi. Copyright~ 1997

59
ALPHABETICAL LIST OF VIT..LAGES
IN PHUL C. D. BLOCK


61
ALPHABETICAL LIST OF VILLAGES
PHUt C. D. BLOCK
1991 Census 19d1 Census Sr. Name of village ---- ~- ----------- -- -.~- - ~----- .. _-_----No. (with Hadbast No.) Location Location LocatJ,)Q Location
Code Code Code Code i
(Manua) (Computer) (Manua)) (Computer)
1 2 3 4 :- 6
Rampura Phul Tahsil (ParO
1 Adampura (29) 20)11/1)24 20/11/0010/0024 17J11/l,2;) 17d 110010/0029
2 Aklia JalaJ (21) 20/11/1/16 20/1110010/0016 1111111,5 11/1110010/0005
3 Allike (446) 20/11/1/43 20/11/0010/0043 17/1111/36 17111/0010/0036
4 Bhagta (186) 20/11/1/4 20/11/0010/0004 17/Ull/ll nil 1/0010/0011
5 Bhai Rora (32) 20/11/1/28 20/11/0010/0028 17/111'1 24 17/1 ['01l10/0024
6 Bhodipura (20) 20/1t/l/17 20/11/0010/0017 17/11;1!3 17/11'0010/0003
7 Bugran (43) 20Jl111/44 20/11/0010/0044 17/11/1,'37 17/11/0010/0031
8 Burj Gillan (36) 20/11/1/29 20/11/0010/0029 J7/11Jl/22 17/11/0010/0022
9 Burj Ladha Singh- (184) 20/11 '1/2 20'1 tiOOIO/OOOl 17'11 '1110 17/11/0010/0010 wala
10 Butj Mansa (41) 20/11/1/46 20/11/0010/0046 17/1111/49 17/1 1/0010/0049
11 Burt ThIor (2) 20/11/1/5 20/[ [/0010/0005 17/11/1/13 17/11'0010/0013
12 Chotian (42) 20,11/1/45 20/11/00 I 0/0045 17111 '1,39 17/11/0010/0039
13 Dhapali (444) 20/11/1/33 20/11/0010/0033 n,'l! '1. H 17/11, OJI0/0041
14 Dhiogar (445) 20,1 ~/1/41 20/11 :00 1 0/004 1 17{lltl/40 17111 '00[0/0040
15 Dulewata (31) 20/11/1jl6 20/11/0010{0026 17/11/1131 17/11'00lO/0031
16 Dyalpura Bhaika (25) 20;11/1/27 20111/0010/0027 17/1 : 11 '25 17/11'0010/0025
17 Dya1pura Mirza (1) lOm/l/9 20/11 1001010009 17/11}lj17 .7/11 10010/0017
18 Gaunspura (26) 20/111l/21 20111/0010/0021 17,11, J/2~ 17/1 J 'OOlO/002d
19 Ghanda Bana (441) 211111/1/30 20/1110010/0030 17111, [/32 J 7/1l/0010/I}033
20 Gum_!i J{a1an -(33) 20/11/1/12 20/11/0010/0012 17,11/\;23 1711110010/0023 .,- __ -21 GUlusar (22) 20/11/1/15 20/11/0010/0015 I" 11/1 '8 :711 1 '0010/00OS
22 Hakam Singhwala (18) 20,11/1,19 20/11;OJI0/0U19 17,11tl,2 1.'/lJ/OJlll/OOO2
23 Hamirgarh (23) 20/11/1/14 20/11,00l0/0UI4 1711.17 17111/0010/0007
24 Hatnam Singhwala (38) 20/11/1/34 20/11/00 1 0/0034 17/lJIl/21 :7'11/0010/0021
.25 Jalal (24) 20JllJlJ 13 20/111001010013 17/1111/6 171 WoolO/OOOo
:6 Kangan (27) 20/11·1/22 20; [1/00 10/0022 17/1111/27 17" 1 /00 I 0/0021
27 KauloKe (35) 20/11; 1,11 20m, OG1 0/0:> 1 1 P,ll .): .• ) .1,11 ')[)lJ,~')lO
28 Keor Singhwala (19) 20/1./1/20 20/1110010/0020 17 11 1,4 17,11/0:lIJ10!>04
29 Kesar Singhwala (185) 2<Jd1 1li3 2G/11/0Jlu/OClJ3 17,11/1:9 17/ j l/1lJ 1\)/vu09
30 Kotha Guru (1) 20m/liS 20111100101000& 17/1111116 n}ll!OOlO/OO16
31 MalqKa (5) 20/11/1/6 20/11/0010/0006 17/11/1;14 11/1 [/OO10:0()14
32 Nool (6) 20/11/1/7 20/1 [/0010/007 17/1111115 17/11/oo10/00U

62
~LPH'ABETJCAL LIST Olf YILLAGES
PHUL C. 0;> BJ,OCK
1991 CEnsus 1981 Census Sr. Namedfvilhige - ------,---~------ -----------Nu. (with Haabast No.) -:Location Location LQcatioJ! Location
Code Code Code' Code (Manual) (Computer) (Manual) (Compute')
I 2 3 4 S 6
-Rampura "Pb-ul"riliin Wart)
33 Patti Kala M<lluaj (L~) 20/11/1/38 20/Uiool0/0038 17(1I/1{4S 17{II{oolO(OO4S
34' Patti Ka1'am ChaDd (193) Mehraj
20/11/1/39 20/11/0010/0039 11!1!/lj46 1'7/11/0010/0046
35 Patti SandaJi (189) 2Q/lJ./1/36 20j U/ool 0/0036 17/1111/43 11111/ooJO/0043 'Mehraj
3'(i Patti Sao] Mehraj (19{\) 20/11/1/37 2'0/11/0010/0037 17/11/1/44 17/1110010/0044
37 Phul (39) 20/11/1/40 20/11/QOIO/004O l7{U/l/42 17111/0010/0042
38 'Pbulewal .(443) 20111/1/32 20m/OO10/0032 17{lill/34 17/ (1/0010/0034
3§ Raiya Urf Hatdas-' (2) 20)11/1/42 20/11/0010/0042 !1Jll/1/J5 17/11/0010/0035 _pura
40 Rajgarh (30) 20/11/1/25 20/11/0010/0025 11111/1/30 ·17/11/0010/0030
41 Ramuwala (17) 20/11/1/18 20/11/0010/0018 17/ HI 1/1 17/11/0010/0001
42 -Sadbana (37) 20JDJl/35 20/ll/oo10/0035 17/ll/l; !8 17/11/0010/0018
43' -Sallibatpura (28) 20/11/1/23 2.0/11/0010/0023 17/11Il/2B 17111/0010/0028
4'1 Saudhu Khurd (442) 20/11/1/31 20/11/0010/0031 17/11/1/33 17/11/0010/0033
.S Se]brab (34) 20/11jl/1f) 20/11"/0010/0010 l7!1l/e (9 17/11/0010/0019
_fi Siriewala (183) 20/11/1/1 20/11/00.10/0001 J.IIH,ld2 17/11/0(JlO/0012

63
VILLAGE DIRECTORY
PHUL C. D. BLOCK

PHUL C. D. BLOCK
Loca- Name of village tion I ('With Badbast No.)· Code t,L No . .,
1 2
Total area of village (in bectares)
3
Totah population
and n'lmber of house-'
holds
4
64
VILLAGE
AmeaHies ad
Amenities available (if Dot available within tho village. a daSh (-) is shov.n in the column' and next to it in brackets the distance
:n broad rangeS viz.-5kms. 5-10 kms and 10+ kms of the nearest place where t he facility ig avaiJa ble is given)
Educa" tional
5
Medical Drinking
6
Wator (Potable)
7
Post and Tele-" grapb
8
Day or CollUllUDi-days cations of tho (bus market' stop, hat, it railway any station,
9
waterway)
to
Rampura Pbal
Siriewala (1~3r ,1295.00 3.886 (599) P, M. H MH. HC. RP(4)
T. HP, C PTO -(-5) BS
2 Furj Iacl:a (184) 608.00 Singl.we.la
3 Ke~ar Singtwala (18S) 402.00
1.681 (283) P ,MH. RP
1.100 (170) P(2). M. PHC 1I
HP • -(-5) -(-5)
T. HP -(-5) . -(-5) -{-S}\
4 Bhagta (l86)~ 2161.00 lJ.772 (1383) F(4). MH. HC. HP M(2). PHC,D
PTO, Phone
.Daily BS
5 Burt ThIor (2)
6 Mall! KlI (5)
7 Neor (6)
8 Kotha Guru (1)
9 Dyalpura Mirza (1)
10 Selbrah (34)
11 Kaulok<! (35)
12 Gumti Kalan (33)
13 Jalal (24)
14 Hamirgarh (23)
15 Gurusar (22)
16 Aklia Jalal (21)
17 Bhodipura (20)
18 Ramuwala \17)
19 Hakam Singh (18) wala
:20 Keor SingbwaJa (19)
21 Gaun~pura (26)
22 Kangan (27)
H(2),PUC
331.00 J .306 (218) P, I\j D
20\:4.00 5.395 (819) p. M PHC,D
515.00 1,505 (245) p. M. H -.(-5)
2992.00 17.507 (1233) P, M. 13 MH. D
2161.00 (4.090 (673) P, M. H D
1539.00 (4,011 (651) p, M, H H
353.00
2025.00
2014.00
798 (227) P ~
4,784 (741) P(2), M, H
l5,189 (8l1) P(2). M. H
837.00 [2.416 (359) P,M,
706.00 1,993 (331) P p,
-(-5)
PHS.D, RP(6).CHW
MH.Ht. PHC,D, FPC
DFPC
PHS
1117.00 2.625 (389) P(2). M, RP H.
1018.00 [2.888 (465) P. M. H D
468.00 1.426 (209) P NH
465'00 Ll,347 (217) p.1 PHC
584.00 1.231 (209) P -(-5)
363.00 512 (76) P -(-5)
685.00 Ll,622 (254) i:;~ -(-5)
T,HP -(-5) -(10+) -(-5)
T,RP )0 -(10+) BS
HP -(-5) -(10+) _(_5)
T. W.HP. PO. -(5-10) BS C Phone
T.Hf
T.HP
PO
PO, Phone
-(10+) BS
-(10+) BS
T. HP -(5-10) -(5-10) BS
T,RP PO -(5-10) BS
W.TW.HP PO -(5-10) BS
T.HP
T,HP
HP
HP
HP
HP
T. HP
W.TW, HP
TW. HP
- (-5) -(-5) BS
- (-5) -(5-10) BS
PO -(10+) BS
-(-5) -(10+) BS
PO -(10+) -(_,)
10
PO
-(-5)
-(10+) BS
-(10+) BS
-(10+) BS
-(-.5) -(lO+) BS

DIRECTORY
land use
Approach to viJIage
11
Nearest town and distance (in kms)
12
Tahsil (Part)
PR Jaitu (16)
PR Jaitu (Hi)
PR Jaitu (24)
PR Bhadaur (22)
PR Jaitu (16)
PR Jaitu (18)
PR Jaitu (20)
PR Bhadaur (22)
PR Rampura PhUI
PR Rampura Phul
PR Rampura Phui
PR Rampura Phul
PR Bhadaur (19)
PR Bhadaur (22)
PR Bhadaur (18)
PR Bhadaur (19)
PR Bhadaut (19)
KR Bhadaur (22)
PR Bhadaur (2l)
PR Bhadaur (19)
PR Bhadaur (12)
PR Bhadaur (11)
(13)
(13)
(10)
(18)
Power Supply
13
EA
ED,EAG
ED. BAG
EA
ED. EAG
EA EAG
ED BAG
BA
EA
EA
ED,EAG
EA
EA
ED, BAG
ED,BAG
ED, EAG
ED,BAG
ED,EAG
bD,EAG
ED, EAG
EA
EA
65
Land use (i.e. area under ditIerent types 01 land use in hectares rounded up to two decimal places)
Forest Irrigated by source
14 15
T(1056.00). GC (6()9 .OJ), W(HH .0)), TW (142.00), TWE (141.00)
T (561.00) GC (156.0()). TWE (405.00)
T(220.00). GC(220.00)
T(1854.oo). GC(968. 00). TWE (886.00)
T(289.00). GC(163.0ll). TW(41.0}). TWE (85.00)
T(1807.00), GC(1482'00), TW(166'OO) TWE (159'00)
T;389 '00), GC(357 '00), TW(ll'OO/ TWE (21'00)
T(2593' 00), GC, (~\)(). 00), TW(588' 00)
T(1322' 00), GC(782' 00), TW(540· (0)
T(1267 '00), GC(770 '00), TW(497 '00)
T(243.00), GC(214.00). TW(29.00)
T(l104.00). GC(498.00), TWE(606.00)
T(838.00). GC(218.00), TW(402.00), TWE (218.00)
T(729.00). GC(430.00). TWE (299.00)
T(615.00). GC(358.00). TWE (257.00)
T(902.00), GC(284.00), TWE (618.0C)
T(904.00). GC(579.00), TW(325.00)
T(424.00). GC(424.00)
T(449 .00), GC(317 .00), tWB (132.00)
T(544.00), GC(489.00) TWE( 55.00)
T(249.00), GC(126.0J). TWE (123.00)
T(465 00). GC(292.00), TWB (173.00)
Un-irrigated
io
144.00
16.00
108.00
'9.0')
5.01
85·00
86'00
130'00
686'00
169·00
86.00
796.00
688.00
46.0)
14.0J
147.00
38.00
4.00
11.00
30.00
96.0J
149.0J
CiJlturable waste (including gaucha and groves)
17
37'00
2.00
9.00
11.00
Area not available for cultivati,1O
I.:!
95.'))
31.00
37.00
258.00
37.00
202.00
40 00
269'00
113,00
t03 '00
24.00
125.00
488.00
6:!.00
77.0,)
66.00
67.00
40.0J
5.00
10.00
13.00
60.00
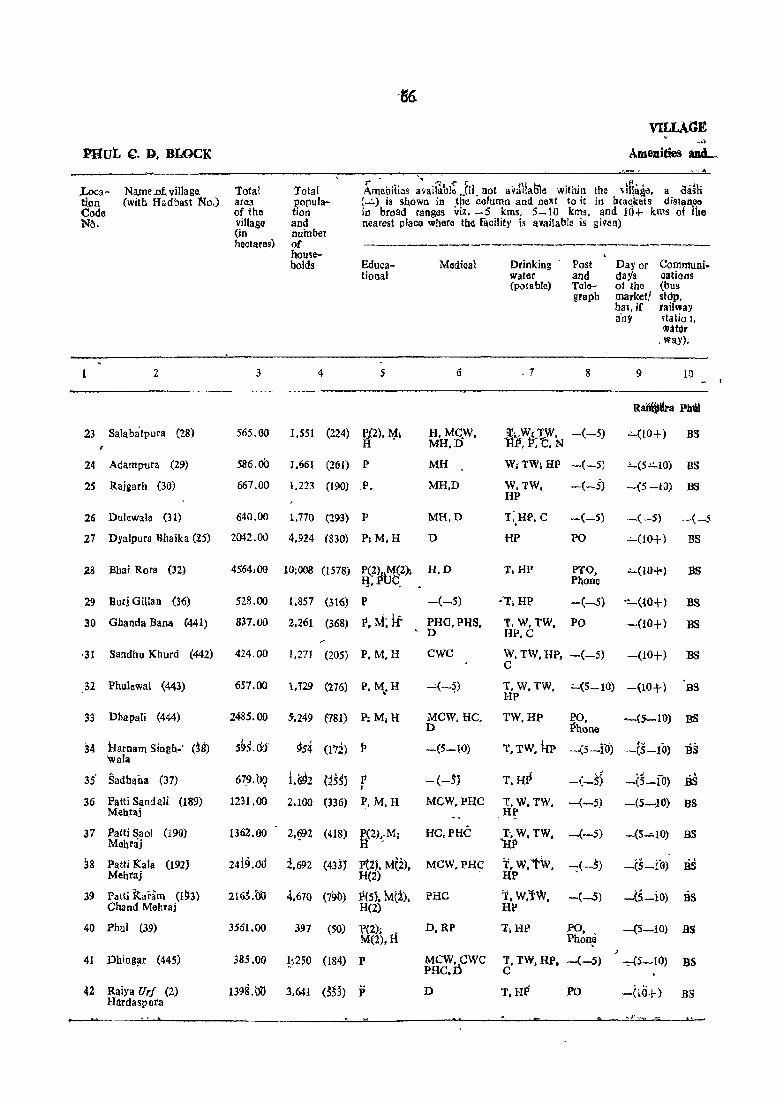
paul. ". D. BWCK
Loca- Na.me..of._ village. tion (with Hadbast No,) Codo No.
2
23 Salabatpura (28)
24 Adampura (29)
2S Rajgarh (30)
26 Dulewala (3l)
1'otal area of the village (in hectares)
3
565.00
10tal population and number of households
4
VILLAGE . Amenities and.....
A.~6bities a~ail~blg Jil. not av.1lialile within the vlfla!ie, a (las\! (..:...) is shown in .t~e column and next to it in Deae,kllts dislall,~o in broad ranges VIZ. -5 kms, 5-10 kms, and 10+ kms of the nearest place whore tho facility is available is given)
Educational
5
Medica1
6
Drinking water (potable)
,7
Post and Telograph
8
Day or day~ 01 the market! hat, if any
9
Communications (bus stOp, uilway ~talio 1, ~aftlr
. way).
10 - I
RaDi~lIra Pblit
1,551 (224) HZ), ¥i H.MQW, MH.D
~.~tlW. -(-5) 11.l? P. c. N
.0..(10+) B3
586.00 1.661 (261) P MH
MH,D
W; TW\ HP -(-5) :"'(5':':'10) BS
-(5 -J[) BS 667.00 1.223 (190) _p •
640.00 1. 770 (293) P
W.TW, HP
-(-5)
I:.HP. C -(-5) -(-5) -(-5
27 Dyalpura Bhaika (25) 2042,00 4.924 (830) PI M. H
MH,D
D HP PO -"-(10+) BS
28 Bhai Rora (32)
29 Burj Gillan (36)
30 Ghanda Bana (441)
,31 Sandhu Khurd (442)
32 Phulewal (443)
33 Dbapali (444)
34 }farnam Singh.' (8) wala
35' §adh~na (37)
36 Patti Sandali (189) Mebraj
37 Patti Saol (190) Mahraj
38 Patti Rata (192J Mehraj
39 Patti Raram (19:n Chand Mahraj
40 Phul (39)
41 Dhinll!lr (445)
42 Raiya Uri (2) Hardaspura
52.8,00
837.00
424.00
10;008 (1578) ~!~~42)l
1.857 (316) P
2.261 (368) P, M; it
1.271 (205) P, M. H
657.00 1.129 (276) P, M .. H
2485.00 5'.249 f78t) 1'; MJ H
67?t>Q 1231.00
1362.00
24i9.00
2163.00
3561.00
1.692 tis5J p • 2.100 (336) p. M, H
2,692 (433)
4.670 (790)
397 (50)
pt2j, M(2), H(2)
JI(S). M(2), H(2)
f(2), >
M(2),H
385.00 !l2S0 (184) P
1398,0l) 3,641 (553) P
H,D
-(-5)
PHO.PHS, 'D
cwe
PTO, Phone
-(-5)
T. W,TW, PO HP.C
W, TW, HP, -(-5) C
·!....(!O+)
-:(10+)
-(lO+)
:as
BS
BS
BS
T. W. TW. .:...(5-10) -(10+) BS HP
MCW, HC, TW. HP D
PO, {Shone
--(5-11» BS
-(5-10) T, TW. HP -(5-fo) -(5-10) -as
- (-SJ T, H~ -(-55 Mew, PHC T. W. TW. -(-5)
,H~
HC. PHC T-, W. TW, --(-.5) 'liP
MCW,PHC
PRC
D.RP
T. W,"w, HP
't. w.'fw, HP
PO. Phone
-(5-10) .as -(5-10) BS
-(5-"-10) BS
-(5-10) BS
;
MCW, ewc 1. l'W. HP. -(-5) -::-(5-10} BS PHe.n c D PO -(10+) BS

DtRE{:TORY
IJiWi 'iise
A~ ,p.~} roa"n to villallc
11
Nearest town and distances (in kms)
12
Tahsil (Part)
PR Bhadaur (10)
PR Bhadaur (7)
PR Bhadaur (7)
PR Bhadaur (8)
PR Rampura Phul
PR Rampura Phu]
PR Rampura Phu!
PR Rampura Phu]
PR Rampura Phu!
PR Rampura Phul
l1R Rampura Phul
PR Rampura Phul
(24)
(8)
(8)
(8)
(10)
(10)
(5)
(S)
PR Rampura Phul (5)
PR Rampura Phul (5)
PR Rampura Phul (5)
PR Rampura Phul (5)
PR Rampura Pllul (15)
PR Rampura Phul (S)
PR Rampura Pilul (5)
PR Rampura Phu] (1])
_----
Power Supply
13
EA
EA
EA
EA
EA
ED, EAG
EA
EA
EA
BA
EA
EA
BA
EA
EA
EA
EA
EA
l:iA
Et\.
61
Land use (i.e. area under different t~pes of lana usa in hectares roilnued upio fWD decimal plaees) ~rcst------~ig~~b;~~;-------U~~-c~~:-~~~~-
, irri- able available
14 15
T(383.00), GC(229.00), TWE (IS4.00)
T(460.oo), GC(129.00), TW (331.0;))
T(461.00), GC(287.00), TWE (174.00)
T(386.00), GC(285.IX», W(101.03)
T(S41.00), GC(S41.00)
T(2892.00j, 0<::(2071.00), TWE (821.00)
Tt288.00), GC(263.00), TWF(2S.oo)
T(705.00), GC(376.00), TW(247.00), fWE(82.00)
T!385.00), GC(132.00), TW (10.00), TWE (243 .00)
T~64. 00), GC(148 .00), TW(243. 00), T E(l73.00)
T(1509.00) GC(1l63.00). TWE(346.00)
T(212.00), GC(192.00), TW(20.00)
T(377 .00) GC(324.00). TW(S3 .00)
T(798.0J) GC(7S3.oo). fW(4S.00)
T(98S.00) GC(1l7.00). TW(60S.00). TWE (260.00)
T(1613.00), GC(65S.00). TW(338.0J), TWE (620.00)
T(1639.00), GC(1214.00), TW(l84.00), TWE (i81.00)
T(2525.00) GC(2064 .00), TWE (461.00)
T(285.00), GC(l64.0U), TW(40.00), TWE(~l.OO)
T(85i.(JO), GC(633 . DO), TW(218.0J)
gated wa~te tor culti. (includ· vation ing gauchar and :Jrov¢s)
16 17 18
118.00 1.00 63.0ll
79.00 47.00
146.00 60.00
202.00 52.00
1323.0:> 77.00 101.03
1314.00 328.00 30.0J
200.00 40.00
81.00 Sl.00
39.00
42.00 S1.0J
747.00 8.00 221.00
251.0U 132.00
264.00 38.00
321.00 2.00 110.01)
334.00 43'00
662.Ou 4.0J 140.1)0
355.0l) U.OJ 156.00
6\)6.0,) 43:>.00
100.00
41J.J·') 3.0v 134.11J

PHUL C. D. BLOCK
Loca- Name of village. tion (with Hadbast No) Code ND.
1 2
43 Allike (446)
44 Busran (43)
45 Cbotian (42)
46 ~urj Mansa (41)
Total area of the viIJa~ (tn lectares)
3
604.00
490.00
409.00
294.00
54318.00
10tal population and nutnbet. of households)
4
1.740
1.637
1.416
919
(327)
(264)
(205)
(143)
1,25,388 (20914).
6~
VILLAGE
Amenities aod < . "
\
Amenities available (if not avai1a~le within the village. a dash (-) is' shown: in tbo' column and next to it in btack~ts th~ distaflc6 in broad langes viz, -5 kms, 5-10 .)(ms and 10+km~ of the nearest place wbere tbe facilityi! avaiJable js givcn) ,
Educational
5
P,M.H
P.M.H _ .. _
P
e.
P(62). M(33), fflZ8) PUC (2). <3(0). TR(O), 1(0). AC(Or 0(0), .
Medical
6
H,MCW, .D
CHW
D
-(-5)
H(4). MCW(6), MH(10) •• CWC(2), HC(5). PRe(u)" D(2l). PHS(3). TB(O). FPC(2). NH '(0). SMP(O) RP(13). Caw(2) OCO)
,,' -----_ .. _----------Drinking Poat Day or Communi. water and ~ays cation! (Pota ble) tale- of the (bus
graph market! stop. hat. if railway any station •
.r wllter WilY)
7 8 9 10
Ramputa Pbu).
W,HP.C PO -(5-10) BEl
W.HP -(10+) -(5-10) as
HP -(-5) -(-5) BS
. HP -(-5) -(-5) BS

DIRECTORY
Jand use
Approach to village
11
Nearest town and distances (in krns)
12
Tahsil (Part)
PR Tapa (5)
PR Rampura PhuJ
PR Rampura Phu!
PR Rampura Phu]
(6)
(6)
(5)
Power Supply
13
EA
EA
EA
EA
69
Land use (i.e. area under diflerent types of land use in hectares rounded up to two decimal places)
Forest Irrigated by source
14 15
T(420.00). GV(330.00), TW(90.00)
T(422.00), GC(202 .00), TW(86 .00), TWE (134.00)
T(316.00). GC(177.00). TW(lil.OO). TWE (78.00)
T(~72 .00), GC(156.00), TW(58.00), TWE(58.00)
T(38113·.00) GC(24466.00) W(lDS.OO) rWE(8069.00) TW(5373.00)
Unirri gated
16
117.00
21.0(}
62.00
2.00
11240.0G
Cultur able waste (including gauchar and groves)
17
4.0(}
499.00
Area not available forcultj. vatioD
13
63.00
47.00
31.00
20.00
4466.00
-------------------------------------------------------------------------------------


71
ALP!lo\BEfICAL LISr OF VIDf,AGES
l.~ RA:\IPURA C. D. BLOCK

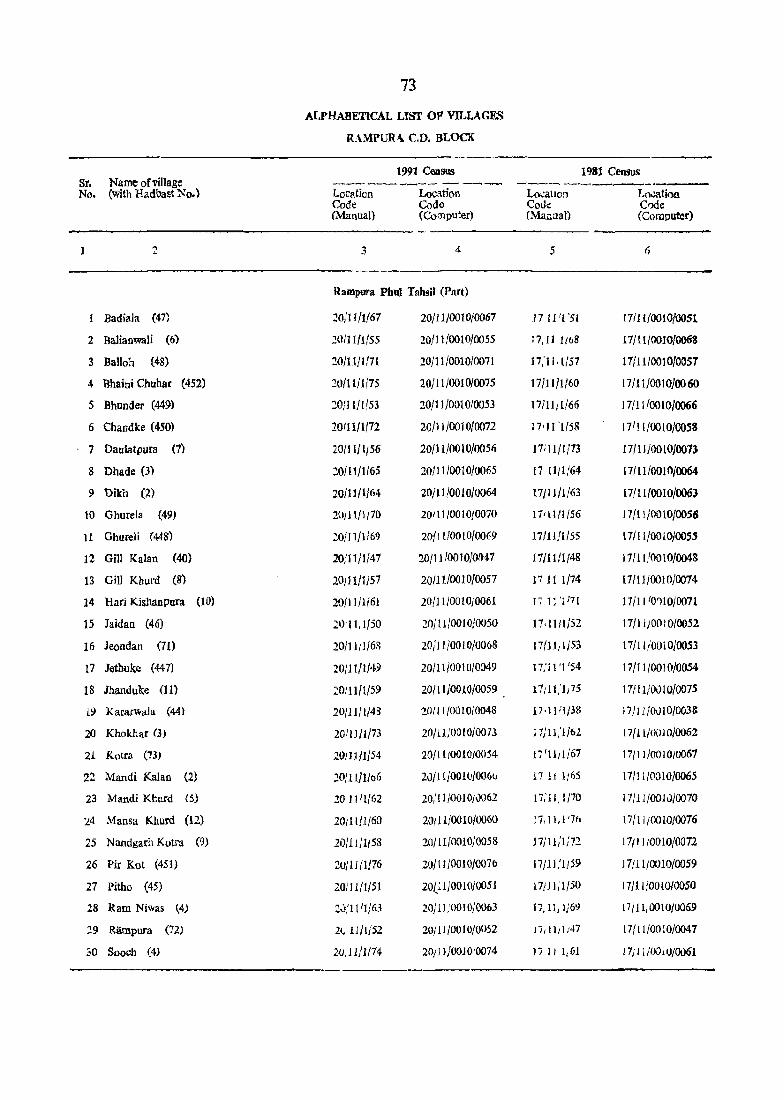
73
ALPHABETICAL LIST OF VlLLAGES
RAMPUR,\;C.D. BLOCK
1991 Census 1981 Census Sr. Name ofvilJage -------- -~-- -~-- -__..___...,,_---No. (with Hadbast ::-:0.) Location Location Location Lo.;atioa
Code Code Cmle Crxie (Manual) (CoOlputer) (Manual) (Computer)
2 3 4 5 Ii
RaRlpura Phul Tahsil (Part)
1 Badiala (47) 2<l/1 I/lf67 20/1110010/0067 17 11 'l'51 17i1!/OO10/00Sl,
2 Balianwali (6) 201t1!Ils5 20/11/0010/0055 17111 1168 17/11/0010/0068
3 Halloh (48) 'lOI11/1111 20/11/0010/0071 17,'tH/57 17/11/0010/0057
4 Bhaini Chuhar (452) 20/11il175 20/11/0010/0075 17/1Ifl{60 17111/0010/0060
5 Bhunder (449) 10{11/1!53 20/11/001010053 17/11/1166 J 7/11 {OOIO/0066
6 Chandke (450) 20t11/1/72 20/1110010/0072 17'Il'l{S8 17{iI/OOl0/0058
7 Daulatpura (7) 20111/1/56 20/11/0010/0056 17:1I{li73 17/11iOO1Oj0073
8 Dbade (3) 10/11/1/65 20/11/0010/0065 17 1111[64 1711l10010/0064
9 Dikh (2) 20111/1/64 20/11/0010/0064 17/11/1/63 17fll/OOlO/OO6J
10 Ghurela (49) 20/11/1t70 20111/00 to/0070 171llfJ /56 17/11/0010/0056
11 Ghureli (448) 10/11/1/69 20/1110010/0069 17/11!1/55 17/11/001O/005S
12 Gill Kalan (40) 20}11/1/47 20/11/0010/0047 17/1111/48 17!11!OOlO/0048
13 Gill Khurd (8) 20/11/1/57 20/11/0010/0057 17 II 1/74 11111/0010/0014
14 Harj Kisl1anpura (10) 20/11/1/61 10!1l/0010j0061 17 1: '1 17 1 17/11 '0,)10/0071
15 Jaidan (46) 20'11,1/50 20/11/0010/0050 17, 1l1l/52 17/1110010/0052
16 Jeondan (71) 20/11/1/68 20/11/0010/0068 17/11 l lj53 17/11';0010/0053
17 Jetbuke (447) 20/11/1/49 20/11/0010/0049 0;11'1 '54 17/11/0010/0054
18 Ihanduke (11) 2011)11/59 20{II/oo10/oo59 11; 11,'1,75 17/11/00) 0/007S
1!1 KararwaJa (44) 20111/1/48 20/1 1/0010/0048 17,IIiJ138 17/11/0v10/oo38
20 Khokhar (3) 20111/1/73 20/ll/0010/0073 ; 7/11,'1/61. 171 11/O()] 0/0062
21 Kotra (73) 201H/lj54 20{lll0010/0()54 17 111,1!67 17/ J 1/00 1010067
" ... ~ ... Mandi Kalan (2) 10/11/1/06 20JI11001OJ0060 17 Jj 1165 17/11/0010/0065
23 Mandi Kturd (5) 20 11f1/62 20,'111001010062 17:11.1J70 17/11/001.:>/0070
~4 Mansa Khurd (12) 20111/1/60 20/11/0010/0060 17d 1,1 '7f1 17/11/CKHO/OO16
2S Nandgarh Kotra (9) 10/11/1/58 2O{11/0010/0058 j 7/11;1;12 17/1110010/0012
26 Pir Kot (451) ZUlU {1176 20/11/00 I 0/007 {> 17/11:1159 17/11/0010/0059
27 Pitho (45) lo/ll/I{St 20/)IJOOI0/0051 17Jll;1/50 17/11 /00 10/0050
28 Ram Niwas (4) :J:ll'l!63 20/11:0010/0063 17, Ii, lj6';l Ii 11110010/0069
19 Riimpura (72) 2(.. 11/1/52 2°111/0010/0052 J7dl)1:47 17/11/00:0/0047
30 Sooch (4) 2<J,11/1/14 20;11 jOOl 0 10074 17 U 1:61 17jll/OJlO/0061

15
VlCLAGE DIRECTORY
RAMPURA CD BLOCK

RAl\1P\JRA C. D. BLOCK
Loca- Name 01 village tion (with Hadba~t No.) Code~
No.
2
47 Gill Kalan (40)
48 Kararwala (44)
49 Jethl..ke (447)
50 Jaidan (46)
51 Pitho (45)
52 Rampura (72)
53 Bhunder (449)
54 KotTa (73)
55 Baliar.waJi (6)
56 Daulatpura (7)
57 Gill Khurd (8)
58 Nandgarh Kotla (9)
59 Jhanduke (11)
60 Mansa Khuld (12)
61 Hari Kishanpura (10)
62 Mandi Khuld', (5)
63 Ram Niwas (4)
64 Dikh (2)
65 Dbade (3)
66 Mandi Kalan q)
67 Badiala (47) I
68 leondan (71)
69 Ghureli (448)
76
VILLAGE
Ameoities aad
Total area of the vilJage (in -hectares)
Total population and . number of house-holds
(Amenities available (if not available within the village, a dash -) is shown in the column and next to it in brackets tbe distance in broad raIlges viz.-5 Kms 5-10 Kms and 10 + Kms or the nearest place where the facility is available is given)
Educational
Medical Drinking
3 4 5 6
1.172.00 3,2S7 (541) P, M PHC
1.193.00 3,425 (537) p. M. H. H
water (Potable)
7
HP
HP
982.00 2.290 (385) p. M. H D. CHW W, HP
457.00 1,033 (167) P H,CWC HP
1,948.00 4,697
1.984.00
1,547.00
1.084.00
5.765
3,811
(774) P(2).M H
(934) P(2).M(2). D H
(600)' 1'"(2). M. H D
(589) p. M. H MH
T.HP
T.HP
HP
TW.HP
Post and Telegraph
Day or days of the marketl hat. if any
9
Communications (bus stop. railway station. waterway)
10
RampUra Pblfl
-(-5) -(-5) BS
PO -(5-10) BS
--(-5) -(--5) BS
PO
-(-5)
PO
PTO
PO, Phone
-(5-10) BS
-(-5)
-(-5)
BS
BS.RS
-(5-10) BS
-(5-10) as
2.392.00 6.831 (1105) P(2). M(2). MCW.MH. T. W. HP PO, -(10+) BS R PHC Phone
401.00 1,294 (216) P D
-(--5)
T.HP
T.HP
-(- 5) -(5-10) BS
448.00 935 l (170) P -(-5) --(5-10) BS
531.00 1.300
886.00 1.973
702.00 ].058
500.00 693
479.00 1.006
669.00 11.919
1.750.00 2.f39
1,260.00 l2.582
(219) P -(-5) T.HP -(-5)
(328) P(2). M. H D HP -(-5)
(168) P - (5-10) T, HP -(-5)
(117) p~ -(-5) T •• HP -(-5)
-(--5) T.HP -(-5) (153) P
(291) P D. RP.CHW T. TW.HP -(-5)
(460) P. M. H
(410) p. M, H
D T PO
H,MH T.TW,HP PO
2,498.00 7.3d (1200) P(3). M.H, H. MeW.HC. T. HP PTO, Phone PUC D
-(10+) BS
-(5-10) - (-5)
-(5-10) BS
-(10+) BS
-(10+) BS
-(10+) as -(10+) BS
-(5-10) BS
-(-5) BS
650.00 1.558 I (231) P~ HC. PHC.!? T. HP FPC.RP
-(-5) -(5-10) -(-5)
1,313.00 2.568 (397) P, M, H -(-5)
316.00 9Z6: (160) PJ -(-5)
HP
HP
-(--5) -(5-10) -(-5)
-(-5) -(-5) BS

DIRECTORY
land use
Ap)lroach to village
11
- --
Nearest town and d:stan(.e (ID kms)
I ~
Tah!il (Part)
PR Raml'ura Phul
PR RampuI3 Phu]
PR Tapa
PR Rampura Phu]
PR Rampura Phul
PR RamJ:ura Phu]
PR Rampura Phu]
PR Rampura P;lul
PR Rampura Phul
PR Bhucho Mandi
PR Bhu.:ho Mandl
PR Bhu,;:ho "vIand.
PR Bhucho Mandl
PR Rhucho Mandi
PR Kot Patta
PR Rampura Phul
PR Rampura Phul
PR Ramrura Phu)
PR Rampura Phu)
PR Rampura Phu)
PR Rampura Phul
PR Rampura Phul
PR Tapa
(4 1
(5)
(3 )
(8)
(5)
(Oi
(5)
(51
(121
(7)
((i)
(101
('J)
(~)
(10)
(22)
(lU)
(13)
(8)
(6)
(8)
(9)
(2)
Power Supp!)
13 - _,..._--
RA
EA
EA
rD, E'\(J, ED
ED, EAC
EA
IA
FA
EA
ED, EAG
ED, BAll
liD,EAG
ED. EAO
ED, EAG
ED, EAG
ED, BAG
ED, EAG
ED, EAG
EA
EA
EA
EA
BD,EAG
77
Land use (i. e. arCd uader uiff~rent typc~ of :and usc in ht.ctarcs roul1ued urt(l twe d<.~irral plac~sl
fare,t Irr,gutc.: by Source
14 15
T(982.00), GC(8l9.0:l), 1'W (31.1)(1), TWE(82.l)(\)
WIOl3 .00), G('(474. UO), TW (336. om, TWE(~03. C~) T(902.00), G('006.00), TW(126.00\, TWE(47u.OO)
T(3n.OO),0('(13(',00) T~(155.00;, TWE(81 ,00)
1(n99,OO), GC(1368.0(,)' W(31.0U)
r(I~15.0(), G(,(1015.00), TW (275.00), TWE(225,UO)
T(1133.00), GC(93(i (0), T\\[(197,(10)
T(737.00), Ge«('50.00). rW(87,00)
T(lb97.00), Gl'(1547.00), TWfI62,OO), TWE(tB~,{){})
T(324,00), G('(275 ,(0). TWE(49.00)
T(:~S().OI)), GC(151).OO)' TW(21i.OO1. TWE(7.t.Cll)
T(383.00), 0('(344.00), TW.C(39.00)
T(672.00). TW(2J4,OJ), TWE(4J8,OO)
T(513 .(0). ClC(t 92.00), rWE(321.001
T(330.00I, GC(251 ,00) lWE(79,001
1'(::63.\\\)1, \J('(::'i6.\\\), 1'WE(7 ,00\
T(549,001, ClC(35J .OU), TW(198.00)
T(979,00), GC(796 ' 00), TWE(183 ,00)
T(l183 ,\lO), GC(4SU.00). W(137 .00), TW(250.00), TWE(346.00)
T(2101,00), G(,(1974,()O), TWE(127.00)
1'(522.00), GC(285 .00),TW(150. 00), TWE(87.00)
T(961.00), GC(517.00), TWE(444.00)
T(276.00), GC(96.00). TWE(J80,00)
U;l- Cultur- Area not im- .lolc available gated waste rl)r cl.I.ti
(inc::Jd- \atiGlIl !ng
16
-+4.00
58.00
40.0,)
431.00
231. 00
282 00
275,0:)
336.00
37,():)
156,00
105.00
163,00
130.00
144,00
tn,CO
68.00
690.00
210,00
49.00
107.00
19.00
ga UC.lar and grov~s)
17
4.00
100.00
[8
142.00
122.0J
SO.OJ
45.00
118.00
238.00
13~,UD
72.00
159.0J
·IO.OJ
42,00
43.00
51.00
59.00
26'00
2~.OJ
51,00
81,00
77,00
187,0)
79,00
145.00
21.00

18
VILtAGE
aALV.lPURA C. D. BLOCK Amenitic~ and
------ ----- ------- -----Loca- Name of village tion (with Hadbast No.) Code No.
70 Gbure1a (49)
71 ;Salloh (48)
72 Chaodke (450)
73 Khokbar (3)
74 Sooch (4)
75 Bhaini Chuhar (452)
76 PJrkot (451)
------
Total area of the village (in hectares)
J
424.0J
1.326.00
3.013.00
],172.0J
617.03
622.0U
862.00
33198.00
Total popula tioa and numb:r of households
875 (142)
3.57\) (570)
7.328 (1111)
2,337 (338)
1.375 (209)
1461 (241)
1.180 (193)
80,716
(12956)
Ameoitie~ available (if 'lot available within the vlliage. a da.h (-) is shown in the column and next I;) it in br~c\..ets the dIStance in br,1aJ Tango, viz., -5 )(ms. 5 -lD kml and 10 kms,. of t:lIl
nearest place ""here the faclhty IS availahle is !liven)
Educational
P
P. M.1l
P,M,H.
P
P
P.M
I'
P(37}. M(18) H(13). PUC(2), C(O). TR(O) 1(0). ACeO) 0(0)
MediCal
-( -5)
PHC.D, RP(6)
D
-(-5)
-( -5)
D
-(--5)
Drinking water (potable)
7
HP
T.TW, IIP
T. HP
T,HP
T.HP.C
'r
T
Post and telegraph
Day or days of the marketl hat, jf ailY
')
Rampura Pbul
.( 5) - (-5)
PO -(5-10)
PO - (- 5)
-(-5) -(IO~ )
- (-5) -(10 )
--( - 5) -(5 -1 U)
-(-5) --(5 -10)
CommunicatIons (bus stop, railway stat'orJ, waterwaYI
:0
13J
8:;
135
BS
RS
BS
BS
---- ----...----H(5), MCW(2) MH(3). CWC(l) HC(2) .. PHC(4) D(12). PHS(O)
TB(O). FPC(J)
NH(O). SMP(O)
RP(S). CHW(2)
0(0)
----~------
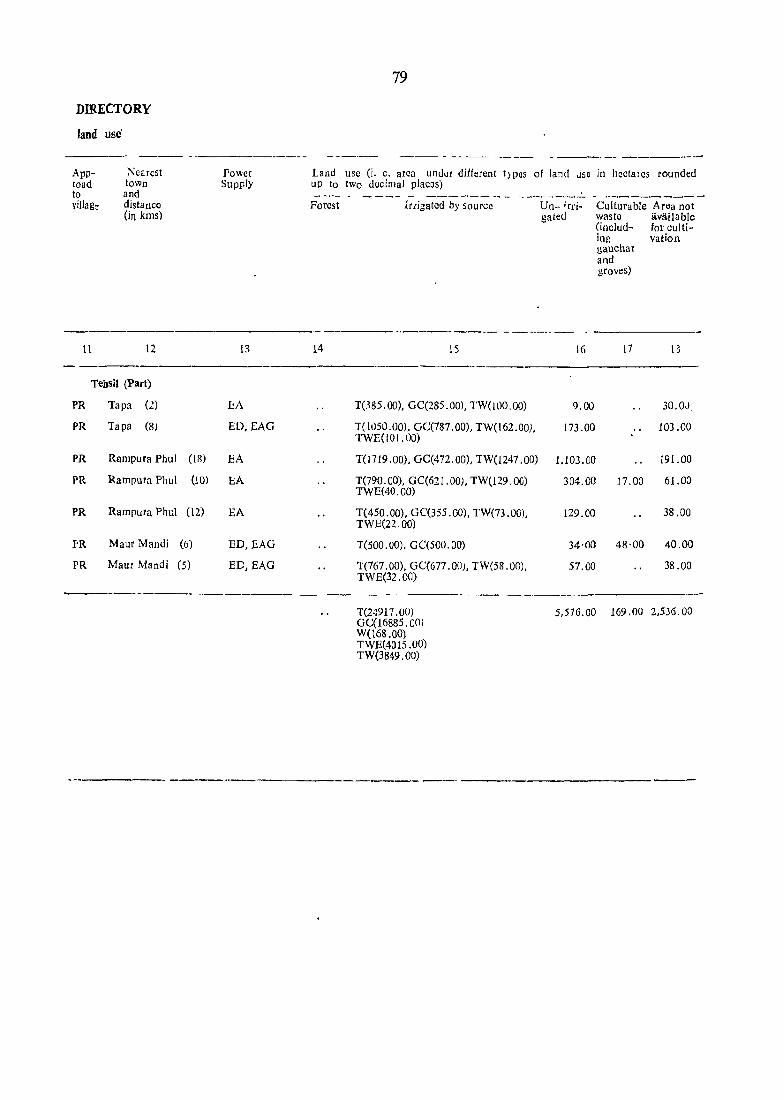
DIRECTORY
land use'
~--- ~----------
Approad to viJ1ag~
1t
~carcst town and distance (iII kms)
12
Tehsil (Part)
PR Tapa (2)
PR Tapa (8)
PR Rampura Phui ([S)
PR Rampura Phul (10)
PR Rampura Phul (12)
.foR Maur Mandi (6)
PR Maur Mandi (5)
-----
Pov.cr Supply
13
BA
ED, EAG
.I:lA
bA
EA
ED, EAG
ED, EAG
79
Land use 0. e. arca undur dillerent t)POS 01 land JSC in hcctalcs rounded up to two docimal placos)
Forest
14
lrtigated by sourco Un- irrigated
-----15 16
1'(385.00), GC(285.00), TW(IOO,OO) 9.00
T(1050.00), GC(787.00), TW(162.00}, 173.00 TWE(IOI.OO)
Te[ 719 .00), GC(472.00), TW(1247 .00) 1.103.00
T(790.CO), GC(621.00), TW(l29.00) 304.00 TWE(40.00)
T(450.00), GC(355.00), TW(73.00), 129.00 TWE(22.00)
T(500.00). GC(500.00) 34·00
1'(767.00), GC(677.00), 1'W(58.0G), 57.00 1'WE(32.00)
--------~
T(24917 . 00) 5,576.00 GC(16885. 00) W(168.00) 1'WE(4015.00) 1'W(3849.00)
Cultul"able Area not was to available (includ- for culti-ing vation llauchar and groves)
17 [3
30.0J
103.00
i91.00
17.00 61.00
38.00
48·00 40.00
38.00
169. 00 2,536.00
------------------------------


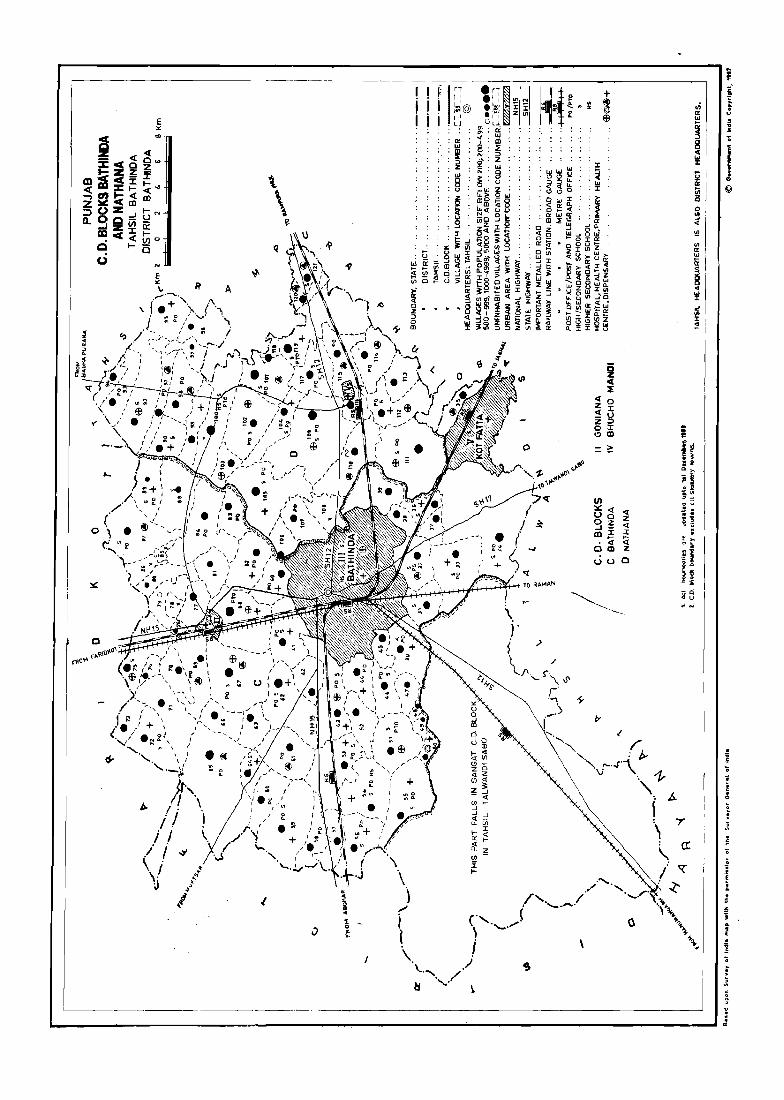

81
ALPHABETICAL LIST OF VILLAGES
IN BATHINDA C.D. B~OGK


83
ALPHABETICAL UST OF VILLAGES
BATHINDA C. D. BLOCK
------ ~----------------------------------------------------------------------
Sr. No.
Name of village (with Hadbast No.)
2
Ab]u (174)
2 Akalia Kalan (8)
3 AkaJia Khurd (7)
4 Amargarh (161)
5 Baho Jattri (3)
6 Baho Sibian Patti (2) Basawa Singh
7 Baho Sibian Patti (1) Dharam Siol,(h
8 Baladewala (73)
9 Balahar Mehma (17iJ)
10 Balahar Vinjhu (1'6)
11 Baluana (77)
12 Behman Dewana (74)
13 Bhagu (59)
14 Bhisiana (180)
15 Bhokhra (160)
16 Bir Behman (75)
11 BiItalab Urr (68\ Talabnai
18 Burj Mehma (118)
19 Chak Goniana (164) Kalan
20 Chak Goniana (165) Khurd
21 Chak Jandanwala (156)
22 Chak Jeeda (IS7)
23 Chugha Kalan (79)
24 Chugha Kburd (76)
25 Dan Singbwala (171)
26 Deo,n (177)
27 Ganga (173)
28 Gebri Devi Nagat (63)
29 Gill Patti (71)
30 Goniana Kalan (162)
31 GoniaUa Khurd (163)
Location Code (Manual)
3
1991 Census
Lo~ation Code (Computer)
4
Bathinda Tabsil (Par!)
20/11/2/65
20/11/2/75
20/11/2/74
20/11/2/81
20/11/2/50
20/11/2/48
20/11/2/49
20/11/2/42
20/11/2/70
20/11/2/77
20/11/2/53
20/11/2/43
20/11/2/39
20/11/2/60
20/11/2/32
20/11/2/44
20/11/2/45
20/11/2/61
20/11/2/78
20/11/2/76
20/11/2{85
20/11/2/86
20/11/2/54
20/11/2/52
20/11/2/71
20/11/2/62
20/11/2/72
20/11/2/33
20}11/2/40
20/11/2/80
20/11/2/79
20/li/onO/OOS5
20/11/0020/0075
20/11/0020/0374
20/11{0020/0081
20/li/OnO/OD50
20/11/0020/00~2
20/11/0020/0049
20/11/0020/0042
20/11/0020/0070
20/11/0020/0077
20/11/0020/0053
20/11/0020/0043
20/11{0020/0D39
20/11/0020/0060
20/11/0020/0082
20/11(0020/0044
20/1I/0020/0MS
20/11/0020/0061
20/11/0020/0078
20/11/0020/0076
20/11/0020/0085
20/11/0020/0086
20/11/0020/0054
20/11}0020/0052
20/11/0020/0071
20/11/0020/0062
20/11/0020/0072
20/11}0020/0033
20J11/0020J0040
20J11/0020/0010
20/11}0020/0079
Location Code (Manual)
5
17/11/2/HJ
17/11/2/5
17/11/2/6
17/11/2/30
17/11/2/88
17/11/2/99
17/11/2/89
17/11/2/78
17/11/2/4
17/11/2/19
17/11/2/82
17/11/2/79
17/11/2/61
17/11/2/12
17/11/2/31
17/11/2/80
17/11/2/74
11/11/2/15
11/11/2/22
11/11/2/21
17/11/2/28
11/11/2/24
17/11/2/85
17/11/2/81
17/11/2/3
17/11/2/16
17/11/2/1
17/11/2/72
17/11/2/76
17/11/2/20
17/11/2/23
1981 Cen!u!
Loeation Code (Computar)
6
17/H/Gi20/0no
17/11/0020/0035
17/11/0020/0006
17/11/0nO/0()30
17/11/0::120/0088
17/11/0020/Q.o90
17/11/0029/0989
17/11/0020/0078
17/11/0020/090~
17/11/0020/0GI9
17/11/0020/0082
17/11/0020/007~
P /11/0D20/00SS
17/11/0320/0012
17/11/0020/0031
17/11[0020/0080
17/11/0020/0~74
17/11/0020jOGI5
17/11/0020/0922
17/11{0020/0021
17/11/0020/0028
17/1)/0020/0024
H{1l/0020/008S
17/11/0020/0081
17/11/0020/0003
17/11/0020/0016
17/11/0020/0001
17/1.110020/0072
17Jl1J0020/0016
17/11/0020/0020
17/11,/002010023
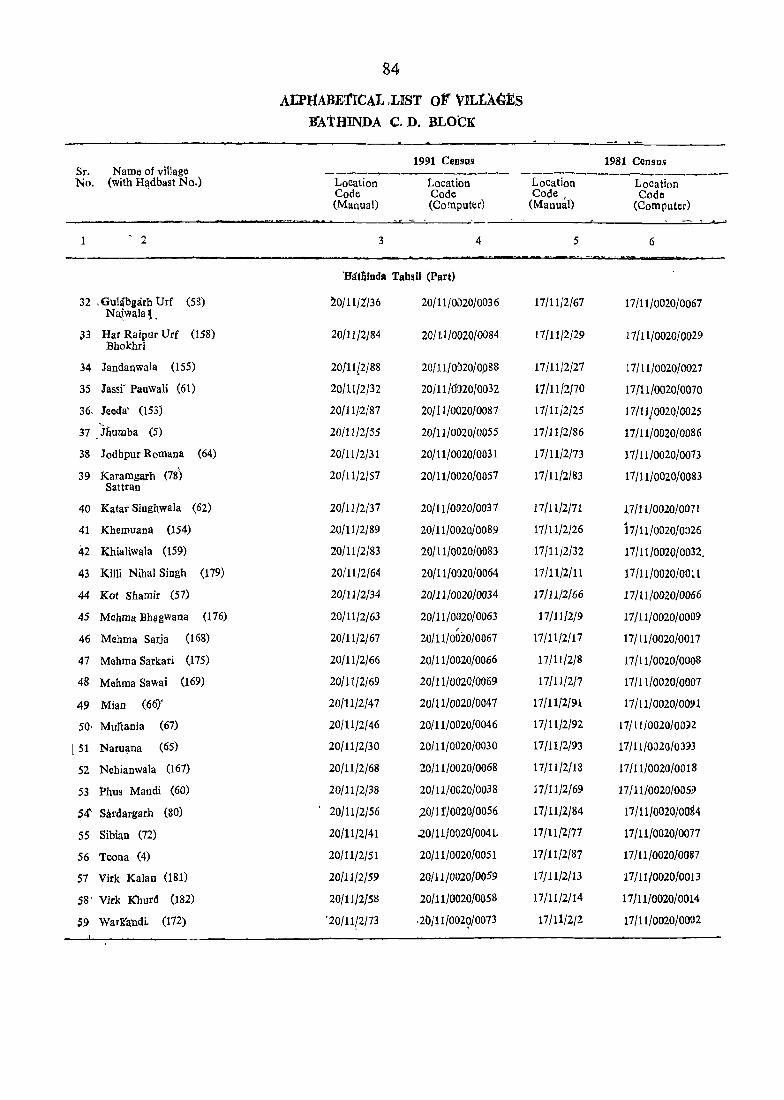
84
AL'PI1ABE1'lCAt .UST 011 \TILtAGli!S B"ATIUNDA C.D. BLOCK
1991 Census 1981 Census Sr. Name of village
----~-----~--- --------------~--No, (with Hadbast No,) Louation Location Location Location Code Code Code, Code (Manual) (Computer) (Manual) (Computer)
1 . 2 3 4 5 6
'B!ttninda Tahsil (Part)
32 ,6uhibgarh VIr Nafwala~ ,
(58) '10/11/tf36 20f11/0020fo036 17/ll/2{67 17f11/0020f0067
33 Har Raipur Vrf Bhokhri
(158) 20/11/2/84 20/1.1/0020/0084 17/11/2/29 17/11/0020/0029
34 Jandanwala (155) 20[1112/88 20/11/0020/0»88 17/11/2/27 17/11/0020/0027
35 Jasst Pauwali (61) 20/11/2/32 20/11/6020/0032 17/11/2/70 17/11/0020/0070
36. Jeeda' (153) 20/11/2/87 20/11/0020/0087 17/11/2/25 17/11/0020/0025
37 _ 'jllumba (5) 20/11/2/55 20/11/0020/0055 17/11/2/86 17/11/0020/0086
38 Jodhpur Romana (64) 20/11/2/31 20/11/0020/0031 17/11}2/73 17/11/0020/0073
39 Karamgarh (78) 20}11/2/57 20/11}0020}0057 17/11/2/83 17/11/0020/0083 Sattran
40 Katar Singhwala (62) 20/11/2/37 20/11/0020/0037 17/H/2/71 17/11/0020/0071
41 Khemuana (154) 20/11/2/89 20/11/0020/0089 17/11/2/26 17/11/0020/0026
42 Kbialiwala (159) 20/11/2/83 20/11/0020/0083 17/11/2/32 17/11/0020/0032,
43 Killi Nibal Singh (179) 20/11/2/64 20/11/0020/0064 17/11/2/11 17/u/0020foOll
44 Kot Shamir (57) 20/11/2/34 20/11/0020/0034 17/11/2/66 17/11/0020/0066
45 Mehma Bh~gwana (176) 20/11/2/63 20/11/0020/0063 17/11/2/9 17/11/0020/0009 ,
46 Mehma Sada (168) 20/11/2/67 20/11/0020/0067 17/11/2/17 17/11/0020/0017
47 Mehma Sarkari (175) 20/11/2/66 20/11/0020/0066 17/11/2/8 17/11/0020/0008
48 Mehma Sawai (169) 20/11/2/69 20/11/0020/0069 17/11/2/7 17/11/0020/0007
49 Mian (66)' 20/11/2/47 20/11/0020/0047 17/11/2/91 17/11/0020/0091
50· Muliaoia (67) 20/11/2/46 20/11/0020/0046 17/11/2/92 17/11/0020/00n
[ 51 Naruana (65) 20/11/2/30 20/11/0020/0030 17/11/2/93 17/11/0020/0J93
52 Nehianwala (167) 20/11/2/68 20/11/0020/0068 17/11/2/18 17/11/0020/0018
53 Pbus Mandi (60) 20/11/2/38 20/11/0020/0038 17/11/2/69 17/11 /0020/0059
54' Sardargarh (80) 20/11/2/56 ),0/lt/0020/0056 17}11/2}84 17/11}0020}0084
55 Sibian (72) 20/11/2/41 .:20/11/0020/0041. 17/11/2/77 17/11/0020/0077
56 Teona (4) 20/11/2/51 20/11/0020/0051 17}11/2/87 17/11/0020/0087
57 Virk Kalan (181) 20/11/2/59 20/11/0020/0059 17/11/2/13 17/11/0020/0013
58' Virk Khurd (182) 20/11/2/58 20/11/0020/0058 17/11/2/14 17/11/0020}0014
59 WarR'andL (172) '20/11/2/13 .2t'J/ll/0029/0073 17/11/2/2 17/11/0020/0002
ViLLAGE DIRECTo'R~
BATHINDA C.D. BLOCK
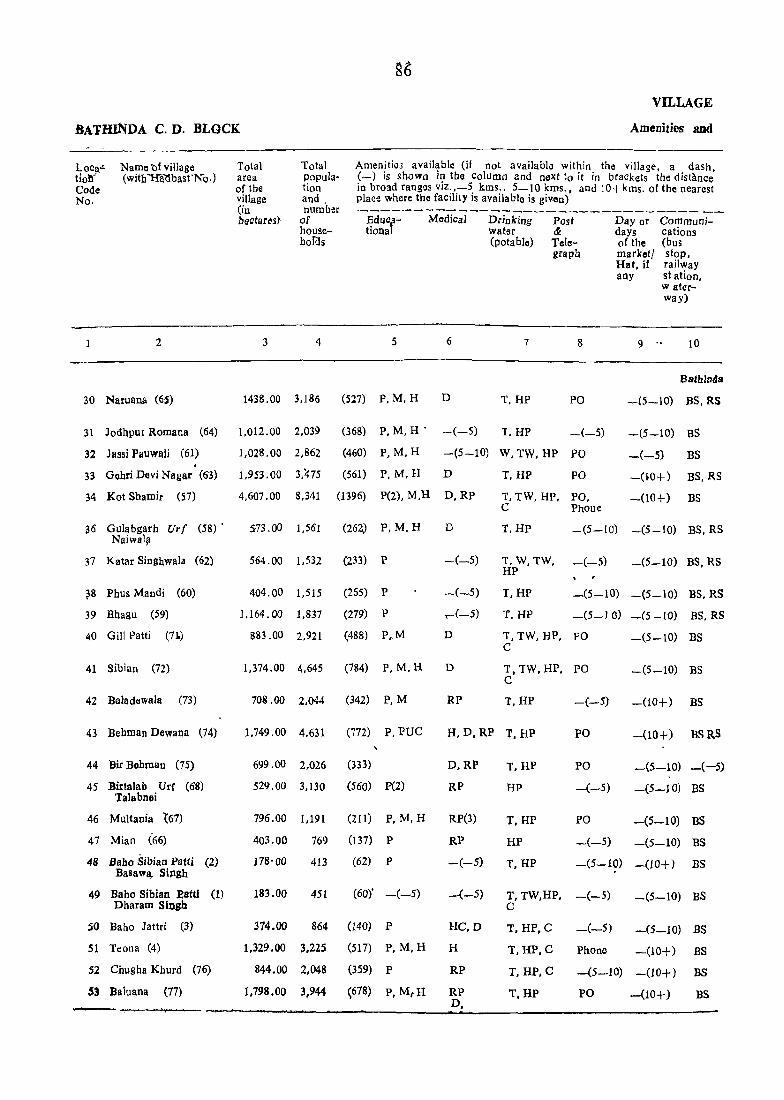
VILLAGE
.8A1rHIN'DA C. D. BLOCK Amenities and
Loca"" Name 'bhillage tion4 (witb"Hi\l.1bast'No.) Code No.
2
30 Naruana (6S)
31 Jodhpur Romana (64)
32 Jassi Pauwali (61) .
Total area of the village (in beatares}
3
Total population and. number
of householQs
4
Amenitio3 available (if not available within the villaoe, a dash. (._) is shown in tbe column and next to it in brackets" the distance in broad ranges viz.,_5 kms .• 5-10 kms .• and IO+kms. of the nearest place where the facility is available is giV{ln)
---------------------------------1?dua~- MedicaJ Drinking Post Day or Communi-tlonal water & days cation3
5 6
(pota ble) Tcle- of the (bus
7
graph market/ stoP.
8
Hat, if railway any sl ation,
waterway)
9 .• 10
BathlDds
1438.00 3,185 (527) p, M, H D T.HP PO -(5-10) BS. RS
1.012.00 2.039
1,028.00 2,862
(368) p. M, H .
(460) P. M, H
-(-5) T,HP -(-5)
-(5-10) W, TW. HP PO
-(5-10) BS
-(-5) BS
33 Gohri Devi Nagar (63) 1,953.00 3);]5 (561) P, M, H D T, HP PO
T, TW, HP, PO,
-no+) BS, RS
34 Kat Shami! (57) 4.607.00 8,341 (1396) P(2), M.H D, RP
36 Gulabgarh Urf (58)' Naiwa11l
37 Katar Singbwala (62)
~8 Phus Mandi (60)
39 Bhagu (59)
40 Gill Patti (7.1.)
41 Sibian (72)
42 Baladewalll (73)
573.00 1.561 (262) p, M. H
564.00 1.532 (233) p
404.00 1,515 (265) P
1.164.00 1,837 (279) P
883.00 2,921 (488) F,M
1,374.00 4,645 (784) P,M,H
708.00 2,044 (342) p, M
D
-(-5)
-(-5)
.... (-5)
D
D
RP
C Phone -(10+) BS
T.HP _(5-10) -(5-10) BS. RS
T, W, TW, _(_5) HP
_(5_10) BS, RS
T, !iP _(5_10) -(5-10) BS, RS
T, HP -(5-10) -(5 -10) BS. RS
T, TW, HP, PO -(5-10) BS C
T, TW, HP, PO C
T, HP -(-5)
_(5_10) BS
-(10+) BS
43 Bebman Dewana (74) 1.749.00 4,631 (772) P,PUC H, D, RP T, HP PO -(10+) BSRS
44 Bir Bohman (75)
45 Birlalab Urf (68) Talabnoi
46 Multania t67)
47 Mian (66)
48 Baho Sibian Patti (2) Basawa, Sipgh
49 Baho Sibian Eatti (I) Dharam SiDgb
50 Baho Jattri (3)
51 Teona (4)
52 Chugha Khurd (76)
53 Baluana (77)
699.00 2,026 (333) D, RP
529.00 3,130 (560) P(2) RP
796.00 1,191 (211) P, M, H RP(3)
403.00
178'00
183.00
374.00
769 (137) P
413 (62) P
451 (60)' -(-5)
864 (140) P
1,329.00 3,225 (517) P, M. H
844.00 2,048 (359) P
1,798.00 3,944 (678) p. MfH
RP
-(-5)
_(_5)
He,D
H
RP
RP D,
T,HP
HP
PO
-(-5)
PO
-(-5)
-(5-10) -(-5)
-(5-10) BS
-(5-10) BS
-(5-10) BS
T,HP
HP
T,HP -(5-10) -(10+) BS
T, TW.HP, -(-5) C
T. HP, e _(_5)
Phone
-(5-10) BS
-(5-10) BS
-(10+) BS T,HP,C
T.HP,C
T,HP
-(5-10) -(10+) BS
PO -(10+) BS

DllRECTORY
land UOJC
App- Neate,! roach tOWl] to and village distance
(in kms.)
11 12
Tahsil (Part)
PR Batbindh (9)
PR Bhatinda (6)
PR Bhutinda (4)
PH Bathinda (10)
PR Bathinda (ll)
PR Bathinda (6)
PR Bathinda (9)
PR Bathinda (6)
PR Bathinda (8)
PR Rathinda (8)
PR Rathinda (5)
PR Bathinda (10)
PR Bathinda (10)
PR Bathinda (7)
PR Bathinda (5)
PR Bathinda (6)
PR Bathinda (8)
PR Bathinda (10)
PR Sangat (8)
PR Bathindn (10)
PR Bathinda (12)
PR Batbinda (10)
l'R Giddarbaha (10)
Power Supply
13
ED.EAG
ED
ED. EAG
ED
EA
ED. EAG
EA
EA
ED.EAG
EA
EA
EA
EA
EA
EA
EA
EA
BA
EA
EA
EA
ED.EAG
EA
87
Land use (i. e. area under different tYP!3 of land use in he;tares roundej upto two decimal placos) --__ ------ ---__ ---_-----------_ -------- - - - --
Porest Irrigated by source
14 15
.. T(1280.00). GQfl36.00). W(98.00). TW(346.00)
.. 1'(713.00). GC(700.00). W(13.00)
., 1'(562 '00), GC(509 .00), TW(53 '00)
., T(1214.00). GC(1186.00). 1'W(2S .GO)
.. T(2458 .00). GC(2362.00). TWE(96.00)
., T(438.00). GC(420.00) .TWE(18. 00)
.. r(459.00). GC(440.00). TW(19.00)
., r(273.00). GC(202.00).lWE(71.00)
., T(603 .00). GC(309 .00). TWE(294 .00)
T(592.00). GC(529.00). TW(63.00)
., T(l233.00), GC(926.0[). TW(J07.00)
.. T(567 .00). GC(494 .00). W(57.00). TW(16.00)
., T(1483.00). GC(1293.00), TW(40.0Q) TWE(150.00)
., T(624 .00). GC(624. 00)
T(448.00). GC(4H.OO)
.. T(703 .. 00). GC(703 .00)
.. T(312.00), GC(312.00)
.. 1(147.08). GC!44.0D). TW(3.00)
.. T(130.03). GC(1l7.00). TW(l3.00)
.. T(303.00). GC(290.00). TW(13.00)
.. T(943.00).GC(890.00), TW(53.00)
.. T(718.00). GC(718.00)
.. 1(1367.00), GC(1204·00). TW(163.00)
Un-irriga,ed
16
56.00
195.00
364'00
605.00
1.837.00
72.00
56.00
19.00
33.00
190.0:)
35.00
89.00
75.00
40,.00
80.0[)
28.03
70.00
11.0)
19.0:)
23.00
244.03
70.00
267.00
Culturable waste
(inaluding llauchar and groves)
17
9.0J
22.08
5.00
11.00
ArCla not available for cultivation
18
9J.O~
82'.00
102·00
129.00
312.00
63.00
49.00
112.0D
528.00
90.0:)
106.00
52.03
191.0:3
35·.00
1.00
65.03
21.00
20.00
34.00
48.00
142.00
56.00
~64.00
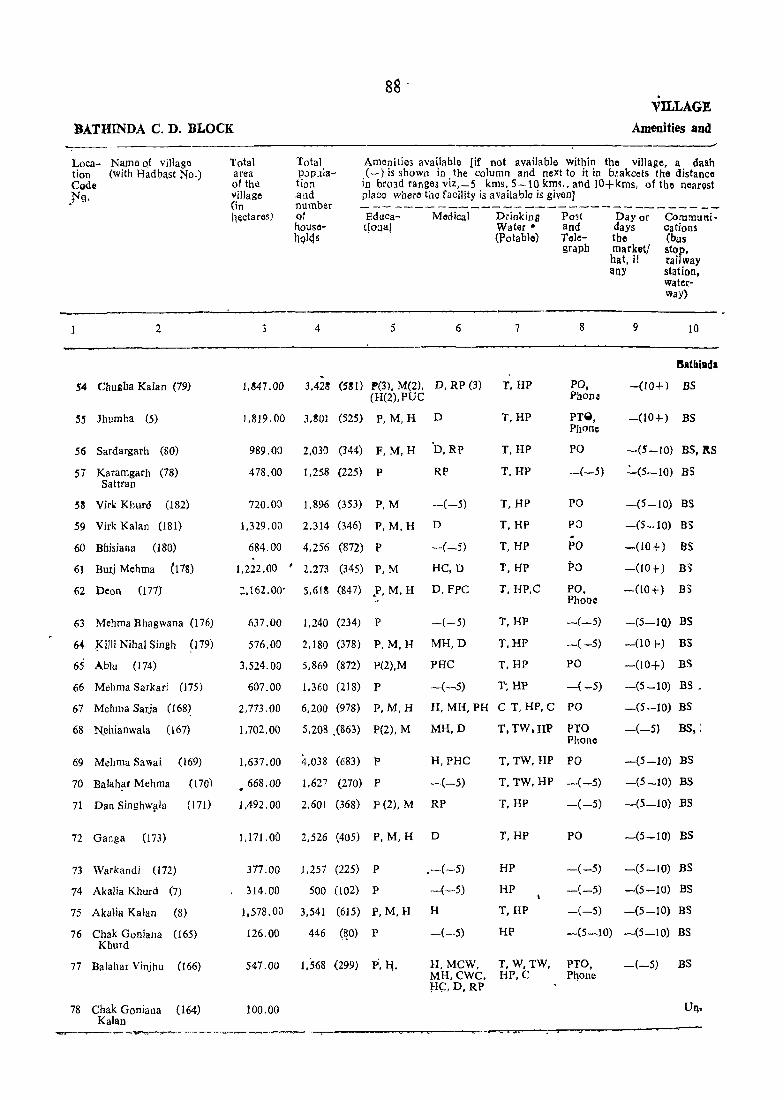
88 . . VILLAGE
BATHINDA C. D. BLOCK Amenities and
Loca- Name of village tion (with Hadhllst No.) Code ."tJ§.
2
54 Chugha Kalan (79)
55 Jhumba (5)
56 Sardargarh (80)
57 Karamgarh (78) Sattran
51! Virk Khurd (182)
59 Virk Kalan (181)
60 Bbisiana (180)
61 Burj Mehma (178)
62 Deon (177)
63 Mehma Bhagwana (176)
604 !(illi Nibal Singh ~179)
65 Ablu (174)
66 Mehma Sarkari (175)
67 Mehma Sarja (168~
68 N,ehianwala (167)
69 Mehma Sawai (169)
70 Balah~r Mehma (170)
71 DatlSinghw?la (171)
72 Ganga (173)
73 Warkandi (172)
74 Akalia Khurd (7)
75 Akalia Kalan (8)
76 Chak Goniana (165) Khurd
77 Balahar Vinjhu (166)
78 Cliak Goniana (164) Kalan
Total area of the village (in hllctares)
Total p')pllation .and number of housohOlqs
Amenilie3 available fif not available within the village, a dash (- ) is shown in the column and next to it in b.lakcets the distance
in bro)d range.> viz,_ 5 kms, 5 -1 0 kms., and 10+ kms, of the nearest place wnera the facility is available is given) ---------------------------------Educa- Modica! Drinking Post Day or Communi-t!o~al Watllr • and days cations
3 4 5 6
(Potable) Tele- the (bus
7
graph market/ stop, hat, if railway
8
!lnY station,
9
waterway)
10
1,847.00 3,423 (SSI) l"(3) , M(2), D, RP (3) T, HP PO, PbOn~
Blthiada
-(lOt) BS (H(2),PUC
1.819.00 3,301 (525) P,M,H D
989.00 2,030 (344) F. M, H 'D, RP
478.00 1.258 (225) P RP
no.OCl 1.896 (353) P, M -(-5)
1.329.00 2.314 (346) p. M. H D
684.00 4,256 (872) P -(-5)
1.222.00 ' 2,273 (345) p, M HC, D
:,162.00' 5,6111 (847) .p, M, H D, FPC
637.00 1.240 (234) P -(-5)
576.00 2.180 (378) P, M, H MH, D
3,524.00 5,869 (872) P(2),M PHC
607.00 1.360 (218) P -(-5)
T,HP
T,HP
T,HP
T,HP
T,HP
T,HP
T,RP
T, RP.C
T,HP
T,HP
T.RP
l",HP
PTWl, Phone
PO
-(-5)
PO
P:J . PO
PO PO, Phone
-(-5)
-(-5)
PO
-(-5)
-(lOt) BS
-(5-10) BS, ItS
2_(5-10) BS
-(5-10) BS
-(5-10) as -(lOt) as -(10 +) B3
-(lOt) BS
-(5-10) BS
-(10 f..) BS
-(10+) BS
-(5 -10) BS_
2,773.00
1.702.00
6,200 (978) p, M, H
5,208 .(863) P(2), M
H, MR, PH C T, HP, C PO -(5-10) BS
MH,D
1.637.00 4,038 (683) P H, PHC
668.00 1.627 (270) P -·(-5)
1.492.00 2,601 (368) P(2),M RP
U71.0a 2,526 (405) P, M, H D
377.00 1.257 (225) P .-(-5)
314.00 500 (102) P -(-5)
1,578.00 3,541 (615) P, M, H H
126.00 446 (~O) P -(-5)
T,TW,HP PTO Phone
T, TW, HP PO
T, TW, HP -(-5)
T, HP -(-5)
T,HP PO
-(-5) BS, J
-(5-10) BS
-(5-10) BS
-(5-10) BS
-(5-10) BS
HP
HP
T,HP
HP
-( -5) -(5 -1 0) BS
-(-5) -(5-10) BS
-(-5) -(5-10) BS
-(5-10) -(5-10) BS
547.00 1,568 (299) P·,Ii. H, MCW, T, W, TW, PTO, -(-5) BS MH, CWC. HP, C PQOlle }ie, D, RP
100.00
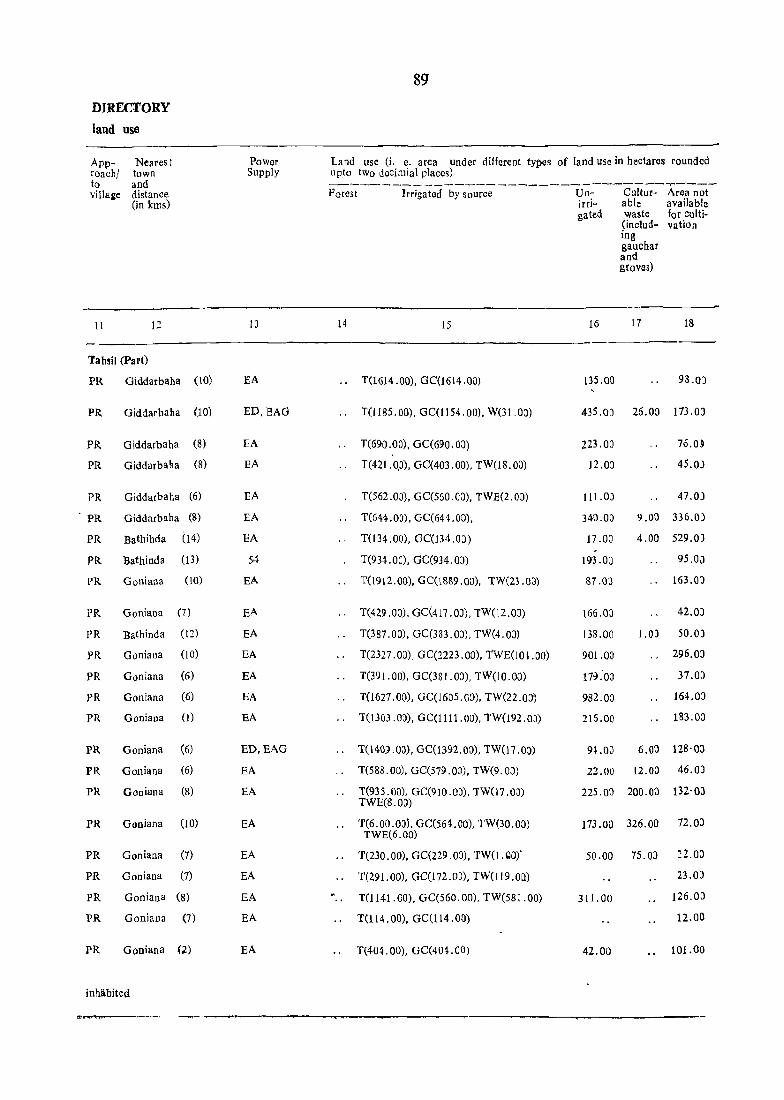
DIRECI'ORY
land use
Approach/ to village
11
Nearest town and distance (in killS)
12
Tahsil (Part)
PR Giddarbaha (10)
PR Giddarbaha (10)
PR Giddarbaha (8)
PR Giddarbaha (8)
PR Giddarbaha (6)
PR Giddarbaha (8)
PR Bathihda (14)
PR Bathinda (13)
PR Goniana (10)
PR Goniana (7)
PR Bathinda ( 12)
PR Goniana (10)
PR Goniana (6)
PR Goniana (6)
PR Goniana (1)
PR Goniana (6)
PR Goniana (6)
PR Goniana (8)
PR Goniana (10)
PR Goniana (7)
PR Goniana (7)
PR Goniaoa (8)
PR Goniana (7)
PR Goniana .(2)
inhabited
Power Supply
13
EA
ED. BAG
EA
EA
EA
EA
EA
54
EA
EA
EA
EA
EA
EA
EA
ED. BAG
EA
EA
EA
EA
EA
EA
EA
EA
Sg
Land use (i. c. area under different types of land use in hectares rounded upto two decimial places) -----------~--------------------~----Porest Irrigated by source Un- Cultur- Area not
irri- able available
14 15
T(1614 .00). GC(1614 .00)
T(1185.00), GC(1l54.00). W(31.03)
T(690.00). GC(690.0Q)
T(421 .QO). GC(403 .00), TW(18. 00)
T(562.00). GC(550.0Q). TWE(2.03)
T(644.0~). GC(644.00).
T(134.00). GC(134.0)
T(93-LOD). GC(934.0:J)
T(1912.00). GC(1889.00). TW(23.03)
.. T(429.0::)). GC(417 .OJ), TW(12.0J)
T(387.00). GC(383.OJ), TW(4.0J)
T(2327.00), GC(2223.00). TWE(lOLOO)
T(391.00). GC(38I.m), TW(IO.OJ)
.. T(1627.00). GC(J605.QO), TW(22.03')
.. 1(1303.0:)). GC(1111.00), TW(l92.0~)
.. 'I(140) .O~). GC(1392.00), TW(l7 . OJ)
'I(588.00), GC(579.0J). TW(9.00)
.. T(935.0(), GC(910 .03). lW(17 .00) TWE(8.0J)
.. T(6.00.00}. GC(564.00), TW(30.00) TWE(6.00)
T(230.00). GC(229.0:J). lW(UlO)'
T(291.00). GC(172.0J). TW(119.00)
T(1141.00), GC(560.00), TW(581.00)
T(114.00). GC(114.00)
T(404.00). GC(404.00)
gated waste for culti· (includ- vatio;) ing gauchar and grOves)
16 17 18
135.00 93 .0)
435.00 26.00 173.0)
223.03 76.09
12.03 45.0)
111 .OJ 47.0)
340.0) 9.00 336.0)
17.0;) 4.00 529.0)
193.0J 95.0;J
87.03 l(j3.0)
165.0::1 42.0)
138.00 1.0) 50.0)
901.00 .. 296.03
179 :OJ 37.0)
982.08 164.0)
216.00 183.0:1
9~.0:J 6.0:> 128'OJ
22.00 12.0n 46.0)
225.00 200.0n 132'0:1
173.00 326.00 72.00
50.00 75.0) ::2.03
23.03
311. 00 126.03
12.00
42.00 101.00

BATHINDA C. D. BLdCK Amenities aDd
Loca- Name of village tion (with HadbMt No.) Code No.
total area ot the village (in hectares)
Total population and number
of household3
Amenities available (if not available 'within the village. a dash ,(-) is shown in the column and next to it in brackets the distance ill' broad ranges viz.-5kms, 5-10 kms. and 10+ kms of the nearest place where the facility is available is given)
-------~--~----------------------
Educational
Medical Drinking water (potable)
Post and Telc-:graph
Day or days oltha marketl hat. it any
Communicatioo. (bus stop. railway station, water-way)
-----.------------------.--~-----------------------------------
2 3 4 5 6 8 9
-----------~-------~--~-------------------~-------------------
Bathinda
79 'Goniana Khurd (163) 530:00 1.211 (195) P -(-5) T.,HP -(-5) -(-5) BS
-80 Goniana Kalan (192), 713.00 1.589 (264) P -(-5) T.HP PO -(5-10) BS
81 Amargarh (161) 496.00 942 -(155) r.M -c- 5) T,HP - (-5) - (- 5) -(-5)
82 Bhokhra (160) 1.180.00 ' 3.328 (516) ~.M D T.RP PO. - (-5) BS PHONE
83 KhiaJiwala (159) 1:045.00 2.414 (400) P ewe T.HP PO -(-5) BS
84 Har Rail?ur Uri (158) 1.878.00 3.342 (503) P.M - (-5)_ T PO -(-5) BS Bhokhn .
85 ChakJandanwala (156) 43.00 Un-
86 ChakJeeda (1$7) 364.09 Un-
87 J.eeda (153) 1.651.00 4.552 ~699) P,M,H PHC T. TW.HP PO _(5-10) BS
88 Jandanwala (155) 2.346.00 4J170 (611) P,M,H FPC. T.HP -(-5) -(5-10) BS RP(2)
89 Khemuana (154) 768.00 2.620. (400) P.M.H /D T. TW.,ijP PO -(5-10) BS
-------------- ------------'--.-----------_---------------- - ----
64683,00, )A9.87:3
(24665)
P(62). M(33) H(24). PUC(2) C{O). TR(O) 1(0). AC(O) 0(0)
H(6). MCW(I) MH(4). CWC(2) HC(3). PHC(4) D(22). PHS(O) TB(O), FPC(2) NH(O). SMP(O) RP(20). CHW(O) 0(0)
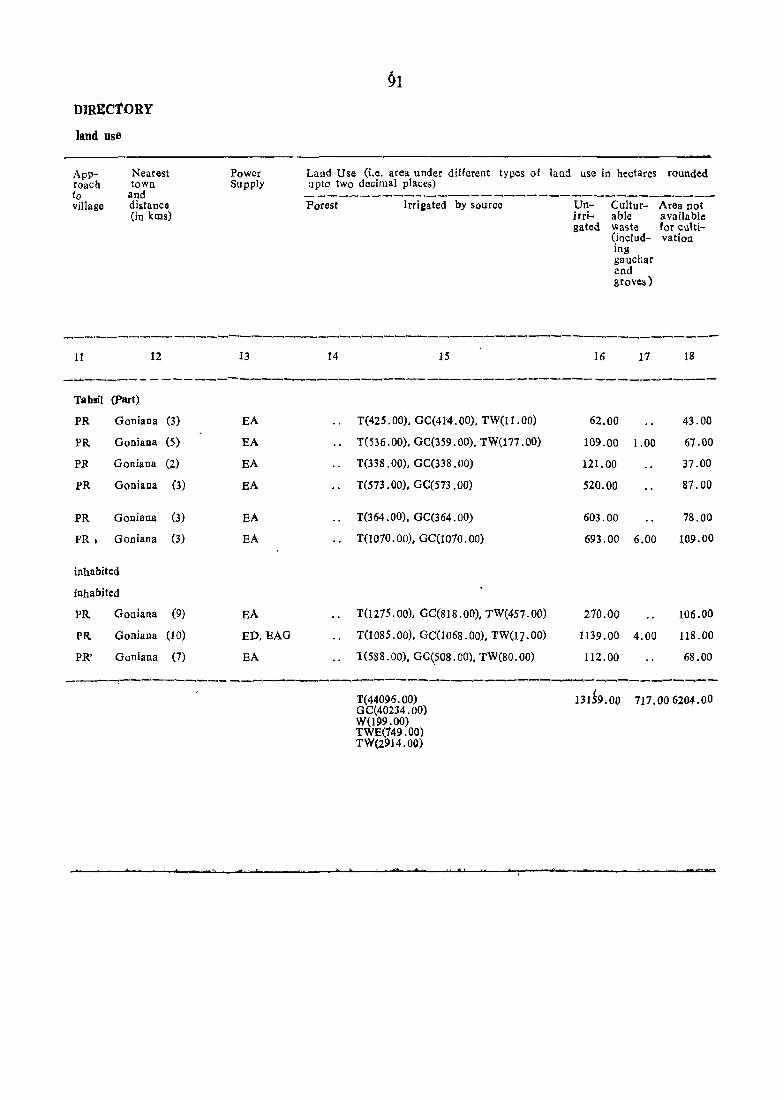
numctoRY land use
Approach to village
Nearost town
and distanco (in kms)
Power Supply
Land Use (i.e. area under different types of land use in hectares rounded upto two decimal places)
Forest Irrigated by source Unirrigated
Culturable Waste (including gauchar and grove~)
Area not available for cultivation
---------------------------------..----------------------------11 12 13 14 15 16 17 18
_.-J.. _____________ - _________________________________________ _
Tabsil (part)
PR Goniaoa (3) EA T(425.00), GC(41'4. 00), TW(I1.00) 62.00 43.00
PR Goniaoa (5) EA T(536.00), GC(359. 00), TW(I77 . 00) 109.00 1.00 67.00
PR Goniana (2) EA T(338.00), GC(338.00) 121.00 37.00
PR Goniana (3) EA T(573 .00), Ge(S73.00) 520.00 87.00
PR Goniana (3) EA T(364.00), GC(364.00) 603.00 78.00
FR i Goniana (3) EA T(1070.00), GC(1070. 00) 693.00 6.00 109.00
i)lhabited
inhabited
PR Goniana (9) EA T(1275.00), GC(818.00), TW(457.00) 210.00 106.00
PR Goniana (10) ED. BAG T(1085.00), GC(1068 .00), TW(l? 00) 1139.00 4.00 118.00
PRo Goniana (7) EA 1(588.00), GC(_S08. 00), TW(80. 00) 112.00 68.00
----~------------------------------------------------------T(44096.00) GC(40234.00)
131~9.00 717.006204.00
W(199.00) TWE(749.00) TW(2914.00)

ALPHABETICAL LIST OF VILLAGES
IN NATHANA C.D. BLOCK


95
ALPHABETICAL LIST OF VILLAGES
NATHA:'IIA C. D. BLOCK
----_--1991 Census 1981 Conslls
Sr. Name of villaga -._ - __ .- --- ----- ____ 4 ___ o_---_______ No. (witn Hadl>~st :"10.) Lllcation I.ocation Location I.ocation
Code Coda Code Coda (Manual) (Computer) (Manual) (G)'1lputer)
---2 3 4 5 6
------ ,_-- -Dalhinda Tabsl! (Part)
1 Bajolma (I 83) 20/11/2/91 3
~0'Il/0020/009 J 17/ 11/2/48 17/II/O::120/0J43
'2 Bath (197) 20/11/2/1 I 2(1/11/0020/0118 17/11/2/56 17/11/0::120/0056
3 H!laini (188) 20/11/2/9 20/11/0020/0095 17/11/2/53 17/11/0)],0/0J53
d Bhucho Kalan (201) 20/11/1/109 20/11/0020/010') 17/11/2/39 17,11/0)20/0)3)
5 Bhucho KhurJ (207) 20!l,l!2/110 20/11/0020/0110 17/11/2/37 17/11/0J20/01)37
6 Biblwala (174) 20/11/2/107 20/ II /0020/0 107 i7/11/2/35 17/II/O)20/0J35
7 Bud Dalla (184) 20/11I2/')7 20/11/0320/00')7 [7/11/2/52 17{1l/0J20/0J52
8 Bud Kahan (206) 20/11'2/116 20,'11/0020,0116 [7/11/2/38 17/11/0320/0038 Sing:lwala
9 Chak Bakhta (203) 20/11!2/11 i 20,'11/0020/0114 17(11/2/61 17/11/0J20/0)'i I
10 Chak Patch (205) 20;11,2/1[2 20/ll/0020/0112 I7/! 1/2/63 17/11I01D/OO53 S:nghwala
11 Chak Rilm (204) 20/11/2/113 20/11/0020/0113 17/1 t/2/6~ 17/11/0)20/0JH Sin~hwala
12 Dhilwan (177) 20/11/2/103 :!uj[ 1/0320/0103 17/1[/2'43 17/11 /OJ20/0) ~3
13 Ganga (180) 20/11/2/9') 20/llIOO2OJ009? 17!1l/2I,IS 17/11/J02')/0J IS
14 Giddar (181) 20/11/2/90 20/1110020/0'0)0 17/1i/2/4r, 17/11/0)2 J!JJ ~J
15 Gobindpura U't.Q) 25>1 i1l l /J,05 2gj 1110020/0 lO5 J 7/1 l./2J.1.L- 17/11/0)2'')/0033
16 Joganand (173) 20/11/2/106 20.'1110020/0105 17/11,2/3 ~ 17/11/0)20/0031
17 Kallan Maika \[86) 20/11/2,93 20, 11/0020/00)3 "
17/102/50 17/11/0)20/JJ50
18 Kalian Su(ha (lim 20/ll/219.J, 20/ll/0J20/0J)~ 17ill/2/51 17 /1l/OJ20/0)SI
19 Kalian 5ukha (185) 20/11/2/92 20/11/JJ20/0JJ2 17/11/2/4') 17/[ 1/0'J2J/OJ D
20 iehra HegHl (200) 20/11/1./117 20;II/OJ20/0117 17/11/2/40 17/11/0)20/lJ.)~'J
21 Lchl'a Dhulkat (194) 20/11/2/121 20/11/oo20/0W 17/11/2/57 [7/11/0)20/0)57
22 Lelua Khana (202) 20/11/2ilI5 20/II/OJ20;0115 17/11/2/60 17/11/0J20/0)5)
23 Lchl'a Mohabat (196) 20/ !I/2/ 119 20/11/0020/011'.) 17/11/215) 17/11/0J20}JJ5)
24 Leht'a Sondha (195) 20/112/120 20/11/0020/0120 17/11/2/53 17/11/0020/0058
25 Mari (191) 20{Il,2/96 20/11/0020/00,);) 17/11/ 12/5 ~ 17/11/0020/0J51
26 Mo]].la (175) ~O/11;2/103 20; 11/0,)20/0103 17/11/2/3.; 17/11/0)20/0036
27 Nathana (179) ;::0/11,2100 20/ll/0J20/010J 17/ll/2/·H 17111!OJ20/0J II
28 Nathpura (182) 20/11/2/93 20/11,0020/0J)3 17dl/2/41 17/ i 1/0020/0J 17
29 Paohla (1981 20/l1/12,101 20: ll,·0.)20/0:0 1 17/11,2,55 17/11/0J20/0J53
30 Poonli U78) 20/ !I/2; Ill2 20/ li/002l)/0 i 02 17; 11/2(-12 17,' 11/0J2.0/0J 12
31 Soman (199) 20.'11!2/10~ 20/ Il,0020/010~ 17/11/2/.11 17/11/00]'0/OJ II
32 Tlingwa h (20B) 20/11,2/111 20/ [1/0020/0111 17/11/2/64 17/11/0020/0054


VILLAGE DIRECTORY
NATHANA C;.D. BLOC"-

Loca- Name6\' vllla~ tion' -(witn'Hadbast l'l'o.) Code No.
2
90 Giddar (181)
91 Bajoana (183)
92 KaJlan Sukha (185)
93 KaHan MaIka (186)
94 KaHan SUdha (187)
95 Bhaini '\IS8)
96 Mari (191)
97 Bud Dalla (184)
98 Nathpura (182)
99 Ganga (180)
100 Nathana q 79)
101 Poohla (198)
102 Poohli (178)
103 Dhilwan (170)
104 Seman (199)
105 Gobindpura (176)
106 Joganand (l73~
107 Bibiwala (174)
108 Mehna (175)
109 Bhucho Kalan (201)
pO Bhucho Khurd (207)
ill Tungwali (208)
ll2 Chak Fateh (205) Singhwala
98
VILLAGE
Amenities and
'Total area of the village (in hectares)
Total population and number
Amenities available (if not available within the vi\\age, a dash (-) is s\1()wn in c.)lumn and next to it in brackets the distance in broad. tangs viz.-5 kms., 5-10 kms and 10+ kms. of the nearest place where the facility is aVailable is given)
of house~ holds..
~----~-__.-------- ------
3 4
Educational
5
Medical
6
1.030.00 2,121 (346) p, M, H cwe. D
632.00 1,671 (270) P PHe
Drinking Post water and (potable) Tele-
graph
7 8
Da:t or da}s of the market/ hat, if any
9
COnllUUnications (bus stop, railway stations, WaterWay)
Bathlnda
T, TW, HP. C -(-5) -(10+) BS
T, HP -.(5-10) -(10+) BS
2,358.00 3,637 ~588) p, M, H H. MH. RP T. TW, HP -(5-10) -(10+) BS
822.00 L507 (235) P RP T,BP PO -(10+) as
524.00 1.379 (223) P
587.00 2.432 (349) p. M
653.00 975 (152) P
284.00 339 (51) P
RP
D
-(-5)
-.(-5)
1.032.00
862.00
2.383.00
2,257 (354) P PHC
2,198 (328) P CWC,D
6,420 (1005) P(2), M(2). PHS. RP(6) H(2). PUC
2,249.00 5,091 (849) P. M, H
1.168.00 3,122 (560) P,M, Ii 448.00
1,104.00
1,544 (221) r. H
3,581 (546) P(2). M. H
2,791.00 6,008 (949) P, M, H
524.00 1,653 (272) P
PHe, RP
H
H
D
D,RP
-.(-5)
886.00 2,071 (356) P(2), M, H -(5-10)
835.00 13.047 (4241) P RP
3,290.00 5.893 (984) P, M, H H
HP
T.HP
HP.C
T.HP
-(-5)
PO
-(-5)
-(-5)
-(10+) DS
-(10+) BS
-(5-10) BS
-(10+) BS
T. HP PO -(10+) BS
BS
BS
T, TW, HP,. C-(-5) -(-5)
T. HP PTO. -(-5) Phone
T, TW. HP.C PO -(-5) BS
T PO -(10+) BS
T
T.TW
T,RP
-(-5) -(10+) DS
PO -(5-10) BS
PO
T. TW.HP.C -.(-5)
T. TW.HP,C PO
HP -(-5)
T.TW.HP PO
-(10+) BS
-(5-10) BS
-(5-.10) BS
-(5-10) BS
-(10+) BS
1.81t).OO 3.856 (591) p. M HC, PHC,RP HP PTO, Phone
.,...(10+) BS
3,206.08 6,103 (937) P(2), M, H R T.HP
1,450.00 3,193 (525) p. M, H H,D T
PTO, PllOne
PO, Phone
-(10+) BS
-(-5) BS

land. use..
Approach to viIlage
11
Nearost town and distance (in krns.)
12
rahsiJ (Part)
PR Blmeho Mandi , (15)
PR Rampura Phul (14)
PR Nathana (7)
PRo Rampu!a Phui (15)
PR Rampura PhuI (14) .
PR. Ramdura Phul,'(-7)
FR Rampura Phul (9)
PR Rampura PhuI (12)
PR Bhuc]1o tAandi (12)
PR. Nafua.na (2)
PR Bhueho Mandi (12)
PR Ramputa PhuI (101)
PR Bathinda (10)
PR Bathinda (12)
PR Bbucho Mandi (5)
PR Bathinda (10)
PR Bathinda (S).
PR Bathinda (6)
PR Bathinda (6)
'PR Batbinda (15)
PR Bathinda (16)
PR Bhucho Mandi (6)
PR Bhucho Mandi (3)
power Supply
13
EA
EA
EA
EA
EA
E1;>-,:E,AG
EA
ED, EAG
E,A
EA
EA
ED.EAG
ED,BAG
ED,BAG
EA
EA
ED.1MG.
ED,EAG
EA
ED,EAG
EA
ED,BAG
ED,EAG
Land use «i. e. a-rea under different types of lane! use 4n hectares rou"ded; upto two decimal places).
---~---------------------~--------~---
Forests. Irrigated ~Y. sauree
14 15
.~ "" ...,..~ ....... "
T(-65{).OO), GC(24'6.00), T,W(404.00)
T(384.00), GC(203.00), TW(181.00)
T(1233.00), GC(739.00), TW(494.00)
• i~ T(739.00), GC(214.00), TW(348.00), TWE(l77 . 00)
T(321.00), GC(321. 00)
_T(434. 00)6·G9(25!r.00\ TW(102: ().i) TWE(81. 0)
.. 1'(530.00):- GC(363 ~ OIJ), TW(81. 0:» 'T,¥.E;(86.00)
T(128.00). GC(87.00), TW(26.00) TWE(15.00).
T(152·.00), GC(455. 00), TW(291~ 0:»
T(765~00), GC(456.00), TW(30.9.0a)
T(19J.O\ 90), GC(1449. 00). TW(4 71.00)
.. T(1864.-00), GC(1110.00), TWE(754.00)
T(760. ~P:r. GC(760. 00)
1'(371.00). GC(37l.00)
·T(587.00). GC(429 .00), TW(158 .00)
T(2113.00), GC(1463.00), TW(328.00) TWE(322.00)
1'.(485-:00r,.ee(384 .00), TWE{101.00}'
.. T(374.00), GC(290.00),TWE(84.00)
T(469.00). GC(469.00)
T(2286.00), GC(1743 .00), TW(543.00)
T(804.00), GC(3S5.00), TW(219.00) TWE(230.00)
T(2080.00), GC(1920.00), TW(81.00), TWE(79.00)
t(1160.00), GC(965.00). TW(195.00)
..
Unirrigated
16
Culturable waste (including gauchu and
grovos)
17
3'2t>. 00
i°l.OO
1005.00
Aro~ not available' for eultivatioD
13
54.00
47.00
120.00
8,00 20100'" 55.00
111.03 92.0)
10.1..0) 5:3'.0)
32.0~ 4.0) 8).0) . . 130.0J 2.?~ Or
199. o.a. SI.OJ
4r.00 56.0J
238.00 225.0:>
191.00 19~ OJ
301.00 107.00
38.00 39.00
420.00 97.0::1
9.00 669.00
, 2':00 1.00' 36.00
9.00 S03.00
300.00 66.00
74S.00 3.00 256.00
123.00 3.00 880.00
895.00 231.01)
190.00 100.G()
~.--

100
V1LLAGE
NATHANAC.~. ILQCE Amenities aJld
----Loca- Name of villa,. Tdtal Total 'AmGnitie~ available (it not available withirr tbe village, a dash tion (with Ha~bait NtI.) area popuJa- (-) is shown in the column and next to it in brackets the distance Coil. ot the tion in broad ranges Vil."'-S kms .• 5-10 Kms. and 10+kms of tbe nearest N •. villa" and place wb~re tho facility is available is given)
(ill 'numlt.r ~~tates) €If
.lireuse- Bl!!uil- Medical Drinkin: Post Day or Commuai-h.1t1'i tifinl watcr and days of cations
(P.lable) Tal.- tbe (bus staph market! stop.
bat. it railway any sfatioR.
water-way)
1 2 3 4 5 6 7 S 9 10 - ............... ,
•• thi'"
113 Caak ~alll Si.,a-(2i4) 7'1 .• ' 2.47' (4") wala"
P -(-5) T -(-5) -(-5) BS
114 Chak :Jakhta (203) 'S9Q.OQ 2.,94 (422) P,M PHC T, TW. HP,C PO -(5-10) BS
115 Lohra Khana (202) ~.367 .OQ 1.S37 (2iG) P PRC T,TW.HP.C PO --(-5) BS. ils 116 Burj Kahan Sillllt-(ZQIi) 437.00 1.454 (266) P -(-5) T. W. TW,C -(-5) -(10+) BS,RS
Wala
111 Leh,raBoga (200) 1,161·00 2,143 (459) l'M,n -(-5) T. TW,Hl' PO- -(-5) :as Hi Bath (197) 277 .. 00 11.211 (178) P -(-5) T.HP.C -(,-5) -(5-10) _(~5)
119 Lohra Mobabat (196) 2.Ci70.00 5.2.96 (867) P(2). M. H D HP pro -~5 _10) Bs, Rl
120 Lehra Sondha (195) 138.00 1.261 (203) P.M PHe T.W.TW, ( -5) -(5 -10) BS
121 Llhra Dhulkot (19~) 721.00 2,219 (359) P.M.H PRC TW,HP -(-5) -(S ..... J BS
19964.09 1.01.306 P(37). H(6). M(19) MCW(O)
(li3S!) H(16), MH~), PUO(l) CW (2) C(O). HG(1). TR(O) PHC(i) T(O). D(7). AC(O) PHS(l) .(8) TB{O),
PPO(Q) Nll(o). SMP(O) RP(13). CHW(O) 0(0)
... _L

DIRECTORY
land use
Approach to village
II
Nearest town and~ distanoe (in kms)
12
Tahsil (Pact)
PR Bhucho Mandi
PR Bhucho Mandi
PR BhucllO Mandi
PR Bathinda
PR Rampura I'hul
PR Rampura Poul
PR Rampura Poul
PR Rampura PO'll
PR Rampura Phul
(2)
(5)
(4)
(16)
(6)
(9)
(6)
(5)
(3)
Power Supply
13
ED, EAG
EA
EA
EA
BD,BAG
ED, BAG
BA
EA
EA
101
Land use i. c. area under dif1ercnt typ55 of land use in hectares rounded upto two decimal places)
Fore-t
14
Irrigated by source
15
T(401.00), GC(370.00), TW(31.00)
T(869.0~),GC(767.00), TW(60.00) TWE(42.QO)
T(968.00), GC(485.00), TWB(4S3.00)
T(303.00), GC(l49.0:», TW(60.00) TWE(94.00)
T(654.03), GC(482.00), TWB(l72.0:»
T(253 .OJ), GC(211.0J), TWE(42 .O~)
1'(1773.0), G::::(1l9~.0), TIV2(58~.0)
T(419 .01), GC(20j .0)), TW 2(214 .OJ)
T(456.0), GC(263.0::l). TW'2(193.0,)
T(27303.00) GC(19168.00) TWE(3753.00) TW(4388.'()0)
Unirrigated
16
297.00
7.03
280.00
4.03
405.0J
22.0)
7l~ .0)
231.0)
192.0J
7H7.0J
Culturable waste (including gauchar and groves)
17
31.0)
Area not available for ouItivatiOD
18
63.00
14.03
119.0:J
130.0:>
103.0)
.2.0)
173.0)
58.0)
80.0)
4327.0)
" ~ r l~ < " t< $ '1 ,-",\::1-" .. O'7'e'i""~~"';' i't:. %& ~C' It ,=m ...... =:.,.


N S ..
(II :Ie () 0 ..J m c:i r.)
II I I r' -I ~i~' q' iii ' , , I . ....
",,'@ ~ ~ ~ : .. I' , II I ' , u
~ « If)
a 4 Z I!l « z ~ « « If) ..... W4.
~
+ !;1 it
€,) E&
i j ~ t u
i ';
) ~
.i (0
j
~ '" i .. . e
! ..

103
ALPHABETICAL LIS:r OF VILLAGES IN SANGA T C. D. BLOCK

106
,ALPHABETICAL LIST OF VILLAGES
SANGAT C. D. BLOCK
1991 Cansus 1981 Consu!
Sr. Name of village Location Location Location Location ')'1\). (with Hadbast No.) Code • Code Coda Code
(Manual) (Computer) (Manual) (Computer)
2 3 4 5 6
Talwandi Sabo Tahsil (Part) ~
30 Amarpur Ur] (112) 20JllJ3Jl 20) 11)0030)0001 17)11)3)1 17 }11}Otl30)OOOl Gurthuri
31 Bagha (119) 20/11/3/8 20/11/0030/0008 17/11/3/7 17/11/0030/0007
32 Bangi Dipa Singh (41) 20/11/3/19 20/11/0030/0019 17/11/3/15 17/11/0030/0015
33 Bangi Nihal Singh (38) 20/11/3/18 20/11/0030/0018 17/11/3/11 17/11/0030/001 [
34 Bangi Raghu (40) 20/11/3/5 20/W0030/000S 17/11/3/16 17/11/0030/0016
3: Bangi Ruldu (37) 20/11/3/17 20Il1/0030/0017 17/11/3/12 17/11/0~30/0J12
36 Bhagwangarh Urr (42) 20/11/3/21 20/11/0030/0021 17/11/3/18 - 17/ 1l'/0;30/0018 Bhukhianwali .
37 Chak RiTa Singh- (115) 20/11/3/4 20/11/(J030/0004 17/11/3/5 17/11/0030/0005 wala UrfPakka Khutd
38 Duewala (97) 20/11/3/22. 20/11/0030/0022 17/11/3/19 17/11/0030/0019 \
39 Jodhpur (116) 20/11/3/3 20/11/0030/0003 17/11/3/3 17/11/0030/0003 Bagga Singh Urf Phairam
40 Kail() Bandar (56) 20/11/3/86 20/11/0030/0086 17/11/3/21 17/11/0030/0;J21
41 Kot Bakhtu wi) 20/llJ3/25 20/11/0'J30/0025 17/11/3/13 17/11/0D30/0013
42 Malwala (42) 20/11/3/20 20/ 11/0~30/0J20 17/11/3/17 17/11/0030:0017
43 Manwala Urr (43) 20/11/3/24 20/11/0030/0024 17/11/3/14 17/11/0030/0014
44 Kishangarh
20/1"1/3/2 20/11/0030/0002 17/11/3/2 17/1 (/0030/00;)2 Pakka Kalan (114)
4S Pbalal'a Sokhu (117) 20/11/3/7 20/11/0030/0337 17/11/3/4 11/11/0030/0004
46 Shacgarh (95) 20/11/3/23 20/11/0J30/0)23· 17/11/3/2 17/11/0030/00;:12
47 Sukh Ladbi (39) 20/11/3/6 20/11/0030/0006 17/11/3/6 17/11/0030/0006
48 Tarkhanwala (l18) 20/11/3/9 20/11/0030/000:) 17/11/3/8 17/11/0030,'0))3

VILLAGE DIRECTORY SANGAT C. D. BLOCK
VILLACE DIRECTORY SANGAT C. D. BLOCK.

108
'VILLAGE ,
S.ANGAT C. D. BLOCK Amenities and
Loca-, Name of village tion (with Hadbast No.) Code No.
2
Raike Kalan (83)
2 Babadargarh (82) Jandian
3 Loo1 Bai (81)
4 langhi Rana (86)
S Raike Khurd (84) UtI Cbak Dana
6 Bam Biha (85)
7 Kaljha Rani (104)
8 Chak Attar (103) Singhwala
9 Bajak (87)
10 Ghudda (89)
11 Nandgarh (88)
12 Dhunike (102)
13 Bandi (107)
14 Kotli Sabo (105)
15 Fllridkot (106)
16 Pathrala (108)
1'7 Chak Kbarak (109) Singh Doomwali .
18 Chak Ruldu (113) Singhwala
19 Kisbanpura (110) uri Kutti
~O 3assi BagwaJi (111)
·2i Muhlan (lOP
~2 Kot Guru (100)
~~ 'Phuto Mithi (90)
~4 Sangat Kalan (99)
Total area .of the village (in bectares)
3
Total Population and number of households
4
1.743.00 3,838 (611)
,641.00 1.371 (239)
467.00 1.248 (202)
1.764.00 3,352 (5?7)
Amenities available (if not available within tbe village, a dash (-) is shown in the co1umn and next to it in brackets the distance in broad ranges [viz.-5 kms. 5-10 kms. and 10+kms. of the nearest place where t'he tacility is avai lable is give~l ---____________ -.! __________ '"' _____ P __
Educational
5
Medical
6
Drinking water (potable)
7
P(2)"M,H H. CWC,D T, HP
p
P
P,M
-(-5) T,BP
-(-5) T,HP
MCW, T, HP, C 'CWC,CHW
Post &. telegraph
8
PO
-(-5)
Day or days of the market! hat, it any
9
Communioations (bus stop, railway statioD. waterway)
10
Bathlndll
-(5-10). BS
-(5-10) BS I
-(-5) -(-5) '135
-(-5) -(5-10) BS
384.00 961 (179) P ...:..(-5) T,HP -(-5) -(5-10) BS
1.341.00 2,381 (406) P -(-5)
1.501.00 2,962 (496) ,P, M -(-5)
936.00 2,159 (370) P H
1.091.00
1.890.00.
667.00
607.00
2,166 (346)
4,031 (663)
1.534 (249)
861 (165)
2.136.00 3,272 (567)
616.00 925 (164)
1,058.00 1,557 (283)
2,926.00 ~205 (850)
1.183.00 1.863 (320)
1.145.00 2,543 (491)
740.00 1,370 (239)
i,798.00
431.00
965;00
1,694.00
1.799.00
2.693 (470)
762 (128)
2,053 (350)
3,090 (521)
2.116 (377)
P
P,M
P
p
P
P
P
p,M,H
p
-(-5)
H
D
-(5-10)
D
-(-5)
-(-5)
D,CHW
-(-5;
P.M,PUC HC
P, PU,C -(-5)
P,M,H MH
P -(-5)
P -(-5) ,
P ..... (-5)
p. M, H H, D, RP
T,HP
T,HP,C
T.HP,C
T,HP.C
T. HP
T,HP,C
-(-5) -(5-10) BS
-( ..... 05) -(5-10) BS
PO -(10+) BS
·-(-5) -(10+) BS
PO -(10+) BS
PO ..... (5-10)
T, TW, HP, -(5_10) -(5-10) C
BS
BS
T,HP,.C PO -(5-10) BS
T, HP. PO -(10+) BS
-T, TW, HP PO -(10+) BS
T, HP,"C PO -(5-10) BS
T, TW,HP -",(-5) -(-5) BS
T, TW, HP PO -(-5)
-(5-10) -,-(5-10) BS
T,HP
T,HP,C
W,BP,C
T,HP,C
T,HP,G
PO, PhOne
. -(_:_S)
PO, Phone
-C-5)
pro, Pbone
-(-5) BS
....... (5-10) as --(-5) BS
~(-5) BS
-( -5) BS
~~--~------------~------------~----.----~--------~--~--~--~--------,----

109
DIRECTORY
land use ~---
App- ~;:arest Power Land me (j, e. arua Jnd('f different types of land use in hectares rounded roach tvwn Supj:ly upto tW0 dEdma1 p'acJ.,) to and - - - - - - ~ - ---- _" - - ---.- -village d;stance Pore,t Irrigated by &ource "C"n- Cultur- Area not
(in kms) irri- able available gatl!d wast<: for culti-
(includ- valio:l log gauuha r and gr oVes)
------ --~ ~ --~~ ~---------- ---II J~ 13 14 15 16 17 16
-- --~--- -_-- --~- ---~
Tahsil (Part)
PR Glddarbaba (8) EA T(1433.00), GC(l433.UO) 193.00 2.00 115.00
PR Giddarbaha (6) ED T(497.00), GC(497 .00) IIO.OO 34.00
rR Glddarba.1J (4) ED T(3!7.00). G0317.00) 122.00 27.00 1.0J
PR Giddarbaha fR) EA T(1359.0D), GC(1359.00l 274.00 131.00
PR Glddarbaha (8) ED f(249.00), GC(249.00) 89'00 46.00
PR Giddarbaha (10) EA T(956.00). GC(950.00) 304.00 81·00
PR Giddarbaha (8) EA T(l219 .00). GC(1214 .OO),TW(5 .00) 132.03 150.01)
PR G;ddarbahu (14) EA T(695.00), GC(695.00) 175.00 66.0()
PR Gidllarbaha (10) EA T(9~0.OO), GC(940.00) );1.00 70.00
PR Giddarbaha (tI) EA T(1262.0Q, GC026J.OJ 520.0J 28.0l) 80.00
PR Sang at (6) CD, BAG T(588.0(»), GC(58~.0()) 25.00 (l.OO 48.00
PR Sang at (9) EA Tl580.(0), GC(580.0l)) 27.00
PR Sangat (LO) bD T(1233.00). GC(1233.00) 853.0:> 50.0J
PR Sangat ( 12) ED,BAG T(469.00). GC(469.00) 115.0) 32.00
PR Sangat 112) ED. HAG T(094.00), GC(694.00) 343.0:) 6.03 25.03
PR Dabwali (5) f.A rU420.00), GC(J420.00) L339.03 161.0J
PI{ Dabwali (2) EI\. T(401.()O). GC(401.UJ) 654.00 128.00
PR Dabwah (5) ED,EAG r(993 .(0), GC(993.00} 51.U[l [01.00
PR Dabwali (7) :CD. BAG T(387 '00), GC(387' (0) 267 'OJ 86·00
PR Sangat (4) SA T(11Ut)·OO), GC(llOQ'QO) 508·00 190·00
F,R Sangat (7) BA T(212.00), GC(212 .00) 198.00 27.00
PR Sanga! (2) EA T(469.00), GC(469.00) 463.00 33.00
PRo Sang at (1) EA T(1l47 .00), GC(1147.00) 461.00 72.00 14.00
PR Sangat ( [) EA 1(1075.00), GC(l07S.QO) 589.00 8.00 i27.00
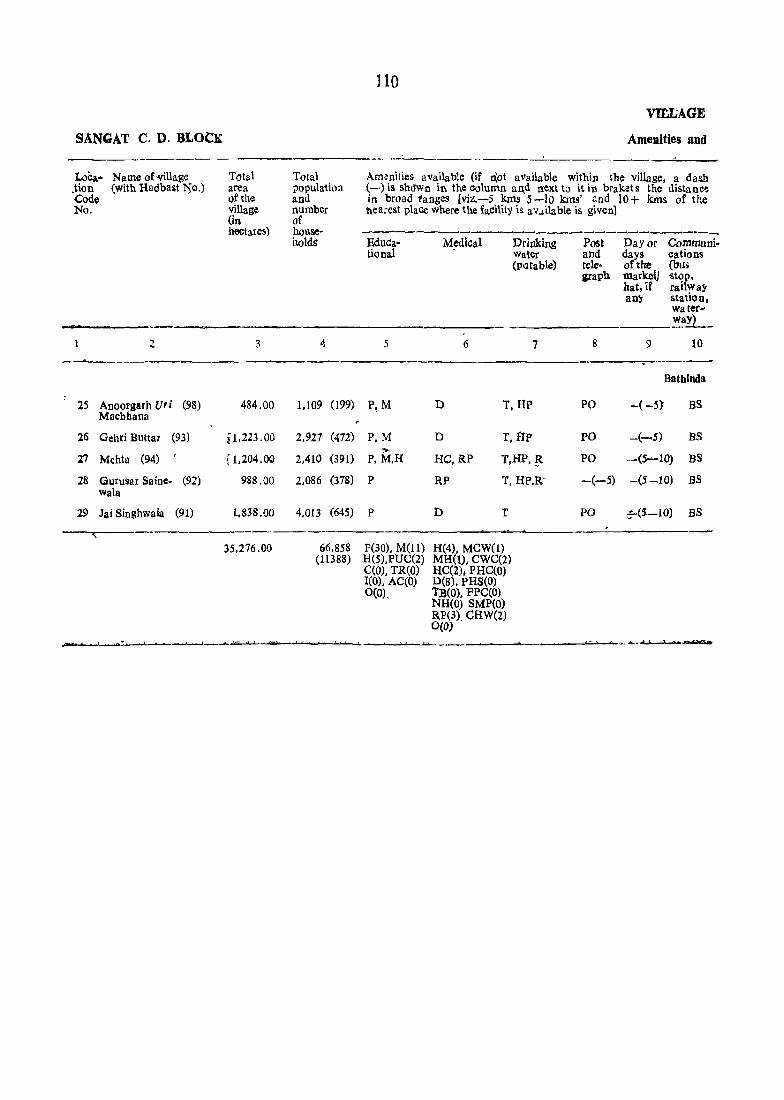
SANGAT C. D. BLOCK
Loea- Name of'"\'illage .tion (with Radba&t 1':fo.) Code No.
2
25 Anoorgarh Ur i (98) Macbhana
26 Gehri Buttar (93)
27 Mehta (94)
28 Gurusar Saine- (92) wala
29 Jai Singhwala (91)
T()tal area of the villag.: (in hectares)
3
484.00
[1.223.00
[1.204.00
988.00
1..838.00
Total population and number of households-
<1
1.109
2.927
2.410
2.086
4.013
(199)
(472)
(391)
(378)
(645)
--_._---_._-,, __ . "
35.276.00 66.858 (11388)
~___.....,.,
110
VIIXAGE
Amenities and
Amenities available (if not aVailable within the village. a dash (-) is. sMwn in the column an.d next to it in braket s the uistance in broad ranges [viz.-5 knlS 5-10 kms' and 10+ kms of the Marest place where the facility is. aVd.i1able is givenl
--------------------------... -_ Educa- M~ical Drinking Post Day or Communi-tional Water and days cations
(potable) tete- of the (bus jVaph market) -stop.
hat, if railwa}' an~ station,
water ..
------------.------~~~ 5 6 7 8 9 10
.-_.----Batbinda
P!M D T,HP PO -( -5} BS
P.M D T. £Ip PO -(--5) BS ~
P.M.H HC.RP T.HP.~ PO -(S ..... 10) BS
P RP T. HP.R; -(-5) -(5 -10) BS
P D T PO ~(S:-10) BS
P(30), M(1l) H(4), MCW(I) H(5).PUC(2) MH(1), CWC(2) C(O). TR(O) HC(2), PHC(O) 1(0), AC(O) D(8), PHS(O) 0(0), TB(O), FPe(O)
NH(O) SMP(O) RP(3). CHW(2) 0(0)
......___ • ; .......... '$ ..............

DIRECTORY
land nse
Approach to village
11
Nearest town and distance (ill kIllS)
12
Tahsil (part)
PR Sangat (4)
PR Sangat (4)
PR Sangat (8)
PR Bathinda (7)
PR Sanga! (5)
r--"-
Power Supply
-- ._-13
_. __ . EA
EA
EA
EA
ED.EAG
III
Land usc (i. c. area under diflerilni types of laud Use in hectares rounded uplo two decimal places)
Porest Irrigated by SQurce
14 15
T(328.00), GC(312.00), W(16.00)
T(718.00), GC(718.00)
1'(718.00), GC(718.00)
T(662.00), GC(662.00)
T(1342.00), GC(1294.00), TW(48.00) ._-_.
T(23463. 00) GC(23394. 00) W(Hi.OD) TW(53.00)
Unirrigatad
16
96.03
433.0:1
330.03
202.00
374.00
9301.00
Culturable waste (including gallohar and grQn,)
17
J.OJ
4.00
s.on
2.00
161.00
Area not available tor cultivation
18
59.00
7:!.00
152.00
119.00
120.00
n51.0J

11'2
V1U,!<\GE SANGAT C.D.BLOCK Amenities -and
Loca':" Name of .village Total Total Amonitifj3 available (if not available _within th() village, a d<1sh tion (with Hadbast No·) area popula- (-) is shown in the column and next to it in brackets the distance 'Code of tion in broad ranges [viz,~5 kms.,5_: 10 kms, and 10+ kms. 'of tbe rlearest 1'lQ. Village and place wh_ere the facility is available is given] _ ,
(in number hectares) of --~ - ,- ------..!.....-~--------;----~---~-!,.,-.,_
house- Educa- Medical Drinking Post Day or Communi-holds tionllJ water ~ days of cations
(PotabJe) tele- market/ bu~ stop, graph hat, if railway
any station, water-way)
2 3 4 5 6 f 8 9 010 -,
Jalwandi Sabo
Amarpuf Urf (112) 596.00 1,50? (215) p _.(-J) T,HP.e -(-5). _ :-.<..:-2) BS Gurthuri
,- _ ...... 2 Pakka Kalan (114) 3,153.00 7,065 (1201) P(2), M, H D T,HP,e PTO -.(-5) BS
• 3 Jodhpur Bagga (116)
Singh urf Pha! ran 817.00 1,634' (241) P -.(5-10) T,HP,e -.(-5) -.(5-10) BS
4 '. Chak Hira Singh· (lIS) 869.00 1,63B (258) 'I' -(-5') T,HP,C -(-05) -(5-10) BS-wala Urf Pakka Khurd
5 Bangi Raghu (40) 565,00 1,~94 (227) p, M D T,TW, PO ":"(5-10) BS HP.C
6 Sukh Ladhi (39) 800.00 2,184 (371). P -(-5) T,W,C -.(-5) -(5_10) BS
7· Ph<tlarlrB.ekhu .(1.l.J). 1.919.00 3.'7.68 (614) P,M_ -(5..-10) r..,.W; HP.,_,. Po. _ .. --(.J.0+4 BS. e
8 Bagha (119) 1.163.00 2,581- (430) P FPC T,RP,e -.(-5) -(-5) BS -9, ,Tarkhanwala (118) 1.220.00 1.584 (252) P -.(-5) T,HP -(-5) -(-5) -(-5)
17 Bangi Ru!du (37) 1.609.00 3,552 (514) P,PUC RP T,W._HP -·(-5) ;;-(5-10) BS
18, Bangi Niha! Singh (38) 1.416.00 2.797 (468) P.M,H. PHS T,W.TW, -(-5) -(5-10) BS, RS PUC _}_;IP
19 Bangi Dipa Singh (41) 601.00 1.746 (297) P -(-5) '1', TW. HP. -(-5) '-.(5-10) BS C
20 Malwala (42) 780.00 2,106 (358) P D T,HP,C -(-5) -(10+) BS
21 Bhagwangarh Urf (42) 1.395.00 2,133 (341) P(2), M)(2) -.(-5) T,W,C -(-5) -($-10) BS Bhukhianwali H
22 Dunewala (97) 487.00 1,085 (170) P -(5-10) ·HP, e -.(5-10) -(5-10) BS
23 Shel'gal'h (95) 895.00 1,420 (235) P -(-5) T,HP #
-(-5) -(5-10) BS,RS
24 Manwala UrI '(43) 675.90 1.663 (265) P -(-5) T -(-5) ":"(10+) BS,RS Kishangarh
25 Kot Bakhtu (44) 1.743.00 3.857 (564) P D T PO -(10+) BS
26 Kaile Bandar (56) 1.132.00 3,569 (533) P D T, W.HP PO -(10+) BS
22,485.00 47.285 P(21), H(O). M(6) MCW(O)
(7554) H(3). MH(O), PUC(2) CWC(O)
0(0) C(O), He(O), TR(O) PRC(O) 1(0). D(5), AC(Or PHS(l) 0(0) TB(D) ,
FPC(I) NH(O), SMP(O) RP(1). CHW(O) 0(0)
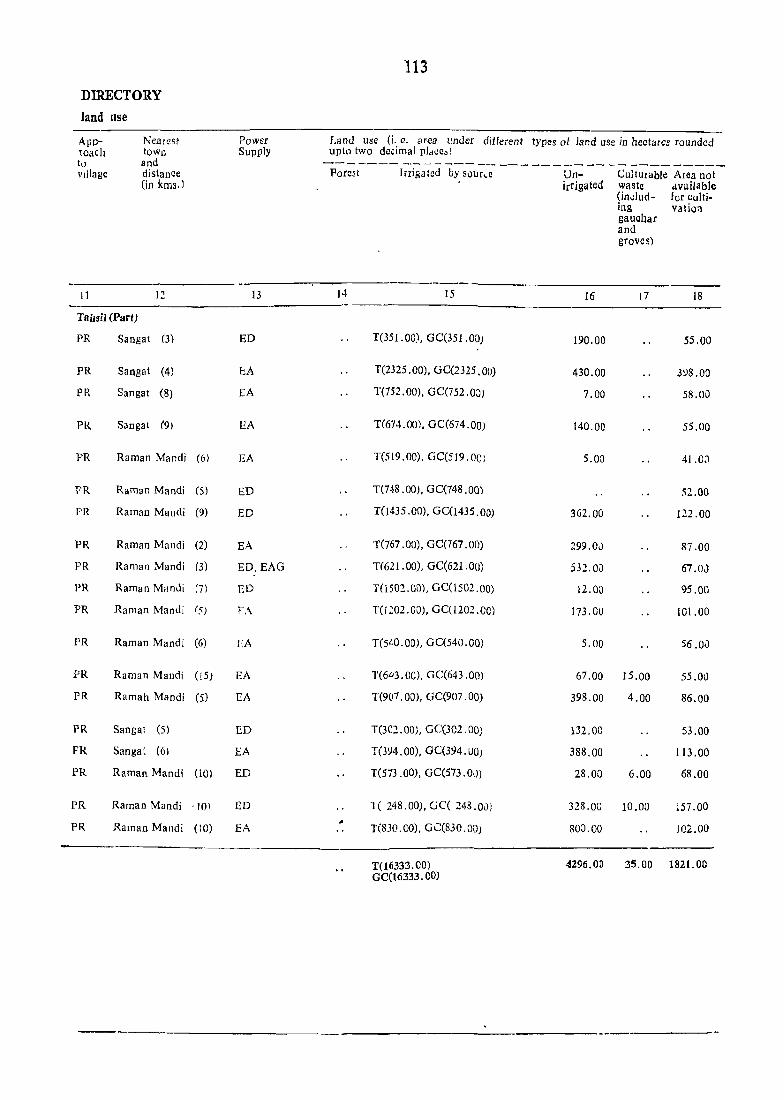
nmECTORY
land use
Approach to village
11
Nearest town and distance (in kms. J
I::!
Tahsil (Part)
PR Sangat (3)
PR Sangat (4)
PR Sangat (8)
PR Sanga! (9)
PR Raman Mandl
PR Raman Mandi
PR Raman Mandi
PR Raman Mandi
PR Raman Mandi
PR Raman M"nui
PR Raman Mandi
PR Raman Mandl
PR Raman Mandi
PR Ramah Mandi
PR Sangat (5)
FR Sangat (6)
PR Raman Mandl
PR Ramao Mandi
PR Raman Mandi
(6)
(5)
(9)
(2)
(3)
(7)
(5)
(6)
(15)
(5)
(10)
'to)
(10)
Power Supply
13
ED
bA
LA
EA
EA
ED
ED
EA
ED, EAG
ED
F:\
EA
EA
EA
ED
EA
ED
ED
EA
113
1.ao<l use (i. D. area IInder diiferent types of land use in hectares rounded uplo two decimal place»
-------------------------------------Forest Irrigated by sour~c Un- Culturable Area not irrigated waste dvailable
(in~lud- for culti· ing val ion gauchar and groves)
H 15 16 17 18
T(351.00), GC(351.0Q) 190.00 55.00
T(2325 .00), GC(2325. 00) 430.00 J~8.00
1'(752.00), GC(752 .0;) 7.00 58.0u
T(674.00), GC(674.00) 140.00 55.00
T(519.00). GC(519.0C) 5.00 41.0:>
T(748 .00), GC(748 .00) 52.00
T(1435 .00), GC(1435 .00) 362.00 122.00
T(767 .00), GC(767.00) 299.0J 87.00
T(621.00), GC(621.00) 532.0J 67.0J
T(1502.00}, GC(1502.00) 12.00 95.00
T(1202 .CO), GctI202.CO) 173.00 101.00
T(540.00), GC(540.00) 5.00 56.0il
T(643.0e), GC(643 .00) 67.00 15.00 55.00
1'(907.00), GC(907. 00) 398.00 4.00 86.00
T(3C2.00), GC(302. 00) 132.00 53.00
T(394.00), GC(394.UO) 388.00 113.00
T(573.00). GC(573.0\)) 28.00 6.00 68.00
1( 248.00), GC( 248.0J) 328.00 10.00 157.00
1'(830.00), G':(830.00) 80:1.00 102.00
T(l633.?J. 00 J .:1296.00 35.00 1821. 00 GC(16333. 00)


ALPHABETICAL LIST OF VILLAGES IN TAL\-VANDI SABO C. D. BLOCK


117
. .u...PHABETICAL LIST OF VILLAGES
TALWANDI SABO C. D. BLOCK
1991 Census 1981 C!lnsus Sr. N aIDe 01 'Village ------- - ~---- --- ...... - ----~~-- ---------~o. (with Hadba~t No.' Location Locatio I Location Locati;lr
Code Code Code Code (Manual) (Computer) (Manual) (C\lmp'Jtu)
.2 3 5 ()
----Batbinda Tahsil (Part)
1 Dhan Sil1!~h Khana (23) 20}11J2J35 20/11/0020/0035 17/ 1l1~,65 1 7/11/0(J10, 0065
Talwandi Sabo TahSil (part)
2 B,~ngher Charat Singh (48) ~0'lli3/32 30! 11/0030:0032 17/1t/3;27 17111/0030,0027
3 Bangher Mohabat (49) 2(), 11/3131 20,ll/0\)30/0,H I 17'] 1/3/2(;) ]7/11/0030/0026 Singh
4 Behman Jassa Singh (133) 2U:1J/3/72 20'11/0030/0012 17/ll/3{65 17/11/0030;0065
5 llehman Kocr (134) 20: 11/3/73 :?'0:II/0030/0073 17: 11 !3/73 17.'11 '01)3, l'O!)73 Singh
6 Bhagi Bander (46) 20/11/3/64 20/11/0030/0064 17/11/3/53 17/11 0(3).0053
7 Rha; Bakhtour (24) 20/11/3/37 2Ulll/0030/0037 17/11/3/30 17! II '\)111,1'\1030
8 Burj (14) 20,'11/3152 20/11/0030/0052 17/11/3/49 17111,'1)0.10'0049
9 Burj Serna (50) 20/11/3/36 20/1110030/003(1 17/11/3/28 17/11 '003.):,)1)28
10 Chathewala (54) 20/l1/3/28 20/11/0030/0028 17/11/3/23 17/ll/OO30,Otll3
1] Fatah BaJu (146) 20/11/3/85 20/11)0030/0085 17/1 J /3/85 17/11 0030, U08S
12 Fatehgarh (33) Nouabad
20/11/3/(;)1 20/11/0030/0061 17/11 :3/(,9 17/1 1 '(}(}3Q,(j069
l? Gadhianwali urf (30) Bhagwanpura
la, 11/3/59 2U/lII0030:0Q59 17/11/3/71 17lll 003J:0071
14 Gatwali (127) 20: 11/3/14 20111/0030/0014 17/11/3/61 ~ 7/11 'OO30'')J61
15 Gehlewala (135) 20/11/3/80 20;11/0030/0080 17/11/3}37,) 17/1 I/ou30ilJ379
16 Gehri Bara Singh (18) 20/11/3142 20) 11/0030/0042 17/ll/3}35 17/lli0030 ,lUJ5
17 Ghaso Khana (22) 20/11/3/38 20/1110030/0038 17/11/3/31 17/11/003,1:01)31
18 Giana (126) 20/11/3/13 20/11/1)030jooI3 17/11/3/60 17/ 11/OU31), J\)b(}
19 Golewala (142) 20:11/3/84 20111/0030/0l)~4 17/11/3/81 17/11,'0030,0082
20 Gurusar Joga (132) 20/11/3162 2011110030/0062 17/11/3/68 17!ll/P03Il,0068
21 Jajjal (35) 20:11/3/67 20i11/0030/0067 J7/ll/3/50 17/11/0U30/1)056
22 Jahi (25) :20)11/3/49 20/11/0030/U049 J7,1l/3/37 17/11;0030,0037
:?3 Jeon Singhwala (55) 2UJl1:3/27 20/11/0U3U/0027 17/11/3,'22 17/1 1/0030 "J022
24 Jodhpur Pakhar (27) ':;0,11/3/35 20/11/1)030,0035 17/1113129 17/II/Oil1O:OO29
25 Jogewa1a (128) lV,Il/3i71 lOllI/D030/0U71 17,11/3/62 17/11/0030,1)062
26 Ka]alwala (145) lU} 11;3;83 20/ II /0030/0083 ] 7Jlli3/U4 17/11 \)03(J, v\)34
27 Kamalu (120) 2'J/1l}3/16 20/11/0J30,'0"'1 (J 17/11j3/lU 17/IJ/Otl3fl 1)010
18 Kamalu (87) 2011113155 20!11/ll030;OO55 17)11/3)45 17111, llJ30 J,)~5
29 l<anakwal Urf (123) Rattang:uh
20111/3/11 20/11/0030/0011 17/11/3/59 17/11/0GJ() '0059
30 Kaureana (143) 20:1113j81 20) 11JOO30J81 17;11/3180 17/11/003\),0080
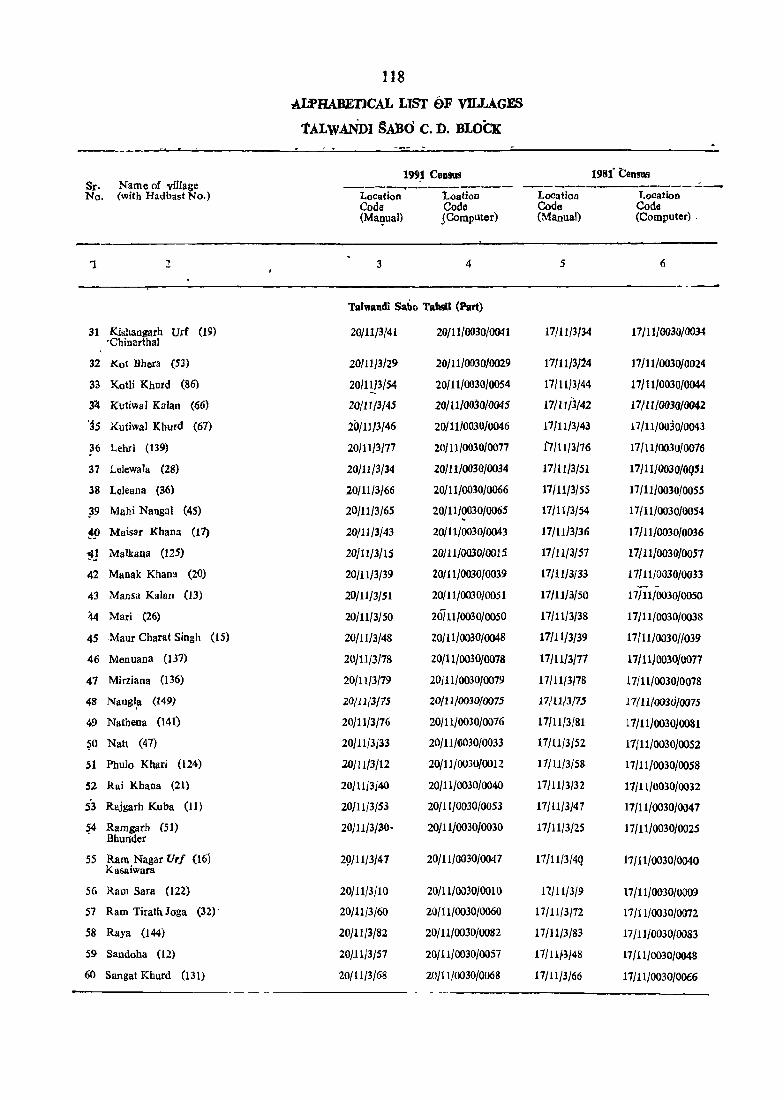
118
-ALPHABETICAL LIST SF VILLAGES
'tALWAM>I SA)JO C. D. BLOCK
--1991 Census 1981 Census
Sr. Name of village -----_-_.:..-._----No. (with Hadbast Noo) Location l.oation Location Location
Code Code Code Coda (Mat:Iual) SComputer) (Manual) (Computer) 0
1 2 3 4 5 6
---Talwandl Sabo Tahsil (Part)
31 Kishangarb Urf (19) 20/11/3/41 20/11/0030/0041 17/11/3/34 17 1ll/0030/0034 °Chinartbal
32 Kot Bbera (53) 20/11/3/29 20/11/0030/0029 17/11/3/14 17/11/0030/0024
33 Kotli Khuld (86) 20/11/3/54 20/11/0030/0054 17/11/3/44 17/11/0030/0044
~ KutiwaI Kalan (66) 20/11/3/45 20/11/0030/0045 17/11/3/42 17/11/0030/0042
'35 KutiwaI Kburd (67) 1'0/11/3/46 20/11/0030/0046 17/11/3/43 17/11/0030/0043
36 Lehri (139) 20)11/3/77 20/11/0030/0077 tT/ll)3/76 17/11/0030/0076
37 Lclewala (28) 20/11/3/34 20/11/0030/0034 17)11/3/51 17/H/OO30/0QSl
38 Leleana (36) 20)11}3/66 20/11/0030/0066 17/11}3/55 17/11/003010055
~9 Mabi Nanga1 (45) 20/11/3/65 20/11/0030/0065 17/11/3{54 17/11/0030/0054
~!J Maisar Khana (11) 20/11/3/43 20/11/0030/0043 17/11/3/36 17/11/0030/0036
'!lJ Malkana (125) 20/11/3/15 20/11/0030/0015 17/11/3/57 17/11/0030/0057
42 Manak Khana (20) 20/11/3/39 20/11/0030/0039 17/11/3{33 17/11/0030/0033
43 Mansa Kalan (13) 20/11/3/51 20/11/0030/0051 17/11/3/50 17/11/0030/0050
44 Mad (26) 20/11/3/S0 20i 11/0030/0050 17/11/3/38 17/11/0030/0038
45 Maur Charat Singh (IS) 20/11/3/48 20/11/0030/0048 17/11/3/39 17/11/00301/039
46 Menuans (137) 20/11/3/78 20/11/0030/0078 17/11/3/77 17/11/0030/0077
47 Mirziana (136) 20/11/3/79 20/11/0030/0079 17/11/3/78 17/11/0030/0078
48 Nangl~ (149) 2Q/11/3/15 20/11/0030/0075 17/11/3/75 17/11/0030/0075
49 Natheua (141) 20/11/3176 20/11/0030/0076 17/11/3/81 17/11/0030}0081
~O Natt (47) 20/11[3/33 20/1I/fJ030/0033 17/U/3/52 17/11/0030/0052
51 Phulo Kbari (124) 20/11/3/12 20/11/0030/0012 17/11/3/58 17/11/0030/0058
52 R.ai Khana (21) 20/11/3140 20/11/0030/0040 17/11/3}32 17}11/0030/oo32
50
3 Rajgarh Kuba (11) 20/11/3/S3 20/11/0030/0053 17/11/3/47 17/11/0030/0047
.?4 Ramgarh (51) Bhullder
20/11/3/30- 20/11/0030/0030 17/11/3/25 ]7/11/0030/0025
55 Ram Nagar Uri (16) 29/11/3/47 20/11/0030/0047 17/11/3/4Q 11/11/0030/0040 Kasaiwara
56 Ram Sara (122) 20/11/3/10 20/11/0030/0010 17/11/3/9 17/11/0030/0009
57 Ram Tirath Joga (32)' 20/11/3/60 20/1I/OO30/0060 11/11/3/72 11/11/0030/0072
58 Raya (144) 20/11/3/82 20/11/0030/0082 17/11/3/83 17/11/0030/0083
59 Sandoha (12) 20Jllj3/57 20/11jOO30j0057 17/11f3/48 17/11/0030/0048
60 Sangat Khurd (131) 20/11/3/68 20/11/0030/0068 17/11/3/66 11/11/0030/00£6

119 ALPHABETICAL LIST OF VILLAGES
TALWANDl SABO C. D. BLOCK
1991 Census 1981 censlU Sr. Ndmc ,of village ------------_._ ----------------N.,?, (with Hadbast No.) Lo:::atio:1 wcatil)!l Lo;a.tion L<Jcation
Code Code Code Code (Manual) (CI)'llpllter) ('lfanu:ll) (Co'1lpater)
1 2 3 " S 6
Tah'andi &abo T.U (Part)
• 61 SalVaitob (88) 20/11/3/56 , 20/11/0J3()/()()56 17/11/3/46 ,17/11/0030/0046
62 Shekhpura (29) 20/11/3JSS 20/11/0()3()/()1)5S 11/11/3/70 .1 7/ll/0030/0070
63 Sin go (138) 20/11/3/74 2'o/11/0J3(j/1)()74 17fll/3/74 17/11/0030/0074
64 Talwaodi Sabo (34) 20/11/3/63 20/11/0030/()()63 17/11/3/67 17/11/0030/0067
65 Tarangali (129) 20/11/3/10 20/11/0J30/0na 1711113/63 17/1110030/0063
66 Toooa Pujarian (130) 20/11/3/69 20/11/0(30101)69 17/ll/3/64 .J. 7/11/0030/0064
67 Tbamangarh (65) 20/11/3/44 20/11/0030/(1)44 17/11/3/4t 17/11/003()/0041


121
VILLAGE~DrREctoRY TALWANDI SABO C. D. BLOCK

TALWANDI SABO C. D. BLOCK . -
Location Code No.
1
Name-of village (with Hadbast No.)
2
Total area ot'the village (in hectares)
3
- Total population and number ot households
4
122
Vn.LAGE
Amenities and
Amenities available (it not available within the village. a dash (_) is shown in the column and next to it in brackets the distance in broad ranges vi2.-5kms •• 5-10 kms. and lO+kms. of the nearest place where the facility is available is given)
Edugltiona I
s
Medical
6
/
7
Drinking water (Potable)
8
Post &
telegraph
Day or days ofth" Marketl bat, it any
9
Communications (bus stop. railway station. Water way)
10
Batbinda
35 Dhan Singh (13) 1142.00 1809 (323) P PRC T.HP -(-5) -(-5) BS Khana
------_. __ --------------------------------" ---1142.00 1,809 (323) P (I).
M(O) H(O), PUC(O) C(O), TR(O) 1(0), AC(O) 0(0)
H(O), MCW(O) MH(O), CWC(O) HC(O}, PHC(l) D(O), PHS(O), TB(O), FPC(O) NH(O), SMP(O) RP(O), CHW(O) 0(0)

DIRECTORY
land use
Approach to village
Nearest town and distance (in kms.)
12
Tahsil (Pllrt)
PR KotPatta
Power Supply
13
(2) ED.EAG
123
Land usa 0. e. area under different types of land use in hectares rounded up to two decimal places)
Pore;--I;dgated by s;;;;;;;---------U~--C~t:;~--Area~t irri- ab Ie a vailahla
15
T(916.QO).GC(S06.00). W(S9.0J). TWE(21.00)
gated ~aste tor culti_ !lnclud- vatioo Jog gauchar and groves)
16 IS
115.00 IS.00 93.00
--------------------------------------------T(916.00) GC(806.00)
. W(89.00) TWE(21.00)
115.00 18.00 93.00

TALWAND! SABO C. D. BLOCK Amellitielf. add
Loca·tiotl~
Code No.
1
Name of vinas!! (with Hildbasf No.)
2
10, .Ram Sara (122)
11 Kllnakwal Urf (123) _Ratlangarh
12 Phul0 Khaf'i (124)
1j dian~ '(126)
14 'Gatwali (127)
15 Malkana (125)
16 Kamalu (120)
27 Jeon Singhwala (55)
28 Chathewala ~54~)
29 Kat Bhara (53)
30 Ramgarh (51) Bhunder
31 Bangher Mohabat (49) Singh
31 Bangher Charat '(48) Sin~h
33 Na tt (47)
34 Lelewala (28)
35 JodhpurPakllar ,(27)
36 Burj Serna (50)
37 BhaiBakhtour (24)
38 Ghaso Khana (22)
39 Manak Khana (20)
40 Rai Khana (21)
41 Kishangarh Urf(19) Chinarthal
42 G~hri Bara Singh (18)
Total' area O,f tHe village (in hectares)
3
576.00
1189.00
1192.00
1875.00
10tal population and number of households
4
Amellities t\vailable (it not available within the· viiJllge. a d~ (-) is shown i r1 the- ~,colul1ln and IJllXt to in brackflts the distance in brpa(\l'anges vlz • ...".Skms .• 5-10 kms. and 10+kms: of the nearOSt place where the lacili t, is availablt-,'is given)' _ ,
---~---~---'--'------------------Educa- Medical Drinking Post Day Communi-tional water & or days cations
(Potable) '1ele- of (bus
6 7 •
graph marketl stoP. Hat if railway.
8
jlny s taiton. waterway)
10
19'6 (301) P
1612 (259) P
_(-5)
-(5-10)
T,it~.C •
T.TW.HP
-(-5) -r"':sj -(5-10) --:-(5-10)
1507 (258) P
3338 (554) P, I'v.f. H MCW, tWC.D
T.TW.HP
T.W,TW. HP
-(5-10) --(5-10)
-(--5) -(5--10)
BS
BS
701.00 1743 (306) P, M ~ew. T, \V,HP, -"(--5) -(10+) BS CWC c
2448.00 3873 (607) P,M,H MCW, T. HP PO. ,-(5-10) BS Phone
600.00
1463.00
1123 .. 00
989.00
606.00
337.00
442.00
1640 (221) P
2892 (495) P, M
2326 _OlSL P,~, f! 2269 (359), P, M. H
1527 (226) P
762 (136) P
1069 (168) P
493.00 1~36 (189) P, M
1270.00 3592 (570) P,M
1966.00
561.00
4072 (659) p. M. H
1454 (249) p. M'
811.00 1881 (316) P
313.00
263.06
1178.00
692 (109) P
403 (65) P
1579 (249) P
872.00 1939 (291) P
691.00 1229 (204) .. P
CWC.D
...... (-5) TW.HP.C -(-5) -(-5) BS
PHS T.W.HP,C -(-5) -(.5-10) BS
PHS _~ _1'.!. H~.C -:;::,(f:;;:!Q) -!$-10) __ BS
D T. HP -(-5) -(-5) -BS
- (- 5) T, HP - (- 5) - (5-10) 'BS
-(-5)
-(-,5)
-(-5)
-(-5)
T.HP
HP
T
-(-5) -(5-10) BS
-(_5)'" -(5--10) BS
-(-5) -'(5-10) BS
-(-5) -(5-10) BS
H.O T.HP PO
PO
-(5-10)' ·BS
_(10+) BS D.RP.ClI:W T.HP"C
-(-5)
D
-(-5)
PHC
T.HP -(-5) - -(10+) BS
H.D
cwe
T.HP -(--5)
T,HP -(-5)
T,TW,HP, PO C
T.nV,HP. -(-5) C
T. TW. HP. -(-5) C
_(5_10) BS
-(5-10) BS
-(5-10) BS
--'(5-10) BS
-(5-10) BS

App. roac]1 to ' viJlage
11
Nearest towh and distance (in kms.)
12
Tahsil (Part)
PR Raman Mandi (2)
PR Raman Mandi (10)
PR Raman Mandi (5)
PR Raman Mandi (6)
PR Raman Mandi (12)
PR Raman Mandi (6)
PR RamaD Mandi (2)
PR Talwandi Sabo (9)
PR Talwandi Sabo (7)
PR Kot Fat1a (3)
PR Kot Fatta (5)
PR Talwandi Sabo (7)
PR Talwandi Sabo (6)
PR Talwandi Sabo (5)
PR Talwandi Sabo (5)
PR MaurMandi (B)
PR MaurMandi (10)
PR Maur Mandi (10)
PR Kot Fatta (5)
PR· Maur Mandi (B)
PR Kot FaUa (5)
PR MaurMandi (B)
PR MaurMandi (5)
Powey Supply
13
EA
EA
ED,EAG
EA
EA
ED
ED
EA
EA
ED
ED
ED,EAG
ED,EAG
ED,EAG
ED, BAG
EA
ED
ED
ED
ED
ED,BAG
EA
EA
125 .
Land use (i. e. area under different types of land me in hectares rounded up,io two cjecimal places)
Forest Irrigated by source
14 15
T(331.00), GC(331.00)
T(311.00), GC(311.0Q)
T(312.00), GC(312.00)
T(1079.00), GC(I079.001
T(255.oo), GC(255.00)
T(ll31.oo), GC(1131.00)
T(544.oo), GC(544.oo)
T(1066.op)" pC(1066.Q~)
T(885.00), GC)B8S.00)
T(805.QO~, GC(805.00)
T(496.00), GC(4%.00)
T(273·QOl, GC(273.00)
T(373.oo), GC(373.0Q)
T(447·99), GC(447.00)
T(1l23.00), GC(1l23. 00)
T(l642.00), GC(I640.oo) W(2.00)
T{390.00), GC(390.00)
T(S45.oo), GC(540.00) W(S.OO)
T(242.00), GC(242.OQ)
T(179.00), GC(179.oo)
T(730.Q9), GC(730.oo)
T(781.00), GC(7B1.oo)
T(479.00), GC(479.00)
Uninigated
16
204.00
B02.00
827.00
720.po
390.00
I1B4.oo
14.00
2B2.0Q
IS5.00
83.1)0
74.00
35.00
34.00
1.00
52.00
140.0\)
129.00
206.00
37.00
65.00
357.00
72.00
165.00
Culturable waste (including gaucbar and groves)
17
4.(10 I
Area not available for cultivation
18
41. 0..0
76.pO
53.00
76.00
56.00
133.00
42.Q.l
l1S.p:>
79.0.0
19l.!4>
36.00
29.\).0
35:0:>
~5.p9
95.00
1~4.p.!>
42.00
60.0:}
34.01)
19.Q?
91.o.~
19.00
47.00

TALW ANDl SABO C. D. BLOCK
Lo~a· Name ot vil1age tion (with Hadbast No.) Codo No.
2
43 Maisat'Khana (17)
M. Thamangarh (65)
45 Kutiwal Kalan (66)
46 Kutiwal Khurd (61)
47 Ram Nagar Uri (16) Kasaiwara
48 Maur Charllt Singh (15)
49 Jatr! (25)
50 Mari (t6)
51 MansaKalau (13)
52 Burj (14)
1'otal area of tho village (in hectares)
3
2002.00
527.00
783.00
567.00
1768.00
907.00
384.00
249.00
910.00
731.00
-i26
VILLAGE
Amediiies and
Total population • and number of households
Afne~ities available (if not ava'ilable within the villages, a' dash (-) is shown in the column and nellCto;it in brackets the distanoa in hraod ranges Vil. -5kms .• 5-10 kms" and 10+kms. of the n6arest place ·where the facility is available given)
E~;~~ili;1--D~kill~-P;t--D~~7-c~~~~ tiona I water &: days catiolls
4 5 6
3705 (592) P.M,H H,O
777 (121)' -(-5) :.:...(-5}"
1655.(248) P.~.H H
1500 (217) P -(-5)
3305 (528) P. M D
2141 (364) P
993 (149) P
815 (116) P
D
-(-5)
D
2656 (391) P(2) M RP
1872 (342) -(::"'5)" RP
(potable) . Tele- of the (bus graph market/ stop.
7 8
hat. if railw>lY - OJ station,
9
water_ way)
Tahtanlli Sabo
T.HP
T.HP
T,HP
PO ~1O+) BS.RS
-(-5) -(5-10) BS
PO. ~ -:-<-5-10) BS Phone
T.HP
TW.HP
--(-5) -(5-10) BS
PO '~~5) B,S
T. TW.HP -(-5)
T.HP -(-5)
T.HP -(-5)
T,HP -(5-10)
T,HP PhOlle
-f-5)
-(-5) , ..
-:-(5-10)
-(~;-IO)
-t5-10)
BS
BS
BS
BS
BS
53 RajGarhKuba (11) 1388.00 3881 (607) P. M;rr D' T,TW.HP PO. - -(5-10) BS
54 Kodi Kbur~ (86)
55 Kamalu (S7)
56 Sawaitch (88)
57 Sandoba (12)
58 Shokhpura (29)
59 Gadhianwaii UrC (30) Bhagwanpura
60 Ram l'irath] oga (32-)
61 Fatebgarh (33) Nouabad
62 Gurusar Jog a (132)
63 Talwalldi Saba (34)
64 Bhagi Bandor (46)
• 65 Mahi Nangal (45)
1195,00
537.00
598.00
1641.00
.1965,00
505.00
2986.00
577.00
558,00
4422.00
25,28.00
1081.00
2422 (381) p. M
1584 (268) P, M. H
1193 (190) p
3429 (523) P.M
4073 (670) P.M,H
626 (117) P
-(-5)
-(-5)
........ (-5)
-(5-10)
H.MCW, CWe.PHC. D
D
T.HP,C
HP
HP
t.R?
T,e
T,W
Phone
-(-S) -(5-10)
-(-5) -(5-10)
PO !....(5-10)
-(5-10) --(5 __ 10)
PO --(5_10)
-( -5) -(5 -to)
BS
BoS
BS
-B.S
as
BS
5303 (796) p. M.B RP(2) T.W.TW, PO e -(5-10) BS
1432 (239J P -(-5). T
1232 (197) P RP(2) TW.HP
T.HP 12880 (2275) P.M.B, H,MH,D. C FPC,NH
5684 (892)
2000 (323)
P(3), M(2). H(3)
1.>
MeW,MH, 1'.HP FPC,RP
-'-:(5-1Q) T
.-( -5). -(5_10) BS
-(_5)
PTO. Phone
PO
-(-5)
--(-5)
-(-5)
-(-5)
BS
--(-5--10) Boi
-(10+) Bi

nmECfORY
lanel use
Approach to village
.u
Nearest town and distance (in kms.)
12
TahSil (part)
PR MaurMandi
PR Mansa (8)
PR MaurMandi
PR MaurMandi
PR MaurMandi
PR MaurMandi
PR MaurMandi
PR MaurMandi
PR MaurMandi
PR MaurMandi
PR MaurMandi
PR MaurMandi
(10)
(7)
(6)
(6)
(2)
(3)
(5)
(6)
(2)
(6)
(8)
PR MaurMandi (10)
PR MaurMandi (10)
PR Maur Mandi (5)
PR Talwaodi Saba (6)
PR Talwandi Sabo (8)
PR Talwandi Sabo (8)
PR Talwandi Sabo (5)
PR Talwandi Sabo (3)
PR Talwandi Sabo (0)
PR Talwandi Sabo (5)
PR Raman Mandi (10)
Power Supply
13
ED EAG
EA
EA
EA
EA
ED
ED
EA
EA
EA
ED,EAG
ED.EAG
ED,EAG
ED.EAG
EA
EA
EAG,ED
EA
ED
ED,EAG
EA
EA
ED
127
Land use (i. e. area 'under different types ot land use in hectares rO:lOded upto two decimal places) • .
Forest Irrigated by Source
,4 15
.. T(lOOO. 00), GC(lOOO. 00)
.. T(19S.00), GC(172.00) W(23.00)
.. T(63 1.00), GC\597.00) W(34.00)
.. T(311.00),GC(297.00) W(l4.00)
T(1042.00). GC(lOlO.OO) W(n.OO)
.. T(616.00), GC(616.00)
.. T(30S.00),GC(306.00) W(2.00)
.. T(214.00). GC(214.00)
.. T(S20.00), GC(S20.00)
.. T(639.00). GC(614.00) nV(25.00)
.. T(l011.00),GC(994.oo) TW(17.00)
.. T(770.00), GC(746.00) TW(24.00)
.. T(425 .00). GC(423 .(0) TWE(2.00)
.. T(395 .00), GC(387 . 00) TWE(8. 00)
.. T(1313.00), GC(1313 .00)
.. T(1730.00), GC(1730.00)
T(247 .(0), GC(247.00)
.. T(16oo.oo), GC(l 600. 00)
T(471.oo), GC(471.oo)
T(374.oo). GC(374.oo)
T(3881.00), GC(33S1.00)
T(2350.00). GC(2316.00), TW(34.00)
T(992.00). GC(992.00)
Vnirrigated
16
lfS7.0a
304.00
98.00
226.00
615.00
21S.00
51.00
2.00
2S.00
39.00
293.00
348.00
SO.OO
169.0(J
261.00
105.00
180.00
1200.00
63.00
152,00
36.00
28.00
Culturable waste (including gauchar and grove.~)
17
4.00
112.00
Arcanot available forcultivati()!)
18
145.00
28.00
54.0J
30.01)
111.0J
73.0J
25.00
33.00
62.00
53.00
84.00
77.00
32.00
34.00
67.00
126.00
78.00
186.00
43.00
32.00
333.00
150.00
89.00

J28
~E
TALWANDI SABO C. D. BI:0Ci: Ameoitie, ad
LQqll:- N1.me of vlll~ge Total Total ~me~itles ~vllilabltl (if not lIyaqable within tl!e village, l! 'd~sb tion (Wi'th Hadba t 'No.) litea' pOp'IJlll- (~l " sltpyq}~n !htl column a~~ !le~tto it 10 bracke(g the 4i§!al1ce Code of the tlon' •• ' in 1)rbad ran~elI VIZ.-S kms., 5-1~Kms. and 10+ kmS, Of the near~st ~9 .. ~il~ge !!.qd. _ pla~~ wP~!y lhll facifity is available is given)' , -.
:In
~
66 ltlleana (36) '.
67 Jajjal (35)
«18 Sangat Khurd (131)
469 Teona Pujarian (130)
16 Tarangali (129)
71 Jogewala (128)
72. Behman Jassa (13~~ Singh
7'J BehmanKoer (13'~ Singh
~4 Singo (138)
ts Nangl. (1119),
76 /.
Nathena (141),
~7 Lehri (139)
~a Menuana (1371.
!?c Mirziana (t:}§) .l",
~o Gehlewala q~!
81' Kaureana (l4~) ; u -to:.
<82 Raya (144)
83 .,0
Kalalwala (l~~)
84 Golewala (142)
85 Fatah Balu (146)
ilectares) ~fPlbH house· holds
" 3 ~
1131.00 31,32 (50S)
838.00 2~64 (1371)
394.00 1332 (2f9) , 117S.OO 1630 (301)
3Q8.oo 549 (88)
431.09 914 (145)-
1167.00 1472 (249)
IISp. DO, 1791 (281)
1419.00 *~2S (,192) .... ,-~
1415 .00 1962 (340)
(344) 1115.00 2068 f'( -- ('
1278.00 .t14l (345)
'378.QO 410 (~6)
~S.6.00 1188 (83)
552.00 9S~ (14j)
798.00 F24 {~7,8) ,. • i "
534.00 985 (156)_,
988.00 ten~Q ~~~P) 490.00 818 (140)
483.00 S30 (81).
671.77.00 MiI,SAI (21.719)
Educa-tional
S-
P
p,M,H
P
P(2). M
P
p
p
J?
P , '" P
p,M,H
P;M,H ... ) 't·' .':
r P(2). M P
P
F
r. P
P.
~fitlJ}~ H(18), BJJC(J) C(l), , TR(O). 1(0). AC(O) ot.oJl'
' Medical
o
~(-5)
1)
-(-5)
fj
....,(-5)
=(5-10)
-(-5)
-0-( ..... 5)
D,RP
'j)
H,CWC, D,NH
-(-5) .. RP .. RP
-(5-10)
-=<-5)
-(-5)
D.FPC
D
-(-5)
.tI(7), MCW(S) MD(2), _CWC(6) HC(O) l"HC(2) D(20), 1"HS(1) :rB(O), FPC(3) NH(2), SMP(Or RP(ll), CHW'l) O'(2r~~-
Drinking water (potable)
7
T
T.HP
'T,HP
T,HP.
T,HP
T.HP
T
T' HP,C_~
T.HP.C
T,HP
T,HP .... tr
"" T.HP r' "}
I!~
~~.!lg T
T
T,HP
}.!l~G <1 .:. ..... t
T.HP
. T.HP,c"
"bay oi: Post Comll1uni-& days cation. 'lelii· of the (bus graph marketl stop.
hat, if railway any station.
water-waY)
8 9 10
TalwiUilT Sllb ..
-(-5) -(5-1') BS
PO -(-5) BS
-(-5) -(-5) BS
-(-5) -(5 -10) BS
-(-5) .. (5~t1J) BS'
-_(5-10) _-(5-101 BS:
PO -(JO+~ B~
-(5.;10):'_"....(lO·tJ BS'
-(10-';") - ---(io+) US ~ l '" , ~
_(_5) t
-(10+) ~~, -, ~ ~ . . .... -(10+) PO as: . .
-(-?) -~10+) B3 ~
-(-~~ -(!o+l .83 j
-(-5) ::-(10+ 1 n~ -(-.5) -S10+) BS·
.~
-(-::-5) -::-(10 t) BS I ".- .*"""
-(-5) -(10+) 33
PO -:-(10-1;;) BSe ';'" :C"~! ~ .... ~
-(-5) -(10+)- -(-5)
-(-5)- -(1O,+} BS

DIRECTORY
land use
Approach to village
11
Nearest town and distance
(in kms.)
12
Tahsil (part)
PR Raman Mandi
PR Ram Mandi
PR Talwandi Sabo
PR Talwandi Sabo
PR Talwandi Sabo
PR Talwandi Sabo
PR Talwandi Saba
PR Talwandi Sabo
PR Talwandi Sabo
PR Talwandi Sabo
PR Talwandi Sabo
PR Talwandi Sabo
PR Raman Mandi
PR Raman Mandi
PR Raman Mandi
PR Raman Mandi
PR Raman Mandi
PR Raman Mandi
KR Talwandi Sabo
PRo Talwandi Sabo
(8)
(3)
(4)
(5)
(1)
(S)
(11)
(:.\
(12)
(12)
(IS)
(10)
(to)
(10)
(16)
(15)
(16)
(22)
(29)
(15)
(20)
Power Supply
13
ED,EAG
ED,EAG
ED
ED
ED
ED
ED,!3AG
ED
ED
EA
EA
EA
ED
ED
ED,BAG
ED,EAG
ED
ED.EAG
ED,EAG
ED
129
Land use (i. e. area under different types of land use in hectares rounded npto two decimal places)
----------------.----------------Forest Irrigated by source Un- Cu1tut- Area no.
14 15
., T(1030 .00), GC(1030. 00)
., T(738.00), GC(738.00)
., T(302.oo), GC(302.00)
T(595.00), GC(595.00)
.. T(222.00}, GC(222.00)
., T(193.00), GC(193 .00)
.. T(662.00), GC(662.00)
.. T(297.00), GC(297.00)
.. T(735.oo), GC(735:00)
.. T(612.00), GC(612 .00)
.. T(49 I. 00), GC(431.00), TW(60.()()
.. T(594.oo), GC(594.00)
.. T(217.03) GC(20:J.OO), TN(t7 .OJ)
T(448.00), GC(448 .00)
.. T(330.00), GC(330.00)
.. T(478.00). GC(478.00)
.. T(331.00), GC(33I. 00)
.. T(882.0U), GC(882.00)
.. T(269.oo), GC(269.00)
., r(257 .00), GC(257 .OO}
T(4s437· 00)
CC(84S13'OO) W (111' 00) TWE(lO'OO) TW(177'OO)
irri- able available gated waste tor culti -
(includ- vation ing gauchar and
groves)
16 17 18
34.0J 67.00
33.0) 67.00
62.0J 30.00
514.0) 69.00
61.00 25.00
212.0J 26.00
449.0\) S6.00
812.0) 47.00
616.00 68.00
535.0) 68.00
544.03 SO.OO
6')7.0) 77.01
136.0) 25.00
172.0J 36.00
198.0J 24.00
256.03 64.00
m.OJ 32.00
95.0J 2·00 9.00
165.0J 56.00)
202.0) 24.01}
17255.00 182.00 4403.00


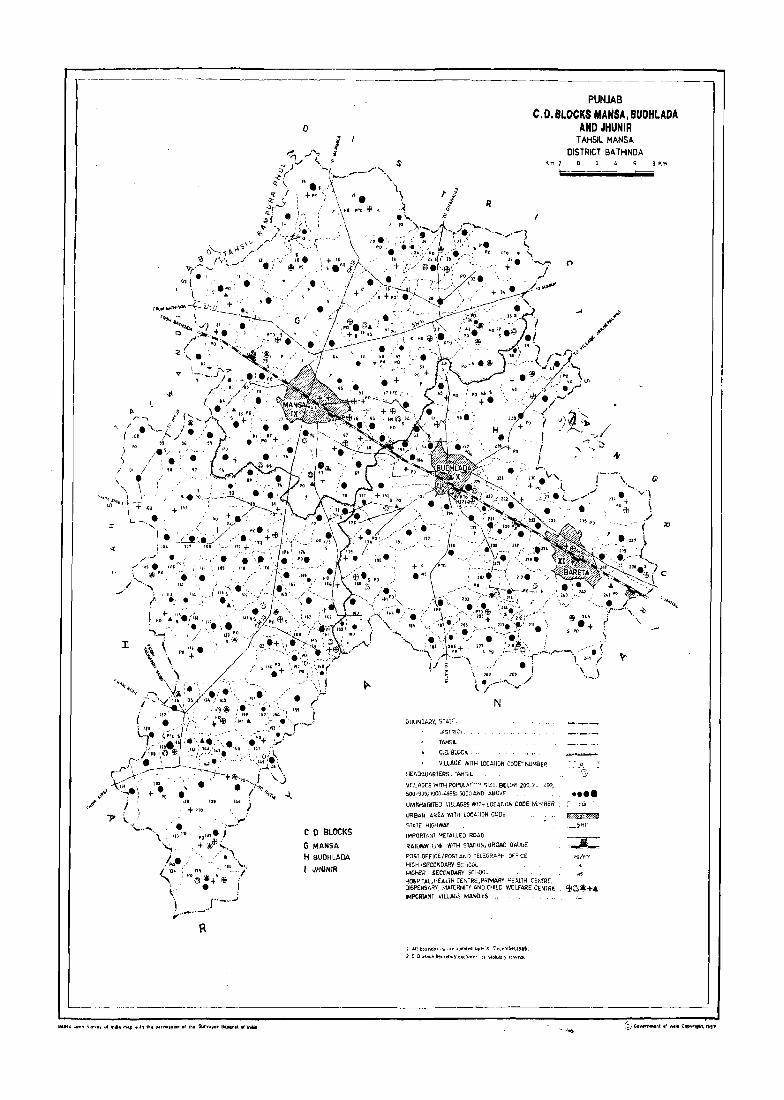
I ", PC '~.
D
i •
C D, BLOCKS
G MANSA
H BUOHLADA
I ,HUNIR
.s
PUNJAB C, 0, BLOCKS MAMSA, BUDHLADA
AND JHUNIR
8(JJ~[)AR,(, STATE
[,JiSTRICi
TAHSil
C.O. BlOCK ...
K", !
N
VILLAGE WflH lOCAliuN COOt' NUMBER
HEADtlUARTERS. TAHSil
VILLAGES WITH POPIJlAr'~~' SIZE. eELOW 2oo,? ~99,
~O-9,)S; 1'J00-49$9; ~OOO AND ABOVE
UNINHABITED VILLAGES W!TIi LOCATION CODE NL:v.B£R
UR8A~ Ai(~A WITH LOCAlll)N CODE
STATE HIGHWAY
IMPORT~NT METALLED ROAD
RAILWAY LINE WiTH STATIO/ij BROAD GAIJGE
POST DFFICE/POST AND TELEGRAPH OFFICE
HIGH /SECONDARY SCHOOL 1-4JGH£R S£CCND.ARY SCHOOL HOSPITAl,HEALTH CENTR£.PRIMARY HEALTH CENTRE, DISPENSARY, MATERNITY AND CHlLD WELFARE CENTRE IMPORTANT VILLAGE MANOJES
i All bO"JmIP''''S ~rfupo:lalfd UP'" \51 t'Htmbff,,,.t.
2 C a Ir/I)(k lttun<1ary fl(cI~d~' 0(1 st;rutory rowns
TAHSIL MANSA DISTRICT BATHINDA
8.",
....
j-'-\ ..... no· Pc~
c
••••
f'O/PTO
--------------------------------,-------------__j
ALPHABETICAL LIST OF VILLAGES IN JHUNIR C. D. BLOCK
131

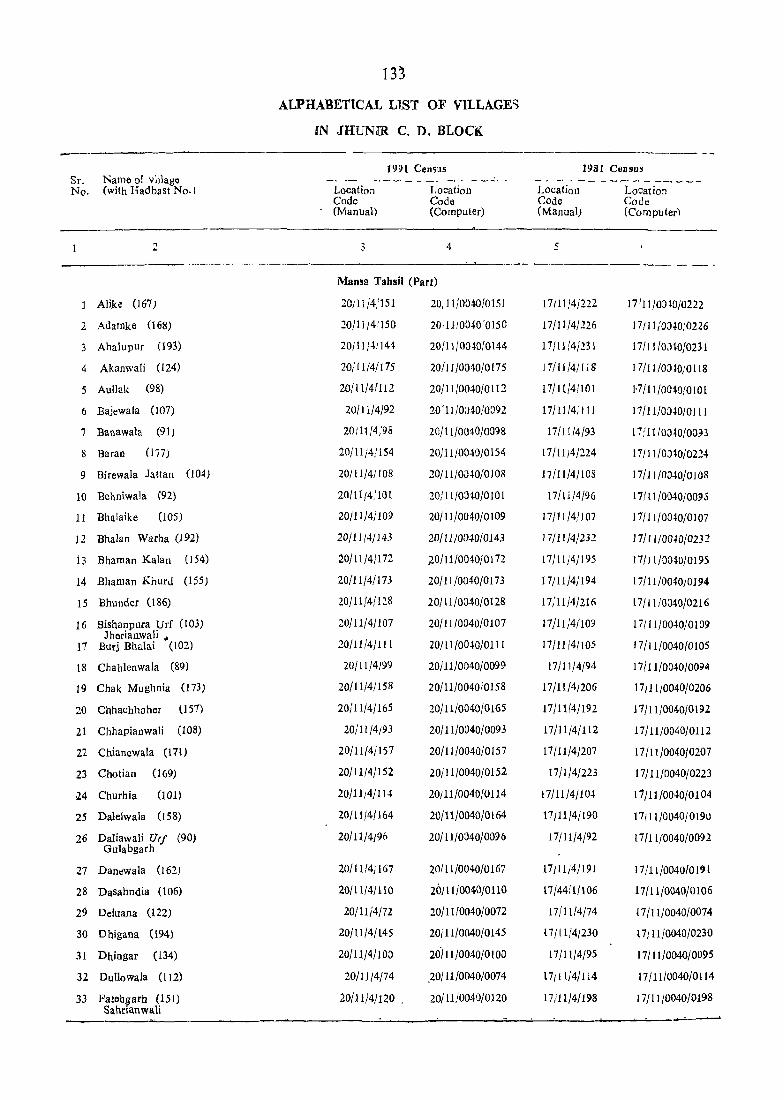
135
ALPHABETiCAL UST OF VILLAGES
IN JHUNfR C. D. BLOCK
19~1 Census 1931 Census Sr. Kame of valage - -- - - -- - - - - -- - - - -_ ----._ -----No. (with Hadbast No.1 Location Location Location Location
Code Code Code Code (Manual) (Computer) (Manual) (Computer)
2. 3 4 5
-----Mans8 Tahsil (Part)
Alike (167) 20i11!4:151 20,11/0040/0151 17 ill 14!222 17111/0:l~Oj0222
.2 Adarnke (168) 20/11/4/150 20,1110040 '0150 17/I1/4j226 17/11/03.J0,'0126
3 Ahalupur (193) 20111141144 20/1110:JlO:0144 1711 J 14/231 17/11/0,)~0!0.231
4 Akanwali (124) 20/ I 1(4/175 20/1I/OO40/0175 17/11/4/118 17/11/0310/0118
5 Aullak (98) 20/11/4/112 20/11/0040/0112 17/11/4/101 1·7(11/00~O!0101
6 Bajewala (107) 20/11/4/92 20' 11 /0:>40/0092 17/1114;111 17( 11!03.JOjOl ( (
7 Banawala (91 ) 20:11 (4;98 20/11/0040/0098 17/11 /4/93 17! 11 /0:HO/00~3
II Baran (177) 20/11/4/154 20/11/004010154 17/1114/224 17/11/0010/0224
9 Birewala Jattan (104) 10/11/4/1 08 20/11/0040/010S 17/11/4/108 17/11/0040/010S
10 Behniwala (92) 20/0/4:101 20/11/0040/0101 17/11/4/96 171l110040100~S
11 Bhalaike (105) 20/11/4/10) 20/11/0040/0 t09 17/11/4/107 17111/00~0/0107
12 Bhalan Warha (192) 20/1 J /4/ ]43 20/11 /OD40/0143 17/11/41232 17/11/0040/0232
13 Bhaman Kalan (154) 20/11/4/172 ,20/11/0040/0172 17/11)4/195 17/11/0040/0195
14 Bhaman KhurJ (155) 20/11/4/173 20/11/0040/0173 17/11/4/194 17/11 /0040/0194
15 Bhunder (186) 20/11/4/128 20/11/0040/0128 17,'11/4/216 17/11/0340/0216
16 Bisbanpura Urf (103) 20/1114/107 20/1110040/0107 17/11/4/10,} 17/11/0040/0109 lherianwali ..
20/1114/111 20111/0040/0111 17/11/4/105 17 Bud Bhalai (102) 17(11/0040(0105
18 Chahlenwala (89) 20/11/4/99 20/11/0040/0099 17/11/4/94 17/11/0040/0094
19 Chak Mughnia (113) 20/11(4/158 20/11/0040/0158 17/11/4/206 17/11/0040/0205
20 Cbbachhoher 057) 20/11/4/165 20/11/0040/0165 17/11/4/192 17/11/0040/0192
21 Chhapianwali (108) 20!1l/4/93 20/11/0040/0093 17/11/4/112 17/11/0040/0112
22 Chi anew ala (171) 20/11/4/157 20/11/0040(0151 17/11/4/207 17111/0040/0201
23 Chotian (169) 20/11/4/152 20/11/0040/0152 17/1/4/223 17/11/0040/0223
:24 Churhia (101) 20/11/4/114 20/11/0040/0114 17/11/4/104 11/11/0040/0104
25 Dalelwala (158) 20/11/4/164 20/11/0040/0164 17/11/4/190 17111/0040/0190
26 Daliawali Urf (90) 20/11/4/96 20/11/0040/0096 17/ 11/4/92 17/11/0040/0093 Gulabgarh
27 Danewala (162) 20/11/4/167 20/11/0040/0167 17/11/4/191 17/11/0040/0191
28 Dasahndia (106) 20/11/4/110 20Jll/0040jOllO 17/44/1/106 17/11/0040/0106
29 Deluana (122) 20/11j4j72 20/11/0040/0072 17/1114/74 17/11/0040/0074
30 Dbigana (194) 20/11/4/145 20; Il{OO40/0145 n/ t 1[4/230 t 7/11/0040/0230
31 Dhingar (134) 20/11/4/100 20) 11/0040/0100 17/11/4/95 17/11/0040j0095
32 Dullowala (112) 20/11/4/74 ,20/11/0040/0074 1701;4/114 17/11/0040/0114
33 Fatehgarh (151) 20/11/4/120 , 20/11}0040/0120 17/11/4/198 17/11/0040/0198 Sahrianwali
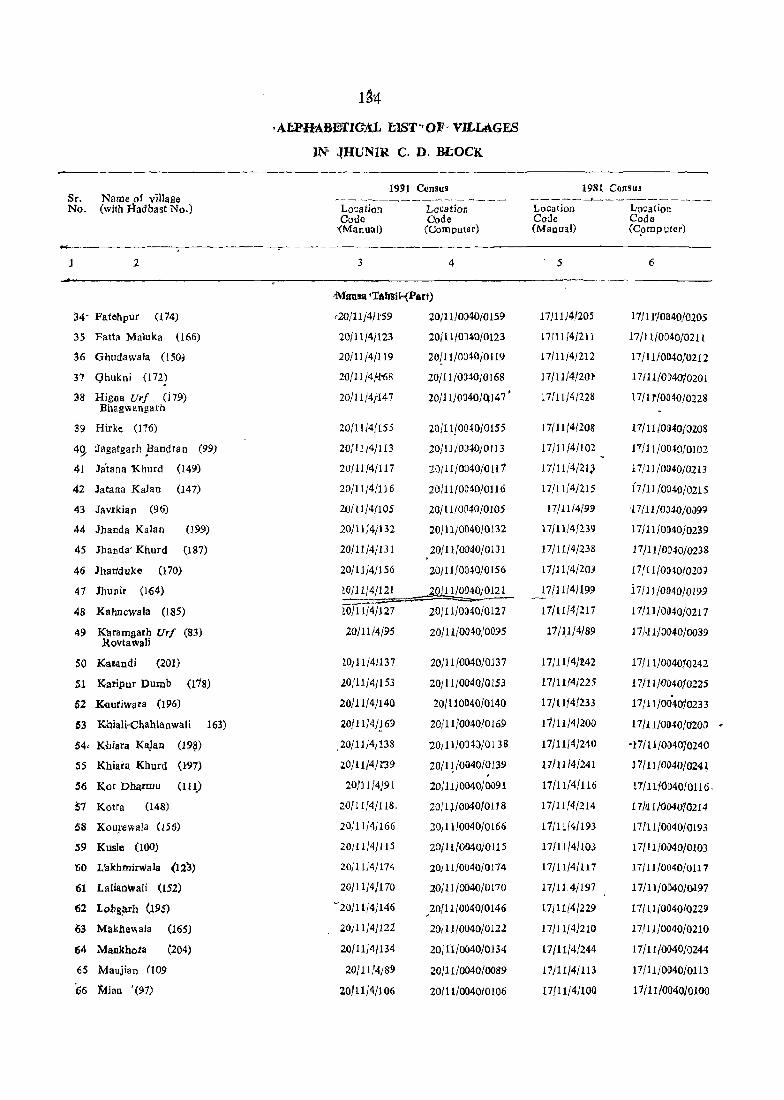
1a14
·AI:.PH-ABBTIC"AL mST"Ol!', VILLAGES
IN' -lHUNIR C. D. :&COCK.
1991 Census 1981 ColISU! Sr. Name of village ~-~-~-~-~------'-~----~ -----~~----------No. (with Hadbast No.) Location Location Location L'ocatioll
Code Code Code Code '(Manual) (Computer) (Manual) (C.omp uter)
2 3 4 5 6
-Mausa'TaIBU"'{Part)
34- Fatehpur (74) ~20/llJ4/1'59 20/11/0()40j0159 17]11/4/205 17! 1110040/0205
35 Fatta Maluka (166) 20/11/4/123 20/11/0)4Q/0123 17/11/4}211 17/11/0040/0211
36 Ghudawala (150~ 20/11/4/119 20U 1/0:J~O!0119 17/11}4}212 17}11!0040/0212
37 Ghukni (1722 20fl1/4fl"68 20/11/0040/0168 17/11/4/20}' 17/11/004010101
38 Higaa Uri (i79) 20/11/4/147 20/11/0:140/0;147 • 17/11/4/228 17/11"/0040/0228 Bhagwangarh
39 Hirke (176) 20[11 [4/155 10/11!00~010155 17/1114/208 17/11/01J40/(}208
49- :Jagatgarh .Bandran (99) 20/11/4/113 20/11/03~0)OI13 17/11}4/102 17)11)0040/0J02
41 la'tana Khurd (149) 20/11/4/117 20/11/0040/0111 17/11/4/21) 17/11/0D40/02l3
42 latana Kalan (147) 20/11/4/116 20111/01J40/{}]] 6 17/11/4/215 17/11 /0040/0215
43 l:wrkian (96) 20/11/4/105 20/11/0040/0105 17/11/4/99 -17/11 /0:)40/0099
44 Jhallda Kalan (199) 20/11}4)132 20)11)0040/0132 17/11/4/239 11[11/0040J0239
45 Jhanda' Khurd (187) 20/11 /4/131 20/11/0040/0131 17/11}4/238 17/11/0040/0238 , 46 Jhall'duke (170) 20/11/4/156 20}11/0040/0156 17/11/4/20'J 17( 11/0040/020J
47 Jhunir (164) tOi11!4/121 20}11/0040)0121 17/11}41199 i 7/11/0D40/0199 : ~
48 KahneWala (185) W/ll/4/127 20/11/0;)40/0127 17/11/4/217 17/11/0040/0217
49 Karamgarh UrI (83) 20/11/4/95 20/11/0040/0095 11/11/4/89 17 f.llJOD40/0089 Rovtawali
50 Katandi (201) W)1l}4/137 20}11 10040/0137 17/11/4/'2.42 17/11/0{)4010242
51 Kalipur Dumb (118) 1.0/1114/153 20/11/0040/0153 17/11t4/225 17/11/004010225
52 K'IIutiwara (196) 20/11/4/140 20/110040/0140 17/1114/233 11/11/004010233
S3 Khiali-Chahlanwali 163) 20/11/4}169 20/11/0040/0169 11/11}4/200 17/ lljOfl40/1J20a . 54, Khiara KaJaA (19~) 20/11}4) 138 20)11!O)~J/013S 17/11{4/240 -17{11/0040]0240
55 Khiats Khurd (197) 1,O/1l/4m9 20/q/0040/0139 17/11/4/241 17/11/0040/0241
56 Kot Dharmu (111) 20/11/4/91 2011110040/0091 17/11{4/116 17/U/tlD40/ 0116 '
57 Kotra (148) 20/11}4/118, 20/1 ]/0040/0118 17} 11/4/214 17/al/004070214
58 Kouj.'ewala (l56) 20i 1114/166 20} 11}0040/0166 11/1114/193 17/11/0040/0l93
59 Kusle (100) 20/U}4/115 20/1I}004010115 17/11/4/103 17/11/0040/0103
60 L'akhmirWaJa (12) 20j11}4/174 20) 1l/0040}O174 17{11/4/117 17/11/0040/0117
161 LaJianwali (152) 20/11/4/170 ],0/11/0040/0170 17/11. 4/197 17/I1/0040/(}197
162 LohS,l:Irh (195) -20/11141146 20111[004010146 17/11/4/229 17/U/OIJ40/Q229 ~
63 Makhewala (165) 20/11/4}122 20/11/0040/0122 17/11/4j210 17/11/004010210
64 Mankhota (204) 20/11/4j134 20iH/0040j0134 11/11/4/244 17/ t 1/0040/0244
65 Maujian (109 20111/4/89 20/11/0040/0089 11) 11/4/113 17/11)0040/0113
66 Mian "(97) 20/11j4)106 20/11/0040/0106 17/11/4/100 17/11/(J040/0100

Sr. Name cf village No. (wah Hadbast No.)
135
ALPHABETICAL UST OF ViLLAGES
lIN JHUNIR C. D. BLOCK
r.ocation Coda (Manual)
19J1 CCD1U1
LOLatio'1 Code (G)mputer)
1981 COD3U3
Location Code (Manual)
LocatIon Code (Computer)
.. _------_ -. _,.--.- - - -- -.- ---_ - -- ---~ -- ~ - --- ~~----- ----3 4 5
-----------------~----------.- --- ---~ ----~-----~~~---- -- .. ----_-~-
Mansa Tahsil (Part)
67 Mirpur Kalan (181 ) 20/11/4/149 20:11!0040iO[49 17!1114/221 17

VILLAGE DIRECTORY JHUNIR C. D. BLOCK

Loca- Name of village tion- (with Hadbast No.) Code No.
71 Saharna (121)
72 Deluana (122)
Total area of the village (in hectares)
3
344.00
783.00,
74 Dullowala .(112) 705.00
89 Maujian (109) 441.00
90 Vdda! Bhagat Ram (110) 775.00
91 Kot Dharmu (Ill) 1148.00
92 Bajewala (107)
93 Chhapian WaH (lOS)
95 Karamgarh Uri (83) Rovtawali
96 Daliawali Uri (90) Gulahgarh
97 Talwandi Akalia (82)
98 Banawala (91)
99 Chahlcnwala (89)
100 Dhin£ar (134)
101 Benhiwala (92)
102 Perron (93)
103 Raipur (94)
104 Tandian (95) •
105 Javrkian (96)
106 Mian (97)
107 Bishanpura Urf (103) Jhorian waH
108 Bircwala Jatt<\u (104)
109 Bhalaike (105)
11 0 Dasahndia (l06)
111 Burj Bhalai (102)
1838.00
535·00
762.00
748.00
711.00
1165.00
751.00
1016.00
1252.00
1017.00
2396.00
619.00
911.00
522.00
739.00
54l·OO
715.00
624.00
632.00
138
, VILLAGE
Amenities and
Total pOpulation and number of llOuseholds
Amenities available (if not available within the villago' a dash (-) is shown in tho column and next to it in brackets the distance in broad ranges vill.-5kms 5-10 kms and 10+Kms of the distance nearest place where the facility is available is given)
~~;~-M~~I--D~~~--P;t-~-D~~~-C~;~~; tiona I water.&; days cations
4 5
1355 (221) P,M,H
1267 (216) l'
2124 (342) P
1118 (197) P
1789 (312) P
3261 (541) P,M,H
6
-(-5)
-(-5)
-(-5)
-(-5)
CHW
D.CHW
(potable) Tele'- of tho (bus
7
TH,P,C
T,HP,C
T,HP,C
T,TW,HP
T,HP,C
T,W,HP,C
graph marketl stop, hat, if railway
PO
any station.
9
water way)
10
Man~a
-([0+) BS
-(5-10) -(5-10) BS
-(-5)
-(-5)
-(-5)
PO
-(5-10)
-(10+)
-.(10-)
-(10-)
BS f BS
BS
BS
3487 (553) P,M D,FPC,RP, T,HP CHW(6)
PTO -(10+ ) BS Phone
895 (152) P ...,...( ....... 5) T,HP -(-5) -(10+ ) BS
1270 (212) P -.(-5) T,W,TW, HP,C
-(-5) -(5-10) BS
1525 (227) P
1253 (199) P
1296 (218) P
PHC, cliW T,HP .-(-5)
-(-5)
-(10+) BS
CHW
-(10+)
2038 (320) P,M,H, CHW(4)
2652 (389) P(2) CHW(6)
3000 (508) P.M. H,CHW
1685 (262) P -.(-5)
4993 (774) P,M,H, D,RP
1216 (199) P
1918 (351) P,M
983 (158) P
1858 (311) P
1342 (210) P
1258 (211) P
1011 (176) P
1352 (229) P
-(-5)
PHC \
-(-5)
-(-5)
-(-5)
-(-5)
-(-5)
-(5-10)
T,HP
T,W,HP -(-5)
-(10+) BS
-([0+) BS
T,TW,HP -·(-5) -(10+) BS
T,TW,HP PO -(10+) BS
TW,HP,C PO -(10+) BS
T,W,TW, -(-5) -(--5) BS HP
T,HP
T,TW,HP
T,HP,C
T,C
T,HP,C
T,HP,C
T,HP,C
_T,HP,C
'l',HP,C
PO -(10+) BS
-(-5) -(10+) BS
PO • -(10+) BS
,PO • -(10+) .as -(-5) -(10+) BS
-(-5) -(10+) BS
-(-5) - (10+) BS
-(-5) -(10+) -(-5)
-.(-5) -(5-10) BS

DIREctORY
land· use
Apj:roach to village
11
Nearest (own and distance (in kms.)
12
Tahsil (Part)
PR Mansa (11)
PR Mansa (10)
PR Mansa (8)
PR Mansa (13)
PR Mansa (15)
PR Mansa (12)
PR Mansa (16)
PR Mansa (15)
PR Mansa (11)
PR Mlur (11)
PR Mansa (13)
PR Maur (II)
PR Maur (II)
PR Maur (11)
PR Talwandl Saba
PR Maur (18)
PR Mansa (16)
PR Mansa (22)
PR Talwandi Sab()
PR Ta1wandi Sabo
PR Mansa (16)
PR Mansa (14)
PR Mausa (15)
PR Mansa (15)
PR Mansa (28)
(13)
(23)
(23)
Power Supply
13
BAG
ED,EAG
ED, EAG
ED, EAG
EA
EA
ED
EA
EA
EA
EA
EA
EA
ED,EAG
ED
EA
'EA
ED.EAG
ED,EAG
ED
ED
EA
ED
EA
ED
139
Land use (i.e. area under different types of land USe in hectares rOJnded upto two decim:d places)
Forest Iuigated by source
14 15 !I,
T(278 ,00), GC(243. 00), TW(15. 00), TWE (20.00)
T(630.00), GC(603 .00), TW(21 .00), TWE(6.00)
T(631.0D), GC(631 .00)
T(398.00), GC(397.00). TW(l.OO)
T(707.00). GC(707. 00)
T(936.00), GC(933 .00), TW(3. 00)
T(102S.00), GC(1004.00), TW(21.00)
T(438.00), GC(405.00), TW(21.00), TWE(12.00)
T(368.00), GC(368. 00)
T(472.00). GC(472.00.
T(458.00), GC(458.00}
T(539.00), GC(532.00), TW(7.00)
T(601.00), GC(601.00)
T(861 .00), GC(861.00)
T(9S7.00), GC(957.00)
T(446.00), GC(420.00), TWE(26.0J)
T(1817.00), GC(1817'OQ)
T(392 .00), GC(387.00), TW(5.00)
T(794.00), GC(794.00)
T(276.00), GC(276.-{)0)
T(431.00), GC(422.00), TW(9.00)
T(453.00), G0(448. 00), TWF(S.UO)
T(443.00), GG(436.00), TW(7.00)
T(440.00). GC(434.00). TW(6.00)
T(469.00), GC(469.00)
Unirrigated
16
27.00
91.0n
8.00
2.00
13.00
115.00
715.00
63.00
345.00
221.00
208.00
554.00
69.00
81.00
196.00
513.00
405.00
174.00
56.00
213.00
258.00
43.00
230.{)0
150.00
122.00
Culturable waste (including gauchar and groves)
17
1.00
2.00
3.08
7.00
1.00
Are not avilable for Cllllt
vadon
13
39.00
6.2· OJ
66.00
41.00
54.00
97.00
9S:0J
34.00
49.00
55.00
45.00
72.00
79·00
71.0e
99.00
58.00
167.00
53.00
61.00
33.00
49.00
45.00
42.00
34.00
41.00

140
VILLAGE
JHutim C. D. BLOCK Amenities and
Loca- Name of village Total Total Amenities available (if not available within the village, a dash tion (with Hadbast No.) Brlla popula- • C-) is shown in tbe column arid next it in brackets the distance Coda of the tion in broad ra\lgos viz. -5kms., 5 -10 kms and 10+kms. ,01 the No. village and nearest place where the faoility is available is given)
(in bumber hectares of ----_---_-----------------_--._--
house- Educa- Medic.al Dlinking Post Day or Communi-holds) tional water & days calio:!,
(potable) Tele- of the (bus glaph markClt/ stop,
hat, if railway any statioll,
.water-way)
2 3 4 5 6 7 '8 9 'io
Mans.
112 ~ullak (98) 572.00 1219 (212) P,M -(- 5) T,TW,HP -(- 5) - (1O+L :ijS
113 Jagatgarb Bandran (99 408.00 520 (81) P CHW HP,e -(-B) - 10+) BS
114 Churhia (101) 607.00 932 (148) P -(- 5) T,TW,HP -C-5) - (10+) - (- 5)
115 Kusla (100) 1363.00 2619 (431) P,M.H MCW,D r.w .. rw, rtp
PO -(10+) BS
" 116 Jatana Kalan (147) 2450.00 2858 (465) p,M D T.TW,HP.C PO. -(10+) BS Phond
117 Jatan Khurd (149) 532.00 1167 (175) P cwe T.e -C-5) -(10+) -(_5)
118. Kotra (148) 356.00 694 (103) P -(-5) T.W,C -(-5) -(10+) -(-5)
119 Ghudawala (150) 597.00 1118 (162) p.M.H MCW T.TW.HP -(-5) -(-5) BS
120 Fatohgarh (1St) 619.00 1014 (170) P -(-5) T.W,TW. -(-5) -(-5) BS Sahrianwali HP
121 Jhunir (164) 2042.00 4180 (743) P.M.rt, H.HC, T.HP.C PO. -(10+) BS PUC PRC Phanl:!
122 Makhewala (165) 599.00 1377 (228) P CWC.D T.HP.C 'Phone -(10+) -(-5)
123 Fatta Maluka (166) 2312.00 5095 (828) P(2). MH.PHC T.HP.C PO -(10+) BS M(2), H
124 Mirpur Khurd (182) 885.00 1701 (267) P -(_:_5) :r.TW.HP -(-5) -(-5) BS
125 Tibi Hari Singh (183) 456.00 772 (128) P -(-5) t.TW,HP. C
-(-5) L-.(-5) BS
126 Sardulowala (184) 762.00 1965 (293) P cwe. T.TW,HP. -(-5) ........ (-5) BS PRC.RP e
127 Kahnewala' (18S) 676.00 1008 (159) P -(-5) T.W.TW. -(-5) -(-5) -(-5) HP
128 Bhunder (186) 684.00' 722 (102) P CHW T.TW.HP. -(-5) -"(-5) _(-_5) C
129 Sardulegarh (189) 1847.00 10262 (1816) P(2). H.HC. T.Tw.HP. PTa. -(-5) BS M(2). RP.CHW C Phone B(2). PUC
130 Rurki (188) 866.00 1591 (263) P MH T,TW.HP -(-5) -(-5) -(-5)
131 Jhanda Khurd (187) 1174.00 2693 (432) P I _(_5) T.TW;HP -(-5) -(5-10) BS
1~"2 Jhanda Kalan (199) 2267.00 3977 (611) P.M D t,W.HP PO. -(5--,,10) -(-5) Phona
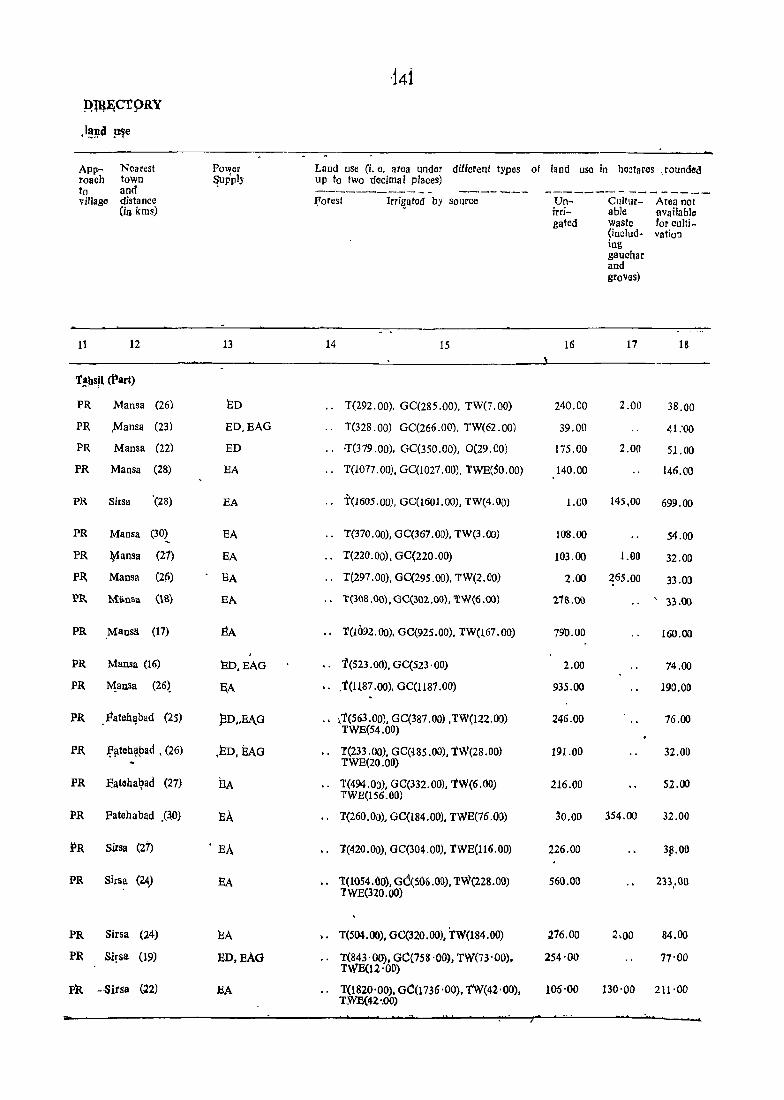
Approach to village!
Nearest town and distance (in kms)
11 12
'l'~hs!l (part)
FR Mansa (26)
FR ,Mansa (23)
PR Mansa (22)
PR Mansa (2s:)
PR Sirsa '(28)
PR Mansa (30)
PR ¥ansa (21)
PR Mansa (2j»
PR Mi'of.O\ (lS)
PR Mansa (17)
PR Mansa (16)
PR ~ansa (26~
PR Fateh!!bad (25)
PR .f!ltch\lparl , (26)
PR F.atabal?ad (27)
PR Patahabad .(40)
PR Sirsa (21)
PR Sirsa (24)
PR Sirsa (24)
PI{ Sirsa (19)
PR -Sirsa (22)
Power ~uppl.l'
13
ED
ED,EAG
ED
EA
EA
EA
EA
BA
EA
EA
l:lD,EAG
I3A
1m,.EAG
.Em, EAO
EA
BA
• EA
EA
EA
ED,BAG
BA
Land llse (i. c. arca under different types of land usc in hectares . rounded up to two "decimal places)
.forest Jrri~at(Jd by source
14 15
.. T(292.00), GC(285.00), TW(7. 00)
.. T(328.00) GC(266.00), TW(62.00)
.. '1(379.00), GC(350.00), 0(29.00)
.. T(1077.00J. GC(1027.00), TWE(~O.OO)
.. 1'(1605.00), GC(1601.00), 1'W(4.00)
.. T(370.00), GC(367.00), TW(3.00)
.. T(220.00), GC(220.00)
T(297 .00), GC(295 .00), TW(2.00)
T(308.00),GC(302.00), 'fW(6.00)
., T(1092.00), GC(925.00), TW(167.00)
.. t(523.00), GC(523 . 00)
•. .t(1l87.oo), GC(1181.00)
,1(563.00). GC(387.00) ,TW(122.00) TWE(54.00)
.. T(233 .00), GC(.J.85 .00), 1W(28.00) TWE(20.00)
.. T(494.00). OC(332.00). TW(6.00) TWE(156.00)
.. T(260.00). GC(184.00), TWE(76.00)
.. 1(420.00), GC(304.00), 1WE(Wi.OO)
1(1054.00), OC(506.00), TW(228.00) lWE(320.00)
.. T(504.00), OC(320.00), TW(184.00)
,. T(843' 00), GC(758 '00), TW(73 '00), TWE(12'OO)
.. T(1820'00), GC(1736 ·00), T'W(42·QO), TYYE(42:.oo)
Unirrigated
16
240.00
39.00
175.00
140.00
1.00
108.00
103.00
2.00
21s.00
79'0.00
2.00
935.00
246.00
191.00
216.00
30.00
226.00
560.00
216.00
254'00
106'00
Culturable wasle (including gaucbar and grOves)
17
2.00
2.00
145 ,00
1.80
~65.00
354.00
2.00
130'00
Area not 1wailablc lor cultivation
18
38.00
41:00
51.00
146.00
699.00
54.00
32.00
33.00
' 33.00
160.00
74.00
190.00
76.00
32.00
52.00
32.00
3~.00
233,.00
84.00
77'00
211'00
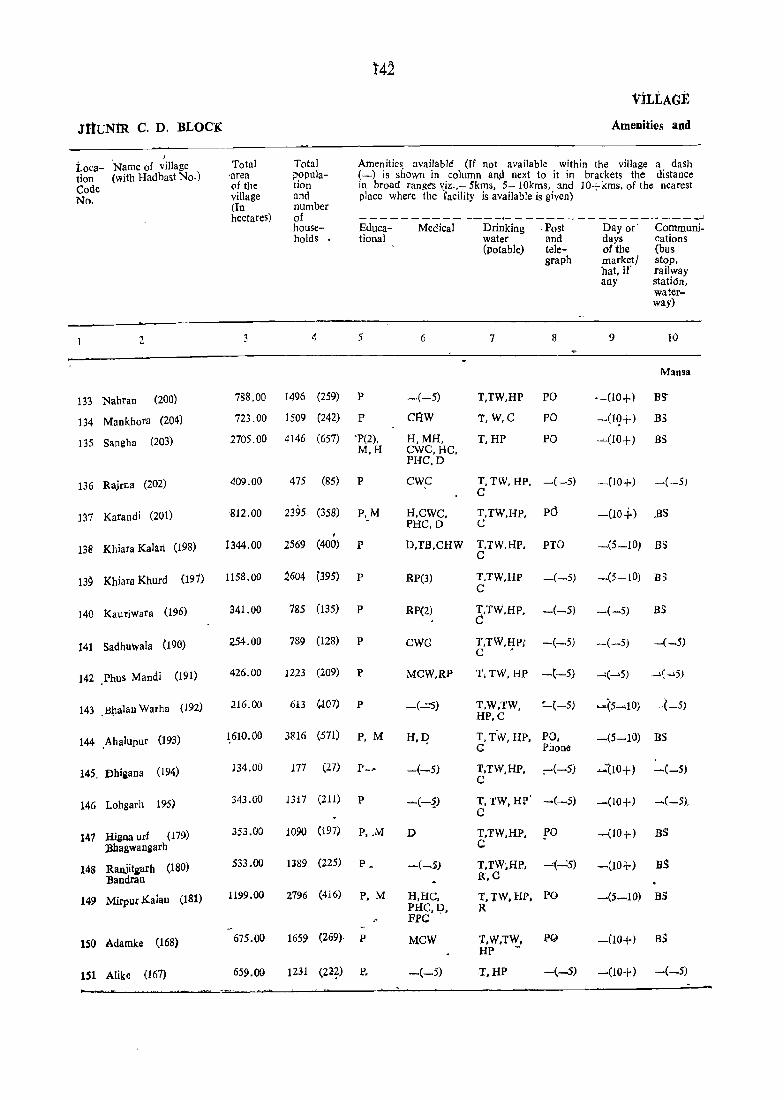
142
ViLLAGt
JrtUNtR c. D. BLOCK Amenities and
I
10ca- 'Name of village Total Total Amenitie~ available (If not available within the village a dash
tion (with Hadbast No,) 'area popula- (-) is shown in column an.d next to it in brackets the distance
Code oftbe tion in broad ranges Xiz,,- 5kms, 5- 10kms, and 10+kms, of the nearest
No. village and place where the facility is available is given) (In number hectares) of --------------------------------~
house- Educa- Medical Drinking . Post Day or' Communi-holds tional water and days cations
(potable) tele- or the (bus graph market/ stop,
hat, if railway any statiCln,
water-way)
2 3 4 5 6 7 8 9 10
Mansa
133 Nahran (200) 788.00 1496 (259) P -(-5) T,TW,HP PO ~(10+) BS"
134 Mankhora (204) 723,00 1509 (242) P cAw T,W,C PO -(19+) B5
135 Sangha (203) 2705,00 4146 (657) 'P(2), H,MH, T,HP PO -,-(10+ ) BS M,H CWe,HC,
PHC,D
136 Rajrna (202) 409,00 475 (85) p cwe T. TW, HP, -(-5) -(10+) ~(-5) C
137 Karandi (201) 812.00 2395 (358) P'oM H,CWe, T,TW,HP, PO -(10+) ..as PHC,D C
,
138 Khiara Kalan (198) 1344.00 2569 (400) p D,TB,eHW T,TW,HP, e
PTO -(5-10) BS
139 Khiara Khurd (191) 1158.00 ,2604 ~39S) P Rp(3) T,TW,HP -(-5) _(5_10) B:J C
140 J<auriWara (196) 341.00 785 (135) P RP(2) l?W,HP. -(-5) -(-5) BS
141 Sadhuwala (190) 254.00 789 (128) P cwe T,TW.HPi -(-5) -(-5) -(-) C .
142 Phus Mandi (191) 426.00 1223 (209) P MeW.RP T,TW,HP -(-5) ....:(--->5) -'( ...,,5)
143 .Bpalan Warha (192) 216.00 60 ~107) P -(-=.'5) T,W.TW, HP,e
~(-5) .... (5--'«10) -~_5)
144 .Ahalupur (193) 1610.00 3816 (571) p, M H.:q T, T'W. HPj PO. -(5-10) BS G Phona
145, Dhigana (194) 134.00 J77 (27) P_J> -(-5) T,TW,HP, C
:-(~5) ...... :{10+) -(_5)
146 Lohgarh 195) 343.00 1317 (211) P -(-~) T,TW,HP' -(-.5) -(10+) -(-5), c
147 Higoa uri (179) 353.00 1090 (197) P.,M D T.TW.HP. PO --(10+) B$ ]3bagwangarh C
148 Ran.iitiarh (180) 533.00 1389 (225) P~ -(-S) T,TW,HP, -'\""':5) -(10+) nS Bandran R.C
149 MirpuI Kalan (181) 1199.00 2796 (416) P, M H,He, T, rW, HP, PO -(5-10) BS pile,p, R
," FPC
ISO Adamke (168) 675.00 1659 (269). P MeW 1,W,T~ PO -(10+) BS HP
lSI Alike (167) 659.00 1231 (22~) P. -(-5) T,HP -(-5) -(10+) -(-5)
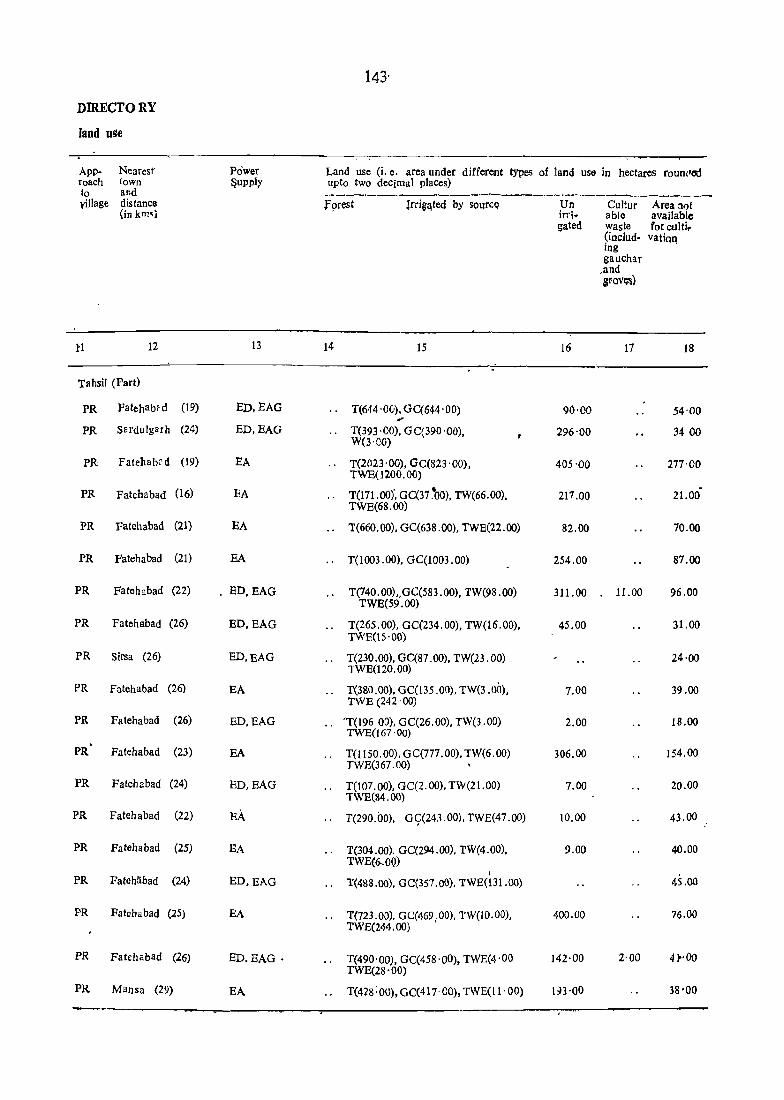
DIRECTORY
land use
App.roach to village
1:1
Nearest' town and distance {in km'J
12
Tahsil (Part)
PR Fatehabpd (19)
PR sardulgarh (24)
PR Fatehab~d (19)
PR Fatehabad (16)
PR Fatehabad (21)
PR Fatehabad (21)
PR Fatehabad (22)
PR Fatehabad (26)
PR Sirsa (26)
PR Futehabad (26)
PR Fatchabad (26)
PR Fatchabad (23)
PR Fatchabad (24)
PR Fatehabad (22)
PR Fatehabad (25)
PR Fatohiibad (24)
PR Fatahabad (25)
PR Fatehabad (26)
PR Mansa (29)
Power ~upplr
13
ED,EAG
ED,EAG
EA
EA
EA
EA
ED,EAG
ED, EAG
ED,EAG
EA
ED,EAG
EA
ED,EAG
EA
EA
ED.EAG
EA
ED. BAG •
EA
143'
Land use (i. e. area under different types of land use in hectares roUn(Ied upto two decimal places)
fprest rrri8~ted by sOl1rc~
14 15
.. T(644 ·OC'), GC(644 '00) ,
.. T(393 ·00), GC(390 '00), W(3'CO)
.. T(2023'00), GC(823'00), TWB(1200.00)
.. T(171.00)" GC(37.'o0), TW(66.00), TWE(68.00)
.. 1'(660.00), GC(638.00), TWE(22.00)
., T(1003.00), GC(lOO3.00)
., 1'(740.00)"GC(583 .00), 1'W(98.oo) 1'WE(59.00)
.. 1'(265.00), GC(234.00), 1'W(16.00), TWE(lS'DO)
T(230 .00), GC(87 .00), 1'W(23. 00) lWE(120.00)
.. T(380.GO), GC(135 .00), TW(3 .00), 1'WE (242 '00)
.. T(196 00), GC(26.00), TW(3 .00) TWE(167·00)
.. T(1150.00), GC(777.00), TW(6.00) TWE(367.00)
" T(107.OO), GC(2.00), TW(2 1. 00) TWE(84.DD)
.. T(290.00), G9(24:l.00), TWE(47.oo)
., 1'(304.00). GC(294.00), 1'W(4.00), TWE(6.0Q)
I
T(488.00), GC(357.00), TWE(131.DO)
.. 1'(723.00), GC(469.00), TW(IO.OO), TWE(244.00) •
T(490'00), GC(458'00), TWE(4'00 TWE(28'OO)
T(42S:00), GC(417'OO), TWE(ll' 00)
Un irrigated
16
90·00
296'00
405 '00
217.00
82.00
254.00
311.00
45.00
7.00
2.00
306.00
7.00
10.00
9.00
400.00
142·00
1:)3'00
Cultur able waste (including gauchar
,and &POVflll)
17
11.00
2·00
Area nt)t available forculti. vatioq
18
54'00
3400
277'00
21.00
70.00
87.00
96.00
31.00
24'00
39.00
18.00
154.00
20.00
43.00
40.00
45.00
76.00
4}o·00
38'00

144-
, VitLAUIt' JHUNllR C. D. BLOCK Amenities -anal
- " -Loea Name-of village Tota1 Tatal Atrj3'nitie3 available (if not available within the village a dash lion (with Hadbast No.) area popula:- (-.) is shown in colum n and next 'to it in brackets the distance
.Code of the 'lion in broadrange3 Vi1;, -5kms, 5-10 kms. and \0 t kms, (f the nearlfSt No. villjige and place where the facility is available is giv,n)
(in number hectares of
~~~-'--M;iical -'-D~;kh;~-P~;-'--'D;~~-;: - C;;~;;:-house-holcts tlonal water & days catiom
(Potable) tele.., of the (bus graph market! stop,
hat, if railway any stations.
water-way)
2 3 ' 4 5 6 7 8 9 10
--- ...
Mansa
lSi' Chotian -(169) 308.00 923 (148) P -(5-10) T.HP =-(-5) ....,.(10 +) BS
153 Karipur Dumb (178) 254.00 358 (49) P RP T,HP -( -5) -(10+) -(-5)
154 .Baran (177) 394.00 7.61 (133) P -(5-10) HP -(-5) -(10+) BS
]55 Hirke (176) 937.00 2050 (368) P -(5-10) T. TW,HP. --(-5) ~(l0+) BS C
156 Jhapdukc (170) 1658.00 4201 (714) M,H,O D T.TW,HP, PO. -(-5) BS C PhoJC
157 Chiancwala (171) 517.0Cl, 1420 (235) P -(-5) T,TW;HP, PO -(5 -IP) BS C -"
'158 Chak.Mughnia (i73) 153.00 l' (1) -(-5) -(-5) HP -(5 -10) -(5-10) BS
]59 Patehpur (174) 667.00 2146 (353) P CHW T,W,TW, PO -(10+) _(_5)' HP,C
160 Moda (175) 202.00 206 (39) P -(-5) T,W,TW, -(-5) -(10+) -(-5) HP
16J Moffer (J 61) 471.00 J410 (229) P,M H', He, D T,TW,HP, PO -(10+) BS C
162 Nandgarh (160) 609.00 )338' (224) P D T,HP,C -(10 -) -(10+) BS
164 Dalelwala (J 58) 1108.00 2283 (381) P,M CWC,D T,HP PO -(5-10) BS
165 Chhachhoher (157) 250.0;) 429 (69) P -(-5) T,HP ":"(-5) -(10+) BS
166 Kourewala (156) ,
658.00 1403 (255) P -(-5) HP -(-5) -(10+) BS
167 Danewala (162) 726,00 1334 (224) P ,:_:-(-sY HP _:_(-5) -DO+) BS
168 Ghukni .(172) 488,00 1662 (247) P CWC T,HP,C -(-5) -(lOt) B3
169 Khiali Chahlan· (163) 886.00 1573 (268) P RP(2) T,W,HP -(-5) -(10+) BS wali
no LaBan Wali (l52) 688.00 1430 -(232) .p -(-5) T,W,TW. _._( -5) -(-5) BS HP,C
171 Raman Mandi (153) 490.00 11411 (194) P D T, HP -(-.5) -00'+) BS .I_
~. ~"

·D:m£eT01\.y laha: US~'
;\pp:' roach to villaga
11
Noarest t()wn~
8nll distance (in-kms)
12-
TaJlsil (Pllrt)
PR Mansa (30)
PR F~ichabad' (26,
PR Mansa (34)
PR Mansa (26)
PR Mansa (27)
PR Mansa (17)
PR Mansa t16)
PR Mansa' (16)
PR Mansa (27)
PR Mansa (15)
PR Mansa (25)
PR Mansa (19)
PR Mansa (19)
PR Mansa (19)
PR Mansa (21)
PR Mansa (l5)
PR Mansa (14)
PR Mansa (l5)
PR Mansa (7)
Pow-at' Supply-
B
ED,EGA
EB.EAG
ED, BAG
EA
ED.EAG
EA
EA
ED.EAG
ED. fAG
ED.EAG
EA
EA
ED. BAG
ED. BAG
EA
EA
EA
EA
EA
145'
Land usc (i: 0- ar~a under dilMreht tYpe1 of land usa in hectares" rounao,1' Up tb two docimal pl~co5)'
Fb;;;-- ---hli;afudbY~ill~-- --- - -U-;;:----Cult;'-A;;;n~t-
14 15-
T(228-00). GC(209 '00). TWE(J9'QO)
T(231.00). GC(212.00), TWE(19.00)·
T(m.OJ), GC(2_26 •. OJ), TWE(63.0J)
T(800.00), GC(433.00), TW(40.0J), TWE(327.00)
r'1490) .oi), GC(l4~! .00). TW(40.0:J) TWE(3? . DO}
1(471.00) ClC{399 .00), TW(20.00) TWE(52.00) .
1(139.00), GC(139. 00)
1.(563.00), GC(429.0[), TW(53.00), TWE(81.00)
1(183.0(l). GC(105.00), 1\\1(38.00), TW8(40.G3)
T(416.00), GC(402.00), TW(14.{l(J)
T(457.0Q), GC(451.00), TW(6.0n)
T(742.0;), GC(730.0:J), TW(l2.0J)
T(2l0.0J), GC(203.0J), TW(2.0:»
T(602.00). GC(602.00)
T(548.0J),GC(548.00)
T(439.00), GC(439.00)
T(690.0,», GC(680.0a). TWE(lO.OO)
T(234.00), GC(234.00)
T(412.00). GC(402.00). TW(10.00)
16·
54'00
3.00'
62.00
41.00
35'00
12.00
24.00
4.on'
7.00
98.00
293.00
26.00
26.00
133.0::1
2.03
13'5.00
412.00
39.00
ablo availablo wasta lor aulli (inalud- vation ing gauahaI and grovos)
1-1 18
26·00
.20\00
38.00
96.03
9'00 115.00
34.0Q
14.00
80.00
15.00
48,00
54.00
73.00
14.00
30.00
45.00
47.00
61.00
42.00.
2.00 37.00
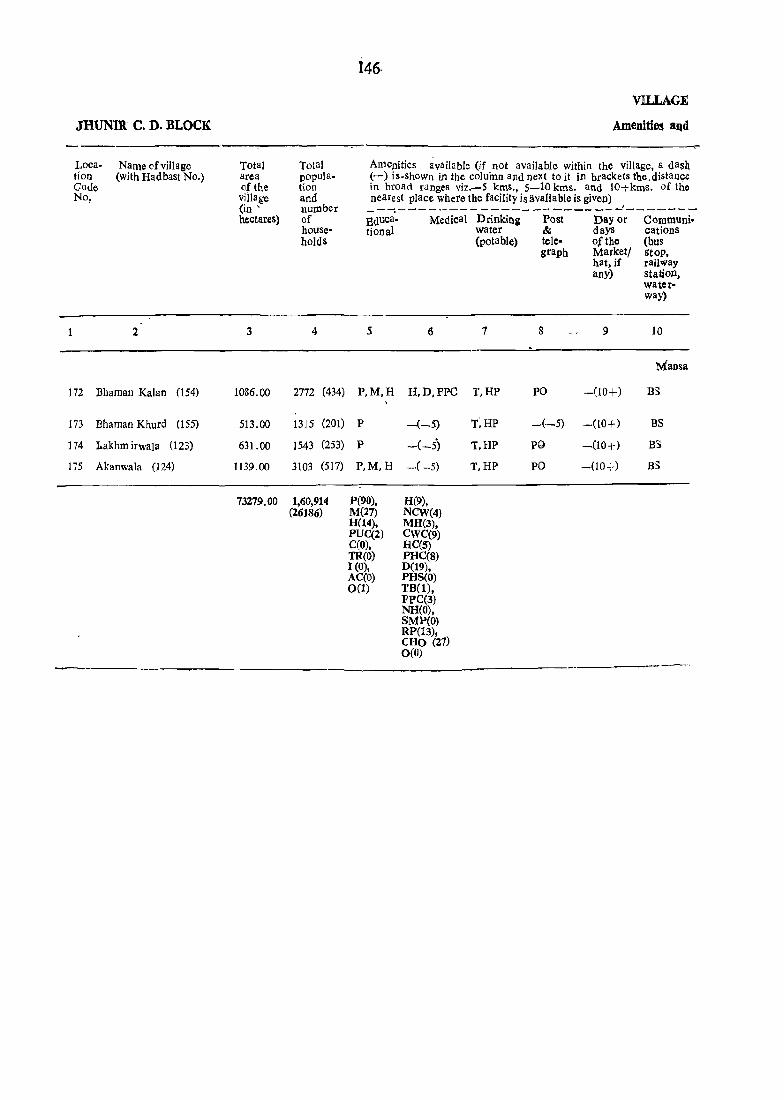
JHUNIR C. D. BLOCK
Loca. tion Code No,
Name of village (with Hadbast No.)
2
172 Bhaman Kalan (154)
173 Bhaman Khurd (155)
174 1akhm irwa]a (123)
175 Akanwala (124)
Total area cfthe viiIage (in' hectares)
3
1086.00
513.00
631.00
1139.00
73279.00
Total population and number of households
4
2772 (434)
1315 (201)
1543 (253)
3103 (517)
1,60,914 (26]S6)
146·
VILLAGE
Amenities aQd
AlllCnities available (if not available within the village, a dash, (-) is.shown in the coluinn and next to it in brackets the.distanc,;e in broad ranges viz.-S kms., 5-10 kms. and IO+kms. of the nearest place where the facility is avaliable is givell) -~---------------------~-------
Bduca• tlonal
5
P,M,H
P
P
P,M,H
P(90), M(27) H(14), PUC(2) C(O), TR(G) 1(0), AC(O) 0(1)
Medical Drinking water (potable)
6 7
H,D,FPC T,HP
-(-5) T,HP
-(-5) T,HP
-(-5) T,H?
H(9), NCW(4) MH(3), CWC(9) HC(S) PHC(S) D(19), PHS(O) TB(l), FPC(3) NH(O), SMP(O) RP(13), CHO (27) 0(0)
Post & telegraph
8
PO
-(-5)
P0
PO
Day or days of the Marketl hat, jf any)
9
-(10+)
-(10+)
-(10+ )
-(10+)
Communi. cations (bus Stop, railway statioJl, waterway)
10
Mausa
BS
BS
BS
BS

bl~EctORY
land. use
App- -roach to villaio
11
NoarClst town aod distanco (in kms)
12
Tabsil (Part)
PR Mansa
PR Mansa
PR Mansa
PR Mans,
(IS)
(14)
\14)
nS)
Power Supply
13
ED,BAG
ED
EA
EA
147
Land usc (i. o. area under different types of land use in hClctares roundod up to two decimal places)
Forest Irrigated by soureo
14 IS
., T(998.00), GC(969.00), TW(28.00), TWE(l.OO)
.. T(38S.00), GC(38S.00)
., T(S88.00), GC(S42.00), TWE(46.00)
T(1033.00), GC(656.00), TW(377 .00)
T(SI976.00) GC(45574.00) W(3.00) TWE(4426.00) TW(1944.00) 0(29.00)
UnIrrigated
16
10.00
89.00
14071.00
Culturable waste (includinK gauchat and groves)
11
2.00
941.00
Area not available tor cultivation
18
76.00
39.00
43.00
108.<lO
6291.00


ALPHABEnCAL ~IST OF VILLAGES IN BUDHLAD~ c. D. BLOCK
149


Sr. 'NameOf.iJIa~'No. (with Hadbast No.)
2
1 I\chank (142)
2 Abmadput (232)
.3 Akbarpur Khuda! (171)
.4 Alamput Bodla (35)
.5 Alampur Mandran (131)
.6 Andianwali, (157)
~-~ 8 B~}1~l§.8)_
9 B~k;hlwaJa (I7lJ
1 0 Barsh (127)
11 Bhawa (155)
12 Bhadra (36)
13 Bhakhrial (159)
14 Bhewals Dogtan (154)
15 Biroke :kaJan (3~
i6 Boha um 17 Borawal. (40) '"
18 Budhpura (39)
19 Budhlada (Rural) (229)
20 Chak AJlsher (156)
21 Cbakan (221)
22 Dariapur (225}.
23 Datewal (223)
24 Dharampura (161)
25 D1alputa (167)
26 Dodra (219)
27 Faridke (134)
28 Gandhet Kalan (150)
29 Gandher Khurd (151)
-30 Ganiwala (147)
31 Gobindpura (164)
32 Gorakh Nath '(lad)
33 GUladi (37)
1~1
ALPHABETICAL LIST OF VILLAGES
BUD~DA C; D. BLOCK
1991 "CenslIs ~~--------------Location
Code (Manual)
3
Location Coda (Computer)
- 4
MfIIS'I TAhsil (Pkl)
20/11/4/201
20JIH4f194
20/11/4/237 - .' - 20/1114i42
20/11/4/i80
.20/11/4/213
20/11/4/228
20111/4/235
20/11/4/238
20/11/4/192
20/11/4/211
20111/4}43
20/11/4/212
20/11/4/209.
20/11/4/44
20/11/4/189
20/11/4/49
,20/11/4/48
20111/41224
20/11/4/210
'"20/11/4/22,7
20/11/4}221
, 20/11/4/222
,20/11/4/217
20/11/4/232
20/11/4/229
20/11/41183
20/11/4/206
20/11/4/205
20/J.1/4/188
20/11/4/219
20/11/4/245
20/11/4/40
20/11/0040/0201 , 20/11f0040/0194
20/11/0040/0237
'20/11/oo40fOQ4.2
20/11/0040/0180
20/11/0040/0213
2OtlJ./OO4O(0228
20}1l/OO40/0235
20/11/004010238
20/1110040/0192
20/11/0040/0211
20111/0040/0043
20/11/0040/0212
20/11/0040/0209
]0/11/0040/0044
'20/U/OO40/0189
20/11/0040/0049
20/11/0040/0048
20/11/0040/0224
20/11/0040/0210
20/11/0040/0227
20/11/0040}0221
20/11/0040/0222
20/11/0040/0217
20/11/0040/0232
20/11/0040/0229
20/11/0040/0183
20/11/0~40/020.s
20/11/oot0/020S
:ZO/ll/OaW!Oll3~
20/11/0040/0219
20/11/0040/0245
20/ ll/OJ~O/OJ ~O
1981 Ceo!Us
s
17/11/4/169'
17/H/4f\2~
11/11/4/146
17/11/4j54
17/1If4/177
17/11/4/158
17/1114/130
..J7J1 1J4,1l44
17/11/4/149
17/11/4/1J.l
17/11/4/l$r I
11/11~15S
17/1l{4/156
17/1 t,/4/160
17/1~/4/S6
17/11/~/r7,8'
17/11/4r.~8
11!lli4is7\
17/11/4/126
17/11/4/H9
17/11/4/128
17111/4/134
17/11/4/132
17/11/4/16~
17/11/4/141
17/11/4/129
17/11/4/187
1711114/182
7/11/4/181
17/11/4/pJ
17/11/4/137 17/11/4/154
6
17/1110040/0169
17/\ 1/01>40/0123
11(1110040/0146
11/11/0040/00S4
7/t 1/0040/0117 , . 7/1l/00~O/0153 . '.
7/11/0040/0130
.2)1 ,,-o.lli_ 1/11/0040/0149
7/1110040/0121
7/1 I 10MU/at s;
7/11/004010055
17/q/OO40/01S6
17/1 1/0 ()'OJ(J16()
17/11/00'9/0JS6
'17/Il{OO40/0173
17[IlIO'J!O/0()58
171 11 fO("O/oOS 7
"~1/0~~()/OI26
11/u7~lolSg -'" 17/H/OJ40/0128 "'
I7/1lI0040/0IJ4
11/It/OO~o/a 132
l71 U/O~~0/Ol63
17/11/0310/0141
" 17/11/0J10/OI2g
1 Tll'l/fmO/Ol87
1 T/11/00~O/0182
H/ll/OlI0/018l
l1JllJO)~0f017~
.l1/1l/0JIO/013T
17/11/0)40/0lSt
17/11/4/52 - .17/1l/0J~O/0)52

Sr. Name of village No. (wifu !1adbast N9.)
1 2
34 Gurney Kalan (42) ., 35 Gurney Khutd (43)
36 Hakarnwala (136) , , .... ,. 37 Hassanpur (44)
"1"
38 Heron Khurd (33)
39 Jalwehra '(162)
40 Jitgarh Urf Biroke ~41) KlTntd" •
11,1 J013n '(129)
42 Juglan (177)
43 Kahangarh (176).
44 KanakWala Chahlan (34}
45 Karipul' (230)
'"46 I<esanllftlr Chhimr (130)
-47 Khatriwala (169,)-
48 :&biwa Mihan Si$ (32)" Urf Samundgafh
'tv:' r :- .....
49 'Khudal Kalan (174) t'l r~'" .,. "
SO Khudal SekhpuI (172) ~ ~ ;Y ~
51 Kisllaligarh Urf (170) Sodhs'SDlghwlIla' .•
52 -Kulabrj (233)
53 Kulana (227)
54 Kularian (179)
55' l.JlkbiwaJa (148)
5,6 Mal Singhwala (f38)
57 Malakpur Bhimra (135)
58 Malkol'J (159)
59 Mander (178)
60 Mandhali (125)
61 Mugbanian (145)
62 Phuluwala Dod (224)
63 'PhuJuw~la Dogran (231)
M Pipliao (126)
'63 Rali (222J
f52
ALPHABETICAL LIST OF VILLAGEs
BUDHLADA c. Q. BLOCK
4
Mansa Tahsil (Part)
20/11/4/51 . , 20/11/4(.5;2
20/11/4/185 ... ..... ~
20/11/4i~3
20/11/4/~9
20/11/4/234 . " 20/11 {41S0
t-
201 1114) IT'l
20/11/4/2~2
20/11!4{24!
~011114~1
... 2011-1/4/196
20/11/4/190:
-10/1114/211
20/11/4/38
iO/11/4/240 ('"" ..flt
20/11 {4/239 ~ !'
- 20/Il/4/23ff .. ~~
'20/11/4{193~
20/11/4/199.
·20lll/4/24<t
20/11/4) 187.
20/11/4/~L
20/11}4/1Sf,
20/11/4/11)3
20/11/4/243
20/11/4/17.6
20/11/4/Z04..
20/11/4/220
20/11/4/195
20/11/4/177
'lO/lf/4/226
20/11/0040/0051 ~ ..,
to/11/0040{0052
20/11/0040{0185
20/11/0040{0053
20/11(0040/0039
20/11/0040/0234 • 2,0/11/0040/0050 " 201\1/(\04010119
20/11/0040/0242
~O/lljOO40/0241
_20/11/oo40/0041
, ~0711/00_40/0196
'1.0/11/0040/0190
-20/11/0040)0231
':l0/11/0040/oo38
ZO{ 11/0040/0240
-zoL 11/0040/0239
'1.0/11/0040/0236 --2.0/11/0040/0193
2.0/11/0040/0199
,2O/11/0040/oi44
~oJllJ004010187
20/11/0040/0191
".2.0/11/0040/0184
20/11/0040/0163
2:,.0/11/0040/0243
20(1 !/}J~JI0176
20} 11{O,}40/0204
20/.l1/OO40j0120
20/11;0040/0195
20/11/0040/0171
ZOr lili1J'lO/OZ26
1981-~, '~ .. " • ..._..a;~%..... __ _
Location Location Coda COda (Manual) (Computar)
5
17{1l/4/GO
17/11/4/61 -"
17/11/4/184
17/11/4102
17/1f/4/50
17/11/4/139 ~~
17/11/4/59
1711\l4111~-
17/11/4/151
17/11/4/150
17/11/4/53
l7/tI/4/125,
17)41/1/176
17/1114Jl~~
17/11/4/51
l1Ill/4/148
17 /11}4{147~
17/11/'l/i45·
17/11/4/122
17{Hj4/13S-.
171.11/AfI53
17}1l}4}fA9
17/11/4/173."
17/1 J /4/185
l7/1 li41lg~
17/11/1/l52
lJ/11/4{U9
17)11/4/163
17 j 1l}4{ 136
17/lHi}}j.}
17t!l/~/ ll\)
17!11f!l/131-
6
... -1: +-17/1170040/0060 , 11(1l/0940/006~
17 it l10040{0184
" 17/11/0040/0062'
l7(i 1/0040/0050-
11/11/0040/0139 , 17 ftl/0040/oo59"
} U1 flqg~o/O} 7S
.H{l~/.f}~f!/Ol~1
17/P/R~~O/OI,s(}
17/1J.lqo10/09~3
l,(trtLqg~,O/0~~5
J 7jl,gQM,O/O~lG
~1{ll1oqW/{l.I43
·1 Tf J !./OOlO/OQ51
17{11/004IJ/0148
"r1 / 1 i/OJ40/ 0 J 4 7
1~/ll/0d'4O!o145
P/JJLOiJW/Ol~
QllJ./!J:t4SJ/0135
P/Ul901Q(Oli;3
p,lH10;)lQ!Ol~i)
17jl!1Q010/01:J3
t1/11{Q°l2101~5
17LWjP~/OI~~
17/ WRJt.-J/Jl52
17/llN~4~OlP
1.]11l!(}~~ }fO ~ 63
17/wrJL~/O~~6
+7/W~iq/V!~4 17/Ilfq~4Jrvl~v
17/11/0JD/0131'

153
.4.LBHABETICAL LIST OF VILLAGES
BUDHLADA C. D. BLOCK
1991 Censlls 1981 Censu9 Sr. Name of village • _-......... -------.--------.--No. (\'\lith Hadbast No.) Location Location Location Location
Code Code Code Code (Manual) (Computer) ,(Manual) (Computer)
1 2 3 4 5 6
M~nsa Tahsil (Part)
66" Ram Nagar (139) 20/11/4/197 20/11/0040/0197 17/11/4/172 17/11/0040/0172 Bhatblan
67 Rampur Mander (140) 20/11/4/198 20/11/0040/0198 17/11/4/171 17/11/0040/0171
68 Ramgarh (226) 20/11/4/223 20/11/0040/0223 17/11J4J133 17 1fI/OO4O/0133
69 Ramgarb Shah 20/11/4/214 2Wl1/oo40/0214 17/11/4/157 17/11/0040/0157 Purian (158) t
70 RanBhrial (166) 20/1l/4J230 20/11/0040/0230 17/11/4/142 17/11/0040/0142
71 Reond Kalan (152) 20/11/4/207 20/11/0040/0211J7 17/11/4/162 17/11/0040/0162
72 Reond Khurd (153) 20/1I/4J208 20/11/0040/0208 17111/4/161 17/11/0040/0161-
73 Saidewala (144) 20/11/4/202 20/11/0040/0202 17/llJ4/165 17/11/0040/0165-
74 Sandli (133) 20/11/4/182 20/11/0040/0182 17/11J4/188 17/11/0040/0188
7S Sanghreri (163) 20/11/4/218 20/11/0040/0218 17/11/4/138 17/11/0040/0138
76 Saswal( (143) 20/11/4/216 20/11/0040/0216 17/11/4/166 17/11/0040/0166
77 Satike (141) 20/11/4/200 20/11/0040/0200 17/11/4/170 17111/0040/0170
78 Sher Khanwala (146) 2tJ/U/4J203 20/11/0040/0203 17/11/4/164 17/11/004010164
79 Sirslwala (165) 20/1l/4j233 20/11/0040/0233 17JIl/4/140 17/11/0040/0140
80 'lahlian (128) 20/11/4/178 20/11/0040/0178 17/11/4/174 17/11 /0040/0174
81 Talabwala (149) ~0/11/4/186 20/11/0040/0186 17Jll/4/183 17 J 1110040/0'183 ~
82 Ta]wandi (228~ 20/11/4/22S 29/11/0040/0225 17 Jll/4/127 17Jl1/0040/0127
83 Todarpur (160) 20/11/4/215 20/11/0040J0215 17JllJ4J167 17JllJOO40/0167
84 Udat Saidewala (132) 20Jl1/4J181 20JllJ0040/0181 17/11J4J186 17/11/0040/0186


IS5
· -:VJlt'bAGE DmE~TOR¥ BUDHLADA C.D. BLOCIk
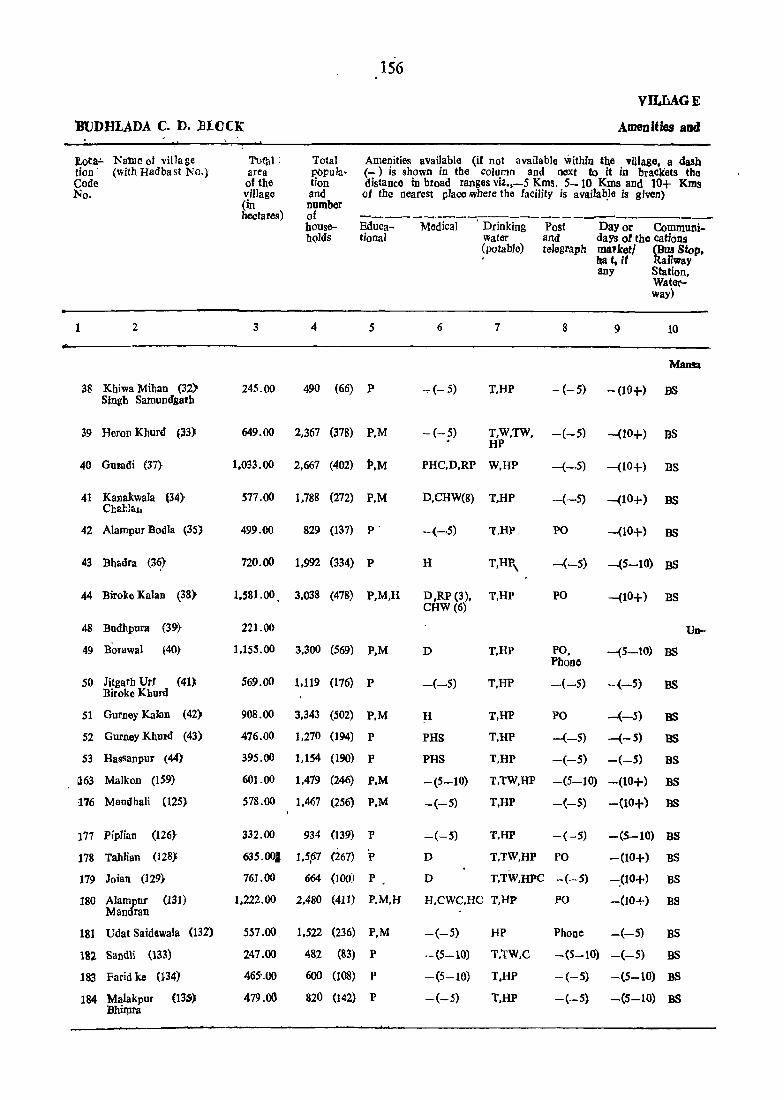
156
'BUDHLADA C. D • .BlUCK
VILMGE
Amenities aDd
toea.!. Natne of viIla &e tion· (with Hadbast No.} Code No.
2
38 Khiwa Mihan (32) Singh Samundgarh
39 Heron Khurd (33)
40 Gumdi (37)
41 KaJlakwaJa (34) Chal:laI.
42 Alampur BadIa (3S)
43 Bhadra (3~'
44 Birolce Kalan (38)
48 Budhpura (39}
49 Borawal (40}
50 Jitgarh Urt (4l) Biroke Khurd
51 Gurney Kalan (42)
52 Gurney Khufd (43)
53 Hassanpur (44)
1163 Malkon (159)
1'76 Mandhali (125)
177 Piplian (126)
178 Tahlian (l2S}
179 Joian (129}
180 Alampur (131) Mandran
181 Udat SaidewaJa (131)
182 Sandli (133)
183 Farid ke (134)
184 MaJakpul (l3S) Bhirpra
Ttlfll) ; area of the village (in hectares)
Total pbpula" tion and number of bousehQlds
Amenities available (it not available within the village, a dash (-) is shown in the column and next to it in brackets the distance in broad ranges viz.,-5 Kms. 5-10 Kms and 10+ Kms at the nearest place ,where the facility is avai}a~le is given)
~~~-~~;l-~Dri~~~-P~t--D~o~-C;~~ni-tional water and dayS ot the cations
3 4 5
245.00 490 (66) P
649.00 2,367 (378) P,M
1,033.00 2,667 (402) P.M
577.00 1.788 (272) P.M
499.00 829 (137) p.
720.00 1.992 (334) P
6
..,.(-5)
(potable) telegraph mapker/ (Bus Stop, , ha t, if ltaiJway
7
T,HP
8
any Station.
9
Waterway)
10
Mansa
- (- 5) - (to+) as
T,W.TW. -(-5) -(10+) BS HP
PHC,D.RP W.HP -{-5) -(10+> BS
D.CHW(8) T,HP -{-5) -(10+) BS
-(-5) 'l.HP PO -(10+) as
H -(-5) -(5-10) BS
1,581.00. 3.038 (478) P.M,H D,RP (3), T,HP CHW (6)
PO -(10+) as
221.00
1.155.00 3.300 (569) P.M
569.00 1,119 (176) P
908.00 3,343 (502) P.M
476.00 1.270 (194) P
395.00 1,154 (190) P
60}.00 1.479 (246) P.M
578.00 1,467 (256) P.M
332.00 934 (139) P
635 .00' 1.5~7 (267) P
761.00 664 (100) P
D
-(-5)
H
PHS
PHS
-(5-10)
-(-5)
-(-5)
D
D
T,HP
T.HP
T,HP
T.RP
T.RP
PO. Phone
-(5-10) BS
-(-5) -(-5) BS
PO --(-5) BS
-(-5) -(-5) BS
-(-5) -(-5) BS
T,TW,HP -(5-10) -(10+) BS
T.HP -(-5) -(to+) BS
1'.HP -(-5) -(5-10) BS
T.TW,HP PO -(10+) BS
T.TW.HPC -(-5) -.(10+) BS
1,222.00 2.480 (411) P.M.H H.CWC.HC T.HP PO -(10+) BS
557.00, 1.522 (236) P.M -(-5) HP Phone -(-5) BS
247.00 482 (83) P -(5-10) T.TW.C -(5-10) -(-5) BS
465'.00 6(JO (108) P -(5-10) T.HP -(-5) -(5-10):OS
479.00 820 (142) P -(-5) T.HP -(-5) -(5-10) BS

DIRECTORV ;-""'WtI. - "'" ,.,.._ ,
~duse
1~
Nearest to.wn & aistance 0,9 ~.~:)
12
TabsU (Part)
PR Budhlada
p~ Budh}ad~
PR Budblada
(8)
(10)
(10
PR SUnan1 (14)
PR Sun am '(14)
PR BUdhlaaa (10)
PR BI}"~Ia~\i (8)
inhaO,i,ted
PR Budblad\i (8)
I
PR Budq!ad\l (4)
PR Bud~ad~ (3)
FR BUdh,)a~ (3)
PR Budblada (5)
PR, Blildblaaa (17)
PR BlldhJada (ll~
PR Mania (10)
PR Bu«Iilua (10)
PR Budhlada (10) . PR Budb~ad~ (12)
PR B~?)l)~ (13)
PR Budhlada (14)
PR Mansa (26)
PIt Budh'lada (IS)
'"
Powar Su,ppiY
13
ED.EAG
.oft
EA
EA
EA
-EA !,
ED,EAG
EA
EA
"EA
EA
ED.EAG
EA
EA
EA
EA
EA
EA
EA . EA
EA
EA
157
Land use ,.(i.e. area. under different types of land usc in hectares rounded )l'p~o two 4<}~cjJ!lal places) _______ --..1i..,o_--...-__ ~ ______ , .,_
]'?pres! • -]iri!ated by sol1tce 'PI!- Cultur'- Area not .• JrrJ- able aVailable
gated waste tor cuJti.. (includ- vation iog -gauchar and groves)
14 15 16 17 18 ~ ~
.. T(146.00}. GC(103.00). TW(43 .00) 84.00 15.00
.. T(573.00),GC(512.00). TW143 .00)1 76.00 t'.WE(18.oo) -
.. 'Ti718.00).GG(5~.OO).TW((63. 00). 229.00 2.qo 84.QO rWE(65:00)
.. T(521.00).GC(365 .OO).TW(116 .00). 11.00 45.00 TWE(40.00)
~397 ,OO}~'(238 :O!T).TW(YOI .00), TWE(S8.~
71·00 31.00
. . 1$07 .OO).GC(27S .~}.TW(243 .00). 59·W 2·09 52.00 TWE(89.00) •
.. ~
., 'T(747 .00), GC(723~.OO),TW(t4 .00) 724.00 110.00
., t(900.00).G~556.l1o).TW(202.oo), IJ5.00 4.00 136.00 DNB(142.00),
.. T(529.00). GC(412.00).lW(80.QO). TWE~37.00)
3.00 --37.00
., 'T(761.00), GC(425.00). TW(336.00) 44.00 103.00 ~
., T(428.00).GC(~10.00).TW(l18 .00) 11.00 37.00
., T(248.oo).GC(10't.bO).TIV(t44.00) 88.00 59.00
.. T(442. OO).~~41~: ()Q/.T~(24. 00) 97·90 fo2.(l!I
.. ,T(403 .00).tGh(361;W).TWiJ9. 00). 88.00 R09 'IWE(12.00) '-, "
.. T(222.00).Gq19l·<>..\9·T~~25.()0} 68.00 • 1-2·FIJ
., T~4S2.oo).GC.(45~ ..oo,l.T.W,(1. 00) 134.00 49·90
.. T(373.00).-GR(31,3.~<)!}).T~i~0.00) 324.00 ~.~
.. T(973.oo), Gq(968.00),TW(5.oo) 131.00 118.00
T(SlS.OO).GC(487 .OO).TW(28 .OO} . :~ 42.00
.. 1'(226.00). GC(226.00) 2.00 19.00
.. ,[(290.00). ~(2~9&9) 129,.QO 16.QO
.. 1X274.00). G<{;(27.f,~) 175.~ ~9.~~

158
VILLAGE
_ BUD "LADA C. D. BLOCK Amenities and
toea- Name of village :tion (with Hadbast No, .). c6de -No.
1 2
185 Hakarnwala (136)
186 Talabwala (149)
181 Lakhiwala (148)
188- Ganiwala (147)
189 Boha (137)
190 Kesarnpur ehhina "'(130)
191 Mal Singbwala (138)
192 Barah (127)
193 Kulahri (233)
194 A,hmadpur (232)
195 PhuJuwala (231) Dogran
1~6 Karipur (230)
197 Ram Nagar (139) Bhathlan. .
Total area of the vi\\age (in hectares)
Totttl poplliation and number of
Ame,nities a.vailable (if not available. w~thin the villgge a dash (- ) IS shown In the column and next to It In brackets the distan::e in broad ranges viz,-S klns., 5-]0 kms., !lnd lO+t.:ms ,ofthe nearest pl~ce where the facility is ayailable is give!\)
3
households'
4
Educational
5
856.00 2.105 (333) P
445.00 1.007 (179) P
370.00 530. (101) P
735.00 12.75 (218) P
3,825.00 8.258 (1395) PO). M(2). H(2)
399.00 1.191 (169) P
678.00 1.658 (275) P
2.i80.00 4.396 (686) P.M.H
490.00 1.413 (235) P
1'639.00 3,646 (632) P.M
821.00 1.313 (210) P ,
446.00 1. 795 (301) P
519,00 1.429 (234) P
Medical
-(-5)
-(-5)
Cwc
Mew
Drinking water (potable)
7 •
Post and telegraph
8
T.TW.HP.C -(-5)
T.TW.HP, -(-5)
T.HP -(-5)
T.TW.HP.e -(-5)
Da)'Qr da)S of the market/ hat, if allY ,
9
-(-5)
-(-5)
'-(-5)
-(-5)
Communications (bus Stop railway station waterway) -
10
Ma.QS8
-(-S)
(-5)
BS
BS'
MH. ewe. T.HP.e D, FPC
PTO, Phone
-(5,-10) BS
ewe
-(-5)
T.HP.e
T.HP
-(5-10) BS
-(5-10) BS
Mew. ewe T.RP HC.D
-(-5)
!__(-5)
PO. Phone
-(5-10) BS
ewc
·D
.... (-5)
- (-5)
..:..(- S)
r:rW.HP -(-5) -(5-10):aS ~
T.RP PO, -(-5) BS Phone
T.HP
T
T.e
-(-S) -(- 5)
- (-5) - (- 5)
- (-5}. - (-5)
BS
- (- 5)
1'98 Rarnpur Mandcl (140) 736.00 2·}22 (350) oM -(- 5) T.C - (- 5) - (5~ H». BS
199 Kul~na (227) 1.040.00 2.080 (355) 'P.M
200 .Sati Ke (141)
201 A,chank (142)
202 Saidewala (144)'
203 Shar Khanwala (146)
2~ Mughanian (145)
205 Gaodh Khurd (151)
206 Gandh Kalan (150)
490.00 1m (161) P
571.00 1.272 (191) .P
659.00 1.578 (275) P.M
804.00 1.586 (254) P
698.00 1.694 (294) P
435.00 1.080 (182) P
458.00 851 (127) P
-- (5-10)
-(10+ )
- (10+)
-(10+)
-(-5)
H,D
'CWC.RP
D'
207 Reond Kalan (152)" H99.00 2.790 (~61) p. M. H RP'
TiW.TW. Hr
- (5-10) - (5-10). - (-5)
T.TW.HP -(-5) -(10+) BS '.
T.TW.HP -::-(10+) -(10+) BS
T,W.TW, PO --(10+) BS HP
T.W.TW. - (- 5) - (- 5) BS HP.e
T.W.TW.C PTO. - (5-10) BS Pholle
T.TW.HP.C - (- 5) -t5-1U) "BS
1. C .).>0 -(~5) -(-5)
T.HP.e PO -(5-10) BS
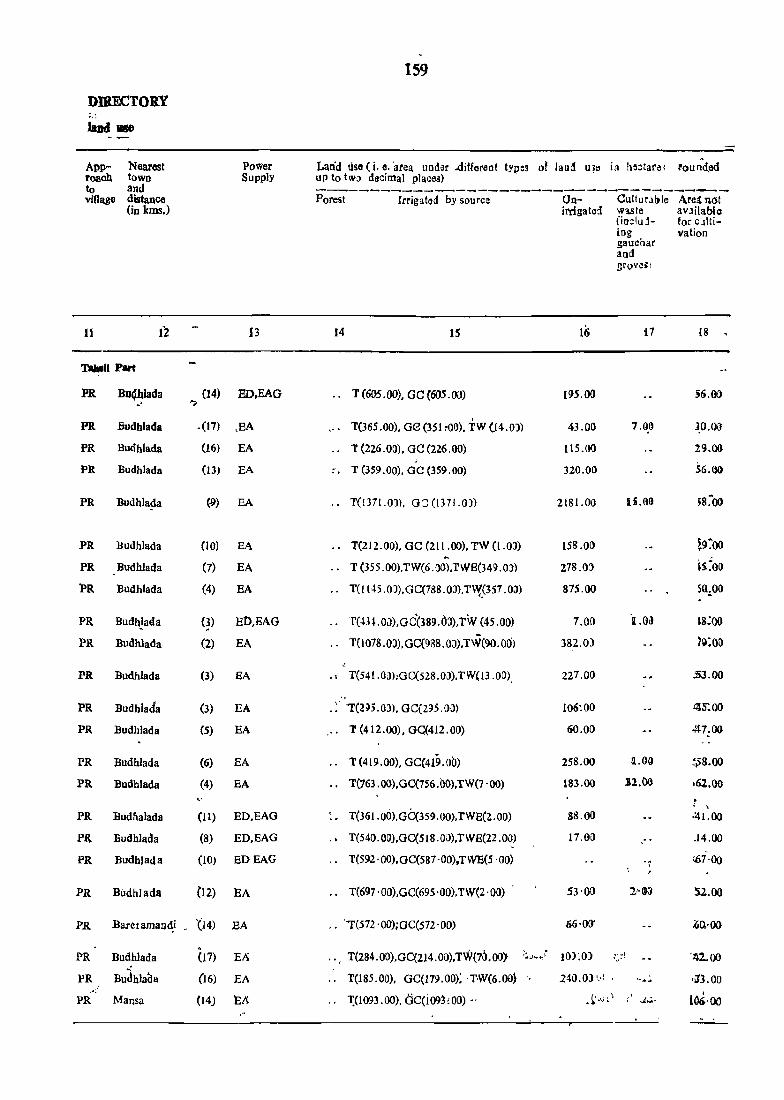
DIRECTORY
Appl'oach to vi11agc
Nearest town and distance (in kms.)
11 12
Talr.til Part
PR Bu4hJada _,
PR BUdhlada
PR Budhlada
PR Budhlada
PR Budhla~a
PR Budhlada
PR Budhlada
PR BUdhlada
PR Budhlada
PR Budhlada
PR Budhlada
PR BUdblada
PR BudbJada
PR Budhlada
.PR Budhlada
PR Budnalada
PR Budblada
PR Budhlada
PR Bildhlada
PR Baretamandi
PR Budhlada
PR BudblaiJa .. -:'
PR Mansa
(14) ?
.(17)
(16)
(13)
(~)
(10)
(7)
(4)
(~)
(2)
(3)
(3)
(5)
(6)
(4)
(11)
(8)
(10)
(12)
'(14)
(17)
(16)
(14)
Power Supply
13
ED,EAG
,EA
EA
EA
EA
EA
EA
EA
Et>,EAG
EA
EA
EA
EA
EA
EA
ED,EAG
ED.EAG
EDEAG
EA
EA
EA
EA
EA
159
. Land use (i. e. 'area under .different type3 o! land U13 in he~tat"H ~ound~d up to tW() dl'lcimal places) .
Forest Irrigated by s()urce
14 IS
.. T (605.00), GC (605.00)
T(365.00). GC (351 ~OO). TW (14.0)
.. T (226.00). GC(226.00)
.. T (359.00). GC (359.00)
.. T(!371.0J), GJ (1371.0)
.. T(212.00). GC (211.00). TW (1.0J) -.. T (355 .00).TW(6.00),TWB(349.0)
.. T(114S .0).GC(788.0),T\\;,.(357 .OJ)
f(,m.OJ),GC(389.0J),TW (45.00)
.. T(1078.0»,GC{988.0J),TW(90.00>
. \ T(541.0l));GC(528.0J).TW(13.00),
"
.: 'T(2~5.0)), GC(295.00)
.. l' (412.00), GG(412.00)
.. 1'(419.00), GC(419.00)
.. 1'(163 .OO),GC(756.00),TW(7 '00)
.. T(361.00),GC(359.00).TWB(2.00)
.. T(540. OO).GC(518 .OJ).T WB(22 .00)
.. T(592· 00),GC(587 . OO),TWE(5 '00)
1'(697' OO),GC(695 'OO),TW(2' 00)
.. '"T(572 ·00)iGC(S72 ,00)
", T(284.00).GC(214.00).T\V(70.00)· ~...; ... ot';\.
T(185.00). GC(179.00); T,W(6.oo}
"I:(1093 .00). GC(i093:00) "
Unirrigate:i
16
195.00
43.00
llS.OO
no.oo
2181.00
ISS ,00
278.0)
875.00
7.00
382.0)
227.00
106:00
60.00
258.00
183.00
88.00
17.00
53·00
(;6'00'
lO}~O)
24i).O;h~ .
CultuulJle w1Ste (in:iu jing gauchar and !lrove~1
i7
7.~O
n.a()
'fl.OI}
1l.(}Q
.!2.00
, ,
21'@)
,~:I
\ .... .:. .~,,\,u\ ~. t ..,/.,;,..
Areino! aV3ilablc for c'lltivation
18
j~.e{)
l,O.OO
19.00
56.00
58~OO
~9:00
'.s.~O()
50.;00
.s;()()
?~:OO
Sl_oo
,;)5:00
-147:00
~';8.00
.61.00 . ; , ~1.00
.14.00
(67'00
52.00
.00-'00
'U.OO
1.13.00
l06·00

,¥P VILLAGE
BUDHLADA C. D. BLOCK 'Amenities ~ ~"
lQca- Name of village Total Total Amenities available (if not available wit'11n thf t1illlille,. a dash tien (with Hadbast No.) area popu1a- (-) is sho",n in Jlolumn and nellt to it in braakets ~~slistan~ in Code of the tion broad faflges viz., -5 kms. 5-1(J kms, and 10 + • s, df . the
- N6. village and- ~eareg.t place whore tbe facility is available is givan) , , (in humber hectares) of
-------------------------------~-bouse- Educa- Medical Drinking Post Payor Communi_ holds tiona! water & days cations
(potable) te1e:. of tba (bus graph market! stop.
'bat. if railway any station.
water-\"ay)
1 2 3 I 4 5 6 7 8 9 10 ~
M'II . I
-(1'0+) 208 Reond Khurd (153) 473.00 814 (133) P -(10+) T.RP.C ~(-5) BS_ ,
209 Birewala Dogran (154) 741.00 1.229 t226) P ewe T. W. TW. -(~5) -(1"+ ) BS' HP.C
21Q Chak Alisher (156) 400.00 1,288 (191) -(;:-5) ,
J! eWC.HC. T.RP -(10+) BS PHe.D
21] Bhawa (I5S) 794.00 i 1.358 (236) p ewc T. HP -~S-5) -(5-10). BS
. 212 Bhakbrial (159) 254.00 793 (144) P -(10+). T.e -(-5) -(5-10) -(-$)
213 Andianwali (IS1) 434.{}9 !)~2 (.1~) r -(10+) T.HP.e -(-5) -(10+) BS
214 Ramgarh Shah Purian .
(1S~) 354.00 939 117.0) P,.M, fI -(-5) T.HP.e -(-5) -(-5) BS
215 Todarpur (160) 343.00 ·357 {62) P -{-5) T.HP,G ......,(,-5) --t5-l.Q) BS
~tp Sas\\aIi (143) 329.00 57';. ~93) P -(10-1" ) T. HP.C -(;:-5) -\5-10) BS ,~ f
247 Dharatppur3 (161) 1.842.00 3.7{J5 (599) .P. M, H Ji. He. PHS T, HP,C PO -(-5) BS
218 Sanghrari (163) 340.00 820 (141) p ewe T:TW. HP -(-5) -(-5) BS
21~ Gobindpura (164) 643.00 L3S1 (233) P.M ewc T, TW.4;lP -(-5) -.(-5) BS
220 Phulu\Yil1a Dod (?74) 464.00 946 ~171~ P .ewc T. TW.ft.P -(·-5) -(5-10) BS.RS e . ,
221 Dariapur (~5) 395.00 1.080 (162) P '-(-.5) T.HP -(-5) --:>(-5 -"10) BS
222 Datew~ ,(223) 1,016.00 2.220 .(41~) ~.M D 1. lIP -J-5) -(5-10) BS . 1.23 Ramgar)l (226) 331.00 ~8, g7~ P -(-5) T.HP -(-5) -(-5) -(-5)
224 Budblada (Rural) (229) 2.035.00 7.980 (1416) P(14).M(10). H. MH. T.liP PTO Daily BS.RS Hp),pUC(3) He, ewe. Phone
•• FPC
225 Talwandi (228) 367.00 9 (I) -{-~) -(-5) HI> ......;(_5) -.(-5) -(-5)
226 Rali (222) 850.00 i.3~5 (367) p.-M -.(-5) T.H4' .-(-5) 4-;.5) -L-5}
227 Cbaka,n .(Q21) 782.00 10;1.89 {f06) f _(_5) T. TW.ljP PO. -(-5) BS t>-h()oe
I
~ Bachho,ana (220) 1.798.00 4.519 P~3) P.,H D T.HP PO. iP'bOne
-(-5) BS
22-9 Dodra (219) l,llS'QO J.(1;O~ ~~OJ ,. D T; TW, I;JP P'Q -(10+) BS
2'0 RaagltriaJ (166) 966.~O ~ •• ?63 J3S4) f eWC,D T.W.HP P9 --;(19+) BS
ZSl KhatJ:iwala (169) 473.00 1.281 ,(~~ .p -.(--5) T. TW.):I..p.e :-:;"(-5) -(--5) as

16i
DIRECTORY
land use
App- Nearest Power Land use (i. e. area under different types of Jand Ilse in hectares' rounded up to roach town Supply two decimal places) to aod village distance
(in kms.)
- ~-----Forest Jnjgated by 'source Un- Cultur- Area not
irri- able available gated waste for culti-
(inc1l1d- vation ing) gauchar and gro'l33)
il 12 13 14 15 16 17 IS'
Tahsil Part
PR Mansa (8) EA 1(411. 00). GC(411. 00) 62·00
PR Bareta Mandi (14) EA 1(375.00). GC(321.00). TWE(54.00) '195.00 123.0:) 48.QO
PR Barela Mandi (12) EA T(239.00). GC(237.00). TWE(2.00) 123.0~ 38.0J
I
fiR Ba teta Mandi (10) ED. BAG T(437.00). GC{328.00). TWE(109.00) 308.00 '" 49.0)
PR Barcta Mandi (1l) EA ,. T(193.00). GC(176.00). TWE(17.00) 36.00 .. 25.0) I
PR Bareta Mandi (11) ED.EAG T(310.oo). GC(280.00). TW(30.00) 69.0~ 55.0J
J'R Barcta Mandi (16) EA T(297.00). GC(297.00) 25.0) 32.0)
PR Bareta Mandi (7) EA T(267.00) GC(266.00). TW(I.OO) 41.0) 35.0J
PR Budhlada (10) tA T(268.o.~). GC(268.00) 33.00 28.0J
PR Bareta Mandi (5) EA T(1483 .00). GC(l46 1. 00).TW(22. 00) 53:00 139.00 167.0n
PR Barcta Mandi (3) EA T(247.00), GC(238.00). TW(9.00) P 62.0) j:OO 28.00
pR Bareta Mandi (5) ED,EAG .. ~(260.00). GC(260.00) 31\0. OJ 4.00 39.00
PR Budhlada (10) ED. BAG ., T(176.00). GC(l72.00), TW(4.00). 238.0) 15.00 3~.OO
PR 13udhla1."!a (8) EA T(193.00), GC(l 87. 00), TW(6.00) i63.0\) 39.00·
PR Budhlada (7) EA II T(603.00).,GC(5S0.00), TW(23.00) 334.00 3.00 16.00
PR Budhlada (5) ED T(204 .00). GC(198.00). TW(6.00) 84.00 43.00
PR Budhlada (0) EA .. T(1l51.00). GC(1l02.00). TW(4J.OJ) 531.00 353.00
. " , PR Budhlada ,(2) EA ,." 1(305.00). GC(305.00) 60.00 " 2.00
PR Budhlada (3) ED. EAG " .. T(421.00), GC(416.00, TWE(5 .00) 342.00 . , 8t.00
PR Budhlada (2) ED.EAG "',, T(653 .00). GC(643.0J). TWE(lO .00) 80.00 49.0J
'PR Budhlada (6) EA 1'(1246.00), GC(l240.00). TW(6.00) 416.00 . \ 136.00
I'
PR Budhlada (10) EA 1'(831.00), GC(753 .00), TW(78.00) 293.00 1.0;) 100· ()()
PR Budhlada .(12) EA T(325 .00), GC(321.00). TW(4.00) 599.0) 1. OJ 41'00
PR Barcta Mandi (5) ED,EAG T(408.oo), GC(40B.OO) 13.00 52.00 a5i1i 4
" ,. ,..._~ . .. .-_, ... -,.. - ... -- -
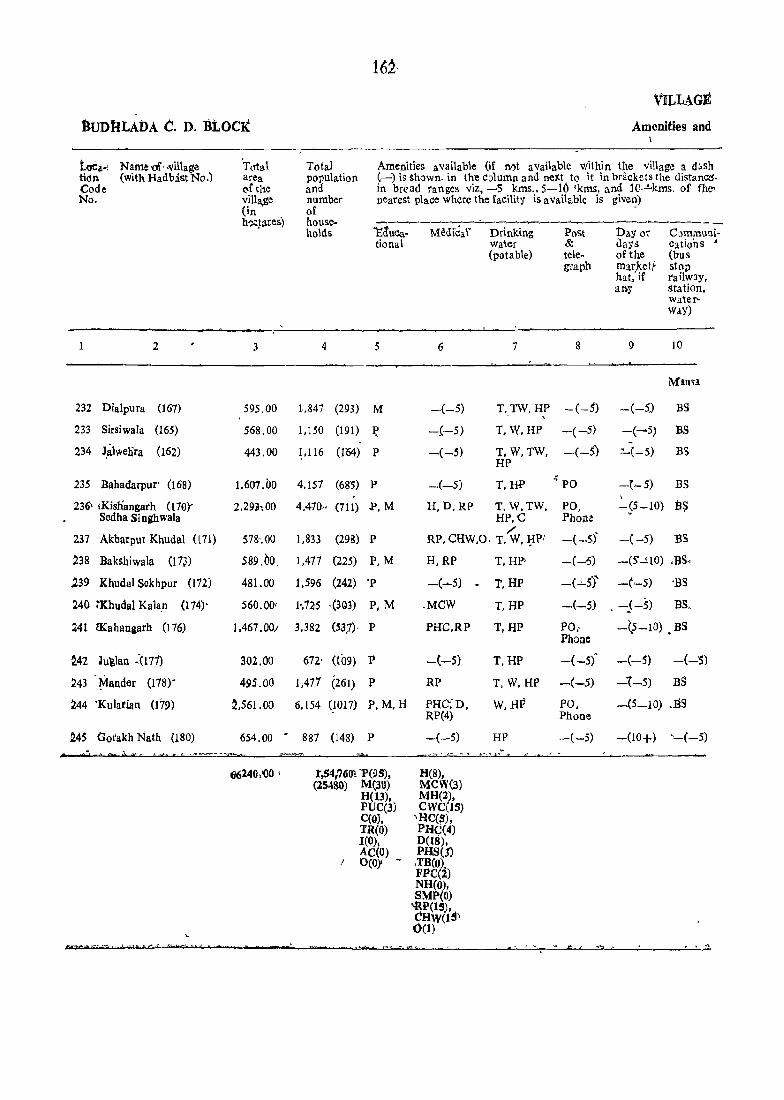
IluOtlLADA C. o. BLOCK
lorla-! Name-of,,,,,mag~ 'Total tion (with Hadbist No.) area Code (}f tlte No. viUa,ge
(in b:~l1!es)
1 2 3
232 Dialpura (167) 59S.00
233 Sirsiwala (165) 568.00
234 J,alwenra (162) 443.00
235 Bahadarpur' (168) 1.607.00
236' (Kisnangarh (170" 2.293,00 Sedha Singhwala
237 Akharpur Kbudal (171) 57&\00
238 Bakshiwala (lm 589.bo,
.239 Khudal Sekhpur (172) 481.00
240 !Kbudal Kala,n (174)' 560.00'
241 l'Kabangarh (176) 1.467.00/
M2 Ju'glan :(171) 302.00
243 '~ander (178)' 495.00
244 'Kulatian (1'19) ~,561.00
~4$ Gol'akh Nath (180) 654.00 .
66240,ilO \
m' .. -n1'-·~-·i-~i.- .... .lCf.dis· VIS+ *t
16~,
V]LLAGE
Amenities and \
Total Amenities available (if not aVailable within the village a d~sh population c-) is ~hown, in the column and next to it in brackets the distanCC!·
in br<rad ranges viz, -'5 kms"5-10 'kms, and lO...!.kms, of th~ and number nearest place where the faC:ilit1 is available is give~) of house-
_ __.__,.-___ .--o _ _:..,......-__ ...-.--__ __.__ _____ __. _______
holds "E:uuC!a-tional
4 5
].,847 (293) M
1,150 (191) ~
1.116 (1'64) P
4,157 (685) P
4,4-70" (71I) P.M
1,833 (298) P
1.477 (225) p. M
1.596 (242) 'P
1-,725 .(3Q3) P, M
3,382 (53.1), P
672' (109) P
1;477 (261) P
6.154 <,1017) P,M,H
887 (148) P
r.54,o60'l 'F(95), (25480) M(38)
H(13). PUC(3) c(oJ. TR(O) 1(0), AC(O)
I 0(0)' -
Medical' Drinking water (potable)
6 7
-(-5) T, TW.HP . , -{-5) 1,W,HP
-(-5) T.W,TW, HP
-(-5) T,HP
H,D,RP T,W,TW, HP,C
/' RP, CHW,Q, T, W, :tIP;
H,RP
-(~S)
.MCW
PHC.RP
-(-5)
RP PHC;'D. RP(4)
-(-5)
H(R), MCW(3) MH(2), CWC(lS)
'He(S). PHC(4) 0(18), PHS(3) ,TB(O) FPe(l) NH(O). SMP(O)
'RP(15), CHW(lS\ O(t)
T,HP'
. T,HP
T,HP
T,HP
T. HP
T, W. HP
W,HP
HP ~"".' ." ,
• "-"b1 , .... ." ... -.
PoSt ba10r C;'Mmuni-& itays Cations I
tele- of the (bus g,'aph mlr,ketf
hat. if stop taiIwly,
any station. water~ WaY)
8 9 10
Mallu
-(-5) -(-5) BS
-(-5) -(-5) BS -
-(-5) .1-(-S) BS
"PO -{-5) BS I
PO, -S5-10) 13$ Phone
-(-$) -(-5) 13S
-(-~) -(S..!.lO) .BS<
-(~5)"- -C-5) 'BS
-(-5) -(-5) . ~ BS,
POI -(5-10) • BS Phone
-(-5f -(-5) -(-'5)
-(-5) -l-5) BS
PO, -(5-10) .BS Phone
-(-5) -(10+) '-(-S)
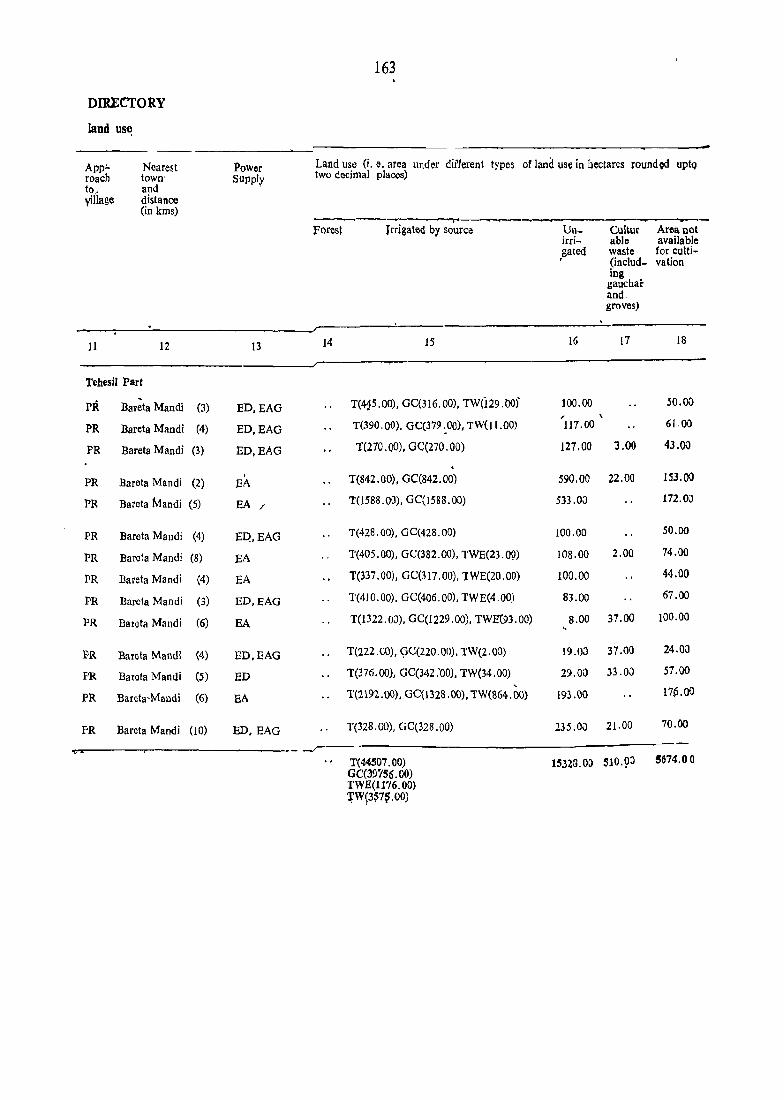
163
DIRECfORY
land US~
App:.. Nearest Power Land use (i. e. area under different typos of land use in bectarcs roundod uptQ roach town' Supply two decimal places) to, and Village distance
(in kms)
forest Jrrigated by so~rce Un- Cultur Arcanot irri- able available gated waste for cUlti-
(ioclud- vatioo ing gauchar and. groves)
11 12 13 14 15 16 17 18
Tehesil Part
PR Bareta Mandi (3) ED,EAG T(415.OO), GC(316.00), TW(129.oof 100.00 50.00 ,
PR Barela Mandi (4) ED,EAG T(390.00), GC(379 ~OO), TW(II.OO) 117.00 61,00
PR Bareta Mandi (3) ED,EAG 1(270.00), GC(270.00) 127.00 '3.00 43.00
PR Barela Mandi ,
T(842.00), GC(842.00} 590,00 22.00 153.00 (2) EA
PR Barela Mandi (5) EA / T(1588 ,00), GC(1588.00) 533.0J I72.0J
PR Barela Mandi (4) EQ,EAG T(428.00), GC(428.00) 100.00 50.00
PR Barela Mandi (8) EA 1'(405.00), GC(382.00), l'WE(23.09) 108.00 2.00 74.00
PR Barela Mandi (4) EA T(337.00), GC(317.00), TWE(20.00) 100.00 44.00
F'R Barcia Mandi (3) ED,EAG 1'(410.00), GC(406.00), TWE(4,00) 83.00 67.00
PR Barata Mandi (6) EA T(1322.00), GC(1229.00), TW£(93.00) 8.00 37.00 100.00
PR Balala Mandi (4) ED,EAG 1(222.00), YC(220.00), 1'W(2.00) 19.03 37.00 24.00
PR Barola Mandi (5) ED 1(376.00), GC(342:00), TW(34.00) 29.00 33.00 57.00
PR Barllta,Maudi (6) EA T(2192.00), GC(1328 .00), TW(864. 00) 193.00 17§.OO
foR Bal'ota Mandi (10) ED,EAG T(328.00), GC(328. 00) 235.0\) 21.00 70.00
__'--'
T( 44507.00) 1532!l.O[) SI0. 0:1 S674.00 GC(39·/S6.00) TWE(1l76.00) l'W\3$7~.OO)

ALPHABETICAL LIST OF VILLAGES ~N lVI.t\.NSA C. D. JJLQCI\


Sr. No.
Name of village (with Hadbast No.)
2
1 Aklia (6)
2 Ali Sher Kalan I (IV
3 Ali Sher Khurd (11)
4 Anupgarh (10)
5 Asr:al (73)
6 AtJa Khurd (18)
7 Atla Kalan (17)
8 Bappiana (47)
9 Barnala (1 1 6)
10 Bhai Desa (71)
11 Bhaini Bagha (59)
12 BhikhJ (20)
13 ~hop~J (16)
14 Bir Khurd (27)
15 }3urj Dhilwan (63)
16. Burj Hari i61)
17 Burj Jhabran (5)
lb Buti Rathi (60)
19 Chaketian~ (117)
.20 • .DaleLSingh_wala (51)
21. Dhalcwan ,(30)
h. Fafre Bhajke (46)
23. Gago,wala - (79)
24 --Gehle (78)
25 Ghal';lognc (SO)
26 Ghumao >Kalan (6~
.27 Uhuinan .Kburd (69)
28 '''hurthati~ (22)
29 <,Hooiirgarhpt, Dhalpai (26)
3~ Heron ltalilD (25)
':31 Hfrewala ([20)
32 Hodla Kalan (31)
AL'1'*BEflCAIJ L'IST 'OKJyJIIDAGIm"
MAN~)c::n.nB£{}OK J
1991 Cansu! 1981 Cflnl1l3
-~--------------Location Location -------------------Codo Cock (Mdnual) ~ * (Computer)
3
MaD!8 Tahsil (PlITt).
20/11/4/15
20/11/4/23
20/11/4/19
20/11/4/22
20/11/4/83
20/11{4/27
20/11/4/18
2Q/l1/4/57
20/11/4/67
20/11/4/3
.20/i'J /4/6
20/11/4/47
20/11/4/17
20/1l/M35
20/11J4JI2
20tLl/4/9
20/Ll/4/13
20/11/4/5
20}ll14/66
291U/4/60
20111/4/45
20/11[4154
20jU/4/86
.20/H/4j87
'20~ 11/4/88
20/11/4/~
20/11/4/1
2~Jllt4/29
20ill14/34
20/1114/33 . 2o/rli4/70
20/11/4/37
4
20/1d./0040/0015
20/11/0040/0023
20/11/0040/0019 , . . . 20]lJ/0040/0022
20/11/0040/0083
20/1410040/0021
.20/ J.l/0040/0018
20/11/0040/0057
20111/0040/0067
2.0/111'0040/0003
20/11/0040/0006
20/11/0340/0047
20/11/0040/0017
20/11/0040/0035
20/11/0040/0012
20/~1{0040/0'J3J \
20/U {00 4 0/0()l3
20/1110,HO/0005
20/11/0040/0056
20/11/0040/005~
20/11/OJ40/0345
,zOJU/0040/0054
• 20Jll/0040/0086
:20/ U/0040/0087
20/11[0040/008.8'
20/1110040/0002
201ujOJ40/0001
20J11j0040/0029
20/11/0040/0034 . iO;nlo040!OOn
~0~11{0040/0070
20j 11j0040/0031
Lo::ation Code (Manual)
5
17/11/4/1
17/11/4/5
11/11/4/6
17/11/4/4
.11/u/4/86
17/11/4fj5·
17/11/4('1
17/11'4/~6
11/11(4/70
17/11/4/18
17/11/4/24
17/11/4/33
17/11/4/8
17/11/4/45-
17/11/41l.5
17/11/4/11
11/1i/4/H
11/11/4/11
11/11/4/68
11/11/4/30
17/11/4/48
17/11/4/64
17/11/4)79
17/11/4/80
17/11/4/78
17/11/4)20
17/11/4/2!
i7/1l/4(40,
17/11/4/44
17/11/4/43
17/11/4/72 ~.. ,..
.17/11/4/49 -
'Location' C'J::ie (ComputeI')
6
'-17/11/0046/0rm'
17/II/0040/0rm
11 {,11/0'J40/00'JS:
1'1/11 /OO~oJoow
17/11/0[)40/0'J86'
17/1fIO)~ro35
17/11/0'JflJ/fJJJ7 •
17/11/0:>$0'/0055 •
t1/11i°iJ1,O/0071J'
'17/1110rHO/OOlS'
L7/1I/0MO/0024
'17j1j/0040/0J3J
1-7~H{OJ~Of~J8_ '
17/ H/0:U0/OJ4S'"
~17 fll/OH'JfODl 5"'
17/,1'l/O:)4I.I/.o011
17/1l10J«!IOOU'
17/11/00~17
17/11/PJromS3
17/rI/OJJO/003ft,
17/-LI/004Q/CJ;WJ
17}idYO'J(IJ/JjJS4
17i U/OOID/OD 79~' • 17 tLl/OJJ()/(J08 0 ~
17111/004010078 :.
-111131./1)OW/0020 ~
1"7/ L'1/D04{J/002f.
,17) £l/0()40/0049
i 7/11/0040/0044
17/11/0040j0043
'17111/0040/0072
17 iJ 1/00.40 /{)049

168
ALPHABETICAL L]ST OF V1LLAGES
MANSA C. D. BLOCK
1991 Census 1981 Census Sr. Name of village --_--_-..-_-__,-_.----- --------_--._-------.. - --No. (with Hadbast No.) Location Locafion Location Location
Code COde Code Code (Manual) (C<1mputor) (Mantlal) (Computor)
1 2 3 4 . 5 6
-- ~-.
MaDsl Tllbli1 (Part)
33 Jassarwala" (2&) 20)1114/36 20/11/0040/0<135 17/11/4/46 17{11/0040/0046
34 Jawaharke (114) 20}11/4]76 20/11/0040/0076 17/11/4/76 17 f 11/0040/0076
35 Jo&a (8) 20/11/4/21 20/ll/0040}002 ! 17/11/4/2 17,11/0040/0002
36 Kalho (10) 20/11/4}82 20/11/0040/0082 17/11/4/22 17/11 {0040{0022
37 Khala (119) 20it 1/4/69 20/11/0fi40/0(J69 17/11/4/71 11/11/0040/0011
38 Kbaiak Sioghwala X64) 20Lll/4/11 20/11/0040/00 II 17/11/4{Ui 17/11iOO40/()()16 ,
39 Khiala Kalan (52) 20}11)4}63 20/11/0040/0063 17/11/4/29 17/11/OO~0/OO29
40 Khiala Khurd (53) 20/11/4/62 20/J1/00~OJ0062 17/11/4{28 17/11/{)040/0028
41 Khillan (45) 20J11/4/55 20/11/0040/{)055 17/11/4/63 11/11 /00~0/OO63
42 Khiwa Dialuwala (23) 20/11/4}30 20(1 I (OO40/(){l30 l1111/4/39 11111)Oi)~OJOO39
43 Khiwa Kalan (21) 10/11/4132 20/11/0,140/0032 11{l1/4/41 H/ll/O) ~()/O041
44 Kbiwa Khurd (24) 20/11/4/31 20/11/0040/0031 17/11/4/42 17/11/0)lG/()J42
45 Khokhar Kalan (75) 20/11/4/79 20/1l/0a40/0J7~ 17/11{4/83 17Jll/I))H/OJ33
46 Khokhar Khurd (74) 20/11/4/78 20/11/0040/0078 11/11/4/84 11111/ilJ jO/J;)3 ~
A1 KishanBarh Urf Phar (48) 20}11/4/58 20/11/0040/0058 17{1l)4/65 11/11/0040/0065
43 Kot Lallu (54) 2(J/1l/4/56 20/11/0040/0056 11/11 {4/67 17/11/0lHO/0051
4? Kotli Kalan (9) 20/11/4/81 20/11/0040/008L l1111/4{23 11/11 /0040/002j
50 Kotra (50) 20/11 /4/61 20/11/0040/0061 17/11/4/32 17/11/0040/0032
51 Makha {81) 20/11/4/94 20/11j0040/00'M 17/11/4/90 17/fljOOiO/OO)()
52 Makha Chehlan (9) 20/11j4/20 20/11/0040/0020 11/11/413 11[11/0040/0003
53 Malakpur (56) 20/11/4/64 20/11f0040/0054 llTIl/4/26 17/11/0040/0026
54 Man Bibrian (85) 20/11/4/84 20/1110040/0084 17/11/4/81 17/U/0040/{)OS1 . 5S Mansa Khllrd (55) 2o{11/4/65 20/11/0Q40/oo65 17/tl/4/21 17/11/0040/\)027 , 56 Matti (15) 20/11/4/26 20/11/0040 jOO26 17111/4/36 17/11/0040/0036
57 Maujo Kalan (13) 20/11/4/24 20/11{OO40{OO24 17/U/4/31 It/ll/0040/OO31
58 Maujo Khurd (14) 20/11/4/25 2o/HlOO40/o025 17/11/4/38 17/11/0040/0038
59 Mohar Si~ghwala (29) 20/1114/46 20/1 i 1004010046 17/11/4/47 17/ ll/OO4() /oo~ l'
60 Moola SinShwala (49) 20/11/4/59 20/1110040/0059 17/11/4/31 Gill 10040/0031
61 Mussa (84) 20/11/4/85 ZOfl1/0040/00s5 17/11/4188 .-17/11-/004010088
,62 Nanga! Kalan (115) 20/11/4/73 20 {! I {0040/0073 17IIl/4J7S 1'7111/0040/0075
~ Nangal knurd (113) 20/11/4/75 20/11/0040/0015 It/ll 14/11 " i7/11/0040/0077
6'1- Narcnderpura Ba&lfanwiilit (118) 20/11/4/68 20/11/0040/0068 17/11/4/69 17/11/0040/0069
65 RaIla (7) 2{)/1l/4/16 iO/U/Q040/0016 17111/419 1'7/11/0040/0009

1'69
ALPHABETICAL LIST OF V1LLAGES
MANSA.C. D. BLOCK
19))1 Cen9u3 1931 Ccn3i1s Sr. Name of village :--1-...- __ ........... __ --,_,.,._.,_ .... _______ ---- -. - ......... ..-_-----------No. (with Hadbast No.) Location Location Lo::ation Location
Code Code Code Code (Manual) (Computer) (Manual) (Computer)
.1 i 3 4 5 6
Mansa Tahsil (Pa~t)
66 Ram Dittawala (77) 20111/4177 20111 /0040/0077 1'1 III /4/81 11/11 /0040/00&1
67 Rar (4) 20111/4114 20{11/0040/0014 17/11/4/14 17/11 /0040/0014
58 Sadda Singhwala (12) 20/11/4/80 201[1/0040/0080 17/11/4/85 17/11 /0040/0085
59 Samaon (19) 20/11/4j28 20/11 /0040 j(J028 17/11/4/34 11/11/0040/0034
70 Sukha Singhwala (10) 20/11/4/4 20/11/0040/0004 17/11/4/19 11/11/0040/0019
11 Tamkot (58) 20/11/4/8 20/11/9040/0008 11/11/4/10 17/11 /0040/0010
72 Thuthianwali (S7) 20/11/4/7 20/11/0040/0007 17/11/4(25 17/11 /00401002S
73 Ubha (62) 20jll/4}10 20111}0040}0010 17/11/4112 17/11 {OO40/0012


VILLAGE DIRECTORY MANSA -C. D. BLOCK
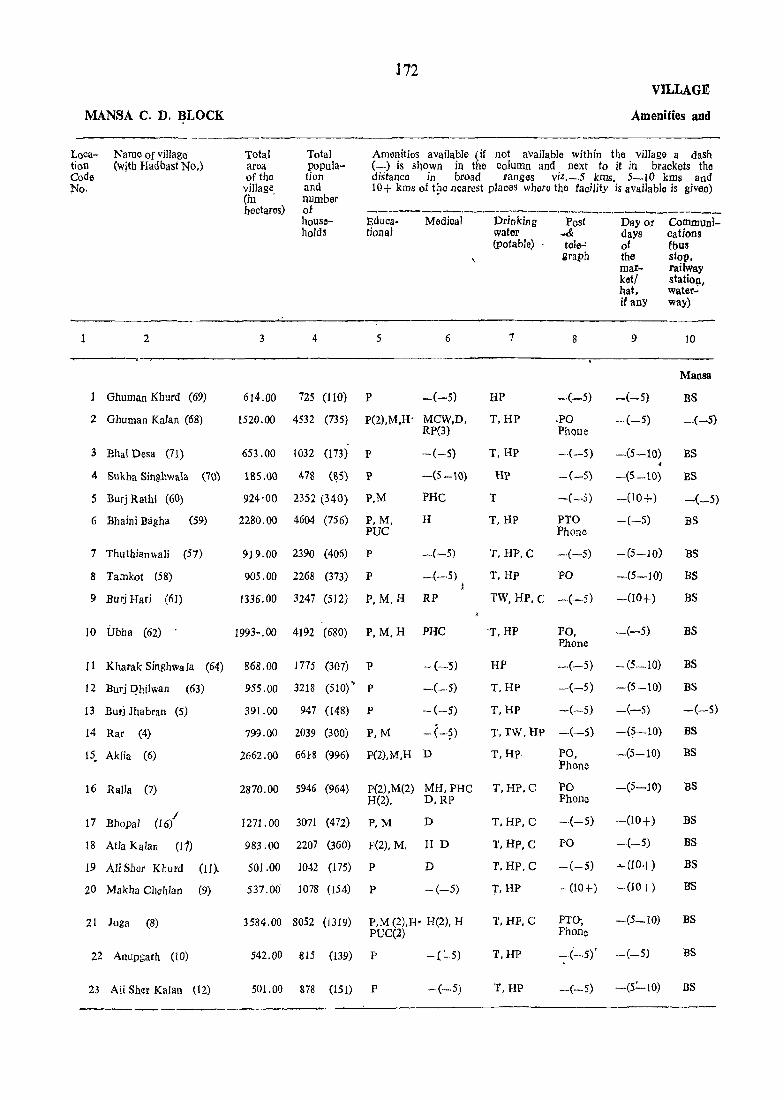
MANSA C. D. BLOCK
Loca- Name of village tion (with Hadbast No,) Code No.
2
Ghuman Khurd (69)
2 Ghuman Kalan (68)
3 Bhai Desa (71)
4 8ukha Singhwala (7C)
5 Burj Rathl (60)
6 Bhaini Bagha (59)
7 Thuthianwali (57)
8 Tamkot (58)
9 Burj Har! (61)
'Total ar()a of the village (in . hoctares)
3
'Total population and number of housoholds
4
172 VILLAGE
Amenities and
Amenities available (if not available within the village a dash (_.) is shown in the column and next to it in brackets the distance in broad ranges viz.-.5 kms, 5-·10 kms and 10+ kms of t~e nearest pJaces whefo the facility is available is given)
Ed;c;'-·-M-;dl~·---p;.~ki~·--p-;t--·-Da;-;-Co-;;;j: tional lVater.& days cations
(potable)· tele..: of ebus graph the stop.
mar- railway ket/ station. bat, water": if any way)
5 6 7 8 9 10
Mansa
614.00 725 (110) P -(-5) HP
T,HP
-.(-5)
,PO Phone
-(-5) BS
-.(-5) 1520.00 4532 (735) P(2).M.R· MCW,D. RP(3)
653.00 1032 (173) P -(-5)
1SS.00 478 (~S) l' -(5-\0)
924·00 2352 (340) P.M PHC
H 2280.00 4604 (756) P, M.
919.00 2390 (406)
905.00 2268 (373)
1336.00 3247 (512)
PUC
P -.(-.5)
P -.(-5)
P, M.H RP I
T.HP
HP
T
T,H?
T. HP,C
T,RP
-·(-5)
-(-5)
-(-.5)
PTO Phone
-(-5)
PO
TW, HP. C -·(-5)
-(-5)
-(5-10)
-(5-10)
-(10+)
-(-5)
-(5-10)
-(5-10)
-(10+)
BS
BS
-<-5)
BS
BS
BS
BS
10 Ubha (62) . 1993-.00 4192 (680) p. M. H PRe ·T.HP PO. -(-5) BS
11 Kharak Singhwala (64) 868.00 1775 (307) P -(--5)
12 Burj I?hilwan (63)
13 Burj Jhabran (5)
14 Rar (4)
15. Aklia (6)
16 RaIla (7)
I 17 Bhopal (16)
18 Atla Kalan (11)
19 Ali Shor Khurd (11)..
20 Makha Choll1an (9)
21 Juga (8)
22 Anupgarh (!O)
23 Ali Sher Kalan t12)
955.00 3218 (510)" P
391.00 947 (148) P
-(-.5)
-(-5)
799.00 2039 (300) p, M -(-?)
2662 .00 6618 (996) P(2),M,H D
2870.00 5946 (964) p(2),Me2) MH. PRe H(2), D, RP
1271. 00 3071 (472) p, M D
983 .00 2207 (360) P(2), M. H D
501.00 1042 (175) P
537.06 1078 (154) P
D
-(-5)
3584.00 8052 (1319) P,M (2),H' H(2), H PUC(2)
542.00 815 (139) P -C-5)
501.00 878 (151) P -(-.5)
P.hone
HP
T,HP
T,RP
-(-5) -(5-10) BS
-(-5) -(5 -10) BS
-(-·5) -.(-5) -(-5)
r. TW. Hp -(-5) -(5-.10)
T. Hp PO, -(5-10) Phone
T,HP.C PO -(5-10) Phone
T,HP,C
T,HP,C
-.(-5) -(10+)
PO -.(-5)
T, HP. C -(-5) ..... (10+)
T, HP -(10+-) -(10+-)
BS
BS
BS
BS
BS
BS
BS
I', HP. C FTC}, Phone
-(5_10) BS
T.HP -(-.5)' _(_5) BS
T.RP -(-5) --(5=-10) BS
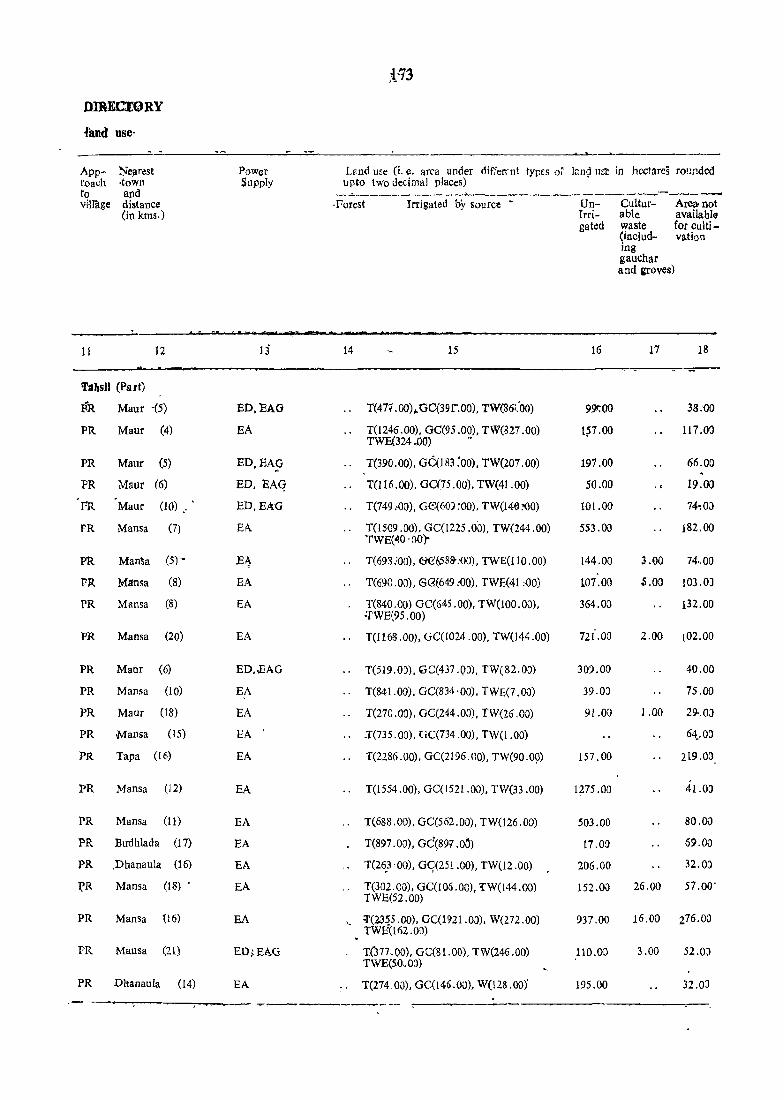
4and use-
Approach to village
11
~e.arest .town and distallce (in kms.)
12
tahsil (Palt)
PR Maur -(5)
PR Maur (4)
PR Maur (5)
PR Maur (6)
PRo Maur (10) "
FR Mansa (7)
PR Man~a (5)-
I"R Mansa (8)
PR Mansa (8)
PR Mansa (20)
PR Maar (6)
PR Mansa (10)
PR Maur (18)
PR Mansa (15)
PR Tapa (16)
PR Mansa (12)
PR Mansa (11)
PR Bttdhlada (17)
PR ,Dbanaula (16)
J?R Mansa (18) •
PR Mansa '(16)
PR Mansa (21)
PR Dhanaula (14)
Power Supply
13
ED,EAG
EA
ED,EAy
ED. EAq
ED,EAG
EA
E~
EA
EA
EA
ED,..EAG
EA
EA
EA
EA
EA
EA
EA
BA
EA
EA
ED;EAG
EA
Lend use (i. e. area under differrnt lypes 0; lung usl: in hectares rO!lJ1dcd upto two decimal places)
- ~.-.----. _._-- _. -.~-------.----- ---.__...__..._-_-------Forest Irrigated by source -
14 15
T(47~ .OO),,'GC(39r.OO), TW(86i:00)
.. T(1246.00), GC(95 .00), TW(827.00) TWE(324 000) ~
.. T(390.00), GC(J83 :00), TW(207.oo)
.. T(116 .00). GC(75 .00), TW(41.00)
.. T(749:00), G€(60J:00), TW(140~0)
.. T(l509 .00), GC(1225 .00), TW(244.00) TWE(40'OO)"
T(693.;OO). ee~8&:OO), TWE(llO.OO)
.. T(690.00), 6<3(649 ;"()O). TWE(4t..oO)
T(840.00) GC(G45.00). TW(lOO.OO), ·TWE(95.00)
.. T(1168 .00), GC(1024 .00), TW(144.00)
.. T(519.00), QC(437 .QD). TW(82.00)
.. T(841.00). GC(834 '00). TWE(7.00)
T(270 .00), GC(244 .00), TW(26.00)
.. .T(735 .00), GC(734 .00), TW(l.OO)
.. T(2286.00). GC(2196.00), TW(90.Q9)
T(1554 .00), GC(1521 .00), TW(33 .00)
T(688 .00), GC(562 .00). TW(126 .00)
T(897 .00), GC~897 .06)
T(26.3 '00), Gq<251 .00), TW(l2 .00)
T(302.00), GC(106 .00), :rW(144 .00) TWE(52.00)
'. :r(23~5 .00), GC(1921.00). W(272.00) TWE{l62.00)
T(377,00), GC(81.00), TW(246.00) TWE(50 .. 00)
.. T(274.00), GC(146.OU), W(12S.00)'
UnIrrigated
16
991:00
1$7.00
197.00
50.00
101.00
553.00
144.00
107.00
364.03
n{.oo
30).00
39.03
91.00
157.00
1275.00
503.00
I7.0a
206.00
152.00
937.00
l10.00
195.00
Culturable waste (includ
Area not available for cultivation
ing gauchar and groves)
17 18
38.00
117.00
66.00
.j 19.00
74~OJ
182.00
3.00 74,00
$.00 103.0)
132.00
2.00 102.00
40.00
.75.00
1.00 29,. OJ
64 •. 00
2t9.00
41.00
80.00
6~.OO
32.00
26.00 57.00'
16.00 276 .00
3.00 52.0)
32.03
~-. ------....-."....--

MANSA C. D. BLOCK
Loea - Name of village tion (With Hadb:i!.t No.) Code No.
1 2
24 Maujo Kalan (13)
25 Maujo Khurd (14)
26 Matti (15)
27 Atla KlJurd (18)
28 Samaon (19)
29 Ghuthari (22)
30 Khiwa Dialuwala (23)
31 Khiwa Khurd (24)
32 Khiwa Kalan (21)
33 Heron Kalan (25)
34 Hamitgarh VIf (26) Dhaipai
35 Bir khurd (27)
36 Jassalwala (28)
3'1 Hodla Kalan (31)
45 Dhalewaq. (30)
46 Mohar Singh- (29) wala
47 Bhikbi (20)
54 Failc Ilhaike (46)
55 KhiIlan (45)
56 K-ot Lallu (54)
57 Bappiana (47)
1"74
__ VILLAGE
Amenities and
Total area ofth~ village (in hectares)
. Total population and numb~r
Amenities available (if not aVailable within the village a dash (-) is shown in the cJlumn and next to it in brackets the distance in broad. ranges viz.-S kms, 5-10 kms aod 10+kms of the Marest place' where the facility is available is given)
of hous.elulds
-------_-_--...._----------_ __._---Educa- Medical Drinking post Day or Commui-tional water & daYs cations
3 4 5 6
91.00 346 (49) -'(-,5) T, HP
(pota ble) tele- of the (bus graph market, stop,
hat, if railway
7
T,HP
8
any statioo,
9
water· way)
10
Mansa
-(-5) -(5~10) BS
505.00 1140 (179) P, M D, RP(3) T, HP -(-5) _('5-10) BS
1367.00 3051 (537) P, M, H PRC, FPC T. HP po, -(5_10) BS Phone
606.00 1524 (263) P -(-5) 'T -(-5) -(-5) BS
1238.00 3357 (588) P -(-5) HP -(-5) -(-5) BS
783.00 1463 (253) P H T,IlP, C -(-5) -(-5) BS
376. 00 133~ (223) P -(5-10) T -(-5) -(10+) BS
954.00 2116 (357) P, M, H -(-5)
1183.00
1495.00
3085 (497) P
3969 (595) P, M, H
H
D(3). CHW(lO)
1185.00 2279 (354) P D
771.00 1436 (252). 1', M. H -·(-5)
170.()() 489 (80) 1', M PH~
910.00 2153 (966) P, M, H HC
1426.00 3122 (491) p, M pHC
602.00 1674 (304) P, M PRC
2793.00 11547 (2002) P(2), M(2), H H(2), PUC
T.IlP
HP
T, HI'
T,TW
T, HP
po
po
PTO, Phone
po
-(-5)
T, W, TW, PO HP
T, W, TW, PO HP
TW.HP. po
T, TW. HI', PO C
T,HP PTO, PhOne
-(5-10)' BS
-(5-10) BS
-(5-10) BS
-(5-10) BS
-(5-10) BS
-(10+) BS
-(10+) BS"
-(10+) BS
-(10+) BS
-(10+) BS
1641.00 3944 (626) p, M, H, H, MH, T, TW, po, Phone
-(5_10) BS PVC HC, D RP HP, C
·441.0Q 1307 (223) P -(-5)
700.00 2242 (381) P H,D
T. TW, HP, -(5-10) -(5-10) BS C
'l',Hp -po
828.00 2084 (349) P D. FPC,RP T. TW, HP PTO
-(5-10) BS
_(5_10) BS

DIRECTORY
lapd use •
App' roach to viI1a~e
11
Nearest tuwn and distance (in kms.)
12
----_ .. Tahsil Part
PR Dhanaula (16)
PR Dhanaula (16)
PR Budhlada (5)
PR Budhlada (16)
PR Budhlada (2)
PR Budhlada ,(10)
PR Sunam (19)
PR Mansa (7)
PR Mansa (9)
PR SUlJam (18)
PR Sunam (19)
PR Suuam (21)
PR Budhiada (14)
PR l3udhlada (12)
PR Budhlada (10)
PR BuJblada (11)
PR Budblada (14)
PR Budhlada (9)
PR' Mansa (1)
PR Mansa (6)
PR Man sa (8)
Power Supply
13
ED. tAG.
ED,EAG
EA
ED,EAG
EA
EA
ED.EAG
EA
EA
EA
ED.,EAG
ED.EAG
EA
BA
EA
EA
EA
BA
EA
ED. BAG
BA
115
Land use (i. e. area under different types of land me in hectares rounded upto two decimal places)
Forest Irrigated by source
14 15
.. T(6Q·.OO). GC(39 .00). TW(IS .00) TWE(3.00)
., T(397.00). GC(316.00), TW(54.00), TWE(27.00)
.. T(S40 .00). GG(S27 .00), TW(13 .00)
.. T(405 .00), GC(357 .00), TW(40.00) TWE(S.OO)
.. T(605 .00), GC(60S..00)
.. T(523 .00). GC(286 .00), TWE(237 .00)
.. T(2S0.00). GC(25S.00) T.W(l6.oo) TWE(6.00)
.. T(611.00). GC(571.00). TW(24.00) TWE(l6.00)
T(878 .00). GC(715 .00). TWE(163 .00)
.. T(1244.00), GC(505. 00). TW(577'.00), TWE(162.00)
.. T(949.00). GC(S09.00). TW(40.00) TWE(lOO.OO)
T(705.00). GC(443.00). TW(122.00) TWE.(14J .00)
.. :r(146 .00), GC(140 .00). TW(4 .00) TWE(2.00)
.. T(SI7.00). GC(760.oo). TW(57.00)
.. T(1127 .00). GC(936.00). TW(150.00) TWB(41.00)
.. T(371.00). GC(253 .00). TW(25.00) TWE(93.00)
.. T(2223 .00). GC(IS55 .00). TW(287.00) TWE(SI.00).
.. T(1125.00). Ge(717 .00). TW(122.00) TWE(286.00)
T(399.00). GC(374.00). TWE(25.60)
.. T(579.00), GC(575.00). TWE(4.00)
.. T(7..z6.00).GC478.00). TW(248.00)
Un- Cultur- Area not irri- able available gated waste for CJlti.
(inc\J1- V.ati01 ing-gauc:lar and grov:l;)
. 16 17 IS
23.00 2.00 6.00
72.00 2.00 34.00
409.OJ 2.00 116.00
50.00 47.00 104.00
510.00 .. 123.00
197.00 63.00
59.00 37.03
318.00 4.00 21.00
207.00 12.00 86.00
121.00 2.00 128.00
103.00 .. 12S.00
3.00 62.00
6.00 1.00 17.0J
93.00
151.0) 143.00 5.0l
1S9.00 42.00
266.00 .. 304.00
365.0) 1St.!»
1.00 41.00
'40.00 6.00 75.00
51.00 51.00
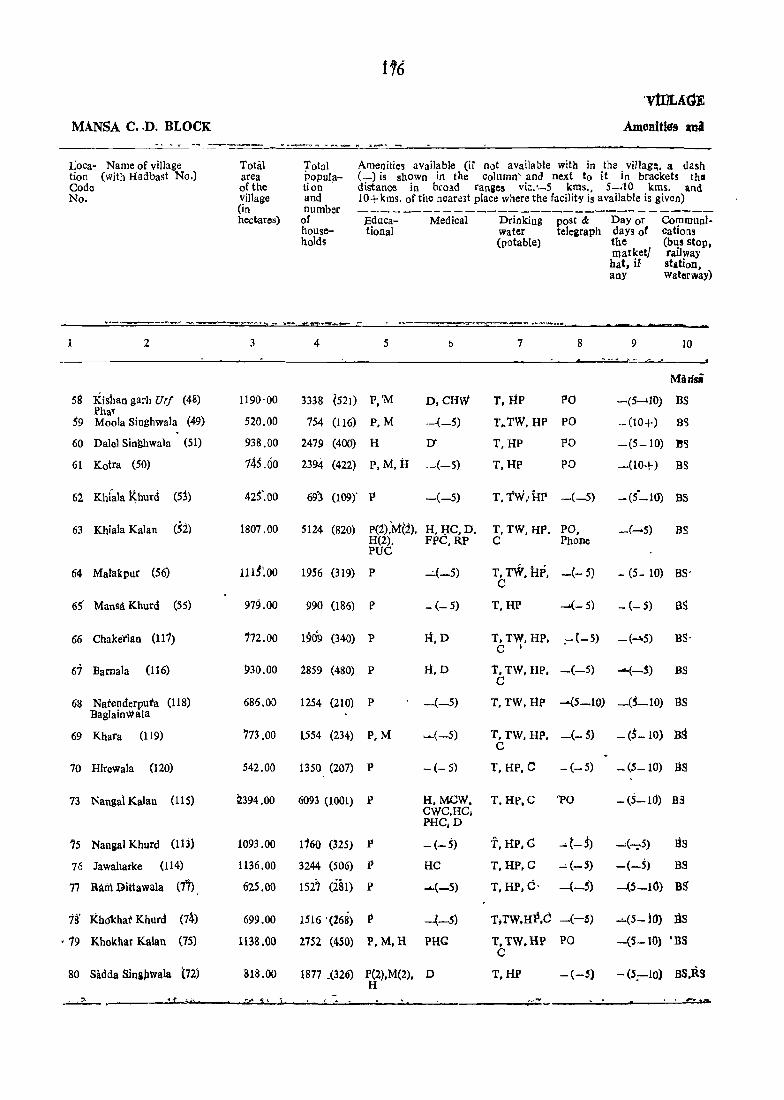
MANSA C .. D. BLOCK
Loca- Name of village tion (with Hadbast No.) Code No.
2
58 Kishao garh Uri (48) Phar
59 Moola Singhwala (49)
60 Dale1 Sin~wala (51)
61 Kotra (50)
6~ Khi~1a Khurd (53)
63 Khiala Kalan (52)
64 Matakput (56)
65 Mansll. Khurd (55)
66 Chake"rlan (111)
67 Bafnala (116)
68 Natenderputa (118) Baglainvtala
69 Khara (119)
10 Hlrewala (120)
73 Nanga} Kalan (115)
15 Nangal Khurd (113)
76 lawaharke (114)
77 Ram Dittawala (71)
18' Kho1<har Khurd (74)
• 79 Khokhar Kalan (75)
80 Sidda SiniPwala l72)
Total area of the Village (in hectares)
Total population . and number
of households
116
'VtDLA~E
Amenitie's .na
Amenities available (H not available with in the villag~. a dash (-) is shown in the column' and next to it in brackets tho distance in broad ranges viz..'-5 kms.. 5-~10 kms. and lO+kms. of the neaTe,t place where the facility is available is given)
Educational
Medical Drinking water (potable)
post & Day or telegraph days of
the market! hat, if any
Communications (bus stop, railway station, waterway)
- .... , IT ~ .... - ------.
3
1190'00
520.00
938.00
145.60
425'.00
4 5
3338 (521) P, 'M 0, CHW
754 (116) P. M .-(-5)
2479 (400) H IY
2394 (422) P. M. iI -(-5)
693 (109)' P -(-5)
7
T,RP PO
T .. TW. HP PO
T. HP PO
T.RP PO
8
T. Tw .. irp -(-5)
9 10
Mansi
-(5 ...... 10) BS
._(10+) BS
-(5-10) '!s
-(10+) BS
1807.00 5124 (&20) P(2).M:(2). R. I.IC. D. T. TW. HP. PO. BS H(2). FPC. RP C Phone PUC
1115:00 1956 (319) P
979.00 990 (186) P
712.00 1909 (340) P
930.00 2859 (480) P
686.00 1254 (210) P
773.00 [554 (234) p. M
542.00 1350 (207) p
- (- 5)
H,D
H.D
_(_5)
~(-5)
- (- 5)
T. TW, HI', -(- 5) - (5_ 10) BS' C
t. HP ......(-5) -(-5) as
T. TW. HP. .- (- 5) -(-"5) BS' C I
T. TW. HP. -(-5) C
--(-5) as
T. TW. Itp ...(5-10) _(5_10) 139
T. TW. HP. -(- 5) _ (5- 10) BS C
T. HP. C _(_5) -(5-10) as
2.394.00 6093 (1001) p H. MeW. T. HP.C 'Po -(5-1(j) B3
1093.00
1136.00
625.00
1160 (325) P
3244 (506) P
1527 dSl) P
CWC.HC, PHC,D
-(-5)
HC
...... (-5)
699.00 1516 '(268) P -(-5)
1138.00 2752 (450) P, M, H PHG
818.00 1877 .(326) P(2),M(2), D H
-
f. Itp. d as T. HP. C ..... (-5) -(-5) BS
T. HP. C' -(-5) -(5-10) BS'
T;TW,HP,C -(-~) -'-(5-}OJ BS
T.TW,HP PO -(5-10) 'BS C
T.HP -(-5) -(5;-10) BS,R,9
~.,------~~~----~~~~~~'~'~'--~~~--~--------~~~~-----~~------~~~
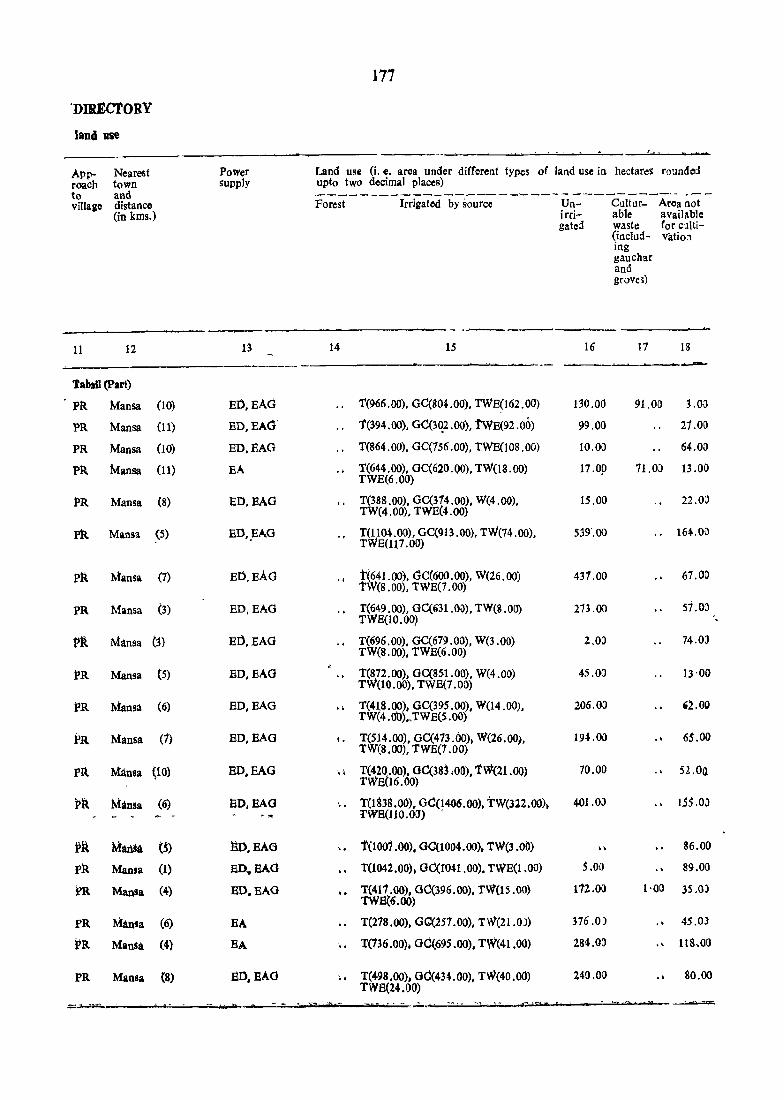
'nmtcroRY
lanel lIse
Approach to village
11
Nearest town and distance (in kms.)
12
1'ahlll (part)
P:R Mansa (10)
PR Mansa (11)
PR Mansa (10)
P:R Mansa (11)
PR Mansa (8)
Pk Mansa (5)
PH. Mansa (1)
PR Mansa (3)
Pit Ml1nsa (3)
l'R Mansa (5)
PR Mansa (6)
FR Mansa (1)
Pit Mansa \10)
Pit Mans& (6)
ilR Mansii (oS)
PR Mansa (1)
fR Mansa (4)
PR Mansa (6)
l'R Mansa (4)
PR Mansa (8)
~
Power supply
13
ED,EAd
ED,EAct'
ED,EAG
EA
ED.EAd
ED,.EAG
ED.EAd
ED.EAd
ED, EAG
ED,EAG
ED,EAG
ED,EAG
ED,EAG
ElJ,EAO
~O,EAG
ED ... EAG
EO.EAG
EA
EA
aO,EAd
177
Land use (i. e. area under different types of land use in hectares rounded upto two decimal places)
Forest Irrigated by source
-.~
14 15
.. 1(966.00). GC(804.00). TWE(162.00)
.. 1'(394.00). GC(3~2.00), 'fWE(92.0()
.. T(864.00). GC(156.00). TWE(108.00)
.1 T(644.00). GC(620.00). TW(18.00) TWE(6.00)
II T(388.00), GC(314.00), W(4.00), TW(4.00), TWE(4.00)
I, T(1l04.00), GC(913 .00), TW(74.00), TWE(111.00)
. , t(641.00), GC(600.00), W(26.00) tW(8 .00), TWE(1. 00)
.. t(649.00), GC(a31.00), TW(S .00) TWB(10.00)
.. T(696.00), GC(679.00), W(3.00) TW(8.00), TWE(6.00)
.. T(872.00). GC(851.00), W(4.00) TW(10.00), TWE(1.00)
.. T(41.8.oo), GC(395.00), W(14.00). TW(4.0t»,.TWE(S.OO)
I. T(514.00), GC(413 .(0») W(26.00), TW(8.00), TWE(1.00)
.. ~ T(420.oo). GC(38} .00). 1'W(21.00) TWE(16.00)
~ . T(183S.00), GC(l406.00), TW(312.00)~ l'WB(110.0ll) ,
" t(1001.00), Gd(1004.00), 1'W(3.00)
.. T(1042.00)1 OC(rou .00). TWE(l.OO) .. T(411.00). GC(396.00), TW'(lS .00) TWE'(6.00) .. T(218.00). G0(257.00), TW(21.0J)
" T(136.00), GC(695.00), TW(41.00)
.. T(498.00), Gd(4H.OO). TW(40.00) TWE(24.00) ,_.
'"'''' '.~ -, ...
Unirrigate;!
16
130.00
99.00
10.00
17.0).1
15.00
5j9'.OD
437.00
213.00
2.00
45.00
206.00
194.00
70.00
401.00
.. S.O\)
112.00
316.0)
284.00
240.00
CUltUfable waste (including gauchar and grove,)
17
Area not available for cultivatio:l
IS ...---
91.00 ~.O()
21.00
64.00
11.03 13.00
22.0:>
., 164.00
.. 67.00
51.0)
74.0)
13'00
'i.OO
65.00
52.00
.. 1$5.0,)
86.00
89.00
1'00 35m
.\ 45.0)
. , IIS.Ot)
. . 80.00
-'II1iiilI"'=
.
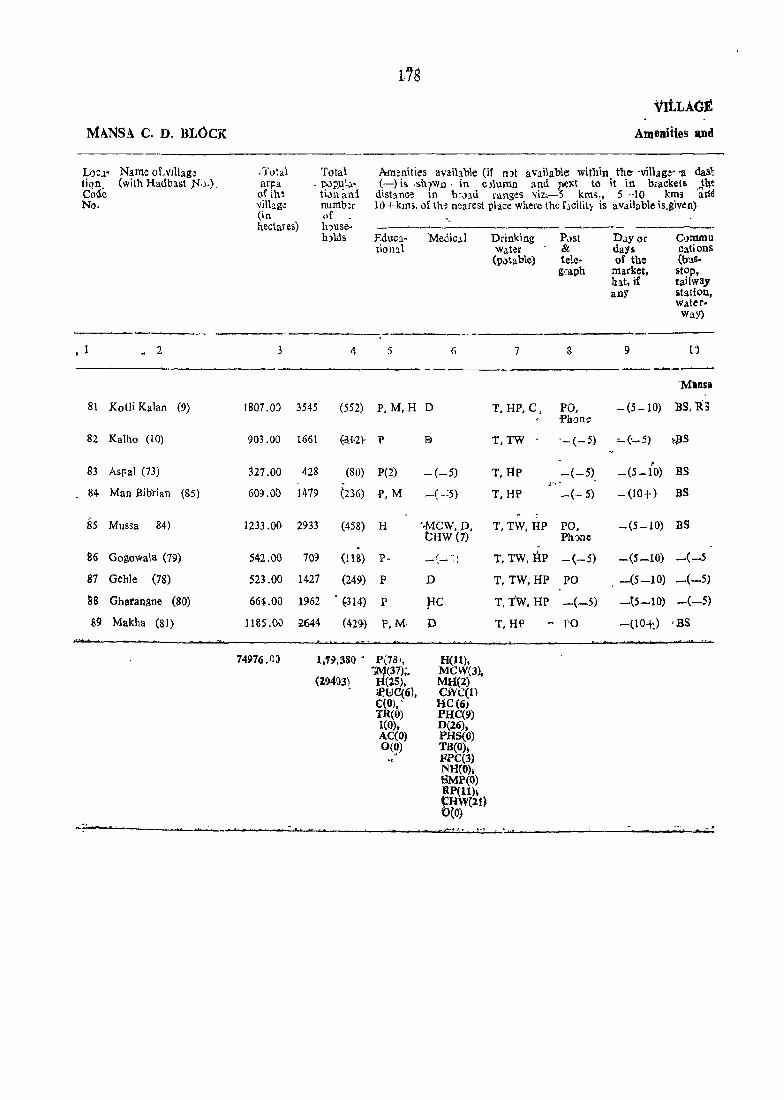
Mi\NSA C. D. BLOC:K
LO~l' Name oLvi1lag~ tiQn. (with Hadbast ,N,).). Coile No.
• 1 " 2
81 Kotli Kalan (9)
82 Kalho (10)
83 Asr-al (73)
84 Man Bib'rian (85)
8S Mussa 84)
86 Gogowala (79)
87 Gehle (78)
M Ghatangne (80)
89 Makha (81)
t'8
Amolliiies and
. Total ill"j!a ofth~ vi1lag~ (in hectares)
Total . P0?J!h·
ti,m ani numb!r <If . h)useh)lds
Amenities avaihble (if nJt aVailable within tIre -villag.!· -a daal1 (-) is. .sh?wn· in C)lUlUn and next to it in brackets .Jh~
distance In br,.nd ranges viz;-'s km;., 5-10 kms artd IO+km,. of th~ nearest place where the f~cilit) is available is,given)
Educa- Medicil tiona1
3 4 5
1807.0) 3545 (552) P, M, H D
903.00 16Gl ~J2). P B
327.00 428 (80) P(2) -(-5)
609.0!) 1419 (236) P, M -(-=5)
Drinking water
(p.>table)
7
P.>st & telegra.ph
8
T, HP, e; PO,
T,TW
T, Hp
T,HP
i f'hooe
--(- 5)
-(-5) r·:
-(- 5)
" 1233 .00 2933 (458) H '·MeW, D, T, TW, HP PO,
tHW (7) PhJne
542.00 709 (118) p. -(- ~l
523.00 1427 (249) P D
664.00 1962 • ~314) P Fe 1185.00 2644 (42~) P;M, D
74976.0;) 1,'1l},380' P(78), ~(37);.
(194()3l H(2S), ;'p'GC(6), C(O), • TR(O) 1(0). AC(O) O(~)
H(11), MCW(3), MH(2) CJVC(l) HC(6) PHC(9) D(26), PHS(O) TB(O); FPC(3) NH(O)I SMP(O) RP(ll); t:HW(21) 0(0)
T, TW, HP -(-5)
T, TW,HP PO
T, TW, HP -(-5)
T,HP ~ 1"'0
Day or daY~ of the
market, hat, jf any
9
OJInmU cations (b:l5-stop, railway station, water-waY)
1')
-----M_nsa
-(5-10) BS, R3
"- ('_ 5) cPS
, -(5-10) BS
- (lOt) BS
-(5-10) BS
-(5-10) _(_5
-(5-10) _(_5)
-{5-10) -(-5)
-(10-t:) 'BS
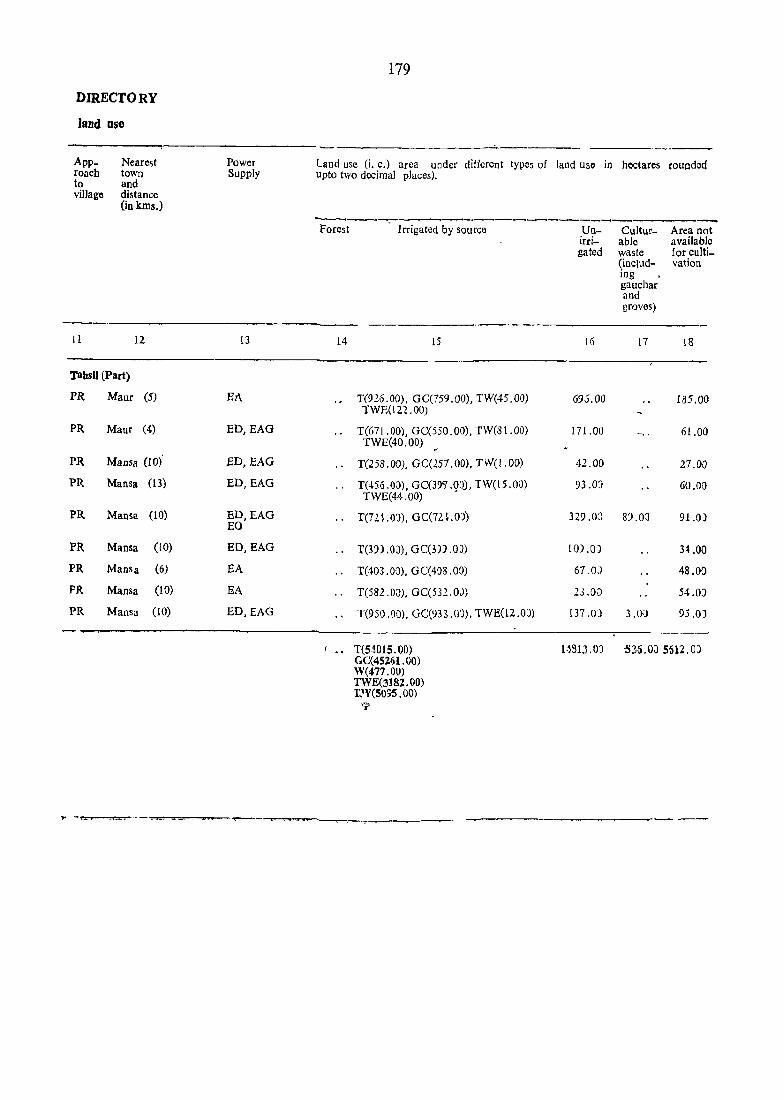
179
DIRECTORY
land use
.~.---
App_ Nearest Power land use (i. c.) area under different typos of land US6 in hectares rounded roach town Supply upto two decimal places). to and village distance
(in krns.)
~---~--------------------Forest Irrigated by source Un- Cultur- Area not irri- able available gated waste for culti-
(includ- vation ing gauchar and groves)
. __ ._--11 12 13 14 15 16 l7 18
Tabsil (Part)
PR Maur (5) B1\ T(926.00), GC(759.00), TW(45.00) 696.00 185.00 TWE(122.00)
PR Maur (4) BD,EAG T(671.00), GC(550.00), TW(81.00) 171.00 61.00 TWE(40.00)
PR Mansa (10) ED,BAG ., T(25S.0D), GC(257. 00), TW(l. 00) 42.00 27.00
PR Mama (13) ED,EAG .. T(456 .00), GC(39'7 .gO), TW(1.5.00) TWE(44.00)
93.03 60.0J
PR Mansa (10) ED,EAG EO
., T(7l ~ .OJ), GC(72,.l. .0)) 329.0:) 8?00 91.0)
PR Mansa (10) ED, EAG ., T(D) .OJ), GC(3)) .OJ) 10).0) H.OO
PR Mansa (6) EA .. T(403.00), GC(403.00) 67.0J 48.00
PR Mansa (10) EA T(582. OJ), GC(532. OJ) 23.0J 54.0J
PR Mansa (10) ED, EAG T(9S0.00), GC(933.0J), TWE(12.0J) 137.0) 3.0J 93.0J
T(5-~015.00) 1;)313,01 536. OJ 5512.0) GC(45261.00) W(477.00) TWE(3182.00) T..'V(5095.00)
'>"


APPENDICES 1-4
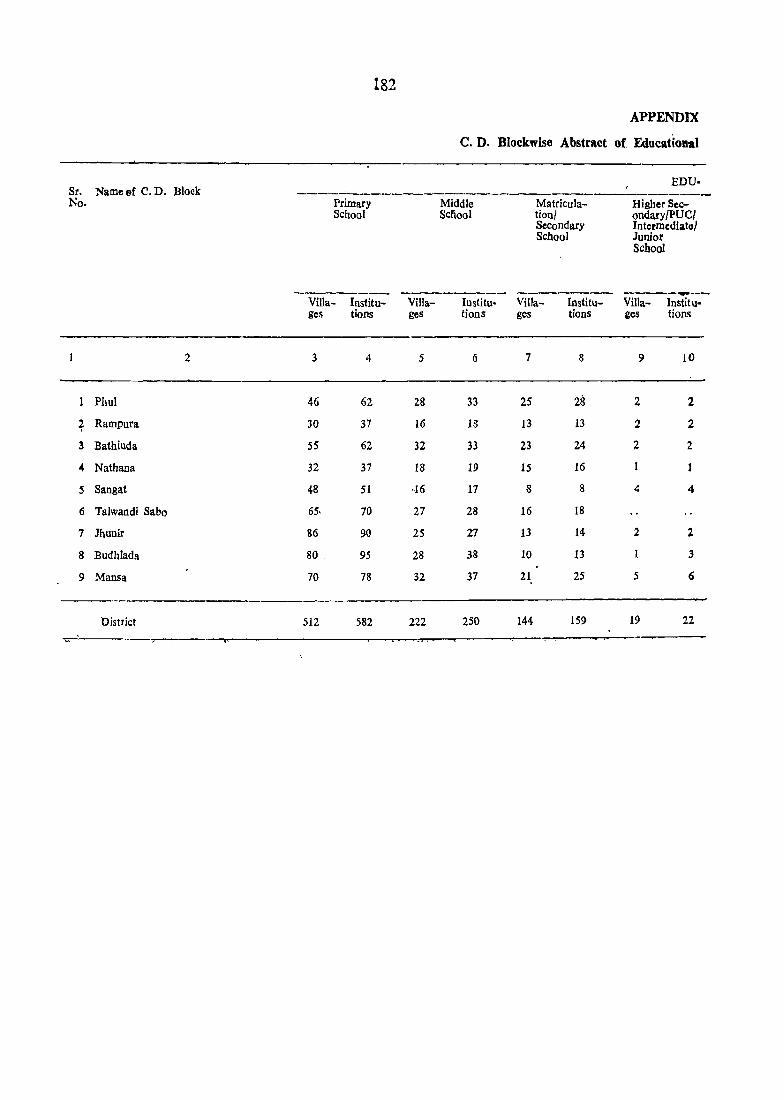
182
APPENDIX
C. D. Blockwise Abstract of Educational
EDU-Sr. Name of C. D. Block ----~----------------------------------No. Primary Middle Matricula- Higher Sec-
School Seliool tionJ ondary!PUC! Secondary Intermediate} School Junior
School
----..---Villa- Institu- Villa- Institu- VlIIa- Institu- Villa- Institu-ges tions ges tions ges tions 2es tions
2 3 4 5 6 7 8 9 10
Phul 46 62 28 33 25 28 2 2
f Rampura 30 37 16 18 13 13 2 2
3 Bathinda 55 62 32 33 23 24 2 2
4 Natbana 32 37 18 19 15 16
5 Sangat 48 51 ·16 17 8 8 4 4
6 Talwandi Saba 65· 70 27 28 16 18
7 Jhunir 86 90 25 27 13 14 2 2
8 Budhlada 80 . 95 28 38 10 13 3
9 Mansa 70 78 32 37 21 25 5 6
District 512 582 222 250 144 159 19 22
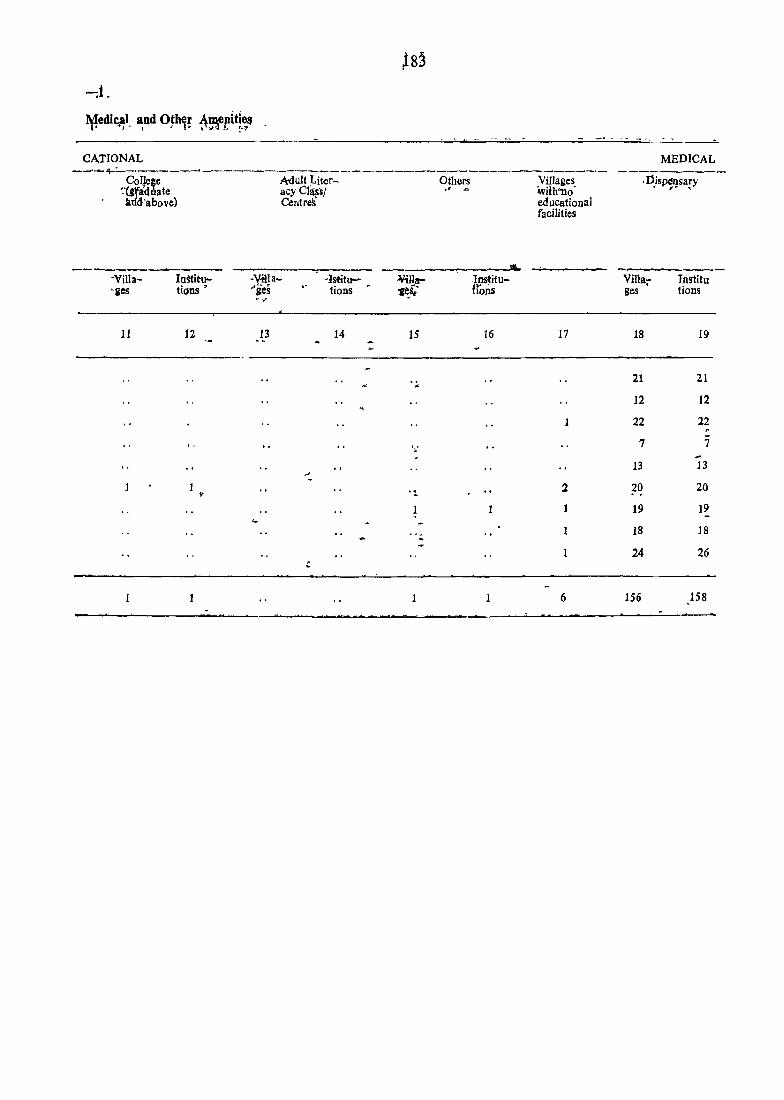
CATIONAL MEDICAL --,---.+:__------------------.---~.---------------------
CoI~ce Mult Liter- Others Yillages_ clei'"1i<t tia te acy CIl{~ll " A wilh"no !u1d'above) Centres educational
. Ujspensary .. ",.. .._
facilities
----_ __.._--- It.,
"ViIla- InStitu- -Vffla- "Istitu- ¥illa- Jnstitu- VilIa;- Jnstitu "gos tions • "Bes tions
w
~t· nons ges tions . .-
11 12 13 14 IS 16 17 18 19 .. <'-~
-~ 21 21
12 12
22 22 ~
7 7 . -13 13 .. -I' -. 2 20 20
1 19 19
'" - '. 1 18 18
1 24 26 ,::
6 156 158
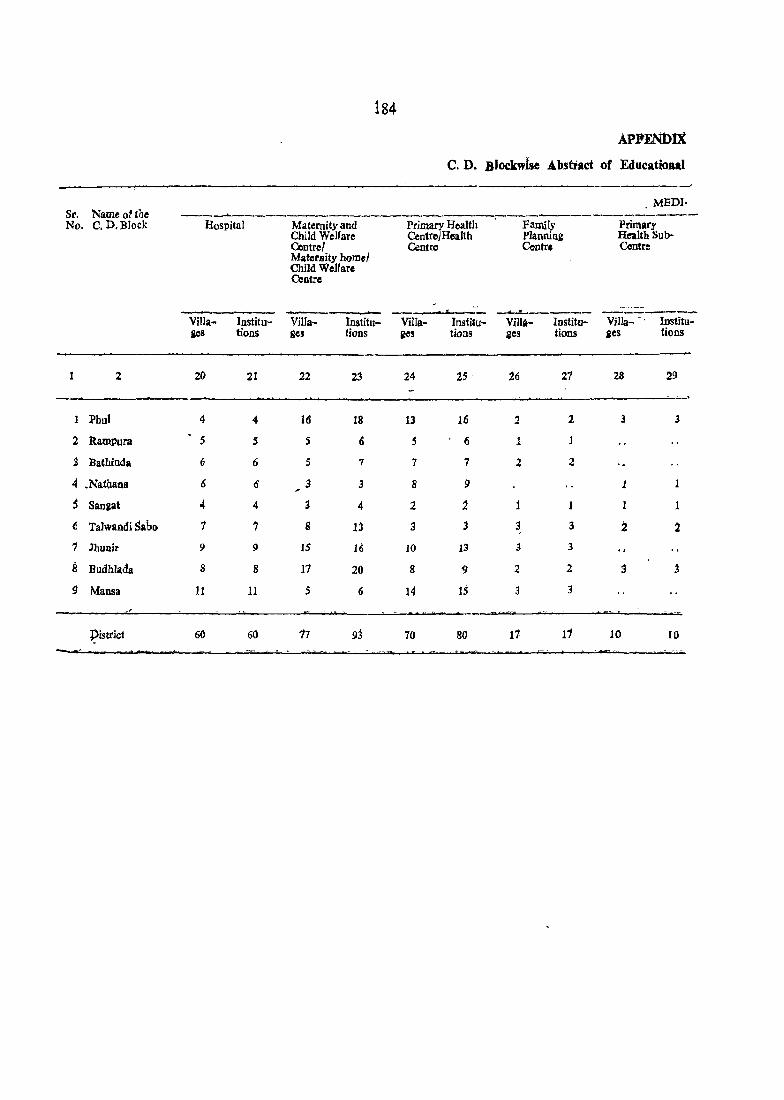
184
APP.ENlltx
C.D. Blockwfse Abstract of Educatio •• 1
MEDI· Sr. Nameotthe --~-----""""'--------~-----.-------------'_"------No. C. D.Block Hospital Maternity and Primary Health Family Primary
Cbild Welfare Centre/Health Planning Health Sub-Centre! Centre Centr. Centre Maternity homel Child Welfare Centre
---.-...=....-_- ~----- --------Villa- Institu- VilIa- Institu- ViIIa- Institu- ViUa- Institu- Villa- -. Institu~ jOS tions ges lions ges tions ges tions jes tions
1 2 20 21 22 23 24 25 26 27 28 29
1 Phul 4 4 16 18 13 16 2 2 l 3
2 Rampura 5 S 5 (j 5 6 1 1
3 Bathinda 6 6 5 7 7 7 2 2
4 .Natuana 6 6 3 3 8 9 1
5 Sangat '"
4 3 4 2 i 1
ii Talwandi Sabo 1 ., 8 Jj 3 3 3 3 ~ :2
7 Jhunir 9 9 IS 16 10 13 j 3
8 Budhlada 8 8 11 20 8 9 .2 2 j j
9 Mansa 11 11 5 6 14 15 3 3
l?istrict 60 60 17 93 70 80 17 11 10 10
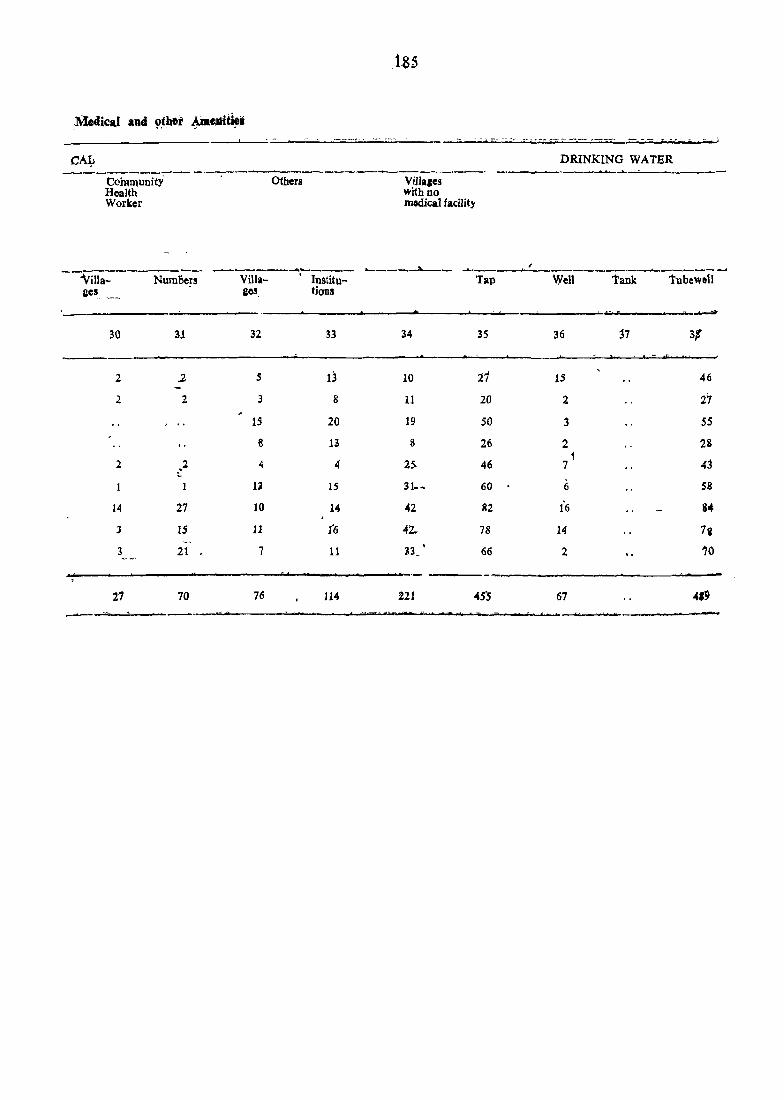
DRINKING WATER -------------------------------- ---- .-~-.... -'--....------
Community' . Others Villa,es Health with no Worker medical facility
""'---____ 'L...-_ , ------------ ------~---- ...... --~--~-----._._-----~ Villa- Numoe!! Villa- Institu- Tap Well tank 1ubewlll1 aes lies, tions
---30 31 32 33 34 35 36 'j7 31
2 .2 5 13 10 11 15 46
2 2 3 8 11 20 2 27 15 20 19 SO 3 5S
6 13 8 26 2 28
2 ~l 4 4 25-1
43 46 7
13 15 31-~ 60 6 S8
14 27 10 14 42 82 1'6 S ..
J 15 11 (6 42- 78 14 1&
3 21 7 11 33_ ' 66 2 "0
21 70 76 114 221 455 67 4'~
-----

S!. _ Namo, Qt C. D. Bloc~ No.
2
1 Jlhul
~. RamPlIral 3 ,Bathinda-.
4 Najhana 1
,5 Sangat
6 Talwandi Sabo
7 Jhunir i
8 Budhlada
9 Mansa
District
AirPBNIDX c. D. tiloCkwlitt.Abs'traet tjf:'Edtif.ti8B
DRINKING WATER POST ,A-'Nb --:------_--_.--._,.._.._._--_._------""""'::" -_..~~~- -----:--.. -~---
River
39
2
2
o o
4
Fountain '.'
40
Canal. Others
41 42
8 - 1
Hl
11
25 '
17
46
24 -
2S'
167 \
More than one Source
43
34"
18
50'
23
45
S4
84
79
6S
452
VilJaacs' with no drinking water facility
.44
P. O.
45 46" .. 41'
12 -1
-1
23-
12
17 1
13 I;. 0
23 1
12
18 1
137
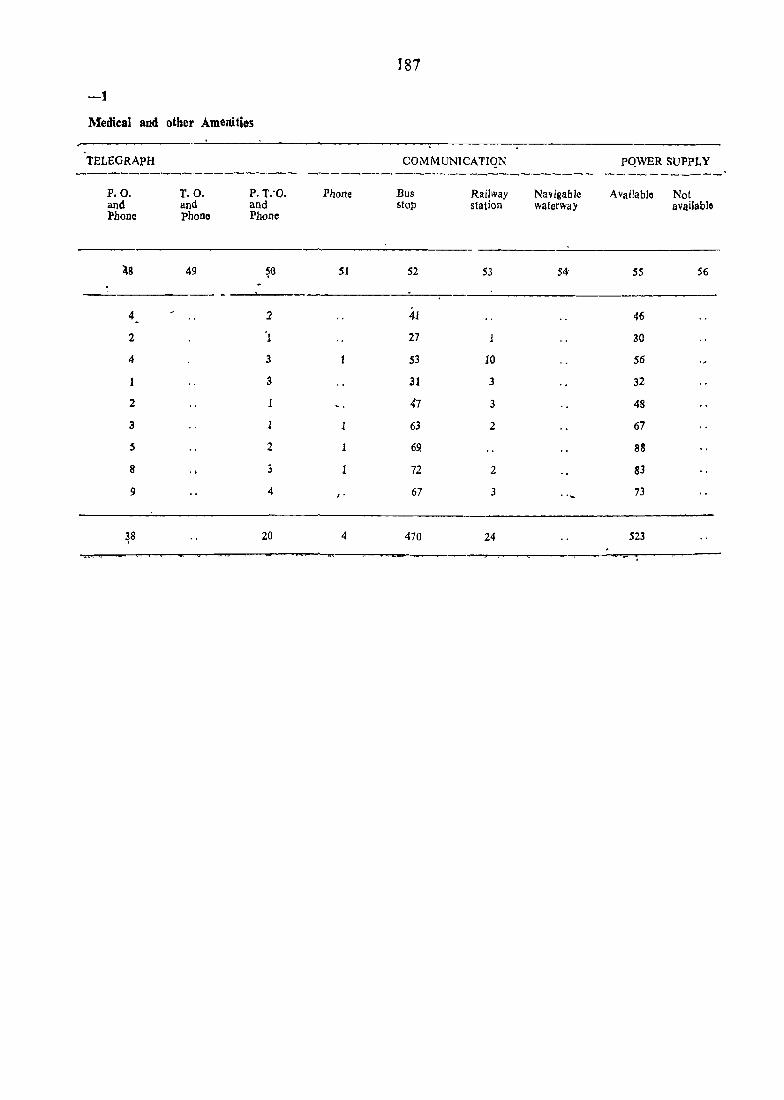
187
-1
Medical and other Amenities
TELEGRApH COMMUNICATIQN PQWER SUPPLY -----------------_._-,_ -'------"---~----.---~----------- -_--------_
P.O. and Phone
;as
4
2
4
2
3
5
8
9
~8
T.O. and phone
49
P.T.'O. and Phone
~O
2
'I
3
3
2
3
4
20
Pbone
51
, .
4
Bus stop
52
41 27
53
31
47
63
69.
72
67
470
Railway station
53
10
3
3
2
2
3
24
Navigable waterway
54
. ....
A vailable Not availablo
55 56
46
30
56
32
48
67
88
83
73
523

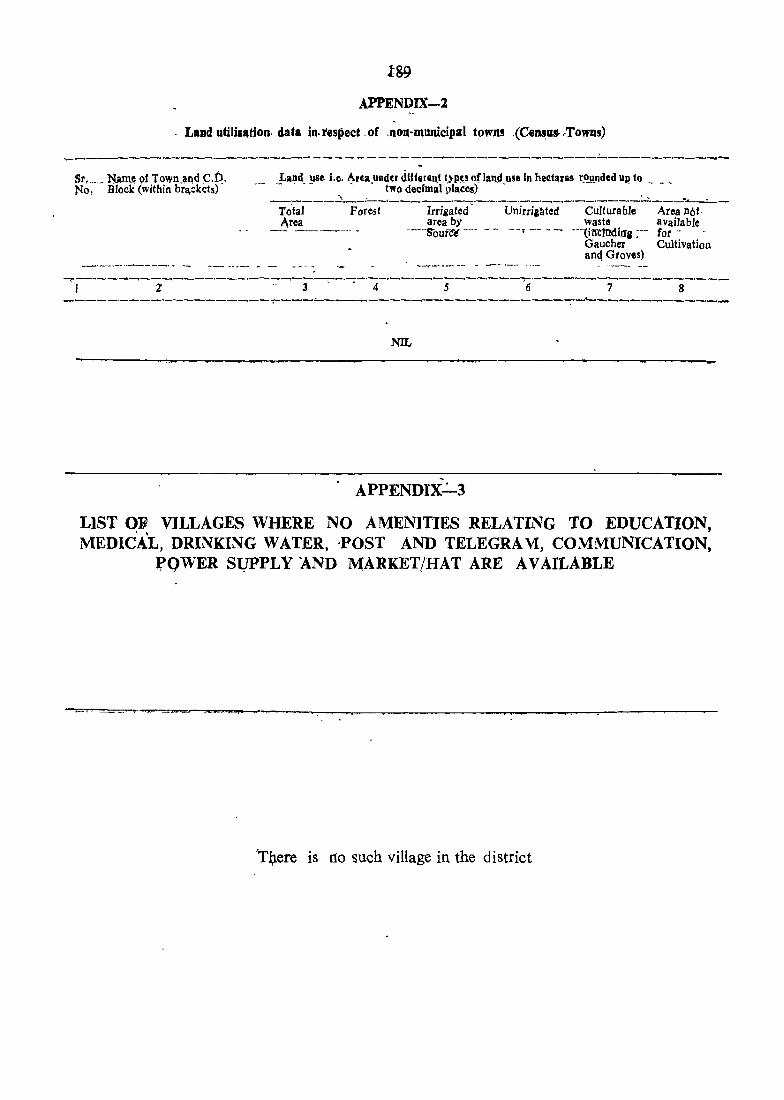
APPENDIX-2 .
. Land utiliaatioD. data in. respect. of .non-municip.1 town! .(Census--. Tons)
-----------------._------ - - - - - -----------._-----------------_-_-Sr •.. _ .. _ NaIl1~ 01 TOWll.!llld C.p. ?'la. Block (within bra,:;kets)
Land use i.e. Area undu dlUalfll\t t,Pt! oflanll use In helltlras rounded Ull to .,. - ' . - .' t"o decimal places)' _-_.- - - - ---.----~--.--..I-------.-.--.--.------------:....:.--~ ....... .._..~-
Total Porest Irriiated - Ul1irril~ted Culturable' Area nOt· Area area by waste available
-- ----_.-. '--S-outU --. - - -Of -- - --- '--(In-cttldil]'a :-- for-Gaucher Cultivation an4 Groves)
~--------,.----..,----.-----.,----,--.-------.-.--------.---~------------------'1 Z " 3 ' • 4 5 6 7 8
~------------------~---~----------------------~-~------------
NIL
APPENDIX':-3
LIST Olf VILLAGES WHERE NO AMEN]TIES RELATING TO EDUCATION, MEDIC'AL, DRINKING WATER, -POST AND TELEGRA VI, COMMUNICATION,
fQ'WER Sl)PPLY AND MARKET/HAT ARE AVAILABLE
'Tl;lere is 110 such village in the district
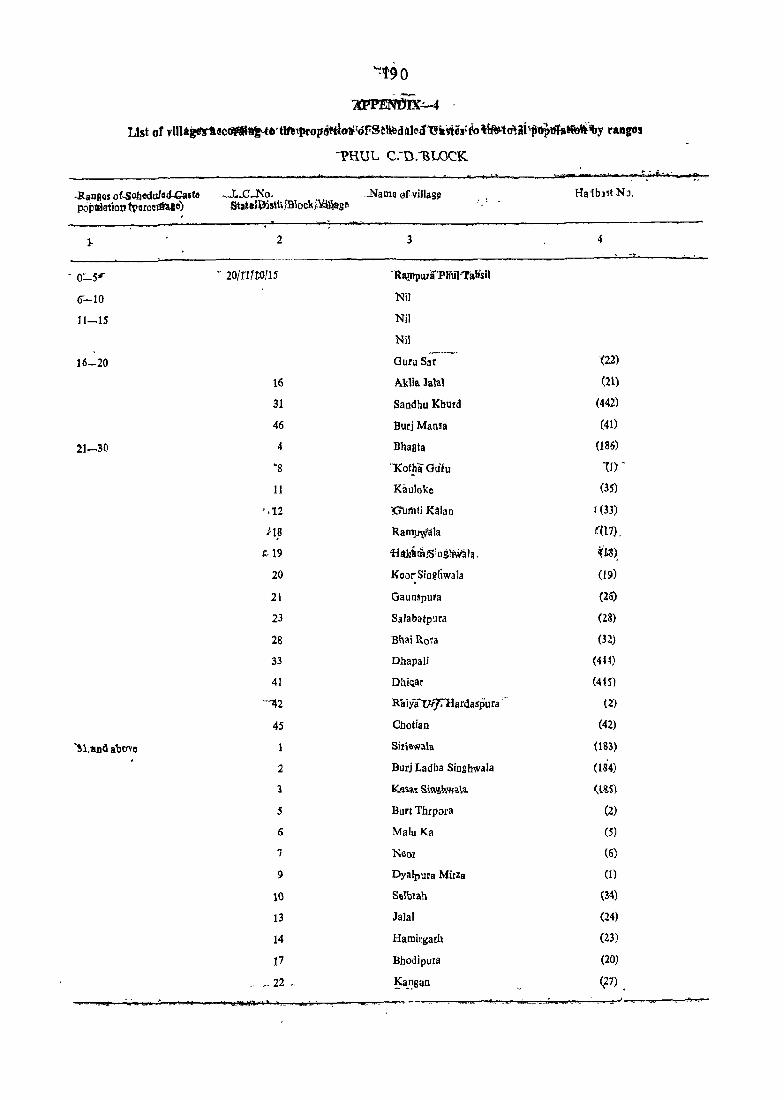
- 0~5"-
0-10
11-15
16-20
21-30
~!90
'Xpp~IX.:....4
ttst of vill.gql«c~o·tlA~ol16ft.lot!~Fg~1iedQled'1!ttnes·iolt~'to·'tiil~I));ifaWo\\:lby range~
-PRUL C.-n:'BLOCK.
2
- 20/rlfI.OIJ5
16
31
46
4
-8
11
.41~
t-19
20
21
23
28
33
41
"'~2
45
3
-RlqIlparaPhbl'1'atisiJ
Nil
Nil
Nil
Guru Sar
Aklia lalal
Sandhu Khurd
Burj Mansa
Bhaota
'Xotpi Gu'iu
KilUloke
!G'tlmti Ki1lan
RarnJ.i\Vala
illfki tilJS i 11 gh\¥'a] ~ ,
Kear: Singnwala
Gaunspula
Salabatp:lra
Bhai Ro!a
Dhapali
Dhi~ar
Riliia'"'Vf.r.Barda~pura "
Chotian
HaiblS! NJ.
4
(22)
(21)
(442)
(41)
(186)
11} -
(35)
1 (33)
({11L
~-~).
(19)
(25)
(23)
(32)
(441)
(4ts)
(2)
'!l;and abmc Sitiewala
(42)
(183)
(184)
<~%Sl
2
3
5
6
7
9
10
13
14
17
,,- 22 "
Bud Ladha Singhwala
K'l~'I. S\\\!!.J...W'l.\a
Burt Thrpora
Malu Ka
NOOl
Dyalpura Mirza
Stllbtah
Jalal
Harnir~alh
Bhodipura
~a.~gan
(2)
(5)
(6)
(1)
(34)
(24)
(23)
(20)
(21) .
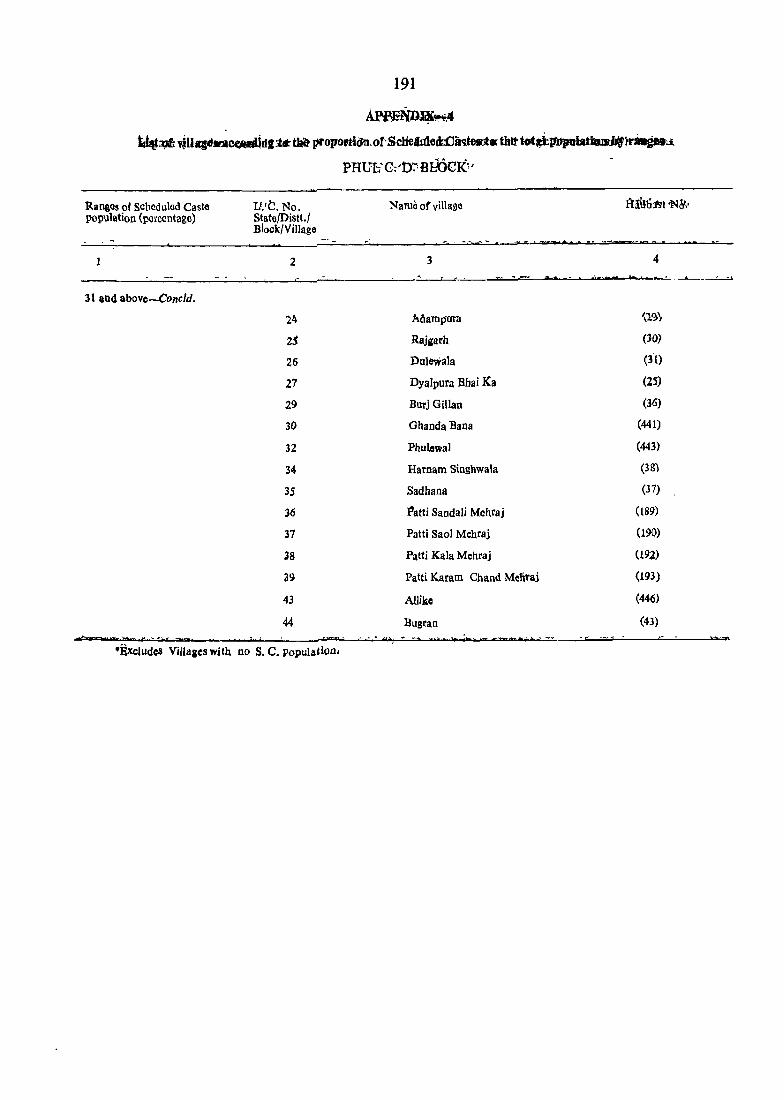
191
A.p.pFlVn~~4
iG"~ "ju.ltllcC;ltWlidl_tlIlt ptoporti(Jn,of'SclieMect1JINtut.thl' tot~tfJlpulat_jfi1""'.J.
PHUI:iC~'D~BilicKv
'Rangos of Scheduled Caste IJ.'C. No. Nama of village llIllb 1'1t <N "". population (percentage) State/Distt./
Block/Villago . 1 2 3 4
::II:Ii ~"' .. ' ... II:!:. ~ ~
31 and abovc-Conc1d.
24 AlIampUl"d '\1.?~
25 Rajiarh (30)
26 Dulewala (30
27 Dyalpura Bhai I(a (25)
29 Burj Gillan (36)
30 Ghanda Bana (441)
32 Phulcwal (443)
34 Harnam Singhwala (38)
35 Sadhana (37)
36 Patti Sanda Ii Mehraj (189)
37 Patti Sao1 Mehraj (190)
38 Patti Kala Mehraj (192)
39 Patti Karam Chand Mel\taj (193)
43 A!like (446)
44 Bugran (43)
.,.., M'- .. t ... ··hl 1:ire . 'j t .. ~,...."'t • • .... 'itk --, H:: 'It .... err .ern.« r . 1 -¥ • C -5- ...
'ExcludeS Villa&es with no S. C. populdiolll
, ..

1~.2 . AP'PENDIX-4
ti~t·of' villaics accOTdtn~ to th~ propdrtiol( of Scheduled Castes to tl~ 'ot_l- popuIatldllo by rAng~ RAMPURA -C.-D, BLOCK
Ranies of Scheduled Caste population' tporcenta ge)
0--;5 ..
6-10
11-15
16-20
21-30
. H and .bove
L.C.No. State/DisH./ Block/Villarc
2
20/11/20/50
63
65
69
51
53
55
57 .' 60
61
64
70
-7J.
73
74
47
48
49
52
54
56
58
59
62
. 66
67
68
?1 15
tCi
_'~luQel ViUqea with DO S. C. populatios\
3
Rampura Pbu) Tamil
Nil
Nil
Nil
laid,!n
Ram Niwas
Dhado
Ghureli
Pi tho
Bhundcl
Balianwali
Gill Khurd
Mansa Khurd
Hari Kishan PUla
Dikh
Ghurlllla
Chandke
Khokhar
Sooch.
Gill Kalan
Karat'"aJa
Jethukc
Ran1pura
Kotra
Dauiatpufa
Nandgarh Kotra
Jhil.odukc!
MandiKhurd
Mandi KalAn
Badial.
!tOndan
Ballob.
Bhaini Cbllbat
Pirkot
Hadbast No.
4
(46)
(4)
(3)
(<<8)
(45)
(449)
(6)
(S)
(l2)
(10)
(2)
(49)
:450)
(3) .
(41
(4)
(44)
447)
(72)
(13)
('7)
(9;
(li)
(5)
(2.
(41,
di)
(4~
(452)
(4Si~
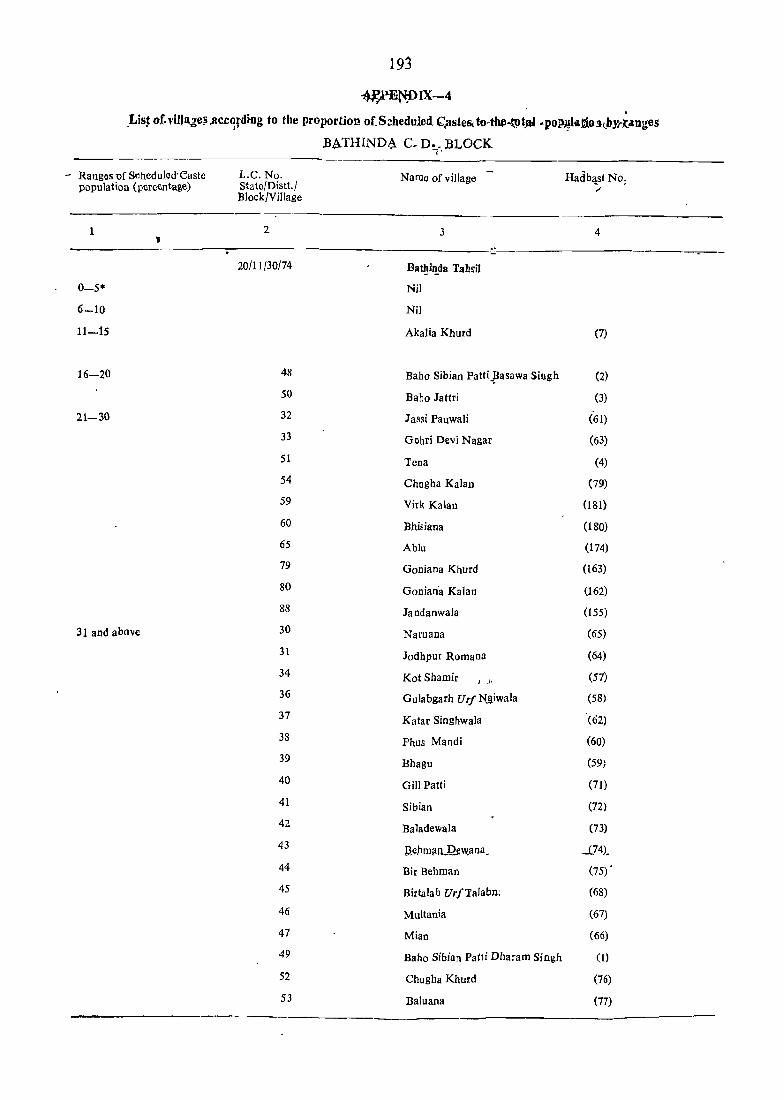
193
*,~F:NPIX-4
.List of. viJl~,ge1i .ac.cqrding to the proportion of. S~heduled. ~.astes. to4IuH:~t~~ ~ POll~llljj911tPy,.r.anges
BaTHINDt,\ C. Do. BLOCK .."
- Rangos uf Sc:hodulorrCastc population (ptlrc~tage)
0-5*
6-10
11-15
16-20
21-30
31 and above
L.C.No. State/Distt./ Block/ViIlage
2
20/11/30/74
48
50
32
33
51
54
59
60
65
79
80
88
30
31
34
36
37
38
39
40
41
42
43
44
45
46
47
49
52
53
Nama of v iIlage
3
Bat~I'!.da Tahsil
Nil
Nil
AkaIia Khurd
Baho Sibian Patti~!Jasawa Siugh
Baho lattri
lassi Pauwali
Ciebri Devi Nagar
'lena
Chugha Kalan
Virk Kalan
Bhisiana
Ablu
Cioniana Khurd
Cionian·a Kalan
landanwala
Naruana
Jodbpur Romana
Kot Sbamir J J.
Ciulabgarh Urf .!I@iwala
Katar Singhwala
Ph us Mandi
Bhagu
Ciill Patti
Sibian
Ba1adewala
p'e]1mila1lew.ana_
Bir Behman
Birtalab UrfTalabn;
Multania
Mian
Ballo Sibian Patti Dharam Singh
Chugha Khurd
Baluana
4
(7)
(2)
(3)
(61)
(63)
(4)
(79)
(181)
(180)
(174)
(163)
(162)
(155)
(65)
(64)
(57)
(58)
(62)
(60)
(59;
(71)
(72)
(73)
_(_74).
(75) •
(68)
(67)
(66)
(1)
(76)
(77)

194
APPENDIX-4
List of viUages according to the proportion of Schedilled Castes to the total population by rrutges
Ra~gos of Scbcsdu1ed Caste population (percentage)
1
L.C.No. State/Distt.} B]ook/Village
2
• BATHINDA C: D. BLOCK
Name of village HadbastNo.
3 4
----~-------------BatbiDda Tahsil
31 and above-COIIdd. 55 Jhumba (5)
S6 Sa1dargarh (80)
57 Karamgarh Sattran (78)
58 Virk Khurd (182)
61 Bud Mohma (178)
62 Deon (177)
63 Mehma Bhagwana (176),
64 Killi Niha] Singh (179)
66, Mohma Sarkari (115)
67 MehmaSarja (168)
68 Nehianwala (167)
69 Mehma Sawai (169)
70 Balahat Mehma (170)
71 Dan Singhwala (171)
72 Ganga (173)
73 Warkandi (172)
7S Akalia Kalan (8)
76 Chak Goniana Khurd (165)
77 Balahar Vinibu (166)
81 Amargarh (161)
82 BboIchra (160)
83 Khialiwala (159)
84 Har Raipur Uri Bbokhri (158)
87 Jeeda (153)
89 Khemuana (154)
·BxcludCS VillaiCS with no' S. C. population.

195
APPENnJX-4
Ltst or villages according to tbe proporti('D of Scheduled Castes to the total popuIa(Joa by raq_
NATHANA C. D. BLOCK.
Ranglls of Scheduled Caste L.C. No. Naille ot villago Ha~blst No. poPulation (percentaga) Stata/Dist!./
Block}ViIlaga
1 2 3 4
20)11}40} 108 Batbioda Tab.!il
0-5'" Nil
6-10 Mehna (115)
11-15 Nil
16-20 97 Burj Dalla (184) -
21-30 90 Giddar (181)
.91 Bajoana (l83)
93 Kalian Maika (186)
109 BhucQo Kalan (201)
115 Lahra Khana (2()2)
117 Lohra Baga (260)
31 and above 92 Kalian Sukba ~ (185)
94 Kalian Sudha (187)
9S Bhaini (188)
96 Mari (191)
98 Nathpura (182)
99 Ganga (180)
100 Nathana (179)
101 Poohla (198)
102 Poohli (178)
103 Dhileswan (177)
104 Saman (199J
105 Gobindpura (176"'"
106 Joganand (173)
107 Bibiwala (114)
110 Bhucho Khurd (201)
111 Tungwali (208)
112 Cbak Fatah SingbwaJa (20S)
113 Cbak Ram Singhwala (204)
114 Chak Bakbta (203)
116 Bud Kahan Singbwala (206)
118 Batb (197)
119 Lohra Moltabat (196)
120 Lchfa Sondha (195)
121 Lcbta Dhu] kot (194) ... .; ~ ...... ""
. _ _ ........ ,,~ ~ .. ~-.. *Excludes ViUases-with ijO S. C. popUlation.

1961'.
APP~ND][,X..!:..4 1 :i(o(vlUiige§'accoj!clfng:~o 'tfi~ pfopOrti~ 'Of'Sclie}~i~d Castes to -the totai population by ranges
sA-NdNr-e~IY.BLOCR.
Ranges of Schedulod Caste population (per.::entage)
6_10
11-.15
16-20
21-30
... ... -_ ..... L.C. NJ. Stat~{Distt.! Hlock/Village
20/11/50/9
10
2
6
7
8
13
14
is
19
20
21
22
23
26
1
2
3
3
l\'amt' of vil1ago
3
Ta(walldi Sabo Tabsil
Nil
Nil
Nil
Tarkhaneswala
Bathinda Tahsil
Ghudda
Tahvandi Sabo Tahsil
Amarpur UrfGurthuri
Fakka Kalan
B:ithinda Tahsil
B~m Biha
Talivandi Sabn Tahsil
PhaJara Sckhu
Blgha
Bathinda Tahsil
Bajak
Bandi
KotJi SlbJ
Faridkot
Kishanpura Ur/Kutti
Jassi Bagwali
MuhJan
Talwandi Sabo Tahsil
Dunowala
Da thinda Tahsli
Phulo Mithi
Talwandi Saba Tahsil
Kaile Bandar
'BafJ:inda Tabsil
Raike Kalan
Bahadargarh Jandian
LoolBai
l'alwandi Sabo Tabsi{
rIadbast No.
4
(118)
(89)
112)
114)
(85)
(117)
(119)
(98)
(107)
(105)
(lOS)
(110)
(tIl)
(101)
~) I)
(56)
(83)
(82)
(81)
Jodhpur-B~gga-Sjngh-.- - _-(116) - -
____ -- ____ --~ _____________________________ ----------------~~.J ~-~ __ ~ ____ ~.---~--

197
APPENDJtX-4
List oMi&lag'i~c,otdjng to,the, propolltion·of Scheduled Castes to the totlll popu1a~oD by ranges·
SA~0A,.T C. D. BLOCK
Ranges of Sched;led Caste population (percentage)
31 and above-contd.
1.e. No. State/DisH./ Block/Village
2
4
4
5
5
6
7
8
11
12
16
17
17
18
18
19
20
21
22
23
24
24
25
Name of village Hadbast No.
3 4
Bathindl! Tahsil
Jfmghi Rana (86)
1a h,andi Sabo Tahsil
Chak Hira Singhwala/Pakka (115)
:Qathinda Tahsil
Raike Khurd Uri Chak Dana (84)
Talwandi Saho Tahsil
Bl!n,gi Raghu (40)
SukhLadhi (39)
Bathinda Tahsil
KaUha Rani (104)
Chak Attar Singhwala (103)
Nandgarh (88)
Dhunike (102)
Pathrala (108)
Chak Kharak Singh Doomwali (109)
Talwaudi Sabo Tahsil
Bangi Ruldu (37)
Bathinda Tahsil
Chak Ruldu Singhwala (113)
Talwaudi Sabo Tahsil
Bangi Nihal Singh (38)
Bangi Dipa Singh (41)
Malwala (42)
Bhagwangarh/Bhukhianwali (42)
Bathinda Tahsil
KotGuru (100)
Talwandi Sabo Tahsil
Shergarh (95)
Bathinda Tahsil
Sangat Kalan (99)
Talwandi Sabo Tahsil
Manwala Uri Kisllangarh (43)
Bathinda Tahsil
Anoorgarh Urf Machhana (98)
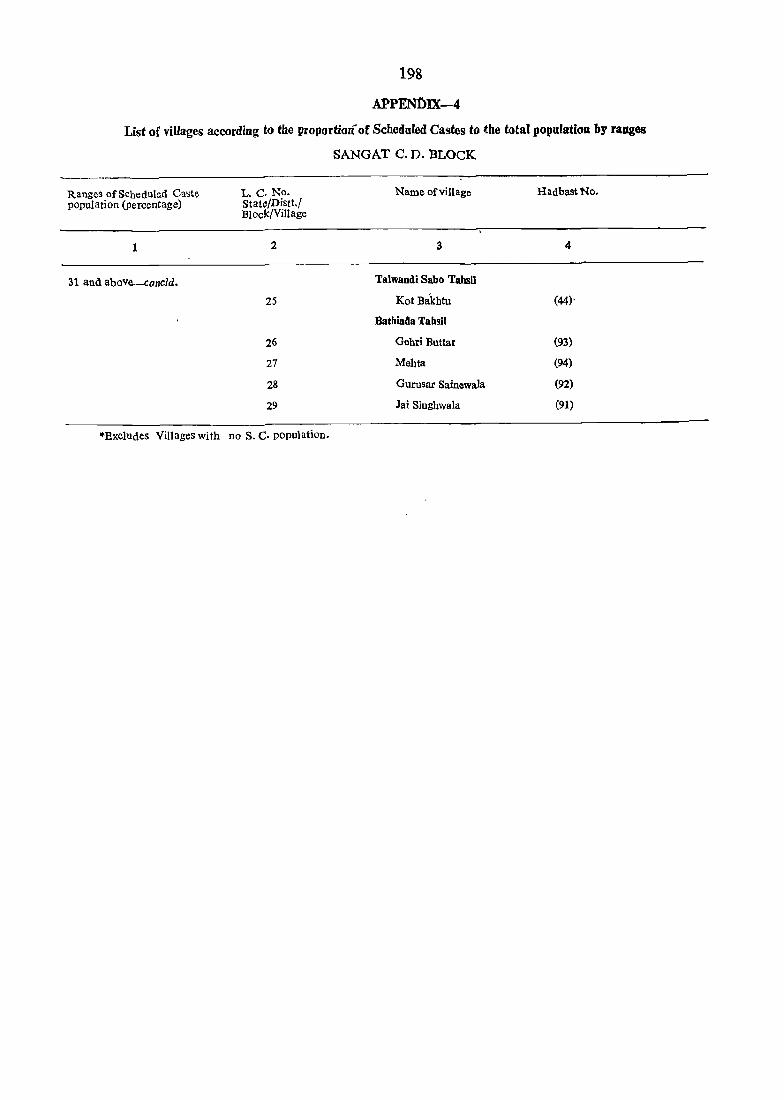
198
APPENf>JX-4
List of villages according to tbe proportion of Scheduled Castes to the total population by ranges
SANGAT C. D. BLOCK
Ranges ofSchedulc.d Caste L. C. No. population (percentage) State/DisH./
Bloc!</Village
Name of village HadbastNo.
1 2 3 4
31 and above-concld. Talwandi Sabo TabsU
25 Xot Bakhtu (44)'
Bathinda Tahsil
26 Gehri Buttar (93)
27 Mehta (94)
28 Gurusar Sainewala (92)
29 Jai Singhwala (91)
*Bxc}udes Villages with no S. C. population.

199
,APPENblX-4
List of vUlaaes according ta the proportion 'of Schedule.d Cast~s to ta~ total population by ranges
TA(WANDI SABO c.b. 'BLoCK
Ranges of Scheduled Caste population (percentage)
1
6-10
11-15
10-.20
21-30
L.C.No. State/Distt., Block/Village
2
20/11/60/39
79
56
71
84.
12
28
40
46
65
69.
74
78
83
14
15
32
33
34
35
41
'43
44
4S
49
51.
S4
57
6b
64
67
Name of village
3
Talwaudi Sabo Tahsil
Manak Khana
Mirdziana
Sawaitch
Jogewala
Qolewala
Phulo Kbari
Chathewala
Rai Khana
Kutiwal Khurd
MahiNangal
T~ona Pujarian
Sin go
Mcnuana
.Ka1alwa1a
Ga'wali
Malkana
Bangher Char at Singh
Natt
Le1ewala
Bathind, Tabsil
Dhan Singh Kh~n_a
TaJwandi Sabo TahSil ..... Kishangarh/Chinarthal
Maisar KhilDa
Thamangarh
Kutiwal Kalan
Jatri
MansaKalan
I<:otIi Khurd
Sandoha
Ram Tirath Joga
Bhagi Bander
Jajjal
"
Hadbast No.
4
(20)
(136)
(88)
(128)
(142)
(124)
(54)
(21)
(67)
(45)
(130)
(138)
(137)
(145)
(127)
(125)
(48)
(47)
(28)
(23)
(19)
(17)
(65)
(66)
(25)
(13)
(86)
(12)
(32)
(46)
(35)

200
APPENDIX-4 List of villages according to the proportion of,. Scheduled Castes to the..totI1J pOPJlJatioal:\v,,!'nges
TALWANDl SABO C. D. BLOCK
Ranges of Scheduled Caste L.C.No. Name of .village ~Hadbast-No. Population (Percentage) State/Distt,1
BJock/VilIage
1 2 . 3 4
Talwandi Sabo Tahsil
21 ..... 30-concld. 70 Taraogali (129)
72 Behman Jassa Singh (133)
76 Nathena (141)
&1 Kaureana (143)
82 Raya (144)
85 Fatah Balu (146)
31 and above 10 Ram Sara (122)
11 KanakwaI Uri Rattangarh (123)
13 Giana (126J
16 Kamalu (120)
27 Jeon Singbwala (55)
29 Kot Bbara (53)
30 Ramgarh Bhunder (51)
31 Banghar Mohabat Singh (49)
35 Jodhpur Pakhar (27)
36 Bud Serna (50)
'37 Bhai Bakhtour (24)
38 GhasoKhana (22)
42 Gchri Bara Singfi (18)
47 Ram Nagar Urr Kasaiwara (16)
·48 Maur Charat Singh (15)
50 Mari (26)
-52 Burj (14)
53' Rajgarh Kuba (11)
55 Kamalu (87)
58 Shekhpura (29)
59 GadhlanwalilBhagwanpura (30)
61 Fatehgarh Nouabad (33)
62 Gurusar JOga (132)
63 Talwandi Sabo (34)
66 Lcleana (36)
68 Sangat Khued (131)
73 Behman Koer Singh (134)
75 Nangla (149)
77 Lebri (139)
80 Gehlewala (135)
1"Excludes Villages with no S. C. population.

201
APPENDIX......-4 -
List of villages according to tbe proportion of Scbedilletl Gastes to the total population by ranges _ - -.., Jr ....
~ 1HUNIR C. D. gLaCK .,."..-;- ..., ", ... ",,. ...
Ranges of Scheduled Casto L.C.No. Name of village. Hadbast No. population (percentage) 0 State/DisH./
B1ock/ViJlage
1 2 3 4 -------- - - --Mauss Tahsil
0-5· 20/11/701138 Khi.ara Kalan (198)
6-10 132 Jhanda Kalan (199)
i45 Dhigana (194)
146 Lohgarh (19S)
11-15 109 Bhalaike (105)
165 Chhachhoher (151)
16-20 95 Karamgarh Urf Rovtawali (83)
9.:1 Chahlenwa la (89)
118 Kotra (148)·
119 Ghudawala (150)
137 Karandi (201)
139 Khiara Knurd (197)
169 Khiali Chahlanwali (163)
21-30 74 Dullowala (112)
9J Uddat Bhagat Ram (110)
92 -Bajewala (107)
93 -ChhapianwaIi (1O~)
97 '-Talwandi Akalia (82)
102 Peron (93)
103 Raipur (94)
105 Javrkian (96)
109 Barewala Jattan (104)
110 - Dasahrid ia (106)
111 "'Burj Bhalai (102)
112 Aullak (98)
113 Jagatgarh Bandral1 (99)
116 Jatana Kalan (147)
123 Fatta Maluka (166)
126 Sardulewala (l84)
129 Sardulcgarh (189)
131 Jhanda Khurd 087)
133 Nahran (2()()
136 Jitajrana (202)
140 Kavriawra (196)

202 '.
APPENDIX-4
List of villages a.ccording to the proportioJ{ of SChtfduled Castes to tbe total population by ranges
JHUNIR C. D. BLOCK
Ranges of Scheduled Caste population (percentage)
1
21-30-concld
31 and above
L.C.No. State/Distt., Block/Village
2
144
150
153
161
162
166
170
171
172
173
174
71
72
89
91
96
98
100
101
104
106
107
114
115
117
120
121
122
124
125
127
128
130
Name of villa&e
3
Mansa Tahsil
Ahalupur
Adamke
Karipur Dumb
Moffer
Nandgarh
Kourewala
LalianwaJi
Raman Mandi
Bhaman Kalan
Bhaman Khurd
Lakhrnirwala
Saharna
Deluana
Maujian
KotDbarmu
Daliawali urr Gulabgarh
Banawala
Dbingar
Behniwala
Tandlan
Mian
Bishanpura/Jherianwali
Churhia
Kusle
Jatana Khurd
Fatebgarh Sahrianwali
Jhuuir
Makhewala
Mirpur Kilurd
Tibi Hari Singh
Kahnewala
Bhunder
Rurki
Hadbast No.
4
(193)
(168)
(178)
(161)
(160)
(156)
(152)
(153)
(154)
(155)
(123)
(121)
(122)
(109)
(111)
(90)
(91)
(134)
(92)
(95)
(1)7)
(103)
(101)
(100)
(149)
(lSI)
(164)
(165)
(182)
(183)
(13S)
(186)
(188)

203:, , -
APPENDIX;-4
List of "ilJal!es according to the prOfortion.ot'..Spbedul~d Castes to t.he i~taI ~OI.JnlatiOd by raoges
Ranges of Scheduled Caste population (pC!1'Centage)
31 and abovc-concld.
L.C.No. -S1ate/Dlstt./ BJock/Vl1lllge
134
135
141
142
143
147
148
149
151
152
154
155
156
157~
158
159
164
167
168
V5
-Excludes Villages with Do S. C. Population.
.... "'" - -lHU1jIl_t C;;:. D. BLO.C·K': _
Mans8"TiiiiSi1 Mankhora
Sangha
Sadhuwala
Phus Mandi
Bhalan Warha
Higna UtI Bbagwangarh
.Ranjitaarh Bandran
Mirpur Kalan
J\alike
Chotian
~Baran
Hilke
Jhanduke
Chian(lwala
Chak Mughnia
Patehpur
Dale1wala
Daacwala
Ghukni
Akanwali
4-
(204)
(203)
(190)
(191)
(192)
(179)
(180)
(181)
(161)
(169)
(171)
(176)
(170) ,
(171)
(173)
(174)
(158)
(162)
(172)
(124)
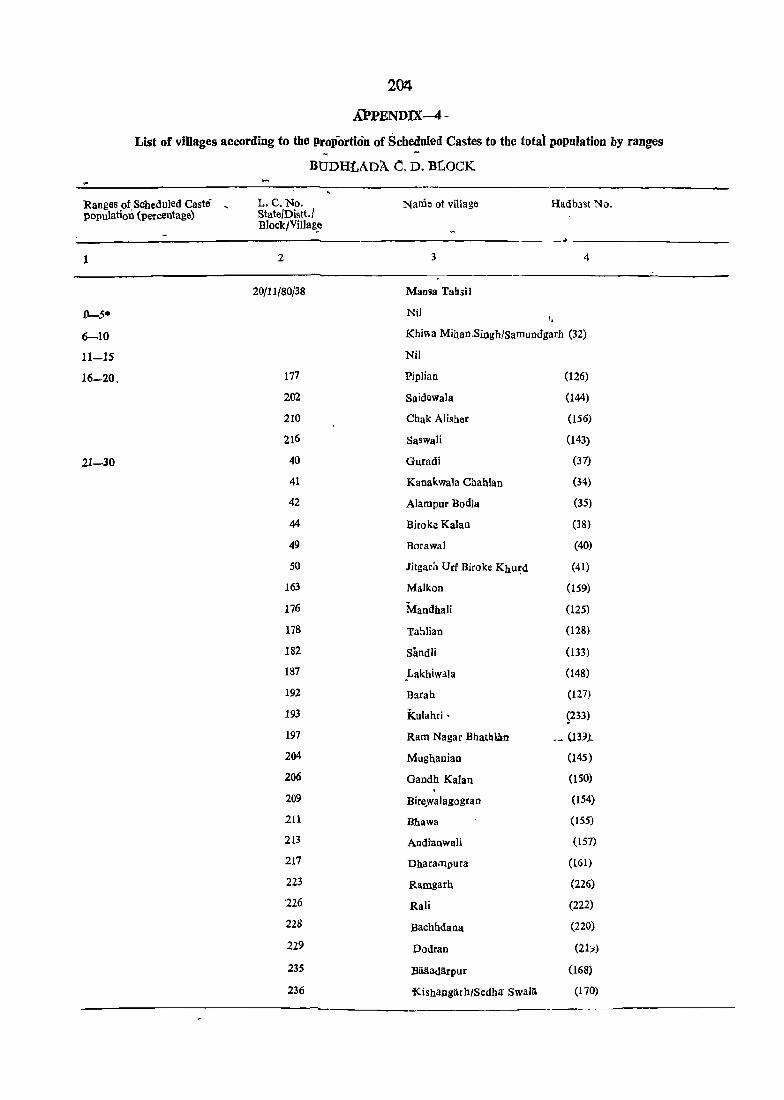
20~
Al»PENDIX-4 -
List of villages according to the Proportion of Scheduled Castes to tbe total population by ranges
BODHtADA C. D. BtOCK
R.anges of Scheduled Caste" , l'Iopulation (percentage)
1
6-10
11-15
16-20,
21-30
L.C.No. StateJDistt. J Block/Villag~
2
20/11/80/38
177
202
210
216
40
41
42
44
49
50
163
176
178
182
187
192
193
197
204
206
209
211
213
217
223
'226
228
229
235
236
Nani~ 01 village Hadbast No.
3 4
MIIQ9a Tabsil
Nil "
Khiwa MihanSingh/Samundgarh (32)
Nil
Piplian (126)
Saidewala (144)
Chak Alisher (156)
Saswali (143)
Guradi (37)
Kanakwala Chahlan (34)
Alampur Bodla (35)
Biroke Kalan (38)
Borawal (40)
Jltgarh Urf Blroke Khutd (41)
Malkon (159)
Mandhali (125)
Tahlian (128)
S1tndli (133)
_Lakhiwala (148)
Barllh (127)
Kulahri· ~233)
Ram Nagar BhatbUtn .- UH) ..
Mughanian (145)
Gandh Kalan (150)
Bire,walagogran (154)
Bhawa (155)
Andi'anwali (157)
Dharampura (161)
Ramgarh (226)
Rali (222)
Bachhdana (220)
Dodran (21::1)
Baaadarpur (168)
KishangarhlSedha swall~ (170)

205
APPENDIX-4
List of YiJlages according to the proplJrtion of Scheduled Castes to the total population by rangel)
BU:DHLADA C. D. BLOCK
Ranaes of Scheduled Caste population (percentage)
21-30-c0ncld.
31andabovo
t·e.No. State/Dist1., Block/Village
2
239
241
242
243
244
245
39
43
51
52
53
179
18(
18J
18~
18~
18~
lS~
t8l
18!
196
1'l
194
195
196
198
199
200
201
203
205
207
208
Name of village
3
Mansa Tahsil
Khudal Sekhpur
Kahangarh
Juglan
Mander
Kularian
Gorakh Nath
Heron Khurd
Bhadra
Gurney Kalan
Gurney Khurd
Hassanpur
Joian
Alampur Mandran
Udat Saidewala
Faridkll
Malakpur Bhimra
Hakamwala
Talabwala
Ganiwala
Boha
Kesampur Chhiod
Mal Singhwala
Ahmadpur
Phuluwala Dogran
Karlpuc
Rampur Mander
Kulaaa
Satiktl
Achaok
Suer Khanwala
GaudbKhurd
Reond Kalan
ReondKhurd
Hadbast No.
4
(172)
(f7&)
(177)
(178)
(179)
(ISO)
(33)
(36)
(42)
(43)
(44)
(129)
(131)
(132)
(134)
(135)
(136)
(149)
(147)
(137)
(130)
(138)
(232)
(231)
(230)
(140}
(227)
(141)
~142)
(146)
(151)
(152)
(153)
- _-- -

206
APPEl'IDix-4
List of vilJltges according to the lJroportion of Scheduled Castes to the total population by ranges
'Bub'HLADA C. D. BLOCK
Ranges of Scheduled Caste L.C.No. Name of village 'Hadbast No. Population (percentage) Stata/Distt. /
Block/Village
2 3 4
31 and above-foncld. Mansa TahsJ1
212 Bhakhrial (159)
214 Ramgarh Shahpurjan (158)
215 Todarpur (160)
2IS Sanghreri (163)
219 . Gobindpura (164)
220 Phuluwala Dod (224)
221 Dariapur (225)
222 Datewas (223}
224 Budhlada (Rural) (229)
221 Chakan (221)
230 Ranghrial (166)
231 Kbatriwala (169)
232 Dialpura (167)
233 Sirsiwala (165)
234 JalWtlbra (162)
237 Akbarpur Klludal (171)
238 Bakshil'lala (173)
240 Kbudal Kalan (174)
Bxcludes villillc with no S. C. population
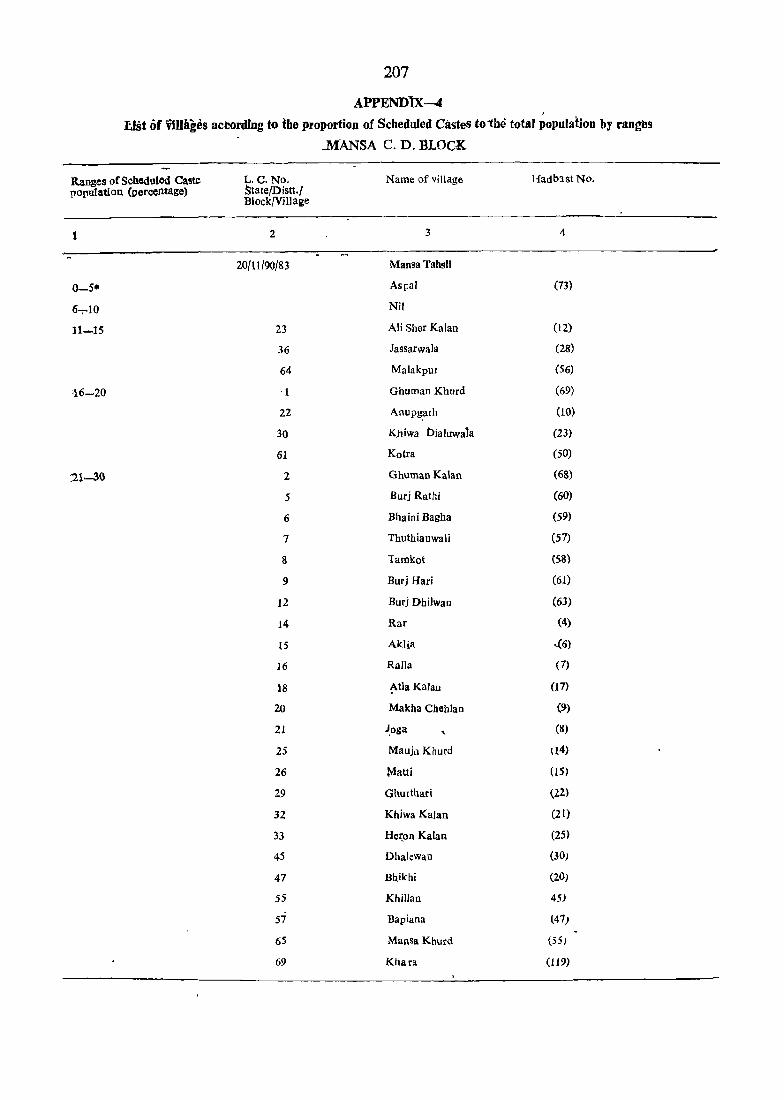
207
APPENDlX-4 . J:.ist of 'ViIlllges according to the proportion of Scheduled Castes to ibe total population by raugbs
Ranges of Scheduled CMte population (Dercentage)
1
6-;-10
11-15
'16-20
21-30
L.C.No. !;tate/Distt./ BI ock/Vill age
2
20/11/90/83
23
36
64
·1
22
30
61
2
5
6
7
8
9
12
14
IS
16
18
20
21
25
26
29
32
33
45
47
55
57
65
69
..MANSA C. D. I!LOCK
Name of villago
3
Mansa Tahsil
As{:al
Nil
Ali Sher Kalan
Jassarwala
Malakpur
Ghuman Khurd
Anup~arh
Kbiwa Dialuwala
Kotra
Ghuman Kalan
Burj Rathi
Bhaini Bagha
Thuthianwali
lamkot
Burj Hari
Burj Dhilwan
Rar
AkJia
RaJla
~tla Kalan
Makha Chehlan
~oga
Maujo Khurd
~atti
Ghu[thari
Khiwa Kalan
Het:_on Kalan
Dhalewan
Bbikbi
Kllillan
Bapiana
Mansa Khurd
Khara
Hadb'lstNo.
4
(73)
(12)
(28)
(56)
(69)
(10)
(23)
(50)
(68)
(60)
(59)
(57)
(58)
(61)
(63)
(4)
.. (6)
(7)
(17)
(9)
(8)
\14)
(15)
(22)
(21)
(25)
(30)
(20)
45)
(47)
(55)
(119)

208
Al'PEND.IX-4
List of villages 8(cording to the p~oportion of Scheduled Castes to tbe total populadoD .y rang ..
MANSA "C. D. BLOCK -.. _ ..... Ranges drScheduled Caste L. C.No. Name of village Hadbast No; population (percentage) State/Di stt./
BlockNillage
1 2 3 . 4
Mansa Tahsil
21-36.-.cmreld • 70 Hirewala (120)
80 Sadda Singhwala (72)
81 Kotli Kalan (9)
84 Man Bibrian (85)
87 Gehle (78)
94 Makha (81)
31 andabova 3 BhalDesa (71) . 4 Sukha Sin&nwala· (70)
10 Ubba (62)
11 Kbarak Sinllbwa)a (64)
13 Burj Jhabran (5)
17· Bbopal (16)
19 Ali Shor Khurd (11)
24 Maujo Kalan (13)
27 Atla Khurd (18)
28 Samaon (19)
31 Khi'flloa Khurd (2")
304 Hamirgarh urJ Dhaipal (26)
IS Bir Kburd (27)
37 HodlaKalan (31)
46 Mohar Singhwala (29)
54 Palta Bhaike (4')
5' Kat Lallu (54)
58 Kishangarh Urf Pbar (48)
59 Moola Singhwala (49)
60 Dale] Singhwala (51,)'
63 Khiala Kalan (52)
66 Chakerian (117)
67 Sarnala (116)
68 NarenderputaJBaglianwala (118)
73 Nangal Kalan (115)
75 Nangal Khurd (llJ)
76 Jawaharke (114,
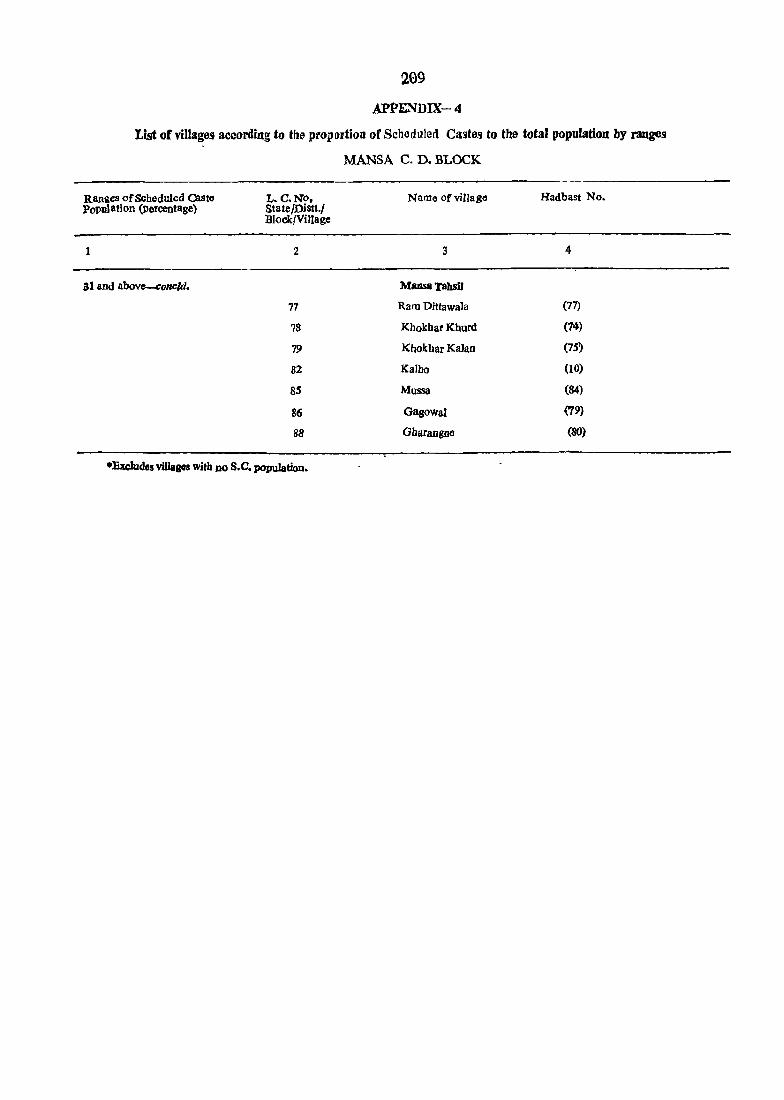
209
APPENDIX-4
List of villages according to tl1e prop()rtioD of Scheduled Castes to the total population by ranges
MANSA C. D. BLOCK
Ranacs of Scheduled Caste po]Jll)atlon (percentage)
1
81 and above-.concld.
L. C. No. State/Distt./ Block/Village
2
77
78
79
82
85
86
88
-&eludes villages with po S.c. population.
Namo of village
3
MansaTahsU
Ram Dittawa]a
Khokbar Kburd
Kbokhar Kalan
Kalho
Mussa
Gagowal
Gharangne
Hadbast No.
4
(77)
(14)
(75~
(10)
(84)
(79)
(SO)


~11
SECTION II TOWN DIRECTOR¥


213
CODES USED IN THE TOWN DIRECTORY

213

215
NOTE EXPLAINING THE CODES USED IN THE TOWN DIREctORY
The town directory has been compiled in six different statements for all the urban areas of the ..district. The data on amenities and other aspects have been presented iu codes which are explained below ;
.statement I :
This gives status and growth history of each town in the district.
Class has 'been introduced in all the statements of town directory to facilitate analysis for purposes ·of demographic and socio-economic characteristics of town. at the state and all India levels. It has been ;presented according to 1991 census popUlation of the core town in the following manner
Population, Class
1,00,000 and above I
50,000-99,999 II
20,000-49,999 III
10,000-19,999 IV
5,000-9,999 V
Below 5,000 VI
The civic administration status as in 1990 has been indicatea by the following abreviations. CensuS 1town is regarded as having no civic status. Code (C.T.) has. been used for census town.
Municipal Corporation
Municipal Committee
Cantonment Board
Notified Area Committee
Census Town
:Statement II :
=M. Corpn.
=M.C.
=C.B.
=N.A.C.
=C.T.
This gives for each town, physical aspects and location of towns.
'Statement m : This gives municipal finance for each town of the district .
. Statement tv :
This gives civic and other amenities. The abbreviations used are indicated below
.(1) Road length :
PR
KR
,(II) System of sewerage:
S
OSD
BSD
SD
=Pucca Road
=Kuccha Road
= Sewer
:= Open surface drains
=Box surface drains
=Sylk drains
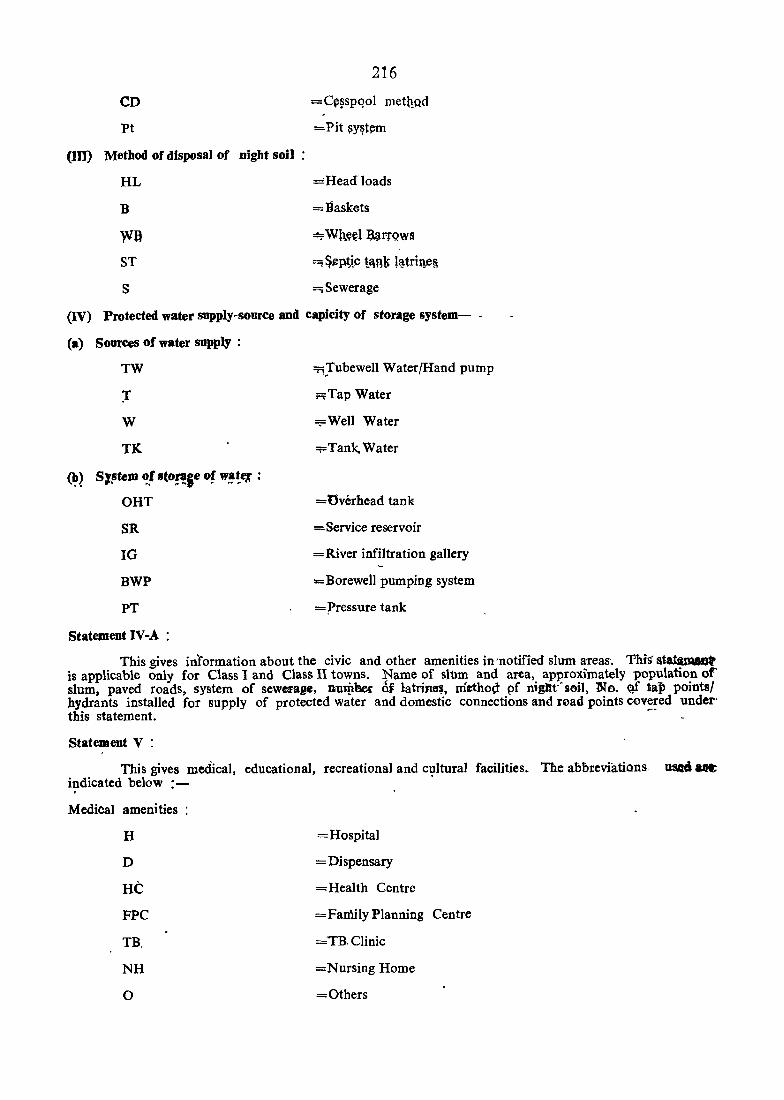
CD
Pt
(In) Method of disposaJ of
HL
B
Wll ST
s
night soiJ
216
=C~~spqol metQQd
=Pit ~y~t~m
=Headloads
= Baskets
---: Wlw~l &J.lfQW$
-:~~ptic l~nk l~tril1e~
=;Sewerage
(IV) Protected water supply-source and capicity of storage system- -
(a) Sources of water supply :
TW
:r W
TK
~~ S~~teJD '?,f st0!'!ie of W!!~{ :
ORT
SR
IG
BWP
PT
Statement IV-A:
.....,Jubewell Water/Hand pump
M'Tap Water
::;;=Well Water
::;:::TankWater
=Uverhead tank
= Service reservoir
=River infiltration gallery
=Borewell pumping system
= ~ressure tank
This gives inl"ormation about the civic and other amenities in 'notified slum areas. This'statimIIW is applicable only for Class 1 and Class II towns. Name of slum and area. approximately pupulation of' slum, paved roadS, system of sewerage. nUlPber 6f latr~, meiho(t pf night' soil. No. ~ tap points! hydrants installed for supply of protected water and domestic connections and road points covered under-this statement. _.
Statement V :
This gives medical, educational, recreational and cultural facilities. The abbreviatians ua Mt;
i~dicated below :-
Medical amenities:
H = Hospital
D = Dispensary
HC =Health Centre
FPC = Family Planning Centre
TB. TRClinic
NH =Nursing Home
0 = Others

A
U
Hom
217
= Ayurvedic
=Unani
= Romoeopathic
In case of allopathic, no separate code has been given. The information in Col. 4 on medical facilities has been presented horizontally in the same line as illustrated below :
R(A-I, 2) D(Hom-2, 1, U-I)
Here H(A-I, 2) represents one ayurvedic and 2 allopathic hospital and D(Hom-2, I, U-I) represents 2 homoeopathic, one allopathic and one unani dispensaries. If the medical facility is not available in a town, name of the nearest place (if in the same district) or nearest district (if in the same state) or other state and its distance from the town where the facility is available has been mentioned in column 4. '
Educational amenities:
The codes that have been used are as follows:
A
S
AS
C
AC
ASC
L
SH
Type
Sh. Type
o P
M
H
PUC
=Arts only
=Science only
=Arts and Science only
= Commerce only
= Arts and Commerce only
=Combined for all categories-Arts, Science and Commerce.
=Law
= Shorthand
= Typewriting
=Shorthand and Typewriting
= Others
= Primary School
=Junior Secondary or Middle Schools
=Matriculation or Secondary
= Higher Secondary /intermediatejpre-university /junior collegejlO+2 system whether held in schools or colleges.
If there are more than one institution of a type in the town their number has been given against each in brackets.
If any educational facility is not available in the town the name of nearest place (if in the same district) or the name of nearest district (if in the same state) or other' state and'-its distance from the town where this facility is available has been given in brackets.
Recreational and cultural facilities:
The following codes have been used:
PL
RR
Statement VI
=Public Library
=Reading Room
This gives information on trade, commerce, industry and banking for each town of the district.
Appendix to the town directory shows towns of the district which have outgrowths and population of outgrowths.

2J9
TQWN DIRECTORY STATEMENTS I-VI
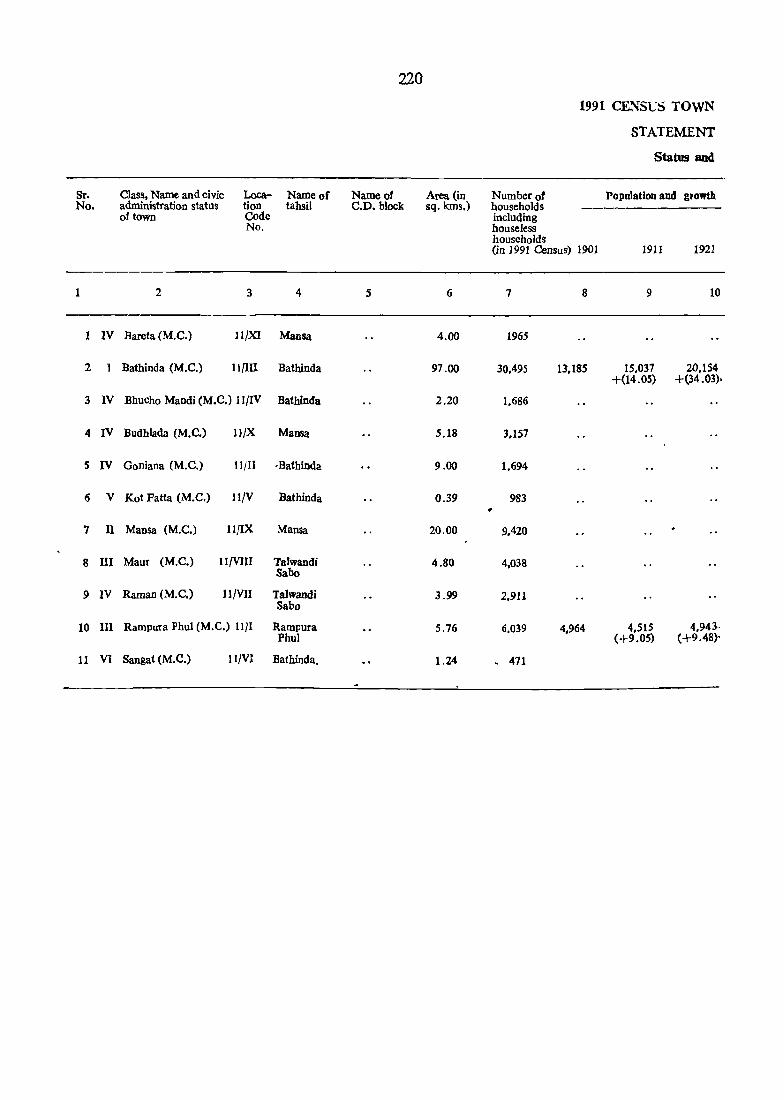
220
1991 CE.."JS1:S TOWN
STATEMENT
Status and
Sr. Class, Name and civic Loca- Name of Name of Area (in Number of Population and growth No. administration status tion tahsil C.D. block sq. kms.) households
of town Code including No. houseless
households (in 1991 Census) 1901 1911 1921
1 2 3 4 5 6 7 8 9 10
1 IV Bareta (M.C.) ll/Xl Mansa 4.00 1965
2 Bathinda (M.C.) 11/111 Bathinda 97.00 30,495 13.185 15,037 20,154 +(14.05) +(34.03).
3 IV Bhucho Mandi (M.e.) Il/1V Batbinda 2.20 1,686
4 IV Budhlada (M.C.) II/X Mansa 5.18 3,157
5 IV Goniana (M.C.) II/II -Bathinda 9.00 1.694
6 V Kot Fatta (M.C.) lI/V Bathinda 0.39 983 ,
7 II Mansa (M.e.) ll/IX Mama 20.00 9.420
8 III Maur (M.C.) ll{VW TaIwandi 4.80 4,038 Sabo
9 IV Raman (M.C.) ll/VII Talwandi Sabo
3.99 2,911
10 III Rampura Phul (M.e.) 11}1 Rampura 5.76 6,039 4,964 4,515 4,943-Phul (+9.05) (+9.48)-
11 VI Sangat (M.e.) II/VI Bathinda. 1.24 . 471

nllmcroRY
I
Growth History
rate or tbe town at the censuses or
1931 1941 1951
11 12 13
5.317
22,771 24.883 34,991 (+12.99) +(906) (+40.91)
1,624
8,369 5,364 7.071 (+35.91) (+31.94)
3,948
640
11,729 15,251 (+30.03)
3.847
6:446
Cl.836 9,515 14,409 (+38.30) (+39.19) (+51'43)
933 ( .. )
1961 1971
14 15
7.041 8.313 (+32.42) +(18.07)
52,253 65,318 +(49.33) (+25.00)
2.227 2,945 (+40.21) (+29.45)
8,620 11,713 (+21.80) (+35.88)
8.054 6,408 (+104.00) (+20.44)
3,808 4.308 (+495.00) (+13.13)
22,473 31,351 (+47.35) (+39.51)
10,944 13,407 (+184.48) <+22.51)
9,507 11,574 (+47.49) (+21.74)
19,700 23.406 (+36.72) (+18.81)
2.874 3.531 (208.04) <+22.86)
221
1981 1991
16 17
9,494 11.537 (+14.21) (+21.52)
1.24,453 1,59,042 (+90.53) (+27.79)
7.820 10,00 (+165.53) (+27.95)
15,968 18,717 (+36.33) (+17.22)
8,596 10,415 (+34.14) (+21.16)
4.973 5,611 ( +15.44) (+12.83)
43.289 . 55,089 (+38.08) (+27.26)
18,853 25,180 (+40.62) (+33.56)
14,318 17,275 (+23.71) (+20.65)
31,890 35.530 (+36.25) (+11.41)
2,859 2,731 (+19.03) (-4.48)
Density (1991) Census)
18
2.884
1,640
4,548
3,613
1,157
14,387
2.754
5,24<1
4,330
6.168
2,202
Sell ratio
1971 1981 1991
19 20 21
880 878 894
828 819 865
864 853 900
889 893 893
839 868 908
913 865 888
890 905 874
881 892 863
851 866 868
891 879 898
871 883 930

222 .'" ,.
STAn:~
Physical aspects ad
SI. Class and name of town PhysIcal aspects Namee. No.
RaintalJ (in Il!m) Temperature (In CGhtlgr'll1tl)" 'SCAte HQ __"._
Maximum Minimum
i 2 3 4 S 6
~ IV .Bareta 359.3 41.2 Sf! Chandi&¥h (169)
2 I Bathinda 876.0 41.2 5.1 Chandigarh (210)
3 IV- Bhucho Mandi 876.0 41.2 5.1 Chandigark (198)
.. " IV Budhlada 868.0 ~1.2 5.1 Chandigarh (174)
5 IV Goniana 876.0 <fl.2 5.1 Chandigarh (221)
(; V -Kot-Fatla 876.0 41.2 5.1 Chandi~h (225)
1 II Mansa 868.0 41.2 5.1 Chandigarh (175)
8 III Maur 868.0 41.2- 5.1 Chandgarh (187)
9 IV' taman 420.0 • 4i.2- 5.1 Chandigarh (238)
-fo m· Rampura I'hul m.o -~4l.2. 5.1 Chandiprh (184)
li vr Sangat 410.0 4f.z.. 5.1 Chandiprli (232)
.. ,

H
L9.~'fiQQ ~f t.~WQS, 1989
7 8 9 10 11 12
Bathinda Mansa Patiala Bareta Bareta (106) (35) (104) (0) (0)
lllltltiq<lll Bathinda Ludhiana Bathinda Bathinda (0) to} (136) (0) (0)
Batbinda Bathinda Bathinda Bhucho Mandi Bhucho Mandl (12) (ll) (12) (01 (0)
~thinda M~ Bathinda BU~Jada Budhlada 88) (88) (0 (0)
Batbinda lrathinda Bathinda Goniana Goniana (ll) (11) (Il) (0) (0)
Bathinda Bat~nda Bathin(.fa Kot F4tta Kot Fatta (26) (2 ) (26) (0) (0)
Bathinda Mansa Bathinda Mansa Mansa (55) (0) (55) (0) (0)
Bathiada T~rs~ndi Sabo Batbinda Mansi MaUl (43) (43) (0) (0)
Balhinda lalwandi Sabo Bathinda Raman Raman (45) (U) (45) (0)- (0)
Bathinda Rampura Phul Bathinda Rampura Phul Rampura Phul (26) (0) (26) (0) (0)
Batbinda Bathinda Bathinda Sangat Sall,at (2:2) (22) (22) (0) (0)

224 STATEMENT
Municipal FiJumee
SI. Class and Dame of Town Civic I{eceJpt (in Rs. '00)
No. administra- -----tion Receipt Revenue, Government Loan Advance status through derived grant (in 1990) taxes, etc. from
Municipal properties and power apart from tallation
2 3 4 5 6 7 8
1 IV Bareta M.e. 9.720 1.790 2,400 8,760
2 I Bathinda M.C. 3,85.241 27,316 40.540 1,500 7,174
3 IV 1ilhucho Mandi M.C. 1.620' 4.620 2,200 620 440
4 IV Budhlada M.C. 26,655 3.321 10,770 12.078 .588
S IV Goniana M.C. 15,690 2.260
6 V KotPatta M.C. 878 174 2,621 750
7 n Mansa M·9· 71,400 8,310 6,210 29,420 2.230
8 ill Maur M.C. 22.345 2.335 2,290 10,620 264
9 IV Raman M.C. 2.737 7.035 4.174 4,000
10 ill Rampura Phul M.C. 5.670 3,270 2.800 4,370 1,230
U VI SaDiat M.C. 2,575 394 1,0'09 SOO
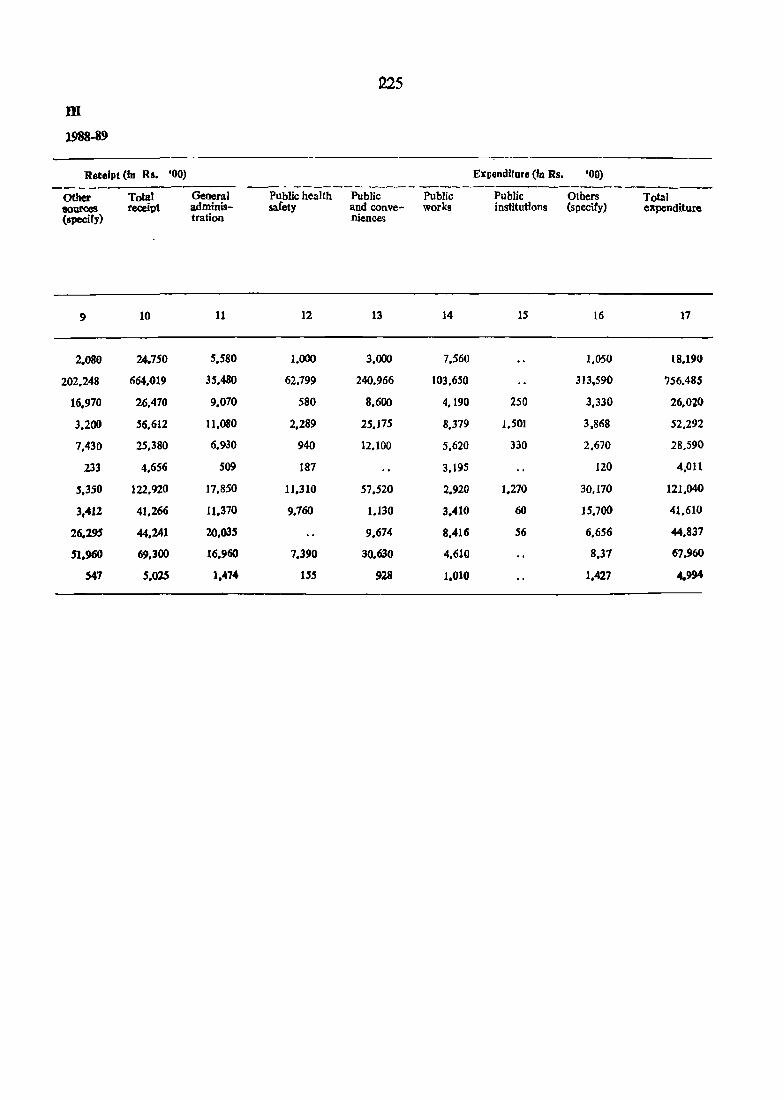
DI
19S8-89
Retelpt (In Rs. '00)
Other sources (specify)
2.080
202.248
16.970
3,200
7,430
233
5.350
3,412
26.295
51.960
S41
Total receipt
10
24.750
664.019
26,410
56,612
25,380
4.656
122.920
41,266
44,241
69.300
.5.0lS
General administration
11
5,580
35,480
9,070
11,080
6.930
509
17.850
11.370
20.035
16.960
1.474
1225
Public health Public Public safety and conve- works
nience9
12 13 14
1.000 3,000 7.560
62.199 240,966 103,650
580 8,600 4,190
2,289 25,175 8,379
940 12.100 5,620
187 3,195
11.310 57.520 2.920
9.760 1.130 3.,nO
9.674 8.416
7,390 30.630 4.610
1.55 928 1.010
ExpGnditure (In Rs. '00)
Public Others institutions (specify)
15 16
1,050
313,590
250 3,330
1.501 3,868
330 2.670
120
1,270 30.170
60 15.700
56 6.656
8.37
1.427
Total expenditure
17
18.190
756.485
26,020
52,292
28.590
4,011
121.040
41.610
44.837
67,960
4.994

SI. No.
1
1
.2
3
Il
5
6
7
8,
9
to
11
Class and name of town
2
IV Bareta
I Bathinda
IV Bhucho Mandi
'IV Budhlada
IV Goniana
V KotFatfa .
II Mansa
. III Maur
IV Raman
III Rampura Phu'
VI Sangat
----_.
Civic administration status (in 1990)
3
M.C.
M.C.
M.C.
M.C.
M.e.
.M.e.
M.e.
M.C •
M.C.
M.C.
M.e.
10 case this service is no.t availablo in the distanoe from the town.
116
Population
4
11.537
159,042
10,006
18,717
10.415
5,611
55,089
25.180
17.21S
35.530
2.731
town mention
Scheduled castes population
5
2,812
32,266
3,291
2.9~9
2,169
2,049
11.619
7.611
4,856
7.945
553
the name of
STATEMENT
Civic and· other
Number of Road length (in kms.)
System o.t sewerage -~-.-.,.._---
S~rvke
6 7
7.00 OSD.Pt
75.00 S.OSD
, 19.50 S.OSD
18.89 qSD,S
13.05 aSD.S
2.11 nco
25.56 S.·()SD
29.00 aSD,S
18.10 S.aSD
33.00 S.OSD
2.00 OSO.S
the nearest place where
Water borne
8
50
1,500
445
495
355
1,500
157
448
893
15
available
9
200
800
200
8S1
127
578
1.910
alongwitb
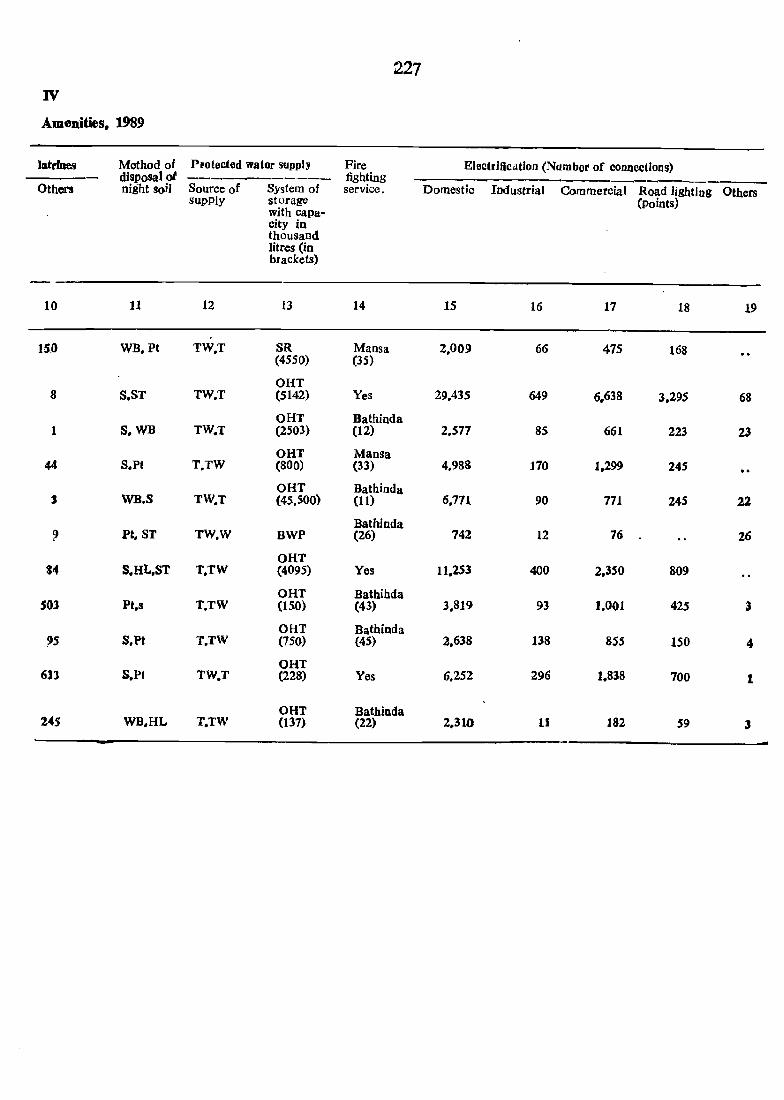
227 IV
Amenities. 1989
latrlnes Method of Protected water supply Fire EltlctrJflcation (Number of connections) disposal of ---------_ fighting ---Others night soil Source of System of service. Domestic Industrial Commercial Road lighting Otbers
sUPPly storage (points) with capa-city in thousand Jittes (in brackets)
10 11 12 13 14 15 16 17 18 19
. 15.0 WB,Pt TW,T SR Mansa 2,009 66 475 168
(4550) (35)
ORT 8 S.ST TW,T (5142) Yes 29.435 649 6.638 3.295 68
ORT Bathinda 1 S. WB TW.T (2503) (12) 2,577 85 661 223 23
ORT Mansa 44 S.Pt T,TW (800) (33) 4,988 170 1.299 245
OHT Bathinda .1 WB.S TW,T (45,500) (11) 6,171 90 771 245 22
Batbinda ? Pt. ST TW,W BWP (26) 742 12 76 26
OHT 34 S.RL.ST T,TW (4095) Yes 11.253 400 2.350 809
ORT Batbihda SOl Pt,s T,TW (15.0) (43) 3,819 93 1,001 425 3
OHT Bathinda ~S S.Pt T,TW (750) (45) 2.638 138 855 150 4
ORT 6]1 S.Pt TW,T (228) Yes 6,252 296 1.838 700 1
OHT Bathinda 2"5 WB.RL T.TW (ll7) (22) 2,310 11 182 59 3


STATEMENT IV-A Civic aDd other ameDities in ootified slums-1989
No slum area has been notified in Punjab State though certain pockets have separately been indentified.
229

Sr. Class and name of Popula-No. town tion
1 2 3
1 IV Bareta 11,537
2 I Bathinda 1.59.042
3 IV Bhucho Mandi 10.006
4 IV Budhlada 18.717
5 IV Goniana 10.415 \.
6 V Kot Falta 5,611
7 II Mansa 55.089
8 1Il Maur 25.180
9 IV Raman 17,275
10 III Rampura Phul 35.530
11 VI Sangat 2.731
230
STATEMENT
Medical, Educational Recreational, and
Medical facilities Educational
---------- --------------------------Hospitals/ Dispensariesl T.B. clinics etc.
4
H D (A)
H(A-l.4) D(A-2HOM -1.9) TB FC(2).O.
D
H HC FC
He D(A-I.I)
D(A)
H(2) D(A-l.-HOM-l)FC
H D(A-I,l)
H D(A-I.l) FC H(2)
Beds in medical institutions noted in column 4
5
25
269 22 25
4
30
10
112
25 4
10 12
56
D(A-I.HOM 12 1,3) 25 He PC
Artsl Medical Science/ Colleges Commerce Colleges (of degree level and above)
6 7
A Patiala (IC4)
ASC(2) Faridkot A(2) (63) 0
Bathinda Faridkot (12) (75)
ASC(2) Patiala (109)
AS Faridkot (74)
Bathinda Faridkot (26) (89)
ASC A Patiala
(110)
Talwandi Faridkot Sabo (18) (l05)
Talwandi Paridkot Sabo (13) (108)
AS (2) Faridkot (77)
Bathinda Faridkot (22) (85)
Engineer- Poly-ing technics Colleges
8 9
Patiala Patiala (W4) (104)
Bathinda Bathinda (0) (0)
Bathinda Bathinda (12) (12)
Bathinda Bathinda (88) (88)
Bathinda Bathinda (11) (11)
Bathinda Bathinda (26) (26)
Bathinda Bathinda (55) (55)
Bathinda Bathinda (43) (43)
Bathinda Bathinda (45) (45)
Bathinda Bathinda (26) (26)
Bathinda Bathinda (22) (22)
Recognised shorthand. typewriting and voCational training institutions
10
0(2)
0(3)
0(2)
0
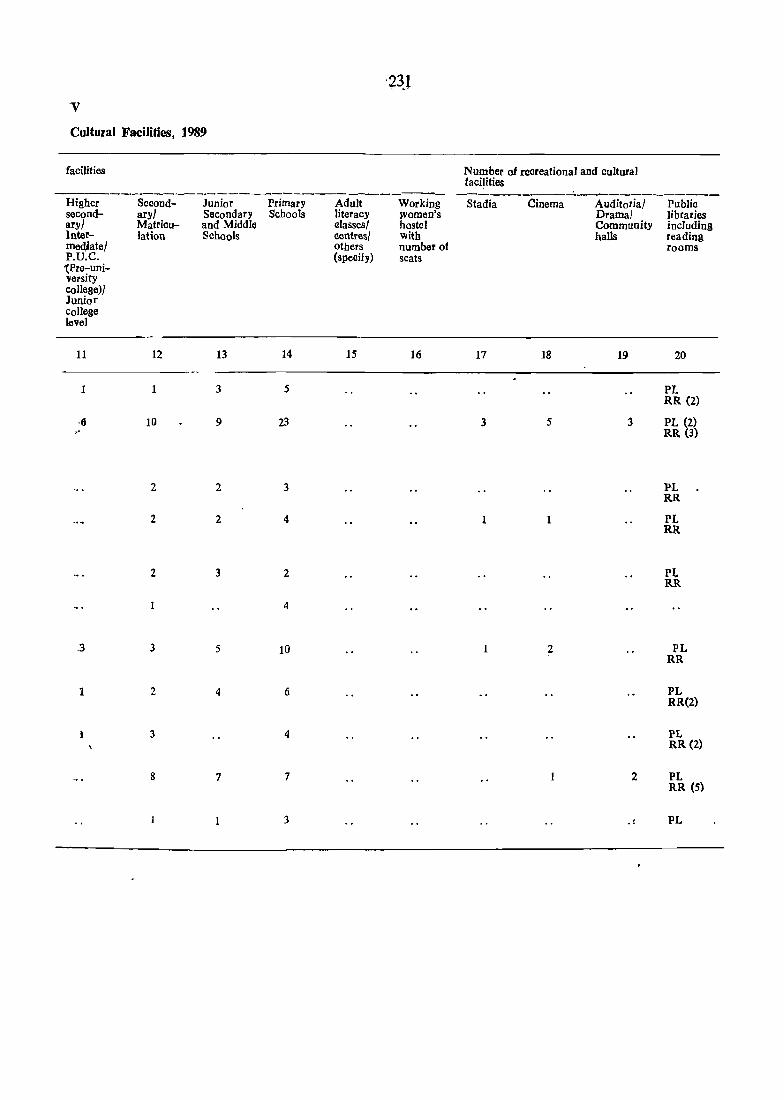
v Cultural Facilities, 1989
facilities Number of recreational and cultural facilities
-----------------------------_--_ -----------------------Higher secondaryl Intermed,iatel P.U.C. '(Pre-university college)l Junior college level
11
1
.'
3
1
1
Second-aryl Matricu-lation
12
10
2
2
2
3
2
3
8
Junior Primary Adult Secondary Schools literacy and Middle classes! Schools centres/
others (specify)
13 14 15
3 5
9 23
2 3
2 4
3 2
4
5 10
4 6
4
7 7
3
Working Stadia Cinema Auditorial women's Drama) hostel Community with halls number of seats
16 17 18 19
3 5 3
1
2
2
.,
Publio Iibralies including reading rooms
20
PL RR (2)
PL (2) RR (3)
P-L RR
PL RR
PL RR
PL RR
PL RR(2)
PL RR (2)
PL RR (5)
PL
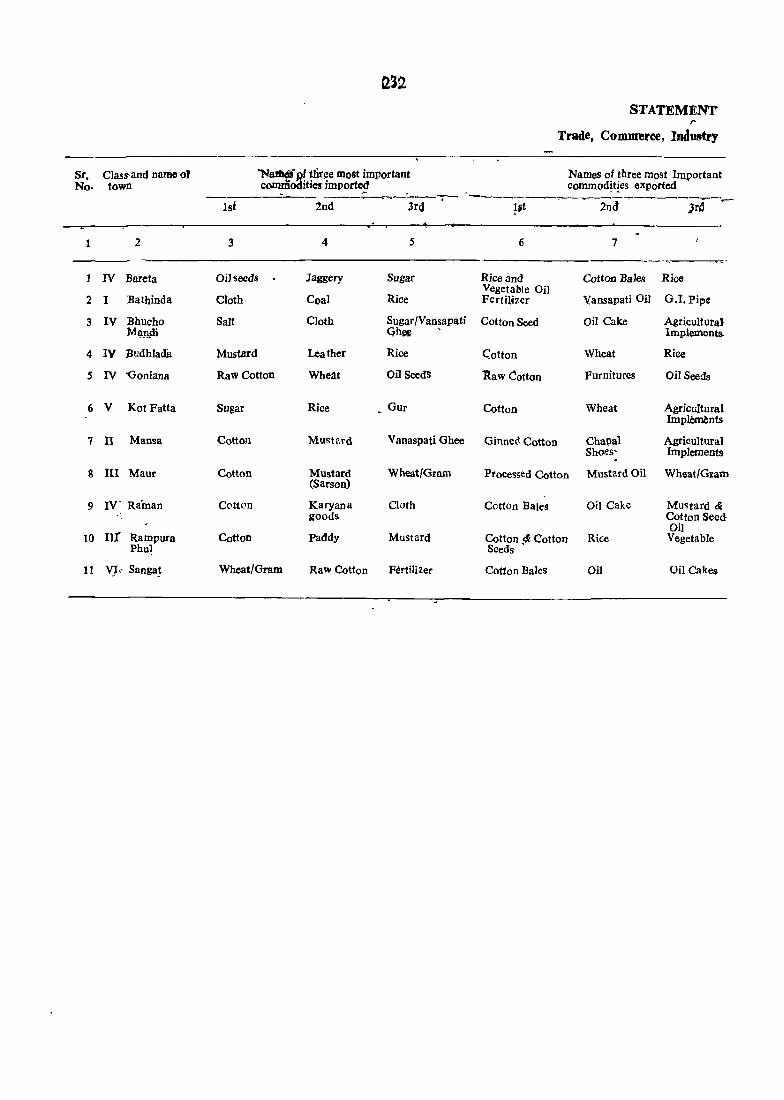
Sr. No.
1
Class-and name of town
2
1 IV Bareta
2 I Bathinda
3 IV Bhucho M;\npi
4 IV Budhlada
5 IV 'Goniana
6 V Kat Fatta
7 II Mansa
8 III Maur
9 IV - Raman
10 II! Rampura Phu!
11 VJ.' Sanga~
STATEMENT ,. Trade, Comnrerce, Industry
"NalflOii 91 tlir~ most important Names of three most Important commooities i1llported , commodit!es eXPorted
--lS-f----~--2-n-d--~-~--·3r-4-~- ----~---~-~2nd~-~-~~-~
3
Oil seeds
Cloth
Salt
Mustard
Raw Cotton
Sugar
Cotton
Cotton
Cotton
Cotton
Wheat/Gram
4
Jaggery
Coal
Cloth
Leather
Wheat
Rice
Mustard
5 6
Sugar Rice and Vegetable Oil
Rice Fertiltzer
Sugar/Vansapati Cotton Seed Ohee
Rice C:otton
Oil SeedS ~aw Cotton
, Gur Cotton
Vanaspati Ghee Ginned Cotton
7
Cotton Bales Rice
Vansapati Oil G.1. Pipe
Oil Cake Agricultural Implements.
Wheat Rice
Furnitures Oil Seeds
Wheat
Chapal Shoes-
Agricultural Imple~nts
Agricultural Implements
Mustard Wheat/Gram Processed Cotton Mustard Oil Wheat/Gram (Sarson)
Karyana Cloth goods
Paddy Mustard
Raw Cotton Fertili2er
Cotton Bales Oil Cake Mustard & Cotton Seed Oil
Cotton,~ Cotton Rice Vegetable Seeds
Cotton Bales Oil Oil Cakes
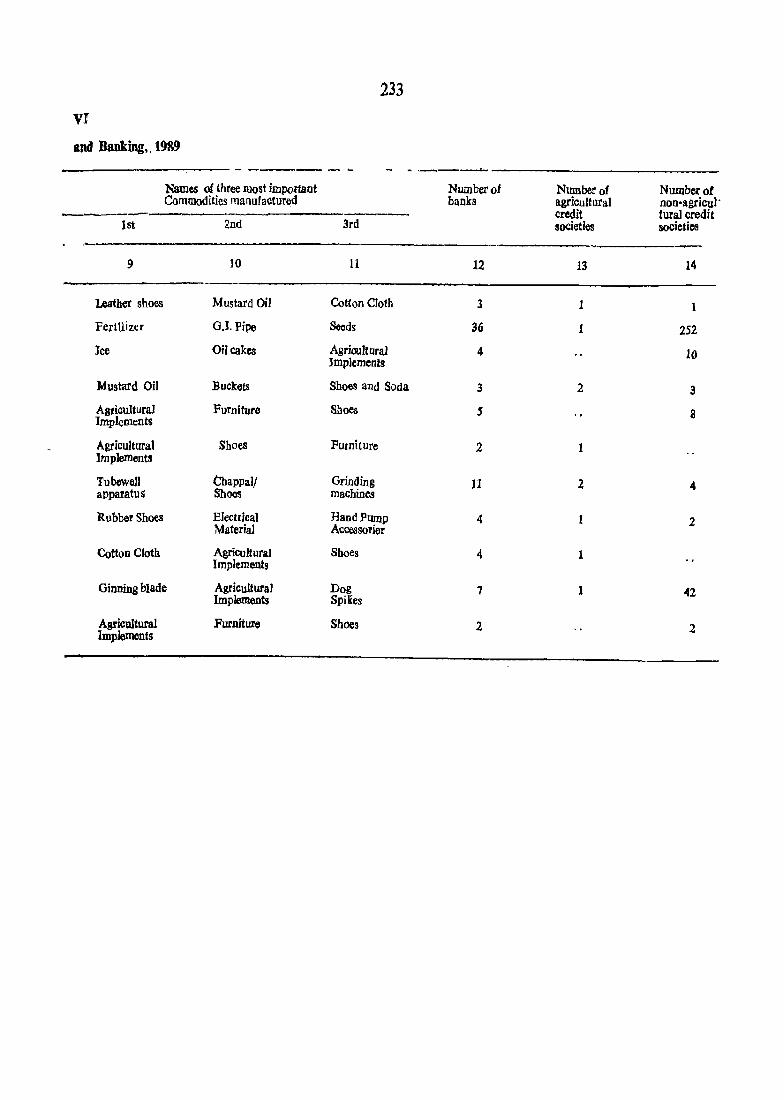
233
VI
and Banking" 1989
- ------- - -----'-Names of three lIlost impOrtant Number 01 Number of Number of Commodities manufactur~d banks agricultural non-agricul' --- .~---------- credit tural credit
1st 2nd 3rd societies societies
9 10 11 12 13 14
Leather shoes Mustard Oil Cotton Cloth 3 1
FertUizer GJ. Pipe Soods 36 1 252
Ice OiJcakes Agricultural 4 10 lmplements
.Mustard Oil Buckets Shoes and Soda 3 2 3
ASl'iculturaJ Furniture Implements
Shoes 5 g
Agricultural Sboes Furniture 2 1 Implements
Tubewe11 Chappall Grinding 11 2 " apparatus Shoes machines
Rubbet Shoes Electrical Hand Pump 4 1 2 Material Accessorier
Cotton Cloth AgricuHuraJ Shoes 4 1 Implements
Ginning blade Agricultural Dog 7 1. .(2 Implements SpiICes
Agricultural Implements
Furniture Shoes 2 2


Sr. No.
1
Name of the Town witi. Location Code
235
APPENDIX
Towns showing tbeir Olltgrowth with Population
Population of Core Town
Out Growth POpulation ctf Out Growth
--------------_._-------,3 4 s
Nil


237
PART B PRlMARY CENSUS ABSTRACT

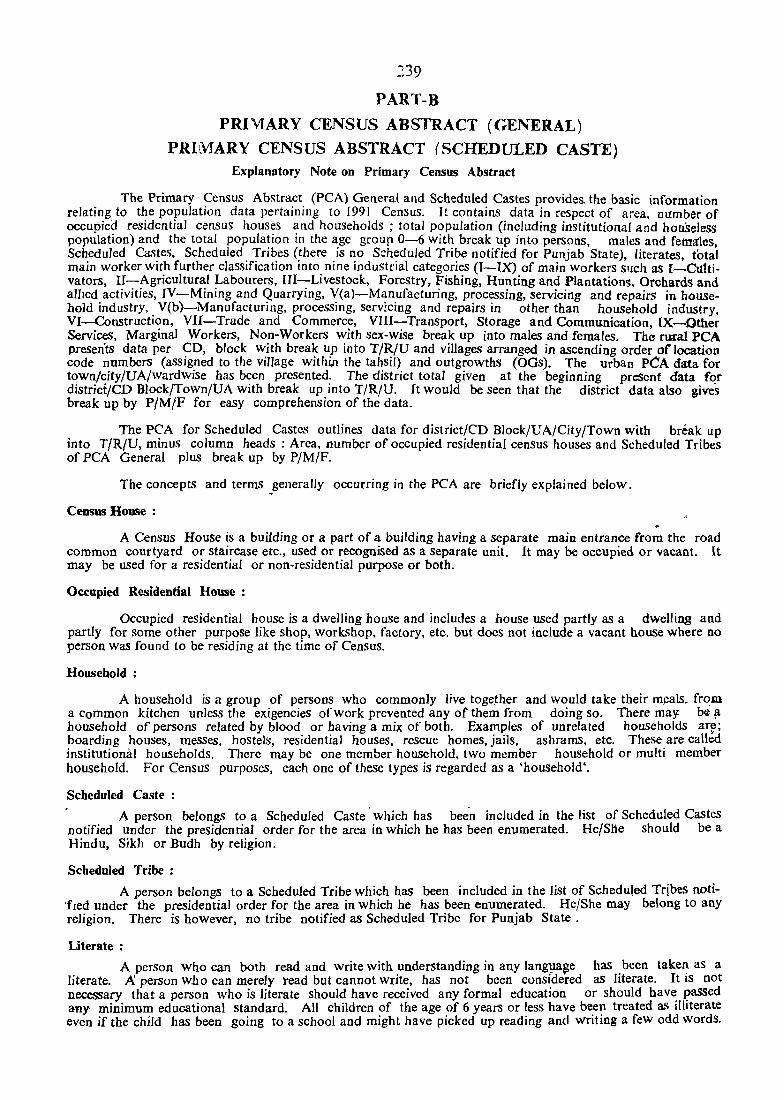
239
PART-B
PRIVlARY CENSUS ABSTRACT (GENERAL)
PRIMARY CENSUS ABSTRACT (SCHEDULED CASTE) Explanatory Note on Primary Census Abstract
The Primary Census Abstract (PCA) General and Scheduled Castes provides. the basic information relating to the population data pertaining to 1991 Census. It contains data in respect of area, number of occupied residential census houses and households; total population (including institutional and hOuSeless population) and the total population in the age group 0-6 with break up into persons, males and fetnltles Scheduled Castes, Scheduled Tribes (there is no Scheduled Tribe notified for Punjab State), literates tata'i main worker with further classification into nine industrial categories (I-IX) of main workers such as I"":Ct11tivators, II-Agricultural Labourers, III-Livestock, Forestry, Fishing, Hunting and Plantations, Orchards and al1led activities, IV-Mining and Quarrying, V(a)-Manufacturing, processing, servicing and repairs in house~ hold industry, . V(b)-Manufacturing, processing, servicing and repairs in other than household industry. VI-ConstructIOn, VII-Trade and Commerce, VIII-Transport, Storage and Communication, IX-Other Services, Marginal Workers, Non-Workers with sex-wise break up into males and females. The rural peA presents data per CD, block with break up into T/R/U and villages arranged in ascending order o(location code numbers (assigned to the village withi,n the tahSil) and outgrowths (OGs). The urban peA data for town/city/UA/wardwise has been presented. The district total given at the beginning preSent data for district/CD Block/Town/VA with break up into T/R/U. It would be seen that the district data also gives break up by P/MjF for easy comprehension of the data.
The PCA for Scheduled Castes outlines data for district/CD Block/UA/City/Town with break up into T/R/U, minus column heads : Area, number of occupied residential cenSus houses and Scheduled Tribes of PCA General plus break up by P/M/F.
The concepts and terms .generally occurring in the peA are briefly explained below.
Census House :
A Census House is a building or a part of a building having a separate main entrance from the road common courtyard or staircase etc., used or recognised as a separate unit. It may be occupied Or vacant. It may be used for a residential or non-residential purpose or both.
Occupied Residential House :
Occupied residential house is a dwelling house and includes a house used partly as a dwelling and partly for some other purpose like shop, workshop. factory, etc. but does not include a vacant house where no person was found to be residing at the time of CenSUS.
Household:
A household is a group of persons who commonly live together and would take their meals. fr~m a common kitchen unless the exigencies of work prevented any of them from doing so. There ma}! be fl household of persons related by blood or having a mix of both. Examples of unrelated households ar~; boarding houses, meSses, hostels, residential houses, reScue homes, jails, ashrams, etc. These are called institutionid households. There may be one member household. two member household or multi member household. For Census purposes, each one of these types is regarded as a 'household'.
Scheduled Caste :
A person belongs to a Scheduled Caste' which has bee'n included in the list of Scheduled Castes notified under the presidential order for the area in which he has been enumerated. He/She should be a Hindu, Sikh or Budh by religion.
Scheduled Tribe :
A person belongs to a Scheduled Tribe which has been included in the list of Scheduled Tribes noti'fled under the preSidential order for the area in which he has been enumerated. He/She may belong to any religion. There is however, no tribe notified as Scheduled Tribe for Punjab State.
Literate:
A person who can both read and write with .understanding in any lang}la~e has. been take~ as a literate. fl:. person who can merely read but cannot wnte, has not been conSIdered as lIterate. It IS not necessary that a person who is literate should have received any formal education or should hav~ J?assed any minimum educational standard. All children of the age of 6 years or less have been treated as Illiterate even if the child has been going to a school and might have picked up reading and writing a few odd Words.

Workers and Categories of Workers:
Work may be defined as participation in any economicaUy productive activity. .Such participation may be physical or mental in nature. Work inv~lves not only actual work but also effective supervision and direction of work.
In the economic questions ,convassed in 1991 Census, there has been s'ome difference. The 'work' concept in 1961 and 1971 Censuses, as opposed to, the 'income' or economic independence concept of earlier censuses was adopted for ] 981 Census, but the criterion for classification as workers was .changed. While in 1961 'and 1971, Censuses, ,different approaches, namely, usual status and current status were adopted with· refe~ence period of one year and one week for seasonal and for regular work respectively at the1981 and 1991 Census~s, the usual status approach )yas adopted uniformly for all work.
in 1961 Census a person qualified as1l worker if he had worked regularly during the last season orif he had worked atleast for a day in regular (non-seasonal) work during the preceding fortnight. At the 1971 Census_, a person was treated as a worker only if he spent his time mainly in work or if he worked atJeasC for a .day in regular (non-seasonal) wqrk during the precding work. The dichotomy ofworker/nonworker of 1961 and 1971 CensuSes was discarded at the 1991 Census and instead a trichotomy of main workers, m3f~in;t1 worker~ an~ non-workers, was adopted. For main worker the time criterion of engagement in work for the. major part of the yeltr I.e., at least 183 days'was adopted. Those Who worked for some time during the last year but not for the majOl" part Were treated as marginal workers. Those who had never wdrked during the last year were non-w9rkers. This trichotomy partial1y permits a comparability of 1991 Census economic -data with that of 1971 as well as 1961 Census. The main workers ,of 1991 Census-can be expected to correspond to the worfers of 1971 Census and tne main workers and marginal workers of 1991 Census together correspond to the workers of 1961 Census.
Main workers :
A person mainly engaged in any economically productive activity during the entire reference period of one year or for major part (183 days or more) of the reference period preceding the date of enumeration is a main worker. His participation maY,be ph:ysi?al ~r mental in natur~ a,nd bis activit-r involved is not only actual work but also effective supervIsIon and dIrectIOn of work. It also mcludes unpaId work on farm or in family enterprise.
These are 9 broad industrial categories (I-IX) in which main workers have been classified. A brief discription of each of the industrial categories has been given below :-
I-Cultivator :
For the purposes of Census, a person has been considered working as Cultivator if he/she has been engaged either as employer, Single workers or family workers in cultivation of land owned or held from government, private persons or institutions for payment in money, kind or share. Cultivation included Su.peivision or direction of cultivation. A person who has given Qut his/her land to another person or persons for· cultivation for money, kind or sliare of crop and who does not even supervise or direct cultivation of land wi1J not be treated as cultivator, Similarly, a person working in another persons land for wages in cash 0; kind.of a combination of both will not be treated as cultivator. Cultivation involves ploJ}ghing, growing and harveSting and production of cereals and millet crops, pulse~, fibre crops "and other crops.
II-Agricultural Labourer :
A person who works,on another persons land for wa,ges in mOi1ey, Rind or sh!l.re should be regarded, as an agricultural labourer. He or she has no risk'in the cultivation, b\lt he/she merely wqrks on another persons' 1ilgd for wages. An agricultural labourer has no right of least or contract on land on which he,/she works. .
In-Livestock, Forestry, Fishing, Hunting, Plantation, Orchards and Allied Activities:
"A person engaged i.n'any·ofthe; activities of plantation (growing.ofroots, tubers, ,vegetables, singharas,.. chillies and spices, other than pepper, cardamom; Floricu1ture and Horticulture and agriCUlture products '; Plantation.of tea, coffee, rul1ber, tobacco, pepper, cardamoi1l cocontlt, arecanut edible nut excluding groundnut ~ Fruits, ganja, cinchona, opium) livestock (cattle breeding and rearing of goats, sheep, horse, camel, mule, pig. duck, hens, bees, silk worms and birds; Collection of honey, prod·uction of milk, wools, eggs, cocoons and- raw silk) ; Agriculture services (Destroying of pests anp- insects; irrigation services ; grading of ,agric)lltura;l, products. or livestock; soil conservation services; harvesting ancfthrashing and agriculture syrvice~); Forestry (cutting .qf trees, production of firewood, fuel wopd, charcoal, gathering of gums, resins, lac, barks,~herbs: "etc; f~restry services n.f~,c,) ; Fishing (fishingana c01lection' of sea products) ; and Hunting is to be c1assified in Industrial., Category HI. ... - -' .

241
IV-Mining and Quarrying:
A worker engaged in mining of coal, lignite, Iron ore, copper, etc., extraction of petroleum, natural gas etc. and mining services is to be included in Industrial category IV.
V(a)--Manufacturing, Processing, Servicing and Repairs in Household Industry:
Industrial category V has been split into two sub-parts V(a) and V(b). The Industrial category Yea) relate to Househola Industry, which has been defined as an Industry conducted by tlie head of the household himself! herself and or by the members of the household at home or within the village in rural areas and only within the precincts'of the house where the household lives in urban areaS. The larger proportion of workers in household industry should consist of members of the household including the head. The industry should not be seen on the scale of a registered factory which would quali fy or has to be registered under the Indian Factories Act. The Household Industry.should relate to production, processing, servicing, reparing or making and selling (but not merely selling) of goodS. A worker engaged in i:\ household industry, as defined above, is to be classified in industrial category V(a)-manufacturing processing, servicing and repairs.
V(b)-Manufacturing, Processing, Servicing and ~epairs in other than Household Industry .
A worker engaged in the following activities has been included in this Industrial Cat~gory i.e., manufactur,e of bakery products, sugar products, salt, oil, blending of tea, preparation of meat, beverages, etc. cotton, jute, wool, silk, leather and man made fibre textiles, wood and woop. products, paper and its 'products, printing and publishing, leather and leather products,for chemical products, r~bber, plastic, petroleu_m and coal product non-metalic mineral products, basic metal and alloys industries machinery and equipment, transport equipment and"'parts, repair of capital goqds such as, ships/boats, aircrafts, agricultural equipment, machine tools, industrial apparatus, locomotive and other rail/road equipment. Repair services such as repair of footwear, leather goods, household electrical appliances TV, VCR, radio, refrigerator, watches, clocks, jewellery motor vehicles, motor cycles, trucks, lorry, bi~ycles and cycle rickshaws, have been included in this industrial category.
VI-Constructions :
A worker engaged in the following activities has been classified in the industrial category VI ; Constructions and maintenance of buildings, roads, railways, bridges, pipe lines and runways etc. Maintenance of power, telecommunications and transmission lines, waterways, canals, tanks, wells etc. Heating and air conditioning and sound proofing, timber works, painting and decorating 'York for constructions.
Vll-Trade and Commerce :
A worker f'ngaged in the following activities has been classified in the industrial category VII ; Wholesale and retail trades and restaurants and hotels. Financing, Insurance, real estate and business services.
VllI-Transport, Storage and Communication :
A worker engaged in the following activities has been classified in the industrial category VIII ; Land transport and air transport, services incidental to transport, storage and warehousing services, communication services.
IX-Other Services :
A worker engaged in the activity of Electricity, gas and \yater services. community, social and perSonal services a~d in activities not adequately defined.
Margina I Worker:
A person whose main activity during the reference period preceding enumeration waS either not for major part (less than 183 days) of that reference priod or he/she w~ engaged in any economic activity which was not his main activity, any time during the reference period, is a marginal worker.
Non-Worker :
A person who is not engaged in any economic activity any time during the reference period preceding enumeration is a non-worker. He should also not fall in the category of main worker or marginal, worker.

A_;PRI VlA-KY CE~SUS ABSTRACT
BATHINDA DISTRICT
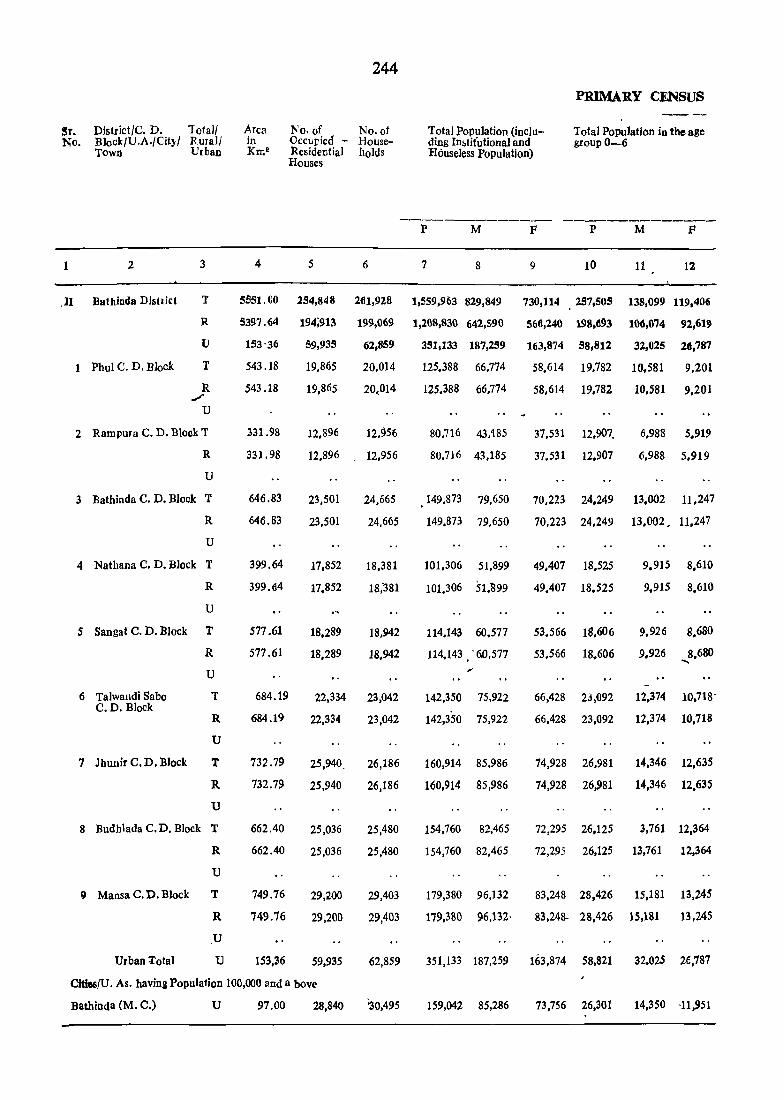
Sr. No.
1
District/C. D. 1otal/ BJock/U.A./Cit)'/ Rural/ Town Urban
2 3
Area in Km 2
4
244
]\'0. of No.ot O.ccl.lpied - HouseResidential holds Houses
5
p
7
Total Population (including In&titutional and Houseless Population)
M F
8 9
PRIMARY CENSUS
Total Population in the age group 0-6
P M F
10 11 12
.n Bathincla Dlsuict T 5551. (iO 2S4,848 2(II,928 1,559,963 829,849 730,114 257,505 138,099 119,406
R 539'1.64 194;913 199,069 1,208,830 642,590 566,240 198,693 106,074 92,6}9
U
1 Phul C. D. Block T
R ,/
U
2 Rampura C. D. Bloak T
R
U
3 Bathinda C. D. Block T
R
U
4 Nathana C. D. Block T
R
U
5 Sangat C. D. Block T
(j Talwalldi Sabo C.D. Block
7 Jhunir C. D. Block
R
U
T
R
U
T
R
U
8 Budhlada C. D. Block T
9 Mansa C. D. Block
Urban Total
R
U
T
R
,U
U
153'36
543.18
543.18
331.98
331.98
646.83
646.83
399.64
399.64
577.61
577.61
59,935
19,865
19,865
12,896
12,896
23,501
23,501
17,852
17.852
18.289
18.289
62,859
20,014
20.014
12,956
12,956
24,665
24,665
18,381
18.,'381
18,942
18.942
684.19 22,334 23,042
684.19 22,334 23,042
732.79
732.79
662.40
662.40
749.76
749.76
153,36
25,940 26,186
25,940 26,186
25,036
25,036
29,200
29,200
59,935
25,480
25,480
29,403
29,403
62,859
Cities/U. As. having Population 100,000 and a hove
BathiDda (M. C.) U 97.00 28,840 130,495
3S1,133 187,2S9 163,874 S8,812 32,025 26,787
125.388 66,774
125.388 66,774
80,716 43,185
80.716 43,185
149,873 79,650
149,873 79,650
101,306 51,899
101.306 51.'899
114,143 60.577
114.143 , '60,577
142,350 75,922
142,350 75,922
160,914 85,986
160,914 85,986
154,760 82,465
154,760 82,465
179,380 96,132
179,380 96,132·
58,614 19.782
58,614 19.782
37.531 12.907.
37.,531 12.907
10.581
10,581
9,201
9,201
6,988 5.919
6,988 5.919
70,223 24.249 13.002 11,247
70,223 24,249 13,002. 11,247
49,407 18,525
49.,407 18.525
53.,566 18,606
53.566 18.606
9,915 8.610
9,915 8,610
9,926 8.680
9.926 8.680 .....
66,428 23,092 12,374 10,718'
66,428 23,092 12,374 10,718
74,928 26,981 14,346 12,635
74,928 26,981 14,346 12,635
72,295 26,125 3,761 12.364
72,295 26,125 13,761 12,364
83,248 28,426
83,248· 28,426
15,181
15,181
13,245
13,245
351,133 187,259 163,874 58,821 32,025 2£.,787
159,042 85,286 73,756 26,301 14,350 '11,951
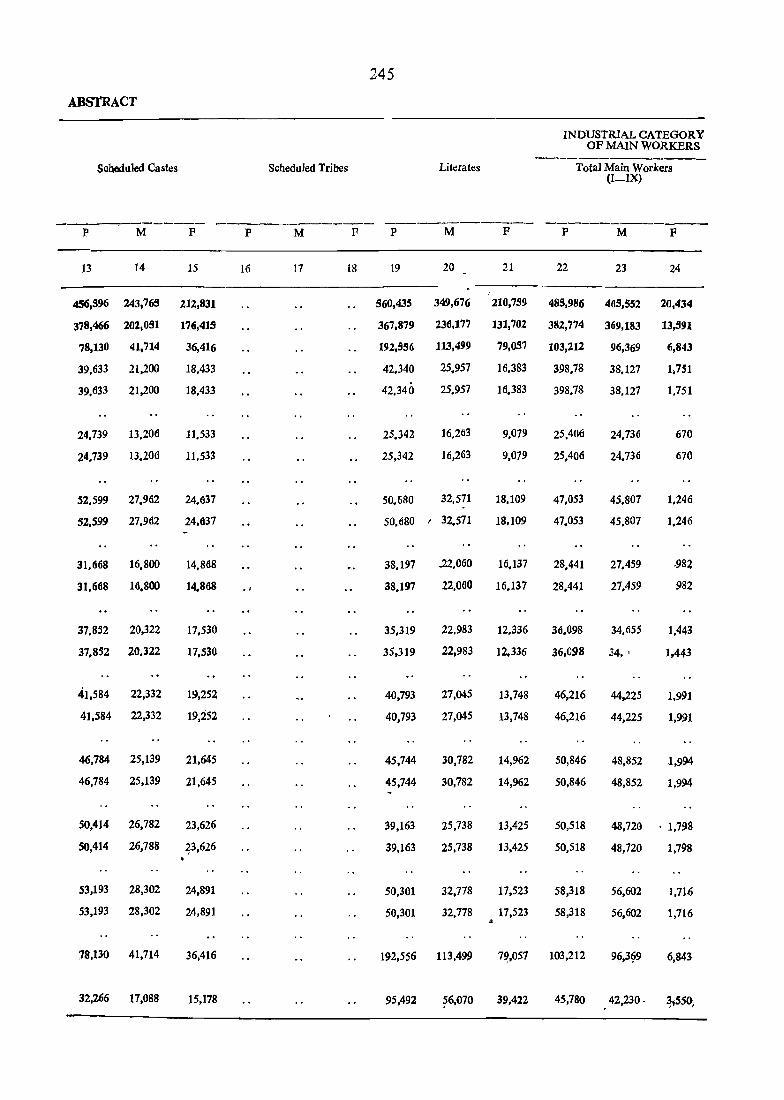
245
ABSTRACT
INDUSTRIAL CATEGORY OF MAIN WORKERS
------..--------Scheduled Castes Scheduled Tribes Literates Tota) Main Workers
(I-IX)
------,-------- ------------- ------------- --..--------------P M P P M F P M F P M F
13 14 15 16 17 18 19 20 21 22 23 24
456,996 243,769 212,831 960,435 349,676 210,7.!19 489,986 465,552 20,434
378,466 202,091 176,415 367,879 236,177 131,702 382,774 369,183 13,.!I91
78,130 41,714 36,416 192,S56 113,499 79,0.!I7 103,212 96,369 6,843
39.633 21,200 18,433 42.,340 25.957 16.383 398.78 38.127 1,751
39.633 21,200 18,433 42.340 25.957 H1.383 398.78 38.127 1,751
24.739 13,206 11,533 25.342 16,263 9,079 25.406 24,736 670
24.739 13,206 11,533 25,342 16,263 9,079 25.406 24.736 670
52,599 27,962 24.,637 50.,680 32,571 18,109 47,053 45,807 1.246 -52.599 27,962 24,637 50.680 , 32,571 18,109 47,053 45.807 1.246
31,668 16.800 14.868 38.197 ..22.060 16.137 28.441 27.459 .982
31.668 16.800 14,868 .1 38.197 22,060 16.137 28.441 27.459 982
37.852 20,322 17.530 35.319 22,983 12.336 36.098 34,655 1,443
37.852 20.322 17.530 35,319 22.983 12,336 36,0.98 34, I 1,443
41,584 22,332 19,252 40,793 27,045 13,748 46,216 44,225 1,991
41,584 22,332 19,252 40,793 27,045 13,748 46,216 44,225 1,991
46,784 25,139 21,645 45,744 30,782 14,962 50,846 48,852 1,994
46,784 25,139 21,645 45,744 30,782 14,962 50,846 48,852 1,994
50,414 26,782 23,626 39,163 25,738 13,425 50,518 48,720 . 1,798
50,414 26,788 ~3,626 39,163 25,738 13,425 50,518 48,720 1,798
53,193 28,302 24,891 50,301 32,778 17,523 58,318 56,602 1,716
53,193 28,302 24,891 50,301 32,778 17,523 58,318 ~
56,602 1,716
78,130 41,714 36,416 192,556 113,499 7~,057 103,212 96,3~9 6,843
32,266 17,088 15,178 95,492 ?6,O70 39,422 45,780 42,230. ~5S0,\

246
PRIMARY CENSUS
Sr. District/C. D. No. Block/U. A./
City/Town
Total! Rurall Urban ------ C~i;;~------Agricu1tural Labourers
INDUSTRIAL CATEGORY
LiveStock. Forestry. Fishing, Hunting and Plantations. Orchards
1 2 3 25 26 27
II Ibrthinda District T
R
U
210,627 2118,162
202~89 200,388
2,465
2,301
164
326
326 1 Phul C. D. Biock f
2 Ramputa C. D.Block
j Bathindi C. D. Block
" Nathana C.D.Block
u
t
It u t It
U
T
R
U
§ Sangat t::!, D. Block T
~ "R
(j TaIwan&: Sabo C.D.Block
1 Jhunir C. D. Block
u f
Ii o
T
u 8 Budhlada: C:D. Block t
R
U
.9 Mansa C. :tJ. Block T
Urbanfofal
u (j
7,938
20.762
20.762
14,511
14:511
7;;74
id,436 i(J.436
13;717
11/1h
i9.idO 19:8~ 1 !I, 100 'is,SG6
·95 95
291 297
!5,393 :H,0d9 ~ 38~
25,393 ':H,009 "384
26;638
26,638
27;374
21,m
26.454
26,454
31,621 31,316
31,62.1 31,316
1S4 184
30S
3(15
7,9~8 1,774 ~ 164
Cities!U. As Having Population 100,000 and above
, tWhindll. (it c.) U 1,5'61 1,479 82
II
p M p
28 29 "30
125,339 117,609 7,730
117,148 110,369 7,379
7,S91 7,240 3SI
13.282 12,240 1,042
13.282 12.240 1.042
" 7,157
. 7,157
6,819 . 338
6.819 "338
1-5,219 14.639 580
580 15,219 .14,639
8,844
8,844
8,458
8,458
386
386
and allied activities JTI
p M
31 32
4,~43 4,208
2,737 2,~i4
1,606 t,~34
122 122
122 122
136
'136
297
297
239
239
130
136
190 2~0
... . 11,494. 10,601 . 893 372 - 368
11,494 10,601 893 - "372 its
14,328 13,233 1,095 330
14,328 13,233 1,095 - 330
14,949 13,948
14,949 ,13,948
1,001
1.U01
15,357 14,262 1,095
15,357 14,262 1,095
17,118 16,169
17,118 16,169
949
!149
408
2108
'411
411
:its
its
7,591 7,240 351 1,606' 1,534
1,320 1,285 35 843
p
ijS
63
72
1
1
4
4
.. -4
Is 15
s s
i6 16
11
12

247
ABSTRACT -- - -
OF MAlN WORKERS ~------- ----- _._-_._ --- ----~ -- -----------
Mining and Quarrying Manufacturing, Processing, Manufacturing, Processing, Servicing and Repairs in Servicing and Repairs in HouSehold Industry other than Household Industry
IV V (a) V(b)
---------"._------- _._ ---------------- -----~----------P M F P M P p M F
34 35 36 37 38 39 40 41 42
16 15 1 6,485 5,88S 600 24.030 23.098 932
9 9 4,550 4,086 464 8,871 8,335 53ft
7 (I 1 1,935 1,799 136 I!, 159 1 .... 763 396
507 463 44 880 820 60
507 463 44 880 820 60
.} 3 323 233 90 499 480 19
3 3 323 233 90 499 480 19
490 440 SO 1,284 1,,231 53
490 440 50 1.284 1,231 53
346 298 48 583 547 - 36 346 298 48 583 547 36
491 446 45 1,019 926 93
491 446 4S 1.019 926 93
~ 3 652 600 52 722 657 6j
3 3 652 600 52 722 657 65
2 2 606 538 68 1,070 1,005 65
2 2 606 538 68 1,070 1,005 65
1 1 545 513 32 1,338 1,260 18
1 1 545 5}3 32 1,338 1.260 18
590 555 35 1,476 1,409 67
590 555 35 1,476 1,409 67
7 6 1 1,935 1,799 136 15,159 14,763 390
4 4 60) 558 45 7,153 6,966 187
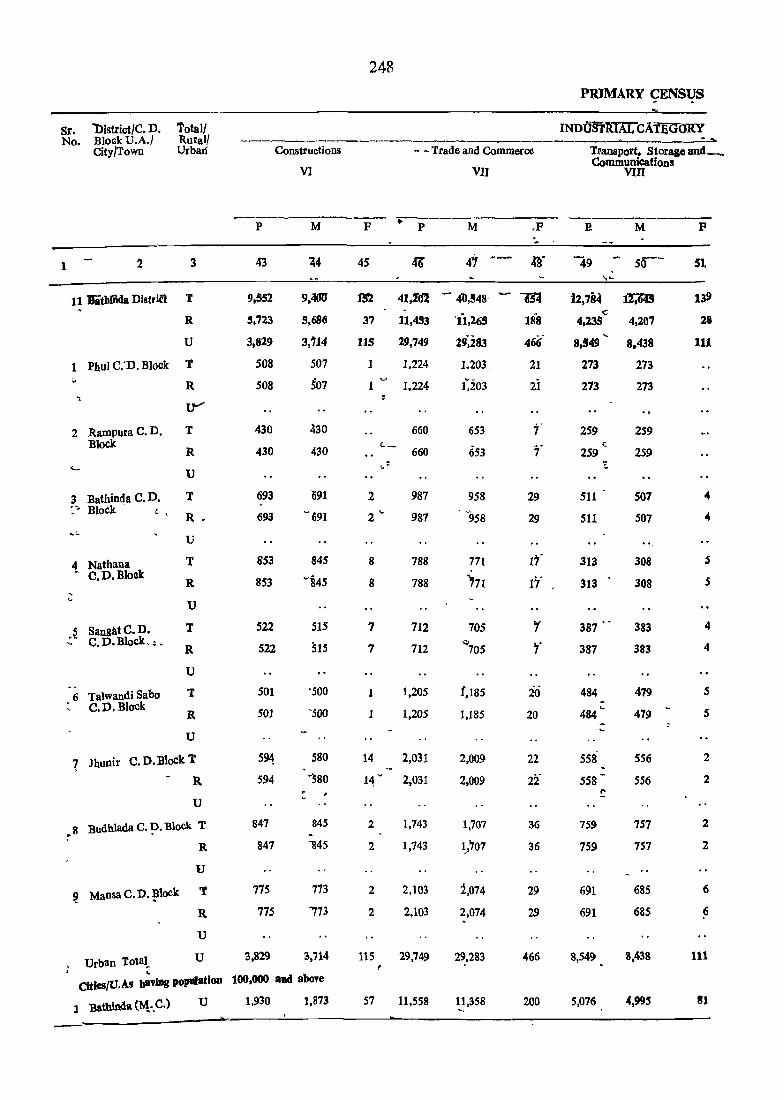
Sr. "'District/C. D. No. Block U.A.J
City/Town
Totall Rural! Urban
1 2 3
11 Dithli'ida Dlstrla T
R
U
1 Phul C:D. Block T
2 Rampura C. D. Block
3 Bathinda C. D. :'. Block . .. ,
4 Nathana • C.D.BlolIk
j Sangat C. D. ... C. D. Block , ~.
6 Talwandi Sabo C.D.Block
R
IY'
T
R
U
T
R •
U
T
R
U
T
R
U
T
R
U
? Jhunir C. D. Block T
R
U
* 8 Budhlada C. p. Block T
R
U
~ Mansa C. D. ~lock T
Urban Totat
R
U
u
CitIes{U.As ~vlng pop1l1ation
1 Bathinda (~"C.) U
Constructions
p
43
9,552
~,?23
3,829
508
508
430
430
693
693
8S3
853
522
522
501
501
594 594
847
847
775
77S
VI
M
44
9,'1tTIJ
5,686
3,'14
507
507
430
430
~91
~ 691
84S
"'~4S
SIS
SIS
'500
·SOO
580
~80
845
'845
773
'173
3,829 3,714
100,000 and above
1,930 1,873
248
- -Trade and Commerce
VII
F .. p M
45
m 37
11S
1
1
41,2'Cll - 4b,!l48'
.;; --
2
2 "
8
8
7
7
1
1
11,453
29,749
1.224
1.224
660
660
987
987
788
788
712
712
l,20S
1,205
14 2,031
14 ~ 2,031
2
2
2
2
115
57
1,743
1,743
2,103
2,103
29,749
11,558
'li,265
29,283
1.203,
1~203
653
653
958
'958
771
)71
70S
')705
[,18S
1,185
2,009
2,009
1,707
1}07
2,074
2,074
29,283
11,3S8 ~,
.F
29
29
r If
26 20
22
22'
36
36
29
29
466
200
PRIMARY CENSUS
----=~ TranspOrt. Storage and_ CommUDications
VIII
:e M
49 - 50-
i2,78~ ~ c
4,235 4,207
8,S49 ..... 8.438
273 273
273
259
259
Sl1
511
313
313
387
387
484
558
558
759
759
691
691
8,549
5,076
273
259
259
S07
507
308
308
383
383
479
479
556
556
757
757
685
685
8,438
4,995
F
51
139 28
III
'" '"
s s
4
4
s s
2
2
2
2
6
6
111
81

249
OF MAIN WORKERS \ ~ ---W "_' __ ....._-.....;t.::_.
_._ Oilier Scl'vices.. Marg_!nal Workers NOll"'Workers
IX
- .--~ p M F p M F p M ·F
52 53 54 SS 56 57 58 59 CO '-
M
051,608 43,982 1,626. 33,849 1,423 12.~26 1,~~.128 362,874 ~77t?-S4
204.1S9. 22,ltl,!'l jI •
Z~595 :l3,1C1l. .. l~~O ll,847 792,889 272,087 520,802
2(1,849" 2!,81~ S,03l "~. 103 579 247,239 90,787 156,452 ... 2,320 2,1)(i3 257 '?~ .11' 127 44,537 28,501 56.036
2,32q, 2,063 257 "3 14. '627 '64,537 2a,5,1 5 ••••
. . ",;:. " ..
{; .. l ... ~~ J .• ~t7 121 lSI, 32 12' s.c,452 11.417 36,'35
t: ',. .' 1."~ ,~:}" 121 ISj 32 12' 54,452 lI,~17 31.'35
G ','
..... 75 ~.2~1 C-" ,,_, ...........
224 1.1," " .l.74fi 191',914 33,777 67.237
..... 75 _4,2~ 224 1.1 •• " 1.7 .... 11)1,011 33,777 67,237 ..,t, 0, ...
~,
-2.724 2,21' 444 2,894 42 2.352 69,971 24,39S 45,573
2.724 2.210 444 2,894 42 2,852 69,971 24.398 45,573
," 2.001 1.845 156 6,195 315 5,'880 71,850 25,607 46,243
2,001 1.845 156 6,195 315 5,880 71.850 25,607 46,243
2,5"8 2,244 3~ 6,888 104 6,784 89,246 31,593 57,653
2,598 2,244 354 6,888 104 6,784 89,246. 31,593 57,653
2,437 ,
67',971 2,812 375 5,260 297 4,963 104,808 36,837
;,812 2,437 375 5,260 297 .4,963 104,808 36,837 67,971
2,868 2,515 353 2,314 112 2,202 101,928 33,633· 68,295
2,868 2,515 353 2,314 112 2,202 101,928 33,633 68,295
3,533 3,222 311 5,979 206 5,773 115,083 39,324 75,759
3,533 3,222 311 5,979 206 5,773 115,083 39,324 75;759
26,849 21,818 5,031 682 103 579 247,23!} 90,787 156,452
15,732 12,911 2,821 320 25 295 112,942 43,031 69,911

250
PRIMARY CENSUS
Sr. District lC~ D. Totall Area in No. of No. of Total Population (including Total Population in the ag'e No. Block/U. A/City! Rural! Km.lI: Occupied =e. Institutional and . group 0-6
Town Urban Residen- ds Houseless population) tial Houses
-------,------ -------------P M -p P M P
1 2 3 4 5 6 7 8 9 10 11 12
I
Towns/U. As. having population les~ than 100,000
Rampura Phul (M. C.) U 5.76 5',749 '6,039 35,530 ~ 18,718 ~ "'16,812 . 5",726 3,092c 2,634
2 Goniana (M.C.) U 9.00 ..: 1,664 1;694 10,415 5,459 4,956 1,786 1,001 785 -
3 Bhucho Mandi (M. C.) U 2.00 1,637 l,ri86 10,006 5,266 - 4,740 ";,793 951 842 ~~ .. 4' Kat Fatta '(M. C.) ,.....·u 0.39 982
. '983 5,611 2,972 .- 2,639 .. 921 486 435
5 Sangat (M. C.) U 1.24 462 471 2,731 1,415 1,316 467 227 240 , .
U" 1,672 6 Raman (M.C.) 3.99 2,809 2,911 17,275- 9,247 8,028 3,106 1,434
'(M:C.) • . 7 Maur U 4.80 3,744 ~4,038 25,1'80 13,~17 11,663 '4,265 2,2!l2 1,983
8 Mansa (M.C.) tT 20'00 9,087 9,420 55,089 29,401 " 25,688 9.266 S,151 4,115
9 Budhlada (M.e.) U 5.18 "3,014 , 3,157 18,717 9,886 - 8,831 '"3,118 1,699 1,419
10 Bareta (M. C.) tJ 4.00 1.947 1,965 1l,53T 6,092 - 5,445 :2,063 1,114 949
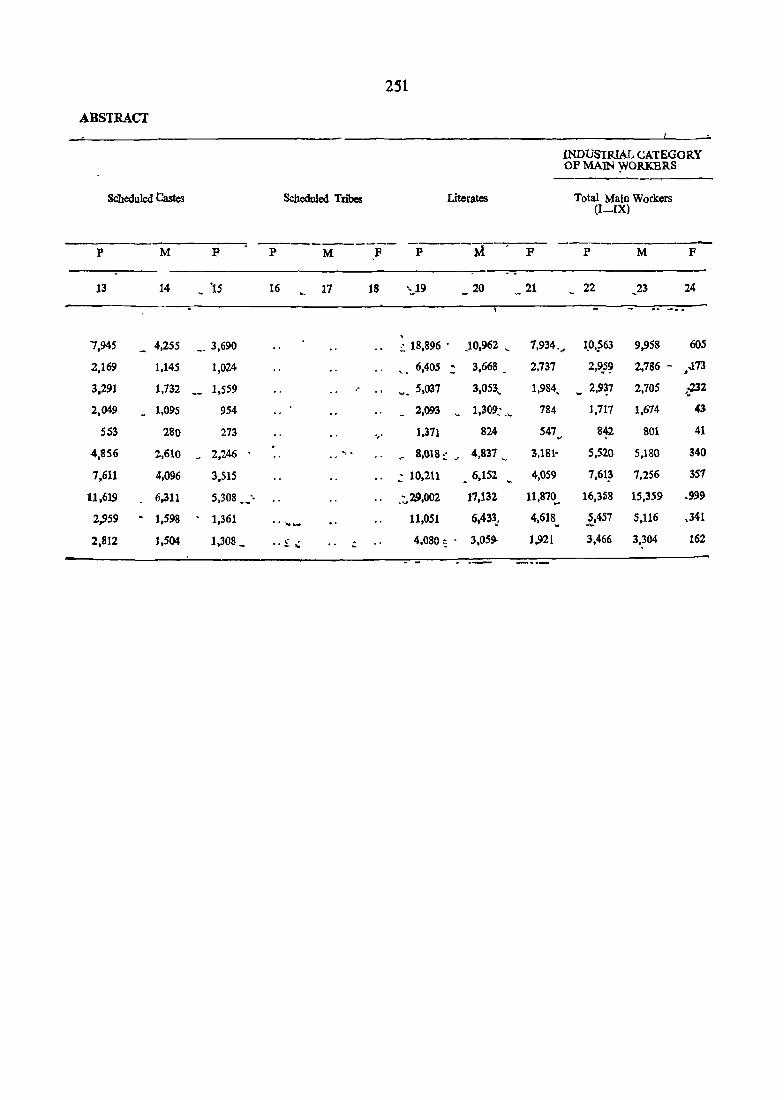
2S1
ABSTRACT
INDUS1RIAL CATEGORY OF MAIN ~OR.K.BRS
Scheduled Castes Scheduled Tn"bcs Literates Total Main Workers (I-IX)
----------P M F P M F P M p P M F
13 14 ~ 'IS 16 17 18 "'!-19 20 21 22 23 24 ~
, 1,945 4,255 __ 3,690 :: 18,896 • .10,962 '- 1,934.~ 1_0';;63 9,958 60S
2,169 1,145 1.024 ~. 6,405 ~ 3.668 _ 2,737 2,~S~ 2,786 - .173 • 3,291 1,732 1,559 " "'. 5.037 3.053 .... 1,984, _ 2,9~7 2,705 .:232
2,049 1,095 954 2,093 1,309,' ." 784 1,717 1.674 43
553 280 273 ',' 1,371 824 547 8~ 801 41 .. ·4,856 2,610 2,246 . 8,018:: .- 4,831 ~. 3,181- 5,520 5,180 340
7,611 4,096 3,515 " .; 10,211 _ 6.152 4,059 7,61~ 7,256 351 ~
11,619 - 6.311 5,308 __ -. .:.29,002 11,132 11,870_ 16,3$8 15,359 .999
2,959 - 1,598 . 1,361 11,051 6,433: 4,618~ 1457 5.116 ,341 . ....... _ 2.812 1.504 1.308 _ •• £. ~ ;:; 4,080 ~ • 3,059- 1,921 3,466 3,304 162

252
PRIMARy.:cENSOS
sf. District/C.D. 1ot~1{ INDUSTRIAL ell, lEGO:RY No~ B]ock/U.A.} :Rula I ----------_....--.-.._., ........ .-- -
City/Town Urban Cultivators Agricultural labourers LivGstock. ForGstry, Fishing, Kunting and Ptahtlttiobl, Otehlirds and allied activities
II III ~-.--- .- ---.~ .-..---
P M F P M F P M F
t2 3 25 • 26 .27 28 2.9 30 ~ 31 32 33
TownsfU.As. _llavlng populatiorlless than 100.000
1 RampUIa Phul (M. C.) U 1,190. 1.188 2 773 772 1 124 120 4
2 Goniana ·(M.~.): U 20 }'O 149 148 1 35 35
:3 Bhuclio Mani1i:(M. C.) U 163. 153 ~ 10 234 206 28 22 21 1
4 Kot'l1atta (~f:C.) U' 678 . 677 . 1 441 425 16 31 31
5 Sangat (M.e.) u 194- 194 130 130 7 7
·6 R.aman (M;C:) U 636. 632. 4 636 604 32 86 68 18
-7 Maur (M.~.) U 1,550: 1,547 3 1,159 1.Q89 70 90 89 1
8 Mansa (M.e:) u 1,074- 1,013 • 61 1,856 1,704 521 240 .. 237 3
9 BudllJaua (M.e.) u 169- 168 1 309 295 14 - 78 78 .-to Bareta (M.C,) U 703 703 584 582 2' SO 47 .3

OP MAIN WORKERS
-------M~g ~d Q;;-arrin;--~---~M~~~ring, Processing, Servic; ng and Repairs in Household Industry
IV V(a)
-----'---:p M
34- 3S 36 37 38
153 146
44 40
S4 48 .. "> 87 84
64 57 '-
64 51 ~
i 1 176 166
i 1 348 328 ,- ~-
112 108 .:..
230 213
F
39
7
4
6
3 -_
7
13
10
20
4
17
p
40
1,392
346
368
51
54
879
924
Manufacturing, Processin" Servicing and Repairs in other than Household Industry
V Cb)
M F
41 42
),~S~ 38
~39 7 361 7
51
~4
!t5~ 29
8~l 33
~,716_ _2.t!4! 75
985 ~6§ ~ I? 291 281 10

2~~
PRIMARY. CENSUS
Sr. District/C. D. Total! NDUSTRIAL CATEGORY No. Block/U. A.I Rural} .
~ _. " _ ...... .._ .... -----------------------.
City/'Iown Urban Constructions Trade and Commerce 'IransPOrt. Storage and eommtfniealiolls
VI i VII vm
, ---------- ---------- --------_ P M F P M F. '~ P. M F :::'
1 2 3 43 44. 4"5 46 - 41 - ";rg 49 50 51
'-" ~ ., -~
TownsjU. As- havi~ population less' ffiau 100,000
1 Rampura Phu! (M. C.) U 449 436 13 3,325 3,276 49 • 746 742 4 ., '2 Goniana (M.e.) u 110 110 1,356 1,346 10 161 158 3
3 Bhucho MMdi (M. C.) U 96 96 1,088 1,067 21 223 220 :5
4 Kot Fatta (M.e.) U 64 64 116 115 1 65 65 t"
5 Sangat (M.C.) U 5 4 1 258 258 14 13 1
6 Raman (M.e.) tl 119 112 '7 ~ 1,806 1;757 49 321 " 311 g . .., MaUl (M:~.) U 243 227 16 1,927 1,870 57 379 377 2 , (M.c.)
"J.) ... '8 Manu U 604 584 20 S,UE 5,096 40 I,O~ 1,085 5 , 9 Budhlada (M:C.) u 141 140 1 2,222 2,195 27 370 366 4 . ~:l
10 Bareta (M.e.) u 68 68 951 945 12 104 104 " "

2~5'
A BSTR ACf
OF MAIN WORKERS Marginal WorkGrs Non-Wo ricers
Otber Semcea'
IX
P M F P M F P M f
52 $3 S4 $$ 56 57 58 59 60
2,411 1,924' 487 19 9 10 29,948 8,751 16,197
738 590 148 .. 7,456 2,673 4,783
688 532 156 7,069 2,56i 4,508
184 162 22 46 46 3,848 1,298 2,550
l~d 84, 32 1,889 614 1,275
973 784 t89 35 ·1 28 11,720 4,060 1,660
1.164. 1,000 164 25 13 12 11,542 6,248 11,,294
3,293 2,670 623 185 46 139 3R,546 13,996 24,550
1,011 800 271 47. 3 44 13,213 4,767 8,444
479 361 U8 5 5 8,Od6 2,188 5,278


C.D. BLOCKWISE
PRIMARY CENSUS ABSTRACT


PRIMARY CENSUS ABSTRACT
PHUL C. D. BWCK

PHUL e. Il. BLOCK
Area of ViUage in 'BeGtares and of C.D. Block} Townl
No. of ~ccppiCld lteSldential Houses
Ward in Sq. kms.
260
No.ot HOuseholds
Total Population (including) Institutional and Houseless Population)
;---------------p M F
2 3 45 6 7 8
Total 543·18 19.865 20,014 1.25,388 66,774 58,614
Rural 543.18 19,865 20,014 1,25,388 66,774 58,614
Urban
Siriewala (183)
2 Burj Ladha Singh. (184) wala
3 Kesar Sin8hwala (185)
4 Bhagta (186)
5 Burt Thror (2)
6 Malu Ka (5)
1295.00
608.00
402.00
583
282
170
2161.00 1,370
331.00 218
2094.00 812
7 Neor (6) 515.00 244
8 Kotha Guru (1) 2992.00 1,229
9 Dyalpura MirZa (1) 2161.00 649
10 Selbrah (34) 1539.00 644
11 Kauloke (35) 353.00 222
12 Gurntj Kalan (33) 2025.00 740
13 Jalal (24) 2014.00 783
14 Hamirgarh (23) 837.00 359
15 Gurusar (22) 706.00 331
16 Aklia Jaml (21) 1117.00 389
17 Bhodipura (20) 1018.00 465
18 Ramuwala (17) 468.00 208
19 Hllkam.Singhwala (18) 465.00 217
20 Keor Singhwala (19) 584.00 209
21 Gaunspura (26) 363.00 76
22 Kangan (27) 685.00 254
23 Salabatputa (28) 565.00 224
24 Adampura (29) 586.00 261
25 Rajgarh (30) 667.00 190
26 Dplawala (31) 640.00 293
27 Dyalpura Bhaika (25) 2042.00 830
599
283
170
1,383
218
819
3,886
1,681
1.100
8,772
1/306
5.395
2,074
875
583
4,683
684
2.877
1.812
806
517
4,089
622
2.518
245 1.505 779 726
1.233 7.507 3,995 3,512
673 4.090 2,179 1.911
651 4,011 2,168 1.843
227 798 400 398
741 4,784 2.559 2.225
811 5.189 2.771 2,418 l
359 2.416 1.305 1.111
331 1,993 1,051 942
389 2.625 1,412 1,213
465 2,888 1.546 1,342
209 1,426 763 663
217 1.347 717 630
209 1,231 640 591
76 512 271 241
254 ~ l.622 846 776
224 1,551 815 736
261 1.661 850 811
190 1.223 655 568
293 1. 710 944 826
830 4,924 2,596 2.328
VILLAGE PRIMARY"
Total Population in the ala group 0-6
p M
9 10
19,782 10,581
19,782 10,581
. ,
F
11
9.201
9,201
Rampllra Phol
654
278 •
173
1,413
208
836
246
1.210
641
619
150
735
819
408
338
382
440
235
208
182
78
284
229
268
193
27::J
779
368
144
91
802
116
463
118
696
331
311
83
372
443
213
179
198
216
135
96
89
42
14<1
120
157
100
156
400
286
134
82
611
92
313
128
514
310
308
67
363
376
195
159
184
224.
100
112.
93
36.
138
109
III
93
121
379

CENSUS ABSTRA~T
Sohedl;!led qt~tlS
M
12.
21,200
21,200
TostI (Part)
941
516
261
1,245
281
1,081
315
1,182
849
712
82
688
978
528
171
271
489
147
179
147
83
364
211
305
304
293
792
p
13
18,433
18,433
790
481
233
1.039
282
912
300
992
726
630
78
638
862
422
148
213
423
145
151
125
67
317
183
298
237
250
~96
Scheduled tribes
M p
15
Literatlls
F
16 17
.25,957 16,383
25,957 16,383
823
405
315
2,192
331
969
293
1.518
882
959
177
1,022
936
438
376
636
480
327
338
287
143
322
354
293
289
455
1,056
532
209
169
1,512
231
597
194
915
606
578
129
683
572
251
274
384
263
151
224
180
89
214
240
222
211
327
68~
26]
I
lND.USTRIAL CATEGORY _OF .MAIN WORKERS.. --~---~------~----------------Total MaIn Wo.)rkers Cultivators Agricultural
(I-IX)
M F M
18 19 _ ~ 20
38,127 .1,751 20,436
38,127 1.751 .20,436
1.190
522
269
2,533
422
1,664
437
2,249
1,350
1.221
215
1.464
1,505
697
626
852
913
401
470
385
125
430
.0484
494
391
529.
1,455
57
1
6
55
3
11
7
45
53
14
6
9
304
1
1
16
2
3
3
13
~,
5
17-3
1
186
29
429
202
110
1.022.
251
792
172
1.114
586
680
145
896
713
377
450
574
494
302
286
242
76
176
237
2'2
Hi7
311
747
J
Labourers
u --:--------
p M
21 22
326 12,240
326 12,240
3
2
1
2
3,
30
166
II
526
290
103
821 .
130
606
178
763
563
., 357
45
423
526
287
124
153
312
50
130
108
21
209
168
163
154
154
519
'.1
F
23
47
, 1
~ 1
11
12
3 '.
... :.
" .
,"
12.
4


CENSUS ABS:fRA(;T
OF MAIN WORKERS. , . , .._---------.:;....::.-~--~-----~~---- Marginal Work_ers 'Non-Woltca~-constructions-'_' Tra(ie 'and Transport •• Stotage .other Stiivices
VI
M F
33
---~ - "1
507
S
11
46
6
2S
9
13
1
3
17
8
13
5
4
9
3
3
3
8
7
S
1
.,.!",
Commerce aM Communications
_,
M
1~:mr
1.203
34
7
8
304
5
45
15
92
34
22
4
25
59
21
fO •
- 20
16
10
iO-6
8
17
,13
7
9
16
57
Vl1 V11I
, 1\1
35 3'0
11 • '"'1:TJ" •
21
4
3 _
1
1
5
273
14
2
11
5
4
11
4
8
4
7
24
1
1
10
3
",
17
s·
5
2
IX
p M
37 33"" -
, ..
", .. '
2.lJ7i3
2,063
74
6
32
234
27 _
103
38
136
75
84
11
89
115
4
11
59
... 57
16
rz-19
8
23
30
.5
15
11
86
..~
'-
F
~1
257
10
2
39
3
8
3
n6 146
1
26 ~ .! ..
7 .r T.
S
8
16.
1
10
2
2
2
2
1
.5
1
3
11
11
41
'921
827
38
2
5
218
M II
28,501 56,036
S84 - L755 353
313
2.149
262
).213
341
J..146
.Si9 9~7 ~
)85
-1.095
1.266
633
425
560
633.
36~
Z47
255
145
416
331
3.56
264
404
1.141
805
511
1.034
619
2.507
719
j,.f67
1J58
1.829
354
2.216
2 • .112
1,110
941
1.1~2
1.340
6IJJ
m Sjl
2,!j
657
7Jl
63d
.567
422
2.2:H
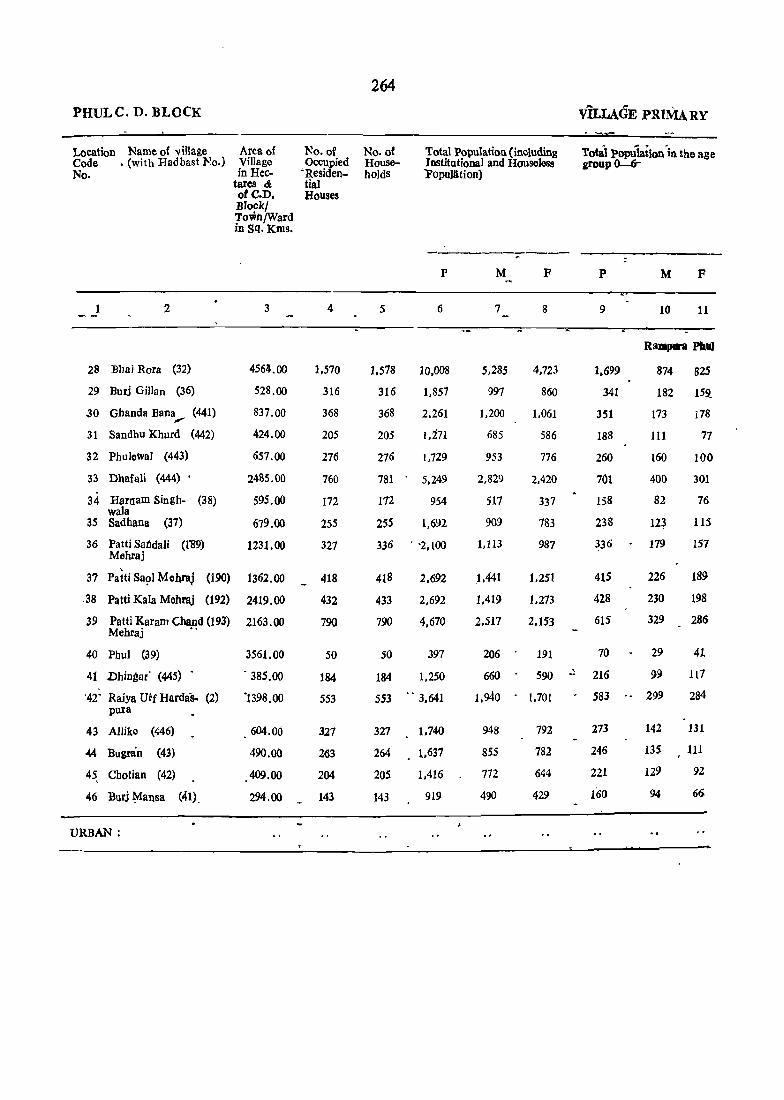
264
PHULC. D. BLOCK ViLLAGE PRIMA RY
Location Name of village Area of No. of No. of Total Population {including Total popuiation"in the age Code • (with Hadbast No.) Village Occupied House- Institutional and Houseless group 0-6-No. in Rec- -Residen- holdS "Population)
tares & tial otC.D. Houses Block! Town/Ward in Sq. Kms.
---------P M F P M F -
1 2 3 4 5 6 7 8 9 10 11
RamJM11'8 Phil
28 Bbai Rora (32) 456~.OO 1 • .570 1 • .578 10,008 5,285 4,723 1.699 874 825
29 Bud Gillan (36) 528.00 316 316 1.857 997 860 341 182 159,
30 Gbanda Bana (441) , 837.00 368 368 2.261 1,200 1.061 351 173 178
31 Sandhu Khurd (442) 424.00 205 205 1,i7l 685 586 188 111 77
32 Phulewal (443) 657.00 276 276 1,729 953 776 260 160 100
33 Dbafali (444) • 2485.00 760 781 5,249 2.829 2.420 701 400 301 . BarlIam Singh-34 (38) 595.00 172 172 wala
954 517 337 158 82 76
35 Sadbana (37) 679.00 255 255 1.692 909 783 238 12~ 115
36 Patti Safldali Mehraj
(1'89) 1231.00 327 336 . '2,100 1,113 987 336 179 157
, 37 Patti Sa9l ~enraJ (190) 1362.00 418 418 2.692 1.441 1.251 415 226 189
.38 Patti Kala Mehraj (192) 2419.00 432 433 2.692 1.419 1.273 428 230 198
39 Patti Karam Chand (193) Mehraj "
2163.00 790 790 4.670 2.517 2.153 615 329 286
40 Phul (39) 3561.00 50 50 397 206 191 70 29 41
41 Dhingar· (445) . 385.00 184 184 1.250 660 590 ,
216 99 117
'42' Raiya Utf Barda'S- (2) '1398.00 553 553 .. 3.641 1.940 - 1.701 583 " 299 284 pura
43 AlJike (446) 604.00 327 327 1.740 948 792 273 142 131
« Bugtan (43) 490.00 263 264 1.637 855 782 246 135 111
45, Chotian (42) 409.00 204 20S 1.416 772 644 221 129 92
46 Burj ~ansa (41). 294.00 143 143 919 490 429 160 94 66
URBAN;

2M CENSuS ABSTRACT
INDUSTRIAL CATE~ORY OF MAIN WORKERS ~c~'I!lqc! ~S' '. St:~W~ Tribes bilqates
~~'il~~ Workers <;:~ltJvat9W Agricu1iuraf. . Labourers' ,
(I-IX) " 1 II
-----.------- ------- ----M P M P ~ M F ~ M P M P M F . _-_ - __ '" .-!.to
12 "13 14 15 16 17 ;"'18 ,. 19 20 21 Z2 23 ,ft_ • t. . 9"." . ' . ....... ""' -,_- . --
1ihsil (PlItT • ~
1,380 ,[,1,263 2".144 1,534 2.801 69 1,483 5 606 11 455 407 363 162 '575 2 270
, 231 I.
391 374 428 258 740 1 50S 193
'128 112 292 194 "384 ,
286 62
319 251 "352 190 473 13 250 18i io 576 497 ' 1.146 678 1'.757 25 1.143 3 422 "3
422 349 159 57 "280 1 46 i 213
342 286 304 144 '465 7 258 160
352 285 -406 '260 "682 '::252 402 93 230 154
467 403 '354 -226 '826 107 447 2 291 ~4
514 427 '-466 346 '830 4 406 33.2 1
803 683 -955 :57-1. 7,494 29 ~14" 413 22
87 . 57 126 • 122
171 139 ' -229 "114 375 1 256 8,
480 433 '-582 . '336 '1.191 .63 730 5 317 -44
404 356 ' 33J "184 '-589 9 297 219 ~,
4 323 318 . 301 "165 496 2 236 J86 1 167 135 '';255 '";145 '478 351 105
91 77 188 120 '272 . 42 . 191 l' 46 40 . -- - -:-.,. -""" . -. - -
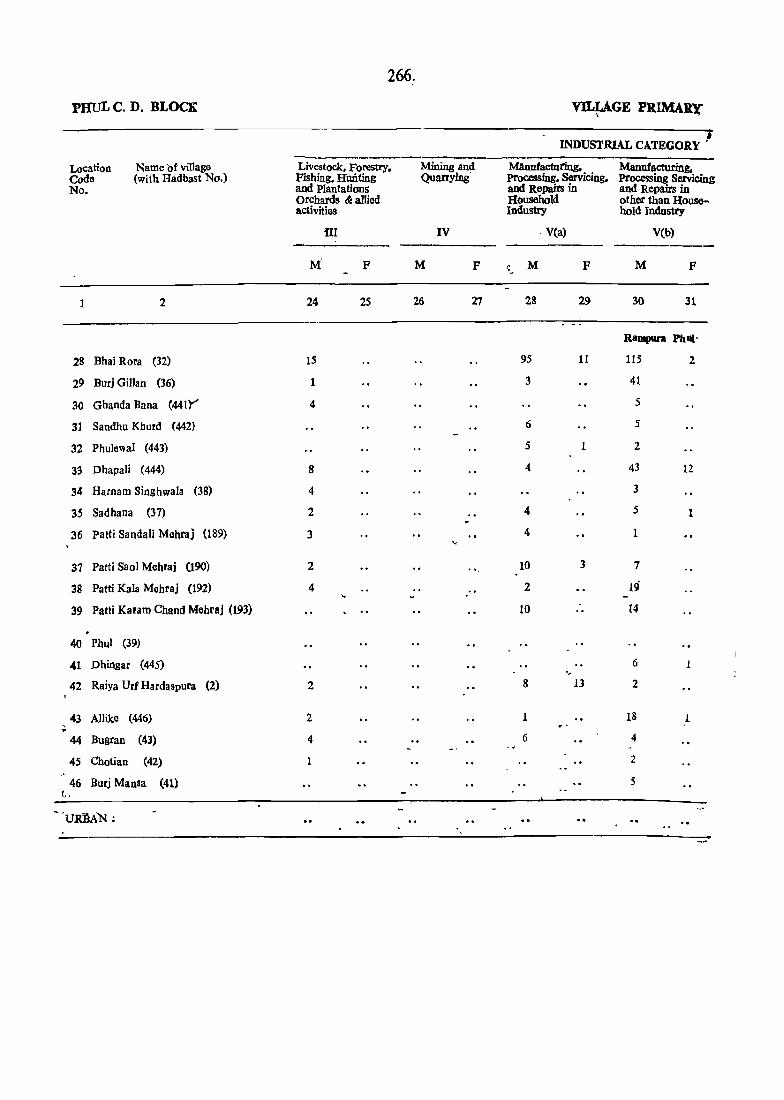
PHUL C. D. BLOCK
Location Code No.
Name 'of village (with Hadbast No.)
1 2
28 Bhai Rora (32)
29 Bud Gillan (36)
30 Ghanda Bana (441Y
31 Sandhu Khurd (442)
32 PhuleVllal (443)
33 Dhapali (444)
34 Harnam Singhwala (38)
35 Sadhana (37)
36 Patti Sandali Mehraj (189)
37 Patti Saol Mehraj (190)
38 Patti Kala Mehraj (192)
39 Patti Karam Chand Mehtaj (193)
40 Phul (39)
41 Dhingar (445)
42 Ralya Ur' Hardaspura (2)
~ 43 Allilee (446)
44 Bugran (43)
45 Chotian (42)
46 Butj Mansa (41) ("
266.
Livestock. Forestry. Fishing. Hunting and Plantations orchards &: allied activities
M
24
IS
1
4
8
4
2
3
2
4
2
2
4
1
m
F
25
Mioiog and Quarrying'
IV
M F
26 27
VILLAGE PRIMARY , '
INDUSTRlAL CATEGORY .
M4nutactut'ing. Processing. Servicing. and Repairs in Household Industry
M
28
95
3
6
5
4
4
4
10
2
10
8
1
6
, Veal
"
F
29
11
1
3
13
Manufacturing, Processing Servicing and Repairs in other than House.. hold Industry
V(b)
M F
30 31
RalJlpllrll Ph III'
115 2
41
5
5
2
43
3
5
1
7
19
14
6
2
18
4
2
5
12
1
1
L
-------------------------------------------~--------------------------~

<: ENSUS ABSTRACT
OF MAIN WORKERS
Constructions
VI
M F
32 33
TlllsiI (Part)
IS8
4
4
6
(j
S
3
4
t
a 12
13
14
7 1
6
2
2 ..
Trade and Commerce
vn
M
34
102
12
13
2
11
31
11
9
21
29
23
3
17
17
14
7
6
F
35
2
1
1
1
1
267
l'tansport, Storage Communications
Vlll
M F
36 37
S6
3
'.
2
5
6
2
·1
4
2
10
1
2
9
3
4
7
Other Services Marginal Workers Non-Workers
IX
M F M F M F
38 39 40 41 42 43
171 32 108 354 2.376 4.300
10 2 422 858
16 1 460 1.060
15 301 586
13 2 6 28 474 735
9S (j 1.072 2)95
10 " 237 436
19 5 19 182 425 .594-
31 S 431 735
37 7 615 1.144
24 2 589 1.269
97 7 I,On Z,lZ4
4 80 191
11 28S 589
53 1 749 1.038
19 3 359 783
37 1 359 780
6 1 294 643
1.5 1 218 387


PRIMARY ·~ENSVS ABS'fRACT-~
~.t\~URA C. D. BLOCK
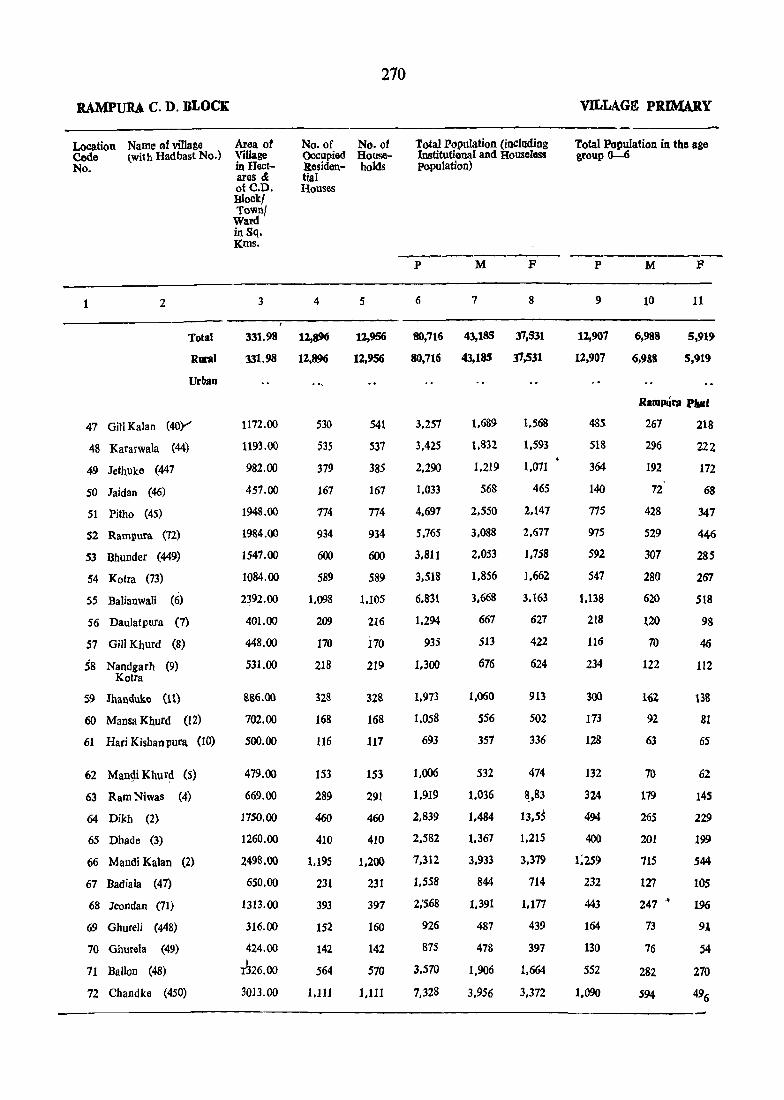
RAMPURA C. D. BLOCK
Location Name of village Code (with Hadbast No.) No.
1 2
Total
Rural
UrbaD
47 Gill Kalan (40Y
48 Kararwala (44)
49 Jethuke (447
50 Jaidan (46)
S1 Pitho (45)
S2 Rampura (72)
53 Bhunder (449)
54 Kolra (73)
55 Balianwali (6)
56 Daulatpura (7)
57 Gill Khurd (8)
58 Nandgarh (9) Kolra
S9 Jhanduke (11)
60 Mansa Khurd (12)
61 Hali Kishanpu1"l\ (10)
62 Mangi Khur~ (5)
63 Ram Niwas (4)
64 Dikh (2)
65 Dhade (3)
66 Mandi Kalan (2)
67 Badiala (47)
68 Jeondan (11)
69 GhureJi (448)
70 Ghurela (49)
71 Ballon (48)
72 Chandke (450)
Area of Village in Hectares & ofe.D. Blockl Town/ Ward in Sq. Kms.
3
No. of Occupied Residential Houses
4
270
No. 01 Households
5
331.98 12,896 12,956
12,956 331. 98 12,896
1172.00
1193.00
982.00
457.00
1948.00
1984.00
1547.00
1084.00
2~92.00
401.00
448.00
531.00
886.00
702.00
500.00
479.00
669.00
1750.00
1260.00
2498.00
650.00
1313.00
316.00
424.00
rl26.00
3013.00
530 541
535 537
379 385
167 167
174 774
934 934
600 600
589 589
1.098 1.105
209 216
170 i70
218 219
328 32&
168 168
116 117
153 153
289 291
460 460
410 410
1.195 1.200
231 231
393 397
152 160
142 142
564 570
1.111 1.111
VILLAGE PRIMARY
Total Population (including Institutional and Houseloss Population)
Total Population in the age group 0-6
P M F p M F
6 7 8 9 10 11
80,716 43,183 3',531 12,907 6,988 5,919
80,716 43,185 37,531 12,907 6,9&& 5,919
3.251
3,425
2.290
1.033
4.697
5.765
3.811
3.518
6.831
1.294
935
1.300
1.973
1.058
693
1.006
1.919
2.839
2.582
7.312
1.558
2;568
926
875
3.570
7.328
1.689 1.568 485
1.832 1.593 518
1.219 1.071 364
568 465 140
2.550 2.147 775
3.088 2.677 975
2.053 1.758 592
1,856 1.662 547
3,668 3,163 1,138
661 627 218
513 422 116
676 624 234
1.060 913 300
556 502 173
357 336 128
532 474 132
1.036 8,83 324
1.484 13,55 494
1,367 1.215 400
3,933 3,379 1;259
844 714 232
1,391 1,117 443
487 439 164
478 397 130
1,906 1,664 552
3,956 3.312 1,090
Rampgl'a PIaIII
267 218
296 222
192 172
12 68
428 347
529 446
307 285
280 267
620 518
120 98
10 46
122 112
162 138
92 81
63 65
70 62
179 145
265 229
201 199
715 544
127 105
247" 196
13 91
16 54
282 210
594 496

-CENSUS ABSTRAcr
Scheduled Castes
M F
13
13,206 11,533
13,206 11,533
l'ahsU (part)
"" 563
578
370
108
664
1.366
405
690
1,077
252
134
303
328
153
95
165
185
3S7
204
1,453
298
461
88
124
(i21
1,126
~
483
503
329
87
540
1,157
359
607
918
243
109
277
297
123
74
155
178
366
187 "
1,286
243
364
94
116
555
1,010
Scheduled Tribes
M F
14 15
,271
INDUSTRIAL CATEGORY OF MAIN WORKERS
Literates
M
16
16,~63
16,263
674
707
525
162
977
1,179 . 764-
852 .. 1,410
315
111
239
372 " 120 . 132
262
353 "
441 ..
595
1,553
287
535
231
159
677
1.471
( I-IX)
M
1.7 18
9.079 ~4. 7J!j <-
9,079 ~4,736
454
450
236
62
574
701
415
470
914
174
52
112
197
24
64
129 .. 149
215
346 " 875
154
333
123
115
341
822
1,019
994
732
282
1.600
1.833
\1,230
1,050
1.~66
337
324
352
609
311
194
288 ~~
568
855
8,00
2,213
478
801
267
303
1,089
2,279
.Cultiva,tors
M
19 20
670. 14,416
610' 14,416
17
29
5
1
4
7S
4
178
36
19
2
i
16
6
r 4
7
18
9
5
3
1
7
26
504
572
422
184
1.024
880
847
502
880
190
199
16~
372
214.,
116,
163
439
534
575
1,142
283
418
i73
219
623
1,400
I
F
21
95
93
6
1
1
1
4
'{
Agricultural Labol!rofs
II
M F
22 23
6,819 3.23l
6,819 3,238
348
287 21
171
360
639 24
223 1
313 138
540
lOS 16
99 ;, 168
205
79
61
77
86
211
146
758
142
290
'"
29
6S
11
4
1
3 "
368 "I
501 11
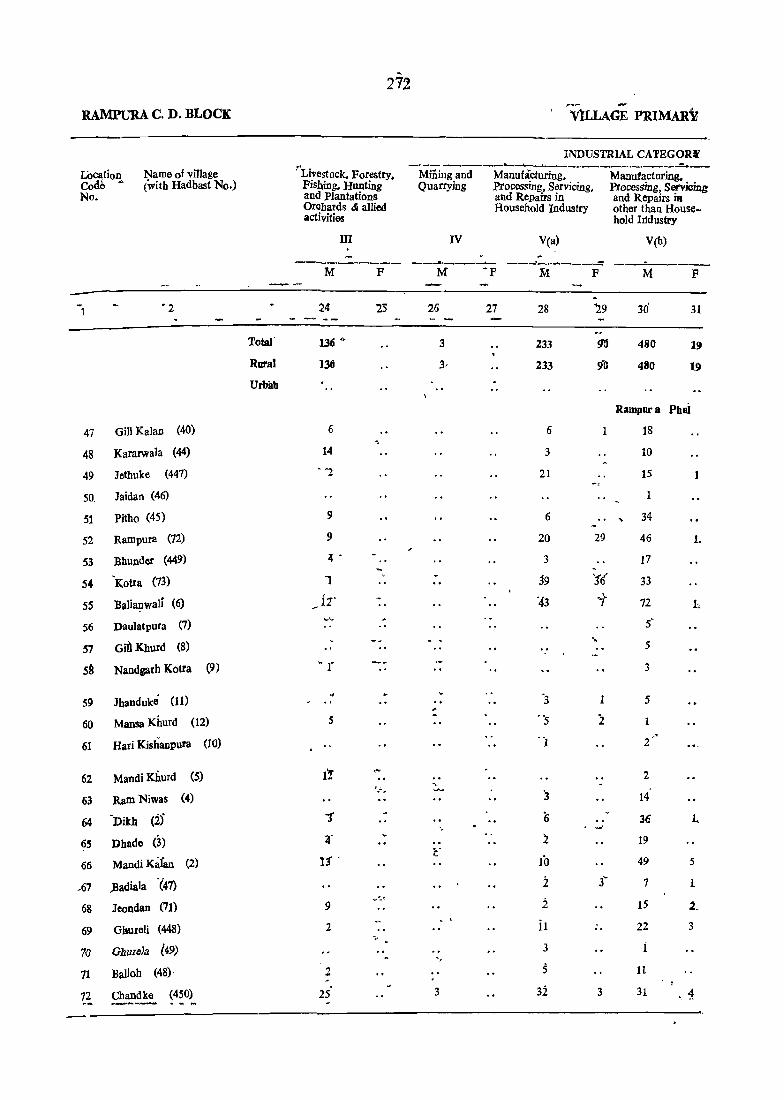
272
RAMPURA C. D. BLOCK \7n.LAGE PRIMARlJ
INDUSTRIAL CA1'EGOR~ _____ --. ____ r..- ---LOcation Name of village rLivestock. Porestry. Miiiing and Manufacturing, Manufacturing. Code " (with Hadbast No.) Fishing. Hunting Quatrying Processing, Servicing, Processing, servicing No. and Plantations and Repairs in and Repairs itt
Orchards & allied Household Industry other than House-activities hold IIidustry
HI IV V(a) V(b) " ----------- --....... --~
__ -.o!. _ __,;.., ___ -!!!:: __ -J ____
M F M -p M F M F
-1 ~2 ~4 '23 26 27 28 ~9 3d' 31 - ---Total' 136 ,. 3 233 !1l) 480 19
Rural 1311 3· 233 !fo 480 19 Urbltb
RlllDpura Phui
47 Gill Kalan (40) 6 6 18 '.
48 Kararwala (44) 14 3 10
49 Jethuke (447) --2 21 15
50, Jaidan (46) 1
51 Pitho (45) 9 6 ., " 34
52 Rampura (72) 9 20 29 46 1.
53 Bhunder (449) 21 • 3 17
54 -Kotra (73) 1 j9 '16 33
55 Balia~wali (6) it' '43 '1 72 l~
(7) ~<.- 5' 56 Daulatpura
.,. 5 57 Gil) Khurd (8)
5~ Nandgarh Kotla (9) ~r 3
59 lhanduke (11) '3 1 5 ;.
Mansa Khurd (12) 5 - 's i 60 'i .'
61 Hari Kishanpura (lO) 2
62 MandiKhurd (5) 1't 2 "' '.- ... .....,
3 14 ,
63 Ram Niwas (4)
64 -Dikh CiS -r 6 36 t . ,."..'
65 Dhade (3) .1' i 19 t'
66 Mandi Karan (2) 1$ . 10 49 5
-67 )3adiala '(47) i 3~ 7 1 v" .. ~ i 15 2. 68 Jeolldan (71) 9
69 Ghureli (448) 2 il .. 22 3 ."
70 GbllIcla (49) 3 ,
71 Balloh (48) 2 5 11
72 Chandke (450) 25 3 32 3 31 .1 ---- • _ M
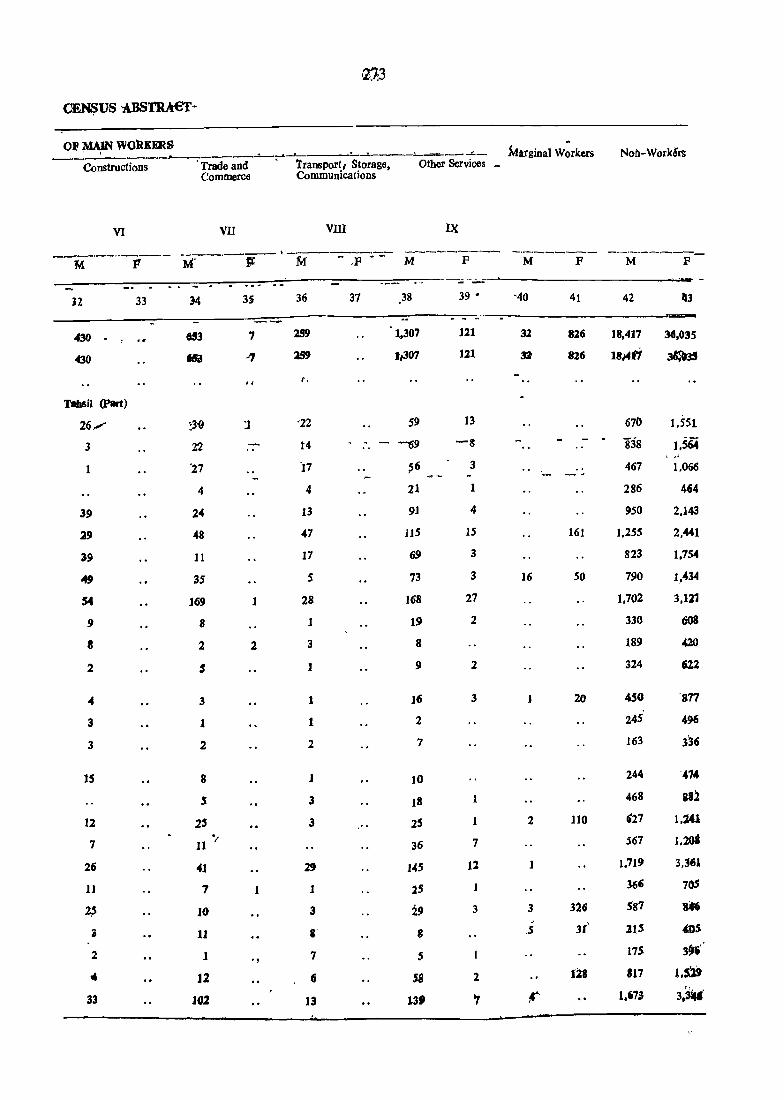
12J:3
OF MAIN WOllEFRS __ __:__:__ _____________ < _ ....... ->----"-...... ---"------~- Mttgina] Workers
Constructions • Trade and ''transport, Storage, Other Services -Commerce Communications
Non-Work!rs
VI VII VIII IX
----------- M~----~·-M---~~~~----...___----. -.-------- _._.-.-.----_
M If M F M F M F
:J2 33 M 3S 36 37 . 38 39 • -40 41 42 113
430 . .. 8S3 7 2S9 1,307 121 32 826 18,417 34,035
430 1&1 ., l59 1,307 121 » 826 1814ti ~
J, r.
TahSil (Part)
26/ ::3'9 1 '22 S9 13 670 l,SS!
3 22 - 14 -.. - -';9 "
-3 838 1.564 ' "
1 '27 i7 ~6 3 " 467 1.066
~-
4 4 21 1 286 464
39 24 13 91 4 950 2.143
29 48 47 115 15 161 1.255 2.441
39 11 17 69 3 823 1.154
49 35 5 73 3 16 50 790 1,434
54 169 1 28 168 27 1,702 3.111
9 8 1 19 2 330 60S
a 2 2 3 8 189 .uo 2 S 9 2 324 622
4 3 1 )6 3 1 20 450 '871
3 1 1 2 245 496
3 2 2 7 163 336
15 8 1 10 244 '4".
$ 3 18 1 468 aU
12 25 3 ." 25 2 110 627 I,m
7 11 "/ 36 7 567 1,204
26 4J 29 145 12 1 1,719 3.j61
11 7 1 l5 366 70s
2~ JO 3 29 3 3 326 587 '"' D 11 a' 8
"
S 3r' lIS .(OS
2 1 ., 7 ," S 17S 3J','
.- 12 fi sa 1 128 817 1.S))
33 102 13 13' ~ ~ 1.613 3.~'

274
RA~URAC.D.BLOCK VJt:tAClf -PRfMARy
LQCation Name of village Area of No. of No. of Total Population (including Total ~opulation in tho ago Cude (with liadbast No.) village Ocoupied House- Institutional and Houseless group 0-6 No. in Hect- Residen- bold Populiition)
ares" tial Houses orC.D. Block Town! Ward in Sq. Kms. . ------------'P M ., P M P
'1 2 3 4 5 6 7 8 '9 10 11
. ..;.. ~:> RIlDIpIIr* Ph"
;:' 13 Khokhar (3) 1172.00 333 338 2.337 1.266 1.(J77 ~4 205 i69
74 Sooch (4) 617.00 209 209 1.375 737 638 186 11l .75
7S ~haini Chuhar (452) 622.00 241 241 1.461 785 676 239 128 111
76 Prkot (4~1) 862.00 193 193 1,380 '63 543 185 .95 90 -_- __ . ~'\"'i.
.. URBAN: ~ ... .. -;. ~.
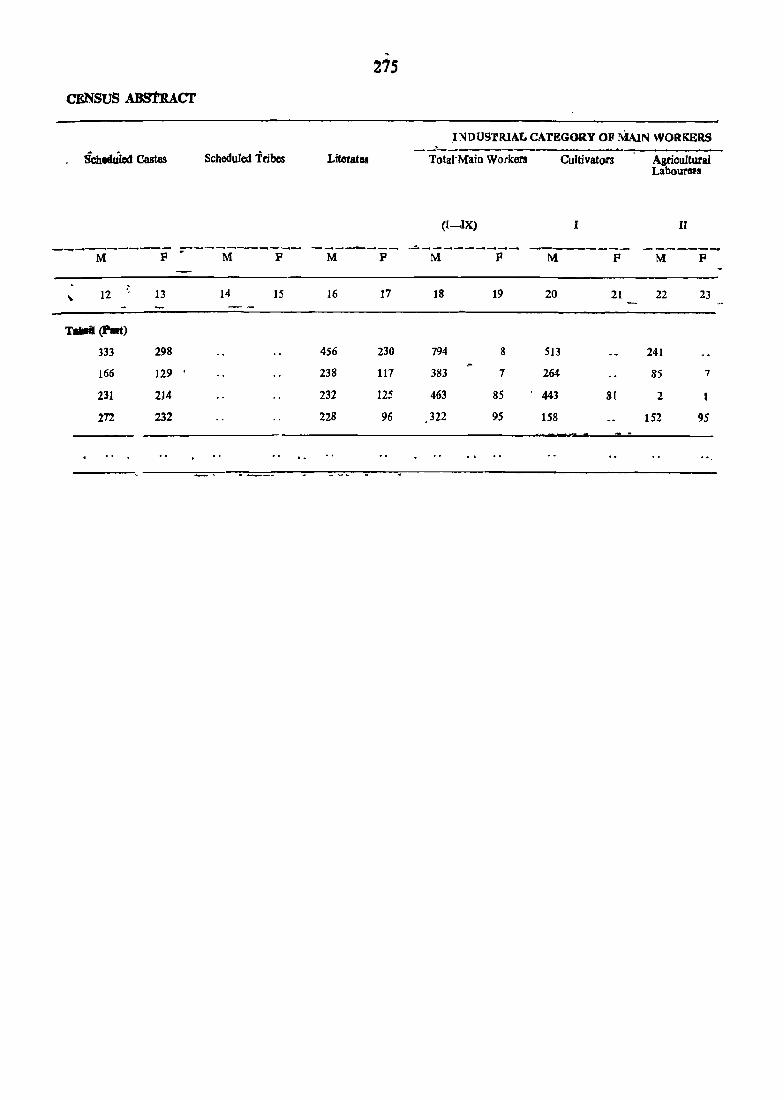
,
275
CENSUS ABS'l'RAcr
Scheduled Tribes Literatos
---~-----p- ~--ri---F-- --------M P
\ 12 13 14 15 16 17
TIIIIIiI (Put)
333 298 456 230
166 129 238 117
231 214 232 125
272 232 228 96
.1 :--I DUSTRIAL CATEGORY OF MAIN WORKERS
T()tal-Main Workers
(I-IX)
~...:::.---------M P
18 19
794 8
383 7
463 85
322 95
Cultivat()l'S
I
------M P
20 21
513
264
443 81
158
Agrioultural La boU1'tlfs
II
-------M fI
22 23
241
85 7
2
152 95
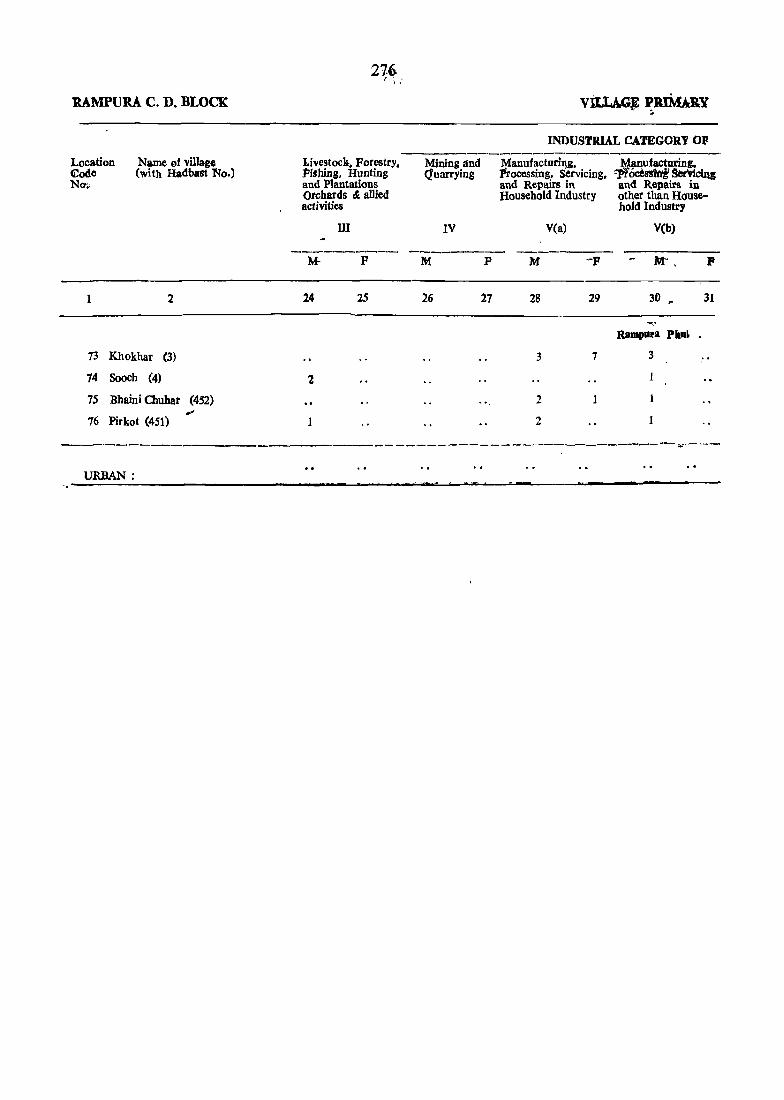
RAMPURA C. D. BLOCK
Location €ode NO'~
Name of village (with Hadbast No.)
2
73 Khokhar (3)
74 Sooch (4)
7S Bhaini Chuhar (452)
76 Pirkot (451)
URBAN:
216 .... , "
l.ivestock. Forestry. :Pjthing, Hunting and Plantations Orchards & allied activities
ill
p
24 25
2
Mining and Quarrying
IV
26
p
27
INDUSTRIAL CATEGORY 01'
Manufacturillg. 1!ocessing. Servicing, and Repairs in Household Industry
Veal
M
28 29
3 7
2
2
Manufacturing. ~~ SeniciJu: and Repairs in other than Household Industry
V(b)
p
30 '" 31
-.-Ramplll'a Pha~
3
1
1
1
---------------------------~---
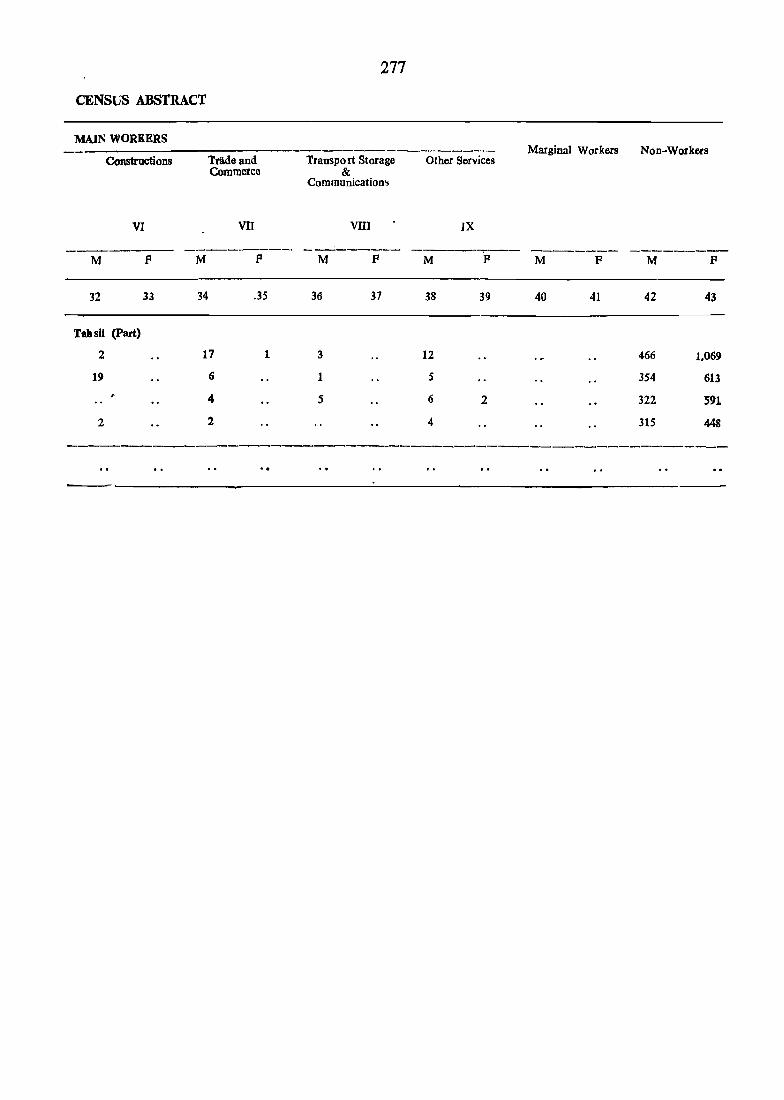
CENSUS ABSTRACT
MAIN WORKERS
Constructions
VI
M F
32 33
Tail sit (part)
2
19
2
M
Trade and Commerce
Vll
F
34 .35
17
6
4
2
1
277
Transport Storage &
Communications
M
3d
3
1
5
VllI
F
37
Other Services
M
38
12
5
6
4
IX
F
39
2
Marginal Workers Non-Workers
M F
40 41
M
42
466
354
322
315
F
43
1.069
613
591
448

PRIMARY CENSUS ABSTRACT
BATmNDA C.D. BLOCK

280
BATHINDA C. I), BLOCK VILLAGE PRIMARY
Location Name 01 1!:illage Code (with Hadbast No.) No.
2
30 Naruana (65)
Total
Rural
Urban
31 Jodhpur Romana (64)
32 Jass] Pauwali (61)
33 Gehri Devi (63) Nagar
34 Kot Snamir (S'!J
36 GulaMarh Urf (58} Naiwala
37 Katar Sinabwala (62)
38 PhllS Mandi (6{))
39 Bhagu -(59)
40 Gill Patti (71)
41 Sibian (72)
42 BaIadewals' (73)
4.3 lJeaman DUW8na (74)
44 Bir Behman (75)
45 Birtalab UrI (68) Talabnlli
46 Multania (67)
47 :\1ian (66)
48 Baho Sibian l>atli (2) Basawa
49 Baho Sibian Patti (1) Dharam
50 Babo Jattri (3)
.51 Teona (4)
52 Chugba Khurd (16)
S3 Baluana (77)
S4 Cbu&lIa Kakcn (79)
505 Jllumba (05)
Area of Village in Hectales and orC.D. Block town/. Ward
No. of Oceupied Residential Ronses
No· of Households
Total :Population (including Institutional and Housele~s Population)
Total Popujation in the age GroupO~
in Sq. Km5.
p M
3 4 5 6 7
646.83 23,5() 1 24,665 1,49,~73 79,650
646J13 %3,501 24,6~5 1,49,873 79,6S0
1438.00
1()12.00
1028.00
19053.00
46<1?00
573.00
564.00
404.00
1164.00
883.00
1374.00
708.00
1749.00
699·00
529.()()
796.00
403.00
178.00
183.00
374.00
1329.00
844.00
1.798.00
1847.00
J8W.OO
519' 527 3,186 1,704
283 368 2.039 1,085
426 460 2,862 1,547
519 561 3,475 1,851
l,310 1.3% 8,341 4,436
251 262 1.561 822
231 233 1.532 788
259 265 1,515 798
262 279 1,837 965
472 488 2,921 1.565
739 784 4.645 2,441
324 342 2.044 1,(}77
726 712 4,1i31 2.459-
320 333 20.26 cor8 554 560 3.13(J 'J .Q58
195 211 1,191 621
127 137 169 413
62 62 413 217
58 60 451 219
140 140 864 455
476 517 3.225 1.702
358
665
561
'60b
359
678
581
,62S
20.48 1.098
3.~4 2,081
3,428. 1.820
3.601 1.974
F p M p'
S 9 10 11
70,223 24,249 13,002 11,247
7(1,223 ~Z49 13,002 B ,247
1,482 563
954 312
1.315 496
1.624 S6Q
3,905 1.246
739 304
744 270
717 259
872 319
1.356 512
2.204 764
967 402
::!,I72 701
948 315
1,412 693
570 178
356 lJl
196 70
232 76
409 145
1.523 559
950
1.863
L.60&
1.827
308
639
483
622
302
152
217
310
,587
172
1)7
136
167
280
399
223
391
163
}91
95
77
-39
36
19
281
171
337
262
324
Batbioda
261
160'
219
2S()
S59
132
133
123
1S2
232.
365
179
310·
152
302
83
.54
31.
56
278
131
302
221
298
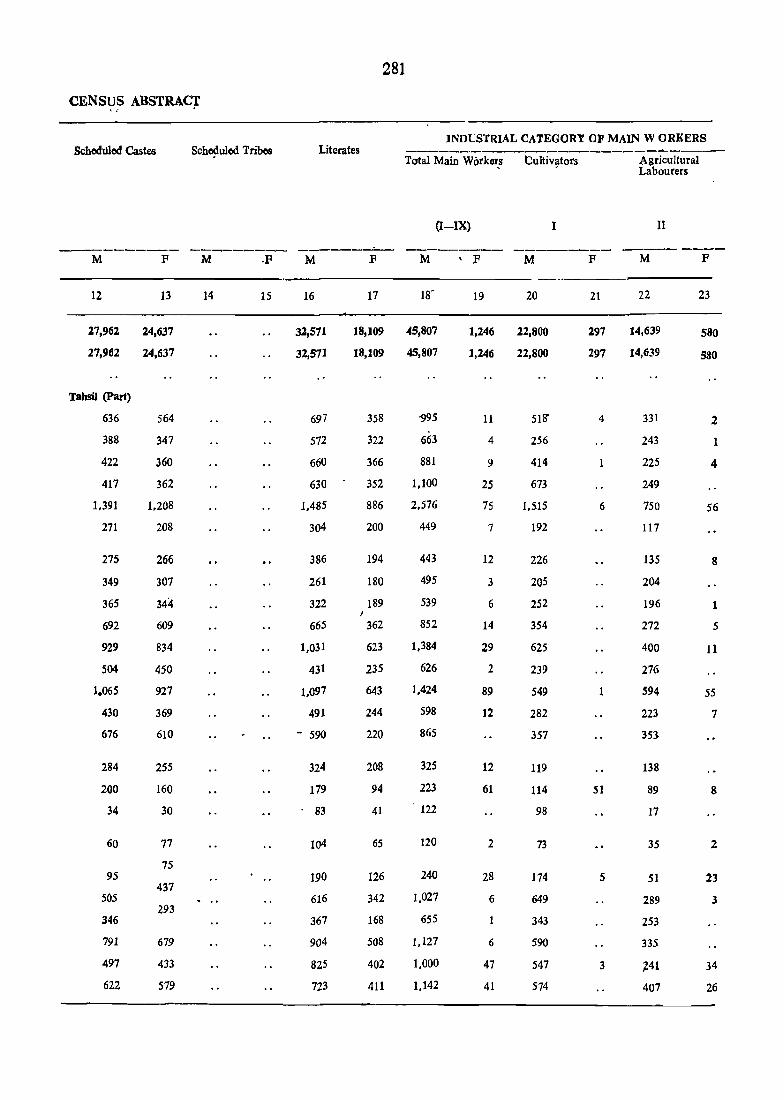
CENSUS ABSTRAC1 . ,
SchedUled Castes
M F
12 13
27,962 24,637
27,962 24,637
Tabsil (part)
636
388
422
417
1.391
271
275
349
365
692
929
504
1.065
430
676
284
200
34
60
95
505
346
791
497
622
564
347
360
362
1,208
208
266
307
344
609
834
450
927
369
610
255
160
30
77
75
437
293
679
433
579
Scho~uled Tribes
M .F
14 15
281
INDUSTRIAL CATEGORY OP MAIN WORKERS Literates -----------------------"""----
Total Main Workor_s t:ultiv~tors
(I-IX) I
------;......_ M
16
32,511
32,511
697
572
660
630
1,485
304
386
261
322
665
1,031
431
1.097
491
- 590
324
119
. 83
1()4
190
616
367
904
825
723
F M
17 18-
18,109 45,807
18,109 45,807
I
358
322
366
352
886
200
194
180
189
362
623
235
643
244
220
208
94
41
65
126
342
168
508
402
411
"995
663
881
1,100
2,576
449
443
495
539
852
1,384
626
1,424
598
865
325
223
. 122
120
240
1,027
655
1,l27
1,000
1.142
\ F M
19 20
1,246 22,800
1,246 22,800
11
4
9
25
75
7
12
3
6
14
29
2
89
12
12
61
2
28
6
6
47
41
518'
256
414
673
1.515
192
226
205
252
354
625
239
549
282
357
119
114
98
73
174
649
343
590
547
574
F
21
297
297
4
6
51
5
3
Agricultural Labourers
II
M F
22 23
14,639
14,639
331
243
225
249
750
117
135
204
196
272
400
276
594
223
353
138
89
17
35
51
289
253
335
741
407
580
580
2
1
4
56
8
1
5
11
55
7
8
2
23
3
34
26

282
BATHOONDA C. D. BLOCK VILLAGE PRIMARY
Localion INDUSl'RIAL CATEGORY
Name 01 village --,-"" -.. .. ,Code (with Hat1~ast No.) ti~tock. Porosity, ' Mining and Manufacturinr. Manufacturing. No. Fishing. Hunting Quarrying Ptocessing.. Servicing. Ptocessin(. Scsfvicing
and Plantations lind Repairs in and' Repaus in Orchards & alUed Housoh()ld Industry other than. Roosa· activities hold' Ind'ustry
m IV V(a) V(b)
-----_. ---- ----- ------- -------M F M F .M F M P
,. ':'
1 2 24 25 26 27 28 29 30 31 •
'[otal 290 7 440 50 1,231- S3
Rural '291) 7 440 50 1,231 53
Urban
Batlainda .... 30 Natuana (65) 5 13 14 1
31 Jodhpur Romana (64) 5 3 39'
32 Jas~i Pauwali (61) 7 5 81
33 Gehri Devi Nagar. (63) 7 10 9 42 3
34 Kot ~hamir (57) 7 30 55
36 Gulabgarb Ur/N,Uwala (5S) 2 23
37 Katar Singhwala (62) 5 4 2 IS
38 Phus Mandl (60) 20
39 llhll.Su (59) 2 8 3 7
40 Gill Patti (71) 10 4 82 1
41 Sibian (72) 6 23 2 9) S
42 Baladcwala (73) 2 22
'43 Bchman Dewana (74) II 1 1& IS 32 • 44 BirBehman (75) .. 2 2 1 7
45 Birtalab (Irf Talabnc:i (68) 19 3 20 . 46 MU,ltania (67) 5 6 4 6
47 Mian (66) 2
48 Babo Sibian Patti Basawa (2)
49 Baho.sibian Patti Dbatam (1)
50 Babo Jattti (3) 6 2
51 TCQoa ,(4) 10 10 J
52 Cllugha Khurd (76) 4 13 4
53 Balusoa (77) 4 4 17 1
S4 Chugua Kalan (79} 6 50 22 3
5.5 Jhumba (5) 7 8 21 1

01' MAIN ~ORKERS
Constructions
VI
---------M P
32 33 ~,
fl91 1
e91 1
Tahsil (Part).
3
.5
23
36
17
44
11
10
10
11
.53
10
30
12
10
2
2
4
4
2
3
1
403
8
ti
Trade and Commerce
VII
----------M F
34 3S
958 l~
9S8 29
25
42
29
16 11
8S 2
I)
(I 1
16 1
18
30
28
15
48 .2
12 1
!)
16
2 1
2
3
26
7
29
38
39
283
T.ransport. Storage & Communications
Vlll
-------M F
36 37
S07 4
307 4
8 . 1
]3
14
9
15
8
(I
3
4
13
13
.5
22
9
12
G 2
2
1
1
22
3
8
Other Services
IX
--------M P
38 39
4,231 224
4,251 22:4
78 J
57 2
83 3
58 1
92 10
S6 S
3S
37 2-
42 l
18 1;
137 H
57 2.
123 14
49 a 82
33 6
12 1
S
2
37 2
2!)
83 5
85 6
72 13
Marginal Workers Non-Workers
------_ -------M F M F
40 41 42 43
.6 1,740 33.1n 67,137
66 1,140 33,771 61,237
709 1471
1 422 949
66d 1,305 1
751 1.591
2 I,858 3,830
... 7 373 725-
'lH
e 29 339 703 1
~ 303 714
d6 8&4 ''OJ
... I 713 1.1"1
1.0S?' " t
.~
141 ].034 ~
431 ~i
4 53 1.031 2.030
480 936
3 7 790 lAdS
296 SS8
190 195
95 196
99 ' 230
liS 381
675 1.511
443 949
954 1.857
13 73 807 1.488
832 1,786

BATHINDA C. D. BLOCK
Location Name of village Code (with Hadbast No.) No.
Area of Village inHectaros and of C.!>. Blockl 1'own/Ward in Sq.Kms.
No. of Occupied Residen-tial Houses
25.4
No. of Households
'Iotal Population (including Institutional and Houseless Population)
p M F
, VILLAGE PRIM ARY
'Iotal Population in the age. group (0-6) .
P M F
-------------------------------------------------------.- .----------------------1 2
56 Sardargarh (80)
57 Karamgarh (78) Sattran
58 Virk Kburd (182)
59 Virk Kalan (181)
60 Bhisiana (180)
61 Burj Mehma (178)
62 I)eon (171)
63 Mehma Bhag- (176) wana
64 Killi Nihal (179) Singq
65 Ablu (174)
66 Mehma Sarkari (175)
67 Mehma Sarja (168)
68 Nehianwala (167)
69 Mehma Sawai (169)
70 Balahar Mehma (170)
;11 I)an Singhwala (171)
72 Ganga (173)
73 Warkandi (172)
74 Akalia Khurd (7)
75 Akalia Kalan (8)
76 Chak Goniana (165) Khuld
77 Ba1ahar Vinjhu (166)
78 Chak Goniana (164) Kalan
79 Goniana Khurd (163)
80 Goniana Kalan (162)
81 Amargarh (161)
82 Bhokhra (160)
3
989.00
478.00
720.00
1329.00
684.00
1222.00
2162.00
637.00
576.00
3524.00
607.00,
2773.00
1702.00
1637.00
668.00
1492.00
1171.00
377.00
314.00
1578.00
126.00
547.00
100.00
530.00
713.00
496.00
1180·00
4
314
202
344
346
871
342
831
226
314
837
218
945
828
635
266
356
405
5
344
225
353
346
872
345
847
6
2.030
1.258
1.896
2.314
4.256
2.273
5.618
7
1.055
663'
1.009
1.232
2,550
1.186
2,968
234 1.240 650
378 2.180 . 1,139
872 5.869 3,201
218 1.360 714
978 6.200 3.319
863 5.208 2.748
683 - 4.1>38 2.142
270 1.627 865
368 2.601 1.383
405
215. 22.5
2.526
1.257
500
3.541
446
1.329
649
270
1.888
242
100 102
510 615
80 80
269 299
191 195
258
153
488
264
155
516
1.568
1.231
1.589
942
3.328
799
660
840
493
1.711
8
975
595
887
1.0.82
1.706
1.087
2.650
9
291
210
303
289
716
368
938
590 212
1.041 397
2.668 900
646 230
2.81 1.048
2.460' 840
1'896 599
762 239
1.218 373
1.197
60S
230
1.653
204
769
571
749
449
1.617
351
216
65
645
8S
259
183
216
140
597
10 11
Bathinda
165
115
169
152
385
196
504
106
203
513
121
560
444
30-3
145
189
180
126,
95
134
137
331
172-
434-
106.
191
387
109
488.
396.
296-
94
184
171
110 106
40 25
344 3011
SO 38
137 122
Un-
96 87
III
76
294
105
64
303

CENSUS ABSTRACT
Schequled Castes ~chcduled Tripes
M F • M F
28$
INDUSTRIA( CATEGORY OF MAIN WORKERS
----------------------------Literates 10tal Main Workers
(I-IX)
------,----M F M F
Cultivators
I
M F
Agricultural Labourers
II
M F
------ --_ -----------------------------12
Tahsil (part)
425
303
493
295
547
419
1,047
268
547
926
230
1.173
1,067
851
302
448
411
334
42
720
166
327
inhabited
165
176
175
656
13
400
248
405
263
487
408
967
245
493
722
185
1.001
961
753
.248
371
353
329
31
649
ISO
312
155
161
162
61.5
14 15 16
530
289
329
503
1,682
441
1,140
291
344
1.139
366
1.232
1,260
786
389
639
589
'236
143
734
48
362
229
385
166
668
17
349
178
181
258
856
286
654
114
194
602
235
644
727
388
212
370
349
109
90
357
20
222
116
203
86
403
18
622
392
653
655
1,686
673
1,684
396
.646
1.940
424
1,823
1.570
1.263
447
870
781
354
145
1.014
136
449
410
499
264
908
19
13
4
4
49
10
85
3
118
5
5
254
12
4
9
45
7
6
13
8
2
2
2
13
20
307
194
268
349
88
316
1,000
199
253'
1.220
195
1,08
643
725
208
495
457
140
114
563"
31
208
284
341
131
441
21
2
85
129
2
3
1
22
183
119
277
209
300
268
501
145
280
530
124
592
478
464
162
293
232
187
11
342
94
119
85
121
112
337
23
27
9
115
109
1
8
43
4
4
4
1
1
5 .•

2'86-
BA.THJlNDA C. D. BLOCK trLLAGE PRIMARY
INDUSTRIAL CATEGORY ..Location
Code No.
Name of village (with Hadbast No.)
---------....----. __.__-------------------Mining'and Manufacturing. Manufacturing,
2
56 Sardargarh (80)
57 Karamgarh Sattran (78)
58 Virk Khurd (1$2)
59 Virk Kalan (181)
60 Bhisiana (180)
61 Burj Mehma (178)
62 Deon (177)
63 Mehma Bhagwana (176)
M Killi Nihal Singh (179)
65 Ablu (174)
66 Mehma Sarkari (175)
67 Mehma Sa rja (168)
68 NehianwaJa (167)
69 Mehma Sawai (169)
70 Balahar Mehma (170)
71 Dan Singhwala (171)
72 Ganga (173)
73 Warkandi (l12)
74 Akalia Khurd (7)
75 AkaiIa Kalan (8)
76 Chak Gon[ana Khurd (105)
Livestock, Forestry, Fishing, Hunting and PJantati ons Orchards & allied activities
M
24
4
1
37
6
1
2
7
5
2
14
5
2
2
1
III
F
25
1
77 Balallar Vinjhu (166) 9
78 Chak Goniana Kalan (164)
79 Goniana Khurd (163) 2
80 <ioniana Kalan (162) 2
81 Amargarh (161)
82 Bhokhra (160) 4
Quarrying Processing. Servicing, Processing, Servicing
IV
M F
26 27
and Rc>pairs in and Rl'pairs in Household Jndu~try other than House
M
28
1
4
4
2
17
4
7
17
7
22
6
1
10
2
2
8
1
14
10
V(a)
F
29
1
4
hold Industry
V~b)
M F
30 31
Bathluda
17
. 33
5
4
9
21
14
49
9
47
98 ~
4
15
22
14
8
4
5
22
10
\ Un-
12
3
33

CENSUS AIlSTRACT
.oF MAIN WORKERS
Constructions
VI
----------M. F
32 33
TahSil (part)
8 -10
4
-1
9
2
4
3
5
13
22
68 1
11
4
3 14
2
7
6
1
17
illhabited
3
8
1
13
Trade and Commerce
VII -..L _______ ...lIOo-
M F
34 35
, 14 "-.
8
12
13
1
18
20 -'
6
18
20
8
,,32
37
6 1
10
10
12
3
15
17
7
2
11
Transport. Storage Other Service,~ and Communications
VIII IX
_....._-....... ---- ---------M F M F
36 37 38 39
14 75 - 13
4 22
10 40 4
5 -61 4
1 1.289 -19
9 41 1
8 11S
3 19 2
6 75 3
13 79 4
5 58 4
11 87 5
44 182 10
,7 45 3
3 35 1
S 3S
7 41 3
12 1
4
2 67 2
3 2
22 3S 8
12 5 1
5 ," 17 2
2 18 2
4 49 7
Marginal W()rkel'~ Non-Workers
-------_ ---------M F M F
- .. ,.. ..... 40 41 42 43
19 189- 414 174
- 2 rsr- 259 414
. , 361 356 312
S 164 57l 814
3 1104 1,6'4
513 1,1)17 . 7 1.284 2.558 .
254 5,87
493 923
., 7 1,261 2.656
290 64t
16 1,496 2.6lt
1.178 2.448
879 1.892
418 753
S13 1.173
S48 1.190
295 .602
125 230
10 240 8M 1.400
69 106 134
1 350 760
16 250 553
341 747
229 446
803 1.60~

, BATHINDA C. D. BLOCK
Location Name of village 'Code (wIth Hadbast ~o.) No.
1 2
83 Khialj\Vala (159)
84 Har Raipur (l5~) UrjBhokhri .....
85 Chak landan- (156) wala
86 Chak Jeeda (157)
87 Jeeda (153)
8~ Jandanwala (155)
89 Khemuana (154)
URBAN:
Area of Village in Hectares and orC.D. Bock/ TOVln/ Ward in Sq. Kms.
3
1045.00
1878.00
43.00
364.00
i651.00
2346.00
165.00
No.ot °RyqlP!$lc!
esldential Houses
4
361
480
673
604
396
No. of House
"holds
5
400
503
699
611
400
Total Population (inciuding lns1itutional and Housel6ss Population)
6
2.414
3,342
7
1,313
1,756
4,552 2,398
4,170 2,226'
2,620~ 1.378
8
1,101
1,586
2,154
1,944
1,242
VlLk\,GE PRIMARY
Total Popul~on in the age group (0-6)
9 10 11
Bathilllla
343
557
191 152
306 251
706 366
609 318
394 219
Un-
Un-
340
291
17~
----~--_...---

CE~5US AtJSrJ{ACr
Scheduled Castes Scheduled Tribos
-----_----- ~-------M P M P
12 13 14 IS
TBIlsD (Part)
S2S 398
587 535
inhabited
Inhabited
874 773
638 557
S7S S17
289
INDUSTRIAL CATEGORY OF MAIN WORKERS Literates
Total Main Workers
(I-IX)
_----- --------M P M P
16 17 18 19
489 230 759 32
687 426 1,013 6
980 588 1,317 J8
844 502 1,357 (;
714 421 786 8
Cultivators
I
--------M P
20 21
348
559
633 2
789 1
349
Agricultural Labourers
II
------~----
M F
22 23
201
289 2
426
440
295
----------~-----~----------------------------~-------~-------

BATHINDA C. D. BLOCK
L'O'catioo Code No.
Name of village (with Hadbast.No.)
2
83 Khialiv.:ala (159)
84 Har Raipur Ur/Bhokhri
85 Chak Jandanwala (156)
86 Chak Jeeda (157)
87 Jeeda {I 53)
88 Jandanw!lla (IS?)
89 Khemuana (154)
(158)
"
'290
Livestock. Forestry. Fishing. Hunting and plantations Orchards & -allied activities
III
M F
24 25
19
5
10
4
22
_..--..- -_- ._ -----~---_.. ........... --.-------------URBAN:
VlLLAGE 'PRIMARY'
INDUSTRIAL .CATEGORY _.L. ______ ~
.-::....!.--Mining and Quarrying
IV
M F
26 27
Manufacturing, Manuiacturing. Processing. Servicing, Proces~ing Servicing and Repairs in and Rerilir, in other Household than Household IndustrY Industry
V(~) V(b)
_---=------M F M F
28 29 30 31
BatllilMla
7 4 66 18
25' 26
Un-
Un.
18 1 34 S
19 oJ
10 9
--------~---~-----------~--~

CENSUS ABSTRACT
OL" MAIN WORKERS
Constructions
VI
-------_.-M F
31 33
Ta.iI (Part)
24
14
inhabited
inhabitod
22
21
7
'Trade and Commerce
~ll
------M F
34 35
22 2
19 2
49 2
12
12
291
Marginal Worker;; Non-Workers Transport Storage & Otll~r Service~ CommuDication~
Vlll IX
--------- -------- ------M F M P Nt r M p
36 37 38 39 40 ~l 41 43
20 52 6 59 554 1,010
17 S9 2 2 13 741 1.567
43 1 82 7 1,081 2,135
8 55 5 &6~ 1,938
7 75 7 59.! 1.lH
--------------------------------------------------_-_----


293
PRIMARY CENSUS ABSTRACT
NATHANA C.D. BLOCK

NAT~A C. D. BLOCK
Location Name of village Code (with Hadbast No.) No.
2
Total
Rural
Urban
Area of village in Hectares and of C.D. Block! Town! Ward in Sq. Kms
399.64
399:64
90 Giddar (181) 1030.00
91 Bajdana (183) 632.00
92 Kalian Sukha (185) 2358.00
93 Ka1ian MaIka (186) 822.00
94 Ka1ian Sudha (187) 524.00
95 Bhaini (188) 587.00
96 Mari (191) 653.00 '
97 Burj Dalla (184) 284.00
98 Nathpura (182) 1032.00
99 Ganga (180) 862.00
100 Nathana (l79) 2383:00
101 Poohla (198) 2249.00
102 Poohli (178) 1168.00
103 Dhilwan (l7!) 448.00
104 Seman (199) 1104 .00
105 Gobindpura (176) 2791.00
106 Joganand (173) 524.00
107 Bibiwala (174) 886.00
108 Mehna (175) 835.00
109 Bhucho Kalan (201) 3290.00
110 Bhucho Khurd (207) 1810.00
111 Tungwali (208) 3206.00
112 Chak Fateh (205) 1450.00 Singhwala
113 Chak Ram (204) Singhwala
114 Chak Bakhta (203)
115 Lehra Khalla (202)
761.00
890.00
1367.00
No. of Occupied Residential Houses
4 .
17,852
17,852
310
259
554
223
208
346
136
47
346
328
970
846
542
221
521
888
267
318
294
No. of House
holds
Total Population (Including Institutional and Houseless Population)
P M
561
18,381 1,01,306 51,899
18,381 1,01, '306 51,899
346
270
588
235
223
349
152
51
354
328
1.005
849
560
221
546
949
272
356
2,121 1.127
1,671 923
3,637 1.923
1,507 785
1,379 72L
2,432 1,307
975 498
339 184
2,257 1,179
2,198 1,192
6.420 3,420
'5,091 2,680
3,122 1.642
1,544 820
3,581 1,908
6,008 3,190
1.653 849
2,071 1.137
F
8
49,407
49,407
994
748
1,714
722
658
1.125
477
155
1.078
1,006
3,000
2,411
1,480
4,241
958
581
894
516
4,241
984\
13,047 5.099
5,893 3,098
724
1.673
2,818
804
934
7,948
2,79,5
1.852
2,839
1,512
379
412
270
591
937
525
409
422
286
3,856 2,004,
6,103 3.264
3,193 1,681
2.476 1,318
2,694 1.423
1,837 974
1,158
1.271
863
VILLAGE PRIMARY
Total Population ill the age group 0-6 '
~.--------------P M
!> 1')
18,525 9,915
18,525 9,915
372 211
235 120
550 306
224' 123
252 131
365 193
172 96
58 28
307 IS5
357 20S
1,058 567
824 4S1
577 298
285 163
609 345
958 495
266. 131
350 191
4,106 2,204
1.064 552
732 381
959 530
516 278
419
397
310
240
219
162
F
II
8,610
8,610
Bathinda
161
115
244
101
III
172
76
30
152
152
491
373
279
122
264
463
135
159
1,902
512
351
429
238
179
178
148

CENSUS ABSTRACT
Scheduled Ca§tes
F
12 13,
Ui,800 14,868
16,800 14,868
T.Mf' (Jfrt)
320
222
786
171
272
552
204
34
456
434
1.056
888
755
289
768
1.119
314
355
358
873
'835
1.018
755
417
494
281
270
188
704
170
258
485
211
17
385
348
943
794
685
243
661
963
284
309
402
791
759
891
675
350
445
237
Scheduled Tribes • 'J
M F
14 15
··1
"
295
INDUSTRIAL CA,TEGORY OF MAIN WORKERS
Literates
Total Main, Workers Cultivators
(I-IX)
M F M '.
17 18
22,060 16,137 27,~~9
2.2,060 -'16,137 27,4~9
427
374
719
364
299
526
221
85
549
330
1.616
1.201
679
286
617
1.080
423
543
2.640
1.262
827
1,278
734
60&
725
428
255
210
443
245
178
273
142
45
335
170
1.017
740
378
183
294
681
233
284
4.717
750·
568
714
482
402
621
506
1.093
429
399
741
277
122
735
751
USI
1.523
950
469
1.154
1.907
475
646
692
1.721
1.092
1,864
900
729
809
522
I
-----.-F M F
19 20 21
982 13,717 34
34 982 13,717
5
53
9
10
5
7
5
225
43
31
3
3
51
10
'8
208
26
16
34
18
4
12
5
370
303
561
286'
175
374
147
74
389
417
824
815
378
285
578
930
254
246
910
377
1.045
405
431
408
3[9
4
3
2
2
1
5
2
1
Agricultural Labourers
r rr
M F
22
8,458
8,458
177
153
3[3
78
146
317
97
~~
27'1
.29p
593 .... .I,
440 f.
42Q
146
381
70t rl
152
95
426
414 , 598
314
208
274
iss
23
386
386
163 [
12
23
J.
2
19

296
NATBANA C. D. BLOCK V1LLAGE PRIMARY
INDUSTRIAL CATEGO~Y
'Location Name of village Livestock, Forestry, Mining and Manufacturing, Manufacturing, Code (with Hadbast No.) Fishinr:' Hunting -Quarrying Processing, Servicing, Processing Servicing NO. and P antations and Repairs in and Repairs in
Orchards & allied Household Industry other than House-activities hold Industry
ill IV V(a) V(b)
-------M- F M F M F M F
1 2 24 25 26 27 28 29 30 31
Total 235 .4 298 48 547 36
Rural 23! 4 . 298 48 547 36
Urban
'" B_thinda
90 Giddar (181) 2 18
91 Bajdana (183) 2 1 '" 5
92 KaHan Sukba (18S) 4 63 7 10 2-
93 KaJian Maika (184) 4 S 2
94 Kalian Sudha (187) 2 10 12
95 Bbaini (188) 2 1 :3
96 Mari (191) 2 1 2
97 Bud DaDa (184) 3
98 Natbpura (182) 3 22 1
99 Ganga (180) 3 1
100 Natbana (179) 9 57 14 36 1
101 Poonla (198) 20 2 31 5 29 12'
102 Poobli (178) 10 10 1 1
103 Dhilwan !I77) 4 8
104- Seman (199) 17 30
105 Gobindpura (176) 30 3 1 40 8
106 Joganand (173) 5 12 I
107 Bibiwala (174) 18 6 76 1
108 Mehna (175) 1 12 2
109 Bhucho Kalan (201) 9 15 1 42
110 Bhucho Kbuid (201) 18 7 31
111 Tungwa(i (208) 11 24 " .
112 Chak PatoQ Singbwala (205) 11 3 33 6
113 Chak Ram SinahwaJa (204) 12 2 10
114 Chak Blkhta (203) 4 3 19
US Lehla Khana (202) 5 2 7 1
~

CENSUS ABSTRACT
OF MAIN WORKERS
ConstructioTlS
M
32
84S
845
Tahsil (Part)
30
9
g
45
12
5
35
32
23
3
13
27
7
69
258
47
59
26
24
7
15
10
VI
F
33
8
8
8
Trade and Commerce
M
34
771
771
6
15
42
15
9
8
5
7
8
103
44
28
12
24
57
5
15
86
64
39
47
30
11
J9
11
VII
F
35
11
11
1
1
1
3
2
3
1
1
297
Transport, Storage and Communica tions
VID
Other Services
IX
-----M
36
368
308
4
2
11
2
4
2
1
2
15
]6
3
1
18
1)
5
7
2
61
25
18
17
7
3
9
F
37
9
5
1
4
M
38
2,28!)
2,180
13
25
80
26
6
33
22
13
32
30
209
96
17
9
92'
108
3S
114
3]1
141
122
9S
63
41
64
24
F
39
444
444
1
5
17
8
S
1-
1
6
5
4]
18
16
]
2
14
6
187
20
11
3
11
4
11
2
Marginal Workers Non Workers
M
40
42
41
11
2
3
3
9
8
1
41 42
2,852 24,398
2,852 24,398
414
224
506
417
829
356
322
566
221
62
444
441
1.539
32 1,146
18
187
349
692
3St
754
1,281
371
49T
5 4,404
198 1,377
240 903
--.181 1,392
201
4
781
589
614
451
p
43
993
74]
1,247
713
424
1,120
476
154
1.071
1,001
2.775
2.336
1.449
703
1.610
2.580
445
926
7,735
2.571
1,596
2,5'24
1,494
1,154
1.058
854

298
NAtHAN A C. D. BLOCK VILLAGE PRIMARY
L'JCltio::t Name of , village Area of No. of - No. of Total Population:(Including Total' Population l1r the- age Go:i ~. '(with Hadb I;t No.) Village ". Occ\lpied ,ffollse!. Institutional andL,~u~Iess group(O~ No. in He<:- Residential holds Population)
tares and ofC.D.
Houses
Blockl Townl Ward in Sq. Kms.
------~----p M F P M F
1 2 3 4 5 6 7 8 9 10 11
c. Bathinda
116 Burj Kahan :(206) 437.00 259 266 . ' Singhwala 689
_< 1.454 765 242 126 116
117 Lehra Bega (200) U68.00 447 459 2,843 1,512 1.331 445' 134 211
118 Bath (192) 217.00 170 178 1.128 593 535 172 79 93
119 Lehra MoMbat (196) 2670.00 843 867 5.29§ • 2.827 2,469 789 424 365
120 Lehra Sondha (195) 738.00 195 203 1.261 61,.9 582 158 79 79
121 Lehra Dhulkot (194) 728.00 357 359 2.219 1.177 1,04,2 397 198 199
URBAN:

1299
CENSuS ABSTRACf
Scheduled Castes SCheduled Tribes Literates
~------
M F M F M F
12 13 14 15 16 17
'TalJsi) (Part)
393 354 287 165
434 383 617 307
196 185 ·269 133
1.023 859 1.217 706
224 194 217 150
504 425 552 296
I INI?1d~AL CATEGORY OF MAIN WORKERS
Tota.1 Main Workers
(I-IX>
---_---M F
18 19
436 9
928 43
332 2
1.687 24
425 67
'643 43
Cultivators
I
-------M F
20 21
184
580 7
181
991
251 2
228
Agricultural Labou'rers
II
-------_ M F
22 23
180
223 27
1 Oil
416
13'1 62
239 31

NATHANA C. D. BLOCK
Location Code No.
Name of village (with Hadbast No.)
2
116 Buli Kahan Singhwala (206)
117 Lebra BClga (200)
118 Bath (197)
119 LehIa Mo1fabat (196)
120 Lehra Sondha (195)
121 Lehla DhuIkot (194)
URBAN:
300
-Westock. ic;restiy. Fishing, Hunting and Plantations 'Orchards & allied activities
III
M F
24 25
9
6
7
1
3
Mining and Quarrying
IV
M F
26 27
VILLAGE PRIMARY
INDUSTRIAL CATEGORY
Manufacturing. Processing, Servicing and Repairs in Household Industry
V(a)
M F
28 29
1
Manufacturing. Processing, Servicing and Repairs in other than Household Industry
V(b)
M F
30
Bathinda
11
7 7 22
1 2
21 20" 3-
4 1
23 25
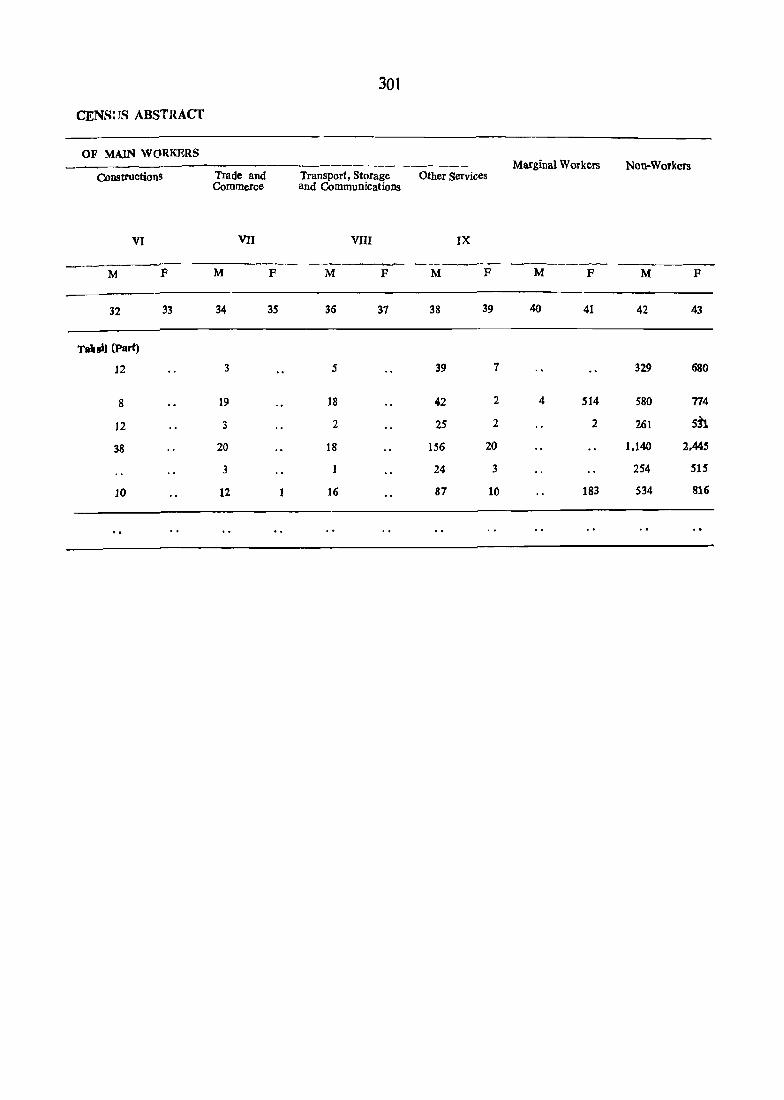
CENS!JS ABSTRACf
OF MAIN WORKERS
ConstructionS
VI
M F
32 33
Ta,.lJ (Part)
12
8
12
38
10
Trade and Commerce
VII
M
34
3
19
3
20
3
12
F
35
30t
Marginal Workers Non-Workers Transport, Storage Other Services and Communications
vrn IX
- --~--
M F M F M F M F
36 37 38 39 40 41 42 43
5 39 7 329 680
18 42 2 4 514 580 T14
2 25 2 2 261 5n
18 156 20 1.140 2.445
24 3 254 515
16 87 10 183 534 816

303
PRI VlARY CENSUS ABSTRACT
SANGAT C. D. BLOCK

304
SANGAT C. D. BLOCK VILLAGE PRIMAR.Y
Location Name of village Code (with Hadbast .. No.) No.
Area of ~iIIage in HectareS & ofC.D. Block! Townj Ward
No. of Occcpied Residential Houses
No. of Households
-Total Population (including institutional and Houseless Population)
Total POPUlation in the age sroupO-6
in Sq. KIllS.
P
2 3 4 5 6
Total
Rural
Ulban
571.61 18,289 18,942 1,14,143
577.61 18,289 18,942. 1,14,143
Raike Kalan
2 ,Bahadargarh Jan dian
(83)
(82)
1743.00
641.00
3 Lool Bai (81) %7.00
4 Janihi Rana (86) 1764.00
5 Raike Khurd (84) 384.00 Urf Chak Dana
6 Bam Biha (85) 1341.00
7 Kaljha Rani (104) 1501 .00
8 Chak Attar Singh- (103) 936.00 wala
9 Bajak (87) 1091.00
10 Ghudda (89) 1890.00
11 Nandgarh (88) 667.00
12 Dhunike (102) 607.ot
13 Bandi (107) 2136.00
14 Kotli Sabo (105)
15 Faridkot (106)
16 Pathrala (108)
17 Chak Kharak (109) Singh Doomwali
18 Chak Ruldu (113) Singhwala
19 Kishanpura (110) Urf Kuttl
20 Jassi Bagwali (111)
21 Muhlan (101)
22 Kat Guru (100)
23 Phulo Milhi (90)
24 Sangat Kalan (99)
616.00
1068.00
2926.00
1183.00
1145.00
740.00
1798.00
437.00
965.00
1694.00
1799 .00
629
216
202
517
159
391
469
363
342
656
241
151
531
148
263
793
314
482
232
449
128
296
515
361
671
239
202
557
179
~6
496
370
346
663
249
165
567
164
283
850
32!)
491
239
470
128
350
521
377
3.838
1,371
1,248
3,352
961
2,381
2.962
2,159
2,166
4,031
1,534
861
3,272
925
1.557
5,205
1.863
2,543
1,370
2,693
726
3.090
2,116
M
7
60,577
60,577
2.071
731
666
1.794
502
1.274
1.5,84
1.132
1.150
2.116
798
477
1.136
481
838
2.744
998
1.331
706
1.485
426
1.103
1.679'
130
F f
8 9
S3,S6(i 18,606
5:t,S66 18,60 6
1,767
640
,582
1,558
459
1.107
1.378
1.027
1.016
1.915
736
384
1.536
444
719
2.461
865
1.212
664
1.258
336
952
t.411
986
624
219
187
553
137
306
~73
353
299
651
227
125
531
169
230
834
346
407
227
431
lOS
319
480
389
M
10
9,926
9,926
346
118
102
322
73
169
257
18S
167
329
12.5
79
291
83
120
424
182
216
120
231
58
171
275
215
F
11
8,680
8,686
Bat ....
27S-
101
85
231
64
137
216·
165.
132
322
102
,6· 24()
86
110
410
164
191
107
200
47
148
W5
1'.

CENSUS ABSTRACT
Scheduled Castes
12
20,322
20,322
Tahsil (Part)
779
382
312
559
236
284
509
436
299
420
273
301
430
104
224
879
322
760
202
374
122
499
495
441
13
17,530
17,530
620
321
267
452
197
199
418
381
253
377
233
256
364
89
185
783
292
688
195
335
96
446
409
378
Scheduled Tribes
M F
14 15
305
Literates
M
16
22,983
22,983
732
215
185
604
191
385
681
339
545
981
368
150
711
197
280
.985
463
447
277
580
176
249
588
394
F
17
12,336
12,336
377
102
86
343
81
205
344
202
301
558
.219
61
385
102
116
617
249
308
177
350
88
93
299
215
INDUSTRIAL CATEGORY OF MAIN WORKERS
Total Main Workers
(I-IX)
M
18
34,655
34,655
1.125
439
395
978
287
794
853
698
644
1.162
475
281
1,078
282
498
1,619
536
665
423
876
277
686
994
682
F
19
1,443
1,443
75
8
20
3
19
54
11
8
30
184
9
4
25
38
55
151
22
14
8
30
13
Cultivators
I
M F
20
18,866
18,866
622
208
212
537
127
543
408
378
418
774
245
111
694
174
329
885
88
198
203
500
164
314
568
289
21
234
234
2
2
12
1.3
2
24
18
16
Agricultural Labourers
n
M F
22
10,601
10,601
373
222
171
266
132
199
227
277
102
276
142
155
257
67
140
474
265
377
127
215
86
186
247
189
23
893
893
68
5
49
6
6
170
1 ..
21
46
124
21
2
6
1

306
SANGAT C. D. BLOCK VILLAGE PRIMARY
INDUSTRIAL CATEGORY
Locatiou Name of village Livestock. Forestry. Mining and Manufacturing Manufacturin g. Code (with Hadbast No.) Fishing. Hunting Quarrying Processing. Servicing Processing Servicing No. and Plantations, and repairs in and Repairs in
Orchards & allied House1rold Industry other than Mouse'-activities hold Industry
III IV V (a) V (b)
-------- ------- --------M F M F M F M F
2 24 25 26 27 28 29 30 31
Total 368 4 446 45 926 93
Rural 368 4 446 45 926 93
Urban
Bathinda
Raike Kalan (83) 5 .. 22 17 ., 2 Bahadargarh landian (82) 2 .,
3 Lool Bai (81)
4 Janghi Rana (86) 17 12 53 18
5 Raike Khurd Urf Ghak (84) 4 3 Dana
6 Bam Biha (85) 4 4 3
7 Kaljha Rani (104) 21 14 65 15
8 Chak Attar Singhwala (103) 3 2
9 Bajak (87) 12 31 4 11
10 Ghudda (89) 3 14 10
11 Nandgarh (88) 8 14 4 5
12 Dhunike (102) 6 2
13 Bandi (107) 8 " 21
14 Kotti Sabo (105) 10 3 3
15 Faridkot (106) 4 3
16 Pathrala (l08) 32 1 '39 3 44 8
17 Chak Kharak Singl (109) 7 2 4 1 46 DoomwaIi
18 Chak Ruldu Singhwala (113) 7 6 3
19 Kishanpura Urf Kutti (110) 19 7
20 Jassi BagwaIi (111) 22 23
21 Muhlan (101) 3 1
22 Kot Guru (lOO) 2 126 8
23 Phulo Mithi (90) 15 , . 6 3 35 t
24 Sangat Kalan (99) 10 1 17 55 1

307
CENSUS ABSTRACT
OF MAIN WORKERS ---------...-~- -~------.------ - -----------
Constructions Trade and Transport, Storage Other Services Marginal Workers Non-Workers Commerce and
Communications
VI VII vm IX
---------- ------- --- ----- ---~-.. --- ----_..---, ---------M F M F M F M F M F M F
32 33 34 35 36 37 38 39 40 41 42 4~
515 7 70S 7 383 4 1,845 156 315 5,880 25,607 46,243
515 7 705 7 383 4 1,845 ]56 315 5,880 25,607 46,243
•• Tahsil (Part)
4 14 3 65 7 941 1,691
:! 4 292 ~3 2
3 :2 4 271 532
8 20 16 49 2 30 54 786 ,1.484
1~ 2 5 215 459
8 11 22 2 4&0 1.104
21 31 15 51' 3 731 1.359
2 6 30 6 434 967
1 13 16 40 7 506 1.005
13 25 2 45 2 954 1,907
1 13 5 42 8 226 323 48{)
4 2 1 196 200
17 13 2 10 54 7 35 885 623 642
18 3 3 2 6 230 193 210
1 17 1 3 43 340 263
13 28 17 87 5 588 1.125 1.835
21 15 51 39 (\. 3 152 459 658
7 8 4 55 9 71 264 595 797
26 6 8 27 43 283 599
27 6 21 7 60 5 6 403 553 841
4 3 2 14 149 336
4 19 S 29 417 942
9 20 17 77 4 166 6~4 1.215
28 15 13 66 10 3 25 ~45 948
/"
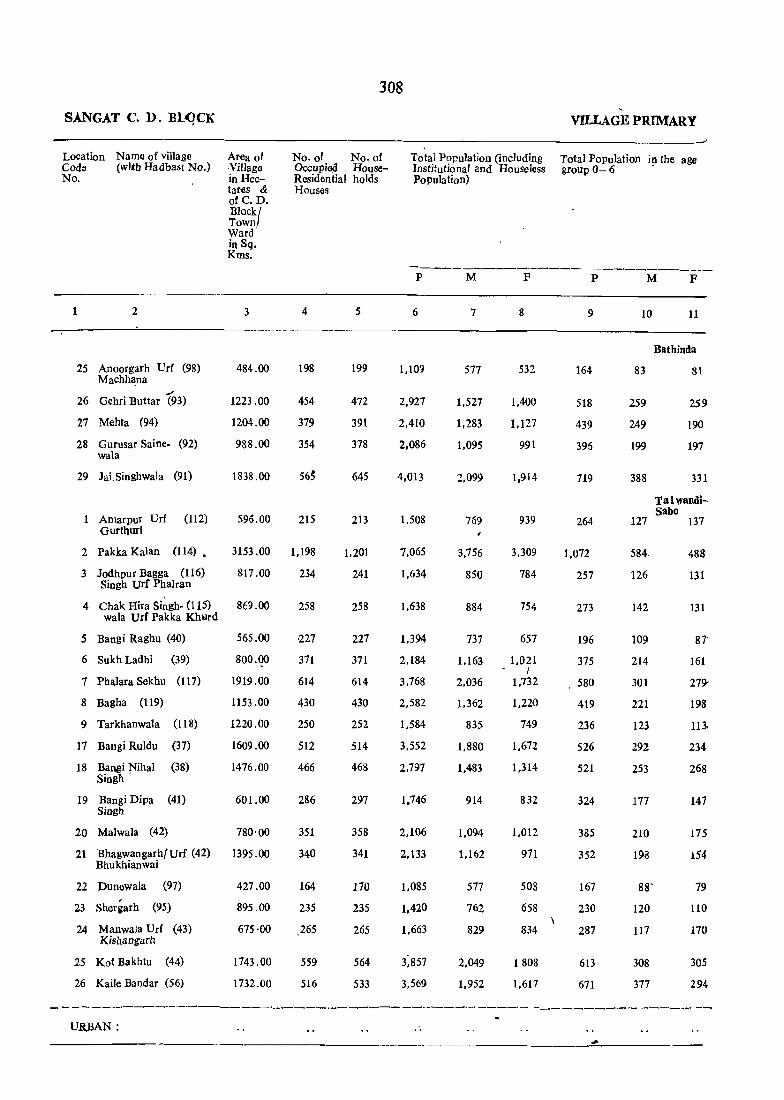
308
SANGAT C. D. BUJCK
Location Name of village Area of Village in Hectares & otC. D. BIOCk/ Town Ward
No. of No. of Cod6 (with Hadbast No.) No.
Occupied HouseResidential holds Houses
1 2
25 Anoorgarh Url (98) Machh~na
26 Gehri Buttar (93)
27 Mehta (94)
28 Gurusar Saine- (92) wala
29 Jai.Singhwala (91)
1 Amarpur Urf (112) Gurthurl
in Sq. Kms.
3
484.00
1223.00
1204.00
988.00
1838.00
595.00.
4
198
454
379
354
56;
215
2 Pakka Kalan (114). 3153.00 1,198
3 Jodhpur Bagga (116) 817.00 234 Singh Urr Phalran
4 Chak Hira Si;gh- (115) 8E9.00 258 wala Urf Pakka Khwrd
5 Bangi Raghu (40) 565.00 ,227
6 Sukh Ladhi (39) 800.~0 371
7 Phalara Sekhu (117) 1919.00 614
8 Bagha (119) 1153.00 430
9 Tarkhanwala (l18)
17 Bangi Ruldu (37)
18 Bangi Nihal (38) Singh'
19 Bangi Dipa (41) Singh
1220.00
1609.00
1476.00
601.00
20 Malwala (42) 780'00
21 Bhagwangarh(Urf (42) 1395.00 Bhukhianwai
22 Dunewala (97)
23 Shergarh (95)
24 Manwala Urf (43) Kisl1angarb
25 Kot Bakhtu (44)
26 Kaile Bandar (56)
427.00
895.00
675 ·00
1743.00
1732.00
250
512
466
286
351
340
164
235
.265
559
516
5
199
472
391
378
645
213
1.201
241
258
227
371
614
430
252
514
468
297
358
341
170
235
265
564
533
VILLAGE PRIMARY
Total Population (including Total Population i!l the age Institutional and Houselcss group 0- 6 Population)
P
6
1,l09
2,927
2.410
2,086
4,013
1,508
1,065
1,634
1.638
1.394
2,184
3,768
2,582
1.584
3,552
2,797
1,746
2,106
2,133
1.085
1,420
1.663
M
7
577
1.527
1,283
1,095
2,099
769
3,756
850
884
737
1.163
2,036
1,362
835
1.880
1,483
914
1.094
1.162
577
762
829
2,049
1,952
F
8
532
1.400
1.127
991
1,914
939
3,309
784
754
657
1,021 (
1.732
1,220
749
1.672
1,314
832
1,012
971
508
658
834
1808
1,617
P
9
164
518
439
396
719
264
1,072
257
273
196
375
580
419
236
526
521
324
3&5
352
167
230
287
613
671
M F
10
83
259
249
199
388
127
584·
126
142
109
214
301
221
123
292
253
177
210
198
88'
120
117
308
377
11
Bathinda
81
259
190
197
331
Talwandi-, Sabo
137
488
131
131
87'
161
279'
198
113-
234
268
147
175
154
79
110
170
305
294
-------------.--------~-~------------------------ -_---------------URBAN:
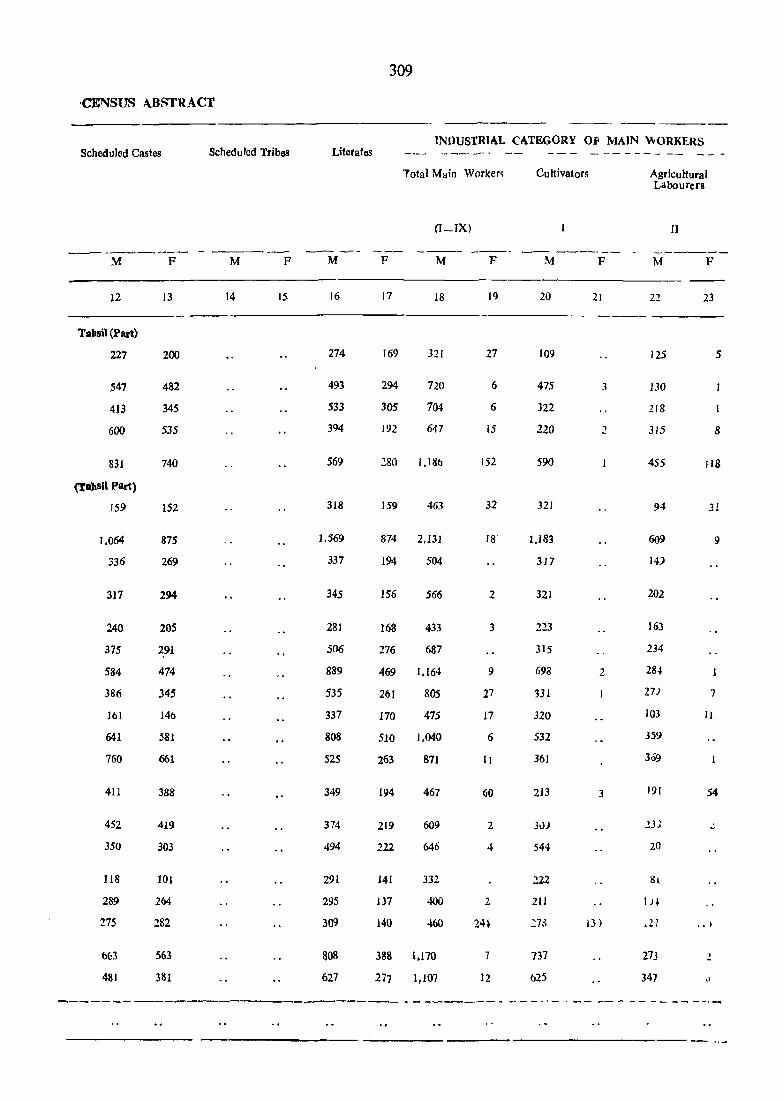
309
'CE1'tJSUS ABSTRACT
INDUSTRIAL CATEGORY OF MA1N \\ORKF_RS Scheduled Castes Scheduled Tribes Literates -~-- -----~ -- --- - _o _______ -- -
Total Main Worker~ Cultivators Agricultural Labourers
(I-IX) II
~-"------
______ 4_ --_-- ----- _- ------ - ------M F M F M F M F M F M F
12 13 14 15 16 17 18 19 20 21 22 23
----Tahsil (Part)
227 200 274 169 321 27 109 125 5
547 482 493 294 720 6 475 3 130
413 345 533 305 704 6 322 218
600 535 394 192 647 15 220 2 315 8
831 740 569 280 1.186 152 59/) 455 118
(Tahsil part)
159 152 318 159 463 32 321 94 31
1.064 875 1.569 874 2.131 18" 1,183 609 9
336 269 337 194 504 317 14)
317 294 345 156 566 2 321 202
240 205 281 168 433 3 223 163
375 291 506 276 687 315 234
584 474 889 469 1.164 9 698 2 28,J
386 345 535 261 805 27 331 27) 7
161 146 337 170 475 17 320 103 11
641 581 808 510 1.040 6 532 359
760 661 525 263 871 11 36J 3 '0 0,
411 388 349 194 467 60 213 3 191 54
452 419 374 219 609 2 JvJ 2JJ .:
350 303 494 222 646 4 544 20
118 101 291 141 332 222 81
289 264 295 137 400 2 211 IH
275 282 309 140 460 24~ :70 13) .27 " , 6{:3 563 808 388 1,170 7 737 273 1
481 381 627 277 1,107 12 625 347 .)
------_------.---------------~ - - -----~-- - - - - ;~ - ~ - - -- - - - - - - - - -~-
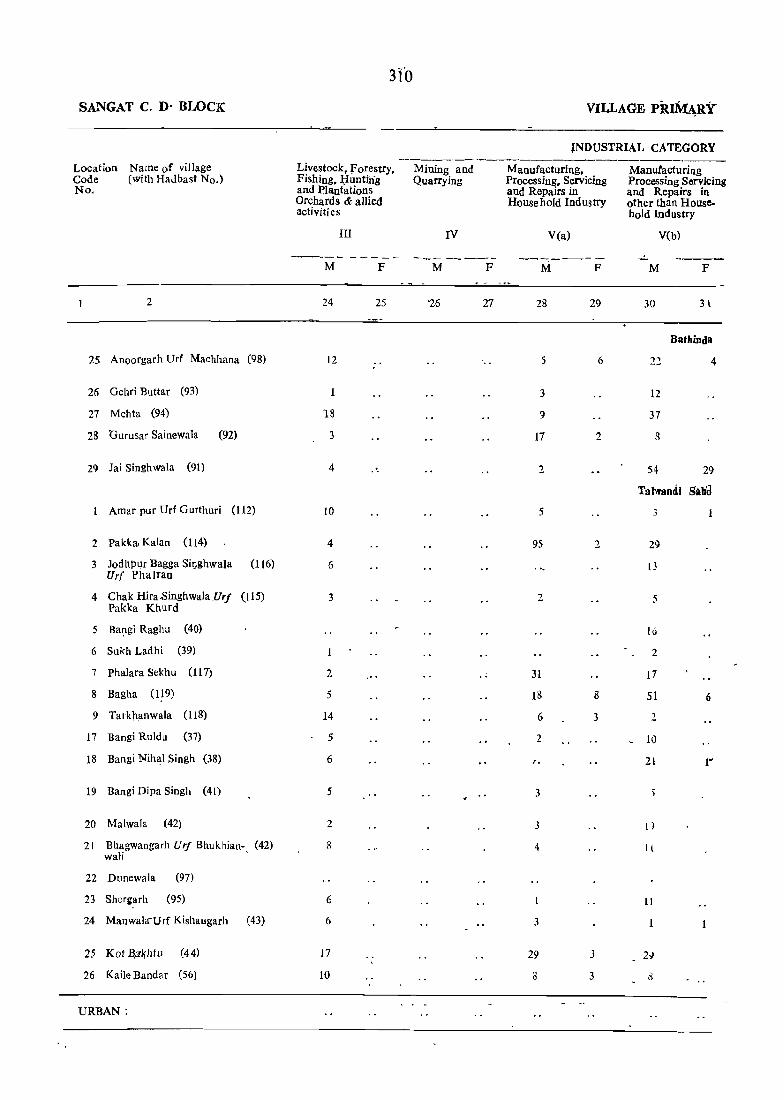
SANGAT C. D' BLOCK
Location Name of village Code (with Haubast No.) No.
2
25 Anoorgarh Urf Machhana (98)
26 Gehri Buttar (93)
27 Mehta (94)
28 Gurusar Sainewala (92)
29 Jai Singhwala (91)
Amar pur Urf Gurthuri (112)
2 Pakka; Kalan (114)
3 JodhPlIf Bagga SilJghwala (116) Urr Phalran
4 Chak Hira..singhwala,Urj (lIS) Pakka Khurd
5 Ba(lgi Raghu (40)
6 Sukh Ladhi (39)
7 Phalara Sekhu (117)
8 Bagha (1 ~ 9)
9 Tark)mnwala (118)
17 Bangi Ruldll (37)
18 Bangi Nihal Singh (38)
19 Bangi Dipa Singh (41)
20 Malwala (42)
21 Bhagwangarh UrJ Bhukhian- (42) waH '
22 DlInewala (97)
23 Slwrgarh (95)
24 Mallwal"Urf Kishaugarh (43)
25 Kot ~~ht!l (44)
26 Kaile l3andar (56)
URBAN:
31'0
Livestock, forestry, Mining and Fishing, I;:Iunttn'g Quarrying and i>lantations Orchards & allied activities
III IV
------- - - - - - - ___ - - __ ---M
24
12
18
3
4
10
4
6
3
2
5
14
5
6
5
2
R
6
6
17
10
F M F
25 '26 27
VILLAGE piU~RY
JNDUSTRIAL CATEGORY
Manufacturing, Processin~, Servicing and RepaIrs in Household Industry
V(a)
----.----M
28
5
3
9
17
2
5
95
2
31
18
6
2
:.
3
3
4
3
29
a
F
29
6
2
2
8
3
J
3
Manufacturing Processing Servicing and Repairs in other than Household Industry
V(b)
M
30
12
37
54
F
31
Bathinda
4
29
Tahflndi Silba
29
13
5
10
2
17
51
2
10
21
1)
It
11
8
6
l~
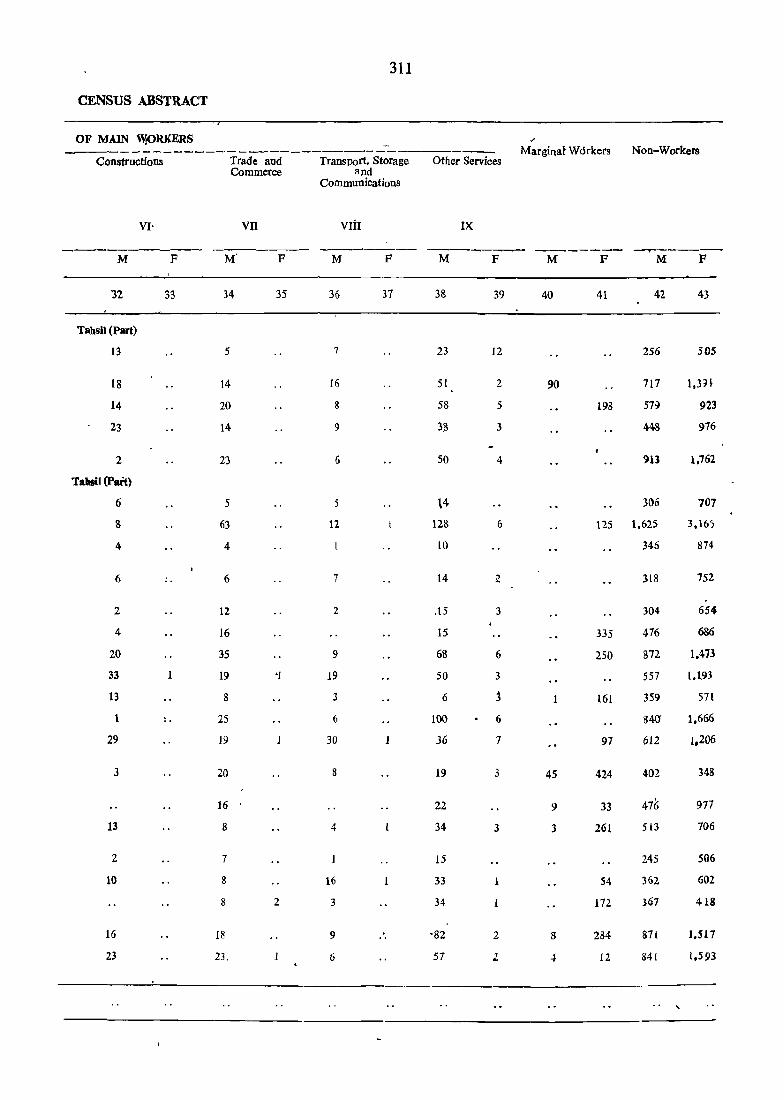
311
CENSUS ABSTRACT
OF MAIN WPRKERS '" -----------------~-------~-------- Marginal' Workers Non-Workers
Constructions Trade and TranspOrt. Storage Other Services Commerce and
Communications
VI' vn VIii IX
_-- ----- ------ ___,....----M F M' F M F M F M F M F
'32 33 34 35 36 37 38 39 40 41 42 43
Tahsil (Part)
13 5 1 23 12 256 50S
18 14 16 51 2 90 717 1,3JI
14 20 8 58 5 198 579 923
23 14 9 38 3 448 976
2 23 6 50 4 ?13 1.762
Tahsil (Part)
6 5 \4 3()6 707
8 63 12 128 6 125 1,625 3,165
4 4 10 346 874
6 ., 6 1 14 l 318 152
2 12 2 ,IS 3 304 654
4 16 15 335 476 686
20 35 9 68 6 250 872 1.473
33 19 '1 19 50 3 551 l,t93
13 8 3 6 j 1 161 359 571
1 ,. 25 6 100 6 S40' 1,666
29 19 30 36 7 97 612 1.206
3 20 8 19 3 45 424 402 348
16 22 9 33 416 977
13 8 4 34 3 3 261 513 106
2 7 15 245 506
10 8 16 33 54 362 602
8 2 3 34 172 367 418
16 18 9 .. '82 2 S 284 871 1.517
23 23. 6 57 2 4 12 841 1,593
,


PRIMARY CENSUS ABSTRACT • ~ ... , I. \ j ... ., ~ ,
TALWANDI SABO C. D. BLOcK I
313
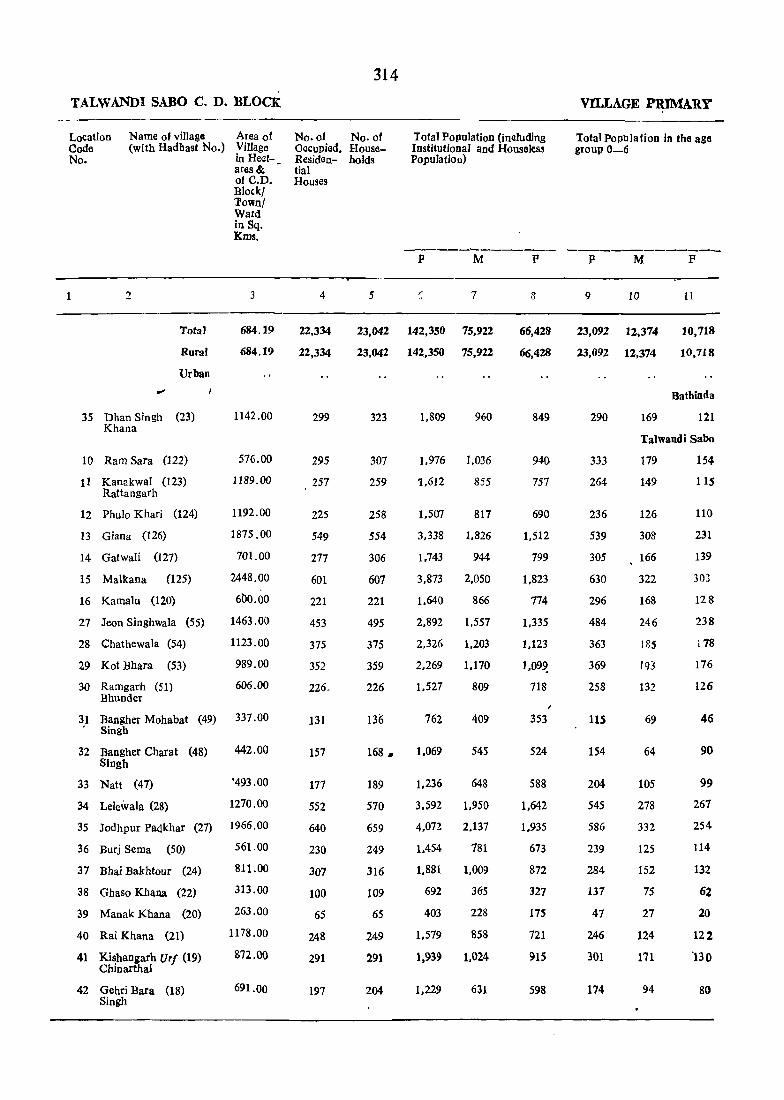
TALWANDI SABO C. D. BLOCK
Location Code No.
Name of villages (with Hadhast No.)
2
Total
Rural
Urban
35 Dhan Singh (23) Khana
10 Ram Sara (122)
11 Kanakwal (123) Rattangarh
12 Phulo Khari (124)
13 Giana (126)
14 Gatwali (127)
15 Malkana (125)
16 Kamalu (120)
27 Jeon Singhwala (55)
28 Chathewala (54)
29 Kot Bhara (53)
Area of Village in HealareS & of C.D. Block! lown! Ward in Sq. Kms.
3
684.19
684.19
1142.00
576.00
1189.00
1192.00
1875.00
701.00
2448.00
600.00
1463.00
1123.00
989.00
30 Ramgarh (51) 606.00 Bhunder
31 Bangher Mohabat (49) 337.00 Singh
32 Bangher Charat (48) 442.00 Singh
33 Natt (47) '493.00
34 Lelewala (28) 1270.00
35 Jodhpur Padkhar (27) 1966.00
36 Burj Serna (SO)
37 Dhai Bakhtour (24)
38 Ghaso Khana (22)
39 Manak Khana (20)
40 Rai Khana (21)
41 Kishangarh Urf (19) Chinarthal
42 Gehri Bara (18) Singh
561.00
811.00
313.00
263.00
1178.00
872.00
691.00
No. of Oacupied. Residential Houses
4
22,334
22,334
299
295
257
225
549
271
601
221
453
375
352
226.
131
157
177
552
640
230
307
100
65
248
291
197
314
No. of Households
Total Population (including Institutional and Housl!less Population)
VILLAGE PRIMARY
Total Population in thl! age group 0-6
----------- ----------_ p M
5 :J 7
23,042 142,350 75,922
23,042 142,350 75,922
323
307
259
258
554
306
607
221
495
375
359
1.809 960
1,976 ],036
'1,612 855
1.507 817
3,338 1.826
1,743 944
3,873 2,050
1.640 866
2,892 1,557
2,326 1,203
2.269 1.170
226 1.527 809
136 762 409
168 If 1.069 545
189 1.236 648
570 3,592 1.950
659 4.072 2.137
249
316
109
65
249
291
204
1.454 781
1.881 1.009
692 365
403 228
1,S79 858
1,939 1.024
1.229 631
p
8
66,428
66,428
849
940
757
690
1.512
799
1.823
774
1.335
1.123
1.09~
718
353
524
588
1.642
1.935
673
872
327
175
721
915
598
P M
9 10
23,092 12,374
23,092 12,374
290 169
p
II
10,718
10,718
Bathinda
121
Talwandi Sabo
333
264
236
539
305
630
296
484
363
369
258
llS
154
204
545
586
239
284
137
47
246
301
174
179
149
126
308
166
322
168
246
185
193
132
69
64
105
278
332
125
152
75
27
124
171
94
154
115
110
231
139
303
128
238
178
176
126
46
90
99
267
254
114
132
62
20
122
130
80
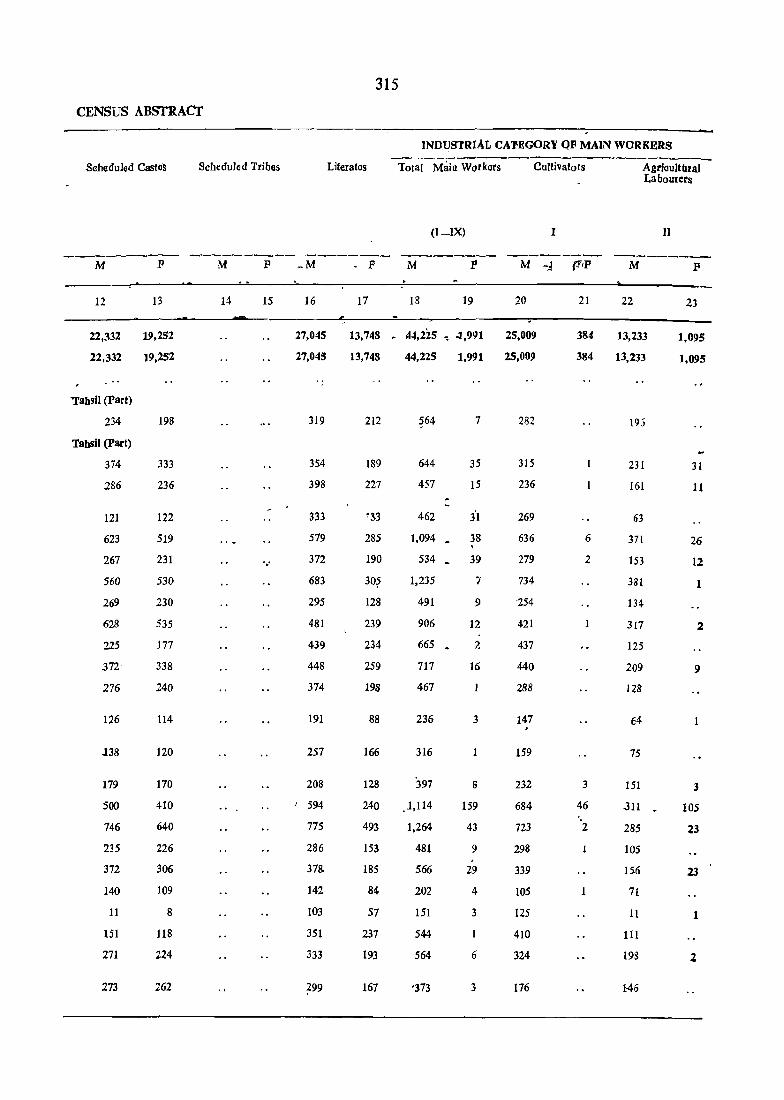
CENSUS ABSTRACT
Scheduled Castc~ Scheduled Tribes Literates
315
INDUSTRIAL CATEGORY OF MAIN WORKERS
Total Maill Workers Cultivators
(I_IX) I
Agrjau]UuaJ Labourers
II
-------- -----_-- -------- ------- ----- -------M p
12 13
22,332 19,252
22,332 19,252
"Tahsil (Part)
234
Tahsil (Part)
374
186
121
623
267
560
269
628
225
372
276
126
J38
179
500
746
235
372
140
11
151
271
273
198
333
236
122
519
231
530
230
535
177
338
240
114
120
170
410
640
226
306
109
8
118
224
262
M p
14 15
'.'
16
27,045
27,045
319
354
398
333
579
372
683
295
481
439
448
374
191
257
208
f 594
775
286
378.
142
103
351
333
799
• p M p M
17 18 19 20 21 22
13,748 • 44,225 .. -1,991 25,009
13,748 44.225 1.991 25,009
212
189
227
564
644
457
462
7
35
15
31 '~3
285
190
3D,?
128
239
234
259
198
1,094 ~ 38
88
166
534
1,235
491
906
665 ~
717
467
236
316
128 397
240 • .1,114
493 1,264
153
185
84
57
237
193
167
481
566
202
151
544
564
'373
, 39
7
9
12
2
16
3
8
159
43
9
29
4
3
6
3
282
315
236
269
636
279
734
'254
421
437
440
288
147 ,
159
232
684
723
298
339
105
125
410
324
176
384 13,233
384 13,233
6
2
1
3
46 , 2
1
19.3
231
161
63
371
153
381
134-
317
125
209
128
75
151
311
285
105
156
71
11
III
193
146
F
23
1,095
1,095
31
11
26
12
1
2
9
3
105
23
23
1
2

TALWANDI SABO C. D. BLOCK
1
Name of village' (Wltlt'Hlfdb .... No.) - ..... ~ .. ~ ...... '_ ...
Total
Raral' , Vr_ ..
35 Dhan Singh Khana (23)
10 Ram Sara (122)
11 K~kwal UrI RattaDgarh (123)
12 Phulo Khari (124)
13 Gia~'a (126) .-~
14 Gatwali (127)
15 Malkana (125)
16 Ka~:lu (120) ". 27 Jeon Singhwala (55)
28 Ch;th~wala (54)
29 KotBhara (~3) 30 Ra~g~rh Bhumier (51)
31 Bangher Mohaodat Singh (49)
32 Bangher Charat Singh . (48)
33 Natt (47)
34 LeJewala (28)
3S Jodhp~r Pakhar (27)
36 Bur] ~ma (SO)
37 Bha'l Bakhtour (24)
38 Gh~s~ Khana en) 39 Ma~;k Khana (20)
40 Rai Khana (21)
41 Kish~ngarh UrJ Chinarthal (19)
42 Gchri Bara Singh (18)
316
Livlstock. Porestry. Fi&hibll~ lEnntlng and'Plantations .Ot~liardUt aJlic<t activities
1Il IV
M
24
315.
315
4
12
5
2
2
4
7
2
2
30
20
6
2
1
8
p
2S
15
15
M
26
'3
3 7'
p
27
M
28
600
600
5
3
14
IS
12
18
35
26
6
14
41
9
8"4
1
Veal
2
4
Vll..LAGE PRIMARY
INDUSTRIAL CATEGOH
p
52
52
4
4
8
Manula(ltUling. ~rocessing Setviclag liM 'Re~1I1r8 in other tban Household Industry
V(b)
M
30
657
657
10
p
31
65
65
Talwa.di SaIJo. ,. . .....,., .. ~
31
10
79
3
6
11
20
17
3
8
7
4
2
5
19
10
1
1
3
6
7
31
1
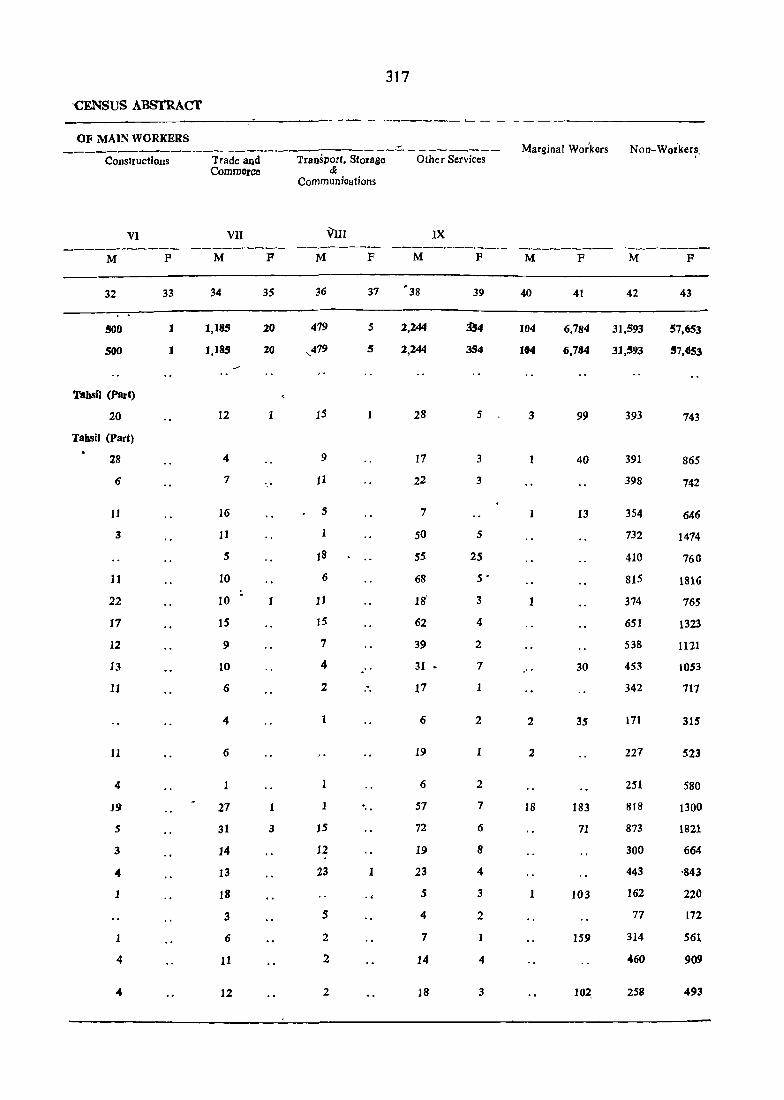
317
'CENSUS ABStRACT
OF MAIN WORKERS
----co~~;tio;----~~~;d---1;~~ort.Sto~---~h~Setv~~-
M
32
SOO
500
VI
Tahsil (part)
20
Tahsil (Part)
28
6
11
3
11
22
17
12
13
11
11
4
19
5
3
" 1
4
"
p
33
J
J
Commerce &
VII
M
34
1,185
1,]SS
12
4
7
16
11
5
10
10
15
9
10
6
4
6
1
27
31
14
13
18
3
6
11
12
F
35
20
20
1
1
1
3
Communications
Vlll
36
419
15
9
11
5
1
18
6
11
15
7
4
2
1
1
15
12
23
5
2
2
2
IX
F M
37 '38
5 2,244
S 2,244
1
28
17
22
7
50
55
68
IS'
62
39
31 •
17
6
19
6
57
72
19
23
5
4
7
14
18
F
39
~4
354
5
3
3
5
25
5 •
3
4
2
7
1
2
1
2
7
6
8
4
3
2
1
4
3
Marginal Wor'kers
M
40
104
104
3
1
1
,"
2
2
18
1
F
41
6,784
6,784
99
40
13
30
35
183
71
103
159
102,
Non-WorkeI~.
M
42
31,593
31,!93
393
391
398
354
732
410
815
374
651
538
453
342
171
227
251
818
873
300
443
162
77
314
460
258
F
43
57,653
!7,6S3
743
865
742
646
1474
760
1816
765
1323
Ul1
1053
717
315
523
580
1300
1821
664
'843
220
172
561
909
493

TALWANDI SABO C. D. BLOCK
Location Co4e No.
Name of village (with liil~P~st !'io.)
Area 01 Village in Hectares & of C.D. Bloakl Town/ Ward in Sq. Kms.
No. of Occupied Residential Houses
NO. of Households
Total Population (including Institutional and Houseless Population) ,
Total P"{)pUJdtion ill tho age group Q_:_6
p M F
----.--------------------------------------~--------------------
43 Maisar Khana (17)-
44 1'hamallgarh (65)
45 Kutiwal Kala1f' '(66)
46 Kutiwal Khurd (67)
47 Ram Nagar Uri (16) Kasaiwara
48 Maur Charat (15) Singh
49 Jatri (25)
50 Mari (26)
51 Mansa Kalan (13)
52 Burj (14)
53 Rajgarh Kuba (tl)
54 Kotli Khurd (86)
55 Kamalu (87)
56' Sawaitch ,(88)
57 Soandoha (12)
'58 Shekhpura (29)
59 Gadhiat\wali/ (30) Bhagwanpura
2002.00
527.00
783.00
567.00
1768.00
907.00
384.00
249.00
910.00
731.00
1388.00
- '1195.00
537.00
598.00
1641.00
1965.00 \
505.00
60 Ram Titath Joga, ,,(32) 2986.00
pi Fatehgarh (33) ,577.00 • Nouabad
p2 Guru~!lr JOga (132) 558.00
63 Ta1wan4i Sabo (34) 4422.00
.64 Bhagi !lander (.4.6) 2528.00
65 Mahi "Nangal (45) 1081.00
6f Leleana (36) 1131. 00
67' Jajjal P5) 838 ·00
68 Sangat Khurd (131) 394:.00
§9 Teoo\l Pujarian (130) 1178.00
70 Tarang~li (129) 308.00
71 Jogewa1a (128) 431.00
584
116
242
216 .
519
345
147
116
385
342
593
358
265
180
506
658
107
789
239
193
2145
870
323
481
370
219
293
84
134
5 ,
592
121
248
217
528
364
149
116
391
342
607
381
268
190
523
670
117
3,705
777
1,655
1.500
3,305
2.141
993
815
2,656
1.872
3,881
2.422
1,584
1,193
3,429
4073
626
796 5303
239 1432
19r 1232
2275 12,880
892 5684
323 2000
508 3132
371 2564
219 1332
301 1630
88 5·~9
145 914
,
1.971
423
8§1
805
1,753
1.125
535
428
1,396
983
2.054
1.285
854
631
1870
2187
335
2841
749
636
6890
3039
1090
1685
1361
705
873
301
497
8
1.734
354
794
695
·1.552
1,016
458
387
1.260
889
1.827
1.137
730
562
1559
1886
291
246
683
596
5990 '
2645
910
1447
1203
627.
757
248
417
9
589
102-
270
228
636
359
166
126
386-
348
581
393
240
172
567
674
95
860
239
206
Z230
867
316
600·
388
229
211
85
15 '
10 JJ
Talwandi SabO
315
60
14J
119
315
181
95
68
198
176
311
202
125
85
30i
357
49
446
110
108
1218
459
163
334.
221
117
113
56
80
274
42
129
1"09
321
178
71
58
188
172
270
HI
ll5
87
263
317
46
414
129
98
1012
408
153 .
266
167
112
98
29
72

--.....__----'M }f
12
'f_" (P~ 460
113
238
138
770
470
163
140
"348
396
13
415
93
210
103
720
413
131
134 . 315
335
626 f 542
317
370
39
406
688
158
697
272
279
2506
860
208
632
341
246
177
76
47
297
315
28
344
588
119
595
240
254
2109
743
184
572
281
210
142
58
35
Scheduled Tribes
M P
14 15
3-19
INDUSTRIAL CATBGORY OF MAIN WORKERS Literates - -----------______ .... _
Total MlIil}o Workc!rs' Cultivators
(I-IX)
-M----P-·· --M--..L;-P-1
---------M . p
IE
761
159
345
298
579
388
257
137
402
295
917
328
227
272
718
657
144
890
307
232
2662
1101
414
615
551
255
- 416
97
170
17
419
82
206
132
• 291
182
93
80
212
148
488
149
96
159
280
354
67
450
136
97
1681
610
157
248
288
112
247
33
88
18
lI87
279
514
490
1068
673
331
229
872
576
1159
765
518
359
1.113
1.299
223
1.<G5
467
368
3798
1688
642
922
758
399
495
179
276
19
11
11
9
123
20
733
169
284
319
~~2
4 394
2· 231
5
8
111
2
04-
7
240
6
425
5
'5
185
35
2
2
4
2
3
151
590
257
600
5)7
258
259
780
762
lQl
1027
263
168
1021
952
530
490
457
225
278
99
174
21
4
3
61
1
3
4
232
2
",
Agricultufai Labouror~
'II
M P
22
:11-. 33
125
129
391
206
79
4 ..
220
293
3P4
168
228
33
24J
389
JQ5
45l
161
!69
1496
533
85
288
210
141
J81
6t ~?
23
2
9
75
6 '
13
3
~16
184
3
.54
28

TALWANDI SABO C. D. BLOCK
Location Code No.
Name of village (with Hadbast No.)
2
43 Maisar Khana (17)
44 Thamanagrh (65)
45 Kutiwal Kalan (66)
46 Kutiwal Khurd ..... (67)
47 Ram Nagar UrJ Kasaiwara (16)
48 Maur Charat Singh {I 5)
49 Jatri (25)
320
Livestock Forestry. Pishing. Hunting and Plantations Orchards & alliod activities
J1I
M F
24
8
2
7
8
8
25
13
50 Mari (26) 7
51 Mansa Kalan (13)
52 Burj (14)
53 Rajgarh Kuba (11)
54 Kotli Khurd (86)
55 Kamalu (87)
56 Sawaitch (88)
57 Sandoha (12)
58 Shekhpura (29)
59 Gadhianwali/Bhagwaopura (30) . , 60 Ram Tirath JOga (32)
61 Fatehgarh Nouabad (33)
62 Gurusar Joga (132)
63 Talwandi Sabo (34)
64 Bhagi Bander (46)
65 Mahi Nanga! (45)
66 Leleana (36)
67 Jajjal (35)
68 Sangat Khurd (131)
69 Teona Pujarian (130)
70 Tarangali (1:l9)
71 Jagewala (128)
2
6
4
3
3
4
5
40
11
2
4
2
5
3
VILLAGE PRIMARY
INDUSTRIAL CATEGORY -----..--------_-----------Mining and' Manufacturing, Manufacturing. Quarrying Processing, Sorvicing Processing Servicing
and Repails in and Repairs in Household other tban House-Industry hold Industry
IV V(a) V(b)
M P
26 27
! .
28
14
10
1
3
19
5
25
5
23
8
3
2
96
32
8
2
29
2
4
9
8
7
30 31
Talwaudi Sabo
22
7
4
32
3
1
1
1
48
7
7
12
31
4
2
69
25
2
10
3
3
5-
4
18

'Ci.NS\JS ABSTBACT
OF MAIN W0J!X~s. -
Constructlons
v]
.Pd- F
32
~~j\(~~ 14
1
7
7
14
6
3
1
11
4
33
1
1
5
~
2
1
2
4
11
90
5
3
25
1
33
1
Trade and Commerce
45
4
21
9
IS
7
2
2
13
11
44
12
8
13
U.
24
2
41
10
1
439
39
2
24
15
6
9
3
vil
35
2
1
3
2
5
2 1 .. '
321
'l'ransport. S_torage &'
Communications
V111
M P
15
6
24
3
13
12
3
11
5
1
24
4
S
a.. 8
3
5
6
71
1.2
3
22
6
2
2
1
.2
37
3
]X
M P
92
12
29
10
60
26
7
-12
28
!
75
16 .,. ~o
17
.i~
89
10
72
18
15
475
79
14
51
64
13
18
8
9
39
8
2
7
1
7
4
2
1
1
IS
2
3
4.
10
2
9
3
117
7
2
1
4
2
3
1
1
-Marginal Workers
'40
2
4
12-
2
2
1
9
1
41
5
37
236
41
89
117
718
104
23.
479~
143
102
6S
122
3S3
614
2S1
Non-WOlkelS
M P
42
782
144
~4.7,
315
681
4Sk
204
199
524
407
894 t
4.95
3~0.
27,2
7Ai
886
112
1206
280
268
3092
1351
447
7S4
602
306
378
122
221
43 -
1118
3~3
7fS 694
1392
456
386
1214
792
1639
417
626
535
1073 .-.._-
1S()3
183-
1972
678
S!H
5683
2610
SSS
831
94~
62S
754
247
416
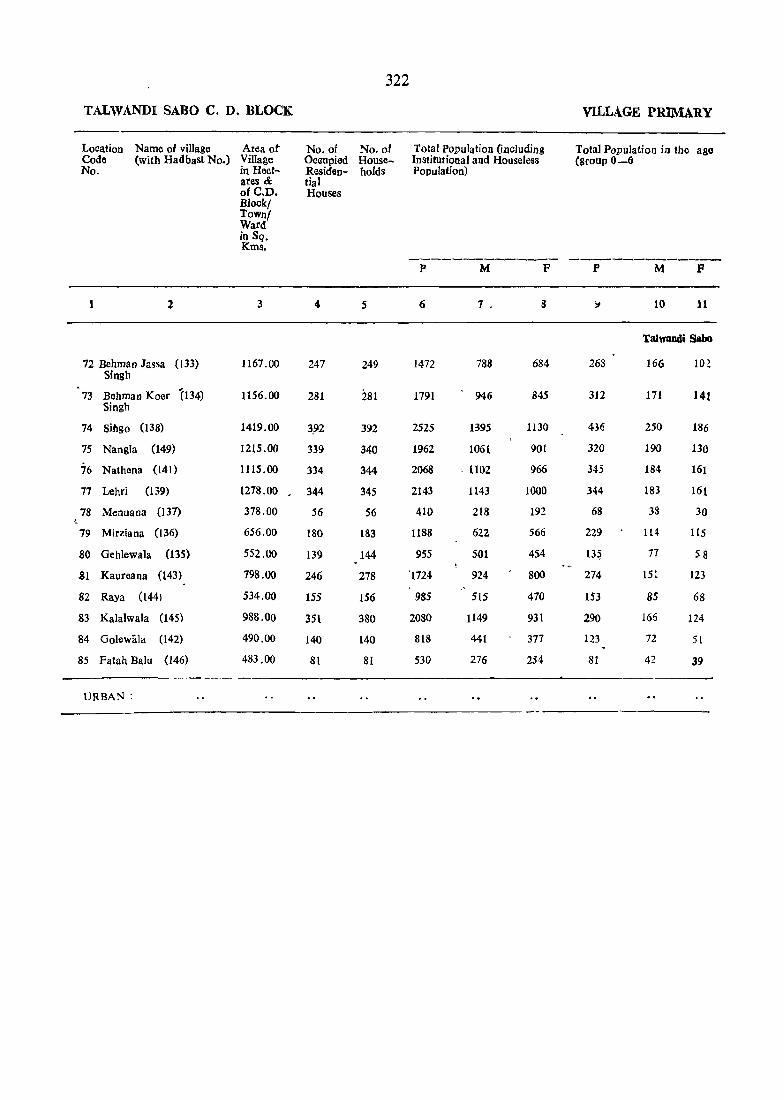
322
TALWANDI SABD C. D. BLOCK VILLAGE PRIMARY
Location Name of village Area ot No. of No. of Total Population (including Total Population in the age Code (with Hadbast No.) Village Ocaupied House- Institutional and Houseless (group 0-6 No. in Hect- Residon- holds Population)
ales & tial ole.D. Houses Block/ Town! Ward in Sq. Kms.
----'-------,- ----------P M P P M F
3 4 5 6 7 . 8 ':J 10 11
Talwandi Sabo
72 Behman Jassa (133) 1167.00 247 249 1472 788 684 263 166 10! Singh
73 Behman Koer (134) 1156.00 281 281 1791 946 845 312 171 141 Singh
74 SitJgo (138) 1419.00 3_92 392 2525 1395 1130 436 250 186
75 Nangla (149) 1215.00 339 340 1962 106 [ 901 320 190 130
76 Nathena (141) 1115.00 334 344 2068 ' 1102 966 345 184 161
77 Lehri (139) 1278.00 344 345 2143 1143 1000 344 183 161
78 Menuaoa (137) 378.00 56 56 410 218 192 68 38 30
79 Mirziana (136) 656.00 180 183 1188 622 566 229 114 115
80 Gehlewala (135) 552.00 139 144 955 501 454 13~ 77 58
81 Kaureana (143) 798.00 246 278 '1724 924 800 274 151 l23
82 Raya (144) 534.00 155 156 985 5{5 470 153 85 68
83 Kala]wala (145) 988.00 351 380 2080 1149 931 290 165 124
84 Golewala (142) 490.00 140 140 818 441 377 123 n 51
85 Fatah Balu (146) 483.00 81 81 530 276 254 81 42 39
URBAN:
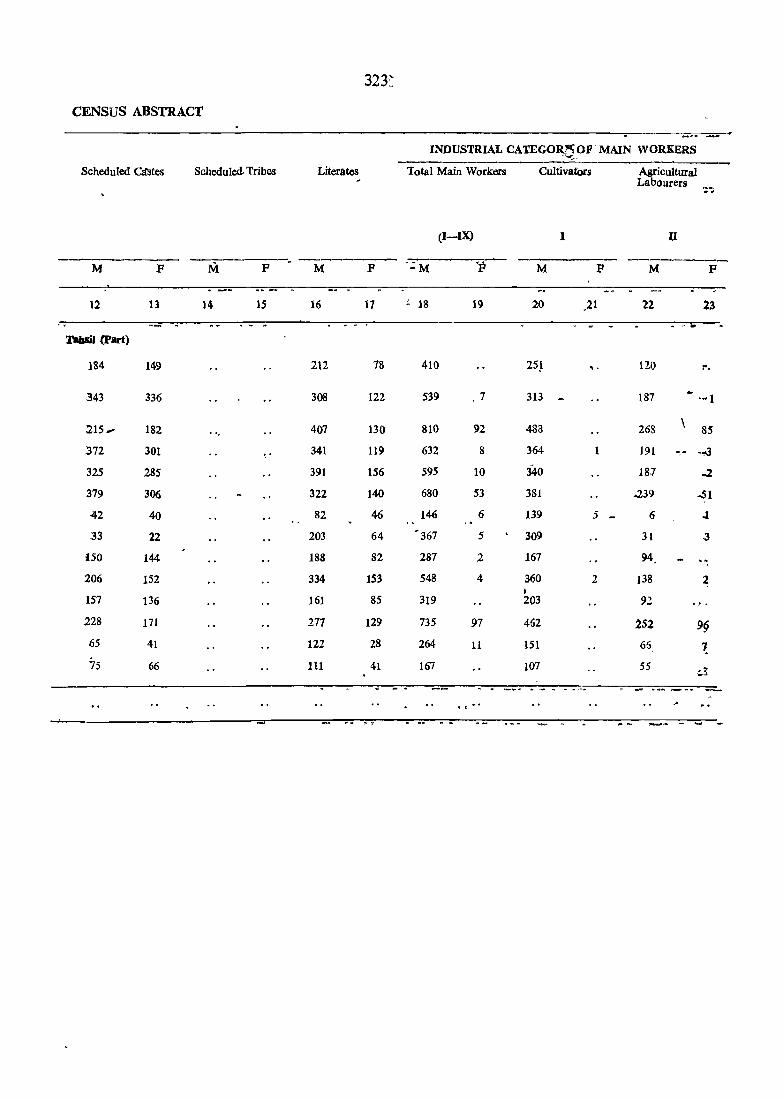
323::
CENSUS ABSTRACT
INDUSTRIAL CATEGOR~OF· MAIN WORKERS ~-~ .. - -
Scheduled QCstes Scheduled. Tribes Literates Total Main Workers Cultivators Agricultural Labourers ..
(I-IX) I II
----- .p M F M F M F -:M M F M F
12 13 14 15 16 17 "- 18 19 20 .21 22 23 . - ..
l'aIIIiI (Part)
184 149 212 78 410 25~ . . 120 ,. .
343 336 308 122 539 ,7 313 - 187 ·"1
215 .... 182 407 130 810 92 483 268 \ .85
372 301 341 119 632 8 364 191 • .,.3
325 285 391 156 595 10 340 18.7 -l
379 306 322 140 680 53 381 ..239 -51
42 40 82 46 146 6 139 5 - 6 J
33 22 203 64 ~367 5 309 31 .3
150 144 188 82 287 2 167 94,
206 152 334 153 548 4 360 2 138 2 , 157 136 161 85 319 203 n 228 171 277 129 735 97 462 252 9§ 65 41 122 28 264 11 151 66 ~ 75 66 111 41 167 107 55 .. 1
. - .. _
---- - -- -- -- - ... -

TALWANDI SABO C. D. BLOCK
Location Code' No.
Name of villaao (with Hidbast No.)
2
72 Behman Jassa Singh (133)
73 Behman KOerSingh (134)
74 Singo (138)
75 Nangla (149)
76 Nathena (141)
77 Lehri (139)
78 Menuana (137)
79 Mir2iana (136)
80 Gehlewala (135)
81 Kaureana (143)
82 Ra~a (144)
83 Kalalwala (145)
84 Golewala (142)
85 Fatah Balu (146)
lJRBAN: ----
Livestock. Pores tty, Mining"and Pishing. Hunting Quarrying and PlantationS Orchards oil: allied activitie's
24
1
.. 4
2
1
2
3
17
3
. ,
25 26 27
v.lLLAGE PlUMAll¥
INDUSTR1AL CATEGORY
Manufacturing, Processing. Servicing; and Repairs in Household Industry
yea) --~-
M F
28 29
6
6 - 4
6
6
3
5
6
7'
?
2
Manufacturin&. Processing Servicing and Repairs in other than Household Industry
V(b) ---.._ ........ ;-:----M F
30 31
~lwandi salK»
13
-s ~
~ 1
14
6 t
10
3
4
10
3
3
7

CENSUS ABSTRACT
OF MAIN WORKERS
Constructions
VI
Trade and Commerce
vn ---------- --------
M F M P
32 33 34 35
TabsD (Part)
S 6
2 5
9
7 10
12 16
2 9
1
2 5
2 2
3 7 ~.
5
5
7
325
Transport, Storage Other Services &
Communications
VItI IX --------- ------
M P M If
36 37 38 39,
2 12 , 1 to 4
1 30 2
4 22 3
6 16 7
8 24 2
8 2
3 7 2
5 17
14
2 6
2 14 4
"
Marginal Workers Non-Workers
-------- ---------M P M P
40 41 42 43
378 684
1 311 406 527
398 58'i E40
4 88 425 805
1 197 506 759
4 449 459 49:8
72 186
13 255 548 • 164 214 288
198 376 598
145 196 325
269 414 5ti5
177 366
158 109 96


PRIMARY CENSUS ABSTRACT
JHUNIR C.D. BLOCK

.JHUNm c. D. BLOCK
LO:latlon Name of village Code (with Hadbast No.) No.
1
•
2
Tolal
Rural
Urban _,
71 Saharna (121)
72 Dliluana (122)
74 Dul10wala (112)
89 Maujian (109)
90 Udda1 Bhagat (110) Ram
91 Kot Dharmu (lll)
92 Bajewala (107)
93 Chhapianwali (108)
95 Karamgarh Uri (8.1) RovtawaJi
96 Dalia Wali Urf (90) Gulabgarh
97 Talwandi Akalia (82)
98 Banawala (91)
99 Chahlenwala (89)
100 Dhingar (134)
101 Dehniwala (92)
102 Peron (93)
103 Raipur (94)
104 Tandian (95)
lOS Javrkian (96)
106 Mian (97)
107 Bishanpura/ (103) Jherianwali
108 Bjrewala Jattan (104)
109 Bhalai Ko (lOS)
110 Dasl!bndia (106)
Area of 'Village in Heetares & orC.D. Block/ Town/ Ward
No. of Occupied Residentlal Houses
in sq. kms.
3 4
732.79 25,940
731.79 25,940
344.00 221
783.00 216
705.00 342
441.00 197
775.00 311
1148.00 541
1838.00
535.00
550
152
762.00 212
748.00 227
711.00 199
1165.00 218
751.00
1016.00
1252.00
10i7.00
23"96.00
619.00
911.00
320
389
508
262
738
199
351
522.00 1~8
739.0,0 293
541.00 . 210
, No. oJ Households
5
328
Total Population (including Institutional and Houseloss Population)
P M F
7 8
VILLAGE PRIMARY
Total Population in tbe age group 0-6
9 10 11
26,186 1,60,914 85,986 74,928· 16,981 14,346 12,(i3~
12,635 26,186 1,60,914 8S,9~6 74'928 26,981 14,345
221
216
342
.197
312
541
553
152
212
227
199
218
320
389
508
262
774
199
351
158
311
1.355
1,267
2,124
1.118
1.789
3,261
3.487
895
1.270
1,525
1.253
1.296
2.038
2,652
3,000
1,685
4,993
1.216
1,918
983
1.858
70S
662
1.127
605
975
1.779
1,865
487
696
795
666
704
1.086
1.421
1,591
883
2.699
648
1.044
545
1,008
650
(lOS
997
513
814
1,482
1,622
408
574
730
587
592
952
1,231
1,409
802
2,294
568
874
438
850
211
~07
339'
168
282
554
566-
159
110
'251
.190
174
351
438
411
288
767
205
357
138
299
107
95
213
91
148
290
286
81
89
123
.105
97
18S'
222
234
ISO
396
107
190
77
164.
M811S9
10l
11:
18l
71
13.
264
280
12
81
128.
as
77
163
216
177
138
371
98
167
61
135
715.00 211 .
210
211
176
1'342
1,258
1.0U
683
682
538
659
576
473
214
190
130
104
106
71
110
84
~ 624.00 163

CENSUS ABSTRACT
Scheduled Castes
~_...---------M P
12 13
2S,l39 21,645
2',139 21.645
Tahsil (Par t)
304
263
331
211
260
523
504
126
106
244
183
246
215
485
623
253
667
258
291
166
512
163
91
143
283
229
296
172
210
459
430
116
87
243
153
205
165
425
572
203
566
233
255
133
433
-130
75
123
8aheduled 'lribl8
M P
14 15
329
lNDUS'lRIAL CA'lBGORy OF MAIN WORKERS Literates -----_.------------"'---_ ........ _------ --_-
'Iotal Main WOlken Cultivatots Agrlcultural
(I-IX)
M P M P
16 17 i8
30/182 14,962 48,8!2
30,782
263
229
339
174
328
523
636
]64
245
286
265
:m 439
438
5tll
239
1,090
148
378
334
245
234
247
208
14,962 0,852
159
117
135
117
103
221
282
99
117
139
184
88
190
178
262
149
523
25
172
92
96
142
71
84
392
357
605
355
506
956
1,029
300
450
472
378
4111
559
781
879
600
1.554
395
650
331
601
395
370
304
19
1,994
1,994
2
9
2
6
35
42
1
6
3
1
5
SO It
146
1
78
3
II
69
4
2
I
M P
20
27,374
27,374
199
186
355
212
326
5~5
554
2Jl_
318
311
261
228
363
458
408
40\
868
233
337
208
203
284
292
198
21
442
442
5,
8
S9
labourers
n _._-----
M II
22 23 ~
13,948 1,001
13,948 1.001
115
122
188
128
93
217
287
77
101
126
107
158
148
250
348
163
397
13'5
146
101
296
97
54
86
2
27
30
5
1.
44
3
112
1
67
4
7
3

JHUNlR C. D. BLOCK
_~Q(ll!tj(1n Code No.
Nama 01 village (with Hadbast No.)
330
INDUSTRJAL CATEGORY 0F
U~~~Po~stry.--Mmm~~---Ma~~~;~~---M~;~~ing:~--Fishing. Hunting' Quarrying Procosing. Sonlcing Proaessing. Servicing and Plantations and Re,pairs in and repairs in Orchards & allied Household Industry other than House-activities . hold lndusttry
III IV V (a) V (b) ---_._.._ -_-------- -----~----------- -------- ---_---- --------M P M P M P M F
1 2 24 t5 26 27 28 29 30 31
Total ~03 S 2 ." 538 68 l,QQ5 65
Rural 403 S 1 338 68 .. 1,~95 (is
U,ban
Mlp,ISli
71 Saharna (121) 5 13
72 D6lu~na (122) 2 1 6
74 Dullowala (112) 4 4 6
89 MauJian (l09) 3
90 Uddat Bhagat Ram (110) 16 13 3 2
91 KotDharmu (111) 8 5 42 2
92 Bajewala (I07) 6 25 4 17. 93 ChhapianwaJi (108) 1
95 Karamgarh Urf Rovtawali (83) 9
96 Daliawali Urf Gulabgarh (90) 2 8 2
97 Talwandi Akalia (82) 2
98 Banawala (91) 7 2
99 Chahleowa1a (89) 4 3 3
100 Dhingar' (134) 9 9 5
101 Behniwala (92) 8 5 2
102 POron (93) 4 9 3
103 Raj pur (94) 15 8 13 37 1
104 Tandian (95) 4 4
105 Javrkian (96) 2 5 31 8
106 MillO (97) 1 2
107 'Bishanpura/Jherianwa Ii '(103) 14 54 5
108 Bilowala Jattan (104) 1
109 Bl1alai Ke '(105) 4 3
110 Dasahndia (106) 4 5

OF l\l<,\~N WO,RJ,U):as
Constructions
VI
, Trade and Commerce
VII
-------~-M P" M P
32
.6
6
28
3
4
10
5
7
30
1
15
5
J
2
33 34
1" 2009
14 ~009
5
11
13
5
19
13
26
6
9
1
10
11
14
14,
6
54
4
29
7
9
4
2
5
35
2
1
1
'--- ---- Marginal W.orkers transport, &torase-- Oihei ~,"j~ -
f,
NQn-Workllrs
'" Communications
VITI
M P
36
'56
556
11
12
9
18
16
22
4
2
3
4
24
. 1
12
2
37
2
2,
IX
- .. _-------M P
39
2,437
~,437
26
14
22
7
13
44
64
13
6
8
II
21
23
85
7
121
13
73
12
14
6
13
6
39
375
37!J
2
2
2
3
6
J
4
4
6
11
2
3
2
3
1
2
-._-------M F M p
40
50
32
3
16
1
41
4,963
4,963
162
161
13
42
36,837
3(i,83?
313
305 '
522
250
4J9
79,,3
181 8Q,4 _., 11 IS7
21
190
262
18
8
246
323
288
288
527
637
712
283
J.l29
,253
394
214
407
288
311
234
67,9"11
67,971
64~ 434
997
S11
641
1434
l.3~
396
568
586
59}
947
991
Jf3~8
8~2
l.88~
567
7~6
435
844
512
564
471

JHUNIR C. D. BLOCK
Location Code No.
Nama of village Area of (with Hadbast No.) Village
in Hectares &: otC.D. Block! Town! Ward
1 2
111 Burj BbaJai (102)
112 Aullak (98)
113 Jagatgarh Bajld- (99) Ian
114 Courhia (101)
115 Ku'sle (tOO)
fI6 Jatana Kalan (147)
117 Jatana Kburd (149)
118 Kotra (148)
119 Ghudawala. (150)
120 Fatthgar_Q (151) SahrianwaJi
121 Jhunir (164)
122 Makbewala (16~
123 Fatta Maluka (166)
124 Mirpur Khurd (182)
125 Tibi Hari Singh (183)
126 Sardulewala (184)
127 Kahnewala (185)
128 Bhunder (186)
129 Sardulegarh (189)
130 Rnrki (188)
131 Jhanda Khurd (187)
132 lhanda 1<alan (199)
133 Nahran (200)
134 Mankhora (204)
135 Sangha (203)
136 Rajrana (202)
137 Karandi (201)
138 Khaira Kalan (198)
139 Khaira Khurd (191)
in sq. kms.
• 3
632.00
572.00
408.00
607.00
1363.00
2450.00
532.00
356.00
597.00
619.00
2042.00
599.00
2312.00
885.00
456.00
762.00
676.00.
684.00
1847.00
866.00
1174.00
2267.00
788.00
723.00
2705.00
409.00
812.00
1344.00
US8.oo
No. of No. of OCCUpied, HouseResiden- holds tial Houses
4
229
212
81
148
431
465
175
103
162
170
743
228
826
267
128
292
159
102
1.790
263
432
611
259
242
657
85
358
400
385
..
5
229
212
81
148
431
465
175
lQ3
162
FO
743
228
828
267
128
293
159
102
1.8.16
263
432
611
259
242
657
85
358
400
395
Total Population (including Institutional and Houseless Population)
6 7
1.352 720
1,219 663
520 285
932 493
2,619 1,412
2.858 1,579
1.167
694
1.118
1,014
635
366
595
535
4,780 2.588
1.371 736
5.095 2.755
1.701 905
772
1.965
1.008
421
1.031
540
722 389
10,262 5,524
1,591 845
2.693 1,404
3.977 2,076
1,496 772
1.5M 821
4,146 2.205
475 259
2.395 1.302
2.569 2,353
2.604 1.433
8
632
556
235
439
1.207
1.279
532
328
523
479
2.912
641
2.340
796
351
934
468
333
4,738
746
1.289
1,901
724
688
1.941
216
1,093
i.216
1.171
viLLAGE PRIMARY
Total Population in tbo ale group 0-6
9 10
258 - 143
172 101
91 46
.125 75
401 203
401
192
96
187
170
732
250
788
264
129
331
189
211
103
42
99
89
381
133
425
137
78
177
113
108 61
1.971 1.075
257 1~0
558 291
706 365
262 131
262 15,3
709 376
104 53
428
467
441
239
253
214
11
MllJIsa
US
71
45
Sa
198
190
89
54
88
81
351
117
363
127
51
154
76
47
896
127
267
341
131
109-
333
51
189
214
227

CtNSVS ABSfltACr'
Scheduled Castes Scheduled Tribes
M F
12
Tahsil (Part)
214
161
87
190
492
425
241
54
105
191
815
300
786
330
156
297
168
130
1.362
298
388
158
227
310
681
76
259
45
238
13
185
133
65
148
461
324
209
63
94
185
693 •
230
680
270
111
249
136
117
1.113
255
354
131
214
221
591
63
186
54
200
14 15
Literates'
16
269
282
84
195
348
514
167
127
213
238
- 1.IO?
188
813
240
122
324
180
147
2.790
248
494.
953
329
369
895
114
531
57i
640
333
17
116
125
27
113
154
224
53
45
89
90
584
87
431
124
52
161
63
56 .
1.718
109
200
554
177
154
581
46
162
272
139
INDUSTRIAL CATEGORY OF MAIN WORKERS
Totat Main Workers Cultivatots
(I-IX) I
18
381
350
184
285
923
960
371
225
311
316
19
41
3
63
1
137
5
3
19
4
3
1.521 - 48
414
1.602
505
240
61i
296
235
8
~3
12
7
4
6
2.984 - 154
475
828
1,227
450
424
1.267
135
683
712
784
51
5
5
14
1
142
13
122
11
M F
20
218
226
128
161
540
684
211
181
200
19-1
625
183
932
305
130
384
210
172
609
297
496
868
221
241
621
63
453
516
602
21
20
1
57
56
11
4
2
5
1
r
4
14
4
82
Agricultural Labourers
11
M F
22
97
84
55
95
281
156
137
36
S9
89
"59
191
415
175
100 1·\4
73
38
4S5
155
200
199
178
163
1156
63
160
146
tHl
23
17
6
73
1
1
8
2
3
17
11
2
3
51
2
9
119
4
38
11

334
JHUNIR C. D. BLOCK VILLAGE PRIMARY
INDUSTRIAL CATEGORY
-----Location Name of village Livestock. Forestry. Mining and Manufacturing 'I Manufacturing.
Code (with Hadbast No.) Fishing. Hunting Quarrying Processing. Servicing Processing. Servicing
No. and Plantations and Repairs in and Repairs in Orchards & allied Household Industry other than House-activities bold 'Industry
III IV V (a) V (b)
-----------M P M F M P M F
2 204 2S 26 27 28 29 30 31
Mansa
111 Bupj Bhalai (102) 2 21 3 4
112 Aunak (98) 7 8 3
113 Jagatgarh Banadran (99)
114 Churhia (101) 1 8 3
115 Kush) (100) 5 21
116 Jatana Kalan (147) 1 14 9
117 Jatana Khufd (149) 4 1
118 Kotra (148) 1
119 Gbudawala (1.50) 11 7 1 2
120 Fatehgarh Sahrianwali (lSI) 4 9
121 Jbunir (164) 12 45 10 44 2
122 Makbewala (165) 8 1
123 Patta Maluka (166) 8 4 20
124 Mirpur Khurd (182) 6
125 Tibi Bari Singh (183) 1
126 Sardulewala (184) 16 1 16
127 Kahnewala (185) 1 1 2
128 Bhunder (186) 6 2 4 1
129 Sardulegarh (189) 25 1 52 18 379 8
130 Rurki (188)
131 Jhanda Khurd (187) 5 7 19
132 Jhanda Kalan (199) 7 2 15
133 Nahran (200) 8 1 1 1 9
134 Mankhodra (204) 8 1
135 Sangha (203) 7 19
136 Rajrana (202) 1
137 Karandi (201) 2 6 7
138 Khiara Kalan (198) 4 7 7
139 Khiara Khurd (197) 4 8 11
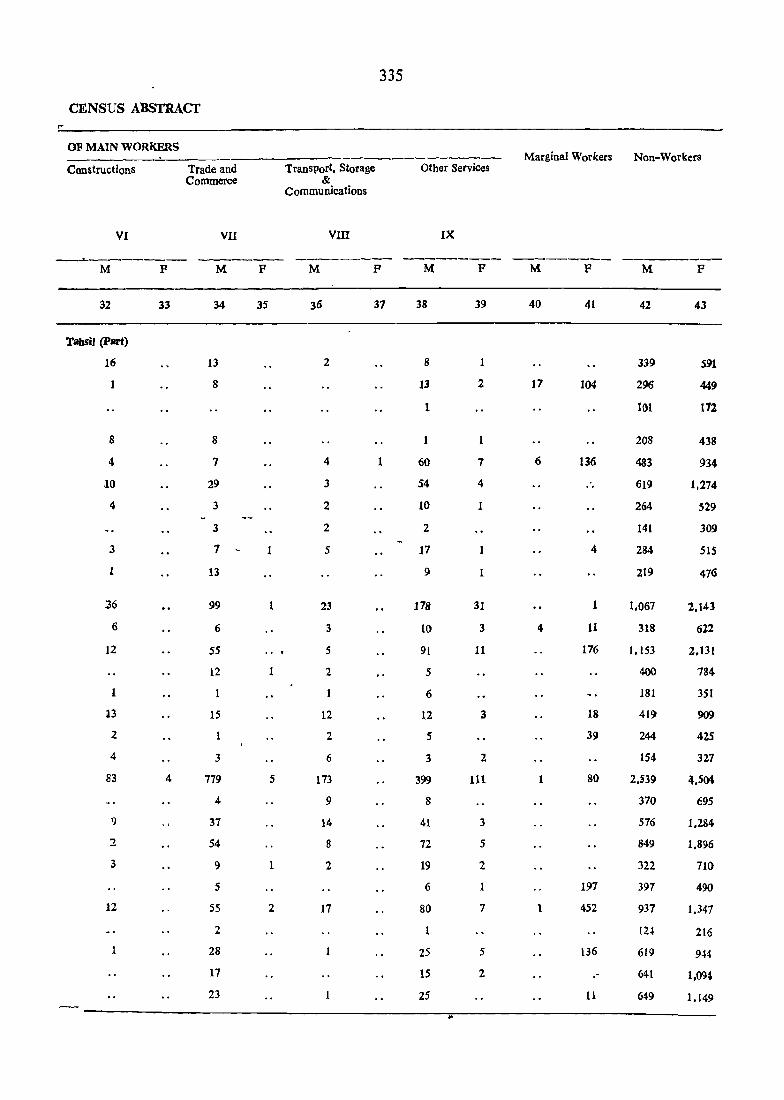
335
CENSUS ABSTRACT
OF MAIN WORKERS Marginal Workers Non-Workers
Constructions Trade and Transport. Storage Other Services Commerce &
Communications
VI VII VIII IX
__._----- ----- ------- ------M P M F M P M P M F M F
32 33 34 35 36 37 38 39 40 41 42 43
TabSiJ (part)
16 13 2 8 1 339 591
1 8 13 2 17 104 296 449
1 101 172
8 8 1 208 438
4 7 4 1 60 7 6 136 483 934
10 29 3 54 4 " 619 1,274
4 3 2 10 1 264 S29
3 2 2 141 309
3 1 1 5 17 1 4 284 SIS
! 13 9 1 219 476
36 99 1 23 178 31 1 1,067 2.143
6 6 3 10 3 4 11 318 622
12 55 5 91 11 176 1.153 2.131
12 1 2 5 400 784
1 6 181 351
13 15 12 12 3 18 419 909
2 2 S 39 244 425
4 3 6 3 2 154 327
83 4 779 5 173 399 III 1 80 2.S39 4.5()\
4 9 8 370 £95
9 37 14 41 3 576 1.284
2 S4 8 72 5 849 1.896
3 9 1 2 19 2 322 710
5 6 197 397 490
12 55 2 17 80 7 1 452 937 1.347
2 1 124 216
1 28 25 5 136 619 94t
17 15 2 - 641 1.09~
23 25 11 649 1.149
..

JHUNIR C. D. BLOCK
Location Code No.
Name of village (with Hadbast No.)
2
140 Kauriwara (196)
141 Sadhuwala (190) .. 142 Phus Mandi (191)
143 Bhalan Warha (192)
144 Ahalupur (193)
]45 Dhigana (]94)
146 Lohgarh (195)
Area of ViII\ige in Hectares & of C.D. Blockl Town Ward! in sq. kms.
3
341.00
254.00
426.00
216.00
1016.00
134.00
343.00
147 Higna Orf (179) 353.00 Bhagwangarh
148 Ranjitgarh Bandran (180) 533·00
149 Mirpur Kalan (181)
150 Adamke (168)
151 AAli Ke (167)
152 Chotian (169)
]53 Karipur Dumb (178)
154 Baran (117)
}55 Rirke (176)
156 Jhanduke (170)
157 Chianewala (171)
]58 Chak Mughnia (173)
159 Fatehpur (174)
160 Moda (175)
161 Moffer (161)
) 62 Nandgarh (160)
]64 Dalelwala (158)
165 Chhachhoher (157)
166 Kourewala (156)
167 Danewala (162)
J 68 Ghukni (172)
169 Khiali Chahlan- (163) wali
1199.00
675.00
659.00
308.00
254.00
394.00
937.00
1658.00
517.00
]53.00
667.00
202.00
471.00
609.00
1108.00
250.00
658.00
726.00
488.00
886.00
No. of Occupied, Residential
Rouses
4
135
128
209
107
563
27
211
197
225
415
269
222
148
49
133
313
698
219
353
39
229
224
373
69
255
223
247
265
336
No. of Households
5
135
128
209
107
571
27
211
197
225
416
269
222
148
49
133
368
714
235
353
39
229
224
381
69
255
224
241
2G8
Total Population (including Institutional and Houseless Population)
p
6
785
789
1.223
613
M
7
406
423
641
322
3,816 1,985
177
1,317
1,090
1,389
95
664
551
711
2,796 1.492
1,659
1,231
923
358
76}
870
660
488
199
416
2,050 1.098
4,201 2,266
1.420 745
2,146 1,114
206
1,410
[,338
111
730
694
2,283 1.229
~29
1,403
1,334
1,662
1,573
226
768
843
889
F
379
366
582
291
1,831
82
653
539
678
1,3.04
789
571
435
159
345
952
1.935
675
1,032
95
680
644
1,054
203
635
613
819
684
VILLAGE PRIMARY
Total Population in the age group 0-6
p
9
167
133
224
125
113
27
258
233
269
443
298
223
162
52
128
318
694
220
375
36
250
213
413
61
201
187
299
206
M
II)
86
18
112
64
364
15
129
114
144
245
153
119
85
29
11
177
394
102
188
24
121
113
223
32
108
104
171
10~
F
11
Mabsa
81
5S
112
61
349
12
129
119
125
198
145:
104
17
23
51
141
300
118
187
12
129
100
190
29
93
83
128
97

CENSUS ABSTRACT
Scheduled Castes
M
12
Tahsil (Part)
J04
156
439
123
457
7
63
277
235
536
187
242
192
50
130
463
722
251
460
222
188
398
29
224
224
329
161
F
13
105
136
402
115
434
5
53
266
224
488
176
212
170
49
100
381
634
232
410
195
181
329
24
178
199
300
108
Scheduled Tribes
M F
14 15
M
16
174
167
263
144
773
52
261
194
184
431
318
234
162
85
125
412
724
237
387
42
262
213
358
65
287
184
253
334
337
Literates
F
17
97
75
120
78
• 453
35
142
146
111
210
145
80
60
37
57
239
317
104
176
25
162
97
169
38
110
84
176
137
INDUSTRIAL CATEGORY OF MAIN WORKERS
Total Main'Workers Cultivators
(I-IX) I
Agricultural Labourers
II
---------- --------- -------M
18
220
207
330
152
1,155
• 63
352
315.
385
824
427
368
275
106
212
618
1.275
432
622
60
475
436
741
147
466
452
429
535
F
19
20
18
4
1
17
4
3
69
6
32
17
3
3
5
31
23
1
13
4
3
210
1
5
17
M
20
81
115
135
59
425
52
238
97
. 210
530
257
203
139
71
131
309
792
288
316
58
283
260
427
136
243
307
258
332
F
21
3
3
2
10
2
6
32
i
M
22
89
40
, 95
4
SSg
7
89
178
155
236
13~
111
9~
30
57
294
347
94
203
." 155
122
228
10
157
127
127
155
F
23
17
12
2
2
60
.2
13
7
17
2
169
4

JHUNffi C. D. BLOCK
Location Code No,
Name of village (with Hadbast No.)
2
140 KaUriwara (196)
141 Sadhuwala (190)
142 Pilus Mandi t191)
143 Bhalan Warha (192)
144 Ahaiupur t193)
145 Dhigana (194)
146 LO~'garh (195)
147 Hlan~ Uri Bhagwangarh (179)
148 Raltj\tgarh Bal1dran U$O) 149 Mti'tiur Kalad (181)
150 Ad4lhkc (168)
151 Alike (167)
152 Chotian (1~9)
153 K4ripur Dumll (178)
154 Barlln (177)
155 Hlrke (17(1)
156 Jhan(tuke (170)
157 Chianewala {171)
158 Clhik Mughnia (173)
159 Pafenpur (174)
160 Mo(fa (175)
161 Mofter (161)
162 Nandgarh (160)
164 Dalelwala (158)
165 Chhachhoher (157)
166 Kourtmala (156)
167- Danewala (162)
168 Ghukni (172)
169 Khiali Chahlanwali (163)
338
INDUSTRIAL CATEGORY
Uv~~d:-furest~ ---I Min;;-;"d - Mauuiac"t;;fing. MatlUfuctll'tilik; Fishin~: Honling Quarrying Processing, Servicing Processing Servicing and Plantations and Repairs in and Repairs in other Orcbards and Household than HousehOld allied activities Industry Industry
III
M F
24
1
<I
3
2
3
3
4
s
5
3
21
IS
5
1
19
7
25
1
IV
-----_ ... ...-.. M F
26 27
..
V (a)
- ... ~v
28
3
2
3
18
1
4
1
2
12
-19
5
11
1
7
8
F
29
3
V (b)
M F
30
6
3
(I
5
8
4
S
3
14
6
13
2
10
1
8
10
9
4
2
5
31
M"dnsa
2
27
1
4
1
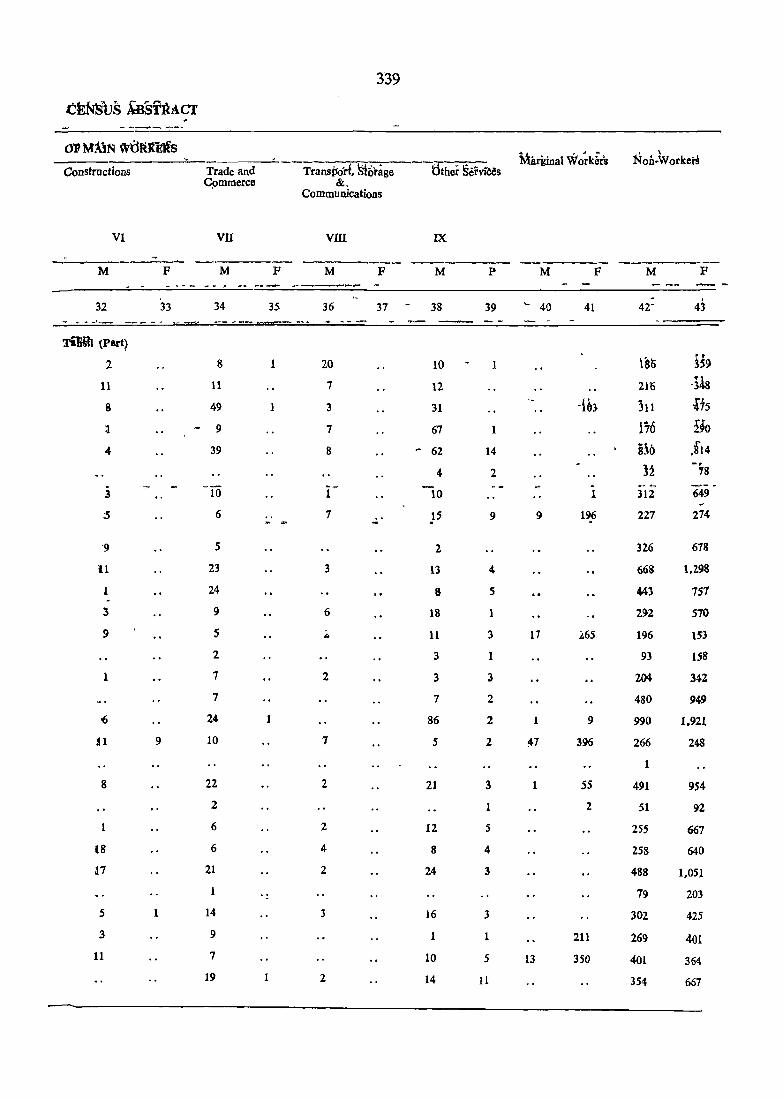
339
.cENSUS '&BSTRACf , -- -
Ot? M;.\i~ wtlrtiElfs M-arkinal Wo~kbr's
. \
Non-WorkerS Constructions Trade and TranspartS10rage tither Services
Cpmmerce &, Communications
VI VII vm IX
------- -----M F M F M F M P M F M F
-- -~
4~ 32 33 34 35 36 37 38 39 '- 40 41 4Z-- .,.. ....... ~,,.,,..... -- "..---- ...... - ~ - _...
~'1iMJ (par9
\86 •• 2 8 1 20 10 lS9
11 11 7 12 2iti ·318
8 49 1 3 31 -Un 311 its a - 9 7 67 1 176 I~o
.. 39 8 - 62 14 830 .914
J~ -.
4 2 18
3 -10 i- 10 1 312 649
:5 6 .. 7 15 9 9 196 227 214 ~ - -
·9 5 2 326 618
U 23 3 13 " 668 1.298
1 24 8 5 443 757
:; 9 6 18 1 2\)2 570
9 5 .l. 11 3 17 i.65 196 1.53
2 3 1 93 ISS
1 7 2 3 3 204 342
7 7 2 480 949
0() 24 86 2 1 9 990 1.921
U 9 10 7 5 2 ~7 396 266 248
1
8 22 2 21 3 1 55 491 954
2 1 2 51 92
1 6 2 12 5 255 667
18 6 4 8 4 258 640
3.7 21 2 24 3 488 1.051
- 79 203
5 1 14 3 16 3 302 425
3 9 1 1 211 269 401 11 7 10 5 13 350 401 364
19 2 14 11 354 661

340 ...
JHUNlR C. D. BLOCK ~ VILLAGE PRIMARY
Loeation Name of village Area of No. 01 No. of Total Population (including Total-Population in the age Code (with Hadl!ast ~o.) Village Occupied House- Institutional and HouseIess group 0-6 No. in Hect- Residen- holds Population)
ares &: tial ofC.D. House~ Block/ Townl Ward in sq. kms.
p M F P Y' M P
2, 3 4 5 6 1 8' 9 10 11
--Mama
170 Lali~wali (152) 688.00 232 232 1.430 785 645 241 136 105
171 RlttTIan ]dandi (153) 490.00 185 194 1,144 - 605 539 169 88 81
172 Bhaman Kalan (154) 1086.00 422 434 2,772 1,490 1,282 487 269 218
173 Bhaman Khurd (155) 513.00 201 201 1,315 719 596 239 135 104
174 Lakhmirwala (123) 631.00 252 253 1543 820 723 145 129 116
175 Akanwali (124) 1139.00 511 517 3,103 1.673 1,430 504 272 232
URBAN;
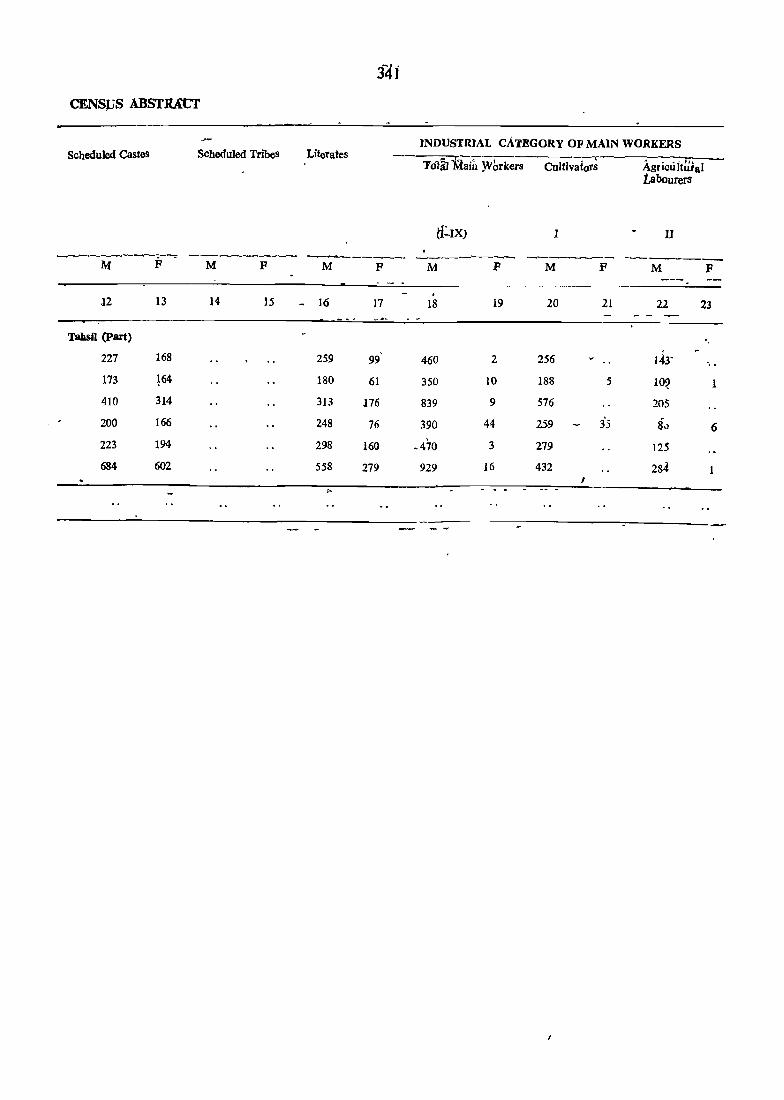
CENSJIS ABSTRAU
Scheduled Castes
J2
TaIlsiJ (Part)
227
173
410
200
223
684
13
168
164
314
166
194
602
SCheduled Tribes
M F
15
34i
Literates
----------M F
- 16
259
180
3J3
248
298
558
17
99
61
176
76
160
279
INDUSTRIAL CATEGORY OF MAIN WORKERS
To1m 'Qain Whrkers Cultivators
tf .. IX) . -----M F
• 18
460
350
839
390
~470
929
19
2
10
9
44
3
16
I
M
20
256
188
576
259
279
432 I
F
2J
5
Agricti1turaI tabourers
II
M F
22 23
143-
1~
205
8.1 125
284
...
6

JHCNm C. D. BLOCK
Location Code N6. -
Name of village (with Hadbast No')
2
170 Lalianwali (152)
171 Raman Mandi (153)
172 Bham'an Kalan (154)
173 Bhaman Khurd (155)
174 Lakhmirwala (123)
175 Akanwali (124)
----~------........ -...._
URBAN:
342
VILLAGE PRIMARY
INDUSTRIAL CATEGORY ----~----------~--£-- ~--Livestock. Forestry. Mining and Manufacturj~. Manufacturing, Fishing; Hunting Quarrying Processing, Servicing ProcessiD¥ Servicing and Plantations and Repairs in and RepaIrs in Orchards & allied ,Ho!lsehold Industry Other than House-activities hold Industr'y
rn IV V (a) V (b)
M F 'M F ';;' .... M F M F
24 25 26 27 28 29 30 31
,. Mansa
14
5 4 2 1
16 2 4
11 3 ,2
8 2 5
11 1 42 3 47 6
--I. -...,

343
CENSUS AlJSTRACT
OF MAIN WORKERS -- Mar~llal Work~rs NOll-Workers Constructions Trade and Transport, Storage 0' her Services
Commerce & . Communications.
VI VII VIII IX
--------- ------ --M F M F M I: M F M F M F
32 33 34 3S 36 37 38 39 40 41 ~2 43
Tahsil (P~)
12 9 6 20 2 325 643
10 8 2 2 22 255 529
13 4 19 9 14 27 637 t.246
2 8 18 2 9 169 32) 383
11 17 9 14 3 25 389 )25 331
18 15 7 72 5 292 144 1.122
------------------------


PRlMARY CENSUS ABSTRAct
BtJDHLADA C.D. BLOCK

BUDHLADA C. D. BLOCK
LOcation Code ' No.
NaJ11e of _Village (with Hadbast No.)
2
Total
Rural
Urban
Area of Village in Hectares & of C.D: Block/ Town! Ward in Sq. Krns.
662.40
662.40
38 Khiwa Mihan Singh (32) 245.00 Urf Samundgarh
39 Heron Khurd. (33) 649.00
40 Guradi (37) 1033.00
41 Kanakwala (34) 577 .00 Chahlan
42 Alampur Bodla (35) 499·00
43 Bhadra (36) 720.00
44' Biroke Kalan (38)
48 BUdhpura (39)
49 Bora wal (40)
50 Jitgarh'Vrf (41) Blroke Khurd
51 Gurney Kalan (42)
52 Gurney Khurd (43)
53 Hassanpur (44)
163 Malkon (159)
176 Mandhali (125)
177 Piplian (126)
178· Tahlian (128)
1581 '00
221.00
1155.00
569.W
908.00
476.00
395.00
601.00
578.00
332.00
635.00
179 Joian (119) 761.00
180 Alampur (131) 1222.00 ·Mandran
181 Udat Saide Wala (132) 557.00
182 Sandli (133) 247.00
183 F aridke (134) 465 .00
184 Malakpur (135) 479.00 Bhimra
185 Hakamwala (136) 856' 00
.No. of
.occupied Residen~ tial HouSes
4
25,036
25,036
66
. 378
402
272
137
334
478
566
176
502
194
190
246
256
f38
266
100
379
236
83
108
142
331
346
No. of Households
Total Population (including 'Institutional and Houseless Population)
-------._;.----p M F
VILLAGE-PRIMARY
Total Population in the age group 0-6
p M F
5 6 789 10 11
25,480 1,S4,766
25,480 1,54,760
66
378
402
272
OJ 334
478
569
176
502
194
190
'246
256
139
267
100
411
236
83
108
142
333
" 490
2.367
2,667
1.748
829
1,992
3.038
3.300
1.119
3.343
1.270
1.154
1,479
1.467
934
1.567
664
2.480
1.522
482
600
820
2;105
82,465 72,295 26,125
82;465 72,295 26,125
250 240
1.290 1.077
1,408 1.259
914 834
444 385
1.053 939
1.628 1.410
1,763
606
1.537
513
1,830 1.513
665
617
757
795
491
824
605
537
722
672
443
743
357 307
1.312 1.168
792 730
249 233
308 292
436 384
1.112 993
93
298
418
263
121
357
448
569
211
221
315
225
148
283
1M
421
275
75
1Z0
143
13,761
13,761
54
155
220
141
6~
188
239
262
96
295
114
122
170
124
82
140
60
207
158
38
56
82
196
12,364
12,364
Mansa
39
'143
198
122
56
169
209'
Un~
230
77
274
97
99
145
101
66
143
44
214
117
37
64
61
188

C~NSUS 41}STl«Cr
INDUSTRiAL CATEGORY OF MAIN WORKERS Scheduled Castes "scheduled Tribes Literates ---_._-_._---_._-----_.
--------- --------M
12
F
13
.. -~. -
26,788 23,626
26, 788 ~3,626 *
Tahsil (Part)
16
473
383
246_
15
396
371
226 "
111
298
M F
14 ."." 15 ..... 16
: .. 23,?38
25,738
III
371
393
312
lIS
333
473 380 (' :~
213
ass 578
inhabited
508
160
655
245
306
211
208
89
231
150
561
400
58
136
261
448
437
121
584
230
285
199
167
87
216
128
492
374
48
126
ZZ(J
'398
513
1~2
478
268
• 231
317
324
182
303
1S2"
419
278
100
106
139
!~tal Main Workers
(I-IX)
F M
17 18 19
13,425 48,720 1,198
1,798 13,425 48,720
75
239
186
2PO
~29
139
324
268
109
231
144
93
175
148
69
152
80
209
158
56
53
50
168
136 '
708
885
2
33
88
S13 '-- 11
226
596 - 25
966
945
374
1,146
370
318
355
474
275
431
196
785
457
1$6
193
237
67~
;
8
65
2
5
3
13
1
5
3
87
24
1
89
19
Culti va tors
I
M
20
121
405
581
279. :
163
406
S13
530
257
621
~23
133
215
280
162
256
114
476
217
115
156
61
362
Agricultural Labourers'
F 'M
21 22
184 14,2C!2
184 14,262
-"
10,
250
217
46
143
331
252
74
408
gO
111
54
11 139
1
2
4
'V
S~.
_1~3
62
235
210
25
.2S
170,
-265
n
F
23
J,09!
17
81
4
9
60
_, .
83
11

348
BUDHLADA C. D. BLOCK VILLAGE PRIMAQy
"
INDUSTRIAL CATEGORY
Location Name of Village Livestock, Forestry, Mining and Manufacturing, Manufacturing, Code (with Hadbast No.) Fishing, Hunting Quarrying Processing, Servicing Processing, Servicing No. and Plantations and Repairs 'in and Repairs in
Orchards & Allied Household Industry other than House-activities hold Industry
1lI IV V(a) V(b)
---- ------- -------_ --_--_. M F M F M P M F
1 2 24 25 26 27 28 29 30 31
Total ~406 16 1 513 32 '1,260 7D
Rural 40.6 16 - 1 513 32 1,260 78-
UrbaD
Mansa
38 Khiwa Mihan Singh (32) 2 Ur f Samundaarn
39 Heron Khurd .(33) 7 3
40 Guradi (37) 2 15 31
41 KanakwaJa ChahJan (34) 10 12 12
42 Alampur Bodla (35) 11
43 Bhadra (36) 2 12' 5 5
44 Biroke Kalan (38) 9 14 2'
48 Budhpura (39) Un-
49 Borawal (40) 5 21 9 .-50 Jitgarh,UrjBiroke Khurd. (41) 4 .. 15 3
51 GurnlEY Kalan (42) 1 8 18
52 Gurney Khurd (43) 12 ,11 11
:53 Hassanpur (44) 4 1 17 ~
i63 Malkon (159) 5 1 3 1() ~
176 Mandhali (125) 6
177 PipJian (126) 10 1 .. ,. 13
'178 Tahliari (128) 4 2
179 Joian '(119) .. . ... 3
180 Alampur Mandran (131) 8 13
181 Udat .saidewala (132) 1 2 6 .... 182 Sandli (133) 2 3
.).83 Faridke (134) 2
J84 Malakpur Bhimra (135)
185 Hakamwala (136) 10 3 7 1

34~
~S :ABSTRAcT
Of! MAIN' Wolnm'is . . ------~---, -~ .----.-------~-" ----'------~----
Marginal Workers Constructions Trade and Tran~o rt, St~rage Other Services Non-Worl(ers Commerce and
Colllmunications
'VI VIJ 'VIlI IX
------ -----~-- ---.~-.---- M F M F M F M F 114 _p M F
32, ~ 31 34 35 :36 37 38 39 40 41 42 43 /'
8...s 2 1,707 36 737 2 2,515 353 112 2,202 33,633 63,295
845 2 . 1,707 36 757 2 2,515 353 112 2,202 33;'633 68-,%95
, .. Tahsil (Part)
2 ~ 114 '238
2 14 1 2 19 3 2 582 1,042
8 7 5 19 5 8 26 515 1.145
3 11 4 19 4 2 399 823
~
3 218 38S
3 9 4 4 12 3 8 89 449 825
5 2~ 5 65 4 662 1,'401
in1Jabited
10 22 19 77 8 818 1,529
14 " 3 1 '232 512
~.".
({ 9 1 4 :"'}. 71 4 684 1,448
14 3 " ~ 10 6 2 295 603
" 299 532 3 10 " 10 29 2 ~!L'
30 16 20 3 65 13 337 706 ,..
9 7 10 22 2 321 659
12: 7 4 16 1 2i6 :442
18: 8 5 14 5 70 3~3 ~668
1 2 9 lS5 ~ lliI 122
5 22 6. 20 3 4 M2 523 863
" 7 lu 3 335 643
8 1 2 I. .. 38 93 171
Z 4 uS 191
6 1 199 ~95
5 7 8 11 2 40 437 934 '-

:BUDHLADA e. D. BLOCK
Location Code No.
Name of village (with Hadbast No.)
1 2
186 Talabwala (149)
187 Lakhiwala ([48)
188 Ganiwala (147)
189 Boha (137)
190 Kesampur (130) Chhina
'191 Mal Singhwala (138)
192 Barah (127)
193 Kulahri (233)
194 Ahmadpur (232)
195 Phlliuwala Dogr!ln (231)
'196 Karipur (230)
197 Ram 'Nagar (139) Bhathlan
198 Rampur (140) Mander
199 Kulana (227)
200 Satike (141)
201 Achank (142)
202 Saidewala (144)
203 Sher Khan- (146) wala
204 Mughanian (145)
205 Gandhu Khurd (l51)
-206 Gandhu Kalan (150)
207 Reond Kalan .(152)
208 Reond Khurd (153)
209 Birewala (154) Dogran
210 Chak Alisher ([,56)
211 Bhawa (155)
212 Bhakhrial (159)
213 Andianwali (157)
Area of Village in Hectares & ofC.D. Block! Ward/Town inSq. Km<.
3
445 .00
370.00
735.00
No. of Occupied Residential Houses
4
163
101
191
3825.00 1,380
399.00 159
678.00' 268
2180.00' ~ 679
490.00
-1639.00
821.00
446.00
519·00
736.00
1040.00
490.00
571.00
659'00'
804.{)0
698·AO
435'00
458.00
1199.00
473.00
741.00
400.00
794.00
254.00
434.00
235
632
206
301
234
350
339
Hi!
191
275
245
294
178
127
460
133
221
184
227
144
146
No. of lJouseholds
5
179
101
218
1,395
169
275
686
235
632
210
301
234
350
355
161
191
275
254
294
182
127
461
133
226
.191
236
144
164
350
Total Population (including Institu tiona1 aod HouseJess Population) -
p
6
1.007
530
1,275
8,258
1,191
1,658
4,396
1,413
3,646
1,313
1,795
1.429
2.122
2.080
933
1.272
1.S78
1.586
1 .. 694
1.080
851
2,790
814
1.229
1.288
1.358
793
922
M
7
544
280
692
F
8
463
250
583
4,333 3.9~5
645 546
859 799
2,394 2.002
734 679 . 1.943 1,703
702 611
961 834
758 671
1.141
1.097
513
663
821"
814
866
981
983
420
609
757
77.2
828
567 513
434 417
1,476 1.314
428
646
694
726
424
515
386
583
594
632
369
407
"
VILLAGE·PRIMARY
Total Population in the age Group 0-6
p
9
157
96
222
1,505
202
314
677
238
600
291
316
235
355
354
154
226
293
261
320
165
138
5~
132
- 230
222
.221
111
161
M
10
74
47
118
783
101
159
363
107
308
150
173
119
186
191
89
124
147
-135
173
82
82
300
62
129
135
112
61
87
F
11
Mansa
83
49
104
722
101
155
314
131
292
141
143
116
169
163
65
102
146
126
J47
83
56
250
70
101
87
109
50
74
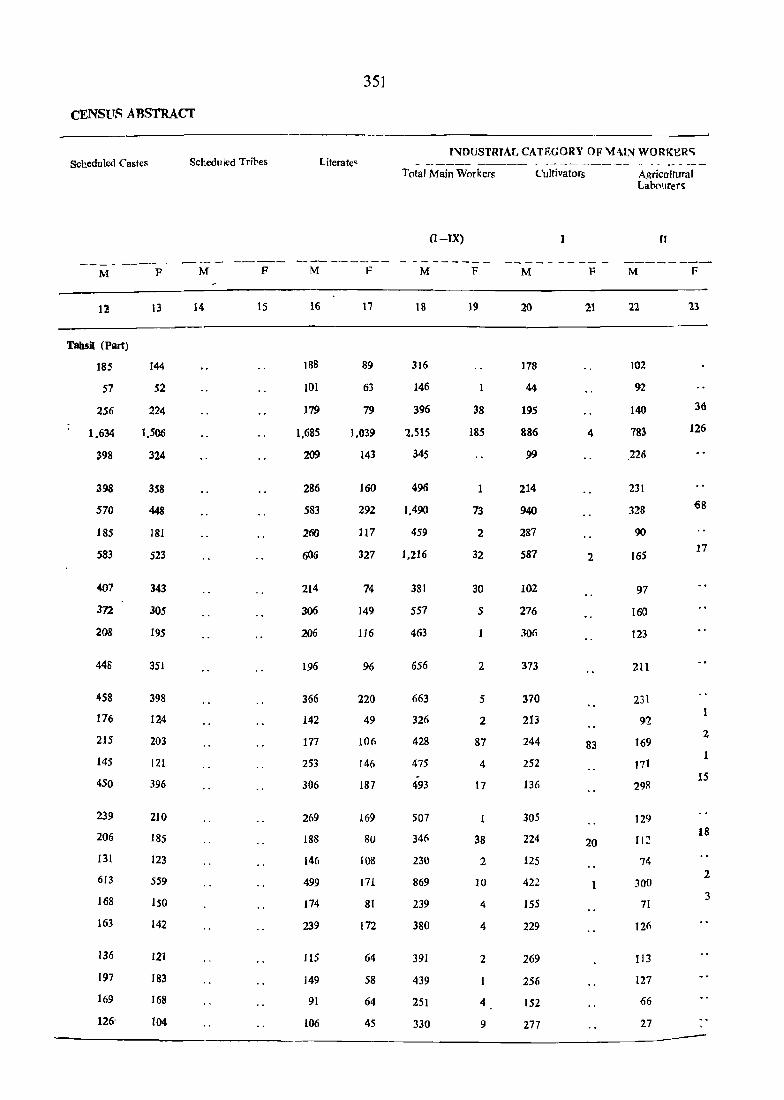
CENSUS A BSTRACf
Scheduled Castes
M F
Tabsil (Part)
185
57
256
1.634
398
398
510
185
583
407
312
208
448
458
116
215
145
450
239
206
131
613
168
163
136
197
169
126'
13
144
52
224
1.506
324
358
448
181
523
343
305
195
351
398
124
203
121
396
210
185
123
559
150
142
121
183
168
104
Scheduled Tripes
M F
14 15
351
Literate'
M F
16
IS8
10l
179
1.685
209
286
583
260
6()6
214
306
206
196
366
142
177
253
306
269
188
146
499
174
239
115
149
91
106
17
89
63
19
1.039
143
160
292
117
327
74
149
116
96
220
49
106
146
187
169
80
108
171
81
172
64
58
64
45
T"IDUSTRTAT~ CATEGORY OF "\HI;'II WORKERC;;
Total Main Workers Cultivators Agricultural
(I-IX)
M F
18
316
146
396
2,515
345
496
1,490
459
1,216
381
557
463
656
663
326
428
475
493
507
346
230
869
239
380
391
439
251
330
19
38
185
1
13
2
32
30
5
2
5
2
87
4
17
1
38
2
10
4
4
2
4
9
M F
20
178
44
195
886
99
214
940
287
587
102
276
306
373
370
213
244
252
136
305
224
125
422
155
229
269
256
152
277
21
<I
2
83
20
Labr>urer~
n
M F
22
102
92
140
183
,226
231
328
90
[65
97
160
123
211
231
92
169
171
29R
129
I I:!
74
300
71
126
113
127
66
27
36
126
68
17
2
1
15
18
2
3

'BUDHLADA C. D. BLOCK
Loclltion Code No.
Name ofvillag"-e (with Hadbast No·)
2
186 Tal!ctJwala (149)
187 Lakhiwala (148)
188 Ganiwala (147)
189 Boha (137)
190 Kesampur Chhini (130)
191 Mf\11Singhwala (138)
192 Barah (127)
193 Kulahri (233)
194 Ahmadpur (232)
195 Phuluwala Dograp (231)
196 Karipur (230)
197 Ram Nagar Bhathlan (139)
198 Rampur Mander (140)
199 Kulana \(227)
200 Satikc (141)
1..0 I A_chank (14~) • t
202 Saidcwa1a (144)
203 Sh9~ Khanwala (146)
204 Ml.;lchanian (145)
205 Gandhu Khurd (151)
206 G.andhu, Kalan (150)
207 R~otid Kalan (152)
208 Reond'Khurd (153)
209 Birc\}'ala Dogran (154)
2Vl Cpak J\Jisher (156)
211 Bhawa (155)
212 Bhakhrial (1!9)
213 A._ndianwali (157)
352
---------------J..ive~toc~. Fqrestry, Mining and FiShIng, HUnting • Quarrying alld Plantations Orchards & allied activities'
24
2
4
26
3
8
54
5
34'
5
3
4
7
1
9
2
2
3
3
4
III
25
2
5
1 f
IV
27
.'.
,.
VJLLAGE-PRlMARY
INDUSTRIAL CATEGOR\
Mimufacturing, Processing, Servicing, and Repairs in Household Industry
Yea)
M F
28 29
39
2
2
10
12
24
3
4
2
11
4
1
Manufacturing, ProcesSing, Serviring and Repairs in other thAn House· hold Industry
V(b)
30
16
7
158
_. \ 3
6
24
17
74
116
6
'S'
6
7
2
4
10
12
6
23
5 . 3
3
31
1
2
.. " ....

353
CENSUS ABSTRACT
OF MAIN WORKERS ._---_. __ .--.- Marginal Workers Non-Workers Constructions Trade and Transport, Storage Other Services
Commerce & Communications
VI VII VIII IX-
------ -- -----._ M F M F M F M F M F M F
32 33 34 35 36 37 38 39 40 41 42 43
'TahsIl (part)
2 5 11 228 463 3 2 .. ' 134 249
16 16 3 17 2 SO 296 495
72 316 1 43 192 40 153 1.817 3,587 1 4 2 8 300 546
9 6 1 10 17 363 798 56 49 7 83 3 240 904 1,689 6 4 16 '31 2 275 677
104 2 54 55 113 5 3 37 724 1,634 7 8" 18 16 6 321 581
5 17 1 26 32 4 3 38 401 791
6 2 12 295 670
10 20 2 10 2 485 979
10 11 6 24 4 88 434 890
2 ',' 9 187 418
2 1. 4 235 522
15 4 27 2 346 752
i 13 6 15 1 321 755
17 2 40 359 827
1 2 3 10 221 465
18 6 2 204 415
9 28 11 73 7 4 246 603 1,058
2 2 1 2 189 382
3 2 10 7 2 266 579
2 4 2 303 592
24 10 8 7 4 14 283 'til 7
5 3 8 5 4 173 365
1 7 3 7 7 185 398

BUDHLADA C. D. BLOCK
Location Code N~.
Name of village • Afea of '(with Hadb~st No.) Village
irt Hectares & ofC.D. block/ Town! Ward
2
in sq. kms.
3
No. of No. of Occupied. HouseResid~n- holds tial Houses
4 5
354
Total Population (including Institutional and Houseless Population)
M
6 7
F
8
vn..LAGE PRl~ARY
Totiil Population in tl~e age group-\)--6
p M F
9 10 11
~----------------------------------~----~---=~--~
214 Ramgarh Shah (158) Purl&h ,.,
'215 Toddrpur (160)
216 Saswali (143)
217 Dhnflfinpura (161)
218 Sanl!hteri (163)
~_219 . Gobindpura (164)
, 'Z20 PhtllUwala ?od .(224)
221 t>ariapur (225)
222 Datewas (223)
223 Ramgarh (226)
354.00
343.00.
329.00
1,842.00
340,00
643.00
464.00
395.00
1,016.00
331.00
224 Budhlada (Rural) (229) 2035.00 , ~
225 Ta Iw a'nd'i (228)-
~~26 Rali (222)
227 Chakan (221)
228 Bachhoana (220)
229 Dodra (219)
230 Rartghrial (166)
231 Khattl\vala (1"'9)
132 Dialpara (167)
..i33 SirslWAla (165)
234 JalWllhra (162)
.235 Bahaltltrpur (168)
367,00
850.00
782.00
1798.00
1,225.00
966.00
473.00
595.00
568.00
443.00
1,607.00
236 Kishangarh Uri (170) 2,293.00 Sedlll! 'SlnghwaJa
237 Akl1J,t1'!)ur (17U. . 578.00 Khudal
170,
62
93
598
141
229
134
162
413
124
1.361
o 363
206
667
4Z0
353
204
285
191
164
683
693
298
170 939
62· 35.7
93 572
599 3.765
141 820
233 1.351
I'll 946
162 1.080
413 2.220
124 688
1.416 7.980
9
367 2.395
206 1,189
743 4.519
420 2,705
354 2,263
223 1.281
293 1,847
191 1,150
164 1.116
685 4.157
711 4,470
298 1,833
!:.
517
173
281
2.oJ9
432
704
497
576
1,164
363
4,232
7
-1.283
636
2.430
1,.440
1.208
673
1,019
590
588
2,293
2.441
979
"
422... 156
184 70-
291 106,
1.746 608"
388 138 . 647 2\2
449 173'
504 175
1,056, 365
325't" 111
3.748 1,409
2
1,112
553.
'2.089.
1.265
~,055
608
828
2
370
178
773
441
388
221
284
560 166
528 • 195
1.864
2.029
854
686
655
346
75 ~
35
55
331
70
105
82
86
190
47
731
194
107
411
223
193
115
155
93
105
373
342
185
Ma ••
81
3S
51
277
68
107
91
89
175
64
678
174
71
362
218
195
106
129
73
90
313
313
161

355
CENSVSABSTRACf
seln:duled Castes Scheduled Tribes Literates
---------- ---------- -----_ M F M F M P
12 13 14 15 16 17
"Tailsil (Part)
180 153 141 43
75 88 54 37
57 47 79 44
502 422 362 141
172 149 128 74
238 221 277 182
183 153 174 79
207 196 164 9S
421 396 52S 267
79 83 148 83
1.572 1.430 2.121 1.359
2
342 289 410 230
275 229 191 113
685 604 709 402
418 359 444 220
.397 343 374 182
'322 309 204 94
327 294 296 146
191 189 214 95
214 192 120 54
630 562 740 267
562 465 547 254
325 271 223 83
INDUSTRIAL CATEGORY 01" MAIN WORKElU -------~-------- - ------_
Total Main Workers
(I-IX)
-----M F
18 19
322 4
106 53
165 2
1.259 294
280 11
405 8
273 2
305 9
629 22
224 3
2.342 151
(I
833 2
350 6
1.458 29
836 10
704 3
411 2
591 10
376
401.
1.493 14
1.485 7
622 1
Culli va tors
--------M F
20 21
116
47
129
710
129
226·
136
157
288
147
393 3
5S9
142
866
480 2
424
143
380
219
361
871 4
922
335
Agricultural Labourers
rr
------M F
22 23
tQ! 2
54 ,2
29
376 29J
49 3
,47
108
84
197 1(1
59
655 22
3
231
152
356 3
260 .3
210
217
116 J
11?
5
347 .2
405 1
2~8
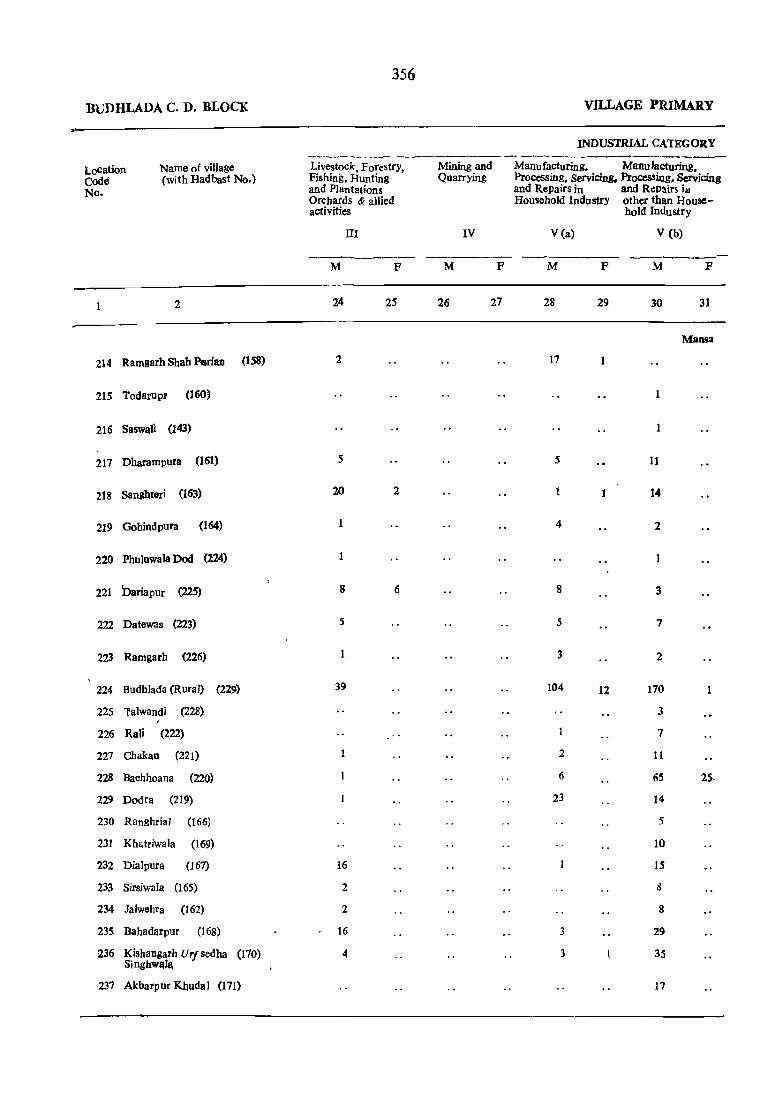
356
BUDHLADA C. D. BLOCK VILLAGE PRIMARY
INDUSTRIAL CATEGORY --- -_-- --- -- --_._---_ .. ----
Location Name of village Livestock, Forestry, Mining and Manufacturing. Manu 'acturing. Code (with Hadbast No.) Fishing. Hunting Quarrying Processing. servicing. Processing. Servicing No. and Plantations and Repairs in and R,:pairs iu
Orchards & allied Hou,ehold Industry other than House-activities hold Industry
III IV Yea) V (b)
-~---
M F M F M F M F
2 24 25 26 27 28 29 30 31
Mansa
214 Ramgarh Shab Purian (lS8) 2 17
215 Todarupr (160) 1
216 Saswali (143)
217 Dharampura (161) 5 5 11
218 SanghIeri (163) 20 2 1 14
219 Gobindpura (164) 1 4 2
220 Phuluwala Dod (224)
221 bariapur (225) 8 6 8 3
222 Datewas (223) 5 S 7
223 Ramgarb (226) 1 3 2
224 Budhlada (Rural) (229) 39 104 12 170 1
225 "lalwandi (228) 3
226 Rali (222) 7
227 Chakan (221) 1 2 11
228 Bachhoana (220) 6 6S 25.
229 Dodra (219) 23 14
230 Ranghrial (166) 5
231 Khatriwala (169) 10
232 DiaJpura (167) 16 IS
233 Sirsiwala (165) 2 8
234 Jalwebra (162) 2 8
235 Bahadarpur (168) 16 3 29
236 Kishangarh Urfsedha (170) 4 3 35 Singhwala
237 Akbarpur Kbudal (171) 17

3S7
CENSUSABStRtt(.l --- _- --~
OF MAIN WORKERS MarWt!al Workers Non-Worket'll
Constructions Trade and fransport, Storage Other Services Comme~ce &
~;ommunications
VI vn VIII IX
----_._---- ------ -~----- ------_ -_------M F M F ,,1 F M F M F M F
----32 33 34 35 3 J 37 38 39 40 41 42 43
Tansil (Part)
4 12 10 1 195 418
2 2 1 67 131
3 1 1 2 ]16 289
16 25 4 107 760 1.452
15 6 I 45 5 152 377
4 6 1 14 8 299 639
g 11 7 2 224 447
19 2 4 20 3 271 495
, 30 18 5 24 55 7 1 10 534 1.024
1 2 5 4 2 139 322
58 415 13 148 1 360 99 4 1.890 3,593 '
2
8 3 10 • 14 2 450 l.1l0
5 6 8 23 6 286 547
21 39 15 89 972 2.060
9 13 14 22 5 604 1.255
19 6 1 39 3 504 1,052
7 7 6 21 1 262 606
6 II 25 21 7 8 428 810
17 6 1 6 214 560
7 8 1 9 187 528
25 79 39 84 7 800 1.850
7 30 9 70 4 956 2.022
2 11 11 18 1 357 853

358
BUDHLADA C. D. BLOCK VfiLAGE PRIMARY
Location Name ofviJ1age Area of No. of No. of Total POPulation (rucluding Total Population in the age Code (witlfHadbast No.) Village • Occupied House- Institutional and Honscless group .0-6 No. in Hect- Residen- holds popUlation)
ares & tial ofC.D. Houses block, Town! Ward in sq.
kms. P M F -p M F
2 3 4 5 6 7 8 9 1.0 11 .::.
Mansa
238 Bakshiwala (173) 589 . .0.0 225 22? 1.477 79~ 678 26~. 148 121
239 Khudal Sekhpur (172) 481 . .0.0 242 242 1.596 876 72.0 251 137 114
24.0 Khudal Kalan (174) 56.0.0.0 3.03 3.03' 1.725 ,-
90S 82.0 313 • 165 148
241 Kahangarh (176) 1467 . .0.0 531 537 3.3~2 1.89? 1.~77 52S 269 - 259
242 Juglan (177) 3.02 . .0.0 109 1.09 672 367 305 138 74 64
243 Mander (178) 495.0.0 248 261 1.477 8.02 615 258 129 129
244 Kularian (179) 2561iGG 1 • .012 1 • .017 6.154. 3,316 2.828 1 • .052 579 473
245 Gorakh Nath (180) 654 • .0.0 148 148 887 479 4.08 185 95. 90
URBAN:
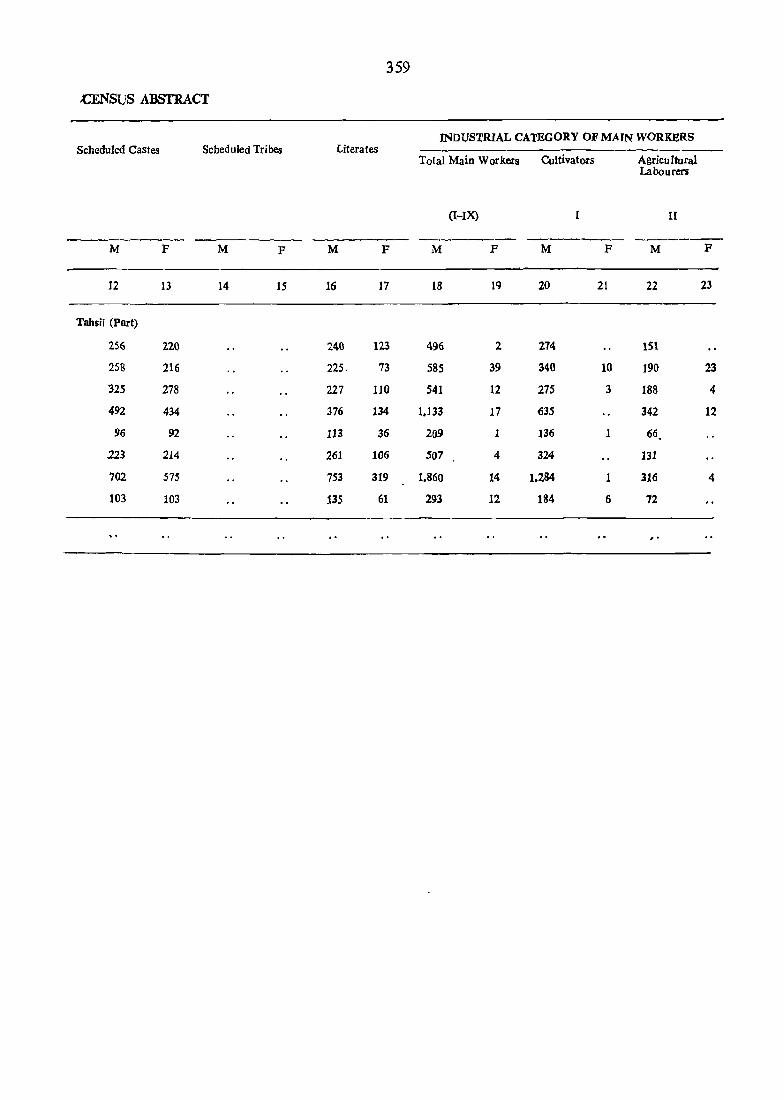
359
,cENSUS ABSTRACT
INDUSTRIAL CATEGORY OF MAIN WORKERS Scheduled Castes Scheduled Tribes Literates
Total Main Workers Cultivators Agricultural Labourers
(I-IX) II
-------- -------M F M F M F M F M F M F
12 13 14 15 16 17 18 19 20 21 22 23
Tahsil (Part)
256 22C 24C 123 496 2 274 lSI
258 216 225. 73 585 39 340 10 190 23
"325 278 227 110 541 12 275 3 188 4
492 434 376 134 1,133 17 635 342 12
96 92 113 36 209 1 136 1 66 . .223 214 261 106 507 4 324 131
702 575 753 319 1,860 14 1.284 1 316 4
)03 103 135 61 293 12 184 6 72
, .

BUDHLADA C. D. BLOCK
Location Code No.
:&ame of village (with Hadbast No.)
1 2
238 Bakshiwala (173)
239 K'U4al Sekhp\lJ (172)
24Q... Khudal Kalan (174)
241 Ka]langarh (176)
242 1uglan (177)
243. Mander (178)
.244 Kuldrlan (179)
245 GoSh Natb (180)
URBAN:
360
Vi,LIrA<iE PRIMARY
INDUSTRIAL CATEGORY -------~-~--~----~---~----------~-~--Livestock:ForeStry, Mining and Manufacturing, Manufacturing Fishing, Hunting Quarrying Processing, S~vicing ProCessing, Servicing-andPlantatioos and Repairs 10. and Repairs'in Orchards and Household Industry other than House-allied activities . hold Industry
TIl IV V(a) V(b)
M f! ----------M F ~------M F
24 25 26 27 28 29 30 31
Mansa
21: 6 , 1
2 1 6
2 1 12 1
6 " 2 18
1 1
29 2 2 -46- 14
4 4 20 4
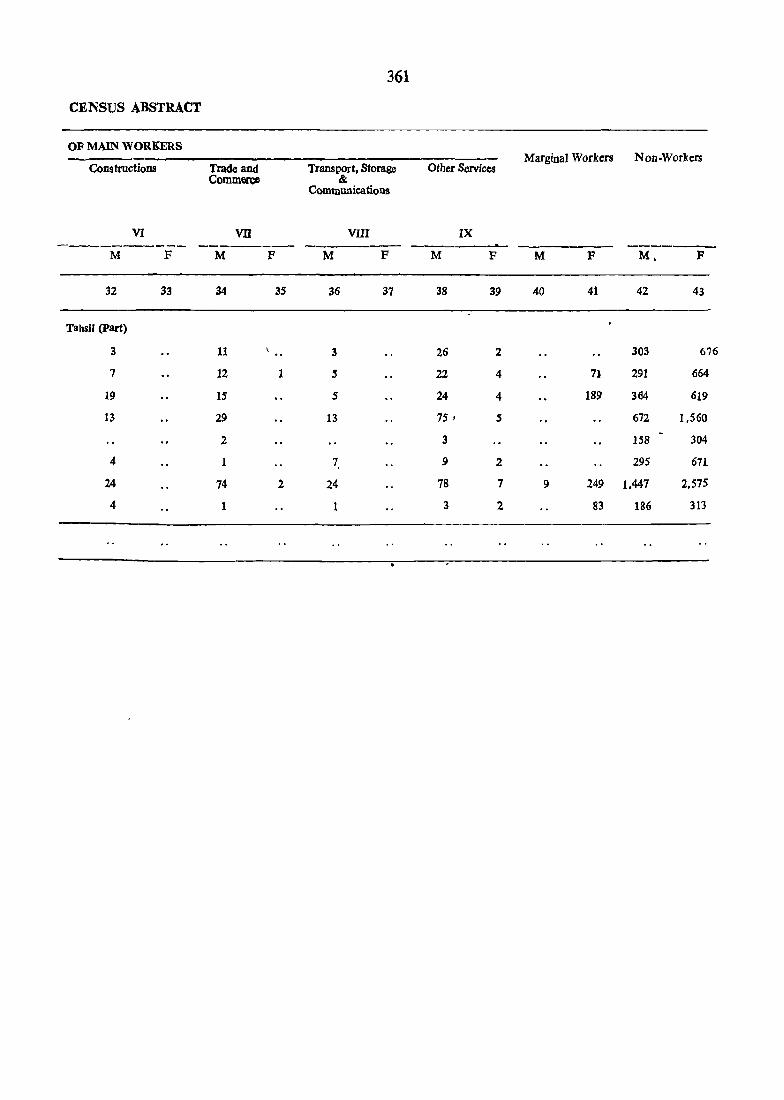
361
CENSUS ABSTRACT
OF MAIN WORKERS Marginal Workers Non-Workers
Constructions Trade and Transport, Storage Other Services Comm~ &
Communications
VI vn VI1I IX ----------- ------M F M F M F M F M F M, F
32 33 34 35 36 37 38 39 40 41 42 43
Tahsil (part)
3 11 3 26 2 303 676
7 12 1 5 22 4 71 291 664
19 15 5 24 4 189 364 619
13 29 13 75, S 672 1,560
2 3 158 304
4 1 7, 9 2 295 671
24 74 2 24 78 7 9 249 1.447 2,575
4 1 1 3 2 83 186 313


-PRIMARY CENSUS ABSTRACT
M:.\NSA C b BLOcli
363
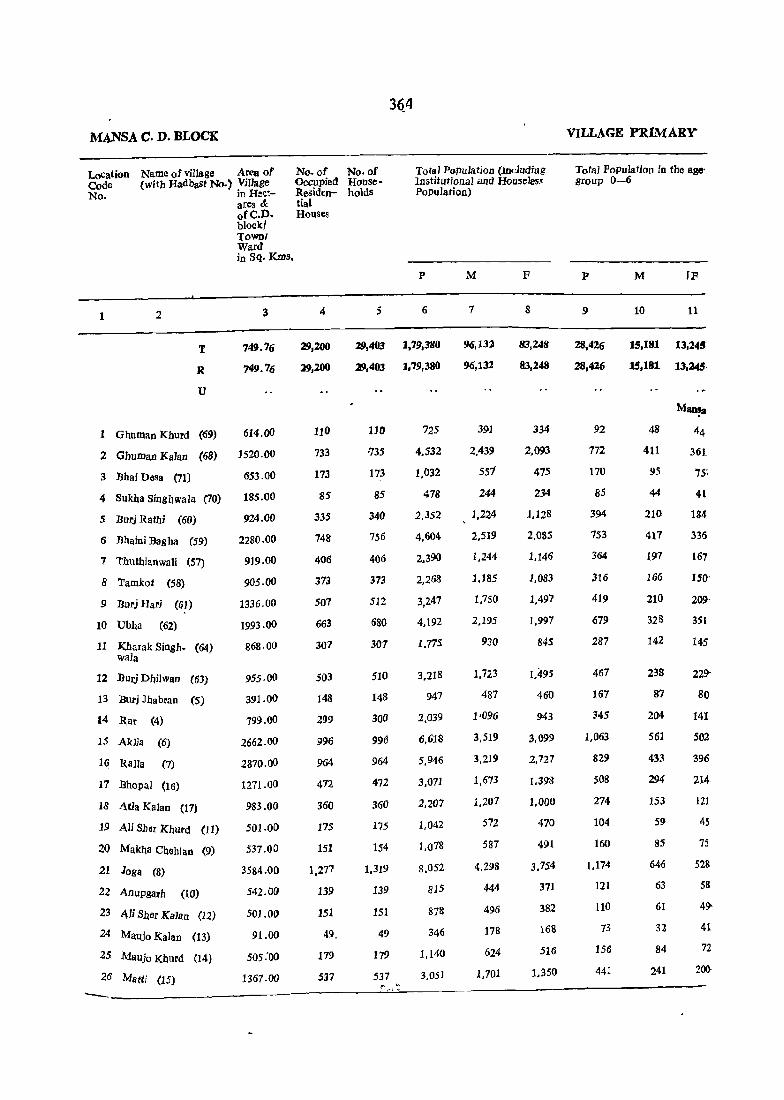
MANSA C. D. BLOCK
LoCation Code No.
Name of village AIX"a of (with Hadbast No.) VjJ1age
in H!!t~arcs & orC.D. block/ Townl Ward
2
T
R
U
in Sq. !(ms.
749.76
749.76
1 Ghuman Kburd (69) 614.00
2 Gbuman Kalan (68) 1520.00
3 Dhai Dosa (71) 653.00
4 Sukha Sillgbwala (70) IS5.00
5 Durj Rathi (60) 924.00
6 llhaini Bagha (59) 2280.00
7 Thuthlanwali (57) 919.00
8 Tamkot (58) 905.oo
9 Durj Bari (61) 1336.00
10 lJbba (62) 1993.00
11 Kuarak Singh- (64) 868.00 wala
12 Durj Dhilwan (63) 955.00
13 Burj lhabran (5) 391.00
14 ~ar (4) 799.00
15 Aklia (6) 2662.00
16, R.al1a (7) 2870.00
17 Bhopal (16) 1271.00
18 A.tla Kalan (17) 983.00
19 Ali Shar Khurd (11) 501.00
20 Makb:1 Cbohlan (9) 537.00
21 Joga (8) 3584 .00
22 Anupgllrb (to) 542.00
501.00
91.00
505 :00
1367.00
No. of OcCllpied Residential Houses
4
29,200
29,200
110
733
173
85
335
748
406
373
507
663
301
503
148
299
996
964
472
360
175
151
1,277
139
151
49.
179
537
No. of HOllseholds
Total Population (lncluding Institutional and Houseles,· Population)
p
5 6
.29,403 1,79,380
29,403 1,79,380
110
-735
173
85
340
756
406
373
512
680
301
510
148
300
996
964
472
360
175
154
1,319
139
151
49
179
537
725
4,532
1,032
478
2,352
4.604
2.390
2,268
3,247
4,192
1,775
3.218
947
2,039
6,618
5.946
3.071
2.207
1.042
1.078
8.052
815
878
346
1.140
3,051
M
1
96,132
96,132
391
2,439
5s1
244
1,224
2.519
1,244
1.185
1,750
2.195
930
1,723
487
1,096
3,519
3,219
1,673
1.207
572
587
4.298
444
496
178
624
1.701
F
8
83,248
83,248
334
2.093
475
234
1,128
2,085
1,146
1,083
1,497
1.997
845
1,49S
460
943
3.099
2.727
1.398
1.000
470
491
3.754
371
382
168
516
1.350
VILLAGE PRIMARY
Total PoPulation in the agegroup 0-6
p
9
28,426
28,426
92
772
170
85
394
753
364
316
419
679
287
467
167
345
1,063
829
50S
274
104
160
1.174
121
110
13
156
441
M fF
10 11
IS,lBI 13,245
15.181 13,245·
48
411
95
44
210
417
191
166
210
328
142
238
87
204
561
433
294
153
59
85
646
63
61
32
84
241
Ma~lI
44
361
7S~
41
184
336
167
150'
209·
351
145
229-
80
141
502
396
214
121
45
75
528
58
49-
41
72
200
23 t\li Sber Kalan (12)
24 Maujo Kalan (13)
25 Maujo Kburd (14)
26 Mlltti (15)
---------------------------------~~~~~---------------------------------
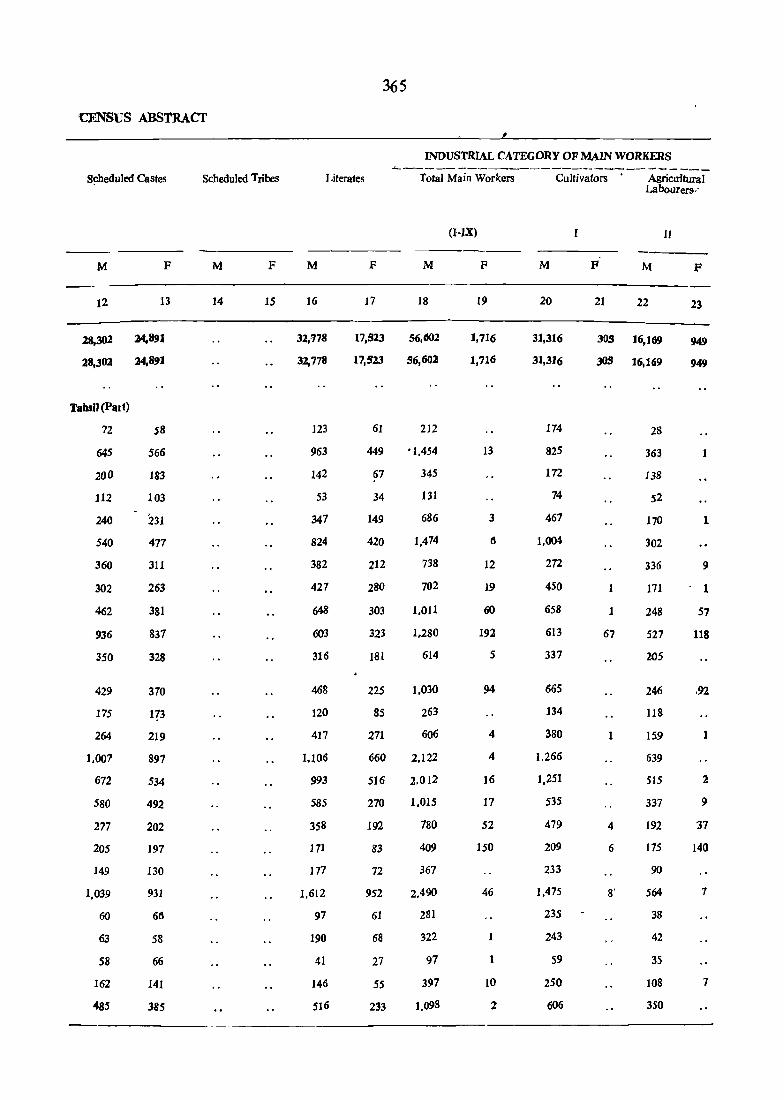
'CENSUS ABSTRACl'
S~beduled Castes
M F
12 13
28,302 24,891
28,302 24,891
Tabsll (Part)
72
645
200
112
240
540
360
302
462
936
350
429
175
264
1.007
672
580
277
205
149
1.039
60
63
58
162
485
S8
566
183
103
231
477
311
263
381
831
328
370
1?3
219
897
534
492
202
197
130
931
66
58
66
141
385
Scheduled Tribes
M F
14 15
365
Literates
M
16
32,778
32,778
123
963
142
53
347
824
382
427
648
603
316
468
120
417
1.106
993
585
358
171
177
1,612
97
190
41
146
516
F M
17 18
17,S23 56,602
17,523 56,602
61
449
67
34
149
420
212
280
303
323
181
225
85
271
660
516
270
192
83
72
952
61
68
27
55
233
212
'1,454
345
131
686
1,474
738
702
1.011
1.280
614
1.030
263
606
2,122
2,012
1.015
780
409
367
2,490
281
322
97
391
1.098
(I-IX)
F
19
1,716
1,716
13
3
6
12
19
60
192
5
94
4
4
16
17
52
ISO
46
1
1
10
Z
M
20
31,316
31,3J6
174
825
172
74
467
I.OM
272
450
658
613
337
665
134
380
1.266
1,251
535
479
209
233
1,475
235
243
59
250
606
F M
21 22
30S 16,169
30S 16,169
1
67
4
6
8'
28
363
138
52
170
302
336
171
248
527
205
246
118
159
639
515
337
192
175
90
564
38
42
35
108
350
II
F
23
949
949
1
9
1
57
118
,92
2
9
37
140
1
7

MANSA C. D. BLOCK
INDUSTRIAL CATEGORY - _--._._,. ----_-- - -_ ----_._- -----------. -.--....,-~-- - ----
Location '~do No.
Name at village (with tladba~t No.)
--" _._- ------- ---2
Livestock, Forestry, Mining and fishing, Hunting Quarrying and Plantations Orchards & allied activities
HI
M F
24 25
IV
M F
26 27
Manufacturing, Ma.Q\lf!lctur~ l'rocllssing', Servicing l>rocessingS6t'vicing and Repairs in and Repairs in Household Industry other than House
yea) hold Industry
V(b)
M F M F
28 29 30 31
------- ----------
t -Ghuman Khurd (69)
2 Ghuman Kalan (68)
T
R
(j
399
399
10
3 Bhai Desa (71) 5
4 Sukha Singhwala (70)
5 Bud Rathi (60) ... 6 Bhaini Bagha (59)
7 Thuthianwali (57)
8 Tamkot (58)
9 Bud Hari (61)
10 Ubha (62)
11 Kharak Singhwala (64)
12 Burj Dhilwan (63)
13 Burj Jhabran (5)
14 Rar (4)
15 Aklia (6)
16 Raila (7)
17 Bhopal (16)
18 AtJa Kalan (17)
19 Ali Sher Khurd (J I)
20 Makha Chehlan (9)
21 Joga (8)
22 Anupgarh (10)
23 Ali Sher Kalan (12)
24- Maujo Kalan (13)
25 Ma\ljo Khurd (14)
26 Mat(i (15)
6
5
2
6
6
4
4
3
2
9
10
6
5
7
.24
6
2
--- --------_---
12
12
".
2
---------
sss sss
12
2
3
2
16
3
15
13
19
37
32
1
51
3
11
35
35
2
3
3
1,409
1,409
28
3
7
16
30
9
11
28
4
39
2
13
19
8
10
15
11
4
36
8
7
10
117
117
9
2
1
3
2
2

367
~---:==----~--------- -----_ -----'-------------
Marginal Workers Non Workers
M F M F M F M F M F -M-F
~----- ------- ---32 33 34 35 36 37 38 39 40 41 n 43
-----_ 773 2 2,074 29 (iBS 6 3,3-22 31l 206 S,773 39,324 7S,7~9
773 2 2,074 29 tt~ 6 3,222 311 206 S,7?3 :f9,324 75,759
T,1Mi1 (Part)
4 3 179 334
18 46 5 31 121 7 985 2.079
4 13 2 9 1 3 210 472
1 113 214 2 9 3 19 2 22 538 I.Un
15 30 6 94 6 1.045 2.071)
18 14 12 38 506 I,J~4
1 22 2 12 30 5 to 483 l.O?4
22 2 64 2 739 1.1n 14 42 4 45 4 21 34 894 1.?71 2 17 1 29 4 189 316 651
.13 19 5 27 5 693 1,396
4 5 219 224 241 22 11 2 16 2 14 203 476 736 13 62 7 88 4 1.397 3.095 15 48 9 119 8 1.207 2.711 3 19 6 67 8 2 319 566 1.662
13 19 5 16 34 2 42 390 385 $58
5 9 26 126 137 194 12 5 3 13 220 491
18 97 27 198 27 20 536 1,788 3.11;l 1 2 3 163 371 9 5 4 7 213 174 168
2 81 16-1 2 3 3 7 227 506 3 49 3 75 2 603 1.3411 --- -_ -
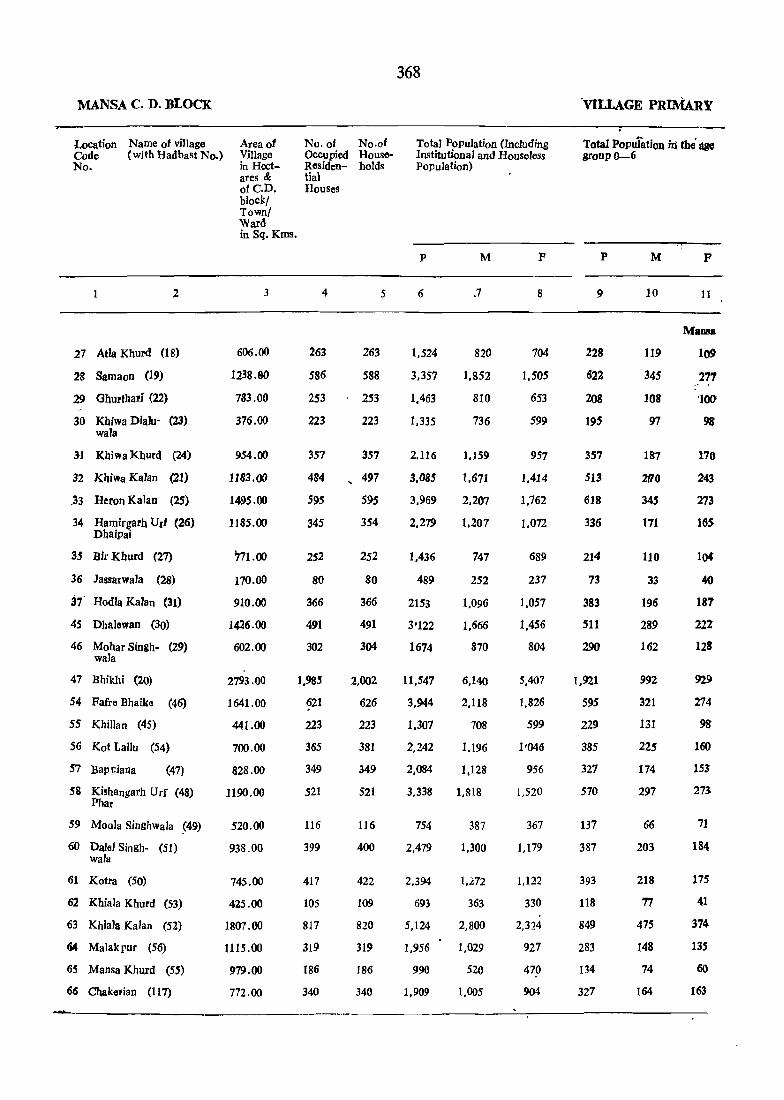
MANSA C. D. BLOCK
Location Name ot village Code (with Hadbast No.) No.
2
27 Atla Khurd (18)
28 Samaon (19)
29 Ghurthari (22)
30 Khiwa DiaJu- (23) wala
3·1 Khiwa Khurd (24)
32 I<biwa Kalan (21)
.33 Heron Kalan (25)
34 Hamirgarh VII (26) Dhaipai
35 Bir I<huld (27)
36 Jassarwala (28)
37 Hodla Kalan (31)
4S Dhalewan (30)
46 Mohar Singh- (29) wala
47 Bhikhi (20)
S4 Fafre Bhaiktl (46)
SS Khillan (45)
S6 Kot LaUu (54)
57 Bap]!iana (47)
58 Kishangarh Urf (48) Phar
59 Moola SinghWala ~49)
60 Dalel Singh- (51) wala
61 Kotla (50)
62 Khiala Khurd (53)
63 Khiala Kalan (52)
64 Ma lak rur (56)
65 Mansa Khurd (55)
66 Chakerian (117)
Area of Village in Hectares & otC.D. block! Town/ Ward in Sq. Kms.
3
606.00
1238.90
783.00
376.00
954.00
1183.00
1495.00
1185.00
771.00
170.00
910.00
1426.00
602.00
2793.00
1641.00
441.00
700.00
828.00
1190.00
520.00
938.00
745.00
425.00
1807.00
1115.00
979.00
772.00
No. 01 Occupied Residential Houses
4
263
586
253
223
357
484
595
345
252
80
366
491
302
1.985
621
223
365
349
521
116
399
417
105
817
319
186
340
No.of Households
263
588
253
223
357
497
59S
354
252
80
366
491
304
2.002
626
223
381
349
521
116
400
422
109
820
319
186
340
5
368
Total Population (Including Institutional and Houseless Population)
p
6
1.524
3.357
1.463
1,335
2.116
3,085
3,969
2,279
1,436
489
2153
3'122
1674
11,547
3,944
M
.7
820
1.852
810
736
1,159
1.671
2,207
1.207
747
252
1.096
1,666
870
6,140
2,118
1.307 708
2,242 1.196
2,084 1,128
3.338 1.818
754 387
2,479 1,300
2,394 1.~72
693 363
5,124 2,800
1,956 1,029
990 520
1,909 1.005
p
8
704
1,505
653
599
957
1,414
1,762
1.072
689
237
J,057
1,456
804
5,407
1,826
599
1'04<1
956
1,520
367
1.179
1,122
330
2,324
927
470
904
'VILLAGE PRIMARY
Total Popuiation in the' age groupQ-6
P
9
228
622
208
195
357
513
618
336
214
73
383
511
290
1,921
59S
229
385
327
570
137
387
393
118
849
283
134
327
M
10
119
345
108
97
187
2(10
34S
171
110
33
196
289
162
992
321
131
225
174
297
66
203
218
77
475
148
74
164
F
11
Mansa
109
277
'100
98
170
243
273
1650
104
40
181
222
128
929
274
98
160
153
273
71
184
175
41
374
135
60
163
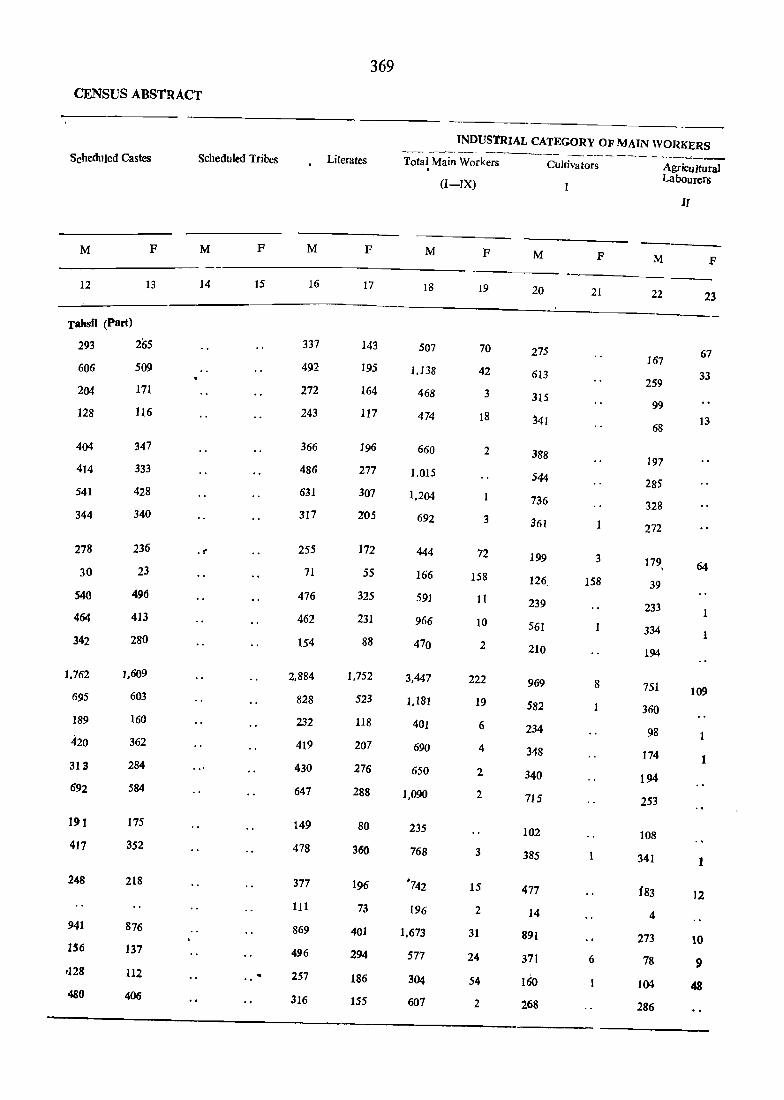
CENSUS ABSTRACT
Scheduled Castes
M F
12 13
Tahsil (Part)
293 265
606
204
128
404
414
541
344
278
30
540
464
342
1.762
695
189
420
313
692
191
417
248
941
156
0128
480
509
171
116
347
333
428
340
236
23
496
413
280
1.609
603
160
362
284
584
175
352
218
876
137
112
406
Scheduled Tribes
M F
14 15
.f"
M
16
337
492
272
243
366
486
631
317
255
71
476
462
154
2.884
828
232
419
430
647
149
478
377
111
869
496
257
316
369
Literates
F
17
143
195
164
117
196
277
307
2'05
172
55
325
231
88
1.752
523
118
207
276
288
80
360
196
73
401
294
186
155
INDUSTRIAL CATEGORY OF MAIN WORKERS --- -._-.-_ __.:..__ ---------------- ---_----_ Total Main Workers .
M
18
507
1.138
468
474
660
1.015
1.204
692
444
166
591
966
470
3.447
1.181
401
690
650
1.090
235
768
"742
196
1.673
577
304
607
(I-IX)
F
19
70
42
3
18
2
3
72
158
11
10
2
222
19
6
4
2
2
3
IS
2
31
24
54
2
Cultivators
M
20
275
613
315
341
388
544
736
361
199
126,
239
561
210
969
582
234
348
340
715
102
385
477
14
891
371
160
268
F
21
3
158
8
1
6
Agricultural Labourers
II
---_ M
22
167
259
99
68
197
285
328
272
179,
39
233
334
194
751
360
98
174
194
253
108
341
i83
4
273
78
104
286
F
23
67
33
13
1
109
1
1
12
10
9
48
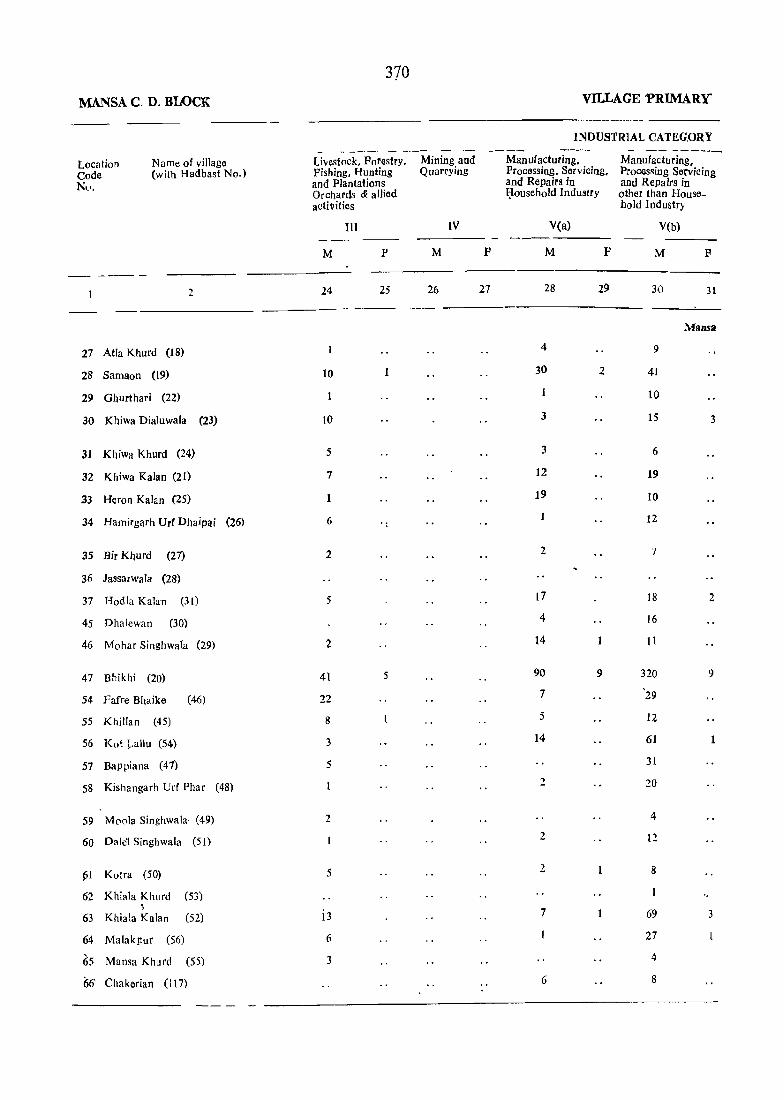
370
MANSA C. D. BLOCK VILLAGE 'PRIMARY
INDUSTRIAL CATEG.ORY -...... --~ - --- - --, - _- ----_
Location Name of village Livestock. Forestry. Mining and Manufacturing, Manufacturing, Code (with Hadbast No.) Fishing. Hunting Quarrying Processing. Servicing, Processing Sefviaing
Nl" and Plantations and Repairs in and Repairs in Orchards & allied ~ousehold Industry other than House-acti~ities hold Industry
III IV V(a) V(b) - ---
M P M F M F M F
----2 24 25 26 27 28 29 30 3l
----Mansa
27 Atla Khurd (18) 4 9
28 Samaon (19) 10 30 2 41
29 Ghurthari (22) 1 10
30 Khiwa Dialuwala (23) 10 3 15 3
31 Khiwa Khurd (24) 5 3 6
32 Khiwa Kalan (21) 7 12 19
.33 Heron Kalan (25) 19 10
34 Hamirgarh UrI Dhaipai (26) 6 12
35 Bir Khurd (27) 2 2 7
36 Jassarwala (28)
37 Hodla Kalan (31) 5 17 18 2
45 Dhal()wan (30) 4 16
46 Mohar Singhwala (29) 2 14 II
47 Bhikhi (20) 41 5 90 9 320 9
54 Pafre Bhaike (46) 22 7 '29
55 Kllillan (45) 8 5 12
56 Kot J-allu (54) 3 14 61
57 Bappiana (47) 5 31
58 Kishangarh Urf Phar (48) 2 20
59 M(lola Singhwala· (49) 2 4
60 Dale'Singllwala (51) 2 12
pI Kotra (50) 5 2 8
62 Khiala Khurd (53) 1
13 7 63 Khiala Kalan (52) 69 3
64 Malakt:ur (56) 6 27
65 Mansa KhLlrd (55) 3 4
66' Chakerian ( 117) 6 8
--- -

371
CENSUS ABSTRACT , I
-- - --- _-- -- ----- --- ----OF MAIN WORKERS __ -L-::-"_",_..LJ_.!. __ ............ __ _ - _
Constructions
VI
M p
32 33
Trade and C'omffil'fce
VlI
M p
34 35
_ "----. -Transport, Storage
& Communications
VIII
M p
36 37
Otl]er Services
IX
M p
38 39
---------- -- - - -- - ---Tahsil (Part)
II
29
15
15
'1
23
3
11
8
n
108
11
5
22
13
8
46
18
18
I.
13
36
7
6
20
39
30
13
22
19
III
11
716
41
19
11
28
1\1
4
16
22
4
55
16
5
6
2
3
6
27
5
6
6
14
9
6
6
19
4
5
78
9
4
16
12
2
II
7
3L
II
13
6
21
93
15
10
24
72
.. 68
10
18
33
16
,7
374
120
16
41
27
70
13
10
25
6
288
49
IS
9
3
3
3
2
2
4
7
7
78
18
2
2
2
2
2
2
15
8
5
2
\1arginal Workers
M
40
4
9
15
13
t:> ••
p
41
208
135
17
5
85
274
3
4
559
681
15
Non-Workers
M
42
313
710
342
262
499
656
1,003
515
103
p
43
426
1,328
6jo
581
955
1.397
1.761
1,069
612
86 7fJ
505
700
400
2,684
922
307
504
478
728
152
532
530
167
1.11-+
216
398
1.046 , 1,446
802
5,100
1.533
593
1.039
950
/.513
J67
617
!.!OJ
323
1,6[2
888
416
9J2
-------- - -- --

MANSA C. D. BLOCK
Location Name of vi1Jage Codtl (with Hadbast No.) No.
1 2
67 Barnala (116)
68 Narenderrura Urf (118) BaglianWli.lli.
69 Khara (119)
70 -Hirewa!a (120)
73 Nanga! Kalan (115)
75 Nanga! Khurd (113)
76 Jawaharke (114)
77 ~am Dittawala (17)
78 Kbokbar Kburd (74)
79 Khokbar Kalan (75)
80 Sadda Singhwala (12)
81 Kotli Kalan (9)
82 Kalho (10)
83 Aspal (13)
84 Man Bihrian (85)
85 Mussa (84)
86 GagowaJa (79)
87 Gehle (78)
88 Gharanllllc (80)
94 Makha (81)
URBAN
Area 01 Village in Hectares & oIC.D. block Town/ Ward in Sq. Kms.
3
930.00
686.00
773.00
542.00
2394.00
1093.00
1136.00
625.00
699.00
1138.00
818.00
1807.00
903.00
327.00
609.00
1233.00
542.00
523.00
664.00
1185.00
No. of Occupied Residential Houses
4
472
204
234
207
998
325
505
281
267
450
326
548
312
79
236
446
118
249
314
429
372
No. of Households
5
480
210
234
207
1,001
325
506
281
268
450
326
552
312
80
236
458
118
249
314
429
Total Population (InCluding Institutional and Housel(!ss Population)
p
6
2,859
1.254
1.554
1.350
6,093
1,760
3,244
1.527
1.516
2,752
1.877
3.545
1.661
428
1,479
2,933
709
1,427
1.962
2. 644
M
7
1,522
649
820
756
3,180
940
1.775
803
826
1.449
994
1.892
904
252
815
1.523
372
776
1,066
1,439
II
8
1,337
605
734
594
2,913
820
1,469
724
690
1,303
883
1.653
757
176
664
1,410
337
651
896
1,205
VILLAGE PRIMARY
Total Population in tho age group 0-6
p
9
442
260
235
235
1,008
322
497
253
223
470
308
566
257
75
222
460
127
256
262
422
M
10
235
132
123
133
503
16&
279
122
122
250
167
296
159
42
113
220
67
152
156
236
p
II
MallSft
207
128
112
102
505
154
218
131
101
220
141
270
98
33
109
240
60
104
106
186
--_._--------------------------
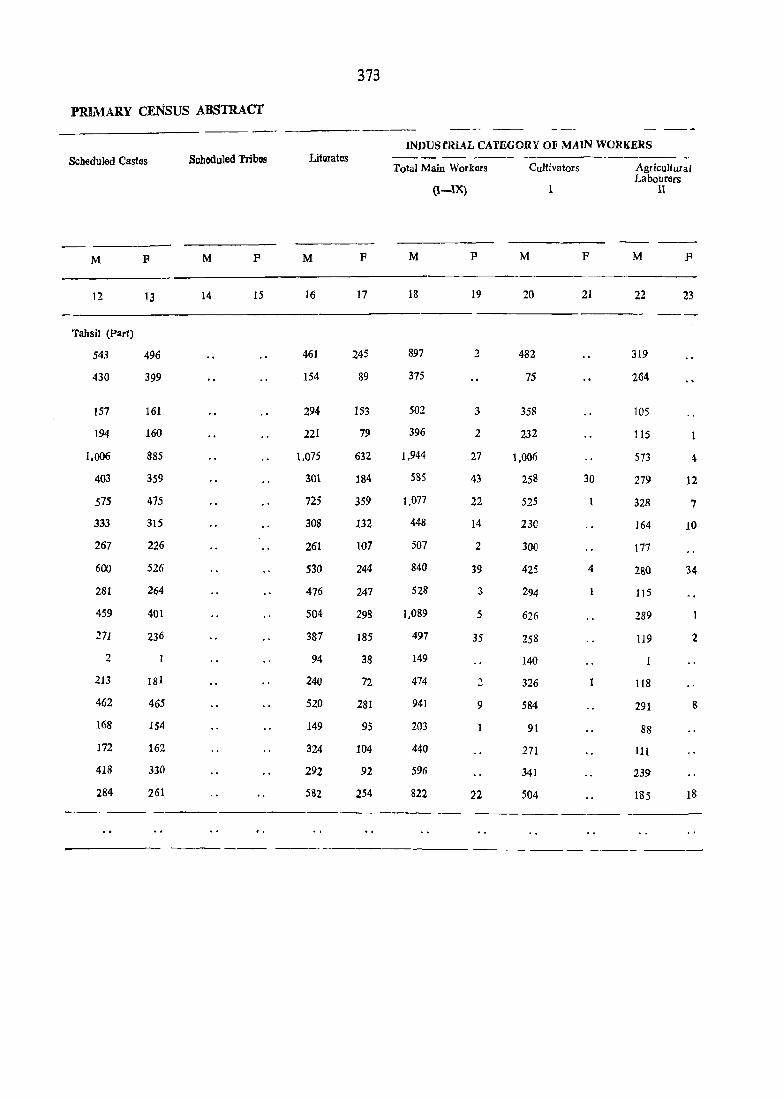
3'73
PRIMARY CENSUS ABSTRACT
Scheduled Castes Scheduled Tribes Litelates
M P M F M F
12 13 14 15 16 17
Tahsil (Part)
543 496 461 245
430 399 154 89
157 161 294 153
194 160 221 79
1.006 885 L075 632
403 359 301 184
575 475 725 359
333 315 308 132
267 226 261 107
600 526 530 244
281 264 476 247
459 401 504 293
271 236 387 185
2 1 94 38
213 181 240 72
462 465 520 281
168 154 149 95
172 162 324 104
418 330 292 92
:284 261 582 254 -_._--
---
INDusrRIAL CATEGORY OF MAIN WORKERS
Total Main Workers Cultivators
(1-1:X) 1
M P M
18 19 20
897 2 482
375 75
502 3 358
396 2 232
1,944 27 1.006
585 43 258
1.077 22 525
448 14 230
507 2 300
840 39 425
528 3 294
1.089 5 626
497 35 258
149 140
474 .2 326
941 9 584
2Q3 91
440 271
596 341
822 22 504 -_._ ------
P
21
30
4
Agricultural Labourers
II
M F
22 23
- --
319
264
105
115
573 4
279 12
328 7
164 10
177
280 34
115
289
119 2
1
118
291 g
88
III
239
185 18

374
MANSA C. D. BLOCK VlLLAGE PRIMARY
INDUSTRIAL CATEGORY --------------------
Location Namll of village Livestock. Forestry. Mining and Manufacturing. Manufacturing, Code (with Hadbast No.) Fishing, Hunting QuarrYing Processing. S6l'vicing, Processing. Servicing No. and Plantations and Repairs in and Repairs in
Orchards & allied Household Industry other than Housc-activities / hold Industry
III IV Veal V (b)
M F M P M F M F
2 24 25 26 27 28 29 30 31
Mansa
67 Barnala (116) 38
68 Narenderpura Urf Bagtian- (118) 2 7 4 wa1a
69 Khara (119) 4 1 9
70 Hirewala (120) 5
73 Nangal Kalan (115) 28 6 2 44
75 Nangal Khurd (113) 2 2 2
76 Jawaharke (114) 32 4 5 37 2
77 Ram Dittawala \77) 2 4 6
78 Khokhar Khurd (74)
79 Khokha Kalan (75) 2 16
80 Sadda Singhwala (72) 13 21 8
81 KotJi Kalan (9) lJ 4 14
~2 Kalho (10) 9 4 53 26
83 Aspal (73)
.84 Man Bibrian (85) 2 5 3
85 Mussa (84) 4 13 5
86 Gagowala (79) 2 4
87 Gehle (78) 1 17
88 Gharangne (80) 2 2
94 Makha (81) 7 4 2 43

375
PRIMARY CENSLS ABSTRACT
OF MA1N WORKERS ___..,...
----~--- Marginal Workers Non WorktUs Constructions Trade and Transport, Storage Other Servi~s
Commerce & Communications
VI VU VU1 IX
M F M F M F M P M P M P
32 33 34 35 36 37 38 39 40 41 42 43
TahSil (Pan)
3 19 7 28 2 625 1.335
4 3 7 9 274 604
5 7 13 2 318 731
3 4 5 32 1 360 59Z
·45 70 38 134 20 6 360 ;1.230 2.526
16 6 2 18 355 7n 18 24 30 79 6 1 4 697 1.443
3 17 2 4 18 2 5 353 705
.3 12 14 319 688
\14 17 44 42 22 314 581 950
5 15 13 44 2 4 20 462 860
19 42 17 74 4 803 1.648
3 14 15 22 7 298 406 424
3 2 3 103 176
2 9 3 6 1 380 341 282
2 6 3 33 1 582 1.401
1 4 3 9 1 169 336
4 11 7 18 336 651
2 8 131 470 765
6 26 11 36 2 3 617 1.180

URBAN PCA
377

Location Code No'
Name of Townl Ward
2
I. Rampura Pllol (M.e.)
Ward-I
2
3
4
5
6
7
8
9
10
11
12
13
14
15
II. Gonjana (M.e.)
Ward I
2
3
4
.5
6
7
8
9
10
11
Area ot Town) Ward in Sq. Kms.
3
5.76
9'00
No. of Occupied. Residential Houses
378
No. 01 Households
Total Population (including Institutional and HouseIess Population)
URBAN PRIMARY
Total Population in the age group 0-6
------- ----- -------------
4
3,749
471
433
354
274
518
466
371
270
301
233
284
454
501
74
5
6,039
474
451
361
331
529
472
379
270
361
267
292
465
547
74
745 766
1,624 1,694
225 238
116
112
128
115
163
97
105
185
244
174
117
112
131
117
163
108
105
185
244
174
P
6
35,530
2.910
2.675
2.139
1.823
2.781
2.724
2.149
1.626
2.249
1.637
1.792
2.756
3.162-
510
M
7
18,718
1.549
1.383
1.156
958
1.4')3
1.412
1.108
835
1.190
863
924
1.518
1.686
260
4.597 . 2.383
10,415 5,459
1.406 736
749
680
886
73[
1,014
668
714
1.117
1.334
1. L 16
400
362
475
391
512
365
359
568
70~
588
p
8
16,812
1.361
1.292
983
865
1.288
1.312
1.041
191
1.059
114
868
1.238
1.476
250
2.214
4,956
670
349
318
411
340
502
303
355
549
631
528
p M
9 10
5,726 3,092
463
413
298
246
518
401
344
181
358
239
256
559
645
91
253
227
160
146
248
214
190
99
202
123
133
303
348
39
714 407
1,786 1,001
286 152
210
102
135
113
163
110
85
162
219
201
143
54
83
63
83
73
42
85
117
106
p
11
2,634
210
186
138
100
270
187
154
82
156
116
123
256
297
52
307
785
134
67
48
52
SO
80
37
43
77
102
95
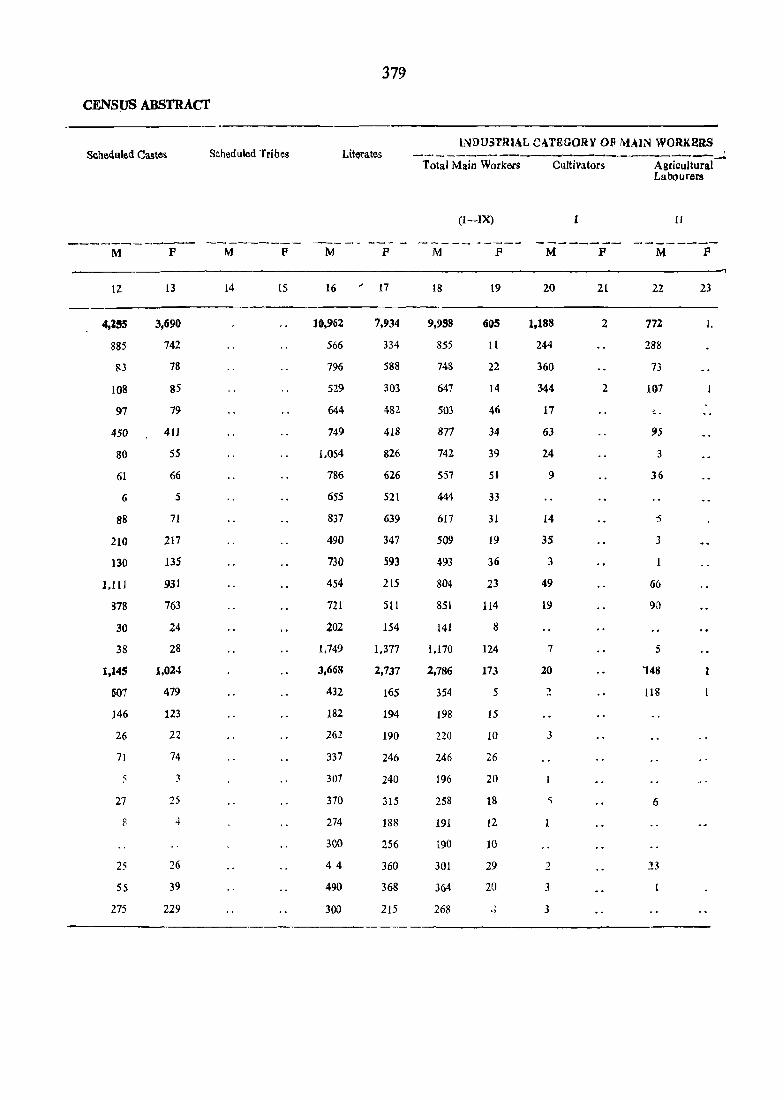
379
CENSUS ABSTRACT
INDU3TRIAL CATEGORY OF M,,\lN WORKERS Sche<illted Castes Scheduled Tribes Literates -----------------------_..-_-__.
Total Main Workers Cultivators Agricultural Labourers
(I-IX) I [I
----------- --------- ----- ---- ----_ ""_--- -------- --------M P M P M P M P M P M P
12 13 14 15 16 17 18 19 20 21 22 23
4,l!S 3,690 10,962 7,934 9,958 60S 1,188 2 772 I.
885 742 566 334 855 11 244 288
83 78 796 588 748 22 360 73
108 85 529 303 641 14 344 2 1()7
97 79 644 482 503 46 11 -,
450 411 749 418 877 34 63 95
80 55 1.054 826 742 39 24 3
61 66 786 626 557 5t 9 36
6 5 655 521 444 33
88 71 837 639 617 31 14 j
210 217 490 347 509 19 3S 3
130 135 730 593 493 36 3
1.111 931 454 215 804 23 49 66
378 763 721 SII 851 114 19 90
30 24 202 154 141 8
38 28 1.749 1,377 1,170 124 7 5
1,145 1,024 3,668 2,737 2,786 173 20 '148 1
501 479 432 165 354 5 2 118
146 123 182 194 198 15
26 22 262 190 220 10 3
71 74 337 246 246 26
5 3 307 240 196 20
27 25 370 315 258 18 ., 6
8 4 274 188 191 12
300 256 190 10
25 26 44 360 301 29 2 13
55 39 490 368 364 2() 3
275 229 300 215 268 , 3 "

380
URBAN PRIMARY
INDUSTR]AL CATEGORY Location Name of Townl - --- -_- -----. -~--- -- ------Code Wdru Livestock. Forestry, Mining and Manufacturing, Manufa.cturing, No. Fishing, Hunting Quarrying Processing, Servia- Processmg, Servic-
and Plantations ing and Repairs in ing and Repairs in Orchards & allied Household ]ndustry other than house-activities hold Industry
1ll IV V(a) V(b)
---_- ------- ----M F M F M F M F
1 2 24 25 26 27 28 29 30 31
J. Rampura Phu) (M.e.) 120 .:( 146 7 1,354 38
Ward-l 10 54 51
2 10 4 44
3 6 5 26
4 10 9 75
5 18 11 182
(j 14 3 117 S
7 17 29 62 2
8 3 42
9 2 112
10 4 79
11 2 85 4_
12 4 11 3 134 4
13 7 14 125 13
14 2 37
15 14 3 182 7
n. Goalllllll (M.e.) 35 40 4 339 7
Ward-l 2 38
2 10 4 11
3 18
4 10 21) 2
5 6 1 '1
6 5 27
7 2+
8 21
9 , 45 -
10 10 If 10! :>
11 3 7 2-l

CENSUS ABStRACT
OF MAIN WORKERS
Constructions
VI
Trade and Commerce
VII
381
Transport. Storage and
Communications
Vlll
Other Services Marginal Workers Non,Workers
IX
----_-- ----- -----..--- -.........,__..---..~-~---. ---,.-..--_,---- -----.----- ---- ----M
32
436
53
21
23
21
73
23
11
5
16
24
49
76
39
110
30 •
21
25
2
3
10
17
F
33
13
2
11
M
34
3,276
51
91
34
248
181
294
251
340
368
176
253
139'
177
71
602
1,346
54
95 178
122
138
132
138
143
152
115
79
F
35
49
2
2
4
2
3
2
2
2
9
19
10
2
:2
2
2
M
36
742
12
12
32
35
100
33 22'
8
42
24
50
164
125
14
69
158
31
21 ;}
23 3
19
2
6
14
26
9
F M
37 38
4 1,924
1
3
1
92
133
70
87
154
231
120
46
73
172
75
188
218
16
590
79
39
16
38
38
62
26
19
60
87
126
p
39
487
11
22
10
41
30
29
47
29
28 -
17
29
12
80
7
95
148
4
8
8
22
20
17
11
10
26
14
8
M
40
9
5
2
2
F M P
41 42 43
10 8,751 16,197
5
2
2
694
635
SOJ
450
616
670
551
391
573
354
431
714
833
119
1.211
2,673
382
202
142
229
195
254
174
169
267
339
3io
1,'350
1.269
969
819
1,254
1,273
990
758
1,023
755
832
1.213
1.360
242
2,090
4,783
665
334
308
385
320
484
291
345
520
611
52()

Looation Code No.
Name of Town/ Ward
2
Ill. Bathinda (M.C.)
Ward-l
2
3
4
5
6
7
8
9
10
11
12
13
14
15
16
17
18
19
20
21
22
23
24
25
26
27
Area of Townl Ward in Sq. Kms.
No. of Occupied. Residential Houses
3 4
97.00 28,840
1.222
1,894
1,063
1,209
917
1.426
1.398
1.350
1.572
1.495
1.386
736
449
766
628
537
877
708
795
663
687
733
10.90
1.031
1.072
1.010
2.126
382
No. of Households
Total Population (including Institutional and Houseless population)
URBAN PRIMARY
Total Population in the age grOUP 0-6
-----:----------- --------------p M
5 6 7
30,495 1,59,042 85,286
1.287
1.953
1,171
1,366
1.149
1.550
l,565
1.457
1.644
1.680
1,461
777
456
902
647
537
880
708
808
672
699
734
1.094
1.031
1.072
1.049
2,146
5,457
8.533
6,222
7,071
6,094
7.534
7,562
6,530
8.024
8.4~9
8,244
5.386
2.591
5.034
3.449
3.469
5.059
4.318
5.059
4.133
4.085
4.032
5.621
5.196
5.729
5.393
10,742
2.947
4,560
3.355
3,779
3.228
3,957
4.087
3.444
4.396
4,825
4,494
2,851
1.358
2637
1.835
1.813
2.651
2,276
2,615
2,213
2,156
2,170
2.987
2,820
3.069
2.878
5,885
F
8
73,756
2,510
3,973
2,867
3,298
2,866
3.577
3,475
3.086
3628
3.644
3,750
2.535
1.233
2.397
1.614
1.656
2.408
2.042
2.444
1.920
1.929
1862
2.634
2.376
2.660
2.515
4.857
p M F
9 10 11
26,301 14,350 11,951
1,046
1.367
1,022
1,162
1.050
1.051
1,103
854
1.225
1.675
1.661
1.072
445
764
434
559
696
616
839
701
507
,563
1.042
760
993
983
2.091
583
770
569
634
573
610
627
484
674
920
874
539
214
414
235
305
38~
364
458
389
284
307
523
404
548
529
1.131
463
597
453
528
477
441
476
370
551
755
787
533
231
350
199
254
308
272
381
312
223
256
519
356
445
454
960
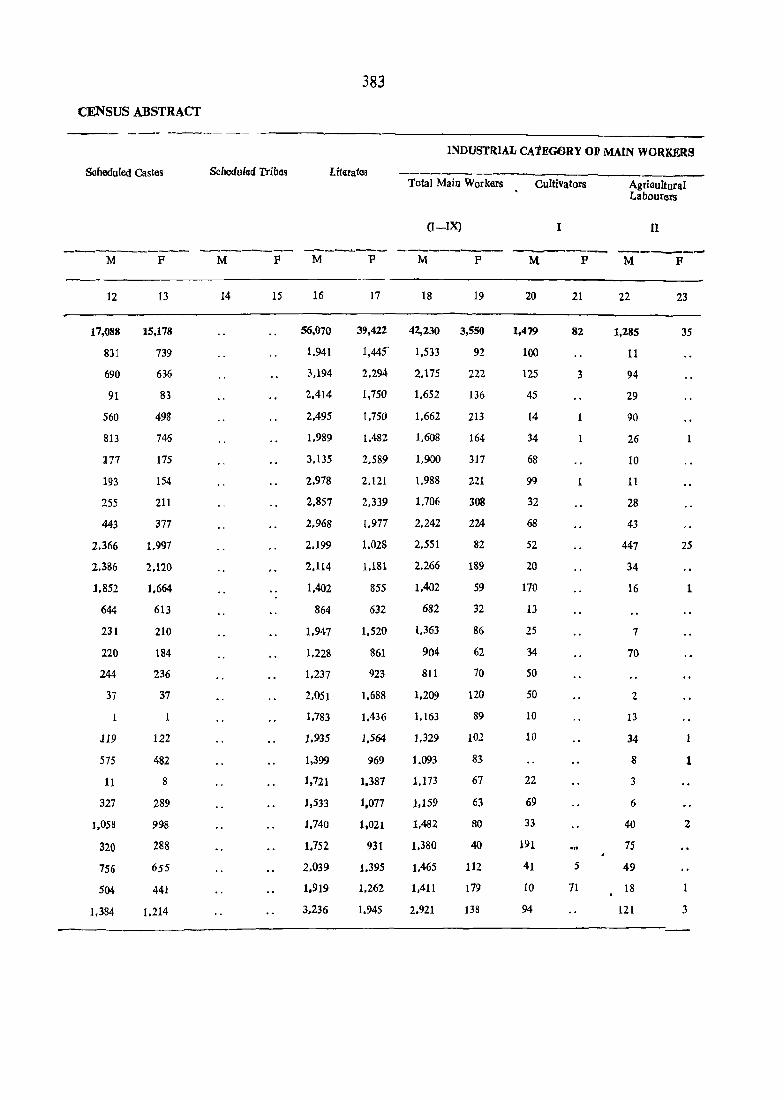
383
CENSUS ABSTRACT
Schedu£e(f Castes Scbeduled Tribes Literates
INDUSTRIAL CATEGORY OF MAIN WORKERS
Total Main Workers Cultivators
(I-IX) I
Agricultural Labourers
II
-~---------- --------- -~--~--- ---------- --------- --------M F
12 13
17,088 15,178
831
690
91
560
813
a77
193
255
443
2,366
2,386
1.852
644
231
220
244
37
JI9
575
11
327
1,058
320
756
504
1,384
739
636
83
498
746
175
154
211
377
1.997
2,120
1,664
613
210
184
236
37
122
482
8
289
998
288
655
441
1.214
M F
14 15
M
16
56,070
1.941
3,194
2.414
2.495
1.989
3,135
2.978
2.857
2,968
2.199
2.114
1,402
864
1.947
1.228
1.237
2.051
1.783
1.935
1,399
1,721
1,533
1,740
1.752
2.039
1.919
3,236
p M p
17 18 19
39,42Z 42,230 3,550
1,445'
2.294
1,750
1.750
1.482
2,589
2.121
2,339
1.977
1.028
1.181
855
632
1.520
861
923
1.688
1.436
1.564
969
1.387
1.077
1,021
931
1.395
1.262
1.945
1.533
2.175
1,652
1.662
1,608
1.900
1.988
1.706
2,242
2.551
2.266
1,402
682
1,363
904
811
1.209
1,163
1,329
1.093
1.173
1,159
1,482
1.380
1.465
1,411
2.921
92
222
136
213
164
317
221
308
224
82
189
59
32
86
62
70
120
89
102
83
67
63
80
40
112
179
138
M
20
1,479
100
125
45
14
34
68
99
32
68
52
20
170
13
25
34
50
50
10
10
22
69
33
191
41
10
94
p
21
82
3
5
71
M
22
1,285
11
94
29
90
26
10
1l
28
43
447
34
16
7
7()
2
13
34
8
3
6
40
75
49
18
121
p
23
35
25
1
1
2
3

384
tTimAN PRIMARY
- ----INDUSTRIAL CATt£GORY
Lucation Name of Town! ~- ~-'-'-- _. ,-
Code Ward Livestock: Forestry. Mining and Manufacturing, Manufacturing, No. Fishing, Hunting Quarrying Processing, Servic- Pro(;(1ssing, Servic-
and Plantations ing, and Repairs in ing and Repairs in Orchards & allied Household -Industry other than House-activities hold Industry
III IV V (a) V (b)
---__,-----_- -- - -_. __ M F M F M F M F
1 2 24 25 26 27 2S 29 30 3l
III. Bathinda (M,e.) 801 42 4 558 45 6,965 187
Ward-l 3 1,068 20
2 15 3 2 4 39
3 31 2 )4 193
4 39 3 40 4 247 3
5 30 51 291 11
6 95 8 2 25 216 3
7 75 3 46 262
8 80 4 40 2 133 8
9' 67 4 32 618' 21
10 24 13' 767' 23-
11 37 3 27 508 17
12 IS" 5 234 7
13 7 9) 2
14 11 18 6 189 6
15 7 35 91
16 14 27 87 2.
17 15 2 4 2 175 4
18 9 40 2 127 4
r9 7 28 5 174- 2
20 6 2 2 156 3
21 7 10 167 2
22 10 114
23" 18 27 185 19
24' 53 2 8 93 2
25 33 16 3 171 17
26 11 19 6 In 2
27 79 1: 28 3 336 7 ---
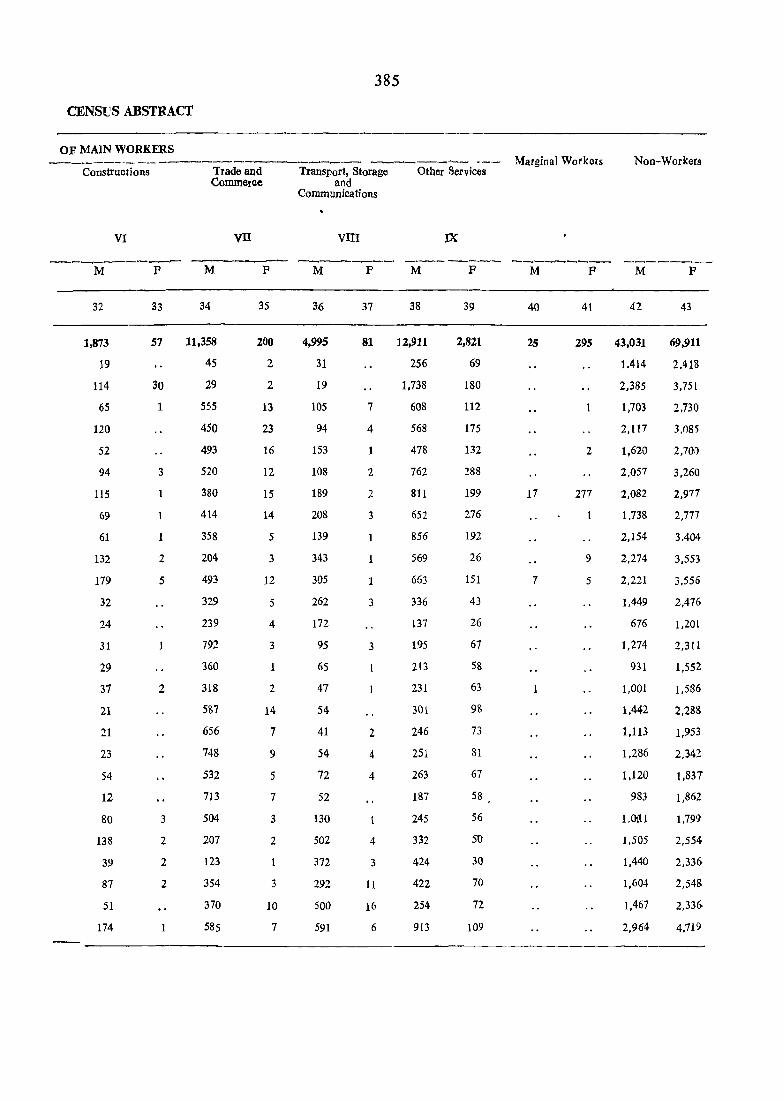
385
CENSVS ABSTRACT
OF MAIN WORKERS _......-_.-~_,_.d ___ ___ .---________________ , ___ -_. ___ _,,__
Construotions
VI
---.-.--_..-_ _....,-M F
32
1,873
19
114
65
120
52
94
115
69
61
132
179
32
24
31
29
37
21
21
23
S4
12
80
138
39
87
51
174
33
57
30
1
3
1
2
5
2
3
2
2
2
Trade and Commerce
VII
M F
34
11,358
4S
29
555
450
493
520
380
414
358
204
493
329
239
792
360
318
587
656
748
532
713
504
207
123
354
370
585
35
200
2
2
13
23
16
12
15
14
5
3
12
5
4
3
2
14
7
9
5
7
3
2
3
10
7
Transport, Storage and
Communications
vm
M F
36
4,995
31
19
105
94
153
108
189
208
139
343
305
262
172
95
65
47
54
41
54
72
52
130
502
372
292
500
591
37
81
7
4
2
2
3
3
3
2
4
4
4
3
11
16
6
Other Services
M F
38
12,911
256
1,738
608
568
478
762
811
652
856
569
663
336
137
195
213
231
301
246
251
263
187
245
332
424
422
254
913
39
2,821
69
180
112
175
132
288
199
276
192
26
151
43
26
67
58
63
98
73
81
67
58
56
50
30
70
72
109
Marginal Workers Non-Workers
M F M F
40 41 42 43
2S
17
7
295 43,031
2
277
9
5
1.414
2,385
1,703
2,117
1,620
2,057
2,082
1,738
2,154
2,274
2.221
1.449
676
1,274
931
1.001
1,442
1,113
1,286
1,120
983
1.0'.11
1.505
1,440
1,604
1.467
2.964
69,911
2.418
3,751
2.730
3,085
2,70,)
3,260
2,977
2,777
3.404
3,553
3.556
2,476
1,20l
2,311
1,552
1.586
2,288
1.953
2.342
1.837
1,862
1.799
2.554
2.336
2,548
2,336-
4.719

Location Name of Townl Code Ward No.
IV. Bhucho Mandi (M.e.) Ward-l
2
3
4
5
6
7
8
9
10
l1
V. Kot Fatta (M.e.)
1
2
3
4
5
6
7
8
9
VI. Sangat (M.e.)
Ward-l
2
3
4
5
6
7
8
9
Area of Town/Ward in Sq. Kms.
386
No. of No. of Occupied HouseRe'siden'-. holds tial Houses
3 4
Total Population (including .. Institutional and Houscless P.opulatiOli)
p M R
, 8
2'20 ~ i,ch; 1,686 '10,006 5,266
1,016
242
566
529
518
250
344
412
393
641
355
4,m 918
212
495
480
444
214
316
389
358
562
352.
'J
0.39
1'24
344
67
164
182
161
65
90
127
113
204
114
982
98
136
116
109
147
78
76
142
80
462
50
45
66
51
76
67
38
32
37
345 1,934
72
176
183
167
65
90
131
139
204
114
983
98
137
116
109
147
78
76
142
80
471
54
45
66
51
76
71
38
32
38
454
1.061
1.009
962
464
660
801
751
1.203
707
5,611
531
778
651
642
704
502
438
871
494
2.731
280
298
375
290
476
382
206
186
238
2,972
277
415
348
337
379
264
237
450
265
1;415
152
149
202
155
239
197
110
84
127
2,639
254
363.
303
30,S
32~
238
201
421,
229
1,316
128
149
173
135
237
185
96
102
111
URBAN PRIMARY
Total POPtllation'in the age group 0-6
p_
1,'193
319
51
203
185
206
73
103
137
153
245
118
921
77
148
120
120
110 . 83
63
129
71
467
51
53
64
54
95
67
24
23
36
M
to
9Si 17)
30
112
96
l12
37
46
65
85
121
68
486
36
81
60
65
56
46
36
69
37
227
2S
32
31
30
39
28
14
9
19
F
II
H42
140
21
91
89
94
36
57
72
68
124
50
435
41
67
60
55
S4
37
27
6
34
240
26
21
33
24
56
39
10
14
17

CENSL'S ABSTRACT
Scheduled Castes
-----------M P
12
94
280
244
.293
9
,197
263
349
3
1.09~
42
58
223
293
.375
92
C'
12
17
9
68
135
13
22
13
88
256
218
247
8
174
241
321
6
954
45
48
185
259
320
84
8
.5
273
9
17
8
81
128
16
14
Scheduled Tribes
14 15
387
Literates
l\l, F
16
30,53
687
197
199
274
276
191
284
247
151
274
273
1.309
191
198
103
135
116
103
116
192
155
824
110
91
143
117
141
67
53
43
59
17
1.984
482
137
117
161
155
138
207
137
96
105
249
784
123
102
68
70
57
7l
68
140
85
547
63
87
83
89
100
30
27
38
30
-INDUSTRIAL CATEGORY OF MAIN WORKERS
1ot~1 ,Main Workers
(I-IX)
M P
18
2,705,
517
135
265
163
24~
142
201
225
204
319
191
1.674
156
241
219
184
197
129
128
265
155
80~
91
83
98
88
125
123
61
57
75
19
232
29
Il
18
15
38
6
3
15
67
16
14
43
7
8
8
2
6
3
4
41
7
10
5
6
9
Cultivators
I
M P
20
153
40
25
31
11
5
35
4
677
57
25
73
54
17
70
83
195
103
194
7
2
4
2
11
30
39
49
50
21
10
(j
2
1
Agrictrltutaf' Labourers
II
----M P
22
206
5
121
27
15
23
425 I'
3
38
112
84
119
37
8
12
12
~~o
5
22
7l
13
17
23
2
18
2
6
16
8
2
4

388
URBAN PRIMARY
INDUSfRIAL CATEG_QRY Location Name of Town/ Code Ward Livestock. Forestry. Mining and Manufacturing. Manufacturing. No. Fishing. Hunting QUarrying Processing. Servic- PlOcessing, Servia-
and Plantations jng. and Repairs in ing and Repairs in Orchards & allied Household Industry other tha!1. House-activities hold Industry
III IV V (a) V (b)
---~------- -- ------- ------_-- -- ... ---M P M II M P M II
----_ 2 24 25 26 27 2g 29 30 31
IV. Bhucho Mandi (Nt.C.) 21 1 1 48 6 361 7
Ward-l 7 I:! 86
2 :! i3
3 5 11
4 5 5 3 30
5 4 32
6 9 14
7 28
8 4 7 39
9 1 6 20 5
10 2 52
11 1 36
V. Kot Fatta (M.C.) 31 84 3 51
Ward-l 4 17 10
2 3 23 2 17
3 7 5 ..;
4 10 4
5 14 19
6 .) 5
7 2 2
8 3 5
9 2 3
VI. Sangat (M.C.) 7 57 7 54
Ward-l 3 17
2 13 4 3
3 ') 18
4 9
5 24
6 5 ., 3
7 3
8
9

389
CENSL'S ABSTRACT
-------OF MAIN WORKERS
---------------------.-------------_._-_._------- Marginal Workers Non-Workers Constructions Trade and Transport, Storage Other Serv ices
Commerce and Communications
VI VII VIII IX
------------ ------!....--- --------- ____ R __ • ___ _- -----_- -------_ M F M F M F M F M F M F
32 33 34 3S 36 37 38 39 40 41 42 43
96 1,067 21 220 3 532 156 2,561 4,508
9 216 1 42 100 27 499 889
88 5 25 11 107 201
52 50 15 301 477
28 43 1 29 65 to 266 465
29 39 29 84 13 275 406
108 2 8 5 lOS 208
158 2 13 2 143 313
7 88 4 26 34 8 187 374
6 34 34 103 53 189 291
9 130 12 45 23 2 322 546
7 HI 2 5 27 10 164 338
64 115 65 162 22 46 1.298 2,550
3 29 17 16 7 121 247
10 55 9 61 5 174 355
2 5 3 8 129 302
6 23 46 153 251
10 2 15 182 323
7 7 2 135 232
4 6 11 11 109 198
10 6 17 16 3 185 417
19 11 5 3 110 225
4 1 258 13 1 84 32 614 1,275
51 2 10 6 61 121
1 48 ;; 12 6 66 139
41 3 18 '4 104 168
66 11 5 67 129
3 47 <-I 12 d 114 228
0 74 185
3 3 1 49 9i
6 27 101
1 6 52 110
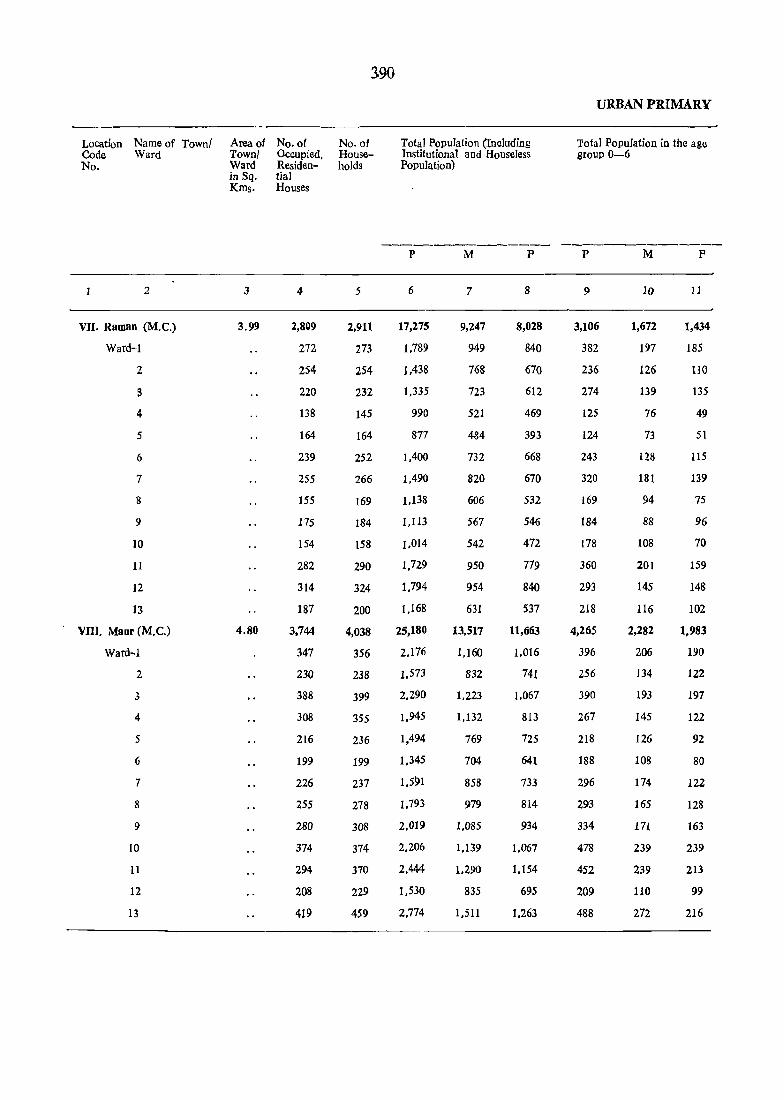
Location Name of Townl <3ode VVard No.
2
vn. Raman (M.e.)
Ward-l
z S
4
5
6
7
8
9
10
11
12
13
vm. Maur (M.e.) VVard~l
2
3
4
5
6
7
8
9
10
11
12
13
Area of Town! Ward in Sq. Kms.
3
3.99
4.80
No. of Occupied, Residential Houses
4
2,809
272
254
220
138
164
239
255
155
175
154
282
314
187
3,744
347
230
388
308
216
199
226
255
280
374
294
208
419
3.90
No. of Households
5
2,911
273
254
232
145
164
252
266
169
184
158
290
324
200
4,038
356
238
399
355
236
199
237
278
308
374
370
229
459
Total Population (Including Institutional and Hous-eless Population)
p
6
17,275
1.789
1.438
1,335
990
877
1.400
1.490
1.138
1.113
1.014
1.729
1.794
1.168
25,180
2.176
1.573
2.290
1.945
1,494
1.345
1.591
1.793
2.019
2.206
2,444
1.530
2.774
M
7
9,247
949
768
723
521
484
732
820
606
567
542
950
954
631
13,517
1.160
832
1,223
1,132
769
704
858
979
1.085
1.139
1.290
835
1.511
p
8
8,028
840
670
612
469
393
668
670
532
546
472
779
840
537
11,663
1.016
741
1.067
813
725
641
733
814
934
1.067
1.154
695
1.263
URBAN PRIMARY
Total Population in the age group 0-6
p
9
3,106
382
236
274
125
124
243
320
169
184
178
360
293
218
4,265
396
256
390
267
218
188
296
293
334
478
452
209
488
M
10
1,672
197
126
139
76
73
128
181
94
88
108
201
145
116
2,282
206
134
193
145
126
108
174
165
171
239
239
110
272
p
11
1,434
185
110
135
49
51
115
139
75
96
70
159
148
102
1,983
190
122
197
122
92
80
122
128
163
239
213
99
216

CENSUS ABSTRACT
Scheduled Castes Scheduled Tribes Literates
391
1NDUS'tRIAL CATEGORY OF MAIN WORKERS
Total Main Workers Cultivators
(I-IX) I
Agricultural Labourers
II
----,_ ... _-- -- ---------- --------- ----_--_-- -------- -----_--M
12
2,610
735
18
474
56
97
288
3
30
2
429
119
359
796
61
286
52
.5
229
493
450
622
806
141
155
F
13
2,246
648
11
419
36
87
242
3
40
4
366
87
303
3,515
698
68
267
36
11
177
386
378
583
701
115
95
M p
14 15
M
16
4,837
364
580
284
354
370
451
278
470
415
399
353
441
78
6,152
313
320
352
684
567
554
439
345
396
425
473
555
729
F
17
3,181
131
408
92
368
248
320
159
346
328
312
191
248
30
4,059
129
160
173
408
476
429
310
269
279
213
316
440
457
M
18
5,180
494
421
393
271
273
387
460
346
331
280
520
566
438
7,256
625
495
667
688
411
372
424
551
580
546
644
447
806
p
19
340
10
30
57
8
23
12
30
16
12
15
76
51
357
19
12
28
22
21
14
28
12
48
71
33
43
M
20
632
10
22
26
3
6
20
10
22
4
13
51
267
178
1,547
168
365
310
29
8
2
19
222
321
25
4
2
72
F
21
4
3
3
3
M
22
604
14
1
214
8
15
101
250
1~O~9
308
47
129
90
40
281
55
16
114
9
F
23
6
25
70
15
2
2
22
2
21

392
lJ RBAN PRiM: AR Y
INDUSTRIAL CATEGORY OF Location Name of Town/ ---...-.---,,__----------------------------~---Code Ward Livestock. Forestry. Mining and Manufacturing, Manuf acturing. No. Fishing. Hunting ~uarrying Processing. Servicing, Processing Servic-
and Plantations, and Repairs in ing and Repairs Orchards & allied Household 1ndustry in houSehold activities 1ndustry
Il1 IV V(a) V(b)
----.......... ----- -_-_---- ---------- -_ .. _------M P M P M F M F
1 2 24 25 26 27 28 29 30 31
VII. Raman (M.C.) 68 18 51 13 85) 20
Ward-l 2 J 5 217
2 76
3 5 64
4 H
5 2 63 3
6 26 4 3 2 93
7 5 2 73 13
8 4 41
9 1 55
10 3 20
11 13 8 58
12 14 13 16 2 64- 1
13 2
VIII. Maur(M.C.) 89 1 1 166· 10 891 33
Ward-l 6 3 38
2 4 9 12
3 17 5 llS 3
4 3 .j. 2Q1
5 6 5 39 3
6 17 3 40
7 5 2 29
8 4 3 7
9 13 8
10 4 52 3 49
11 2 55 III 19
12 5 1 36
13 20 1 10 203 6

OF MAIN WORKERS
Constrtlctions
VI
l'rade and Commarce
VII
393
Transporf, Storage and
Communications
VIJ]
Other Services Marginal Workers Non Workers
IX
___ -------- ____ ~ __ __,_ ~ ___ ___.._____ _~ ____ - ___ _________ _ .. __ r _ ___ _
r
M
32
112
15
9
15
2
15
11
5
6
27
7
9
11
8
18
2.
40
52
15
3
42
33
7
5
16
5
M
34
1,757
91
235
117
200
133
117
61
215
203
210
149
21
5
1;S70
21
6
17
211
301
251
215
6
44
120
177
240
261
P
35
49
3
1
3
38
6
2
4
30
7
3
4
M
36
313
21
20
47
2
17
39
43
20
24
5
44
31
377
20
17
i7 17
10
6
48
31
105
41
9
5l
F
37
8
3
4
2
2
M
38
784
116
57
117
29
49
74
42
44
31
23
155
45
2
1,000
44
26
45
122
41
48
48
21
68
113
135
151
13il
P
39
189
3
27
51
8
17
4
4
13
12
14
29
7
164
4
4
27
12
18
8
3
5
12
18
29
24
M
40
7
13
I)
2
F
41
18
6
2
19
12
4
M P
42 43
4,060 7,660
455
343
3~9
250
::'11
345
35,9
260
236
262
430
387
193
83)
6H
553
461
370
655
639
516
534
457
703
770
537
6,2~8 11,294
337
55\)
4-U
358
33.!
42.~
42.0
5'13
593
646
383
705
997
741
1.051
7S5
703
620
711
730
922
1,019
1,077
662
1.210

Localion Code No.
Name of Town/ Wlird
2
IX Mansa (MC.)
Ward-I
2
3
4
5
6
7
8
9
10
11
12
13
14
15
16
17
-.
Area of Town! Ward in Sq. Km~.
3
20.00
No. of Occupied Residt:ntial Houses
4
!).O87
745
1.0n
460
540
530
686
593
350
476
518
fi7I
358
353
392
380
547
457
-
~94
No. of Households
Total Population (including Institutional and Houseless Population)
--------~------P M F
5 (I 7 8
9,420 53,089 29,401 25,688
784 4.079 2.261 1.818
1.039 5.212 2.789 2.423
461 2.869 1.513 1.356
546 3.128 1630 1.498
531 3.061 1.602 1.479
743 4.246 2.241 2,005
619 3.780 2,054 1.726
361 2,219 1.201 1.018
487 2.862 1.490 1,372
555 3,228 1,733 1,495
702 4.148 2.236 1.912
378 2,437 1.253 1,184
362 2.352 1.236 1,116
392 2.606 1.372 1.234
404 2.453 1.325 1,128
550 3.343 1.788 1.555
500 3,046 1.677 1,369
URBAN PRIMARY
Tolal Population in the age group (0-6)
-----------_ P M F
9 10 11
9,266 5,131 4,115
827 459 368
841 471 370
4&3 276 207
512 286 226
533 293 240
793 448 345
665 369 296
394 21<1 1<18
430 233 197
467 257 210
640 345 295
371 192 179
357 213 144
395 235 160
424 247 177
601 328 273
543 283 260

- 395
(::ENSUSABSTRACT
INDUSTRIAL CATBGORY OF MAIN WORKERS Sch.dulod Castes Scheduled l'ribes Literates -----_.
10tal Main Workers Cultivatms Agricultural Labourers
(I-IX) II
---_. __ ---_._ --~-..,----- -------~--
-_._.-_-_-- ------- ---------M F M F M P M P M P M F
12 13 14 IS 16 17 18 19 20 21 22 23
8,311 5,308 17,132 11,870 15,359 999 1,013 61 1,704 152
1,239 1,012 789 390 1,185 112 176 53 91 3
460 425 1.790 1.157 1.432 113 56 1 28
314 257 1,00S 722 766 30 18 1 34
38 44 1,177 918 812 70 18 2
40 36 1.125 852 804 49 7 34
796 672 1.092 725 1.152 68 69 120
521 483 988 597 1.112 53 28 1 429 3
153 127 857 594 623 46 11 23
25 21 1.166 878 774 57 10 ,59
39 31 1.254 940 973 S8 17 32
72 67 1.373 950 1.259 SO 65 1 98 3
5 4 881 681 688 27 6
16 16 881 672 671 12 32 25
131 102 975 749 686 16 19 '36
376 318 519 337 707 19 255 2 132
1.029 850 527 326 878 ; 176 163 2 399 140
1,057 843 733 382 837 43 63 162
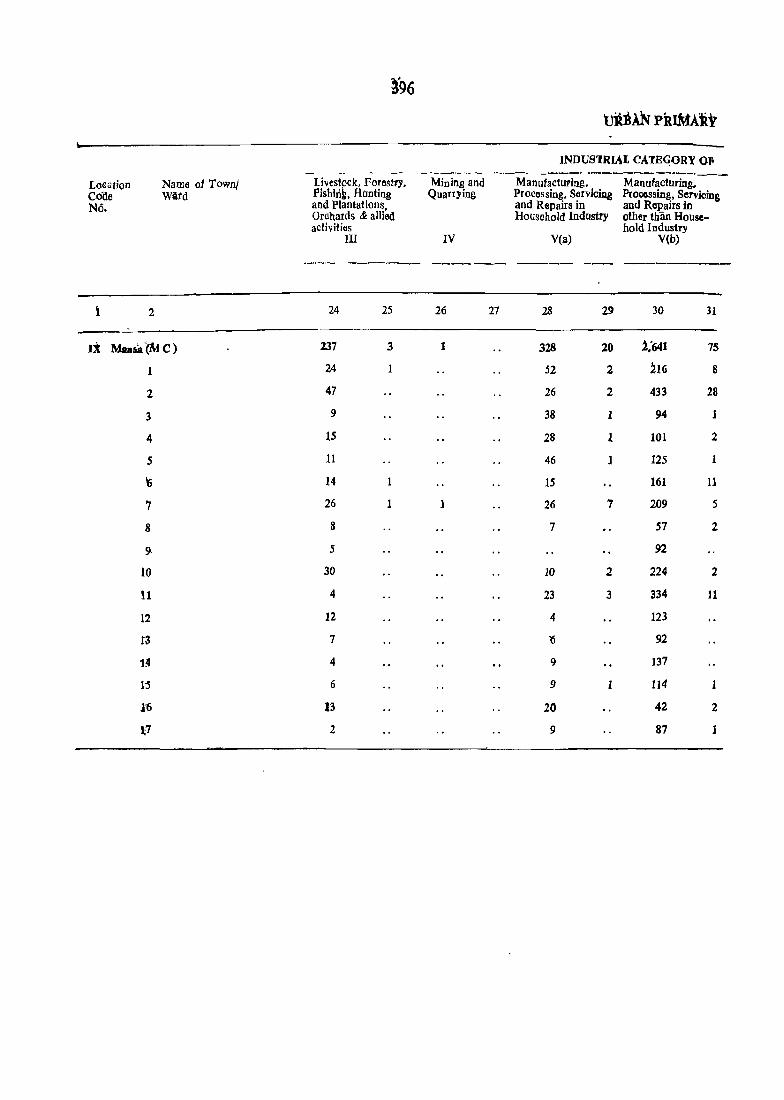
~96
'UitBAN piUMARY
INDUSTRIAL CATEqORY OF -_._--- _..- ........ - ... _----------_--
Loaation Name of Townj livestock, Forestry, Mining and Manufacturing, Manufacturing. Colle Wiitd Pishlri~, Honting Quarrying Processing, ServiciIIg Procossing, Servicing N6. and Plantations, and Repairs in and Repairs In
Orahards & allied Household Industry other than House-activities hold Industry
1II IV V(a) V(b)
--- ~----- ------ -----~ ---------
i 2 24 25 26 27 28 29 30 31
d Mansit (M C ) 237 3 1 328 20 1:641 75
1 24 52 2 i16 8
2 47 26 2 433 28
3 9 38 1 94 1
4 15 28 1 101 2
5 11 46 1 125
~ 14 1 15 161 11
7 26 1 1 26 7 209 .5
8 8 7 57 2
9- .5 92
10 30 10 2 224 2
H 4 23 3 334 11
12 12 4 123
13 7 '(I 92
1A 4 9 137
15 6 9 1 114
1'6 13 20 42 2
~7 2 9 87 1

3.9.7
CENS{)S ABSTRACT
OF MAiN WORKERS --------------_-_---...__,----..-_---------
Constr uctions Trade and Transport, Storage & Othel Services Marginal Workers Non-Workers Commerce Communications
VI VIl VlII IX
----_-_-----.-- -------- ------_-- ----...._.----- --------- ---------M F M P M F M F M F M F
32 33 34 35 36 37 38 39 40 41 42 43
584 20 5,096 40 1805 3 2,670 623 46 139 13,996 24,350
45 184 12 97 300 33 1,075 1,706
113 (j 269 5 172 288 71 16 101 1,341 2,209
54 340 2 50 129 24 2 7 745 1,319
22 2 390 4 24 2 212 59 818 1.428
44 322 45 170 47 798 1,4&0
102 2 192 6 219 .. 260 47 1.089 1.987
23 156 1 63 151 35 ,
942 1,673
33 309 47 128 43 578 972
11 443 5 7 147 52 25 691 1,315
30 401 1 74 155 52 760 1,437
5 516 1 8S 129 31 979 1,861
6 458 11 68 27 565 1.157
5 431 21 52 11 565 1.084
4 361 19 97 16 686 1.318
25 72 42 52 14 2 30 616 1,079
32 10 34 62 113 22 910 1.379
30 218 2 47 219 39 840 1,326
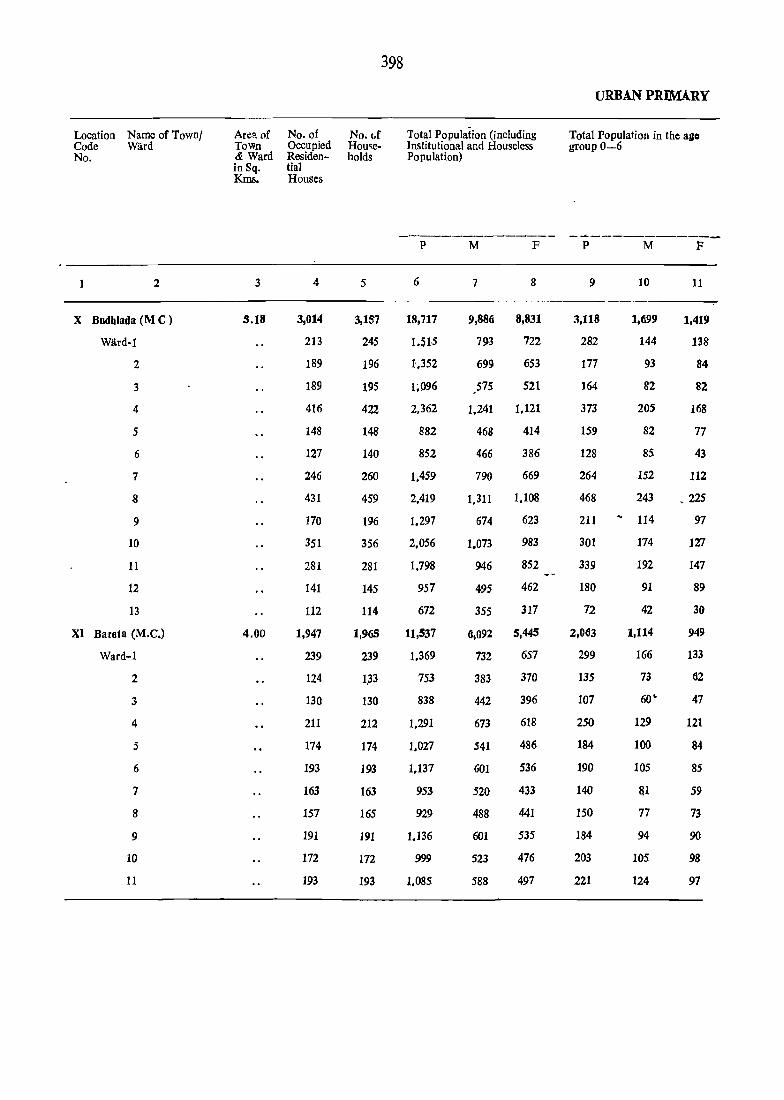
Location Name of Town/ Code Ward No.
2
X Budhlada (M C )
Ward-l
2
3
4
5
6
7
8
9
10
11
12
13
Xl Bareta (M.C.)
Ward-1
2
3
4
5
6
7
8
9
10
11
Are~ of Town & Ward in Sq. Kms.
3
5.18
4.00
No. of Occupied Residential Houses
4
3,014
213
189
189
416
148
127
246
431
170
351
281
141
112
1,947
239
124
130
211
174
193
163
157
191
172
193
398
No. lor Hou~e· holds
Total Population (including Jnstitutional and Houseless Population)
URBAN PRIMARY
Total Population in the aiel group 0-6
--------~------ -~------------
5
3,157
245
196
195
422
148
140
260
459
196
356
281
145
114
1,965
239
1,33
130
212
174
193
163
165
191
172
193
p
6
18,717
1.51$
1,.352
1~096
2.362
882
852
1.459
2.419
1.297
2,056
1,798
957
672
11,537
1.369
753
838
1,291
1,027
1,137
953
929
1,136
999
1,085
M F
7 8
9,886 8,831
793 722
699 653
,575 521
1.241 1,121
468 414
466 386
790 669
1.311 1.108
674 623
1.073 983
946 852
495 462
355 317
6,092 5,445
732 657
383
442
673
541
601
520
488
601
523
588
370
396
618
486
536
433
441
535
476
497
p M
9 10
3,118 1,699
282 144
177 93
164 82
373 205
159 82
128 85
264 152
468 243
211 .. 114
301 174
339 192
180 91
72 42
2,063
299
135
107
250
184
190
140
150
184
203
221
1,114
166
73
129
100
105
~l
77
94
105
124
F
11
1,419
138
84
82
168
17
43
112
.225
97
127
147
89
30
949
133
62
47
121
84
85
59
73
90
98
97
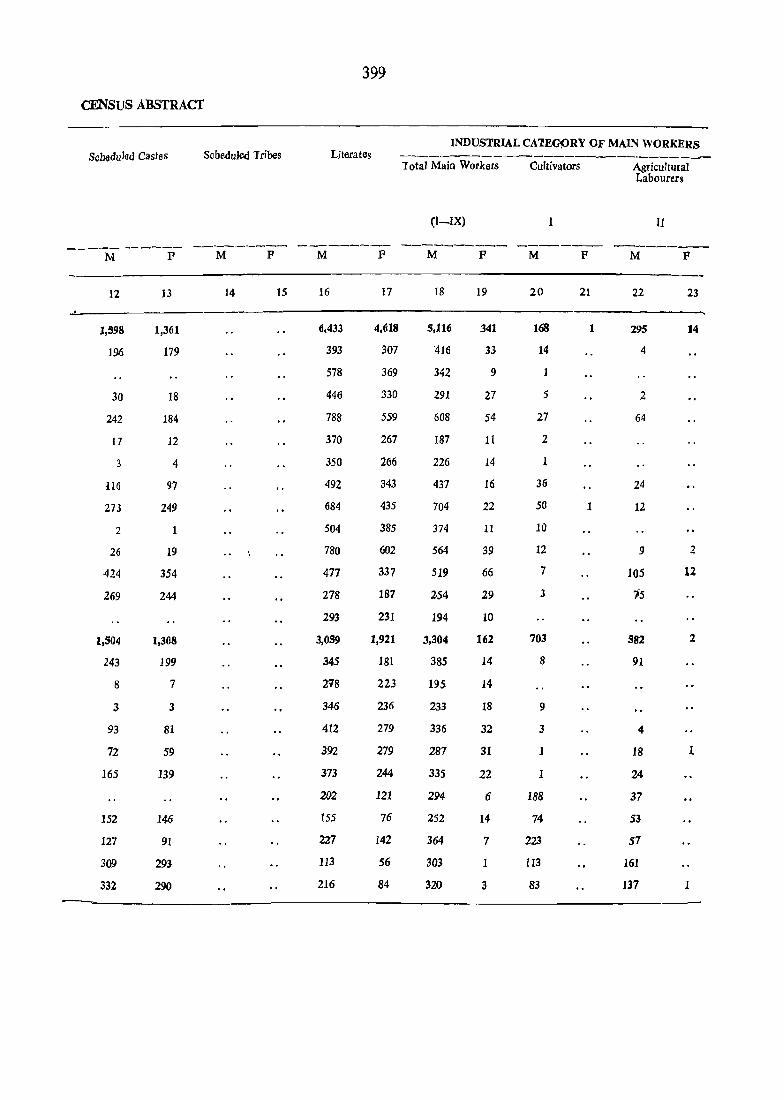
399
CENSUS ABSTRACT
INDUSTRIAL CA'1!EGPRY OF MAIN WORKERS Scheduled Tribes Scbadul6d Castos Literates ------------------------------Iotal Mail] Workers Cultivators Agricultural
Labourers
(I-IX) 1 11
---~-- ------ -------- ---,------ ---_----- ------- --------M P M P M F M P M P M F
12 13 14 15 16 17 18 19 20 21 22 23
1,598 1,361 6,433 4,618 5,116 341 168 1 295 14
196 179 393 307 '4H1 33 14 4
578 369 342 9 1
30 18 446 330 291 27 5 2
242 184 788 559 608 54 27 64
17 12 370 267 187 11 2
3 4 350 266 226 14 1
:116 97 492 343 437 16 36 24
273 249 684 435 704 22 50 1 12
2 1 504 385 374 11 10
26 19 780 602 564 39 12 9 2
424 354 477 337 519 66 7 105 12
269 244 278 187 ~54 29 3 15
293 231 194 10
1,504 1,308 3,OS9 1,921 3,304 1(i2 703 382 2
243 199 345 181 385 14 8 91
8 7 218 223 195 14
3 3 346 236 233 18 9
93 81 412 279 336 32 3 4
72 59 392 279 287 31 1 18 1
165 139 373 244 335 22 1 24
202 121 294 6 188 37
152 146 155 76 252 14 74 53
127 91 227 142 364 7 223 57
309 293 113 56 303 113 161
332 290 216 84 320 3 83 137 1

400
URBAN PRIMARY
INDUSTRIAL CA1RGORY --------~-- --_.------. ...... -.._,-----_ ....... - _,--_- .. __
Locatioq. Name of Town! Livestock, Forestry. . Mining and Manufaoturing, Manufacturing --Code Ward Pishing, H~nting Quarrying Plocessing .. S~rviaing Processing, Ser~ioing No. and PlantationS, and R.epalrs In and Repairs in
Orchards & allied Household Indusnry other than House-activities hold Industry
III IV V(a) V(b)
--------- -------- .........__------ --------M P M P M p M P
1 2 24 25 26 27 28 29 30 31
X Budhlada (M.e,) 78 108 4 966 19
Ward-l 1 29 59
2 1 52
3 5 50
4 12 12 104
5 46
6 1 12 3 24
7 3 25 48.
8 47 10 286 J
9 1 79 2
10 3 9 76
11 8 4 1 89 9
12 29 2
13 24 2
XI Barela (M.e.) 47 3 213 17 281 1()<
1 10 3 79 32
2 2 10 2 9
3 3 5 1 28
4 2 39 13 41 1
5 37
6 S 6S 28
7 13 3 12 2
8 6 5 39 6
9 2 2 30 1
10 2 3
11 1 5 22

401
CENSUS ABSTRAcr
OF MAIN WORKERS . "'on~Workers ----~ ------ --_--.------, --. -. -- .- Marginal Workers
Constructions Trade and Transport, Storage Other Services Commerce &
Communications
VI VII VIII IX
---------- --~--~- --~--,-~- __,,--.------ ---.... -_--M F M F M F M r M F M F
32 33 34 35 36 37 38 39 40 41 42 43
140 1 2,195 27 3<16 4 800 271 3 44 4,;117 8,446
4 168 2 49 88 30 377 689
3 237 6 42 9 357 644
9 166 2 10 44 25 284 494
28 209 30 122 54 632 1.067
91 2 44 11 281 408
2 144 6 36 11 240 392
35 125 89 52 15 1 3 352 650
28 97 1 69 105 17 39 607 1,047
10 214 19 40 9 300 612
13 310 4 32 100 33 508 944
4 1 220 18 36 # 2 46 23 2 427 784
3 82 11 50 27 241 433
132 7 1 31 7 161 307
68 94S 12 10~ 361 118 S 2,788 5,278
12 84 15 54 ]0 347 643
2 ISO 21 11 188 356
162 3 23 17 209 378
16 158 1 11 62 17 4 337 582
2 185 1 7 36 29 254 455
3 140 4 12 57 18 266 514
7 10 5 19 4 226 427
14 20 4 21 20 4 236 426
2 13 7 28 5 237 528
6 4 2 12 1 220 475
4 19 20 29 2 268 494 --- -----


APPENDIX I
"DETAILS OF C.D. BLOCKS INCLUDED UNDER VARIOUS TAHSILS
AND TAHSlLWISE PRIMARY CENSUS ABSTRACT
403

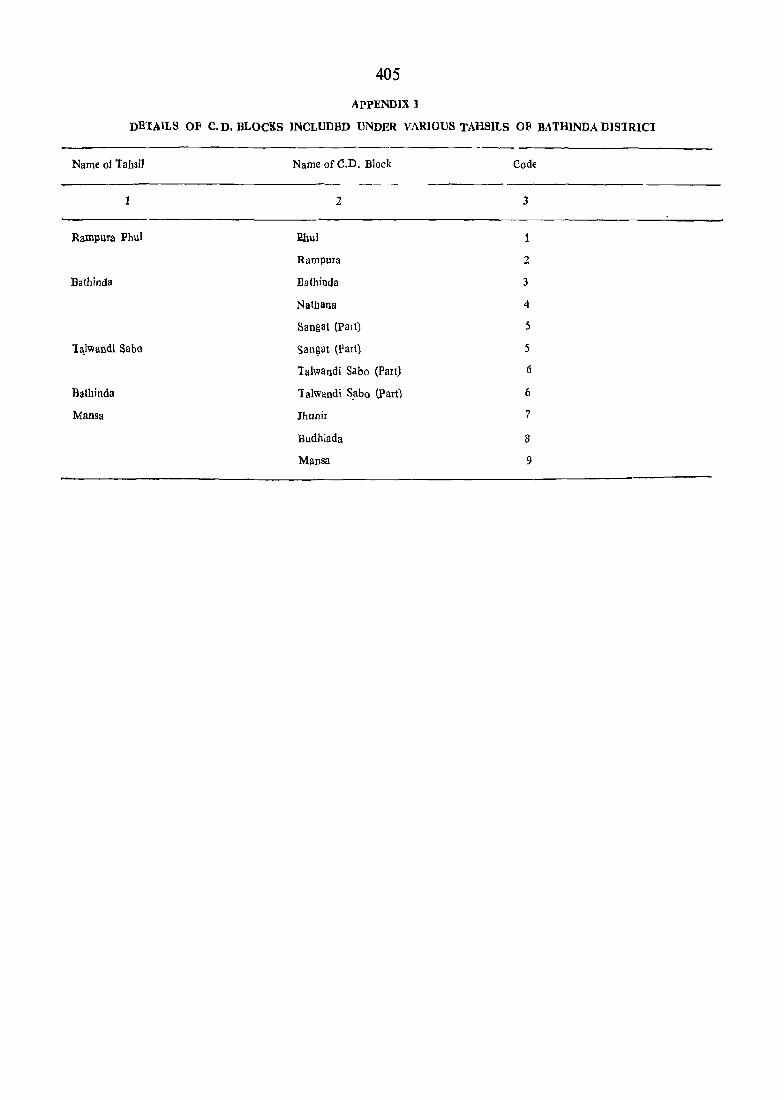
405
ApPENDIX 1
DEIAILS OF Co Do BLOCKS INCLUDBD UNDER VARIOUS TAHSILS OF BATHINDA mSlRICl
Name 01 Tahsil
1
Rampura Phul
Balhinda
la,lwandi Saba
Batbinda
Mansa
Name of C.D. Block
2
lUlu!
RampuIa
Eathinda
Nathana
Sang at (PaIt)
San~at (Part)
lalwandi Sabo (Part)
lalwandi S,!lbo (Part)
Jhunir
Budhlada
Mansa
Code
3
1
2
3
4
5
5
Ii
6
7
8
9

- -----Sr. No.
1
Districtl Tahsil! City/ Town
2
Total} Rural, Urhan
3
Area in km!.
4
~o. of Occupied Rresidential House~
5
406
No. of Households
6
P
7
Total Population (including Institutional and Houseless Population)
M F
8 9
DISTRICT PRIMARY
P
Total Population in the age group 0 -6
M F
10 11 12
11. Bathinda Dlslrlct T 5551 00 254,848 261,928 1,359,963 829,849 730,114 257,303 138,099 119,406
R 5397·64 194,913 199,069 1,208,837 (\42,390 566,240 198,693 106,074 92,619
Rampura Phu! Tahsil
u
1
.R
U
Rampura Phul (MC) U
153· 36 59,935
875·16
869·40
5.76
5.76
2 Bathinda labsil 1 1,51,8.45
38.510
32.761
5.749
5,749
86,035
R 1,408·82 52.450
U 109.63 33.585
Goniana (M.C.) U
Bathinda (M.C.) U
BhudlO Mandi U (M.e.)
Kot Palla (M.e,) {.;
Sanga! (M.e.) U
3 Talwandi Sabo r Tahsil
Raman
MauT
R
U
(M.e.) u
(M.e.) U
4 Mansa Tahsil T
R
U
Mansa (M.e.) U
BUdh!ada (M.C.) u Barela (M.e.) {.;
9.00 1,664
97.00 28,840
2.00 1,637
0.39 982
1.24 462
950.44 36,079
941.65 29,526
8.79
3.99
4.80
2,192'25
2,163,07
29'18
20.00
5.18
4.00
6,553
2,804
3,744
94,224
80,176
14,048
9,087
3,014
1.947
62,859 351,133 187,259 183,874
39,009 241.634 128,677 112,957
32.970 206,104 109,959 96,145
6,039 35,530 18,718 16,812
6,039 35,530 18.718 16,812
90.086 507,651 268,390 239,261
54.757 319,846 167,992 151,854
35,329 187,805 100.398 87,407
1,694 10,415 5,459 4.956
30,495 159,042 85.286 73.756
1,686 10,006 5,266 4,740
983 5,611 2,972 2,639
471 2,731 1,415 1.316
37.222 230,281 122.820 107,461
30,273 187,826 100,056 87,770
6.949 42,455 22,764 19,691
2.911 17,275 9.247 8,028
4,038 25,180 13,517 11,663
95,611 580,397 309,962 270,435
81.069 495,054 264,583 230,471
14,542 85.343 45 379 39,964
9,420
3,157
1.965
55,089 29,401
18.717 9,886
11.537 6,092
25,688
8,831
5.445
38,812
38,415
32,689
5,726
5,726
32,013 26,187
20.661 17.754
17.569 15,120
3,092 2,634
3.092 2,634
85,190 45,940 39,250
53,922 28.925 24.997
31.268 17,015 14.253
1,786 1.001 785
26.301 14,350 11,951
1,793 951 842
921 486 435
467 227 240
37.921 20,246 17,675
30,550 16,292 14,238
7.371
3,106
4.265
95,979
81,532
14,447
9.266
3,118
2,063
3,954 3,417
1.672 1.434
2,282 1.983
51.252 44,727
43.288 38,244
7,964 6,483
5.151 4,1l5
1.699 1.419
1,114 949

CENSt S ABSTRACT
--- ---- ---
Scheduled Castes Scheduled Tribes
_- - ---_._--p M F p M p
13 14 15 16 17 18
4S6,596 243,765 212,831
378,466 202,051 176,415
78,130 41,714 36,416
72,317 38,661 33656
64,371 34,406 29,966
7,945 4,255 3,690
7.945 4,255 3,690
147)123 78,596 69,227
107,495 57,256 50,239
40,328 21,340 18,988
2,169 1,145 1,024
32,266 17,088 15,178
3,291 1.732 1,559
2,049 I,C95 954
553 280 273
68.675 36,866 31.809
56,208 30.160 26,048
12,467 6,706 5,761
4,856 2,610 2.246
7,611 4,096 3,515
i67.781 89,642 78,139
150,391 80,229 70.162
17,390 9,413 7,977
11,619 6,311 5,308
2,959 1,598 1,361
2.812 1,504 1.308
407
Literates
INDUSTRIAL CATEGORY OF MAIN WORKERS -- ---- ... _--------
Total Mai 1 Workers (I-IX)
p M F --- --- --- - ----p M
19 20 21 22 23
S60,435 349676 210,759 485,986 46!!,552
367,879 236,177 131,702 382,774 369,183
192,556 113,499 79,057 103,212 96,369
86,578 53.182 33,396 75,847 72,821
67,682 42,220 25,462 65,284 62,863
18,896 10,962 7,934 10,563 9,958
18,8.96 10,962 7,934 10,563 9,958
219,910 1.32860 87,050 151.612 144.351
109,512 67,936 41.576 97.377 94,155
110,398 64.924 45,474 54,235 50,196
6,405 3,668 2.737 2,959 2,786
95,492 56,070 39,422 45,780 42,230
5,037 3,053 1,984 2,937 2,705
2,093 1.309 784 1.717 1,674
}.371 824 547 842 801
73.706 47,712 25,994 73,564 70,427
55,477 36.723 18,754 60,431 57.991
18.229 10,989 7.240 13.113 12,436
8,018 4,837 3,181 5.520 5,180
10,211 6.152 4.059 7.613 7,256
180.241 115.922 64,319 184.963 177.953
135,208 89.298 45 910 159,682 154,174
45,033 26.624 18,409 25.281 23.779
29,002 17,132 11.870 16,358 15.359
11,051 (1,433 4,(118 5,457 5,116
4,980 3,059 1,921 3,46(; 3,304
F
24
20,434
13,591
11,843
3,026
2,421
(lOS
605
7,261
3,222
4,039
173
3,550
232
43
4L
3,137
2,440
697
340
357
7,010
5,508
1.502
999
341
162
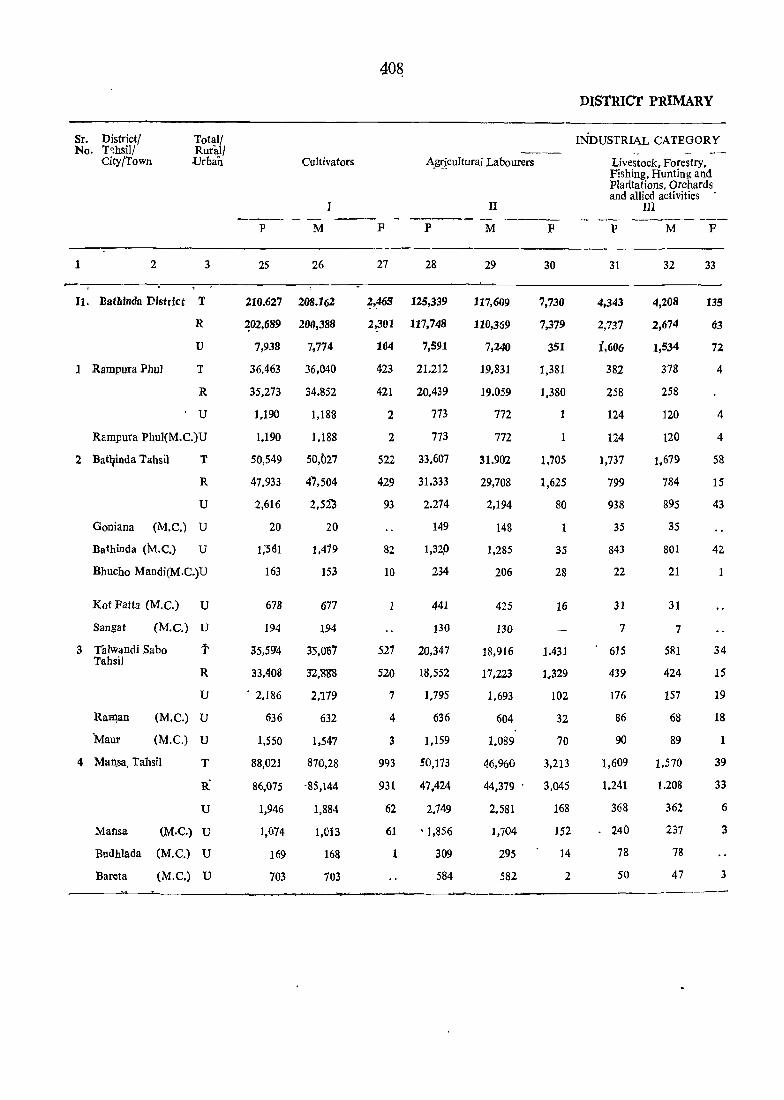
Sr. District/ No. T~hsil/
City/Town
Total/ Rural} Urban
1 2 3
II. Batltlnda District T
1 Rampura PhuJ
R
U
T
R
U
Rampura Phul(M.C.)U
2 Batqinda Tahsil T
R
U
Goniana (M.e.) U
Bathinda (M.e.) U
Bhucho Mandi(M.C.)U
Kot Fatta (M.e.) U
Sangat (M.C.) U
3 Titlwandi Sabo Tahsil
t
R
U
RaR1an
'Maur
(M.e.) U
(M.C.) U
4 Man,sa. Tahsil T
R u
Mansa (M.e.) u
Budhlada (M.e.) U
Bareta (M.C.) U
Cultivators
J
p M
25 26
210.627 208.162
~02,(j89 200,388
7,938 7,774
36,463
35,273
1,190
1.190
50,549
47,933
2,616
20
1.'561
163
678
194
35,59'4
33,408
. 2,186
636
1,550
36,040
34.852
1,188
1,188
50,027
47,504
2,51)
20
1,419
153
677
194
35,0157
32,'88'8
2.,179
632
1,547
88,021 870,28
86,075 -85,144
1,946
1,074
169
703
1,884
1,013
168
703
40~
Ag~jcultural Labourers
F P
27 28
~,46S 125,339
2,.301 117,748
164 7,591
423
421
2
2
522
429
93
82
10
1
21.212
20.439
773
773
33,607
31.333
2.274
149
1,321)
234
441
130
521 20,347
520
7
4
3
993
931
62
61
1
18,552
1,795
636
1.159
50,173
47,424
2.749
'1,856
309
584
II
M
29
117,609
110,359
7,240
19.831
19.059
772
772
31.902
29,708
2,194
148
1,285
206
425
130
18,916
17.223
1.693
604
1,089
F
30
7,730
7,379
351
1,381
1,380
1
1
1.705
1,625
80
1
35
28
16
1.431
1.329
102
32
70
46,960 3,213
44,379' 3,045
2,581
1,704
295
582
168
152
14
2
DIStRICT PRIMARY
INDUSTRIAL CATEGORY ..
Livestock. Forestry. Fishing. Hunting and Plarltations. Orchards and allied activities .
III
p M F
--------31
4,343
2,737
[,606
382
258
124
124
1,737
799
938
35
843
22
31
7
615
439
176
86
90
],609
1.241
368
240
78
50
32
4,208
2,674
1,534
378
258
120
120
1,679
784
895
35
801
21
31
7
581
424
157
68
89
1.570
1.208
362
237
78
47
33
135
63
72
4
4
4
58
15
43
42
1
34
15
19
18
1
39
33
6
3
3
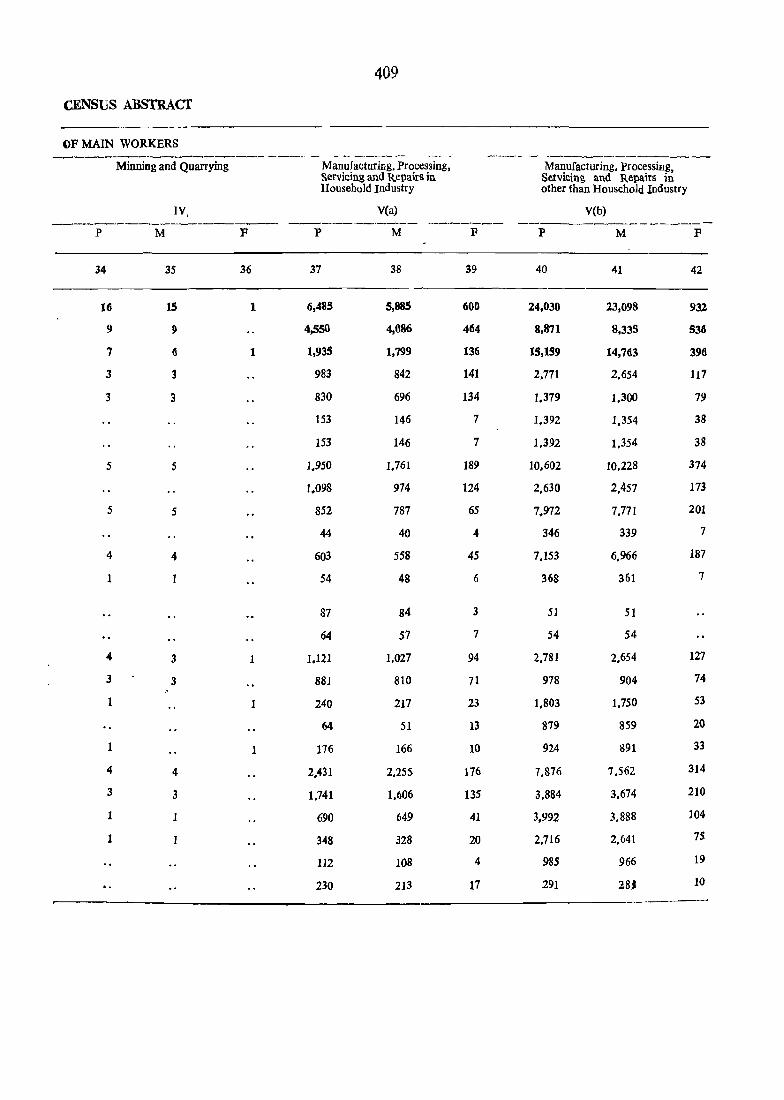
409
CENSUS ABSTRACT
OF MAIN WORKERS -------_ .. _---_---.---- -,--- - - ,_ -------__ -- _--_- - ---------------Minning and Quarrying Manufacturing. Processing, Manufacturing. Processing,
Servicing and Repairs in Servicing and Repairs in Household Industry other than Household Industry
IV, V(a) V(b) ------------------------ ------"---- -...----._.,._.. ------------------P M F P M F P M F
34 35 36 37 38 39 40 41 42
Hi 15 1 6,485 5,885 600 24,030 23,098 932
9 9 4,550 4,086 464 8,871 8,335 S31l
7 II 1 1,935 1,799 136 15,159 14,763 396
3 3 983 842 141 2.771 2,654 117
3 3 830 696 134 1.379 1.300 79
153 146 7 1,392 1,354 38
153 146 7 1,392 1.354 38
5 5 1,950 1.761 189 10,602 10,228 374
1.098 974 124 2,630 2,457 173
5 5 852 787 65 7.972 7,771 201
44 40 4 346 339 7
4 4 603 558 4S 7.153 6,966 187
1 54 48 6 368 361 7
87 84 3 51 51
64 57 7 54 54
4 3 1 1.121 1.027 94 2,781 2.654 127
3 3 881 810 71 978 904 74
1 1 240 217 23 1.803 1.750 53
64 51 13 879 859 20
1 1 176 166 10 924 891 33
4 4 2.431 2.255 176 7,876 7,562 314
3 3 1.741 1,606 135 3.884 3,674 210
1 690 649 41 3,992 3,888 104
1 348 328 20 2,716 2,641 7S
112 108 4 985 966 19
230 213 17 291 .l8) 10

Sr. District/T:lhsil/ Ne>. City/Town
1 2
11 Bathlnda District
Rampura Phu I Tabsil
Total/ Rural} Urban
3
T
R
U
T
R
U
Rampura Phul (Me) U
2 Bathinda Tahsil
Goniana (M.e.)
Bathinda (M.e.)
T
R
U
U
U
Bhucho Mandi (M.C.) U
Kot Patta (M.e.)
Sangat (M.e.)
3 l'alwandi Sabo Tahsil
Raman (M.e.)
Maur (M.e.)
4 Mansa Tahsil
Mansa
U
U
T
R
U
U
U
T
R
V
U
Budhlada (M.C.) U
Barela (M.e.) U
p
43
5,723
3,829
1.387
938
449
449
4.099
1.894
2.205
110
1.930
96
64
5
1.017
675
362
119
243
3.029
2.216
813
604
141
68
Constructions
VI
M
44
9,400
5,686
3,714
1.373
937
436
436
4.025
J.878'
2.147
110
1.873
96
64
4
1.012
673
339
112
227
2.990
2.198
792
584
140
68
..
410
Trade and Commerce
F P
45 46
1S2 41,202
37 11,453
11S 29,749
14
1
13
13
74
16 .58
5.209
1.884
3.325
3.325
16.551
2.175 c
14.376
1.356
57 11.558
1,088
116
258
5.250
1,511
3.733
1.806
1.927
14.192
5.877
8.315
5.136
2.222
9.57
VII
M
47
40,548
11,265
29.283
5.132
1.856
3.276
3.276
16.270
2.126
14.144
1.346
11.358
1.067
115
258
5.120
1.493
3.627
1.757
1,870
14,026
5.790
8.236
5.096
2.19.5
945
P
48
654
188
466
77
28
49
49
281
49
232
10
200
21
1
130
24
106
49
57
166
87
79
40
27
12
DISTRICT PRIMARY
INDUSTRIAL CATEGORY
Transport. Storage and Communications
VIII
P M
:49 50
12,784 12,645
4,23S
8,549
1.278
532
746
746
6,621
1.082
5.539
161
5.016
223
6.5
14
1.313
613
700
321
379
3,572
2,008
1.564
1,090
370
104
4,207
8,438
1,274
532
742
742
6.523
1.072
5,4.51.
158
4.995
220
65
13
1.295,
605
690
313
377
3.553
1.998
1.555
1.085
366
104
F
51
139
28
III
4
4
" 98
10
88
3
81
3
18
8
10
8
2
19
10
9
.5
4
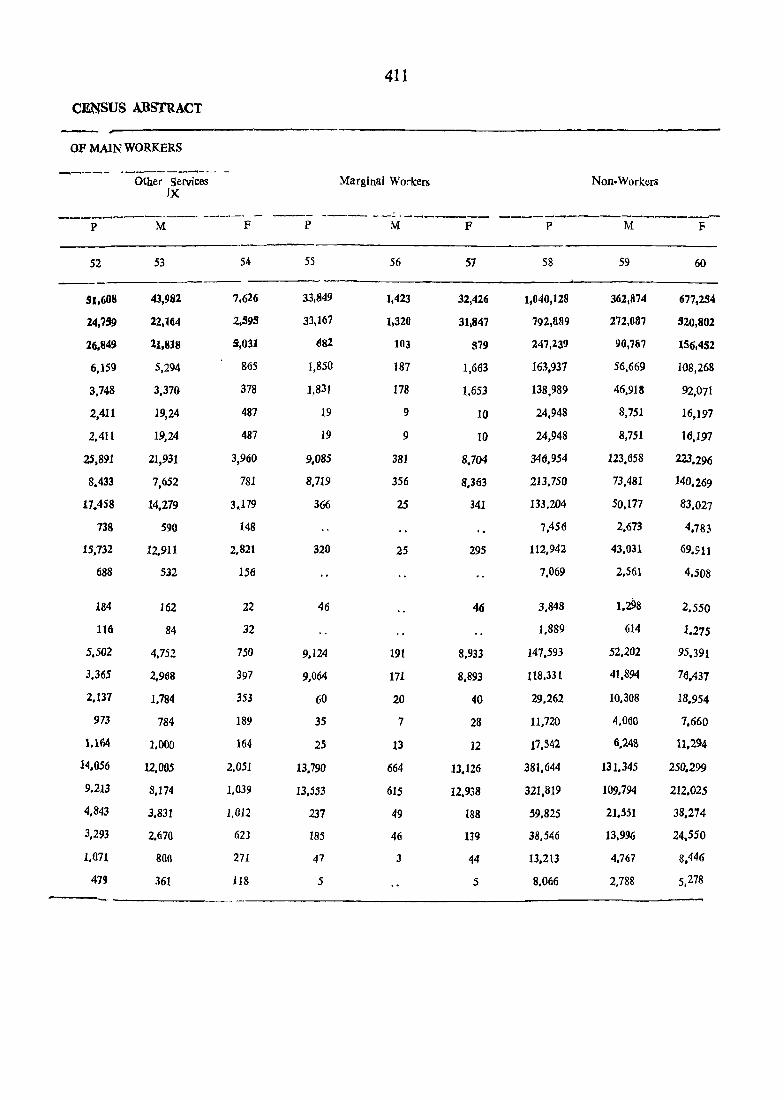
411
CENSUS ABSTRACT
OF MAIN WORKERS
----.-- .----_---_ -Other Services Marginal Workers Non.Workers
IX
-----.,...._---~--- ----~ - ----- --- ~ ----_..--._ _----------------_-p M F P M F P M F
52 53 54 55 56 57 58 59 60
SI,608 43,982 7,626 33,849 1,423 32,426 1,040,128 362,874 677,~4
24,7!9 22,164 2,595 33,167 1,320 31,847 792,889 272,087 520,802
26,84!} 21,818 5,031 d82 103 579 247,239 90,787 156,452
6,159 5,294 865 1,850 ]87 1,663 163,937 56,669 108,268
3,748 3,370 378 1,831 178 1,653 138,989 46,91S 92,071
2,411 19,24 487 19 9 10 24,948 8,751 16,197
2.411 19,24 487 19 9 to 24,948 8,751 16,197
25,891 21,931 3,960 9.085 381 8,704 346,954 123,658 223,296
8,433 7,652 781 8,719 356 8,363 213.750 73.481 140,269
17,458 14,279 3.,179 366 25 341 133,204 50.177 83.027
738 590 148 7,456 2.673 4,783
15,732 12.911 2,821 320 25 295 112.942 43.031 69,911
688 532 156 7,069 2.561 4,508
184 162 22 46 46 3.848 1.298 2,550
WI 84 32 1.889 614 1.275
5.502 4,752 750 9,124 191 8,933 147.593 52,202 95,391
3.365 2,968 397 9,064 171 8.893 118.33l 41,894 76,437
2,137 1,784 353 60 20 40 29,262 10,308 18,954
973 784 189 35 7 28 11.120 4,OeO 7.660
1.164 1.000 164 25 13 12 17.542 6,24& 11.294
14.056 12,005 2,051 13,790 664 13.126 381,644 131.345 250,299
9.213 8.174 1,039 13,553 615 12,938 321,819 109.794 212,025
4,843 3.831 1,012 237 49 188 59,825 21,S51 38,274
3.293 2,670 623 185 46 139 38,546 13,996 24,550
1.071 800 271 47 J 44 13.213 4.767 8.446
479 361 118 5 5 8,066 2,788 5,278


APpl2:~~DrX 11
ENU,\1ERATIO~ BLOCK ISJ ..lO..lAL POPULATION t\ ~D <5CHEDVL:ED CAS TE
POPULATION IN URBAN AR~S
413


415
URBAN PRIMARY CENSUS ABSTRACT
APPENDIX II
Total and Scheduled Caste Population Urban Blockwise
Location Name of Towo/Ward/ Total Population Scheduled Castes 'Code No. Urban Block
1 2 3 4
20/11/1 Rampura Phu) (M.C.) 35,530 7,945
Ward No.1 2,910 1,627
Block No. 1 616 165
2 557 78
3 872 699
4 865 685
Ward No.2 2,675 161
Block No. 5 702 11
6 564 26
7 598 19
8 811 105
Ward No.3 2,139 193
Block No. 9 817 2
10 775 161
11 547 30
Ward No.4 1,823 176
Block No. 12 905 104
13 918 72
Ward No.5 2,781 861
Block No. 14 705 51
15 609 39
16 626 319
17 841 45.2
Ward No.6 2,724 135
Block No. 18 932 '70
19 871
20 9.21 65
Ward No.7 2,149 127
Block No. 21 752 110
22 719 6
23 678 II
Ward No.8 1,626 11
Block No. 24 800 11
25 826

Location Code No.
1
20/11/I
416
URBAN PRIMARY CENSfJS t\BSTR t\CT
t\PPE -JDfX II
Total and Scheduled Caste Population Urban Blockwise
Name of Town/Ward/ Urban Block
T L •• l Pc 10~
2 3 - --
Rampura Phul (M.C.)-Concld.
Ward No.9 2,249
Block No. 26 878
27 640
28 731
Ward No. 10 1,637
Block No. 29 810
30 827
Ward No. 11 1,792
Block No. 31 463
32 651
33 678
Ward No. 12 2,756
Block No. 34 868
35 839
36 1,049
Ward No. 13 3,162
Block No. 37 982
38 827
39 699
40 654
Ward No. 14 510
Block No. 41 510
Ward No. 15 4,597
Block No. 42 477
43 1,020
44 748
45 700
46 891
47 761 --- - -
S' _\::Ul Ie. Castes
4
159
155
4
427
270
157
265
10
255
2,042
772
744
526
1,641
829
266·
59
487
54
54
66
lZ
1
28
25

417
URBAN PRI1\1ARY CENSU~ ABSTRACT APPENDIX II
Total and Scheduled Caste Population Urban Blockwise
¥>J!ti9!1 Na]De pf T.own/Wardl Total Population Scheduled Castes C eNo. Urban block
1 2 3 4
2Ujl1/n (;oiiiana eM. c. j 10,415 2,169
Ward No.1 1,406 986
Block No. 1 165 487
2 641 499
Ward No. 2 749 269
BlockN'6: 3 419 86
4 330 183
Ward No.3 680 48
Block No. 5 680 48
Ward No.4 Block~a.
886 145 6 886 145
Ward No. 5 731 8
Blook Nd. 7 j78 2
8 353 6
Ward No.6 1,014 52
Block Nfl. 9 516 7
10 498 45
Ward No. 7 Mi8 12
Block No. 11 422
12 246 12
Ward No. 8 714
Block No. 13 390
14 324
Ward No.9 1,117 51
Block No. IS 691 .. 14
i6 426 37
Ward No. 10 1,334 94
Block No. 17 276 9
18 255 23
19 419 29
20 384 33
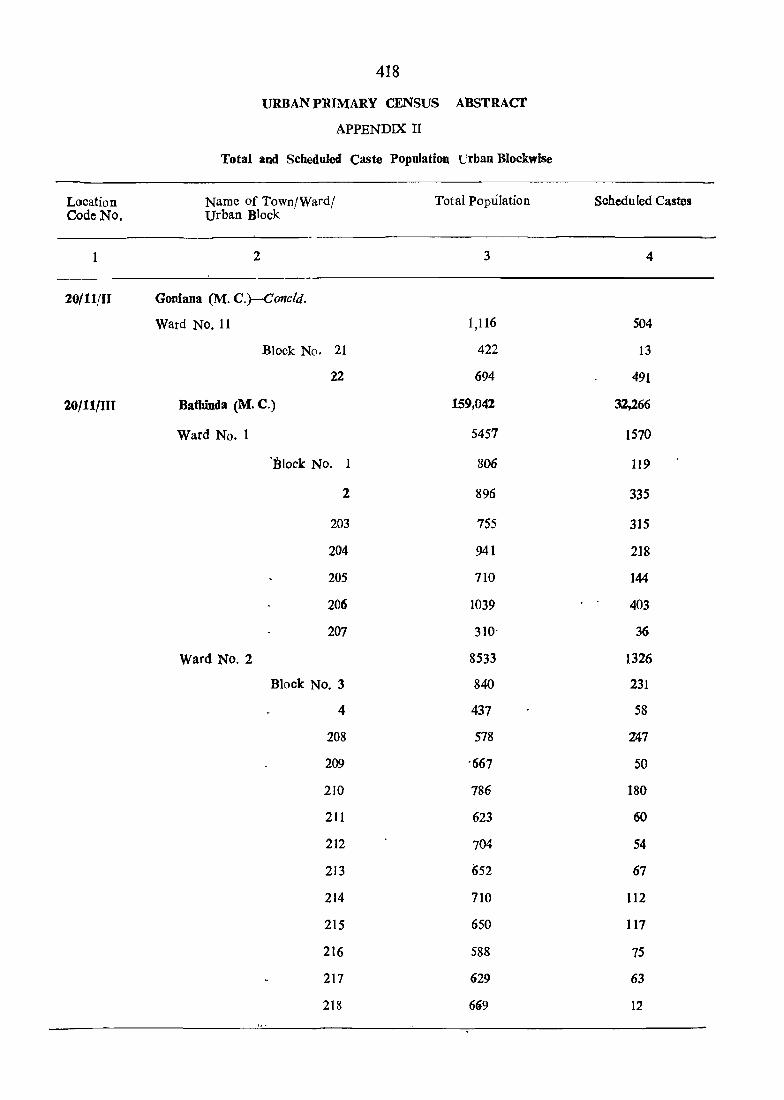
418
URBAN PRIMARY CENSUS ABSTRACf
APPENDIX II
Total and Scheduled Caste Population urban Blockwise
Location Name of Town/Ward/ Total Population Scheduled Castes Code No. Urban Block
2 3 4
20/H/II Goniana (M. C.)-Concld.
Ward No. 11 1,116 504
Block No. 21 422 13
22 694 491
20/11/III Bathinda (M. C.) 159,042 32,266
Ward No.1 5457 1570
'Block No. 806 119
2 896 335
203 755 315
204 941 218
205 710 )44
206 1039 403
207 310' 36
Ward No.2 8533 1326
Block No.3 840 231
4 437 58
208 578 247
209 '667 50
210 786 180
211 623 60
212 704 54
213 652 67
214 710 112
215 650 117
216 588 75
217 629 63
218 669 12

419
URBAN PRIMARY CENSUS ABSTRAcr
APPENDIX I~
Total and Scheduled Caste Population Urban Blockwise
Location Name of Town/Ward/ Total Population Scheduled Castes Code No. Urban Block
1 2 3 4
20/11/m Bathinda (M. C.)-Contd.
Ward No.3 6222 174
Block N". 5 946 65
6 790 21
7 744 71
8 502
9 608 17
10 778
11 735 12 637
13 482
Ward No.4 7077 ]058
Block. No. 14 639 70 15 813 457
16 746
17 866 177 18 927 191
19 772 16
20 680 7S
21 760
22 874 6
Ward No. S .6,094 1.559
Block-No. 23 782 217
24 860 258
25 778 453
26 700 468
27 392 60
28 802 63
29 942 8
30 838 32
Ward No.6 7,534 352
Block No. 31 636 17
32 /682 . 21
33 655 47
34 818 15
35 572 .8
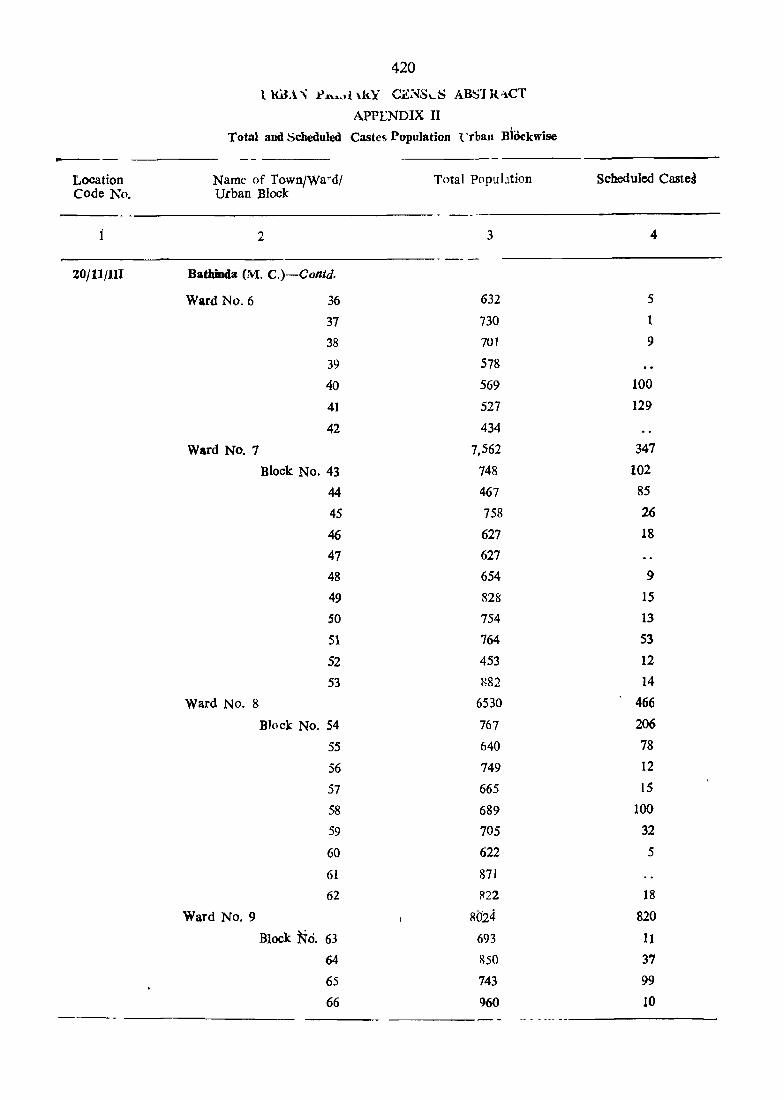
420
l lti.U. ~ _l:)J. ..... ,,1 \kY CE:~Sd; ABSl R ",-CT
APPENDIX II
Total and Scheduled Caste., Population 1. 'tban Biockwise
Location Name of TownjWa,od/ Total popubtion Scheduled Castes Code No. Urban Block
2 3 4
~ ~~ ---20jll/lll Bathioda (M. C.)-Conld.
Ward No.6 36 632 5
37 730 1
38 701 9
39 578
40 569 100
4] 527 129
42 434
Ward NO.7 7,562 347
Block No. 43 748 102
44 467 85
45 758 26
46 627 18
47 627
48 654 9
49 828 15
50 754 13
51 764 53
52 453 12
53 882 14
Ward No.8 6530 466
Block No. 54 767 206
55 640 78
56 749 12
57 665 15
58 689 100
59 705 32
60 622 5
61 871
62 ~22 18
Ward No.9 8024 820
Block No. 63 693 II
64 850 37
65 743 99
66 960 10 ---- ~~ ~ ~ --- --
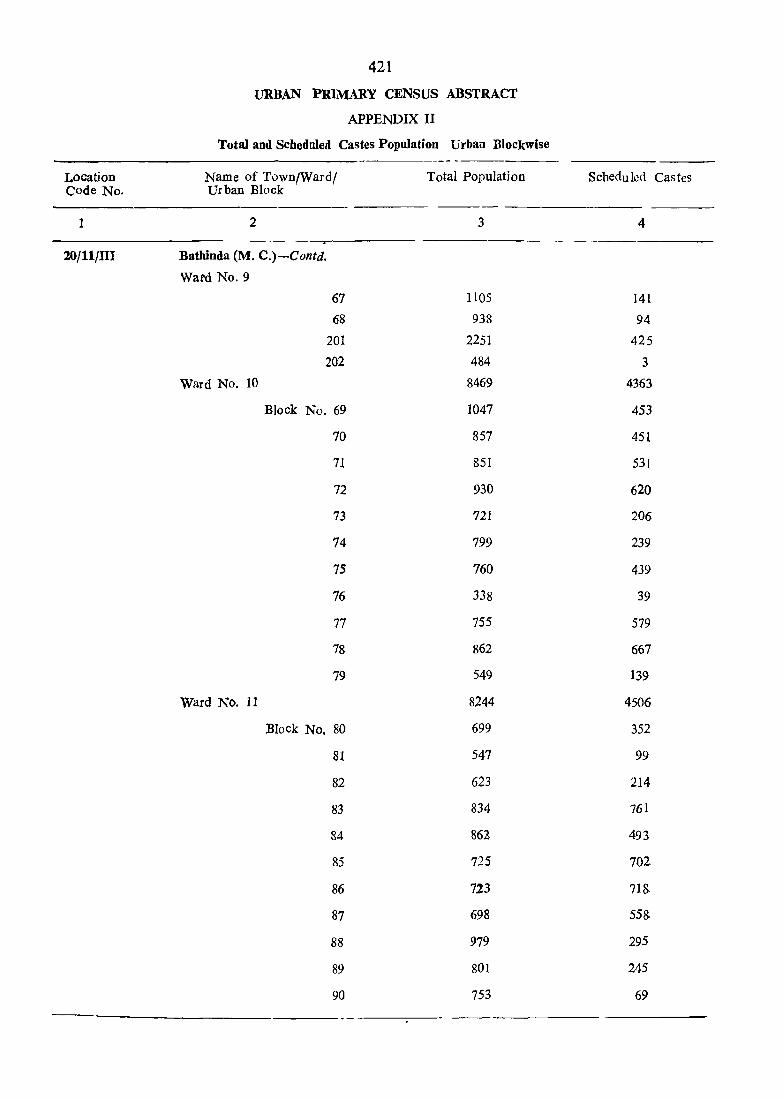
421
VRBAN PRIMARY CENSUS ABSTRACT
APPENDIX II
Total and Scheduled Castes Population Urban Blockwise
Location Name of Town/Ward/ Total Population Scheduled Castes Code No. Urban Block
1 2 3 4
lO/l1/ITI Bathinda (M. C.}-Contd.
Ward No.9
67 1l0S 141
68 938 94
201 2251 425
202 484 3
Ward No. 10 8469 4363
Block No. 69 1047 453
70 857 451
71 851 531
72 930 620
73 721 206
74 799 239
75 760 439
76 338 39
77 755 579
78 862 667
79 549 139
Ward No. II 8244 4506
Block No. 80 699 352
81 547 99
82 623 214
83 834 761
84 862 493
85 725 702
86 723 718
87 698 55g.
88 979 295
89 801 245
90 753 69

422
t RBAN PRIM.1RY CENSUS ABSTRACf
A.PPENDIX II
Total and ScheduIell Castes Population Urban Blockwfse
Location Name of Town/Wardr Total Population Scheduled Castes Code No. Urban Block
1 2 3 4
20/11/ll Bathinda (M. C.)-Contd.
Ward No. 12 5386 3516
Block No. 91 900 453
92 643 275
93 492 300
94 722 317
95 1395 1181
96 325 454
97 332 536
Ward No. 13 2591 1257
BloCk No. 98 847 549
99 918 602
100 826 106
Ward No. 14 5034 441
Blo~k No. 101 806 3
102 757
103 808 15,
104 701
105 461 56
106 833 170
107 668 197
Ward No. 15 3449 404
Block No. 108 640 J09
109 605
110 912 104
111 679 191
112 613

423
URBAN PRIMARY CENSUS ABSTRACT
APPENDIX II
Total and SJ!heduJed Castes Population Urban Blockwise
Location Name of Town/Ward/ Total population Scheduled Castes Code No. Urban Block
1 2 3 4
20fllfIII Bathinda (M. C.)-Contd.
Ward No~ 16 3469 480
Block No. 113 988
114 718 9
115 .842 182
116 921 289
Ward No. 17 5059 74
Block No. 117 \ 942 26
118 1018 5
119 683 28
120 478
121 1043
122 895 15
Ward No. 18 4318 2
Block No. 123 1032
124 749
125 890
126 707
127 940 2
Ward No. 19 5059 241
Block No. 128 638
129 406
130 602
131 579 6
132 604 23
133 420 4
134 834
135 413 7
136 563 201

424 URBAN PRIMARY CENSUS ABSTRACT
APPENDIX II
Total and Scheduled Castes Population Urban Blockwise --- ----- --- - --
Location Name of TownJWard/ Total Population Scheduled castes Code No. Urban Block
----I 2 3 4
~OfU/m Batbinda (M. C.}-Contd.
Ward No. 20 4133 1057
Block No. 137 520
138 558
139 639 179
140 624 379
141 537 349
142 520 150
143 735
Ward No. 21 4085 19
Block No. 144 363 5
145 498
146 498
147 517
148 679
149 704 14
150 826
Ward No. 22 4032 616
Block No. 151 635 290
152 895 399
153 784 2T
154 764
155 954
Ward No. 23 5621 2056
BlocK No. 156 649 95
157 603 210
158 646 335
159 563 135
160 520 266
161 801 111
162 978 620
163 861 284 -~---
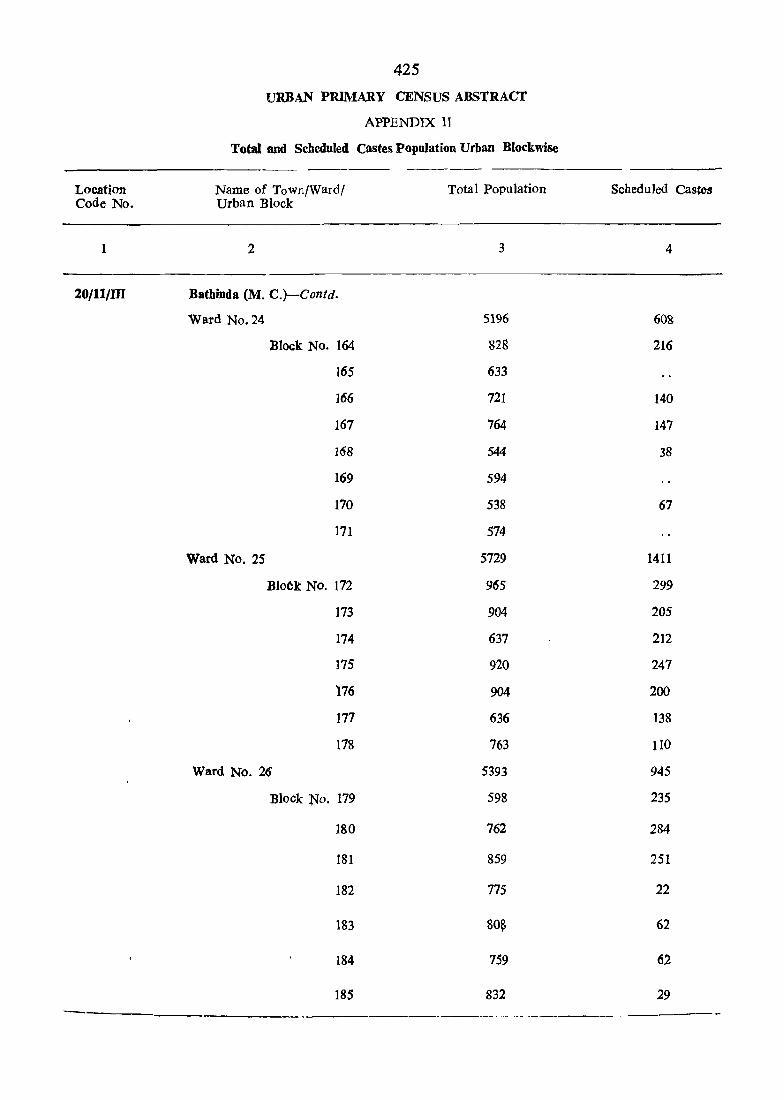
425
URBAN PRIMARY CENSUS ABStRACT
APPENDIX II
Total and Scheduled Castes Population Urban Blockwise
----Location Name of Town/Ward/ Total Population Scheduled Castes Code No. Urban Block
1 2 3 4
20/11jID Batbinds (M. C.)-Contd.
Ward No. 24 5196 60S
Block No. 164 82S 216
165 633
166 721 140
167 764 147
168 544 38
169 594
170 538 67
171 574
Ward No. 25 5729 1411
BloOk No. 172 965 299
173 904 205
174- 637 212
175 920 247
176 904 200
177 636 138
178 763 IlO
Ward No. 26 5393 945
Block No. 179 598 235
180 762 284
181 859 251
182 775 22
183 80~ 62
184 759 62
185 832 29
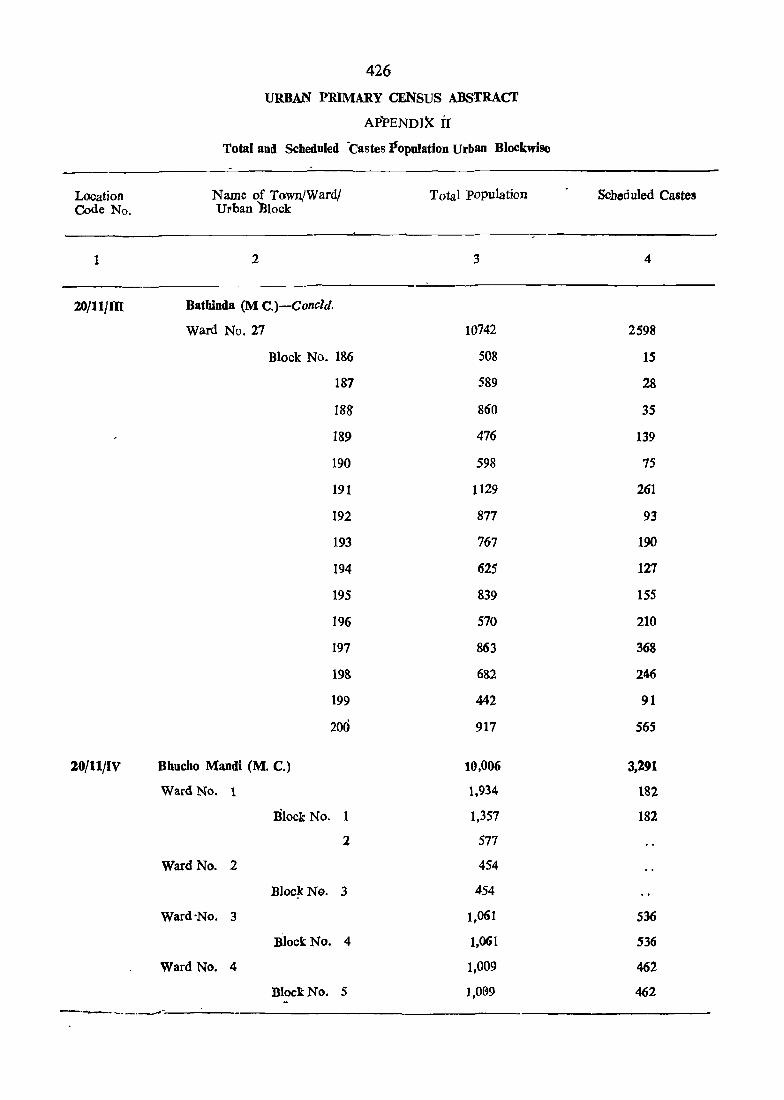
Location Code No.
1
2Ojll/m
20/H/IV
426
URBAN PRIMARY CENSUS ABSTRACT
APPENDIX ir Total and Scheduled ·Castes I'opulatioD Urban Blockwise
Name of Town/Ward/ Urban Block
2
Bathinda (M C.)-Concld.
Ward No. 27
Block No. 186
187
188
189
190
191
192
193
194
195
196
197
198
199
200
Bhucho Mandi (M. C.)
Ward No. 1
Block No. 1
2
Ward No. 2
Bloclc No. 3
Ward-No. 3
Block No. 4
Ward No. 4
Block No. 5 -
Total Population
10742
508
589
860
476
598
1129
877
767
625
839
570
863
682
442
917
10,006
1,934
1,357
577
454
454
1,061
1,061
1,009
1,069
Scheduled Castes
4
2598
15
28
35
139
75
261
93
190
127
IS5
210
368
246
91
565
3,291
182
182
536
536
462
462
-._-.. _._ .. _---._-------------- ----------

425
URBAN PRIMARY CENSUS ABSTRACT
APPENDIX II
Total and Scheduled Castes Population Urban Blockwise
LocatiO'b Name of Town/Ward/ Total Population Schedul~d Castes Code No. Urban Block
1 2 3 4
20/11/nl Bathinda (M. C.)-Contd.
Ward No. 24 5196 608
Block No. 164 828 216
165 633
166 721 140
Hi7 764 147
168 544 38
169 594
170 538 67
171 574
Ward No, 25 5729 1411
. . Blot:k No. 172 965 299
173 904 205
174 637 212
175 920 247
176 904 200
177 636 138
178 763 110
Ward No. 26 5393 945
Block No. 179 598 235
180 762 284
181 859 251
182 775 22
183 808 62
184 759 62
185 832 29

Location Code No.
1
20/11/m
20Lll/IV
426
URBAN PRIMARY CENSuS ABSTRACT
APPENDIX II
Total and Scheduled "Castes Population urban BJockwise
Name of Town/Ward/ Urban Block
2
Bathinda (M C.)-Conc/d.
Ward No,27
Block No. 186
187
188
189
190
191
192
193
194
195
196
197
198
199
200
Bbucho Mandi (M. C.)
Ward No. 1
Block No.
2
Ward No. 2
Block No. 3
Ward No. 3
Block No. 4
Ward No. 4
Bloci:No. 5 ~
,
Total Population
3
10742
508
589
860
4'76
598
1129
877
767
625
839 .
570
863
682
442
917
10,006
1,934
1,357
577
454
454
1,061
1,061
1,009
1,099
Sched uled Castes
4
2598
IS
28
35
139
75
261
93
190
127
ISS
210
368
246
91
565
3.291
182
182
536
536
462
462
--.-.-.--:.-_---------=-----------___._--~----------
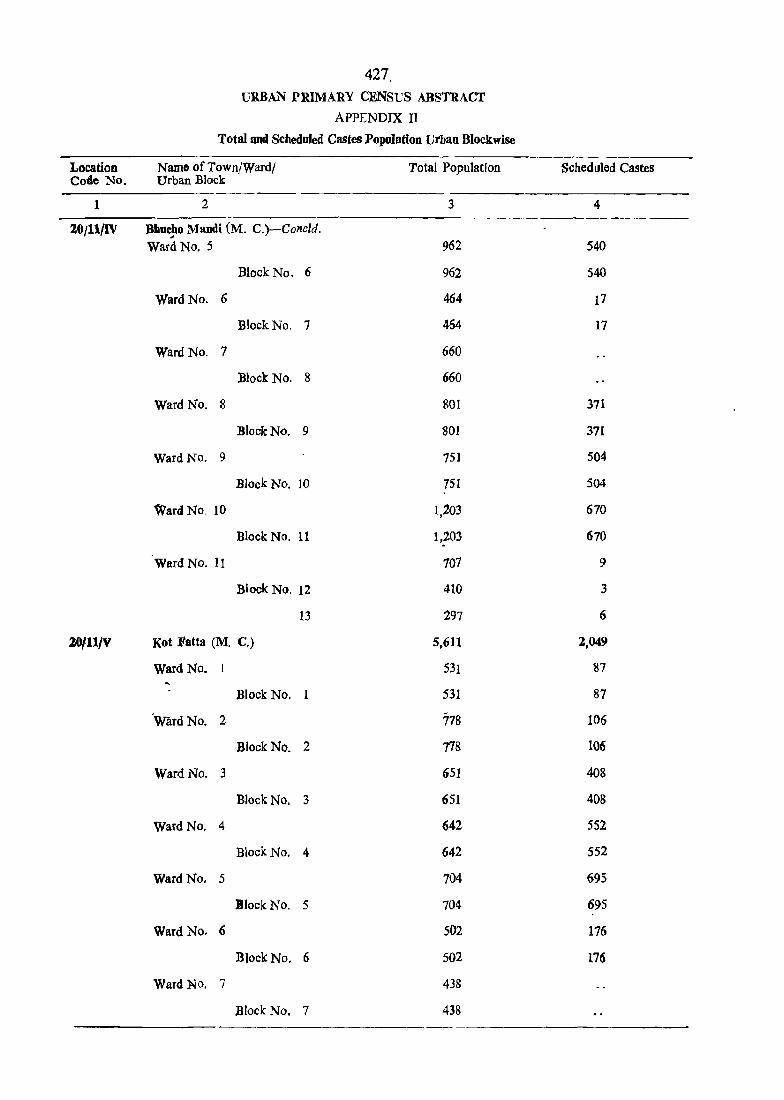
427, URBAN PRIMARY CENSl:S ABSTRACT
APPENDIX II
Total and Scheduled Castes Population urban Blockwise
LocatiOD Name of Town/Ward/ Total Population Scheduled Castes Code ~o. Urban Block
1 2 3 4 -
Ze/ll/lV Bhucho Mandi (M. C.)-Concld. J
Ward No.5 962 540
Block No. 6 962 540
Ward No. 6 464 17
Block No. 7 464 17
Ward No. 7 660
Block No. 8 660
Ward No. g 801 371
Block No. 9 801 371
Ward No. 9 751 504
Block No. 10 751 504
WardNo 10 1,203 670
Block No. 11 1,203 670
Ward No. 11 107 9
Block No. 12 410 3
13 297 6
'lOll1/V Kot Fatta (M. C.) 5,611 2,049
Ward No. 1 531 87
Block No. 1 531 87
'Ward No. 2 778 106
Block No. 2 778 106
Ward No. 3 651 408
Block No. 3 651 408
Ward No. 4 642 552
Block No. 4 642 552
Ward No. 5 104 695
Block No. 5 704 695
Ward No. 6 502 176
Block No. 6 502 176
Ward No. 7 438
Block No. 7 438

428 .,.. URBAN PRIMARY CENSUS ABSTRACT
APPENDIX II
Tatai and SCheduJe(I Castes Popuration Urban BJoc.kwise
Location Name of Town/Wardj Total Population ~!!~uled ~kstes_ Code No. Urban BIllCk
1 2 3 4
f],OjllJV Bhucho Mandi (M. c.)-Cone/d.
Ward No.8 871 14
BloekNo. 8 871 14
Ward No. 9 494 11
Block No. 9 494 11
f],O,l1/VI Sangat M. C. 2.731 ~~3
\VardNo. 1 280 4 ~
Block No. 1 280 4
Ward No. 2 298 21
Block No. 2 298 21
\VardNo. 3 375 34
Block No. 3 375 3!1
Ward No. 4 290 17
Block No. 4 290 17
Ward No. 5 476 14? Block No. 5 476 149
Ward No. 6 382 263
Block No. 6 382 243 Ward No. 7 206 29
Block No . . 7 206 29
Ward No. 8 186
Block No. 8 1&6
Ward No. 9 238 36
Block No. 9 238 3~
20/11jVII Raman (M. C.) 17,275 4,856
Ward No. t 1,789 1,383
Block No. 1 547 342
2 508 5Q8
3 734. 533

429 URBAN PRIMARY CENSrf' ~B"'tRACT
APPENDIX n Total and Scheduled Castes Population Urban Blockwise
---Location Name of Town/Ward/ Total Population Scheduled Castes Code No. Urban Block
------ ----I 2 3 4
lO/l1/VII Raman (M. C.)-C ontd.
Ward No. l 1,438 29
Block No. 4 794 ]6
S 644 13
watd No. 3 1.355 893
Block No. 6 709 574
7 626 319
Ward No. 4 990
Block No. 8 615
9 375
Ward No. S 877 92
Block No 10 315 31
11 562 61
Ward No. (; 1,400 184
Block No. 12 713 103
13 687 81
Ward No. 7 1,490 530
Block No. 14 429 135
15 493 235
16 568 160
Ward No. 8 1,138 6
Block No. 17 429 6
18 709
Ward No. 9 1,113 70
Block No 19 563 8
20 550 62
Ward No, 10 1,014 6
BJockNo.21 447 6
22 567

430
URBAN PRIMARY CENSUS 1\BSTRACT
APPENDIX II
total and Scheduled Castes Population Urbad BlocKwise
Location Name of Town/Wardj Total Population Scheduled Cllstes CodoNo. Urban Block
1 2 3 4
20/11/VlI Raman (M. C.)-Concld. Ward No. 11 1,729 795
BloekNo. 23 805 689
24 ' 477 106
25 477
Ward No, 12 1,794 206
Block No. ~6 537 35
27 466 20
28 791 151
Ward No. 13 J., 168' 662
Bl9ck No. 29 542 50
30 626 612
20jlljVIU Maur (M.e.) 25,~80 7,611
Ward No.1 2176 1,494
Block No; 'I 639 437
2 . 748 345
.3 789. 712
Ward No.2 1,573 129
Block No.4 808 111
5 765 18
Ward No.3 2,290 553
Block No.6 647
7 705 471
8 938 82
Ward No.4 1,945 88
Block No. 9 817 71
10 365 17
it 331
12 '432
Ward No.5 13 1,494 16
Block No. 14 494
15 490
510 16 ---

431
URBAN PRIMARY CENSCS ABSTRACT
APPENDIX If
TotlJ]. anti Scfteduled Castes Population Lrban Blockwise
----Location Name of Town/Ward! Total Population Scheduled Castes Codo No. Urban Block
1 2 3 4
20/11/Vm Maur lM. C.)-Concld.
Ward No.6 1,345
Block No. 16 779
17 276
18 290
Ward No.7 1,591 406
Block No. 19 470 29
20 582
21 539 377
Ward No.8 1,793 879
Block No. 22 949 506
23 844 373
Ward No.9 2,019 828
Block No. 24 980 330
25 1,039 498
Ward No. 10 2,206 1,205
Block No. 26 869 482
27 694 373
2g 643 350
Ward No. 11 2,444 1,507
Block No. 29 1,011 271
30 824 759
'31 609 477
Ward No. 12 1,530 256
Block No. 32 527 174
33 207
34 796 82
Ward No. 13 2,774 250
Block No. 35 385 62
36 665 28
37 807' 84
38 335
39 582 76
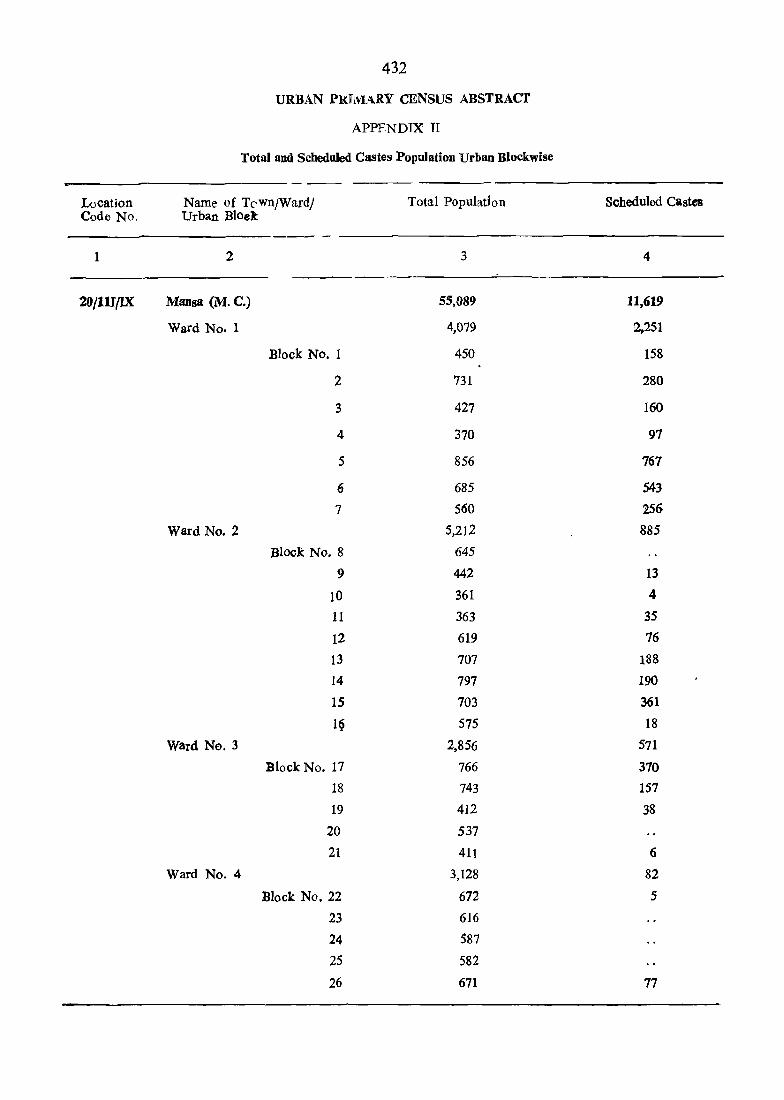
432
URBAN PldMARY CENSUS ABSTRACT
APPFNDTX II
Total aDd Scheduled Castes Population Urban Blockwise
---Location Name of TcwnjWardj Total Population Scheduled Castes Code No. Urban Bloet
1 2 3 4
20/111{lX Mansa (M. C.) 55,089 11,619
Ward No.1 4,079 2,251
Block No.1 450 158
2 731 280
3 427 160
4 370 97
5 856 767
6 685 543
7 560 256
Ward No.2 5,212 885
Block No.8 645
9 442 13
10 361 4
11 363 35
12 619 76
13 707 188
14 797 190
15 703 361
1~ 575 18
Ward No.3 2,856 571
Block No. 17 766 370 18 743 157
19 412 38
20 537
21 411 6
Ward No.4 3,128 82
Block No. 22 6.72 5
23 616
24 587
25 582
26 671 77
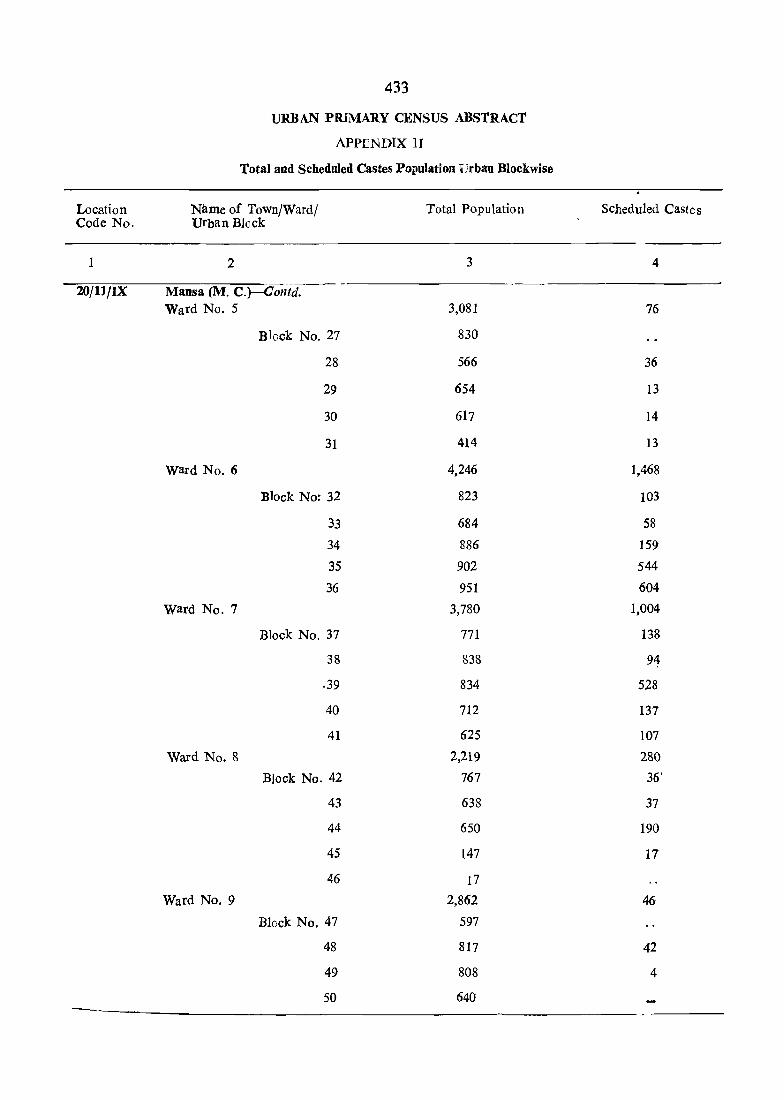
433
URBAN PRIMARY CENSUS ABSTRACT
APPENDIX IT
Total and Scheduled Castes Population Urban Blockwise
Location Name of Town/Ward/ Total Population Scheduled Castes Code No. Urban Block
1 2 3 4
20/lJ/IX Mansa (M. C.)-Oontd. Ward No.5 3,081 76
Bleck No. 27 830
28 566 36
29 654 13
30 617 14
31 414 13
Ward No.6 4,246 1,468
Block No: 32 823 103
33 684 58
34 886 159
35 902 544
36 951 604
Ward No.7 3,780 1,004
Block No. 37 771 138
38 838 94
.39 834 528
40 712 137
41 625 107
Ward No.8 2,219 280
Block No. 42 767 36'
43 638 37
44 650 190
45 147 11
46 17
Ward No.9 2,862 46
Block No. 47 597
48 817 42
49 808 4
50 640

434
UR.BAN PRIMARY C~NSpS ABSTRACT
AP~ENDJX n Total and ~chedu!ed Castes ropu)at~on Urban Blockwise
Location Name of Town/Ward/ Total Population Sched uled Castes Code 'No. Urban Block
- ---1 2 3 4
20JllJIX Mansa MC-Contd.
Ward No. 10 3,228 70 Bleck No. 51 911 58
52 695 12
53 860
54 762
Ward No. 11 4,148 139
Block No. 55 670 73
56 743 43
57 6'S0
58 615
59 624 8
60 846 15
Ward No. 12 2,437 9
Block No. 6! 854
62 864
63 719 9
Ward No. 13 2352 32
Block No. 64 556 32
65 597
66 663
67 536
Ward No. 14 2,606 233
Block No. 68 694 228
69 615
70 686
71 611 5
Ward No. 15 7,453 694
Block No. 72 659 17
73 693 559
74 555 75
7~ 546 43

Location Code No.
1
'20/l1/IX
20/11/X
43S
URBAN PRIMARY CENSUS ABSTRAct t 1 • f I 1
APPENDIX II , , ,,4 1 -
Total and Scheduled Castes Population Urban Blockwise t t .. ~ •• """ ........ '"..... :f t. C
Name ofTvwn/Warc!i Urban Block
2
Mansa (M.C.)-Concld.
Ward No. 16
Ward No. 17
Block No. 7~
77
78
79
80
Block No. 81
82
83
84
Budhlada (M.e.)
Ward No.1
Ward No.2
Ward No.3
Ward No.4
Ward No.5
Ward No.6
Block No.1
Block No.3
4
Block No. ~
6
Block No.7
8
9
Block No. 10
Block No. 11
12
Total Population
3
3,343
668
609
745
581
740 . 3.046
800 r
909 .,' 76,0
577
18,717
l,515
1,183
332
1,352
6~9
723
1,q96
325
771
2,362
681
853
828
882
882
852
684
168
SChodulod CasteS
4
1,879
402
221
401
356
499
1,900
683
170
559
488
2,959
375
361
14
48
48
426
362
21
43
29
29
7
7

436
URBAN PRIMARY CENSUS ABSTRACT
APPENDIX II
Total and Scheduled Castes Population Urban Blockwise
Location Name 'of Town/Ward/ Total Population Scheduled Castes Code No. Urban Block
1 2 3 4
20/11jX Budblada (M. C.)-Concld.
Ward No.7 1,459 . 213
Block No. 13 416 28
14 330 85
15 713 100
Ward NO.8 2,419 522
Block No. 16 540 87
17 412
18 199
19 575 43"
20 693 392
Ward No.9 1,297 J.
Block No. 21 350
22 947 3
Ward No. 10 2,056 45
Block No. 23 588
24 812 42
25 656 3
Ward No. 11 1,798 778
Block No. 26 684 214
27 1,114 564
Ward No. 12 957 513
Block No. 28 527 504
29 430 9-
Ward No. 13 672
Block No. 30 374
31 298
20/ll/XI Bareta (M. C.) 11,537 2,812
Ward No.1 1,389 442
Block No.1 765 277
2 f624 165
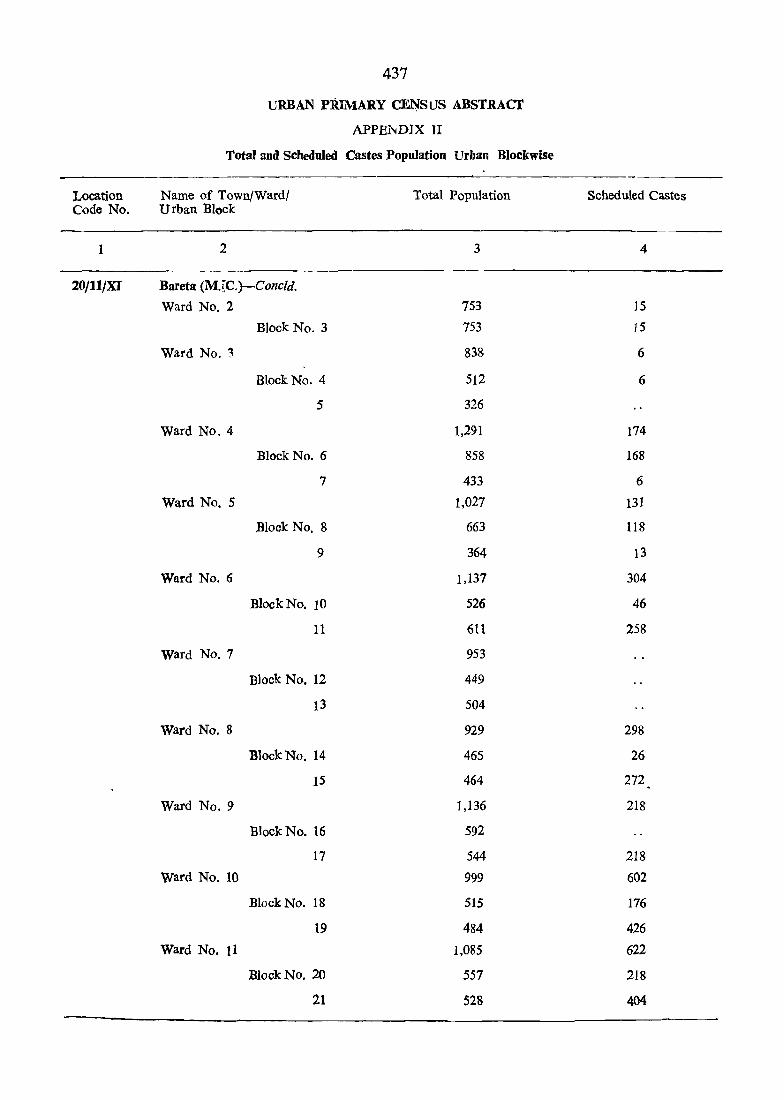
437
URBAN plUMARY C~SUS ABSTRACT
APPENDIX II
Total and Scheduled Castes Population Urban Blockwise
Location Name of Town/Ward! Total Population Scheduled Castes Code No. Urban Block
I 2 3 4
20/11/XI Bareta (M.~C.)-Concld.
Ward No.2 753 15
Block No.3 753 15
Ward No. ~ 838 6
Block No.4 512 6
5 326
Ward No.4 1,291 174
Block No.6 858 168
7 433 6
Ward No.5 1,027 131
Block No.8 663 118
9 364 13
Ward No.6 1,137 304
Block No. 10 526 46
11 611 258
Ward No.7 953
Block No. 12 449
13 504
Ward No.8 929 298
BlockNo. 14 465 26
15 464 272
Ward No.9 1,136 218
BlockNo. 16 592
17 544 218
Ward No. 10 999 602
Block No. 18 515 176
19 484 426
Ward No. 11 1,085 622
Block No. 20 557 218
21 528 404

ANNEXURE TO APPENDIX
DISTRICT PRIMARY CENSUS ABSTRACT FOR
SCHEDULED CASTES
43~
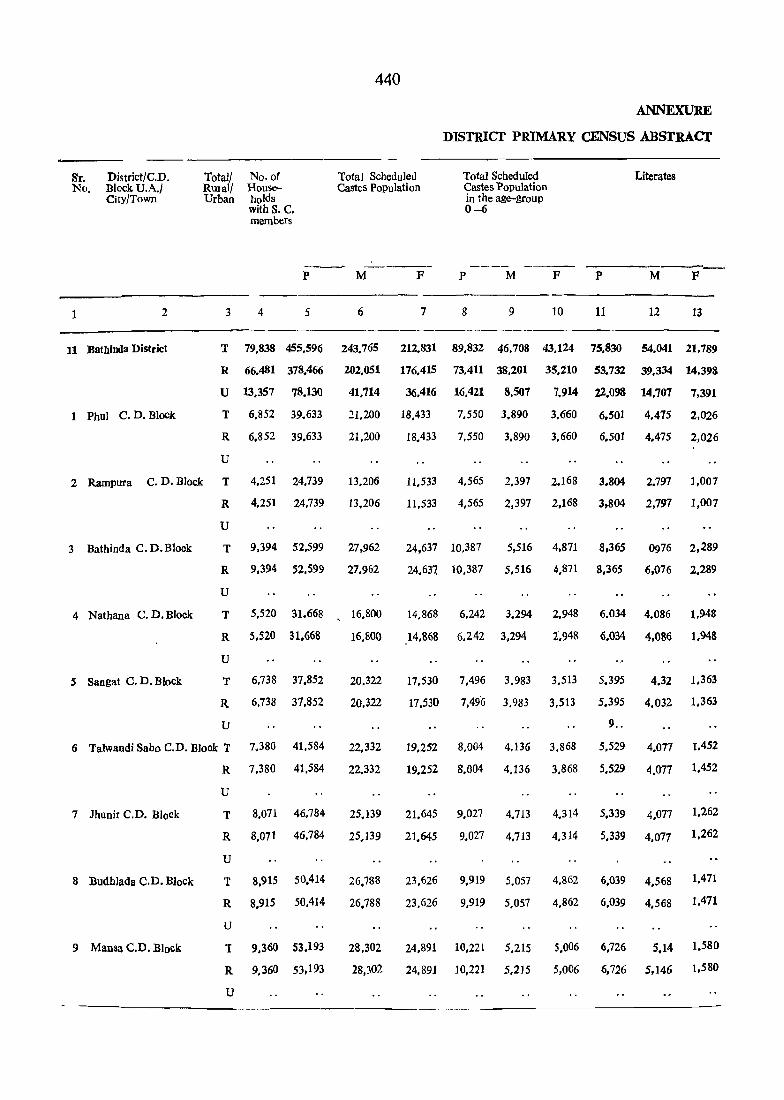
Sr. No.
1
District/C.D. BlcckU.A.J City/Town
2
11 Bathinda District
1 Phu1 C. D. Block
Total/ RUIal/ Urban
3
No. of Households with S. C. members
4
p
5
440
Total Scheduled Castes POPulation
M F
6 7
ANNEXURE
DISTRICT PRIMARY CENSUS ABSTRACf
Total Scheduled Castes Population in the age-group 0-6
p M
8 9
F
10
Literates
---p M F
11 12 13
T 79.838 455,596 243.765 212,831 89,832 46,708 43,124 75.830 54,041 21,789
R 66.481 378.466 202,051 176,415 73,411 38,201 35.210 53,732 39,334 14,398
U 13.357 78,130 41.714 36.416 16,421 8.507 7.914 22.098 14.707 7,391
T 6,852 39.633 21.200 18 .• 433 7.550 3.890 3.660 6.501 4.475 2,026
R 6,852 39.633 21,200 18,433 7.550 3.890 3,660 6.501 4.475 2,026
U
2 Rampura C. D. Block T 4.251 24,739 13,206
13,206
11.533 4.565 2.397 2.168 3.804 2.797 1,007
R 4.251 24,739 11.533 4,565 2,397 2,168 3,804 2,797 1,007
U
3 Bathinda C.D.Blook T 9,394 52,599 27,962 24,637 10,387 5,516 4,871 8,365 0976 2,289
R 9.394 52.599 27.962 24.637, 10.,387 5.516 4.871 8,365 6,076 2,289
U
4 Nathana C.D.Blook T 5,520 31.668
R 5.520 31.668
U
5 Sangat C. D. Block T 6,738 37.852
R 6,738 37.852
U
6 Talwandi Sabo C.D. Blook T 7 .• 380 41.584
R 7.380 41.584
U
7 Jhunir C.D. Block T 8,071 46,784
R 8.071 46,784
U
8 Budhlada C.D. Block T 8.915 50,414
R 8.915 50,414
U
9 Mansa C.D. Block 1 9.360 53.193
R 9.360 53,193
U
16.800 14.868 6,242 3.294 2.948 6.034 4.086 1.948
16.800 14.868 6.242 3.294 2.948 6.034 4,086 1.948
20,322
20,322
22,332
22.332
25.139
25,139
26,788
26,788
28.302
17.530 7,496 3,983 3,513 5,395 4.32 1.363
17.530 7.496 3,983 3.513 5.395 4.032 1.363
9 ..
19.252 8,004 4,136 3,868 5 .• 529 4.077 1.452
19,252 8,004 4.136 3,868 5.529 4.077 1,452
21,645 9.027 4,713 4,314 5,339 4,077 1.262
21,645 9.027 4,713 4.314 5.339 4,017 1.262
23,626 9,919 5,057 4,862 6.039 4.568 1,471
23,626 9,919 5.057 4,862 6,039 4.568 1.471
24.891 10.221 5 .• 215 5.006 6.726 5.14 1.580
28,302 24,891 10.221 5,215 5,006 6.726 5,146 1,580

I
FOR SCHEDULED CASTES
Total Main Workers Cultivators
44l
--- - --- -- -- -- --------------
Agricultural Labourers
INDUSTRIAl CA1EGORY OF MAIN WORKERS
Liyestock, Forestry, Fishing. Hunting & Plantations. Orchards and allied activities
Mining and Quarrying
Cl-IX) 1 n ill IV ---~-- --_ ------- -----------
p M F
14 15 16
144.605 135.474 9.131
122.153 114,704 7.44!)
22.325 20.7111 1.682
12.913 11.857 1,056
12.913 11,857 1,056
7.804 7.353 451
7.804 7.353 451
16.271 15.653 622
16.277 15.655 622
9.841 9.399 442
9.841 9.399 442
12.269 11.313 956
12.269 11.313 956
13,794 12.910
13.794 12.910
15,121 14.174
15.121 14.174
884
884
947
947
p ,M
17 18
7.2!t0 7;025
6,490 6.305
~170 720
377
377
494
494
124
724
"316
316
750
750
927
927
946
946
373
373
452
452
710
710
736
736
876
'876
926
926
16.793 15,668 1,125 1,147 1,128
16.793 15.668 1.125 1.147 1.128
17.341 16.375 966 809 189
17.341 16.375 966 809 789
F p M F
19 20 21 22
235 105,445 98.990 6,455
ISS 100.635 94,441 6,194
50 04,810 4.54!1 261
4 11.462 10.501 961
4 11.462 10,501 961
42 6.375 6.065 310
42 6,375 6.065 310
14 13.412 12.888 52~
14 13.4!2 12.888 524
1 8.018 7.688 330
8,018 7.688 330
14 9.939 9.135 804
14 9.939 9'135 804
51 11,542 10,810 732
51 11.542 10.810 732
20 12,461 11,669 792
20 12,461 11.669 792
19 13.058 12,162 896
19 13.058 12.162 896
20 14.368 13.523 845
20 14.368 13.523 845
P M
23 24
1.571 1.639
1.366 1.339
305 300
43 43
43 43
65 65
65 65
127 127
127 127
120 117
120 117
217 215
217 215
146 141
[46 141
240 236
240 236
240 232
240 232
168 163
168 163
F
25
32
27
5
3
3
2
2
5
5
4
4
g
8
5
5
P M F
26 27 28
4
3
1
2
2
4
3
1
2
2

Location Code No.
1,
District/ C.D. Block/ U.A./City) 'Town
2
11 Bathinda District
! 1 Pbul G. D. Block
2 Rampura C. D. Block
3 .Bathiflda C. D.1:Uock
4 Nathana C. D. BlOCK
5 Bangat C. D.Block
Total/ Rural! Urban
ANNEXURE
DIStRIcT PRIMARY CENSUS ABStRAct
INDUSTRIAL CATEGORY OF MAIN WORKERS
M;;t~t-;;;g-~-Ma~trlact;-i;g, -----C~;ttucti;;;_ - -:- -T-;-aj~~c~~;c; Pro~e~sing~ Processing. servicing servlcmg and and repairs in repairs in House- other than House-hold Industry hold Industrv
V(a) V(b) VI Vll ---"'-_-
P M F P M F p M F p M F
3 29 30 31 32 33 34 ,35 36 37 38 39 40
T 1.849 1.630 219 5.291 4.901' 390 2..520 2.454 66 3.963 3.766, 197
R 1.293 1.114 179 2.386 2.136250 1.204 1.~80 24 1.393· 1.366 27
U
T
R
U
1
556 516
153 112
153 112
135
R 135
U
73
73
l'
.R
U
1
R
U
"::r
R
U
131
131 121
152 136
152 136
82
82 72
40 2.905 2.76'5 140 1.316 1.174 42 2.570 2.400 170
41
41
132 129
132 129
.
3
3
'131 119 P
,:40
40
dO 62
62 .131 119 12 - 60
111 360 336 24
10 , .... 3dO 336 24
16
1,6
10
.......
125 109 ·16
125 109 16
400' 329 71
184'
1,84
If4
124
7J15
115
-39
39
60
60
-184
184
,.?, .
1.22
122
1,09
109
I' 11,3
113
113
113
123
123
130,
2 130
91
111
111
113
113
II9
119
1.211
126
91 (j
6 ~1, 91
2
2
4
4
A
4
6 :ralwandi Sabo C.D. Block - T 116 100 16
16
142 i29 HI 84
84
84
84
167
167
159
159
8
8
7 Jhunir C.D. Block
8 . Budhlada C.D. Block:
9 Mansa C.D. Block
R "116 100
U
T 150 135
R 150 135
U
T 244 237
R 244 237
V
T
R
U
130 128
130 128
IS'
15
7
7
2
2
142 129 13
258 236 22
258 236 22
473 409 64
473 409 64
150
,'150
297
297
365 340 25 t 150
365 340' 25 150
137 13 182
137 13 182
295
295
iSO
150
2 218
2 218
256
256,
)79
179.
216
216
252
252,
3
3
2
2
4
4

443
I
FOR, SCHEDULED CASTES
INDUSTRIAL CATEGO'&Y OF MAIN WORKERS ----------------~-------Transport. Storage Other Services and Comunications
Vlll IX "----_--_...----- _0-- _____________ _
P M F P M P
41 42
3..953 3.901
USa,- 1,149
2.795 2.152
.52 .50
32 sa
74
14
192
192
84
84
114
114
124
124
110
110
210
210
198
198
74
74
192
192
84
84
111
111
122
122
109
109
210
210
191
197
43 44
52 12.649
9 6.225
43 6.424
2 .541
2 ~41
3
'3
2
2
357
357
561
561
544
544
624
624
906
906
897
897
45
11,164
5.671
5,493
499
499
332
332
977
977
702
702
515
515
487
487
547
547
779
779
833
833
46
1,435
554
931
42
42
25
25
46
46
70'
70
46
46
57
5i
77
77
127
127
64
64
p
47
13,560
13.419
141
464
464
326
326
1.590
1.590
2.186
2.186
1.972
1'972
2,057
2.057
1.380
1,380
2.412
2.412
Marginal Workers
M
48
742
724
18
94
94
19
19
33
33
17
17
225
225
33
33
146
146
75
75
82
82
Non Workers
--- --.--_ -------p P M F
49 50 51 52
12,818 298.431 107,549 190,882
12,695 242.894 86.623 156.271
123 55.537 20.926 34.611
370 26.25<l 9.249 17,007
370 26,256 9.249 17,007
307
307
999
999
16,'609
16.609
35,290
35,290
1.573 20,237
1.573 20,237
1.961
1,961
1.939
1.939
1.911
1.911
1.305
1,305
2.330
2.330
23,397
23,397
25,818
25.818
29,606
29.606
32.241
32,241
33.440
33.440
5,834
S.834
12.274
12.274
73.84
73.84
10,715
10,775
23,0l6
23.016
12.853
12,853
8,784 14.613
8.784 14.613
9.389 16,429
9.389 16,42!1
10.819 18.787
10.819 18.787
11.045 21.196
11,045 21,196
11.845
11.845
...
21,595
21.595

444 ANNEXURE
DISTRICT PRlillit ciN~tjS dSntAct .;
Loaa- District! Total/ No. of Total Scheduled Total Scheduled literates tion C. D. Blockl Rurall House- Castes Population Castes Population Code U. A.ICity} Urban holds in the age-group No. Town with S. C. 0-6
members
---_----- ----------- ----------P M F P M F P M F
1 2 3 4 5 6 • 7 8 9 1,0 11 12 13
Urban Total U 13.357 78.130 41.714 36,416 16,421 8,5.07 7,914 22,p98 14.707 7~391
.CITIES/U. AS HAVING POPULATION 100.Q~ AND ABOVE
Bathinda (M. C.) U 5.6()0 32,266 17Jl88 15,178 6,669 ,3,408 3r261 11.923 7.728 4.195
TOWNS!U. AS HAVING POPULATION LESS THAN lCO,{)OO
Rampura Phu] (M.C..) U 1.356 7,945 4,255 3,690 1",650 890 760 1,950 1.29.6. 654
2 Goniana (M.C.) U 360 2.169 1,145 l.P24 445 241' 2,04 701 476 225
3 Bhucho Mandi ~M: C.) U 564 31291 1,732 1.559 . 699 ,352 347 327 595 232
4 Kot Patta (M.C.) U 387 2.049 1.0~5- 954 37[ 197 174 518 344 174
5 Sangat (M.e.) U 108 553 280 273 106 45 (il 113 73 40
6 Raman (M.e.) U 80$ 4,856 2,610 2,246 1.063 567 4~ 911 '6,70 241
7 Maur (M.C.) U 1.207 7.611 4.096 '.
3,515 1,544 813 731 1 .. 4~~ 954 472
8 Mansa (M.C.) U 1.945 11.619 6,311 5,ao8 2,586 1.310 1.276 2,493 1,689 804
9 Budhlada (M. Co) U 482 2,9S.0 l,5~8 1,361 66~ 354 308 659 456 203 ~
,
10 Bareta (M. C.) U 543 2,812 1,504 1,308 626 330 296 577 4~6 151 /

4"45
1
FOlt SCHEDULED aSTES
INDUSTRIAL CATEGO_RY OF MAIN WORKERS -------; .--------------'--.----------------------_--'---- --------
Total Main Workers Cultivators Agricultural Livestock, Por~stry, Mining and Labourers. Fishing, Hunting & Quarrying
Plantations, Orchards and allied activities
(I-IX) 1 II III IV ---~ ----------- ---' ~~--,---....._..-- -------------
p M F P M F P M F p M F P M F
14 15 16 17 18 19 20 21 22 23 24 25 26 27 28
22,452 20,770 1,682 770 720 50 4,810 4,549 261 205 300 5 1 1
8,771 8,11(1 655 227 224 3 574 539 35 89 87 2
2,312 2,208 104 51 51 518 518 28 28
570 541 29 2 2 69 69 6 6
983 857 126 24 20 4 181 156 25 9 9
611 595 16 56 56 380 366 14 20 20
171 164 7 1 113 113 4 4
1.,592 1.421 171 15 15 403 382 21 14 12 2
2,236 2,064 172 125 125 870 809 61 30 30 1
3,438 3,170 268 , 246 204 42 1,935 944 91 34 33 1
917 823 94 14 13 1 250. 238 12 38 38
851 811 40 9 9 417 415 2 33 33 ---
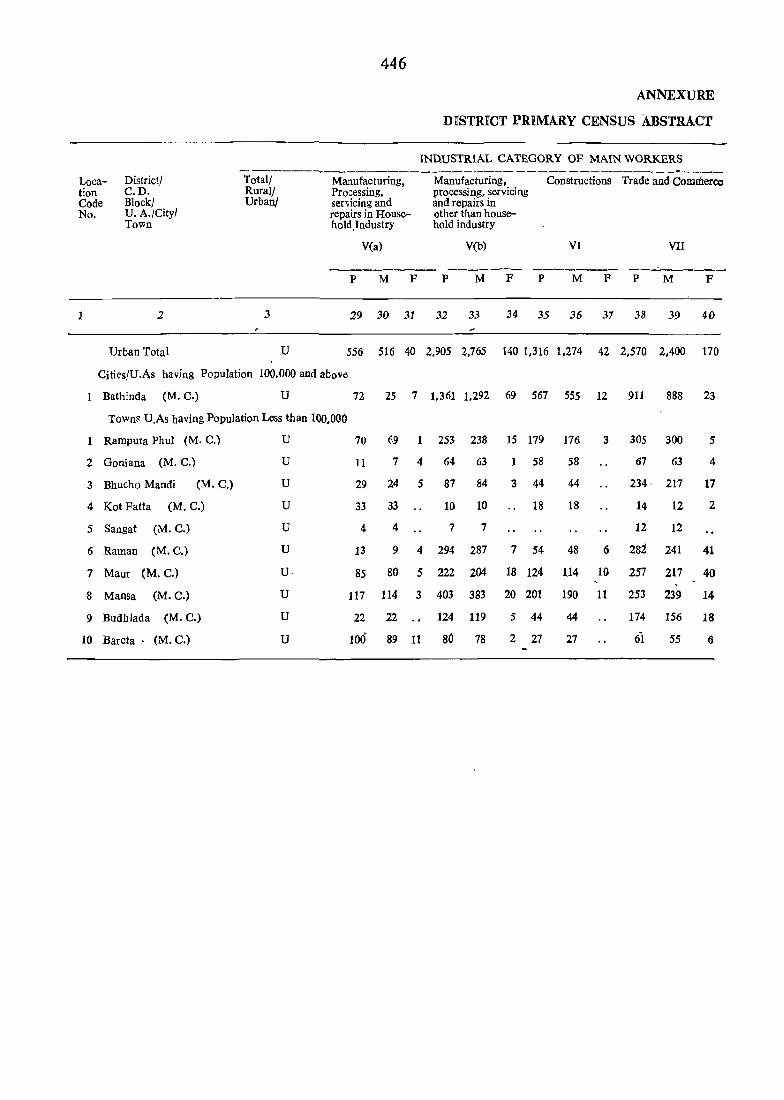
446
ANNEXURE
DKSTR:n:CT PRIMARY CENSUS ABSTRACT
IND.USTRIAL CATEGORY OF MAIN WORKERS - _._------------------- ----- -------_ - _----
Loca- District! Total/ Manufacturing, Manufacturing, Constructions Trade and Commerce tion C.D. Rural/ Processing, processing, servicing Code Block! Urban! servicing and and repairs in No. U. A./City! repairs in House- other than house-
Town hold,Industry hold industry
V(a) V(b) VI VII
_-----,_----- ------_ ------_- --....:.------P M F P M F P M F P M P
1 2 3 29 3D 31 32 33 34 35 36 37 38 39 4D
Urban Total U 556 516 40 2,905 2,765 140 1,316 1,274 42 2,570 2,400 170
CHies/U.As having Population 100,000 and above
1 Bathinda (M. C.) U 72 25 7 1.361 1.292 69 567 555 12 911 888 23
Towns U.As having Population Less than 100,000
1 Rampura Phul (M. C.) U 70 69 1 253 238 15 179 176 3 305 300 5
2 Goniana (M. C.) U 11 7 4 64 63 1 58 58 67 63 4
3 Bhucho Mandi (M. C.) U 29 24 5 87 84 3 44 44 234· 217 17
4 Kot Fatta (M. C.) U 33 33 10 10 18 18 14 12 2
5 Sangat (M. C.) U 4 4 7 7 12 12
6 Raman (M.C.) U 13 9 4 294 287 7 54 48 6 282 241 41
7 Maur (M. C.) U· 85 80 5 222 204 18 124 114 10 257 217 40
8 Mansa (M.C.) U 117 114 3 403 383 20 201 190 11 253 239 14
9 Budhlada (M. C.) U 22 22 124 119 5 44 44 174 156 18
10 Bareta ' (M.C.) u 100 89 11 80 78 2 27 27 61 55 6
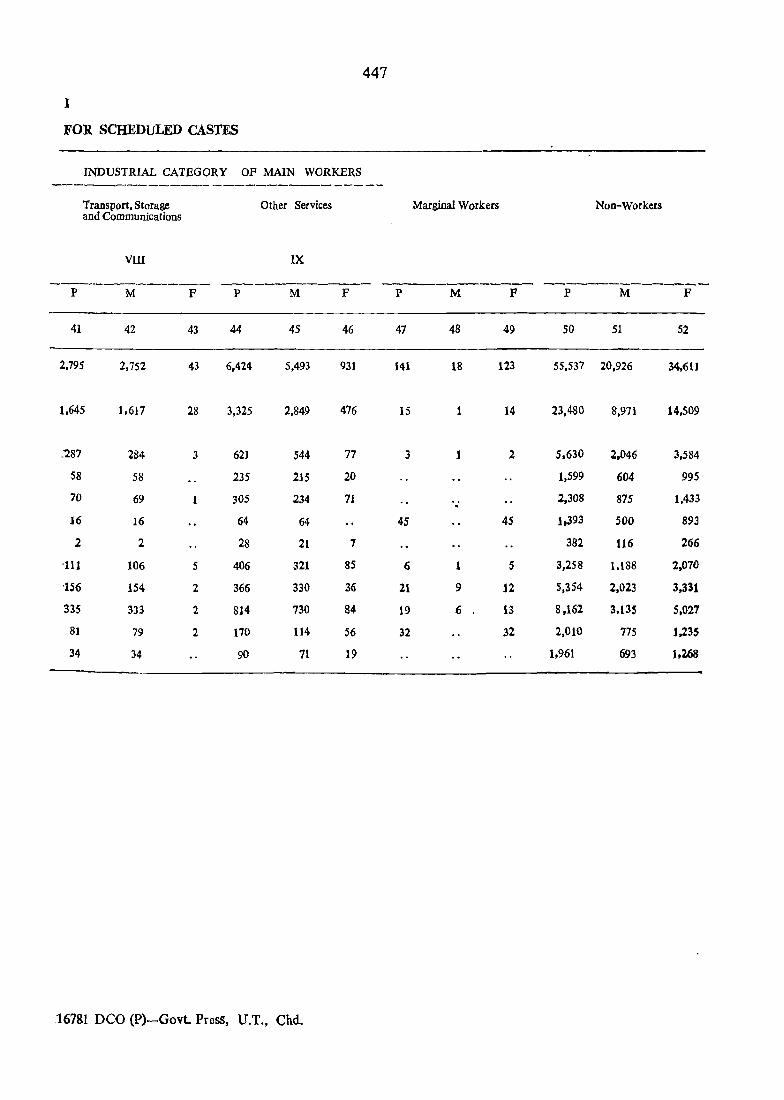
447
I
FOR SCHEDULED CASTES
INDUSTRIAL CATEGORY OF MAIN WORKERS
-----_-------------------------Transport, Storage Other Services Marginal Workers Non-Workers and Communications
VIII IX
-------------- _------------- ----------- -------------P M F P M F P M P P M F
41 42 43 44 45 46 47 48 49 50 51 52
2,795 2,752 43 6,424 5,493 931 141 18 123 55,537 20,926 34,611
1,645 1,617 28 3,325 2,849 476 15 14 23,480 8,971 14,509
_'287 284 3 62) 544 77 3 1 2 5,630 2.046 3,584
58 58 235 215 20 1,599 604 995
70 69 1 305 234 71 2,308 875 1,433 . 16 16 64 64 45 45 1.393 500 893
2 2 28 21 7 382 116 266
'111 106 5 406 321 85 6 1 5 3,258 1,188 2,070
'156 154 2 366 330 36 21 9 12 5,354 2,023 3,331
335 333 2 814 730 84 19 6 13 8,162 3,13S 5,027
81 79 2 170 114 S6 32 32 2,010 775 1.235
34 34 90 71 19 1,961 693 1,268
16781 nco (P)-Govt. PreSS, U.T., Chd.