Village & Townwise Primary Census Abstract, Bathinda, Part XII
Upload
khangminh22Category
view
3download
0
Women’s Participation in Politics and Local Governance
A Dissertation submitted to the Central University of Punjab
For the award of
Master of Philosophy
In
Centre for South and Central Asian Studies
BY
Mairu
Dissertation Supervisor:Dr. Kiran K. Singh
Centre for South and Central Asian Studies
School of Global Relations Central University of Punjab, Bathinda
November, 2013

i
DECLARATION
I declare that the dissertation entitled ‘Women’s Participation in Politics and
Local Governance’ has been prepared by me under the guidance of Dr. Kiran K.
Singh, Assistant Professor, Centre for South and Central Asian Studies, Central
University of Punjab. No part of this dissertation has formed the basis for the
award of any degree or fellowship previously.
Mairu
Centre for South and Central Asian Studies
School of Global Relations
Central University of Punjab
Bathinda-151001
Punjab, India.
Date:
Place:

ii
CERTIFICATE
I certify that Mairu has prepared her dissertation entitled ‘‘Women’s
Participation in Politics and Local Governance” for the award of M.Phil degree
under my supervision. She has carried out this work at the Centre for South and
Central Asian Studies, School of Global Relations, Central University of Punjab.
Dr. Kiran K. Singh
Assistant Professor
Centre for South and Central Asian Studies,
School of Global Relations,
Central University of Punjab,
Bathinda-151001
Date:

iii
ABSTRACT
Women’s Participation in Politics and Local Governance
Name of student : Mairu
Registration Number : SCAS/MPh-PhD/SGR/CPL/2011-12/08
Degree for which submitted : Master of Philosophy
Name of supervisor : Dr. Kiran K. SIngh
Centre : South and Central Asian Studies
School of Studies : School of Global Relations
Key words: Woman, Political Participation, Representation, Awareness, Local
Governance.
‘Where women are honoured there reside the gods’ was said by Manu. In India, women have made a considerable progress and have proved themselves by
conducting the worldly affairs efficiently and effectively over the periods, but still they are deprived of their rights of equality with men. Their status has deteriorated due to various social, economic, cultural and religious factors. This status of women continued for quite a long time, until some social reformers like Ishwar Chandra Vidyasagar, Raja Rammohan Roy and Swami Dayanand Saraswati of Arya Samaj and Brahmo Samaj stood against the brutality and the grave injustice which was being done against the women. Child Marriage, Sati Pratha, Pardah, Confinement to home and non-inclusion of females in day to day affairs were the examples of women suppression. Women have not been able to achieve an equal status and equal opportunity for themselves due to various reasons. Their representation in politics and various public offices has remained nominal. Women have contributed equally in the Struggle for Independence. At the advent of Independence, provisions were made for equal status of women in Indian Constitution. On the same lines, the provisions of women reservation in local bodies were made, so that women make their presence felt in local bodies in India and are a part of decision making process at the grass root level. Studies have shown that even after having reservation in local bodies, women are still not active and their husbands or other male relatives are actively involved in using their positions and they are only rubber stamps. The present study strives to find out the reasons behind the meagre representation of woman in political arena. The study has tried to find out the representation of women, their educational background, reason for coming to the public life and avenues wherein they could do better to serve the people of their constituency in a better way. For the present study, Bathinda City has been selected and Bathinda Municipal Corporation (BMC), which is a local governance body, has been chosen. For this purpose, a
iv
detailed schedule has been prepared to understand the above given aspects from the municipal councillors of BMC. The data collected through the schedules have been analysed and the results have been interpreted. It was observed that women are coming in local governance due to the reservations but are more dependent upon their family members to perform the election and governance related activities.
(Name and signature of student) (Name and signature supervisor)

v
ACKNOWLEDGEMENT
I would like to express my gratitude to all those who gave me the opportunity to
complete this dissertation and make my life’s very precious memorable
experience. First I would like to thank to the Almighty and my Parents who
encouraged me for this study. I personally pay my deep gratitude to my guide Dr. Kiran K. Singh,
Assistant Professor Centre for South & Central Asian Studies, Central University
of Punjab who every minute supported me for research work and without her help;
I could not be able to complete this work. I also acknowledge the support of all
friends (Waseem, Aman, Gurvinder, Mandakini, Mudasir, Arif, Swaity and Lokesh)
who continuously encouraged me during my work. I wish good future for my
classmates and friends of CUP. Finally, I would like to thank to all who blessed me
for this study and say sorry not to mention them personally.

vi
TABLE OF CONTENTS
Sr. No. Contents Page No.
1 Introduction (Chapter-1) 1-11
2 Local self-governance, its Evolution and Growth (Chapter- 2) 12-24
3 Women’s Participation in Indian Politics (Chapter-3) 25-44
4 Women’s Participation in Punjab Politics (Chapter- 4) 45-71
5 Women in Urban Local governance: A case study (Chapter -5) 72-89
6 Conclusion and Recommendations 90-94
7 References/ Bibliography 95-100
8 Appendices 101-119

vii
LIST OF TABLES
Table No. Table Description Page No.
1.1 Summary Electoral Participation: Electorate, Turnout and Number of Candidates Compared to the Assembly Election (2007)
6
1.2 Constituency Summary, 2007 (Bathinda) 6
1.3 Constituency Summary, 2012 (Bathinda) 7
2.1 Structure of Municipalities 17
2.2 Composition of Municipalities 18
2.3 Functions of Urban Local Government 19
2.4 Sources of Income for Urban Local Government 20
2.5 Parameters for the Urban Population and Income 21
2.6 Area, Population and Density of Urban Governance Bodies 22
3.1 Participation of Women in Lok Sabha Elections (Lower House)
29
3.2 Women Representation in Rajya Sabha (Upper House) 30
3.3 Participation of women in State Legislative Assemblies 31-33
3.4 Women as Contestants 39
3.5 Women’s Representation 42
4.1 Area, Population and Headquarter of Each District of Punjab 47
4.2 Percentage of Male and Female Electors in Punjab Assembly Election, 2007 50
4.3 Percentage of Male and Female Electors in Punjab Assembly Election, 2012
50
4.4 Percentage of Votes Polled By Male and Female Electors in Punjab Assembly Election, 2007
52
4.5 Percentage of Votes Polled By Male and Female Electors in Punjab Assembly Election, 2012
52

viii
4.6 Percentage of Male and Female Contested Candidates in 2007-Punjab Assembly Elections
55
4.7 Percentage of Male and Female Contested Candidates in 2012-Punjab Assembly Elections
55
4.8 Percentage of Votes Polled to Male and Female Candidates (Elections-2007&2012)
58
4.9 Numbers of Male and Female Winners(Elections-2007&2012)
61
4.10 Numbers of Rural Local Bodies in Punjab State (As on 31st March 2012)
65
4.11 Woman in PRIs (Gram Panchayats) in Punjab Region, (2002/2003) 65
4.12 Woman in PRIs (Panchyat Samitis) in Punjab Region, (2002/2003)
66
4.13 Woman in PRIs (Zila Parishad) in Punjab Region, (2002/2003)
67
4.14 PRI Election Data (2008) 68
4.15 Number of Female Councillors in Municipal Corporations 71
5.1 General Information about the BMC 73
5.2 Age wise Distribution of Councillors 73
5.3 Educational Qualification of the Councillors (BMC Members) 73
5.4 Cast Wise Distribution of the Councillors 74
5.5 Religious Status of Councillors 75
5.6 Occupation Pattern of BMC Councillors 75

ix
5.7 Political affiliation of the councillors 76
5.8 Participation of Councillors in Election Related Activities during Elections
77
5.9 Inspiration behind Joining the Elections 77
5.10 Number of Elections contested by the Councilors 78
5.11 Problems Faced During the Elections 79
5.12 Politics and Political Parties are organized to favor of Men 80
5.13 Willingness of the Present Councillors to Participate in the next Elections
80
5.14 Major Indicators of Awareness 82
5.15 Women can contribute in local governance effectively 84
5.16 Details of the BMC Meetings 85
5.17 Number of Councillors who is accompanied in meetings of BMC
85
5.18 Dependence of the Councillors to play their roles 86
5.19 Major Indicators of Transparency 88-89

x
LIST OF FIGURES
Figure No. Description of Figures Page No.
3.1 State Wise Percentage of Electors (General Elections, 2004) 36
3.2 State Wise Percentage of Electors (General Elections, 2009) 36
3.3 State Wise Percentage of Voters (General Elections, 2004) 37
3.4 State Wise Percentage of Voters (General Elections, 2009 37
3.5 Percentage of State Wise Contesting Candidates (General Elections 2004) 40
3.6 Percentage of State Wise Contesting Candidates (General Elections 2009)
40
3.7 Percentage of State Wise Elected Candidates in Parliament (General Elections 2004)
43
3.8 Percentage of State Wise Elected Candidates in Parliament (General Elections 2009)
43
4.1 Map of Punjab 45
4.2 Assembly Constituencies of Punjab 46
4.3 Male and Female Electors (Punjab Assembly Election, 2007) 51
4.4 Male and Female Electors (Punjab Assembly Election, 2012) 51
4.5
Votes Polled by Male and Female Voters (Punjab Assembly Election, 2007)
53
4.6 Votes Polled by Male and Female Voters (Punjab Assembly Election, 2012)
53
4.7 Male and Female Contested Candidates, (Punjab Assembly Election, 2007)
56
4.8 Male and Female Contested Candidates, (Punjab Assembly Election, 2012) 56

xi
4.9 Votes Polled to Male and Female Candidates, (Punjab Assembly Election, 2007)
59
4.10 Votes Polled to Male and Female Candidates, (Punjab Assembly Election, 2012
59
4.11 Number of Male and Female Winners, (Punjab Assembly Election, 2007)
62
4.12 Number of Male and Female Winners, (Punjab Assembly Election, 2012)
62
4.13 Women in all Three Tiers of Panchayats (2002-2003 and 2008)
69
5.1 Ward Map of Bathinda. 72

xii
LIST OF APPENDICES
Appendix Part (A) Page No.
Appendix Part (A) Articles from 243(P) to 243 (ZG) 101-103
Appendix Part (B)
Table B(1) State Wise Number and Percentage of Electors (General Elections, 2004)
104-105
Table B(2) State Wise Number and Percentage of Electors
(General Elections, 2009) 106-107
Table B(3) State Wise Number and Percentage of Voters (General Elections, 2004) 108-109
Table B(4) State Wise Number and Percentage of Voters (General Elections, 2009)
110-111
Table B(4) Percentage of State Wise Contesting Candidates (General Elections, 2004) 112-113
Table B(6) Percentage of State Wise Contesting Candidates (General Elections, 2009)
114-115
Table B(7) Percentage of State Wise Elected Candidates in Parliament (General Elections, 2004)
116-117
Table B(8) Percentage of State Wise Elected Candidates in Parliament (General Elections, 2009)
118-119

xiii
LIST OF ABBREVIATIONS
Sr .No. Full Form Abbreviations
1 Bharatiya Janta Party BJP
2 Bathinda Municipal Corporation BMC
3 Beijing Platform for Action BPA
4 Central Finance Commission CFC
5 Convention on the Elimination of All Forms of Discrimination against Women
CEDAW
6 Committee on the Status of Women in India CSWI
7 United Nations Division for the Advancement of Women
DAW
8 Development Planning Committees DPCs
9 Elected Women Representatives EWRs
10 First Punjab State Finance Commission FPFC
11 Infrastructure Development and Finance Corporation
IDFC
12 Infrastructure Development and Finance Corporation
IDFC
13 Infrastructure Leasing and Financial Services IL&FS
14 Life Insurance Corporation LIC
15 Life Insurance Corporation LIC
16 Members of Parliament MPs
17 Members of State Legislative Assemblies MLAs
18 Members of State Legislative Councils MLCs
19 Municipal Corporations MCs
20 National Federation of Indian Women NFIW
21 Panchayti Raj Institutions PRIs
22 Punjab Municipal Act 1911 PMA-1911
23 Punjab Municipal Act 1976 PMA-1976
24 Representation of People Act -1950 RPA
25 Rural Local Bodies RLBS 26 Second Punjab State Finance Commission SPFC
27 Shromani Akali Dal SAD
28 Urban Local Bodies ULBs

1
Chapter 1
Introduction
“Ede, ranthe kaamye chandre jyothyedathe Saraswathi mahee vishruththih| Ethathe Agne namaani devebhyomaah sukrutham bruyaath”
“Possessing all praiseworthy qualities, giver of happiness, lighter of home, a
scholar who is away from being helpless, weak and pathetic, having noble
thoughts and lofty behaviour and well known, never to be beaten and rejected, are
the qualities with which you Devi are named. Having possessed of these qualities,
O Devi! Advise me too the noble thoughts and deeds.”
-Yajurveda 8.43
Indian Vedic literatures are full of lofty thoughts on women which accord total
equality between men and women in their respective fields. Women were
considered the veritable treasure of the Earth but she became subordinate of men.
In a country like India, where social orientation is based on class, caste and
gender, the picture of deprivation and inequality is appalling. So long the women
were not considered as a social group in their own right; rather they were either
included with men or totally ignored. In British India, social reformers like Iswar
Chandra Vidyasagar, Raja Rammohon Roy, and Swami Dayananda Saraswati
etc. first raised their voices for oppressed and suppressed women. Iswarchandra
Vidyasagar espoused the cause of women-education and widow remarriage, Raja
Rammohan Roy championed for the abolition of Sati and Dayananda Saraswati,
resolutely opposed the child marriage. Behram Malabari and Ranade had given a
new dimension to the struggle of women in India. In post-independent India,
Sarada Act provided an impetus to the battle for rights of Women. The passing of
the Hindu Code Bill, 1955 and the provision of equal rights for women in the
Constitution of India improved the status of women. In June 1954, the first post-
war all-India organization of women ‘National Federation of Indian Women’ (NFIW)
was formed in view of impending socio-political issues. In 1992, the National
Women’s Commission and the State Women’s Commission were formed.
Like men, women are the essential part of society because they constitute
approximately fifty percent of the population. But the situation of women in India is
not very glowing. Their socio economic status is low and discrimination in all walks

2
of life is a common scene throughout the country. For centuries, women have
been confined to home and deprived of their rights to get a fair treatment in the
male dominated society. With the advancement of time, it has now been
recognized that without ensuring women development and their participation in
governance, the national development and the principle of equality (Article-14 and
Article-15) cannot be achieved (Fardaus Ara, 2006). In a nutshell, the
development of the nation cannot be achieved until due attention is given to the
gender equality and women participation in political life of the country because
women contribution, like men, in the development of the social and economic
sphere of the society is very important. Women participation in formal political
process and its institutions, where the decisions regarding the use of societal
resources are taken, needs to be enhanced (Bari, 2005). To ensure women
participation in public life, Indian Government amended the laws of the local
bodies through the 73rd and 74th Constitutional Amendments, wherein 33 percent
of the seats were reserved for women candidates in local bodies. These local
bodies have the potential to achieve the principle of gender equality and bring the
transformative change in the society. In other words, local governance may be
considered as an effective governance because it not only provide the political
participation to the women but it also assures their required representation in the
decision making process through the legitimate institutions to understand their
intentions, ideas and interest without any discrimination. The increased
representation of women in the local bodies can be seen as a positive trend
towards the gender equality (Shamim and Kumari, 2002).
1.1 Structure of Governance in India
India, the largest democracy in the world, is a union of 28 states and 7 centrally
administered Union Territories. The country attained its independence on 15th
August 1947 and adopted its own written constitution on 26th January 1950. The
Indian constitution provides for single citizenship for all the citizens and also grants
the right to vote to every person who has attained an age of 18 years. By using
this right to vote, citizens elect and send their representatives to Lok Sabha, State
Assemblies and Local Bodies. Local governance through local bodies is an
effective method of governance through which the constitutional laws are
implemented and exercised at the grass root level by the representatives, who

3
have collective authority to take decisions for public welfare. Any political structure,
whether it is federal system or unitary system, cannot be considered complete and
democratic if it does not have a local governance system. Actually, in any system
local governments are created to lessen the burden of central governments and to
provide services that are local in character (Asaju, 1999).
In India, the local governments are under the control of the State Governments. In
the rural areas a three-tier structure has been adopted. They are Grama
Panchayat consisting of a village or group of villages, Taluk or Block Panchayat for
every taluk or every block and Zilla Panchayat for every district. In the urban areas
there are the Municipal bodies namely Nagara Palika i.e., Nagara Panchayats
(transitional area - an area in transition from a rural area to an urban area). There
are also the Municipal Councils for smaller urban areas and Municipal
Corporations for larger urban areas, based on the size of population (NIAS, 2001).
After independence, Articles 325 and Article 326 were enacted to ensure women’s
political rights and their participation in government’s decision-making policies.
This participation has started from the grass-root level i.e. Panchayats at village
level and municipal bodies at urban level which is known as local level
governance. In other words to ensure the functions of democracy and participation
in decision makings on the basis of equality our Indian government has amended
the constitutional laws and introduced the concept of local governance through the
73rd and 74th Constitutional Amendment Acts (Rout, 2012). Therefore, Local
governance is that governance which provides the political space to the
disadvantage section of the society like scheduled castes and scheduled tribes
and specially the women. So, the strengthening of the local governance can be
seen as a positive trend towards both the gender equality and good & effective
governance (Shamim and Kumari, 2002).
1.2 Women in Governance
The subject of women’s participation in governance, decision making and
development has gained global attention. The World Bank Report, 2005 indicates
that gender inequality adversely affects women throughout their lives and stifles
the development prospect of their society. In spite of the significant roles played by
women in development processes, they are still ignored, especially in public and

4
political decision making. According to the HDR, 1995 “Development, if not
engendered is endangered.” In India women constitute 48 percent of the total
population (Census of India, 2011). In spite of their large proportion, women are
not well represented when it comes to the matter of governance. According to
Subermaniam, 2002 “Less than 8% of Parliamentary seats, less than 6% Cabinet
positions, less than 4% of seats in High Court and the Supreme Court have been
occupied by women, less than 3% of the Administration and Managers are
women. The average percentage of women’s representation in the Parliament,
State Assemblies and Council of Ministers taken together has been around 10%.
One of the important reasons why women have not received adequate benefits
from years of planning and development was their inadequate representation, non-
participation and non-involvement in the preparation and execution of plans for
their economic development and social justice through centralized institutions.
Indian constitution has adopted an affirmative action to ensure the women’s
participation in politics through the provision of one-third reservation in all
institutions of local self-government. It also provides the reservation of posts for
chairperson and deputy chairperson in the panchayats and the committees in the
Nagar Pallikas. The reservation constituencies vary in each election because of
the adoption of the policy of rotation. The term of the elected persons is for a five
years.
1.3 Women's Political Participation
Political participation means the functioning of all the public institutions and forces
which are involved in influencing the lives of the people by way of decisions and
policies that affect their relations with one another. Participation of women in
politics and governance would include:
Women as voters
Women as members of political parties
Women as candidates
Women as elected members of local government bodies taking part in
decision-making, planning, implementation and evaluation
Women as members of women’s organizations, their association with
voluntary organizations

5
Women in developmental works and dealing of priority issues in the village
level.
Gender empowerment is determined by the degree to which women and men
participate actively in economic, professional and political activity and take part in
decision-making. A typical system of social relations in the male-dominated society
was the major hindrance to women’s political participation, reflecting the orthodox
male-centric mentality (Kaushik, 1996).
1.4 Statement of Concern
Discrimination is a well-known fact and inclusion of marginalised people of society
(women being the one) in governance process is constitutional provision.
Participation is a development approach, which recognizes the need to involve
disadvantaged segments of the population in the design and implementation of
policies concerning their wellbeing. The strengthening of women’s participation in
all spheres of life has become a major issue in the development discourse. Socio-
economic development cannot be fully achieved without the active participation of
women at the decision making level in society. Despite the government efforts the
participation of women in politics and governance is very low. According to DAW
report (2005), women’s participation and representation in decision-making bodies
involves their enhanced presence as well as their empowerment through such
participation. Women’s political leadership and accountability are key cross-cutting
issues. On the one hand, women’s political leadership allows them to set agendas
and, on the other hand, it is in such roles that they are made responsive to
constituencies and publics. This accountability becomes the cornerstone for not
only numerical enhancement of women’s presence but also their ability to
transform outcomes, the content and the ways in which policy actors make public
policy. The present study tries to analyse the women’s participation in politics and
governance by examining their representation in politics and participation in
governance process by taking a case study of Bathinda Municipal Corporation.
Main objective of this study is to find out the participation of women in governance
process and since representation in election is one aspect of participation so
highlighting representation in politics also becomes important.
Table 1.1 reflects the summary of electoral participation in the fourteenth Punjab
Legislative Assembly Election that was held in year 2012. It is clear from the table

6
that number of female electorate is less than that of male in the same year but the
female turn out (79.1%) exceeded the male turnout (78.1%) by 1 percent. The
increasing number of women turnout shows that women are becoming aware of
the right of their adult franchise and actively participating in the election process
but when it comes to the matter of their involvement in process of governance and
policy making they fail to represent the women community.
Table 1.1 Summary of Electoral Participation: Electorate, Turnout and
Number of Candidates Compared to the Assembly Election (2007-2012)
Assembly elections 2012 change from 2007 %
Total electorate 1,76,82,363 +4.5
Male electorate 93,20,878 +6.3
Female electorate 83,61,485 +2.6
Total voters 1,38,92,638 +9.0
Total turnout 78.6% +3.2
Male turn out 78.1% +2.7
Female turnout 79.1% +3.5
No. of candidates 1,078 +3.2
Source: Economic and Political Weekly-fourteenth Assembly Election in Punjab, 2012.
The picture of women participation and their representation in the election process
is also not different in Bathinda from the rest of the Punjab. Table 1.2 shows that in
the 2007 State Assembly Election of Punjab the number of women who filed their
nomination were 3 while that of the men were 21. Out of these three, 2 withdrew
their nomination and the nomination of the remaining one was rejected. Hence no
women candidate contested the election in 2007.
Table 1.2 Constituency Summary, 2007 (Bathinda)
Candidates Male Female Total
Nominated 21 3 24 Rejected 1 1 2 Withdrawn 6 2 8 Contested 14 0 14
Winner Male (Harminder Singh Jassi)
Source: Election Commission of India State Election, 2012 (Legislative Assembly of Punjab)

7
Table 1.3 Constituency Summary, 2012 (Bathinda)
Bathinda Urban Candidates Male Female Total Nominated 13 5 18 Rejected 0 5 5 Withdrawn 0 0 0 Contested 13 0 13 Winner Male (Sarup Singla (SAD) Bathinda Rural Candidates Male Female Total Nominated 9 1 10 Rejected 2 0 2 Withdrawn 1 0 1 Contested 6 1 7 Winner Male (Darshan Singh (SAD)
Source: Election Commission of India State Election, 2012 (Legislative Assembly of Punjab)
Table 1.3 shows that 5 women candidates in Bathinda Urban and 1 women
candidate in Bathinda Rural filed their nominations, but only one woman candidate
was left in the fray and that was from Bathinda Rural constituency, whereas the
nomination for 5 female candidates from Bathinda Urban were rejected. It
corroborates the fact that female representation in Bathinda district is not very
encouraging.
1.5 Rationale of the Study
The inadequate representation of women in decision-making bodies is one of the
major factors that have contributed to their low status. Political participation of
women is essential to ensure women’s involvement in decision making process.
The discrimination and injustice toward women can’t be controlled until women
have their own voice and own will against them. The affirmative action adopted by
the government of India providing for reservation of not less than one-third seats in
local self-governing bodies has facilitated more number of women to participate in
the decision-making arena equally with men in these institutions. Further, these
women are now in a position to access resources and utilise the powers vested in
them as elected members. This is a significant step towards achieving the
constitutional goal of equality. However, much more needs to be done to provide

8
an enabling and conducive environment in the political institutions to enable
women to participate effectively.
The political domain continues to be perceived as best suited for men and
therefore remains very male dominated. Today, the political environment is deeply
entrenched with corruption and criminalisation. This situation needs to be changed
as women have the potential to defuse and transform the mainstream political
culture, by making it more transparent, accountable and participative. They can
also positively contribute to the process of de-criminalising politics, which in turn
would provide a conductive environment for their entry and effective participation
in politics, thus facilitating the achievement of substantive equality for women.
This dissertation is an effort in highlighting the fact that women can work as
effectively as they work in the house. Women are sensible and responsible and if
they enter in politics and decision making process, several social, political and
economic changes may occur. This is a small effort to examine the way women is
operational (in BMC), the obstacles they are facing and the rights they are aware of.
This brief review of existing literature portrays that all these works done by the
eminent researchers have elevated our understanding about the background
and strength and weaknesses of the women members but also reveals that
there is a scope of in-depth study regarding the women participation in politics
and development. Inspire of valuable contribution by researchers and scholars in
this field, still there are some gaps as follows:
A. Active political participation means not only using the voting rights or contesting
the vote but also performing duties and responsibilities towards people.
Researches are required to be carried out on how far the members are imparting
their roles or responsibilities.
B. After reservation women participation in governance has increased .But
whether they (women) are properly groomed or not or whether they (women) have
their role clarity or not, may be assessed.
1.6 Objective
Merely having women in politics does not automatically mean that the interests of
women in the community are represented. Without women’s needs and interest
being taken into account, without giving opportunity for them to participate in and

9
influence decision-making, development involvements and planning justifiable
results will not come. The objective of this study is to find out the representation
and participation of women in politics and governance process. It becomes
important to define what is governance? Governance is the act of governing. It
relates to decisions that define expectations, grant power, or verify performance.
In political and development contexts "governance" means: the process of
decision-making and the process by which decisions are implemented (or not
implemented). To see the participation, the first step is to find out the representation
because women can’t participate in governance until they represent. It has been
tried to find out women’s representation in various elections (Lok sabha and Rajya
sabha) by analysing different election data. Such analysis has been followed by
field study of Bathinda Municipal Corporation as a case study to know about
women’s real participation in local governance process. Keeping these concepts in
mind few objectives have been set which will guide the whole process of this work.
1. What is the status of women’s representation/participation in Indian politics;
2. What is the status of women’s representation/participation in Punjab
politics;
3. How women are participating in governance process of Bathinda Municipal
Corporation?
Few research questions were also set to achieve the objectives of this research.
Answer of these research questions were tried to obtain during the field survey.
The response on these questions is particularly based on the opinion collected
from the ward councillors of Bathinda Municipal Corporation. These questions are
as follows:
1.7 Research Questions
1. Do women like joining politics?
2. Are they aware of the local governance process?
3. Do women actively participate in governance?
4. What are the obstacles being faced by women working in Bathinda
Municipal Corporation?

10
1.8 Methodology
The definition of women’s participation in local governance encompasses a large
arena comprising a wide range of activities. However, the scope of this study is
very limited as it is an effort to bring out the women in governance process. The
participation itself has a wide definition but here it is restricted to the political
participation or representation at Central level (State Legislatures and Parliament)
and participation in the governance process at local (grassroots) level. The
representation of women at Central level has been studied by analysing the data
of Lok Sabha and Rajya Sabha elections while at the grassroots level of local self-
governance, the study has attempted to provide an analysis based on a case
study approach. The Bathinda Municipal Corporation (BMC) has been selected as
a study area and the councillors of all the wards of BMC form the basis of this
study. In order to know about the participation in local governance the councillors
have been interviewed.
1.8.1 Sources of Information
The information for this dissertation has been primarily collected from secondary
as well as primary sources. They range from statistics regarding women’s political
participation at all levels of governance from published books, reports, research
works, journals and newspapers and internet browsing to qualitative information
that includes individual case studies collected by taking interviews. Adequate
information on election data at Centre and State level are available but data on
local governance is scarce and inadequate thus posed limitations in collecting
more data only on local governance in a state like Punjab. At this point it has
become a need for generating a database through micro studies and compile
document to enable further analysis of issues. The material collated in relation to
women’s participation in politics has been analysed using the framework of
substantive equality.
1.9 Organisation of Work
This dissertation is organised into five chapters. First chapter, Introduction, gives
the idea about the work and covers objectives, research questions and
methodology used in the work. The second chapter, Local self-governance, its
evolution and growth, gives the detailed idea of evolution and growth of concept of
11
Local governance. The third chapter, Women’s Participation in Indian Politics,
examines the representation of women in Indian politics by analysing data of Lok
Sabha and Rajya Sabha elections. Likewise the fourth chapter, Women’s
Participation in Punjab Politics, analyses the same situation but at state level. Fifth
and final chapter, Women in Urban Local Governance: Glimpse of a Real Picture
through a Case Study, has been compiled after carrying out a field survey. This
chapter explores the participation of women in urban local governance.

12
Chapter 2
Local Governance: Evolution and Growth
Indian constitution has declared India a Semi- Federal state. According to the
Article (1) of the constitution “India that is Bharat shall be a union of state”. So our
constitution ensures the tenets of the federal structure by making the provision of
Central government at the centre level and State governments at the state level.
Now the local self-government, which is the third level of governance, is the
integral part of the federal structure. This chapter describes the evolution and
growth of both rural and urban local governance in the history of the Indian
constitution and situation of women’s reservation in local governance
2.1 Evolution of Rural Local Governance and its Growth
The concept of local self-government is not new to our country; its roots can be
traced back to the Vedic periods. Around 600 BC the territory north of river Ganga
(modern north Bihar and eastern UP) under small republic were known as
Janapadas. Among these Janapadas, Lichhavis was the most powerful. In these
Japandas, the affairs of the state were conducted by the assembly consisting of
local chieftains. In the Post Mauraya times, there existed republics of Malvas and
Kshudrakas where decisions were taken by ‘Sabhas’. In Chola kingdom, the
village councils, with its sub-committee and wards, played an important role in
administration. They were responsible for revenue collections, irrigation, road
buildings and others necessary work. They also managed social affairs and solved
the different disputes. Their transaction, recorded on the walls of village temples,
shows a vigorous community life and was a permanent memorial to the best
practices in early Indian polity (Singh, 1996). The present structure of local
government took its shape in 1688 when the British established a municipal
corporation at Madras which was followed by the creation of the similar structure
or bodies at Bombay and Calcutta in 1726. These corporations were units of
administration enjoying considerable judicial powers. A corresponding effective
structure for rural areas came up with the enactment of the Bengal Local Self
Government Act, 1885 which led to establishment of district local boards across
the entire territory of Bengal province. Within five years, a large number of district
boards came into existence in other parts of the country: Bihar, Orissa, Assam and

13
North-West Province. When local self-government became a transferred subject,
the Minto-Morley reforms (1909) and the Montague Chelmsford reforms (1919)
widened the participation of people in the local governing process. This
arrangement continued till the country achieved independence in 1947 and
thereafter till the late 1950s (Sixth Report, 2007).
The long debate in the constitution assembly reveals that the leaders at that time
were hesitant to bring changes in the prevailing administrative system. As a
compromise by framers of the constitution, Panchayati Raj Institutions get the
place in the Directive Principles of State Policy- Part-IV, Article-40 “State shall take
steps to organize village Panchayats and endow them with such powers and
authority to enable them to functions of as unit of Self Government” (Alok, 2011).
Following the Directive Principles, the various state government organized village
Panchayat as units of Rural Self Government. Greater importance was given to
the Panchayat system after the adoption of the Five Year Plan and Community
Development programmes. In 1956 when the Second Five Year Plan was
launched, it recommended that the Village Panchayat should be linked with the
popular organization at higher level. To operationalize this initiative, Government
of India appointed a committee under the chairmanship of Balwant Rai G. Mehta in
1957. The recommendations given by Balwant Rai Mehta committee were
approved by the National Development Council in January, 1958. This set the
stage for launching Panchayat Raj Institutions throughout the country. The three-
tier system of Panchayat Raj was first adopted by Rajasthan in Oct 2, 1959 and
was followed by Andhra Pradesh, Bihar, Gujarat, Himachal Pradesh, Maharashtra,
Punjab, Tamil Nadu, Uttar Pradesh and West Bengal. Gradually the Panchayat
Raj System was adopted by most of the states even though the system differed in
terms of their way of functioning. Though the Panchayat Raj institutions have been
working in different parts of the country for over four decades, certain shortcoming
were noted which impeded their operation, for example, they lacked adequate
financial resources, clear distribution of function at the various level, the
dominancy of higher structure over sub-ordinate structure (Bandi, 2011).
Therefore, in December, 1977 the Janata Party Government appointed a
committee under the chairmanship of Ashok Mehta to review the working of PRIs
and to make necessary recommendation for its improvement. These

14
recommendations were designed to revitalize PRIs and to accord them
constitutional status. However these did not find favour and as a result not
implemented. During the period of 1978 and 1986 number of committees were
formed to look into aspect to strengthen the Local Self Government institutions
(Sharma, 2009). In July 1989, Congress Government under Sh. Rajiv Gandhi
introduced 64th and 65th Amendment Bill. The basic provisions of the bill were;
It should be mandatory for all States to set up PRIs/ULBs;
The elections to be conducted by the Election Commission;
Tenure of Panchayats/ULBs to be of five years and, if dissolved before
time, fresh elections should be held within six months;
Reservation of seats to be made for SC/ST/Women;
Local Bodies to be entrusted with more functions e.g. minor irrigation, soil
conservation, bio-gas, health, benefits to SC/ST;
Planning and budgeting systems be introduced at the Panchayat level;
The State Legislature to authorize Panchayats/ULBs to levy taxes/tolls and
fees;
A separate commission to review the Local Body finances, and PRI/ULB
accounts to be audited by the CAG.
The Bill could however not be passed in the Rajya Sabha. After that in 1990, a
combined constitution bill covering both PRIs and ULBs was brought in
Parliament, but the dissolution of the government, this bill was lapsed again.
Finally in 1992, after synthesizing important features on this subject (PRI)
Government drafted and introduced the 73th and 74th amendment bill in parliament
which were passed in 1993 and these introduced new parts IX and IXA in the
Indian Constitution containing Articles 243 and 243 ZG. The 73rd and 74th
amendments to the constitution constitute a new chapter in the process of
democratic decentralization in the country. The 73rd and 74th Amendment Acts
came into force on 24th April, 1993 (Sixth Report, 2007).

15
2.2 Evolution of Urban Governance and its Growth
As already discussed, like rural governance, the evolution of urban governance
also dates back to the period of Vedas and has passed through many stages. The
first municipal corporation was set up in Madras in 1688 which was followed by the
creation of the similar structure or bodies at Bombay and Calcutta in 1726. The
real attempts were made to strengthen the municipal function through resolutions
by Lord Mayo, the Governor-General of India in 1870 and then by Lord Ripon in
1882, Lord Ripon’s Resolution (Lord Ripon’s resolution is regarded as Magna
Carta of local government in India) introduced the system of election with a limited
franchise and also approved non-official majorities in all municipalities and
replaced even the district collector by a non-official chairman. After that the
subject of local self-government was considered to the Royal Commission on
Decentralization (1907) because Lord Curzon the descendant of Lord Ripon was
in favour of centralization. But the recommendations of Royal Commission were
implemented at the time of Montague Chelmsford reforms of 1919. The
Government of India Act, 1919, enlarged the scope of taxation by local self-
government and introduced a dual system of governance for empowering the
provincial governments to control the local institutions. Local self-governments
continued to function under the control of provincial governments or the district
administration (Gupta et. al, 2006). After the Government Act of India, 1919, the
Simon Commission Report, also observed that “efficiency of local self-government
depends upon the control or pressure which is exercised by the provincial
government”. The Government of India Act, 1935 was very important event during
the British rule which introduced the autonomy of local provincial government and
enlarged the function of local self-government aiming at empowerment of local
self-governments in India. The task force on planning and development of Small
and Medium Town and Cities (1975), the Study Group on Strategy of Urban
Development (1983) and others has made useful recommendations for the
smoothness of urban development in India. In August 1988, the Government set
up the National Commission on Urbanisation (NCU), under the chairmanship of
C.M. Correa, to review and analyse the urbanisation process like urban
management, urban housing, and urban poverty and also to formulate the policies
like resources allocation, legal framework, information system. This commission

16
recommended the establishment of a National Urbanization Council (NUC), an
Indian Council for Citizens' Action (ICCA) and recommended that every town with
a population of more than 50,000 be provided with an urban community develop-
ment department through which development programmes are implemented
(Bhatacharya,2009). The year 1985 proved to be a landmark year because the
Ministry of Urban Development was set up at the union level. After that an effort
was made in the form of 65th
amendment bill by the Prime
Minister Rajiv Gandhi to ensure
municipal bodies being vested
with necessary powers and
removed their financial
constraints so that they become
able to perform function
effectively as units of local
government but this bill was not
passed in the Rajya Sabha in
1989. In December, 1989 the
National Front Government
reviewed the provisions of the
65th amendment bill and it was
introduced in Lok Sabha in 1990
but this bill was again defeated
with the dissolution of Lok Sabha. In 1991, Narasahima Rao government took
charge and introduced the same bill in the Lok Sabha with a few modifications.
Finally, it was passed by both the houses. It received the assent of the president of
India on 20 April, 1992 and was published in the gazette as the Constitution
Amendment Act, 1992. It came into force on 1st June 1993). The Act introduced a
new part in the Constitution namely part IX-A covering Articles from 243P to 243
ZG. It also introduced schedule 12th in the Constitution, which lists 18 subjects
(Box-1) coming under the jurisdiction of municipalities. The main provisions of this
Act have given in the Appendix Part (A) (Sharma, 2011).

17
2.3 Structure and Composition of the Urban Local Governance
Before 1992, state governments were given power to constitute four different types
of Municipalities namely Municipal corporations, Municipal committees/councils,
Notified area committee and Town area committee. But in 1992 the 74th amendment
act was passed and it made the provision of three types of municipalities instead of
four namely Municipal corporations, Municipal committees/councils and Notified
area committee & Town area committee has been changed into Nagar panchayats.
The attempt made by the central government is only to bring the uniformity
throughout the country which is based on the principle of the democracy. The
structure of municipalities is given in Table 2.1.
Table 2.1 Structure of Municipalities
Types of Municipalities
Before 1992 After 1992
Municipal corporation
Established in metropolitan areas or big cities; Wider functions and larger powers than councils, enjoy more autonomy and have larger revenue resources; Separation of deliberative from executive functions and vesting of all executive powers in an appointed authority that is independent of the elected body.
Constituted in “large urban areas”
Municipal committee/council
Most popular form of local government in urban areas; Set up in cities and large towns; Extent of State control is relatively larger than corporations.
Constituted in “small urban areas”
Nagar Panchayat Constituted after 1992
Constituted in “areas in transition from rural to Urban
Notified area committee
Set up by State government in medium and small towns; Created for areas which do not fulfil conditions for constitution of councils but are otherwise important; Also created for newly developing towns or areas where industries are being established; All members including chairman are nominated by State government and not elected.
Abolished
Notified town committee
Semi-municipal authority constituted for small towns; Members are either wholly nominated or wholly elected, or partly nominated and partly elected.
Abolished
Source: Challenges for Urban Local Government in India, (2006) www2.lse.ac.uk/asiaResearchCentre/

18
2.4 Composition of Municipalities
According to the 74th amendment act municipal area is divided into several wards
on the basis of population and the elections are conducted every five year by the
departments of State government for the post of councillors and one person is get
elected as councillor from each ward. There is also the provision of the elections
for the post of a Mayor in Municipal corporations and a Chairperson (also known
as a president/chairman) in Municipal Councils and Nagar panchayats. Besides,
the state government also appoints the staffs which are viewed as the most
important part of the municipality. The appointed staffs are trained to handle duties
and are made aware about the quality of life at the ward level. To enable wider
participation in municipal affairs, seats in local governments are reserved for some
sections of the society. In addition to the appointed, nominated and the elected
functionaries, ex-officio persons are also affiliated to the local government. A
typical composition of an urban local government is shown in Table 2.2.
Table 2.2 Composition of Municipalities
Category Municipal Corporation Municipal Council/Nagar
Panchayat
Elected Members
Mayor; Deputy Mayor
Councillors/Elected
Ward Representatives
Chairperson/President; Vice-
President, Councillors/Elected
Ward Representatives
Appointed Staff
Municipal Commissioner
Subordinate Staff
Executive Officer
Subordinate Staff
Nominated
Members Selected Staff Selected Staff
Ex-officio Members MPs, MLAs, MLCs MPs, MLAs, MLCs
Source: Challenges for Urban Local Government in India, 2006
www2.lse.ac.uk/asiaResearchCentre/
2.5 Functions of Urban Local Government
The 74th constitutional amendment act has placed the important responsibilities on
the urban local bodies. These bodies are responsible for the improvement of the
efficiency of programmes and services, to mobilize local resources and to provide

19
coherent planning and delivery of the services at the local level. In fact the state
government provide an exhaustive list of functions, which are classified into
obligatory (Compulsory) and discretionary (Optional) functions. The obligatory
functions are necessary to be performed by the local government. To perform
these obligatory functions there is the provision of the sufficient budget in the form
of income from the taxes, non-taxes and grants by the state and central
government. Failure to perform any of these functions may force the State
government to supersede a municipality. Discretionary functions are not
compulsory but it depends upon the availability of the funds. Municipal functions
listed in the State Municipal Acts (According to the schedule 12th of the
Constitution, which lists 18 subjects Box-1) can be seen through the Table 2.3
which is divided in two categories obligatory or discretionary. Primary Education is
the responsibility of the local bodies in a large number of states.
Table 2.3 Functions of Urban Local Government
Obligatory Functions Discretionary Functions
Supply of pure and drinkable water;
Laying out of area
Construction and maintenance of public streets
Securing or removing dangerous buildings or places
Lighting and watering public streets
Construction and maintenance of public parks, gardens, libraries, museums, rest houses, leper homes, orphanages and rescue homes for women, etc.
Regulations of offensive, dangerous or obnoxious trades and callings or practices
Planting and maintenance of roadside and other trees
Cleansing public streets, places and sewers Housing for low income groups
Maintenance or support of public hospitals Making a survey
Establishment and maintenance of primary schools
Organizing public receptions, public exhibitions, public entertainment, etc.
Registration of births and deaths Provision of transport facilities with the municipality
Removing obstructions and protections in public streets, bridges and other places
Promotion of welfare of municipal employees
Naming streets and numbering house Providing music for the people
Source: Local government in Asia and Pacific: A comparative study, India
www.unescap.org/huset/lgstudy

20
2.6 Sources of Income
The Municipal Bodies of every state have to perform a vast array of functions for
which they require a substantial amount of financial resources to execute their
functions and they generate the financial resources from the various external and
internal resources. Internal sources comprise income generated from various
taxes and non-taxes levied by the municipality. External sources include funds
obtained (in the form of grants, loans, etc.) from the Central government, State
government, domestic institutions, financial intermediaries and capital markets.
Table 2.4 describes the sources of Income of the Municipal Bodies.
Table 2.4 Sources of Income for Urban Local Government
Internal Sources
Description External Sources
Description
Taxes
Property-Tax, Advertisement-Tax and Vehicle-Tax. Tax on Consumption and sale of electricity. Betterment tax on increase in urban land values caused by the execution of any development or improvement work. Tax on deeds of transfer of immovable property is collected by the State Government and the amount collected within the area under the jurisdiction of a corporation is transferred to it etc.
Central Government
Budgetary allocations Central Finance Commission, etc.
Non-Taxes
License and other fees, Duties and Tolls. Rent from properties. Receipts from markets, Slaughter houses, fairs and Renting of road- sides, etc.
State Government
Budgetary allocations State Finance Commission. Shared taxes with Local-Govt.–Entertainment tax, Motor vehicle tax, etc.
Domestic Institutions
LIC, ILFS, IDFC, etc.
Source: Challenges for Urban Local Government in India, 2006
www2.lse.ac.uk/asiaResearchCentre.

21
2.7 Constitution and Composition of the Municipal Bodies (Article 243Q) in
Punjab
In Punjab, the municipal bodies are also divided into three categories namely
Municipal corporations for the larger urban areas with a population of three lakh or
more. Municipal councils for smaller urban areas (further classified in to class A,
class B, and class C municipalities on the basis of their population and revenue
generation capacity) and the last third category of the Municipal bodies is the
Nagar Panchayats, Nagar Panchayats for transitional areas from rural to urban
areas. These bodies are governed according to the Punjab Municipal Act 1911
and the Punjab Municipal Corporation Act 1976 was amended in 1994 after the
74th amendment (1992).
The parameters of population and income for the larger urban area as 'Municipal
corporations', smaller urban areas as 'Municipal councils' and transitional urban
areas as 'Nagar panchayats' have been decided according to the changed criteria
that is described in the Punjab Municipal Bill,1999. Table 2.5 presents the
specified parameters of Population and income used to designate a city with
different urban local body.
Table 2.5 Parameters for the Urban Population and Income
Sr. No. Class or urban local bodies Population Revenue Generated
1 Municipal Corporation 3 lakh or above 2 crore or above
2 Municipal Council Class I 50,000 to 3 Lakh 50 Lakh to 2 crore
3 Municipal Council Class II 10,000 to 50,000 15 Lakh to 50 Lakh
4 Municipal Council Class III Up to 10,000 Up to 15 Lakh
5 Nagar Panchayats 5,000 and above More than150 per
head
Source: Key Paper On Urban Local Self Government Institution in Punjab: History Structure, Capacity and Emergency Challenges
2.8 Area and Population of Punjab Municipal Corporation and Council
In Punjab there are Five Municipal Corporation namely Ludhiana, Amritsar,
Jalandhar, Patiala and Bathinda. Population ranking shows that Ludhiana
(1398467) is at number one, Amritsar (1003917) is at second place, Jalandhar is
at third (714077) followed by the Patiala (323884) and Bathinda (217256) at fourth
and fifth respectively. Out of total 50,362 sq. km area of state, the area of
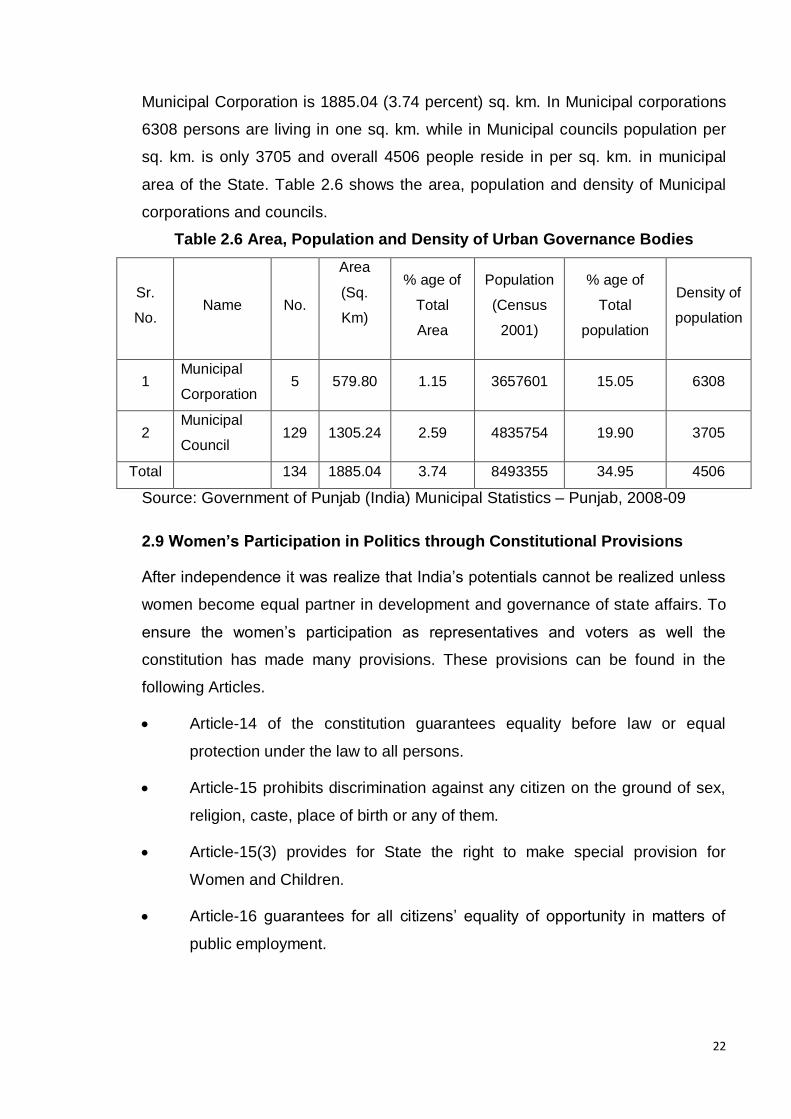
22
Municipal Corporation is 1885.04 (3.74 percent) sq. km. In Municipal corporations
6308 persons are living in one sq. km. while in Municipal councils population per
sq. km. is only 3705 and overall 4506 people reside in per sq. km. in municipal
area of the State. Table 2.6 shows the area, population and density of Municipal
corporations and councils.
Table 2.6 Area, Population and Density of Urban Governance Bodies
Sr.
No. Name No.
Area
(Sq.
Km)
% age of
Total
Area
Population
(Census
2001)
% age of
Total
population
Density of
population
1 Municipal
Corporation 5 579.80 1.15 3657601 15.05 6308
2 Municipal
Council 129 1305.24 2.59 4835754 19.90 3705
Total 134 1885.04 3.74 8493355 34.95 4506
Source: Government of Punjab (India) Municipal Statistics – Punjab, 2008-09
2.9 Women’s Participation in Politics through Constitutional Provisions
After independence it was realize that India’s potentials cannot be realized unless
women become equal partner in development and governance of state affairs. To
ensure the women’s participation as representatives and voters as well the
constitution has made many provisions. These provisions can be found in the
following Articles.
Article-14 of the constitution guarantees equality before law or equal
protection under the law to all persons.
Article-15 prohibits discrimination against any citizen on the ground of sex,
religion, caste, place of birth or any of them.
Article-15(3) provides for State the right to make special provision for
Women and Children.
Article-16 guarantees for all citizens’ equality of opportunity in matters of
public employment.

23
Article- 325 of the constitution guarantees political equality to women and
prohibits exclusion from the electoral rolls on the basis of sex, caste,
religion etc.
Article 326 of the constitution guarantees equal political status to every
citizen of India including women
The Directive Principles of State Policy articulate the key policy goals of Indian
welfare state. The duty of the state is to provide an appropriate policy, enabling
condition and environment to fulfil the Fundamental Right through the Directive
Principles: Article 38, Article 39 (a), Article 39 (d), Article 39(e), Article 41, Article
42 and Article 51(1) are exclusively dealt with welfare of women (Basu, 2012).
Besides these articles many other important initiatives have also been undertaken
by the Government. The committee on the status of women in India (CSWI) was
set up in the year 1971 to look into different aspects of status of women in India
including their political participation which released its report in 1974. The report of
the committee noted the ineffectiveness of the representation of women in
Panchayat Governance System. It started taking initiatives and efforts to
encourage participation of women in the rural local governance as well as urban
governance system. This committee also recommended for the reservation for
women in the legislation bodies which were opposed by some members of the
committee. The National Education Policy, 1986 and the ‘Report of the National
Commission on self-employed women’ and ‘Women in the Informal Sector and the
‘National Policy’ for women 2001’ etc. have also made significant contribution to
understanding the issues related to women participation in the local governance of
India (Rout, 2012).
2.9.1 73rd and 74th Constitutional Amendment Acts: Instrument for Women’s
Participation
The historic 73rd and 74th constitutional amendment acts were passed and came
into force in 24th April, 1993. The most significant features of these Acts are the
provision of reservation of 1/3 of seats for women (Article 243 D) in all the 3-tier of
Rural Local Governance system. It ensures that not less than one third of the total
number of seats to be filled by direct elections in every Panchayat shall be

24
reserved for women and those seats may be allotted by rotation to different
constituencies in a Panchayat (NIAS, 2001).
Article- 243(D) provides that the office of the chairperson in the Panchayats
at the village or any other level shall also be reserved for women and such
reservation shall not be less than one third of total number of offices. If
there is no Women Chairperson then the post of Vice-chairman shall be
reserved for women at all levels of rural local governance.
Article-243(T) of the Constitution provides for the reservation of seats in
favour of scheduled castes and scheduled tribes in proportion according to
their population in the municipal area. It also makes the provision for the
reservation of one-third seats in favour of women candidates. There is
parallel reservation for the women of Scheduled Castes and Scheduled
Tribes though, the Act does not provide for the reservation in favour of other
backward classes, the State Legislature may, by law make such reservation
in their favour. It should be further noted that the reservation in favour of
Scheduled Castes, Scheduled Tribes and women is applicable in offices of
members as well as Chairman of the Municipalities (Basu, 2012).
The provisions of reservation under the Constitutional 73rd and 74th Amendment
Acts-1993 were made to ensure that women play a major role in rural local self-
governance system. It provided women an opportunity to demonstrate their
potential and to prove their capability as partners in the process of rural
development. The reservation has also given many women a greater
understanding of the functioning of politics, in particular the importance of political
parties, although it is at local level after this Constitutional Amendment a large
number of women have been elected to the PRIs (Jain, 1996).

25
Chapter 3
Women’s Participation in Indian Politics
“Achieving the goal of equal participation of women and men in decision making
will provide a balance that more accurately reflects the composition of society and
is need in order to strengthen democracy and promote its proper functioning
….Without the active participation of women and the incorporation of women’s
perspective at all levels of decision making, the goals of equality, development and
peace cannot be achieved”
-Fourth World Conference on Women, Beijing, 1995: Article 181
Political participation may be defined as voluntary participation in political affairs
through membership, voting and taking part in the activities of the political parties,
legislative bodies and or politically motivated movements (Matthai, 2006). Political
participation means not only exercising the right to vote, but also power sharing,
co-decision is making, co-policy making at all levels of governance of the state
(Singh, 2000). Political participation is broadly defined as being a process through
which individual plays a role in political life of his society, has the opportunity to
take part in deciding what the common goals of that society are and the best way
of achieving these goals. Political participation refers to actual participation in
these voluntary activities by which members of the society share in the selection of
rules and directly or indirectly in the formulation of public policy (Rashmi, 2000).
In other words, Political participation is a process by which people take part in
political activities like: to get the membership of political parties, to hold the
election campaigning, attending party meetings, demonstrations, communication
with political leaders, to contest the elections, membership in representative
bodies, influencing decision-making bodies and other related activities.
Indian constitution, which came into existence in the year 1950, gives the right to
take part in all political activities through the Article 325 which guarantees political
equality to women and prohibits exclusion from the electoral rolls on the basis of
sex, caste, religion and Article 326 of the constitution guarantees equal political
status to every citizen of India including women. The constitution also granted the
universal adult franchise to all its citizens. In addition to this, India is also a

26
signatory to a number of international agreements like CEDAW, BPFA (Mir, 2008).
In other words, under the constitution and national and international commitments,
the state is obliged to promote the rights of women including the political equality
without any discrimination on the basis of sex. However, due to these
constitutional and legal provisions, although the percentage of female voters have
increased from 37.1 percent in the first general elections held in1952 to 48.10
percent in 2009 Lok Sabha elections (ECI, 2011-12) but women have not achieved
the adequate and proper representation in the legislative and other decision
making bodies. Report given by the IPU, 2013 reveals that India has only 60
women lawmakers in the current 543 members of Lok Sabha while there are 24
women MPs out of 240 members in Rajya Sabha at present. Two seats in Lok
Sabha and five in the Upper House have been lying vacant. This report also
reveals that India has only 11 percent representation of women in Lok Sabha and
10.7 percent in Rajya Sabha.
It may be because that the political domain continues to be perceived as male
centred and it is, therefore, not conducive for women. Women have been treated
by formal political institutions as a mean to fulfil their own interest. Women lack
access and control over apex bodies where decisions and policies are discussed
and formulated. Women’s participation in political process and chances to exercise
their political right is hindered due to the absence of stringent mechanisms,
policies and laws. In the absence of such laws and policies women lack the self-
confidence and skills needed to function effectively in the public sphere. The under
representation of women and absence of women from position power strengthen
their exploitation and deprivation (Narzary, 2013). In this context the women’s
greater participation in political domain becomes more necessary. The Indian
government therefore, passed the 73rd and 74th Amendment Acts to empower the
women politically. These affirmative steps, although, has created the space for
women in local governments, yet failed to guarantee the non- discriminative and
conducive environment for the women and for their political equality, but this legal
intervention in higher bodies i.e. Parliament and State Legislative is still absent.
Therefore, the issue of women’s participation gained more importance (Pujari,
2012).

27
It is interesting to note that our neighbouring countries Nepal, Pakistan and
Bangladesh have provided the reservation of seats for women in their parliaments.
As Article 114 of 1991 of the constitution of Nepal has reserved the 5 percent
seats in the lower house and 3 seats in the upper house for Nepalese women.
Pakistan made provision for 33 percent reservation of women in the national
assembly and 36 out of 342 seats (i.e. 17%) in the senate as per Election Law
Quota in 2002. Bangladesh has assured 15% reserved seats for women in its
parliament as per 14th constitutional amended introduced in 2004 (Patel, 2010).
But the history of the Indian democracy reveals that the Indian government fails to
pass the reservation bill which makes the provision of the 33 percent for women in
Parliament and State Legislative Assembly. Lapse of the ‘Women Reservation Bill’
and no amendments in the ‘Peoples Representation Act’ that enjoins the political
parties to allocate the 33 percent tickets to the women candidates, reveals that the
women in Indian politics continues to be under represented, unheard and excluded
from the decision making process (Subermanian, 2002).
Their actual participation in government and government institutions is not
possible unless they provide their adequate share in the political system of the
country. Different scholars and writers keep on lamenting on the issue of low
women’s participation. However, the actual position of the women participation in
the political affairs of the country can be gauged through the assessment and
analysis of the data available from different sources. It has been tried to highlight
the picture of women’s representation in politics by analysing different election
results.
3.1 Number of Women Elected Representatives
According to the provisional population totals of census 2011, out of total
population i.e. 1,210,193,422, 623,724,248 are males and they constitute 51.53
percent whereas 586,469,174 are females and they form approximately half of the
population i.e. 48.46 percent. And as per the statistical report given by the election
commission of India, 2011-12, in 2004 elections there were 321997066 women
electors i.e. 48.26 percent while male electors were 34940864 i.e. 51.74 percent in
2004. In 2009 elections also female electors constituted 48.10 percent and male
electors constituted 51.90 percent.

28
From the above figure it is clear that women’s percentage as electors and their
population is not very less as compare to that of men but still women are not been
able to get an equal status and share in the political sphere because there are only
59 women in Lok Sabha out of 545 and 21 in Rajya Sabha out of 245 got elected
as member of Parliament even after the adoption of constitution which heralded a
new era for the equality of women in India. Despite the fact that women’s
participation in the political arena and in the decision making bodies is not in
proportion to their population, except in the local bodies. Their effective
participation, even in these bodies, leaves much to be desired (Narain et. al,
2005). To study the number of elected representatives in India, it has been tried to
analyze the women’s representation in elections and their participation in Indian
Legislatures over the last few years.
3.2 Participation of Women in the Parliament – Lok Sabha (Lower House)
and Rajya Sabha (Upper House)
Data collected on the extent of women’s participation in government at both local
and central levels shows that, despite efforts of some improvements in the social
and economic condition of women in India in the last few decades, women are still
profoundly underrepresented. In all the elections held since independence, women
had had the voting rights. Women’s representation in all the elections held since
1952 may be seen in the Table 3.1. The number of women contestants in
Parliamentary elections has not increased significantly over the years. Female
representation in the lower house of the Indian Parliament is much less than the
world average of 20 percent, lower than the “critical mass” required to introduce
gender parity in political decision making and legislation (Sivan, 2010). Political
parties are still reluctant to bring women candidates at national level governance
process. In the second Lok Sabha election, the number of women representatives
was merely 22, which was only 4.4% of the total seats in the Lok Sabha. The sixth
Lok sabha in the year 1977 saw an all-time low of just 19 women representatives.
The fourteenth Lok Sabha had 45 women i.e. 8.29% of the total seats represented
by women candidates. It increased marginally over the years.

29
Table 3.1 Participation of Women in Lok Sabha Elections
Lok Sabha Election
Total no of seats
Total seats
contested by women
Seats won by women
Percentage of seats won of
contested seats
Percentage of seats won of total seats (women
members)
First-1952 489 - - - -
Second -1957 494 45 22 48.89 4.45
Third-1962 494 66 31 46.97 6.27
Fourth-1967 520 67 29 43.28 5.57
Fifth- 1971 518 86 21 24.41 4.05
Sixth-1977 542 70 19 27.14 3.50
Seventh-1980 542 143 28 19.58 5.16
Eight-1984 543 162 42 25.93 7.74
Ninth-1989 543 198 29 14.64 5.34
Tenth-1991 543 326 37 11.35 7.10
Eleventh-1996 543 599 40 6.68 7.36
Twelth-1998 543 274 43 15.69 7.91
Thirtheen-1999 543 284 49 17.25 9.02
Fourtheen-2004
545 355 45 12.67 8.29
Fifteenth-2009 545 556 59 10.61 10.8
Source: Election Commission of India. http://eci.nic.in/eci_main1/ElectionStatistics.aspx.
Analysis of trends of women’s’ participation to contest elections in Rajya Sabha
Table 3.2 indicates that there has been a poor representation of women in the
Rajya Sabha also. In 1952 there were only 16 women members in the Rajya
Sabha which was 7.3 percent of the total seat which increased to 15.5 percent in
1991 but again in 1998 the percentage reached to the level of 1952 that was 7.3
%. In year 2004 there was a slight increase (11.4%) in the percentage of women
representative but again dropped to 8.6 percent in 2009.

30
Table 3.2 Women Representation in the Rajya Sabha (Upper House)
Year Total seats (No.) No. of women members
Percentage of women members to total
1952 219 16 7.3
1957 237 18 7.6
1962 238 18 7.6
1967 240 20 8.3
1971 243 17 7.0
1977 244 25 10.2
1980 244 24 9.8
1985 244 28 11.4
1990 245 24 9.7
1991 245 38 15.5
1992 245 17 6.9
1994 245 20 8.1
1996 223 20 9.0
1997 245 18 7.3
1998 245 15 6.1
1999 245 19 7.8
2004 245 28 11.4
2009 245 21 8.6
Source: Election Commission of India. http://eci.nic.in/eci_main1/ElectionStatistics.aspx
3.2 Representation of Women in State Legislatures
Another Table 3.3 depicts the performance of women as contested and elected
candidates during the last three elections in all State Legislative Assembly. From
this table one can examine that women’s political representation at the state level
as gauged by their membership in State Legislatures is abysmally low and the
number of female representatives in Legislative Assemblies in most of the states
of India is also below the 20 percent mark reflecting a pan Indian gender exclusion
from electoral participation and quality representation (Rai, 2011). The latest data
from the States show that the percentage of elected women in Jammu & Kashmir,
Arunachal Pradesh, Goa, Gujarat, Tripura, Uttar Pradesh, Maharashtra,
Rajasthan, Haryana have observed more than 10 percent but in Bihar the
percentage of contested and elected women increased significantly from 5.86
percent in 2000 and 10.29 percent in 2005 to 13.99 in last elections held in 2010.

31
In other states like Andhra Pradesh, Punjab, Madhya Pradesh and Chhattisgarh
also the percentage of elected women members has increased in their respective
Legislative Assembly elections but their representation as a whole is not very
encouraging. Pondicherry, Nagaland and Mizoram are the three states where no
women got elected during the last three elections. In these states the performance
of women is nil. In the National Capital Territory Delhi the percentage has declined
from 12.86 (1998) to 4.29 (2008). In a big state like Uttar Pradesh also only 35
women were elected against total 403 seats. After examining this table 3.3 it can
be said that despite the increase in electoral participation of women, their
representation in the formal political structures has not changed much.
Table 3.3 Participation of Women in State Legislative Assemblies
States/UT Years of
elections
No.
of
seats
No. of
women
contestants
No. of
women
elected
Percentage of
successful
candidate
Percentage of
representation
for women
Andhra
Pradesh
2009 294 300 34 11.33 11.56
2004 294 161 26 16.15 8.84
1999 294 157 28 17.83 9.52
Arunachal
Pradesh
2009 60 9 2 22.22 3.33
2004 60 9 0 0.00 0.00
1999 60 4 1 25.00 1.67
Assam 2011 126 85 14 16.47 11.11
2006 126 70 13 18.57 10.32
2001 126 55 10 18.18 7.94
Bihar
2010 243 307 34 11.07 13.99
2005 Oct 243 138 25 18.12 10.29
2005Feb 243 234 3 1.28 1.23
2000 324 189 19 10.05 5.86
Chhattisgarh 2008 90 94 11 11.70 12.22
2003 90 62 5 8.06 5.56
Delhi
2008 70 81 3 3.70 4.29
2003 70 78 7 8.97 10.00
1998 70 57 9 15.79 12.86
Goa 2012 40 10 1 10.00 2.50
2007 40 14 1 7.14 2.50
2002 40 11 1 9.09 2.50
Contd….

32
States/UT Years of
elections
No.
of
seats
No. of
women
contestants
No. of
women
elected
Percentage of
successful
candidate
Percentage of
representation
for women
Gujarat 2007 182 88 16 18.18 8.79
2002 182 37 12 32.43 6.59
1998 182 49 4 8.16 2.20
Haryana 2009 90 69 9 13.04 10.00
2005 90 60 11 18.33 12.22
2000 90 49 4 8.16 4.44
Himachal
Pardesh
2007 68 25 5 20.00 7.35
2003 68 31 4 12.90 5.88
1998 68 25 6 24.00 8.82
Jammu &
Kashmir
2008 87 67 3 4.48 3.45
2002 87 30 2 6.67 2.30
1996 87 17 2 11.76 2.30
Jharkhand 2009 81 107 8 7.48 9.88
2005 81 94 3 3.19 3.70
Karnataka 2008 224 107 3 2.80 1.34
2004 224 101 6 5.94 2.68
1999 224 62 6 9.68 2.68
Kerala 2011 140 83 7 8.43 5.00
2006 140 70 7 10.00 5.00
2001 140 54 8 14.81 5.71
Madhya
Pradesh
2008 230 226 25 11.06 10.87
2003 230 199 19 9.55 8.26
1998 320 181 26 14.36 8.13
Maharashtra 2009 288 211 11 5.21 3.82
2004 288 157 12 7.64 4.17
1999 288 86 12 13.95 4.17
Manipur 2012 60 15 3 20.00 5.00
2007 60 12 0 0.00 0.00
2002 60 7 1 14.29 1.67
Meghalaya 2008 60 21 1 4.76 1.67
2003 60 14 2 14.29 3.33
1998 60 15 3 20.00 5.00
Mizoram 2008 40 9 0 0.00 0.00
2003 40 7 0 0.00 0.00
1998 40 10 0 0.00 0.00
Contd….

33
States/UT Years of elections
No. of seats
No. of women
contestants
No. of women Elected
Percentage of successful candidate
Percentage of representation
for women
Nagaland 2008 60 4 0 0.00 0.00
2003 60 3 0 0.00 0.00
1998 60 0 0 0.00 0.00
Orissa 2009 147 129 7 5.43 4.76
2004 147 55 11 20.00 7.48
2000 147 59 13 22.03 8.84
Punjab 2012 117 93 14 15.05 11.97
2007 116 56 7 12.50 6.03
2002 117 71 8 11.27 6.84
Pondicherry 2011 30 6 0 0.00 0.00
2006 30 12 0 0.00 0.00
2001 30 9 0 0.00 0.00
Rajasthan 2008 200 154 28 18.18 14.00
2003 200 118 12 10.17 6.00
1998 200 69 14 20.29 7.00
Sikkim 2009 32 15 4 26.67 12.50
2004 32 6 3 50.00 9.38
1999 32 6 1 16.67 3.13
Tamilnadu 2011 234 143 17 11.89 7.26
2006 234 156 22 14.10 9.40
2001 234 112 25 22.32 10.68
Tripura 2008 60 31 3 9.68 5.00
2003 60 19 2 10.53 3.33
1998 60 21 2 9.52 3.33
Uttar
Pradesh
2012 403 583 35 6.00 8.68
2007 403 370 23 6.22 5.71
2002 403 344 26 7.56 6.45
Uttrakhand 2012 70 63 5 7.94 7.14
2007 69 56 4 7.14 5.80
2002 70 72 4 5.56 5.71
West Bengal 2001 294 174 34 19.54 11.56
2006 294 139 37 26.62 12.59
2001 294 114 28 24.56 9.52
Source: Statistical Report of Assembly Elections-Election Commission of India http://eci.nic.in/eci_main1/ElectionStatistics.aspx

34
From the above analysis it becomes clear that their representation as members of
Legislative Assembly has not changed much even after the constitutional
assurance. Today women are facing difficulty to get their foot into the politics
without having any strong political background or strong political relations with the
political parties. The presence of few women in leadership positions cannot
encourage the entry of more numbers of women in political arena. The analysis of
the above data clearly depicts that women’s participation and representation
needs considerable attention (Narayan, 2005).
3.3 Women Contesting Elections
Elections have been considered the pillar of the democracy. Elections create a
sense of involvement and participation among the citizens and increased the
interest in the political affairs of the country. In India elections are conducted after
every five years and modes of conduct are based on the Representation of People
Act-1951. India being the largest democracy in the world is also a land of
diversities has ensured the adequate representation of all majority and minority
communities through the electoral processes. Electoral process works as an agent
of social change by electing the representatives, periodically. It is an integrating
factor within the political system and a mechanism of social change at the three
main levels i.e. Village, the state and the centre (Forrester, 1968).
3.4 Women as Electors
The right to vote provides the citizens a mean to participate in the process of
governance. Voting has been the most universal and regularized political activity,
and in terms of the overall impact of the citizen on governmental performance, it
may be the single most important act. Voting represents a mass involvement of
most citizens at scheduled times. As a part of the electoral process it exerts a
great pressure upon the leaders and hence it is called a blunt but powerful
instrument of control upon the government and decision makers (Verba and Nie,
1972). Political participation means to participate as electors, as voters, as
contestant candidate and as elected candidates. Though voting is an important
indicator of political participation and mobilization, but it is not necessarily indicator
of representation. Voting is a tool of political equality and it mobilizes women but

35
voting by itself does not result in the desired end of equality (Subermanian, 2002).
Their current participation as voter, as electors can be analysed through the
following Figures 3.1 and 3.2 and through the Tables B(1) and B(2) given in
Appendix Part (B) in Politics during the last two elections.
From the analysis of results of last two parliamentary elections held in 2004
(14th) and 2009 (15th), it is clear that the numbers of women electors were
321997066 and they constitute 48.26 percent while male electors were
34940864 and they constitute up 51.74 percent in 2004 elections. In 2009
elections, female electors constituted 48.10 percent and male electors
constituted 51.90 percent. From the Figures 3.1 and 3.2 it can be concluded that
the percentage of women electors is almost similar to the men electors. The
exercise of franchise by a citizen is the most obvious manifestation of political
participation.
Table B (3) and Table B (4) given in Appendix Part (B) portrays the percentage
of female voters who used their right of vote during the elections 2004 and 2009.
During the elections 2004 the percentage of female and male voters was 45.97
percent and 53.85 per cent respectively but there were few states such as
Kerala, Meghalaya, Daman & Diu Lakshadweep and Pondicherry where the
percentage of female voters was observed high. In 2009 Lok Sabha elections
female and male voters share was observed 46.88 percent and 52.97 per cent
respectively.
From the above analysis (show the percentage of voter turnout) we find that
Indian women have been becoming more aware about the right of their adult
franchise. The percentage of women’s voter turnout had increased from 37.1% in
the 1951-1952 first general elections to 46.88 percent in 2009 general elections.
The gap between male and female voter turnout was 15.9 percent in 1951-1952
first general elections and it decreased slowly over the years which came down
to 7.88 percent in 2009 general elections but this narrowing gap does not show
the women participation as elective candidates, but as voters only. So the
increment in the percentage of voter turnout has not led to the path of more
representation of women in the Legislative bodies.

36
Fig. 3.1 State Wise Percentage of Electors (General Elections, 2004)
Fig. 3.2 State Wise Percentage of Electors (General Elections, 2009)

37
Fig.3.3 State Wise Percentage of Voters (General Elections, 2004)
Fig. 3.4 State Wise Percentage of Voters (General Elections, 2009)
38
3.5 Women as Contesting Candidates
The democratic system in India is based on the principle of universal adult
suffrage, and any Indian citizen who is registered as a voter and is over 25 years
of age is allowed to contest elections to the Lok Sabha or State Legislative
Assemblies (Figueras, 2011). But Women’s political participation was very
negligible immediately after the independence though they had played a vital role
for getting independence for the country. The statistics clearly indicate that during
the 1952 elections the percentage of women contestants were as low as 2.29 per
cent. Shri Jawaharlal Nehru was quite appalled at the low representation of
women in Parliament at that time and expressing his anguish over the issue he
wrote thus on the matter in his letter to the Chief Ministers:
“There are over 700 of them as between the two Houses. I have noticed with
great regret how few women have been elected. I suppose this is so in the State
Assemblies and Councils also. I think we are very much to be blamed. It is not a
matter of showing favour to any one or even of injustice, but rather of doing
something, which is not conducive to the future growth of our country. I am quite
sure that our real and basic growth will only come when women have a full chance
to play their part in public life. Our laws are man-made, our society dominated by
man, and so most of us naturally take a very lopsided view of the matter. We
cannot be objective, because we have grown up in certain grooves of thought and
action. But the future of India will probably depend ultimately more upon the
women than the men”
Jawahar Lal Nehru, Letters to the Chief Ministers, VolI-I, p.615
In the later years the number of women contesting elections increased at a very
low pace. The two elections where there has been a noticeable increase in the
number of women contestants are those held in 1980 and 1998. They occurred at
the time when the Committee for the Status of Women, 1974 made their
recommendations and the 73rd and 74th Constitutional Amendments were passed.
In 2004 and 2009 elections also the percentage of women contestants grew but as
compared to men contestant the share of women is very low. According to Haider.
(1998, p.386), “One encouraging fact that emerges from the data available for the

39
Lok Sabha elections from the year 1952 to 1996 is that the total number of women
who contested the elections has been consistently going up.”
Table 3.4 Women as Contestants
Year Males Females Males
Percentage Females
Percentage Total
1952 1831 43 97.71 2.29 1874
1980 4478 142 96.93 3.07 4620
1984 5149 164 96.91 3.09 5313
1991 8374 325 96.26 3.74 8699
1996 13353 599 95.71 4.29 13952
1998 4708 271 94.56 5.44 4979
2004 5080 355 94.28 5.72 5435
2009 7514 556 93.58 6.42 8070
Source: i) Women in India - A Statistical Profile, 1997, Department of Women and Child Development, New Delhi.
ii) Election Commission of India
http://eci.nic.in/eci_main1/ElectionStatistics.aspx
Figures 3.5 and 3.6 show the participation of women as contestants in
different states of India during 2004 and 2009 elections. In both the elections
2004 and 2009, there was no state in which the percentage of female
candidates was observed high as compare to their male counterparts.
Moreover there were few states like Arunachal Pradesh Meghalaya, Mizoram,
Nagaland, Lakshadweep and Daman & Diu where no female even contested
the elections.

40
Fig. 3.5 Percentage of State Wise Contesting Candidates (General Elections 2004)
Fig.3.6 Percentage of State Wise Contesting Candidates (General Elections 2009)

41
3.6 Women as Winners
“It is very difficult for women to make up her mind to enter Politics. Once she
makes up her own mind, and then she has to prepare her husband and her
children and her family. Once she has overcome all these obstacles and applies
for the ticket, then the male aspirant against whom she is applying makeup all
sorts of stories about her and after all these, when her name goes to the party
bosses, they do not select her name because they fear losing that seats”
Sushma Sawaraz, MP of India
It is true that women contestants have to face a lot of opposition from family,
community and political leaders if women decide to enter into politics. Political
parties also do not provide the candidature, and do not make the fund available to
women candidates easily during the elections. If the members of political party
provide the fund then they start to underestimate women candidates after
achieving the success in the elections. Ground reality is that the process of
selection and nomination for candidature is biased because the party gives the
ticket only to those members who have more chances to win the elections. It is
therefore at the party level that the principle of equality must be put into practice.
Moreover, political parties, which are traditionally male bastions, need to be further
encouraged to revise their status, admit more women into their internal structures
and include them as candidates in elections (Dahlerup, 2005).
In 2009, the number of women who contested the elections for 543 Lok Sabha
seats was 556 of which 59 won (7.5 per cent of total) which is 10.6 percent of the
total women contested. Out of total 7514 men contested in 2009, 484 (92.49 per
cent of total) won the elections which is 6.44 percent of the total men contested.
This clearly shows that the chances of winning of women are high (almost double)
as compared to men Table 3.5. In 2004 election 494 men out of total 5080
contested men (9.8 percent) while 45 women out of total 355 women contested
(12.67 percent) won the seats, thus all the time women success rate is very high.

42
Table 3.5 Women’s Representation
Year
Electors Voters Contested Elected
Male Female Male Female Male
(number)
Female
(number) Male Female
2004 51.74 48.26 53.85 45.97 94.28
(5080)
5.72
(355)
94.38
(498)
5.62
(45)
2009 51.90 48.10 52.97 46.88 93.58
(7514)
6.42
(556)
92.49
(484)
7.51
(59)
Source: Election Commission of India.
http://eci.nic.in/eci_main1/ElectionStatistics.aspx
If we look at the state wise number of elected women in Parliament only from the
Punjab through the Table B(7) given in Appendix Part B and Figures 3.7 and 3.8
depicts that only 2 women namely Preneet Kaur and Paramjit Kaur Gulshan got
elected out of the total Punjab Parliament Constituencies seats i.e. Eleven (11)
Candidates. And, in 2009 elections, Table B (8) had given in Appendix Part B and
from the Fig.3.8, four females from the Punjab state who won the parliament seats
or constituencies. The names of four Member of Parliament are Harsimrat Kaur
Badal from Bathinda, Santosh Chowdhary from Hoshiarpur, Paramjit Kaur
Gulshan Faridkot and Preneet Kaur from Patiala. In Haryana, Madhya Pradesh,
Punjab and Meghalaya elected women percentage was more than 20 in 2009
election. In short their participation as elected candidates has been abysmally poor
in Politics. Besides this there were some states where there was no female who
contested the elections, while winning the election is far-fetched dream in
respective states.

43
Fig. 3.7 Percentage of State Wise Elected Candidates in Parliament (General Elections 2007)
Fig. 3.8 Percentage of State Wise Elected Candidates in Parliament (General Elections 2009)

44
The above analyses clearly indicates that there are very few women present in
Parliament and legislative bodies in the Indian states and the proportion of women
in the legislature remains low even in those states where women have a better
quality of life in terms of access to education and life expectancy such as Kerala
(Chhibber, 2002). There is no doubt that due to the right to vote and to participate
in the electoral process on the ground of equality women are becoming aware and
participating in the elections but still they are not actively participating in the
Political life. Women’s participation in the political process is very crucial to
strengthen the democratic institutions or traditions and to struggle against
subjugation. The struggle for women’s reservation at the higher levels of political
institutions is still going on. In other words the enactment of the 85th constitutional
amendment act is still seems to be a distant dream. The struggle for equality in
economic, social and political spheres will continue until they are achieved. Only
then can women charter their political agenda to build a gender just society
(Shamim and Kumari, 2002).

45
Chapter 4
Women’s Participation in Punjab Politics
Punjab is one of the states in northern India that is known for its rich history and
deep cultural heritage. In 1947, the Punjab Province of British India was divided
into two parts i.e. Indian Punjab and Pakistani Punjab. The Indian Punjab, again,
was divided in 1966 and three states namely Haryana, Himachal Pradesh and the
present Punjab came into existence. The state is sub-divided into three parts
namely Malwa, Majha and Doaba. Malwa region covers the southern part of the
Punjab and it comprises the cities like Ludhiana, Patiala, Bathinda and Mohali,
whereas Majha embraces modern districts of Amritsar, Gurdaspur and Tarn Taran
and Doaba is one of the most fertile regions which includes bigger cities such as
Jalandhar, Hoshiarpur, Adampur, Nawansher and Phagwara. A political boundary
map has been shown in Figure 4.1 and Figure 4.2, which show twenty districts
(Fazilka and Pathankot were formed in the year 2011). The present form of the
Punjab Legislative Assembly is unicameral and it consists of 117 members,
directly elected from 117 single -seat constituencies with the tenure of five years.
The state of Punjab is divided into twenty two districts (Chamber, 2011).
Fig 4.1 Map of Punjab (Source: PRSC, Ludhiana)

46
Fig 4.2 Assembly Constituencies of Punjab (Source: NIC)

47
Table: 4.1 Area, Population and Headquarter of Each District of Punjab
Sr. No. District Area in 000'
sq. Km
Population Headquarters
2011 Census (Provisional Data)
1 Amritsar 5,094 24,90,891 Amritsar
2 Bathinda 3,382 13,88,859 Bathinda
3 Faridkot 1,469 6,18,008 Faridkot
4 Fatehgarh Sahib 1,180 5,99,814 Fatehgarh Sahib
5 Ferozepur 5,300 20,26,831 Ferozepur
6 Gurdaspur 3,569 22,99,026 Gurdaspur
7 Hoshiarpur 3,364 15,82,793 Hoshiarpur
8 Jalandhar 2,634 21,81,753 Jalandhar
9 Kapurthala 1,633 8,17,668 Kapurthala
10 Ludhiana 3,767 34,87,882 Ludhiana
11 Mansa 2,169 7,68,808 Mansa
12 Moga 2,216 9,92,289 Moga
13 Mukthsar 2,615 9,02,702 Muktsar
14 Nawanshahr 1,266 6,14,362 Nawanshehar
15 Patiala 3,627 18,92,282 Patiala
16 Rupnagar 2,056 6,83,349 Rupnagar
17 Sangrur 5,021 16,54,408 Sangrur
18 Barnala* 1,410 5,96,294 Barnala
19 Mohali* 1,098 9,86,147 Mohali
20 Tarn Taran* 2,449 11,20,070 Tarn Taran
21 Pathankot 0 0 Pathankot
22 Fazilka 0 0 Fazilka
Punjab 50,362 sq.Km 2,77,04,236
Source: Census of India, 2011,
http://www.censusindia.gov.in/2011-prov-results/
4.1 Political History of Punjab
Before Independence, there were four main parties namely Akali Dal, Indian
National Congress, Muslim League and the Unionist party. The Unionist party
dominated the political scene of Punjab under the leadership of Sir Sikander Hayat
Khan from the World War-I to 1946 Punjab Assembly elections. After the death of
Sir Sikander Hayat khan, the Muslim League emerged as the largest party and
during the elections of 1946 declared to form the government in the province but
this party failed to achieve an absolute majority. As a result, the coalition
government was formed by three parties; the Congress, the Unionist party and the

48
Akali Dal. From 1947-1966 the Punjab politics was mainly dominated by largest
party of India i.e. Indian National Congress. In 1966, Punjab was divided into
Haryana, Himachal Pradesh and Punjab under the State Reorganization Bill,
1966. Afterwards, under the leadership of Jarnail Singh Bhindranwale, AkaliDal
started gaining importance in Punjab. After the death of Bhindranwale in the
Operation Bluestar, Alkali Dal lost its Political importance and also power in
Punjab politics and Indian National Congress again came into power in 1992. In
1997 Akali Dal was voted to power and in 2002, Congress again marked the
victory (Khan, 2005). In both the 2007 and 2012 elections of Punjab Legislative
Assembly, SAD-BJP coalition formed the government in Punjab.
4.2 Women in Punjab Politics
In 1962, when Punjab was not divided, it had 154 assembly constituencies. In the
state assembly elections held in the same year, 742 male and 14 female
candidates were in the fray, out of which 146 males and 8 females (5 percent) won
their respective seats. The number of male electors in that year was 5874037 (54
percent) and number of female electors was 4871615 (46 percent). After 50 years,
in the assembly election of 2012, there were 117 seats for which 985 male and
103 females contested the elections out of which 93 males (88 percent) and 14
females (11.96 percent) were able to get success. The number of male and female
electors in 2012 was 9381331(54.18 percent) and 8384356 (48.37 percent)
respectively. The above data shows that despite the percentage of female electors
being 46 percent and 48 percent in 1962 and 2012 respectively, their
representation in state assembly is not proportionate and was only 5 percent and
12.82 percent two elections (ECI, Punjab, 2011-12).
The above data clearly depicts their participation has increased as voters but their
representation in legislative assembly remains low i.e.12.82 percent. Political
participation is quite different from the political representation because in Political
participation one can involve the use of right to vote during the elections, to
contest the elections for the public offices but the political representation is to
have hold on the decision making process and to act as an representative of the
people. For instance, the increase of votes cast by women in elections from 10 to
40% of total votes casted in eight years signifies a form of increase in participation.
49
But when the number of women holding public offices, when compared to men, is
relatively low, there is under representation (Agbalajobi, 2010).
There are many social, cultural and familial reasons due to which women are not
able to come in the front and take part actively. There is also absence of strong
economic base as they are mainly dependant on their families and do not have
their direct source of income. Besides, they are expected to take up household
chores, due to which they are most of the time remain inside their houses. Male
dominance is so prominent in case of women representatives in local bodies that
their male relatives are active and dispose their (Banarjee,1984).
4.3 Women as Elector and Voter
The right to vote provides the citizens a mean to participate in the decision making
process through the elected representatives. In a country like India most of the
citizens participate in governmental affairs only through voting. Voting, therefore,
has been considered the most universal and regularized political activity. In the
case of women, voting is the most important mode of political participation
because it broadens the base of women’s political participation and helps to
strengthen women’s faith in the political process which is otherwise dominated by
men (Patel, 2010).
The result of 2007 Punjab Assembly Elections Table 4.2 and Table 4.3 indicates
that out of the total electors i.e. 16918355, male electors were 8764790 and they
constituted 51.74% while female electors were 7668535 and they constituted
48.26% which was slightly less as compare to that of male voters. In 2012, the
total voters of all twenty districts were 17754814 and male & female numbers were
9381331 and 8384356 respectively. But in these two elections (2007 & 2012) the
situation of male electors is quite different because their percentage increased
from 51.74 in 2007 elections to 54.18 in 2012 elections whereas the percentage of
female electors has been observed almost the same during the 2012 elections i.e.
48.37 percent as it observed in 2007 i.e. 48.26. From the below two tables it
becomes clear that there was no district in Punjab, during both the State Assembly
Elections, where the percentage of Female voters was observed higher than that
of male voters.

50
Table 4.2 Percentage of Male and Female Electors in Punjab
Assembly Election, 2007 Parliamentary Constituencies
(District Names)
Electors (%)
Total Male % Female %
Gurdaspur 1445269 51.16 48.84
Amritsar 2218746 51.83 48.17
Jalandhar 1356812 51.01 48.99
Kapurthala 499312 50.23 49.77
Hoshiarpur 1024688 50.13 49.87
Nawanshahr 379150 50.31 49.69
Ludhiana 2062304 52.29 47.71
Ropar 798123 52.36 47.64
Patiala 1322027 52.07 47.93
Fatehgarh 309681 52.07 47.93
Sangrur 1403285 52.56 47.44
Ferozepur 1203181 51.80 48.20
Moga 558433 52.25 47.75
Faridkot (SC) 467475 52.04 47.96
Mukthsar 553016 51.96 48.04
Bathinda 769240 52.72 47.28
Mansa 547613 52.76 47.24
Total 16918355 51.74 48.26
Source: Statistical Report on Legislative Elections of Punjab, 2007.Election Commission of India
Table 4.2 Percentage of Male and Female Electors in Punjab
Assembly Election, 2012
Parliamentary Constituencies/ District
No. & Name
Electors (%)
Total Male (%) Female (%)
01-Gurdaspur 1519854 52.26 47.74
02-Amaritsar 1651717 52.70 47.30
03-Tarn-Taran 682791 52.21 47.79
04-Kapurthala 514829 51.73 48.27
05-Jalandhar (SC) 1393747 52.03 47.97
06-Hoshiarpur(SC) 1073470 51.50 48.5
07-Nawan Shahr 420167 51.68 48.32
08-Rupnagar 487786 53.18 46.82
09-SAS Nagar 529519 53.30 46.69 10-Fatehgarh Sahib 375522 53.21 46.79
11-Ludhiana 2138829 53.47 46.53
12-Moga 665279 53.13 46.87
13-Firozepur 1242523 52.99 47.01
14-Muktsar 586062 52.72 47.28
15- Faridkot (SC) 398845 52.93 47.07
16-Bathinda 904702 53.62 46.38
17-Mansa 502711 53.60 46.40
18-Sangrur 1021069 53.66 46.33
19-Barnala 420866 53.43 46.57
20-Patiala 1224526 53.58 47.36
Total 17754814 54.18 48.37
Source: Chief Electoral Officer, Punjab

51
Fig. 4.3 Male and Female Electors (Punjab Assembly Election, 2007)
Fig. 4.4 Male and Female Electors (Punjab Assembly Election, 2012)
In 2007 State Assembly Election the percentage of votes polled by male and
female voters was 51.59 and 48.41respectively (Table 4.4) whereas in 2012
elections, it was 52.38 and 47.62 respectively (Table 4.5). The analysis of both
the Assembly Elections (2007 & 2012) depicts that there were three districts
namely Kapurthala, Hosiarpur (Sc) and Nawanshahr where the percentage of
votes polled by female voters is more than that of male voters.
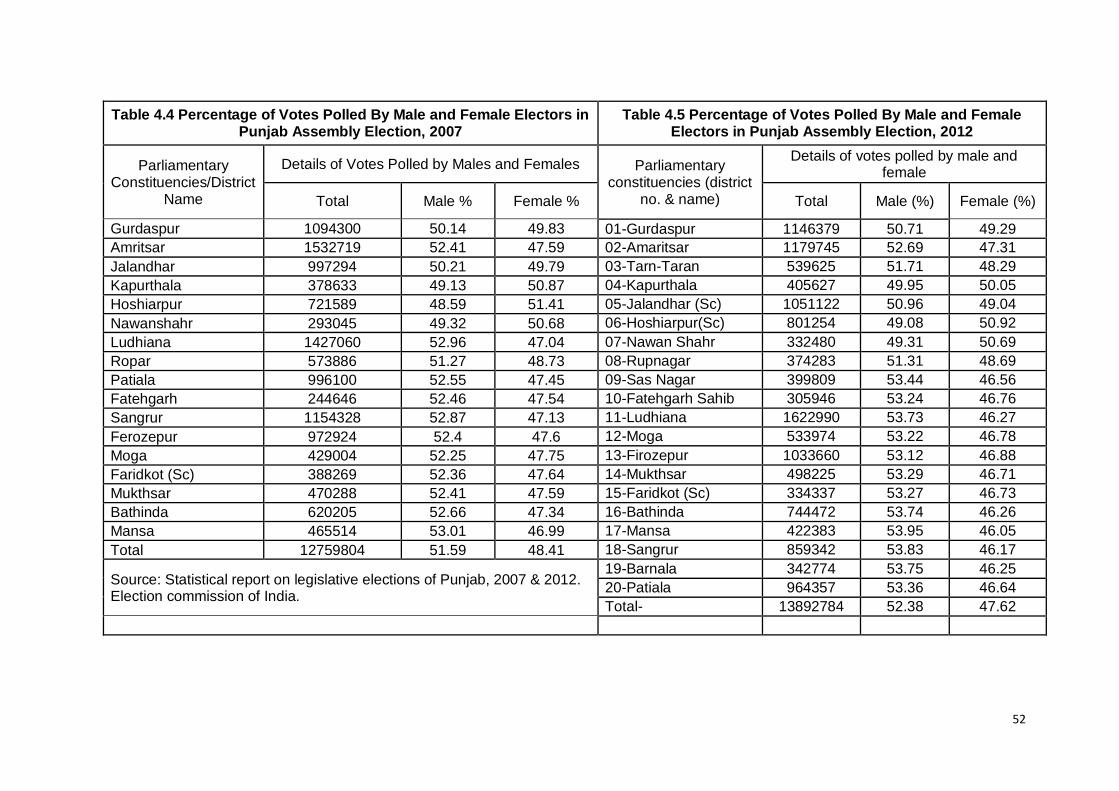
52
Table 4.4 Percentage of Votes Polled By Male and Female Electors in Punjab Assembly Election, 2007
Table 4.5 Percentage of Votes Polled By Male and Female Electors in Punjab Assembly Election, 2012
Parliamentary Constituencies/District
Name
Details of Votes Polled by Males and Females Parliamentary constituencies (district
no. & name)
Details of votes polled by male and female
Total Male % Female % Total Male (%) Female (%)
Gurdaspur 1094300 50.14 49.83 01-Gurdaspur 1146379 50.71 49.29 Amritsar 1532719 52.41 47.59 02-Amaritsar 1179745 52.69 47.31 Jalandhar 997294 50.21 49.79 03-Tarn-Taran 539625 51.71 48.29 Kapurthala 378633 49.13 50.87 04-Kapurthala 405627 49.95 50.05 Hoshiarpur 721589 48.59 51.41 05-Jalandhar (Sc) 1051122 50.96 49.04 Nawanshahr 293045 49.32 50.68 06-Hoshiarpur(Sc) 801254 49.08 50.92 Ludhiana 1427060 52.96 47.04 07-Nawan Shahr 332480 49.31 50.69 Ropar 573886 51.27 48.73 08-Rupnagar 374283 51.31 48.69 Patiala 996100 52.55 47.45 09-Sas Nagar 399809 53.44 46.56 Fatehgarh 244646 52.46 47.54 10-Fatehgarh Sahib 305946 53.24 46.76 Sangrur 1154328 52.87 47.13 11-Ludhiana 1622990 53.73 46.27 Ferozepur 972924 52.4 47.6 12-Moga 533974 53.22 46.78 Moga 429004 52.25 47.75 13-Firozepur 1033660 53.12 46.88 Faridkot (Sc) 388269 52.36 47.64 14-Mukthsar 498225 53.29 46.71 Mukthsar 470288 52.41 47.59 15-Faridkot (Sc) 334337 53.27 46.73 Bathinda 620205 52.66 47.34 16-Bathinda 744472 53.74 46.26 Mansa 465514 53.01 46.99 17-Mansa 422383 53.95 46.05 Total 12759804 51.59 48.41 18-Sangrur 859342 53.83 46.17
Source: Statistical report on legislative elections of Punjab, 2007 & 2012. Election commission of India.
19-Barnala 342774 53.75 46.25 20-Patiala 964357 53.36 46.64 Total- 13892784 52.38 47.62

53
Fig. 4.5 Votes Polled by Male and Female Voters (Punjab Assembly Election, 2007)
Fig.4.6 Votes Polled by Male and Female Voters (Punjab Assembly Election, 2012)

54
4.4 Women as Contestant
In 2007 elections (Tables 4.6) there were total 1024 candidates who contested the
elections, out of which male candidate were 992 or 94.42%, which was far greater
than female candidates because there were only Fifty –five i.e. 5.55% female
candidates who contested the elections. A mere 5% of the tickets were given to
women candidates during the 2007 elections. This was even lower than in 2002,
when 8% of the tickets went to women (Sharma, 2011). In 2012 Legislative
Assembly elections of Punjab (Table 4.7) there were 1172 candidates out of which
980 male candidates and only 92 female candidates contested the elections. It
clearly indicates that the percentage of male candidates was 90.05% which was
very high as compare to their female counterparts i.e. only 9.45%. From these
tables it becomes quite clear that although their percentage as contested
candidates is not proportionate to their population but it has increased a little from
5.55 percent in 2007 elections to 9.45 in 2012 elections.
From the above interpretation it is clear that the women who contested the
elections were not in a large number as compared to the male candidates. Political
parties during the elections are driven by the principle of ‘Winnabilty’ of the
candidates from the angel of prospect of government formation. As a result the
concept of the ‘Winnabilty and the quest for the formation of government compel
the parties to deny tickets to women unless they are sure to win. Political parties
consider that women have less chances of winning the elections and also assert
that it is difficult to get sufficient number of qualified women, which is not
necessarily true in reality. Women have been active and vocal both in times of
peace and crisis. They have been active in movements of peace, women and child
welfare, trade unionism, food adulteration, price rise and deforestation and many
other issues candidates. Moreover in India, the structure and pattern of the
political parties are still patriarchy and reluctant to support the women while giving
the tickets to contest the elections (Subermanian, 2002).

55
Table 4.6 Percentage of Male and Female Contested Candidates in 2007-Punjab Assembly Elections
Parliamentary constituencies (district name)
Candidates
Total Male Female Male % Female%
Gurdaspur 87 83 6 98.63 7.44
Amritsar 121 115 6 95.02 4.98
Jalandhar 94 90 4 96.79 3.21
Kapurthala 31 28 3 89.16 7.79
Hoshiarpur 51 47 4 91.25 8.75
Nawanshahr 30 28 2 93.33 6.67
Ludhiana 132 129 3 98.42 1.58
Ropar 43 39 4 91.67 8.33
Patiala 86 83 3 97.05 2.95
Fatehgarh 0 20 3 87.31 12.69
Sangrur 87 79 8 90.34 10
Ferozepur 73 70 3 94.94 5.06
Moga 28 28 0 100 0
Faridkot (Sc) 27 27 0 100 0
Mukthsar 46 42 2 92.15 4.01
Bathinda 54 52 2 95.83 4.17
Mansa 34 32 2 93.3 6.7
Total 1024 992 55 94.42 5.55
Source: Statistical report on legislative elections of Punjab, 2007 & 2012. Election commission of India.
Table 4.7 Percentage of Male and Female Contested Candidates in 2012-Punjab Assembly Elections
Parliamentary Constituencies (District No. & Name)
Candidates
Total Male Female Male % Female%
01-Gurdaspur 70 61 9 88.1 11.9
02-Amaritsar 98 92 6 93.91 6.09
03-Tarn-Taran 32 29 3 89.29 10.71
04-Kapurthala 37 34 3 91.48 8.52
05-Jalandhar (Sc) 179 72 7 83.21 6.78
06-Hoshiarpur(Sc) 55 52 3 94.62 5.38
07-Nawan Shahr 27 25 2 93.94 6.06
08-Rupnagar 26 22 4 84.17 15.83
09-Sas Nagar 30 28 2 92.96 7.04
10-Fatehgarh Sahib 28 26 2 90.74 9.26
11-Ludhiana 137 134 3 97.82 2.18
12-Moga 32 30 2 92.86 7.14
13-Firozepur 80 72 8 90 10
14-Mukthsar 42 37 5 87.63 12.37
15-Faridkot (Sc) 33 27 6 79.59 20.41
16-Bathinda 60 57 3 94.58 5.42
17-Mansa 21 19 2 89.68 10.32
18-Sangrur 70 64 6 91.4 8.6
19-Barnala 30 27 3 89.18 10.82
20-Patiala 85 72 13 85.92 14.08
Total 1172 980 92 90.05 9.45

56
Fig. 4.7 Male and Female Contested Candidates (Punjab Assembly Election, 2007)
Fig. 4.8 Male and Female Contested Candidates (Punjab Assembly Election, 2012)
57
Table 4.8 depicts the percentage of votes polled to male and female candidates who
contested the elections. In 2007, the result of the general elections to the Legislative
Assembly of the Punjab shows that total votes polled on Electronic Voting Machine
were 12750203 out of which male candidates obtained 11998472votes and female
candidates obtained 643234 votes i.e., 93.22% and female got only 6.78% votes. The
result of 2012 elections also depicts exactly the same situation of female candidates
because in the elections, percentage of votes polled to female candidates was 10.21
percent which is negligible as compared to the male candidates who obtained 89.56%
votes. Although the percentage of votes polled to female candidates increased from
6.78% in 2007 to 10.21% in 2012 but still it is very low and highlights their miserable
conditions in elections as well as in politics. Table 4.8 given below explains the average
percentage of votes polled to male and female candidates in the districts of Punjab.
Though the percentage of votes polled to female candidates is quite low, yet in all these
constituencies, females also emerged as winners. The reason of low percentage is due
to the totality of votes polled to different candidates. This fact is being supported by
Table no. 4.9. This table gives the exact number of candidates who were winners in the
assembly elections of 2007 and 2012. This table proves that though the average
number of votes polled to female candidate is low yet they emerged winners. Moreover,
the performance of female candidates has improved significant in 2012 elections as
compared to the elections of 2007.

58
Table 4.8 Percentage of Votes Polled to Male and Female Candidates (Elections 2007 & 2012)
2007 Punjab Assembly Elections 2012 Punjab Assembly Elections
Parliamentary Constituencies (District
No. & Name)
Male % Female % Parliamentary Constituencies (District
No. & Name)
Male% Female %
Amritsar 95.25 4.75 01-Gurdaspur 84.67 15.33 Jalandhar 96.44 3.56 02-Amaritsar 93.95 6.05 Kapurthala 63.05 36.95 03-Tarn-Taran 99.34 0.66 Hoshiarpur 100 0 04-Kapurthala 75.99 24.01 Nawanshahr 85.85 14.15 05-Jalandhar (Sc) 94.10 5.90 Ludhiana 99.91 0.09 06-Hoshiarpur(Sc) 94.31 5.69 Ropar 91.78 8.22 07-Nawan Shahr 80.07 19.93 Patiala 99.92 0.08 08-Rupnagar 86.60 13.4 Fatehgarh 79.26 20.74 09-Sas Nagar 98.18 1.82 Sangrur 77.91 22.09 10-Fatehgarh Sahib 88.71 11.28 Ferozepur 99.80 0.20 11-Ludhiana 99.94 0.06 Moga 100 0 12-Moga 89.26 10.74 Faridkot (Sc) 100 0 13-Firozepur 92.86 7.14 Mukthsar 99.91 0.09 14-Mukthsar 88.27 11.73 Bathinda 99.25 0.75 15-Faridkot (Sc) 95.44 4.56 Mansa 99.67 0.33 16-Bathinda 99.74 0.26 Total 93.22 6.78
17-Mansa 80.63 19.37 18-Sangrur 80.49 14.95 19-Barnala 83.57 16.43
Source: Statistical Report on Legislative Elections of Punjab, 2007.Election Commission of India.
20-Patiala 85 15.00 Total 89.56 10.21 Source: Chief Electoral Officer of Punjab,

59
Fig. 4.9 Votes Polled to Male and Female Candidates (Punjab Assembly Election, 2007)
Fig.4.10 Votes Polled to Male and Female Candidates (Punjab Assembly Election, 2012)

60
4.5 Women as Winner
Table 4.9 depicts the condition of women in politics is very depressing. In 2007 out of
116 winners 109 were males and seven were the females who achieved the success
during the 2007 elections In the next elections, 2012 the number of female candidates
although increased from seven (7) in 2007 to fifteen (15) but it was very low as compare
to male winner because there were 102 male winners out of 117. From this table it is
clear that during the 2007 elections in Amritsar out of the total 15 seats, 14 were male
and only 1 was female candidate who won the elections. In Kapurathala there were four
seats out of which 2 seats were won by male candidates and 2 by female candidates. In
Hoshiarpur, elections were contested for the 7 seats out of which 6 seats were won by
the male candidates and 1 by the female candidate. In Sangrur district out of the 10
seats 7 seats were won by the male candidates and three by the female candidates. In
the rest of the districts all winners were the male candidates. This table also depicts that
Women entered in the state politics from ten districts (Gurdaspur-3, Amritsar-1, Kapurthala-1,
Hoshiarpur-1, NawanShahr-1, Barnala-1, Moga-2, Muktsar, Sangrur-2, and Patiala-2) in
2012 election. It can be concluded that their representation in State Assembly is not
proportionate and was only 5 percent and 12.82 percent in 2007 and 2012 elections
respectively.
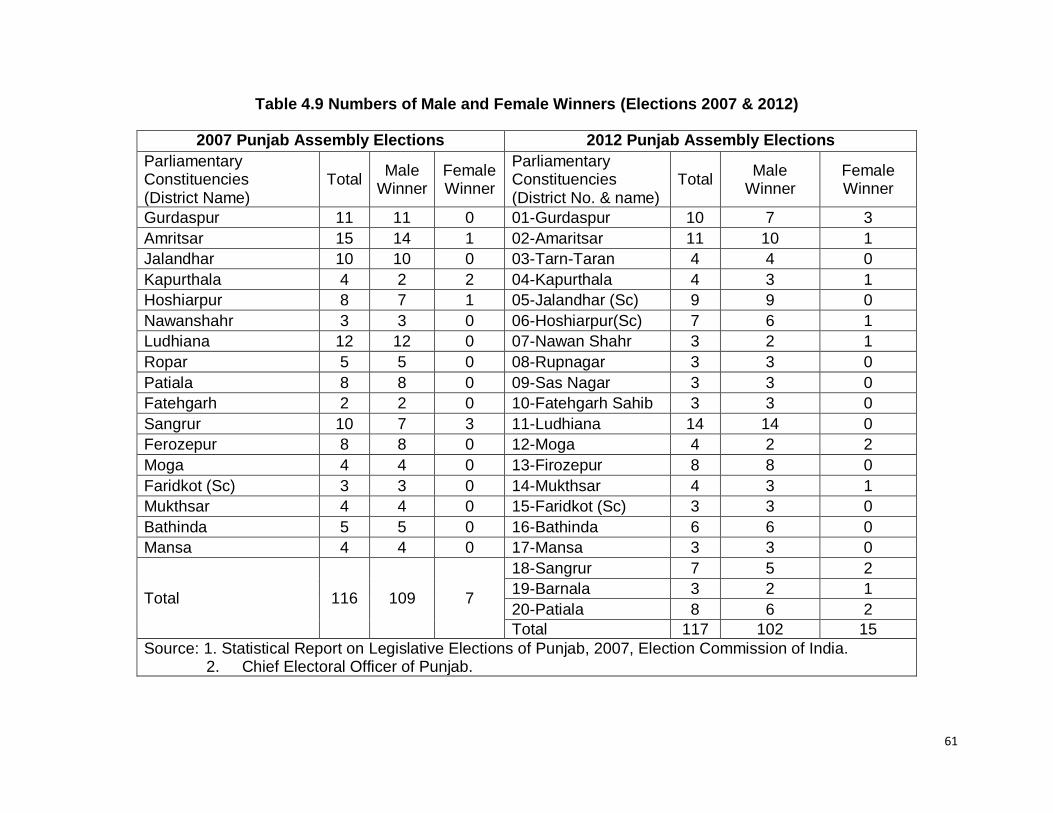
61
Table 4.9 Numbers of Male and Female Winners (Elections 2007 & 2012)
2007 Punjab Assembly Elections 2012 Punjab Assembly Elections Parliamentary Constituencies (District Name)
Total Male
Winner Female Winner
Parliamentary Constituencies (District No. & name)
Total Male
Winner Female Winner
Gurdaspur 11 11 0 01-Gurdaspur 10 7 3 Amritsar 15 14 1 02-Amaritsar 11 10 1 Jalandhar 10 10 0 03-Tarn-Taran 4 4 0 Kapurthala 4 2 2 04-Kapurthala 4 3 1 Hoshiarpur 8 7 1 05-Jalandhar (Sc) 9 9 0 Nawanshahr 3 3 0 06-Hoshiarpur(Sc) 7 6 1 Ludhiana 12 12 0 07-Nawan Shahr 3 2 1 Ropar 5 5 0 08-Rupnagar 3 3 0 Patiala 8 8 0 09-Sas Nagar 3 3 0 Fatehgarh 2 2 0 10-Fatehgarh Sahib 3 3 0 Sangrur 10 7 3 11-Ludhiana 14 14 0 Ferozepur 8 8 0 12-Moga 4 2 2 Moga 4 4 0 13-Firozepur 8 8 0 Faridkot (Sc) 3 3 0 14-Mukthsar 4 3 1 Mukthsar 4 4 0 15-Faridkot (Sc) 3 3 0 Bathinda 5 5 0 16-Bathinda 6 6 0 Mansa 4 4 0 17-Mansa 3 3 0
Total 116 109 7
18-Sangrur 7 5 2 19-Barnala 3 2 1 20-Patiala 8 6 2 Total 117 102 15
Source: 1. Statistical Report on Legislative Elections of Punjab, 2007, Election Commission of India. 2. Chief Electoral Officer of Punjab.

62
Fig. 4.11 Number of Male and Female Winners (Punjab Assembly Election, 2007)
Fig. 4.12 Number of Male and Female Winners (Punjab Assembly Election, 2012)
63
At last, after observing the whole scenario we find that women’s representation is
abysmal. Actually, our prevailing values that are based on cultural, traditional and
patriarchal practices and male dominance on political institutions prevent women from
exercising and enjoying their political rights. The absence of stringent affirmative action
in the form of reservation bill also impedes the women’s entry at the centre and the
state level. The absence of reservation makes the entry only of those women who are
connected with political families and those belonging to the upper economics class.
There is no doubt ‘reservation is a tool that begins to repair the damage cost by
centuries of the discrimination that exists ubiquitously across political parties, social
classes and community division, but solely reservation cannot bring more women into
political arena because the reservation bill introduced only limited number of women in
political fields against their population.
In other words the results of the Punjab assembly elections depicts that even after so
many constitutional assurance, they are still left outside the system. The absence of
women with sufficient representation in the legislative assemblies or in the decision
making positions impoverishes the development of democratic principle and inhibits the
development of the society. Male-dominated political institutions of government do not
promote women or women's issues. Thus it remains imperative to emphasize that
women themselves must organize and mobilize their networks, learn to communicate
their interests with different organizations and push for mechanisms to enhance their
own representation. The electoral system and the electoral laws must be reformed
adequately for a more free and fair representation (Shvedova, 2002).
4.6 Elected Women Representatives in Panchayati Raj
The 73rd Constitution Amendment, by making the provision of reservation of one-third
of the seats for females all over the country, has created space for women in political
participation and decision-making at the grass root level. Apart from one-third
reservation of women in PRIs, the Act has also given powers and responsibilities
including resource management, family planning, education and health. The creation of
such quota system at the grass root level for the vast majority of local women, being
illiterate and poor, has come to occupy as much as 43% of the seats, spurring the

64
election of increasing numbers of women at district, provincial and national levels. Since
the advent of PRI, the percentages of women in various levels of political activity have
increased from 4-5% to 25-40% (Aslatha, 2010). This landmark legislation gave India
the unique distinction of having more number of elected women representatives than
the rest of the world together. The presence of more than 1 million elected women
representatives in the institutions of local governance in rural India has rightly been
termed as a ‘silent revolution’ within the process of democratic decentralization ushered
in by the 73rd amendment. Out of the total 28 lakh elected Panchayat representatives,
around 10 lakh are estimated to be women (Ministry of Panchayti Raj, 2011) With the
amendment in Article 243(D) of the Constitution of India in 2009, which provide 50%
reservation for women in seats and also offices of Chairpersons in all three tiers of
Panchayats, the number of elected women representatives (EWRs) is expected to rise
to more than 14 lakhs (Singh, 2012). The representation of women as elected
representatives in the three tiers of Panchayats can be analysed through the following
tables.
4.7 Women in Local Governance of Punjab
The 'panchayat' in rural India and ‘municipalities’ in urban India are defined in the
constitution as institutions of local-governance. The local governa or Panchayat Raj
Institutions (PRIs) are under the control of the State Governments. In the rural areas a
three-tier structure has been adopted. They are: Gram Panchayat (b) Taluk Panchayat
(c) Zilla Panchayat for every district. In the urban areas there are the Municipal bodies
called the NagaraPalike i.e., Nagara Panchayats, Municipal Councils (for smaller urban
areas) and Municipal Corporations (for larger urban areas). Table 4.10 shows the
number of rural local bodies in Punjab. Punjab is divided into three regions Malwa,
Majha and Doaba and these three regions comprise 21 districts. In 21 districts there are
20 District Panchayat (ZilaParishad), 142 Block Panchayts (Panchayat Samiti) and
12800 Gram Panchayats.

65
Table 4.10 Numbers of Rural Local Bodies in Punjab State (As on 31st March 2012)
State Districts District Panchayat
(ZilaParishad)
Blocks Block Panchayts (Panchayat
Samiti)
Village/Gram Panchayats
Punjab 21 20 142 142 12800 Total of India
651 585 6612 6317 240355
Source: Rural Development Statistics, Section-9: Panchayati Raj, www.panchayat.gov
In order to improve the working of the panchayati raj system, Punjab government
appointed several study teams such as Rajinder Singh study team, Badal study team,
Harcharan Singh Committee and Departmental Officers Committee. An observation
made by the Badal Committee is given here.
Table 4. 11 Women in PRIs (Gram Panchayats) in Punjab Region, (2002/2003)
Region Districts
Gram Panchayats
Numbers Elected
members Number of
women
Percentage of women in Gram
Panchayat
Majha Amritsar 1287 9397 991 10.55 Gurdaspur 1592 10734 853 7.95
Doaba
Hoshiapur 1317 8700 3189 36.66 Jullandhar 886 6260 2133 34.07 Kapurthala 535 3570 1279 35.83 Nawaanshahr 445 3132 164 5.24
Malwa
Bathinda 306 2667 818 30.67 Faridkot 181 1428 487 34.10
Fatehgarh sahib 430 2814 989 35.15
Ferozpur 1089 7553 2200 29.13 Ludhiaa 876 6504 2213 34.03 Mansa 242 2016 661 32.79 Moga 326 2814 964 34.26 Muktsar 265 2181 440 20.17 Patiala 1079 7206 1969 27.32 Roopnagar 852 5564 1937 34.81 Sangrur 735 5818 2232 38.36 Total 12443 88358 23519 26.62
Source: Key Paper on Rural Local Self-Government in Punjab: It’s Evolution, Functioning and Functional Deficiencies

66
Table 4.11 shows that the percentage of elected women in Gram Panchayat election is
very low in Amritsar, Gurdaspur and Nawamshahr districts i.e. 10.55 %, 7.95 %, 5.24 %
respectively and women did not able to occupy the mandatory seats. The Sangrur is
the only district of Malwa region where the performance of women is impressive
i.e.38.36 % followed by the Hoisharpur district (36.66 percent) of the Doaba region. And
except these two districts the percentage of elected female in some districts like
Ferozpur is 29.13 %, Muktsar is 20.17 % and Patiala is 27.32 % which is less than thirty
three percent compare to the parliament and Punjab state legislative Assembly.. In
Fatehgarh Sahib and Jallandhar their percentage is slightly higher i.e. 34.07 % and
35.83 % respectively. There is no doubt that women’s participation has been made
possible due to the reservation policy and this very kind of participation can set an
example for the other women to come and take part in the politics and political activities.
Table 4.12 Women in PRIs (PanchyatSamitis) in Punjab Region, (2002/2003)
Region Districts
PanchyatSamitis
Numbers Elected
Members Number of
Women
Percentage of Women in
Panchayat Samitis
Majha Amritsar 16 283 107 37.81 Gurdaspur 15 259 77 29.73
Doaba
Hoshiapur 10 185 60 32.43 Jullandhar 10 173 57 32.95 Kapurthala 5 81 27 33.33 Nawaanshahr 5 83 27 32.53
Malwa
Bathinda 8 134 43 32.09 Faridkot 2 46 13 28.26 Fatehgarh sahib
5 75 25 33.33
Ferozpur 10 187 60 32.09 Ludhiaa 12 204 65 31.86 Mansa 5 85 26 30.59 Moga 5 105 35 33.33 Muktsar 4 82 26 31.71 Patiala 9 172 55 31.98 Roopnagar 7 122 40 32.79 Sangrur 12 210 63 30.00 Total 140 2486 806 32.42
Source: Key Paper on Rural Local Self-Government in Punjab: It’s Evolution, Functioning and Functional Deficiencies

67
Table 4.12 depicts that in Panchayat Samiti elections, women representation is
approximately one third due to reservation but Amritsar was the only district where the
percentage of elected women in Panchayat Samiti was more than the mandatory seats
i.e. 37.81% as compared to the other districts of Punjab. Whereas Faridkot and
Gurdaspur were the two districts where the percentage of elected women in Panchayat
Samitis was low than the 33 percent i.e. 28.26 % and 29.73 % respectively. The
percentage of women in the rest of the districts was slightly less than 33 percent. But
overall performance of elected women in Pabnchayat Samitis is far better than the
Parliament and Legislative Assemblies.
Table 4.13 Women in PRIs (ZilaParishad) in Punjab Region, (2002/2003)
Region Districts
ZilaParishad
Numbers Elected
members
Number of
women
Percentage of women in
ZilaParishad Majha Amritsar 1 25 6 24
Gurdaspur 1 25 8 32 Doaba Hoshiapur 1 21 7 33
Jullandhar 1 19 7 37 Kapurthala 1 10 3 30 Nawaanshahar 1 10 3 30
Malwa Bathinda 1 14 - - Faridkot 1 10 3 30 Fatehgarh sahib 1 10 3 30 Ferozpur 1 22 7 32 Ludhiaa 1 23 7 30 Mansa 1 10 3 30 Moga 1 13 4 31 Muktsar 1 10 3 30 Patiala 1 21 7 33 Roopnagar 1 13 4 31 Sangrur 1 25 8 32 Total 17 281 83 30
Source: Key Paper on Rural Local Self-Government in Punjab: It’s Evolution,
Functioning and Functional Deficiencies
Table 4.13 shows that the overall percentage of elected women in Zilla Parishad was
although less than the reserved seats i.e. 33 percent yet form this table it can be said
that their conditions is far better if we compare it with the elections held at the centre

68
and the state level. In Majha region there was no district where the percentage of
women was observed more than the 33 percent. But in Doaba region there was the
Jullandhar district where the percentage of women was quite high i.e.37 percent and
was followed by the Hoisharpur- 33 percent, Kapurthala-30 percent and Nawaanshahar-
30 percent. This table also depicts that the percentage of elected women in all the
districts of the Malwa region was little less than the 33 percent. In short it can be said
that their participation in Politics is not negligible yet it has been increasing due to the
reservation of one- third seats for the women in the local governance.
Table 4.14 PRI Election Data (2008)
Number of Elected Representatives in all Panchayats
No. of Panchayts
General SC Total Women Men
Number %
Number % Number %
12604 62614 28349 31.2 90963 31809 35 59154 65.03
Number of Women in Village Panchayats
No. of Gram Panchayats
General SC Total Women Men
Number %
Number % Number %
12443 60692 27440 31.1 88132 30875 35 57257 64.96
Number of Women in Block Panchayts (Panchayat Samiti)
No. of Block Panchayats
General SC Total Women Men
Number %
Number % Number %
141 1782 840 32.04 2622 866 33 1756 66.97
Number of Women in District Panchayat (ZillaParishad)
No. of ZillaParishad
General SC Total Women Men
Number %
Number % Number %
20 140 69 33 209 68 32.5 141 67.46
Source: GOI, Ministry of Panchayat Raj, Annual Report, 2007-08, Rural Development Statistics www.panchayat.gov

69
Table 4.14 shows the performance of total elected women in all three tiers of
Panchayats namely Village, Block and District during the elections held in 2008. From
this table 4.13 it becomes clear that overall percentage of women was 35 % which is not
only encouraging but more than the mandatory seats. From this table it becomes clear
that the percentage of elected women at the village level was also more than the 33
percent i.e.35 % whereas the male percentage was 64.96 percent, at the Block level
female percentage was 33 percent and male percentage was 66.97 percent and the
district level the percentage of elected women was slightly less than the stipulates seats
i.e. 32.5 % while the male percentage was 67.46 percent. In short we can say that their
participation as elected representative in the local governance increased significantly
from 29.67 percent in 2002-03 to 35 percent in 2008 elections. Fig 4.13 reveals a
comparative picture of two different year data.
Fig. 4.13 Women in All Three Tiers of Panchayats (2002-2003 and 2008)
Women in Gram
Panchayats Women in Panchayats
Samitis Women in Zilla Parishad
Women in All Three Tiers of Panchayats -2002-2003
Women in Gram Panchayats
Women in Block Panchayats
Women in Zilla Parishad
Women in All Three Tiers of Panchayats -2008

70
The above figures shows that the quota system has brought the considerably number
of women in all three level panchayats. Women’s entrance into grass root level in such
a large number shattered the myth that women are not interested in Politics and have
no time to go to meetings or to undertake the work that is required in political party
processes. Their entry in to political field, due to the resrvation policy, make them feel a
sense of empowernment by attaining the responsibilties and duties as equal to men.
The reservation policy has also brought the women straight from the kitchen into the
fray of politics & administration with no training or experience whatsoever in public life
(Sekhon, 2006). Due to the reservation women are becoming capable to do work and
perform their duties in the political sphere. They have started coming forward to
participate in the local governance and have started raising their voices and making
their perspective felt in decision making. The 73rd amendment act has brought the
considerable changes in the condition of rural women by providing the adequate
representation at different levels of local governance. As a result elected women are
attaining the success by making a place in panchayats all over the India. The situation
of women can become better over a period of time with men changing their mind set
and accepting women in their new roles (Singh, 2008).
4.7 Women in Urban Local Governance in Punjab
Women’s involvement in local governance through the reservation policy has confirmed
their share by allotting the one third seats for women which is affirmative step to
enhance the woman’s share in the political arena. In Punjab there are nine Municpal
Corporations namely Ludhiana, Amritsar, Jalandhar, Patiala, Mohali, Bathinda, Moga,
Phagwara and Pathankot and 129 Municiapal Councils. In the Municipal Corporation
Ludhiana, Amritsar, Jalandhar, Patiala and Bathinda women have occupied 35 to 40
percent of the total seats. Since no data is available regarding the newly formed three
Municipal Corporations namely Moga, Phagwara and Pathankot only six MCs have
been highlighted below. This is because of the reservation policy women have entered
in the governance process but in no single Corporation the post of Mayor is held by any
woman. In Jalandhar and Chandigarh Senior Deputy Mayor is a lady while in Bathinda
and Ludhiana women are the Deputy Mayors.

71
Table 4.15 Number of Female Councillors in Municipal Corporations
Sr..No Municipal
Corporation
Last Year of
election held
No of Councillors
No of female Councillors
Percentage of Female
Councillors Mayor
Sr.Deputy Mayor
Deputy Mayor
1 Bathinda Municipal Corporation
2008 50 19 38 Male Male Female
2 Amritsar Municipal Corporation
2007 60 23 38 Male Male Male
3 Jalandhar Municipal Corporation
2012 60 25 42 Male Female Male
4 Patiala Municipal Corporation
2012 50 18 36 - - -
5 Ludhiana municipal corporation
2012 75 30 40 Male Male Female
6 Chandigarh Municipal Corporation
2011 35 13 37 Male Female Male
Source: Official website of Bathinda, Ludhiana, Patiala ,Jullandhar, Amritsar
http://mcludhiana.com/www.mcjalandhar.in/http://mcbathinda.com/www.amritsarcorp.com/atiala.gov.in/html/corporation.html/ http://mcchandigarh.gov.in/maillist1.htm
.

72
Chapter 5
Women in Urban Local Governance: Glimpse of a Real
Picture through a Case Study
The previous chapters on women’s representation in politics have come out with a
conclusion that women representation is abysmal in politics and reservation has
changed the figure in local governance system. It has become important to find out the
actual participation and performance of women in governance process. Keeping few
objectives in the mind (mentioned in the first chapter) a case study has been
undertaken. A field study has been conducted in Bathinda Municipal Corporation. The
present study includes male and female ward councillors of BMC. Due to some field
difficulty 40 out of 50 ward councillors were selected purposively to collect in-depth
information for this case study.
BMC with 50 wards was formed in 2003 (Fig. 5.1 and Table 5.1) and the first election
was held in year 2008. To understand
the participation of women in local
governance process an interview
schedule was prepared and the ward
councillors, male and female, were
interviewed. The schedule was prepared
under some heads like; personal profile,
awareness about local governance,
participation in election and governance,
participation in decision making process,
transparency and accountability
maintained by them. It was tried to
interact more and more with male and female councillors so that the active participation
of women can be understood. The questions were qualitative in nature and the answers
have been interpreted and analysed to achieve the objective.
Fig. 5.1 Ward map of Bathinda (Source: PUDA)

73
Table 5.1 General Information about the BMC
City Bathinda Status Municipal Corporation Formation 2003 Ward 50 Councillors 50 Male 31 Female 19 Source: Bathinda Municipal Corporation.
5.1 Personal and Socio-Economic Profile of Councillors
Personal and socio-economic profile of the councillors provides the background they
have come from and also provide substantial information to analyse them as political
leaders and the impact of their leadership in the society. While studying the socio-
economic profile of the respondents’ age, cast, education qualification, religion and
occupation are taken into consideration as important factors.
Table 5.2 Age wise Distribution of Councillors
Sr. No Age Group Male Female Total 1 Young Age (below 35) 0 2 2 2 Middle Age (36-50) 16 10 26 3 Aged (51-65) 6 5 11 4 Above 65 0 1 1 Total 22 18 40
Table 5.3 Educational Qualification of the Councillors (BMC Members)
Sr. No Education Qualification Male Female Male % Female % 1 Uneducated 0 2 0 11 2 Under Metric 2 5 9 27 3 Metric 7 8 31 44 4 High School 3 0 13 0 5 Graduate 2 1 9 5 6 Post-Graduation 7 2 31 11
Total 22 18 100 100
Majority of the ward councillors belong to 36-50 age groups (Table 5.2) and no
significant difference has been observed in the age of male and female councillors. It
has been observed that men rules in the politics for longer ages but women usually

74
leaves politics at higher age but in BMC the number of women from aged group (51-65)
is same as that of men. It shows that higher age group women are also participating in
governance.
Higher educational level of citizen is an important prerequisite for greater role in political
process because one cannot act rationally and very effectively without education. If
education and literacy rate will be high, the representatives of the people will not only be
aware of their duties but also be able to formulate rational policies and bring change in
the society. A state is known by its leaders; therefore the political system of the leader
should be in the hand of the educated people and education is very important for the
growth of a nation. In India, women have lesser education than men and since they are
also less likely to be in the workforce women may be less politically active than men
(Azy, 2012 ). Table 5.3 depicts that 11 percent female councillors are uneducated while
no male member is found uneducated. This table 5.3 also depicts that the majority of
the women are educated up to the metric level i.e. 44 percent. However there are only
two female councillors (11%) who are master degree holders and one (5%) is found
only up to the graduate level. On the other hand 31 percent male councillors are
educated up to the post graduate level and 37 percent male councillors are metric
passed. In short it can be said that majority of the males have secondary as well as the
higher education. Education has been perceived as an important asset by the 63
percent of the people that influence the effectiveness of an elected representatives
while the rest of the people perceived personal qualities such as good analytical
understanding, fairness, and ability to speak before the people not the education as an
important factor to win the elections and participate actively winning the elections (Alsop
et.al, 2004).
Table 5.4 Cast Wise Distribution of the Councillors
Sr. No Category Male Female Male % Female % 1 General Category 20 13 91 72 2 Reserved category 2 5 09 27 Total 22 18 100 100
From the data, collected during the field survey, it is found that 72 percent female and
91 percent male councillors belong to the general category. In Bathinda Municipal

75
Corporation out of the total 50 councilors two seats are reserved (SC and BC) for the
male members and five for the female members. Although the percentage of female
councillors who belong to the SC category is not high but such type of participation of
women from the reserved category may bring the change in the male biased society
(Panda, 1996). The CPI (M) leader and State Minister Binoy Chowdhury, stated that the
inclusion of women from the scheduled castes and backward classes in the panchayats
would reduce the inequalities and flaws in the existing system (Ghosh, 2012).
Table 5.5 Religious Status of Councillors
Sr. No Religion Male Female Male % Female% 1 Hindu 9 6 40 33 2 Sikh 13 12 59 66 3 Muslim 0 0 0 0 4 Christian 0 0 0 0 Total 22 18 100 100
This table shows that out of the 22 male councillors 9 are Hindu and 13 are the Sikh.
There is no male member who is from the Muslim or belongs to any other religion. It
also depicts that 6 females i.e. the one third of the total belongs to the Hindu religion
and 12 are from the Sikh religion. In other words, in BMC majority of the members are
from the Sikh religion.
Table 5.6 Occupation Pattern of BMC Councillors
Sr. No
Income Sources Male Female Male % Female %
1 Own Business 12 1 55 6
2 Household work/House wives (in case of women)
0 14 0 78
3 Agriculture 2 1 9 6
4 Professional 8 0 36 0
5 Pensioner 0 2 0 10
6 Other 0 0 0 0
Total 22 18 100 100

76
Above data (Table 5.6) shows that among the 18 female councillors 14 (78 %) of the
women leaders are the housewives and dependent upon their husband. Only four
women are economically independent and one out of them has her own business and
one is the owner of agricultural land and two are retired principle of government school
and are getting pension. During the interview they revealed that they could not have
won the election if their husband had not provided any financial support during the
election process. On the other hand, all the male members are economically
independent; 12 male members (55%) have their own business, 2 male members (9%)
get the income from the agriculture land and 8 male members (36%) are professionals.
“Without the financially independence, political participation will remain a myth” (Pujari,
2012).
5.2 Participation of Councillors in Election Related Activities
Table 5.7 Political Affiliation of the Councillors
Sr. No Category Male Female Male % Female % 1 Congress 4 2 18 11 2 BJP 4 5 18 28 3 Akali Dal 13 8 59 44 4 CPI/CPM 0 0 0 0 5 Independent 1 3 5 17 6 Others 0 0 0 0 Total 22 18 100 100
Although most of the women ward councillors entered in politics first time but they
possessed a history of family involvement in politics. And all the reserved seated
women councillors except three are found to be directly or indirectly affiliated with the
major political parties of Centre and State. From the above data (Table 5.7) shows that
in BMC 8 female (44%) and 13 male (59%) councillors belong to the Akali Dal Party.
This data (Table 5.7) also shows that there are 2 females (18%) and 4 males (18%)
who belong to the congress party and 5 females (28%) and 4 males (18%) come from
the BJP party but these two parties were unable to make majority in the elections. There
are also 3 women councillors (17%) and 1 male councillor (5%) who fought the election
independently. Majority of councillors are from the Akali Dal party.

77
Table 5.8 Participation of Councillors in Election Related Activities during Elections
Sr. No Activities Male Female
1. Filling the Nomination Paper 22 18 2. Door to Door Campaign 22 18 3. Participation in rallies and election meetings 20 06 4. Distribution of Pamphlets and Posters 22 06
Total 22 18
The councillors were asked about their activities done during the election. All the female
councillors had filed the nomination paper but 6 of them had just signed it and the other
formalities were done by their husband while all the councillors had gone for door to
door campaigning but all of them were accompanied either by their husband or other
family members. The table 5.8 reveals that their participation in election as compare to
the male colleague has not been very enthusiastic. During the election 2008, all female
councillors said that they took part in door to door campaign out of them 6 admitted that
the nomination paper was filed by their husband and they just signed it. It also became
clear that male councillors were more active during the election campaign because 20
male councillors took part in all the activities.
Politics is not considered a good place for women but their presence is required for their
own empowerment and to bring change in the attitude of society. Women can bring
positive change in the condition of women. Politics has yet not become an attracting
sphere for them. If they join politics there are certain reasons. It was tried to know the
motivational or inspirational factors behind their joining politics. With changing time are
they coming voluntarily in the politics or somebody is pushing them or they have some
political backgrounds?
Table 5.9 Inspiration behind Joining the Elections
Sr. No Factors Male Female Male % Female% 1 Family Members /
Husband 1 11 4 61
2 Political party/ Political Background
9 7 40 38
4 Self-Inspiration 19 1 86 11 5 Social Service 22 18 100 100 6 Others 0 0 0 0
Total 22 18 100 100

78
The Table 5.9 depicts those factors or reasons due to which the women as well as men
join the politics. During the survey 61 percent female councillors made it clear that they
have joined the politics due to their husband because the ward was reserved for the
females only and their husband couldn’t contest the election in 2008 from the respective
wards and they wanted to be in the politics at any cost and so their husband inspired or
forced them to join the politics whereas these 61 percent female councillors also replied
that they are not interested in politics and have no experience to handle the political
institutions. Moreover 7 female councilors (38%) were inspired by political party and
joined the politics due to their intimate relations with the political leaders or due to the
political background. Out of the total, 1 female (11%) contested the elections due to
their own willingness to join the politics. On the other hand 19 (86 percent) male
councillors stated that they joined or contested the elections due to their self-interest out
of which some male members made it clear that they had already contested the election
three and two time due to which they are not only interested but also due to previous
experience they joined the politics.
Table 5.10 Number of Elections Contested by the Councilors
Sr. No
Numbers Male Female Male% Female %
1 One 13 13 59 72
2 Two 6 4 27 22
3 Three 3 1 14 5
4 Four 0 0 0 0
5 More than Four 0 0 0 0
Total 22 18 100 100
It is found from this table that majority of the women i.e. 72 percent came in the local
governance first time and that is mainly due to the reservation policy. Moreover it is
interesting to note that these 72 percent female members contested the elections first
time. There are 4 female members (22%) who have fought the elections twice and only
1 female councilor (5%) contested the elections for the three times. Frequency of
contesting election is more with the male councillors while less with female members.

79
When women enter politics within this patriarchal context of modern democracies, they
are unable to play a role to radically change the sexual politics rather they largely play
political roles on male’s terms. The fundamental assumption in liberal democracies
needs to be changed in order to create genuine political space for women within.
Patriarchy as a system of male domination shapes women’s relationship in politics. It
transforms male and females into men and women and construct the hierarchy of
gender relations where men are privileged (Eisenstein, 1984). It was tried to find out the
problems faced by women during election.
Table 5.11 Problems Faced During the Elections
Sr. No Category Male Female Male% Female % 1 Yes 6 11 27 61 2 No 14 8 64 39 3 No Response 2 0 9 0
Total 22 18 100 100
Form this table 5.11 it becomes clear that 61 percent female faced the problems during
the elections yet they contested the elections from those seats which are reserved for
them. Violence during the election from the opposition, lack of economic resources
(because most of the female councillors are not very well off and do not belong to the
rich families and had to look after the funds which had provided by their cast,
community and political parties as a result they are dependent upon them to play their
roles) are few problems which women face. Apart from this, women have to finish lots of
household chores and their responsibilities as wife and mother is not compensated by
their involvement in outside-home activities. They remained mentally very disturbed
during the whole phase of election as their responsibilities had increased and her work
was not shared by other family members. Out of total councilors, 11female councillors
i.e. 61 percent who had to face the problems during the elections out of these 11female
councilors there are 2 female councilors who said that they were forced by the political
parties to withdraw their nomination because they fought the elections independently.
This table 5.11 also shows that 8 women candidates (39%) clarified that they did not
face any sort of the problem due to strong backup from the political party and financial

80
support from the elder members of their family. Whereas the majority of the male
members (64%) clarified that they did not face any sort of problem because of having
intimate relations with the political parties and they have capability to fight and win in
elections.
When the male and female councillors were asked (Table 5.12) whether politics and
political parties are organized to favor men, the answer of all female councillors were
vague, it may be because of fear or lack of self-confidence etc. But there were 33
percent female councillors stated firmly that politics and political parties are organized to
favor men because they are not informed about several decisions taken during the party
meetings or scheduling of party meetings. Even if they are informed about the meetings
they are not treated well and their views and opinions are usually ignored in the
meetings. They expressed that they are also unable to protest their decision because
their voice is not strengthened by other people and sometimes even women do not
support women. Most of the decisions are taken without their consent in the meeting
whereas their male councillors replied that women are heard and responded properly
and no discrimination is made anywhere with women.
Table 5.12 Politics and Political Parties are organized to favor of Men
Sr. No Category Male Female Male% Female %
1 Yes 1 6 5 33
2 No 17 6 77 33
3 No response 4 6 18 33
Total 22 18 100 100
From this table it also becomes clear that out of the 22 male councillors 17 male
councilors (77%) that there is no discrimination against the female members, 4 male
members (28%) gave no response and only 1male councilor (5%) said yes and said
that the representation of female is low and they will not come again in the ward but
men has chances to come again so men decisions are preferred.

81
Table 5.13 Willingness of the Present Councillors to participate in the next Elections
Sr. No Category Male Female Male% Female %
1 Yes 21 10 95 55
2 No 1 8 5 44
3 No Response 0 0 0 0
Total 22 18 100 100
From this table it becomes clear that out of the total councillors 21 male councilors
(95%) want to contest the coming elections and 1 (5%) deny due to his old age to
contest the next election and 10 female members (55%) also stated they wanted to
contest the next elections but due to the rotation policy they will not contest the
elections from the reserved seats yet they will contest from the general seats. While the
8 female councilors (44%) denied contesting the election due to various difficulties
faced by them and also due to illness and old age problem of few women.
5.3 Awareness about local governance
The lack of knowledge and awareness of elections and electoral processes among
women is a major barrier in participating in elections. Also, the low level of literacy
among the majority of the women prevent them from accessing information about the
various political candidates, parties, party manifestos and the debates that precede
elections that are critical for making an informed choice of the most appropriate
candidate. Most of the information is in print media and hence a serious handicap for a
large majority of women, who are illiterates. For the elected women representatives who
are relatively new in the political field, the lack of knowledge of the roles and
responsibilities associated with political institutions impedes their effective participation
in decision-making processes of governance including that of financial management.
One pilot study on GP Members in Kerala, found that women political leaders were still
not clear about the exact roles they were expected to play in this new system or why a
reservation bill had been set for women representatives. (Swain and Mahapatra, 1994)
in their study found that 49 per cent of women leaders were not aware of the role of

82
PRIs. A number of questions were asked regarding the local governance to know their
level of political awareness. The results indicate (from the below table 5.14) that
majority of women are not much aware about the local governance and its procedure
but there are the some female who have moderate knowledge.
Whenever above mentioned questions were asked from male councillors the answers
were explained explicitly while female councillors could not even explain the
requirement of local governance. They knew about their duties and role because they
have been trained about their responsibilities but were unable to explain how the funds
are allocated to BMC. In fact many of them do not know about different committees of
the BMC. Women in the governance process are not well informed due to variety of
reasons. For house wives house governance is more important than the governance of
their locality.
Table 5.14 Major Indicators of Awareness
Sr. No.
Indicators of Awareness
Male Female
Yes No Up to Some extent
No response
Yes No Up to Some extent
No response
1. Meaning and importance of local governance
15 5 2 0 3 8 2 5
2. Formation of BMC, tenure and Year of its first election
15 0 7 0 5 7 6 0
3. Seats reserved in BMC
10 7 5 0 6 8 0 4
4. Administrative hierarchy
14 0 8 0 5 2 11 0
5. Function BMC 22 0 0 0 10 2 6 0

83
From this table it is clear that the awareness about local governance and BMC is better
in the case of male councillors. But out of the total councillors there were only 3 female
and 15 male members who knew about the local governance and its structure, they
clearly stated that the corporation is formed in the big cities with the population of three
lakh or more than there lakh and committees in the towns. Nagar Panchayat is
constituted at village level (transition from rural to urban). This table 5.14 also depicts
that 5 male and 8 female members are not aware about the meaning of local
governance. There are also 2 male and 2 female councillors who have moderate
knowledge while 5 female councillors did not give any sort of response.
This table also depicts that 15 male councillors are fully aware and 7 male councillors
are aware only up to some extent about the formation of BMC, its tenure and its first
election. On the other hand their female counterparts only 5 female members know
about the BMC, its election and its tenure whereas 6 female members have a little
knowledge and 7 are not aware about the formation of BMC.
Majority of the female members although gave the answers about the reservation of
seats but ground reality is that they do not know the exact number of seats are reserved
for them. This simply indicates that they came in the politics because their ward was
reserved and their husband inspired them to contest the elections. On the other hand
there are 10 male councillors who are fully aware about the reservation for the women,
SC and BC, 7 male members do not know the number of seats reserved for the women
and 5 are aware up to some extent. One more thing is worth highlighting that most of
the councillors know about the function of BMC. This is because training about the
functioning is given time to time to the councillors.
The BMC consists of elected members from the ward and the Mayor and Deputy Mayor
are elected by the members among themselves and also there is the provision of the
commissioner and sub commissioner (From the Indian administrative service,
Information given by the BMC corporation) to head the administrative staff and to
implement the decision and prepare its annual budget. From this table 5.14 it is also
clear that only 5 female members are fully aware about the administrative hierarchy but
11 female members have the partial knowledge and the rest of the female councillors

84
neither gave the right answer nor gave any response. In the case of male councillors
there is totally opposite situation that has been observed. In other words 14 male
councillors know about the elected and appointed staff whereas the 8 male councillors
did not give the right answer.
Another question was asked about the working efficiency of male and female
councilors. The table 5.15 given below clearly depicts that five male and ten female
councillors agreed that women can work effectively in local governance bodies. But ten
male and three female respondents said that women cannot contribute effectively
because they are female and our society is not developed or secure for the female
members. They are also completely dependent upon their husband. Female councillors
argued that women are ready to serve the society but opportunities are not given to
prove their capabilities. Even if they have got the opportunity in the BMC their opinions
are not considered important because they are not in majority.
Table 5.15 Women can contribute in local governance effectively
Sr. No Category Male Female Male% Female%
1 Yes 5 10 23 56
2 No 10 3 45 16
3 No response 3 5 14 28
4 Total 22 18 100 100
5.4 Participation of Councilors in Meetings and Decision Making Process of BMC
Regarding the extent of women’s participation in the BMC meetings, it became clear
that women’s participation in the political realm has many facets. One of these is that
since BMC meetings approve policies that will be subsequently implemented, if the
ward councilors don’t participate in the meetings they will not be able to bring the
problem of their localities to the attention of BMC and such problem will remain
unresolved. Attendance of meetings is not only an important indicator for active
participation but also a forum to discuss development activities and decision-making.
Moreover, active participation of members and the level of their participation at

85
meetings are the important indicators from which we can draw their involvement in
decision- making and development activities at local level.
Table 5.16 Details of the BMC Meetings
Details of the BMC Meetings* Meetings Attended by the Councilors during the last
Four year (2008-2012)
Meetings Of BMC
Years Numbers Category Male Female Male% Female%
General House
2008 5 Regular 19 13 86 72
General House
2009 6 Irregular 3 5 14 28
General House
2010 7 Total 22 18 100 100
General House
2011 8
General House
2012 7
*Source: Bathinda Municipal Corporation.
First meeting of the General House was held in 2008. Right from the 2008 to 2012 only
thirty three meetings have been conducted whereas it was revealed by the staffs of
BMC that 72 meetings should have been held during that period to run the
administration properly. The data could not be obtained about the number of councillors,
male and female, who attended the meeting irregularly or regular during the period from
the BMC office record. One staff member gave a rough figure about their attendance.
From the above table it is clear that most of the male and female councillors stated that
they attend the meeting regularly, only 3 male members (14%) were irregular in the
meeting due to their business or job. There is no doubt that 72 percent female
councillors attended the meeting regularly but they are not playing any effective role
except giving support to their male counterparts. Five female councillors (28 %) due to
the sickness, family and they have to look after their family and they do not attend the
meeting sometimes.

86
Table 5.17 Number of councillors who is accompanied in meetings of BMC
Sr. No Category Male Male% Female Female% 1 Always/Yes 0 0 10 56 2 Often/No 22 100 8 44 3 Never/No Response 0 0 0 0
Total 22 100 18 100
From this table it becomes clear that more than 56 percent women like to be
accompanied while going to attend the meetings. It is because of the distance from their
house and secondly their husband does not allow them to go alone because of the
unsafe social environment. Along with these reasons some female councillors are
unable to cover the long distance due to their old age. On the other side there is no
male councillor who takes company because they said that they have their personnel
vehicles and they do not feel any fear while going.
Table 5.18 Dependence of the Councillors to Play their Roles
Sr. No Category Male Female Male % Female % 1 Husband 0 16 0 89 2 Family Members 0 0 0 0 3 Political Party 0 0 0 0 4 Others 0 0 0 0 5 No 22 02 100 11
Total 22 18 100 100
Only to be member of local governance cannot ensures the women participation.
Women contribute in politics only when they perform their duty actively and
independently. But during the interview we come to know that most of the female
members (89 %) are dependent upon their spouse to play their role. They stated that
they cannot do anything without their husband’s support because their husband knows
better than them and have much knowledge of the locality and development activities.
On the other hand there was no male councillors who has been observed to be
dependent on their family members.
The studies show, inter alia, that there has been an increase in the number of elected
women in unreserved wards in successive municipal elections. Field experiences also
reveal that women have not been able to participate effectively due to a number of

87
constraints. It has been suggested that artificial measures like reservation may only
ensure quantitative participation of women. Reservation per se does not guarantee
empowerment. Along with a favourable political will, a number of complementary
interventions need to be initiated to overhaul the patriarchal social structure. This calls
for an organised and sustained mass movement to adequately represent women’s
interests. The ongoing experiments and experiences suggest that periodic training,
orientation and sensitisation can help women representatives perform their assigned
functions in a better way. In this regard, they are to be supported by institutions like the
Non-Government Organisations (NGOs), women’s organisations and above all the
political parties which may politically enlighten the masses especially on the issues like
gender sensitisation.
5.5 Transparency
Transparency is the factors that contribute to make the local governance works
smoother through their elected representative; transparency means the citizens ‘right to
know’ and accountability, on the other hand, means ‘responsibility of the administration’
(Mahajan and Mahajan, 2005).
The local governance is considered the main platform for the transparency and
accountability. Its central function is to take stock of past developments, review
expenditures, and to decide which new activities are possible within the sanctioned
budget. The local governance is that forum which provides an opportunity to local
citizens to obtain clarification about the all aspects and activities of the local governance
(Alsop et.al, 2004). In real sense accountability means that local people can monitor,
control and evaluate the performance of local bodies and the bodies can monitor and
control local officials particularly in relation to quality and efficiency. In this work it was
not possible to collect opinion of people of different wards regarding working quality of
the councilors. So the result which has been presented below may not be true to the
reality. Everyone usually exaggerate his/her performances and so was observed here
also. Everyone said at length about the work done by him/her.

88
Table 5.19 Major Indicators of Transparency
Sr. No Indicators Male Female Male % Female%
1 Sharing plan with people of ward and taking peoples opinion
18 8 81 44
2 Accessibility of information to electorate
0 0 0 0
3 free right to take part in discussion
12 4 54 18
4 display/submission of documentation
0 0 0 0
It was observed that the level of transparency was higher among males and in the case
of female less transparency was maintained. It was observed that councillors do not
followed any of the mechanisms due to political influence of ruling party apparently for
the fear that if it was done so, people would seek to know about many issues regarding
budget, expenditure, beneficiary list etc. Many respondents said that information can be
obtained through RTI so nothing is hidden but they don’t display the documents in front
of anyone.
In the questionnaire few questions were kept only for female respondents. When it was
asked that ‘Do you feel any improvement in your life after becoming a councillor?’ They
recognized the improvement of educational achievement and also about their liberty
and free movement and access with the people after being elected.
In another question regarding primary constraints towards their proper functioning they
expressed that lack of education, lack of awareness and information, traditional system
etc were the primary constraints towards their proper functioning. Women respondents
also confessed that non-co-operation of men folk outside the family and inside the
family and their household responsibilities made them incapable of performing their
roles in Municipal Corporation.
According to general public women members were better from the view point of time
management, capability, understanding, leadership but they were the prey of gender
sensitivity. The interview also portrays that the women members were very active in

89
identification of problems in their locality and capable enough to pursue any
programme.
Question was also asked about the importance of training given to them about
functioning of BMC, they said that such trainings are very important to empower the
women with information. Due to exposure to the working environment and
empowerment the potentials of women functionaries are accelerated. Their ignorance
made them dependent on the other people but if they know about their duties and also
how to prepare and execute the plans it becomes easy to work for the ward. This report
showed that women participation in politics had elevated the status of women inside
and outside the family. Elected women representatives got weightage in the community.

90
Conclusion
Through the analysis of Lok sabha and Rajya sabha elections it is clear that
women’s percentage as electors is approximately equal to men i.e. 48.26 percent. It
is also worth mentioning that their percentage as voters has increased from first
elections from 37.1 percent in 1951-52 to 46.88 percent in 2009 elections which is
quite significant. This picture reveals that they are not only becoming aware about
the right of vote but also contributing in electing the representatives of the people in
the parliament where the decisions and policies are formulated and implemented.
However, when it comes to the matter of their representation as elected
representative of the people they get fail to achieve the status of the decision
makers even after the constitution has given the right of political equality via a
number of articles to its each citizen. In Parliament only a handful of women got
elected over the 545 seats i.e.55 and they constitute 10.8 percent. Moreover it is
also very distressing that the percentage of elected women in Parliament from 4.45
to 10.8 in 2009 has increased but marginally. Such inadequate representation has
also been observed in the Rajya Sabha, in 1952 there were only 16 women
members in the Rajya Sabha which was 7.3 percent of the total seat which
increased to 15.5 percent in 1991 but again in 1998 the percentage reached to the
level of 1952 that was 7.3 %. In year 2004 there was a slight increase (11.4%) in the
percentage of women representative but again dropped to 8.6 percent in 2009. This
worrisome scenario has been noticed at the State Legislative Assemblies also where
the percentage of women has not exceeded more than 15 percent even in a states
single state. Moreover there were few states like Arunachal Pradesh Meghalaya,
Mizoram, Nagaland, Lakshadweep and Daman & Diu where no female contested
the elections and winning factor is far-fetched dream.
Analysis of trends of women’s participation in Punjab politics also indicates the
verbatim picture as analysis of elections in Parliament indicates. At state level
women’s participation as electors is quite different from the national level since here
the percentage of women electors although increased from 46 percent in 1962 to
47.36 percent in 2012 but difference is not more. It is also interesting to note that the

91
analysis of both the Assembly Elections (2007 & 2012) depicts that there were three
districts namely Kapurthala, Hosiarpur (SC) and Nawanshahr where the percentage
of votes polled by female Voters has been noticed more than that of men voters.
However their representation in Punjab Legislative Assembly is not up to the mark.
During the elections of 1962 only 5 percent female and 11.96 percent women got
elected in Punjab assembly. This sordid picture indicates that women representation
is very poor in General elections and State Assembly elections.
In BMC representation of women has risen from 4-5% to 25-40% because of
reservation and they begin to feel a sense of empowerment by attaining the
responsibilities and duties as equal to men. Their entrance into the governance
process have also shattered the myth that they are not able to come and handle the
male centred politics. Such type of mechanism in the form reservation should be
introduced at the centre and the state level also.
Reservation has been proved a strong mechanism for the marginalized section of
the society i.e. women especially the women from the scheduled cast and backward
class. Due to the reservation women, women are coming forward more than
expectation which have ever been seen. It is strong weapon to empower the women.
In BMC the education level has been observed more among the male councillors but
according to the women councillors they are trying to learn the things from the
number of sources like from their husband’s experience and also through the
training programs and personal experiences. Therefore, we should not analyse the
education as solely factor for the active political participation. Along with the
education personal qualities such as good analytical understanding, fairness, quality
to speak before the people etc are the factors which should be considered as
important factors for the active participation. Because there are a number of
examples which was observed during the field survey reveals that even the
educated male members are not participating actively.
During the field survey it has been also observed that the most of the women are
dependent upon their husband’s income. But after becoming the councillor they are

92
getting the salary from the corporation which make them, to some extent,
economically independent and they have also started taking their own decision.
They have started to feel the value of economic independency since.
During the field survey it has been found that women have entered in governance
process but they are not very much aware about the concept of local governance.
But the ground reality is that there are number of female councillors who did not give
the exact response of any of the questions which had been asked to them. But they
said that they are trying to learn as they are new to such type of environment.
Political party is an important factor to promote the women’s participation in elections
because of the reservation political parties are allotting the tickets without taking the
win ability factor into consideration. Before the reservation it’s all up to the party to
whom they would like to allot the ticket but after the reservation it becomes
mandatory to give the tickets at least one third to the women.
From the case study of BMC we come to know that male councillors were more
active during the election campaign and female councillors only preferred the door to
door campaign although from their door to door campaign we cannot draw their
active participation but their participation, at least, has begun. In short it can be said
that due to reservation they have started to learn and participate in election relate
activities like how to file the nomination paper etc.
It can be concluded that women are coming in governance due to the reservations
but are more dependent upon their husband to perform the election related activities;
even some are not capable to file their nomination paper due to their ignorance and
perform all the activities with the support of their husband. In other words they are
dependent upon their husband for the election campaign. Likewise men women are
also becoming aware about the public sphere.
There is no second opinion that all the women have come for the first time in the
politics due to the reservation but there are few women who contested the elections
due to their own will and only one female who contested the election against the
reservation seat. Apart from the reservation all the female candidates came into the

93
fray of politics due to their husband’s inspiration because they want to remain in the
politics through their wives.
All the female councillors have been found to be more serious regarding the
attendance of the training programme. All the female said that they attend the
training program regularly while male councillors are not very serious about the
attendance of the training programme. Some said that due to their busy scheduled
they are not able to attend the training program and few said that they do not
consider it as compulsory of usefully.
Except the few female members all are wanted to contest the elections but due to
the rotation policy they can’t. Apart from the rotation policy, the policy of 33 percent
reservation for women has been interpreted in such a manner that it restricts the
scope for women to contest the elections. Male members of the political parties
assert that women can contest only against the “reserved constituencies” only not
against the constituencies categorized as “general” seats. This implies that the
general seats are exclusively meant for men. Such interpretation deprives the
women of opportunities to contest against the general or male category.
It was observed that the level of transparency was higher among males and in the
case of female less transparency was maintained. It was observed that councillors
do not followed any of the mechanisms due to political influence of ruling party
apparently for the fear that if it was done so, people would seek to know about many
issues regarding budget, expenditure, beneficiary list etc. Many respondents said
that information can be obtained through RTI so nothing is hidden but they don’t
display the documents in front of anyone.
In the questionnaire few questions were kept only for female respondents. When it
was asked that ‘Do you feel any improvement in your life after becoming a
councillor?’ They recognized the improvement of educational achievement and also
about their liberty and free movement and access with the people after being
elected.

94
In another question regarding primary constraints towards their proper functioning
they expressed that lack of education, lack of awareness and information, traditional
system etc were the primary constraints towards their proper functioning. Women
respondents also confessed that non-co-operation of men folk outside the family and
inside the family and their household responsibilities made them incapable of
performing their roles in Municipal Corporation.
According to general public women members were better from the view point of time
management, capability, understanding, leadership but they were the prey of gender
sensitivity. The interview also portrays that the women members were very active
in identification of problems in their locality and capable enough to pursue any
programme.
Question was also asked about the importance of training given to them about
functioning of BMC, they said that such trainings are very important to empower the
women with information. Due to exposure to the working environment and
empowerment the potentials of women functionaries are accelerated. Their
ignorance made them dependent on the other people but if they know about their
duties and also how to prepare and execute the plans it becomes easy to work for
the ward. This report showed that women participation in politics had elevated the
status of women inside and outside the family. Elected women representatives got
weightage in the community.

95
Bibliography
[ECI] Election Commission of India. (2011-12).Statistical Report on General Elections 2012 to the Legislative Assembly of Punjab. Government of India. <http://eci.nic.in/eci_main1/index.aspx.>. Accessed 2012 Sep 13.
[ECI] Election Commission of India. (2011-12).Statistical Report on General Elections 2007 to the Legislative Assembly of Punjab. Government of India. <http://eci.nic.in/eci_main1/index.aspx.>. Accessed 2012 Sep 13.
[ECI] Election Commission of India. (2011-12). <http://eci.nic.in/eci_main1/index.aspx.>. Accessed 2012 Sep 13.
[HDR] Human Development Report. (1995). <http://hdr.undp.org/en/media/hdr1995 en overview.pdf> Accessed 2012 Nov 20.
[IPU] Inter Parlimentary Union. (2013). <http://www.ipu.org/wmn-e/classif.htm>. Accessed 2012 Sep 14.
Agbalajobi, D. T. (2010). Women’s participation and the political process in Nigeria: Problems and prospects. African Journal of Political Science and International Relations. Nigeria. 4(2): 075-082. <www.academicjournals.org/ajpsir/pdf/pdf2010/February/Agbalajobi.pdf>. Accessed 2012 Nov, 4.
Alok, V. (2011). Role of Panchayat Bodies in Rural Development since 1959. Indian Institue of Public Administration: New Delhi. <www.academia.edu/.../Role_of_Panchayat_Bodies_in_Rural_Develo...>. Accessed. 2013 January,15.
Alsop, Ruth. J. Karishna .A and Sjoblom.D. (2004). Inclusion and Local Elected Government: The Panchayat Raj System South Asia. <ndiagovernance.gov.in/files/localgovernment.pdf>. Accessed 2013 Mar, 5.
Asaju, K. (1999). Local Government Autonomy in Nigeria: Politics and Challenges. 1999 Constitution. International Gernal Journal of advance Legal Studies and Governance.
Aslatha, B.P. (2010). Women’s Development: The Indian Experience. Paper No 43935. Kessinger Publishin. America. < http://mpra.ub.uni-muenchen.de/43935/>. Accessed 2012 Sep, 20.
Azy. (2012).The Role of Education in Political Development.< http://ilm.com.pk/learning-articles/the-role-of-education-in-political-development/> Accessed 2012. Dec, 12.

96
Bandi, M. (2011). A Review of Decentralisation in India with Particular Reference to PRIs in Gujarat. Gujarat Institute of Development Research (GIDR). Ahmedabad. <www.ruralgov-ncaer.org>. Accessed 2013 Jan, 20.
Bari, Farzana. (2005). Woman's Political Participation: Issues and Challenges. <www.un.org/womenwatch/daw/egm/enabling-environment2005/docs>. Accessed 2012 Sep, 20.
Banarjee, Narayan. K. (1984). Women’s Participation in development : A Case Study from West Bengal. <http://www.cwds.ac.in/OCPaper/WomenParticipationandDevelopment.pdf> . Accessed 2012 Oct, 7.
Census of India. (2011). Government of India, Ministry of Home Affairs. <http://www.censusindia.gov.in/2011-prov-results/PPT_2.html>. Accessed 2012. Aug, 20.
Chamber, P. (2011). Punjab: The State Profile. PHD Chamber of Commerce and Industry. New Delhi. < http://www.phdcci.in/admin/userfiles/file/Research-Bureau/Punjab.pdf>. Accessed 2012Nov, 13.
Chhibber, P. (2002). Why Some Women are Polticaly Active: The Household, Public Space, and Poltical Participation in India. University of California. California. <polisci.berkeley.edu/people/faculty/ChhibberP/india-gender.pdf>. Accessed 2012 Oct, 7.
DAW. (2005). Equal Participation of Women and Men in Decision-Making Processes, with Particular Emphasis on Political Participation and Leadership, pp.1-38. Department of Economic and Social Affairs. New York. <http://www.un.org/womenwatch/daw>.Accessed 2013 Mar, 9.
Fardaus Ara, M.R.K. (2006). Woman Perticipation and Empowerment in Local Governance: Bangladesh Union Parishad Perspective. Asian Affairs.29(1): 73-92. <http://www.cdrb.org/journal/current/1/3.pdf>. Accessed 2012 March, 17.
Figueras, I. C. (2011). Women in politics : Evidence from the Indian States. Journal of Public Economics. 95(7-8): 664-69.<http://www.sciencedirect.com/science/article/B6V76.>. Accessed 2012 Nov,7.
Forrester, Dunccan. B. (1968). Electoral Politics and Social Change. Economic and Political Weekly, III. < http://www.jstor.org/stable/4358817>. Accessed 2012 Nov, 16.
97
Ghosh, J. ( 2012 ). Women Empowernment and the Role of Press: An Analysis of Newspaper Coverages of 1993 West Bengal Panchayat Elections . Global Media Journal– Indian Edition. University of Calcutta. 3(1).<www.caluniv.ac.in>. Accessed 2013 Jan 3.
Gupta, J.P. Teotia, M.K and Prehss. (2006). Urban Local Self-Government Institution in Punjab:History, Structure, Capacity and Emerging Challenges. Chandigarh: Centre for Research in Rural and Industrial Development.<
http://www.crrid.res.in/keyurban.pdf>. Accessed 2013 Jan 8.
Haider, Saraswati. (1998). All Women’s Political Party launched in UP. Economic and Political Weekly,Feb 21, 385-88. < http://www.epw.in/commentary/all-women-s-political-party-launched.html>. Accessed 2013 Feb, 6.
Jain, D. (1996). Panchayat Raj :Women Changing Governnace. Gender in Development Monograph Series #5, UNDP. <http://devakijain.com/pdf/jain_panchayatraj.pdf>. Accessed 2012 Nov, 11.
Sekhon, Joti. (2006). Engendering Grassroots Democracy: Research, Training, and Networking for Women in Local l Self Government in in Indian Context NWSA Journal.18(2):101-122. <muse.jhu.edu/journals/nwsa_journal/v018/18.2sekhon.htm>.Accessed 2013 Jan, 7.
Matthai, R. (2006). Poltical Status oF Indian Women: Progres Since Independence. Mainstream Weekly. lXLV ( 01). <www.mainstreamweekly.net>. Accessed 2012 Sep, 6.
Ministry of Panchayti Raj. (2011). Road map for Panchayati Raj (2011-16): An All India Perspective. <http://www.indiaenvironmentportal.org.in/files/panchayat%20Roadmap.pdf>. Accessed 2013 March, 6.
Mir, S. and Keenan, L. (2008). Women's Reservation : Along Delayed and A Much Needed Step. Centre for Legislative Research and Advocacy.Policy Brief for Parliamentarians. 1-7. < www.clraindia.org/include/women.pdf>. Accessed 2012 July, 8.
Narain, Yogendra, Sahu, S.N. and Lakshmi, L. (2005). Political Empowerment of Women. The Indian Journal of Public Administration. New Delhi Vol. LI(1). IIPA .
Narayan, Jayaprakash. Sheth, Dhirubhai. and Yadav Dhirubhai.(2005). Enhancing Women's Representaion in Legislatures:An Alternative to the government Bill for

98
Women's Reservations.Delhi. < www.manushi-india.org/...>. Accessed 2012 Nov, 11.
Narzary, M. (2013). Women's Role in Poltics. Global Research Methodolgy. Assam. II(8). < www.grmgrlaranya.com/Journals/8th%20issue/6.pdf>. Accessed 2013 April 20.
NIAS (2001). Women and Political Participation in India. International Women's Rights Action Watch Asia Pacific. < www.iwraw-ap.org/publications/baseline.htm> Accessed 2012 Mar, 25.
Panda, S. (1996). Emerging Pattern of Leadership among Rural Women in Orissa. Indian Journal of Public Administartion,pp 3-4.
Patel, v. (2010). Getting Foothold in Poltics. Mumbai: SNDT Women’s University.
Mumbai.<www.academia.edu/.../Women_in_Decision_Making_by_Vibhuti_Pa..>. Accessed 2012 Oct 18.
Pujari, Vankatesh.G. (2012). Efficacy of Women in Politics. Indian Streams Research Journals. 2(II): 1-4. < www.isrj.net/UploadedData/777.pdf>. Accessed 2013 Jan, 5.
Rai, Praveen. (2011). Electoral Participation of Women in India: Key Determinants and
Barriers. Economic and Political Weekly. XLVI: 47. <http://www.epw.in/special-
articles/electoral-participation-women-india-key-determinants-and
barriers.html?ip_login_no_cache=5e5b56d3a1083783185b726b0f959dfc>.
Accessed 2012 Oct, 17.
Rout, B. (2012). Woman Participation in Rural Local Self Governance System. <orissa.gov.in/e-magazine/Orissareview/2012/Feb-March/.../55-64.pd>. Accessed 2012 April, 20.
Sekhon, Joti. (2006). Engendering Grassroots Democracy: Research, Training, and Networking for Women in Local l Self Government in in Indian Context. NWSA Journal.18(2):101-122. <muse.jhu.edu/journals/nwsa_journal/v018/18.2sekhon.htm>.Accessed 2013 Jan, 7.
Shamim, I. and Kumari, R . (2002). Gender and Local Governance: A New Discourse in Development. South Asia Network of Economic research Institutes. New Delhi. < saneinetwork.net/Files/02_06.pd>. Accessed 2012 June, 10.
99
Sharma, V. (2011). Punjab Polls Biased against Women; May not see Fair Fight. The Economic Times. <http://articles.economictimes.indiatimes.com/2011-12-14/news/30516127_1_women-candidates-women-in-ticket-distribution-women-s-reservation-bill>. Accessed 2012 Oct, 14.
Singh, D. P. (2008). Impact of 73rd Amendment Acton Women's Leadershipin the Punjab. International Journal of Rural Studies. 15(1-8).< www.vri-online.org.uk/> Accessed 2012 July, 6.
SIngh, J.P. (2000). Indian Democracy and Empowernment of Women. The Indian Journal of Public Administration. XLVI. 4: 19-49.< labordoc.ilo.org/>. Accessed 2012 July, 5.
Singh, R. (1998). Status of Women in Indian Society. <http://www.bu.edu/wcp/Papers/Huma/HumaSing.htm>. Accessed 2012 Nov, 12.
Singh, R. K. (2012). Elected Women Representatives in Panchayat Raj. Social Action, 62. <www.isidelhi.org.in/saissues/sa112/rakesh.pdf>. Accessed 2012 July, 14.
Sivan, D. (2010). Advocating for Inclusive Electoral Processes for Minority Rights and for Rule of Law in South Asia. South Asian for Human Rights.<www.southasianrights.org/wp-content/uploads/.../IEP-India-Final.pdf> Accessed 2012 July, 4.
Subermaniam, M. (2002). Political Participation and Representation of Women in Indian Poltics. University of Delhi.Delhi. <www.du.ac.in/fileadmin/DU/Academics/course.../hrge_08.pdf>. Accessed 2012 Mar, 12.
Sixth Report. (2007). Local Governance And Inspiring Journey Into Future. Second Adminstration Reforms Commission, Government of India. New Delhi. <darpg.nic.in/darpgwebsite_cms/Document/file/local_governance6.pdf>. Accessed 2012 Nov 15.
Banarjee, Narayan. K. (1984). Women’s Participation in development : ACase Study
from West Bengal. <http://www.cwds.ac.in/OCPaper/WomenParticipationandDevelopment.pdf>. Accessed 2012 Oct 07.

100
Books Reference
Basu, Durga.D. (2011). Introduction to the Constitution of India.Lexis Nexis,Gurgaon.
Bhatacharay, A. (2009). Local Self Government and Parliamentary Democracy in India. Panchayati Raj Update. 16(4):6. <http://www.indiaenvironmentportal.org.in/feature-article/local-self-government-and-parliamentary-democracy-india>. Accessed 2012 Oct,16.
Dahlerup, D. (2005). Increasing Women's Poltical Representation: New Trends in Gender Quotas. In: Ballington, Julie and Karam, Azza. (Eds.), Women In Parliment :Beyand Numbers. International IDEA. Stockholm, Sweden. pp. 141-150.
Eisenstein, Z. (1984). Contemporary Feminist Thought, Unwin, London.
Kaushik, Susheela.(1996). A Panchayati Raj in Action: Challenges to Women’s Role. Freidrich Ebert stiftung. New Delhi. Pp.64-95.
Khan, Jamsheed.Ali.(2005).Punjab di Rajniti. Lokgeet Parkashan.chandigarh. pp.29-50.
Rashmi, S. (2000). Empowernment of Women Through Poltical Participation with special reference to Madhya Pardesh. Anmol Publications. New Delhi.
Sharma, S.K. (2009). Indian political System. Sonia Publications. Patiala.
Shvedova, N. (2002). Obstacles to Women's Participation. Stockholm. Sweden. Trydells Tryckeri. In: Ballington, Julie and Karam, Azza. (Eds.), Women In Parliment :Beyand Numbers. International IDEA. Stockholm, Sweden. pp. 141-150.
Singh, Raj.(1996). A Socio-Historical Cum Legal Perspective.Anmol Publications.New Delhi.
Swain and Mahapatra. (1994). Role Performance and Constraints of Women Leaders in Gram Panchayats in Orissa: A Case Study of Balipatra Block. Utkal University.
Verba, Sidney. and Nie, Norman H. (1972). Participation in America: Poltical Democracy and Social Equ

101
Appendices
Appendix- Part (A) Articles from 243(P) to 243(ZG)
Contd….
Articles Provisions of the Articles
Article-243(P) It gives definitions of various terms used in the Act. Inter alia, it defines ‘metropolitan’ area which has a population of 10 lakh or more. It may consist of one or more districts, municipalities or panchayats
Article-243(Q)
It makes the provision in the constitution about the various types of urban local bodies. A Municipal Corporation has to be set-up in larger urban area, Municipal Council in a smaller urban area and Nagar Panchayat in a transitional area which is in transition from rural areas to urban areas. A municipality may not be setup in an industrial township, if so designated by the Governor of the State. The respective areas of these urban local bodies are to be designated and demarcated by the state government.
Article-243(R)
It deals with the composition of municipalities. All the seats in the municipalities are to be filled by direct election from municipal constituencies known as wards. However, the Legislature of the state may provide for the representation of persons having special knowledge of municipal administration, members of the Lok Sabha and Legislative Assembly whose area falls under the municipal area and members of the Rajya Sabha and Legislative Council, if such members are registered as electors in the municipal area. The Chairpersons of the ward committee may also be given such representation
Article-243(S)
It makes the provision for the establishment of ward committees in municipalities having a population of three lakh or more. The State Legislatures have been empowered to make provision for the composition of ward committee and the manner by which seats in the ward committee shall be filled up.
Article-243(T)
It provides for the reservation of seats in favour of scheduled castes and scheduled tribes in proportion according to their population in the municipal area. It also makes the provision for the reservation of one-third seats in favour of women candidates. There is paralleled reservation for the women of Scheduled Castes and Scheduled Tribes though, the Act does not provide for the reservation in favour of other Backward Classes, the State Legislature may, by law make such reservation in their favour. It should be further noted that the reservation in favour of Scheduled Castes, Scheduled Tribes and women is applicable in offices of members as well as Chairman of the Municipalities.
Article-243(V)
It provides for the disqualifications for being a member of municipality. Accordingly, if a person becomes disqualified to become a member of State Legislature, he shall also be disqualified to become member of a municipality. However, the minimum age required to become a member of municipality shall be 21 years.

102
Contd....
Articles Provisions of the Articles
Article 243(W)
Power, Authority and Responsibilities- provides that the Legislature of a State by law may provide the following powers and authority: (1) to the municipalities as to enable them to function as the institutions of self-government and responsibilities for (a) the preparation of plans for economic development and social justice and (b) the implementation of schemes entrusted to them including schemes with respect to the subject listed in the 12th schedule. (2) to the committees (ward committees) as to enable then to carry out responsibilities conferred upon them.
Article- 243(X)
Power to Impose Taxes- makes the provision that the State Legislature may by law: (a) authorize a municipality to levy and collect taxes. (b) Assign to municipality such taxes and duties as levied and collected by the state government. (c) Provide for making grants in-aid to the municipalities from the Consolidated Fund of the State. (d) Provide for the establishment of special funds for the municipalities.
Article 243-1
Finance Commission-The State Finance Commission is to be constituted under Article 243-1 which shall make recommendations with respect to both the panchayats and municipalities. According to Article-243(Y) the State Finance Commission, constituted in each state by the Governor, shall make recommendation to the Governor with respect to the principles which should govern: (a) the distribution of proceeds of the taxes between the state and municipalities; (b) the determination of taxes which may be assigned to or appropriated by the municipalities; and (c) grants-in-aid to the municipalities from the Consolidated Fund of State. The Finance Commission shall also recommend the measures to improve the financial position of municipalities and measures in their sound finances. The Commission shall submit its report to the Governor, who shall lay down the same before the Legislature of the State.
Article-243(ZD)
District Planning Committee- It provides for the establishment of a District Planning Committee in each district to consolidate the plans prepared by the panchayats and municipalities in the district and to prepare a draft development plan for the entire district. The State Legislature shall make law with respect to the composition of the committee, provided not less than four-fifth members of the council shall be elected by the elected members of Panchayats and municipalities of the district from among themselves. While preparing the development plan for the district, the committee shall take into consideration the following factors: (a) matters of common interest between the panchayats and municipalities; (b) spatial planning, sharing of water and other resources between the panchayats and municipalities and the integrated development of infrastructure and environmental conservation; (c) the extent and type of available financial and other resources; and (d) consult such persons while making plans, as the Governor may specify. The development plan prepared by the District Planning Committee shall be forwarded by the Chairman to the state government.

103
Articles Provisions of the Articles
Article-243(ZD)
District Planning Committee- It provides for the establishment of a District Planning Committee in each district to consolidate the plans prepared by the panchayats and municipalities in the district and to prepare a draft development plan for the entire district. The State Legislature shall make law with respect to the composition of the committee, provided not less than four-fifth members of the council shall be elected by the elected members of Panchayats and municipalities of the district from among themselves. While preparing the development plan for the district, the committee shall take into consideration the following factors: (a) matters of common interest between the panchayats and municipalities; (b) spatial planning, sharing of water and other resources between the panchayats and municipalities and the integrated development of infrastructure and environmental conservation; (c) the extent and type of available financial and other resources; and (d) consult such persons while making plans, as the Governor may specify. The development plan prepared by the District Planning Committee shall be forwarded by the Chairman to the state government.
Metropolitan Planning
Committee-Article-243(ZE)and Article-
(ZF)
In each metropolitan area, a metropolitan planning committee shall be established to prepare a draft development plan for the entire metropolitan area. The State Legislature shall make rules for the composition of the metropolitan committee, provided not less than two thirds of its members shall be elected by the elected members of municipalities and Chairpersons of the panchayat of the metropolitan area, from amongst themselves.
Article- ZG The State Legislature may also provide for the representation of the state or the Government of India or such other associations as it may believe necessary.

104
Appendix Part (B)
Table B (1) State Wise Number and Percentage of Electors General Elections, 2004 (Lok Sabha)
Sr.no States/UT
No. of
Parliament
constituencies
Total Male Female Male % Female %
1 Andhra
Pradesh 42 51146342 25355118 25791224 49.57 50.43
2 Arunachal
Pradesh 2 684034 351564 332470 51.4 48.6
3 Assam 14 15014874 7821591 7193283 52.09 47.91
4 Bihar 40 50559672 27053408 23506264 53.51 46.49
5 Goa 2 941167 475847 465320 50.56 49.44
6 Gujarat 26 33675062 17341760 16333302 51.5 48.5
7 Haryana 10 12320557 6660631 5659926 54.06 45.94
8 Himachal
Pradesh 4 4181995 2128828 2053167 50.9 49.1
9 Jammu 6 6368115 3468235 2899880 54.46 45.54
10 Karnataka 28 38592095 19605257 18986838 50.8 49.2
11 Kerala 20 21125473 10168428 10957045 48.13 51.87
12 Madhya
Pradesh 29 38390101 20028161 18361940 52.17 47.83
13 Maharashtra 48 63012208 32788476 30223732 52.04 47.96
14 Manipur 2 1536510 746054 790456 48.56 51.44
15 Meghalaya 2 1289374 648654 640720 50.31 49.69
16 Mizoram 1 549959 273454 276505 49.72 50.28
17 Nagaland 1 1041433 547114 494319 52.53 47.47
18 Orissa 21 25651989 13191691 12460298 51.43 48.57
19 Punjab 13 16615399 8652294 7963105 52.07 47.93
20 Rajasthan 25 34712385 18149028 16563357 52.28 47.72
21 Sikkim 1 281937 145738 136199 51.69 48.31
Contd….
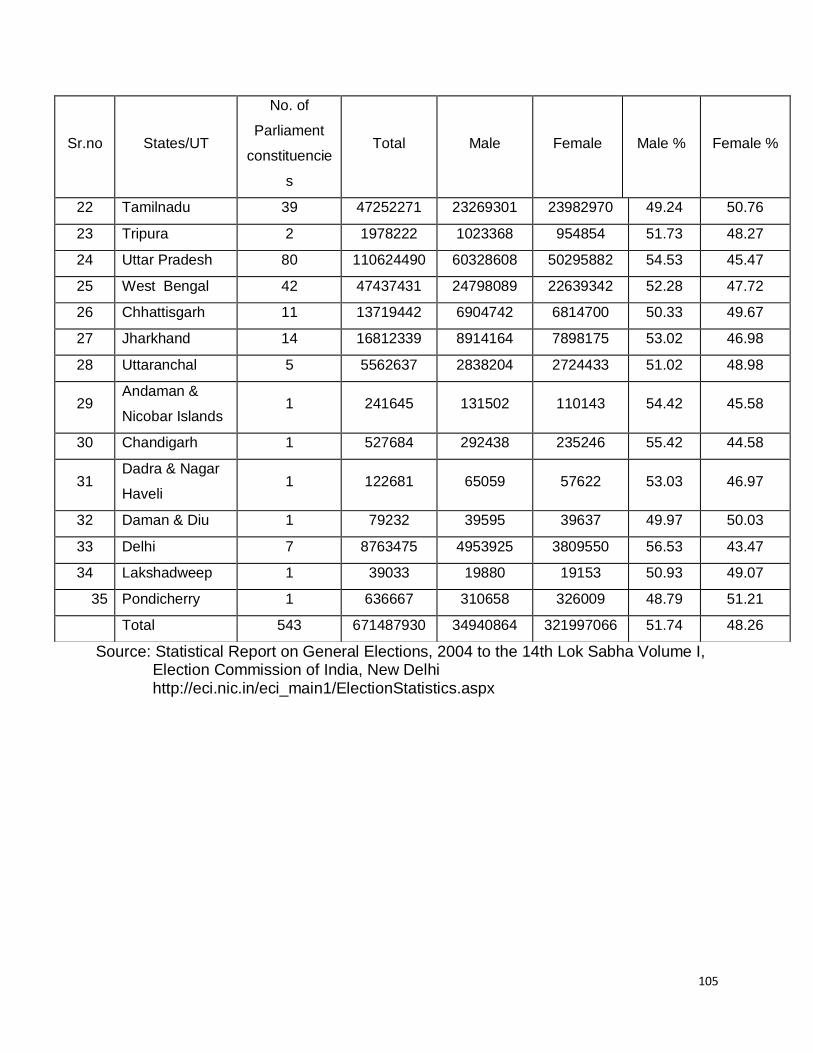
105
Sr.no States/UT
No. of
Parliament
constituencie
s
Total Male Female Male % Female %
22 Tamilnadu 39 47252271 23269301 23982970 49.24 50.76
23 Tripura 2 1978222 1023368 954854 51.73 48.27
24 Uttar Pradesh 80 110624490 60328608 50295882 54.53 45.47
25 West Bengal 42 47437431 24798089 22639342 52.28 47.72
26 Chhattisgarh 11 13719442 6904742 6814700 50.33 49.67
27 Jharkhand 14 16812339 8914164 7898175 53.02 46.98
28 Uttaranchal 5 5562637 2838204 2724433 51.02 48.98
29 Andaman &
Nicobar Islands 1 241645 131502 110143 54.42 45.58
30 Chandigarh 1 527684 292438 235246 55.42 44.58
31 Dadra & Nagar
Haveli 1 122681 65059 57622 53.03 46.97
32 Daman & Diu 1 79232 39595 39637 49.97 50.03
33 Delhi 7 8763475 4953925 3809550 56.53 43.47
34 Lakshadweep 1 39033 19880 19153 50.93 49.07
35 Pondicherry 1 636667 310658 326009 48.79 51.21
Total 543 671487930 34940864 321997066 51.74 48.26
Source: Statistical Report on General Elections, 2004 to the 14th Lok Sabha Volume I, Election Commission of India, New Delhi
http://eci.nic.in/eci_main1/ElectionStatistics.aspx

106
Table B (2) State Wise Number and Percentage of Electors General Elections, 2009 (Lok Sabah)
Sr.no States/UT
No. of
Parliament
constituencies
Total Male Female Male % Female%
1 Andhra Pradesh 42 57892259 28684841 29207418 49.55 50.45
2 Arunachal Pradesh 2 734541 369664 364877 50.33 49.67
3 Assam 14 17470329 9031095 8439234 51.69 48.31
4 Bihar 40 54505246 29220807 25284439 53.61 46.39
5 Goa 2 1020794 512475 508319 50.2 49.8
6 Gujarat 26 36484281 18898387 17585894 51.8 48.2
7 Haryana 10 12087710 6590954 5496756 54.53 45.47
8 Himachal Pradesh 4 4606674 2348721 2257953 50.99 49.01
9 Jammu 6 6572896 3421708 3151188 52.06 47.94
10 Karnataka 28 41790939 21316482 20474457 51.01 48.99
11 Kerala 20 21859536 10528581 11330955 48.16 51.84
12 Madhya Pradesh 29 38085179 20183099 17902080 52.99 47.01
13 Maharashtra 48 72954058 38160162 34793896 52.31 47.69
14 Manipur 2 1736251 836499 899752 48.18 51.82
15 Meghalaya 2 1277739 629436 648303 49.26 50.74
16 Mizoram 1 524444 291666 232778 55.61 44.39
17 Nagaland 1 1321878 676722 645156 51.19 48.81
18 Orissa 21 27194864 14075854 13119010 51.76 48.24
19 Punjab 13 16958380 8828996 8129384 52.06 47.94
20 Rajasthan 25 37060011 19539361 17520650 52.72 47.28
21 Sikkim 1 300584 157362 143222 52.35 47.65
22 Tamilnadu 39 41620460 20895322 20725138 50.2 49.8
23 Tripura 2 2082265 1065706 1016559 51.18 48.82
24 Uttar Pradesh 80 116006374 63394500 52611874 54.65 45.35
25 West Bengal 42 52493168 27567740 24925428 52.52 47.48
Contd….

107
Sr.no States/UT
No. of
Parliament
constituencies
Total Male Female Male % Female%
26 Chhattisgarh 11 15476577 7849788 7626789 50.72 49.28
27 Jharkhand 14 17934095 9484167 8449928 52.88 47.12
28 Uttaranchal 5 5887724 3037542 2850182 51.59 48.41
29 Andaman & Nicobar
Islands 1 265108 141149 123959 53.24 46.76
30 Chandigarh 1 524444 291666 232778 55.61 44.39
31 Dadra & Nagar
Haveli 1 150704 81061 69643 53.79 46.21
32 Daman & Diu 1 95382 48357 47025 50.7 49.3
33 Delhi 7 11096854 6188875 4907979 55.77 44.23
34 Lakshadweep 1 45983 23502 22481 51.11 48.89
35 Pondicherry 1 1020794 512475 508319 50.2 49.8
543 717138525 374884722 342253803 51.90 48.10
Source: Statistical Report on General Elections, 2004 to the 14th Lok Sabha Volume I, Election Commission of India, New Delhi http://eci.nic.in/eci_main1/ElectionStatistics.aspx

108
Table B (3) State Wise Number and Percentage of Voters in General Elections, 2004 (Lok Sabha)
Sr. no States/UT
No. of
Parliament
constituencies
Total Male Female Male% Female%
1 Andhra
Pradesh 42 35762670 18320019 17384444 51.23 48.61
2 Arunachal
Pradesh 2 384928 199413 183909 51.81 47.78
3 Assam 14 10372089 5671454 4701710 54.68 45.33
4 Bihar 40 29329444 17195139 12134913 58.63 41.37
5 Goa 2 552497 286156 264934 51.79 47.95
6 Gujarat 26 15210904 8664929 6543424 56.97 43.02
7 Haryana 10 8093378 4536234 3554361 56.05 43.92
8 Himachal
Pradesh 4 2495486 1269539 1211994 50.87 48.57
9 Jammu 6 2239342 1391263 841489 62.13 37.58
10 Karnataka 28 25114659 13119442 11962519 52.24 47.63
11 Kerala 20 15086428 7480351 7567329 49.58 50.16
12 Madhya
Pradesh 29 18459240 11322391 7124280 61.34 38.59
13 Maharashtra 48 34253278 18957642 15263748 55.35 44.56
14 Manipur 2 1035557 522526 512834 50.46 49.52
15 Meghalaya 2 678893 302113 377125 44.5 55.55
16 Mizoram 1 348546 175372 170000 50.32 48.77
17 Nagaland 1 954719 505682 446002 52.97 46.72
18 Orissa 21 16934324 9010592 7929405 53.21 46.82
19 Punjab 13 10229072 5437861 4794658 53.16 46.87
20 Rajasthan 25 17332448 10009085 7290569 57.75 42.06
21 Sikkim 1 219648 112404 102890 51.17 46.84
Contd….
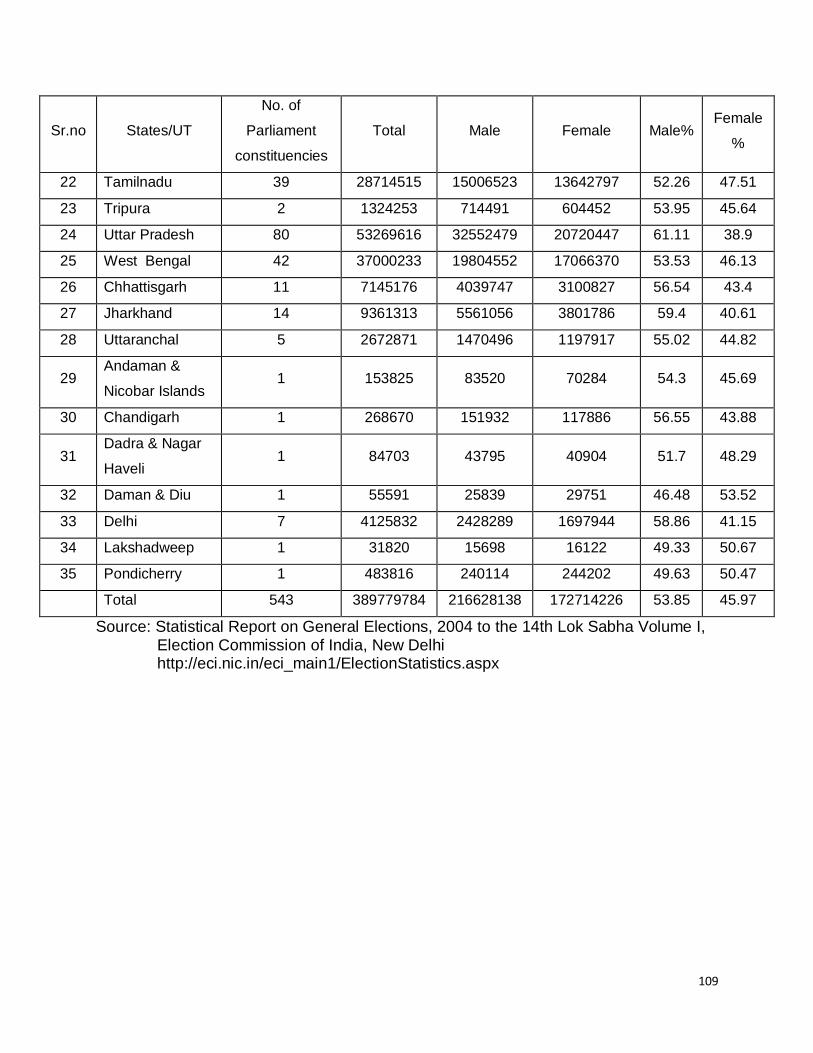
109
Sr.no States/UT
No. of
Parliament
constituencies
Total Male Female Male% Female
%
22 Tamilnadu 39 28714515 15006523 13642797 52.26 47.51
23 Tripura 2 1324253 714491 604452 53.95 45.64
24 Uttar Pradesh 80 53269616 32552479 20720447 61.11 38.9
25 West Bengal 42 37000233 19804552 17066370 53.53 46.13
26 Chhattisgarh 11 7145176 4039747 3100827 56.54 43.4
27 Jharkhand 14 9361313 5561056 3801786 59.4 40.61
28 Uttaranchal 5 2672871 1470496 1197917 55.02 44.82
29 Andaman &
Nicobar Islands 1 153825 83520 70284 54.3 45.69
30 Chandigarh 1 268670 151932 117886 56.55 43.88
31 Dadra & Nagar
Haveli 1 84703 43795 40904 51.7 48.29
32 Daman & Diu 1 55591 25839 29751 46.48 53.52
33 Delhi 7 4125832 2428289 1697944 58.86 41.15
34 Lakshadweep 1 31820 15698 16122 49.33 50.67
35 Pondicherry 1 483816 240114 244202 49.63 50.47
Total 543 389779784 216628138 172714226 53.85 45.97
Source: Statistical Report on General Elections, 2004 to the 14th Lok Sabha Volume I, Election Commission of India, New Delhi http://eci.nic.in/eci_main1/ElectionStatistics.aspx

110
Table B (4) State Wise Number and Percentage of Voters in General Elections, 2009 (Lok Sabha)
Sr.no States/UT
No. of
Parliament
constituencies
Total Male Female Male % Female %
1 Andhra
Pradesh
42 42009025 21052314 20845852 50.11 49.62
2 Arunachal
Pradesh
2 500583 255345 245284 51.01 49
3 Assam 14 12138945 6507097 5632823 53.61 46.4
4 Bihar 40 24230877 13458166 10775241 55.54 44.47
5 Goa 2 564071 290278 273482 51.46 48.48
6 Gujarat 26 17472323 9849339 7624781 56.37 43.64
7 Haryana 10 8154018 4535822 3619042 55.63 44.38
8 Himachal
Pradesh
4 2689567 1353662 1334297 50.33 49.61
9 Jammu 6 2605966 1539539 1065887 59.08 40.9
10 Karnataka 28 24567178 12972420 11592518 52.8 47.19
11 Kerala 20 16030249 7773572 8220848 48.49 51.28
12 Madhya
Pradesh
29 19482195 11620081 7852392 59.64 40.31
13 Maharashtra 48 36978848 20478932 16487190 55.38 44.59
14 Manipur 2 1336489 648533 690644 48.53 51.68
15 Meghalaya 2 822518 406532 415923 49.43 50.57
16 Mizoram 1 325558 164910 154086 50.65 47.33
17 Nagaland 1 1189460 613756 575635 51.6 48.39
18 Orissa 21 17757104 9304441 8452619 52.4 47.6
19 Punjab 13 11827727 6185757 5645170 52.3 47.73
Contd….

111
Sr.
no States/UT
No. of
Parliament
constituencies
Total Male Female Male % Female %
20 Rajasthan 25 17924439 10069744 7844124 56.18 43.76
21 Sikkim 1 251253 127201 118668 50.63 47.23
22 Tamilnadu 39 30383034 15453080 14903459 50.86 49.05
23 Tripura 2 1756517 910390 838874 51.83 47.76
24 Uttar Pradesh 80 55402134 32139774 23271819 58.01 42.01
25 West Bengal 42 42721172 22684694 20003460 53.1 46.82
26 Chhattisgarh 11 8553561 4569595 3983764 53.42 46.57
27 Jharkhand 14 9135434 5107910 4033059 55.91 44.15
28 Uttaranchal 5 3134926 1685060 1441326 53.75 45.98
29 Andaman &
Nicobar Islands
1 170103 91740 78359 53.93 46.07
30 Chandigarh 1 343556 192358 151176 55.99 44
31 Dadra & Nagar
Haveli
1 110363 57746 52617 52.32 47.68
32 Daman & Diu 1 68023 32502 35522 47.78 52.22
33 Delhi 7 5752950 3319925 2433896 57.71 42.31
34 Lakshadweep 1 39498 19721 19777 49.93 50.07
35 Pondicherry 1 607942 293090 315383 48.21 51.88
543 417037606 225765026 191028997 52.97 46.88
Source: Statistical Report on General Elections, 2009 to the 14th Lok Sabha Volume I, Election Commission of India, New Delhi http://eci.nic.in/eci_main1/ElectionStatistics.aspx

112
Table B (5) State Wise Contesting Candidates Number and percentage General Election, 2004
Sr.no States/UT
No. of
Parliament
constituencie
s’
Total Male Female Male % Female%
1 Andhra Pradesh 42 279 258 21 92.47 7.53
2 Arunachal Pradesh 2 13 13 0 100.00 0.00
3 Assam 14 116 110 6 94.83 5.17
4 Bihar 40 462 448 14 96.97 3.03
5 Goa 2 16 15 1 93.75 6.25
6 Gujarat 26 162 151 11 93.21 6.79
7 Haryana 10 160 152 8 95.00 5.00
8 Himachal Pradesh 4 23 21 2 91.30 8.70
9 Jammu 6 83 79 4 95.18 4.82
10 Karnataka 28 172 162 10 94.19 5.81
11 Kerala 20 177 162 15 91.53 8.47
12 Madhya Pradesh 29 294 264 30 89.80 10.20
13 Maharashtra 48 412 383 29 92.96 7.04
14 Manipur 2 12 11 1 91.67 8.33
15 Meghalaya 2 5 5 0 100.00 0.00
16 Mizoram 1 3 3 0 100.00 0.00
17 Nagaland 1 5 5 0 100.00 0.00
18 Orissa 21 100 91 9 91.00 9.00
19 Punjab 13 142 132 10 92.96 7.04
20 Rajasthan 25 185 168 17 90.81 9.19
21 Sikkim 1 4 4 0 100.00 0.00
22 Tamilnadu 39 571 548 23 95.97 4.03
Contd….

113
Sr. no States/UT
No. of
Parliament
constituencies’
Total Male Female Male % Female%
23 Tripura 2 12 12 0 100.00 0.00
24 Uttar Pradesh 80 1138 1077 61 94.64 5.36
25 West Bengal 42 355 321 34 90.42 9.58
26 Chhattisgarh 11 102 90 12 88.24 11.76
27 Jharkhand 14 182 169 13 92.86 7.14
28 Uttaranchal 5 54 49 5 90.74 9.26
29 Andaman &
Nicobar Islands
1 12 11 1 91.67 8.33
30 Chandigarh 1 17 16 1 94.12 5.88
31 Dadra & Nagar
Haveli
1 10 9 1 90.00 10.00
32 Daman & Diu 1 3 3 0 100.00 0.00
33 Delhi 7 129 114 15 88.37 11.63
34 Lakshadweep 1 4 4 0 100.00 0.00
35 Pondicherry 1 21 20 1 95.24 4.76
Total 543 5435 5080 355 94.28 5.72
Source: Statistical Report on General Elections, 2004 to the 14th Lok Sabha Volume I, Election Commission of India, New Delhi http://eci.nic.in/eci_main1/ElectionStatistics.aspx

114
Table B (6) State Wise Contesting Candidates Number and percentage General Elections 2009
Sr .no States/UT
No. of
Parliament
constituencies’
Total Male Female Male % Female%
1 Andhra Pradesh 42 569 530 39 93.15 6.85
2 Arunachal Pradesh 2 8 8 0 100.00 0.00
3 Assam 14 158 147 11 93.04 6.96
4 Bihar 40 672 626 46 93.15 6.85
5 Goa 2 18 16 2 88.89 11.11
6 Gujarat 26 359 333 26 92.76 7.24
7 Haryana 10 210 196 14 93.33 6.67
8 Himachal Pradesh 4 31 30 1 96.77 3.23
9 Jammu 6 81 75 6 92.59 7.41
10 Karnataka 28 427 408 19 95.55 4.45
11 Kerala 20 217 202 15 93.09 6.91
12 Madhya Pradesh 29 429 400 29 93.24 6.76
13 Maharashtra 48 819 764 55 93.28 6.72
14 Manipur 2 16 13 3 81.25 18.75
15 Meghalaya 2 11 8 3 72.73 27.27
16 Mizoram 1 4 4 0 100.00 0.00
17 Nagaland 1 3 3 0 100.00 0.00
18 Orissa 21 157 148 9 94.27 5.73
19 Punjab 13 218 205 13 94.04 5.96
20 Rajasthan 25 346 315 31 91.04 8.96
21 Sikkim 1 7 7 0 100.00 0.00
22 Tamilnadu 39 823 775 48 94.17 5.83
Contd….

115
Sr. no States/UT
No. of
Parliament
constituencies’
Total Male Female Male % Female%
23 Tripura 2 19 18 1 94.74 5.26
24 Uttar Pradesh 80 1368 1268 100 92.69 7.31
25 West Bengal 42 368 339 29 92.12 7.88
26 Chhattisgarh 11 178 163 15 91.57 8.43
27 Jharkhand 14 249 235 14 94.38 5.62
28 Uttaranchal 5 76 69 7 90.79 9.21
29 Andaman &
Nicobar Islands
1 11 10 1 90.91 9.09
30 Chandigarh 1 14 13 1 92.86 7.14
31 Dadra & Nagar
Haveli
1 5 5 0 100.00 0.00
32 Daman & Diu 1 7 7 0 100.00 0.00
33 Delhi 7 160 142 18 88.75 11.25
34 Lakshadweep 1 4 4 0 100.00 0.00
35 Pondicherry 1 28 28 0 100.00 0.00
543 8070 7514 556 93.58 6.42
Source: Statistical Report on General Elections, 2004 to the 14th Lok Sabha Volume I, Election Commission of India, New Delhi http://eci.nic.in/eci_main1/ElectionStatistics.aspx

116
Table B (7) State Wise Elected Candidates in Parliament, General elections, 2004
Sr. no States/UT Total Male Female Male % Female%
1 Andhra Pradesh 42 39 3 92.86 7.14
2 Arunachal Pradesh 2 2 0 100 0
3 Assam 14 14 0 100 0
4 Bihar 40 37 3 92.5 7.5
5 Goa 2 2 0 100 0
6 Gujarat 26 25 1 96.15 3.85
7 Haryana 10 9 1 90 10
8 Himachal Pradesh 4 3 1 75 25
9 Jammu 6 5 1 83.33 16.67
10 Karnataka 28 26 2 92.86 7.14
11 Kerala 20 18 2 90 10
12 Madhya Pradesh 29 27 2 93.1 6.9
13 Maharashtra 48 43 5 89.58 10.42
14 Manipur 2 2 0 100 0
15 Meghalaya 2 2 0 100 0
16 Mizoram 1 1 0 100 0
17 Nagaland 1 1 0 100 0
18 Orissa 21 19 2 90.48 9.52
19 Punjab 13 11 2 84.62 15.38
20 Rajasthan 25 23 2 92 8
21 Sikkim 1 1 0 100 0
22 Tamilnadu 39 35 4 89.74 10.26
23 Tripura 2 2 0 100 0
24 Uttar Pradesh 80 73 7 91.25 8.75
25 West Bengal 42 38 4 90.48 9.52
Contd….

117
Sr.no States/UT Total Male Female Male % Female%
26 Chhattisgarh 11 10 1 90.91 9.09
27 Jharkhand 14 13 1 92.86 7.14
28 Uttaranchal 5 5 0 100 0
29 Andaman & Nicobar
Islands
1 1 0 100 0
30 Chandigarh 1 1 0 100 0
31 Dadra & Nagar Haveli 1 1 0 100 0
32 Daman & Diu 1 1 0 100 0
33 Delhi 7 6 1 85.71 14.29
34 Lakshadweep 1 1 0 100 0
35 Pondicherry 1 1 0 100 0
Total 543 498 45 94.38 5.62
Source: Statistical Report on General Elections, 2004 to the 14th Lok Sabha Volume I, Election Commission of India, New Delhi http://eci.nic.in/eci_main1/ElectionStatistics.aspx

118
Table B (8) State Wise Elected Candidates in Parliament, General Elections, 2009 (Lok Sabha)
Sr.no States/UT No. of Parliament
constituencies Total Male Female Male% Female%
1 Andhra Pradesh 42 42 37 5 88.10 11.90
2 Arunachal Pradesh 2 2 2 0 100.00 0.00
3 Assam 14 14 12 2 85.71 14.29
4 Bihar 40 40 36 4 90.00 10.00
5 Goa 2 2 2 0 100.00 0.00
6 Gujarat 26 26 22 4 84.62 15.38
7 Haryana 10 10 8 2 80.00 20.00
8 Himachal Pradesh 4 4 4 0 100.00 0.00
9 Jammu 6 6 6 0 100.00 0.00
10 Karnataka 28 28 27 1 96.43 3.57
11 Kerala 20 20 20 0 100.00 0.00
12 Madhya Pradesh 29 29 23 6 79.31 20.69
13 Maharashtra 48 48 45 3 93.75 6.25
14 Manipur 2 2 2 0 100.00 0.00
15 Meghalaya 2 2 1 1 50.00 50.00
16 Mizoram 1 1 1 0 100.00 0.00
17 Nagaland 1 1 1 0 100.00 0.00
18 Orissa 21 21 21 0 100.00 0.00
19 Punjab 13 13 9 4 69.23 30.77
20 Rajasthan 25 25 22 3 88.00 12.00
21 Sikkim 1 1 1 0 100.00 0.00
22 Tamilnadu 39 39 38 1 97.44 2.56
23 Tripura 2 2 2 0 100.00 0.00
24 Uttar Pradesh 80 80 67 13 83.75 16.25
Contd….

119
Sr.no States/UT
No. of
Parliament
constituencies
Total Male Female Male% Female%
25 West Bengal 42 42 35 7 83.33 16.67
26 Chhattisgarh 11 11 9 2 81.82 18.18
27 Jharkhand 14 14 14 0 100.00 0.00
28 Uttaranchal 5 5 5 0 100.00 0.00
29 Andaman &
Nicobar Islands
1 1 1 0 100.00 0.00
30 Chandigarh 1 1 1 0 100.00 0.00
31 Dadra & Nagar
Haveli
1 1 1 0 100.00 0.00
32 Daman & Diu 1 1 1 0 100.00 0.00
33 Delhi 7 7 6 1 85.71 14.29
34 Lakshadweep 1 1 1 0 100.00 0.00
35 Pondicherry 1 1 1 0 100.00 0.00
543 543 484 59 92.49 7.51
Source: Statistical Report on General Elections, 2004 to the 14th Lok Sabha Volume I, Election Commission of India, New Delhi http://eci.nic.in/eci_main1/ElectionStatistics.aspx
Copyright © 2022 FDOKUMEN