Vesicle-micelle transition in aqueous mixtures of the cationic dioctadecyldimethylammonium and...
30
Vesicle-micelle transition in aqueous mixtures of the cationic dioctadecyldimethylammonium and octadecyltrimethylammonium bromide surfactants Fernanda Rosa Alves, 1 Maria Elisabete D. Zaniquelli, 2 Watson Loh, 3 Elisabete M.S. Castanheira, 4 M. Elisabete C.D. Real Oliveira, 4 and Eloi Feitosa 1,* 1 Physics Department, São Paulo State University, São José do Rio Preto - SP, Brazil 2 Instituto de Química, Universidade de São Paulo, Ribeirão Preto – SP, Brazil 3 Instituto de Química, Universidade Estadual de Campinas, Campinas – SP, Brazil 4 Physics Department, University of Minho, Campus de Gualtar, 4710-057 Braga, Portugal *To whom correspondence should be addressed: Eloi Feitosa Physics Department, IBILCE/UNESP Rua Cristóvão Colombo, 2265 São José do Rio Preto, SP - Brazil CEP: 15054-000 Voice: +55 17 3221 22 40 Telefax: +55 17 3221 22 47 e-mail: [email protected]
-
Upload
independent -
Category
Documents
-
view
1 -
download
0
Transcript of Vesicle-micelle transition in aqueous mixtures of the cationic dioctadecyldimethylammonium and...

Vesicle-micelle transition in aqueous mixtures of the cationic
dioctadecyldimethylammonium and octadecyltrimethylammonium bromide
surfactants
Fernanda Rosa Alves,1 Maria Elisabete D. Zaniquelli,2 Watson Loh,3 Elisabete M.S.
Castanheira,4 M. Elisabete C.D. Real Oliveira,4 and Eloi Feitosa1,*
1Physics Department, São Paulo State University, São José do Rio Preto - SP, Brazil 2Instituto de Química, Universidade de São Paulo, Ribeirão Preto – SP, Brazil
3Instituto de Química, Universidade Estadual de Campinas, Campinas – SP, Brazil
4Physics Department, University of Minho, Campus de Gualtar, 4710-057 Braga,
Portugal
*To whom correspondence should be addressed:
Eloi Feitosa
Physics Department, IBILCE/UNESP
Rua Cristóvão Colombo, 2265
São José do Rio Preto, SP - Brazil
CEP: 15054-000
Voice: +55 17 3221 22 40
Telefax: +55 17 3221 22 47
e-mail: [email protected]

1
Abstract
The vesicle-micelle transition in aqueous mixtures of dioctadecyldimethylammonium
and octadecyltrimethylammonium bromide (DODAB and C18TAB) cationic
surfactants, having respectively double and single chain, was investigated by
differential scanning calorimetry (DSC), steady state fluorescence, dynamic light
scattering (DLS) and surface tension. The experiments performed at constant up to 1.0
mM total surfactant concentration reveal that these homologue surfactants mix
together to form either mixed vesicles and/or micelles, or both of these structures in
equilibrium, depending on the relative amount of the surfactants. The main transition
melting temperature Tm of the mixed DODAB-C18TAB vesicles is larger than that for
the neat DODAB in water owing to the incorporation of C18TAB in the vesicle
bilayer, however, little amount of C18TAB having a minor effect on the Tm of
DODAB. The surface tension decreases sigmoidally with C18TAB concentration and
the inflection point lies around xDODAB ≈ 0.4, indicating the onset of micelle formation
owing to saturation of DODAB vesicles by C18TAB molecules and formation of
vesicle structures. At low C18TAB concentrations When xDODAB > 0.5 C18TAB
molecules are mainly solubilized by the vesicles bilayers, while at high C18TAB
concentrations but when xDODAB < 0.25 micelles are dominant. Fluorescence data of
the Nile Red probe incorporated in the system at different surfactant molar fractions
indicate the formation of micelle and vesicle structures. These structures have
apparent hydrodynamic radius RH of about 180 and 500-800 nm, respectively, as
obtained by DLS measurements.
Keywords: DODAB, C18TAB, surfactant, DSC, tensiometry, light scattering, melting
temperature, Nile Red, steady-state fluorescence.

2
Introduction
In aqueous solution surfactants can form a variety of colloidal aggregates and phases
depending on the surfactant concentration. When a micelle-forming surfactant is
mixed with a vesicle-forming surfactant in aqueous solution, within the range of
concentrations that favours the micelle or vesicle formation of the neat surfactants,
vesicle-micelle transition occurs, and the intermediate aggregate structures formed in
the mixed system depend on the surfactant composition, chemical structure and
solvent characteristics. In case these surfactants mix ideally together, the structures of
the mixed aggregates are usually investigated in order to elucidate the mechanism of
the vesicle-micelle transition.
Cationic vesicles from dioctadecyldimethylammonium bromide (DODAB) in
aqueous solution can easily be formed by simply mixing the surfactant molecules in
water, followed by warming the mixture to around 60ºC, that is, safely above the
melting temperature of the surfactant gel to liquid crystalline state transition, Tm ≈
43ºC [1-6]. The so prepared vesicle dispersions are stable for months even when
stored at a temperature below Tm, for example, at the fridge temperature (5ºC). The
properties of these vesicles can be mechanically modified by properly sonicating or
extruding the dispersion [3], or by adding co-solutes or co-surfactants to the
dispersion [4-11]. The Tm of DODAB in aqueous dispersions can be raised or lowered
on addition of co-surfactants [7]; the dependence of DODAB Tm on the co-surfactant
concentration is determined by the nature of the co-surfactant, like the chain length
and head group polarity [4-8]. For example, nonionic and zwitterionic surfactants
reduce the Tm of DODAB until complete solubilization of DODAB molecules by the
surfactants and the vesicle-micelle transition is complete, and the decrease in Tm has
been ascribed to the formation of “softer” mixed bilayer [4,5]. The surfactant
counterion also plays an important role in the thermotropic phase behavior of charged
vesicles in general and cationic vesicles in particular. It has been reported that in the
absence of inorganic salts like NaBr or NaCl, the Tm is larger for the chloride
homologue (DODAC) than for DODAB, owing to the specific affinity of these
counterions to the vesicle interfaces [10]. Furthermore, NaCl rises whereas NaBr
lowers the Tm of DODAB, as reported [9].
Anionic [11,12] and cationic [7,13] surfactants also modify the Tm of
DODAB. Sodium dodecyl sulfate (SDS) yields fusion of DODAB vesicles, while

3
sodium cholate (NaC) solubilizes DODAB to form micelles that fuse into large
aggegates [12]. SDS increases [11] but NaC decreases [12] Tm of DODAB.
Alkyltrimethylammonium salts (CnTAB, n = 12-18) may reduce, increase or leave
constant the Tm of DODAB, depending on the relative chain length of these
surfactants [7,13].
In this communication it is reported that when mixed with DODAB the single
chain cationic surfactant octadecyltrimethylammonium bromide (C18TAB) yields
higher Tm or leave it roughly constant depending on the relative amount of these
surfactants. The main Tm of DODAB increases slightly while a second even higher
melting temperature appears at higher xC18TAB. Furthermore, it is shown the
dependence of Tm on the relative amount of these surfactants. At low concentrations
and above the Krafft temperature (Tk ≈
38ºC in water) C18TAB self-assembles as
globular micelles [14] and in small proportion as bilayer structure, as suggested in this
communication. The melting temperature, hydrodynamic radius, surface tension and
fluorescence emission of the hydrophobic probe Nile Red, are reported for the
DODAB/C18TAB aqueous mixtures to gain information on the mechanism of
association of these surfactants as vesicles or micelles, within the framework of on the
vesicle-micelle transition.
Experimental
Materials
Dioctadecyldimethylammonium bromide (DODAB), C18TAB (octadecyltrimethyl-
ammonium bromide) and 9-(diethyl-amino)-5H-benzo[α]phenoxazin-5-one (Nile
Red) were used as supplied by Aldrich. Ultrapure Milli-Q-Plus water was used in
sample preparation. Scheme 1 shows the molecular structures of DODAB, C18TAB
and Nile Red.
Sample preparation
DODAB and C18TAB (1.0 mM) aqueous solutions were prepared by weighting the
surfactants and warming the dispersion to 60 and 50ºC, respectively, that is, safely
above the melting (Tm ≈
43oC) [3] and Krafft (Tk ≈ 38ºC) [14] temperatures of these
systems.
4
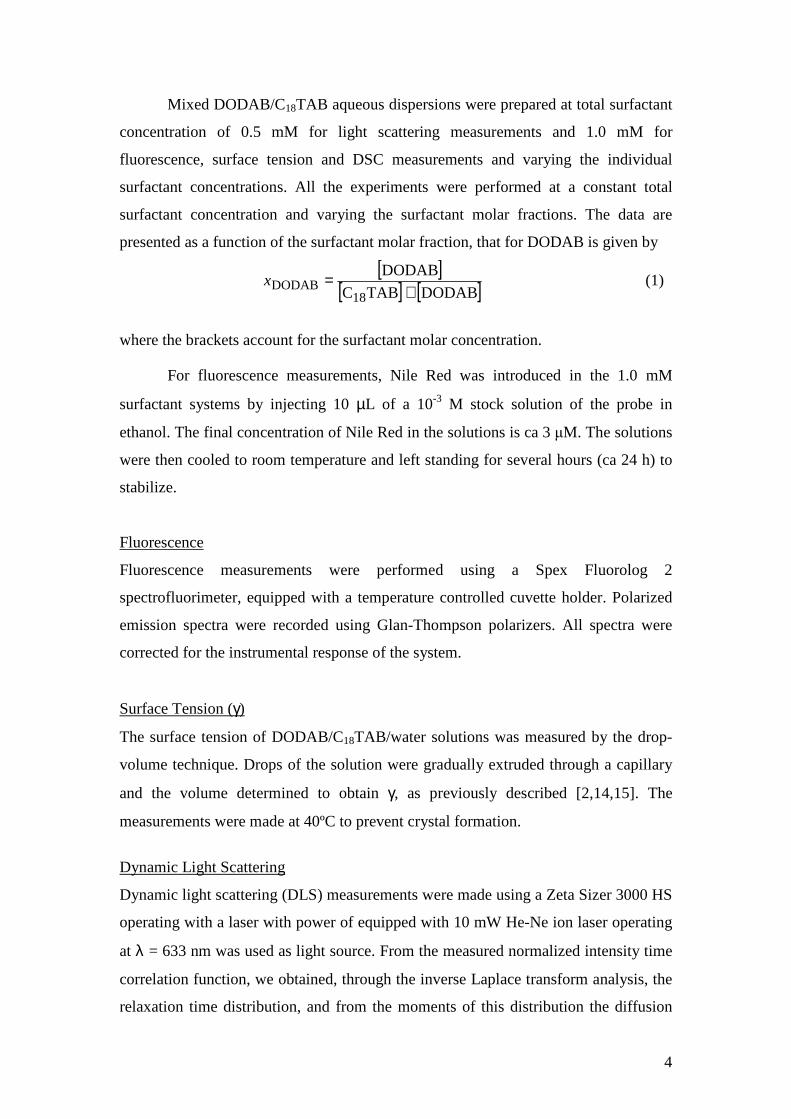
Mixed DODAB/C18TAB aqueous dispersions were prepared at total surfactant
concentration of 0.5 mM for light scattering measurements and 1.0 mM for
fluorescence, surface tension and DSC measurements and varying the individual
surfactant concentrations. All the experiments were performed at a constant total
surfactant concentration and varying the surfactant molar fractions. The data are
presented as a function of the surfactant molar fraction, that for DODAB is given by
[ ]
[ ] [ ]DODABTABC
DODAB
18DODAB +
=x (1)
where the brackets account for the surfactant molar concentration.
For fluorescence measurements, Nile Red was introduced in the 1.0 mM
surfactant systems by injecting 10 µL of a 10-3 M stock solution of the probe in
ethanol. The final concentration of Nile Red in the solutions is ca 3 µM. The solutions
were then cooled to room temperature and left standing for several hours (ca 24 h) to
stabilize.
Fluorescence
Fluorescence measurements were performed using a Spex Fluorolog 2
spectrofluorimeter, equipped with a temperature controlled cuvette holder. Polarized
emission spectra were recorded using Glan-Thompson polarizers. All spectra were
corrected for the instrumental response of the system.
Surface Tension (γ)
The surface tension of DODAB/C18TAB/water solutions was measured by the drop-
volume technique. Drops of the solution were gradually extruded through a capillary
and the volume determined to obtain γ, as previously described [2,14,15]. The
measurements were made at 40ºC to prevent crystal formation.
Dynamic Light Scattering
Dynamic light scattering (DLS) measurements were made using a Zeta Sizer 3000 HS
operating with a laser with power of equipped with 10 mW He-Ne ion laser operating
at λ = 633 nm was used as light source. From the measured normalized intensity time
correlation function, we obtained, through the inverse Laplace transform analysis, the
relaxation time distribution, and from the moments of this distribution the diffusion
5
coefficients of the particles were determined [16]. The apparent hydrodynamic radius
was then obtained using the Stokes-Einstein equation
RH = D
kT
06πη (2)
where D is the mean diffusion coefficient, k is the Boltzmann constant, T is the
absolute temperature and η0 is the solvent viscosity.
Differential Scanning Calorimetry (DSC)
A VP-DSC (MicroCal, Northampton, MA) calorimeter equipped with 0.542 ml twin
cells for the reference and sample solutions was used. The measurements were
performed with the scan rate of 1oC/min and temperature range of 5-80°C. The two
cells filled with water were run as baseline reference. From the thermograms we
obtained Tm, which is the temperature at the peak maximum, the enthalpy change of
this transition, which is proportional to the area under the transition peak, and the
transition cooperativity, which is inversely proportional to the peak width. Further
Details on the DSC methods and setup can be found elsewhere in previous
publications [4-6].
Results and discussion
When C18TAB (critical micellar concentration, CMC ≈ 0.35 mM at 40oC) [17] and
DODAB (critical vesicular concentration, CVC ≈ 0) [2] are mixed together in water,
either vesicles or micelles or both can be formed, depending on the surfactant
concentration, temperature and ionic strength, since the structure of these surfactant
aggregates depends individually on these parameters [9,14]. In this communication, it
is reported the effect of the surfactant concentration and temperature on some physical
properties of the DODAB/C18TAB/water system.
Above CMC and at room temperature (ca 25ºC), neat C18TAB in water
precipitates as hydrated crystals (HC) within ca. 24 hours of preparation, since the
system is below the Krafft temperature (Tk ≈ 38ºC. [14] of this surfactant in water.
DODAB, on the other hand, has quite low CVC [2] and is poorly soluble in water
below Tm ≈ 43ºC. Above this critical temperature DODAB forms large unilamellar
vesicles (LUV) at concentrations up to ca 1 mM [1-13].

6
In presence of up to ca xDODAB = 0.25 (xC18TAB > 0.75) the dispersion is rich in
C18TAB micelles and there are some HC precipitates at 25oC in equilibrium with
mixed vesicles; above xDODAB ≈ 0.25 this DODAB concentration the dispersion is
bluish and rich in vesicle structures, and most of the C18TAB molecules are either
incorporated in the vesicle bilayers or free in solution as monomers. The phase
diagram for the DODAB/C18TAB/water system for 1.0 mM total surfactant
concentration and 25ºC is shown in the supporing materials (Fig. SM1). It indicates
the region of vesicle dispersion (L1), xDODAB > 0.25 and that of crystal precipitates in
vesicle dispersion (L1 + HC), xDODAB < 0.25. Most probably the unbound C18TAB
surfactants to the vesicle structures precipitate as hydrated crystals. The phase
diagram was constructed by preparing a number of samples having different
compositions that were kept standing for months at 25oC before the phase border
being defined. The samples were observed by naked eyes and the properties of
surfactant mixtures at varying surfactant concentration were monitored by a number
of techniques, as discussed below. For all experimental data the error does not exceed
5%.
Surface Tension results
The surface tension (γ) data for the DODAB/C18TAB/water system were collected at
40ºC (slightly above Tk of neat C18TAB in water and below Tm the of neat DODAB in
water) and constant 1.0 mM total surfactant concentration (Fig. 1). For xDODAB = 1
(neat DODAB in water) γ approaches that of pure water (ca 72.0 mNm-1), owing to
the very low CVC of DODAB in water [2]. In presence of up to xC18TAB ≈ 0.5 (xDODAB
> 0.5), there is no significant decrease change in γ, indicating that C18TAB is
solubilized into the vesicle bilayer to form mixed DODAB-C18TAB vesicles instead
of adsorbing at the air/water interface. At higher C18TAB content, however,
γ decreases sigmoidally, with the inflection point around xDODAB ≈ 0.4, to attain the
minimum value of ca 36 mNm-1, that is comparable similar to the value of neat
C18TAB in water above CMC [14]. The decrease in γ is most probably due to
saturation of the vesicle bilayer by C18TAB and the excess surfactant monomers that
remain free in solution act at the air-water interface of the system. For xDODAB < 0.25
the solution is dominated by C18TAB-DODAB mixed micelles. Finally, neat C18TAB
(1.0 mM) in water assembles mainly as globular micelles, as reported [14].

7
Dynamic light scattering (DLS) results
DLS data were collected at 25ºC and constant 0.5 mM total surfactant concentration,
and the mean apparent hydrodynamic radius (RH) of the aggregates monitored as a
function of xDODAB the surfactant molar fraction (Fig. 2). At higher concentrations
DODAB vesicles scatter too much light, thus being not suitable for the data analyses
[1]. Accordingly, for the neat DODAB vesicles RH ≈ 544 nm and in presence of
increasing amount of C18TAB (decreasing xDODAB) RH tends to increase to a maximum
value of RH ≈ 820 nm when xDODAB ≈ 0.3, and then it decreases to the value of RH for
the neat C18TAB micelles, RH ≈ 180 nm. The large micelle size has to do with the
trend of C18TAB not to assemble as globular micelles, as reported [14].
The vesicle growth may be attributed to the incorporation of C18TAB into the
DODAB bilayer to favor larger vesicle formation. The RH maximum at xDODAB ≈ 0.3
corresponds to the onset of micelle formation. Beyond this point (xDODAB < 0.3), RH
decreases to attain the value of the neat C18TAB micelles. The decrease in RH is most
probably related to the formation of increasing amount of mixed micelles in
equilibrium with a decreasing amount of mixed DODAB vesicles. Since the micelles
are smaller than the vesicles, the mean size reported might be the average size of the
vesicle and micelle populations.

8
Differential scanning calorimetry (DSC) results
The DSC traces for 1.0 mM total surfactant concentration in mixed DODAB/C18TAB
aqueous dispersions are shown in Fig. 3 for varying surfactant concentrations. The
melting temperature, Tm, melting enthalpy (∆H) and peak width (∆T1/2) related to the
main transition are also shown in Figs. 4 and 5 and Table SM1, as function of xDODAB.
Accordingly, the neat DODAB/water dispersion (xDODAB = 1) exhibits a small pre-
transition peak around Ts = 33.3oC, in addition to the main transition at Tm = 42.5oC,
as reported before [3]. The pre- and main transitions are related to the transitions from
the gel phase to the rippled gel phase and from this to the liquid-crystalline (LC)
phase, respectively, upon raising the temperature [18,19]. Since the pre-transition
vanishes in presence of a small amount of C18TAB (Fig.3), mixed C18TAB-DODAB
vesicles exhibit a direct gel-LC phase transion.
Even though the vesicle dispersions are quite polydisperse [1,2], the width of
the main transition peak is rather narrow [3], thus indicating a little dependence of Tm
on the vesicle curvature and structure (like multilamellar or multistructural) in
dispersions of large vesicles, and does not change with surfactant concentration
except for the intermediate range of xDODAB = 0.5-0.9 where there is some peak
overlaping, indicating that C18TAB is solubilized in different vesicle populations,
according to the two-population model for the vesicle dispersions of DODAB [1]. In
this range of concentration the large values of ∆T1/2 (Fig. 5) are meaningless since
they are related to peak overlaping instead of single transition peaks.
The peak related to the main transition for neat DODAB in water is slightly
shifted upward, that is, Tm increases just a little bit slightly on increasing xC18TAB up to
ca 0.7 wt%, when the relative amount of C18TAB, whereas a new peak appears at a
slightly higher temperature overlapping the main transition peak. By further
increasing the amount of C18TAB, the intensity of the neat DODAB main peak
decreases while the intensity of the additional peak becomes more pronounced.
Finally, the main peak for the DODAB-rich vesicles disappears around ca xDODAB ≈
0.5 (Fig. 3), indicating the presence of mixed vesicles dominated by C18TAB that
exhibit higher Tm.
The presence of two main transitions associated to the main peak can be
explained by the presence of two populations of vesicles in the neat DODAB aqueous

9
dispersion that differ mainly in size and structure (multilamellar vs. multistructural)
[1] and also to the different surfactant packing of DODAB and C18TAB which
determines the vesicle curvature. Since Tm tends to increase with vesicle size [3], the
lower and higher temperature main peaks may be related to the higher- and lower-
curvatured vesicles, respectively. Since C18TAB yields vesicle growth (Fig. 2), the
population of smaller vesicles may be reduced in comparison with the larger ones.
Thus, as the relative concentration of C18TAB increases, the peak intensity for the
C18TAB-rich vesicles increases, while the one for DODAB-rich vesicles decreases to
disappear around the equimolar concentration of the surfactants.
Up to xC18TAB ≈ 0.3 (xDODAB ≥ 0.7), Tm is roughly the same (or slightly higher),
(Fig. 4) thus indicating that the C18TAB monomers are incorporated into the DODAB
vesicles to form mixed DODAB-C18TAB vesicles with the C18TAB monomers
distributed homogeneously within the DODAB bilayer, such that the mixed vesicles
exhibit similar characteristics to the neat DODAB vesicles. For xDODAB lower than 0.7,
there is a pronounced increase in Tm until xDODAB approaches 0.3, when Tm ≈ 47oC and
mixed DODAB-C18TAB micelles are formed. In fact the higher Tm comes from a
second peak in the thermogram that initially overlap with the original peak, and these
two peaks may be due to solubilization of C18TAB in different vesicle populations.
When the amount of C18TAB is further increased, Tm remains roughly constant,
indicating that the C18TAB monomers are not solubilized anymore by the (saturated)
vesicle bilayers.
Fig. 3 insert indicates a rather broad peak at Tk’ ≈ 26.7oC for neat C18TAB in
water. This critical temperature is lower than that expected for the Krafft point of this
system (ca 38oC) [14] and may be related to a transition in the micelle structure, since
at this concentration and temperature the rate of crystal formation is much slower than
the DSC scan rate. In presence of small amount of DODAB Tk’ increases but the peak
intensity decreases to vanish around xDODAB ≈ 0.8. The sharper peak above 40oC
comes from the main transition.
Interestingly C18TAB exhibits in addition to the peak at Tk’ = 26.7oC, an
additional peak centered at Tm = 46oC. Neither these peaks have to do with the Krafft
phenomenon that takes place for this surfactant around 40oC [2]. Even though the
origin for these peaks is not clear, the smaller one centered at Tm = 46oC is most
probably related to the trend of C18TAB to form bilayer-like structures, as reported
[14]. Upon addition of DODAB, the peak at Tm increases intensity whereas the one at
10
Tk’ is inhibited. According to Fig. 4 Tm initially increases to a maximum plateau
around 47oC and then it decreases to values comparable to that of neat DODAB,
meaning that the vesicle bilayers dominated by C18TAB are more compact than those
dominated by DODAB.
The melting enthalpy decreases monotonically with the amount of C18TAB
concentration (Fig. 5), also indicating that the C18TAB-rich bilayer is more densily
packed relative to that of DODAB . Figure 5 also shows the effect of xDODAB on the
width ∆T1/2 of the main transition peak. The larger ∆T1/2 for xDODAB ≈ 0.5-0.9 is due to
the overlap of the two main peaks that might be related to the two populations of
DODAB vesicles present in solution that mainly differ by the relative fraction of
C18TAB solubilized into the vesicle bilayers. Except for the region of peak overlap,
the width of all single peaks is rather narrow, indicating high cooperativity of the
main transition. In fact the peaks are narrower for the C18TAB-rich than for the
DODAB-rich vesicles.
Fluorescence results
The fluorescence probe Nile Red (NR) has been extensively used as a probe for lipid
aggregates, such as vesicles, due to its hydrophobic nature that allow it to be
incorporated in the bilayer moiety [20-23]. In addition, this probe exhibits a
solvatochromic behavior and in polar media it is observed a red shift in the emission
maximum, together with fluorescence quenching, due to the capability of NR to
establish hydrogen bonds with protic solvents [24]. As a consequence, the NR
emission in water is very weak with λmax ≈ 660 nm [25].
Figure 6 shows the emission spectra of NR incorporated in the
DODAB/C18TAB/water system at 25ºC, for selected surfactant molar fractions. The
fluorescence intensity increases when xDODAB decreases (xC18TAB increases). The lower
fluorescence emission for the neat DODAB/water system (xDODAB = 1) indicates that
NR feels a water-rich environment in DODAB vesicles. In fact, the maximum
emission wavelength for xDODAB = 1, λmax ≈ 650 nm, is close to the value for pure
water (λmax ≈ 660 nm) [25], probably due to the fact that at room temperature (below
Tm = 42.5ºC) DODAB vesicle bilayers are in the gel phase, thus hindering the probe
to penetrate deeper in the lipid bilayer.

11
When xDODAB decreases, the emission intensity increases monotonically (Fig.
6), indicating that NR becomes less exposed to water in the mixed aggregates. This
can be explained by the formation of larger structures with a lower curvature, due to
the incorporation of C18TAB into the DODAB bilayer, as shown by the light
scattering data (Fig. 2). At higher C18TAB content (xDODAB < 0.3), the further increase
in NR fluorescence intensity may be justified by the formation of an increasing
amount of mixed micelles, where NR feels a more fluid (less viscous) environment
and may achieve a deeper penetration.
The variation of the maximum emission wavelength (λmax) of NR with
increasing xDODAB (Fig. 6 insert) indicates the same trend. At 25ºC (below Tm), in the
gel phase, λmax decreases with decreasing xDODAB, thus indicating an increasing
hydrophobicity of the local environment of NR when the relative amount of C18TAB
is increased. An opposite behavior of λmax is observed at 55ºC (above Tm), in the
liquid-crystalline phase, where NR feels a more hydrophobic environment at higher
xDODAB. These results indicate that the aggregate bilayer fluidity depends both on
temperature and surfactant composition, and plays an important role in the probe
location in the mixed systems.
Figure 7 shows the average steady-state fluorescence anisotropy, r, of NR in
DODAB/C18TAB/water mixtures, obtained at increasing temperature, for xDODAB
varying from 0 to 1. The anisotropy is given by
VHVV
VHVV
2 IGI
IGIr
+−
= (3)
where IVV and IVH are the intensity of the emission spectra obtained with vertical and
horizontal polarization, respectively (for vertically polarized excitation light), and
HHHV IIG = is the instrument correction factor, where IHV and IHH are the emission
intensities obtained with vertical and horizontal polarization (for horizontally
polarized excitation light).
A high steady-state fluorescence anisotropy value is related to a low degree of
rotation of the fluorescence probe. Therefore, anisotropy variations are indicative of
changes in fluidity of the probe environment. When temperature increases above Tm, a
decrease in anisotropy is observed resulting from the decrease in the medium
viscosity in the liquid-crystalline phase.

12
For neat DODAB vesicles (xDODAB = 1) the anisotropy is high at temperatures
below Tm, in the gel phase, and exhibits a pronounced decrease upon the gel to liquid-
crystalline transition, as previously observed [6]. For the mixed surfactant systems
and temperature below 35ºC, the anisotropy decreases monotonically with the
decrease in the DODAB content, indicating an average increase in fluidity of the
mixed aggregates.
In the liquid crystalline phase the anisotropy of the mixed systems for xDODAB
> 0.3 is similar to the value obtained for neat DODAB vesicles. However, a different
behaviour was observed for xDODAB ≤ 0.3, where the anisotropy approaches the value
for neat C18TAB in water. This indicates that for ca xDODAB > 0.3, the aggregates are
dominated by mixed vesicles, while for lower xDODAB, the aggregates are dominated
by mixed micelles. This is supported by the surface tension data that approach the
value for the neat DODAB/water system when xDODAB > 0.5 (Fig. 1). Since the CMC
of C18TAB in water at 40ºC is ca 0.35 mM [17], it is possible that some mixed
micelles and vesicles co-exist when xDODAB < 0.5. This could explain the strong
attenuation of the phase transition in the anisotropy plots for xDODAB = 0.4 and 0.5
(Fig. 7).
Figure 8 shows the variation of the total fluorescence intensity,
VHVVtotal IG2II += , with temperature for three different DODAB molar fractions
(for other values of xDODAB similar data were obtained – results not shown). In the
mixed surfactant systems, a maximum is observed around 47ºC, close to Tm. Below
this temperature, in the gel phase, it can be observed a slight increase in fluorescence
intensity followed by a steep rise around Tm. This may be due to an increase in bilayer
fluidity (chain melting) of the system, causing a deeper penetration of NR in the
mixed aggregates. This behavior exceeds the usual fluorescence quenching with
temperature, due to the increase in the competitive non-radiative processes, as
observed for the neat C18TAB system (xDODAB = 0). Above DODAB Tm, in the liquid-
crystalline phase, the emission intensity decreases with increasing temperature, which
is the usual behavior.
The less abrupt increase in Itotal for xDODAB = 0.3 relative to xDODAB = 0.7 may
reflect the lower transition temperature for the latter molar fraction (Fig. 4 and Table
SM1). However, the fluorescence measurements are not sensitive enough to small
variations in Tm as observed by DSC.

13
Conclusions
Based in the present results of differential scanning calorimetry, dynamic light
scattering, NR fluorescence and tensiometry the following conclusions can be
outlined: At 1 mM DODAB and C18TAB form vesicles and micelles, respectively. By
mixing these surfactants mixed vesicles and/or micelles are formed. The melting
temperature (Tm) for the mixed vesicles is higher than that for neat DODAB, so as the
hydrodynamic radii for the mixed micelles and mixed vesicles. In the gel phase the
average fluidity of the aggregates increases with the increasing amount of C18TAB,
while in the liquid-crystalline phase two regions are distinguished, one with the
presence of vesicle structures (xDODAB > 0.3) and the other dominated by higher fluid
mixed micelles.
Association colloids with well defined and controlled properties, such as
melting temperature, size and polydispersity, can thus be formed by mixing
surfactants aiming the developement of structures that contain domains of
solubilization for specific solute molecules for different applications.
Acknowledgements
FRA and EF thank CNPq for PhD and research grant (Grant 304543/2006-3),
respectively. EF also thanks FAPESP for supporting his visity to Universidade do
Minho (Grant 07/51039-3). EMSC and MECDRO thanks FCT-Portugal for funding
through Centro de Física of Universidade do Minho.
References
[1] E. Feitosa, G. Karlsson, K. Edwards, Chem. Phys. Lipids 140 (2006) 66.
[2] E. Feitosa, W. Brown, Langmuir 13 (1997) 4810.
[3] E. Feitosa, P.C.A. Barreleiro, G. Olofsson, Chem. Phys. Lipids 105 (2000)
201.
[4] P.C.A. Barreleiro, G. Olofsson, N.M. Bonassi, E. Feitosa, Langmuir 18
(2002) 1024.
[5] E. Feitosa, N.M. Bonassi, W. Loh, Langmuir 22 (2006) 4512.
14
[6] E. Feitosa, F.R. Alves, A. Niemiec, M.E.C.D. Real Oliveira, E.M.S.
Castanheira, A.L.F. Baptista, Langmuir 22 (2006) 3579.
[7] A. Kacperska, J. Thermoch. Analysis 45 (1995) 703.
[8] M.J. Blandamer, B. Briggs, M.D. Butt, P.M. Cullis, M. Waters, J.B.F.N.
Engberts, D. Hoekstra, J. Chem. Soc. Faraday Trans. 90 (1994) 727.
[9] E. Feitosa, P.C.A. Barreleiro, Prog. Coll. Polym. Sci. 128 (2004) 163.
[10] C.R. Benatti, E. Feitosa, R.M. Fernandez, M.T. Lamy-Freund, Chem. Phys.
Lipids 111 (2001) 93.
[11] J. Cocquyt, U. Olsson, G. Olofsson, P. Van der Meeren, Langmuir 20 (2004)
3906.
[12] F.R. Alves, E. Feitosa, Thermochim. Acta 450 (2006) 76.
[13] M.J. Blandamer, B. Briggs, P.M. Cullis, A. Kacperska, J.B.F.N. Engberts, D.
Hoekstra, J. Indian Chem. Soc. 70 (1993) 347.
[14] M. Swanson-Vethamuthu, E. Feitosa, W. Brown, Langmuir 14 (1998) 1590.
[15] E. Tornberg, J. Coll. Interf. Sci. 60 (1977) 50.
[16] W. Brown, Dynamic Light Scattering. The Method and Some Applications.
Clarendon Press, Oxford, 1993.
[17] J. Mata, D. Varade, P. Bahadur, Thermochimica Acta 428 (2005)147.
[18] P.L. Luisi, B.E. Straub, in Reverse Micelles – Biological and Technological
Relevance of Amphiphilic Structures in Apolar Media. Plenum Press, New
York and London, 1984.
[19] D.F. Evans, H. Wennerström, The Colloidal Domain. Wiley-VCH, 1994.
[20] P. Greenspan, S.D.J. Fowler, Lipid Res. 26 (1985) 781.
[21] I. Krishnamoorthy, G. Krishnamoorthy, J. Phys. Chem. B 15 (2001) 1484.
[22] P.J.G. Coutinho, E.M.S. Castanheira, M.C. Rei, M.E.C.D. Real Oliveira, J.
Phys. Chem. B 106 (2002) 12841.
[23] G. Hungerford, E.M.S. Castanheira, A.L.F Baptista, P.J.G. Coutinho,
M.E.C.D. Real Oliveira, J. Fluorescence 15 (2005) 835.
[24] A. Cser, K. Nagy, L. Biczók, Chem. Phys. Lett. 360 (2002) 473.
15
[25] G. Hungerford, E.M.S. Castanheira, M.E.C.D. Real Oliveira, M.G. Miguel,
H.D. Burrows, J. Phys. Chem. B 106 (2002) 4061.

16
Figure texts
Fig. 1 – The effect of DODAB (or C18TAB) molar fraction on the surface tension of
water-air interface for the DODAB/C18TAB/water system. The total surfactant
concentration is 1.0 mM and data obtained at 40oC. It indicates regions dominated by
micelles (I), micelles and vesicles (II) and vesicles (III). Ves = vesicle, Mic = micelle,
Surf = surfactant.
Fig. 2 – The effect of DODAB (or C18TAB) molar fraction on the apparent
hydrodynamic radius (RH) of the surfactant aggregates in the DODAB/C18TAB/water
system, at the total surfactant concentration of 0.5 mM (25oC). The dashed line is just
a guide for the eyes.
Fig. 3 – DSC upscan thermograms for the mixture DODAB/C18TAB/water, for 1.0
mM total surfactant concentration and varying DODAB molar fraction (numbers
beside the curves). Insert shows the expanded thermograms for neat C18TAB in water
and for xDODAB = 0, 0.1 and 0.2.
Fig. 4 – The effect of DODAB (or C18TAB) molar fraction on the melting
temperature (Tm) of the cationic mixed DODAB/C18TAB aqueous dispersions.
Fig. 5 – The effect of DODAB (or C18TAB) molar fraction on the enthalpy change
(∆H) width of the melting peak (∆T1/2) for the cationic mixed DODAB/C18TAB
aqueous dispersions.
Fig. 6 – Fluorescence spectra of Nile Red in DODAB/C18TAB/water mixed systems
for several xDODAB at 25ºC (λexc = 550 nm). Insert: Maximum emission wavelength of
Nile Red in DODAB/C18TAB/water mixed systems in water, below (T = 25ºC) and
above (T = 55ºC) the melting temperature, as a function of xDODAB.
Fig. 7 – Steady-state anisotropy of Nile Red in DODAB/C18TAB/water mixed
systems for selected DODAB molar fractions.

17
Fig. 8 – Total intensity of fluorescence (Itotal = IVV + 2GIVH) of Nile Red in
DODAB/C18TAB/water mixed systems for selected DODAB molar fractions.

18
Nile Red
C18TAB
DODAB
Scheme 1 – Molecular structures of Nile Red, C18TAB and DODAB.

19
Fig. 1, Alves et al.

20
0,0 0,2 0,4 0,6 0,8 1,0
200
400
600
800
RH /
nm
xDODAB
Fig. 2, Alves et al.

21
20 40 60 80
0.0
0.1
0.2
0.3
0.4
0.5
0.6
0.7
0.8
0.9
1.0
End
othe
rmic
Temperature (oC)
Fig. 3, Alves et al.
20 40 60 80
0.2
0.1
0.0
End
othe
rmic
Temperature (oC)

22
0,0 0,2 0,4 0,6 0,8 1,042
43
44
45
46
47
Tm /
o C
xDODAB
Fig. 4, Alves et al.

23
0,2 0,4 0,6 0,8 10
2
4
6
8
10
12
xDODAB
∆H /
kcal
mol
-1
0
1
2
3
4∆
T1/2 / oC
Fig. 5, Alves et al.

24
Fig. 6, Alves et al.

25
Fig. 7, Alves et al.

26
Fig. 8, Alves et al.

27

28
Graphical Abstract
Vesicle-micelle transition in aqueous mixtures of the cationic
dioctadecyldimethylammonium and octadecyltrimethylammonium bromide
surfactants
Fernanda Rosa Alves, Maria Elisabete D. Zaniquelli, Watson Loh, Elisabete M.S.
Castanheira, M. Elisabete C.D. Real Oliveira, and Eloi Feitosa

29
Supporting materials for JCIS-07-1096
0 0.6 0.8 1.00.4
L + HC1 L1
Fig. SM1 – Phase diagram for the DODAB/C18TAB/water system, at 1.0 mM total
surfactant concentration and varying the individual surfactant molar fraction. Similar
diagram was obtained for 0.5 mM total surfactant concentration (not shown). L1 and
HC account for vesicle phase and hydrated crystals, respectively.
Table SM1: Main and pre-transion temperatures, enthalpy and width of the melting
transition peak for different DODAB molar fractions. Tk’ accounts either for DODAB
pre-transiton temperature or neat C18TAB/water structure transition. For xDODAB
= 0.7
and 0.8 there are two values of Tm due to the overlapping of the peaks.
xDODAB
Tm (oC)
Ts or Tk’
(oC) ∆H (kcal mol-1) ∆T1/2 (
oC)
1.0 42.59 33.3 9.74 1.33
0.9 42.42 32.5 9.57 1.60
0.8 42.71 (43.5)
--- 7.71 2.39
0.7 42.81 (44.0)
--- 7.85 2.93
0.6 45.29 --- 8.65 3.48
0.5 46.32 --- 6.80 1.33
0.4 46.75 --- 5.44 1.06
0.3 47.00 --- 3.92 1.07
0.2 47.02 2.87 1.06
0.1 46.88 31.66 1.29 1.07
0.0 45.85 26.70 --- ---
xDODAB