Manganese ferrite prepared using reverse micelle process: Structural and magnetic properties...
8
Manganese ferrite prepared using reverse micelle process: Structural and magnetic properties characterization Mohd. Hashim a,⇑ , Sagar E. Shirsath b , S.S. Meena c , M.L. Mane d , Shalendra Kumar e , Pramod Bhatt c , Ravi Kumar f , N.K. Prasad g , S.K. Alla g , Jyoti Shah h , R.K. Kotnala h , K.A. Mohammed i , Erdog ˘an S ßentürk j , Alimuddin a a Department of Physics, Aligarh Muslim University, Aligarh 202002, India b Spin Device Technology Centre, Department of Engineering, Shinshu University, Nagano 380-8553, Japan c Solid State Physics Division, Bhabha Atomic Research Centre, Mumbai 400085, India d Department of Physics, S.G.R.G. Shinde Mahavidyalaya, Paranda 413502, MS, India e School of Materials Science and Engineering, Changwon National University, Changwon, Gyeongnam 641-773, Republic of Korea f Centre for Material Science Engineering, National Institute of Technology, Hamirpur, HP, India g Deptartment of Metallurgical Engineering, Indian Institute of Technology (Banaras Hindu University), Varanasi 221005, India h National Physical Laboratory (CSIR), Dr. K.S. Krishnan Road, New Delhi 110012, India i Department of Mathematics & Physics Sciences, College of Arts and Sciences, University of Nizwa, Nizwa, Oman j Department of Physics, Sakarya University, Esentepe, 54187 Sakarya, Turkey article info Article history: Received 9 January 2015 Received in revised form 3 April 2015 Accepted 14 April 2015 Available online 20 April 2015 Keywords: Nanostructured materials Chemical synthesis Magentisation Mössbauer spectroscopy X-ray diffraction abstract Reverse microemulsion process was employed to prepare of nanocrystalline Mn 3+ substituted MnFe 2x Mn x O 4 ferrites. The structural, magnetic and dielectric properties were studied for different con- centrations of Mn 3+ . The structural and microstructural properties were analyzed using X-ray diffraction technique (XRD), transmission electron microscopy (TEM), scanning electron microscopy (SEM) and Fourier transform infrared (FT-IR) spectroscopy techniques. The phase identification of the materials was studied by Rietveld refined XRD patterns which reveals single phase with cubic symmetry for the samples. The lattice parameters were ranged in between 8.369 and 8.379 Å and do not show any signif- icant change with the substitution of Mn 3+ . The average particles size was found to be around 11 ± 3 nm. Magnetization results obtained from the vibrating sample magnetometer (VSM) confirm that the substi- tution of Mn 3+ in MnFe 2 O 4 ferrite caused an increase in the saturation magnetization and coercivity. The dependence of Mössbauer parameters on Mn 3+ substitution has been analyzed. Magnetic behavior of the samples were also studied at field cooled (FC) and zero field cooled (ZFC) mode. The dependence of Mössbauer parameters on Mn 3+ substitution was also analyzed. All the magnetic characterization shows that Mn 3+ substitution enhance the magnetic behavior of MnFe 2 O 4 ferrite nanoparticles. Ó 2015 Elsevier B.V. All rights reserved. 1. Introduction The unique and novel size dependent chemical and physical properties articulated by metal and semiconductor nanocrystals have commenced the present extensive assortment of rigorous investigation on nano materials [1,2]. Recently, extreme zests have been broadcast into restraining the shape of nano materials and also into understanding the correlations between material proper- ties and its shape. The shape of nano materials can be as vital as the size in determining the uniqueness and novelty of material proper- ties. Moreover, a large part of the societal impact by nano materials surely will be realized in a variety of devices consisting of nano material components. Manganese ferrites belong to a family of soft ferrite materials characterized by high magnetic permeability and low losses. Furthermore, it is also ascribed that Mn ferrites are of inverse spinel structure because 80% of Mn ions occupy tetrahedral site (A-site), which is surrounded by four O 2 ions, and the left 20% of Mn ions occupy octahedral site (B-site), which is surrounded by six O 2 ions. The cation distribution for Mn ferrites can be repre- sented by (Mn 2+ 0.8 Fe 0.2 3+ ) A [Mn 3+ 0.2 Fe 2+ 0.2 Fe 3+ 1.6 ] B O 4 [3,4]. These materials are predominantly consumed in numerous applications such as microwave devices, computer memory chips, magnetic recording media, radio frequency coil fabrication, transformer cores, rod anten- nas and many branches of telecommunication and electronic engi- neering [5–8]. Congregation of nano-components is a key itinerary http://dx.doi.org/10.1016/j.jallcom.2015.04.085 0925-8388/Ó 2015 Elsevier B.V. All rights reserved. ⇑ Corresponding author. Tel.: +91 9359380185. E-mail address: [email protected] (Mohd. Hashim). Journal of Alloys and Compounds 642 (2015) 70–77 Contents lists available at ScienceDirect Journal of Alloys and Compounds journal homepage: www.elsevier.com/locate/jalcom
Transcript of Manganese ferrite prepared using reverse micelle process: Structural and magnetic properties...

Journal of Alloys and Compounds 642 (2015) 70–77
Contents lists available at ScienceDirect
Journal of Alloys and Compounds
journal homepage: www.elsevier .com/locate / ja lcom
Manganese ferrite prepared using reverse micelle process: Structuraland magnetic properties characterization
http://dx.doi.org/10.1016/j.jallcom.2015.04.0850925-8388/� 2015 Elsevier B.V. All rights reserved.
⇑ Corresponding author. Tel.: +91 9359380185.E-mail address: [email protected] (Mohd. Hashim).
Mohd. Hashim a,⇑, Sagar E. Shirsath b, S.S. Meena c, M.L. Mane d, Shalendra Kumar e, Pramod Bhatt c,Ravi Kumar f, N.K. Prasad g, S.K. Alla g, Jyoti Shah h, R.K. Kotnala h, K.A. Mohammed i, Erdogan S�entürk j,Alimuddin a
a Department of Physics, Aligarh Muslim University, Aligarh 202002, Indiab Spin Device Technology Centre, Department of Engineering, Shinshu University, Nagano 380-8553, Japanc Solid State Physics Division, Bhabha Atomic Research Centre, Mumbai 400085, Indiad Department of Physics, S.G.R.G. Shinde Mahavidyalaya, Paranda 413502, MS, Indiae School of Materials Science and Engineering, Changwon National University, Changwon, Gyeongnam 641-773, Republic of Koreaf Centre for Material Science Engineering, National Institute of Technology, Hamirpur, HP, Indiag Deptartment of Metallurgical Engineering, Indian Institute of Technology (Banaras Hindu University), Varanasi 221005, Indiah National Physical Laboratory (CSIR), Dr. K.S. Krishnan Road, New Delhi 110012, Indiai Department of Mathematics & Physics Sciences, College of Arts and Sciences, University of Nizwa, Nizwa, Omanj Department of Physics, Sakarya University, Esentepe, 54187 Sakarya, Turkey
a r t i c l e i n f o
Article history:Received 9 January 2015Received in revised form 3 April 2015Accepted 14 April 2015Available online 20 April 2015
Keywords:Nanostructured materialsChemical synthesisMagentisationMössbauer spectroscopyX-ray diffraction
a b s t r a c t
Reverse microemulsion process was employed to prepare of nanocrystalline Mn3+ substitutedMnFe2�xMnxO4 ferrites. The structural, magnetic and dielectric properties were studied for different con-centrations of Mn3+. The structural and microstructural properties were analyzed using X-ray diffractiontechnique (XRD), transmission electron microscopy (TEM), scanning electron microscopy (SEM) andFourier transform infrared (FT-IR) spectroscopy techniques. The phase identification of the materialswas studied by Rietveld refined XRD patterns which reveals single phase with cubic symmetry for thesamples. The lattice parameters were ranged in between 8.369 and 8.379 Å and do not show any signif-icant change with the substitution of Mn3+. The average particles size was found to be around 11 ± 3 nm.Magnetization results obtained from the vibrating sample magnetometer (VSM) confirm that the substi-tution of Mn3+ in MnFe2O4 ferrite caused an increase in the saturation magnetization and coercivity. Thedependence of Mössbauer parameters on Mn3+ substitution has been analyzed. Magnetic behavior of thesamples were also studied at field cooled (FC) and zero field cooled (ZFC) mode. The dependence ofMössbauer parameters on Mn3+ substitution was also analyzed. All the magnetic characterization showsthat Mn3+ substitution enhance the magnetic behavior of MnFe2O4 ferrite nanoparticles.
� 2015 Elsevier B.V. All rights reserved.
1. Introduction
The unique and novel size dependent chemical and physicalproperties articulated by metal and semiconductor nanocrystalshave commenced the present extensive assortment of rigorousinvestigation on nano materials [1,2]. Recently, extreme zests havebeen broadcast into restraining the shape of nano materials andalso into understanding the correlations between material proper-ties and its shape. The shape of nano materials can be as vital as thesize in determining the uniqueness and novelty of material proper-ties. Moreover, a large part of the societal impact by nano materials
surely will be realized in a variety of devices consisting of nanomaterial components. Manganese ferrites belong to a family of softferrite materials characterized by high magnetic permeability andlow losses. Furthermore, it is also ascribed that Mn ferrites are ofinverse spinel structure because 80% of Mn ions occupy tetrahedralsite (A-site), which is surrounded by four O2� ions, and the left 20%of Mn ions occupy octahedral site (B-site), which is surrounded bysix O2� ions. The cation distribution for Mn ferrites can be repre-sented by (Mn2+
0.8Fe0.23+ )A [Mn3+
0.2Fe2+0.2Fe3+
1.6]B O4 [3,4]. These materialsare predominantly consumed in numerous applications such asmicrowave devices, computer memory chips, magnetic recordingmedia, radio frequency coil fabrication, transformer cores, rod anten-nas and many branches of telecommunication and electronic engi-neering [5–8]. Congregation of nano-components is a key itinerary

Mohd. Hashim et al. / Journal of Alloys and Compounds 642 (2015) 70–77 71
in building devices, and the outline of nano-building blocks andassociated properties will be decisive for the congress and gadgetdesigns. Shape-controlled synthesis of nanocrystals certainly is anexperimental challenge. Successes in shape control of nanocrystalshave been reported in the syntheses of metals and semiconductors.Clearly, it is desirable to develop strategies for shape controlled syn-theses of complex metal oxides possessing rich properties, especiallythe electric and magnetic characteristics. The most operable tech-niques of synthesis of nano materials include formation through achimie douce solution chemistry methodology, a sol–gel processingmechanism, the use of microemulsions, the utilization of hydrother-mal and solvothermal methods, the kinetic control of growththrough the use of capping reagents, the application of template-inspired methodologies, and lastly, bio-mimetic synthesis. Themicroemulsion technique promises to be one of the adaptableresearch process which enables to manage the particle propertiessuch as mechanisms of particle size control, geometry, morphology,homogeneity and surface area. The uses and applications ofmicroemulsions are copious in chemical and biological fields. Thenanoparticles not only are of fundamental scientific attention, butalso have resulted in important technological applications, such ascatalysts, high-performance ceramic materials, microelectronicdevices, high-density magnetic recording and drug delivery.
In the present research work the microstructures, morphology,magnetic and electrical properties of Mn3+ substituted MnFe2O4
ferrite nanoparticles were studied by means of various experimen-tal techniques. The samples were synthesized with a chemical for-mula Mn2+Fe3+
2�xMn3+xO4 where Mn3+ is substituted for Fe3+ from
x = 0.0 to x = 1.0 in steps of 0.25. The XRD results infer the singlephase nature of MnFe2�xMnxO4 ferrite nanoparticles. DC magnetiza-tion results show increase in saturation of magnetization and coer-cive field with increase in the Mn content, Mossbauer spectroscopyresults indicate that magnetic interactions increases with Mn doping.
2. Experimental
Weighted amounts of all analytical grade reagents were used as receivedwithout further purification in order to obtain homogeneous morphology and sto-ichiometry of MnFe2�xMnxO4 nanoparticles by reverse microemulsion technique.Metal nitrates of respective cations were used as metal precursors. ThePreparation procedure of MnFe2�xMnxO4 ferrite nanoparticles by the reversemicroemulsion technique is displayed in Fig. 1, with cyclohexane as oil, cetyl-tri-methyl-ammonium bromide (CTAB) as surfactant, isoamylalcohol as theco-surfactant phase. Micro-emulsions were prepared by adding to 10.20 g ofCTAB, 12.81 ml of isoamylalcohol and 30.48 ml of cyclohexane with 5.5 wt% of an
Fig. 1. Schematic of the preparation of Mn3+xMn2+Fe2�xO4 fe
aqueous solution of the reactants, corresponding to the desired value of Water/[CTAB] ratio being equal to 10.12. The emulsions were sonicated until clear solu-tions formed. In order to synthesize MnFe2�xMnxO4 ferrite, two microemulsionswere prepared: one containing the metal salts prepared by mixing stoichiometricamounts of ferrite and manganese nitrates. Second reverse micro-emulsion solutionwas prepared with 0.1 M aqueous solution of NaOH as water phase under similarconditions. The solutions were mixed quickly with vigorous stirring at constanttemperature (80 �C) and pH of the resulting solution was maintained at 9. Theresulting solution was continuously stirred for another 2 h in order to completethe reaction. An equal volume of acetone and isopropanol was added to the result-ing solution and centrifuged to separate the solid product. The product was washedwith water and acetone and dried in an air oven at 100 �C for 36 h. After the pow-ders formation the samples were annealed at 700 �C for 4 h, the mixtures werepressed into pellet form by using a hydraulic press at 8 ton/cm2. These sampleswere used in powder form for the X-ray diffraction (XRD), transmission electronmicroscopy (TEM), scanning electron microscopy (SEM), Fourier transform infraredspectroscopy (FTIR), vibrating sample magnetometer (VSM), SQUID magnetometer(for isothermal DC magnetization measurements) and the Mössbauer spectroscopyexperiments. The sintered pellets were used to measure the electric and dielectricbehavior of these samples.
3. Results and discussion
3.1. Structural study
The Rietveld refined XRD patterns of MnFe2�xMnxO4 at differentconcentrations of Mn3+ is illustrated in Fig. 2. The matching of thestandard d values with the observed planes in the diffraction pat-terns confirms the formation of a cubic spinel structure. The mainreflections from planes (220), (311), (400), (422), (333), (511)and (440) characterizing spinel ferrites are clearly observed with-out any trace of detectable impurity. The XRD of the prepared sam-ple (MnFe2�xMnxO4) seems to be different from one another,mainly due to (i) the concentration of Mn cations, (ii) the differencein the crystal size of the obtained powder, and (iii) relative changein lattice constant.
The lattice parameters were calculated from the XRD patternsdata and are presented in Fig. 3. The lattice constant is influencedby the cationic stoichiometry. The lattice parameter values whichwere calculated using Bragg’s Law do not showed any significanttrend with the substitution of Mn3+. This may be due to the similarsize of the ionic radii of Fe3+ and Mn3+ ions. The ionic radii of Fe3+
and Mn3+ are 0.67 and 0.645 Å respectively. The average particlesize was calculated from the (311) diffraction peak of the XRD pro-files using the well-known Debye Scherer equation. From the cal-culation, the particle size tends to decrease with from 28 to23 nm with increase in Mn3+ concentration. Typical TEM and
rrite synthesized by reverse microemulsion technique.

20 30 40 50 60 70 80
1200
1400
1600
1800
2000
2200
2400
2600
2800
(442
)(5
31)
(620
) (622
)(5
33)
(space group = Fd3m; a=8.373(4) Å)
(deg)
(511
)(4
22) (440
)
(333
)
(331
)(400
)
(222
)(3
11)
(220
)
300 K(a) x = 0
Inte
nsity
(arb
. uni
ts)
Observed Calculated Difference Bragg peak Positions
20 30 40 50 60 70 80
1000
1200
1400
1600
1800
2000
2200(4
42)
(531
)
(620
) (622
)(5
33)
(space group = Fd3m; a=8.371(6) Å)
(511
)(4
22) (440
)
(333
)
(331
)(400
)
(222
)(3
11)
(220
)
(b)x = 0.25
Inte
nsity
(arb
. uni
ts)
Observed Calculated Difference Bragg peak Positions
20 30 40 50 60 70 801000
1200
1400
1600
1800
2000
2200
(442
)(5
31)
(620
) (622
)(5
33)
(space group = Fd3m; a=8.379(1) Å)
(511
)(4
22) (440
)
(333
)
(331
)(400
)
(222
)(3
11)
(220
)
(c)x = 0.5
Inte
nsity
(arb
. uni
ts)
Observed Calculated Difference Bragg peak Positions
20 30 40 50 60 70 801000
1200
1400
1600
1800
2000
2200
(442
)(5
31)
(620
) (622
)(5
33)
(space group = Fd3m; a=8.369(4) Å)
(511
)(4
22) (440
)
(333
)
(331
)(400
)
(222
)(3
11)
(220
)
(d)x = 0.75
Inte
nsity
(arb
. uni
ts)
Observed Calculated Difference Bragg peak Positions
20 30 40 50 60 70 801000
1200
1400
1600
1800
2000
2200
(442
)(5
31)
(620
) (622
)(5
33)
(space group = Fd3m; a=8.376(1) Å)
(511
)(4
22) (440
)
(333
)
(331
)(400
)
(222
)(3
11)
(220
)
(e)x = 1
Inte
nsity
(arb
. uni
ts)
Observed Calculated Difference Bragg peak Positions
2θ
(deg)2θ (deg)2θ
(deg)2θ(deg)2θ
Fig. 2. Rietveld refined X-ray diffraction patterns of Mn3+xMn2+Fe2�xO4 for (a) x = 0.0, (b) x = 0.25, (c) x = 0.5, (d) x = 0.75 and (e) x = 1.0.
0.00 0.25 0.50 0.75 1.008.368
8.370
8.372
8.374
8.376
8.378
8.380
Latti
ce c
onst
ant '
a' (A
0 )
Mn3+ content (x)
Fig. 3. Variation of lattice constant (a) with Mn3+ substitution inMn3+
xMn2+Fe2�xO4.
72 Mohd. Hashim et al. / Journal of Alloys and Compounds 642 (2015) 70–77
SEM micrographs of the synthesized Mn3+ substituted Mn-ferritenanoparticles showed (Figs. 4 and 5) that most of the ferrite
particles were fine, homogeneous with narrow particle distribu-tions. The typical TEM micrograph for Mn3+
xMn2+Fe2�xO4 for com-position x = 0.5 is shown in Fig. 4(a). Most of the particles areindividual however some of them are agglomerated. The averageparticles size was found to be in the range of 4–22 nm. The size dis-tribution of the particles was also estimated by counting 50nanoparticles from random view field of TEM micrograph usingImage J software and it is shown in Fig. 4(b). It suggests that theaverage particles size was around 11 ± 3 nm. The SAD pattern ofthe sample suggests that it was essentially a F.C.C. crystal structurewhich confirms our XRD finding. The SEM micrographs of theMn3+
xMn2+Fe2�xO4 samples for (a) x = 0.0, (b) x = 0.25, (c) x = 0.5and (d) x = 1.0 are shown in Fig. 5. Particles are almost agglomer-ated. From the contrast of the particles (due to charging) we maysay that the samples are essentially oxide phase. It can further beassumed that there is no other phase except Mn3+
xMn2+Fe2�xO4
phase, as no particles with different contrast were observed.Fig. 6 shows the infrared spectra of all the samples under inves-
tigation. The vibronic studies using infrared radiation are a good

2 4 6 8 10 12 14 16 18 20 220
2
4
6
8
10
12
Freq
uenc
y
Average Particle Size (nm)
(b)
( 4 0 0 )( 2 2 2)( 2 0 0)
( 3 3 3 )
50 nm(a)
Fig. 4. (a) TEM micrograph of Mn3+xMn2+Fe2�xO4 for composition x = 0.5
(Bar = 50 nm). The inset shows selective area electron diffraction (SAD) pattern.Arrows indicate agglomerated particles. (b) Particles size distribution of the samesample.
Mohd. Hashim et al. / Journal of Alloys and Compounds 642 (2015) 70–77 73
fingerprint for the local chemical bonds. According to the Waldron[9], the ferrites can be considered continuously bonded crystals,meaning that the atoms are bounded to all the nearest neighborsby equivalent forces. In spinel ferrites, the metal ions are locatedinto two sub-lattices namely tetrahedral (A-site) and octahedral(B-site) according to the geometrical configuration of the oxygennearest neighbors. The appearance of low frequency bands in therange of 400–600 cm�1, m2 and m1 respectively are assigned to theintrinsic vibration of tetrahedral and octahedral complexes [9].The absorption bands observed within this range is an indicationof the formation of single phase spinel structure. In the presentstudy m2 is observed in the wavenumber range of 572 (x = 0.0)–586 (x = 1.0) cm�1 and it shows increasing trend with increase inMn3+ concentration. On the other hand m1 slightly increased from465 (x = 0.0) to 472 (x = 1.0) cm�1. This variation in m2 and m1 givingan evidence that the Mn3+ ions affect the cation distribution ofMnFe2�xMnxO4. Moreover, Mn3+ occupy the octahedral site moreas compared to that of tetrahedral site. Further, the difference inband positions is attributed to the difference in the Fe3+ to O2�
distances for tetrahedral and octahedral complexes.
3.2. Magnetic properties
The magnetizations vs. field curves of the Mn-ferrite samplesmeasured at room temperature using VSM are shown in Fig. 7.The hysteresis loops of the samples displayed narrow hystereticloops of soft ferromagnetic materials and shows obvious differ-ences as manganese content was changed. It is clear from Fig. 8that saturation magnetization (MS) increased from 16 to 30 emu/g whereas coercivity (HC) increased from 115 to 223 Oe. Theincrease in MS is quite interesting even though the magneticmoment of Mn3+ is lower (=4.97 lB) compared to that of Fe3+
(=5 lB). It is our hypothesis that the change in the ionic distribu-tion causes enhancement in saturation magnetization. It is knownfact that in the spinel ferrite saturation magnetization is depend onthe exchange interaction between the A and B site i.e. A–Bexchange interaction. Mn3+ ions assumed to occupy the B sitereplacing Fe3+ ions. The increased concentration of Mn3+ ions at Bsite might have enhanced the exchange interaction betweenMn2+ ions of A site and Mn3+ ions of B site.
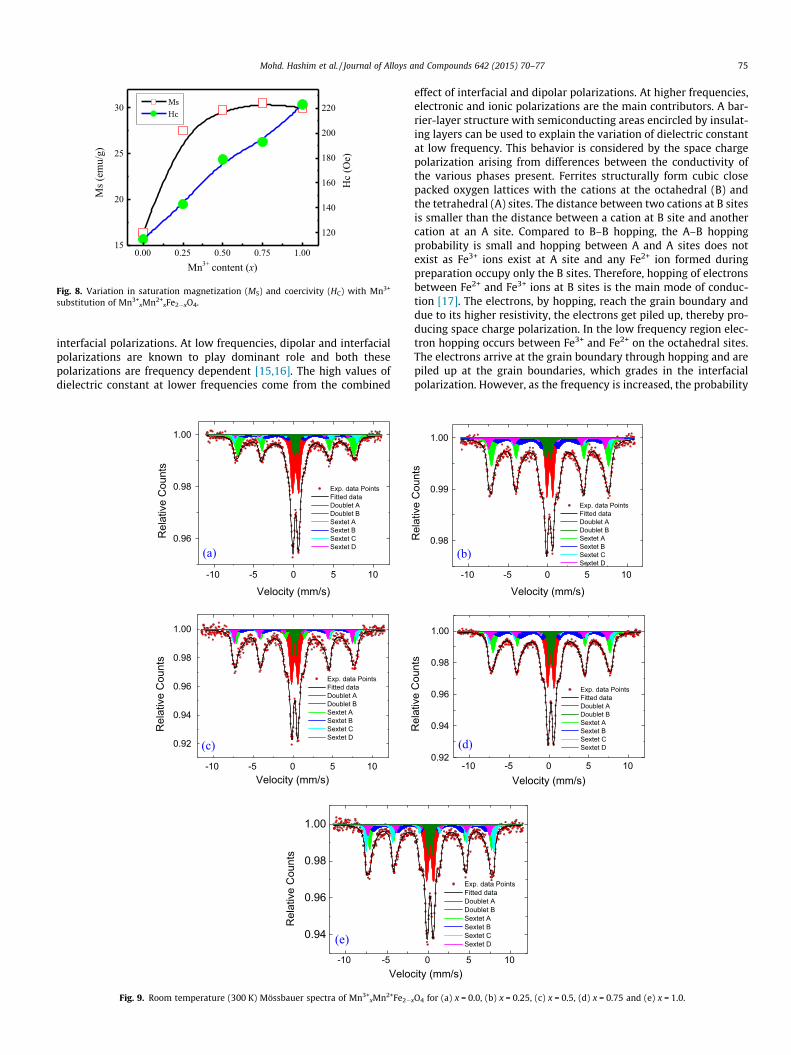
The Mössbauer spectra of the presently investigated system areshown in Fig. 9. It is observed from Fig. 9 that the lines of the B-sitepatterns are broadened and certain overlapping appears, so the Aand B-site pattern is fitted into several components to obtain theA and B-site subpatterns. The appearance of several componentsis due to the different cations at the A and B-site. In our study,the A and B-site is occupied by Fe3+, Mn2+ and Mn3+, though theFe3+ and Mn3+ prefer octahedral B-site. The variation inMössbauer parameters with Mn3+ substitution; such as hyperfinefield (Hhf), isomer shift (d), quadrupole splitting (D), linewidth(C) and relative areas (RA) can be determined from the above men-tioned sub patterns. The values of Hhf, d, D, C and RA are tabulatedin Table 1. On the basis of d and Hhf values, it can be stated that thesextet D is due to the tetrahedral site and the other patterns{Doublets (A and B), sextet A, sextet B and sextet C} are due to octa-hedral site. It can be observed from Table 1 that the isomer shiftvalue for octahedral sites is more than that for tetrahedral sites.In cubic spinel ferrites, the bond separation Fe3+–O2� is larger foroctahedral sites when compared to that for tetrahedral sites. Dueto this, overlapping of orbital of Fe3+ ions is small at B-sites andthus a larger isomer shift at B-sites was expected [10–12]. Theobserved variation of isomer shift shows an insignificant changewith increasing substitution of Mn3+ ions. It implies that thes-electron charge density of Fe3+ ions is not much influenced byincreased Mn3+ substitution. The variation of quadrupole splittingfor hyperfine spectra of all the samples are found to be negligiblysmall (except doublets, D is nearly zero for all sextets) and attrib-uted to the fact that overall cubic symmetry is maintained betweenFe3+ ions and their surroundings with Mn2+ and the substitutedMn3+ ions. It is observed that hyperfine field increased withincreasing Mn3+ substitution up to x = 0.75 and this can be qualita-tively explained using Neel’s super-exchange interactions. As bothA and B sites are occupied by Fe3+ ions, so the interaction of Fe3+ ispossible with Mn2+ and Mn3+ ions. In the present series Fe3+ ionsare replaced by Mn3+ ions with a magnetic moment. This resultsincrease of magnetic linkages in Fe3þ
A —O—Fe3þB ; Fe3þ
A —O—Mn2þA ;
Fe3þA —O—Mn2þ
B and Mn2þA —O—Mn3þ
B . Hence MnFe2�xMnxO4 experi-ences an increase in the magnetic field at A and B sites and hyper-fine magnetic field is also expected to increase with increase ofMn3+ concentration. Usually the saturation magnetization is pro-portional to the hyperfine field which agrees well with hysteresismeasurements [13,14].
Fig. 10 shows the variation of magnetization (M) as a function oftemperature (T) in the range 50–350 K in the zero field cooling(ZFC) and field cooling (FC) modes for typical samples x = 0.0,0.50 and 1.0. The ZFC curves shows peak at �175 K for x = 0.0

(a) (b)
(c) (d)
1 m 1 m
1 m1 m
µ
µ µ
µ
Fig. 5. Scanning electron microscopy (SEM) images of Mn3+xMn2+Fe2�xO4 for (a) x = 0.0, (b) x = 0.25, (c) x = 0.5 and (d) x = 1.0.
1000 2000 3000 4000400 500 600 700 800
0.4
0.6
0.8
1.0 2 1
(e)(d)(c)
(b)(a)
Tran
smitt
ance
Wavenumber (cm-1)
ν ν
Fig. 6. FTIR spectra of Mn3+xMn2+Fe2�xO4 for (a) x = 0.0, (b) x = 0.25, (c) x = 0.5,
(d) x = 0.75 and (e) x = 1.0.
-6000 -4000 -2000 0 2000 4000 6000-40
-30
-20
-10
0
10
20
30
40
-200 -100 0 100 200
-10
0
10
M (e
mu/
g)
H (Oe)
(c)(d)
(b)
(a)
M (e
mu/
g)
H (Oe)
Fig. 7. Variation of magnetization with applied magnetic field of Mn3+xMn2+Fe2�xO4
for (a) x = 0.0, (b) x = 0.25, (c) x = 0.5 and (d) x = 1.0 at room temperature. Inset showsthe variation of magnetization at low applied field.
74 Mohd. Hashim et al. / Journal of Alloys and Compounds 642 (2015) 70–77
which indicates it’s blocking temperature (TB) and similarly the TB
was found to be near 200 and 280 K for x = 0.5 and 1.0 respectively.
3.3. Dielectric properties
The dielectric properties of the samples have been studied as afunction of concentration at different frequencies. Permittivity inan AC electric field is defined as complex relative permittivity e,given by
e ¼ r� je00 ð1Þ
The value of dielectric constant (e0) has been calculated usingthe relation:
e0 ¼ Cp � de0A
ð2Þ
where Cp is the capacitance of parallel pellet in F, d is the thicknessof pellet in cm, A is the cross-sectional area of the flat surfaces of thepellet in cm2 and e0 is the free space permittivity. Fig. 11 shows thatthe room temperature dielectric constant is observed to decreasewith the increase in Mn3+ ion concentration. The dielectric constantof any material, in general, is due to dipolar, electronic, ionic and
0.00 0.25 0.50 0.75 1.0015
20
25
30M
s (em
u/g)
Mn3+ content (x)
Ms Hc
120
140
160
180
200
220
Hc
(Oe)
Fig. 8. Variation in saturation magnetization (MS) and coercivity (HC) with Mn3+
substitution of Mn3+xMn2+
xFe2�xO4.
Mohd. Hashim et al. / Journal of Alloys and Compounds 642 (2015) 70–77 75
interfacial polarizations. At low frequencies, dipolar and interfacialpolarizations are known to play dominant role and both thesepolarizations are frequency dependent [15,16]. The high values ofdielectric constant at lower frequencies come from the combined
-10 -5 0 5 10
0.96
0.98
1.00
(a)
Exp. data Points Fitted data Doublet A Doublet B Sextet A Sextet B Sextet C Sextet D
Rel
ativ
e C
ount
s
Velocity (mm/s)
-10 -5 0 5 10
0.92
0.94
0.96
0.98
1.00
(c)
Exp. data Points Fitted data Doublet A Doublet B Sextet A Sextet B Sextet C Sextet D
Rel
ativ
e C
ount
s
Velocity (mm/s)
-10 -5
0.94
0.96
0.98
1.00
(e)
Rel
ativ
e C
ount
s
Veloc
Fig. 9. Room temperature (300 K) Mössbauer spectra of Mn3+xMn2+Fe2�x
effect of interfacial and dipolar polarizations. At higher frequencies,electronic and ionic polarizations are the main contributors. A bar-rier-layer structure with semiconducting areas encircled by insulat-ing layers can be used to explain the variation of dielectric constantat low frequency. This behavior is considered by the space chargepolarization arising from differences between the conductivity ofthe various phases present. Ferrites structurally form cubic closepacked oxygen lattices with the cations at the octahedral (B) andthe tetrahedral (A) sites. The distance between two cations at B sitesis smaller than the distance between a cation at B site and anothercation at an A site. Compared to B–B hopping, the A–B hoppingprobability is small and hopping between A and A sites does notexist as Fe3+ ions exist at A site and any Fe2+ ion formed duringpreparation occupy only the B sites. Therefore, hopping of electronsbetween Fe2+ and Fe3+ ions at B sites is the main mode of conduc-tion [17]. The electrons, by hopping, reach the grain boundary anddue to its higher resistivity, the electrons get piled up, thereby pro-ducing space charge polarization. In the low frequency region elec-tron hopping occurs between Fe3+ and Fe2+ on the octahedral sites.The electrons arrive at the grain boundary through hopping and arepiled up at the grain boundaries, which grades in the interfacialpolarization. However, as the frequency is increased, the probability
-10 -5 0 5 10
0.98
0.99
1.00
(b)
Exp. data Points Fitted data Doublet A Doublet B Sextet A Sextet B Sextet C Sextet D
Rel
ativ
e C
ount
s
Velocity (mm/s)
-10 -5 0 5 100.92
0.94
0.96
0.98
1.00
(d)
Exp. data Points Fitted data Doublet A Doublet B Sextet A Sextet B Sextet C Sextet D
Rel
ativ
e C
ount
s
Velocity (mm/s)
0 5 10
Exp. data Points Fitted data Doublet A Doublet B Sextet A Sextet B Sextet C Sextet D
ity (mm/s)
O4 for (a) x = 0.0, (b) x = 0.25, (c) x = 0.5, (d) x = 0.75 and (e) x = 1.0.

Table 1The hyperfine field values (Hhf), isomer shift (d), quadrupole splitting (D), line width (C), relative areas (RA) in percentage of Fe sites for Mn3+
xMn2+Fe2�xO4 (x = 0.0–1.0) and fittingquality factor (v2) derived from Mössbauer spectra recorded at room temperature. Isomer shift values are relative to a-Fe metal foil (d = 0.0 mm/s). Square bracket denotes theestimated error.
Mn3+ (x) Iron sites RA (%) C (mm/s) [±0.06] d (mm/s) [±0.02] D (mm/s) [±0.02] Hhf (Tesla) [±0.16] v2
0.0 Doublet A 24.1 0.577 0.329 0.783 – 1.03264Doublet B 3.3 0.353 0.327 0.511 –Sextet A 23.4 0.318 0.345 0.018 45.11Sextet B 39.7 1.029 0.403 0.009 39.84Sextet C 8.3 0.434 0.338 0.008 47.48Sextet D 1.2 0.256 �0.139 �0.057 43.72
0.25 Doublet A 9.8 0.473 0.369 0.724 – 1.07529Doublet B 3.1 0.458 0.16 0.665 –Sextet A 29.4 0.511 0.39 0.003 45.77Sextet B 45.1 1.021 0.334 �0.078 40.15Sextet C 4.3 0.348 0.278 0.053 47.8Sextet D 8.3 0.491 0.07 �0.116 45.5
0.50 Doublet A 18.9 0.574 0.326 0.825 – 0.93775Doublet B 2.2 0.282 0.326 0.489 –Sextet A 24.5 0.578 0.411 0.032 46.04Sextet B 39.0 1.423 0.324 0.086 41.42Sextet C 6.9 0.365 0.280 0.105 48.12Sextet D 8.4 0.356 0.170 �0.047 45.72
0.75 Doublet A 15.6 0.554 0.331 0.8179 – 1.02966Doublet B 2.8 0.299 0.336 0.507 –Sextet A 22.3 0.441 0.392 0.042 46.57Sextet B 41.5 0.901 0.329 �0.045 42.67Sextet C 8.8 0.432 0.294 0.009 48.14Sextet D 9.0 0.507 0.13 �0.093 45.75
1.0 Doublet A 17.3 0.557 0.332 0.830 – 0.89444Doublet B 3.3 0.327 0.326 0.511 –Sextet A 15.5 0.378 0.312 0.169 45.77Sextet B 35.7 0.729 0.323 �0.038 42.31Sextet C 18.1 0.393 0.294 0.052 47.95Sextet D 10.1 0.455 0.328 �0.315 45.74
9
10
11
12
13
14
50 100 150 200 250 300 350
8
10
12
14
16
18 50 100 150 200 250 300 350
16
18
20
22
Temperature (K)
Temperature (K)
Mag
netiz
atio
n (e
mu/
g)
FC zfc
(c)
(b)(a)
Fig. 10. Variation infield cooled (FC) and zero field cooled (ZFC) of Mn3+xMn2+Fe2�xO4 for (a) x = 0.0, (b) x = 0.5 and (c) x = 1.0.
76 Mohd. Hashim et al. / Journal of Alloys and Compounds 642 (2015) 70–77
of electrons reaching the grain boundary decreases, which results ina decrease in the interfacial polarization [18]. Therefore, the dielec-tric constant decreases with increasing frequency. Also as reportedby several researchers, hopping of electrons between Fe2+ and Fe3+
(n-type semiconductor) and hopping of holes between Mn3+ andMn2+ (p-type semiconductor) are responsible for the conductionprocess [3]. Accordingly the ferrite is assumed to be made up of
well-conducting grains separated by poor conducting layers orgrain boundaries. The transport of charge carrier creates the spacecharge polarization and these charge carriers are stopped at apotential barrier, which is possibly the grain boundary. This can alsobe understood by a mechanism similar to conduction mechanism. Itis seen from the figure that the dielectric constant shows the max-imum values for the composition x = 0.0. It can be explained on the

1x10⁶ 2x10⁶ 3x10⁶ 4x10⁶ 5x1060
20
40
60
80
100
(c)(d)(b)(a)
Die
lect
ric c
onst
ant (
')
Applied Frequency (Hz)
ε
Fig. 11. Variation of dielectric constant (e0) with applied frequency ofMn3+
xMn2+Fe2�xO4 for (a) x = 0.0, (b) x = 0.25, (c) x = 0.5 and (d) x = 1.0 at roomtemperature.
Mohd. Hashim et al. / Journal of Alloys and Compounds 642 (2015) 70–77 77
basis that as the Mn3+ ions doped in Mn ferrite prefer the B-site. Theincrease in number of Mn3+ ions at octahedral sites decreases therate of hopping which in turn, decreases the dielectric constant.
4. Conclusions
Mn3+ substituted MnFe2O4 ferrite were successfully synthesizedby the reverse microemulsion technique. Structural analysis withRietveld refined XRD reveals that the system confirms the forma-tion of single phase cubic spinel structure. Lattice constant donot show any significant change with Mn3+ substitution due tothe comparable ionic radii of Mn3+ ions with Fe3+ ions. Selectivearea electron diffraction (SAD) pattern also infers crystalline singlephase of cubic structure. From the TEM study, it can be said thatparticles had dimension in the range of 4–22 nm but most of themwere around 11 ± 3 nm. Infrared spectra shows two prominentbands corresponding to spinel ferrite phase. Magnetic studies sug-gest that the samples were ferromagnetic at room temperature.The Mössbauer measurements showed well resolved magneticspectra for the tetrahedral and octahedral sites. The hyperfinemagnetic field at both the sub lattices increases with the introduc-tion of increasing Mn3+ ions by strengthening the exchange inter-actions. The dielectric constant and ac conductivity increased
with Mn3+ substitution as Mn3+ ion substitutes for Fe3+ ions leadingto decrease of the hopping rate of electrons between Fe3+
+ Mn2+M Fe2+ + Mn3+. The frequency dependence of dielectric
constant and ac conductivity can be understood throughMaxwell–Wagner type interfacial polarization.
Acknowledgments
Shalendra Kumar is thankful for the financial assistant supportfrom the Basic Science Research Program through the NationalResearch Foundation of Korea (NRF) funded by the Ministry ofEducation, Science and Technology (MEST; 2012-0009457) andby the Priority Research Centers Program through the NationalResearch Foundation of Korea (NRF) funded by the Ministry ofEducation, Science and Technology (MEST; 2012-045424).
References
[1] S. Maensiri, C. Masingboon, B. Boonchom, S.S. Eraphin, Scripta Mater. 56 (2007)797.
[2] Alex Goldman, Modern Ferrite Technology, second ed., Springer, New York,2006.
[3] R.H. Kadam, A.R. Biradar, M.L. Mane, Sagar E. Shirsath, J. Appl. Phys. 112 (2012)043902.
[4] Sagar E. Shirsath, B.G. Toksha, R.H. Kadam, S.M. Patange, D.R. Mane, Ganesh S.Jangam, Ali Ghasemi, J. Phys. Chem. Solids 71 (2010) 1669.
[5] Q.M. Wei, Jian-biao Li, Yong-jun Chen, Yong-sheng Han, Mater. Charact. 47(2001) 247.
[6] J.A.T. Taylor, S.T. Reczek, A. Rosen, Soft ferrite processing, Am. Ceram. Soc. Bull.74 (4) (1995) 91–94.
[7] M. Rozman, M. Drofenik, J. Am. Ceram. Soc. 81 (7) (1998) 1757–1764.[8] S.H. Chen, S.C. Chang, L.N. Lin, J. Magn. Magn. Mater. 209 (2000) 193–196.[9] R.D. Waldron, Phys. Rev. 99 (1955) 1727.
[10] S.S. Shinde, Sher Singh Meena, S.M. Yusuf, K.Y. Rajpure, J. Phys. Chem. C 115(2011) 3731–3736.
[11] Mohd. Hashim, Alimuddin, Sagar E. Shirsath, S.S. Meena, R.K. Kotnala, AmeenaParveen, Aashis S. Roy, Shalendra Kumar, Pramod Bhatt, Ravi Kumar, J. Magn.Magn. Mater. 341 (2013) 148–157.
[12] A. Lakshman, P.S.V. Subba Rao, K.H. Rao, Mater. Lett. 60 (2006) 7.[13] S.M. Patange, Sagar E. Shirsath, B.G. Toksha, S.S. Jadhav, K.M. Jadhav, J. Appl.
Phys. 106 (2009) 023914.[14] Mohd. Hashim, Alimuddin, Shalendra Kumar, Sagar E. Shirsath, R.K. Kotnala,
Jyoti Shah, Ravi Kumar, Mater. Chem. Phys. 139 (2013) 364–374.[15] C.G. Koops, On the dispersion of resistivity and dielectric constant of some
semiconductors at audio frequencies, Phys. Rev. 83 (1951) 121–124.[16] J.C. Maxwell, Electricity and Magnetism, vol. 2, Oxford University Press, New
York, 1973.[17] Sagar E. Shirsath, Santosh S. Jadhav, B.G. Toksha, S.M. Patange, K.M. Jadhav,
Scripta Mater. 64 (2011) 773–776.[18] I.T. Rabinkin, Z.I. Novikova, Ferrites, Izv Acad. Nauk USSR Minsk (1960).