Alternatives to Methyl Bromide Fumigation of Empty Ship Holds
Upload
khangminh22Category
view
0download
0
crystals
Article
Effect of Nitrate/Bromide on the Hydration Process ofCement Paste Mixed with Alkali Free Liquid Acceleratorat Low Temperature
Yongdong Xu 1,2,* and Tingshu He 1,*
�����������������
Citation: Xu, Y.; He, T. Effect of
Nitrate/Bromide on the Hydration
Process of Cement Paste Mixed with
Alkali Free Liquid Accelerator at Low
Temperature. Crystals 2021, 11, 1585.
https://doi.org/10.3390/
cryst11121585
Academic Editors: Dawei Wang and
Hui Yao
Received: 21 November 2021
Accepted: 7 December 2021
Published: 19 December 2021
Publisher’s Note: MDPI stays neutral
with regard to jurisdictional claims in
published maps and institutional affil-
iations.
Copyright: © 2021 by the authors.
Licensee MDPI, Basel, Switzerland.
This article is an open access article
distributed under the terms and
conditions of the Creative Commons
Attribution (CC BY) license (https://
creativecommons.org/licenses/by/
4.0/).
1 College of Materials Science and Engineering, Xi’an University of Architecture and Technology,Xi’an 710055, China
2 School of Chemwastry and Chemical Engineering, Ankang University, Ankang 725000, China* Correspondence: [email protected] (Y.X.); [email protected] (T.H.)
Abstract: The effects of different inorganic salt accelerators (CaBr2, NaBr, Ca(NO3)2, NaNO3) and analkali-free liquid accelerator were researched at a low temperature of 10 ◦C. The results showed theeffects of 1.5% NaBr and 1.5% NaNO3 inorganic accelerator were pronounced. The 1-d compressivestrengths of the mortar with these two inorganic salts were increased by 185.8% and 184.2%, respec-tively, and the final setting times were shortened from 7.74 to 6.08 min and 6.12 min, respectively.The hydration temperatures at 10 ◦C were measured, and the promotion effects of the inorganicaccelerators were calculated: the relationship between the hydration degree was αAS + NN > αAS + NB
> αAS + CB > αAS + CN > αAS. In addition, the reaction of C3A with NaBr and NaNO3 was used toanalyze the products in an ettringite phase, i.e., Ca4Al2O6Br210·H2O, 3CaOAl2O3Ca(NO3)2X·H2O.The formation of these phases was detected in the hydration products of the cement paste hydra-tion for 12 h, 24 h, and 28 d. Combined with the mass loss of the ettringite phase at 90–120 ◦C,determined using TG/DTG, the synergetic acceleration mechanism of the inorganic accelerators wascomprehensively inferred.
Keywords: acceleration; ettringite phase; low temperature; mechanism
1. Introduction
Shotcretes have been widely used in tunnel and mine construction. It has the ad-vantages of a fast setting time and a high early strength, speeding up the constructionprocess [1,2]. Among these, an accelerator is an integral part of shotcrete to accelerate thehydration of cement to achieve these characteristics [3–5]. However, although shotcretehas the characteristics of rapid setting and early strength, its early compressive strengthdevelopment depends on ambient temperature, just like ordinary concrete. For ordinaryconcrete, when the average temperature is higher than 20 ◦C, the compressive strengthof the concrete develops well; however, when the temperature is lower than 10 ◦C, thestrength of the concrete decreases and the curing cycle is prolonged [6]. For ordinaryconcrete, many researchers used chemical admixtures to promote low-temperature hy-dration to improve early strength development. Presently, the early strength of concreteis improved by accelerating the hydration of tricalcium silicate. Some researchers havesummarized the relationship between different ions and cement hydration. The promotioneffect of different anions and cations on hydration is as follows [7–10]: anions: Br− > Cl− >SCN− > I−; cations: Ca2+ > Sr2+ > Ba2+ > Na+.
Similarly, for shotcrete, an alkali-free accelerator could shorten the setting time andimprove the early compressive strength, and environmental temperatures have a significanteffect on it. At present, research on the influence of ambient temperature on the mechanicalproperties of shotcrete mainly focuses on the influence of high-temperature environments;the Niu research group mainly focuses on the influence of high-temperature environmentson the mechanical properties of shotcrete [11].
Crystals 2021, 11, 1585. https://doi.org/10.3390/cryst11121585 https://www.mdpi.com/journal/crystals
Crystals 2021, 11, 1585 2 of 15
However, there is little research on the effects of low-temperature environments onthe performance of shotcrete. For low temperature (<20 ◦C), the reaction rate of cementclinker is reduced [12]. The influence of the environmental temperature on the cementhydration is directly reflected in the performance of the accelerator, such as initial and finalsetting times and early strength. In addition, as an alkali-free liquid accelerator containsmany aluminum ions, sulfate ions, and a small number of polyol amines, sensitive ofthe system, if early-strength inorganic salts are added to the accelerator, the precipitationphenomenon often occurs. Therefore, we propose to use the synergetic effect of inorganicsalt accelerators to solve the problems of shotcrete in a low-temperature environment toreduce the occurrence of events that affect the shotcrete construction due to low ambienttemperature. The selection of inorganic salt early-strength agents was performed basedon the research of relevant scholars on inorganic salt early-strength agents, as shown inTable 1.
Table 1. Summary of the related effects of inorganic salt early-strength agents in the literature.
References Types of Inorganic Salts AmbientTemperature Dosage Compressive
Strength (24 h) Types
Zhang et al. [13] CaBr2 5 ◦C 1% 10.9 MPa Cement pastesBao et al. [14] C2H2CaO4 5 ◦C 1% 3.7 MPa C40 concreteShi et al. [15] A + B + Ca(NO3)2 20 ◦C 2.1% 41.0 MPa Mortar
Wang et al. [16] ZL-1 8 ◦C 6% 5.7 MPa Cement stoneLee et al. [17] CaBr2 + NaSCN + DEA 10 ◦C 0.5% 5.0 MPa ConcreteZou et al. [18] LiAl-LDHs −10 ◦C 1.5% 25.0 MPa Cement stone
Yoneyama et al. [19] Ca(NO3)2 −10 ◦C 13% 7.0 MPa ConcreteKim et al. [20] Ca(NO3)2 10 ◦C 8% 7.6 MPa MortarLiu et al. [21] CaCl2 5 ◦C 1.5% 7.0 MPa Cement mortars
For inorganic salt early-strength agents, they mainly react with C3A to form a cal-cium aluminate-like AFt phase, such as CaBr2, and Ca(NO3)2 reacts with C3A to formbromo aluminate calcium hydrate (Ca4Al2O6Br2·10H2O) and nitrate hydrates (nitrate-AFm; 3CaO·Al2O3·Ca(NO3)2·XH2O) [13,19,20,22,23]. The literature shows that they havebetter early strength properties in a low-temperature environment for ordinary concrete.
Therefore, whether those kinds of early strength agent could produce a synergeticeffect with an alkali-free liquid accelerator, improving the early strength of concrete in alow-temperature environment, and solve the influence of the low-temperature environmenton the mechanical properties of shotcrete. Therefore, the effect of different kinds of nitrateand bromide (calcium bromide, sodium bromide, calcium nitrate, and sodium nitrate)on the strength of mortar mixed with an accelerator system was researched to reveal themechanism of inorganic salt, promoting the strength development in a low-temperatureenvironment.
2. Materials and Experimental Program2.1. Raw Materials
Ordinary Portland cement was used in the experiment, and the relevant chemicalcomposition and parameters are shown in Table 2. Table 3 shows the chemical compositionand the related performance indexes of an alkali-free liquid accelerator. The chemicalreagents used in the experiment were analytical reagents.
Table 2. Chemical composition of cement.
ChemicalComposition SiO2 Al2O3 Fe2O3 CaO MgO R2O SO3 Loss
Cement (wt%) 21.3 5.96 3.36 60.31 2.7 0.83 1.72 2.12
Crystals 2021, 11, 1585 3 of 15
Table 3. Physical and chemical indexes related to the accelerator performance.
AcceleratorCategory
SolidContent (%)
pH Initial SettingTime (s)
Final SettingTime (s)
CompressiveStrength (MPa)
1 d 28 d
Alkali-freeaccelerator 40% 3–4 150 345 8.3 45.6
Note: The test method in the table was carried out according to the standard GB-T 35159-2017, in which thedosage of the alkali-free accelerator was 7%.
2.2. Specimen Preparation and Mix Proportions
The mixing water–cement (W/C) ratio was 0.50, the dosage of the alkali-free liquidaccelerator was 7% of the cement mass, and the sample size was 40 mm × 40 mm × 160 mmaccording to the requirements of accelerator for shotcrete (GB/T 35159-2017). The mixingamount of inorganic salt was also carried out according to the percentage of cement quality,and the specific mixing design proportions are shown in Table 4.
Table 4. Mixing design proportions.
Mix ID Cement(g)
CaBr2(%)
NaBr(%)
Ca(NO3)2(%)
NaNO3(%)
Water(g)
Alkali-FreeAccelerator
(g)
AS 900 – – – – 412.2 63AS-CB1.0 900 1.0% – – – 412.2 63AS-CB1.5 900 1.5% – – – 412.2 63AS-CB2.0 900 2.0% – – – 412.2 63AS-NB1.0 900 – 1.0% – – 412.2 63AS-NB1.5 900 – 1.5% – – 412.2 63AS-NB2.0 900 – 2.0% – – 412.2 63AS-CN1.0 900 – – 1.0% – 412.2 63AS-CN1.5 900 – – 2.0% – 412.2 63AS-CN2.0 900 – – 3.0% – 412.2 63AS-NN1.0 900 – – – 1.0% 412.2 63AS-NN1.5 900 – – – 1.5% 412.2 63AS-NN2.0 900 – – – 2.0% 412.2 63
Note: CaBr2, NaBr, Ca(NO3)2, NaNO3, and the alkali-free accelerator are abbreviated as CN, NB, CN, NN, andAS, respectively.
2.3. Mixed C3A and Inorganic Salt Solution
The inorganic salt solution was mixed with C3A to prepare the calcium aluminatephase material. The mixing procedures were described as follows: 3 g of NB and NN eachwere dissolved in 30 g of water (10 ◦C) separately. The respective solutions were stirredfor 2 min, placed in a low-temperature test chamber for 24 h, washed with deionizedwater. Hydration was terminated with isopropanol for 24 h. Then, these two solutionswere filtered and vacuum-dried for 48 h to obtain bromide-C3A and nitrate-C3A reactants,respectively. Detection and analysis were carried out respectively.
2.4. Testing of Samples2.4.1. Setting Time
The test method for initial and final setting time was described as follows: water,cement, and the accelerators were pre-cooled at 10 ± 0.5 ◦C for 24 h. The setting timeswere tested with the Vicat apparatus. Refer to GB/T 35159-2017 for specific test steps, andthe addition amounts of inorganic salts are shown in Table 5.
Crystals 2021, 11, 1585 4 of 15
Table 5. Setting time test design proportions.
Water/Binder Ratio Composition ofthe Slurry The Dosage of Inorganic Salts
0.35 Cement + 7% AS
1% CaBr2/1.5% CaBr2/2.0% CaBr21% NaBr/1.5% NaBr/2.0% NaBr
1% Ca(NO3)2/1.5% Ca(NO3)2/2.0% Ca(NO3)21% NaNO3/1.5% NaNO3/2.0% NaNO3
2.4.2. Heat of Hydration
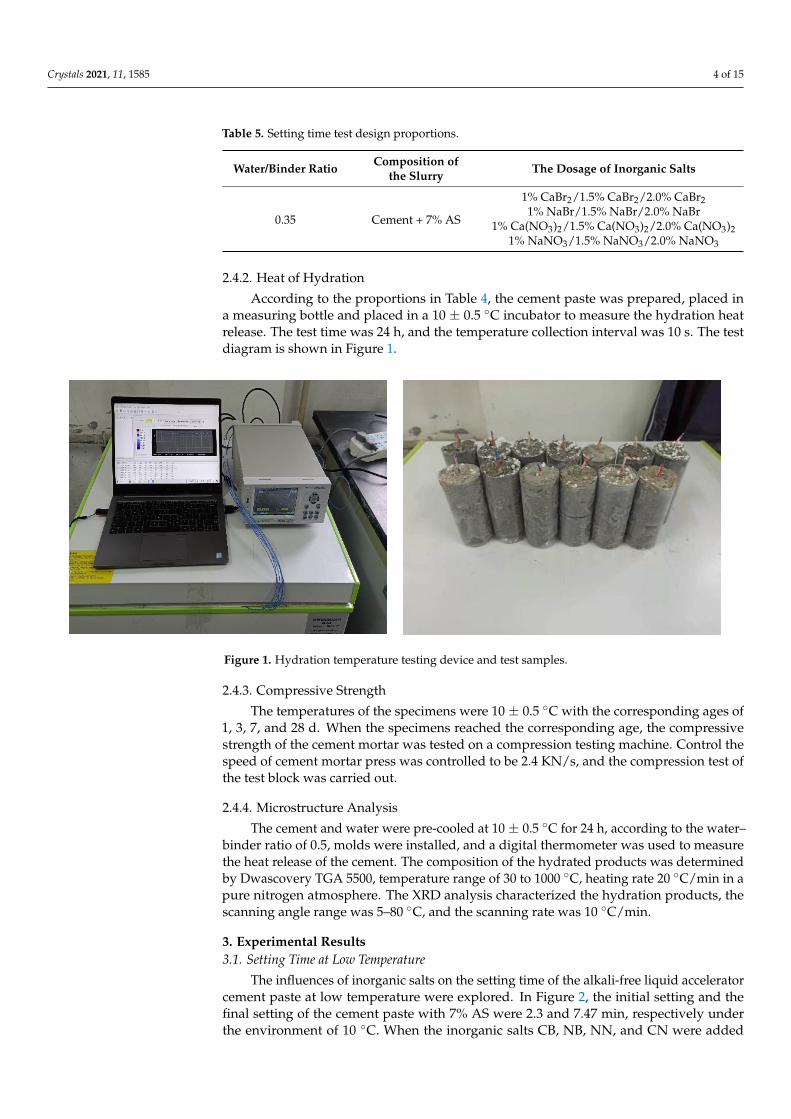
According to the proportions in Table 4, the cement paste was prepared, placed ina measuring bottle and placed in a 10 ± 0.5 ◦C incubator to measure the hydration heatrelease. The test time was 24 h, and the temperature collection interval was 10 s. The testdiagram is shown in Figure 1.
Crystals 2021, 11, x FOR PEER REVIEW 4 of 16
2.4. Testing of Samples 2.4.1. Setting Time
The test method for initial and final setting time was described as follows: water, cement, and the accelerators were pre-cooled at 10 ± 0.5 °C for 24 h. The setting times were tested with the Vicat apparatus. Refer to GB/T 35159-2017 for specific test steps, and the addition amounts of inorganic salts are shown in Table 5.
Table 5. Setting time test design proportions.
Water/Binder Ratio Composition of the Slurry The Dosage of Inorganic Salts
0.35 Cement + 7% AS
1% CaBr2/1.5% CaBr2/2.0% CaBr2 1% NaBr/1.5% NaBr/2.0% NaBr
1% Ca(NO3)2/1.5% Ca(NO3)2/2.0% Ca(NO3)2 1% NaNO3/1.5% NaNO3/2.0% NaNO3
2.4.2. Heat of Hydration According to the proportions in Table 4, the cement paste was prepared, placed in a
measuring bottle and placed in a 10 ± 0.5 °C incubator to measure the hydration heat re-lease. The test time was 24 h, and the temperature collection interval was 10 s. The test diagram is shown in Figure 1.
Figure 1. Hydration temperature testing device and test samples.
2.4.3. Compressive Strength The temperatures of the specimens were 10 ± 0.5 °C with the corresponding ages of
1, 3, 7, and 28 d. When the specimens reached the corresponding age, the compressive strength of the cement mortar was tested on a compression testing machine. Control the speed of cement mortar press was controlled to be 2.4 KN/s, and the compression test of the test block was carried out.
2.4.4. Microstructure Analysis The cement and water were pre-cooled at 10 ± 0.5 °C for 24 h, according to the water–
binder ratio of 0.5, molds were installed, and a digital thermometer was used to measure the heat release of the cement. The composition of the hydrated products was determined by Dwascovery TGA 5500, temperature range of 30 to 1000 °C, heating rate 20 °C/min in a pure nitrogen atmosphere. The XRD analysis characterized the hydration products, the scanning angle range was 5–80 °C, and the scanning rate was 10 °C/min.
Figure 1. Hydration temperature testing device and test samples.
2.4.3. Compressive Strength
The temperatures of the specimens were 10 ± 0.5 ◦C with the corresponding ages of1, 3, 7, and 28 d. When the specimens reached the corresponding age, the compressivestrength of the cement mortar was tested on a compression testing machine. Control thespeed of cement mortar press was controlled to be 2.4 KN/s, and the compression test ofthe test block was carried out.
2.4.4. Microstructure Analysis
The cement and water were pre-cooled at 10 ± 0.5 ◦C for 24 h, according to the water–binder ratio of 0.5, molds were installed, and a digital thermometer was used to measurethe heat release of the cement. The composition of the hydrated products was determinedby Dwascovery TGA 5500, temperature range of 30 to 1000 ◦C, heating rate 20 ◦C/min in apure nitrogen atmosphere. The XRD analysis characterized the hydration products, thescanning angle range was 5–80 ◦C, and the scanning rate was 10 ◦C/min.
3. Experimental Results3.1. Setting Time at Low Temperature
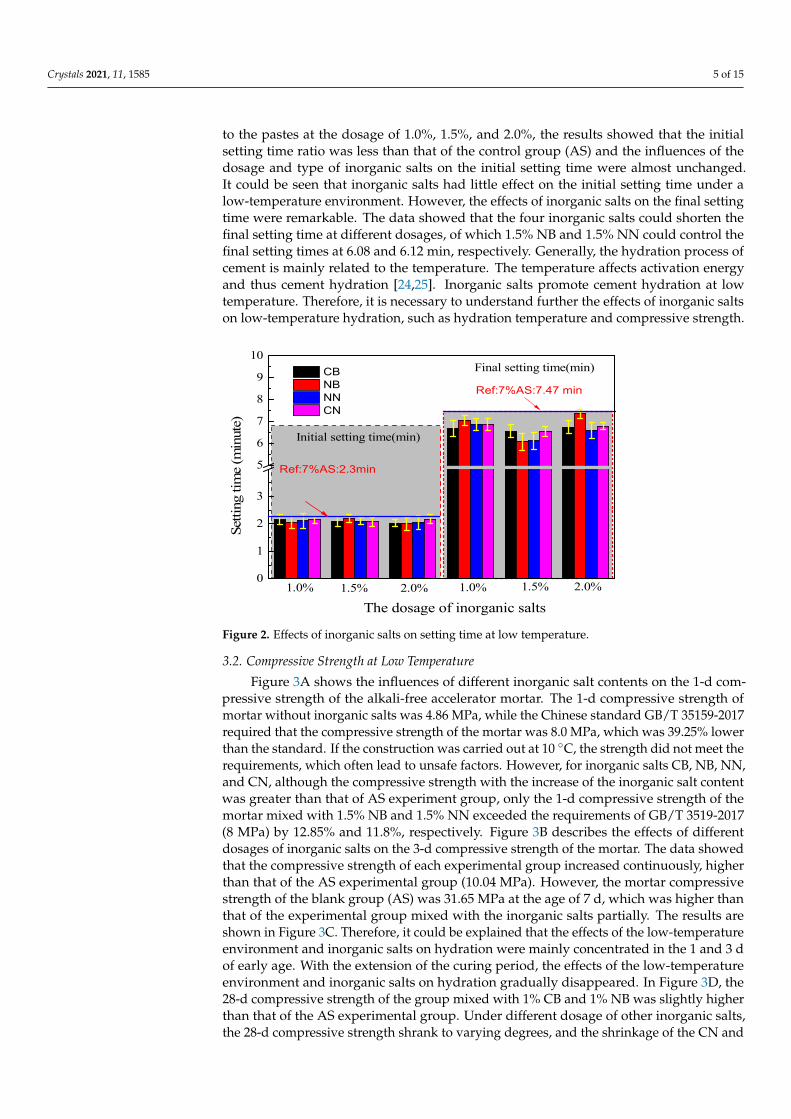
The influences of inorganic salts on the setting time of the alkali-free liquid acceleratorcement paste at low temperature were explored. In Figure 2, the initial setting and thefinal setting of the cement paste with 7% AS were 2.3 and 7.47 min, respectively underthe environment of 10 ◦C. When the inorganic salts CB, NB, NN, and CN were added
Crystals 2021, 11, 1585 5 of 15
to the pastes at the dosage of 1.0%, 1.5%, and 2.0%, the results showed that the initialsetting time ratio was less than that of the control group (AS) and the influences of thedosage and type of inorganic salts on the initial setting time were almost unchanged.It could be seen that inorganic salts had little effect on the initial setting time under alow-temperature environment. However, the effects of inorganic salts on the final settingtime were remarkable. The data showed that the four inorganic salts could shorten thefinal setting time at different dosages, of which 1.5% NB and 1.5% NN could control thefinal setting times at 6.08 and 6.12 min, respectively. Generally, the hydration process ofcement is mainly related to the temperature. The temperature affects activation energyand thus cement hydration [24,25]. Inorganic salts promote cement hydration at lowtemperature. Therefore, it is necessary to understand further the effects of inorganic saltson low-temperature hydration, such as hydration temperature and compressive strength.
Crystals 2021, 11, x FOR PEER REVIEW 5 of 16
3. Experimental Results 3.1. Setting Time at Low Temperature
The influences of inorganic salts on the setting time of the alkali-free liquid accelera-tor cement paste at low temperature were explored. In Figure 2, the initial setting and the final setting of the cement paste with 7% AS were 2.3 and 7.47 min, respectively under the environment of 10 °C. When the inorganic salts CB, NB, NN, and CN were added to the pastes at the dosage of 1.0%, 1.5%, and 2.0%, the results showed that the initial setting time ratio was less than that of the control group (AS) and the influences of the dosage and type of inorganic salts on the initial setting time were almost unchanged. It could be seen that inorganic salts had little effect on the initial setting time under a low-temperature environment. However, the effects of inorganic salts on the final setting time were re-markable. The data showed that the four inorganic salts could shorten the final setting time at different dosages, of which 1.5% NB and 1.5% NN could control the final setting times at 6.08 and 6.12 min, respectively. Generally, the hydration process of cement is mainly related to the temperature. The temperature affects activation energy and thus ce-ment hydration [24,25]. Inorganic salts promote cement hydration at low temperature. Therefore, it is necessary to understand further the effects of inorganic salts on low-tem-perature hydration, such as hydration temperature and compressive strength.
Figure 2. Effects of inorganic salts on setting time at low temperature.
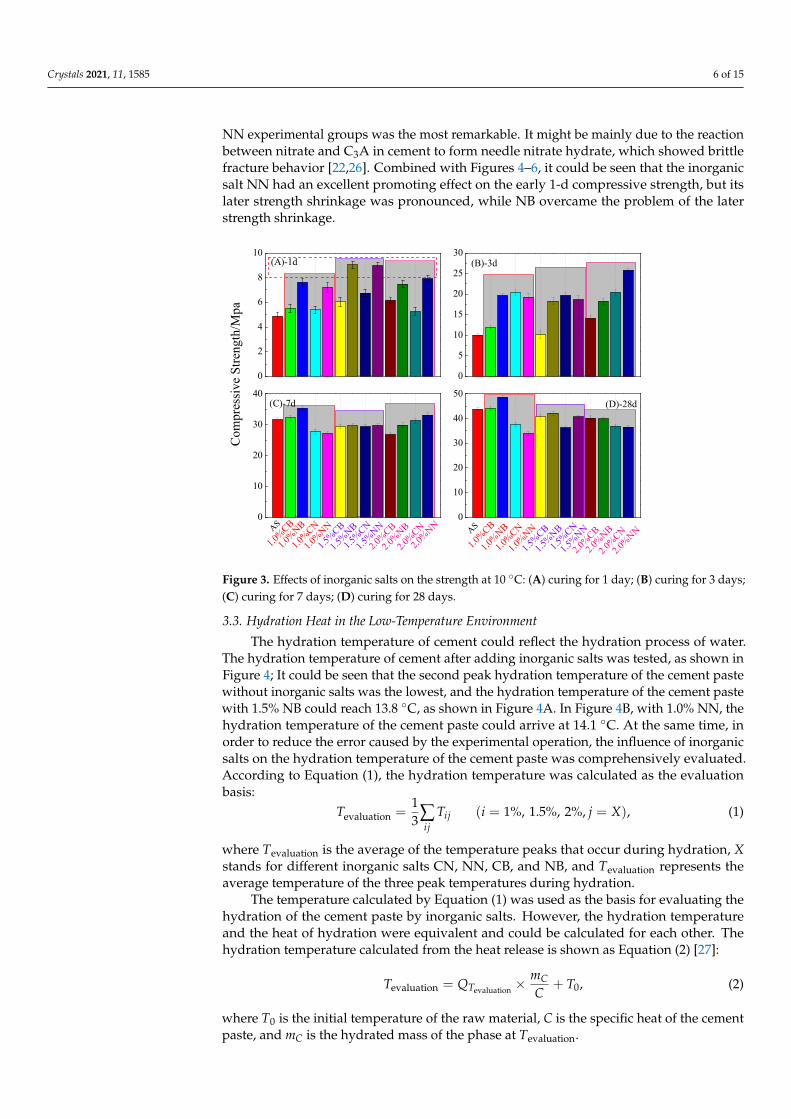
3.2. Compressive Strength at Low Temperature Figure 3A shows the influences of different inorganic salt contents on the 1-d com-
pressive strength of the alkali-free accelerator mortar. The 1-d compressive strength of mortar without inorganic salts was 4.86 MPa, while the Chinese standard GB/T 35159-2017 required that the compressive strength of the mortar was 8.0 MPa, which was 39.25% lower than the standard. If the construction was carried out at 10 °C, the strength did not meet the requirements, which often lead to unsafe factors. However, for inorganic salts CB, NB, NN, and CN, although the compressive strength with the increase of the inor-ganic salt content was greater than that of AS experiment group, only the 1-d compressive strength of the mortar mixed with 1.5% NB and 1.5% NN exceeded the requirements of GB/T 3519-2017 (8 MPa) by 12.85% and 11.8%, respectively. Figure 3B describes the effects of different dosages of inorganic salts on the 3-d compressive strength of the mortar. The data showed that the compressive strength of each experimental group increased contin-uously, higher than that of the AS experimental group (10.04 MPa). However, the mortar
0
1
2
3
5
6
7
8
9
10
Ref:7%AS:7.47 min
2.0%1.5%1.0%2.0%1.5%
Final setting time(min)
Initial setting time(min)
Setti
ng ti
me
(min
ute)
CB NB NN CN
1.0%
Ref:7%AS:2.3min
The dosage of inorganic salts
Figure 2. Effects of inorganic salts on setting time at low temperature.
3.2. Compressive Strength at Low Temperature
Figure 3A shows the influences of different inorganic salt contents on the 1-d com-pressive strength of the alkali-free accelerator mortar. The 1-d compressive strength ofmortar without inorganic salts was 4.86 MPa, while the Chinese standard GB/T 35159-2017required that the compressive strength of the mortar was 8.0 MPa, which was 39.25% lowerthan the standard. If the construction was carried out at 10 ◦C, the strength did not meet therequirements, which often lead to unsafe factors. However, for inorganic salts CB, NB, NN,and CN, although the compressive strength with the increase of the inorganic salt contentwas greater than that of AS experiment group, only the 1-d compressive strength of themortar mixed with 1.5% NB and 1.5% NN exceeded the requirements of GB/T 3519-2017(8 MPa) by 12.85% and 11.8%, respectively. Figure 3B describes the effects of differentdosages of inorganic salts on the 3-d compressive strength of the mortar. The data showedthat the compressive strength of each experimental group increased continuously, higherthan that of the AS experimental group (10.04 MPa). However, the mortar compressivestrength of the blank group (AS) was 31.65 MPa at the age of 7 d, which was higher thanthat of the experimental group mixed with the inorganic salts partially. The results areshown in Figure 3C. Therefore, it could be explained that the effects of the low-temperatureenvironment and inorganic salts on hydration were mainly concentrated in the 1 and 3 dof early age. With the extension of the curing period, the effects of the low-temperatureenvironment and inorganic salts on hydration gradually disappeared. In Figure 3D, the28-d compressive strength of the group mixed with 1% CB and 1% NB was slightly higherthan that of the AS experimental group. Under different dosage of other inorganic salts,the 28-d compressive strength shrank to varying degrees, and the shrinkage of the CN and
Crystals 2021, 11, 1585 6 of 15
NN experimental groups was the most remarkable. It might be mainly due to the reactionbetween nitrate and C3A in cement to form needle nitrate hydrate, which showed brittlefracture behavior [22,26]. Combined with Figures 4–6, it could be seen that the inorganicsalt NN had an excellent promoting effect on the early 1-d compressive strength, but itslater strength shrinkage was pronounced, while NB overcame the problem of the laterstrength shrinkage.
Crystals 2021, 11, x FOR PEER REVIEW 6 of 16
compressive strength of the blank group (AS) was 31.65 MPa at the age of 7 d, which was higher than that of the experimental group mixed with the inorganic salts partially. The results are shown in Figure 3C. Therefore, it could be explained that the effects of the low-temper-ature environment and inorganic salts on hydration were mainly concentrated in the 1 and 3 d of early age. With the extension of the curing period, the effects of the low-tem-perature environment and inorganic salts on hydration gradually disappeared. In Figure 3D, the 28-d compressive strength of the group mixed with 1% CB and 1% NB was slightly higher than that of the AS experimental group. Under different dosage of other inorganic salts, the 28-d compressive strength shrank to varying degrees, and the shrinkage of the CN and NN experimental groups was the most remarkable. It might be mainly due to the reaction between nitrate and C3A in cement to form needle nitrate hydrate, which showed brittle fracture behavior [22,26]. Combined with Figures 4–6, it could be seen that the in-organic salt NN had an excellent promoting effect on the early 1-d compressive strength, but its later strength shrinkage was pronounced, while NB overcame the problem of the later strength shrinkage.
Figure 3. Effects of inorganic salts on the strength at 10 °C: (A) curing for 1 day; (B) curing for 3 days; (C) curing for 7 days; (D) curing for 28 days.
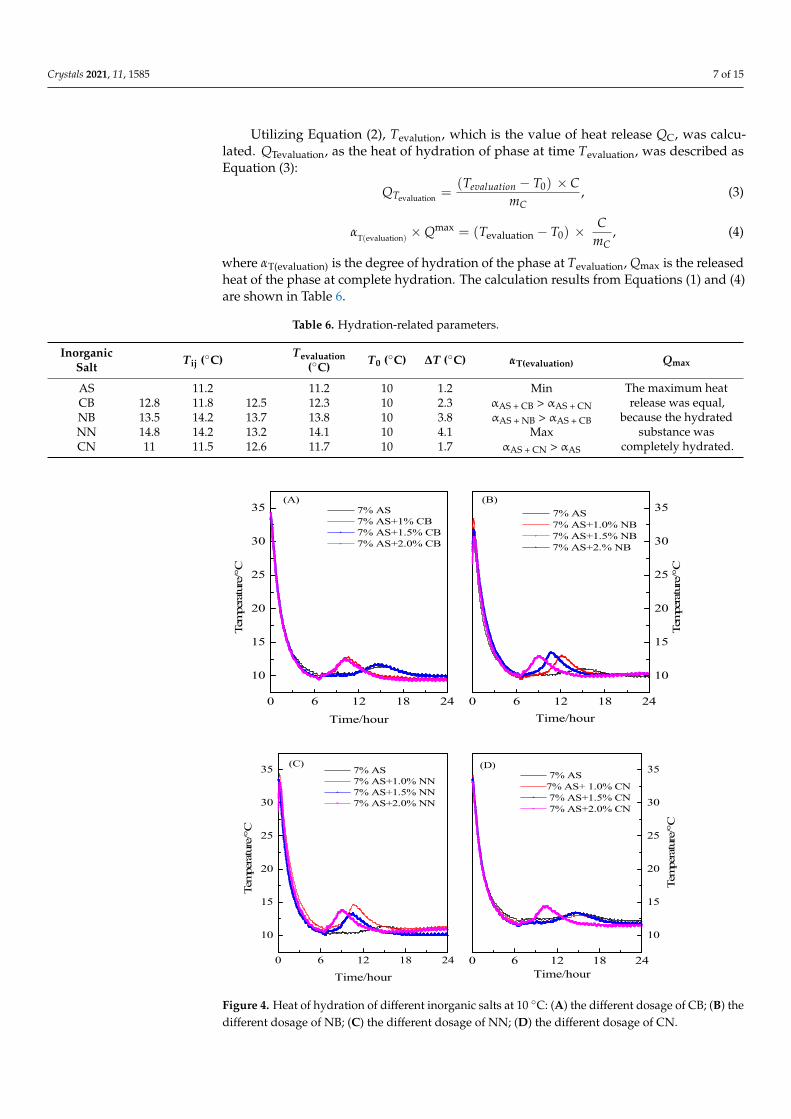
3.3. Hydration Heat in the Low-Temperature Environment The hydration temperature of cement could reflect the hydration process of water.
The hydration temperature of cement after adding inorganic salts was tested, as shown in Figure 4; It could be seen that the second peak hydration temperature of the cement paste without inorganic salts was the lowest, and the hydration temperature of the cement paste with 1.5% NB could reach 13.8 °C, as shown in Figure 4A. In Figure 4B, with 1.0% NN, the hydration temperature of the cement paste could arrive at 14.1 °C. At the same time, in order to reduce the error caused by the experimental operation, the influence of inorganic salts on the hydration temperature of the cement paste was comprehensively evaluated. According to Equation (1), the hydration temperature was calculated as the evaluation basis:
( )XjiTTij
ij =%,2%5.1%,1=31
= ∑evaluation , , (1)
0
2
4
6
8
10
2.0%NN
2.0%CN
2.0%NB
2.0%CB
1.0%NN
1.0%CN
1.0%NBAS
1.0%CB
2.0%NN
2.0%CN
2.0%NB
2.0%CB
1.5%NN
1.5%CN
1.5%NB
1.5%CB
1.0%NN
1.0%CN
1.0%NB
(A)-1d
AS
1.0%CB
Com
pres
sive
Stre
ngth
/Mpa
0
5
10
15
20
25
30(B)-3d
0
10
20
30
40(C)-7d
0
10
20
30
40
50
1.5%NN
1.5%CN
1.5%NB
1.5%CB
(D)-28d
Figure 3. Effects of inorganic salts on the strength at 10 ◦C: (A) curing for 1 day; (B) curing for 3 days;(C) curing for 7 days; (D) curing for 28 days.
3.3. Hydration Heat in the Low-Temperature Environment
The hydration temperature of cement could reflect the hydration process of water.The hydration temperature of cement after adding inorganic salts was tested, as shown inFigure 4; It could be seen that the second peak hydration temperature of the cement pastewithout inorganic salts was the lowest, and the hydration temperature of the cement pastewith 1.5% NB could reach 13.8 ◦C, as shown in Figure 4A. In Figure 4B, with 1.0% NN, thehydration temperature of the cement paste could arrive at 14.1 ◦C. At the same time, inorder to reduce the error caused by the experimental operation, the influence of inorganicsalts on the hydration temperature of the cement paste was comprehensively evaluated.According to Equation (1), the hydration temperature was calculated as the evaluationbasis:
Tevaluation =13∑
ijTij (i = 1%, 1.5%, 2%, j = X), (1)
where Tevaluation is the average of the temperature peaks that occur during hydration, Xstands for different inorganic salts CN, NN, CB, and NB, and Tevaluation represents theaverage temperature of the three peak temperatures during hydration.
The temperature calculated by Equation (1) was used as the basis for evaluating thehydration of the cement paste by inorganic salts. However, the hydration temperatureand the heat of hydration were equivalent and could be calculated for each other. Thehydration temperature calculated from the heat release is shown as Equation (2) [27]:
Tevaluation = QTevaluation ×mCC
+ T0, (2)
where T0 is the initial temperature of the raw material, C is the specific heat of the cementpaste, and mC is the hydrated mass of the phase at Tevaluation.
Crystals 2021, 11, 1585 7 of 15
Utilizing Equation (2), Tevalution, which is the value of heat release QC, was calcu-lated. QTevaluation, as the heat of hydration of phase at time Tevaluation, was described asEquation (3):
QTevaluation =(Tevaluation − T0) × C
mC, (3)
αT(evaluation) × Qmax = (Tevaluation − T0) × CmC
, (4)
where αT(evaluation) is the degree of hydration of the phase at Tevaluation, Qmax is the releasedheat of the phase at complete hydration. The calculation results from Equations (1) and (4)are shown in Table 6.
Table 6. Hydration-related parameters.
InorganicSalt Tij (◦C) Tevaluation
(◦C) T0 (◦C) ∆T (◦C) αT(evaluation) Qmax
AS 11.2 11.2 10 1.2 Min The maximum heatrelease was equal,
because the hydratedsubstance was
completely hydrated.
CB 12.8 11.8 12.5 12.3 10 2.3 αAS + CB > αAS + CNNB 13.5 14.2 13.7 13.8 10 3.8 αAS + NB > αAS + CBNN 14.8 14.2 13.2 14.1 10 4.1 MaxCN 11 11.5 12.6 11.7 10 1.7 αAS + CN > αAS
Crystals 2021, 11, x FOR PEER REVIEW 8 of 16
Figure 4. Heat of hydration of different inorganic salts at 10 °C: (A) the different dosage of CB; (B) the different dosage of NB; (C) the different dosage of NN; (D) the different dosage of CN.
0 6 12 18 24
10
15
20
25
30
35
0 6 12 18 24
Tem
pera
ture
/℃
Time/hour
Tem
pera
ture
/℃
Time/hour
7% AS 7% AS+1% CB 7% AS+1.5% CB 7% AS+2.0% CB
(A)
7% AS 7% AS+1.0% NB 7% AS+1.5% NB 7% AS+2.% NB
(B)
10
15
20
25
30
35
0 6 12 18 24
10
15
20
25
30
35
0 6 12 18 24Time/hour
Tem
pera
ture
/℃
Tem
pera
ture
/℃
Time/hour
7% AS 7% AS+1.0% NN 7% AS+1.5% NN 7% AS+2.0% NN
(C) 7% AS7% AS+ 1.0% CN 7% AS+1.5% CN 7% AS+2.0% CN
(D)
10
15
20
25
30
35
5 10 15 20 25 30 35 40 45 50
(Ca4Al2O6)Ca(NO3)2XH2O
C3A+NN C3A+NB
Inte
nsity
2 -Theta
△△
△
◇
◇ ◇◇◇◇
▲
△
△
△ △△△
▲▲
◇
◇◇◇
◇
◇
◇
☆
△ (Ca4Al2O6Br2)10•H2O
◇ C3A
▲
☆NaNO3
(A)
10 20 30 40 50 10 20 30 40 50
■
2-Theta
AS+1.5% CB
AS+1.5% NB
AS
C3A+NB
△
■
▲ △△△
△ △△△
△■
▲
▲▲▲
■
2-Theta
▲▲▲ ▲
▲
▲
▲▲
△
PDF:#42-1473
Ettringite phase
C3S, C2S
(Ca4Al2O6Br2)10H2O
(B)
C3A+NNPDF:#50-0652
(Ca4Al2O6)Ca(NO3)2XH2O
AS
AS+2% NN
AS+1.5% NN
▲▲
▲▲
▲
△ △△
△
△△
■■
(C)
■ Ettringite phase
△C3S, C2S
Figure 4. Heat of hydration of different inorganic salts at 10 ◦C: (A) the different dosage of CB; (B) thedifferent dosage of NB; (C) the different dosage of NN; (D) the different dosage of CN.
Crystals 2021, 11, 1585 8 of 15
From the calculation results in Table 5, it could be seen that the degree of NN promot-ing hydration was the largest, that of NB was the second largest, and that of AS was thesmallest. In addition, the second peak of the hydration heat flow curve was correspondingto the time of the maximum hydration temperature peak in Figure 5, which could be seenin the relevant literature [28,29], which indicated that NN, NB, CB, and CN promoted thehydration of C3S, thus accelerating the hydration and improving the early strength. Inaddition, the hydration time of the second hydration peak indicated NB and NN couldaccelerate the hydration in advance, shorten the hydration time and promote the secondhydration peak to reach the peak. However, the hydration effects of NN and NB weresignificantly than those of CB and CN. The results were consistent with the strength datain Figure 3.
Crystals 2021, 11, x FOR PEER REVIEW 8 of 16
Figure 4. Heat of hydration of different inorganic salts at 10 °C: (A) the different dosage of CB; (B) the different dosage of NB; (C) the different dosage of NN; (D) the different dosage of CN.
0 6 12 18 24
10
15
20
25
30
35
0 6 12 18 24
Tem
pera
ture
/℃
Time/hour
Tem
pera
ture
/℃
Time/hour
7% AS 7% AS+1% CB 7% AS+1.5% CB 7% AS+2.0% CB
(A)
7% AS 7% AS+1.0% NB 7% AS+1.5% NB 7% AS+2.% NB
(B)
10
15
20
25
30
35
0 6 12 18 24
10
15
20
25
30
35
0 6 12 18 24Time/hour
Tem
pera
ture
/℃
Tem
pera
ture
/℃
Time/hour
7% AS 7% AS+1.0% NN 7% AS+1.5% NN 7% AS+2.0% NN
(C) 7% AS7% AS+ 1.0% CN 7% AS+1.5% CN 7% AS+2.0% CN
(D)
10
15
20
25
30
35
5 10 15 20 25 30 35 40 45 50
(Ca4Al2O6)Ca(NO3)2XH2O
C3A+NN C3A+NB
Inte
nsity
2 -Theta
△△
△
◇
◇ ◇◇◇◇
▲
△
△
△ △△△
▲▲
◇
◇◇◇
◇
◇
◇
☆
△ (Ca4Al2O6Br2)10•H2O
◇ C3A
▲
☆NaNO3
(A)
10 20 30 40 50 10 20 30 40 50
■
2-Theta
AS+1.5% CB
AS+1.5% NB
AS
C3A+NB
△
■
▲ △△△
△ △△△
△■
▲
▲▲▲
■
2-Theta
▲▲▲ ▲
▲
▲
▲▲
△
PDF:#42-1473
Ettringite phase
C3S, C2S
(Ca4Al2O6Br2)10H2O
(B)
C3A+NNPDF:#50-0652
(Ca4Al2O6)Ca(NO3)2XH2O
AS
AS+2% NN
AS+1.5% NN
▲▲
▲▲
▲
△ △△
△
△△
■■
(C)
■ Ettringite phase
△C3S, C2S
Crystals 2021, 11, x FOR PEER REVIEW 9 of 16
Figure 5. XRD of hydration products: (A) C3A + nitrate ions and C3A + bromine ions hydrated samples; (B) hydration product of the cement paste added with bromide for 12 h; (C) hydration product of the cement paste added with nitrate for 12 h; (D) hydration product of the cement paste added with bromide for 24 h; (E) hydration product of the cement paste added with nitrate for 24 h; (F) hydration product of the cement paste added with bromide for 28 d; (G) hydration product of the cement paste added with nitrate for 28 d.
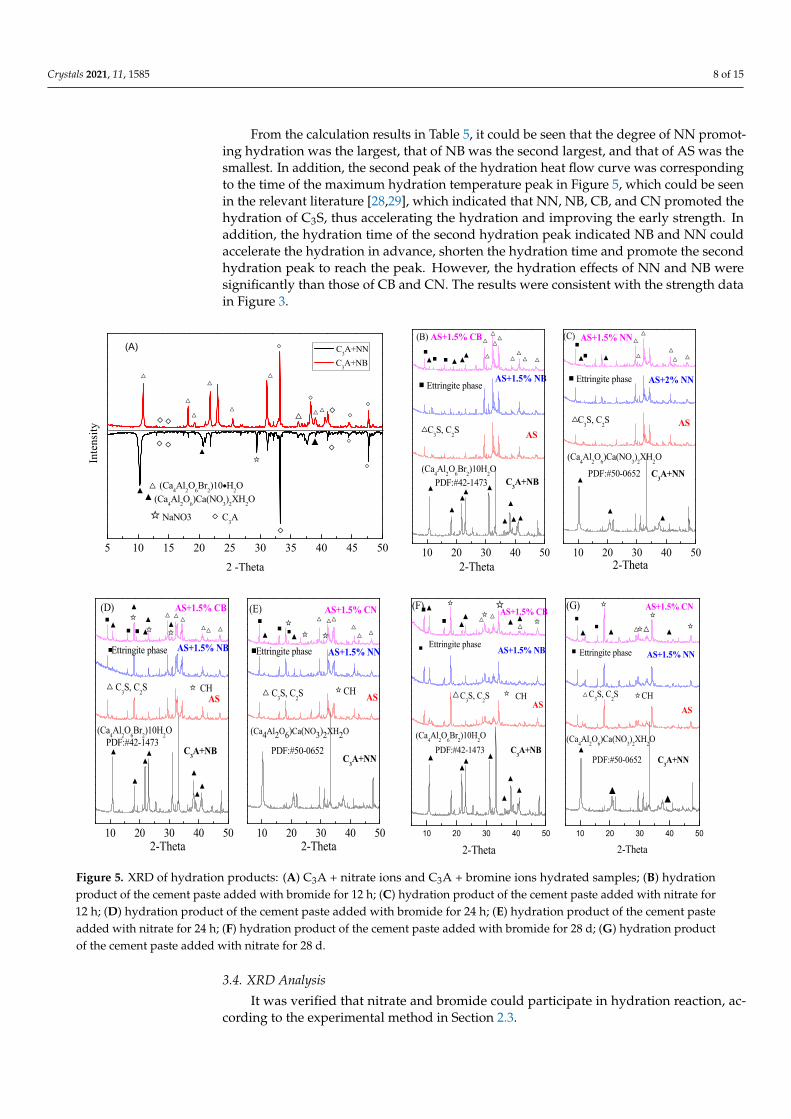
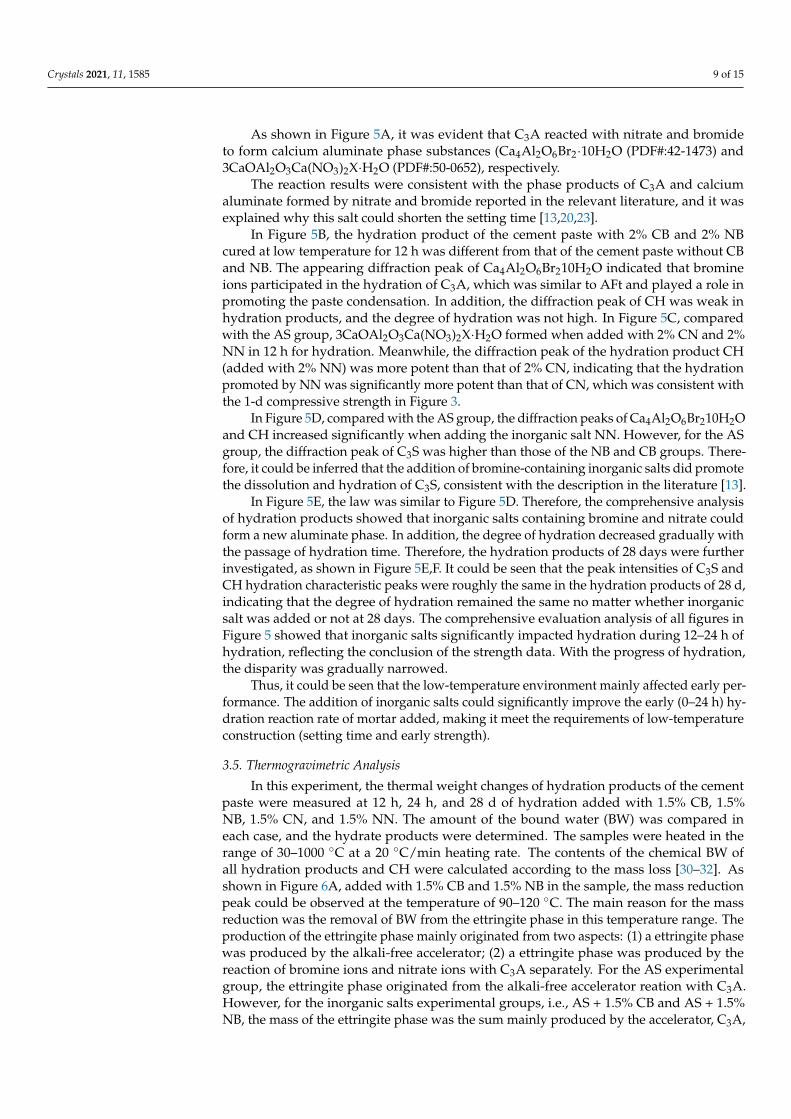
3.4. XRD Analysis It was verified that nitrate and bromide could participate in hydration reaction, ac-
cording to the experimental method in Section 2.3. As shown in Figure 5A, it was evident that C3A reacted with nitrate and bromide to
form calcium aluminate phase substances (Ca4Al2O6Br2·10H2O (PDF#:42-1473) and 3CaOAl2O3Ca(NO3)2X·H2O (PDF#:50-0652), respectively.
The reaction results were consistent with the phase products of C3A and calcium alu-minate formed by nitrate and bromide reported in the relevant literature, and it was ex-plained why this salt could shorten the setting time [13,20,23].
In Figure 5B, the hydration product of the cement paste with 2% CB and 2% NB cured at low temperature for 12 h was different from that of the cement paste without CB and NB. The appearing diffraction peak of Ca4Al2O6Br210H2O indicated that bromine ions par-ticipated in the hydration of C3A, which was similar to AFt and played a role in promoting the paste condensation. In addition, the diffraction peak of CH was weak in hydration products, and the degree of hydration was not high. In Figure 5C, compared with the AS group, 3CaOAl2O3Ca(NO3)2X·H2O formed when added with 2% CN and 2% NN in 12 h for hydration. Meanwhile, the diffraction peak of the hydration product CH (added with 2% NN) was more potent than that of 2% CN, indicating that the hydration promoted by NN was significantly more potent than that of CN, which was consistent with the 1-d compressive strength in Figure 3.
In Figure 5D, compared with the AS group, the diffraction peaks of Ca4Al2O6Br210H2O and CH increased significantly when adding the inorganic salt NN. However, for the AS group, the diffraction peak of C3S was higher than those of the NB and CB groups. Therefore, it could be inferred that the addition of bromine-containing inorganic salts did promote the dissolution and hydration of C3S, consistent with the description in the literature [13].
In Figure 5E, the law was similar to Figure 5D. Therefore, the comprehensive analy-sis of hydration products showed that inorganic salts containing bromine and nitrate could form a new aluminate phase. In addition, the degree of hydration decreased grad-ually with the passage of hydration time. Therefore, the hydration products of 28 days were further investigated, as shown in Figure 5E,F. It could be seen that the peak intensi-ties of C3S and CH hydration characteristic peaks were roughly the same in the hydration
10 20 30 40 50 10 20 30 40 50
▲
AS+1.5% CB
AS+1.5% NB
AS
C3A+NBPDF:#42-1473
(Ca4Al2O6Br2)10H2O
▲
▲
▲▲
▲
▲▲
■▲ ■
☆▲
■ ☆▲ △ △ △
☆▲ △ △△
■Ettringite phase
△ C3S, C2S ☆ CH
(D)
■■■
2-Theta2-Theta
AS
AS+1.5% NN
AS+1.5% CN
C3A+NNPDF:#50-0652
(Ca4Al2O6)Ca(NO3)2XH2O
▲☆
☆▲
■Ettringite phase
△ C3S, C2S☆CH
(E)
☆△ △ △ △△
△
10 20 30 40 50 10 20 30 40 50
☆
C3A+NBPDF:#42-1473(Ca4Al2O6Br2)10H2O
AS
AS+1.5% NB
AS+1.5% CB
(Ca4Al2O6)Ca(NO3)2XH2O
▲▲ △△▲▲ ☆■
☆ ☆▲
▲▲
▲
▲▲▲
2-Theta
■☆
▲
△
■ Ettringite phase
△C3S, C2S
(F)
CH
AS+1.5% CN
☆AS
C3A+NNPDF:#50-0652
▲▲ △▲☆△☆
☆☆
■■
▲▲
▲
2-Theta
△C3S, C2S
AS+1.5% NN■ Ettringite phase
CH
(G)
Figure 5. XRD of hydration products: (A) C3A + nitrate ions and C3A + bromine ions hydrated samples; (B) hydrationproduct of the cement paste added with bromide for 12 h; (C) hydration product of the cement paste added with nitrate for12 h; (D) hydration product of the cement paste added with bromide for 24 h; (E) hydration product of the cement pasteadded with nitrate for 24 h; (F) hydration product of the cement paste added with bromide for 28 d; (G) hydration productof the cement paste added with nitrate for 28 d.
3.4. XRD Analysis
It was verified that nitrate and bromide could participate in hydration reaction, ac-cording to the experimental method in Section 2.3.
Crystals 2021, 11, 1585 9 of 15
As shown in Figure 5A, it was evident that C3A reacted with nitrate and bromideto form calcium aluminate phase substances (Ca4Al2O6Br2·10H2O (PDF#:42-1473) and3CaOAl2O3Ca(NO3)2X·H2O (PDF#:50-0652), respectively.
The reaction results were consistent with the phase products of C3A and calciumaluminate formed by nitrate and bromide reported in the relevant literature, and it wasexplained why this salt could shorten the setting time [13,20,23].
In Figure 5B, the hydration product of the cement paste with 2% CB and 2% NBcured at low temperature for 12 h was different from that of the cement paste without CBand NB. The appearing diffraction peak of Ca4Al2O6Br210H2O indicated that bromineions participated in the hydration of C3A, which was similar to AFt and played a role inpromoting the paste condensation. In addition, the diffraction peak of CH was weak inhydration products, and the degree of hydration was not high. In Figure 5C, comparedwith the AS group, 3CaOAl2O3Ca(NO3)2X·H2O formed when added with 2% CN and 2%NN in 12 h for hydration. Meanwhile, the diffraction peak of the hydration product CH(added with 2% NN) was more potent than that of 2% CN, indicating that the hydrationpromoted by NN was significantly more potent than that of CN, which was consistent withthe 1-d compressive strength in Figure 3.
In Figure 5D, compared with the AS group, the diffraction peaks of Ca4Al2O6Br210H2Oand CH increased significantly when adding the inorganic salt NN. However, for the ASgroup, the diffraction peak of C3S was higher than those of the NB and CB groups. There-fore, it could be inferred that the addition of bromine-containing inorganic salts did promotethe dissolution and hydration of C3S, consistent with the description in the literature [13].
In Figure 5E, the law was similar to Figure 5D. Therefore, the comprehensive analysisof hydration products showed that inorganic salts containing bromine and nitrate couldform a new aluminate phase. In addition, the degree of hydration decreased gradually withthe passage of hydration time. Therefore, the hydration products of 28 days were furtherinvestigated, as shown in Figure 5E,F. It could be seen that the peak intensities of C3S andCH hydration characteristic peaks were roughly the same in the hydration products of 28 d,indicating that the degree of hydration remained the same no matter whether inorganicsalt was added or not at 28 days. The comprehensive evaluation analysis of all figures inFigure 5 showed that inorganic salts significantly impacted hydration during 12–24 h ofhydration, reflecting the conclusion of the strength data. With the progress of hydration,the disparity was gradually narrowed.
Thus, it could be seen that the low-temperature environment mainly affected early per-formance. The addition of inorganic salts could significantly improve the early (0–24 h) hy-dration reaction rate of mortar added, making it meet the requirements of low-temperatureconstruction (setting time and early strength).
3.5. Thermogravimetric Analysis
In this experiment, the thermal weight changes of hydration products of the cementpaste were measured at 12 h, 24 h, and 28 d of hydration added with 1.5% CB, 1.5%NB, 1.5% CN, and 1.5% NN. The amount of the bound water (BW) was compared ineach case, and the hydrate products were determined. The samples were heated in therange of 30–1000 ◦C at a 20 ◦C/min heating rate. The contents of the chemical BW ofall hydration products and CH were calculated according to the mass loss [30–32]. Asshown in Figure 6A, added with 1.5% CB and 1.5% NB in the sample, the mass reductionpeak could be observed at the temperature of 90–120 ◦C. The main reason for the massreduction was the removal of BW from the ettringite phase in this temperature range. Theproduction of the ettringite phase mainly originated from two aspects: (1) a ettringite phasewas produced by the alkali-free accelerator; (2) a ettringite phase was produced by thereaction of bromine ions and nitrate ions with C3A separately. For the AS experimentalgroup, the ettringite phase originated from the alkali-free accelerator reation with C3A.However, for the inorganic salts experimental groups, i.e., AS + 1.5% CB and AS + 1.5%NB, the mass of the ettringite phase was the sum mainly produced by the accelerator, C3A,
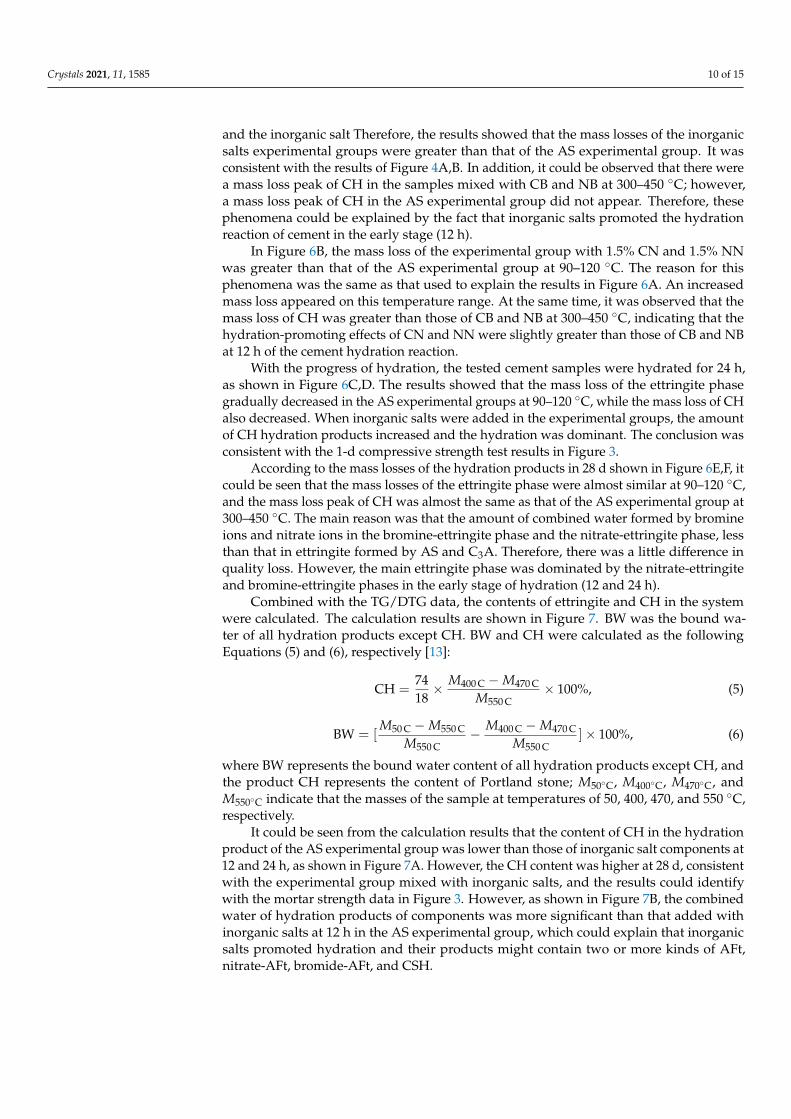
Crystals 2021, 11, 1585 10 of 15
and the inorganic salt Therefore, the results showed that the mass losses of the inorganicsalts experimental groups were greater than that of the AS experimental group. It wasconsistent with the results of Figure 4A,B. In addition, it could be observed that there werea mass loss peak of CH in the samples mixed with CB and NB at 300–450 ◦C; however,a mass loss peak of CH in the AS experimental group did not appear. Therefore, thesephenomena could be explained by the fact that inorganic salts promoted the hydrationreaction of cement in the early stage (12 h).
In Figure 6B, the mass loss of the experimental group with 1.5% CN and 1.5% NNwas greater than that of the AS experimental group at 90–120 ◦C. The reason for thisphenomena was the same as that used to explain the results in Figure 6A. An increasedmass loss appeared on this temperature range. At the same time, it was observed that themass loss of CH was greater than those of CB and NB at 300–450 ◦C, indicating that thehydration-promoting effects of CN and NN were slightly greater than those of CB and NBat 12 h of the cement hydration reaction.
With the progress of hydration, the tested cement samples were hydrated for 24 h,as shown in Figure 6C,D. The results showed that the mass loss of the ettringite phasegradually decreased in the AS experimental groups at 90–120 ◦C, while the mass loss of CHalso decreased. When inorganic salts were added in the experimental groups, the amountof CH hydration products increased and the hydration was dominant. The conclusion wasconsistent with the 1-d compressive strength test results in Figure 3.
According to the mass losses of the hydration products in 28 d shown in Figure 6E,F, itcould be seen that the mass losses of the ettringite phase were almost similar at 90–120 ◦C,and the mass loss peak of CH was almost the same as that of the AS experimental group at300–450 ◦C. The main reason was that the amount of combined water formed by bromineions and nitrate ions in the bromine-ettringite phase and the nitrate-ettringite phase, lessthan that in ettringite formed by AS and C3A. Therefore, there was a little difference inquality loss. However, the main ettringite phase was dominated by the nitrate-ettringiteand bromine-ettringite phases in the early stage of hydration (12 and 24 h).
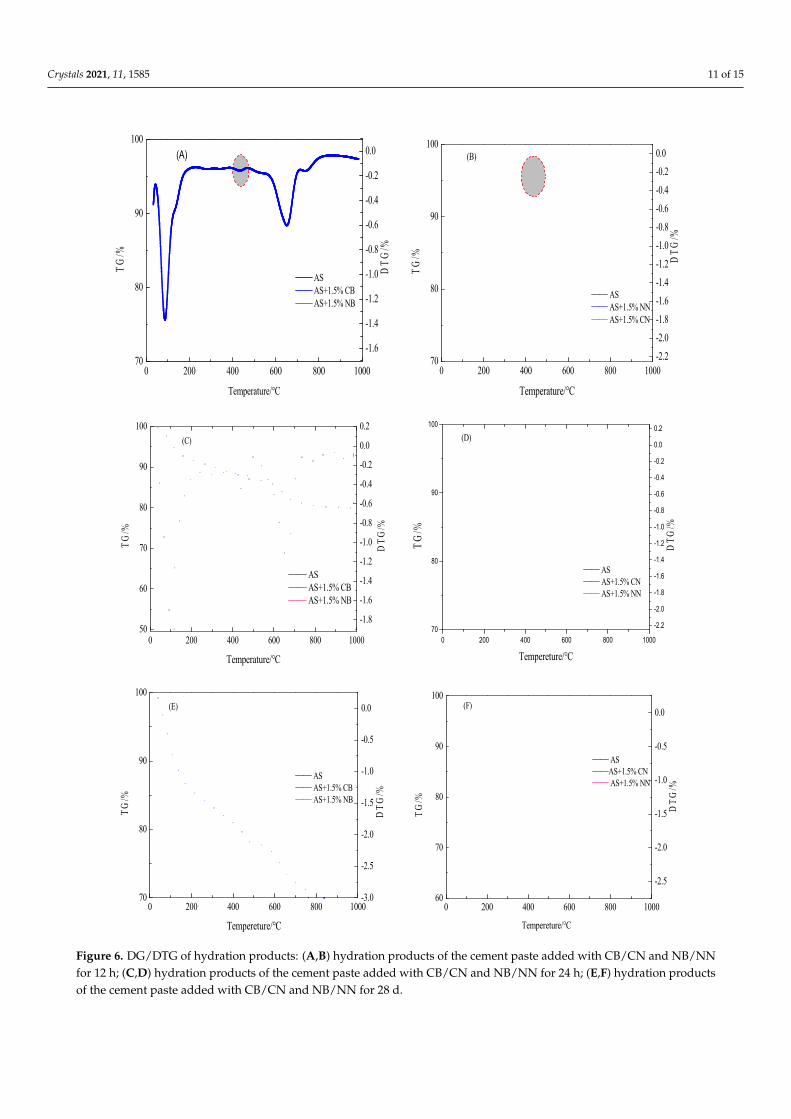
Combined with the TG/DTG data, the contents of ettringite and CH in the systemwere calculated. The calculation results are shown in Figure 7. BW was the bound wa-ter of all hydration products except CH. BW and CH were calculated as the followingEquations (5) and (6), respectively [13]:
CH =7418
× M400 C − M470 C
M550 C× 100%, (5)
BW = [M50 C − M550 C
M550 C− M400 C − M470 C
M550 C]× 100%, (6)
where BW represents the bound water content of all hydration products except CH, andthe product CH represents the content of Portland stone; M50◦C, M400◦C, M470◦C, andM550◦C indicate that the masses of the sample at temperatures of 50, 400, 470, and 550 ◦C,respectively.
It could be seen from the calculation results that the content of CH in the hydrationproduct of the AS experimental group was lower than those of inorganic salt components at12 and 24 h, as shown in Figure 7A. However, the CH content was higher at 28 d, consistentwith the experimental group mixed with inorganic salts, and the results could identifywith the mortar strength data in Figure 3. However, as shown in Figure 7B, the combinedwater of hydration products of components was more significant than that added withinorganic salts at 12 h in the AS experimental group, which could explain that inorganicsalts promoted hydration and their products might contain two or more kinds of AFt,nitrate-AFt, bromide-AFt, and CSH.
Crystals 2021, 11, 1585 11 of 15
Crystals 2021, 11, x FOR PEER REVIEW 11 of 16
difference in quality loss. However, the main ettringite phase was dominated by the ni-trate-ettringite and bromine-ettringite phases in the early stage of hydration (12 and 24 h).
0 200 400 600 800 100070
80
90
100
AS AS+1.5% CB AS+1.5% NB
Temperature/℃
TG/%
(A)
-1.6
-1.4
-1.2
-1.0
-0.8
-0.6
-0.4
-0.2
0.0
DTG
/%0 200 400 600 800 1000
70
80
90
100
AS AS+1.5% NN AS+1.5% CN
Temperature/℃
TG/%
(B)
-2.2-2.0-1.8-1.6-1.4-1.2-1.0-0.8-0.6-0.4-0.20.0
DTG
/%
0 200 400 600 800 100050
60
70
80
90
100
AS AS+1.5% CB AS+1.5% NB
Temperature/℃
TG/%
(C)
-1.8
-1.6
-1.4
-1.2
-1.0
-0.8
-0.6
-0.4
-0.2
0.0
0.2
DTG
/%
0 200 400 600 800 100070
80
90
100
AS AS+1.5% CN AS+1.5% NN
Tempereture/℃
TG/%
(D)
-2.2
-2.0
-1.8
-1.6
-1.4
-1.2
-1.0
-0.8
-0.6
-0.4
-0.2
0.0
0.2
DTG
/%
0 200 400 600 800 100070
80
90
100
AS AS+1.5% CB AS+1.5% NB
Tempereture/℃
TG/%
(E)
-3.0
-2.5
-2.0
-1.5
-1.0
-0.5
0.0
DTG
/%
0 200 400 600 800 100060
70
80
90
100
ASAS+1.5% CN AS+1.5% NN
Tempereture/℃
TG/%
(F)
-2.5
-2.0
-1.5
-1.0
-0.5
0.0
DTG
/%
Figure 6. DG/DTG of hydration products: (A,B) hydration products of the cement paste added with CB/CN and NB/NNfor 12 h; (C,D) hydration products of the cement paste added with CB/CN and NB/NN for 24 h; (E,F) hydration productsof the cement paste added with CB/CN and NB/NN for 28 d.
Crystals 2021, 11, 1585 12 of 15
Crystals 2021, 11, x FOR PEER REVIEW 12 of 16
Figure 6. DG/DTG of hydration products: (A,B) hydration products of the cement paste added with CB/CN and NB/NN for 12 h; (C,D) hydration products of the cement paste added with CB/CN and NB/NN for 24 h; (E,F) hydration products of the cement paste added with CB/CN and NB/NN for 28 d.
Combined with the TG/DTG data, the contents of ettringite and CH in the system were calculated. The calculation results are shown in Figure 7. BW was the bound water of all hydration products except CH. BW and CH were calculated as the following Equations (5) and (6), respectively [13]:
400 470
550
-74 100%18
M MCHM
= × ×℃ ℃
℃
, (5)
50 550 400 470
550 550
- -[ - ] 100%M M M MBWM M
= ×℃ ℃ ℃ ℃
℃ ℃
, (6)
where BW represents the bound water content of all hydration products except CH, and the product CH represents the content of Portland stone; M50°C, M400°C, M470°C, and M550°C indicate that the masses of the sample at temperatures of 50, 400, 470, and 550 °C, respec-tively.
It could be seen from the calculation results that the content of CH in the hydration product of the AS experimental group was lower than those of inorganic salt components at 12 and 24 h, as shown in Figure 7A. However, the CH content was higher at 28 d, con-sistent with the experimental group mixed with inorganic salts, and the results could iden-tify with the mortar strength data in Figure 3. However, as shown in Figure 7B, the com-bined water of hydration products of components was more significant than that added with inorganic salts at 12 h in the AS experimental group, which could explain that inor-ganic salts promoted hydration and their products might contain two or more kinds of AFt, nitrate-AFt, bromide-AFt, and CSH.
Figure 7. Hydration products of different systems at 10 °C: (A) CH (wt%); (B) bound water (BW; wt%).
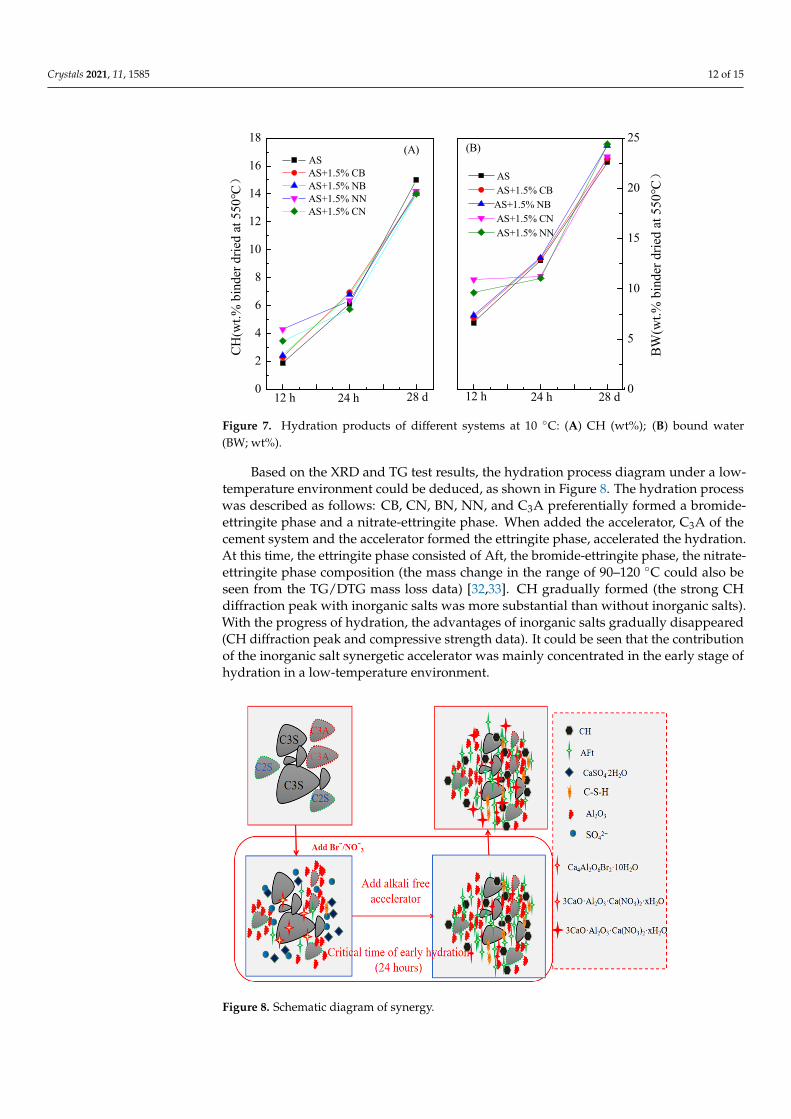
Based on the XRD and TG test results, the hydration process diagram under a low-temperature environment could be deduced, as shown in Figure 8. The hydration process was described as follows: CB, CN, BN, NN, and C3A preferentially formed a bromide-ettringite phase and a nitrate-ettringite phase. When added the accelerator, C3A of the cement system and the accelerator formed the ettringite phase, accelerated the hydration. At this time, the ettringite phase consisted of Aft, the bromide-ettringite phase, the nitrate-ettringite phase composition (the mass change in the range of 90–120 °C could also be seen
0
2
4
6
8
10
12
14
16
18
AS AS+1.5% CB AS+1.5% NB AS+1.5% NN AS+1.5% CN
CH(w
t.% b
inde
r drie
d at
550
℃)
24 h12 h 28 d
(A)
BW(w
t.% b
inde
r drie
d at
550
℃) AS
AS+1.5% CBAS+1.5% NB AS+1.5% CN AS+1.5% NN
12 h 28 d24 h
(B)
0
5
10
15
20
25
Figure 7. Hydration products of different systems at 10 ◦C: (A) CH (wt%); (B) bound water(BW; wt%).
Based on the XRD and TG test results, the hydration process diagram under a low-temperature environment could be deduced, as shown in Figure 8. The hydration processwas described as follows: CB, CN, BN, NN, and C3A preferentially formed a bromide-ettringite phase and a nitrate-ettringite phase. When added the accelerator, C3A of thecement system and the accelerator formed the ettringite phase, accelerated the hydration.At this time, the ettringite phase consisted of Aft, the bromide-ettringite phase, the nitrate-ettringite phase composition (the mass change in the range of 90–120 ◦C could also beseen from the TG/DTG mass loss data) [32,33]. CH gradually formed (the strong CHdiffraction peak with inorganic salts was more substantial than without inorganic salts).With the progress of hydration, the advantages of inorganic salts gradually disappeared(CH diffraction peak and compressive strength data). It could be seen that the contributionof the inorganic salt synergetic accelerator was mainly concentrated in the early stage ofhydration in a low-temperature environment.
Crystals 2021, 11, x FOR PEER REVIEW 13 of 16
from the TG/DTG mass loss data) [32,33]. CH gradually formed (the strong CH diffraction peak with inorganic salts was more substantial than without inorganic salts). With the progress of hydration, the advantages of inorganic salts gradually disappeared (CH dif-fraction peak and compressive strength data). It could be seen that the contribution of the inorganic salt synergetic accelerator was mainly concentrated in the early stage of hydra-tion in a low-temperature environment.
Figure 8. Schematic diagram of synergy.
3.6. SEM Analysis
The hydration products produced by the alkali-free liquid accelerator system were analyzed by a scanning electron microscope. In Figure 9A, it could be observed that AS could also produce hydration products at 10 °C, which were mainly ettringite and C–S–H. Compared with that for 28 d, the amount of hydration products was observably re-duced. However, compared with the component added with an inorganic salt (Figure 8C,E,G,H), the hydration degree was prominently improved in 1 d, of which 1.5% NN and 1.5% NB were relatively obvious. However, for the added inorganic salt components, the formation of new phases was the focus of attention.
According to the XRD results of the hydration of C3A, inorganic salts, and the cement paste, the components of the new phase were Ca4Al2O36Br210·H2O, 3CaOAl2O3Ca(NO3)2X·H2O. By the SEM analysis in Figure 8, the new phase formed by bromide could hardly be found. The main reasons might be two aspects: (a) the new phase was covered by the hydration products, failing to be reflected in the figure; (b) the new phase crystal grew slowly or stably and did not increase bulk with the extension of hy-dration time, and the strength of the bromide inorganic salt did not shrink back in the later stage. For the system added with nitrate, the formation of a new phase could be ob-served obviously, and the formation of thick rod ellipsoid was observed in Figure 9J. However, the product was not evident in 1 d, mainly concentrated in 28 days of hydration. Therefore, it was inferred that the crystal growth and expansion process could promote the early mechanical strength of the mortar and gradually show adverse effects later. It was consistent with the influence law of adding nitrate on the mechanical strength of the mortar in Figure 3.
Figure 8. Schematic diagram of synergy.

Crystals 2021, 11, 1585 13 of 15
3.6. SEM Analysis
The hydration products produced by the alkali-free liquid accelerator system wereanalyzed by a scanning electron microscope. In Figure 9A, it could be observed that AScould also produce hydration products at 10 ◦C, which were mainly ettringite and C–S–H.Compared with that for 28 d, the amount of hydration products was observably reduced.However, compared with the component added with an inorganic salt (Figure 8C,E,G,H),the hydration degree was prominently improved in 1 d, of which 1.5% NN and 1.5% NBwere relatively obvious. However, for the added inorganic salt components, the formationof new phases was the focus of attention.
Crystals 2021, 11, x FOR PEER REVIEW 14 of 16
Figure 9. SEM patterns of samples: (A,B) hydration products of the cement paste added with 7% AS for 24 h/28 d; (C,D) hydration products of the cement paste added with 1.5% CB for 24 h/28 d; (E,F) hydration products of the cement paste added with 1.5% NB for 24 h/28 d; (G,H) hydration products of the cement paste added with 1.5% CN for 24 h/28 d; (I,J) hydration products of the cement paste added with 1.5% NN for 24 h/28 d.
4. Conclusions The purpose of this paper was to investigate the effects of inorganic salts (CaBr2,
NaBr, Ca(NO3)2, and NaNO3) on the hydration products, microstructure, and mechanical strength of mortar at 10 °C. The main results were as follows: (1) The effects of inorganic salts CB, NB, CN, and NN mixed with an alkali-free liquid
accelerator on the comperssive strength and the setting time of mortar at 10 °C were studied. The 1-d comperssive strength of the AS experimental group was 4.17 MPa. When 1.5% NB and 1.5% NN were added to the cement, the 1-d compressive strength growth rates were 185.8% and 184.2%, respectively. The final setting time of the AS experimental group was 7.74 min. When 1.5% NB and 1.5% NN were added, the final setting time was shortened to 6.08 and 6.12 min, respectively, so as to ensure that the alkali-free liquid accelerator met the requirements of GB/T 35159-2017 at low temper-ature.
(2) C3A reacted with nitrate and bromine to form the nitrate-ettringite phase (3CaOAl2O3Ca(NO3)2X·H2O) and the bromine-ettringite phase (Ca4Al2O6Br210H2O). In addition, the hydration products hydrated for 12 h, 24 h, and 28 d were analyzed in the cement paste mixed with inorganic salts and the accelerator, and 3CaOAl2O3Ca(NO3)2X·H2O and Ca4Al2O6Br210·H2O were detected. The mass loss of the ettringite phase at 90–120 °C was analyzed by TG/DTG. The comprehensive TG and XRD analyses showed that the ettringite phase were composed of AFt, 3CaOAl2O3Ca(NO3)2X·H2O, and Ca4Al2O6Br210·H2O. This stage had a positive contri-bution to the early strength of the cement, but its contribution gradually weakened in the later stage of the cement hydration.
(3) A test multi-channel temperature collector was used to collect the hydration temper-ature in the hydration process with different dosage of the accelerator at 10 °C. Through calculation, the influence relationships between the inorganic salts and the alkali-free liquid accelerator on the hydration degree were as follows: αAS + NN > αAS +
NB > αAS + CB > αAS + CN > αAS. At the same time, combined with the influence of inorganic salts on the mortar compressive strength, it was comprehensively analyzed that when the dosage was 1.5% NN and 1.5% NB, it had the greatest influence on the hydration degree.
(B)-7%AS-28d
(C)-7%AS-1.5%CB-1d (D)-7%AS-1.5%CB-28d
% (1)
(A)-7%AS-1d
% (1)
(H)-7%AS-1.5%CN-28d
(E)-7%AS-1.5%NB-1d (F)-7%AS-1.5%NB-28d
(G)-7%AS-1.5%CN-1d (J)-7%AS-1.5%NN-28d
(I)-7%AS-1.5%NN-1d
Figure 9. SEM patterns of samples: (A,B) hydration products of the cement paste added with 7% AS for 24 h/28 d; (C,D)hydration products of the cement paste added with 1.5% CB for 24 h/28 d; (E,F) hydration products of the cement pasteadded with 1.5% NB for 24 h/28 d; (G,H) hydration products of the cement paste added with 1.5% CN for 24 h/28 d; (I,J)hydration products of the cement paste added with 1.5% NN for 24 h/28 d.
According to the XRD results of the hydration of C3A, inorganic salts, and the cement paste,the components of the new phase were Ca4Al2O36Br210·H2O, 3CaOAl2O3Ca(NO3)2X·H2O. Bythe SEM analysis in Figure 8, the new phase formed by bromide could hardly be found.The main reasons might be two aspects: (a) the new phase was covered by the hydrationproducts, failing to be reflected in the figure; (b) the new phase crystal grew slowly orstably and did not increase bulk with the extension of hydration time, and the strength ofthe bromide inorganic salt did not shrink back in the later stage. For the system addedwith nitrate, the formation of a new phase could be observed obviously, and the formationof thick rod ellipsoid was observed in Figure 9J. However, the product was not evidentin 1 d, mainly concentrated in 28 days of hydration. Therefore, it was inferred that thecrystal growth and expansion process could promote the early mechanical strength of themortar and gradually show adverse effects later. It was consistent with the influence lawof adding nitrate on the mechanical strength of the mortar in Figure 3.
4. Conclusions
The purpose of this paper was to investigate the effects of inorganic salts (CaBr2,NaBr, Ca(NO3)2, and NaNO3) on the hydration products, microstructure, and mechanicalstrength of mortar at 10 ◦C. The main results were as follows:
(1) The effects of inorganic salts CB, NB, CN, and NN mixed with an alkali-free liquidaccelerator on the comperssive strength and the setting time of mortar at 10 ◦C werestudied. The 1-d comperssive strength of the AS experimental group was 4.17 MPa.
Crystals 2021, 11, 1585 14 of 15
When 1.5% NB and 1.5% NN were added to the cement, the 1-d compressive strengthgrowth rates were 185.8% and 184.2%, respectively. The final setting time of the ASexperimental group was 7.74 min. When 1.5% NB and 1.5% NN were added, thefinal setting time was shortened to 6.08 and 6.12 min, respectively, so as to ensurethat the alkali-free liquid accelerator met the requirements of GB/T 35159-2017 at lowtemperature.
(2) C3A reacted with nitrate and bromine to form the nitrate-ettringite phase(3CaOAl2O3Ca(NO3)2X·H2O) and the bromine-ettringite phase (Ca4Al2O6Br210H2O).In addition, the hydration products hydrated for 12 h, 24 h, and 28 d were an-alyzed in the cement paste mixed with inorganic salts and the accelerator, and3CaOAl2O3Ca(NO3)2X·H2O and Ca4Al2O6Br210·H2O were detected. The mass lossof the ettringite phase at 90–120 ◦C was analyzed by TG/DTG. The comprehen-sive TG and XRD analyses showed that the ettringite phase were composed of AFt,3CaOAl2O3Ca(NO3)2X·H2O, and Ca4Al2O6Br210·H2O. This stage had a positive con-tribution to the early strength of the cement, but its contribution gradually weakenedin the later stage of the cement hydration.
(3) A test multi-channel temperature collector was used to collect the hydration tem-perature in the hydration process with different dosage of the accelerator at 10 ◦C.Through calculation, the influence relationships between the inorganic salts and thealkali-free liquid accelerator on the hydration degree were as follows: αAS + NN >αAS + NB > αAS + CB > αAS + CN > αAS. At the same time, combined with the influenceof inorganic salts on the mortar compressive strength, it was comprehensively ana-lyzed that when the dosage was 1.5% NN and 1.5% NB, it had the greatest influenceon the hydration degree.
Author Contributions: Experiment, result analysis, and data processing, Y.X.; conceptualization,resources, funding acquisition, data curation, and reviewing and editing, T.H. All authors have readand agreed to the published version of the manuscript.
Funding: This research was funded by the Lei Zhi Innovation Fund project (grant number: JY-Grp20190501).
Data Availability Statement: Not applicable.
Acknowledgments: The authors were grateful to the Xiamen Academy of Building Research GroupCo., Ltd. This research was funded by the Lei Zhi Innovation Fund project (JYGrp20190501).
Conflicts of Interest: The authors declare that they have no known competing financial interest orpersonal relationships that could have appeared to influence the work reported in this paper.
References1. Tang, Y.; Xu, G.; Lian, J.; Su, H.; Qu, C. Effect of temperature and humidity on the adhesion strength and damage mechanism of
shotcrete-surrounded rock. Constr. Build. Mater. 2016, 124, 1109–1119. [CrossRef]2. Prudêncio, L.R. Accelerating admixtures for shotcrete. Cem. Concr. Compos. 1998, 20, 213–219. [CrossRef]3. Han, J.; Wang, K.; Shi, J.; Wang, Y. Influence of sodium aluminate on cement hydration and concrete properties. Constr. Build.
Mater. 2014, 64, 342–349. [CrossRef]4. Salvador, R.P.; Cavalaro, S.H.; Segura, I.; Figueiredo, A.D.; Pérez, J. Early age hydration of cement pastes with alkaline and
alkali-free accelerators for sprayed concrete. Constr. Build. Mater. 2016, 111, 386–398. [CrossRef]5. Wang, Y.; Shi, C.; Ma, Y.; Xiao, Y.; Liu, Y. Accelerators for shotcrete—Chemical composition and their effects on hydration,
microstructure and properties of cement-based materials. Constr. Build. Mater. 2021, 281, 122557. [CrossRef]6. Mehta, P.K.; Monteiro, P.J.M. Concrete: Microstructure, Properties, and Materials, 3rd ed.; McGraw-Hill: New York, NY, USA, 2006.7. Popovics, S. (Ed.) Concrete Materials—Properties, Specifications and Testing, 2nd ed.; William Andrew Publwashing: Norwich, NY,
USA, 1992; pp. 236–246.8. The Americould Concrete Institute. Committee Report ACI 212.3R-04, Chemical Admixtures for Concrete; The Americould Concrete
Institute: Farmington Hills, MI, USA, 2004.9. Taylor, H.F.W. Cement Chemwastry; Academic Press Limited: London, UK, 1990; Chapter 11; pp. 358–359.10. Lee, T.; Lee, J.; Kim, Y. Effects of admixtures and accelerators on the development of concrete strength for horizontal form removal
upon curing at 10 ◦C. Constr. Build. Mater. 2020, 237, 117652. [CrossRef]
Crystals 2021, 11, 1585 15 of 15
11. Niu, D.; Zhang, S.; Wang, Y.; Hong, M.; Li, Z. Effect of temperature on the strength, hydration products and microstructure ofshotcrete blended with supplementary cementitious materials. Constr. Build. Mater. 2020, 264, 120234. [CrossRef]
12. Zeng, X.; Ma, C.; Long, G.; Dang, H.; Xie, Y. Hydration kinetics of cement composites with different admixtures at lowtemperatures. Constr. Build. Mater. 2019, 225, 223–233. [CrossRef]
13. Zhang, F.; Bai, Y.; Cai, Y. Early strength and microstructure of Portland cement mixed with calcium bromide at 5 ◦C. Constr. Build.Mater. 2020, 271, 121508. [CrossRef]
14. Bao, J.; Ren, Q.; Sun, L.; Ding, Y.; Oh, W.-C. Preparation of an Early Strengthening Agent for Concrete under Low-TemperatureConditions and Evaluation of Its Reaction Mechanism. Korean J. Mater. Res. 2021, 31, 195–208. [CrossRef]
15. Shi, Y.Z.; Wang, Q.; Song, P.; Jia, L.L. Advanced early strength agent development and mechanism analysis. Adv. Mater. Res. 2011,261–263, 323–327. [CrossRef]
16. Wang, J.G.; Tong, A.Q.; Fan, Z.Z.; Liu, Q.W. The Performance Evaluation of New Low Temperature early Strength Agent ZL-1.Appl. Mech. Mater. 2014, 470, 842–846. [CrossRef]
17. Lee, T.; Lee, J.; Kim, J.; Choi, H.; Lee, D.-E. Effect of Formwork Removal Time Reduction on Construction ProductivityImprovement by Mix Design of Early Strength Concrete. Appl. Sci. 2020, 10, 7046. [CrossRef]
18. Zou, D.; Wang, K.; Li, H.; Guan, X. Effect of LiAl-layered double hydroxides on hydration of calcium sulfoaluminate cement atlow temperature. Constr. Build. Mater. 2019, 223, 910–917. [CrossRef]
19. Yoneyama, A.; Choi, H.; Inoue, M.; Kim, J.; Lim, M.; Sudoh, Y. Effect of a Nitrite/Nitrate-Based Accelerator on the StrengthDevelopment and Hydrate Formation in Cold-Weather Cementitious Materials. Materials 2021, 14, 1006. [CrossRef]
20. Kim, J.; Honda, D.; Choi, H.; Hama, Y. Investigation of the Relationship between Compressive Strength and Hydrate FormationBehavior of Low-Temperature Cured Cement upon Addition of a Nitrite-Based Accelerator. Materials 2019, 12, 3936. [CrossRef]
21. Liu, Z.; Lou, B.; Barbieri, D.M.; Sha, A.; Ye, T.; Li, Y. Effects of pre-curing treatment and chemical accelerators on Portland cementmortars at low temperature (5 ◦C). Constr. Build. Mater. 2020, 240, 117893. [CrossRef]
22. Balonwas, M.; Medala, M.; Glasser, F.P. Influence of calcium nitrate and nitrite on the constitution of AFm and AFt cementhydrates. Adv. Cem. Res. 2011, 23, 129–143. [CrossRef]
23. Suh, J.I.; Yum, W.S.; Song, H.; Park, H.-G.; Oh, J.E. Influence of calcium nitrate and sodium nitrate on strength development andproperties in quicklime (CaO)-activated Class F fly ash system. Mater. Struct. 2019, 52, 115. [CrossRef]
24. Sargam, Y.; Wang, K. Hydration kinetics and activation energy of cement pastes containing various nanoparticles. Compos. Part BEng. 2021, 216, 108836. [CrossRef]
25. Xu, Q.; Hu, J.; Ruiz, J.M.; Wang, K.; Ge, Z. Isothermal calorimetry tests and modeling of cement hydration parameters. Thermochim.Acta 2010, 499, 91–99. [CrossRef]
26. Paulo, J.M. Concrete, Microstructure, Properties, and Materials, 2nd ed.; Mc Graw Hill: New York, NY, USA, 1995; pp. 181–227.27. D’aloia, L.; Chanvillard, G. Determining the “appwerent” activation energy of concrete: Ea—numerical simulations of the heat of
hydration of cement. Cem. Concr. Res. 2002, 32, 1277–1289. [CrossRef]28. Li, G.; Zhang, J.; Niu, M.; Song, Z. The mechanism of alkali-free liquid accelerator on the hydration of cement pastes. Constr.
Build. Mater. 2020, 233, 117296. [CrossRef]29. Yang, R.; He, T. The accelerating mechanism of alkali free liquid accelerator based on fluoroaluminate for shotcrete. Constr. Build.
Mater. 2021, 274, 121830. [CrossRef]30. Deschner, F.; Lothenbach, B.; Winnefeld, F.; Neubauer, J. Effect of temperature on the hydration of Portland cement blended with
siliceous fly ash. Cem. Concr. Res. 2013, 52, 169–181. [CrossRef]31. Guo, X.; Hu, W.; Shi, H. Microstructure and self-solidification/stabilization (S/S) of heavy metals of nano-modified CFA–MSWIFA
composite geopolymers. Constr. Build. Mater. 2014, 56, 81–86. [CrossRef]32. Balonwas, M. The Influence of Inorganic Chemical Accelerators and Corrosion Inhibitors on the Mineralogy of HydratedPortland
Cement Systems. Ph.D. Thesis, University of Aberdeen, Aberdeen, UK, 2010.33. Falzone, G.; Balonwas, M.; Sant, G. X-AFm stabilization as a mechanism of bypassing conversion phenomena in calcium
aluminate cements. Cem. Concr. Res. 2015, 72, 54–68. [CrossRef]
Copyright © 2022 FDOKUMEN