Thermodynamic modelling of the hydration of Portland cement
18
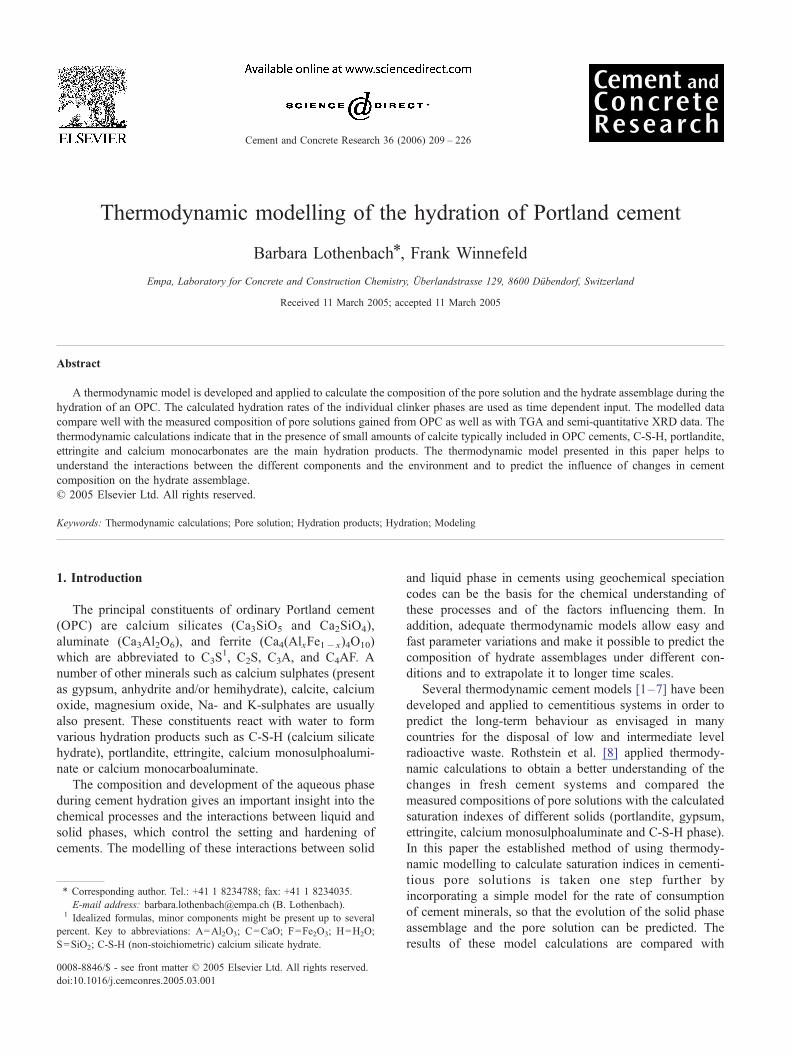
Thermodynamic modelling of the hydration of Portland cement Barbara Lothenbach * , Frank Winnefeld Empa, Laboratory for Concrete and Construction Chemistry, U ¨ berlandstrasse 129, 8600 Du ¨ bendorf, Switzerland Received 11 March 2005; accepted 11 March 2005 Abstract A thermodynamic model is developed and applied to calculate the composition of the pore solution and the hydrate assemblage during the hydration of an OPC. The calculated hydration rates of the individual clinker phases are used as time dependent input. The modelled data compare well with the measured composition of pore solutions gained from OPC as well as with TGA and semi-quantitative XRD data. The thermodynamic calculations indicate that in the presence of small amounts of calcite typically included in OPC cements, C-S-H, portlandite, ettringite and calcium monocarbonates are the main hydration products. The thermodynamic model presented in this paper helps to understand the interactions between the different components and the environment and to predict the influence of changes in cement composition on the hydrate assemblage. D 2005 Elsevier Ltd. All rights reserved. Keywords: Thermodynamic calculations; Pore solution; Hydration products; Hydration; Modeling 1. Introduction The principal constituents of ordinary Portland cement (OPC) are calcium silicates (Ca 3 SiO 5 and Ca 2 SiO 4 ), aluminate (Ca 3 Al 2 O 6 ), and ferrite (Ca 4 (Al x Fe 1 x ) 4 O 10 ) which are abbreviated to C 3 S 1 ,C 2 S, C 3 A, and C 4 AF. A number of other minerals such as calcium sulphates (present as gypsum, anhydrite and/or hemihydrate), calcite, calcium oxide, magnesium oxide, Na- and K-sulphates are usually also present. These constituents react with water to form various hydration products such as C-S-H (calcium silicate hydrate), portlandite, ettringite, calcium monosulphoalumi- nate or calcium monocarboaluminate. The composition and development of the aqueous phase during cement hydration gives an important insight into the chemical processes and the interactions between liquid and solid phases, which control the setting and hardening of cements. The modelling of these interactions between solid and liquid phase in cements using geochemical speciation codes can be the basis for the chemical understanding of these processes and of the factors influencing them. In addition, adequate thermodynamic models allow easy and fast parameter variations and make it possible to predict the composition of hydrate assemblages under different con- ditions and to extrapolate it to longer time scales. Several thermodynamic cement models [1–7] have been developed and applied to cementitious systems in order to predict the long-term behaviour as envisaged in many countries for the disposal of low and intermediate level radioactive waste. Rothstein et al. [8] applied thermody- namic calculations to obtain a better understanding of the changes in fresh cement systems and compared the measured compositions of pore solutions with the calculated saturation indexes of different solids (portlandite, gypsum, ettringite, calcium monosulphoaluminate and C-S-H phase). In this paper the established method of using thermody- namic modelling to calculate saturation indices in cementi- tious pore solutions is taken one step further by incorporating a simple model for the rate of consumption of cement minerals, so that the evolution of the solid phase assemblage and the pore solution can be predicted. The results of these model calculations are compared with 0008-8846/$ - see front matter D 2005 Elsevier Ltd. All rights reserved. doi:10.1016/j.cemconres.2005.03.001 * Corresponding author. Tel.: +41 1 8234788; fax: +41 1 8234035. E-mail address: [email protected] (B. Lothenbach). 1 Idealized formulas, minor components might be present up to several percent. Key to abbreviations: A= Al 2 O 3 ; C=CaO; F=Fe 2 O 3 ; H=H 2 O; S=SiO 2 ; C-S-H (non-stoichiometric) calcium silicate hydrate. Cement and Concrete Research 36 (2006) 209 – 226
Transcript of Thermodynamic modelling of the hydration of Portland cement
Cement and Concrete Research
Thermodynamic modelling of the hydration of Portland cement
Barbara Lothenbach*, Frank Winnefeld
Empa, Laboratory for Concrete and Construction Chemistry, Uberlandstrasse 129, 8600 Dubendorf, Switzerland
Received 11 March 2005; accepted 11 March 2005
Abstract
A thermodynamic model is developed and applied to calculate the composition of the pore solution and the hydrate assemblage during the
hydration of an OPC. The calculated hydration rates of the individual clinker phases are used as time dependent input. The modelled data
compare well with the measured composition of pore solutions gained from OPC as well as with TGA and semi-quantitative XRD data. The
thermodynamic calculations indicate that in the presence of small amounts of calcite typically included in OPC cements, C-S-H, portlandite,
ettringite and calcium monocarbonates are the main hydration products. The thermodynamic model presented in this paper helps to
understand the interactions between the different components and the environment and to predict the influence of changes in cement
composition on the hydrate assemblage.
D 2005 Elsevier Ltd. All rights reserved.
Keywords: Thermodynamic calculations; Pore solution; Hydration products; Hydration; Modeling
1. Introduction
The principal constituents of ordinary Portland cement
(OPC) are calcium silicates (Ca3SiO5 and Ca2SiO4),
aluminate (Ca3Al2O6), and ferrite (Ca4(AlxFe1� x)4O10)
which are abbreviated to C3S1, C2S, C3A, and C4AF. A
number of other minerals such as calcium sulphates (present
as gypsum, anhydrite and/or hemihydrate), calcite, calcium
oxide, magnesium oxide, Na- and K-sulphates are usually
also present. These constituents react with water to form
various hydration products such as C-S-H (calcium silicate
hydrate), portlandite, ettringite, calcium monosulphoalumi-
nate or calcium monocarboaluminate.
The composition and development of the aqueous phase
during cement hydration gives an important insight into the
chemical processes and the interactions between liquid and
solid phases, which control the setting and hardening of
cements. The modelling of these interactions between solid
0008-8846/$ - see front matter D 2005 Elsevier Ltd. All rights reserved.
doi:10.1016/j.cemconres.2005.03.001
* Corresponding author. Tel.: +41 1 8234788; fax: +41 1 8234035.
E-mail address: [email protected] (B. Lothenbach).1 Idealized formulas, minor components might be present up to several
percent. Key to abbreviations: A=Al2O3; C=CaO; F=Fe2O3; H=H2O;
S=SiO2; C-S-H (non-stoichiometric) calcium silicate hydrate.
and liquid phase in cements using geochemical speciation
codes can be the basis for the chemical understanding of
these processes and of the factors influencing them. In
addition, adequate thermodynamic models allow easy and
fast parameter variations and make it possible to predict the
composition of hydrate assemblages under different con-
ditions and to extrapolate it to longer time scales.
Several thermodynamic cement models [1–7] have been
developed and applied to cementitious systems in order to
predict the long-term behaviour as envisaged in many
countries for the disposal of low and intermediate level
radioactive waste. Rothstein et al. [8] applied thermody-
namic calculations to obtain a better understanding of the
changes in fresh cement systems and compared the
measured compositions of pore solutions with the calculated
saturation indexes of different solids (portlandite, gypsum,
ettringite, calcium monosulphoaluminate and C-S-H phase).
In this paper the established method of using thermody-
namic modelling to calculate saturation indices in cementi-
tious pore solutions is taken one step further by
incorporating a simple model for the rate of consumption
of cement minerals, so that the evolution of the solid phase
assemblage and the pore solution can be predicted. The
results of these model calculations are compared with
36 (2006) 209 – 226

Table 2
Alkalis, Mg and sulphate associated with the unhydrated clinker phases in
the OPC calculated according to Table 1.3 in Taylor [10] and the phase
composition (Table 1)
B. Lothenbach, F. Winnefeld / Cement and Concrete Research 36 (2006) 209–226210
experimentally determined concentrations in the pore
solution as well as with semi-quantitative XRD and TGA
data obtained during the first year of the hydration of OPC.
Na K Mg SO3
In mmol/100 g cement
Alite 0.48 0.8 27.1 1.06
Belite 0.17 2.9 3.2 0.38
Aluminate 0.52 1.3 4.9
Ferrite 0.07 0.4 10.6
Total 1.2 5.4 45.9 1.4
2. Materials and methods
All experiments were carried out using an ordinary
Portland cement (OPC), CEM I 42.5 N, at 20 -C. The
composition of the cement and the calculated amount of the
clinker phases in the unhydrated cement are compiled in
Table 1. The distribution of alkali between sulphates and
oxides is calculated using the measured concentration of
‘‘easily soluble’’ alkalis in bi-distilled water at a solid /water
ratio of 0.1 after an equilibration time of 5 min. These
easily soluble alkalis are assumed to correspond to the
alkali sulphates present in the clinker, while the remaining
K, Na, Mg and S are assumed to be present as minor
constituents in solid solution with the major clinker phases
[9,10] (cf. Table 2).
Cement pastes were prepared with a w/c of 0.5 by
adding cement to distilled water. For the experiments with
fresh pastes (up to 7 h), small samples of ¨100 g were
prepared, cured in the glove box under N2-atmosphere and
the pore solution was collected by vacuum filtration using
0.45 Am filter. For longer hydration times, larger samples
consisting of 1 kg cement and 0.5 kg water were mixed for 3
min in a Hobart mixer. The pastes were cast in 0.5 l PE-
bottles, sealed and stored under controlled conditions at 20
-C. Pore fluids of the hardened samples were extracted
using the steel die method using pressures up to 250 N/
mm2; the solutions were filtered immediately (0.45 Am).
Table 1
Composition of the OPC used (CEM I 42.5N)
Chemical analysis Normative phase compositiona
g/100 g g/100 g mmol/100 g
SiO2 19.7 alite 55 241
Al2O3 4.7 belite 15 87
Fe2O3 2.67 aluminate 7.9 29
CaO 63.2 ferrite 8.1 17
MgO 1.85 CaO 0.46 8.2
SrO 0.07 CaCO3 4.4 44
K2O 1.12 CaSO4b 4.2 31
Na2O 0.08 K2SO4c 1.6 9.2
CaO (free) 0.46 Na2SO4c 0.096 0.67
CO2 1.93 SrO 0.07 0.68
SO3 3.35 K2Od 0.26 2.7
readily soluble alkalisc Na2Od 0.04 0.6
K2O 0.86 (77% of total K) MgOd 1.9 46
Na2O 0.042 (52% of total Na) SO3d 0.12 1.4
Blaine surface area: 300 m2/kg.a Calculated from the chemical analysis.b Present as anhydrite (2.5 g/100 g), hemihydrate (0.5 g/100 g) and
gypsum (1.5 g/100 g).c Readily soluble alkalis were calculated from the concentrations of
alkalis measured in the solution after 5 min agitation at a w/c of 10; present
as alkali sulphates.d Present as solid solution in the major clinker phases, cf. Table 2.
Hydroxide concentrations were determined with a
combined pH-electrode in undiluted samples; the pH
electrode had been calibrated against KOH solutions of
known concentrations. The total concentrations of Al, Ba,
Ca, Cr, Fe, K, Li, Mg, Mo, Na, Si, Sr, S and Zn were
determined with ICP-OES in samples diluted at least by a
factor 4 with diluted HNO3 to prevent the precipitation of
solids. The solid fraction was crushed and ground in
acetone, dried at 40 -C and then used for XRD and
thermogravimetric analysis (TGA). TGA was carried out in
nitrogen on about 10 mg of powdered cement pastes at 3 -C/min up to 220 -C and at 10 -C/min up to 640 -C. Theamount of pore solution present was calculated from the
difference of the total weight loss during TGA between
the samples washed with acetone and untreated samples; the
amount of Ca(OH)2 present from the weight loss between
500–580 -C in the TGA results and from the extracted
amount of Ca determined according to the method of Franke
[11].
3. Experimental results
3.1. XRD and TGA data
The extent of cement hydration was estimated based on
the changes in the peak intensities of the crystalline phases
in XRD patterns as well as on the changes observed by
DTG/TGA. The DTG/TGA analysis of the unhydrated
sample shows the presence of gypsum and hemihydrate.
After 30 min reaction time hemihydrate is dissolved,
gypsum is consumed within the first day. Increasing
amounts of ettringite, C-S-H and portlandite could be
observed in the hydrated samples. The presence of DTG
peaks at 200, 260 and 430 -C are consistent with the
presence of an AFm phase such as calcium monosulphoa-
luminate or calcium monocarboaluminate [10,12] after 7
days; the weak peaks at 260 and 430 -C could also be due
(in part) to a hydrotalcite phase [10].
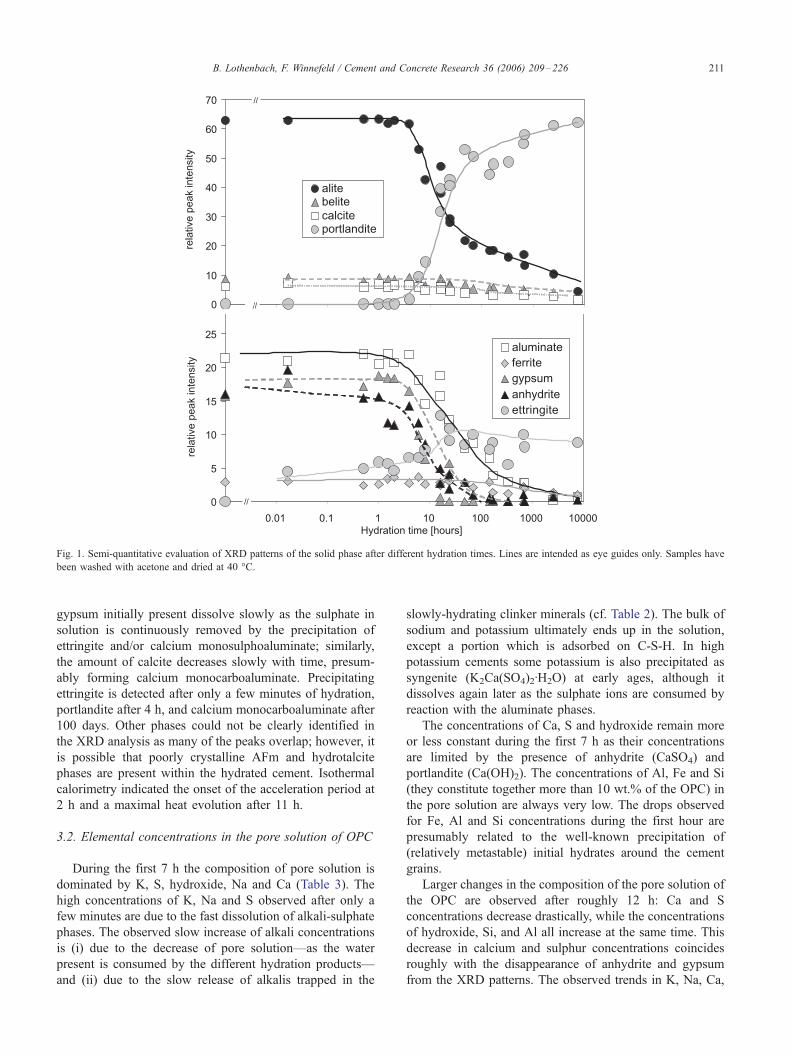
A semi-quantitative evaluation of the XRD patterns
(Fig. 1) shows that the alite and aluminate phase hydrate
relatively fast and have mostly disappeared by 300 days.
The observed hydration rates for belite and ferrite phase
hydration are significantly slower. The anhydrite and
0
10
20
30
40
50
60
70
rela
tive
peak
inte
nsity
alitebelitecalciteportlandite
//
//
0
5
10
15
20
25
0.01 0.1 1 10 100 1000 10000Hydration time [hours]
rela
tive
peak
inte
nsity
aluminateferritegypsumanhydriteettringite
//
Fig. 1. Semi-quantitative evaluation of XRD patterns of the solid phase after different hydration times. Lines are intended as eye guides only. Samples have
been washed with acetone and dried at 40 -C.
B. Lothenbach, F. Winnefeld / Cement and Concrete Research 36 (2006) 209–226 211
gypsum initially present dissolve slowly as the sulphate in
solution is continuously removed by the precipitation of
ettringite and/or calcium monosulphoaluminate; similarly,
the amount of calcite decreases slowly with time, presum-
ably forming calcium monocarboaluminate. Precipitating
ettringite is detected after only a few minutes of hydration,
portlandite after 4 h, and calcium monocarboaluminate after
100 days. Other phases could not be clearly identified in
the XRD analysis as many of the peaks overlap; however, it
is possible that poorly crystalline AFm and hydrotalcite
phases are present within the hydrated cement. Isothermal
calorimetry indicated the onset of the acceleration period at
2 h and a maximal heat evolution after 11 h.
3.2. Elemental concentrations in the pore solution of OPC
During the first 7 h the composition of pore solution is
dominated by K, S, hydroxide, Na and Ca (Table 3). The
high concentrations of K, Na and S observed after only a
few minutes are due to the fast dissolution of alkali-sulphate
phases. The observed slow increase of alkali concentrations
is (i) due to the decrease of pore solution—as the water
present is consumed by the different hydration products—
and (ii) due to the slow release of alkalis trapped in the
slowly-hydrating clinker minerals (cf. Table 2). The bulk of
sodium and potassium ultimately ends up in the solution,
except a portion which is adsorbed on C-S-H. In high
potassium cements some potassium is also precipitated as
syngenite (K2Ca(SO4)2IH2O) at early ages, although it
dissolves again later as the sulphate ions are consumed by
reaction with the aluminate phases.
The concentrations of Ca, S and hydroxide remain more
or less constant during the first 7 h as their concentrations
are limited by the presence of anhydrite (CaSO4) and
portlandite (Ca(OH)2). The concentrations of Al, Fe and Si
(they constitute together more than 10 wt.% of the OPC) in
the pore solution are always very low. The drops observed
for Fe, Al and Si concentrations during the first hour are
presumably related to the well-known precipitation of
(relatively metastable) initial hydrates around the cement
grains.
Larger changes in the composition of the pore solution of
the OPC are observed after roughly 12 h: Ca and S
concentrations decrease drastically, while the concentrations
of hydroxide, Si, and Al all increase at the same time. This
decrease in calcium and sulphur concentrations coincides
roughly with the disappearance of anhydrite and gypsum
from the XRD patterns. The observed trends in K, Na, Ca,

Table 3
Measured total concentrations in the pore solutions gained from OPC (w/c=0.5)
Time [h] K Na Li Ca Sr Ba Cr Mo Fe Al Si S OH�
mM
0.02 320 26 0.35 21.1 0.15 0.015 0.36 0.021 0.143 0.04 0.14 161 85
0.5 350 28 0.46 21.1 0.16 0.006 0.40 0.025 0.021 0.03 0.10 163 120
1 360 28 0.46 22.2 0.17 0.006 0.41 0.025 0.014 0.03 0.09 156 130
1.5 360 28 0.46 22.9 0.17 0.006 0.41 0.021 0.007 0.03 0.07 150 150
2 360 29 0.52 24.1 0.18 0.006 0.41 0.025 0.007 0.03 0.06 147 150
4 360 29 0.52 23.0 0.24 0.003 0.36 0.017 0.007 0.03 0.07 150 150
6 340 27 0.52 22.1 0.29 0.003 0.25 0.008 <0.007 0.03 0.06 139 150
7 350 30 0.63 21.3 0.30 0.006 0.22 0.008 <0.007 0.03 0.07 151 150
16 430 32 0.58 9.5 0.15 <0.003 0.10 <0.004 <0.007 <0.004 0.07 136 200
26 430 44 0.75 4.2 0.08 <0.003 0.07 <0.004 <0.007 <0.007 0.17 83 360
69 480 49 0.69 2.0 0.05 <0.003 0.04 <0.004 <0.007 <0.007 0.21 9 480
144 520 55 0.81 2.1 0.05 <0.003 0.05 <0.004 <0.007 0.09 0.24 10 520
336 510 56 0.86 1.9 0.05 <0.003 0.05 <0.004 <0.007 0.09 0.23 9 560
696 560 63 0.92 1.2 0.03 <0.003 0.05 <0.004 <0.007 0.12 0.27 11 540
2520 650 57 0.86 1.5 0.05 <0.003 0.06 <0.004 <0.018 0.04 0.21 17 570
7608 640 65 1.2 1.5 0.05 n.a. 0.06 n.a. <0.018 0.11 0.21 16 590
Concentrations in filtered blank solutions
0.06 0.05 <0.006 0.03 <0.005 <0.003 <0.004 <0.004 <0.007 <0.01 0.01 0.04 –
The values for OH� refer to the free concentrations measured in the pore solutions.
The measured concentrations of Zn and Mg were in all samples below the respective detection limits of 0.001 and 0.02 mM, respectively. Total S is determined
by ICP-OES independent of its redox state. In pure OPC system investigated, S is present in the oxidized form as sulphate.
B. Lothenbach, F. Winnefeld / Cement and Concrete Research 36 (2006) 209–226212
S, Si, Al and hydroxide concentration are consistent with the
observations reported by other authors [8,13–15]. The Ca,
Si, Al, and hydroxide concentrations reported in the
literature are comparable with each other and with our
results, while K, Na and S concentrations differ depending
on the composition of cement and the water / cement ratio
used. However, the pore solution development follows in all
cases roughly the same trends.
Thermodynamic calculations (see details below) indicate
that during the first hours, the pore solution of this cement is
in equilibrium with anhydrite, and thus oversaturated with
respect to gypsum (Fig. 2). A relatively slow gypsum
precipitation rate at low oversaturation ratios [16]—coupled
with the calcium and sulphate consumption by the precip-
itation of ettringite—could explain the continued coexis-
0
5
10
15
20
25
30
0 50 100 150 200 250SO4 [mM]
Ca
[mM
]
CaSO4
CaSO4 2H2O
Fig. 2. Measured calcium, sulphate, and hydroxide concentrations in the pore solu
(CaSO4I2H2O), anhydrite (CaSO4) and portlandite (Ca(OH)2) in the pore solution
tence of gypsum and anhydrite, as observed in the XRD
data, during the first hours of cement hydration. Similarly,
the solutions are oversaturated with respect to portlandite
(Fig. 2), ettringite and syngenite as the release of Ca and Al
from the hydration of the clinker phases into the solution is
faster than the precipitation of these solids from the
modestly oversaturated solutions. Oversaturation of cemen-
titious pore solutions with respect to portlandite, gypsum,
ettringite and/or syngenite during the early cement hydration
has been observed in several previous studies [4,8,13,17].
The concentrations of a number of other ‘‘trace’’
elements were also measured in the cement pore solutions
(Table 3). Li shows a similar increase with time as observed
for Na and K. The concentrations of Sr and Ba decrease
after 1 day as observed also for Ca. Similarly, the
0
5
10
15
20
25
30
0 50 100 150 200 250OH- [mM]
Ca
[mM
]
Ca(OH)2
0.02
0.5h
1h1.5-7 h
tion during the first 7 h compared with the calculated solubility of gypsum
of OPC.

B. Lothenbach, F. Winnefeld / Cement and Concrete Research 36 (2006) 209–226 213
concentrations of Mo and Cr, which under these alkaline
conditions are only likely to be present in solution as
MoO42� and CrO4
2�, both decrease after 1 day. Both MoO42�
and CrO42�, are expected to show similar trends in their
concentrations as S, as they can substitute for SO42� in AFt
and AFm phases [18–20] due to their identical charge,
similar structure and comparable ionic radii.
4. Modelling approach
When OPC is brought into contact with water, the
soluble alkali sulphates dissolve readily releasing K, Na and
S into the solution. Less soluble solids such as gypsum,
anhydrite, and calcite dissolve partially until equilibrium
with the pore solutions is reached. In addition, the slow
hydration of the clinker phases releases continuously Ca, Si,
Al, Fe and (hydr)oxide into the solution. Si and Ca react to
precipitate as C-S-H phase, while Al and Fe react with the
hydroxide, S, C and Ca present to yield AFt, AFm or other
hydroxide phases. The dissolution rate of the clinker phases
determines the amount of Ca, Al, Fe, Si and hydroxide
released into the solution and thus the rate of the
precipitation of AFt and AFm, C-A-H and C-S-H phases.
Thus, the model used is based
(i) On the measured composition of the OPC used in this
work (cf. Tables 1 and 2),
(ii) On the calculated dissolution rates of the clinker
phases as kinetic input, and
(iii) On using the Gibbs free energy minimisation program
GEMS [21] together with the internally consistent
thermodynamic data set of [22] expanded with addi-
tional data for solids that are expected to form under
cementitious conditions (thermodynamic constants
used are summarized in the Appendix).
Table 4
Parameters from Parrot and Killoh [26] used to calculate the hydration of
the individual clinker phases as a function of time
Parametera Clinkers
Alite Belite Aluminate Ferrite
K1 1.5 0.5 1.0 0.37
N1 0.7 1.0 0.85 0.7
K2 0.05 0.006 0.04 0.015
K3 1.1 0.2 1.0 0.4
N3 3.3 5.0 3.2 3.7
a All parameters from Ref. [26] for OPC.
4.1. Modelling the dissolution of the cement clinker phases
The hydration of cements can be assumed to take place via
dissolution and precipitation processes. Different models
exist to describe the hydration and/or dissolution rates of the
phases in Portland cements. One can distinguish between
models which include both dissolution and precipitation
reactions, e.g. Refs. [23,24], and models which are based on
the dissolution reactions only [25–28]. The latter authors
derived (based on quantitative X-ray measurements) empiri-
cal expressions which estimate the degree of dissolution of
each clinker mineral as a function of time; the differences
between the results of these four different approaches are
generally rather small. However, the mathematical expres-
sions used by Refs. [25,27,28] imply that essentially no
dissolution of any of the clinker phases occurs during the first
few hours, while the approach of Parrot and Killoh [26] has
no such restrictions and describes the rate R of the hydration
of the individual clinker phases by a set of equations, where
the lowest value of R at the time t is considered as the rate
controlling step:
nucleation and growth
Rt ¼K1
N1
1� atð Þ � ln 1� atð Þð Þ 1�N1ð Þor ð1Þ
diffusion Rt ¼K2 � 1� atð Þ2=3
1� 1� atð Þ1=3or ð2Þ
Rt ¼ K3 � 1� atð ÞN3 ð3Þ
The degree of hydration a at time t (in days) is then
expressed as at=at� 1+Dt IRt� 1. In this paper, the empiri-
cal expressions (Eqs. (1) (2) (3)) as given by Parrot and
Killoh [26] are used together with their values of K1, N1,
K2, K3 and N3 as compiled in Table 4. The influence of w /c
according to f(w /c)= (1+4.444* (w /c)�3.333*at)4; for
at >1.333*(w /c) [26] as well as the influence of the
surface area on the initial hydration is included using the
data given in Parrot and Killoh [26]. The set of equations
describes the progress of dissolution in OPC well as can
be seen by comparing the calculated progress of dis-
solution with the results of our semi-quantitative XRD
results (Fig. 3).
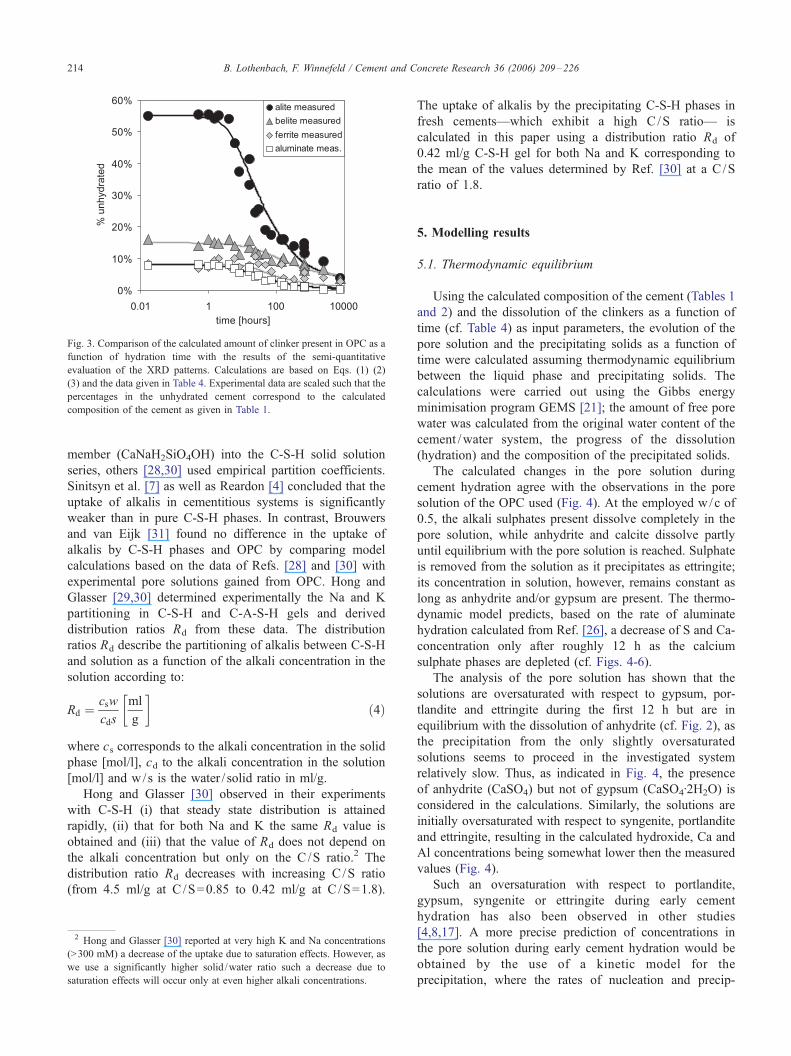
4.2. Release and uptake of alkalis, sulphate and magnesium
during hydration
In cement clinkers some substitution of Ca, Si, Al, and
Fe by Na, K, Mg, Fe, Al, P or S is often observed [10].
These elements associated with clinker phases are released
into the solution only upon the dissolution of the respective
clinker phase. For the model calculations the distribution of
K, Na, Mg and S between the clinker phases is taken into
account as described in Taylor [10] (cf. Table 2).
The alkalis released from the dissolution of the alkali
sulphates and during the slow dissolution of the clinkers,
partition between the solution and the precipitating C-S-H
phases. The quantification of the amount of alkalis taken up
by the C-S-H phases has been discussed by different authors
[3,4,7,28–30]. While Sinitsyn et al. [7] modelled the Na
uptake by C-S-H by the introduction of a Na-Ca-hydrate end
0%
10%
20%
30%
40%
50%
60%
0.01 1 100 10000time [hours]
% u
nhyd
rate
dalite measured
belite measured
ferrite measured
aluminate meas.
Fig. 3. Comparison of the calculated amount of clinker present in OPC as a
function of hydration time with the results of the semi-quantitative
evaluation of the XRD patterns. Calculations are based on Eqs. (1) (2)
(3) and the data given in Table 4. Experimental data are scaled such that the
percentages in the unhydrated cement correspond to the calculated
composition of the cement as given in Table 1.
B. Lothenbach, F. Winnefeld / Cement and Concrete Research 36 (2006) 209–226214
member (CaNaH2SiO4OH) into the C-S-H solid solution
series, others [28,30] used empirical partition coefficients.
Sinitsyn et al. [7] as well as Reardon [4] concluded that the
uptake of alkalis in cementitious systems is significantly
weaker than in pure C-S-H phases. In contrast, Brouwers
and van Eijk [31] found no difference in the uptake of
alkalis by C-S-H phases and OPC by comparing model
calculations based on the data of Refs. [28] and [30] with
experimental pore solutions gained from OPC. Hong and
Glasser [29,30] determined experimentally the Na and K
partitioning in C-S-H and C-A-S-H gels and derived
distribution ratios Rd from these data. The distribution
ratios Rd describe the partitioning of alkalis between C-S-H
and solution as a function of the alkali concentration in the
solution according to:
Rd ¼csw
cds
ml
g
��ð4Þ
where cs corresponds to the alkali concentration in the solid
phase [mol/l], cd to the alkali concentration in the solution
[mol/l] and w/s is the water / solid ratio in ml/g.
Hong and Glasser [30] observed in their experiments
with C-S-H (i) that steady state distribution is attained
rapidly, (ii) that for both Na and K the same Rd value is
obtained and (iii) that the value of Rd does not depend on
the alkali concentration but only on the C /S ratio.2 The
distribution ratio Rd decreases with increasing C/S ratio
(from 4.5 ml/g at C /S=0.85 to 0.42 ml/g at C /S=1.8).
2 Hong and Glasser [30] reported at very high K and Na concentrations
(>300 mM) a decrease of the uptake due to saturation effects. However, as
we use a significantly higher solid /water ratio such a decrease due to
saturation effects will occur only at even higher alkali concentrations.
The uptake of alkalis by the precipitating C-S-H phases in
fresh cements—which exhibit a high C/S ratio— is
calculated in this paper using a distribution ratio Rd of
0.42 ml/g C-S-H gel for both Na and K corresponding to
the mean of the values determined by Ref. [30] at a C/S
ratio of 1.8.
5. Modelling results
5.1. Thermodynamic equilibrium
Using the calculated composition of the cement (Tables 1
and 2) and the dissolution of the clinkers as a function of
time (cf. Table 4) as input parameters, the evolution of the
pore solution and the precipitating solids as a function of
time were calculated assuming thermodynamic equilibrium
between the liquid phase and precipitating solids. The
calculations were carried out using the Gibbs energy
minimisation program GEMS [21]; the amount of free pore
water was calculated from the original water content of the
cement /water system, the progress of the dissolution
(hydration) and the composition of the precipitated solids.
The calculated changes in the pore solution during
cement hydration agree with the observations in the pore
solution of the OPC used (Fig. 4). At the employed w/c of
0.5, the alkali sulphates present dissolve completely in the
pore solution, while anhydrite and calcite dissolve partly
until equilibrium with the pore solution is reached. Sulphate
is removed from the solution as it precipitates as ettringite;
its concentration in solution, however, remains constant as
long as anhydrite and/or gypsum are present. The thermo-
dynamic model predicts, based on the rate of aluminate
hydration calculated from Ref. [26], a decrease of S and Ca-
concentration only after roughly 12 h as the calcium
sulphate phases are depleted (cf. Figs. 4-6).
The analysis of the pore solution has shown that the
solutions are oversaturated with respect to gypsum, por-
tlandite and ettringite during the first 12 h but are in
equilibrium with the dissolution of anhydrite (cf. Fig. 2), as
the precipitation from the only slightly oversaturated
solutions seems to proceed in the investigated system
relatively slow. Thus, as indicated in Fig. 4, the presence
of anhydrite (CaSO4) but not of gypsum (CaSO4I2H2O) is
considered in the calculations. Similarly, the solutions are
initially oversaturated with respect to syngenite, portlandite
and ettringite, resulting in the calculated hydroxide, Ca and
Al concentrations being somewhat lower then the measured
values (Fig. 4).
Such an oversaturation with respect to portlandite,
gypsum, syngenite or ettringite during early cement
hydration has also been observed in other studies
[4,8,17]. A more precise prediction of concentrations in
the pore solution during early cement hydration would be
obtained by the use of a kinetic model for the
precipitation, where the rates of nucleation and precip-

0
100
200
300
400
500
600
700
800
0.01 0.1 1 10 100 1000 10000time [hours]
[mM]
K OH-
Na SCaSO4,Ca(OH)2
C-S-H, ettringite, brucite, syngenite
C-S-H, Ca(OH)2, ettringite, calciummonocarbonate,
hydrotalcite
K
S
Na
OH-
Fig. 4. Comparison of the modelled evolution of the pore solution during the hydration of OPC assuming thermodynamic equilibrium with the concentrations
measured in the pore solution of OPC. The solid phases in equilibrium with the calculated pore solution are indicated in italics. Note that free concentrations are
only given for hydroxide, while all other concentrations refer to total dissolved elemental concentrations.
B. Lothenbach, F. Winnefeld / Cement and Concrete Research 36 (2006) 209–226 215
itation could be calculated as a function of the relative
oversaturation in the solution for each of the solids. Due
to the lack of kinetic data for many of the solids, a more
simple approach has been used here, as discussed in the
next section, assuming during the first 12 h of the cement
hydration the precipitation of somewhat ‘‘less crystalline’’
(more soluble) solids than the pure standard phases,
which is equivalent to the assumption of a constant
degree of oversaturation.
5.2. Oversaturation during the first 12 h
Based on the comparison of experimental and modelled
results for Ca and hydroxide, a constant (over)saturation
ratio= (IAP /KS0)1/n of 100.15 was applied to all calculations
referring to the first 12 h, increasing the solubility product
of all precipitating solids (i.e. portlandite, gypsum, syngen-
ite, brucite, tobermorite-II, jennite, ettringite and Fe-
ettringite) by n times 0.15 log units, where n corresponds
to the number of ions in the formula unit of the respective
mineral and IAP to the ion activity product (for reactions
and the equilibrium constants cf. Table A.1). Thus,
assuming the precipitation of less crystalline and more
soluble solids during the first 12 h, a better agreement
between the calculated Ca, hydroxide and S concentrations
in the pore solution and the measured data is obtained (Fig.
5) and no gypsum is predicted to precipitate under these
conditions. Only the calculated Al and Fe concentrations
are still lower than the measured concentrations during the
first 12 h, indicating an even stronger oversaturation with
respect to ettringite than considered in the calculations. A
similar large oversaturation relative to ettringite has also
been observed by Rothstein et al. [8] during the first 6 h of
their experiments.
The modelled composition of the pore solution (Fig. 5)
is constant during the first 12 h and dominated by the
presence of K, S, and hydroxide, as observed in the
experimental data. Also the calculated concentrations Na,
Ca and Si concentrations agree well with the measured
concentrations (Fig. 5). The model calculations predict the
presence of anhydrite and calcite as well as the precipitation
of portlandite, C-S-H, ettringite and small amounts of
brucite during the first few hours (Fig. 6) which agrees well
with observations made in the TGA and XRD analysis (cf.
Fig. 1). Only brucite has not been detected, which might be
due to the low fraction of brucite likely to be present (<1%)
or due to the uptake of Mg by the newly forming C-S-H
phase (which is not considered in the model).
5.3. Solid and liquid phase after 1 day
The prediction of K and Na concentrations as a function
of time reproduces the measured data very well (Fig. 5).
The concept of alkali release, pore solution decrease and
uptake of alkalis by using the distributions ratio determined
by Hong and Glasser [30] for C-S-H describes the
measured K and Na concentrations in the presence of
OPC very well. This suggests that C-S-H is in fact the
main binder of alkalis in hydrating OPC as already
suggested by Brouwers and van Eijk [31] based on data
of another OPC. The concentration of hydroxide after 1
day or longer is dominated by the concentrations of K and
Na present and the agreement between measured and
predicted values is excellent.
The thermodynamic modelling in combination with the
calculated hydration rates [26] predicts the depletion of
anhydrite and gypsum after half a day and a drastic decrease
of the sulphate concentrations in the pore solutions as

0
100
200
300
400
500
600
700
800
[mM]
K OH-
Na SCaSO4,Ca(OH)2
C-S-H, ettringite, brucite
C-S-H, Ca(OH)2, ettringite, calciummonocarbonate,
hydrotalcite
K
S
Na
OH-
0
10
20
30
40
50
60
70
80
90
100
[mM]
Na S Ca
CaSO4,Ca(OH)2
C-S-H, ettringite, brucite
SCa
Na
C-S-H, Ca(OH)2, ettringite, calciummonocarbonate,
hydrotalcite
0
0.1
0.2
0.3
0.4
0.5
0.6
0.7
0.8
0.9
1
0.01 0.1 1 10010 1000 10000time [hours]
[mM]
Si
Al
Fe
CaSO4
Ca(OH)2
C-S-H ettringite brucite
C-S-HCa(OH)2,
ettringite, calciummonocarbonate,
hydrotalcite
Al
Si
Fe
CO3
Fig. 5. Comparison of the modelled evolution of the pore solution during the hydration of OPC assuming during the first 12 h the precipitation of less stable
solids (see text) with the concentrations measured in the pore solution of OPC. To ease readability the data are plotted using different concentrations scales.
Measured Fe concentrations after 24 h or longer are below the detection limit and thus not indicated in the graph. The solid phases in equilibrium with the
calculated pore solution are indicated in italics.
B. Lothenbach, F. Winnefeld / Cement and Concrete Research 36 (2006) 209–226216
ettringite continues to precipitate until sulphate in the
solution is depleted (Figs. 5 and 6). At the same time, as
the electroneutrality of the solution is maintained, hydroxide
concentration and thus the pH value increases drastically.
This leads to a decrease in Ca concentration due to the
common ion effect (portlandite equilibrium) while the
calculated Al, Si and also Fe concentrations increase. The
calculated Si, Ca, S and Al concentrations after 1 day or
longer agree well with the experimental findings (Fig. 5)
while the calculated concentrations of Fe and Mg with 0.2
0
10
20
30
40
50
60
[g/1
00 g
sol
id]
pore solution (TGA)
portlandite (TGA)
portlandite (free lime)
alite
belite
C-S-H(ss)
Ca(OH)2
pore solution
//
//
0
2
4
6
8
10
12
14
16
0.1 1 10 100 1000 10000
time (hours)
[g/1
00 g
sol
id]
CaSO4
ettringite (ss)
calcium monocarbonate (ss)
ferrite
aluminate
OH-hydrotalciteCaCO3
brucite//
Fig. 6. Modelled evolution of the solid phases during the hydration of OPC (w/c=0.5) assuming thermodynamic equilibrium with the aqueous phase as given
in Fig. 5 compared with the experimentally determined amount of pore solution and portlandite. In order to ease the comparison with XRD and TGA data, the
values refer to 100 g of solid; i.e. the mass of the solid phase increases with time as more and more hydration product precipitates and the amount of pore
solution is reduced (ss=solid solution).
4 Note that the quantities given in Fig. 6—in order to ease the comparison
with the experimental evidence from the XRD and TGA data—refer to
weight relative to 100 g of solid phase (including also the newly formed
B. Lothenbach, F. Winnefeld / Cement and Concrete Research 36 (2006) 209–226 217
AM and 1 nM, respectively, are well below the respective
detection limits of these elements in the experimental pore
solutions (Table 3).
The calculations also predict carbonate concentrations of
up to 0.7 mM in the pore solution. Carbonate originates
principally from calcite in the cement. In the calculations, no
atmospheric CO2 was assumed to enter into the system. As
the pore solutions were not analysed for carbonate, the
calculations cannot be verified against experimental data.
The changes in the composition of pore solution after
half a day lead also to changes in the modelled phase
assemblage; calcium monocarbonate3 and hydrotalcite are
predicted to precipitate while at the same time calcite is
consumed (Fig. 6). With time, more and more C-S-H and
portlandite are predicted to form while the precipitation of
ettringite stops after roughly one day once all of the soluble
sulphate (with exception of the very small portion still
associated with the unhydrated clinker phases) is con-
3 The expression calcium monocarbonate is used in this paper for the
solid solution between calcium monocarboaluminate and its Fe-containing
analogue: C4(A,F)CH11, see Appendix.
sumed.4 These model predictions agree well with the TGA
and XRD data of the experimental investigations (Fig. 1),
where the amount of ettringite slightly decreases after 1
day, while the formation of C-S-H, portlandite, and AFm
phase in the cement continues.
The slow dissolution of calcite as observed in the XRD
data (Fig. 1) indicates that the observed AFm phase could in
fact be calcium monocarbonate, even though calcium
monocarboaluminate could be identified only after 100
days in the XRD data. The thermodynamic calculations
show that calcium monocarbonate should form in preference
to calcium monosulphoaluminate or other AFm phases in
cementitious systems containing carbonates. This is in
agreement with the experimental findings of Kuzel [32],
hydration products) and not to unhydrated cement paste; i.e. the absolute
amount of ettringite remains more or less constant after 24 h, the relative
amount, however, (as shown in Fig. 6) is decreasing as the weight of the
solid fraction in the cement increases due to the precipitation of the
hydration products.

B. Lothenbach, F. Winnefeld / Cement and Concrete Research 36 (2006) 209–226218
who showed that in the presence of sufficient carbonate,
calcium mono-or hemicarboaluminate formation prevents
the formation of calcium monosulphoaluminate from
ettringite. However, even though thermodynamic modelling
predicts only the precipitation of calcium monocarbonate, it
cannot be excluded that other AFm phases may also
precipitate as the thermodynamic models which describe
the solid solution behaviour of the different AFm phases are
only a rough approximation (for a more detailed discussion
of the interaction of the AFm phases, see Appendix) and the
experimental evidence is very limited. The model calculates
significant solid solutions (Al, Fe) for precipitated ettringite
and calcium monocarbonate.
It is interesting to note, that the thermodynamic calcu-
lations also indicate, that in the presence of calcite, calcium
monocarboaluminate is more stable than the hydrogarnet
phases and thus no hydrogarnet is expected to form. In the
absence of calcite (and other carbonate sources), thermody-
namically stable hydrogarnet phases should precipitate. If
we neglect the formation of hydrogarnet phases for kinetic
reasons, an AFm solid solutions of C4(A,F)SH12,
C4(A,F)H13, C2(A,F)H8 and mainly C2(A,F)SH8 is predicted
to precipitate in the cement water system (Fig. 7). However,
thermodynamic modelling also shows that upon carbona-
tion, these AFm phases will be replaced by calcium
monocarbonate as has been observed by Kuzel [32] in
experiments with carbonate-free Portland cements.
MgO present in cementitious systems is predicted to
precipitate initially as brucite (Mg(OH)2) and later to
convert to hydrotalcite (Fig. 6), once the soluble sulphates
have been exhausted. Whether brucite and hydrotalcite are
actually formed or whether most of the Mg is incorporated
into the C-S-H phase is difficult to predict. Taylor [10],
however, concluded, based on TEM and X-Ray evidence,
that Mg is generally associated with Al and Fe to form
hydrotalcite-like phases.
0
2
4
6
8
10
12
14
16
18
20
0.1 1 10
time (h
[g/1
00 g
sol
id]
CaSO4
ferrite
aluminate
brucite//
//
Fig. 7. Modelled evolution of the solid phases during the hydration of OPC
The good agreement between calculations and exper-
imental results indicates that the most important processes
and phases have been included in the model system even
though some of their thermodynamic data had to be
estimated or are completely missing. In particular, we lack
data for the Fe-containing AFm and AFt-phases as well as
for the hydrotalcite and hydrogarnets. In addition, we lack
data for a thermodynamic description of the uptake of ions
such as Na, K, Al, Fe, Mg and sulphate in C-S-H, which
may limit the applicability of the model particularly for
systems where a more significant uptake of different ions in
the C-S-H structure is observed (e.g. in slag systems).
6. Conclusions and outlook
A thermodynamic model is developed and applied to
calculate the composition of the pore solution and the
development of the solid phase during hydration. A simple
kinetic model for the rates of consumption of the individual
clinker phases is used as time dependent input.
The modelled data compare well with the measured
compositions of the pore solutions obtained from OPC as
well as with TGA and XRD data on the solid phases. The
good agreement between calculations and experimental
results indicates that chemical equilibrium calculations can
adequately predict the hydrates formed in cement systems
and that all of the important phases were included in our
model even though some thermodynamic data had to be
estimated or are still missing. The results serve as an
important reminder of the fact that calcium monocarboa-
luminate is thermodynamically more stable than hydro-
garnet or other AFm phases under typical cement
conditions. Only in the absence of carbonate, are either
hydrogarnets or other AFm phases predicted to precipitate
or is ettringite expected to disappear.
100 1000 10000
ours)
ettringite (ss)
AFm (ss)
OH-hydrotalcite
(w /c=0.5) assuming the absence of carbonate (ss=solid solution).
B. Lothenbach, F. Winnefeld / Cement and Concrete Research 36 (2006) 209–226 219
Our thermodynamic model could also be used for
predicting the influence of changes in the original cement
composition (such as the presence or absence of calcite) and
the environment on the hydrate assemblage and thus the
properties of the resulting hardened cement pastes. Ther-
modynamic modelling can provide a deeper understanding
of the interactions between the different components and
help with further optimisation of complex, multicomponent
cementing systems.
Acknowledgements
The active support of Luigi Brunetti from the section
concrete / construction chemistry, EMPA, during the labo-
Table A.1
Chemical equilibrium constants used for modelling the composition of the pore s
Aqueous species
Ca2++H2OSCaOH++H+
Ca2++SO42�
SCaSO40
Ca2++HCO3�SCaHCO3
+
Ca2++HCO3�SCaCO3
0+H+
Ca2++H2SiO42�
SCaH2SiO40
Ca2++H3SiO4�SCaH3SiO4
+
Mg2++H2OSMgOH++H+
Mg2++SO42�
SMgSO40
Mg2++HCO3�SMgHCO3
+
Mg2++HCO3�SMgCO3
0+H+
Mg2++H2SiO42�
SMgH2SiO40
Mg2++H3SiO4�SMgH3SiO4
+
Na++H2OSNaOH0+H+
Na++SO42�
SNaSO4�
Na++HCO3�SNaHCO3
0
Na++HCO3�SNaCO3
�+H+
K++H2OSKOH0+H+
K++SO42�
SKSO4�
H2OSOH�+H+
HCO3�SCO3
2�+H+
HCO3�+H+
SH2CO30
HCO3�+H+
SCO2(g)+H2O
Al3++H2OSAl(OH)2++H+
Al3++2H2OSAl(OH)2++2H+
Al3++3H2OSAl(OH)30+3H+
Al3++4H2OSAl(OH)4�+4H+
Al3++H3SiO4�SAlSiO(OH)3
2+
Al(OH)4�+H4SiO4
0SAlSiO(OH)6
�+H2O
Al3++SO42�
SAlSO4+
Al3++2SO42�
SAl(SO4)2�
Fe3++H2OSFe(OH)2++H+
2Fe3++2H2OSFe2(OH)24++2H+
3Fe3++4H2OSFe3(OH)45++4H+
Fe3++2H2OSFe(OH)2++2H+
Fe3++3H2OSFe(OH)30+3H+
Fe3++4H2OSFe(OH)4�+4H+
Fe3++H3SiO4�SFeH3SiO4
2+
Fe3++H++SO42�
SFeHSO42+
Fe3++SO42�
SFeSO4+
Fe3++2SO42�
SFe(SO4)2�
SiO2(OH)22�+H+
SSiO(OH)3�
SiO2(OH)22�+2H+
SSi(OH)40
ratory work, the careful analysis of R. Figi, P. Lienemann
and their co-workers from the section inorganic chem-
istry/characterisation of solids, EMPA, are gratefully
acknowledged.
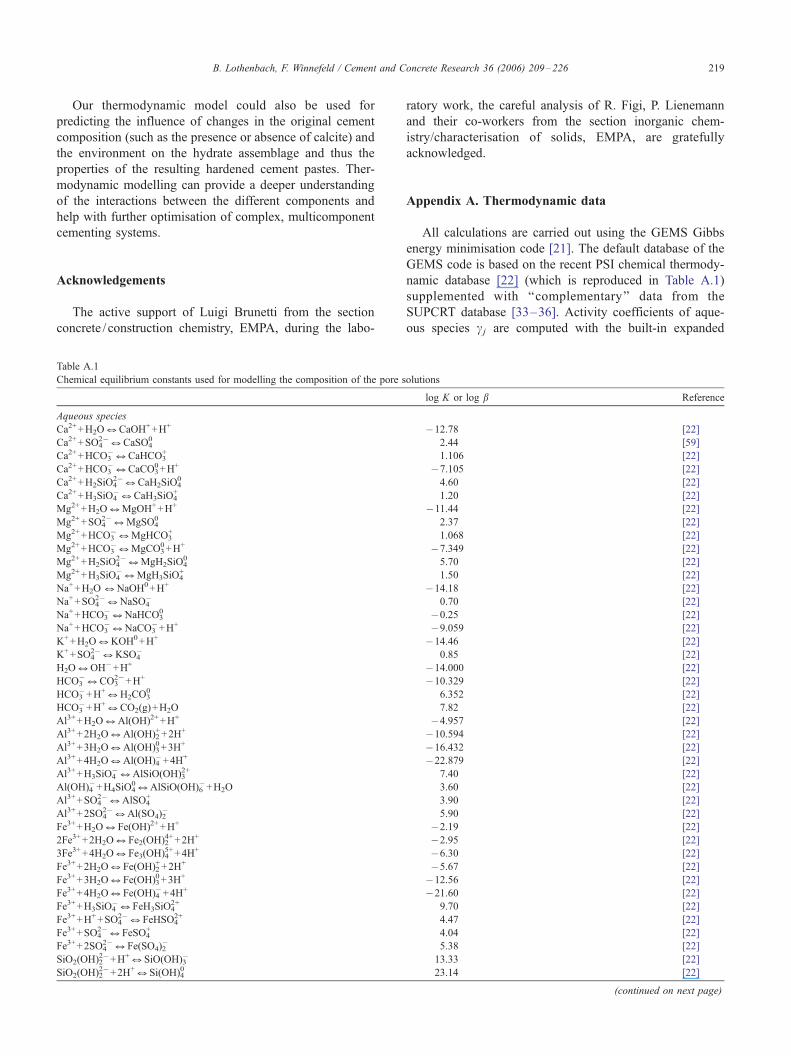
Appendix A. Thermodynamic data
All calculations are carried out using the GEMS Gibbs
energy minimisation code [21]. The default database of the
GEMS code is based on the recent PSI chemical thermody-
namic database [22] (which is reproduced in Table A.1)
supplemented with ‘‘complementary’’ data from the
SUPCRT database [33–36]. Activity coefficients of aque-
ous species cj are computed with the built-in expanded
olutions
log K or log b Reference
�12.78 [22]
2.44 [59]
1.106 [22]
�7.105 [22]
4.60 [22]
1.20 [22]
�11.44 [22]
2.37 [22]
1.068 [22]
�7.349 [22]
5.70 [22]
1.50 [22]
�14.18 [22]
0.70 [22]
�0.25 [22]
�9.059 [22]
�14.46 [22]
0.85 [22]
�14.000 [22]
�10.329 [22]
6.352 [22]
7.82 [22]
�4.957 [22]
�10.594 [22]
�16.432 [22]
�22.879 [22]
7.40 [22]
3.60 [22]
3.90 [22]
5.90 [22]
�2.19 [22]
�2.95 [22]
�6.30 [22]
�5.67 [22]
�12.56 [22]
�21.60 [22]
9.70 [22]
4.47 [22]
4.04 [22]
5.38 [22]
13.33 [22]
23.14 [22]
(continued on next page)

Table A.1 (continued)
Minerals1 Gf- [kJ/mol]2 Reactions log KS0 Reference
Carbonate or sulphate minerals
Calcite �1129.176 CaCO3(s)+H+SCa2+HCO3
� 1.849 [21,22]
Magnesite �1029.275 MgCO3(s)+H+SMg2+HCO3
� 2.041 [21,22]
Anhydrite �1322.422 CaSO4(s)SCa2++SO42� �4.41 [59]
Gypsum �1797.892 CaSO42H2O(s)SCa2++SO42�+2H2O �4.60* [59]
Syngenite �2884.91 K2Ca(SO4)2H2O(s)SCa2++2K++2SO42�+H2O �7.2* Calculated3
C-S-H solid solutions and portlandite
Silica, amorphous4 �848.903 SiO2(am)+2H2OSSi(OH)4 �2.713 [21,22]
Tobermorite-I4 �4370.50 Ca(OH)2)2(SiO2)2.4I(H2O)2(tob-I)+0.4H2OS2Ca2+
+2.4SiO(OH)3�+1.6OH�
�18.2 Calculated3
Tobermorite-II5 �3277.87 Ca(OH)2)1.5(SiO2)1.8I(H2O)1.5(tob-II)+0.3H2OS1.5Ca2+
+1.8SiO(OH)3�+1.2OH�
�13.65* Calculated3
Jennite5 �2353.70 Ca(OH)2)1.5(SiO2)0.9I(H2O)0.9(jen)S1.5Ca2+
+0.9SiO(OH)3�+2.1OH�
�11.85* Calculated3
Portlandite �897.013 Ca(OH)2(s)+2H+SCa2++2H2O 22.80* [21,22]
AFt-phases
Ettringite6 �15207.02 Ca6Al2(SO4)3(OH)12I26H2O(s)S6Ca2++2Al(OH)4�
+3SO42�+4OH�+26H2O
�45.09* Calculated3
Fe-ettringite6 �14313.22 Ca6Fe2(SO4)3(OH)12I26H2O(s)S6Ca2++2Fe(OH)4�
+3SO42�+4OH�+26H2O
�49.41* Estimated7
Tricarboaluminate6 �14535.96 Ca6Al2(CO3)3(OH)12I26H2O(s)S6Ca2++2Al(OH)4�
+3CO32�+4OH�+26H2O
�41.3 Calculated3
AFm-phases
C4AH138 �7327.46 4CaOIAl2O3I13H2O(s)S4Ca2++2Al(OH)4
�+6OH�+6H2O �25.56 [49]
C4FH138 �6433.66 4CaOIFe2O3I13H2O(s)S4Ca2++2Fe(OH)4
�+6OH�+6H2O �29.88 Estimated7
C2AH88 �4812.75 2CaOIAl2O3I8H2O(s)S2Ca2++2Al(OH)4
�+2OH�+3H2O �13.56 [49]
C2FH88 �3918.95 2CaOIFe2O3I8H2O(s)S2Ca2++2Fe(OH)4
�+2OH�+3H2O �17.88 Estimated7
C2ASH88 �5709.63 2CaOIAl2O3ISiO2I8H2O(s)S2Ca2++2Al(OH)4
�
+Si(OH)3�+OH�+2H2O
�20.49 Calculated3
C2FSH88 �4815.83 2CaOIFe2O3ISiO2I8H2O(s)S2Ca2++2Fe(OH)4
�
+Si(OH)3�+OH�+2H2O
�24.80 Estimated7
C4ASH128 �7769.60 3CaOIAl2O3I(CaSO4)I12H2O(s)S4Ca2++2Al(OH)4
�
+SO42�+4OH�+6H2O
�27.70 Calculated3
C4FSH128 �6875.80 3CaOIFe2O3I(CaSO4)I12H2O(s)S4Ca2++2Fe(OH)4
�
+SO42�+4OH�+6H2O
�32.02 Estimated7
C4ACH119 �7337.46 3CaOIAl2O3I(CaCO3)I11H2O(s)S4Ca2++2Al(OH)4
�
+CO32�+4OH�+5H2O
�31.47 Calculated3
C4FCH119 �6443.66 3CaOIFe2O3I(CaCO3)I11H2O(s)S4Ca2++2Fe(OH)4
�
+CO32�+4OH�+5H2O
�35.79 Estimated7
C4AC0.5H1210 �7339.51 3CaOIAl2O3(Ca(OH)2)0.5I(CaCO3)0.511.5H2O(s)
S4Ca2++2Al(OH)4�+0.5CO3
2�+5OH�+5.5H2O
�29.75 Calculated3
C4FC0.5H1210 �6445.72 3CaOIFe2O3(Ca(OH)2)0.5(CaCO3)0.511.5H2O(s)
S4Ca2++2Fe(OH)4�+0.5CO3
2�+5OH�+5.5H2O
�34.07 Estimated7
Hydrogarnets
C3AH611 �5019.34 3CaOIAl2O3I6H2O(s)S3Ca2++2Al(OH)4
�+4OH� �22.46 [49]
C3FH611 �4125.53 3CaOIFe2O3I6H2O(s)S3Ca2+2Fe(OH)4
�+4OH� �26.78 Estimated7
CAH10
CAH10 �4622.332 CaOIAl2O3I10H2O(s)SCa2++2Al(OH)4�+6H2O �7.49 [53]
Aluminum and iron hydroxides
Al(OH)3(am.) �1143.212 Al(OH)3(am)+OH�SAl(OH)4
� 0.24 [53]
Gibbsite �1150.986 Al(OH)3(s)+3H+SAl3++3H2O 7.76 [21,22]
Fe(OH)3(am.) �700.194 Fe(OH)3(am)+3H+SFe3++3H2O 5.00 [21,22]
Fe(OH)3(microcr) �711.610 Fe(OH)3(mic)+3H+SFe3++3H2O 3.00 [21,22]
B. Lothenbach, F. Winnefeld / Cement and Concrete Research 36 (2006) 209–226220

Table A.1 (continued)
Minerals1 Gf- [kJ/mol]2 Reactions log KS0 Reference
Magnesium-phases
Brucite �832.227 Mg(OH)2(s)+2H+SMg2++2H2O 16.84* [21,22]
OH-hydrotalcite (cr) �6394.56 Mg4Al2(OH)14I3H2O(cr)S4Mg2++2Al(OH)4�
+6OH�+3H2O
�56.02 Calculated3
CO3-hydrotalcite �6342.97 Mg4Al2(OH)12ICO3I2H2O(s)S4Mg2+
+2Al(OH)4�+CO3
2�+4OH�+2H2O
�51.14 [58]
Reactions constants for aqueous species as compiled in [22].1Cement chemistry short-hand notations were used, where applicable C=CaO; M=MgO; S=SiO2; A=Al2O3; F=Fe2O3; H=H2O; S=SO3; C=CO2;
2Gf-
values calculated from log KS0 values;3See text and Table A.3; 4, 5, 6, 8, 9, 10, 11Solid solutions; 7Estimated from the solubility of the Al-bearing analogues using
DHf-=�215.2 kcal/mol and DSf-=4.8 cal/mol/K (see text).
* For solids precipitating during the first 12 h, a higher solubility was assumed: gypsum: �4.30, syngenite: �6.45, portlandite: 23.25, tobermorite-II:
�12.98, jennite: �11.18, ettringite: �42.84, Fe-ettringite: �47.16 and brucite: 17.29.
B. Lothenbach, F. Winnefeld / Cement and Concrete Research 36 (2006) 209–226 221
extended Debye–Huckel equation in Truesdell–Jones form
with individual Kielland ion-size parameters ac- and
common third parameter bc [21]:
logcj ¼� Acz
2j
ffiffiI
p
1þ Bca-cffiffiI
p þ bcI
where zj denotes the charge of species j, I the effective
molal ionic strength and Ac and Bc are P,T-dependent
coefficients.
Thermodynamic data—with exception of the calcium
sulphate data—are taken from the recent PSI-GEMS data
set [21,22] supplemented with additional data for solids in
cementitious materials as compiled in Table A.1. Addi-
tional solubility products for solids are recalculated as far
as possible from experimental data published in the
literature using Gibbs energy minimisation modelling
[21]. In the few cases, where recalculation was not
possible, the solubility products were rearranged using
the auxiliary data from the respective source to refer to the
aqueous species Al(OH)4�, Fe(OH)4
�, SiO(OH)3�, and OH�
in order to minimize the influence of the different auxiliary
data sets.
A.1. C-S-H
C-S-H phases are modelled using the solid solution
model developed by Kulik and Kersten [37], where the C-S-
H system is described as a system of two concurrent solid
solution systems (cf. Fig. A.1):
(i) CSH-I solid solution system with the end-members
SiO2(am) and tobermorite (Tob-I: Ca(OH)2)2(SiO2)2.4I(H2O)2), and
(ii) CSH-II solid solution system with the end-members
jennite (Ca(OH)2)1.5(SiO2)0.9I(H2O)0.9) and tobermor-
ite (Tob-II: Ca(OH)2)1.5(SiO2)1.8I(H2O)1.5).
Using the solid solution model [37] and based on the data
of Greenberg and Chang [38], the respective solubility
products are refitted using the PSI chemical thermodynamic
database (Table A.1) for the best graphical fit to the
observed pH and dissolved concentrations of Ca and Si
(Fig. A.1). As already observed by Kulik and Kersten [37],
at high C /S ratios the Si concentrations are slightly
underestimated.
During the first hours and days of cement hydration,
the morphology of the precipitating C-S-H phases
changes markedly from the amorphous C-S-H via spongy
to needle like C-S-H type [39]. It is not clear, however,
whether also the C /S ratio of the solid and/or the
solubility of the morphologically distinct C-S-H phases is
changing. Using the solid solution model as described
above which is based on data gained in a C-S-H system
aged for several weeks [38], possibly underestimates the
solubility of C-S-H during the first few hours of cement
hydration.
A.2. Ettringite (AFt)
Reported solubility products for ettringite range from log
KS0=�43.13 to �46.43 (cf. Table A.2). The experimental
Al, S and Ca concentrations measured by Perkins and
Palmer [40] were used to recalculate the solubility product
of ettringite (cf. Table A.2), resulting in solubility products
of 10�45.23 and 10�44.95 for the dissolution and precip-
itation experiments, respectively. The calculated mean value
of 10�45.09 T 0.41 is in good agreement with other values
reported in the literature.
Tricarboaluminate (Ca6Al2(CO3)3(OH)12I26H2O), the
structural carbonate analogue of ettringite, is unstable
relative to calcium monocarboaluminate and calcite [41].
Pollmann and Kuzel [42] reported the extensive (but not
complete) formation of solid solutions between the sulphate,
hydroxide and carbonate ettringite end-members. The
sulphate containing ettringite is significantly more stable
than the OH or CO3 substituted ettringites; however, a
partial replacement of SO42� by CO3
2� and OH� is possible
[42]. Thermodynamic data describing the solubility of
CO32� substituted ettringite (tricarboaluminate) have been
calculated using the solubility measurements given in Ref.
[41] (cf. Table A.3).
For Fe-ettringite, which forms a solid solution with the
Al-bearing ettringite [10,43], no experimentally derived

0
5
10
15
20
25
0 0.5 1 1.5 2
Total C/S ratio in the system
Caaq,
Siaq [mM] or pH
refitted
Ca (experimental)
Si (experimental)
pH (experimental)
(A)
0
10
20
30
40
50
60
70
80
90
100
0 0.5 1 2
Total C/S ratio in the system
Mol
e fr
actio
n [%
]
SiO2(am)
Tobermorite-I
Tobermorite-II
Jennite
Portlandite
CSH-ICSH-II
(B)
1.5
Fig. A.1. (A) Comparison of pH values, aqueous Ca and Si concentrations calculated with the C-S-H model proposed by Ref. [37] using the refitted solubility
constants as given in Table A.1 with the experimental solubility results of Greenberg and Chang [38]. (B) Mole fractions of C-S-H solid solution endmembers
with the refitted data (Table A.1). The presence of portlandite is indicated by a horizontal line (out of scale).
B. Lothenbach, F. Winnefeld / Cement and Concrete Research 36 (2006) 209–226222
solubility data are available in the literature. Babushkin et
al. [44] estimated between ferric and aluminium hydrates
a constant difference in standard enthalpy and entropy of
�215.2 kcal/mol and 4.8 cal/mol/K, respectively. This
approach was applied to calculate the Gibbs free energies
and the solubility product of Fe-ettringite and other iron-
containing solids, resulting in a solubility product of
10�49.41 for Fe-ettringite Ca6Fe2(SO4)3(OH)12I26H2O (cf.
Table A.1).
Thaumasite Ca3Si(OH)6(SO4)(CO3)12I26H2O has a
structure similar to ettringite and is reported to form solid
solution with ettringites. However, reliable solubility data
for thaumasite were not available at the time this work was
done.
A.3. AFm phases
The AFm phases (C4(A,F)X2IyH2O, where X denotes
one formula unit of a single charged anion) occurring in
cements are mineralogically and chemically complex. Its
layer structure incorporates variable amounts of water as
well as anions such as hydroxyl, sulphate, silicon,
aluminate, or carbonate. Solid solutions between hydroxy-
and sulphate-AFm and Al- and Fe-containing compounds
are extensive [10,43,45,46], while solid solution formation
between calcium monocarboaluminate, calcium hemicar-
boaluminate and hydroxy- or sulphate-AFm is very limited
[45,47,48]. However, as only for the binary C2AH8–
C4AHx system a thermodynamic descriptions of the solid
solutions has been published [49], the adequate description
of the multicomponent AFm solid solution system present
in cement is not yet possible. As a rough approximation,
ideal solid solution behaviour has been assumed for all
AFm phases, except for calcium hemi- and calcium
monocarboaluminates, where no solid solution formation
was considered.
For modelling the solubility of the metastable Ca-
aluminates C2AH8 and C4AH13 (or C4AH19), the data
recently fitted by Berner and Kulik [49] are used. These data
are similar to the data reported by other authors (Table A.2),
consider the formation of an ideal solid solution between the
two endmembers and the solubility products can be used
without any further fitting as they have been calculated
using the same auxiliary database [21] as in this paper. For
calcium monosulphoaluminate (C4ASH12), a solubility
product of 10�27.7 was fitted using the data measured by
Jones [51] assuming the presence of C4ASH12 and an ideal
solution between the metastable endmembers C2AH8–
C4AH13 [49]. Solid solution formation between sulphate
and hydroxide-AFm have been observed mainly at the
sulphate-rich end of the series [45,46], while at the
hydroxide-AFm end—as in the experiments of Jones
[51]—two distinct phases seem to predominate. The
solubility products of calcium monosulphoaluminate deter-
mined from the data of Refs. [52] and [50] are somewhat
lower (cf. Table A.3), which might be caused by the partial
transformation of the metastable C4ASH12 initially present
to ettringite and C4AH13 in these experiments.
A solubility product of 10�20.49 for the AFm phase
gehlenite hydrate or stratlingite C2ASH8 (cf. Table A.3)
was calculated from the experimental data measured by
[3,50].
Considerable uncertainty exists in the literature concern-
ing the conditions for the existence of carboaluminate

Table A.2
Solubility products for solids in cementitious systems compiled from different literature sources
AFt AFm Hydrogarnets CAH10 Reference
Ettringite C6FS3H32 C4ASH12 C4FSH12 C4AH13 C4AH19 C4FH13 C2AH8 C2ASH8 C3AH6 C3FH6 CAH10
�25.50 �13.75 �22.30 [60]
�25.50 �13.75 �22.30 [61]
�44.00 �49.78 �28.19 �34.05 �27.92 �27.94 �33.78 �13.26 �20.33 �26.19 �5.47 [44]
�25.19 �13.78 �7.59 [62]
�25.19 �13.78 �21.91 �7.58 [63]
�25.16 �13.99 �22.83 �7.49 [53]
�43.13 �27.62 �27.49 �13.04 �19.95 [64]
�43.94 �29.25 �13.75 �23.13 [4]
�44.91 �23.13 [65]
�45.59 �20.57 �21.25 [3]
�44.44 [66]
�44.55 �29.43 �22.54 [67]
�25.4 �13.73 �22.61 [41]
�44.33 �20.53 [2]
�44.6 �29.43 �22.54 �30.36 [5]a
�44.0 �27.94 [6]
�46.43 [68]
�45.54 �28.02 �20.56 �21.20 [7]
�45.13 [20]
�44.90 [40]
�45.00 �29.43 [8]
�25.56 �13.56 �22.46 [49]
All solubility products refer to the solubility with respect to the species Al(OH)4�, Fe(OH)4
�, SiO(OH)3�, OH�, H2O, Ca
2+or SO42�. Where necessary, the
solubility products have been rearranged using the respective auxiliary data set.a Calculated by Ref. [5] using Gf- values from Ref. [44] and various other sources.
B. Lothenbach, F. Winnefeld / Cement and Concrete Research 36 (2006) 209–226 223
phases. Damidot et al. [41] found that calcium hemi-
carboaluminate (C4AC0.5H12) is stable only over a limited
range of CO2 activities, while the calcium monocarboalu-
minate (C4ACH11) is more stable and can exist also in the
presence of CaCO3. In the presence of carbonate,
hydroxy—and sulphate—AFm phases readily transform to
carboaluminate phases. The solubility products of calcium
monocarboaluminate (C4ACH11) and calcium hemicarboa-
luminate (C4AC0.5H12) have been calculated using the
solubility measurements given in Refs. [41,12] and [52]
(cf. Table A.3).
Again for the Fe-bearing analogues no experimentally
derived solubility data have been found in the literature.
Following the procedure outlined by Babushkin et al. [44], a
constant difference in standard enthalpy and entropy of
�215.2 kcal/mol and 4.8 cal/mol/K between ferric and
aluminium hydrates was used to calculate the respective
solubility products for C4FH13, C2FH8, C2FSH8, C4FSH12,
C4FCH11 and C4FC0.5H12 (cf. Table A.1).
A.4. Hydrogarnets
Hydrogarnets have structures related to grossular
C3AS3. A solid solution series between C3AH6–
C3FH6–C3AS3–C3FS3 has been reported, although the
extent of Si substitutions at temperatures below 100 -Cseems to be limited to one formula unit (siliceous
hydrogarnet: C3ASH4) with a miscibility gap between
hydrogarnet and the siliceous hydrogarnet [3,10].
Although hydrogarnet is a thermodynamically stable
phase at ordinary temperatures, it is not found as a major
hydration product in modern Portland cements even
though minor quantities of poorly crystalline hydrogarnet
may be present [10].
Several similar solubility products for hydrogarnet
(C3AH6) are reported (cf. Table A.2) in the literature. For
modelling, the solubility product fitted by Berner and Kulik
[49] for C3AH6 was used. The solubility product of the Fe-
analogue C3FH6 was calculated using the approach of
Babushkin et al. [44] (cf. Table A.1). For siliceous hydro-
garnet (C3ASH4) a solubility product of 10�31 was
estimated from the data given in Bennet et al. [3] for the
C3AH6–C3ASH4 system and from the observation of minor
amounts of siliceous hydrogarnet in the experiments with
stratlingite. However, the solubility product of siliceous
hydrogarnet is based on very little and somewhat contra-
dictory experimental evidence and is therefore not used in
the present calculations. Further experimental data are
needed to obtain a more reliable solubility product and for
the description of this solid solution series.
A.5. Other aluminate phases
While hydrogarnet is the thermodynamically stable
phase, at low temperature (5 -C) metastable Al(OH)3(am)
and CAH10 are formed. When temperature is increased,
metastable C2AH8 and C4AH13 precipitate, while above 50
-C, C3AH6 is formed rapidly. The solubility products for the
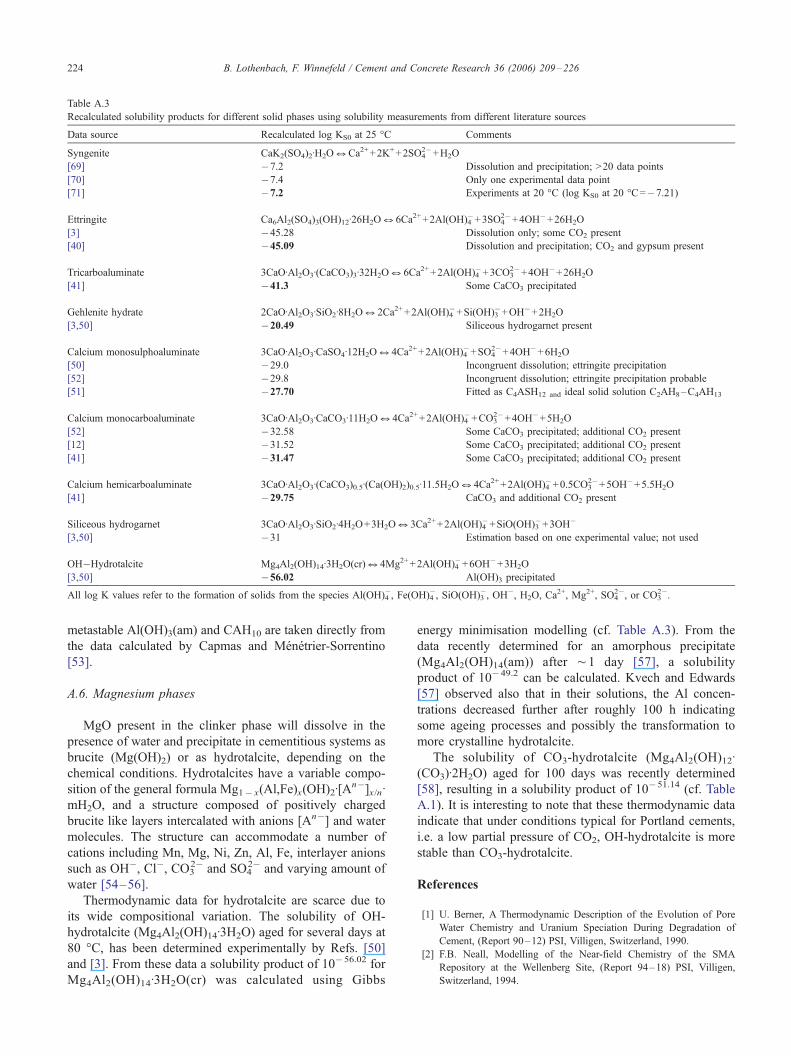
Table A.3
Recalculated solubility products for different solid phases using solubility measurements from different literature sources
Data source Recalculated log KS0 at 25 -C Comments
Syngenite CaK2(SO4)2IH2OSCa2++2K++2SO42�+H2O
[69] �7.2 Dissolution and precipitation; >20 data points
[70] �7.4 Only one experimental data point
[71] �7.2 Experiments at 20 -C (log KS0 at 20 -C=�7.21)
Ettringite Ca6Al2(SO4)3(OH)12I26H2OS6Ca2++2Al(OH)4�+3SO4
2�+4OH�+26H2O
[3] �45.28 Dissolution only; some CO2 present
[40] �45.09 Dissolution and precipitation; CO2 and gypsum present
Tricarboaluminate 3CaOIAl2O3I(CaCO3)3I32H2OS6Ca2++2Al(OH)4�+3CO3
2�+4OH�+26H2O
[41] �41.3 Some CaCO3 precipitated
Gehlenite hydrate 2CaOIAl2O3ISiO2I8H2OS2Ca2++2Al(OH)4�+Si(OH)3
�+OH�+2H2O
[3,50] �20.49 Siliceous hydrogarnet present
Calcium monosulphoaluminate 3CaOIAl2O3ICaSO4I12H2OS4Ca2++2Al(OH)4�+SO4
2�+4OH�+6H2O
[50] �29.0 Incongruent dissolution; ettringite precipitation
[52] �29.8 Incongruent dissolution; ettringite precipitation probable
[51] �27.70 Fitted as C4ASH12 and ideal solid solution C2AH8–C4AH13
Calcium monocarboaluminate 3CaOIAl2O3ICaCO3I11H2OS4Ca2++2Al(OH)4�+CO3
2�+4OH�+5H2O
[52] �32.58 Some CaCO3 precipitated; additional CO2 present
[12] �31.52 Some CaCO3 precipitated; additional CO2 present
[41] �31.47 Some CaCO3 precipitated; additional CO2 present
Calcium hemicarboaluminate 3CaOIAl2O3I(CaCO3)0.5I(Ca(OH)2)0.5I11.5H2OS4Ca2++2Al(OH)4�+0.5CO3
2�+5OH�+5.5H2O
[41] �29.75 CaCO3 and additional CO2 present
Siliceous hydrogarnet 3CaOIAl2O3ISiO2I4H2O+3H2OS3Ca2++2Al(OH)4�+SiO(OH)3
�+3OH�
[3,50] �31 Estimation based on one experimental value; not used
OH�Hydrotalcite Mg4Al2(OH)14I3H2O(cr)S4Mg2++2Al(OH)4�+6OH�+3H2O
[3,50] �56.02 Al(OH)3 precipitated
All log K values refer to the formation of solids from the species Al(OH)4�, Fe(OH)4
�, SiO(OH)3�, OH�, H2O, Ca
2+, Mg2+, SO42�, or CO3
2�.
B. Lothenbach, F. Winnefeld / Cement and Concrete Research 36 (2006) 209–226224
metastable Al(OH)3(am) and CAH10 are taken directly from
the data calculated by Capmas and Menetrier-Sorrentino
[53].
A.6. Magnesium phases
MgO present in the clinker phase will dissolve in the
presence of water and precipitate in cementitious systems as
brucite (Mg(OH)2) or as hydrotalcite, depending on the
chemical conditions. Hydrotalcites have a variable compo-
sition of the general formula Mg1� x(Al,Fe)x(OH)2I[An�]x/nI
mH2O, and a structure composed of positively charged
brucite like layers intercalated with anions [An�] and water
molecules. The structure can accommodate a number of
cations including Mn, Mg, Ni, Zn, Al, Fe, interlayer anions
such as OH�, Cl�, CO32� and SO4
2� and varying amount of
water [54–56].
Thermodynamic data for hydrotalcite are scarce due to
its wide compositional variation. The solubility of OH-
hydrotalcite (Mg4Al2(OH)14I3H2O) aged for several days at
80 -C, has been determined experimentally by Refs. [50]
and [3]. From these data a solubility product of 10�56.02 for
Mg4Al2(OH)14I3H2O(cr) was calculated using Gibbs
energy minimisation modelling (cf. Table A.3). From the
data recently determined for an amorphous precipitate
(Mg4Al2(OH)14(am)) after ¨1 day [57], a solubility
product of 10�49.2 can be calculated. Kvech and Edwards
[57] observed also that in their solutions, the Al concen-
trations decreased further after roughly 100 h indicating
some ageing processes and possibly the transformation to
more crystalline hydrotalcite.
The solubility of CO3-hydrotalcite (Mg4Al2(OH)12I(CO3)I2H2O) aged for 100 days was recently determined
[58], resulting in a solubility product of 10�51.14 (cf. Table
A.1). It is interesting to note that these thermodynamic data
indicate that under conditions typical for Portland cements,
i.e. a low partial pressure of CO2, OH-hydrotalcite is more
stable than CO3-hydrotalcite.
References
[1] U. Berner, A Thermodynamic Description of the Evolution of Pore
Water Chemistry and Uranium Speciation During Degradation of
Cement, (Report 90–12) PSI, Villigen, Switzerland, 1990.
[2] F.B. Neall, Modelling of the Near-field Chemistry of the SMA
Repository at the Wellenberg Site, (Report 94–18) PSI, Villigen,
Switzerland, 1994.

B. Lothenbach, F. Winnefeld / Cement and Concrete Research 36 (2006) 209–226 225
[3] D.G. Bennett, D. Read, M. Atkins, F.P. Glasser, A thermodynamic
model for blended cements: II. Cement hydrate phases; thermody-
namic values and modelling studies, J. Nucl. Mater. 190 (1992)
315–325.
[4] E.J. Reardon, Problems and approaches to the prediction of the
chemical composition in cement /water systems, Waste Manage. 12
(1992) 221–239.
[5] J.H. Lee, D.M. Roy, B. Mann, D. Stahl, Integrated approach to
modeling long-term durability of concrete engineered barriers in
LLRW disposal facility, Mater. Res. Soc. Symp. Proc. 353 (1995)
881–889.
[6] C. Ayora, S. Chinchon, A. Aguado, F. Guirado, Weathering of iron
sulfides and concrete alteration: thermodynamic model and observa-
tion in dams from Central Pyrenees, Spain, Cem. Concr. Res. 28
(1998) 1223–1235.
[7] V.A. Sinitsyn, D.A. Kulik, M.S. Khororivsky, I.K. Karpov, Prediction
of solid-aqueous equilibria in cementitious systems using Gibbs
energy minimization: I. Multiphase aqueous ideal solution models,
Mater. Res. Soc. Symp. Proc. 506 (1998) 953–960.
[8] D. Rothstein, J.J. Thomas, B.J. Christensen, H.M. Jennings, Solubility
behavior of Ca-, S-, Al-, and Si-bearing solid phases in Portland
cement pore solutions as a function of hydration time, Cem. Concr.
Res. 32 (2002) 1663–1671.
[9] H.W.W. Pollitt, A.W. Brown, The distribution of alkalis in Portland
cement clinker, 5th ICCC, vol. 1, 1969, pp. 322–333.
[10] H.F.W. Taylor, Cement Chemistry, Thomas Telford Publishing,
London, 1997.
[11] A. Franke, Bestimmung von Calciumoxid und Calciumhydroxid
neben wasserfreiem und wasserhaltigem Calciumsilikat, Z. Anorg.
Allg. Chem. 241 (1941) 180–184.
[12] T. Nishikawa, K. Sato, S. Ito, K. Suzuki, Thermal and chemical
stability of AFm phase-isostructural group, 9th ICCC, vol. IV, 1992,
pp. 437–442.
[13] W. Schwarz, Novel cement matrices by accelerated hydration of the
ferrite phase in Portland cement via chemical activation: kinetics and
cementitious properties, Adv. Cem. Based Mater. 2 (1995) 189–200.
[14] F.W. Locher, W. Richartz, S. Sprung, Erstarren von Zement: I. Reaktion
und Gefugeentwicklung, Zem.-Kalk-Gips 29 (1976) 435–442.
[15] P. Gunkel, Die Zusammensetzung der flussigen Phase erstarrender und
erhartender Zemente, Beton-Inf. 23 (1983) 3–8.
[16] P.G. Klepetsanis, E. Dalas, P.G. Koutsoukos, Role of temperature on
the spontaneous precipitation of calcium dihydrate, Langmuir 15
(1999) 1534–1540.
[17] E.M. Gartner, F.J. Tang, S.J. Weiss, Saturation factors for calcium
hydroxide and calcium sulfates in fresh Portland cement pastes, J. Am.
Ceram. Soc. 68 (1985) 667–673.
[18] M. Zhang, Incorporation of oxyanionic B, Cr, Mo, and Se into
hydrocalumite and ettringite: application to cementitious systems, PhD
thesis. University of Waterloo, Waterloo, Canada, 2000.
[19] R.B. Perkins, C.D. Palmer, Solubility of chromate hydrocalumite
(3CaOIAl2O3ICaCrO4InH2O) 5–75 -C, Cem. Concr. Res. 31 (2001)
983–992.
[20] M. Ochs, B. Lothenbach, E. Giffaut, Uptake of oxo-anions by cements
through solid-solution formation: experimental evidence and model-
ling, Radiochim Acta. 90 (2002) 639–646.
[21] D. Kulik, GEMS-PSI 2.0, PSI, Villigen, Switzerland, 2002, (available
at http://les.web.psi.ch/Software/GEMS-PSI/).
[22] W. Hummel, U. Berner, E. Curti, F.J. Pearson, T. Thoenen, Nagra/PSI
Chemical Thermodynamic Data Base 01/01, Universal Publishers/u-
PUBLISH.com, USA, also published as Nagra Technical Report NTB
02–16, Nagra, Wettingen, Switzerland, 2002.
[23] S. Garrault, A. Nonat, Hydrated layer formation on tricalcium and
dicalcium silicate surfaces: experimental study and numerical simu-
lations, Langmuir 17 (2001) 8131–8138.
[24] A. Smith, T. Chotard, N. Gimet-Breart, D. Fargeot, Correlation
between hydration mechanism and ultrasonic measurements in an
aluminous cement: effect of setting time and temperature on the early
hydration, J. Eur. Ceram. Soc. 22 (2002) 1947–1958.
[25] J.A. Dalziel, W.A. Gutteridge, The Influence of Pulverized-fuel Ash
upon the Hydration Characteristics and Certain Physical Properties of
a Portland Cement Paste, Tech. Rep., vol. 560, Cement and Concrete
Association, Slough, 1986.
[26] L.J. Parrot, D.C. Killoh, Prediction of cement hydration, Br. Ceram.
Proc. 35 (1984) 41–53.
[27] S. Swaddiwudhipong, D. Chen, M.H. Zhang, Simulation of the
exothermic process of Portland cement, Adv. Cem. Res 14 (2002)
61–69.
[28] H.F.W. Taylor, A method for predicting alkali ion concentrations in
cement pore solutions, Adv. Cem. Res 1 (1987) 5–17.
[29] S.-Y. Hong, F.P. Glasser, Alkali sorption by C-S-H and C-A-S-H
gels: Part II. Role of alumina, Cem. Concr. Res. 32 (2002)
1101–1111.
[30] S.-Y. Hong, F.P. Glasser, Alkali binding in cement pastes: Part I. The
C-S-H phase, Cem. Concr. Res. 29 (1999) 1893–1903.
[31] H.J.H. Brouwers, R.J. van Eijk, Alkali concentrations of pore solution
in hydrating OPC, Cem. Concr. Res. 33 (2003) 191–196.
[32] H.-J. Kuzel, Initial hydration reactions and mechanisms of delayed
ettringite formation in Portland cements, Cem. Concr. Compos. 18
(1996) 195–202.
[33] J.W. Johnson, E.H. Oelkers, H.C. Helgeson, SUPCRT92: a software
package for calculating the standard molal thermodynamic properties
of minerals, gases, aqueous species, and reactions from 1 to 5000 bar
and 0 to 1000 -C, Comput. Geosci. 18 (1992) 899–947.
[34] D.A. Sverjensky, E.L. Shock, H.C. Helgeson, Prediction of the
thermodynamic properties of aqueous metal complexes to 1000 -Cand 5 kb, Geochim. Cosmochim. Acta 61 (1997) 1359–1412.
[35] E.L. Shock, D.C. Sassani, M. Willis, D.A. Sverjensky, Inorganic
species in geologic fluids: correlations among standard molal
thermodynamic properties of aqueous ions and hydroxide complexes,
Geochim. Cosmochim. Acta 61 (1997) 907–950.
[36] E.L. Shock, An updated and augmented version (slop98.dat) of the
original SUPCRT92 database (sprons92.dat) is available at http://epsc.
wustl.edu/geopig/, 1998.
[37] D.A. Kulik, M. Kersten, Aqueous solubility diagrams for cementitious
waste stabilization systems: II. End-member stoichiometries of ideal
calcium silicates hydrate solid solutions, J. Am. Ceram. Soc. 84 (2001)
3017–3026.
[38] S.A. Greenberg, T.N. Chang, Investigation of the colloidal hydrated
calcium silicates: II. Solubility relationships in the calcium oxide–
silica–water system at 25-, J. Phys. Chem. 69 (1965) 182–188.
[39] L. Holzer, F. Winnefeld, B. Lothenbach, D. Zampini, The early
cement hydration: a multi-method approach, 11th ICCC, 2003,
pp. 236–248.
[40] R.B. Perkins, C.D. Palmer, Solubility of ettringite (Ca6[Al(OH)6]2(SO4)3I26H2O) at 5–75 -C, Geochim. Cosmochim. Acta 63 (1999)
1969–1980.
[41] D. Damidot, S. Stronach, A. Kindness, M. Atkins, F.P. Glasser,
Thermodynamic investigation of the CaO–Al2O3–CaCO3–H2O
closed system at 25 -C and the influence of Na2O, Cem. Concr. Res.
24 (1994) 563–572.
[42] H. Pollmann, H. Kuzel, Solid solution of ettringites, Cem. Concr. Res.
20 (1990) 941–947.
[43] A. Emanuelson, S. Hansen, Distribution of iron among ferrite
hydrates, Cem. Concr. Res. 27 (1997) 1167–1177.
[44] V.I. Babushkin, G.M. Matveyev, O.P. Mchedlov-Petrossyan, Thermo-
dynamics of Silicates, Springer-Verlag, Berlin, 1985.
[45] F.P. Glasser, A. Kindness, S.A. Stronach, Stability and solubility
relationships in AFm phases: Part I. Chloride, sulfate and hydroxide,
Cem. Concr. Res. 29 (1999) 861–866.
[46] H. Pollmann, Solid solution in the system 3CaOIAl2O3ISO4Iaq–
3CaOIAl2O3ICa(OH)4Iaq–H2O at 25 -C, 45 -C, 60 -C, 80 -C, Neues
Jahrb. Mineral. Abh. 161 (1989) 27–40.
B. Lothenbach, F. Winnefeld / Cement and Concrete Research 36 (2006) 209–226226
[47] R. Fischer, H.-J. Kuzel, Reinvestigation of the system C4AInH2O–
C4AICO2InH2O, Cem. Concr. Res. 12 (1982) 517–526.
[48] H.-J. Kuzel, H. Pollmann, Hydration of C3A in the presence of
Ca(OH)2, CaSO4I2H2O and CaCO3, Cem. Concr. Res. 21 (1991)
885–895.
[49] U.R. Berner, D.A. Kulik, Ca-Al-hydrates: solid solutions? Geochim.
Cosmochim. Acta 66 (2002) (A73-A73).
[50] M. Atkins, F.P. Glasser, A. Kindness, Cement hydrate phases:
solubility at 25 -C, Cem. Concr. Res. 22 (1992) 241–246.
[51] F.E. Jones, The quaternary system CaO–Al2O3–CaSO4–H2O.
Equilibria with crystalline Al2O3I3H2O, alumina gel, and solid
solutions, J. Phys. Chem. 48 (1944) 311–356.
[52] F. Zhang, Z. Zhou, Z. Lou, Solubility product and stability of
ettringite, 7th ICCC, vol. 2, 1980, pp. 88–93.
[53] A. Capmas, D. Menetrier-Sorrentino, The effect of temperature on
the hydration of calcium aluminate cement, UNITECR ’89, 1989,
pp. 1157–1170.
[54] L. Chatelet, J.Y. Bottero, J. Yvon, A. Bouchelaghem, Competition
between monovalent and divalent anions for calcined and uncalcined
hydrotalcite: anion exchange and adsorption sites, Colloids Surf., A
Physicochem. Eng. Asp. 111 (1996) 167–175.
[55] J. Wang, A.G. Kalinichev, R.J. Kirkpatrick, X. Hou, Molecular
modeling of the structure and energetics of hydrotalcite hydration,
Chem. Mater. 13 (2001) 145–150.
[56] T. Sato, H. Fujita, T. Endo, M. Shimada, Synthesis of hydrotalcite like
compounds and their physico-chemical properties, React. Solids 5
(1988) 219–228.
[57] S. Kvech, M. Edwards, Solubility controls on aluminum in drinking
water at relatively low and high pH, Water Res. 36 (2002) 4356–4368.
[58] C.A. Johnson, F.P. Glasser, Hydrotalcite-like minerals (M2Al(OH)6(CO3)0.5IxH2O, where M=Mg, Zn, Co, Ni) in the environment:
synthesis, characterisation and thermodynamic stability, Clay Clay
Miner. 51 (2003) 1–8.
[59] D. Garvin, V.B. Parker, H.J. White, CODATAThermodynamic Tables.
Selections for Some Compounds of Calcium and Related Mixtures: A
Prototype Set of Tables, Springer Verlag, Berlin, 1987.
[60] V.M. Nikushchenko, V.S. Khotimchenko, P.F. Rumyantsev, A.I.
Kalinin, Determination of the standard free energies of formation of
calcium hydroxyaluminates, Cem. Concr. Res. 3 (1973) 625–632.
[61] O.P. Mchedlov-Petrossyan, W.L. Tschernjawski, W.W. Ssawenkow,
Uber die Bestandigkeit der Zementsteinmineralien in sulfat-und
karbonathaltigen Wasserlosungen, Baustoffindustrie A19 (1976)
24–25.
[62] P. Barret, D. Bertrandie, Courbe d’instabilite minimale dans une
solution metastable de CA, 7th ICCC, vol. V, 1980, pp. 134–139.
[63] P. Barret, D. Bertrandie, D. Beau, Calcium hydrocarboaluminate,
carbonate, alumina gel and hydrated aluminates solubility diagram
calculated in equilibrium with CO2g and with Naaq+ ions, Cem. Concr.
Res. 13 (1983) 789–800.
[64] E.J. Reardon, An ion interaction model for the determination of
chemical equilibria in cement /water systems, Cem. Concr. Res. 20
(1990) 175–192.
[65] C.J. Warren, E.J. Reardon, The solubility of ettringite at 25 -C, Cem.
Concr. Res. 24 (1994) 1515–1524.
[66] D. Damidot, M. Atkins, A. Kindness, F.P. Glasser, Sulphate attack on
concrete: limits of the AFt stability domain, Cem. Concr. Res. 22
(1992) 229–234.
[67] D. Damidot, F.P. Glasser, Thermodynamic investigation of the CaO–
Al2O3–CaSO4–H2O system at 25 -C and the influence of Na2O,
Cem. Concr. Res. 23 (1993) 221–238.
[68] S.C.B. Myneni, S.J. Traina, T.J. Logan, Ettringite solubility and
geochemistry of the Ca(OH)2–Al2(SO4)3–H2O system at 1 atm
pressure and 298 K, Chem. Geol. 148 (1998) 1–19.
[69] F.K. Cameron, J.F. Breazeale, Calcium sulphate in aqueous solutions
of potassium and sodium sulphates, J. Phys. Chem. 8 (1904) 335–340.
[70] A.E. Hill, Ternary systems: XIX. Calcium sulfate, potassium sulfate
and water, J. Am. Chem. Soc. 56 (1938) 1071–1078.
[71] E.M. Gartner, S. Sabio, J.P. Perez, Equilibria in the system calcium
hydroxide–calcium sulphate–alkali sulphate–water at 5–30 -C, andtheir relevance to Portland cement hydration in the presence of
superplasticizers, 11th ICCC, 2003, pp. 635–644.