Vection change exacerbates simulator sickness in virtual environments
13
University of Wollongong Research Online Faculty of Health and Behavioural Sciences - Papers (Archive) Faculty of Science, Medicine and Health 2008 Vection change exacerbates simulator sickness in virtual environments Frederick Bonato Saint Peter's College Andrea Bubka St Patrick's College Stephen A. Palmisano University of Wollongong, [email protected] Danielle Phillip Saint Peter's College Giselle Moreno Saint Peter's College Research Online is the open access institutional repository for the University of Wollongong. For further information contact the UOW Library: [email protected] Publication Details Bonato, F., Bubka, A., Palmisano, S. A., Phillip, D. & Moreno, G. (2008). Vection change exacerbates simulator sickness in virtual environments. Presence, 17 (3), 283-292.
Transcript of Vection change exacerbates simulator sickness in virtual environments

University of WollongongResearch Online
Faculty of Health and Behavioural Sciences - Papers(Archive) Faculty of Science, Medicine and Health
2008
Vection change exacerbates simulator sickness invirtual environmentsFrederick BonatoSaint Peter's College
Andrea BubkaSt Patrick's College
Stephen A. PalmisanoUniversity of Wollongong, [email protected]
Danielle PhillipSaint Peter's College
Giselle MorenoSaint Peter's College
Research Online is the open access institutional repository for theUniversity of Wollongong. For further information contact the UOWLibrary: [email protected]
Publication DetailsBonato, F., Bubka, A., Palmisano, S. A., Phillip, D. & Moreno, G. (2008). Vection change exacerbates simulator sickness in virtualenvironments. Presence, 17 (3), 283-292.

Vection change exacerbates simulator sickness in virtual environments
AbstractThe optic flow patterns generated by virtual reality (VR) systems typically produce visually inducedexperiences of self-motion (vection). While this vection can enhance presence in VR, it is often accompaniedby a variant of motion sickness called simulator sickness (SS). However, not all vection experiences are thesame. In terms of perceived heading and/or speed, visually simulated self-motion can be either steady orchanging. It was hypothesized that changing vection would lead to more SS. Participants viewed an optic flowpattern that either steadily expanded or alternately expanded and contracted. In one experiment, SS wasmeasured pretreatment and after 5 min of viewing using the Simulator Sickness Questionnaire. In a secondexperiment employing the same stimuli, vection onset and magnitude were measured using a computer-interfaced slide indicator. The steadily expandingflow pattern, compared to the expanding and contractingpattern, led to: 1) significantly less SS, 2) lower subscores for nausea, oculomotor, and disorientationsymptoms, 3) more overall vection magnitude, and 4) less changing vection. Collectively, these results suggestthat changing vection exacerbate SS.
KeywordsVection, change, exacerbates, simulator, sickness, virtual, environments
DisciplinesArts and Humanities | Life Sciences | Medicine and Health Sciences | Social and Behavioral Sciences
Publication DetailsBonato, F., Bubka, A., Palmisano, S. A., Phillip, D. & Moreno, G. (2008). Vection change exacerbates simulatorsickness in virtual environments. Presence, 17 (3), 283-292.
This journal article is available at Research Online: http://ro.uow.edu.au/hbspapers/1651

Frederick Bonato*Andrea BubkaDepartment of PsychologySaint Peter’s College2641 Kennedy BoulevardJersey City, NJ 07306
Stephen PalmisanoSchool of PsychologyUniversity of WollongongWollongong, New South Wales2522 Australia
Danielle PhillipGiselle MorenoDepartment of PsychologySaint Peter’s CollegeJersey City, NJ 07306
Presence, Vol. 17, No. 3, June 2008, 283–292
© 2008 by the Massachusetts Institute of Technology
Vection Change ExacerbatesSimulator Sickness in VirtualEnvironments
Abstract
The optic flow patterns generated by virtual reality (VR) systems typically producevisually induced experiences of self-motion (vection). While this vection can en-hance presence in VR, it is often accompanied by a variant of motion sicknesscalled simulator sickness (SS). However, not all vection experiences are the same. Interms of perceived heading and/or speed, visually simulated self-motion can be ei-ther steady or changing. It was hypothesized that changing vection would lead tomore SS. Participants viewed an optic flow pattern that either steadily expanded oralternately expanded and contracted. In one experiment, SS was measured pre-treatment and after 5 min of viewing using the Simulator Sickness Questionnaire. Ina second experiment employing the same stimuli, vection onset and magnitudewere measured using a computer-interfaced slide indicator. The steadily expandingflow pattern, compared to the expanding and contracting pattern, led to: 1) signifi-cantly less SS, 2) lower subscores for nausea, oculomotor, and disorientation symp-toms, 3) more overall vection magnitude, and 4) less changing vection. Collectively,these results suggest that changing vection exacerbates SS.
1 Introduction
Virtual reality (VR) systems often lead to visually induced self-motionperception, or vection (Fischer & Kornmuller, 1930; Tschermak, 1931). Whenvection occurs, the user perceives self-motion that is often compelling even inthe absence of any physical self-motion relative to earth. Vection is importantin virtual environments because it can enhance the realism, or presence, of theuser’s experience. For example, a flight simulator’s visual display may producevection similar to the self-motion perception that would occur in an actual air-craft, even though the simulator may be stationary relative to earth.
However, vection is often accompanied by a form of kinetosis (motion sick-ness) known as simulator sickness (SS; Kennedy, Hettinger, & Lilienthal,1989). Symptoms can include, but are not limited to, dizziness, headache, sali-vation, blurred vision, eyestrain, nausea, disorientation, sweating, and pallor.Often less severe than the more well known forms of kinetosis (seasickness,airsickness, etc.), simulator sickness can nonetheless have a negative impact onVR users.
*Correspondence to [email protected].
Bonato et al. 283

Vection that occurs in VR is most often the productof visual input. It has been well known since Gibson(1966) that optic flow patterns on the retina provide arich source of input for mediating self-motion percep-tion. For example, during daily life an expanding opticflow pattern typically results from forward self-motionwhereas a contracting pattern results from backwardself-motion. Similarly, in VR the computer-generatedoptic flow pattern also gives the user information aboutspeed and heading in the virtual environment. This isthe case even when other sensory inputs are incompati-ble with the visual input.
An important assertion underlying the theoretical pre-dictions for the current study is that different optic flowpatterns can lead to different types of vection. Just likethe self-motion perception that can take place duringactual passive travel, vection can be either steady orchanging. These terms are not conventional in the fieldand thus need to be defined. Steady vection, as thename implies, is defined as vection that is unwavering interms of its perceived speed and heading. Conversely,changing vection is defined as vection that varies in per-ceived speed, perceived heading, or both. For example,in a flight simulator, vection may be steady at times, butduring maneuvers changing vection is more likely toprevail.
Another point to note is that sensory inputs (visualand nonvisual) that occur during steady vection andactual steady passive travel can be similar (if the head isheld steady). In both cases, an optic flow pattern on theretina provides visual input that leads to steady self-motion perception. Nonvisual inputs (e.g., vestibular)that occur during steady vection and actual steady travelcan also be similar (Howard, 1982). This is because thevestibular organs only respond to changes in headingand/or velocity. Consider traveling in a steadily movingvehicle; closing one’s eyes and preventing head move-ments all but eliminates any percept of self-motion. Thevestibular organs may respond to vehicle vibrations, butvestibular and other nonvisual sensory inputs do notprovide information about speed and heading whentravel is steady.
However, sensory inputs that occur during changingvection and actual travel often differ significantly. Dur-
ing actual travel, the senses often provide inputs that arecompatible with each other. In VR this is hardly everthe case. For example, in fixed-base vehicle simulators,the optic flow pattern may lead to changing vection,but vestibular input will typically indicate that no self-motion is occurring. In motion-based simulators, at-tempts to replicate what the sensory inputs would beunder real-life conditions often fall short. Hence,whereas steady vection and steady passive self-motioncan result in similar sensory inputs, changing vectionand changing passive self-motion often do not. Sensoryinputs are more likely to be inconsistent when changingvection is perceived.
It has been reported by Hettinger and colleagues(Hettinger, Berbaum, Kennedy, Dunlap, & Nolan,1990) that individuals who reported vection also indi-cated higher levels of SS. Their stimulus displays de-picted aerial self-motion with changes in roll and pitchas well as displacements in the lateral, longitudinal, andvertical axes. This flight scenario undoubtedly resultedin a high degree of changing vection. Their explanationof the higher incidence of SS when vection is experi-enced is based on sensory conflict: visually producedself-motion perception in the absence of consistent in-put from other senses leads to sickness and is consideredby some theorists to be a significant causal factor of mo-tion sickness. Sensory conflict has been defined as a lackof sensory input consistency (Reason & Brand, 1975) oras a mismatch between actual sensory inputs and ex-pected sensory inputs obtained from past experience(Oman, 1990).
The hypothesis for the current study is that optic flowindicating changing self-motion will lead to significantlymore SS than optic flow indicating steady self-motion.The plausibility of our hypothesis is supported by workconducted using optokinetic drums. Under optokineticdrum conditions, a stationary observer inside a large,rotating cylinder simply views the patterned interior ofthe drum as it rotates. Circular vection typically occurswithin 30 s and motion sickness symptoms often de-velop after several minutes of viewing (Hu, Stern, Va-sey, & Koch, 1989). Optokinetic drum conditions aresimilar to fixed-base simulator conditions because the
284 PRESENCE: VOLUME 17, NUMBER 3

observer is stationary relative to earth. The optical flowpattern alone leads to vection.
Work conducted in our lab suggests that compared toa steadily rotating drum, subjective motion sicknessscores obtained in a drum that changed rotation direc-tion every 30 s were significantly higher (Bonato,Bubka, & Story, 2005). Similarly, changing drumrotation velocity every 30 s also led to more severemotion sickness symptoms (Bubka, Bonato, Urmey,& Myecewicz, 2006). Finally, if a drum is tilted, so thatit rotates in a wobble-like fashion, the vection that isperceived is circular but it also includes a swaying com-ponent that in essence is a combination of perceived tiltand roll. Under tilted drum conditions, motion sicknessalso develops faster compared to a drum that rotates onan earth-vertical axis (Bubka & Bonato, 2003). For thecurrent study, the results obtained using optokineticdrums suggest that changing linear vection resultingfrom a virtual display may also lead to more SS com-pared to steady linear vection.
2 Experiment 1
2.1 Method
2.1.1 Overview. In Experiment 1, optic flowpatterns displayed on a computer monitor were shownto stationary observers. The experimental setup was de-signed to emulate the sensory inputs one would expectin a fixed-base simulator. In the steady condition, the
optical flow pattern viewed expanded from the center ofthe display monitor at a constant rate. In the alternat-ing condition, the optical flow pattern intermittentlyexpanded and contracted. The change in flow patternwas used to 1) reduce the overall vection magnitudegiven that it usually takes more than 5 s for vection tobegin, and 2) increase the probability that any vectionperceived would contain a high degree of change (alongthe fore and aft axis). We hypothesized that sensoryconflict would be renewed often in the alternating con-dition by the flow pattern’s frequent changes leading toa subsequent increase in SS.
2.1.2 Participants. Fourteen undergraduate vol-unteers participated in the experiment (7 males, 7 fe-males, mean age � 19.4 yr). All had normal or corrected-to-normal vision and no one reported any neurological,vestibular, or gastrointestinal problems. All participantsreported general good health at the time of the experi-ment.
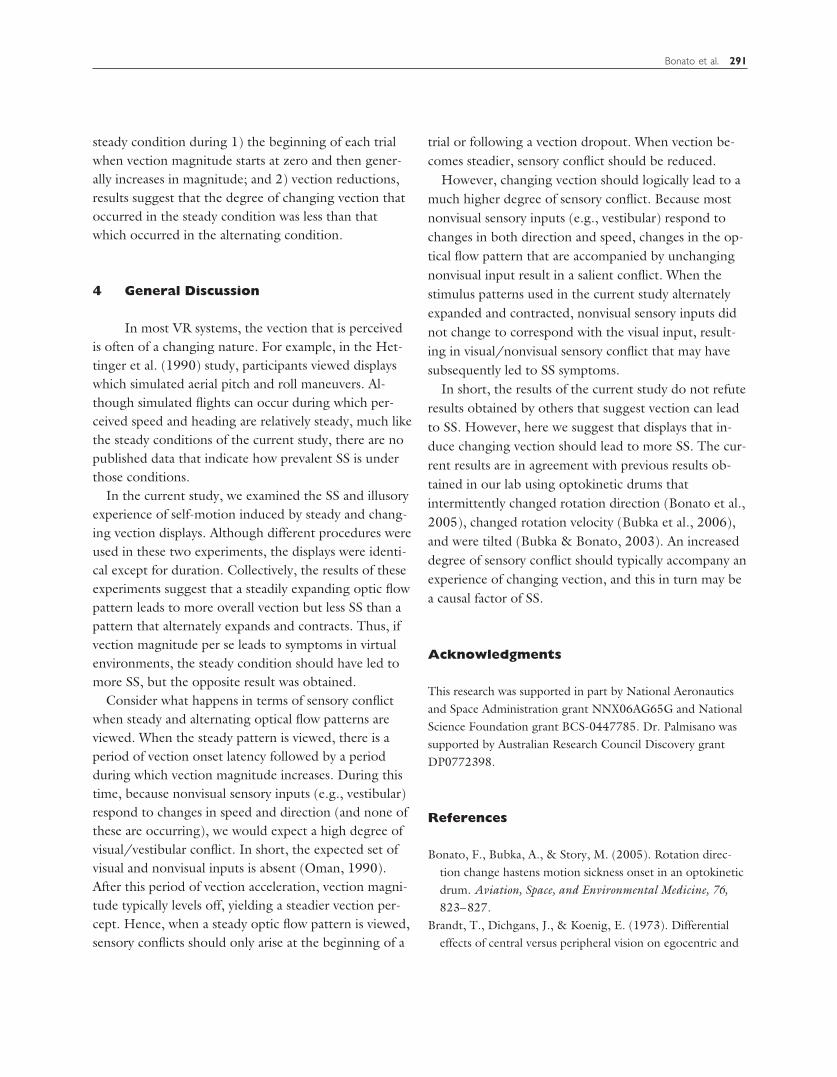
2.1.3 Stimuli and Apparatus. The stimulus pat-tern consisted of an array of light blue squares against adark background displayed on a 43 cm Dell CRT moni-tor using an Apple G5 desktop computer (see Figure 1).The monitor resolution was 1,280 � 1,024 pixels andthe refresh rate was 85 Hz. The viewing distance was 30cm, yielding a display that subtended 45° (high) by 53°(wide) of visual angle. The virtual space in the displaywas 40,000 pixels wide (x) � 40,000 pixels high (y) �
Figure 1. The stimulus pattern used in Experiment 1 either steadily expanded from
the center of the screen (A) or alternately expanded and contracted (A & B).
Bonato et al. 285

100,000 pixels deep (z). There were 500 objects in to-tal. Objects were separated in depth by approximately200 pixels. Objects could be placed in four quadrants(top left, top right, bottom left, bottom right) relativeto the x � 0, y � 0 point at the center of the screen.The density was held constant in each quadrant (125objects in each). Horizontal and vertical placementwithin the quadrant was random, with the sole restric-tion being that the objects could not have an x valueless than �640 or greater than �640 pixels and a y valueless than �512 or greater than �512. This represents asquare region of 1,280 pixels � 1,024 pixels and pre-vented elements from “hitting” the observer. No squareelement was ever closer than 2,000 pixels to the ob-server. If the z value for an object reached 2,000 pixels,the object was moved 100,000 pixels away, but kept thesame horizontal and vertical coordinates it always had.
Perspective was incorporated into the displays; assquares moved from the center of the screen outward(expanding pattern) they increased in size. At maximumsize, each element subtended 1.3° of visual angle. Aselements expanded, their velocity toward the edge ofthe screen also increased so as to be consistent with the3D virtual space. For reference, and in relative terms,the rate of expansion was consistent with an optic flowpattern that would result in an aircraft cruising at aspeed of 340 km/h with a visible range of 220 m.
The array of square objects either steadily expandedfrom the center of the screen (steady condition), or al-ternately expanded and contracted (alternating condi-tion). In the alternating condition, every 5 s of flow pat-tern was interrupted by 1 s of a stationary pattern. Nointerruptions occurred in the steady condition.
Head position was maintained throughout each trialwith an optical chin rest that consisted of a depressionfor the chin and a concave bar to which participantspressed their foreheads. Although participants wereinstructed to keep their heads stationary throughouttrials, the chin rest allowed for slight head shifts inboth conditions. An eye patch was used to cover eachparticipant’s left eye, resulting in monocular viewingof the stimulus display. The viewing condition hasbeen shown to affect how voluminous a flat display isperceived, and when an optic flow pattern is viewed, the
magnitude of vection (Bubka, Bonato, & Mycewicz,2006). By eliminating stereopsis and vergence, monocu-lar depth cues present in the display (perspective, ratesof expansion and contraction) may play more of a rolein determining perceived depth, resulting in enhancedthree-dimensionality of what is actually a flat display.
2.1.4 Simulator Sickness Assessment Instru-ment. SS symptoms were assessed using the SimulatorSickness Questionnaire (SSQ) developed by Robert S.Kennedy and colleagues (Kennedy, Lane, Berbaum, &Lilienthal, 1993). This instrument has frequently beenused for measuring symptoms in studies that employedvarious VR systems. The first page of the questionnairecontains questions about general background, health,alcohol and drug consumption, and simulator experience.The second (pretreatment) and third (post-treatment)pages require participants to rate the severity of knownsimulator sickness symptoms. When scored according topublished guidelines, the SSQ yields four scores: a totalSSQ score and three subscores corresponding to nausea,oculomotor (e.g., eye strain, blurred vision) effects, anddisorientation. These dimensions of simulator sicknesshave been identified in a series of factor analyses of largedatabases.
Sixteen items on the questionnaire contribute to theSSQ scores. Subjects indicate the level of each symp-tom’s severity pretreatment and post-treatment using aLikert-type scale by circling one of four choices (none,slight, moderate, or severe). The 16 symptoms that col-lectively contribute to the SSQ scores are general dis-comfort, fatigue, headache, eye strain, difficulty focus-ing, increased salivation, sweating, nausea, difficultyconcentrating, fullness of the head, blurred vision, dizzi-ness with eyes open, dizziness with eyes closed, vertigo,stomach awareness, and burping.
2.1.5 Procedure and Design. Prior to eachtrial, the participant completed the first two pages of theSSQ. The participant was then seated in front of thestimulus screen and an eye patch was placed on his orher left eye. The optical chin rest was adjusted so thatthe participant’s right eye was aligned with the center ofthe monitor screen. At this time the monitor screen was
286 PRESENCE: VOLUME 17, NUMBER 3

obscured with a baffle and the participant was instructedto close his or her eyes. The lights in the laboratorywere turned off, the baffle was removed, and the partici-pant was then instructed to avoid head movements andview the stimulus pattern continuously for 5 min. Im-mediately after the 5-min viewing period, the laboratorylights were turned on, the participant completed thepost-treatment page of the SSQ, and the participant wasasked to describe any perception of self-motion thatmay have occurred. The participant was allowed to restuntil any adverse symptoms subsided before leaving thelaboratory. Each participant served in both the steadyand alternating conditions of the experiment in counter-
balanced order. Participation in the two conditions wasseparated by at least 72 hr.
2.2 Results and Discussion
An analysis of post-treatment scores was con-ducted. All pretreatment scores indicated no degree ofsickness. The results of the post-treatment scores ob-tained in Experiment 1 are shown in Figure 2. The totalSSQ scores (A) obtained in the steady condition(mean � 21.6, SD � 21.4) were significantly lower(t(13) � 2.94, p � .006) than the total SSQ scores ob-tained in the alternating condition (mean � 36.9, SD �
Figure 2. Results of Experiment 1. Total SSQ scores are shown in (A). Also shown are the mean SSQ
subscores for nausea (B), oculomotor symptoms (C), and disorientation (D). Error bars represent the
standard error.
Bonato et al. 287

29.6). The nausea SSQ subscores (B) obtained in thesteady condition (mean � 14.3, SD � 16.2) were alsosignificantly lower (t(13) � 2.35, p � .017) than thoseobtained in the alternating condition (mean � 21.1,SD � 22.2). Similarly, the oculomotor subscores (C)obtained in the steady condition (mean � 20.0, SD �
20.7) were lower (t(13) � 2.35, p � .017) than themean subscores obtained in the alternating condition(mean � 32.5, SD � 25.3). Finally, the disorientation(D) subscores were lower (t(13) � 2.64, p � .010) inthe steady condition (mean � 22.8, SD � 28.7) com-pared to the subscores obtained in the alternating con-dition (mean � 46.7, SD � 41.1).
These results suggest that an alternating optic flowpattern that intermittently expands and contracts leadsto more SS than a steadily expanding pattern. It standsto reason that an alternating pattern is more likely tolead to changing vection, in this case, along the fore andaft axis. Postexperimental reports by observers indicatedthat this was the case: 1) the steady condition led toforward self-motion that was reported to be predomi-nantly steady, and 2) the alternating condition led toforward-backward self-motion.
In terms of sensory conflict, one might expect thealternating condition to lead to more visual/nonvisualsensory conflict. This is especially true if the expectedsensory inputs are compared to those that actually re-sulted during a trial (Oman, 1990). In the steady condi-tion, visual and nonvisual sensory inputs would be mostat odds during the beginning of a trial, but with contin-ued viewing of the steadily expanding pattern, inputswould come to be more similar to those arising duringactual passive travel (as long as the participant’s headremained stationary). However, in the alternating con-dition, the frequent direction changes of the flow pat-tern would serve to make visual and nonvisual inputs beat odds throughout a trial.
3 Experiment 2
Although assumptions were made about vectionexperience in Experiment 1, it was not measured. Infact, given that vection onset typically takes at least 5 s
(Brandt et al., 1973), it seemed important to assesswhether or not vection occurred at all in the alternatingcondition. Hence, the purpose of Experiment 2 was tomeasure vection with displays that were identical tothose used in Experiment 1 (steady and alternating)except for their duration.
Ideally, it would have been informative to measure SSand vection in the same experiment using identicalmethods. However, Experiments 1 and 2 employed dif-ferent methods for several reasons. Five minute trialswere used in Experiment 1 because this allowed enoughtime for measurable SS symptoms to develop. However,measurable vection typically occurs faster than SS andthus 5 min trials were not necessary in Experiment 2.Multiple trials were run for each condition (three). Vec-tion measures were taken to be the average of the threetrials in an effort to reduce variability that is a commoncharacteristic of vection experiments. Attention de-mands on participants were also a concern. Significanttime was spent instructing participants on using theSSQ in Experiment 1 and the apparatus in Experiment2. To use the SSQ and the apparatus in the same experi-ment, although possible, would have made the proce-dure for each participant more complicated.
We hypothesized that overall vection magnitudewould be higher in the steady condition; frequent rever-sals of the flow pattern in the alternating conditionmight inhibit vection. Also, every 5 s of flow pattern wasfollowed by 1 s of a static pattern, an arrangement thatwould further serve to inhibit steady vection. Also, al-though it was predicted that both conditions would re-sult in some degree of changing vection, the alternatingcondition due to the frequent changes in flow patterndirection was predicted to result in a higher degree ofchanging vection.
3.1 Method
3.1.1 Participants. Fourteen undergraduatevolunteers participated in the experiment (4 males,10 females, mean age � 20.6 yr). All had normal orcorrected-to-normal vision with no reported history ofany neurological, vestibular, or gastrointestinal prob-
288 PRESENCE: VOLUME 17, NUMBER 3

lems. All reported general good health prior to partici-pating in the experiment.
3.1.2 Stimuli and Apparatus. The stimulus pat-terns used in Experiment 2 were identical to those usedin Experiment 1 except for their duration. Vection wasmeasured using a Biopac MP100 data acquisition sys-tem. The participant manipulated the slide control on aBiopac TSD-115 variable transducer using his or herright index finger that was positioned on the same ta-bletop that supported the display monitor. The slide onthe transducer was positioned so that it moved horizon-tally relative to the participant’s line of sight. This ar-rangement, coupled with explicit instructions, was pur-posely chosen to help eliminate participants fromthinking that the slide should be pushed forward whenthe flow pattern expanded and vice versa. The systemallowed measurement of vection onset (seconds) andmagnitude (0–100%) to be recorded with a desktopcomputer. Sample output for a 30-s trial is shown inFigure 3.
3.1.3 Procedure and Design. A patch wasplaced on the participant’s left eye and his or her headwas positioned in an optical chin rest. Instructions weregiven on how to use the slide control to indicate vectionmagnitude. Pushing the slide control to the right wasmeant to indicate that vection was being perceived.Pushing the slide farther to the right was meant to indi-
cate that vection magnitude was increasing. Pushing theslide all the way (5 cm) was meant to indicate that vec-tion was saturated. Careful attention was paid to in-structing participants that pushing the slide to the rightwas meant to be an increase in vection magnitude re-gardless of whether the flow pattern expanded or con-tracted. In short, participants were told that the slidehad nothing to do with whether or not forward or back-ward vection was perceived. Three trials were run foreach condition; each trial was 30 s long. Each partici-pant’s dependent measures were taken to be the meanof the values obtained in the three trials. This averagingwas done to reduce variability that tends to be high inthese types of experiments. Between trials participantsrested for three min before serving in the subsequenttrial. Every participant served in both conditions. Theorder of conditions was counterbalanced. After eachcondition participants were asked to verbally describetheir vection experience.
3.2 Results and Discussion
The results of Experiment 2 are shown in Figure4. Vection onset and overall vection for each participantwere calculated by averaging his or her responses for thethree trials. Vection onset latencies in seconds (A) ob-tained in the steady condition (mean � 8.8, SD � 6.1)were not significantly different (t(13) � 1.35, p � .100)than the latencies obtained in the alternating condition(mean � 10.3, SD � 7.3). The overall vection magni-tude was defined as the mean amount of slide distanceon the variable assessment transducer that resulted forthe entire trial. This distance was calibrated on a 0–100scale (0 � no vection, 100 � vection completely satu-rated). Overall vection (B) measures obtained in thesteady condition (mean � 21.1, SD � 20.5) were sig-nificantly higher (t(13) � 2.06, p � .030) than theoverall vection measures obtained in the alternatingcondition (mean � 10.3, SD � 11.3). That overall vec-tion magnitude was lower in the alternating condition isnot surprising given that: 1) vection direction changedevery 6 s, and 2) 20% of the time the display was static.These two factors most likely contributed to vection
0
1 0 0 % slide distance
5 0 7 5
2 5 0
3 05 10 15 20 25
magnitude increases
vection saturated
vection onset
secondsno vection
vection reduction
Figure 3. Sample output for a 30-s trial using the Biopac MP100
data acquisition system. The participant manipulated the slide control
on a Biopac TSD-115 variable transducer.
Bonato et al. 289

reductions during each trial when vection magnitudeeither decreased or ceased entirely.
An analysis of vection reductions was conducted. Avection reduction was defined as any reduction of slidedistance on the variable assessment transducer of at least2% of the total possible distance of 100%. This analysisrevealed that the mean number of vection reductionsobtained (for each 30-s trial) in the steady condition(0.52) was significantly lower (t(13) � 3.1, p � .004)than the mean number of reductions that occurred inthe alternating condition (1.2). In short, these data in-dicate that more than twice as many reductions oc-curred in the alternating condition. This finding is inagreement with results that suggest inconsistent sensoryinputs can inhibit vection. More specifically, optical flowpatterns typically associated with a large degree of ex-pected nonvisual stimulation have been reported to re-sult in weaker vection experiences (Wann & Rushton,1994). Also, when nonvisual stimulation (e.g., vestibu-lar) occurs during vection that results in a sudden lackof agreement between visual and nonvisual inputs, vec-tion can be diminished or destroyed (Teixeira & Lack-ner, 1979; Young, Oman, & Dichgans, 1975).
However, it should be noted that other work showsthat sometimes increasing the mismatch between visualand vestibular inputs can increase vection magnitude
(Palmisano, Gillam, & Blackburn, 2000). In this study,coherent visual field “jitter” was added to radially ex-panding optical flow patterns. Thus, these jittering dis-plays simulated forward self-motion of a constant veloc-ity combined with continuous, random horizontaland/or vertical impulse self-accelerations (similar to theeffects of “camera shake”). It would not be unreason-able to hypothesize that the lack of agreement betweenvisual and vestibular inputs produced by global visualfield jitter would inhibit vection. However, Palmisanoand his colleagues found that this jitter actually en-hanced vection. This work raises the intriguing possibil-ity that because of past experiences of walking and run-ning, visual field jitter is accepted, and perhaps evenexpected, by the visual system as a normal feature ofoptical flow patterns.
Although the results of Experiment 2 suggest thatless overall vection occurred in the alternating condi-tion, it is important to note that the degree of changingvection perceived in the two conditions differed. In ad-dition to the results of our vection reduction analysis,verbal reports provided by participants unanimously in-dicated that vection in the alternating condition oc-curred on the fore-and-aft axis. In short, the alternatingcondition resulted in forward/backward changing vec-tion. Whereas some changing vection occurred in the
Figure 4. Results of Experiment 2. Mean vection onset latencies measured in seconds are shown in
(A). Mean lever distance percentages (0–100) for the 30-s trials are shown in (B).
290 PRESENCE: VOLUME 17, NUMBER 3
steady condition during 1) the beginning of each trialwhen vection magnitude starts at zero and then gener-ally increases in magnitude; and 2) vection reductions,results suggest that the degree of changing vection thatoccurred in the steady condition was less than thatwhich occurred in the alternating condition.
4 General Discussion
In most VR systems, the vection that is perceivedis often of a changing nature. For example, in the Het-tinger et al. (1990) study, participants viewed displayswhich simulated aerial pitch and roll maneuvers. Al-though simulated flights can occur during which per-ceived speed and heading are relatively steady, much likethe steady conditions of the current study, there are nopublished data that indicate how prevalent SS is underthose conditions.
In the current study, we examined the SS and illusoryexperience of self-motion induced by steady and chang-ing vection displays. Although different procedures wereused in these two experiments, the displays were identi-cal except for duration. Collectively, the results of theseexperiments suggest that a steadily expanding optic flowpattern leads to more overall vection but less SS than apattern that alternately expands and contracts. Thus, ifvection magnitude per se leads to symptoms in virtualenvironments, the steady condition should have led tomore SS, but the opposite result was obtained.
Consider what happens in terms of sensory conflictwhen steady and alternating optical flow patterns areviewed. When the steady pattern is viewed, there is aperiod of vection onset latency followed by a periodduring which vection magnitude increases. During thistime, because nonvisual sensory inputs (e.g., vestibular)respond to changes in speed and direction (and none ofthese are occurring), we would expect a high degree ofvisual/vestibular conflict. In short, the expected set ofvisual and nonvisual inputs is absent (Oman, 1990).After this period of vection acceleration, vection magni-tude typically levels off, yielding a steadier vection per-cept. Hence, when a steady optic flow pattern is viewed,sensory conflicts should only arise at the beginning of a
trial or following a vection dropout. When vection be-comes steadier, sensory conflict should be reduced.
However, changing vection should logically lead to amuch higher degree of sensory conflict. Because mostnonvisual sensory inputs (e.g., vestibular) respond tochanges in both direction and speed, changes in the op-tical flow pattern that are accompanied by unchangingnonvisual input result in a salient conflict. When thestimulus patterns used in the current study alternatelyexpanded and contracted, nonvisual sensory inputs didnot change to correspond with the visual input, result-ing in visual/nonvisual sensory conflict that may havesubsequently led to SS symptoms.
In short, the results of the current study do not refuteresults obtained by others that suggest vection can leadto SS. However, here we suggest that displays that in-duce changing vection should lead to more SS. The cur-rent results are in agreement with previous results ob-tained in our lab using optokinetic drums thatintermittently changed rotation direction (Bonato et al.,2005), changed rotation velocity (Bubka et al., 2006),and were tilted (Bubka & Bonato, 2003). An increaseddegree of sensory conflict should typically accompany anexperience of changing vection, and this in turn may bea causal factor of SS.
Acknowledgments
This research was supported in part by National Aeronauticsand Space Administration grant NNX06AG65G and NationalScience Foundation grant BCS-0447785. Dr. Palmisano wassupported by Australian Research Council Discovery grantDP0772398.
References
Bonato, F., Bubka, A., & Story, M. (2005). Rotation direc-tion change hastens motion sickness onset in an optokineticdrum. Aviation, Space, and Environmental Medicine, 76,823–827.
Brandt, T., Dichgans, J., & Koenig, E. (1973). Differentialeffects of central versus peripheral vision on egocentric and
Bonato et al. 291

exocentric motion perception. Experimental Brain Research,16, 461–491.
Bubka, A., & Bonato, F. (2003). Optokinetic drum tilt has-tens the onset of vection-induced motion sickness. Avia-tion, Space, and Environmental Medicine, 74, 315–319.
Bubka, A., Bonato, F., & Mycewicz, D. (2006). Viewing con-dition affects the salience of self-motion perception. Posterpresented at the annual meeting of the Eastern Psychologi-cal Association.
Bubka, A., Bonato, F., Urmey, S., & Mycewicz, D. (2006).Rotation velocity change hastens motion sickness onset inan optokinetic drum. Aviation, Space, and EnvironmentalMedicine, 77, 811–815.
Fischer, M., & Kornmuller, A. (1930). Optokinetisch ausge-loste bewegungswahrnedhmungen und optokinetischernystagmus. Journal fur Psychologie und Neurolgie (Leipzig),41, 273–308.
Gibson, J. J. (1966). The senses considered as perceptual systems.Boston: Houghton Mifflin.
Hettinger, L., Berbaum, K., Kennedy, R., Dunlap, W., & No-lan, M. (1990). Vection and simulator sickness. MilitaryPsychology, 2, 171–181.
Howard, I. P. (1982). Human visual orientation. Chichester,UK: John Wiley.
Hu, S., Stern, R., Vasey, M., & Koch, K. (1989). Motionsickness and gastric myoelectric activity as a function ofspeed of rotation of a circularvection drum. Aviation, Space,and Environmental Medicine, 60, 411–414.
Kennedy, R. S., Hettinger, L. J., & Lilienthal, M. G. (1989).
Simulator sickness. In G. Crampton (Ed.), Motion and spacesickness. Boca Raton, FL: CRC Press.
Kennedy, R. S., Lane, N. E., Berbaum, K. S., & Lilienthal,M. G. (1993). Simulator sickness questionnaire: An en-hanced method for quantifying simulator sickness. Interna-tional Journal of Aviation Psychology, 3, 203–220.
Oman, C. (1990). Motion sickness: A synthesis and evaluationof the sensory conflict theory. Canadian Journal of Physio-logical Pharmacology, 68, 294–303.
Palmisano, S., Gillam, B., & Blackburn, S. (2000). Global-perspective jitter improves vection in central vision. Percep-tion, 29, 57–67.
Reason, J., & Brand, J. (1975). Motion sickness. London: Aca-demic Press.
Teixeira, R., & Lackner, J. (1979). Optokinetic motion sick-ness: Attenuation of visually-induced apparent self-rotationby passive head movements. Aviation, Space, and Environ-mental Medicine, 50, 264–266.
Tschermak, A. (1931). Optischer raumsinn [Optical sense ofspace]. In A. Bethe, G. Bergnann, G. Emden, & A. Ellinger(Eds.), Handbuch der normalen und pathologischen physiolo-gie (824–1000). Berlin: Springer-Verlag.
Wann, J., & Rushton, S. (1994). The illusion of self-motionin a virtual reality environment. Behavioral and Brain Sci-ences, 17, 338–340.
Young, L., Oman, C., & Dichgans, J. (1975). Influence ofhead orientation on visually induced pitch and roll sensa-tion. Aviation, Space, and Environmental Medicine, 46,264–268.
292 PRESENCE: VOLUME 17, NUMBER 3