Classroom Technology and Motion Sickness A ... - CORE
75
Classroom Technology and Motion Sickness A DISSERTATION SUBMITTED TO THE FACULTY OF THE UNIVERSITY OF MINNESOTA BY Anthony Maurice Mayo IN PARTIAL FULFILLMENT OF THE REQUIREMENTS FOR THE DEGREE OF DOCTOR OF PHILOSOPHY Thomas A. Stoffregen, PhD December 2015 brought to you by CORE View metadata, citation and similar papers at core.ac.uk provided by University of Minnesota Digital Conservancy
-
Upload
khangminh22 -
Category
Documents
-
view
2 -
download
0
Transcript of Classroom Technology and Motion Sickness A ... - CORE

Classroom Technology and Motion Sickness
A DISSERTATION SUBMITTED TO THE FACULTY OF THE
UNIVERSITY OF MINNESOTA BY
Anthony Maurice Mayo
IN PARTIAL FULFILLMENT OF THE REQUIREMENTS FOR THE DEGREE OF
DOCTOR OF PHILOSOPHY
Thomas A. Stoffregen, PhD
December 2015
brought to you by COREView metadata, citation and similar papers at core.ac.uk
provided by University of Minnesota Digital Conservancy

© Anthony M. Mayo 2015

i Acknowledgements
I would like to thank individuals who played an influential role in my professional
development and who provided me with support to undertake and complete this
challenging endeavor. Thomas A. Stoffregen, PhD – Thank you for giving me the
opportunity to pursue graduate work at the highest level. You consistently challenged me
throughout the program enabling me to discover my research interests and to better
understand myself. Your patience during this time of professional and personal
discovery has been deeply appreciated. Michael G. Wade, PhD – Thank you for your
encouragement and for mentoring me to teach motor learning and control. Your
guidance has been invaluable to my teaching career. Maureen R. Weiss, PhD – I owe my
appreciation of the multidisciplinary nature of kinesiology research and my respect for its
sub-disciplines to you. Thank you for encouraging me to take your classes and to explore
topics from a multidisciplinary perspective. David I. Anderson, PhD – This journey
would not have been possible without your mentorship over the years. Your expertise,
encouragement, and guidance have been instrumental in my development as a
kinesiologist. Mom and Dad – Thank you for providing me with the best educational
opportunities that set the foundation for my successes. To my sisters Althea and Cynthia
and their families – Thank you for the emotional support and encouragement throughout
this academic endeavor. Lastly, I would like to acknowledge two individuals no longer
here - Herbert L. Pick, Jr. PhD and Michael A. da Luz. Herb – Thank you for letting me
participate in your research and teaching me how to mentor students. Mike - Thank you
for encouraging me to find my passion. The search led me to the University of
Minnesota. I will be forever grateful to these individuals for this wonderful experience.
ii Dedication
This work is dedicated to my father Maurice A. Mayo. As a young immigrant from the
Philippines, he ventured to Minneapolis-St. Paul in search of the American Dream and
the goal to earn a high school diploma. He eventually achieved the American Dream, but
was not able to fulfill his educational goals. Earning this PhD at the University of
Minnesota is for you, Dad.

iii Abstract
This study was spurred by reports of a presentation software application causing
symptoms of motion sickness in classroom and training environments. Many educators
use presentation applications to help convey ideas and concepts related to course learning
objectives. Thus, presentations that make learners ill can have a serious consequence on
learning. Two experiments were conducted to investigate the influence of classroom
presentations with different optic flow characteristics on symptoms of motion sickness.
In Experiment 1, college-aged students were exposed to either a low optic flow (LOF)
presentation or a high optic flow (HOF) presentation. In Experiment 2, students were
exposed to either a HOF presentation or a moderate optic flow (MOF) one. In both
experiments, students completed a Simulator Sickness Questionnaire (SSQ) (Kennedy,
Lane, Berbaum, and Lilienthal, 1993) before and after instruction to assess severity of
motion sickness. In addition, in both experiments, students completed a quiz that
assessed learning. Wilcoxon Matched-Pairs Signed Rank Tests were conducted to
determine differences in ranking of PRE- and POST-SSQ scores. Differences in quiz
scores between groups were assessed using independent samples t-tests. In Experiment
1, participants who viewed a HOF presentation experienced a significant increase in
simulator sickness symptoms, while those who viewed a LOF presentation did not. In
Experiment 2, participants in both HOF and MOF groups experienced a significant
increase in simulator sickness symptoms. In both experiments, no differences in quiz
scores between groups were found. These results suggest that moderate to high amounts
of optic flow can cause an increase in symptoms of motion sickness in individuals who
view animated instructional presentations.

iv Table of Contents
Acknowledgements………………………………………………………………….. i
Dedication………………………………………………………………………….... ii
Abstract…………………………………………………………………………….... iii
Table of Contents…………………………………………………………………...... iv
List of Tables……………………………………………………………………...…. vii
List of Figures………………………………………………………………………... viii
CHAPTER 1: Introduction and Literature Review………………………………….. 1
Theories of Motion Sickness………………………………………………… 3
Motion Sickness Phenomena……………………...…………………………. 5
Visually Induced Motion Sickness (VIMS)……………...………………….. 6
Measurement of VIMS……………………………………………… 7
Optic Flow and Motion Sickness ……………………………............ 9
Motion Sickness in Educational and Training Settings……............... 11
The Present Study……………………...……………………………............. 15
Rationale for the Study………...……………………………............. 15
Purpose of the Study………...……………………………................. 16
Significance……………………...…………………………….......... 16
Research Questions and Hypotheses…………………………............ 17
CHAPTER 2: Experiment 1………...…………………………….............................. 18
Method……………………….......................................................................... 18
Participants………...……………………………................................. 18
Equipment and Apparatus………...…………………………….......... 19
Presentation tools………………………………….................. 19
Presentation content………………………………….............. 22
Classroom environment………...………………………......... 23
Measurement and Data Analysis........................................................... 23
Severity of motion sickness symptoms………………………. 23
Assessment of learning………………………………………. 24
Procedure……………………….......................................................... 24

v
Results………………………........................................................................... 25
Demographic Data……………………………………………………. 25
Severity of Motion Sickness Symptoms............................................... 26
Wilcoxon Matched Pairs Signed Ranks Test - LOF Presentation........ 26
Wilcoxon Matched Pairs Signed Ranks Test - HOF presentation........ 27
Quiz Scores………………………....................................................... 28
Discussion………………………..................................................................... 29
CHAPTER 3: Experiment 2………………………...................................................... 31
Method………………………........................................................................... 32
Participants………………………........................................................ 32
Equipment and Apparatus………………………................................. 32
Measurement and Data Analysis………………………....................... 32
Procedure……………………….......................................................... 32
Results………………………........................................................................... 33
Severity of Motion Sickness Symptoms............................................... 33
Wilcoxon Matched-Pairs Signed Ranks Test – HOF Presentation...… 34
Wilcoxon Matched-Pairs Signed Ranks Test – MOF Presentation….. 35
Quiz Scores………………………....................................................... 36
Discussion………………………..................................................................... 37
CHAPTER 4: General Discussion…………................................................................ 39
Classroom Presentations and Motion Sickness................................................. 39
Presentation Optic Flow and Learning.............................................................. 41
Limitations........................................................................................................ 41
Design Implications.......................................................................................... 42
Suggestions for Future Research....................................................................... 42
Conclusion........................................................................................................ 44
References……………………………………………………………..……………... 45
Appendix A – Institutional Review Board Approval……………………………….... 54
Appendix B – Simulator Sickness Questionnaire……………………………………. 57

vi
Appendix C – Consent Form………………………………….................................... 59
Appendix D – Demographics Information Form…………………………………..... 61
Appendix E – Summary of Demographics Data…………………………………...... 64

vii List of Tables
Table 1. Ranking of SSQ Data – LOF Presentation (Experiment 1)………………… 27
Table 2. Ranking of SSQ Data – HOF Presentation (Experiment 1) ………………... 28
Table 3. Mean, Standard Deviation, and Standard Error Mean – HOF and LOF
Groups…………………………………………………………………………...…… 29
Table 4. Ranking of SSQ Data – HOF Presentation (Experiment 2)………………… 35
Table 5. Ranking of SSQ Data – MOF Presentation (Experiment 2)………............... 36
Table 6. Mean, Standard Deviation, and Standard Error Mean – MOF and HOF
Groups……………………………………………………………………………...… 37

viii List of Figures
Figure 1. Example of frames connected by paths ………………………………..…. 20
Figure 2. Example of frames organized to demonstrate a concept …………………. 21
Figure 3. Optic flow movements associated with paths ………………….................. 22
Figure 4. Experiment 1 - Means and 95% Confidence Intervals for each condition... 26
Figure 5. Experiment 2 - Means and 95% Confidence Intervals for each condition... 34

1
CHAPTER 1
Introduction and Literature Review
The influence of visually induced motion sickness (VIMS) on performance has
been an interest to scientists for several decades. Research has confirmed that virtual
reality simulations (Kennedy, Berbaum, & Lilienthal, 1997; Kennedy, Fowlkes, &
Lilienthal, 1993; Stanney & Hash, 1998; Stoffregen, Hettinger, Haas, Roe, & Smart,
2000), video games (Merhi, Faugloire, & Stoffregen, 2007; Stoffregen, Faugloire,
Yoshida, Flanagan, & Merhi, 2008), and the operation of hand held mobile devices such
as smart phones and tablets (Stoffregen, Chen, & Koslucher, 2014) can cause nausea or
increase motion sickness symptoms. Recently, anecdotal evidence suggests symptoms of
motion sickness have emerged in technologies used in educational settings. Students
attending classroom lectures or training seminars have reported experiencing motion
sickness symptoms after viewing highly animated instructional presentations.
The use of presentation technology in educational settings is prevalent. Many
textbook publishers offer Microsoft PowerPoint (PPT) presentations as part of their
ancillary materials, and most instructors use PPT or similar applications to create their
own instructional presentations. Also, to support faculty, most institutes of higher
education provide instruction on the use of PPT. For example, the University of
Minnesota’s Center for Teaching and Learning (2010) provides a tutorial on Active
Learning with PPT. Other institutions such as the University of Pennsylvania
(Communication Within the Curriculum, n.d.), Vanderbilt (Center for Teaching, n.d.),
and University of Oregon (Teaching Effectiveness Program, 2015, September 14)

2 provide content on how to use PPT effectively. In addition to providing support for the
use of PPT, some post-secondary institutions provide guidance on the use of other
presentation software applications such as Apple’s Keynote and/or Prezi.
Over the last two decades, the use of technology tools in educational settings has
increased. Before the release of PPT, classroom instructional content was generally
presented visually via blackboards, dry-erase boards, paper handouts, slides, overhead
projectors, or video. Now, instruction can be delivered using technologies that have
visual properties that resemble virtual reality, video games, and other dynamic visual
formats. The Horizon Report, which reflects the collaboration between The New Media
Consortium (NMC) and the Educause Learning Initiative, identifies emerging educational
technology that potentially will influence teaching and learning in higher education. In
2011, the Horizon Report (Johnson, Smith, Willis, Levine, & Haywood, 2011) listed
augmented reality and game-based learning as emerging technologies, and games and
gamification were discussed in 2013 (Johnson et al., 2013).
Contemporary first-person video games give rise to motion sickness in
approximately 30% of users (Stoffregen et al., 2008). Incidence is higher among people
who passively watch games as opposed to those who actively play them (Chen, Dong,
Chen, & Stoffregen, 2012; Dong, Yoshida, & Stoffregen, 2011). Given the large numbers
of people who are exposed to classroom technologies, even a low rate of motion sickness
could result in large numbers of sufferers. Panjwani, Gupta, Samdaria, Curtell, and
Toyama (2010) reported that over 6 million teachers use PPT worldwide. If each of these
teachers taught 25 students, approximately 150,000,000 students would be exposed to
presentation technology. In addition, over 50 million individuals are now users of Prezi

3 (Prezi Blog, 2014), an application that allows users to create presentations with
increased levels of visual motion animation. If 250,000 (or 0.5%) of Prezi users create
presentations for educational or training purposes, and if they teach approximately 25
students, then 6.25 million students would be exposed to potentially nauseogenic
animation. If 5% of students exposed to Prezi experienced motion sickness symptoms,
then there would be 312,500 people suffering from motion sickness in educational and
training settings. Given that the purpose of instruction is to enable students to achieve
learning objectives, classroom presentations that make people sick can hinder students
from achieving those goals.
Theories of Motion Sickness
The most widely accepted explanation for the etiology of motion sickness is based
on sensory rearrangement theory, also known as sensory conflict theory (Reason, 1978;
Reason & Brand, 1975). This theory suggests that motion sickness is the result of a
discrepancy between sensory inputs from the visual and vestibular system and stored
internal programs generated based on previous interactions with the environment
(Reason, 1978). Motion signals transmitted by the visual, vestibular and non-vestibular
proprioceptors conflict with each other and hence with what is expected. This conflict
results in motion sickness because the current stimulation does not match the stored
expectations.
With respect to VIMS, sensory conflict might occur in the absence of inertial
motion when visually induced motion is not validated by vestibular inputs. Hettinger,
Berbaum, Kennedy, Dunlap, and Nolan (1990) performed one of the first studies
confirming that provocative visual stimuli could induce motion sickness. After

4 completing a pre-motion sickness questionnaire, participants were exposed to a fixed-
based visual flight simulator that displayed aerial self-motion. After exposure,
participants reported whether or not they experienced illusory self-motion (i.e., vection)
and completed a post-motion sickness questionnaire. Hettinger et al. (1990) found that
80% of individuals (8 out of 10) who reported experiencing vection also experienced
motion sickness. In contrast, only 20% of individuals (1 out of 5) who reported
experiencing no vection became sick. The researchers suggested that heredity and
experience moving in the world might determine if an individual experienced VIMS.
Specifically, some people who were exposed to provocative visual stimuli may have been
more susceptible to motion sickness than others, and moving in an environment created a
tight coupling between the visual and sensory (e.g., vestibular and proprioceptive)
systems. A novel situation where visual inputs were not consistent with vestibular or
proprioceptive inputs caused motion sickness.
One of the criticisms of sensory conflict theory is that while it offers an
explanation for motion sickness, it has low predictive validity regarding which “sensory
rearrangements will result in sickness symptoms and which will not, and it is unclear as
to what constitutes a sensory rearrangement” (Draper, Viirre, Furness, & Gawron, 2001,
p. 130). Ricco and Stoffregren (1991) provided an alternate theory to explain motion
sickness etiology – postural instability theory. They postulated that the root cause of
motion sickness was related to changes in the constraints that influence postural control,
not sensory conflict with internal models. Posture subserves goal directed movement;
thus the ability to maintain postural control is necessary to accomplish goals. Individuals
can experience motion sickness in novel situations that disrupt postural control.

5 According to postural instability theory, some situations such as operating a
simulator or playing a video game may compromise control of the head and torso. In
these situations, the visual stimuli, which represent simulations of observer motion,
destabilize posture. The observer must search for a new postural control strategy to
stabilize the head and torso. If an appropriate strategy is not found, VIMS can occur.
Postural instability theory accepts the premise that motion sickness occurs in settings
where changes in the patterns of multiple sensory stimulation are likely to occur.
However, Riccio and Stoffregen (1991) also considered the ecology of the interaction
between animal and environment in these nauseogenic situations.
Motion Sickness Phenomena
Motion sickness is the term used to describe the many signs and symptoms felt by
animals exposed to certain types of motions (Hettinger et al., 1990; Money, 1970). These
motions are generally associated with modes of transportation such as ships, trains,
automobiles, and aircrafts. The earliest documented evidence for this malady can be
found as far back as the ancient Greeks. In his work On the Nature of Man, Hipprocates
wrote, “sailing on the sea shows that motion disorders the body” (Money, 1970, p. 2).
Other forms of transit have also been linked to motion sickness. For instance,
travel via domesticated animals can be nauseogenic (Guignard & McCauley, 1990).
During the 19th century, some individuals riding in carriages or stagecoaches experienced
motion sickness as they crossed the North American continent to settle the West
(Helmich, 2008). In addition, people riding on camels and elephants have also reported
experiencing motion sickness (Guignard & McCauley, 1990). Interestingly, people
riding on horses rarely report experiencing motion sickness. Another form of

6 transportation that has been associated with motion sickness is passive travel. In this
situation, a seated individual who is carried by people walking in unison (generally in a
ceremonial procession) experiences motion sickness.
Clearly, individuals have experienced motion sickness in a variety of settings
across the millennia. With the exception of traveling across country in stagecoach, all of
the above mentioned modes of transportation are still viable methods for travel.
Remarkably, these modes share a commonality with respect to movement characteristics
– low frequency oscillatory movement within the range of 0.1 to 1.0 Hz (Guignard &
McCauley, 1990).
Visually Induced Motion Sickness (VIMS)
VIMS is a unique variant of motion sickness. According to Smart, Stoffregen,
and Bardy (2002), VIMS is a side effect of “exposure to optical depictions of inertial
motion” pg. 451. Thus, it is related to motion that is seen and not felt. In contrast,
motion sickness related to travel is associated with physical oscillations of a vehicle,
animal, or carrying device.
VIMS is not a new phenomena. Wood (1895) reported that the Haunted Swing, a
carnival-like attraction that exposed seated patrons to oscillating visual motion, caused
several customers to experience dizziness and nausea. However, the prevalence of VIMS
has recently increased in training and entertainment settings. Cutting-edge hardware and
software technology used in training simulators, video games, and movies that create
realistic visual images is the likely cause of VIMS.
While the environment in which these two forms of motion sickness may differ
(i.e., in-motion versus stationary), traditional forms of motion sickness and VIMS share a

7 commonality with respect to what is felt and what is viewed. Similar to motion sickness
associated with travel, low frequency oscillations are related to VIMS. However, in the
case of VIMS, low frequency oscillations of optic motion can cause nausea or an increase
in motion sickness symptoms. Hettinger et al. (1990) reported that individuals observing
visual patterns between 0.15 and 0.25 Hz while seated in a flight simulator experienced
VIMS. In addition, Stoffregen and colleagues have found that participants exposed to
oscillating visual stimuli ranging between 0.0167 and 0.3100 Hz experienced motion
sickness (Smart et al., 2002; Villard, Flanagan, Albanese, & Stoffregen, 2008).
Moreover, Diels and Howarth (2013) reported that VIMS peaked between the ranges of
.2 and .4 Hz when individuals viewed optic flow oscillations in the fore-aft direction.
Measurement of VIMS
The Simulator Sickness Questionnaire (SSQ) developed by Kennedy et al. (1993)
is one instrument commonly used to assess VIMS. It measures symptoms associated
with VIMS that occur in simulators or simulator-like environments such as fatigue,
headache, eyestrain, nausea, difficulty concentrating, and vertigo. The SSQ has been
used in a variety of contexts. For instance, scientists have used the SSQ to assess
symptoms of motion sickness that might arise as the result of playing video games (Dong
et al., 2011; Merhi et al., 2007; Stoffregen et al., 2008), interacting with mobile
technology (Pölönen, Järvenpää, & Häkkinen, 2012; Stoffregen et al., 2014), watching 3-
D movies (Solimini, 2013), and operating military aircraft (Kennedy et al., 1997;
Stoffregen et al., 2000) or vehicular training simulators (Lee, Yoo, & Jones, 1997;
Mourant & Thattacherry, 2000).

8 The SSQ is a validated instrument that was developed specifically to assess
motion sickness that occurs in simulated training environments. Prior to the
implementation of the SSQ, the Pensacola Motion Sickness Questionnaire (MSQ) was
the instrument used to assess motion sickness in real and simulated training environments
(Kennedy et al., 1993). However, many of the variables assessed by the MSQ were not
applicable to training in simulators. For example, vomiting or emesis an important sign
of motion sickness rarely occurs in a simulated environment. To determine the variables
specific to simulator sickness, Kennedy et al. (1993) assessed 1,119 pairs of pre- and
post-test MSQ data from 10 simulator locations. Variables included on the MSQ not
associated with simulator sickness were eliminated. Kennedy et al. (1993) then
performed a factor analysis to create symptom clusters or independent subscales. The
analysis revealed three dimensions: oculomotor, disorientation, and nausea. The
oculomotor dimension includes symptoms that are associated with the visual system such
as eyestrain, difficulty focusing, blurred vision, and headache. In contrast, the
disorientation dimension includes factors such as dizziness and vertigo, while the nausea
dimension contains factors related to gastrointestinal distress such as feelings of nausea,
stomach awareness, increased salivation and burping.
The SSQ is given twice during an experiment – prior to the presentation of visual
stimuli and immediately afterward. The initial presentation of the questionnaire enables
participants to become familiar with symptoms of motion sickness and provides baseline
data to compare pre- and post-motion sickness symptom states (Bonnet, Faugloire, Riley,
Bardy, & Stoffregen, 2006; Dong et al., 2011; and Stoffregen & Smart, 1998). Scores for
each dimension and an index of Total Severity (TS), a score that represents a weighted

9 average of the three dimensions, can be calculated. According to Kennedy et al. (1993),
the maximum TS that can be achieved on the SSQ is ~300. However, much lower scores
are typically reported and can be associated with simulator sickness symptoms. For
example, Kennedy et al. (2003) reported that TS scores between 10 and 15 identify a
simulator associated with significant symptoms, while a TS score between 15 and 20
identifies a more troublesome simulator. A score greater than 20 indicates a problem
simulator. In these situations, participants might not feel sick, but analysis of the SSQ
scores indicate an increase in symptoms of simulator sickness. With respect to the use of
the SSQ to measure motion sickness in video games, Stoffregen et al. (2008) reported
that high TS score are only reported when participants expressed that they felt motion
sick. Kennedy et al. (1993) reported that the distribution of SSQ scores tend to be
skewed. Since scores are not normally distributed, non-parametric tests are used to
compare within and between group pre- and post-test scores.
Optic Flow and Motion Sickness
The situations and contexts where motion sickness occurred due to non-inertial
factors share one commonality – individuals were exposed to optic flow. Optic flow
refers to the spatio-temporal pattern of light rays that impinges on the retina. This
concept was introduced by Gibson (1950) to describe the visual information perceived by
an animal as it moved in its environment. Visual stimuli observed by an animal can
translate in a variety of directions, rotate about different axes, and expand and contract.
Gibson (1957) identified six parameters of optic motion: (a) vertical translation, (b)
horizontal translation, (c) enlargement (i.e., looming or zooming) or reduction (i.e.,
contracting), (d) horizontal foreshortening, (e) vertical foreshortening, and (f) rotation.

10 While listed as separate phenomena, these factors can also be integrated. For instance,
an individual may perceive an object translate horizontally while it simultaneously
enlarges. Under certain conditions, viewing specific types of optic motion can cause
feelings of motion sickness.
However, an animal is not required to locomote to experience optic flow. Using a
moving room, Lee and colleagues (Lee & Aronson, 1974; Lee & Lishman, 1975) first
demonstrated that individuals would make postural adjustments in response to the optic
stimuli produced by the moving room. Lee and Aronson (1974) found that when infants
were exposed to optic flow that expanded toward them (i.e., the room moved toward
them), they fell backward. When the room moved away from them (i.e., optic flow
contracted), the infants fell forward. Using the same paradigm, Lee and Lishman (1975)
found that adults also compensated posturally in response to optic flow. However, in
their experiments adults did not fall; they swayed backward in response to expanding
optic flow, specifying forward motion, and forward in response to contracting optic flow
specifying backward motion.
Clearly, optic flow can profoundly influence balance, but can it induce motion
sickness? Researchers have empirically examined the relationship between optic motion
and motion sickness and the answer is yes. Using a flight simulator, Stoffregen et al.,
(2000) demonstrated that motion sickness or symptoms of motion sickness could occur
when individuals viewed visual stimulations that oscillated in the roll axis. Keshavarz
and Hecht (2011) reported similar findings when individuals were exposed to one of
three computer generated roller coaster rides. While all three roller coaster rides included
translational movement in the sagittal direction, the conditions varied in the axis of

11 rotational motion. One group was exposed to visual stimuli primarily in the pitch axis,
another group was exposed to visual motions primarily about pitch and roll axes, and a
third group was exposed to visual stimuli primarily in the pitch, roll, and yaw axes. All
three conditions elicited an increase in severity of motion sickness symptoms. These
findings suggested that viewing rotating movements could elicit motion sickness or
symptoms of motion sickness.
Other types of optic motions such as vertical oscillations and expanding and
contracting visual stimuli may be related to motion sickness or an increase in motion
sickness symptoms. Bubka, Bonato, and Palmisano (2007) investigated the relationship
between expanding and contracting optic flow on simulator sickness. In their
experiment, individuals viewed two visual patterns on a desktop computer monitor with
monocular vision and the conditions were viewed at separate times. In one condition, the
optic flow of the visual stimuli expanded toward the individual. In the other condition,
the visual stimuli contracted away from the individual. Bubka et al. (2007) reported that
expanding optic flow was related to an increase in motion sickness compared to
contracting optic flow. In a follow up study, Palmisano, Bonato, Bubka, and Folder,
(2007) found that vertical oscillating radial optic flow produced more motion sickness
than non-oscillating radial flow displays.
Motion Sickness in Educational and Training Settings
Simulators and virtual reality environments have been used extensively in
education and training settings. For instance, they have been used to train surgeons to
perform laparoscopic surgery techniques (Ali, Mowery, Kaplan, & DeMaria, 2002;
Rosenberg, Landsittel, & Averch, 2005; Rosser et al., 2007), to evaluate and to train

12 pilots (Jones, Kennedy, & Bittner, Jr., 1981), to teach levee patrollers to inspect for
structural damages that may cause levees to fail (Harteveld & Bidarra, 2007), to help
stroke patients improve motor function (Cameirão, Badia, Oller, & Verschure, 2010;
Holden, Todorov, Callahan, & Bizzi, 1999), and to teach middle school children concepts
related to astronomy (Chen, Yang, Shen, & Jeng, 2007) and mathematics (Bai, Pan,
Hirumi, & Kebritchi, 2012; Ke, 2008).
Training simulators and virtual reality environments provide a number of benefits
to individuals learning new skills. According to Magill and Anderson (2013) benefits of
these devices include: (a) enabling learners to practice without concern for the costs of
accident associated with practice in real environments, (b) allowing trainers to more
easily control specific characteristics of the training environment, and (c) permitting
learners to practice for longer durations and intensity. In addition, Kennedy, Lilienthal,
Berbaum, Baltzley, and McCauley (1989) indicated that flight simulators enable trainees
to experience emergency training situations, can provide trainees with knowledge of
performance feedback, and can reduce operational costs.
However, while simulators and virtual reality environments provide many training
benefits, VIMS is a negative side-effect for some participants who interact with these
technological devices. In these situations, the optic flow designed into the system to
create a realistic experience or a sense of presence caused VIMS. Kennedy and his
colleagues (Kennedy et al., 1989, 1997) and Stoffregen et al. (2000) reported that
participants exposed to optic flow while operating flight simulators experienced motion
sickness. In the context of driving simulators, Brooks et al. (2010), Lee et al., (1997),
and Mourant and Thattacherry (2000) reported similar findings. Some classroom

13 technologies can now display optic flow characteristics traditionally associated with
simulators and virtual environments. For example, research conducted by Stoffregen et
al. (2014) demonstrated that playing a video game on a computer tablet caused motion
sickness.
A case of VIMS was reported to have occurred at a school setting in Japan on July
8th, 2003 (Kuze & Ukai, 2008; Ujike, 2007; Ujike, Ukai, & Nihei, 2008). According to
reports, 36 junior high school students were hospitalized for motion sickness like
symptoms after viewing a 20-minute video. To investigate the possible causes that led to
students experiencing VIMS, Ujike et al. (2008) surveyed the students who watched the
video, interviewed school officials, and assessed the environment where the video was
presented. The authors found that headache, nausea, and cold sweat were the motion
sickness symptoms reported most frequently. In addition, they suggested that the severity
of VIMS was related to visual angle as those who sat in the front row and middle of the
room reported greater amounts of symptom severity than students who sat in the back
row. Moreover, those who concentrated more on the content experienced greater motion
sickness; however, student interest did not influence motion sickness severity.
Recently, students attending classroom lectures or training seminars have reported
experiencing motion sickness symptoms after viewing highly animated instructional
presentations (Conboy, Fletcher, Russell, & Wilson, 2012). Instructional presentations
that make people sick are problematic given that the purpose of instruction is to enable
students to achieve learning objectives. The presentation software that is anecdotally
linked to motion sickness in the learning environment is Prezi.

14 This software application allows instructors to create fascinating, animated
presentations where objects can translate or pan across the screen, rotate, zoom out, and
contract relative to the visual display. This feature allows instructors and designers to
create presentations with greater visual motion compared to traditional presentation
software such as PowerPoint. In addition, instructors and designers can arrange content
spatially enabling students to see how concepts are connected. Conboy et al. (2012)
conducted a focus group on the effectiveness of Prezi to facilitate learning in
undergraduate students. They reported that some students liked Prezi because it
functioned “like a mind map” which enabled them to integrate concepts. Another finding
was that students found Prezi to be more engaging. However, the authors cautioned that
student engagement in this context might be associated with Prezi’s novelty. Moreover,
Virtanen, Myllärniemi, and Wallander (2013) reported that students who used Prezi to
complete assignments felt that the application facilitated brainstorming and enabled them
to make connections with course content. However, while this technology may permit an
instructor to create captivating presentations and enable students to better understand
concepts, anecdotal reports have also linked Prezi presentations to motion sickness.
After Prezi’s release to market, several technology bloggers reported either
personally experiencing motion sickness symptoms or accounts of individuals
experiencing sickness. Leberecht (2009) of CNET indicated several Prezi presentations
that he viewed included transitions that caused him to experience dizziness. In addition,
Wired blogger Allain (2010) reported that viewing a Prezi presentation induced
headache, a symptom of motion sickness. Moreover, Salter (2012, June 28), a blogger
for The Chronicle of Higher Education mentioned that Prezi often “gets a bad reputation

15 for causing motion sickness.” Walton (2011) coined the phrase “Death by motion
sickness in Prezi” to describe the nauseogenic effects of Prezi. In addition to these
reports from bloggers, Conboy et al. (2012) reported that some students participating in
their focus group indicated that they experienced dizziness while using Prezi. Brown
University (2014) presents a list of eight reasons why faculty should not use Prezi.
Students experiencing motion sickness is one reason listed.
Since its release in 2009, the number of Prezi users has grown substantially. In
December 2011, Prezi announced that they reached 5 million users (Prezi, 2011,
December 9). Two years later, Bort (2013) reported that over 30 million individuals used
Prezi. In November 2014, Prezi (Prezi Blog, 2014) announced that over 50 million
individuals use the application. Given the number of users, millions of students in
educational and training settings could be exposed to nauseogenic visual motion. As
such, anecdotal evidence is not sufficient to allow instructors and designers to create
pedagogically and andragogically sound presentations that take advantage of Prezi’s
features. Controlled experimental research is needed to determine the risk or prevalence
of motion sickness associated with presentations with high optic flow, and to determine
factors that may affect (i.e., increase or decrease) that risk.
The Present Study
Rationale for the Study
Motion sickness can affect individuals in a variety of settings and can occur in
situations without physical motion related to travel. The culprit in many of these settings
is optic flow. Empirical research has been conducted to understand the factors related to
motion sickness in flight or vehicle simulators, virtual reality environments, and video

16 games. The reports of individuals experiencing motion sickness or symptoms of
motion sickness while observing a presentation created in Prezi are speculative. The
reports have not been verified through scientific research.
Purpose of the Study
The purpose of this study was three-fold. The first purpose was to determine
whether a lecture presentation that incorporates optic motion could induce VIMS or
symptoms of VIMS. While anecdotal evidence has suggested commercial presentation
software may cause symptoms of motion sickness, the relationship has not been
empirically tested. The second purpose was to evaluate whether elevated motion
sickness symptoms would impact academic performance in a classroom setting. The
third purpose was to identify strategies that could be used by instructors and/or
instructional designers to create presentations with optic flow that will not induce feelings
of motion sickness. The objective is not to determine whether Prezi is a good or bad
medium for instruction, but to examine how optic flow characteristics could influence
motion sickness in classroom environments.
Significance
The use of animation in instruction can enable students to focus on relevant
information that can help them attain learning objectives. However, a presentation that
induces motion sickness or symptoms related to motion sickness will likely interfere with
the learning process. This study may identify strategies to help instructors and designers
to create animated presentations that will not induce nausea or feeling of motion sickness
to enable their students to attain learning objectives.

17 Research Questions and Hypotheses
Students and trainees rarely experience motion sickness when viewing a PPT. In
contrast, people have reported experiencing motion symptoms while view a presentation
designed using Prezi. The optic flow characteristics of some Prezi presentations are the
likely cause of these symptoms. Based on the literature that examined the relationship
between optic flow and motion sickness, the following predictions were made:
H1: Participants who view a HOF presentation will experience a significant increase in
simulator sickness symptoms, while participants who view a LOF presentation will not
experience a significant increase in simulator sickness symptoms.
H2: Participants who view a HOF presentation will have lower quiz scores than
participants who view a LOF presentation.
H3: Participants who view a HOF presentation will experience a significant increase in
simulator sickness symptoms, while participants who view a moderate optic flow (MOF)
presentation will not experience a significant increase in simulator sickness symptoms.
H4: Quiz scores will be higher for participants who view a presentation with MOF
compared to students who view a HOF instructional presentation.
Note: With respect to H1 and H3, participants who view a HOF presentation will
experience a significant increase in simulator sickness as observed in SSQ difference
scores, but will not vomit. As indicated by Kennedy et al. (1993), vomiting rarely occurs
in simulated environments. In addition, the magnitude of the SSQ scores will be low, but
within-group differences for the HOF groups will be significantly different. This
prediction is aligned with Kennedy et al.’s (2003) finding that low scores could reveal a
problematic simulator that could cause motion sickness.

18
CHAPTER 2
Experiment 1
Anecdotal evidence suggests that animated instructional presentations may cause
feelings of motion sickness during classroom lectures or corporate trainings sessions;
however, scientific research has not confirmed or refuted these reports. Experiment 1
was designed to determine whether instructional presentations with HOF characteristics
could induce symptoms of motion sickness in a classroom setting. In addition, the effect
of viewing a potentially nauseogenic presentation on academic performance was
assessed. This study was conducted during Spring Semester 2013 at the University of
Minnesota according to procedures approved by the University of Minnesota Institutional
Review Board - Study No.: 1211P24423 (see Appendix A).
Two predictions were made: (a) participants who view a HOF presentation will
experience a significant increase in simulator sickness symptoms, while participants who
view a LOF presentation will not experience a significant increase in simulator sickness
symptoms (H1) and (b) participants who view a HOF presentation will have lower quiz
scores than participants who view a LOF presentation (H2).
Method
Participants
Sixty-five students (39 Females; 26 males) enrolled in two sections of
Kinesiology 3135 – Motor Learning and Control – participated in this experiment. Of the
65 students, 36 participants (22 Females: Mean Age = 20.95, SD = 1.33, 14 Males: Mean
Age = 21.36, SD = 1.82) attended the class where the PPT presentation was given and 29

19 students (17 Females: Mean Age = 20.35, SD = .61, 12 Males: Mean Age = 21.25,
SD = 1.60) attended the class where Prezi was used as the presentation media. Using
random assignment (i.e., a coin flip), Section 001, which met on Fridays from 9:05 am to
11:00 am, was assigned to the HOF group, while Section 005, which met on Wednesday
from 9:05 to 11:00 am, was assigned to the LOF group.
Equipment and Apparatus
Presentation tools. The presentation tools used to examine the relationship
between animated instructional presentations and motion sickness were Microsoft PPT
and Prezi. PPT was selected as it represents commonly used presentation software in the
academic environment. PPT has been available to the general public since its launch in
1990. PPT presentations typically are designed with little animation or optic flow.
Students rarely experience symptoms of motion sickness when viewing a PPT
presentation. Prezi was chosen because it has been associated with motion sickness in
classroom and training environments.
Two features unique to Prezi are its use of zoomable user interface (ZUI)
technology and non-linear sequencing of frames. The ZUI technology allows instructors
and designers to create presentations with visual motion in X, Y, and Z planes relative to
the visual display. The non-linear sequencing feature allows content to be spatially
arranged on a “canvas.” In contrast to PPT, content is not organized on slides that are
shown in a specific sequence. Content is contained within frames, and paths are used to
connect frames, which establishes the order of the content. Figure 1 provides an example
of how frames are connected by paths. In this example, the navigation results in
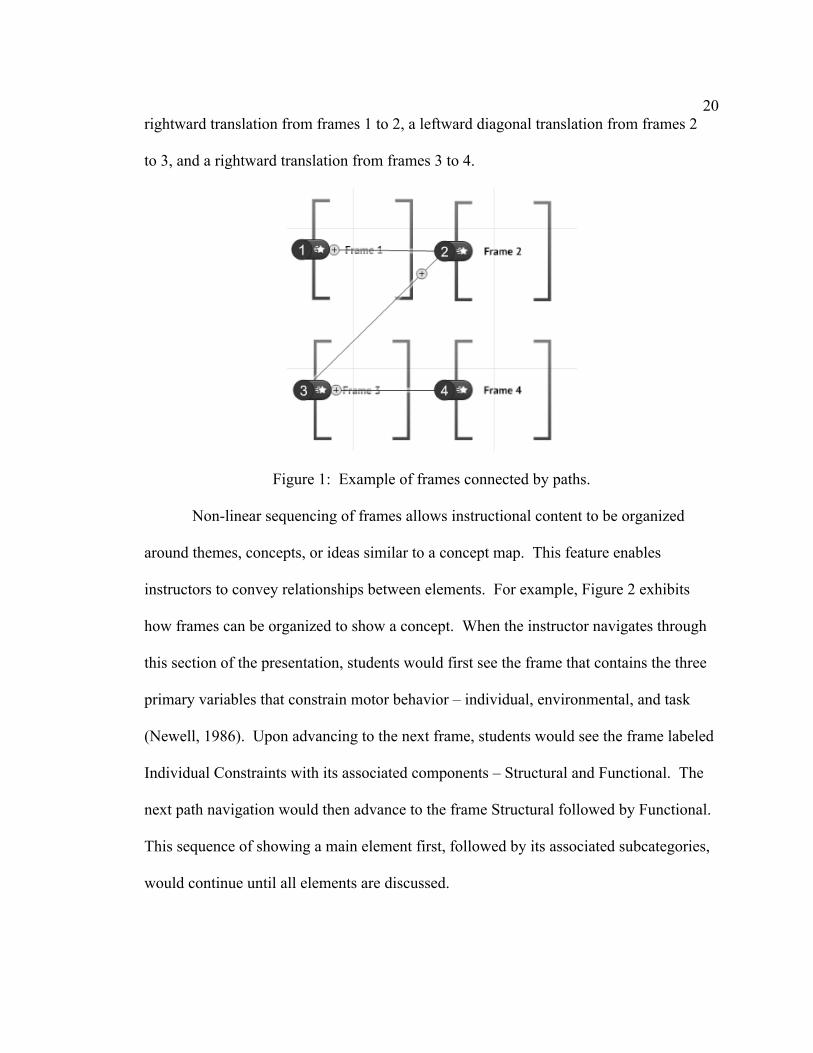
20 rightward translation from frames 1 to 2, a leftward diagonal translation from frames 2
to 3, and a rightward translation from frames 3 to 4.
Figure 1: Example of frames connected by paths.
Non-linear sequencing of frames allows instructional content to be organized
around themes, concepts, or ideas similar to a concept map. This feature enables
instructors to convey relationships between elements. For example, Figure 2 exhibits
how frames can be organized to show a concept. When the instructor navigates through
this section of the presentation, students would first see the frame that contains the three
primary variables that constrain motor behavior – individual, environmental, and task
(Newell, 1986). Upon advancing to the next frame, students would see the frame labeled
Individual Constraints with its associated components – Structural and Functional. The
next path navigation would then advance to the frame Structural followed by Functional.
This sequence of showing a main element first, followed by its associated subcategories,
would continue until all elements are discussed.

21
Figure 2: Example of frames organized to demonstrate a concept.
These features allow instructors and designers to create presentations with greater
amounts of optic flow compared to traditional presentation software such as PowerPoint.
For instance, sequential frames that are arranged haphazardly on the canvas can create an
optic flow of translational movements with frequent shifts in direction. Frames ordered
in this way would require observers to shift their gaze frequently, which could induce
simulator sickness or an increase in symptoms. In addition, paths that connect frames
that differ in size would create an optic flow that could consist of one or more of the
following optic motions: (a) translation (horizontal, vertical, diagonal, forward, and
backward), (b) contraction, and (c) expansion. These optic motions can induce simulator
sickness or an increase in simulator sickness symptoms. Figure 3 is a screen shot of the
Prezi canvas with frames that are spatially arranged that would create a high amount of

22 optic flow. The path that connects frames 16 and 17 is associated with forward and
downward rotation, contraction, and expansion. The next path that connects frames 17 to
18 is associated with forward and leftward translation, rotation, contraction, and
expansion. Finally, the path that connects frames 18 and 19 is associated with forward
and rightward translation, rotation, contraction, and expansion.
Figure 3: Optic flow movements associated with paths.
Presentation content. Two presentations on the topic “Sensory Components of
Motor Control” were designed and developed using PPT and Prezi. The PPT file
represented a “typical” presentation given during an in-class lecture. It consisted of text,
digital images, and embedded movie clips. Animation included in the PPT file consisted
of the dissolve setting for text, and zoom or appear settings for digital images. The optic
flow characteristics of the PPT presentation were considered low. The presentation
created using Prezi took advantage of Prezi’s ZUI technology and non-linear presentation

23 features. This presentation included a variety of animated movements - zooming,
contracting, rotation and translation (vertical, horizontal, and diagonal). One or more of
these motions could occur when navigating frame-to-frame. In addition, frame-to-frame
path sequencing was not spatially organized with respect to content. This created longer
translational movements and changes in direction of optic motion. The optic flow
characteristics for the Prezi were considered high. Instructional content included in the
PPT and the Prezi files were the same.
Classroom environment. The experiments took place in Rapson Hall 54. This
classroom was designed to seat 73 students. The configuration of the room consisted of 8
rows of tables. The first 6 rows had 10 seats per row. Due to the position of the
audiovisual room, there were fewer seats in the seventh and eighth rows. These rows
consisted of seven and six seats respectively. Rows 1 and 2 were positioned at ground
level; rows 3, 4, and 5 were elevated 12 inches above ground level; and rows 6, 7, and 8
were elevated 24 inches above ground level.
The audiovisual system projected media onto a screen that was 2.13 m high by
3.66 m wide. The distance from the center of the first row to the projector screen was
3.81 m. The second row was 4.9 m from the screen. Rows 3 through 8 were 6.24 m,
7.56 m, 8.88 m, 10.20 m, 11.52 m, and 12.84 m away from the screen. The screen
resolution was set to 1024 x 768.
Measures and Data Analysis
Severity of motion sickness symptoms. The severity of motion sickness
symptoms was assessed using the Simulator Sickness Questionnaire (SSQ) created by
Kennedy et al. (1993) (see Appendix B). For this experiment, only TS was computed and
24 analyzed since the goal was to determine if a HOF presentation could cause symptoms
of motion sickness. Since SSQ data are non-parametric, a two-sample paired Wilcoxon
Signed Rank Test was used to compare differences in PRE-SSQ and POST-SSQ within
each condition (i.e. class section). Effect Size (ES) was calculated using the equation
ES = r = z-score/SQRT (n) based on the recommendation by Pallant (2007). ES was
interpreted using Cohen (1988) criteria.
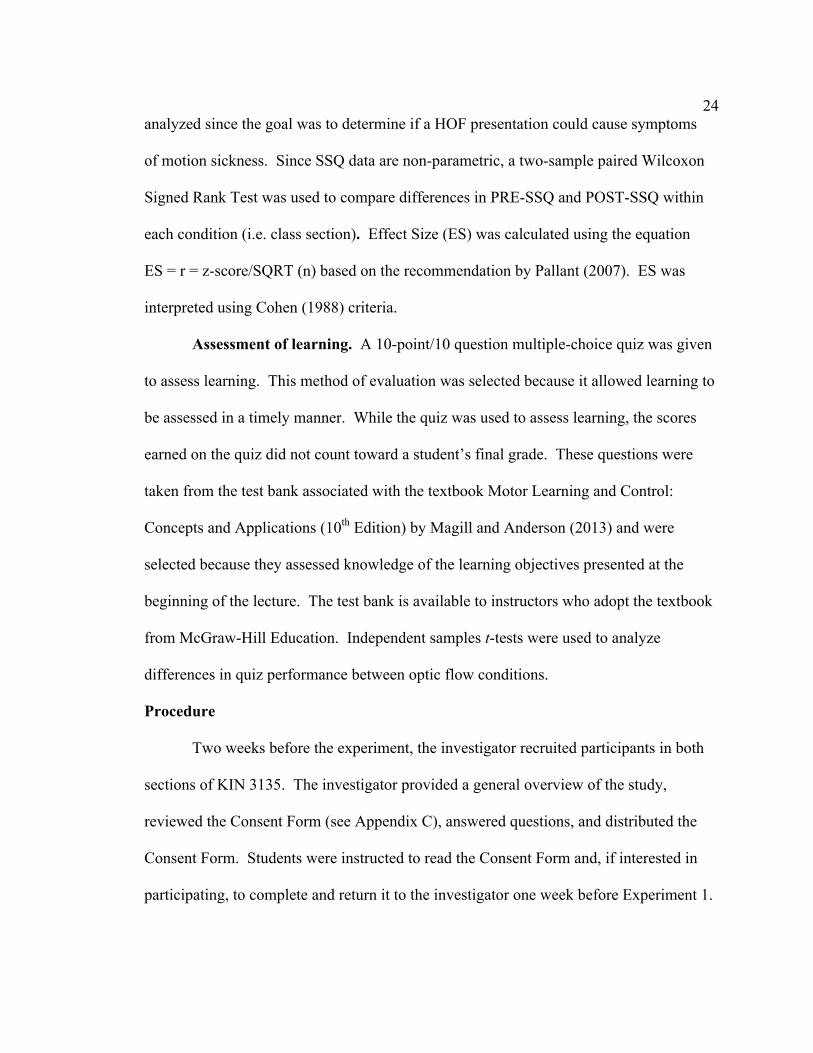
Assessment of learning. A 10-point/10 question multiple-choice quiz was given
to assess learning. This method of evaluation was selected because it allowed learning to
be assessed in a timely manner. While the quiz was used to assess learning, the scores
earned on the quiz did not count toward a student’s final grade. These questions were
taken from the test bank associated with the textbook Motor Learning and Control:
Concepts and Applications (10th Edition) by Magill and Anderson (2013) and were
selected because they assessed knowledge of the learning objectives presented at the
beginning of the lecture. The test bank is available to instructors who adopt the textbook
from McGraw-Hill Education. Independent samples t-tests were used to analyze
differences in quiz performance between optic flow conditions.
Procedure
Two weeks before the experiment, the investigator recruited participants in both
sections of KIN 3135. The investigator provided a general overview of the study,
reviewed the Consent Form (see Appendix C), answered questions, and distributed the
Consent Form. Students were instructed to read the Consent Form and, if interested in
participating, to complete and return it to the investigator one week before Experiment 1.

25 The investigator collected the Consent Form in each class one week before the
experiment.
The experiment took place on Wednesday, February 20th and Friday, February
22nd. On those dates, a packet consisting of PRE- and POST-SSQs, a Demographics
Information Form (see Appendix D), and the quiz was placed on each desk. The
Demographics Information Form collected information such as age, sex, seat location,
video game playing experience, and physical activity experience. Upon entering the
classroom, students were informed that they could choose their own seat. They were also
instructed to not examine the packet. Prior to the start of the lecture, students were
reminded that participation was voluntary and that they could drop out at any time. In
addition, they were instructed to look away or close their eyes if they experienced
symptoms of motion sickness. Students were then instructed to complete the PRE-SSQ
Form and the Demographic Information Form. In addition, they were asked not to view
the quiz. The lecture started once both forms were completed. Students were instructed
to attend to course material as they would in any other class. Both HOF and LOF
presentations were designed to be delivered in approximately 75 minutes. At the end of
each lecture, participants completed the POST-SSQ Form followed by the quiz.
Results
Demographic Data
The demographics data is summarized in tables located in Appendix E. These
tables provide a summary of video gaming experience and a summary of physical activity
with respect to American College of Sports Medicine (ACSM) recommendations for
weekly exercise. The data in these tables include information from Experiments 1 and 2.

26 The data was organized in this manner because many students participated in both
experiments. Sports or Physical Activity Experience was not summarized, as there was
no consistent pattern in self-reports of physical activities. Due to the small sample size,
statistical power is reduced. Therefore, demographic data were not analyzed.
Severity of Motion Sickness Symptoms
The means and 95% confidence intervals for each condition are presented in
Figure 4. POST-SSQ scores increased in both LOF and HOF presentation conditions.
0 5
10 15 20 25 30 35 40
LOF PRE-SSQ LOF POST-SSQ HOF PRE-SSQ HOF POST-SSQ
Figure 4: Experiment 1 - Means and 95% Confidence Intervals for each condition.
Wilcoxon Matched-Pairs Signed Ranks Test – LOF Presentation
A Wilcoxon Matched-Pairs Signed Rank Test was conducted to determine
differences in the ranking of PRE- and POST-SSQ scores for students who viewed the
LOF presentation. Positive and negative ranks based on the difference between POST-
SSQ and PRE-SSQ scores, as well as ties, are presented in Table 1. Results of the
analysis indicated a non statistically significant differences between PRE- and POST-
SSQ scores, z = -1.805, p = .071, with a moderate effect size (ES = .30). The mean
POST-SSQ score (25.868) was not significantly greater than mean PRE-SSQ score

27 (19.531) for students who viewed the LOF presentation.
Table 1
Ranking of SSQ Data – LOF Presentation (Experiment 1)
Rank N Mean Rank Sum of Ranks
Negative 9a 16.11 145.00
Positive 21b 15.24 320.00
Ties 6c
Total 36
Note. a) POST-SSQ < PRE-SSQ, b) POST-SSQ > PRE-SSQ, and c) POST-SSQ = PRE-SSQ
Wilcoxon Matched-Pairs Signed Ranks Test – HOF Presentation
A Wilcoxon Matched-Pairs Signed Rank Test was conducted to determine
whether there were differences between the ranking of PRE- and POST-SSQ scores for
students who viewed the HOF presentation. Positive and negative ranks based on the
difference between POST-SSQ and PRE-SSQ scores, as well as ties, are presented in
Table 2. Results of the analysis indicated a statistically significant difference between
PRE- and POST-SSQ scores, z = - 2.914, p < .05, with a large effect size (ES = .541).
The mean POST-SSQ score (21.795) was significantly greater than PRE-SSQ score
(14.057) for students who viewed the HOF presentation.

28 Table 2
Ranking of SSQ Data – HOF Presentation (Experiment 1)
Rank N Mean Rank Sum of Ranks
Negative 6a 5.33 32.00
Positive 15b 13.27 199.00
Ties 8c
Total 29
Note. a) POST-SSQ < PRE-SSQ, b) POST-SSQ > PRE-SSQ, and c) POST-SSQ = PRE-SSQ
Quiz Scores
The class that viewed the LOF presentation had a mean quiz score of 6.64 points,
compared to the class that viewed the HOF presentation that had a mean score of 6.17
points (Table 3). The maximum score for this quiz was 10 points. An independent
samples t-test was conducted to compare quiz scores for students who viewed the HOF
presentation and the LOF presentation. The difference between groups was not
significant, t(63) = 1.186, p = .240, α = .05. The mean quiz scores for the group who
viewed the HOF presentation and the group who viewed the LOF presentation were
statistically similar.

29 Table 3
Mean, Standard Deviation, and Standard Error Mean - HOF and LOF Groups.
Groups N Mean Std. Deviation Std. Error Mean
HOF 29 6.17 1.671 .310
LOF 36 6.64 1.496 .249
Discussion
Anecdotal reports have suggested that presentations with HOF can cause feelings
of motion sickness in students or trainees who view them (Allain, 2010; Conboy et al.,
2011; Leberecht, 2009; Salter, 2012). Experiment 1 was designed to verify those reports.
In this experiment, one group of students viewed a traditional PPT presentation with LOF
properties, while a second group observed a Prezi presentation designed with HOF
properties. Both groups completed SSQs prior to viewing each presentation and
immediately after the presentation. After completing the POST-SSQ, students answered
10 multiple-choice questions that pertained to the lecture. The two predictions made
were: (a) participants who viewed a HOF presentation will experience a significant
increase in simulator sickness symptoms, while participants who viewed a LOF
presentation will not experience a significant increase in simulator sickness symptoms,
and (b) participants who viewed a HOF presentation will have lower quiz scores than
participants who view a LOF presentation
The results supported only one of two hypotheses. In support of Hypothesis 1,
POST-SSQ scores were significantly higher compared to PRE-SSQ scores for

30 participants who viewed the HOF presentation. There were no significant differences
in PRE- and POST-SSQ scores for students who viewed the LOF instructional
presentation. While the mean PRE- and POST-SSQ scores were relatively low for both
groups (compared to the maximum SSQ score that could be earned), the difference for
the HOF group was significant and the effect size for the HOF group was large
suggesting that a presentation with HOF characteristics can induce symptoms of motion
sickness. As expected, no one vomited. However, while the students who viewed the
LOF presentation had higher mean quiz scores, the difference in quiz score performance
between LOF and HOF was not significant. Thus, Hypothesis 2 was not supported.
Given that Hypothesis 1 was supported, it was deemed necessary to replicate the
influence of a HOF presentation on SSQ values. In addition, a strategy to minimize
simulator sickness by reducing optic flow characteristics of an animated presentation was
also evaluated. Experiment 2 compared the influence of HOF and MOF presentations on
simulator sickness.

31
CHAPTER 3
Experiment 2
Experiment 1 verified that a presentation incorporating excessive zooming,
contracting, rotation, and unorganized translational movements could cause an increase in
simulator sickness symptoms. However, the prediction that students viewing a
presentation with HOF would have lower quiz scores than students who viewed the LOF
presentation was not supported. Experiment 2 was designed to investigate a design
strategy that could minimize incidence of motion sickness. Using only the Prezi
application, two presentations on the topic “Augmented Feedback” were created. The
HOF presentation for this experiment was somewhat similar to the HOF presentation
implemented in Experiment 1. It incorporated contracting, zooming, and translational
movements of text, digital images, and movie clips, and the frame sequencing was
disorganized. However, rotational motion was eliminated and vertical translation was
used more frequently compared to horizontal translation. The MOF presentation
incorporated similar optic motion characteristics, but contracting and zooming were less
pronounced. In addition, horizontal translation was used more frequently compared to
vertical translation. The frames were also spatially arranged to reduce frame-to-frame
path travel in vertical, horizontal, and diagonal directions.
Two predictions were made: (a) participants who view a HOF presentation will
experience a significant increase in simulator sickness symptoms, while participants who
view a MOF presentation will not experience a significant increase in simulator sickness
symptoms (H3) and (b) quiz scores will be higher for participants who view a
32 presentation with MOF compared to students who view a HOF instructional
presentation (H4).
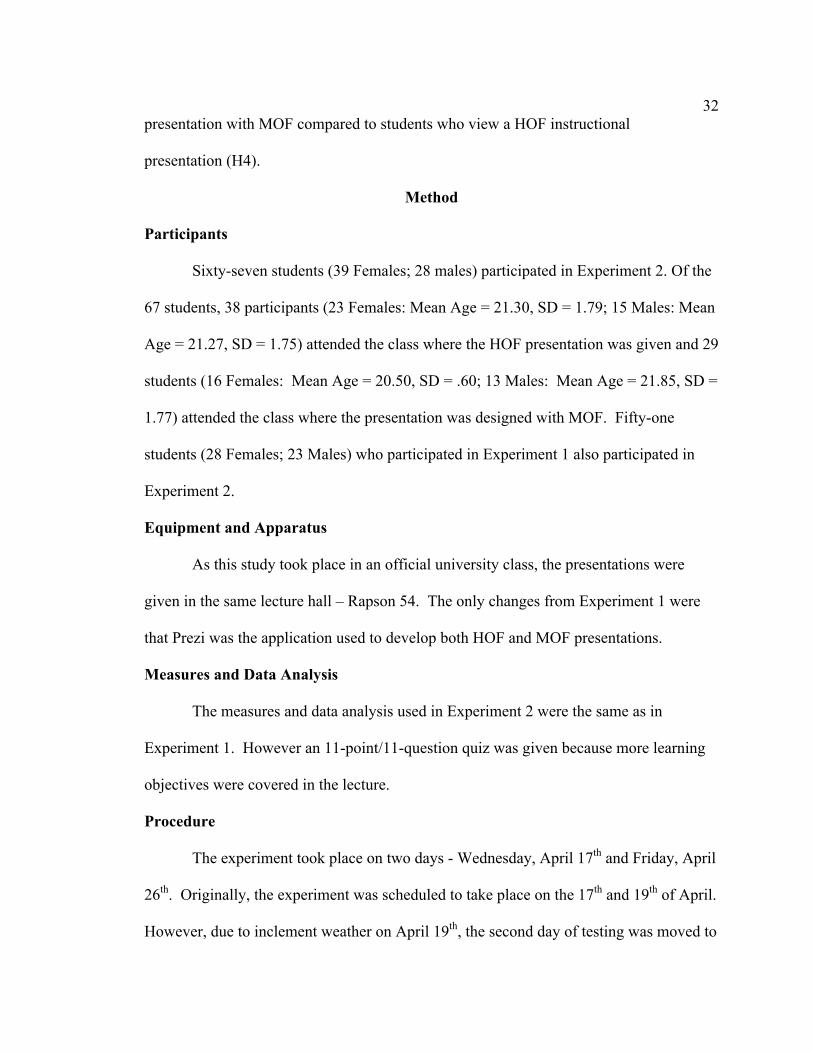
Method Participants
Sixty-seven students (39 Females; 28 males) participated in Experiment 2. Of the
67 students, 38 participants (23 Females: Mean Age = 21.30, SD = 1.79; 15 Males: Mean
Age = 21.27, SD = 1.75) attended the class where the HOF presentation was given and 29
students (16 Females: Mean Age = 20.50, SD = .60; 13 Males: Mean Age = 21.85, SD =
1.77) attended the class where the presentation was designed with MOF. Fifty-one
students (28 Females; 23 Males) who participated in Experiment 1 also participated in
Experiment 2.
Equipment and Apparatus
As this study took place in an official university class, the presentations were
given in the same lecture hall – Rapson 54. The only changes from Experiment 1 were
that Prezi was the application used to develop both HOF and MOF presentations.
Measures and Data Analysis
The measures and data analysis used in Experiment 2 were the same as in
Experiment 1. However an 11-point/11-question quiz was given because more learning
objectives were covered in the lecture.
Procedure
The experiment took place on two days - Wednesday, April 17th and Friday, April
26th. Originally, the experiment was scheduled to take place on the 17th and 19th of April.
However, due to inclement weather on April 19th, the second day of testing was moved to
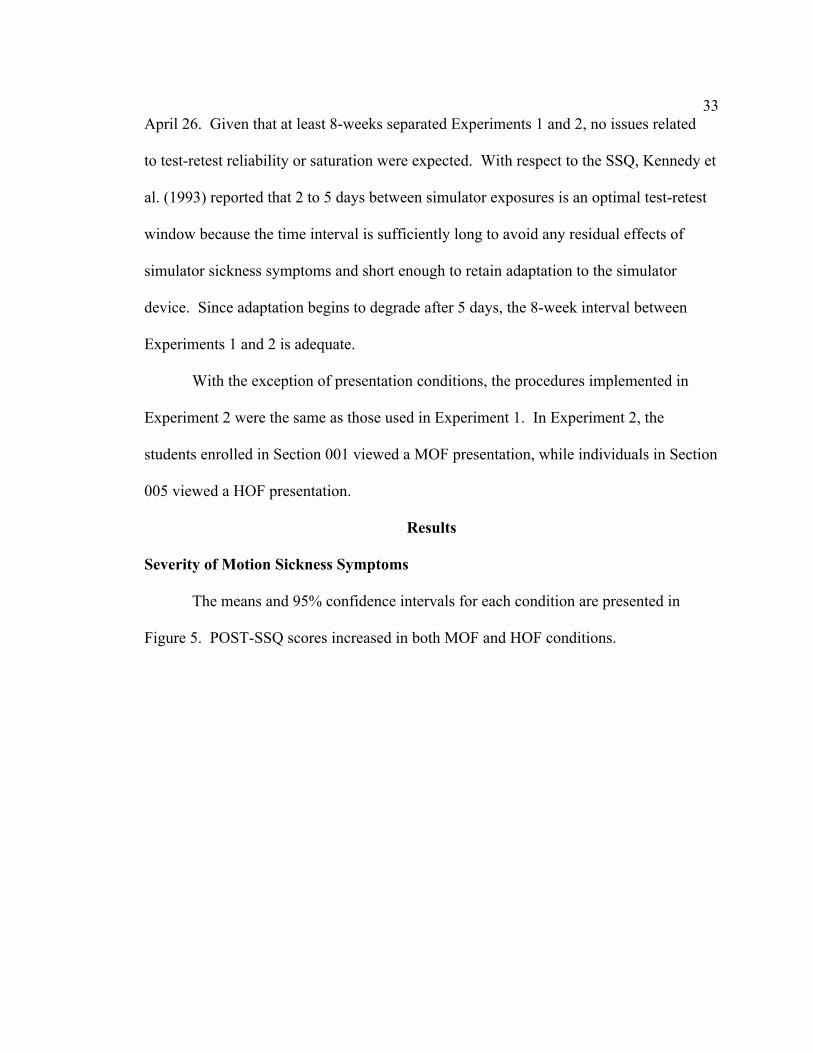
33 April 26. Given that at least 8-weeks separated Experiments 1 and 2, no issues related
to test-retest reliability or saturation were expected. With respect to the SSQ, Kennedy et
al. (1993) reported that 2 to 5 days between simulator exposures is an optimal test-retest
window because the time interval is sufficiently long to avoid any residual effects of
simulator sickness symptoms and short enough to retain adaptation to the simulator
device. Since adaptation begins to degrade after 5 days, the 8-week interval between
Experiments 1 and 2 is adequate.
With the exception of presentation conditions, the procedures implemented in
Experiment 2 were the same as those used in Experiment 1. In Experiment 2, the
students enrolled in Section 001 viewed a MOF presentation, while individuals in Section
005 viewed a HOF presentation.
Results
Severity of Motion Sickness Symptoms
The means and 95% confidence intervals for each condition are presented in
Figure 5. POST-SSQ scores increased in both MOF and HOF conditions.

34
0 5
10 15 20 25 30 35 40
HOF PRE-SSQ HOF POST-SSQ MOF PRE-SSQ MOF POST-SSQ
Figure 5: Experiment 2 - Means and 95% Confidence Intervals for each condition.
Wilcoxon Matched-Pairs Signed Ranks Test – HOF Presentation
A Wilcoxon Matched-Pairs Signed Rank Test was conducted to determine
whether there was a difference in the ranking of PRE- and POST-SSQ scores for students
who viewed the HOF presentation. Positive and negative ranks based on the difference
between SSQ-POST and SSQ-PRE scores, as well as ties, are presented in Table 4.
Results of the analysis indicated a statistically significant difference between PRE- and
POST-SSQ scores, z = - 3.771, p < .05, with a large effect size (ES = .612). The mean
POST-SSQ score (25.689) was significantly greater than PRE-SSQ score (13.787) for
students who viewed the HOF presentation.

35
Table 4
Ranking of SSQ Data – HOF Presentation (Experiment 2)
Rank N Mean Rank Sum of Ranks
Negative 6a 7.25 43.50
Positive 23b 17.02 391.50
Ties 9c
Total 38
Note. a) POST-SSQ < PRE-SSQ, b) POST-SSQ > PRE-SSQ, and c) POST-SSQ = PRE-SSQ
Wilcoxon Matched-Pairs Signed Ranks Test – MOF Presentation
A Wilcoxon Matched-Pairs Signed Rank Test was conducted to determine
whether there was a difference in the ranking of PRE- and POST-SSQ scores for students
who viewed the MOF presentation. Positive and negative ranks based on the difference
between SSQ-POST and SSQ-PRE scores, as well as ties, are presented in Table 5.
Results of the analysis indicated a statistically significant difference between PRE- and
POST-SSQ scores, z = - 1.968, p < .05, with a medium effect size (ES = .365). The mean
POST-SSQ score (22.311) was significantly greater than PRE-SSQ score (13.541) for
students who viewed the MOF presentation.

36
Table 5
Ranking of SSQ Data – MOF Presentation (Experiment 2)
Rank N Mean Rank Sum of Ranks
Negative 6a 8.75 52.50
Positive 14b 11.25 157.50
Ties 9c
Total 29
Note. a) POST-SSQ < PRE-SSQ, b) POST-SSQ > PRE-SSQ, and c) POST-SSQ = PRE-SSQ
Quiz Scores
The class that viewed the MOF presentation earned a mean quiz score of 6.48
points, compared to the class that viewed the HOF presentation that earned a mean score
of 6.97 points (Table 6). The maximum value of the quiz was 11 points. To compare
scores between MOF and HOF an independent samples t-test was conducted. The
difference in scores between the two conditions was not significant, t(65) = 1.260, p =
.212, α = .05.

37 Table 6
Mean, Standard Deviation, and Standard Error Mean – MOF and HOF Groups.
Groups N Mean Std. Deviation Std. Error Mean
MOF 29 6.48 1.617 .300
HOF 38 6.97 1.551 .252
Discussion
In Experiment 1, students who viewed a presentation with HOF characteristics
experienced a significant increase in simulator sickness symptoms, while students who
viewed a presentation with LOF did not. Experiment 2 was designed to determine if a
presentation with MOF characteristics, as well as more spatially organized translational
movement could lead to lower simulator sickness scores. In addition, differences in
academic performance were assessed between the group that viewed a MOF presentation
and the group that viewed the HOF presentation
In this experiment, Section 001 viewed a presentation with MOF properties, while
Section 005 observed a presentation designed with HOF properties. Both groups
completed SSQs prior to watching each presentation and immediately at the end of the
lecture. After completing the POST-SSQ, students answered 11 multiple-choice
questions that pertained to the lecture. The two predictions made were: (a) participants
who viewed a HOF presentation will experience a significant increase in simulator
sickness symptoms, while participants who viewed a MOF presentation will not
experience a significant increase in simulator sickness symptoms (H3) and (b) quiz scores
38 would be higher for participants who viewed a presentation with MOF compared to
students who view a HOF instructional presentation (H4).
The results did not support either hypothesis. With respect to the first prediction
(H3), significant differences in SSQ values were found for both groups. Students who
viewed a HOF presentation and students who viewed a MOF presentation experienced
significant increases in SSQ values. Similar to Experiment 1, the mean HOF and MOF
scores were relatively low and no one vomited. However, the p-value associated with the
group that viewed the HOF presentation was extremely low (.000) and the effect size was
large (.612). In contrast, the p-value for the group that viewed the MOF presentation was
.049 and the effect size was medium (.365). For the second prediction (H4), no
significant differences in quiz scores were found between the participants who viewed the
MOF presentation and those who viewed the HOF presentation. Interestingly, the
average quiz score for the group that viewed the HOF presentation was higher than the
group that viewed the MOF presentation.

39
CHAPTER 4
General Discussion
In two experiments, students attending their regular class meeting viewed lecture
presentations of varying levels of optic flow. In Experiment 1, one section of students
enrolled in the course Introduction to Motor Learning and Control (KIN 3135) attended a
class lecture where a LOF PPT presentation was used to convey lecture content; the other
section attended a class where a HOF presentation designed using Prezi was
implemented. In Experiment 2, the section that viewed the HOF presentation in
Experiment 1 attended a lecture where a MOF Prezi presentation was implemented, and
the section that viewed the LOF PPT observed a HOF Prezi presentation. In both
experiments, students completed a PRE-SSQ immediately before the presentation, a
POST-SSQ immediately after the presentation, and a multiple-choice quiz after
completing the POST-SSQ.
Classroom Presentations and Motion Sickness
Anecdotal reports have suggested that Prezi, an application that allows instructors
to create animated presentations, can cause symptoms related to motion sickness (Allain,
2010; Conboy et al., 2011; Leberecht, 2009; Salter, 2012, June 28). The results of this
study verified the anecdotal reports that presentations with optic motion could cause
symptoms related to motion sickness. Across experiments, symptoms of motion sickness
increased after viewing lecture presentations with moderate and high optic motion. In
Experiment 1, students who viewed a presentation with HOF characteristics had
significantly higher POST-SSQ scores compared to their PRE-SSQ scores than students

40 who viewed a LOF presentation. In Experiment 2, students exposed to MOF and HOF
presentations exhibited significant increases in POST-SSQ scores compared to their PRE-
SSQ scores.
The HOF presentations used in Experiments 1 and 2 were designed to maximize
the optic flow characteristics allowable by the application. In Experiment 1, the HOF
presentation incorporated rotation, contraction, expansion, and translation (forward,
backward, vertical, horizontal, and diagonal). Results from this experiment suggest that
these optic motions can cause an increase in simulator sickness symptoms. However, the
effects of a specific type of optic flow characteristic on simulator sickness could not be
identified, as those variables were not systematically manipulated. This project intended
to explore the various optic flow characteristics of a readily available presentation
application. The goal was not to examine each feature individually.
The design of the HOF presentation in Experiment 2 was similar to the HOF
design in Experiment 1 except that rotational visual motion was eliminated. This
decision was based on Keshavarez and Hecht’s (2011) finding that movement in the roll
axis could elicit motion sickness or cause an increase in motion sickness symptoms. In
addition, vertical translation was used more frequently. In comparison, the MOF
presentation incorporated the same optic motion features, but included less contraction,
expansion, forward, and backward translation and included more horizontal translation
(compared to vertical translation).
Without visual motion in the roll axis, both groups of individuals experienced a
significant increase in simulator sickness symptoms. However, the HOF group had a
much larger effect size compared to the MOF group. Remarkably, the effect sizes for the

41 HOF presentations in both Experiments 1 and 2 were similar. While optic motion
about the roll axis might cause motion sickness or an increase in motion sickness
symptoms, this finding suggests that the optic motions of vertical, forward, and backward
translation, contraction, and expansion (or a combination of these forms) has an equal
effect on symptoms related to visually induced motion sickness.
Presentation Optic Flow and Learning
With respect to student learning, no differences in quiz performance were found
between groups in the two experiments. However, an interesting finding is that students
enrolled in Section 005 had higher average quiz scores in both experiments compared to
students enrolled in Section 001. A possible rationale for this finding is discussed in the
section Limitations.
Limitations
While this experiment verified that presentations with high amounts of optic flow
could cause an increase in motion sickness symptoms, the findings should be treated with
caution. Three limitations potentially could have influenced the results. The first
limitation relates to the sample populations in both experiments. The individuals who
volunteered to participate in the experiment were students from two sections of the
course Motor Learning and Control. Therefore, the population does not represent a true
random sample. In addition, the individual who taught the classes in Experiments 1 and
2 was the assigned instructor to one of the two sections of Motor Learning and Control.
Consequently, students in Section 001 were taught by their official instructor, while
students from Section 005 were taught by a guest lecturer. This element of novelty is a
confounding variable that could have influenced student attention and may explain why

42 students from Section 005 achieved higher scores on the quiz assessment in both
experiments. Finally, this study lacked a true control group. To investigate the
relationship between optic flow characteristics of classroom technology on motion
sickness and learning, a no optic flow control group where the instructor uses a
blackboard or a white board instead of a presentation technology should have been
implemented. While PPT is now considered a traditional presentation tool, it still
represents an instructional technology tool.
Design Implications
Findings from this study suggest that moderate to high amounts of optic flow in
animated presentations can significantly increase motion sickness symptoms. Thus,
when designing instructional presentations using an application that enables one to
incorporate optic motion, moderate to excessive amounts should be avoided. If an
instructor or designer chooses to include animation it should be purposeful, infrequent,
and used with care to avoid unintentional motion sickness. For presentation applications
such as Prezi, the use of visual motions such as rotation and expansions should be
avoided since they are know optic flow characteristics that can cause motion sickness. In
addition, maintaining similar frame dimensions and positioning sequential frames in
close proximity can reduce translational motion. Also, given the findings of this
research, incorporating horizontal translation rather than vertical translation may reduce
symptoms of motion sickness.
Suggestions for Future Research
As previously stated these experiments were exploratory in scope; specific types
of optic motion were not systematically manipulated. Future studies should investigate

43 which optic motions or combinations of optic motions might induce motion sickness or
cause an increase in motion sickness symptoms. Based on the findings from Experiment
2, a more systematic study comparing a presentation consisting primarily of vertical optic
motion with moderate expansion to a presentation consisting primarily of horizontal optic
flow with moderate zooming is warranted. Results from this proposed study could
provide evidence for a presentation design that does not cause an increase in simulator
sickness symptoms.
As identified in the section Limitations, the present experiment utilized a
convenience sample. As a result, the findings of this research should not be generalized
to a larger population. In order to make conclusions that apply to a broader population,
subsequent studies should incorporate random sampling procedures. A second design
issue identified was the possible confound related to the investigator who was the official
instructor for one of the course sections. This limitation could be addressed by
conducting research outside of an official class setting. In addition, with this
modification, participants could be randomly assigned to seats throughout the classroom.
Since, the current research was conducted in a regular class setting students were allowed
to freely choose where they sat. As a result, students were not equally distributed across
rows. By having an equal distribution of participants across rows, researchers would be
able to examine the effect of field of view (FOV) on visually induced motion sickness.
According to Pausch, Crea, and Conway (1992), FOV is “a spatial property that
defines the horizontal and vertical angular dimensions of the display” (p. 347) and can
cause motion sickness. Research has shown that wider FOV displays enhance
performance, but increases the likelihood of simulator sickness (Pausch et al., 1992). For

44 instance, Kennedy, Lilienthal, Berbaum, Baltzley, and McCauley (1989) reported that
flight simulators that provided the greatest FOV were associated with high incidence of
motion sickness-like symptoms. Lin, Duh, Parker, Abi-Rached, and Furness (2002)
reported that individuals performing in a driving simulator experienced more symptoms
of motion sickness as FOV increased, corroborating the relationship between FOV and
motion sickness.
Conclusion
This study verified the anecdotal accounts that presentations with optic motion
can cause symptoms of motion sickness. Specifically, instructional presentations that
incorporate moderate to high amounts of optic flow can cause students to experience
significantly elevated levels of simulator sickness. Findings from this study highlight the
importance of using sound instructional design strategies when designing and developing
instruction. While optic motion in a presentation can make a lecture or training program
more interesting to students, it can also make them sick. Based on current findings,
individuals who design instructional presentations should not develop and implement
instructional presentations with moderate to high amounts of optic flow. However, more
systematic research should be conducted to understand if some optic motions or
combinations of optic motions might be more or less nauseogenic than others. In
addition, environmental factors such as field of view should also be assessed in
educational settings. Based on findings from proposed future research, an optimal
amount of optic flow for animated presentations may be determined.

45
References
Ali, M. R., Mowery, Y., Kaplan, B., & DeMaria, E. J. (2002). Training the novice in
laparoscopy: More challenge is better. Surgical Endoscopy, 16(12), 1732-1736.
Allain, R. (2010). Non-linear presentations with Prezi. Retrieved from
http://www.wired.com/2010/09/non-linear-presentations-with-prezi/
Bai, H., Pan, W., Hirumi, A., & Kebritchi, M. (2012). Assessing the effectiveness of a 3-
D instructional game on improving mathematics achievement and motivation of
middle school students. British Journal of Educational Technology, 43(6), 993 –
1003.
Bonnet, C. T., Faugloire, E., Riley, M. A., Bardy, B. G., & Stoffregen, T. A. (2006).
Motion sickness preceded by unstable displacements of the center of pressure.
Human Movement Science, 25, 800 – 820.
Bort, J. (2013, November 14). Presentation maker Prezi added new features to lure
business users away from PowerPoint. Retrieved from
http://www.businessinsider.com/prezi-reaches-30-million-users-2013-11.
Brooks, J. O., Goodenough, R. R., Crisler, M. C., Klein, N. D., Alley, R. L., Koon, B.
L.,…Tyrrell, R. A. (2010). Simulator sickness during driving simulation studies.
Accident Analysis & Prevention, 42(3), 788 – 796.
Brown University (2014). 8 reasons why Prezi is not recommended for teaching.
Retrieved from http://www.brown.edu/about/administration/sheridan-
center/teaching-learning/course-design/learning-technology/prezi.

46 Bubka, A., Bonato, F., & Palmisano, S. (2007). Expanding and contracting optical
flow patterns and simulator sickness. Aviation, Space, and Environmental
Medicine, 78(4), 383 – 386.
Cameirão, M. S., i Badia, S. B., Oller, E. D., & Verschure, P. F. M. J. (2010).
Neurorehabilitation using the virtual reality based Rehabilitation Gaming System:
methodology, design, psychometrics, usability and validation. Journal of
Neuroengineering and Rehabilitation. 7: 48, doi: 10.1186/1743-0003-7-48
Center for Teaching (n.d.). Making better PowerPoint presentations. Retrieved from
https://cft.vanderbilt.edu/guides-sub-pages/making-better-powerpoint-
presentations/.
Center for Teaching and Learning (2010). Active learning with PowerPoint. Retrieved
from www1.umn.edu/ohr/teachlearn/tutorials/powerpoint/.
Chen, Y-C., Dong, X., Chen, F-C., & Stoffregen, T. A. (2012). Control of a virtual
avatar influences postural activity and motion sickness. Ecological Psychology,
24, 279 – 299.
Chen, C. H., Yang, J. C., Shen, S., & Jeng, M. C. (2007). A desktop virtual reality earth
motion system in astronomy education. Journal of Educational Technology &
Society, 10(3), 289 – 304.
Cohen, J. (1988). Statistical power analysis for the behavioral sciences (2nd ed.).
Hillsdale, NJ: Lawrence Earlbaum Associates.
Communication Within the Curriculum (n.d). Workshops. Retrieved from
http://www.sas.upenn.edu/cwic/workshops.html.

47 Conboy, C. Fletcher, S., Russell, K., & Wilson, M. (2012). An evaluation of the
potential use and impact of Prezi, the zooming editor software, as a tool to
facilitate learning in higher education. Innovations in Practice, 7 (March), 32 –
46.
Diels, C., & Howarth, P. A. (2013). Frequency characteristics of visually induced motion
sickness. Human Factors, 55(3), 595 – 604.
Dong, X., Yoshida, K., & Stoffregen, T. A. (2011). Control of a virtual vehicle
influences postural activity and motion sickness. Journal of Experimental
Psychology: Applied, 17(2), 128 – 138.
Draper, M. H., Viirre, E. S., Furness, T. A., & Gawron, V. J. (2001). Effects of image
scale and system time delay on simulator sickness within head-coupled virtual
environments. Human Factors, 43(1), 129 – 146).
Gibson, J. J. (1950). The perception of the visual world. The Riverside Press:
Cambridge, MA.
Gibson, J. J. (1957). Optical motions and transformations as stimuli for visual
perception. Psychological Review, 64(5), 288 – 295.
Guignard, J. C., & McCauley, M.E. (1990). The accelerative stimulus for motion
sickness. In G. H. Crampton (Ed.) Motion and space sickness (pp. 123 – 152).
Boca Raton, FL: CRC Press.
Harteveld, C., & Bidarra, R. (2007). Learning with games in a professional environment:
A case study of a serious game about levee inspection. Proceeding from the 1st
Learning with Games, 555 – 562.

48 Helmich, M. A. (2008). A moving experience by stage. Retrived from
http://www.parks.ca.gov/?page_id=25450.
Hettinger, L. J., Berbaum, K. S., Kennedy, R. S., Dunlap, W. P., & Nolan, M. D. (1990).
Vection and simulator sickness. Military Psychology, 2(3), 171 – 181.
Holden, M., Todorov, E., Callahan, J., & Bizzi, E. (1999) Virtual environment training
improves motor performance with stroke: case report. Neurology Report, 23(2),
57-67.
Johnson, L., Adams Becker, S., Cummins, M., Estrada, V., Freeman, A., & Ludgate, H.
(2013). NMC Horizon Report: 2013 Higher Education Edition. Austin, TX: The
New Media Consortium.
Johnson, L., Smith, R., Willis, H., Levine, A., & Haywood, K., (2011). The 2011
Horizon Report. Austin, TX: The New Media Consortium.
Jones, M. B., Kennedy, R. S., & Bittner, A. C. (1981). A video game for performance
testing. American Journal of Psychology, 94, 143 – 152.
Ke, F. (2008). A case study of computer gaming for math: Engaged learning from
gameplay? Computers & Education, 51, 1609 – 1620.
Kennedy, R. S., Berbaum, K. S., & Lilienthal, M. G. (1997). Disorientation and postural
ataxia following flight simulation. Aviation, Space, and Environmental Medicine,
68, 13–17.
Kennedy, R. S., Drexler, J. M., Compton, D. E., Stanney, K. M., Lanham, D. S., & Harm,
D. L. (2003). Configural scoring of simulator sickness, cybersickness and space
adaptation syndrome: Similarities and differences. In L. J. Hettinger and M. W.

49 Haas (Eds.), Virtual and adaptive environments: Applications, implications,
and human performance issues (pp. 247 – 278). Boca Raton, FL: CRC Press.
Kennedy, R. S., Fowlkes, J. E., & Lilienthal, M. G. (1993). Postural and performance
changes following exposure to flight simulators. Aviation, Space, and
Environmental Medicine, 64, 912–920.
Kennedy, R. S., Lane, N. E., Berbaum, K. S., & Lilienthal, M. G. (1993). Simulator
sickness questionnaire: An enhanced method for quantifying simulator sickness.
The International Journal of Aviation Psychology, 3(3), 203 – 220.
Kennedy, R. S., Lilienthal, M. G., Berbaum, K. S., Baltzley, D. R., & McCauley, M. E.
(1989). Aviation, Space, and Environmental Medicine, 60(1), 10 – 16.
Keshavarz, B., & Hecht, H. (2011). Axis rotation and visually induced motion sickness:
The role of combined roll, pitch, and yaw motion. Aviation, Space, and
Environmental Medicine, 82(11), 1023 – 1029.
Kuze, J., & Ukai, K. (2008). Subjective evaluation of visual fatigue caused by motion
images. Displays, 29, 159 – 166.
Leberecht, T. (2009, August 23). Power to Prezi! Retrived from
http://www.cnet.com/news/power-to-prezi/.
Lee, D. N., & Aronson, E. (1974). Visual proprioceptive control of standing in human
infants. Perception and Psychophysics, 15(3), 529 – 532.
Lee, D. N., & Lishman, J. R. (1975). Visual proprioceptive control of stance. Journal of
Human Movement Studies, 1, 87 – 95.

50 Lee, G. C. H., Yoo, Y., & Jones, S. (1997). Investigation of driving performance,
vection, postural sway, and simulator sickness in a fixed-based driving simulator.
Computers and Industrial Engineering, 33(3-4), 533 – 536.
Lin, J, J-W., Duh, H. B. L., Parker, D. E., Abi-Rached, H., & Furness, T. A. (2002).
Effects of field of view on presence, enjoyment, memory, and simulator sickness
in a virtual environment. Proceedings of the IEEE Virtual Reality.
Magill, R. A., & Anderson, D. I. (2013). Motor learning and control: Concepts and
applications. New York: McGraw Hill.
Merhi, O., Faugloire, E., Flanagan, M., & Stoffregen, T. A. (2007). Motion sickness,
console video games, and head-mounted displays. Human Factors, 49(5), 920 –
934.
Money, K. E. (1970). Motion sickness. Physiological Reviews, 50(1), 1 – 39.
Mourant, R. R., & Thattacherry, T. R. (2000). Simulator sickness in a virtual
environments driving simulator. Proceedings of the IEA 2000/HFES 2000
Congress, 534 – 537. San Diego, CA.
Newell, K. M. (1986). Constraints on the development of coordination. In M. G. Wade
& H. T. A. Whiting (Eds.), Motor development in children: Aspects of
coordination and control (pp. 341-360). Dordrecht, Germany: Martinus Nijhoff.
Pallant, J. (2007). SPSS Survival Manual (3rd ed). McGraw-Hill: New York.
Palmisano, S., Bonato, F., Bubka, A., & Folder, J. (2007). Vertical display oscillation
effects on forward vection and simulator sickness. Aviation, Space, and
Environmental Medicine, 78(10), 951 – 956.

51 Panjwani, Gupta, Samdaria, Curtell, & Toyama (2010). Collage: A presentation tool
for school teachers. Proceedings of ICTD 2010, the 4th ACM/IEEE International
Conference on Information and Communication Technologies and Development,
IEEE. New York: ACM.
Pausch, R., Crea, T., & Conway, M. (1992). A literature survey for virtual environments:
Military flight simulator visual systems and simulator sickness. Presence, 1(3),
344 – 363.
Pölönen, M., Järvenpää, T., & Häkkinen, J. (2012). Reading e-books on a near-to-eye
display: Comparison between a small-sized multimedia display and a hard copy.
Displays, 33, 157 – 167.
Prezi (2011, December 9). Prezi zooms to 5 million users. Retrieved from
https://prezi.com/pet5awq0xsxj/prezi-zooms-to-5-million-users/
Prezi Blog (2014). Thanks a million (or rather 50 million). Retrieved from
http://blog.prezi.com/?tag=50+million+users.
Reason, J. T. (1978). Motion sickness adaptation: A neural mismatch model. Journal of
the Royal Society of Medicine. 71, 819 – 829.
Reason, J. T., & Brand, J. J. (1975). Motion sickness. Academic Press: London.
Riccio, G. E., & Stoffregen, T. A. (1991). An ecological theory of motion sickness and
postural stability, Ecological Psychology, 3, 195 – 240.
Rosenberg, B. H., Landstittel, D., & Averch, T. D. (2005). Can video games be used to
predict or improve laparoscopic skills? Journal of Endourology, 19(3), 372 –
376.

52 Rosser, J. C., Lynch, P. J., Cuddihy, L., Gentile, D. A., Klonsky, J., & Merrell, R.
(2007). The impact of video games on training surgeons in the 21st century.
Archives of Surgery, 142(2), 181 – 186.
Salter, A. (2012, June 28). Revisiting Prezi for presentations. Retrieved from
http://chronicle.com/blogs/profhacker/revisiting-prezi-for-presentations/41041
Smart, L. J., Stoffregen, T. A., & Bardy, B. G. (2002). Visually induced motion sickness
predicted by postural instability. Human Factors, 44(3), 451 – 465.
Solimini, A. G. (2013). Are there side effects to watching 3D movies? A prospective
crossover observational study on visually induced motion sickness. PLoS ONE, 8
(2), e56160. DOI: 10.1371/journal.pone.0056160.
Stanney, K. M., & Hash, P. (1998) Locus of user-initiated control in virtual
environments: Influences on cybersickness. Presence, 7(5), 447 – 459.
Stoffregen, T. A., Chen, Y-C., & Koslucher, F. C. (2014). Motion control, motion
sickness, and the postural dynamics of mobile devices. Experimental Brain
Research, 232(4), 1389 – 1397.
Stoffregen, T. A., Faugloire, E., Yoshida, K., Flanagan, M., & Merhi, O. (2008). Motion
sickness and postural sway in console video games. Human Factors, 50(2), 322–
331.
Stoffregen, T. A., Hettinger, L. J., Haas, M. W., Roe, M. M., & L. J. Smart (2000).
Postural instability and motion sickness in a fixed-base flight simulator. Human
Factors, 42(3), 458 – 469.
Stoffregen, T. A., & Smart, L. J. (1998). Postural instability precedes motion sickness.
Brain Research Bulletin, 47, 437 – 448.

53 Teaching Effectiveness Program (2015, September 14). Unleashing the power of
PowerPoint. Retrieved from
http://tep.uoregon.edu/technology/powerpoint/powerpoint.html.
Ujike, H. (2007). Effects of global motion included in video movie provoking an
incident on visually induced motion sickness. Virtual Reality HCII Lecture Notes
in Computer Science, 4563, 392 – 396.
Ujike, H., Ukai, K., & Nihei, K. (2008). Survey on motion sickness-like symptoms
provoked by viewing a video movie during junior high school class. Displays,
29(2), 81 – 89.
Villard, S. J., Flanagan, M. B., Albanese, G. M., & Stoffregen, T. A. (2008). Postural
instability and motion sickness in a virtual moving room. Human Factors, 50(2),
332 – 345.
Virtanen, P., Myllärniemi, J., & Wallander, H. (2013). Diversifying higher education:
Facilitating different ways of learning. Campus-Wide Information Systems, 30(3),
201 – 211.
Walton, T. (2011). Prezi for presentations. Retrived from http://blogs.ihes.com/tech-
elt/?p=1275.
Wood, R. W. (1895). The “haunted swing” illusion. The Psychological Review, 2, 277 –
278.

54
Appendix A
Institutional Review Board Approval

55

56

57
Appendix B
Simulator Sickness Questionnaire

58 Simulator Sickness Questionnaire
! ! ROW:!!! ! SEAT:!!! !
! Page!1!of!1! Ver.!11.21.12!
The$Simulator$Sickness$Questionnaire$$Subject:$$$ $ $ $ $ $ $ $ $$!Circle!how!much!each!symptom!below!is!affecting!you!now.!!!0!=!“not!at!all”!! ! 1!=!“mild”! ! 2!=!“moderate”! 3!=!“severe”!
1. General!discomfort! ! ! 0! 1! 2! 3! !
2. Fatigue!! ! ! ! 0! 1! 2! 3!
3. Headache! ! ! ! 0! 1! 2! 3!
4. Eyestrain! ! ! ! 0! 1! 2! 3!
5. Difficulty!focusing! ! ! 0! 1! 2! 3!
6. Increased!salivation! ! ! 0! 1! 2! 3!
7. Sweating! ! ! ! 0! 1! 2! 3!
8. Nausea! ! ! ! 0! 1! 2! 3!
9. Difficulty!concentrating! ! 0! 1! 2! 3!
10. Fullness!of!head! ! ! 0! 1! 2! 3!
11. Blurred!vision! ! ! ! 0! 1! 2! 3!
12. Dizziness!(eyes!open)!!! ! 0! 1! 2! 3!
13. Dizziness!(eyes!closed)!! ! 0! 1! 2! 3!
14. Vertigo*! ! ! ! 0! 1! 2! 3!
15. Stomach!awareness**! ! 0! 1! 2! 3!
16. Burping! ! ! ! 0! 1! 2! 3!
*Vertigo!is!experienced!as!loss!of!orientation!with!respect!to!vertical!upright!**Stomach!awareness!is!usually!used!to!indicate!a!feeling!of!discomfort!that!is!just!short!of!nausea.!

59
Appendix C
Consent Form

60
IRB Code No: I211P24423 Ver. 11.22.12
Page 1 of 1
CONSENT FORM Instructional Technology Tools and Motion Sickness
You are invited to be in a research study examining the influence of classroom instructional presentations on motion sickness. You were selected as a possible participant because you are a healthy adult between the ages of 18 and 65, you are not pregnant, and you have no history of dizziness, balance disorder, or vestibular dysfunction. We ask that you read this form and ask any questions you may have before agreeing to be in the study. This study is being conducted by Anthony M. Mayo, graduate student, School of Kinesiology, University of Minnesota. Background Information: The purpose of this study is to understand whether classroom instructional presentations can cause motion sickness. Motion sickness can occur with many types of visual technologies, such as video games. This study focuses on the possibility that an animated instructional presentation may cause motion sickness. Not everyone who views an animated instructional presentation becomes motion sick, and we do not expect everyone in this study to become sick. Procedures: If you agree to be in this study, we will ask you to watch an instructor-led class presentation. After the presentation, we will ask you to provide some demographic information and to complete a symptom report questionnaire. This questionnaire should be returned either at the end of the class or beginning of the next class. If you experience symptoms of motion sickness, you should close your eyes or look away. The total duration of the experiment will not exceed the length of the class period. Risks and Benefits of Being in the Study: You may experience symptioms of motion sickness. If you experience symptoms of motion sickness, you should close your eyes or look away. There are no direct benefits to participation. Compensation: You may receive course credit (extra credit), as determined by your instructor. Confidentiality: The records of this study will be kept private. In any sort of report we might publish, we will not include any information that will make it possible to identify you. Research records will be kept in a locked file; only researchers will have access to the records. Voluntary Nature of the Study: Your decision whether or not to participate will not affect your current or future relations with the University of Minnesota. If you decide to participate, you are free to withdraw at any time without affecting those relationships. Contacts and Questions: The researchers conducting this study are Anthony M. Mayo and Thomas A. Stoffregen. You may ask any questions you have now. If you have questions later, you may contact them at the Affordance Perception Action Lab, Cooke Hall 5B. Phone: (612) 624-1025. If you have any questions or concerns regarding the study and would like to talk to someone other than the researcher(s), contact Patient Relations Department, Mayo Mail Code-310, B310 Mayo Memorial Building, 420 Delaware Street S.E., Minneapolis, Minnesota 55455; telephone (612) 273-5050. You will be given a copy of this form to keep for your records. Statement of Consent: I have read the above information. I have asked questions and have received answers. I consent to participate in the study. Signature: Date: Signature of Investigator: Date ________________

61
Appendix D
Demographics Information Form

62
Demographics-Information- - ParNum:--- -
IRB-Code-No:--I211P24423- - Ver.-11.21.12-Page-1-of-2-
Date:--- - Seat-Location:--- --Age:-- - Sex:-- --Video&Game&Experience&&&-Number-of-Years:--- -
Frequency-(Hours-per-week):--- -
Frequency-(Hours-per-month):- - -
Video-Game-Proficiency-(On-the-scale-of-1-to-10,-with-1-being-a-novice-and-10-being-an-expert,-circle-the-number-that-best-describes-your-gaming-ability)-
Novice& & & & & & & & & Expert&
1- 2- 3- 4- 5- 6- 7- 8- 9- 10-
-Physical&Activity&&Do-you-currently-meet-ACSMs-current-recommendations-for-weekly-exercise?--Please-answer-by-circling-the-appropriate-response.--
For-cardiorespiratory-exercise-[-30[60-minutes-of-moderate[intensity-exercise-(five-days-per-week)-or-20[60-minutes-of-vigorous[intensity-exercise-(three-days-per-week).---
YES- NO-
For-resistance-exercise-[-train-each-major-muscle-group-two-or-three-days-each-week-using-a-variety-of-exercises-and-equipment.---
YES- NO-
For-flexibility-exercise-[-at-least-two-or-three-days-each-week-to-improve-ROM.- YES- NO-
For-neuromotor-exercise-–-at-least-two-or-three-days-a-week-of-functional-fitness-training*-20-to-30-minutes-per-day.--Functional-fitness-training-involves-motor-skills-(balance,-agility,-coordination-and-gait),-proprioceptive-exercise-training-and-multifaceted-activities-(tai-chi-and-yoga)-to-improve-physical-function.-
YES- NO-
-Sports&or&Physical&Activity&Experience&&Please-list-the-sports-and-physical-activities-in-which-you-have-regularly-participated:--1)- - 4)- --2)- - 5)- --3)- --

63
Demographics-Information- - ParNum:--- -
IRB-Code-No:--I211P24423- - Ver.-11.21.12-Page-2-of-2-
For-each-sport-or-physical-activity-that-you-listed,-on-a-scale-of-1-to-10,-with-1-being-a-novice-and-10-being-an-expert,-circle-the-number-that-best-describes-your-level-of-proficiency:--Sport-or-Physical-Activity:--- - - --How-many-hours/week-if-currently-participating-in-activity?:--- - -
Novice' ' ' ' ' ' ' ' ' Expert'
1- 2- 3- 4- 5- 6- 7- 8- 9- 10-
-Sport-or-Physical-Activity:- - --How-many-hours/week-if-currently-participating-in-activity?:--- - -
Novice' ' ' ' ' ' ' ' ' Expert'
1- 2- 3- 4- 5- 6- 7- 8- 9- 10-
-Sport-or-Physical-Activity:--- - --How-many-hours/week-if-currently-participating-in-activity?:--- - -
Novice' ' ' ' ' ' ' ' ' Expert'
1- 2- 3- 4- 5- 6- 7- 8- 9- 10-
-Sport-or-Physical-Activity:--- - --How-many-hours/week-if-currently-participating-in-activity?:--- - -
Novice' ' ' ' ' ' ' ' ' Expert'
1- 2- 3- 4- 5- 6- 7- 8- 9- 10-
-Sport-or-Physical-Activity:--- - --How-many-hours/week-if-currently-participating-in-activity?:--- - -
Novice' ' ' ' ' ' ' ' ' Expert'
1- 2- 3- 4- 5- 6- 7- 8- 9- 10-
-

64
Appendix E
Summary of Demographics Data

65 The tables below provide a summary of responses related to video game experience
and current physical activity levels with respect to ACSM recommendations. Since many
students participated in both experiments, the tables are organized by class section
instead of by experiment. If a student participated in Experiments 1 and 2, only the data
reported in Experiment 1 was included in the table to avoid duplication. Sports or
Physical Activity Experience was not summarized. There was no consistent pattern in
self-reports of physical activities.
Video Game (VG) Experience Self Assessment – Sections 001 and 002!
Section! N!%!Students!with!VG!
Experience!
%!Students!Currently!Playing!VGs!
Hours/Month!(Range)!
Proficiency!(Range)!
001! 37! 62.2 (N = 23)!
56.8 (N = 21)! .5 to 80! 1 (Novice) to
9 (Near Expert)!
005! 45! 62.2 (N = 28)
37.8 (N = 17) .5 to 80 1 (Novice) to
10 (Advanced)
!
Physical Activity Self Assessment – % Meeting ACSM Current Recommendations – Sections 001 and 002!
Section! N!Cardio-
respiratory Exercise!
Resistance Training!
Flexibility Exercise!
Neuromotor Exercise!
001! 37! 78.4 (N = 29)!
56.8 (N = 21)!
59.5 (N = 21)!
59.5 (N = 22)!
005! 45! 82.2 (N = 37)
55.6 (N = 25)
55.6 (N = 25)
48.9 (N = 22)
!