The KScalar simulator
36
1 The KScalar Simulator Abstract. Modern processors increase their performance with complex microarchitectural mechanisms, which makes them more and more difficult to understand and evaluate. KScalar is a user-friendly simula- tion tool that facilitates the study of such processors. It allows students to analyze the performance behav- ior of a wide range of processor microarchitectures: from a very simple in-order, scalar pipeline, to a de- tailed out-of-order, superscalar pipeline with non-blocking caches, speculative execution, and complex branch prediction. The simulator interprets executables for the Alpha AXP instruction set: from very short program fragments to large applications. The object’s program execution may be simulated in varying levels of detail: either cycle-by-cycle, observing all the pipeline events that determine processor perform- ance, or million cycles at once, taking statistics of the main performance issues. Instructors may use KScalar in several ways. First, it may be used to provide demonstrations in lectures or online learning environments. Second, it allows students to investigate the characteristics of specific processor microarchitectures as practical short assignments associated to a lecture course. Third, students may undertake major projects involving the optimization of real programs at the software-hardware inter- face, or involving the optimization of a processor microarchitecture for a given application workload. A preliminary version of KScalar has been successfully used in several lecture courses during the last two years in our University. It runs on a x86/Linux/KDE system. It consists of a graphical interface run- ning on top of a text-based simulator engine. The graphical interface has been developed using the KDE and QT libraries. The simulator engine is a heavily-modified version of SimpleScalar. KScalar code is available under the terms of the GNU and SimpleScalar General Public License. 1. Introduction The increasing complexity of processor microarchitectures –pipelining, superscalar or out-of-order execu- tion– makes them very difficult to understand and evaluate. Processor performance is determined by many interacting events, and showing their occurrence in a complete and easy-to-understand way is a difficult challenge. Books on computer architecture education often use two different schemes to show processor behavior: cycle diagrams and event frequency tables or charts. Cycle diagrams represent the contents of the pipeline stages along time, indicating the cycles and stages where pipeline hazards occur. Cycle diagrams are very complete, because they allow displaying all types of pipeline events, like RAW stalls or operand forwarding. Book space restrictions, though, often limit the size of cycle diagrams to a few cycles. Also, in order to maintain the diagram’s readability, information de- scribing pipeline hazards must be limited. For example, it is not suitable to provide full information about all data cache misses (addresses conflicting in the same way, matching entries in the Miss Address File, ...). The use of cycle diagrams in a textbook always involves a trade-off between readability and completeness. Event frequency tables or charts show the frequency of certain events –like RAW stalls, cache misses, or forward taken branches– along the execution of a relatively large program segment. In this scheme there are no restrictions on the execution run length, and allows focusing on those events that are significant for a given educational purpose. For example, to compare the relative performance penalty of some hazard types we may display the percentage of cycles that each hazard type has caused a pipeline stall. The main difficulty of teaching processor architecture on a textbook is the lack of interactivity inherent to its static representation of information. Understanding how a processor works and the relations among the different processor elements is easier when we may interact with the running system and modify either the processor microarchitecture or the executed program. Reproducing the program execution using static tables is limited to a small number of short examples. Generating tables by hand is very error-prone, since there are many details to consider and it is easy to forget one of them. For this task, processor simulators may represent a very useful learning tool. KScalar is a user-friendly processor simulation tool that facilitates the study of complex processor microar- chitectures. It is a graphical environment that simulates the execution of a program binary on a parameter-
-
Upload
gabinetecomunicacionyeducacion -
Category
Documents
-
view
0 -
download
0
Transcript of The KScalar simulator

1
The KScalar Simulator
Abstract. Modern processors increase their performance with complex microarchitectural mechanisms,which makes them more and more difficult to understand and evaluate. KScalar is a user-friendly simula-tion tool that facilitates the study of such processors. It allows students to analyze the performance behav-ior of a wide range of processor microarchitectures: from a very simple in-order, scalar pipeline, to a de-tailed out-of-order, superscalar pipeline with non-blocking caches, speculative execution, and complexbranch prediction. The simulator interprets executables for the Alpha AXP instruction set: from very shortprogram fragments to large applications. The object’s program execution may be simulated in varyinglevels of detail: either cycle-by-cycle, observing all the pipeline events that determine processor perform-ance, or million cycles at once, taking statistics of the main performance issues. Instructors may use KScalar in several ways. First, it may be used to provide demonstrations in lecturesor online learning environments. Second, it allows students to investigate the characteristics of specificprocessor microarchitectures as practical short assignments associated to a lecture course. Third, studentsmay undertake major projects involving the optimization of real programs at the software-hardware inter-face, or involving the optimization of a processor microarchitecture for a given application workload.
A preliminary version of KScalar has been successfully used in several lecture courses during the lasttwo years in our University. It runs on a x86/Linux/KDE system. It consists of a graphical interface run-ning on top of a text-based simulator engine. The graphical interface has been developed using the KDEand QT libraries. The simulator engine is a heavily-modified version of SimpleScalar. KScalar code isavailable under the terms of the GNU and SimpleScalar General Public License.
1. Introduction
The increasing complexity of processor microarchitectures –pipelining, superscalar or out-of-order execu-tion– makes them very difficult to understand and evaluate. Processor performance is determined by manyinteracting events, and showing their occurrence in a complete and easy-to-understand way is a difficultchallenge. Books on computer architecture education often use two different schemes to show processorbehavior: cycle diagrams and event frequency tables or charts.
Cycle diagrams represent the contents of the pipeline stages along time, indicating the cycles and stageswhere pipeline hazards occur. Cycle diagrams are very complete, because they allow displaying all types ofpipeline events, like RAW stalls or operand forwarding. Book space restrictions, though, often limit the sizeof cycle diagrams to a few cycles. Also, in order to maintain the diagram’s readability, information de-scribing pipeline hazards must be limited. For example, it is not suitable to provide full information aboutall data cache misses (addresses conflicting in the same way, matching entries in the Miss Address File, ...).The use of cycle diagrams in a textbook always involves a trade-off between readability and completeness.
Event frequency tables or charts show the frequency of certain events –like RAW stalls, cache misses, orforward taken branches– along the execution of a relatively large program segment. In this scheme there areno restrictions on the execution run length, and allows focusing on those events that are significant for agiven educational purpose. For example, to compare the relative performance penalty of some hazard typeswe may display the percentage of cycles that each hazard type has caused a pipeline stall.
The main difficulty of teaching processor architecture on a textbook is the lack of interactivity inherent toits static representation of information. Understanding how a processor works and the relations among thedifferent processor elements is easier when we may interact with the running system and modify either theprocessor microarchitecture or the executed program. Reproducing the program execution using static tablesis limited to a small number of short examples. Generating tables by hand is very error-prone, since thereare many details to consider and it is easy to forget one of them. For this task, processor simulators mayrepresent a very useful learning tool.
KScalar is a user-friendly processor simulation tool that facilitates the study of complex processor microar-chitectures. It is a graphical environment that simulates the execution of a program binary on a parameter-

2
ized processor configuration, and provides information about the processor and program states in severalvisualization modes. Displayed data is hierarchically organized to make them more readable and selective:
° A pipeline view allows observing, cycle-by-cycle, all the microarchitecture events that occur duringthe execution of a program fragment. It shows a snapshot of the processor’s state to allow exploringthe state of each single instruction or pipeline stage.
° A cycle diagram view displays the contents of the pipeline stages along several cycles, using a verysimple notation to represent pipeline stages and instruction stalls. It provides the whole picture ofwhat has happened on a short period of time (around 15 cycles). Additionally, we may focus selec-tively on particular details of an instruction or a pipeline stage, requesting help on almost any datathat is displayed on the screen, or switching to the pipeline view mode.
° A statistics table shows the number of occurrences for certain (configurable) pipeline events, for ex-ample RAW stalls or cache misses. These statistics may provide an accurate picture of the bottle-necks that limit the performance of the processor for a given program.
KScalar models a wide range of processor microarchitectures: from a very simple in-order, scalar pipe-line, to a detailed out-of-order, superscalar pipeline with non-blocking caches, speculative execution, andcomplex branch prediction. It interprets executables for the Alpha AXP instruction set. They may be shortprogram fragments or very large, complete applications. Finally, the object’s program execution may besimulated either cycle-by-cycle, observing all the pipeline events that determine processor performance, ormillion cycles at once, taking statistics of the main performance issues. In the cycle-by-cycle mode, with thepipeline and cycle diagram views, we can navigate forward and backward through the simulation. This per-mits advancing the simulation to take performance statistics, and then revising the execution to find thereasons for possible bottlenecks.
In summary, the simulator helps understanding the performance impact of the various microarchitecturaltechniques used on current processors, and permits finding the performance bottlenecks on real programfragments or whole applications.
Instructors may use KScalar in several ways. First, it may be used to provide demonstrations in lectures oronline learning environments. Second, it allows students to investigate the characteristics of specific proces-sor microarchitectures as practical short assignments associated to a lecture course. Third, students mayundertake major projects involving the optimization of real programs at the software-hardware interface, orinvolving the optimization of a processor microarchitecture for a given application workload.
A preliminary version of KScalar has been successfully used in several lecture courses during the last twoyears in our University. KScalar runs on x86/Linux systems under a KDE environment. It is composed oftwo parts: a graphical interface and a text-based simulator engine. The graphical interface has been devel-oped using the KDE and QT graphic libraries. The simulator engine is a heavily-modified version of Sim-pleScalar 3.0 [1]. KScalar code is available under the terms of the GNU and SimpleScalar General PublicLicense.
The rest of the paper is organized as follows. Section 2 reviews some introductory concepts regardingsimulation and processor architecture. Section 3 describes all the simulator capabilities from the user’s pointof view. The next section presents a tutorial to show how these capabilities may be used in a learning dem-onstration. Then, we present the simulator as a teaching tool, providing some advice to instructors that wantto use it in their courses. Section 6 lists a large set of future development lines for KScalar, some of themare ongoing projects. To conclude, we provide references and comment some existing processor simulators.Four extra appendices provide complete information about KScalar installation and technical information,about the functionality of the simulator engine alone, about the license conditions, and a brief guide to theAlpha AXP ISA.
2. Basic Concepts regarding Simulation and Processor Architecture
The instruction set architecture (ISA) of a processor specifies its programmer-visible state and the opera-tions performed by each instruction on this state. It describes all the details required to write correct pro-grams. Functional or instruction-set simulators can interpret programs written or compiled for processors

3
that may be unavailable, providing detailed information about the behavior of programs. Classical addresstracing gathers a list of instruction and/or data memory references performed by a system. A generalizationis to trace, count, or categorize execution events, such as common values of variables, register usage pat-terns, and so on.
A functional simulator may be a very good debugging tool, since it runs deterministically and makes itpossible to query the program’s state without disturbing it. The simulator can also be backed up to an earliercheckpoint in order to implement reverse execution, and can perform consistency checks that cannot bedone on real hardware. However, for current processors, functional simulators cannot be used to determineexecution performance.
A performance simulator models the timing behavior of some computer components when executing a pro-gram, especially the processor pipeline and the memory system. It may be trace-driven, when data from theexecution is obtained from a trace file, or execution-driven, when it performs its own instruction-levelsimulation. The microarchitecture of a processor specifies its internal organization (caches, instructionqueues, arbitration policy of storage ports) and includes state not specified at the ISA level. It determinesthe final performance of the processor. A performance simulator provides access to the processor microar-chitecture, and may be used to analyze its behavior and, in turn, to improve the design and implementationof everything from microarchitectures to architectures to compilers to applications.
A cycle-by-cycle simulator models all simulated events in terms of processor clock cycles. To get the ul-timate measure of a processor’s performance it is necessary to estimate its cycle time on a real implementa-tion. This detailed model must specify several details of the specific implementation technology in order todetermine the longest critical path through any of the pipeline stages.
3. KScalar User ’s Guide
KScalar is a cycle-by-cycle, execution-driven, performance simulator, with a graphical interface that makesit suitable for studying and evaluating complex processor microarchitectures. Its main characteristics are:
1. It runs on x86/Linux systems under a KDE graphical environment.
2. It interprets executables for the Alpha AXP instruction set, ranging from short program fragments tovery large, complete applications. It doesn’ t support system level simulation: system calls made by thesimulated binary are intercepted and executed by the Linux operating system, with the results copiedinto the simulated program’s memory.
3. It models a wide range of processor microarchitectures: from a very simple in-order, scalar pipeline, toa detailed out-of-order, superscalar processor with non-blocking caches, speculative execution, andcomplex branch prediction.
4. It provides information about the processor state and the program state in a hierarchical way, using sev-eral visualization modes: pipeline view, cycle diagram view, and statistics table. We can navigate for-ward and backward through the previous simulated processor states.
5. Execution may be simulated either cycle-by-cycle, observing all the pipeline events taking place, ormillion cycles at once, taking statistics of the main performance issues.
3.1.Overview of the Main Simulator Window
The KScalar graphical interface has the look&feel of the KDE/Linux environment. Basic knowledge in awindows system is assumed along this description. Figure 1 shows the basic components of the simulatorwindow: the classical menu, tool and status bars. They are present in any windows-based application andshould be very intuitive to understand and use. As a general guideline, you may refer intensively to thecontext-sensitive help provided in almost any widget in the window. Stay a few seconds pointing to objects

4
and tip descriptions will pop-up. Clicking on the help button, , and then on the object of interest, pro-vides more detailed information.
The particular elements inside each window bar will be described in the order they will likely be used in asimulation session:
1. configuring the simulated processor’s microarchitecture
2. loading the object program
3. advancing simulation
4. visualizing information in two basic modes: pipeline view and cycle diagram view
5. and showing simulation’s statistics
� � ��� � ���. Main elements of the KScalar window.
3.2.Configur ing the processor ’s microarchitecture
Configuration may be done interactively, selecting options on a dialog window, or using a configurationfile. A configuration file may be easily created by first selecting options interactively and then using theprovided save facility to store the configuration for later use. Configuration files are expected to have theextension .cnf and to be found in the directory cnf. Loading a new configuration file or modifying the cur-rent configuration reinitializes the simulation. The bottom-right corner of the window shows the name of theconfiguration file used to specify the current options, if any.
Configuration commands are grouped into the Processor menu, and may be accessed using specific but-tons on the toolbar or pressing dedicated hotkeys. Individual configuration parameters are classified intoseveral groups:
• � ��� � � � � � ��� . It is possible to select, individually, the width of the following pipeline stages: fetch,decode, issue and retire. The maximum branch predictor bandwidth is also selectable.
• ��� � � � . Allows modifying the size of the fetch queue and the misprediction recovery latency. It is pos-sible to indicate the use a perfect branch predictor or a perfect instruction cache. Perfect means thatfetch unit performance is never reduced due to branches (either taken or not taken) or instruction
����� �"!$#�%: all functionality
is available here, classifiedby type of operations
&(' )�' * +-,$)�.: information
regarding the state of thesimulator is presented here
/ 0 0 132$4�5: click here to invoke
frequently used functions

5
cache misses. The size of the Branch Queue is user-defined, and determines the maximum number ofpredicted and not retired branches.
• 6�7 8 9 :�; < =�>@?3=�A 8 . Permits selecting between in-order and out-of-order instruction dispatching. It ispossible to activate or deactivate operand bypass and the use of a perfect data cache. For in-order dis-patching, we may force all instructions to pass through the pipeline memory stage, or allow non-memory instructions to skip the stage. For out-of-order processor models, the size of the instructionqueue and the active list may be specified. Figure 2 shows a snapshot of the B�C D E F G H I JLKMI N D dialog,which also exemplifies the use of the context-sensitive help to get tip information.
• O3P Q�R�S TVU�P W X Y S Z Y [�R . Static and dynamic branch prediction algorithms may be used. Dynamic branchprediction may be local, global, or a hybrid model that combines both methods using a selection table(McFarling algorithm [3]). We may choose the size of the local and global history tables, and the sizeof the prediction counters. The simulator also models a parameterized Branch Target buffer and aReturn Address Stack.
• \�] ^ ]$_3] ` a�b c�d e�f ^ g h�` ^ i j�ek_3] ` a�bl]�e�mon�pVqle�i r i b mk_3] ` a�b . The organization and topological parame-ters of all the caches are user-defined (line size, number of ways and sets, and replacement policy).Access latencies are defined for the data cache and the L2 cache. Additionally, the number of datacache ports is user-defined.
• s�t u v w�x y z�{(|�} x u {�v y u ~ . The latency of each operation type may be individually configured.
• ��� ����� � . The L2 Bus and System Bus latencies and bandwidths may be specified. It is possible toindicate the use of a perfect L2 cache. Finally, the size and the number of ports of the Miss AddressFile (MAF) is user-defined, which determines the maximum number of pending miss requests and thenumber of miss requests that may be serviced per cycle.
Some option values may be invalid or some combination of options may be incompatible. In this case, anerror message appears when we press the Apply button.
� � ��� � ���. Processor configuration dialog. The figure shows the particular options for the Execution Core.
All options can be modified and pop-up a tip description regarding their function and their format.

6
3.3.Loading an object program: binary files or EIO trace files
The simulator is able to execute Alpha AXP EV6 binary code (see appendix D for a short description of theAlpha AXP ISA). Object programs may be loaded in a typical executable format, produced by a compilerand linker (statically linked), or may be specified as External Input/Output (EIO) trace files.
EIO files are generated from the original program binary using the text-based simulator provided inKScalar. Appendix B describes the procedure to create an EIO file. It contains the initial architected state(registers and memory), including the code text and the command-line arguments. Also, a trace of the exter-nal Input/Output operations of the program’s execution is stored (i.e., the system calls made by the simu-lated program to the operating system). Using the EIO trace, the simulator can repeat the same executionseveral times. EIO traces are 100% reproducible, since the sources of irreproducibility are captured in thetrace file. Also, EIO files provide a convenient method to execute interactive programs in batch mode andallows packaging up an experiment into a single file (including options, user environment, file accesses,network I/O, etc. ). Finally, since EIO traces capture the output of a program (writes, network output, etc.),the simulator may check any output attempted against that recorded in the EIO trace file, making EIO tracefiles self-validating.
EIO files are expected to have the extension .eio and to be found in the directory eio. Figure 3 illustrateshow to use a file dialog to load an EIO file.
� � ��� � �3�. File dialog used to load a program EIO trace file.
3.4.Execution commands: Step, Fast Forward, Run and Stop
There are three modes to advance the simulation: stepping a single cycle, simulating cycle-by-cycle in con-tinuous mode, or executing at maximum speed a given number of cycles. Simulation history is normallymaintained as the simulation advances. This allows navigating forward and backward through the previoussimulated processor states, observing certain pipeline events in detail, or taking a broader look at severalcontiguous executed cycles, or even looking at the execution statistics for thousands or millions of simu-lated cycles. Storing simulation history, though, consumes memory and slows down simulation. For thisreason, the third simulation model does not stores history, making its operation two or three orders of mag-nitude faster.
The step command (available as a button, as a menu option and with the hotkey F7) advances the simula-tion a single cycle and permits observing in detail all the events occurring during the execution of this cycle.The Run command advances the simulation cycle-by-cycle, storing simulation history, but continues thesimulation until the Stop command is invoked (generally clicking on the stop button or hotkey F9). It ispossible to configure a simulation delay, in order to avoid the simulation advancing too fast.

7
Finally, the Fast Forward command advances the simulation a selectable number of cycles without up-dating simulation history. This behavior introduces holes into the pipeline and cycle diagram views, andmay lead to certain confusion.
The status bar (see figure 4), always shows the counters for the last simulated cycle. There are alternativeview counters pointing to the instructions being visualized at this moment.
� � ��� � ���. Status bar showing information about the current action and the current program and processor configuration.
3.5.Pipeline View
The pipeline view allows observing, cycle-by-cycle, all the microarchitecture events that occur during theexecution of a program fragment. It shows a snapshot of the processor state, allowing to explore the state ofeach single instruction or pipeline stage (see figure 5). There are three visualization areas: the active list, thepipeline stages, and the instruction information window.
The active list contains, in instruction-fetch order, all the instructions into the pipeline. It provides a PC-related identifier of the instruction and its mnemonic description. Next we will explain how instructions areidentified.
The pipeline stages only show the instruction identifier, sometimes followed by a character symbol thatindicates a significant event on the instruction. A significant event does not necessarily means that a pipe-line hazard has occurred. It may indicate, for example, the use of a bypass path to forward a result to theexecuting instruction (as it is the case in the example of figure 5). By clicking on a instruction, some se-mantic information is displayed in the bottom-left window, including the type of operation and its executionlatency, the operand registers, the constants used, the accessed memory address, ... Also, a short explanationof the event is shown at the bottom line. Additional help may be obtained by clicking on the help button andthen on symbol ,.
On each simulation step, the view is updated with the new pipeline state and the last instruction beingentered in the pipeline is automatically selected and its semantics are visualized.
� � �� ¡ ¢3£. Pipeline View. The active list shows instructions in order. The Pipe Stage lists show only the instruction Pctag,
while the Instruction View window describes the semantics of the selected instruction.
¤�¥§¦ ¨ ©�ª@«�¨ ¬�¦
¨ ®Mª�¯ ¨ °�ª�± ¦ ²M³�ª�¬
´ °�¬�¦ µ ¶�¥§¦ ¨ ·3°k¸�¨ ª§¹

8
Instructions are identified using a combination of two tags, which provides a unique identification method:PC tags and counter tags. PC tags classify instructions using the sequential order of their memory addresses.Instructions stored into contiguous memory addresses have contiguous PC tags. This kind of tag is the mostintuitive way to identify instructions, and it is often found in textbooks about computer architecture. Thefirst instruction in the text segment is assigned the PC tag 0, the following instruction is assigned the tag 1,and so on.
PC tags, however, do not uniquely identify the instruction instances in the processor pipeline. For exam-ple, when a loop is executed, it may frequently happen that two instances of the same instruction, each be-longing to different loop iterations, are concurrently present in the pipeline. One way to differentiate thisinstruction instances is using an additional counter tag.
Counter tags are built using the dynamic program execution order, which also matches decode and retireorder (even in an out-of-order processor). We use PC-relative counter tags, assigning a different tag to eachexecuted instance of the same static instruction. Combining a PC-tag plus a PC-relative counter tag providesa tagging method that always differentiates the instructions in the processor pipeline. All the instances of thesame static instructions share the same PC tag, maintaining intuitiveness, but have a different counter tagthat establishes an order between them. In the graphical simulator, counter tags are not shown. Instead, adifferent color is used for different PC tags (from a palette of 8 different colors).
º » ¼�½ ¾ ¿3À. Detail of the state slide. It permits navigating through the simulated cycles. The associated counter indicates
the cycle being visualized. There is a similar bar for navigating through instructions.
We can navigate forward and backward through the previous simulated processor states using the horizontaland vertical sliders (figure 6). This permits revising the execution with detail, analyzing events that werepreviously ignored. Remember that the status bar (figure 4) always shows the counters for the last simulatedcycle and the last retired instruction, while the counters on the sliders show the cycle and instruction beingvisualized at this moment.
3.6.Cycle Diagram View
A cycle diagram view displays the contents of the pipeline stages along several cycles, using a very simplenotation to represent pipeline stages and instruction stalls. It provides the whole picture of what has hap-pened on a short period of time (14 cycles). We may select a specific instruction and pipeline stage, andthen switch to the pipeline view mode in order to get additional help regarding the instruction. There is abutton for switching between the pipeline and the cycle diagram views (an also the hotkey CTRL+T).
The cycle diagram representation is very similar to the representation used in the Patterson and Hennessytextbooks, [2]. It includes the same symbols used in the pipeline view to indicate the occurrence of a signifi-cant pipeline event. Visualization counters point to the bottom instruction and to the leftmost simulationstate. The horizontal and vertical sliders also allow navigating forward and backward through the previoussimulated processor states.
It is easy to find the dependency chains that are causing the main problems on the execution: they arevisualized as large rows into the cycle diagram and make the bottom part of the diagram to shift to the left.If an instruction is delayed (large row), but the instructions below it are not shifted to the left, then the delayis hidden, and no penalization occurs.
Figure 7 visualizes some instructions inside a loop. Notice how instructions 1-4 appear two times, butwith a different color. This indicates that they have a different counter tag and, then, belong to different loopiterations.

9
Á  Ã�Ä Å Æ3Ç. Cycle Diagram View. Colors indicate different iterations of a loop.
3.7.Showing statistics
A statistics table shows the number of occurrences for certain (configurable) pipeline events, for exampleRAW stalls or cache misses. These statistics may provide an accurate picture of the bottlenecks that limitthe performance of the processor for a given program.
Kscalar does not provide a fixed set of statistics. Instead, statistics have to be generated (defined) dy-namically. These are some of the reasons:
• Taking statistics wastes considerable simulation time, and often we want to obtain statistics from alarge program fragment. Allowing “activating” and “deactivating” statistics affords simulation time.
• Statistics strongly depend on the model being simulated. For example, the way to measure pipelinestalls is very different if we use an in-order processor model or an out-of-order processor model.Selecting statistics dynamically permits adapting the measures to the processor model.
• It is impossible to provide all the statistics that a user should try to obtain. For example, the numberof times conditional branch instructions that jump forward mispredict using a local predictor. Fa-cilitating a mechanism to create statistics allows adapting better to the user’s requirements.
All statistics are constructed from built-in state variables. State variables can be inspected using a menuoption or a button. For example, there is a variable that indicates if a data cache miss has occurred in thecurrent simulation cycle. State variables represent events occurring on the processor microarchitecture anddescribe the state of the simulated processor. Some of them are present in any processor configuration whileother variables are particular to a given processor model. For more details about how to create statisticsrefer to section 5 and appendix B.
Although creating statistics is a complex task, the method to “ install” pre-defined statistics is very simple.A command file, which contains commands understandable by the underlying simulator core, can be exe-cuted to install the statistics. For example, figure 8 shows a list of statistics created when invoking the (pro-vided) command file inOrderStats.cmd. Command files are expected to have the extension .cmd and to be

10
found in the directory cmd. Loading a new configuration file or modifying the current configuration reini-tializes the simulation and loses the predefined statistics. Help information about the meaning of each sta-tistic may be obtained by pointing to the statistic name during a few seconds.
È É Ê�Ë Ì Í�Î. Pre-defined Statistics for in-order execution. They are loaded when executing the file Ï Ð Ñ§Ò Ó Ô Ò Õ�Ö × Ö Ø Ù Ú Û3Ó
The underlying text-mode simulator provides functionality that is not fully integrated in the graphical inter-face. However, there is a special expert mode window that permits communicating directly with the simu-lator engine. Figure 9 shows an example that also presents some of the available text-mode commands.
Ü Ý Þ�ß à á�â. Communicating with the underlying simulator core using the Expert Mode window.

11
4. Tutor ial: a First Example
This tutorial describes a session using KScalar that shows how a simple processor pipeline works. The basiceducational goal of the tutorial is to show and quantify the problem of true data dependencies (RAW) andcontention on a single register write port. We start with a very simple 5-stages pipeline configuration (simi-lar to the Hennessy-Patterson pipeline model [2]) with all execution latencies equal to one cycle.
1. We analyze the performance advantage of implementing result bypassing (or result forwarding).2. We study the problems introduced when multicycle operations are considered.
This simple example is not meant to show all aspects of Kscalar, but acts only as a first introduction. Pleaseuse the context-sensitive help by pressing the help button and then pressing anywhere. The software distri-bution provides many configuration files and some additional object binaries that will be helpful to use.
At this point it is assumed that you have an installed Kscalar distribution (see appendix A), an you havebasic knowledge both in the use of the Linux-KDE environment and about the Alpha AXP achitecture (seeappendix D)
4.1.The Simulated Object Program
This chapter uses a synthetic code fragment that performs the scalar product of two vectors. The basic sub-routine is called from a main program and then execution ends. A C implementation for that code would besomething like this:
f l oat V1[ 16] , V2[ 16] , Res;voi d mai n( ){ Vect Pr od( 16, V1, V2, &Res) ; exi t ( 0) ;}
voi d Vect Pr od( i nt l engt h, f l oat * A, f l oat * B, f l oat * C){ f l oat t mp=0. 0; f or ( ; l engt h; l engt h- - , A++, B++) t mp= t mp + ( * A) * ( * B) ; * C = t mp;}
Next we list the Alpha assembler code, with register-transfer and C-like comments. Instructions are num-bered from 0 to 20 and code addresses are substituted by instruction numbers (this is the way KScalar dis-plays instructions). Program execution starts at instruction 13.
Vect Pr od:
0> adds f 31, f 31, f 0 ; f 0 ← 0. 0 t mp=0. 0 1> beq r 1, 10 ; i f ( r 1==0) got o 10 f or ( ; l engt h; )
2> l ds f 1, 0( r 2) ; f 1 ← MEMORY( r 2) access t o * A
3> l ds f 2, 0( r 3) ; f 2 ← MEMORY( r 3) access t o * B
4> mul s f 1, f 2, f 3 ; f 3 ← f 1 · f 2 * A · * B
5> adds f 0, f 3, f 0 ; f 0 ← f 0 + f 3 t mp += . . .
6> addqi r 2, 4, r 2 ; r 2 ← r 2 + 4 A++
7> addqi r 3, 4, r 3 ; r 3 ← r 3 + 4 B++
8> subqi r 1, 1, r 1 ; r 1 ← r 1 - 1 l engt h- - 9> br r 31, 1 ; got o 1 r epeat f or
10> st s f 0, 0( r 4) ; MEMORY( r 4) ← f 0 * C = t mp11> r et r 31, ( r 26) ; j ump t o r 26 r et ur n

12
mai n:
13> addqi r 31, 16, r 1 ; r 1 ← 16 l engt h
14> l da r 2, 320( r 31) ; r 2 ← 140h ( 16bi t s) bui l d &V1
15> i nswl i r 2, 3, r 2 ; r 2 ← 140h bui l d &V1
16> addqi r 2, 64, r 3 ; r 3 ← r 2+64 bui l d &V2 as &V1+16* 4
17> subqi r 3, 64, r 4 ; r 4 ← r 3+64 bui l d &Res as &V2+16* 4
18> bsr r 26, 0 ; cal l 0 ( r 26← next PC) cal l Vect Pr od( )
19> addqi r 31, 1, r 0 ; r 0 ← 1 ( exi t syst em cal l )20> syscal l ; syst em cal l exi t ( )
The execution of function VectProd consists of a loop that is executed 16 times (16 is the initial value ofvariable ã ä§å�æMç�è / register r1). On each iteration, two 32-bit memory loads, two floating-point operations,three integer operations and two branch operations (one conditional and one unconditional) are executed.Memory loads start on addresses 0x140000000 and 0x140000040 (variables é and ê / registers r2 and r3).The final result is written to memory address 0x140000080 (variable ë§ì�í / register r4). Instructions 0, 10-11, and 13-20 are executed only once, while instructions 1-9 are executed 16 times. Instruction 1, the condi-tional branch, is executed 17 times, and only the last time is taken. 156 instructions are executed in total.
4.2.The Simulated Processor Microarchitecture
As said before, a default processor configuration is initiated. We will explain later how to change it, but, fornow, we will use the default configuration. The main characteristics of the default 5-stage processor pipelineare listed bellow. Detailed characteristics will be introduced during the simulation tutorial.
IF: One instruction fetched per cycle, ideal instruction cache (always hit), and ideal branch prediction(always fetches the correct instruction)
ID: One instruction decoded per cycle. RAW or resource hazards stall the instruction here. Up to twooperands are read from the register file. Results from an older instruction may be forwarded to thedecode instruction.
EX: One instruction issued per cycle (always in-order). Execution latency is always 1 clock cycle. Takenbranches (both conditional and unconditional) modify the PC at the end of this stage.
MEM : All instructions traverse this stage but only loads/stores do access the ideal data cache (always hit)WB: At most one result written per cycle
4.3.Star ting KScalar and Loading an Object Program
When Kscalar is started, a clean main window appears with several menu options. A default processor con-figuration is initiated but no object program is loaded. You can check the current configuration and programin the status bar, at the bottom-right of the main window.
In order to be able to start the simulation, one program and one configuration must be loaded. To load ourexample, click on the InputFile menu and click open EIO (you can either push the corresponding tool but-ton or press the hotkey CTRL+O. Hotkeys are shown in the menus, in this case hotkey is CTRL+O). Wewill not specify where are the command buttons. Just point to the buttons in the tool bar, wait a few secondsand a tip description of the button function will pop-up.
After invoking the open EIO command, a file window is opened and you have to type or select the filename “vectprod.eio“ and click the OK button. Confirm the loading by looking at the status bar.
It is time to start the simulation now, so click Simulate in the main window. In the appearing pull downmenu, click Step one Cycle. Pressing F7 or clicking the Step button has the same effect. Don’ t worry aboutconfiguring the simulated processor, for now. The default configuration is just the one described in the lastsection.
î ï î ð ñ òó ô õ ó õ

13
At this moment, the simulation has advanced one cycle (see the instruction counter in the status bar), aninstruction has entered the pipeline, and some information regarding the instruction is displayed on thescreen.
4.4.Pipeline View
Let us take a look at how KScalar represents the processor pipeline. The simulator starts with the pipelineview as a default view, but you may toggle between the pipeline and the cycle diagram view using theoption Toggle Pipeline View (CTRL+T or toggle button).
Figure 10 shows the pipeline view after executing one instruction. There one large and wide column dis-playing a list of currently active instructions: it is the Active List. There are five shorter and narrower col-umns representing the processor‘s five-stage pipeline. Instruction number 13 has entered the pipeline and is
in the IF column, i.e., it is in the instruction fetch stage. Clicking on the help button, , and then on thecolumn title, provides detailed information about the pipeline stage function.
ö ÷ ø�ù ú û ü ý. Pipeline view. An instruction has entered the pipeline and is shown in the IF stage. Semantic information is
displayed in the bottom window, specifying the input and output registers, the type and latency of the operation.
Semantic information is displayed in the instruction view window, specifying the input and output registers,the type and latency of the operation. The number at the top-left of the instruction view window representsthe number of execution instances of the same static instruction. In this case, since the instruction is exe-cuted for the first time, its value is 0.
4.5.Advancing the Simulation
Press the step button four times to reach the 5th cycle. Instruction 15 has a ¬ symbol in the EX pipeline stage.Click on the EX pipeline stage on top of instruction 15 and observe the help explanation in the instructionview window. Figure 11 shows that situation. You should notice that instruction 15 has a RAW dependencewith instruction 14 on register R2. However, since instruction 14 is in the MEM stage and has completed itsoperation (it is an integer operation, not a load instruction), the result that must be written to register r2 in
þ(ÿ�� � ������� �� � ����� � ������ �����
� ��� � �Mÿ�� � �� ���� ���

14
the next cycle may be forwarded to instruction 15 using a bypass path. From now on, you must associate thesymbol ¬ to a bypass. Don’ t worry! You can always click on the instruction to get help in the instructionview window. Try getting help by clicking on the help button and then on symbol ,.
� � �! " #%$ $. Pipeline view. An instruction has received an input operand from a bypass path. See the ¬ symbol in the
pipeline stage and the help explanation in the instruction view window.
Before advancing simulation let’s try to navigate backward through the previous simulated processor states.You may use the horizontal sliders (in the tool bar), the buttons next to the slider or hotkeys F5 and F6. Wemay say a word to explain how the counters in the screen must be interpreted. The status bar always showsthe counters for the last simulated cycle and for the last retired instruction (retired means that the instructionhas left the pipeline). On the other side, the counters on the sliders show the cycle and instruction beingvisualized at this moment.
Notice that the active list contains all the instructions currently into the pipeline in instruction-fetch order.Moving through the active list or selecting instructions modify the counter on the top-right of the active list,but do not modify the top-left counter nor modify the pipeline contents. The counter on top of the active listis a global instruction counter, i.e., counts instructions as they enter the pipeline.
Pressing on the top-left slider, though, modifies the visualized cycle, so the pipeline contents move. Itpermits repeating the sequence of execution backwards and forwards.
Advance to the 12th cycle and then advance to the 14th cycle. You can find another two symbols, * and !.Try getting help on instructions 3 and 4 to understand the reasons of the pipeline stalls.
4.6.Cycle Diagram View
Deselecting on the View menu the option Toggle Pipeline View (or clicking the toggle button or pressingCTRL-T), will switch to the Cycle Diagram view. It shows execution information along time. Figure 12shows all the information from cycle 1 to cycle 14. In this mode we cannot get visual information about theinstructions (we must remember the meaning of symbols). However, we may select an instruction (like infigure 12), and then switch to the pipeline view to get information.

15
& ' (!) * +%, -. Cycle Diagram view. Instruction 3 (selected) is stalled due to a WB conflict. Issuing instruction 3 to EX on
cycle 12 would have created a conflict with instruction 0 on the WB stage, since there is only one register file write port.
Press F8 to execute the program continuously. This hotkey invokes the Run command. You can stop simu-lation run by pressing F9 -or clicking on the stop button-. In this case, however, let simulation run until theinstruction count reaches 156 and the simulation is stopped automatically. At this stage, the pipeline con-tains only a syscall instruction. It has generated a system call with parameter 0, which indicates an exit pro-gram system call. Now you should navigate backward through the cycle diagram to analyze the execution ofthe last instructions. Go at your own speed, but be sure you understand all the information shown in bothviews.
4.7.Statistics window
Now we will examine the statistics window. Try opening the statistics window by invoking the ExecutionStatistics command in the View menu: it doesn’ t work! In fact, statistics must be installed each time youwant to start taking measures on a program execution. Also, you may select which statistics are installed:those that you are interested in at that moment. The procedure to install statistics is very simple.
First you must reset simulation (CTRL+R). Then, invoke the Execute Command File on the Simulatemenu and select the file inOrderStats.cmd. Press OK and the command file will be executed. If you invokethe Execution statistics command again you will see the statistics window with all of them set to zero.
Now run the program in fast mode. You must modify the fast forward step from 10 to 1000 and press thefast forward button (or SHIFT+F7). The simulation stops when the instruction reaches 156. If you toggle tothe cycle diagram view you will find a strange diagram: remember that fast forward simulation does notstore simulation history!
If you invoke the Statistics command now you will see the list of stall counters with updated information(a snapshot of the statistics screen is shown in figure 13). The “ installed” statistics count the total penaliza-tion for each type of pipeline stall. Those penalizations only occur in the ID stage, creating a bubble into thepipeline.
Statistics are extremely useful to compare the effects of changes in the microarchitecture configuration.We will try this now: let us examine the effects of operand bypassing in the example. Until now, we haveused this feature; what would the execution time have been without bypassing?

16
. / 0!1 2 354 6. Statistics dialog. The “installed” statistics count the total penalization for each type of pipeline stall.
Let’s take a look now at the configuration dialog. It describes all the processor options, and allows modify-ing the. configuration. Figure 14 shows the Execution Core options. To disable bypassing, click on the Re-sult Bypass checkbox. When you select apply, the simulation is restarted. Don’ t forget installing the in-order statistics again (loading and executing the file inOrderStats.cmd). Run the whole simulation againwith SHIFT+F7.
7 8 9!: ; <5= >. Options dialog. The “installed” statistics count the total penalization for each type of pipeline stall.
17
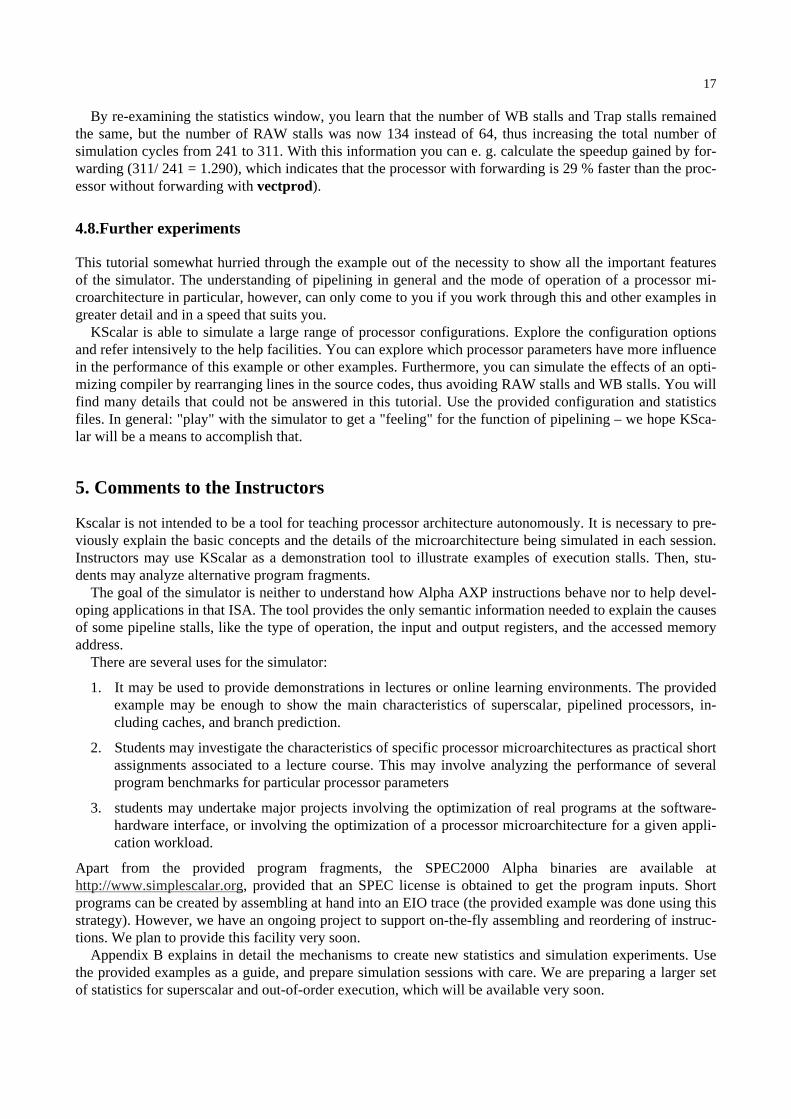
By re-examining the statistics window, you learn that the number of WB stalls and Trap stalls remainedthe same, but the number of RAW stalls was now 134 instead of 64, thus increasing the total number ofsimulation cycles from 241 to 311. With this information you can e. g. calculate the speedup gained by for-warding (311/ 241 = 1.290), which indicates that the processor with forwarding is 29 % faster than the proc-essor without forwarding with vectprod).
4.8.Fur ther exper iments
This tutorial somewhat hurried through the example out of the necessity to show all the important featuresof the simulator. The understanding of pipelining in general and the mode of operation of a processor mi-croarchitecture in particular, however, can only come to you if you work through this and other examples ingreater detail and in a speed that suits you.
KScalar is able to simulate a large range of processor configurations. Explore the configuration optionsand refer intensively to the help facilities. You can explore which processor parameters have more influencein the performance of this example or other examples. Furthermore, you can simulate the effects of an opti-mizing compiler by rearranging lines in the source codes, thus avoiding RAW stalls and WB stalls. You willfind many details that could not be answered in this tutorial. Use the provided configuration and statisticsfiles. In general: "play" with the simulator to get a "feeling" for the function of pipelining – we hope KSca-lar will be a means to accomplish that.
5. Comments to the Instructors
Kscalar is not intended to be a tool for teaching processor architecture autonomously. It is necessary to pre-viously explain the basic concepts and the details of the microarchitecture being simulated in each session.Instructors may use KScalar as a demonstration tool to illustrate examples of execution stalls. Then, stu-dents may analyze alternative program fragments.
The goal of the simulator is neither to understand how Alpha AXP instructions behave nor to help devel-oping applications in that ISA. The tool provides the only semantic information needed to explain the causesof some pipeline stalls, like the type of operation, the input and output registers, and the accessed memoryaddress.
There are several uses for the simulator:
1. It may be used to provide demonstrations in lectures or online learning environments. The providedexample may be enough to show the main characteristics of superscalar, pipelined processors, in-cluding caches, and branch prediction.
2. Students may investigate the characteristics of specific processor microarchitectures as practical shortassignments associated to a lecture course. This may involve analyzing the performance of severalprogram benchmarks for particular processor parameters
3. students may undertake major projects involving the optimization of real programs at the software-hardware interface, or involving the optimization of a processor microarchitecture for a given appli-cation workload.
Apart from the provided program fragments, the SPEC2000 Alpha binaries are available athttp://www.simplescalar.org, provided that an SPEC license is obtained to get the program inputs. Shortprograms can be created by assembling at hand into an EIO trace (the provided example was done using thisstrategy). However, we have an ongoing project to support on-the-fly assembling and reordering of instruc-tions. We plan to provide this facility very soon.
Appendix B explains in detail the mechanisms to create new statistics and simulation experiments. Usethe provided examples as a guide, and prepare simulation sessions with care. We are preparing a larger setof statistics for superscalar and out-of-order execution, which will be available very soon.

18
6. Future Development L ines
A preliminary version of KScalar has been successfully used in several lecture courses during the last twoyears in our University and it is being used now in two more universities. During this experience, apart fromdetecting many bugs, students have suggested many interesting improvements; some of them are currentlybeing developed and some will be developed in the near future.
There are three ongoing projects:• Static Analysis of Programs: Static code disassembling. Static analysis of program dependencies.
Support for assembling and reordering instructions on the fly. Enhanced help on ISA. The existing sup-port for creating EIO traces from binaries will be integrated in the graphical interface.
• Profile suppor t: Breakpoints and watch-points both in program-related events and in processor–relatedevents. For example, analyzing why a given conditional branch is mispredicted too frequently may re-quire tracing particular entries on the branch prediction tables and identifying conflicting conditionalbranches. Detailed cache and branch prediction visualization modules will allow the selective tracing oftable contents (watches on specific cache lines or branch prediction entries).
• Graphical Statistics Package: Support to create new statistics integrated on the graphical interface.Configurable chart diagrams. Generating graphical data while running the program. Generation of resulttables to be processed with a spreadsheet.
Additionally, there are future development lines that are under consideration:• As long as the SimpleScalar tool offers support for other ISAs (support for i386 and ARM is promised
in the SimpleScalar 4.0 release, this December) we try to integrate them with our graphical tool.• Configuration of the processor microarchitecture using a real graphical interface. Dynamic control of
restrictions for the configuration parameters.• Enhancement of the simulated processor’s model: register renaming, restrictions on the execution
bandwidth for each operation type, trace-only and warm-up simulation mode, ...
7. References
[1] Burger, D., Austin, T.M.: The SimpleScalar Tool Set. Univ. Wisconsin-Madison Computer Science Department,Technical Report TR-1342, 1997.
[2] Hennessy, J., and Patterson, D.: Computer Architecture: a Quantitative Approach. 2nd Edition. Morgan KaufmannPublishers, California, 1999
[3] McFarling, S.: Combining Branch Predictors. Technical Report TN-36, Digital Western Research Laboratory, June1993
There exist many processor simulators that may be of interest. Here we provide references and commentsome existing processor simulators
SimpleScalarhttp://www.simplescalar.org/
This tool set consists of compiler, assembler, linker, simulation, and visualization tools for the SimpleScalararchitecture and the Alpha AXP architecture. With this tool set, the user can simulate real programs on arange of modern processors and systems, using fast execution-driven simulation. They provide simulatorsranging from a fast functional simulator to a detailed, out-of-order issue processor that supports non-blocking caches, speculative execution, and state-of-the-art branch prediction. The tool set is partly derivedfrom the GNU software development tools. It provides researchers with an easily extensible, portable, high-performance test bed for systems design. The SimpleScalar tools are used widely for research and instruc-tion, for example, in 2000 more than one third of all papers published in top computer architecture confer-ences used the SimpleScalar tools to evaluate their designs.

19
All simulators and the pipeline tracing facility run on a text-based environment. A new toolset release(4.0) is coming, with support for new architectures (x86 and ARM) and new performance visualizationtools, statistical analysis resources, and debug and verification infrastructure.
System prerequisites: A general-purpose Unix machine
WinDLX
ftp://ftp.mkp.com/pub/dlx/
It is a MS-Windows based front-end simulation for the DLX simulator available from Stanford. It was de-veloped at the Vienna Institute of Technology. Its graphics applications include a code window that isautomatically colored to indicate the status of instructions in the pipeline, a statistics window that is updatedevery cycle, a pipeline diagram that allows you to inquire about the progress of an instruction in a givenstage, and a pipeline clock cycle diagram that is colored according to the pipeline stage.
It models an in-order execution processor, without superscalar or speculative execution.
System prerequisites: PC with DOS 3.3 or later. Microsoft Windows 3.0 or later.
DLXVSIM Simulator
ftp://www.dpi.inpe.br/pub/dlxvsim/
Developed at the University of Illinois, DLXVsim is a simulator of DLXV, the vector extension of DLXdescribed in Computer Architecture: A Quantitative Approach. DLXVsim allows simulation of chainedvector operations and memory bank conflicts. Both the source code and a small user’s guide are available.
System prerequisites: A general-purpose Unix machine
RSIMhttp://www-ece.rice.edu/~rsim
RSIM was developed at Rice University to simulate shared-memory multiprocessor and uniprocessor sys-tems built from processors that aggressively exploit instruction-level parallelism (ILP). RSIM is execution-driven and models state-of-the-art ILP processors, an aggressive memory hierarchy, and a multiprocessorcoherence protocol and interconnect. It models all system components in great detail (including contentionat all resources), and provides a wealth of statistics. RSIM is being used in both undergraduate and graduatecomputer architecture courses at Rice University.
System prerequisites:
° SUN machines running Solaris 2.5 and 2.6, SGI Power Challenge running IRIX 6.2, and Convex Exem-plar running HP-UX version 10. Applications simulated on RSIM must be compiled and linked forSPARC V9/Solaris 2.5 or 2.6, and must be linked with the included library.

20
Appendix A: Installation Guide and Technical Information
A.1.General Software descr iption
KScalar runs on x86/Linux systems under a KDE environment. It is composed of two parts: a graphicalinterface and a text-based simulator engine.
The graphical interface has been developed using KDevelop 1.2, a C++ visual language that uses theKDE (version 1.1) and QT (version 1.4) graphical libraries. Unfortunately, KDE 2.X and QT 2.X introducesubstantial changes and are backward incompatible. We are currently working on a new version that usesthe new libraries.
The simulator engine has been developed using pre-release 3.0 (May 2000) of the SimpleScalar tool set(www.simplescalar.org). The SimpleScalar tools are used to develop execution-driven simulators. Theyavoid generating, storing and reading instruction trace files, and permit modeling control and data mis-speculation in a performance simulator. Our implementation has introduced substantial changes, both in thesimulation engine and the simulator environment. Appendix B describes the added functionality in depth.
The graphical interface communicates with the text-based simulator by capturing the standard input andthe standard output streams. It converts commands generated in graphical mode to text commands that aresent to the simulator engine. The simulator answer is parsed and information is translated to a graphicalview.
Most of the microarchitectural-related issues are obtained from the simulation engine on the fly, and thegraphical interface adapts to that information. This issue permits making substantial modifications to thetext-based (SimpleScalar-like) simulator without needing to recompile the graphical interface. For example,the number of pipeline stages, the different type of stalls with their tip descriptions and help messages, allthe simulation options and their default values, etc. are all obtained from the text-based core dynamically. Infact, options and statistics may be deleted and created during the simulation run.
The simulator has been tested by running the SPEC2000 benchmarks to completion. We have used thebinaries provided by Christopher T. Weaver in the SimpleScalar web (http://www.simplescalar.org/). Thetest, though, only assures functional correctness (the benchmarks do what they have to) but not performancecorrectness (to validate if the execution time is correct under the considered simulation parameters). Per-formance tests are always difficult to do. Only an accurate analysis done by several people may guaranteecorrectness to some degree. We have validated our program with our students, but surely many details arestill hidden.
We have tested Kscalar on several Linux distributions: Red Hat versions 6.1 and 7.1, Mandrake 7.0, andSuse 6.X and 7.0. For very new distributions (Red Hat 7.1), we have had to re-link some shared libraries tomake the program work (see below the installation problems section).
A.2.Installing the Software
There are three distribution files:
kscalar.tgz – simulator suite (binaries and examples)ksource.tgz – sources for the graphical interfacekcore.tgz – sources for the simulator engine
Copy the kscalar.tgz file into your root directory. To decompress the file you need to run the gunzip (GNU)decompress utility and then the tar command. You may do both things in one step with the following com-mand:
ROOT/ > t ar - xzvf kscal ar . t gz
Now you should have the following files in your target directory:

21
KScalar – Directory containing all the binaries and examplesKScalar/Kscalar – Graphical simulator interface binary (you may execute this file)KScalar/Kcore – Text-Based simulator core executableKScalar/eio – Contains sample EIO traces of Alpha binaries
KScalar/eio/vectprod.eio – Tiny object program example (used in the tutorial)KScalar/eio/go.eio – SPEC95 go program (an EIO trace restricted to 100 million instructions)KScalar/bin – Should contain sample Alpha executables (it is empty)KScalar/cnf – Contains sample processor configuration filesKScalar/cnf/inOrder.cnf – In-order processor, perfect mode, issues one instruction per cycleKScalar/cnf/inOrderLat1.cnf – In-order processor, perfect mode and all execution latencies set to 1KScalar/cnf/inOrderBp.cnf – In-order processor, perfect mode but models branch predictionKScalar/cnf/inOrderDC.cnf – In-order processor, perfect mode but models Data CacheKScalar/cnf/inOrder2.cnf – In-order superscalar processor, perfect mode, issues two instructions per cycleKScalar/cnf/inOrder4.cnf – In-order superscalar processor, perfect mode, issues four instructions per cycleKScalar/cnf/outOrder.cnf – Out-of-order processor, perfect mode, issues one instruction per cycleKScalar/cnf/outOrder2.cnf – Out-of-order superscalar processor, perfect mode, issues two instructions per cycleKScalar/cnf/outOrder4.cnf – Out-of-order superscalar processor, perfect mode, issues four instructions per cycleKScalar/cmd – Contains command files used to create execution statisticsKScalar/cmd/inOrderStats.cmd – Creates statistics for accounting the types of stalls in an in-order processorKScalar/cmd/dCacheStats.cmd – Creates statistics for accounting the number of data cache missesKScalar/cmd/iCacheStats.cmd – Creates statistics for accounting the number of instruction cache missesKScalar/cmd/brpredStats.cmd – Creates statistics for accounting the number and type of branch mispredictions
A.3.Problems to run the program
To run the program you must be on the KDE graphical environment, then you must invoke the graphicalinterface from its directory:
ROOT/ Kscal ar / > . / Kscal ar
Unfortunately, some problems may occur. We will comment the most usual ones and provide a solution.
1. The Graphical Interface opens but the simulator core is not found
The Kcore binary must be found in the directory where the Kscalar program is invoked. If necessary, set theappropriate path.
2. The Graphical Interface does not open and complains about not finding a shared library
The Kscalar binary needs the KDE libraries, version 1.1, the QT libraries, version 1.44, and the libstdc++libraries. They have to be installed in your system. For very new Linux distributions, the old QT and KDElibraries are not installed by default.
In first place, you must check that the libraries aren’ t really present in the system. To do this, you mayuse the following command:
> l dconf i g - v
It shows a list of all the system libraries. If a newer version of the requested library exists, a link may becreated to connect the name of the older library with the new library. However, since the QT and KDE ver-sions 2.X are not compatible with versions 1.X, this solution may not work. In this case, you have to installthe older libraries from the installation media. We will describe the steps required to install the libraries forthe Red Hat distribution of Linux, version 7.1. For other Linux distributions the steps should be very simi-lar. Older Linux distributions should work with no problem.
First mount the Red Hat install CD number 2. Then, enter the Package Manager on the KDE graphicalenvironment (it should be necessarily installed, and is found on the system menu). Select the open a package

22
file menu option and navigate though the directory mnt/cdrom/redhat/RPMS/ to find the packages qt1X andkde1-compat. Select those files and the option install. Be sure you check the options upgrade + replace files+ check dependencies. An error message window appears, but the installation is done. Check that navigat-ing through the package manager. The qt1X and kde1-compat packages should be listed bellow the optionssystem Environment/libraries.
There is still one step to do. It is possible that some shared libraries are still not found. They should befound in the directory /usr/lib but they may be newer versions. All that you need is to create links to thenewer versions. The following command will work to for Linux 7.1:
/ usr / l i b/ > l n –s l i bst dc++- l i bc6. 2- 2. so. 3 l i bst dc++- l i bc6. 1- 2. so. 3
Since the provided simulator binary looks for the version 1.2 of the libstdc++ library, this command createsa link to the version 2.2.
A.4.Compiling the Software
In many cases, recompiling the graphical interface will be a cleaner solution than creating links to newerlibraries. However, recompiling in a system that contains the newer, backward uncompatible, QT 2.X orKDE 2.X libraries could be difficult, since the autoconfigure utility cannot find the older versions of QT andKDE.
In order to recompile the graphical interface, you must first copy the ksource.tgz file to your root direc-tory and then execute the following commands:
ROOT/ > t ar - xzvf ksour ce. t gzROOT/ > cd sscal ar - 0. 1ROOT/ sscal ar - 0. 1> . / conf i gur eROOT/ sscal ar - 0. 1> cd sscal arROOT/ sscal ar - 0. 1/ sscal ar > make
Now you should have generated a file named sscalar, which is the graphical simulator interface binary.
Copy the kcore.tgz file to a directory /Kcore, created on the root directory. Then decompress the file andcompile it with the following commands:
ROOT/ > cd Kcor eROOT/ Kcor e/ > t ar - xzvf kcor e. t gzROOT/ Kcor e/ > make
Now you should have generated a file named Kcore, which is the text-based simulator binary. You can testif it works by doing:
ROOT/ Kcor e/ > . / Kcor eDl i t e! > hel pCommand: hel p { name}. . . . . .
A.5.More Information
KScalar is maintained by XXX.Questions and comments can be sent to xxxxxx@xxxxxFor more information about SimpleScalar, visit the SimpleScalar web page at www.simplescalar.org.

23
Appendix B: Kcore
The Kcore text-mode simulator is based on the SimpleScalar 3.0 tools. It contains an embedded light-weight symbolic interpreter (DLite!) that parses and executes simulation commands. Since Kcore has beenadapted to communicate directly with a graphical front-end, all the options that could be specified in thecommand line are also accessible from the command interpreter. Now DLite! is invoked automatically andpermits the execution of simulation commands from a file.
Conversely, the facilities supporting the access to the processor architected state (registers and memory)have been cleared. The goal of our simulator is not to teach issues relative to the Alpha ISA or develop cor-rect assembler programs, nor to prove how the speedup techniques used in modern processors, like out-of-order execution, register renaming and speculation, are implemented to preserve correct processor opera-tion. Since we are only interested in performance issues, providing the actual contents of memory and reg-isters to show the precise semantics of each instruction is out of our interest.
B.1.State Var iables
There are several built-in state variables that can be inspected using DLite! commands. State variables maybe combined with a wide range of operators to form expressions. These expressions can be used to computecomplex execution statistics and generate pretty-printed lists of results.
State variables describe the state of the simulated processor. Some of them are present in any simulatorimplementation while other are particular to a given processor model. Additionally, it is possible to createnew integer, float or string variables that can be used to compute intermediate values or hold temporal in-formation. A formula variable is assigned a string that defines an expression including other variables orconstants. A formula variable is evaluated dynamically each time its value has to be computed and allowsreplacing long formulas by a simple name.
The next table shows the syntax of valid expressions. It is very similar to the C language syntax, includ-ing array indexing [], a ternary conditional operator ?:, and an special def operator that evaluates as TRUE(non-zero) if the following identifier is a defined variable.
<const > : = <dec_const > | <hex_const > | <oct _const > | <f l oat _const >
<dec_const > : = ( ? - @ ) [ A - B ] *
<hex_const > : = C D [ E - F , G - H ] +
<oct _const > : = I [ J - K ] *
<f l oat _const > : = <dec_const > L [ M - N ] * | [ O ] P [ Q - R ] *
<i dent > : = <var i abl e- name> | <opt i on- name>
<t er m> : = ( <expr >) | ( S | T ) <t er m> | <const > | <i dent >[ ‘ U ‘ <expr >’ V ’ ]
<f act or >: = <t er m> | <f act or >( W | X | Y | Z | ‘ [ ’ ) <t er m>
<sum> : = <f act or > | <sum>( \ | ] ) <f act or >
<cond> : = <sum> | ^ <cond> | _a`cb <t er m> | <sum>( d | e | f | gch | i!j | k l ) <sum>
<expr > : = <cond> | <expr >( mam | “ nan ” ) <cond> | <expr > o <sum> p <sum>
qcrasat u�v. Expression Syntax
B.2.Information and File Commands
The following commands describe how to get help, how to load an object program, and how to create anEIO trace at any point of the simulation. An EIO file created before the simulation has started may be usedas a checkpoint to rapidly start the execution of the program at a particular point, instead of restarting thesimulation from the beginning. The creation of EIO and checkpoint files and the use of checkpoint files isdone using special simulator commands.

24
help [<name>]print a description of a simulator command, state variable or simulator option. By default lists all commands
quit exit simulator
version print simulator version
print [/<modifiers>] <expr>print the value of the expression using optional modifiers (see ¡Er ror !No se encuentra el or igen de la refer -encia.)
prints <string>print a string without evaluation. If the string has to include blanks, then it must be double quoted (“….” ). Spe-cial characters can be specified inside the string using ‘ \’
load <string>|<file>load a program with its arguments specified by string (double quoted) or an EIO file. The command reconfig-ures and restart the simulated processor
loadchk <file> load a checkpoint file and forward execution of current program to the checkpoint. He command reconfiguresand restart the simulated processor
makeeio <file> start the generation of a program trace from the current execution point. The trace ends when the program exe-cution is completed, the simulator ends, or another program is loaded
makechk <file>create a checkpoint file at the current execution point. It is assumed that a trace is being used for execution or atrace is being generated
B.3.Execute Commands
They are used for controlling the execution of a program. An execution interval is specified using simulatedcycles or executed instructions. It is important to note that in a processor using out-of-order execution, aninstruction is not considered to be completed until it is retired, i.e., until all previous instructions have beenexecuted and retired. Also, several instructions may be retired in the same cycle.
step [<expr>]simulate the execution for an interval of expr cycles (1 cycle by default)
stepi <expr1> [<expr2>]simulate the execution for an interval of expr1 instructions. Optionally, expr2 sets a maximum on the number ofsimulated cycles for the execution interval
contcontinue execution until completion of program or until a specific processor breakpoint event is found
B.4.Option Commands
All the simulation options described so far are general options that control the operation of the simulator.There are however, options that are used to specify a particular configuration of the simulated processor, forexample, to indicate the size of the internal cache, or the number of execution units. These kind of optionsare called configuration options and, as any other options, may be included into a configuration file. Ofcourse, configuration options are specific to a given processor model. Since the name of the options andtheir description are accessible from the graphical interface we only describe here the commands used tohandle options.
Configuration options, like state variables or defined variables, can be inspected and modified interac-tively. This issue is extremely useful when designing a large simulation experiment, since it permits to rede-fine the simulated processor on the fly and take performance measures over a range of processor parameters.

25
optsprint the name of all simulation options
dumpopt [<file>]print the name and value of all simulation options in a form that can be used as a configuration file (optionallydump information to a file)
config [<file>]reconfigure the processor microarchitecture using the currently specified options. The processor memory andthe internal registers are initialized. An optional configuration file may be used to modify a sequence of options
set_option <name> <expr>change the value of the option name with the evaluation of the expression. It is necessary to use the configcommand for these changes to take effect onto the simulator
B.4.Control Commands
There are three simple control commands (if, while and for) to conditionally invoke another built-in com-mand or a sequence of commands stored in a command file. Command files contain simulation commandsand are expected to have the extension .cmd and to be found in the directory cmd. The recursive invocationof command files can be nested up to a certain depth (implementation dependent). Command files can in-clude comments by starting a line with the character #.
The provision of simple control commands, powerful expression syntax, and operations to create newvariables provides a very simple script language for designing simulation experiments and visualizingsimulation statistics. This issue is very useful for simulating large programs and/or obtaining results forvarying processor parameters.
def_int <name> <expr>[<nelem>]create an integer variable (or array of nelem elements) called name, initialized with value expr
def_float <name> <expr>[<index>]create a float variable (or array of nelem elements) called name, initialized with value expr
def_str <name> <string>create a string variable called name initialized with string
do <file> execute command file unconditionally
exit exit current command file
if <expr> <command>evaluate the integer expression expr and, if it is TRUE (non-zero), then execute command (it may be a com-mand file)
while <expr> <command>evaluate the integer expression expr and, if it is TRUE (non-zero), then execute command (it may be a com-mand file) and repeat the execution of the while command
for <expr> <command>execute command (it may be a command file) as many times as the value provided by the integer expressionexpr
When specifying a command as an argument to another command, it could be necessary to double quote(“…”) the command. Special characters can be specified inside the string using the character ‘ \’ . Example:> if var “prints \”not found\” ”
If the value of variable var is different than zero then the command pr i nt s “ not f ound” is exe-cuted. Note how the use of the character ‘ \’ has allowed to include the character “ into the specification ofthe second argument of the if.

26
B.5.Generating Statistics
The simulator provides extensive support for taking statistics of selected variables. It is possible to dy-namically select one or several variables (either simple state variables or complex formula variables) to besampled cycle-by-cycle during the simulation of a program in order to obtain a distribution of values, orLittle’s law queue statistics.
The following list presents all the commands related with the creation of statistics. Look at the examplesprovided with the distribution to better understand its use and feel free to create new statistics.
varslist name of all state variables
stats
list name of all statisticsset <name> <expr> [<index>]
assign value expr to variable name (optionally indexed by index)
def_state <name> <definition> <state-class> <description> create a state variable called name, which will be evaluated as the formula definition
def_stat <name> <definition> <statistic-class> <description> create a statistic variable called name, which will be evaluated as the formula definition
def_statdis <name> <stat-name> <statistic-class> <description> <number-of-buckets> <bucket-size> <init-value>create an statistic, called name, storing the distribution of values taken by variable stat-name, classifying valuesinto buckets of an specified size and starting from the value init-value
def_little <name> <statistic-class> create a statistic variable that stores the minimum and maximum values of variable name, called name_minand name_max, and the sum of values and the sum of the squares of the values, called name_sum and name_sqr
del <name>delete variable name
B.6.Program-Related Commands
listlist the state of all the instructions (in program execution order) hold into the processor pipeline
dis <PCtag> [<count>]disassemble count consecutive instructions (in memory order) starting from the specified instruction (default is20 instructions)
break <PCtag>set breakpoint at instruction id
The syntax of the per-instruction information provided by the w x y z command is very complex, since it pro-vides lots of information that the graphical interface will parse to generate a user-friendly view. For exam-ple, it provides the complete instruction description, its state, its operands, its dependencies, the functionalunit requirements, ...
The break command is very useful to skip the execution of initialization code or large loops. Currentlythere is no access to that command from the graphical interface (you must use the expert command dialog).Breakpoints will be included in the following release of KScalar.
B.7. System Calls and Memory layout
System calls are managed by a proxy handler. It intercepts system calls made by the simulated binary(using the CALL_PAL syscall instruction), decodes the system call, copies the system call arguments,makes the corresponding call to the host’s operating system (Linux), and then copies the results of the callinto the simulated program’s memory.

27
The architecture uses a 43-bit address space. The text segment starts at the address 0x120000000, the datasegment starts at the address 0x140000000 and the stack base address (grows down) is 0x11ff9b000.
Systems calls are initiated with the CAL_PAL syscall instruction. Prior to execution of the instruction,register v0 ($r1) should be loaded with the system call code. The arguments of the system call interfaceprototype should be loaded into registers a0-a6 ($r16-$r22) in the order specified by the system call inter-face prototype. For example, the command: r ead ( i nt fd, char * buf, i nt nbyte) loads thevalue 0x03 into register v0, loads the value fd into register a0, buf into register a1, and nbyte into registera2. The list of all system calls supported by the simulator with their system call code (syscode), and inter-face specification is the following.
EXIT: Exit process. (0x01) void exit(int status);
READ: Read from file to buffer. (0x03) int read(int fd, char *buf, int nbyte);
WRITE: Write from a buffer to a file. (0x04) int write(int fd, char *buf, int nbyte);
OPEN: Open a file. (0x05) int open(char * fname, int flags, int mode);
CLOSE: Close a file. (0x06) int close(int fd);
CREAT: Create a file. (0x08) int creat(char * fname, int mode);
UNLINK : Delete a file. (0x0a) int unlink(char * fname);
CHDIR: Change process directory. (0x0c) int chdir(char *path);
CHMOD: Change file permissions. (0x0f) int chmod(int * fname, int mode);
CHOWN: Change file owner and group. (0x10) int chown(char * fname, int owner, int group);
BRK : Change process break address. (0x11) int brk(long addr);
LSEEK : Move file pointer. (0x13) long lseek(int fd, long offset, int whence);
GETPID: Get process identifier. (0x14) int getpid(void);
GETUID: Get user identifier. (0x18) int getuid(void);
ACCESS: Determine accessibility of a file. (0x21) int access(char * fname, int mode);
STAT: Get file status. (0x26) int stat(char * fname, struct stat *buf);
LSTAT: Get file status (and don’t dereference links). (0x28) int lstat(char * fname, struct stat *buf);
DUP: Duplicate a file descriptor. (0x29) int dup(int fd);
PIPE: Create an interprocess comm. channel. (0x2a) int pipe(int fd[2]);
GETGID: Get group identifier. (0x2f) int getgid(void);
IOCTL : Device control interface. (0x36) int ioctl(int fd, int request, char *arg);
FSTAT: Get file descriptor status. (0x3e) int fstat(int fd, struct stat *buf);
GETPAGESIZE: Get page size. (0x40) int getpagesize(void);
GETDTABLESIZE: Get file descriptor table size (0x59) int getdtablesize(void);
DUP2: Duplicate a file descriptor. (0x5a) int dup2(int fd1, int fd2);
FCNTL : File control. (0x5c) int fcntl(int fd, int cmd, int arg);
SELECT: Synchronous I/O multiplexing.
(0x5d) int select (int width, fd_set * readfds, fd_set *writefds, fd_set *exceptfds, struct timeval * timeout);
GETTIMEOFDAY: Get the date and time. (0x74) int gettimeofday(struct timeval * tp, struct timezone * tzp);
WRITEV: Write output, vectored. (0x79) int writev(int fd, struct iovec * iov, int cnt);
UTIMES: Set file times. (0x8a) int utimes(char * file, struct timeval * tvp);
GETRLIMIT: Get maximum resource consumption. (0x90) int getrlimit(int res, struct rlimit * rlp);
SETRLIMIT: Set maximum resource consumption. (0x91) int setrlimit(int res, struct rlimit * rlp);

28
Appendix C: L icense Terms
The Kscalar graphical interface is free software; you can redistribute it and/or modify it under the terms ofthe GNU General Public License as published by the Free Software Foundation; either version 2 of the Li-cense, or (at your option) any later version.
The software is distributed in the hope that it will be useful, but WITHOUT ANY WARRANTY; withouteven the implied warranty of MERCHANTABILITY or FITNESS FOR A PARTICULAR PURPOSE.
License is hereby given to use, modify, and redistribute the software, in whole or in part, for any non-commercial purpose, provided 1) that the user agrees to the terms of this copyright notice, including dis-claimer of warranty, and 2) provided that this copyright notice, including disclaimer of warranty, is pre-served in the documentation of anything derived from this software and 3) provided that the person or groupmodifying this software notifies us regarding the modifications and makes those modifications available toother non-commercial parties. Any redistributor of this software or anything derived from this softwareassumes responsibility for ensuring that any parties to whom such a redistribution is made are fully aware ofthe terms of this license and disclaimer.
The Kcore text-simulator inherits the License terms of the SimpleScalar Tools, which we replicate here:No portion of this work may be used by any commercial entity, or for any commercial purpose, without theprior, written permission of SimpleScalar, LLC ([email protected]). Nonprofit and noncommercialuse is permitted as described below.1. SimpleScalar is provided AS IS, with no warranty of any kind, express or implied. The user of the pro-
gram accepts full responsibility for the application of the program and the use of any results.2. Nonprofit and noncommercial use is encouraged. SimpleScalar may be downloaded, compiled, exe-
cuted, copied, and modified solely for nonprofit, educational, noncommercial research, and noncom-mercial scholarship purposes provided that this notice in its entirety accompanies all copies. Copies ofthe modified software can be delivered to persons who use it solely for nonprofit, educational, non-commercial research, and noncommercial scholarship purposes provided that this notice in its entiretyaccompanies all copies.
3. ALL COMMERCIAL USE, AND ALL USE BY FOR PROFIT ENTITIES, IS EXPRESSLY PROHIB-ITED WITHOUT A LICENSE FROM SIMPLESCALAR, LLC ([email protected]).
4. No nonprofit user may place any restrictions on the use of this software, including as modified by theuser, by any other authorized user.
5. Noncommercial and nonprofit users may distribute copies of SimpleScalar in compiled or executableform as set forth in Section 2, provided that either: (A) it is accompanied by the corresponding machine-readable source code, or (B) it is accompanied by a written offer, with no time limit, to give anyone amachine-readable copy of the corresponding source code in return for reimbursement of the cost of dis-tribution. This written offer must permit verbatim duplication by anyone, or (C) it is distributed bysomeone who received only the executable form, and is accompanied by a copy of the written offer ofsource code.
6. SimpleScalar was developed by Todd M. Austin, Ph.D. The tool suite is currently maintained by Sim-pleScalar LLC ([email protected]). US Mail: 2395 Timbercrest Court, Ann Arbor, MI 48105.
Copyright © 1994-2001 by Todd M. Austin, Ph.D. and SimpleScalar, LLC.

29
Appendix D: Alpha ISA Descr iption
Alpha is a 64-bit load/store RISC architecture designed to avoid bias toward any particular operatingsystem or programming language. It facilitates pipelining multiple instances of the same operations becausethere are no special registers and no condition codes. Instructions interact with each other only by one in-struction writing a register or memory and another instruction reading from the same place.
• All operations are done between 64-bit registers.• Memory is accessed via 64-bit virtual byte addresses using the little-endian byte numbering convention.• There are 32 integer registers and 32 floating-point registers.• Longword (32-bit) and quadword (64-bit) integers are supported.• Floating-point data types supported (among others):
— IEEE single (32-bit)— IEEE double (64-bit)
D.1.Instruction Format Overview
Alpha instructions are all 32 bits in length. There are four major instruction format classes that contain 0, 1,2, or 3 register fields. All formats have a 6-bit opcode.
• PALcode instructions specify, in the function code field, one of a few dozen complex operations to beperformed.
• Conditional branch instructions test register Ra and specify a signed 21-bit PC-relative longword targetdisplacement. Subroutine calls put the return address in register Ra.
• Memory instructions (load and store) move bytes, words, longwords or quadwords between register Raand memory, using Rb plus a signed 16-bit displacement as the memory address.
• Operate instructions for floating-point and integer operations are both represented by the same operateformat and are as follows:— Word and byte sign-extension operators.— Integer and Floating-point operations use Ra and Rb as source registers, and write the result in reg-
ister Rc. There is an 11-bit extended opcode in the function field.— Integer operate instructions can use the Rb field and part of the function field to specify an 8-bit lit-
eral. In this case, there is only one source register (specified by Ra), a source literal operand, and a7-bit extended opcode in the function field.
Branch Instructions: There are no branch condition codes. Conditional branch instructions can test aregister for positive/negative or for zero/nonzero. They can also test integer registers for even/odd. Uncon-ditional branch instructions can write a return address into a register. There is also a calculated jump in-struction that branches to an arbitrary 64-bit address in a register.
Load/Store Instructions: Load and store instructions move 8-bit, 16-bit, 32-bit or 64-bit aligned quanti-ties from and to memory. Memory addresses are flat 64-bit virtual addresses, with no segmentation. A 32-bit integer datum is placed in a register in a canonical form that makes 33 copies of the high bit of the da-tum. A 32-bit floating-point datum is placed in a register in a canonical form that extends the exponent by 3bits and extends the fraction with 29 low-order zeros. The 32-bit operates preserve these canonical forms.
Integer Operate Instructions: The integer operate instructions manipulate full 64-bit values, and in-clude the usual assortment of arithmetic, compare, logical, and shift instructions. There are just three 32-bit

30
integer operates: add, subtract, and multiply. They differ from their 64-bit counterparts only in overflowdetection and in producing 32-bit canonical results. There is no integer divide instruction.
The Alpha architecture also supports the following additional operations:• Scaled add/subtract instructions for quick subscript calculation• 128-bit multiply for division by a constant, and multiprecision arithmetic• Conditional move instructions for avoiding branch instructions• An extensive set of in-register byte and word manipulation instructions
Integer overflow trap enable is encoded in the function field of each instruction, rather than kept in aglobal state bit. Thus, for example, both ADDQ/V and ADDQ opcodes exist for specifying 64-bit ADD withand without overflow checking. That makes it easier to pipeline implementations.
Floating-Point Operate Instructions: The floating-point operate instructions include IEEE arithmeticinstructions, plus instructions for performing conversions between floating-point and integer quantities. Inaddition to the operations found in conventional RISC architectures, Alpha includes conditional move in-structions for avoiding branches and merge sign/exponent instructions for simple field manipulation. Thearithmetic trap enables and rounding mode are encoded in the function field of each instruction, rather thenkept in global state bits. That makes it easier to pipeline implementations.
D.2.Alpha Registers
Program Counter : The Program Counter (PC) is a special register that addresses the instruction stream.As each instruction is decoded, the PC is advanced to the next sequential instruction. This is referred to asthe updated PC. Any instruction that uses the value of the PC will use the updated PC. The PC includes onlybits <63:2> with bits <1:0> treated as RAZ/IGN. This quantity is a longword-aligned byte address. The PCis an implied operand on conditional branch and subroutine jump instructions. The PC is not accessible asan integer register.
Integer Registers: There are 32 integer registers (R0 through R31), each 64 bits wide. Register R31 isassigned special meaning by the Alpha architecture. When R31 is specified as a register source operand, azero-valued operand is supplied. For all cases except the Unconditional Branch and Jump instructions, re-sults of an instruction that specifies R31 as a destination operand are discarded. An exception is never sig-naled for a load that specifies R31 as a destination operation.
Floating-Point Registers: There are 32 floating-point registers (F0 through F31), each 64 bits wide.When F31 is specified as a register source operand, a true zero-valued operand is supplied. Results of aninstruction that specifies F31 as a destination operand are discarded and it is UNPREDICTABLE whetherthe other destination operands (implicit and explicit) are changed by the instruction. An exception is neversignaled for a load that specifies F31 as a destination operation. A floating-point instruction that operates onsingle-precision data reads all bits <63:0> of the source floating-point register. A floating-point instructionthat produces a single-precision result writes all bits <63:0> of the destination floating-point register.
D.3.Addressing
The basic addressable unit in the Alpha architecture is the 8-bit byte. Virtual addresses are 64 bits long.An implementation may support a smaller virtual address space. The minimum virtual address size is 43bits. Virtual addresses as seen by the program are translated into physical memory addresses by the memorymanagement mechanism.
Byte: A byte is 8 contiguous bits starting on an addressable byte boundary. The bits are numbered fromright to left, 0 through 7. A byte is an 8-bit value specified by its address. The byte is only supported in Al-pha by the load, store, sign-extend, extract, mask, insert, and zap instructions.
Word: A word is 2 contiguous bytes starting on an arbitrary byte boundary. The bits are numbered fromright to left, 0 through 15. A word is specified by the address of the byte containing bit 0. A word is a 16-bitvalue. The word is only supported in Alpha by the load, store, sign-extend, extract, mask, and insert instruc-tions.

31
Longword: A longword is 4 contiguous bytes starting on an arbitrary byte boundary. The bits are num-bered from right to left, 0 through 31. A longword is specified by the address of the byte containing bit 0. Alongword is a 32-bit value. When interpreted arithmetically, a longword is a two’s-complement integer withbits of increasing significance from 0 through 30. Bit 31 is the sign bit. The longword is only supported inAlpha by sign-extended load and store instructions and by longword arithmetic instructions.
Quadword: A quadword is 8 contiguous bytes starting on an arbitrary byte boundary. The bits are num-bered from right to left, 0 through 63. A quadword is specified by the address of the byte containing bit 0. Aquadword is a 64-bit value. When interpreted arithmetically, a quadword is either a two’s-complement inte-ger with bits of increasing significance from 0 through 62 and bit 63 as the sign bit, or an unsigned integerwith bits of increasing significance from 0 through 63.
D.4.IEEE Floating-Point Formats
The Alpha architecture supports the basic single and double ANSI/IEEE 754-1985 formats.S_Floating: An IEEE single-precision, or S_floating, datum occupies 4 contiguous bytes in memory
starting on an arbitrary byte boundary. The bits are labeled from right to left, 0 through 31. An S_floatingoperand occupies 64 bits in a floating register, left-justified in the 64-bit register.
The S_floating load instruction reorders bits on the way in from memory, expanding the exponent from 8to 11 bits, and sets the low-order fraction bits to zero. This produces in the register an equivalent T_floatingnumber, suitable for either S_floating or T_floating operations. This mapping preserves both normal valuesand exceptional values. The S_floating load instruction does no checking of the input.
The S_floating store instruction reorders register bits on the way to memory and does no checking of thelow-order fraction bits. Register bits <61:59> and <28:0> are ignored by the store instruction. TheS_floating store instruction does no checking of the data; the preceding operation should have specified anS_floating result.
An S_floating datum is specified by the address of the byte containing bit 0. The memory form of anS_floating datum is sign magnitude with bit 31 the sign bit, bits <30:23> an excess-127 binary exponent,and bits <22:0> a 23-bit fraction.
Floating-point operations on S_floating numbers may take an arithmetic exception for a variety of rea-sons, including invalid operations, overflow, underflow, division by zero, and inexact results.
T_floating: An IEEE double-precision, or T_floating, datum occupies 8 contiguous bytes in memorystarting on an arbitrary byte boundary. The bits are labeled from right to left, 0 through 63. A T_floatingoperand occupies 64 bits in a floating register, arranged as shown in the figure.
The T_floating load instruction performs no bit reordering on input, nor does it perform checking of theinput data. The T_floating store instruction performs no bit reordering on output. This instruction does nochecking of the data; the preceding operation should have specified a T_floating result.
A T_floating datum is specified by the address of the byte containing bit 0. The form of a T_floating da-tum is sign magnitude with bit 63 the sign bit, bits <62:52> an excess-1023 binary exponent, and bits<51:0> a 52-bit fraction.Floating-point operations on T_floating numbers may take an arithmetic exception for a variety of reasons,including invalid operations, overflow, underflow, division by zero, and inexact results.

32
D.5.Alpha Instruction Set
This appendix contains a summary of all Alpha architecture instructions. All values are in hexadecimalradix. Table A–1 describes the contents of the Format and Opcode columns that are in Table A–2.
{c|a}a~ �����c��� �!� � � � � � � �����!��� ��| �c|a� ���5� � �c�a�����a� | � � ���
Instruction Format FormatSymbol
OpcodeNotation
Meaning Syntaxis
Branch Bra oo oo is the 6-bit opcode field. Bcc Ra,displ
Floating-point F-P oo.fff oo is the 6-bit opcode field.
fff is the 11-bit function code field.
Op Fa,Fb,FcFa, Fb: input, Fc: output
Memory Mem oo oo is the 6-bit opcode field. LD/ST Ra,displ(Rb)
Memory/ functioncode
Mfc oo.ffff oo is the 6-bit opcode field.
ffff is the 16-bit function code in thedisplacement field.
Special
Memory/ branch Mbr oo.h oo is the 6-bit opcode field.
h is the high-order 2 bits of the displace-ment field.
BSR/JMP/JSR/RET Ra, Rb, displ
Operate Opr oo.ff oo is the 6-bit opcode field.
ff is the 7-bit function code field.
Op Ra,Rb,RcRa,Rb: input, Rc: output
PALcode Pcd oo oo is the 6-bit opcode field; the particularPALcode instruction is specified in the26-bit function code field.
CAL_PAL function
� ����� ���c�c�5��� �¡a¢ £ �c c£ ¤a� ��¥ ¦!§ £ � ¤! a£ ¢ ¨�¦!§(Sheet 1 of 5)
©%ª «a¬5aª ® ¯ ° a± ¬5²!³µ´�¶!¯!!·!«¹¸!« º ¯a± ® ¶ ³ ® aªADDF F-P 15.080 Add F_floatingADDG F-P 15.0A0 Add G_floatingADDL Opr 10.00 Add longwordADDL/V Opr 10.40 Add longword (check overflow)ADDQ Opr 10.20 Add quadwordADDQ/V Opr 10.60 Add quadword (check overflow)ADDS F-P 16.080 Add S_floatingADDT F-P 16.0A0 Add T_floatingAMASK Opr 11.61 Determine byte/word instruction implementationAND Opr 11.00 Logical productBEQ Bra 39 Branch if = zeroBGE Bra 3E Branch if ≥ zeroBGT Bra 3F Branch if > zeroBIC Opr 11.0 Bit clear (and ~)BIS Opr 11.20 Logical sum (or)BLBC Bra 38 Branch if low bit clearBLBS Bra 3C Branch if low bit setBLE Bra 3B Branch if ≤ zeroBLT Bra 3A Branch if < zero

33
� ����� ���c�c�5��� �¡a¢ £ �c c£ ¤a� ��¥ ¦!§ £ � ¤! a£ ¢ ¨�¦!§(Sheet 2 of 5)
©%ª «a¬5aª ® ¯ ° a± ¬5²!³µ´�¶!¯!!·!«¹¸!« º ¯a± ® ¶ ³ ® aªBNE Bra 3D Branch if ≠ zeroBR Bra 30 Unconditional branchBSR Mbr 34 Branch to subroutineCALL_PAL Pcd 00 Trap to PALcodeCMOVEQ Opr 11.24 Conditional MOVE if = zeroCMOVGE Opr 11.46 Conditional MOVE if ≥ zeroCMOVGT Opr 11.66 Conditional MOVE if > zeroCMOVLBC Opr 11.16 Conditional MOVE if low bit clearCMOVLBS Opr 11.14 Conditional MOVE if low bit setCMOVLE Opr 11.64 Conditional MOVE if ≤ zeroCMOVLT Opr 11.44 Conditional MOVE if < zeroCMOVNE Opr 11.26 Conditional MOVE if ≠ zeroCMPBGE Opr 10.0F Compare 8 unsigned bytes in parallel (multimedia)CMPEQ Opr 10.2D Compare signed quadword equalCMPGEQ F-P 15.0A5 Compare G_floating equalCMPGLE F-P 15.0A7 Compare G_floating less than or equalCMPGLT F-P 15.0A6 Compare G_floating less thanCMPLE Opr 10.6D Compare signed quadword less than or equalCMPLT Opr 10.4D Compare signed quadword less thanCMPTEQ F-P 16.0A5 Compare T_floating equalCMPTLE F-P 16.0A7 Compare T_floating less than or equalCMPTLT F-P 16.0A6 Compare T_floating less thanCMPTUN F-P 16.0A4 Compare T_floating unorderedCMPULE Opr 10.3D Compare unsigned quadword less than or equalCMPULT Opr 10.1D Compare unsigned quadword less thanCPYS F-P 17.020 Copy sign to floating-point valueCPYSE F-P 17.022 Copy sign and exponent to floating-point valueCPYSN F-P 17.021 Copy sign negate (complement sign)CVTDG F-P 15.09E Convert D_floating to G_floatingCVTGD F-P 15.0AD Convert G_floating to D_floatingCVTGF F-P 15.0AC Convert G_floating to F_floatingCVTGQ F-P 15.0AF Convert G_floating to quadwordCVTLQ F-P 17.010 Convert longword to quadwordCVTQF F-P 15.0BC Convert quadword to F_floatingCVTQG F-P 15.0BE Convert quadword to G_floatingCVTQL F-P 17.030 Convert quadword to longwordCVTQL/SV F-P 17.530 Convert quadword to longword (overflow & s/w completion)CVTQL/V F-P 17.130 Convert quadword to longword (check overflow)CVTQS F-P 16.0BC Convert quadword to S_floatingCVTQT F-P 16.0BE Convert quadword to T_floatingCVTST F-P 16.2AC Convert S_floating to T_floatingCVTTQ F-P 16.0AF Convert T_floating to quadwordCVTTS F-P 16.0AC Convert T_floating to S_floatingDIVF F-P 15.083 Divide F_floatingDIVG F-P 15.0A3 Divide G_floatingDIVS F-P 16.083 Divide S_floatingDIVT F-P 16.0A3 Divide T_floatingEQV Opr 11.48 Logical equivalence (xor ~)EXCB Mfc 18.0400 Exception barrier (wait for exceptions on all previous insts)

34
� ����� ���c�c�5��� �¡a¢ £ �c c£ ¤a� ��¥ ¦!§ £ � ¤! a£ ¢ ¨�¦!§(Sheet 3 of 5)
©%ª «a¬5aª ® ¯ ° a± ¬5²!³µ´�¶!¯!!·!«¹¸!« º ¯a± ® ¶ ³ ® aªEXTBL Opr 12.06 Extract byte low (shift right)EXTLH Opr 12.6A Extract longword high (shift left)EXTLL Opr 12.26 Extract longword low (shift right)EXTQH Opr 12.7A Extract quadword high (shift left)EXTQL Opr 12.36 Extract quadword low (shift rigth)EXTWH Opr 12.5A Extract word high (shift left)EXTWL Opr 12.16 Extract word low (shift right)FBEQ Bra 31 Floating branch if = zeroFBGE Bra 36 Floating branch if ≥ zeroFBGT Bra 37 Floating branch if > zeroFBLE Bra 33 Floating branch if ≤ zeroFBLT Bra 32 Floating branch if < zeroFBNE Bra 35 Floating branch if ≠ zeroFCMOVEQ F-P 17.02A Floating Conditional MOVE if = zeroFCMOVGE F-P 17.02D Floating Conditional MOVE if ≥ zeroFCMOVGT F-P 17.02F Floating Conditional MOVE if > zeroFCMOVLE F-P 17.02E Floating Conditional MOVE if ≤ zeroFCMOVLT F-P 17.02C Floating Conditional MOVE if < zeroFCMOVNE F-P 17.02B Floating Conditional MOVE if ≠ zeroFETCH Mfc 18.80 Prefetch data (aligned 512-byte block surrounding virt.addr.)FETCH_M Mfc 18.A0 Prefetch data, modify intent (aligned 512-byte block)IMPLVER Opr 11.6C Determine CPU typeINSBL Opr 12.0B Insert byte lowINSLH Opr 12.67 Insert longword highINSLL Opr 12.2B Insert longword lowINSQH Opr 12.77 Insert quadword highINSQL Opr 12.3B Insert quadword lowINSWH Opr 12.57 Insert word highINSWL Opr 12.1B Insert word lowJMP Mbr 1A.0 JumpJSR Mbr 1A.1 Jump to subroutineJSR_ COROUTINE Mbr 1A.3 Jump to subroutine returnLDA Mem 08 Load addressLDAH Mem 09 Load address high (displacement shifted 16 positions)LDBU Mem 0A Load zero-extended byteLDF Mem 20 Load F_floatingLDG Mem 21 Load G_floatingLDL Mem 28 Load sign-extended longwordLDL_L Mem 2A Load sign-extended longword lockedLDQ Mem 29 Load quadwordLDQ_L Mem 2B Load quadword lockedLDQ_U Mem 0B Load unaligned quadwordLDS Mem 22 Load S_floatingLDT Mem 23 Load T_floatingLDWU Mem 0C Load zero-extended wordMB Mfc 18.4000 Memory barrier (ensures memory access ordering)MF_FPCR F-P 17.025 Move from floating-point control registerMSKBL Opr 12.02 Mask byte lowMSKLH Opr 12.62 Mask longword high

35
� ����� ���c�c�5��� �¡a¢ £ �c c£ ¤a� ��¥ ¦!§ £ � ¤! a£ ¢ ¨�¦!§(Sheet 4 of 5)
©%ª «a¬5aª ® ¯»° a± ¬5² ³µ´%¶ ¯!!·a«¼¸!« º ¯a± ® ¶ ³ ® aªMSKLL Opr 12.22 Mask longword lowMSKQH Opr 12.72 Mask quadword highMSKQL Opr 12.32 Mask quadword lowMSKWH Opr 12.52 Mask word highMSKWL Opr 12.12 Mask word lowMT_FPCR F-P 17.024 Move to floating-point control registerMULF F-P 15.082 Multiply F_floatingMULG F-P 15.0A2 Multiply G_floatingMULL Opr 13.00 Multiply longwordMULL/V Opr 13.40 Multiply longword (check overflow)MULQ Opr 13.20 Multiply quadwordMULQ/V Opr 13.60 Multiply quadword (check overflow)MULS F-P 16.082 Multiply S_floatingMULT F-P 16.0A2 Multiply T_floatingORNOT Opr 11.28 Logical sum with complement (or ~)RC Mfc 18.E0 Read and clear (VAX compatibility)RET Mbr 1A.2 Return from subroutineRPCC Mfc 18.C0 Read process cycle counterRS Mfc 18.F000 Read and set (VAX compatibility)S4ADDL Opr 10.02 Scaled add longword by 4 { (Ra*4 + Rb) → Rc }S4ADDQ Opr 10.22 Scaled add quadword by 4 { (Ra*4 + Rb) → Rc }S4SUBL Opr 10.0B Scaled subtract longword by 4 { (Ra*4 - Rb) → Rc }S4SUBQ Opr 10.2B Scaled subtract quadword by 4 { (Ra*4 - Rb) → Rc }S8ADDL Opr 10.12 Scaled add longword by 8 { (Ra*8 + Rb) → Rc }S8ADDQ Opr 10.32 Scaled add quadword by 8 { (Ra*8 + Rb) → Rc }S8SUBL Opr 10.1B Scaled subtract longword by 8 { (Ra*8 - Rb) → Rc }S8SUBQ Opr 10.3B Scaled subtract quadword by 8 { (Ra*8 - Rb) → Rc }SEXTB Opr 1C.00 Store byteSEXTW Opr 1C.01 Store wordSLL Opr 12.39 Shift left logicalSRA Opr 12.3C Shift right arithmeticSRL Opr 12.34 Shift right logicalSTB Mem 0E Store byteSTF Mem 24 Store F_floatingSTG Mem 25 Store G_floatingSTS Mem 26 Store S_floatingSTL Mem 2C Store longwordSTL_C Mem 2E Store longword conditionalSTQ Mem 2D Store quadwordSTQ_C Mem 2F Store quadword conditionalSTQ_U Mem 0F Store unaligned quadwordSTT Mem 27 Store T_floatingSTW Mem 0D Store wordSUBF F-P 15.081 Subtract F_floatingSUBG F-P 15.0A1 Subtract G_floatingSUBL Opr 10.09 Subtract longwordSUBL/V Opr 10.49 Subtract longword (check overflow)SUBQ Opr 10.29 Subtract quadwordSUBQ/V Opr 10.69 Subtract quadword (check overflow)

36
� ����� ���c�c�5��� �¡a¢ £ �c c£ ¤a� ��¥ ¦!§ £ � ¤! a£ ¢ ¨�¦!§(Sheet 5 of 5)
©�ª «c½¬5aª ® ¯
° a± ½¬5² ³
´�¶c½¯!!·a«
¸!« º ¯a± ® ¶ ³ ® aª
SUBS F-P 16.081 Subtract S_floatingSUBT F-P 16.0A1 Subtract T_floatingTRAPB Mfc 18.00 Trap barrier (all prior insts are completed without arithmetic traps)UMULH Opr 13.30 Unsigned multiply quadword high (64 high-order bits of 128bit result)WMB Mfc 18.44 Write memory barrier (control internal write buffers)XOR Opr 11.40 Logical differenceZAP Opr 12.30 Zero bytes (set selected bytes of register to zero)ZAPNOT Opr 12.31 Zero bytes not (set selected bytes of register to zero)
� ����� ���c�a¾�¿��cÀ��%� �¡a¢ £ �� a£ ¤a� ��¥ ¦!§ £ � ¤! c£ ¢ ¨�¦!§©%ª «a¬5aª ® ¯ ° a± ¬5²!³µ´�¶!¯!!·!«¹¸!« º ¯a± ® ¶ ³ ® aªCTLZ Count leading zero (number of leading zeros in Rb)CTPOP Count population (number of ones in Rb)CTTZ Count trailing zero (number of trailing zeros in Rb)ECB Evict cache block (hint: cache space can be reused)FTOIS Floating-point to integer register move, S_floatingFTOIT Floating-point to integer register move, T_floatingITOFF Integer to floating-point register move, F_floatingITOFS Integer to floating-point register move, S_floatingITOFT Integer to floating-point register move, T_floatingSQRTF Square root F_floatingSQRTG Square root G_floatingSQRTS Square root S_floatingSQRTT Square root T_floatingWH64 Write hint—64 bytes (cache block will never be read)
� ����� ���c�aÁ�¿��cÀÃÂ�¤a� £ ¢ Ä���Å�¢ �ÇÆ È £ ��¦!§ ¢ ¨�¦!§©%ª «a¬5aª ® ¯ ° a± ¬5²!³µ´�¶!¯!!·!«¹¸!« º ¯a± ® ¶ ³ ® aªMAXSB8 Vector Signed Byte Maximum (set max. byte in parallel)MAXSW4 Vector Signed Word Maximum (set max. word in parallel)MAXUB8 Vector Unsigned Byte MaximumMAXUW4 Vector Unsigned Word MaximumMINSB8 Vector Signed Byte MinimumMINSW4 Vector Signed Word MinimumMINUB8 Vector Unsigned Byte MinimumMINUW4 Vector Unsigned Word MinimumPERR Pixel Error (sum of absolute values of all byte differences)PKLB Pack longwords to bytes (2 longwords → 2 bytes)PKWB Pack words to bytes (4 words → 4 bytes)UNPKBL Unpack bytes to longwords (2 bytes → 2 longwords)UNPKBW Unpack bytes to words (2 bytes → 4 words)