Improvement of the driving simulator control and comparison ...
219
HAL Id: tel-03033387 https://tel.archives-ouvertes.fr/tel-03033387 Submitted on 1 Dec 2020 HAL is a multi-disciplinary open access archive for the deposit and dissemination of sci- entific research documents, whether they are pub- lished or not. The documents may come from teaching and research institutions in France or abroad, or from public or private research centers. L’archive ouverte pluridisciplinaire HAL, est destinée au dépôt et à la diffusion de documents scientifiques de niveau recherche, publiés ou non, émanant des établissements d’enseignement et de recherche français ou étrangers, des laboratoires publics ou privés. Improvement of the driving simulator control and comparison between driver-road-vehicule interaction in real and simulated environment Navid Ghasemi To cite this version: Navid Ghasemi. Improvement of the driving simulator control and comparison between driver-road- vehicule interaction in real and simulated environment. Signal and Image processing. Université Paris- Est; Università degli studi (Bologne, Italie), 2020. English. NNT : 2020PESC2010. tel-03033387
-
Upload
khangminh22 -
Category
Documents
-
view
1 -
download
0
Transcript of Improvement of the driving simulator control and comparison ...
HAL Id: tel-03033387https://tel.archives-ouvertes.fr/tel-03033387
Submitted on 1 Dec 2020
HAL is a multi-disciplinary open accessarchive for the deposit and dissemination of sci-entific research documents, whether they are pub-lished or not. The documents may come fromteaching and research institutions in France orabroad, or from public or private research centers.
L’archive ouverte pluridisciplinaire HAL, estdestinée au dépôt et à la diffusion de documentsscientifiques de niveau recherche, publiés ou non,émanant des établissements d’enseignement et derecherche français ou étrangers, des laboratoirespublics ou privés.
Improvement of the driving simulator control andcomparison between driver-road-vehicule interaction in
real and simulated environmentNavid Ghasemi
To cite this version:Navid Ghasemi. Improvement of the driving simulator control and comparison between driver-road-vehicule interaction in real and simulated environment. Signal and Image processing. Université Paris-Est; Università degli studi (Bologne, Italie), 2020. English. NNT : 2020PESC2010. tel-03033387
Alma Mater Studiorum – Università di Bologna in cotutela con Università Paris-Est
DOTTORATO DI RICERCA IN
Ingegneria Civile, Chimica, Ambientale e dei Materiali
Ciclo XXXII
Settore Concorsuale: 08/A3 Infrastrutture e Sistemi di Trasporto, Estimo e Valutazione
Settore Scientifico Disciplinare: ICAR/04 Strade, Ferrovie ed Aeroporti
IMPROVEMENT OF THE DRIVER SIMULATOR CONTROL AND
COMPARISON BETWEEN DRIVER-ROAD-VEHICLE INTERACTION IN
REAL AND SIMULATED ENVIRONMENT
Presentata da: Navid Ghasemi
Coordinatore Dottorato Supervisore
Prof. Ing. LUCA VITTUARI Prof. Ing. Andrea SIMONE
Supervisore
Prof. Ing. Hocine IMINE
Co-Supervisore
Dott. Ing. Claudio Lantieri
Esame Finale anno 2020

Keywords
1
Keywords:
Real-time vehicle simulation
Motion cueing algorithm
Surrogate safety measures
Eye-tracking
Perception Reaction Time

Contents
1
Contents
List of Figures ...................................................................................................................................... 7
List of Publications ............................................................................................................................ 11
List of abbreviations and symbols ..................................................................................................... 13
Abstract .............................................................................................................................................. 15
CHAPTER I ....................................................................................................................................... 17
INTRODUCTION ............................................................................................................................. 17
1.2. Human factor in road safety .................................................................................................... 22
1.3. Driving simulator and road safety ........................................................................................... 24
1.4. Thesis Contribution ................................................................................................................. 25
CHAPTER II ...................................................................................................................................... 27
VEHICLE DYNAMICS AND 2DOF MOTION PLATFORM IMPROVEMENT IN THE DRIVING
SIMULATOR .................................................................................................................................... 27
2.3. Vehicle dynamic model (Matlab-Simulink) ........................................................................... 30
2.3.1 Vehicle Trajectory calculation .......................................................................................... 32
2.3.2 Vehicle Longitudinal sliding model: ................................................................................. 35
2.3.3. Vehicle lateral sliding model ........................................................................................... 36
2.4. Motion cueing platform: ......................................................................................................... 37
2.4.1. Motion cueing algorithm .................................................................................................. 38
2.5. Case- Study I ........................................................................................................................... 41
2.5.1. Discussion: ....................................................................................................................... 41
Contents
2
2.6. Case Study II: .......................................................................................................................... 42
2.6.1. Discussion: ....................................................................................................................... 43
Chapter III .......................................................................................................................................... 45
THE INTEGRATION OF HUMAN FACTOR IN ROAD SAFETY USING INNOVATIVE
TECHNOLOGIES ............................................................................................................................. 45
3.2. Road infrastructure safety management approach .................................................................. 46
3.3 Vehicles trajectory monitoring and sensor fusion.................................................................... 48
3.4 Eye-tracking ............................................................................................................................. 51
3.4. Experiment: Case study III ..................................................................................................... 53
3.4.1.Discussion ......................................................................................................................... 53
3.5. Case Study IV. ........................................................................................................................ 54
3.5.1. Discussion ........................................................................................................................ 55
Chapter IV .......................................................................................................................................... 57
INVESTIGATING VULNERABLE USER SAFETY AT CROSSING USING SURROGATE
MEASURES ...................................................................................................................................... 57
4.1. Introduction ............................................................................................................................. 58
4.2. Crossing Elements................................................................................................................... 58
4.3. Surrogate Measures ................................................................................................................. 60
4.4. Case Study V. .......................................................................................................................... 62
4.4.1. Discussion ............................................................................................................................ 62
4.5.1. Discussion ........................................................................................................................ 64
Contents
3
CHAPTER V...................................................................................................................................... 65
INVESTIGATING THE EFFECT OF ADAPTIVE CRUISE CONTROL (ACC) ON DRIVER
BEHAVIOUR .................................................................................................................................... 65
5.1. Advanced driver assistance system (ADAS) .......................................................................... 66
5.1.2. Driving automation and human behaviour ........................................................................... 67
5.2. Methodology ........................................................................................................................... 69
5.3. Experiment 1: On-road ACC .................................................................................................. 70
5.3.1. Participants ....................................................................................................................... 71
5.3.2. Driver monitoring and eye-tracking ................................................................................. 71
5.3.3. Data Analysis ....................................................................................................................... 72
5.3.3.1 Vehicle Position and monitoring system. ...................................................................... 72
5.3.3.2. Visual Behaviour and Distraction ................................................................................. 73
5.3.3. Driver workload index (EEG) .......................................................................................... 74
5.3.4. Self-evaluated workload using (NASA_TLX questionnaire) .......................................... 75
5.3.4. Results (On-Road experiment-ACC) ................................................................................... 75
5.3.4.1. Visual attention-distraction ............................................................................................... 75
5.3.4.2. Reaction time ................................................................................................................ 76
5.3.4.3. Driver performance ....................................................................................................... 77
5.3.4.3 Workload analysis .......................................................................................................... 77
5.3.4.4 Discussion ...................................................................................................................... 78
5.4. Case study VII& VIII .............................................................................................................. 79
Contents
4
5.5. Experiment 2: Driving simulation Experiment ....................................................................... 80
5.5.1. Participants ....................................................................................................................... 83
5.5.2. Eye-tracking ..................................................................................................................... 84
5.5.2.1 Eye tracking Calibration ................................................................................................ 85
5.5.2.2 Eye tracking Post hoc analysis ....................................................................................... 85
5.5.3 Eye tracking elements and distraction analysis................................................................. 86
5.6. Results of the ACC experiment in the driving simulator Simu-Lacet .................................... 90
5.6.1. Motion investigation during ACC OFF condition ........................................................... 90
5.6.2. Adaptive cruise control comparison ................................................................................ 94
5.6.3. Real and Simulation Comparison: ACC OFF .................................................................. 97
5.6.4. Discussion ...................................................................................................................... 100
CHAPTER VI .................................................................................................................................. 101
Conclusion ....................................................................................................................................... 101
References ........................................................................................................................................ 105
Annex I. Case Study I: ..................................................................................................................... 119
Annex II. Case Study II: .................................................................................................................. 127
Annex III. Case Study III: ................................................................................................................ 141
Annex IV. Case Study IV: ............................................................................................................... 151
Annex V. Case Study V: .................................................................................................................. 163
Annex VI. Case Study VI: ............................................................................................................... 175
Annex VII. Case Study VII: ............................................................................................................. 189

Contents
5
Annex VIII. Case Study VIII: .......................................................................................................... 205

6
Contents
7
List of Figures
Figure 1. Road Infrastructure management approach (D.Lgs 35) .................................................... 19
Figure 2. Pyramid of Traffic Events (Hyden,1977) ........................................................................... 21
Figure 3. Driver-Vehicle- Environment system ................................................................................. 23
Figure 4. Driving Simulator Architecture and Connections .............................................................. 29
Figure 5. Visual cueing unit (View from the driver seat) ................................................................. 30
Figure 6. Vehicle Model sub systems ................................................................................................. 31
Figure 7. Vehicle Model Blocks ......................................................................................................... 32
Figure 8.a. Vehicle Fixed Coordinate System; b. Earth Fixed Coordinate System. ......................... 33
Figure 9.a. Rolling effective radius; b. Forces acting on the wheel; c. contact and speed and angular
speed................................................................................................................................................... 34
Figure 10. Single-track lateral model (bicycle model) ...................................................................... 36
Figure 11. Motion cueing algorithm implementation ........................................................................ 37
Figure 12. Simulator cabin and motion cueing platform................................................................... 38
Figure 13. Classical Motion Algorithm for Translational Motion .................................................... 39
Figure 14. Lead vehicle velocity profile ............................................................................................ 42
Figure 15. Allowed velocity and driver velocity profile .................................................................... 49
Figure 16. Velocity profile of one driver with a lost of GPS signal ................................................. 50
Figure 17. a VBOX HD2 data recorder; b. IMU and GPS antenna (roof mounting) ....................... 50
Figure 18. IMU sensor ....................................................................................................................... 51
Figure 19. a eye-tracking picture and the software. b. spot cluster .................................................. 51
Figure 20.a. Vbox HD2 video and velocity profile; b. eye-tracking frame ...................................... 52
Figure 21. Visual attention rate of drivers after the intervention ...................................................... 54
Figure 22. Narrowing the street before and after the intervention ................................................... 54
Figure 23. The average velocity of the drivers in the track before and after the intervention .......... 55
Figure 24. vehicle velocity and position at the time of brake initiation in a lead vehicle stopped .... 61
Figure 25. pedestrian crossing elements ........................................................................................... 63
Figure 26. Pedestrian crossing element perception distance (Left OFF, Right LED) ...................... 63
Figure 27. a. The driver velocity profile in case of LED b. case of Control Situation ...................... 64
Figure 28 . Schematic view of dynamic driving task and different level of function ......................... 67
Figure 29.On –Road Experiment Itinerary (A14 Bologna) .............................................................. 70
Contents
8
Figure 30 Test LAP: ACC ON and OFF events................................................................................. 70
Figure 31 a. ACC system in the test vehicle ; b. EEG Helmet and ME during the test ..................... 71
Figure 32.The velocity of test and lead vehicle vs Time –ACC OFF................................................. 72
Figure 33.The velocity of test and lead vehicle vs Time –ACC ON ................................................... 73
Figure 34. a. Driver gaze at the lead vehicle; b. driver gaze at dashboard; c. gaze back to lead vehicle
............................................................................................................................................................ 73
Figure 35. Driver attention and distraction percentage ACC ON and OFF ..................................... 76
Figure 36 Braking reaction time during braking events-ACC OFF .................................................. 76
Figure 37 .a Driving simulator Virtual Environment; b. On- Road experiment Real Environment
............................................................................................................................................................ 80
Figure 38. The luminance of the elements in the visual from 40 meters (cd/m) ................................ 81
Figure 39 . Adaptive Cruise Control activation switch ..................................................................... 82
Figure 40 vehicle in front and braking light luminance from 40 meter (cd/m2) ............................... 82
Figure 41. Driving simulation Experiment Condition and Braking Events ...................................... 83
Figure 42. a. Pupil core eye tracker, b. participant during the simulation with eye tracker ............ 84
Figure 43. Eye-tracking calibration using 5 point ........................................................................... 85
Figure 44 a. eye fixation segment; b. Excel file export of segment classification by software ......... 86
Figure 45. Eye tracking Elements during the braking event ............................................................. 86
Figure 46. Driver Element distribution at an event with ACC OFF-MOTION ON .......................... 87
Figure 47. Driver Element distribution at event 2 with ACC ON_MOTION ON .............................. 88
Figure 48. Velocity profile of the test and lead vehicle- Event 1 ACC OFF ..................................... 89
Figure 49. Velocity profile at event 1 during ACC on ....................................................................... 90
Figure 50. Velocity during each event at condition with ACC OFF ................................................. 91
Figure 51 Time to collision with ACC OFF ...................................................................................... 91
Figure 52. Reaction time with ACC OFF .......................................................................................... 92
Figure 53. Minimum Distance During Braking Event ACC OFF ..................................................... 93
Figure 54. Braking Distance with ACC OFF .................................................................................... 93
Figure 55. Fixation Frame on attention element ACC On and OFF ................................................ 94
Figure 56. Pupil diameter during the braking phases ....................................................................... 95
Figure 57. Drivers visual attention during ACC OFF in real and simulator experiment ................. 99
Figure 58. Drivers visual attention during ACC ON in real and simulator experiment ................... 99
Figure 59. Visual attention percentage for ACC ON and OFF condition for real and simulator .. 100
Contents
9
List of Tables:
Table 1 Vehicle Fixed Coordinate System ......................................................................................... 33
Table 2 Earth Fixed Coordinate System ........................................................................................... 33
Table 3 OBD available data from OBD II ......................................................................................... 49
Table 4. Driver performanc on-road experiment............................................................................... 77
Table 5. Workload Index from EEG ................................................................................................... 77
Table 6. Self-evaluation workload index ............................................................................................ 78
Table 7. Eye-tracking gaze analysis .................................................................................................. 94
Table 8. T-test for the kinematic parameters ..................................................................................... 96
Table 9.Average and standard deviation of kinematic parameters during ACC OFF and ON ........ 96
Table 10.Car following ACC OFF driver performance .................................................................... 97
Table 11.T-test for the driver performance variables ACC OFF ...................................................... 98

Contents
10
List of Publications
11
List of Publications
This doctoral dissertation consists of the following publications that are referred to in the text by the
case-study, all the papers are
Case Study I. N. Ghasemi “Investigating driver response to vehicle gear shifting system in motion
cueing driving simulator”, (Unpublished)
Case Study II. N. Ghasemi, H. Imine, A. Simone, C. Lantieri, V. Vignali, K. Finamore,
“Longitudinal Motion Cueing Effects on Driver Behaviour: A Driving Simulator Study ”, Advances
in Transportation Studies, Volume XLIX, Pages 91-102
Case Study III. N. Ghasemi, H. Imine, C. Lantieri, A. Simone, V. Vignali, E. Acerra “Innovative
technologies measurements to integrate Human Factor in Road Safety Review”, at International
Congress on Transport Infrastructure and Systems in a changing world, TIS ROMA 2019, Roma,
Case Study IV. V. Vignali, M. Pazzini, N. Ghasemi, C. Lantieri, A. Simone, G. Dondi, “ The safety
and conspicuity of a pedestrian crossing at roundabouts: the effect of median refuge island and zebra
markings”, Transportation Part F Journal, Transportation Part F: Traffic Psychology and Behaviour,
Volume 68, Pages 94-104
Case Study V. M. Costa, C. Lantieri, V. Vignali, N. Ghasemi, A. Simone, “Evaluation of an
Integrated Lighting-Warning System on Motorists’ Yielding at Unsignalized Crosswalks During
Nighttime” Transportation Part F: Traffic Psychology and Behaviour, Volume 68, Pages 132-143
Case Study VI. N. Ghasemi, “Driver yielding behaviour at priority cyclist crossing using surrogate
measures”,(In progress)
Case Study VII. E.M. Acerra, M. Pazzini1, N. Ghasemi, V. Vignali1, C. Lantieri, A. Simone, G. Di
Flumeri, P. Aricò, G. Borghini, N. Sciaraffa, P. Lanzi and F. Babiloni, “ EEG-based mental workload
and Perception-Reaction Time of the drivers while using Adaptive Cruise Control ”, 3rd International
Symposium on Human Mental Workload: Models and Applications, Roma, Italy
Case Study VIII. E. M. Acerra, N. Ghasemi, C. Lantieri1, A. Simone, V. Vignali1, F. Balzaretti, “
Perception-Reaction times of the drivers during the use of Adaptive Cruise Control ”, 28th annual
congress EVU, Barcelona, Spain

12
List of Abbreviations and Symbols
13
List of abbreviations and symbols
AADT Annual Average Traffic
ADAS Advanced Driving Assistant Systems
ACC Adaptive Cruise Control
BA Behavioural adaptation
DOF Degree of Freedom
DDT Dynamic Driving Task
EEG Electroencephalography
ET Eye Tracking
FFT Fast Fourier Transform
IAF Individual Alpha Frequency
MCA Motion Cueing Algorithm
PET Post Encroachment Time
PRT Perception Reaction Time
TTC Time to collision
WL Workload

14
Abstract
15
Abstract
The present doctoral thesis discusses the ways to improve the performance of driving simulator,
provide objective measures for the road safety evaluation methodology based on driver’s behavior
and response and investigates the drivers’s adaptation to the driving assistant systems.
The related research activities were carried out in collaboration with the University of Bologna, Paris-
Est University and Gustave Eifel university (IFSTTAR) in the form of a cotutelle PhD. The activities
are divided into two macro areas; the driving simulation studies conducted in Gustave Eifel
University (IFSTTAR) and on-road experiments organized by the University of Bologna.
The first part of the research is focused on improving the physical fidelity of the two DOF driving
simulator with particular attention to motion cueing and vehicle dynamics model. The vehicle
dynamics model has been developed in MATLAB-Simulink and has the ability of real-time
calculation of the vehicle states and control the motion platform. During this phase of the research,
motion cueing algorithms were developed to control the simulator movements and the effect of the
motion cues on drivers’ behaviour was analysed through experimentation. The results of these studies
are discussed in the case study I and II.
In the second part of the research, the driver performance and visual behaviour were studied on the
road under different scenarios. The driver visual behaviour was recorded with the use of a head-
mounted eye-tracking device, while the vehicle trajectory was registered with an instrumented vehicle
equipped with Global Positioning System (GPS). During this phase, several case studies were
developed to monitor drivers’ behaviour in the naturalistic environment. Case study III aims to
integrate the traditional road safety auditing with an innovative driver behaviour monitoring system.
The real road experiment with drivers was carried out in an urban arterial road in order to evaluate
the proposed approach through innovative driver monitoring techniques. These same driving
monitoring instruments were used for evaluating the improvement of a pedestrian crossing at the
roundabout in case study IV. The eye-tracking data were evaluated in both studies in order to identify
a driver visual attention indicator based on the participants gaze position and duration.
Significant attention is given to the safety of vulnerable drivers in urban areas during the naturalistic
driving behaviour study. Case study V analyzed the driver yielding behaviour in approach phase to a
bicycle priority crossing with the use of surrogate safety measures. The drivers’ performance
Abstract
16
measures such as perception reaction time and gaze behaviour were used to assess the safety level of
the crossing equipped with standard and innovative signalling systems. The improvement on the
driver’s yielding behaviour towards an un-signalized crossing during nighttime and their reaction to
an integrated lighting-warning system was evaluated in the case study VI.
The last phase of the thesis is dedicated to the study of Adaptive Cruise Control (ACC) with on-road
and simulator experimentation. The on-road experimentation investigated the driver assistant system
influence on the drivers' adaptation with objective and subjective assessment, in which an eye-
tracking instrument and EEG helmet were used to monitor the drivers on a highway. The results are
presented in Case studies VII and VIII and drivers’ visual attention was reduced due to adaptation to
the ACC in the car following scenario. The results of the on-road test were later used to reproduce to
the same scenario in the driving simulator and the adaptation of drivers’ behaviour with the use of
ACC was confirmed through experimentation.

Chapter I: Introduction
17
CHAPTER I
INTRODUCTION
Chapter I: Introduction
18
Road safety engineering is a set of measures that aim to ensure safety on road networks, with the final
goal of reducing the number of road accidents and injuries. These measures address the
implementation of integrated actions considering all the components of the road network
environment, driver, and vehicle.
According to the 2018 global status on road safety, road traffic injuries are the leading cause of death
of children and young adults with the total fatality of more than 1.35 million around the world and
about 50 million people seriously injured (World Health Organization, 2018). Accidents have a major
impact also on the economy as a recent study of the word bank group shows that by reducing the road
crash by half, the long term Gross Domestic Product (GDP) could increase up to 22% in some
countries (Bose, et al.,2018).
Considerable steps have been made towards reducing the road fatalities, mainly with the
implementation of safety systems in the vehicles (i.e. airbag, seatbelts), However, human errors are
the main reason in occurring accidents. Studies on the crash causation by showed that in more than
94% of the crashes, the main accident contributor was the driver, from which 41% identified to have
recognition error, 33 % decision error and 11% was the performance error (NHTSA, 2015).
Road safety analyses consider the concept of the driving task including control, guidance and
navigation. The complexity of the information process increases from basic control to navigation
task, whereas the safety impact of each level decreases from navigation to control. The driver controls
the vehicle base on the visual sensory input from the road environment and the vehicle feedback.
These skills are mainly learned by experience and executed automatically by the driver. The guidance
and navigation skills, However, requires cognitive activity and the use of long-term memory.
The first step to analyze the driving behaviour is to consider the physiological and mental capabilities
of the driver such as visual field, reaction time, memory, task prioritization and anticipation.
According to these models, the errors can be classified into different groups. The resource overflow
error which is due to fatigue, stress and loss of vigilance may cause from the saturation of information.
The failure of execution of the task might also occur due to poor coordination of task, poor perception
of distance or misunderstanding of the road infrastructure. The error as a fault in the reasoning step
is usually induced from an unexpected event, which the driver had not experienced before.
Chapter I: Introduction
19
The road safety engineer is responsible for applying specific measures on the road environment
component during the design, maintenance and during the daily operation of the road infrastructure.
For example, in order to allow safe traffic operation, road infrastructure should provide adequate
quality (visibility, self-explaining, durable pavement, protection) and must be consistent over space
(consistency of the road elements and signaling with the environment) and should be also consistent
overtime for the drivers (i.e. visual information adapting to operating velocity). Therefore there is a
need for a procedure to measure the safety of the road since there is a significant gap between
objective and subjective safety perceived level of risk from the road users. This problem is addressed
in chapter 3, by introducing a methodology to integrating the driver behaviour (visual and velocity)
with the existing road safety assessment methods.
The road infrastructure management approach is the systematic procedure for the examination of a
road project or an existing road by a qualified technical expert (auditor), independent of the designer
and the administrators. The increase in accident rate or accident severity is one of the main indicators.
These guidelines define criteria and to carry out regular audits on the road, inspections on the existent
infrastructures, implementation of the project and classify the roadways. Moreover, these guidelines
have the main goal to direct, coordinate activities involved in the safety process.
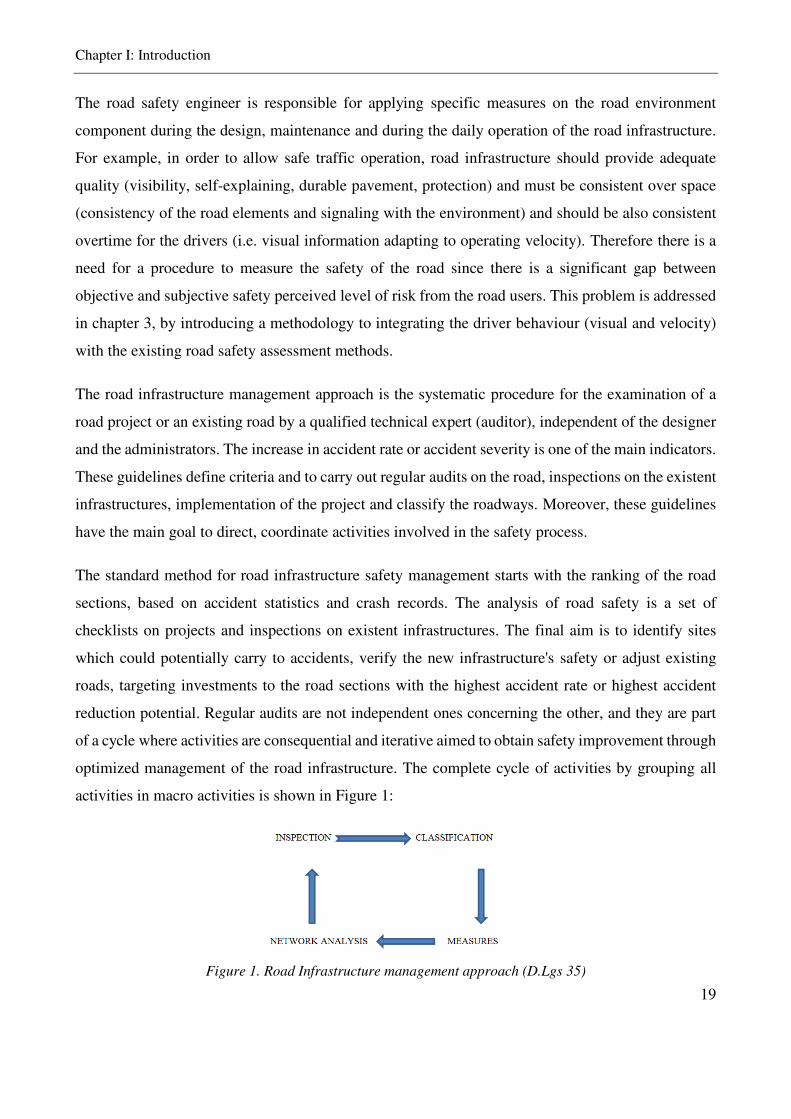
The standard method for road infrastructure safety management starts with the ranking of the road
sections, based on accident statistics and crash records. The analysis of road safety is a set of
checklists on projects and inspections on existent infrastructures. The final aim is to identify sites
which could potentially carry to accidents, verify the new infrastructure's safety or adjust existing
roads, targeting investments to the road sections with the highest accident rate or highest accident
reduction potential. Regular audits are not independent ones concerning the other, and they are part
of a cycle where activities are consequential and iterative aimed to obtain safety improvement through
optimized management of the road infrastructure. The complete cycle of activities by grouping all
activities in macro activities is shown in Figure 1:
Figure 1. Road Infrastructure management approach (D.Lgs 35)
Chapter I: Introduction
20
The Road Safety Review is an analysis of the current state of the road infrastructure by identifying
the sections with highest accident rate and critical issues in order to plan the type of intervention for
improving the safety level of the infrastructure. Considering the Italian legislation, the operating to
assess of the Road Safety Review is composed of four steps (D.Lgs 35): network analysis,
inspections, classification and intervention. The network analysis consists of the state of the
motorway, road type, traffic data and accident analysis. This will be followed by an examination of
the geometrical and functional structure of the road. The inspection program consists of the
programming and assigning the expert for the realisation of the examination. During this phase,
several parameters of the infrastructure will be investigated depending on the stage of the project.
Among investigated parameters is visibility condition of the road, approach sight distance, junctions
location, number of lanes, meteorological conditions, operating velocity, horizontal and vertical
signs, road signing, roadside barrier condition, emergency parings, etc. (Ghasemi et al. 2019).
1.1. Measuring road safety with surrogate events
The standard method for road infrastructure safety management is based on the accident statistics and
crash records. This method has some drawbacks, such as under-reporting accidents, lack of details in
the police report and more importantly, it requires long observation periods. Estimating safety is one
of the greatest challenges faced by those involved in safety research and management. It still is not
possible to confidently attribute a resulting safety improvement to any implemented countermeasure
because of the fundamental difficulty in measuring the countermeasures. Surrogate safety measures
are new method designed to study road safety based on identification and examination of nearmiss
events that with the growing use of intelligent systems in the vehicles, can be easily implemented to
estimate the risk of road infrastructure.
The fundamental idea of the Traffic Conflict Theory (TCT) is that near-miss events can be used to
investigate road safety instead of accidents. This TCT potentially will reduce the time of observation
for assessing road safety and use objective measures such as operative velocity, distance and other
time-based Surrogate measures for quantifying the riskiness of the event. The word conflict defined
as when two or more road users approach each other in a way that a collision is about to happen if
their movements remain unchanged. In order to investigate the surrogate event, usually, the events
are being recorded and then analysed later using post hoc video analysis. The conflicts can be
recorded stationary or in-vehicle by using video-based observation, semi-automated or fully
Chapter I: Introduction
21
automated video analysis (Laureshyn 2010). The technological development made these data more
accessible than before with a relatively low cost. The surrogate safety measures are also being used
in driving simulator studies, in a controlled and safe environment that can provide robust data.
Vulnerable road users such as pedestrians, cyclists suffer severe injuries more than protected road
users (i.e. car, bus). The angle of the approach before the collision may have changed the patterns
from head-on to rear-end. For collisions involving a protected road user, the point of impact
influences the gravity of injuries. For example, head-on collisions are less dangerous than right-angle
collisions. Collision at higher velocity produces more severe injuries than collisions at lower velocity
due to a larger amount of kinetic energy released. There are indications that the relative velocity of
the involved road users is a more important variable than the absolute velocity values.
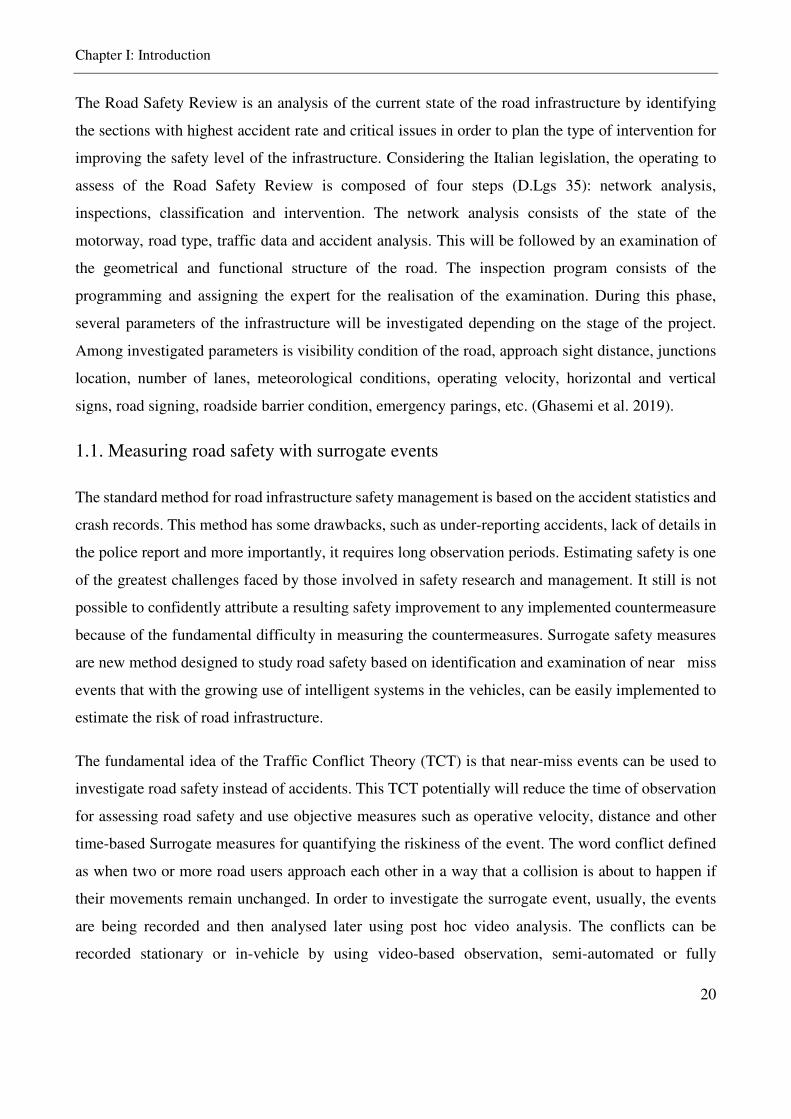
Researchers obtained that the riskiness level changes in the reverse order to the frequency of traffic
interactions. The concept as a pyramid of traffic event is that the pyramid is divided into several
levels, each one representing the frequency of these events. According to this model, the higher the
severity, the lower would be the frequency of the events. Therefore, dangerous and less frequent are
accidents at the top of the pyramid (Figure 2).
A well known surrogate safety measure is the time to collision (TTC). The TTC is the expected time
for two moving objects to crash if they remain at their present velocity and on the same collision
course. The collision course is the necessary condition for calculating the TTC, and it can be used to
evaluate the collision risk of various types of collisions. The minimum calculated TTC value used
represents the riskiness of the event recorded during the entire event, rather than the value recorded
at the time of evasive action. The lower TTC value corresponds to a higher conflict severity.
Figure 2. Pyramid of Traffic Events (Hyden,1977)
Chapter I: Introduction
22
Post Encroachment Time (PET) is another surrogate conflict measure refers to the time lapse between
the end of encroachment of passing the vehicle and the time that the through vehicle arrives at the
potential point of collision (conflict zone). The main difference between PET and TTC is the absence
of the collision course criterion. PET is easier to extract using a stationary camera as no relative
velocity and distance data is needed.
1.2. Human factor in road safety
Human Factors was introduced as a technical term since 1930 with the growing use of man-machine
systems in automation. The term human factor defined as the contribution of human to develop an
error or failure in the machine function. As also mentioned before, the human factor plays a crucial
role in road safety, since the critical reason for more than 90 % of road crashes in the motorways is
driver recognition, decision, and performance error (Singh 2015).
The road design engineer should not only comply with the requisites of the vehicle (i.e. curve radius,
stopping distance), but also should consider the driver behaviour towards the road infrastructure, and
anticipate the reaction of different road users. Some of these are related to the traffic situation and
maybe investigated using traffic analysis techniques; others are related to the human visual capacity,
spatial perception and sense of orientation which are essential to detect obstacles, road sign and traffic
lights.
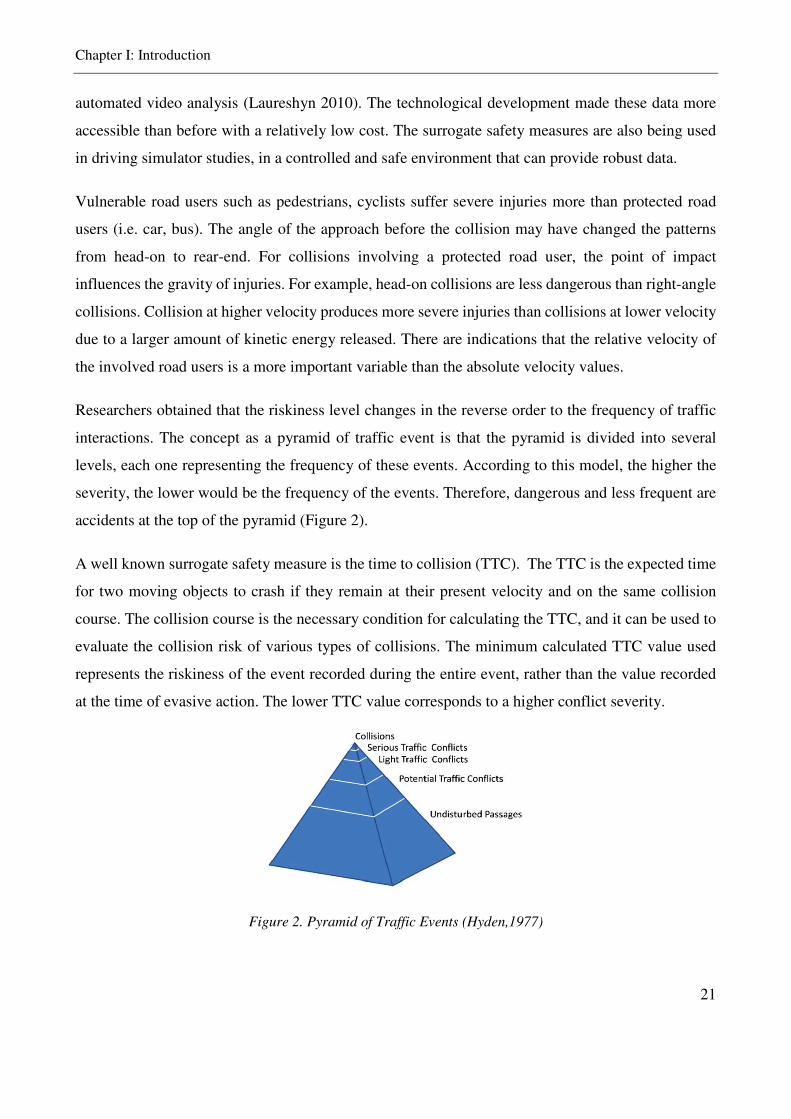
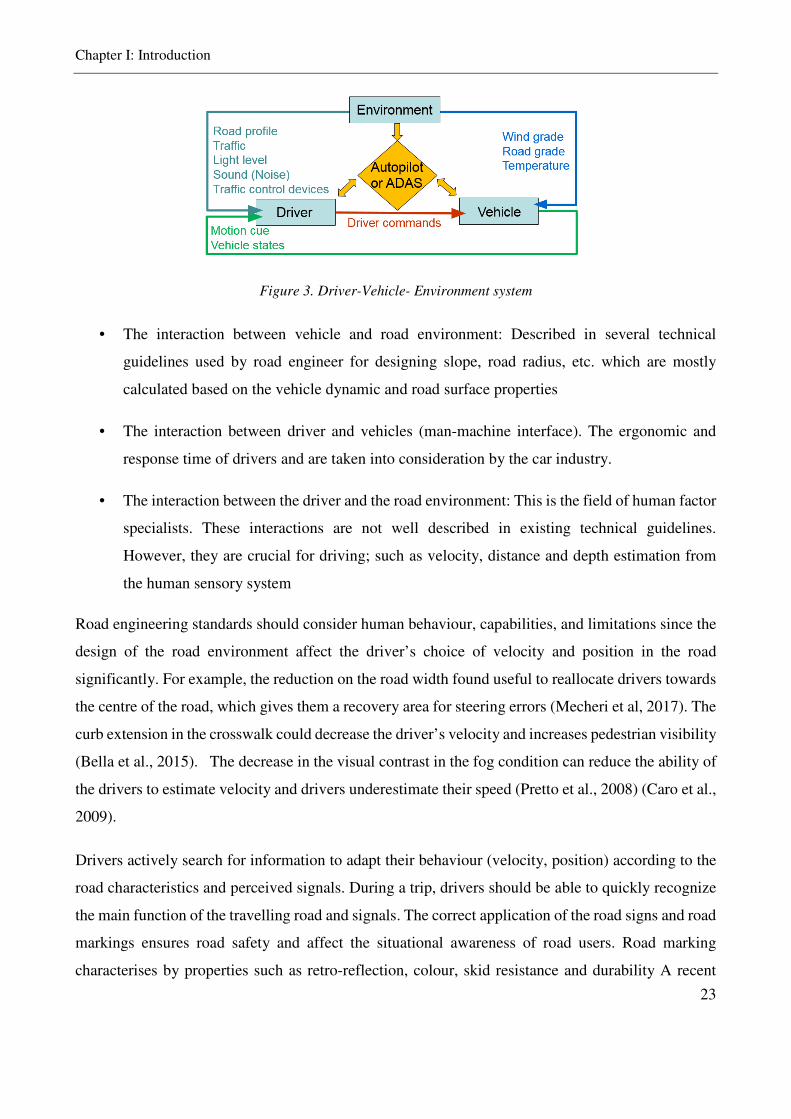
The road transport system can be described with the model of the three key components: Driver
(human), vehicle and the road environment (Figure 3). The study of the interactions between these
components can be used to investigate the effect of each of these components on a traffic accident
and to design assistant systems to increase road safety. A systematic approach to investigate the
human-vehicle-environment should consider the human physiological and psychological capabilities
and limitations in the design of road infrastructure and traffic management. These interactions can be
listed as:
Chapter I: Introduction
23
Figure 3. Driver-Vehicle- Environment system
• The interaction between vehicle and road environment: Described in several technical
guidelines used by road engineer for designing slope, road radius, etc. which are mostly
calculated based on the vehicle dynamic and road surface properties
• The interaction between driver and vehicles (man-machine interface). The ergonomic and
response time of drivers and are taken into consideration by the car industry.
• The interaction between the driver and the road environment: This is the field of human factor
specialists. These interactions are not well described in existing technical guidelines.
However, they are crucial for driving; such as velocity, distance and depth estimation from
the human sensory system
Road engineering standards should consider human behaviour, capabilities, and limitations since the
design of the road environment affect the driver’s choice of velocity and position in the road
significantly. For example, the reduction on the road width found useful to reallocate drivers towards
the centre of the road, which gives them a recovery area for steering errors (Mecheri et al, 2017). The
curb extension in the crosswalk could decrease the driver’s velocity and increases pedestrian visibility
(Bella et al., 2015). The decrease in the visual contrast in the fog condition can reduce the ability of
the drivers to estimate velocity and drivers underestimate their speed (Pretto et al., 2008) (Caro et al.,
2009).
Drivers actively search for information to adapt their behaviour (velocity, position) according to the
road characteristics and perceived signals. During a trip, drivers should be able to quickly recognize
the main function of the travelling road and signals. The correct application of the road signs and road
markings ensures road safety and affect the situational awareness of road users. Road marking
characterises by properties such as retro-reflection, colour, skid resistance and durability A recent
Chapter I: Introduction
24
study in Switzerland, where the yellow marking was used at the zebra crossings, illustrated that the
use of glass beads material in road marking can improve the retro-reflectivity of the zebra crossing at
night (Burghardt et al. 2019). The colour of the road markings and the retro-reflectivity of the
pavement materials also can improve the conspicuity level of the vulnerable user (Costa et al., 2018).
Additional lighting features can be used at night such as flashing LED curb and found useful to reduce
the velocity of the drivers (Bella et al., 2015) (Samuel et al., 2013).
The workload level of the driver might influence their performance. The workload is a
multidimensional phenomenon and can affect the driver in many ways. Having a low amount of
information or overload of information both may lead to significant errors. Information underload
decreases the driver’s attention and awareness that may lead to increasing velocity. On the contrary,
high workload leads to perception error or reaction delay. Various measures are being used to study
the workload such as driver's eye glancing patterns, Number of glances, duration and the location of
glances made while performing a driving task or directly by measuring the activity of the brain using
the electroencephalographic technique (EEG).
1.3. Driving simulator and road safety
Driving simulation development started in the 60s using analogue computers and electronic circuits.
In 1965, the American Society of Mechanical Engineers published a report outlining the development
of a driving simulator in which drivers were seated in a stationary vehicle cab in front of a projection
system re-playing colour video recorded from a real-world scene (Fisher et al., 2011). Driving
simulators can vary from very simple simulators using a joystick or keyboard control with a primary
road environment displayed on a PC screen to multi-million-dollar Simulators with full-size vehicle
cabin and motion restitution, 6 degrees of freedom and a 360° field of view.
Driving simulators are powerful tools which allow testing complex tasks at a relatively low cost. They
are useful to study driving behaviour and represent an efficient alternative to test track evaluations.
Repeatability of experimental conditions, safety and cost-effectiveness of the tests are some of the
motivating factors for using driving simulators. Driving simulators make it easy to test and compare
different existing or new road configurations or equipment. Thus, they are powerful tools to
investigate driving behaviour, allowing them to determine how road design perceived and understood
by the drivers and how they may respond to them.
Chapter I: Introduction
25
Experimenting high-risk scenario in the virtual environment is the main advantages of driving
simulators. They provide total control over the simulated events in a safe environment. It is possible
to present the participants with driving tasks that would be challenging to study on a test track or the
road, either because they are dangerous, or they rarely occur. For instance, driving simulators can be
used to study populations at risks such as elderly pedestrians or scenarios with traffic congestion.
They can also be used to investigate the driver’s fatigue, impairment and medical issue. The driving
situations can be reproduced as many times as needed, and this facilitates behaviour comparisons of
several participants in the same scenario. Driver feedback to the virtual environment and driving
performance measures such as steering wheel, pedals, gear change can be recorded using high-
frequency sensors.
When it comes to a driving simulator, the advantages are related to the possibility of bypassing road
tests with real vehicles. However, the fidelity of the simulator must be ensured, so that results in the
driving simulator are comparable with those obtained with a real vehicle. In other words, the driving
simulator needs to be validated. This is a very important step for generating meaningful test and the
credibility of the simulator experiments for road safety studies. This validity can be investigated by
comparing the behaviour of the drivers in the simulator (behavioural validity) by comparing with a
similar scenario in another simulator or a real road experiment (relative validity). Another validation
method could be done by comparing the physical variable (i.e. velocity) in a real and simulated
environment. Statistical methods such as analyse of variance (ANOVA) or correlation analysis must
be used to find the statistical significance between the simulated and real road test results. In the last
chapter of the thesis, some of these aspects were discussed using surrogate safety measures.
1.4. Thesis Contribution
This thesis advances the state of the art in the human-vehicle-road interaction and proposes design
solutions for enhancing road safety based on the drivers’ performance and objective measures.
The main focus being on the drivers’ braking and yielding behaviour and the thesis aimed to enhance
the understanding of the drivers’ performance through various designs and stimuli on road and
followed up by simulation. Another major contribution of this thesis is the experimental work on the
motion cueing platform and the impact on human depth/distance perception in the virtual
environment.
Chapter I: Introduction
26
The drivers' adaptation to the automation solutions is another topic covered by this thesis, in particular
for the car following/braking scenario with the use of Adaptive Cruise Control (ACC). An original
approach for estimating the human visual distraction was used in the thesis and the proposed
methodology was applied to the real road and simulation experimentation.
1.5. Thesis outline
The thesis is structured in five chapters and eight case studies at the end. Chapter 1 is an introduction
to the thesis. chapter two is focused on the vehicle dynamic model and the motion cueing platform
and presents two original case study on the motion perception of drivers in the simulator. In chapter
3, Innovative road safety measures and the advanced monitoring technologies for road safety audit
is presented with two case studies. In chapter 4, the surrogate safety measures were used to compare
design solutions at pedestrian and bicycle crossing with two case studies And n Chapter 5, the driver
adaption to ACC in a car following scenario was investigated, using a microscopic traffic simulator
and on-road investigation with two case studies.
Chapter II: Vehicle Dynamics and 2DOF Motion Platform
27
CHAPTER II
VEHICLE DYNAMICS AND 2DOF MOTION
PLATFORM IMPROVEMENT IN THE
DRIVING SIMULATOR
Chapter II: Vehicle Dynamics and 2DOF Motion Platform
28
Driving dynamic task (DDT) is defined as all the real-time operations and tactical functions required
for operating a vehicle on the road, excluding the selection of itinerates and trip scheduling that are
strategic. The operations such as lateral vehicle motion control via steering wheel (operational),
Longitudinal vehicle motion control with pedals (operational), Monitoring the driving environment
(via object and event detection), recognition, classification, and response preparation (operational and
tactical), object and event response execution (operational and tactical), Manoeuvre planning
(tactical), enhancing conspicuity via lighting and signalling (tactical) are all considered as the
dynamic driving task (SAE J3063, 2015).
Vehicle dynamic model (VDM) is in charge of simulating in real-time the entire vehicle states that
during dynamic driving task are necessary for the driver. This information later is being displayed on
the dashboard (i.e. velocity, rpm), through a Human-machine-Interface (HMI) or use as input for
visual, sound or motion cueing systems. The vehicle dynamic model depends on vehicle
characteristics such as the engine, braking system, gear shifting system, suspension and even driving
assistant system or cabin control. This makes driving simulator an important research tool for vehicle
manufacturing companies to test their vehicle design and provide useful information for improving
the design of the road infrastructure.
The visual cue is the primary source of information for monitoring and event detection; however, the
motion and proprioceptive feedback of the vehicle to the input signal is giving information to the
driver to adapt his control input according to the vehicle performance. The movement of the simulator
can enhance the driver perception in the virtual environment with the correct motion according to the
visual stimuli. However, reproducing the full-scale accelerations of the real vehicle is very costly if
not impossible, and therefore, motion cueing algorithms should be used to reproduce the motion in
driving simulators. The motion cueing algorithm uses the vehicle states (in real-time) from the vehicle
dynamic model and performs calculation considering human vestibular perceptual limitations.
This chapter first explains the simulator architecture and the vehicle dynamic model used for the
simulation. Different gear shifting systems were implemented to investigate driver behaviour. Finally,
experimentation involving participants conducted to test the simulator motion in different sessions.
All the activities in this chapter are case-study I that you can find in the annexe.
Chapter II: Vehicle Dynamics and 2DOF Motion Platform
29
2.1. Simulator architecture
The choices of the structure and motion bases for the SIMU-LACET driving simulator are motivated
by the necessity to produce sufficient perception while driving as well as by financial design
constraints. Thus, the objective of the simulator project is not to reproduce all of a real vehicle’s
motions, but only the longitudinal movements or surge, and yaw, which makes this a 2DOF driving
simulator.
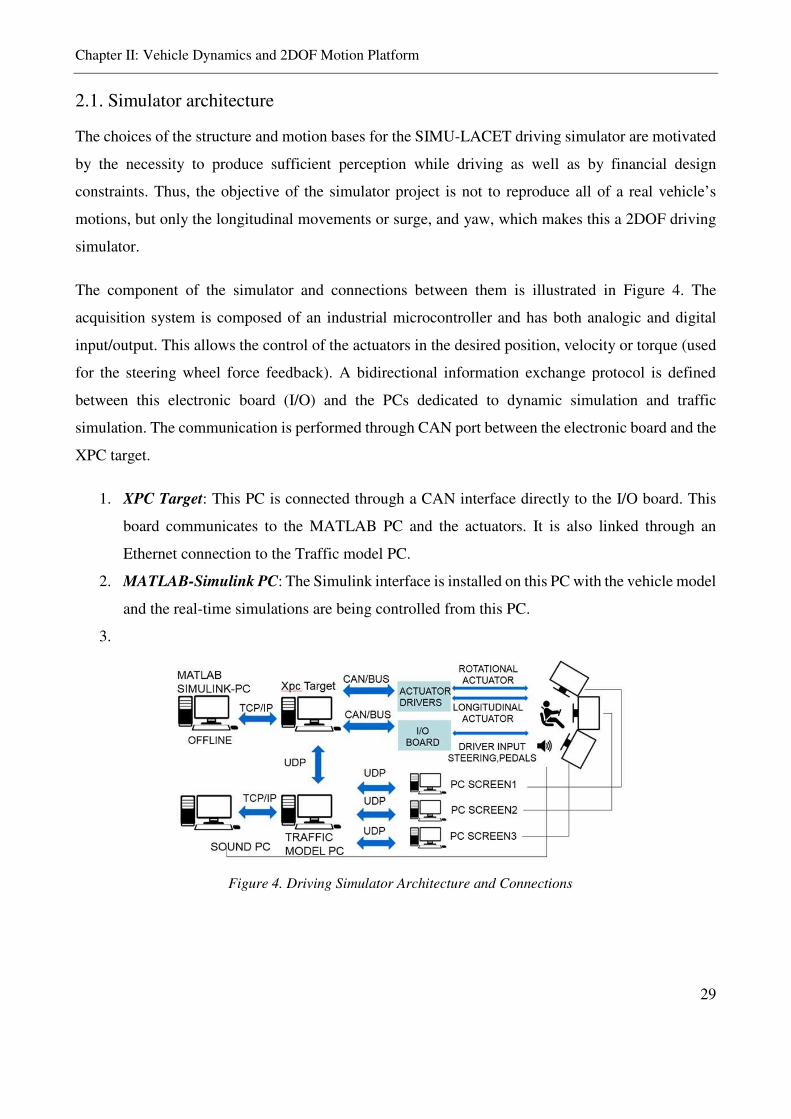
The component of the simulator and connections between them is illustrated in Figure 4. The
acquisition system is composed of an industrial microcontroller and has both analogic and digital
input/output. This allows the control of the actuators in the desired position, velocity or torque (used
for the steering wheel force feedback). A bidirectional information exchange protocol is defined
between this electronic board (I/O) and the PCs dedicated to dynamic simulation and traffic
simulation. The communication is performed through CAN port between the electronic board and the
XPC target.
1. XPC Target: This PC is connected through a CAN interface directly to the I/O board. This
board communicates to the MATLAB PC and the actuators. It is also linked through an
Ethernet connection to the Traffic model PC.
2. MATLAB-Simulink PC: The Simulink interface is installed on this PC with the vehicle model
and the real-time simulations are being controlled from this PC.
3.
Figure 4. Driving Simulator Architecture and Connections
Chapter II: Vehicle Dynamics and 2DOF Motion Platform
30
4. Sound cueing PC: The sound cues such as road-noise, engine, other traffic during the
simulation is simulated using this PC which consists of software managing the sound effects
during the simulation. It works with a sound card mounted under the platform, while the
speakers which are mounted in the motion cabin reproduce the sounds;
5. Traffic Model PC (Dr2): This computer simulates the road environment, traffic and the
driving scenario. The software ArchiSim2 is used for the programming of the traffic and
allows different time, distance or velocity criteria to be used for the simulation of the events.
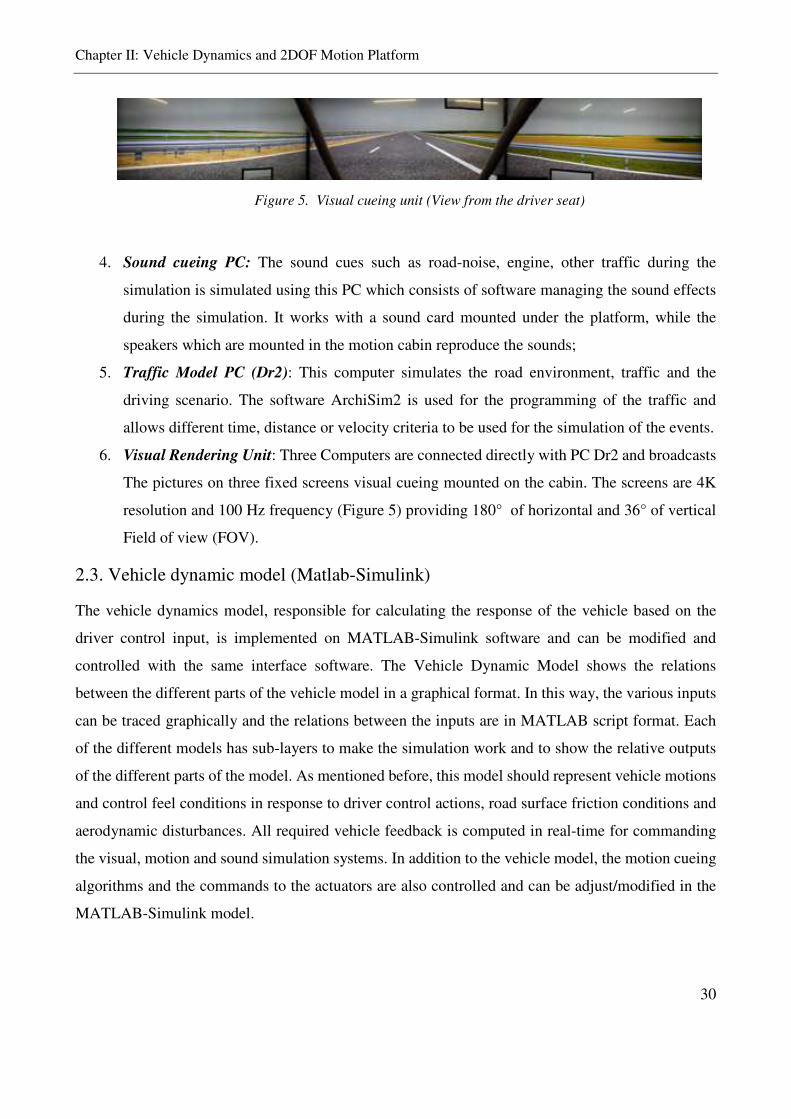
6. Visual Rendering Unit: Three Computers are connected directly with PC Dr2 and broadcasts
The pictures on three fixed screens visual cueing mounted on the cabin. The screens are 4K
resolution and 100 Hz frequency (Figure 5) providing 180° of horizontal and 36° of vertical
Field of view (FOV).
2.3. Vehicle dynamic model (Matlab-Simulink)
The vehicle dynamics model, responsible for calculating the response of the vehicle based on the
driver control input, is implemented on MATLAB-Simulink software and can be modified and
controlled with the same interface software. The Vehicle Dynamic Model shows the relations
between the different parts of the vehicle model in a graphical format. In this way, the various inputs
can be traced graphically and the relations between the inputs are in MATLAB script format. Each
of the different models has sub-layers to make the simulation work and to show the relative outputs
of the different parts of the model. As mentioned before, this model should represent vehicle motions
and control feel conditions in response to driver control actions, road surface friction conditions and
aerodynamic disturbances. All required vehicle feedback is computed in real-time for commanding
the visual, motion and sound simulation systems. In addition to the vehicle model, the motion cueing
algorithms and the commands to the actuators are also controlled and can be adjust/modified in the
MATLAB-Simulink model.
Figure 5. Visual cueing unit (View from the driver seat)
Chapter II: Vehicle Dynamics and 2DOF Motion Platform
31
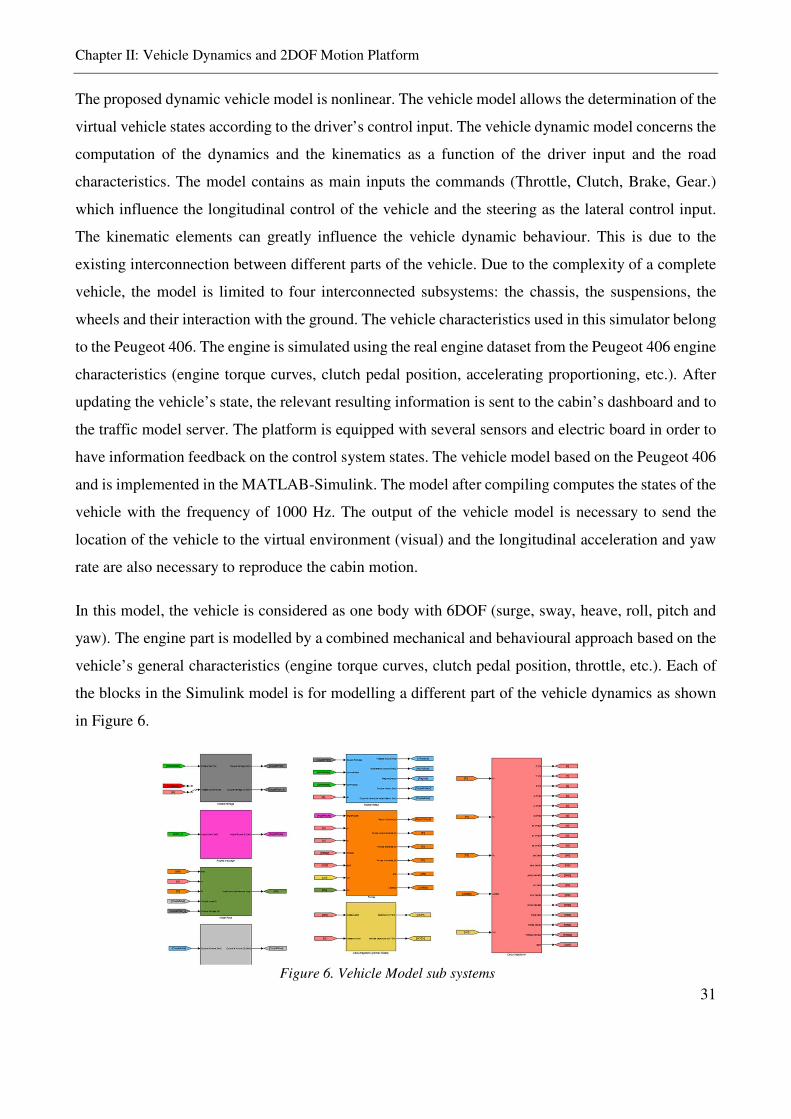
The proposed dynamic vehicle model is nonlinear. The vehicle model allows the determination of the
virtual vehicle states according to the driver’s control input. The vehicle dynamic model concerns the
computation of the dynamics and the kinematics as a function of the driver input and the road
characteristics. The model contains as main inputs the commands (Throttle, Clutch, Brake, Gear.)
which influence the longitudinal control of the vehicle and the steering as the lateral control input.
The kinematic elements can greatly influence the vehicle dynamic behaviour. This is due to the
existing interconnection between different parts of the vehicle. Due to the complexity of a complete
vehicle, the model is limited to four interconnected subsystems: the chassis, the suspensions, the
wheels and their interaction with the ground. The vehicle characteristics used in this simulator belong
to the Peugeot 406. The engine is simulated using the real engine dataset from the Peugeot 406 engine
characteristics (engine torque curves, clutch pedal position, accelerating proportioning, etc.). After
updating the vehicle’s state, the relevant resulting information is sent to the cabin’s dashboard and to
the traffic model server. The platform is equipped with several sensors and electric board in order to
have information feedback on the control system states. The vehicle model based on the Peugeot 406
and is implemented in the MATLAB-Simulink. The model after compiling computes the states of the
vehicle with the frequency of 1000 Hz. The output of the vehicle model is necessary to send the
location of the vehicle to the virtual environment (visual) and the longitudinal acceleration and yaw
rate are also necessary to reproduce the cabin motion.
In this model, the vehicle is considered as one body with 6DOF (surge, sway, heave, roll, pitch and
yaw). The engine part is modelled by a combined mechanical and behavioural approach based on the
vehicle’s general characteristics (engine torque curves, clutch pedal position, throttle, etc.). Each of
the blocks in the Simulink model is for modelling a different part of the vehicle dynamics as shown
in Figure 6.
Figure 6. Vehicle Model sub systems
Chapter II: Vehicle Dynamics and 2DOF Motion Platform
32
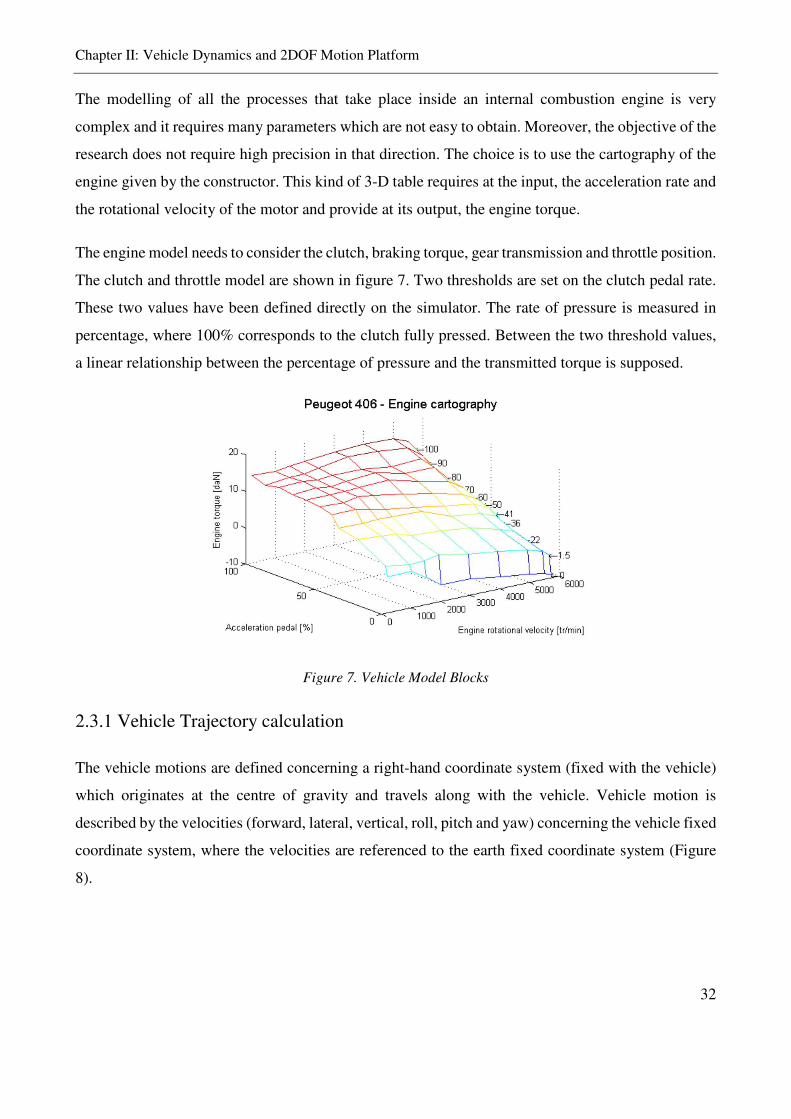
The modelling of all the processes that take place inside an internal combustion engine is very
complex and it requires many parameters which are not easy to obtain. Moreover, the objective of the
research does not require high precision in that direction. The choice is to use the cartography of the
engine given by the constructor. This kind of 3-D table requires at the input, the acceleration rate and
the rotational velocity of the motor and provide at its output, the engine torque.
The engine model needs to consider the clutch, braking torque, gear transmission and throttle position.
The clutch and throttle model are shown in figure 7. Two thresholds are set on the clutch pedal rate.
These two values have been defined directly on the simulator. The rate of pressure is measured in
percentage, where 100% corresponds to the clutch fully pressed. Between the two threshold values,
a linear relationship between the percentage of pressure and the transmitted torque is supposed.
Figure 7. Vehicle Model Blocks
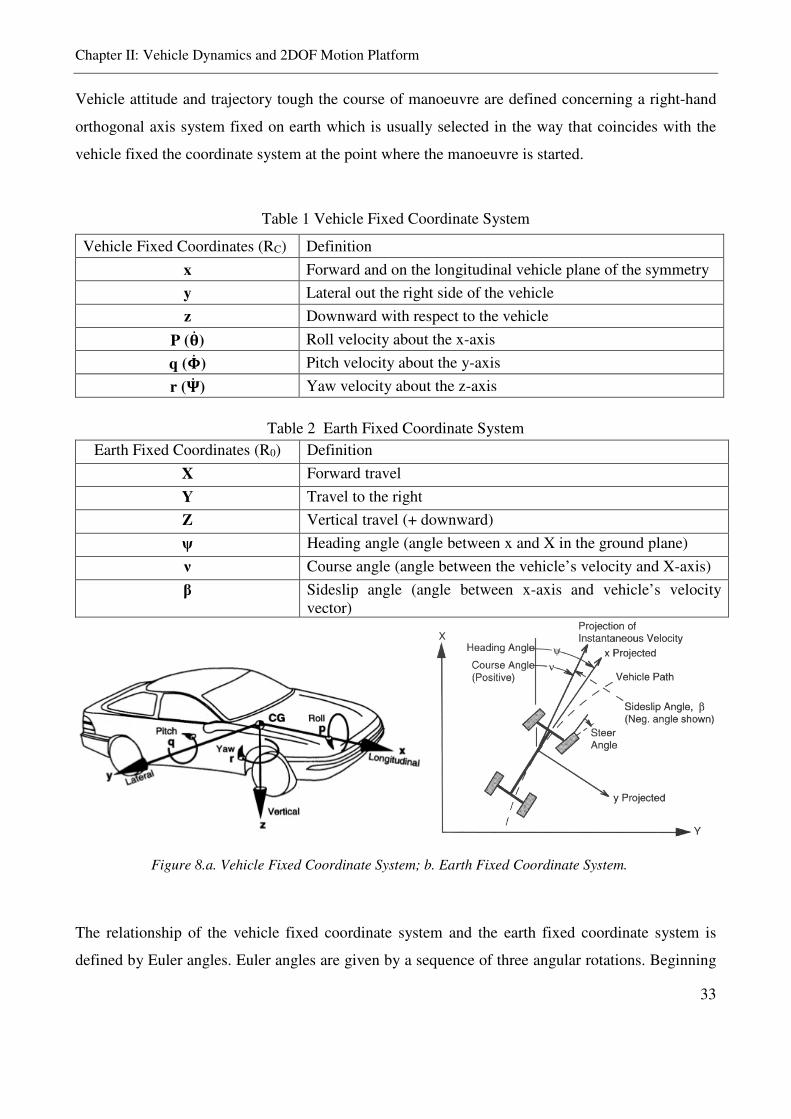
2.3.1 Vehicle Trajectory calculation
The vehicle motions are defined concerning a right-hand coordinate system (fixed with the vehicle)
which originates at the centre of gravity and travels along with the vehicle. Vehicle motion is
described by the velocities (forward, lateral, vertical, roll, pitch and yaw) concerning the vehicle fixed
coordinate system, where the velocities are referenced to the earth fixed coordinate system (Figure
8).
Chapter II: Vehicle Dynamics and 2DOF Motion Platform
33
Vehicle attitude and trajectory tough the course of manoeuvre are defined concerning a right-hand
orthogonal axis system fixed on earth which is usually selected in the way that coincides with the
vehicle fixed the coordinate system at the point where the manoeuvre is started.
Table 1 Vehicle Fixed Coordinate System
Table 2 Earth Fixed Coordinate System
Earth Fixed Coordinates (R0) Definition
X Forward travel
Y Travel to the right
Z Vertical travel (+ downward)
ψ Heading angle (angle between x and X in the ground plane)
ν Course angle (angle between the vehicle’s velocity and X-axis)
β Sideslip angle (angle between x-axis and vehicle’s velocity vector)
The relationship of the vehicle fixed coordinate system and the earth fixed coordinate system is
defined by Euler angles. Euler angles are given by a sequence of three angular rotations. Beginning
Vehicle Fixed Coordinates (RC) Definition
x Forward and on the longitudinal vehicle plane of the symmetry
y Lateral out the right side of the vehicle
z Downward with respect to the vehicle
P ( ) Roll velocity about the x-axis
q ( ) Pitch velocity about the y-axis
r ( ) Yaw velocity about the z-axis
Figure 8.a. Vehicle Fixed Coordinate System; b. Earth Fixed Coordinate System.
Chapter II: Vehicle Dynamics and 2DOF Motion Platform
34
at the earth fixed system the axis system rotates around the yaw (z-axis), then in pitch (y-axis) and
then in pitch (x-axis). In order to transform the fixed coordinate system “R0 to the centre of gravity
coordinate system “Rc”, a transformation matrix must be constructed “Tr”.
= × × = c ss − cs cs + sss + cc − cs− (3-1)
∙ ()!()()" = ×
#$$%&'(())&'!())&'())*
++, (3-2)
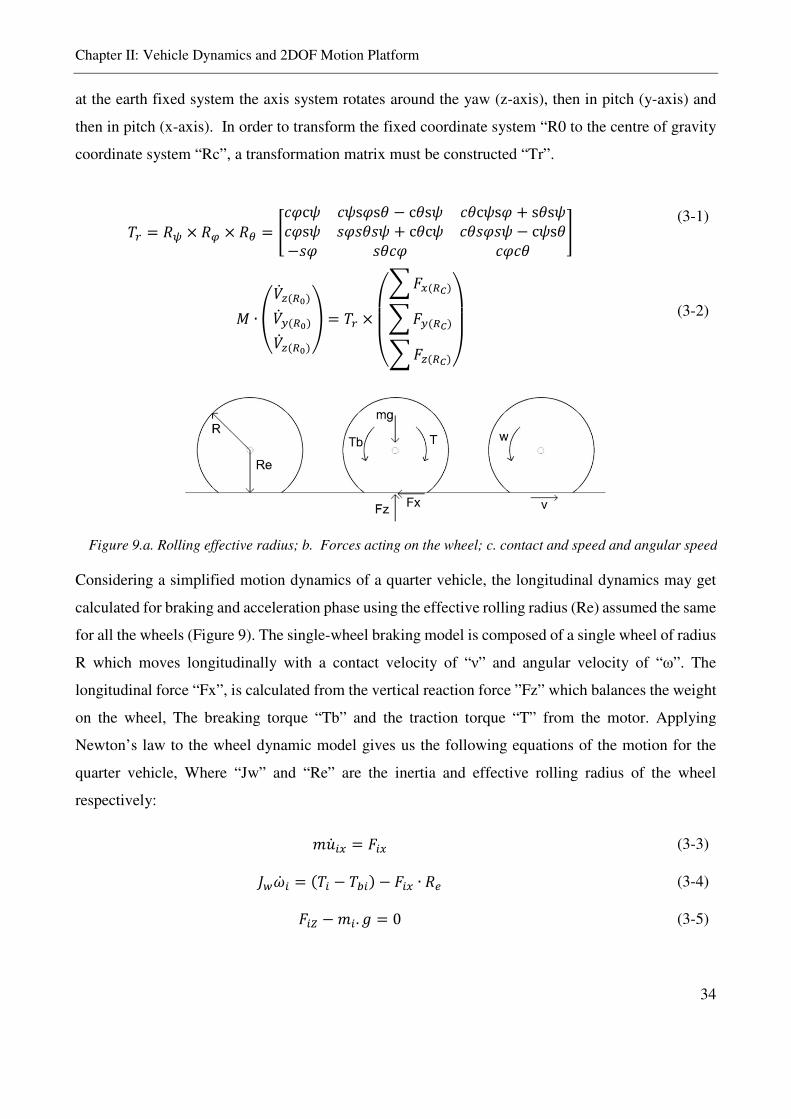
Considering a simplified motion dynamics of a quarter vehicle, the longitudinal dynamics may get
calculated for braking and acceleration phase using the effective rolling radius (Re) assumed the same
for all the wheels (Figure 9). The single-wheel braking model is composed of a single wheel of radius
R which moves longitudinally with a contact velocity of “ν” and angular velocity of “ω”. The
longitudinal force “Fx”, is calculated from the vertical reaction force ”Fz” which balances the weight
on the wheel, The breaking torque “Tb” and the traction torque “T” from the motor. Applying
Newton’s law to the wheel dynamic model gives us the following equations of the motion for the
quarter vehicle, Where “Jw” and “Re” are the inertia and effective rolling radius of the wheel
respectively:
-. /( = '/( (3-3)
012 / = (/ − 3/) − '/( ∙ 4 (3-4)
'/5 − -/. 7 = 0 (3-5)
Figure 9.a. Rolling effective radius; b. Forces acting on the wheel; c. contact and speed and angular speed
Chapter II: Vehicle Dynamics and 2DOF Motion Platform
35
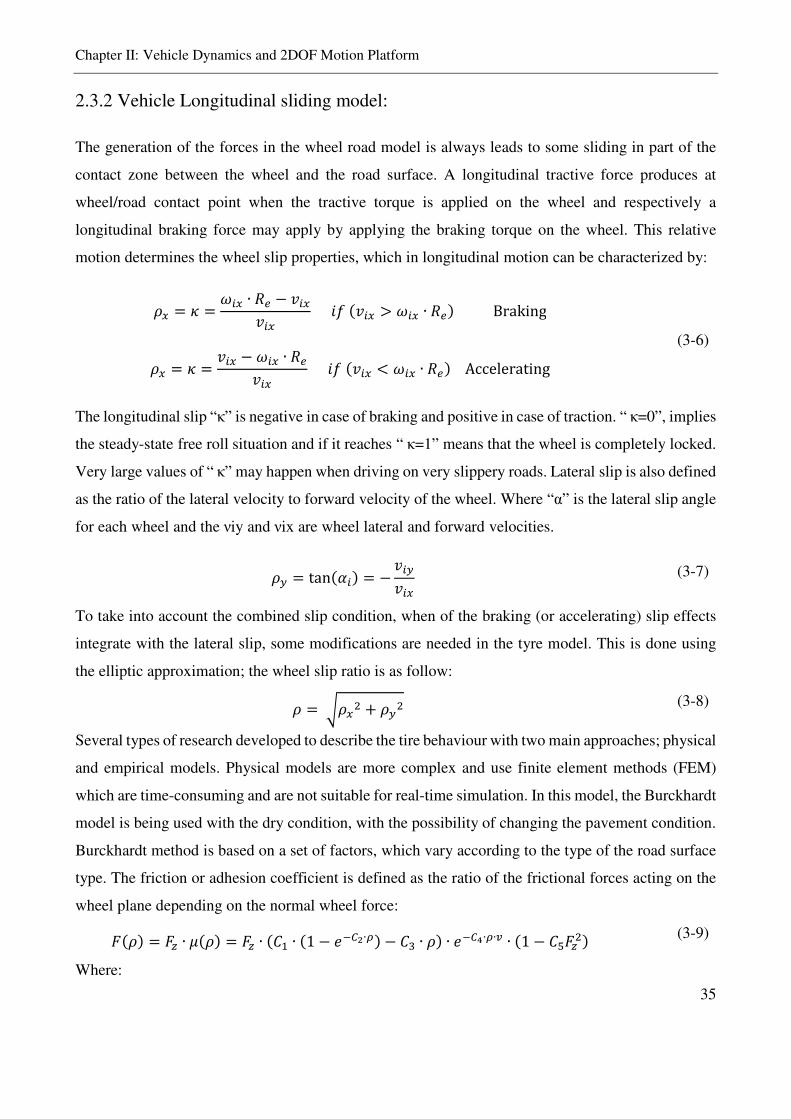
2.3.2 Vehicle Longitudinal sliding model:
The generation of the forces in the wheel road model is always leads to some sliding in part of the
contact zone between the wheel and the road surface. A longitudinal tractive force produces at
wheel/road contact point when the tractive torque is applied on the wheel and respectively a
longitudinal braking force may apply by applying the braking torque on the wheel. This relative
motion determines the wheel slip properties, which in longitudinal motion can be characterized by:
9( = : = 2/( ∙ 4 − ;/(;/( =>(;/( > 2/( ∙ 4)Braking
9( = : = ;/( − 2/( ∙ 4;/( =>(;/( < 2/( ∙ 4)Accelerating
(3-6)
The longitudinal slip “κ” is negative in case of braking and positive in case of traction. “ κ=0”, implies
the steady-state free roll situation and if it reaches “ κ=1” means that the wheel is completely locked.
Very large values of “ κ” may happen when driving on very slippery roads. Lateral slip is also defined
as the ratio of the lateral velocity to forward velocity of the wheel. Where “α” is the lateral slip angle
for each wheel and the νiy and νix are wheel lateral and forward velocities.
9! = tan(L/) = −;/!;/( (3-7)
To take into account the combined slip condition, when of the braking (or accelerating) slip effects
integrate with the lateral slip, some modifications are needed in the tyre model. This is done using
the elliptic approximation; the wheel slip ratio is as follow:
9 = M9(N + 9!N (3-8)
Several types of research developed to describe the tire behaviour with two main approaches; physical
and empirical models. Physical models are more complex and use finite element methods (FEM)
which are time-consuming and are not suitable for real-time simulation. In this model, the Burckhardt
model is being used with the dry condition, with the possibility of changing the pavement condition.
Burckhardt method is based on a set of factors, which vary according to the type of the road surface
type. The friction or adhesion coefficient is defined as the ratio of the frictional forces acting on the
wheel plane depending on the normal wheel force:
'(9) = ' ∙ O(9) = ' ∙ (PQ ∙ (1 − STUV∙W) − PX ∙ 9) ∙ STUY∙W∙Z ∙ (1 − P['N) (3-9)
Where:
Chapter II: Vehicle Dynamics and 2DOF Motion Platform
36
C1: the maximal value of the friction curve: C1=1.28
C2: corresponds to the shape of the friction curve: C2=23.99
C3: the difference between the maximal value of the friction and 1. : C3= 0.52
C4: depends on the maximal velocity of the wheel. : C4=0
C5: represents the influence of the vertical load on the wheel. C5=0
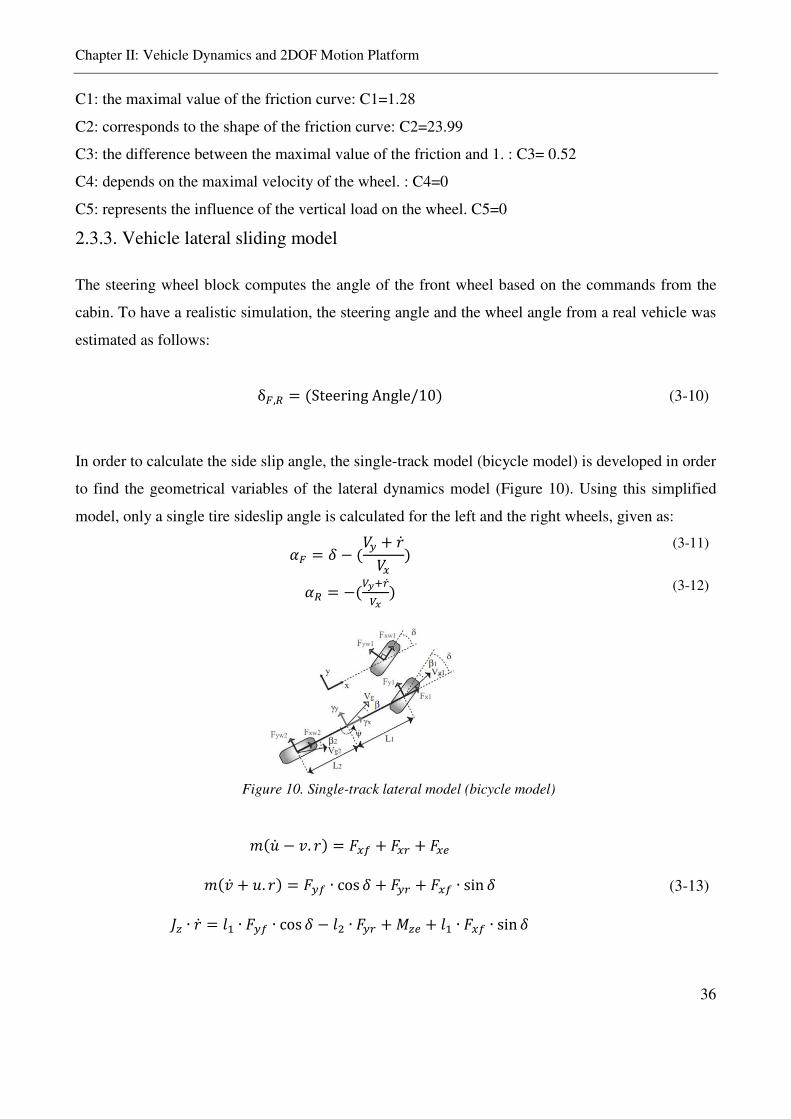
2.3.3. Vehicle lateral sliding model
The steering wheel block computes the angle of the front wheel based on the commands from the
cabin. To have a realistic simulation, the steering angle and the wheel angle from a real vehicle was
estimated as follows:
δ], = (SteeringAngle/10) (3-10)
In order to calculate the side slip angle, the single-track model (bicycle model) is developed in order
to find the geometrical variables of the lateral dynamics model (Figure 10). Using this simplified
model, only a single tire sideslip angle is calculated for the left and the right wheels, given as:
L] = a − (! + b( ) (3-11)
L = −(cdecf ) (3-12)
-(. − ;. b) = '(g + '( + '(4
-(; + .. b) = '!g ∙ cos a + '! + '(g ∙ sin a (3-13)
0 ∙ b = iQ ∙ '!g ∙ cos a − iN ∙ '! + 4 + iQ ∙ '(g ∙ sin a
Figure 10. Single-track lateral model (bicycle model)
Chapter II: Vehicle Dynamics and 2DOF Motion Platform
37
The equations of the motion are based the single-track model in planar motion. Where r is the yaw
rate, u and v are longitudinal and lateral velocity in Rc frame. The equilibrium must hold in lateral,
longitudinal and yaw direction with the force of the tires and the moment acting on the vehicle
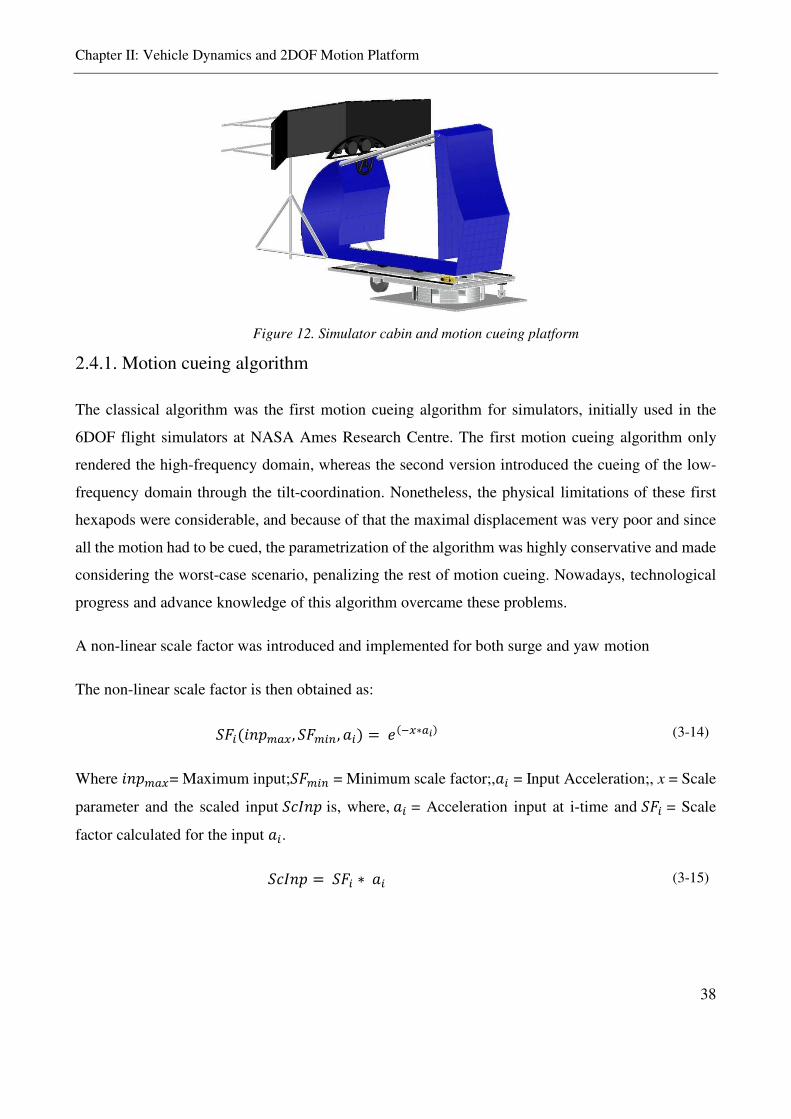
2.4. Motion cueing platform:
The motion cueing platform is composed of two separate structures and drives. The longitudinal rail
is located on the top of the rotating circular platform. The longitudinal upper structure can move
linearly along the rail. A pulley-belts system is being used to move the cabin powering from a
brushless servo motor (SMB 80). The lower structure provides yaw angle cabin rotation by using a
circular platform in which the servomotor directly rotates the upper structure with wheel support in
the front of the cabin. The vehicle motion simulation structure is shown in Figure 12. The participant
in the driving Simulator cabin gives control input from the steering wheels and pedals to the vehicle
dynamics model which generating the vehicle states. These states then will be used to mock the
desired motion cues on the platform using the motion cueing algorithm. Two actuators generate the
motion in the two degrees of freedom space of the cabin (yaw and longitudinal) using the desired
platform states.
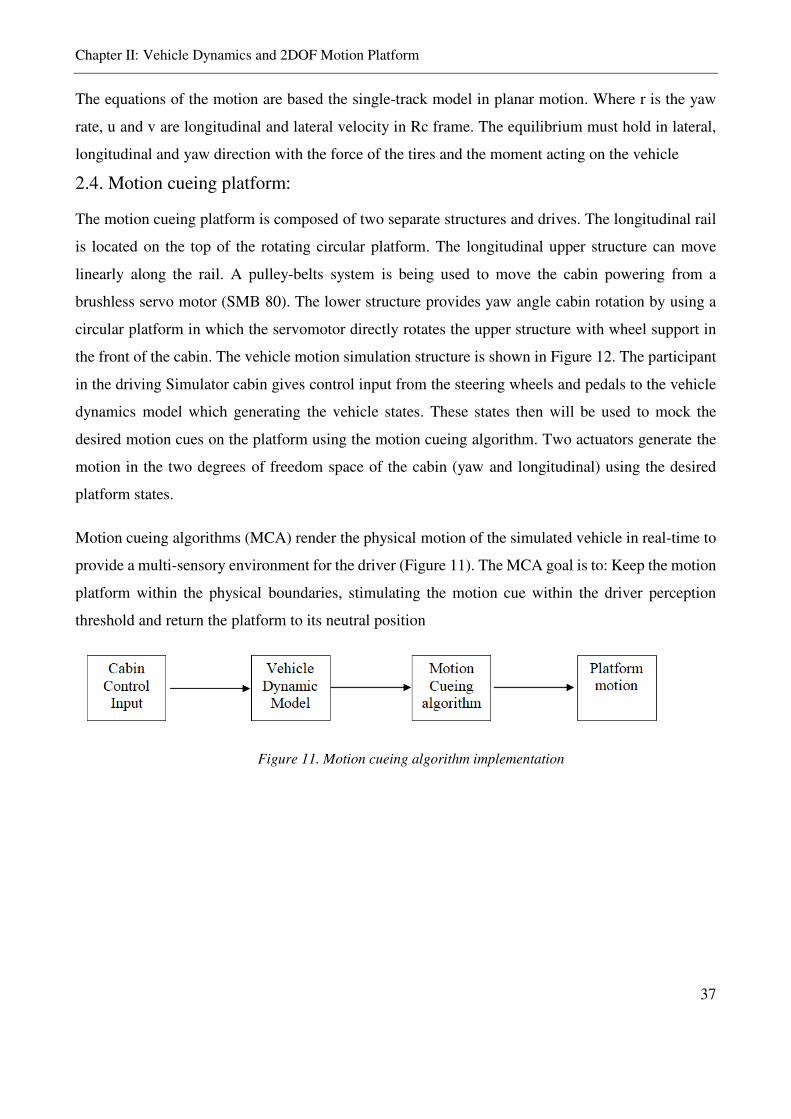
Motion cueing algorithms (MCA) render the physical motion of the simulated vehicle in real-time to
provide a multi-sensory environment for the driver (Figure 11). The MCA goal is to: Keep the motion
platform within the physical boundaries, stimulating the motion cue within the driver perception
threshold and return the platform to its neutral position
Figure 11. Motion cueing algorithm implementation
Chapter II: Vehicle Dynamics and 2DOF Motion Platform
38
2.4.1. Motion cueing algorithm
The classical algorithm was the first motion cueing algorithm for simulators, initially used in the
6DOF flight simulators at NASA Ames Research Centre. The first motion cueing algorithm only
rendered the high-frequency domain, whereas the second version introduced the cueing of the low-
frequency domain through the tilt-coordination. Nonetheless, the physical limitations of these first
hexapods were considerable, and because of that the maximal displacement was very poor and since
all the motion had to be cued, the parametrization of the algorithm was highly conservative and made
considering the worst-case scenario, penalizing the rest of motion cueing. Nowadays, technological
progress and advance knowledge of this algorithm overcame these problems.
A non-linear scale factor was introduced and implemented for both surge and yaw motion
The non-linear scale factor is then obtained as:
j'/(=klmn(, j'm/o, p/) = S(T(∗nr) (3-14)
Where =klmn(= Maximum input;j'm/o = Minimum scale factor;,p/ = Input Acceleration;, x = Scale
parameter and the scaled input jskl is, where,p/ = Acceleration input at i-time and j'/ = Scale
factor calculated for the input p/. jskl = j'/ ∗ p/ (3-15)
Figure 12. Simulator cabin and motion cueing platform
Chapter II: Vehicle Dynamics and 2DOF Motion Platform
39
In this way, fixing the maximal acceleration and the minimal scale factor to be applied to this
acceleration, the procedure generates each time a new non-linear exponential equation to calculate
the scale factor to be used for each input.
For calculating the longitudinal acceleration input, consideringpmn( = 0.87, being Omn( in the
dynamic model 0.8; j'm/o = 0.5. As a result, the exponential form to calculate the scale factor is:
j'/ = S(Tu.uvvX∗nr) (3-16)
And for the yaw motion input, with the absolute maximum yaw rate for the limit case of ISO chicane
at 100 km/h is 22.11 o/s, and using SFmin = 0.5 the scale factor is
j'/ = S(Tu.uXQX∗!w) (3-17)
The classical algorithm is developed by the combination of the washout and tilt coordination
algorithm. The filters separate the frequencies of the linear acceleration for the displacements and
rates for the rotations in high-frequency components and low-frequency components. It is by treating
those that the classical algorithm cues a motion compatible with the limits of the platform. First, high-
pass filter F1 passes the high-frequency components of the scaled signal. These components represent
the transitory component of the signal, namely the variation of acceleration. A typical representation
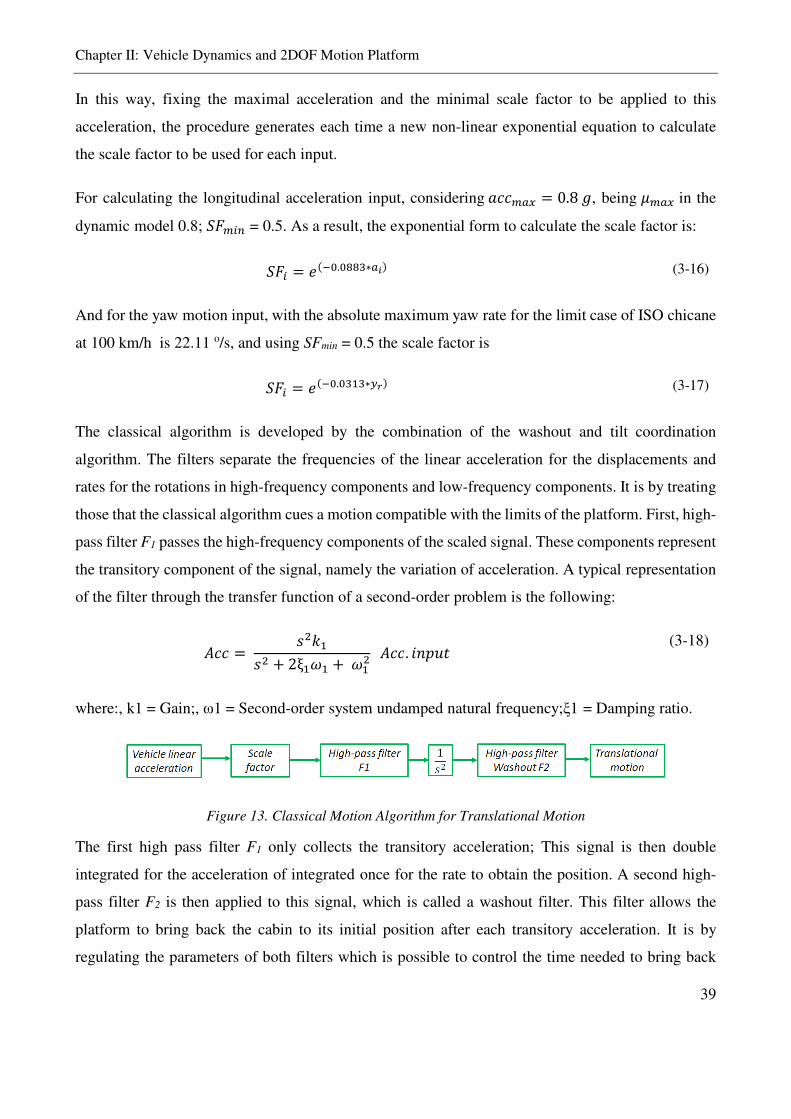
of the filter through the transfer function of a second-order problem is the following:
x = NyQN + 2ξQ2Q +2QN x. =kl.| (3-18)
where:, k1 = Gain;, ω1 = Second-order system undamped natural frequency;ξ1 = Damping ratio.
Figure 13. Classical Motion Algorithm for Translational Motion
The first high pass filter F1 only collects the transitory acceleration; This signal is then double
integrated for the acceleration of integrated once for the rate to obtain the position. A second high-
pass filter F2 is then applied to this signal, which is called a washout filter. This filter allows the
platform to bring back the cabin to its initial position after each transitory acceleration. It is by
regulating the parameters of both filters which is possible to control the time needed to bring back
Chapter II: Vehicle Dynamics and 2DOF Motion Platform
40
the platform to its initial position, the amplitude of the signal and therefore also the space used by the
platform.
When adjusting the MCA, it is important to define the parameters so that the perceived accelerations
are not inconsistent with the rest of the motion, the so-called false cues. These reduce the quality of
immersion and create a degradation of simulated vehicle control. This incoherence in motion
perception can be removed by regulating the filters. In general, it is possible to distinguish three
principal sources of false cues:
• Post-filter acceleration exceedance:
After applying the high-pass filter to the simulated acceleration or rate, the filtered signal tends to
follow the simulated signal in the transitory phase, whereas it vanishes when it comes to continuous
accelerations. However, when the acceleration vanishes, an incoherent perception could be generated
because of the motion conflicting with the rest of the simulation. Therefore, the overflow must be
under the perceptive motion threshold of the vestibular system.
• Platform return to the neutral position
The washout filter purpose is to bring back the platform to its neutral position when continuous
components of the input occur. However, the platform displacement to its neutral position might alter
the perceptive coherence on the simulator. If the platform is moved in the opposite direction of the
vehicle simulated motion with higher amplitude than the perceptive threshold of the vestibular
system, a sensorial incoherence between visual perception and motion perception might occur;
• Sudden changes in input acceleration:
This is a case typical of the longitudinal motion. Generally, in this driving situation, protracted
braking is generated. In the stopping manoeuvre, the acceleration goes from zero to a negative value,
while the filter allows the driver only to perceive the transitory component. In the continuous
acceleration phase, the acceleration remains negative, and the driver does not perceive any inertial
effect. However, at the end of braking, the vehicle’s simulated acceleration is characterised by a
relevant jerk, going from negative to positive. The virtual world of the simulation displays a vehicle
perfectly still, while the platform cues a negative acceleration. This situation might be perceived as
incoherent and creates unpleasant feelings in the driver.
Chapter II: Vehicle Dynamics and 2DOF Motion Platform
41
2.5. Case- Study I
The vehicle modelling is a very important part of the driving simulation studies. The longitudinal and
lateral sliding models, type of the surface, engine power and the assistant systems in the vehicle can
change the driving simulator experience and driving performances.
The case study I aimed to describe in brief the vehicle modelling used in the simulator and focused
in particular the effect of different gear change system on driving behaviour in the motion cueing
simulator. The motivation of the experiment found after observing that drivers had difficulties to use
the correct gear in the simulator. Therefore different gear shifting scenarios were developed in the
simulator to see if the various gears shifting scenario would alter the motion perception of the
participants. In addition to the manual gear shift, Sound gear shift assistant (Beep session) was
developed. A beep sound is implemented to be activated when engine rpm was more than 4800. In
this way, not only very high RPMs are avoided, but the driver was instructed to change the gear when
changing the gear. The automatic gear change is implemented, that was automatically changing the
gears so that the RPMs stay in the identified ideal range of 2000 > rpm > 4300.
The following scenarios were tested with 19 participants in the driving simulator with the driving task
involving car following and braking, 2 chicanes and one overtaking manoeuvre.
1. Manual Session: in this session, the participant is free to adopt the gearing strategy
2. Assisted Session: in this session, the sound gear shift assistant is activated;
3. Automatic Session: in this session, the participant uses the automatic gear change
2.5.1. Discussion:
Drivers were adapting their behaviour with different gear shifting system in the simulator study. The
result of the experiment did not show a significant difference by the repeated measure ANOVA
significant test between the sessions for the studied indicator, namely maximum lateral, longitudinal
acceleration or the RPM of the engine. The same adaptation might be seen when drivers using
different vehicles in the real road, meaning that despite different performance and features of the
vehicles, the drivers can control the vehicle in the road environment. The results are essential for the
authors for the validation of the simulator performance and the 2DOF motion platform.
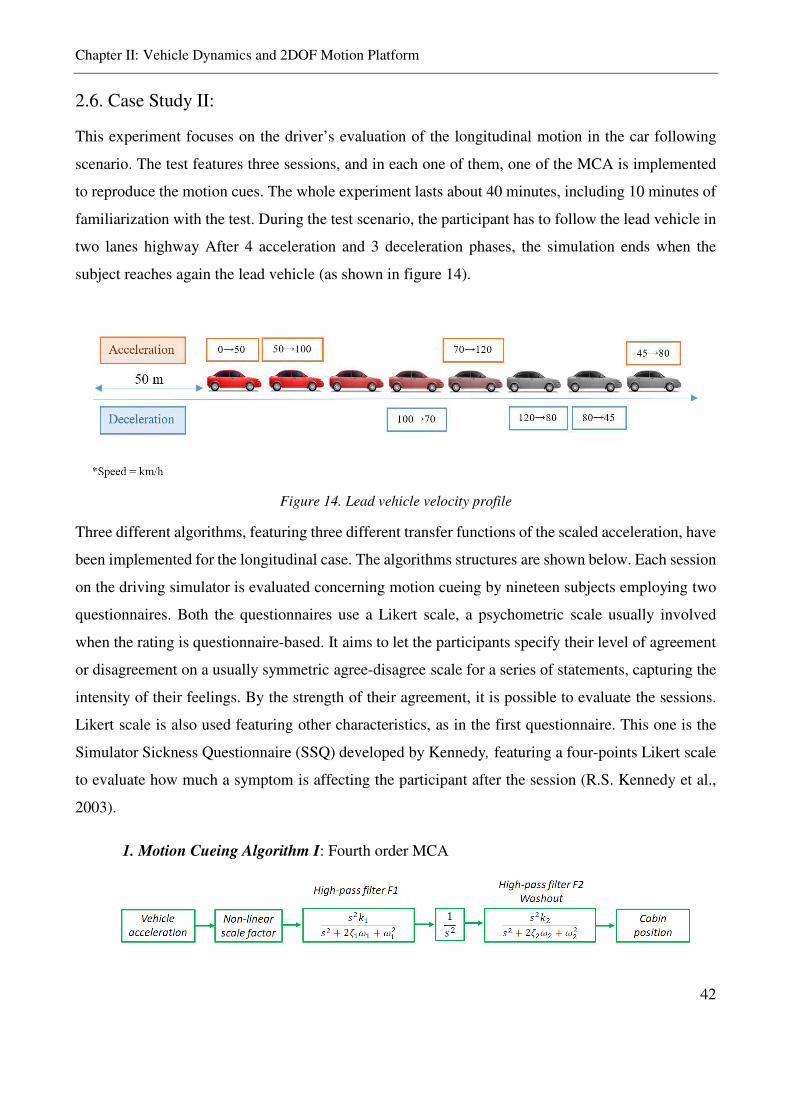
Chapter II: Vehicle Dynamics and 2DOF Motion Platform
42
2.6. Case Study II:
This experiment focuses on the driver’s evaluation of the longitudinal motion in the car following
scenario. The test features three sessions, and in each one of them, one of the MCA is implemented
to reproduce the motion cues. The whole experiment lasts about 40 minutes, including 10 minutes of
familiarization with the test. During the test scenario, the participant has to follow the lead vehicle in
two lanes highway After 4 acceleration and 3 deceleration phases, the simulation ends when the
subject reaches again the lead vehicle (as shown in figure 14).
Figure 14. Lead vehicle velocity profile
Three different algorithms, featuring three different transfer functions of the scaled acceleration, have
been implemented for the longitudinal case. The algorithms structures are shown below. Each session
on the driving simulator is evaluated concerning motion cueing by nineteen subjects employing two
questionnaires. Both the questionnaires use a Likert scale, a psychometric scale usually involved
when the rating is questionnaire-based. It aims to let the participants specify their level of agreement
or disagreement on a usually symmetric agree-disagree scale for a series of statements, capturing the
intensity of their feelings. By the strength of their agreement, it is possible to evaluate the sessions.
Likert scale is also used featuring other characteristics, as in the first questionnaire. This one is the
Simulator Sickness Questionnaire (SSQ) developed by Kennedy, featuring a four-points Likert scale
to evaluate how much a symptom is affecting the participant after the session (R.S. Kennedy et al.,
2003).
1. Motion Cueing Algorithm I: Fourth order MCA
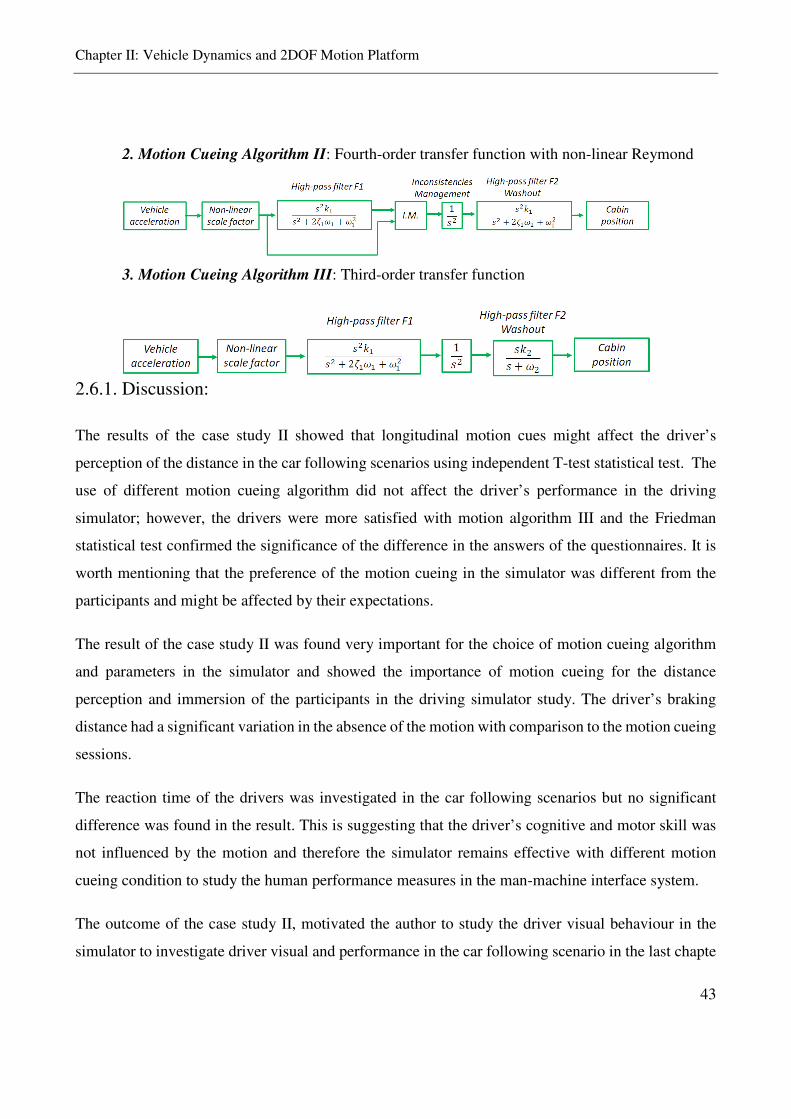
Chapter II: Vehicle Dynamics and 2DOF Motion Platform
43
2. Motion Cueing Algorithm II: Fourth-order transfer function with non-linear Reymond
3. Motion Cueing Algorithm III: Third-order transfer function
2.6.1. Discussion:
The results of the case study II showed that longitudinal motion cues might affect the driver’s
perception of the distance in the car following scenarios using independent T-test statistical test. The
use of different motion cueing algorithm did not affect the driver’s performance in the driving
simulator; however, the drivers were more satisfied with motion algorithm III and the Friedman
statistical test confirmed the significance of the difference in the answers of the questionnaires. It is
worth mentioning that the preference of the motion cueing in the simulator was different from the
participants and might be affected by their expectations.
The result of the case study II was found very important for the choice of motion cueing algorithm
and parameters in the simulator and showed the importance of motion cueing for the distance
perception and immersion of the participants in the driving simulator study. The driver’s braking
distance had a significant variation in the absence of the motion with comparison to the motion cueing
sessions.
The reaction time of the drivers was investigated in the car following scenarios but no significant
difference was found in the result. This is suggesting that the driver’s cognitive and motor skill was
not influenced by the motion and therefore the simulator remains effective with different motion
cueing condition to study the human performance measures in the man-machine interface system.
The outcome of the case study II, motivated the author to study the driver visual behaviour in the
simulator to investigate driver visual and performance in the car following scenario in the last chapte

44
Chapter III: The Integration of Human Factor in Road Safety
45
Chapter III
THE INTEGRATION OF HUMAN FACTOR IN
ROAD SAFETY USING INNOVATIVE
TECHNOLOGIES
Chapter III: The Integration of Human Factor in Road Safety
46
The Road Safety audit consists of standard safety analysis of the current state of the road infrastructure
that should carry out by experts and it includes all the states of the road project, from the impact
assessment, project level, design, pre-opening and even plan for maintenance and interventions.
However, road interventions are rather expensive and usually prioritise at locations with high accident
history.
Accidents are rare, random and multifactor events and as much important as to solve the problem in
the high accident areas, it is important to prevent them. This chapter aims to provide objective
measures that can be used in the evaluation of infrastructure safety at the operating level. The
technologies were used during the study are can provide detailed and objective measures with a
relatively low cost. An essential advantage of the presented method over the traditional method is that
the driver perspective towards the road is being investigated together with the expert point of view.
Two case studies are presented in this chapter to discuss the importance of the human factor in road
safety by experimentation. In the case study III, the classical road safety review of an urban arterial
road has been carried out and integrated with the driver observation techniques and vehicle trajectory
measurements. The innovative measurement technologies used to observe the driver behaviour (eye-
tracking) and vehicle trajectory monitoring (with extended modules) are explained in detail with the
driving performance measures that were found after the synchronization of the two instruments. The
case-study IV is the before/after the intervention of an urban road in the residential area with several
roundabouts and pedestrian crossing. The behaviour of the drivers in terms of visual fixations and the
operative speed were investigated for the studied sections.
3.1. Road infrastructure safety management approach
The road safety impact assessment is the first step of any infrastructural project. At this level, the
initial planning stage before the infrastructure shall indicate the road safety considerations which
contribute to the choice of the proposed solution providing all the relevant factor for a cost-benefit
analysis.
The road safety audit is considering road at different levels. As draft design, the geographical location
together with seasonal and climatic conditions and seismic activity is being reported in the report
together with the types of and distance between junctions, number and type of lanes, kinds of traffic
admissible to the new road, functionality of the road in the network, meteorological conditions,
Chapter III: The Integration of Human Factor in Road Safety
47
driving speeds, cross-sections, horizontal and vertical alignments, visibility, junctions layout, public
transport and infrastructures and possible road/rail level crossings. The detailed design stage
considers the layout, coherent road signs and markings, the lighting of lit roads and intersections,
roadside equipment, roadside environment, fixed obstacles at the roadside, safe parking areas,
vulnerable road users, a user-friendly adaptation of road restraint systems. Criteria for the pre-
opening stage consist of the safety of road users and visibility under different conditions such as
darkness and under normal weather for readability of road signs and markings condition of
pavements. The early operation measure is being assessed based on road safety in the light of the
actual behaviour of drivers and audits at any stage may involve the need to reconsider criteria from
previous stages.
Article 5 of the Directive 2008/96/EC of the official journal of the European Union is providing a set
of the manual for the safety ranking and management of the road network in operation. The high
accident concentration ranking and network safety rankings should carry out at least every three years
and has to meet the criteria. The network safety ranking is evaluated by expert teams using site visits
and plan for intervention considering the benefit-cost ratio. The road sign is important for situation
awareness and anticipation of events during day and night, the signs should be visible during both
day and night and set up at a safe distance from the road. Any sign system should comply with the
provision of the Vienna convention on sign and signals of 1968.
Regarding the procedure of the network analysis, the first step is the identification of the road sections
with high accident concentration should be identified taking to account at least the number of fatal
accidents per unit of the road about the volume of the traffic, or based on a number of the intersection.
The second step is the identification of the sections taking into account the potential saving in the
accident casts. For each category of road, safety relate factor such as accident concentration, traffic
volume and traffic typology should be considered.
The thirds step is the evaluation of the expert team site visits. The expert should provide a description
of the road section considering a reference of possible previous reports, the analyses of the accidents
reports, including fatalities and severely injured person and provide a set of potential remedial
measures for implementation with different timescales, as follows:
- Removing or protecting fixed roadside obstacles,
- Reducing velocity limits and intensifying enforcement
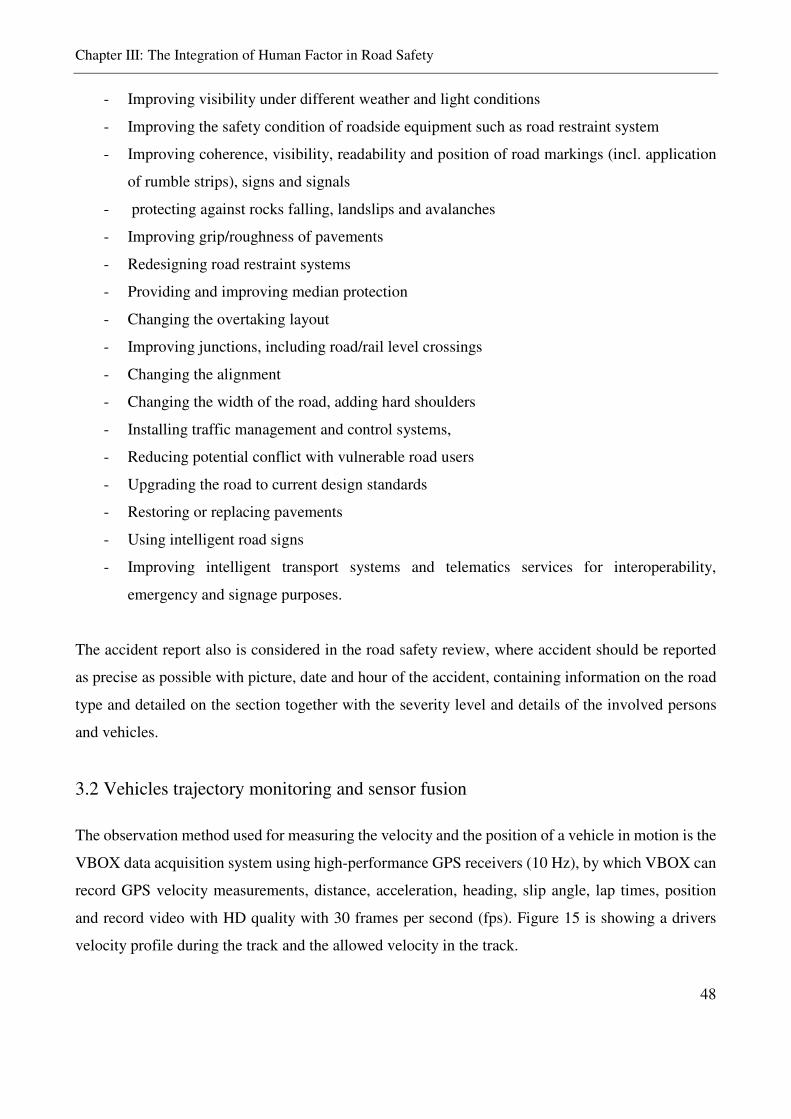
Chapter III: The Integration of Human Factor in Road Safety
48
- Improving visibility under different weather and light conditions
- Improving the safety condition of roadside equipment such as road restraint system
- Improving coherence, visibility, readability and position of road markings (incl. application
of rumble strips), signs and signals
- protecting against rocks falling, landslips and avalanches
- Improving grip/roughness of pavements
- Redesigning road restraint systems
- Providing and improving median protection
- Changing the overtaking layout
- Improving junctions, including road/rail level crossings
- Changing the alignment
- Changing the width of the road, adding hard shoulders
- Installing traffic management and control systems,
- Reducing potential conflict with vulnerable road users
- Upgrading the road to current design standards
- Restoring or replacing pavements
- Using intelligent road signs
- Improving intelligent transport systems and telematics services for interoperability,
emergency and signage purposes.
The accident report also is considered in the road safety review, where accident should be reported
as precise as possible with picture, date and hour of the accident, containing information on the road
type and detailed on the section together with the severity level and details of the involved persons
and vehicles.
3.2 Vehicles trajectory monitoring and sensor fusion
The observation method used for measuring the velocity and the position of a vehicle in motion is the
VBOX data acquisition system using high-performance GPS receivers (10 Hz), by which VBOX can
record GPS velocity measurements, distance, acceleration, heading, slip angle, lap times, position
and record video with HD quality with 30 frames per second (fps). Figure 15 is showing a drivers
velocity profile during the track and the allowed velocity in the track.
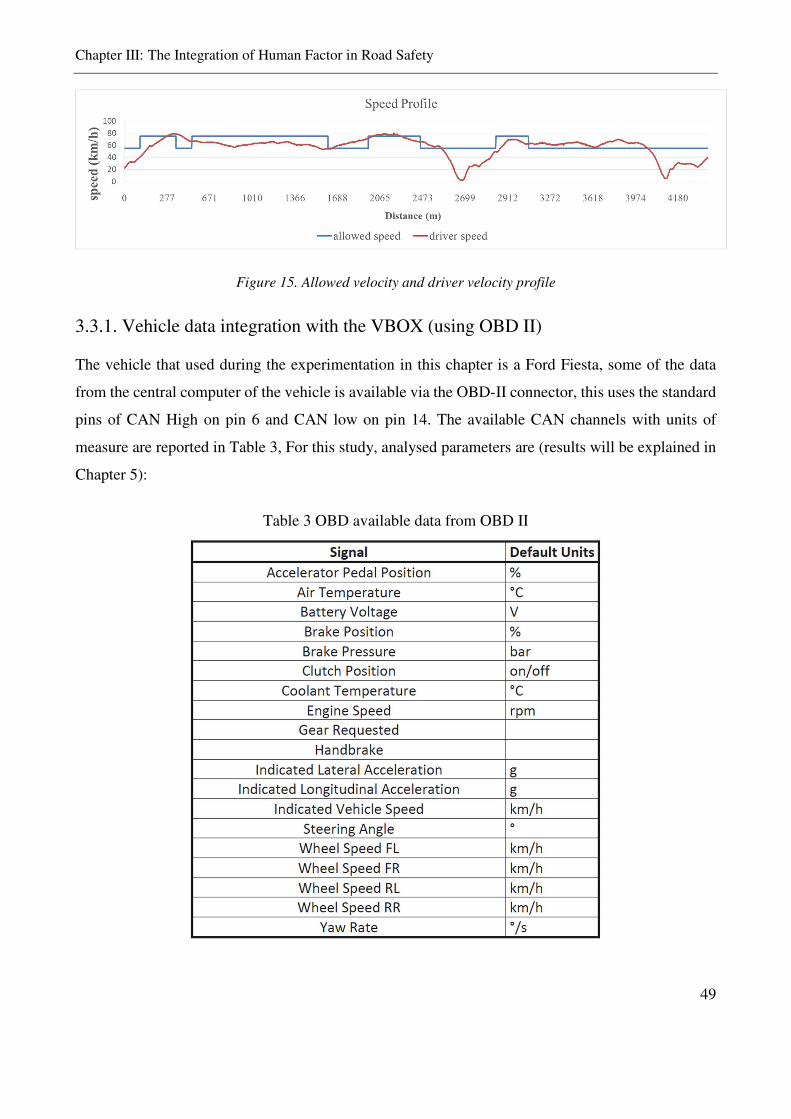
Chapter III: The Integration of Human Factor in Road Safety
49
Figure 15. Allowed velocity and driver velocity profile
3.3.1. Vehicle data integration with the VBOX (using OBD II)
The vehicle that used during the experimentation in this chapter is a Ford Fiesta, some of the data
from the central computer of the vehicle is available via the OBD-II connector, this uses the standard
pins of CAN High on pin 6 and CAN low on pin 14. The available CAN channels with units of
measure are reported in Table 3, For this study, analysed parameters are (results will be explained in
Chapter 5):
Table 3 OBD available data from OBD II
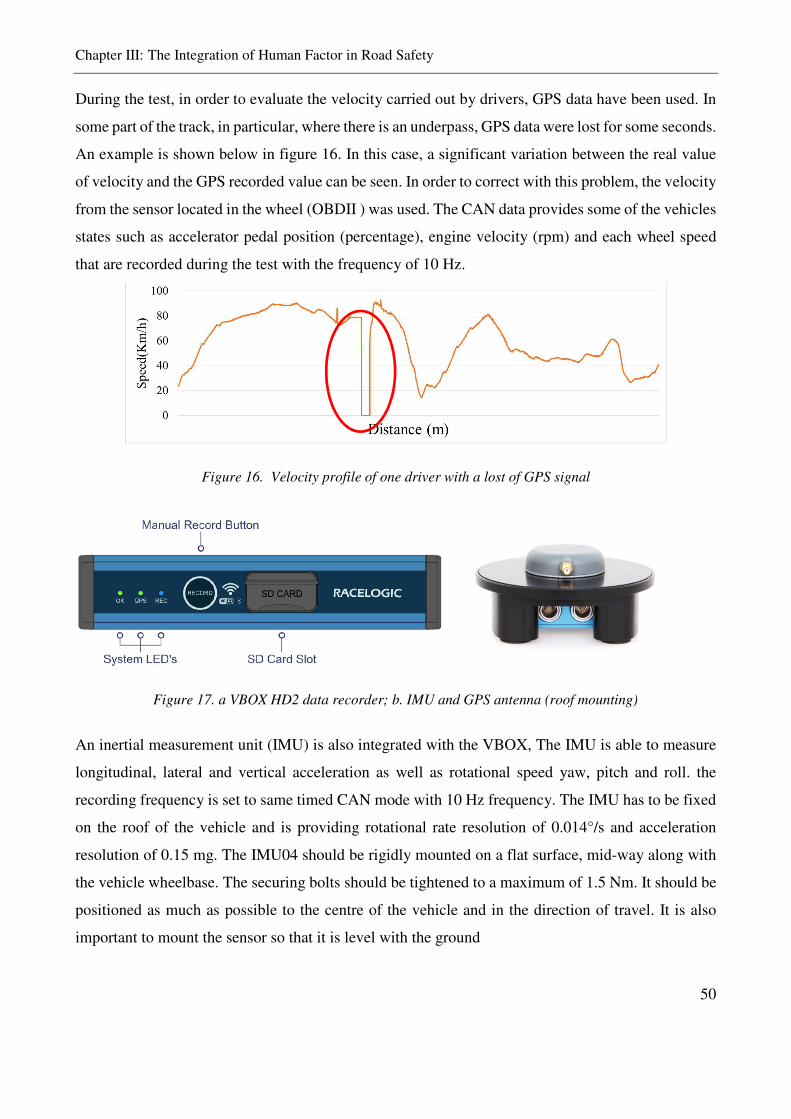
Chapter III: The Integration of Human Factor in Road Safety
50
During the test, in order to evaluate the velocity carried out by drivers, GPS data have been used. In
some part of the track, in particular, where there is an underpass, GPS data were lost for some seconds.
An example is shown below in figure 16. In this case, a significant variation between the real value
of velocity and the GPS recorded value can be seen. In order to correct with this problem, the velocity
from the sensor located in the wheel (OBDII ) was used. The CAN data provides some of the vehicles
states such as accelerator pedal position (percentage), engine velocity (rpm) and each wheel speed
that are recorded during the test with the frequency of 10 Hz.
Figure 16. Velocity profile of one driver with a lost of GPS signal
An inertial measurement unit (IMU) is also integrated with the VBOX, The IMU is able to measure
longitudinal, lateral and vertical acceleration as well as rotational speed yaw, pitch and roll. the
recording frequency is set to same timed CAN mode with 10 Hz frequency. The IMU has to be fixed
on the roof of the vehicle and is providing rotational rate resolution of 0.014°/s and acceleration
resolution of 0.15 mg. The IMU04 should be rigidly mounted on a flat surface, mid-way along with
the vehicle wheelbase. The securing bolts should be tightened to a maximum of 1.5 Nm. It should be
positioned as much as possible to the centre of the vehicle and in the direction of travel. It is also
important to mount the sensor so that it is level with the ground
Figure 17. a VBOX HD2 data recorder; b. IMU and GPS antenna (roof mounting)
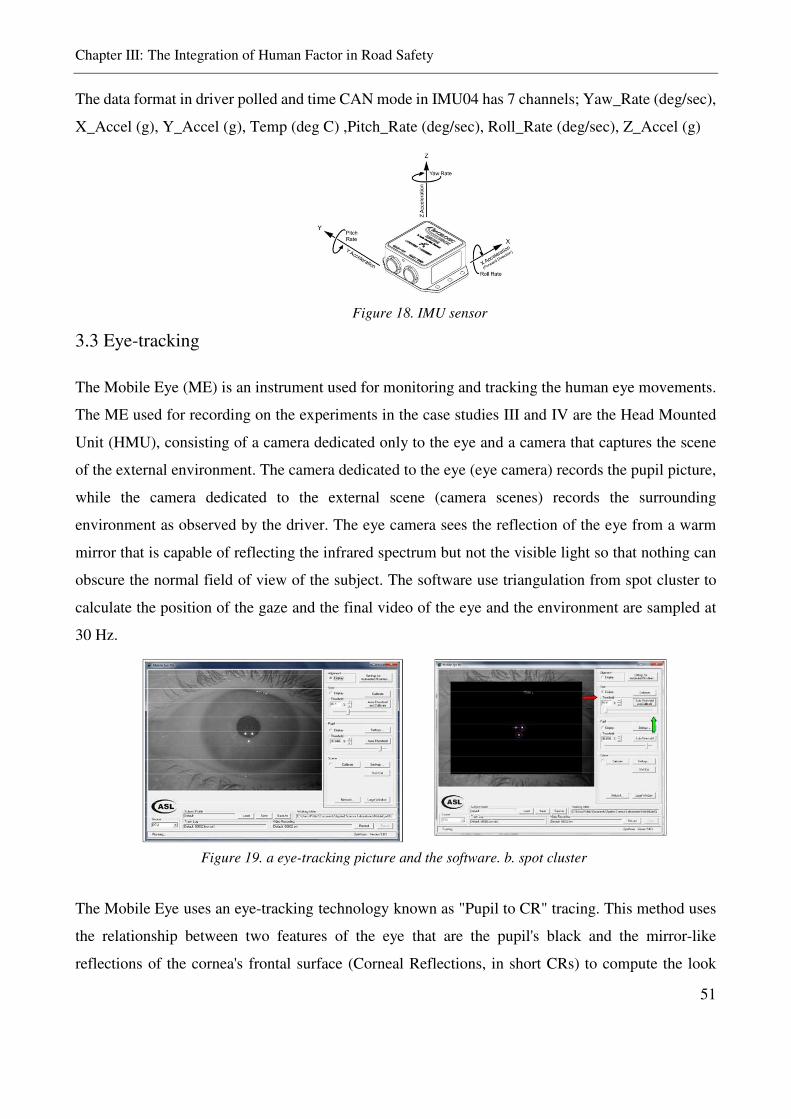
Chapter III: The Integration of Human Factor in Road Safety
51
The data format in driver polled and time CAN mode in IMU04 has 7 channels; Yaw_Rate (deg/sec),
X_Accel (g), Y_Accel (g), Temp (deg C) ,Pitch_Rate (deg/sec), Roll_Rate (deg/sec), Z_Accel (g)
Figure 18. IMU sensor
3.3 Eye-tracking
The Mobile Eye (ME) is an instrument used for monitoring and tracking the human eye movements.
The ME used for recording on the experiments in the case studies III and IV are the Head Mounted
Unit (HMU), consisting of a camera dedicated only to the eye and a camera that captures the scene
of the external environment. The camera dedicated to the eye (eye camera) records the pupil picture,
while the camera dedicated to the external scene (camera scenes) records the surrounding
environment as observed by the driver. The eye camera sees the reflection of the eye from a warm
mirror that is capable of reflecting the infrared spectrum but not the visible light so that nothing can
obscure the normal field of view of the subject. The software use triangulation from spot cluster to
calculate the position of the gaze and the final video of the eye and the environment are sampled at
30 Hz.
The Mobile Eye uses an eye-tracking technology known as "Pupil to CR" tracing. This method uses
the relationship between two features of the eye that are the pupil's black and the mirror-like
reflections of the cornea's frontal surface (Corneal Reflections, in short CRs) to compute the look
Figure 19. a eye-tracking picture and the software. b. spot cluster
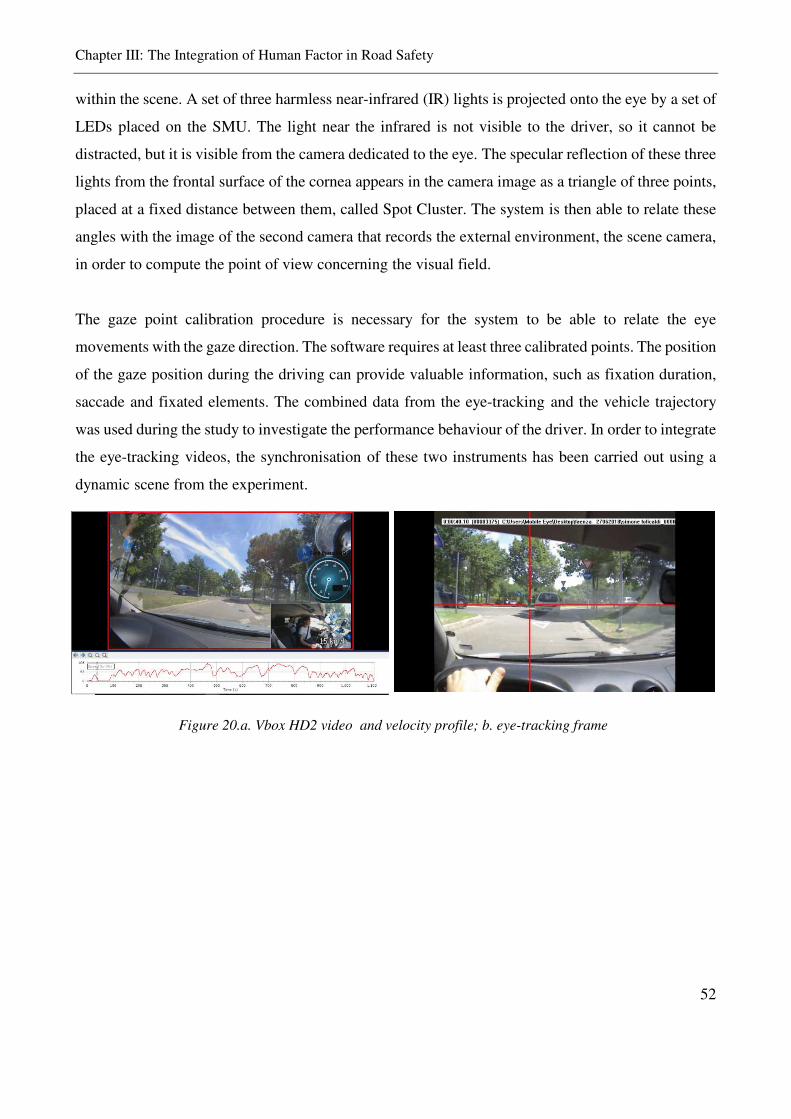
Chapter III: The Integration of Human Factor in Road Safety
52
within the scene. A set of three harmless near-infrared (IR) lights is projected onto the eye by a set of
LEDs placed on the SMU. The light near the infrared is not visible to the driver, so it cannot be
distracted, but it is visible from the camera dedicated to the eye. The specular reflection of these three
lights from the frontal surface of the cornea appears in the camera image as a triangle of three points,
placed at a fixed distance between them, called Spot Cluster. The system is then able to relate these
angles with the image of the second camera that records the external environment, the scene camera,
in order to compute the point of view concerning the visual field.
The gaze point calibration procedure is necessary for the system to be able to relate the eye
movements with the gaze direction. The software requires at least three calibrated points. The position
of the gaze position during the driving can provide valuable information, such as fixation duration,
saccade and fixated elements. The combined data from the eye-tracking and the vehicle trajectory
was used during the study to investigate the performance behaviour of the driver. In order to integrate
the eye-tracking videos, the synchronisation of these two instruments has been carried out using a
dynamic scene from the experiment.
Figure 20.a. Vbox HD2 video and velocity profile; b. eye-tracking frame
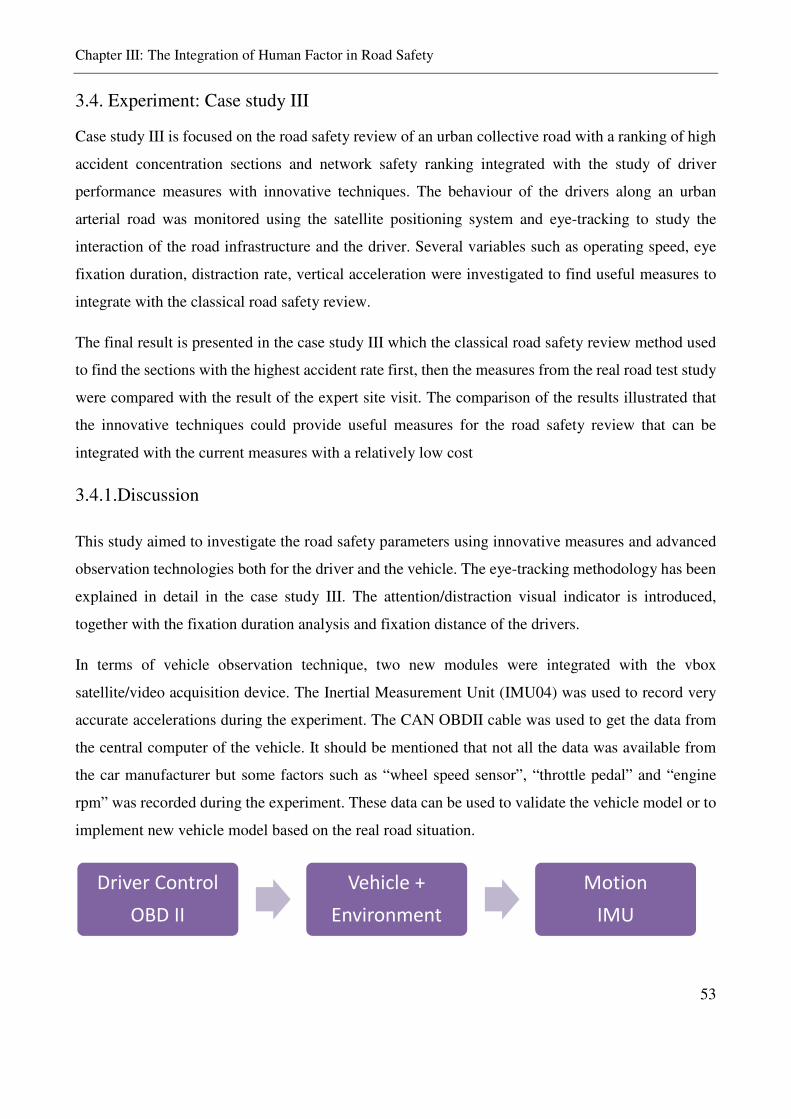
Chapter III: The Integration of Human Factor in Road Safety
53
3.4. Experiment: Case study III
Case study III is focused on the road safety review of an urban collective road with a ranking of high
accident concentration sections and network safety ranking integrated with the study of driver
performance measures with innovative techniques. The behaviour of the drivers along an urban
arterial road was monitored using the satellite positioning system and eye-tracking to study the
interaction of the road infrastructure and the driver. Several variables such as operating speed, eye
fixation duration, distraction rate, vertical acceleration were investigated to find useful measures to
integrate with the classical road safety review.
The final result is presented in the case study III which the classical road safety review method used
to find the sections with the highest accident rate first, then the measures from the real road test study
were compared with the result of the expert site visit. The comparison of the results illustrated that
the innovative techniques could provide useful measures for the road safety review that can be
integrated with the current measures with a relatively low cost
3.4.1.Discussion
This study aimed to investigate the road safety parameters using innovative measures and advanced
observation technologies both for the driver and the vehicle. The eye-tracking methodology has been
explained in detail in the case study III. The attention/distraction visual indicator is introduced,
together with the fixation duration analysis and fixation distance of the drivers.
In terms of vehicle observation technique, two new modules were integrated with the vbox
satellite/video acquisition device. The Inertial Measurement Unit (IMU04) was used to record very
accurate accelerations during the experiment. The CAN OBDII cable was used to get the data from
the central computer of the vehicle. It should be mentioned that not all the data was available from
the car manufacturer but some factors such as “wheel speed sensor”, “throttle pedal” and “engine
rpm” was recorded during the experiment. These data can be used to validate the vehicle model or to
implement new vehicle model based on the real road situation.
Driver Control
OBD II
Vehicle +
Environment
Motion
IMU
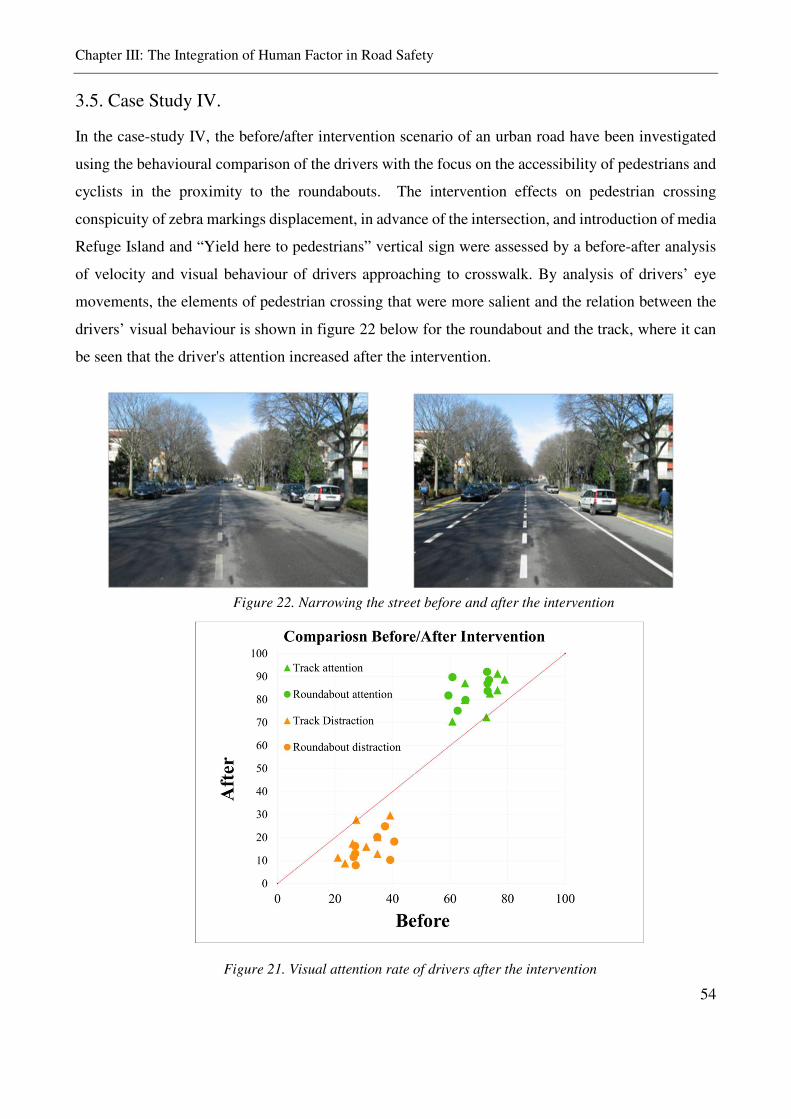
Chapter III: The Integration of Human Factor in Road Safety
54
3.5. Case Study IV.
In the case-study IV, the before/after intervention scenario of an urban road have been investigated
using the behavioural comparison of the drivers with the focus on the accessibility of pedestrians and
cyclists in the proximity to the roundabouts. The intervention effects on pedestrian crossing
conspicuity of zebra markings displacement, in advance of the intersection, and introduction of media
Refuge Island and “Yield here to pedestrians” vertical sign were assessed by a before-after analysis
of velocity and visual behaviour of drivers approaching to crosswalk. By analysis of drivers’ eye
movements, the elements of pedestrian crossing that were more salient and the relation between the
drivers’ visual behaviour is shown in figure 22 below for the roundabout and the track, where it can
be seen that the driver's attention increased after the intervention.
Figure 22. Narrowing the street before and after the intervention
Figure 21. Visual attention rate of drivers after the intervention
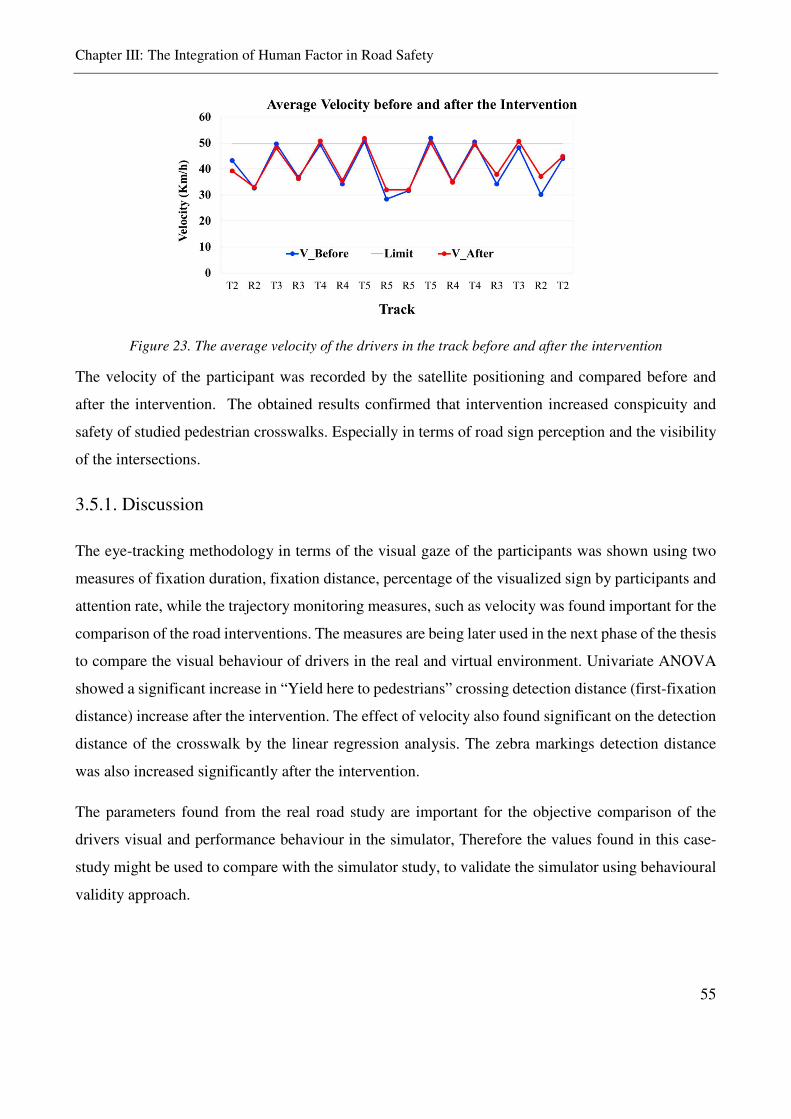
Chapter III: The Integration of Human Factor in Road Safety
55
Figure 23. The average velocity of the drivers in the track before and after the intervention
The velocity of the participant was recorded by the satellite positioning and compared before and
after the intervention. The obtained results confirmed that intervention increased conspicuity and
safety of studied pedestrian crosswalks. Especially in terms of road sign perception and the visibility
of the intersections.
3.5.1. Discussion
The eye-tracking methodology in terms of the visual gaze of the participants was shown using two
measures of fixation duration, fixation distance, percentage of the visualized sign by participants and
attention rate, while the trajectory monitoring measures, such as velocity was found important for the
comparison of the road interventions. The measures are being later used in the next phase of the thesis
to compare the visual behaviour of drivers in the real and virtual environment. Univariate ANOVA
showed a significant increase in “Yield here to pedestrians” crossing detection distance (first-fixation
distance) increase after the intervention. The effect of velocity also found significant on the detection
distance of the crosswalk by the linear regression analysis. The zebra markings detection distance
was also increased significantly after the intervention.
The parameters found from the real road study are important for the objective comparison of the
drivers visual and performance behaviour in the simulator, Therefore the values found in this case-
study might be used to compare with the simulator study, to validate the simulator using behavioural
validity approach.

56

Chapter IV: Vulnerable User Safety at Crossing
57
Chapter IV
INVESTIGATING VULNERABLE USER
SAFETY AT CROSSING USING SURROGATE
MEASURES
Chapter IV: Vulnerable User Safety at Crossing
58
4.1. Introduction
Providing vulnerable user’s safety and maintaining a desirable level of service for vehicles is a
challenging objective for transportation and road safety engineers. In this chapter, we will focus on
the two studies carried out in order to increase the safety of the vulnerable (pedestrians and cyclist).
The case studies are focused on the effect of crossing geometry and sign systems, on the driver
behaviour when approaching an un-signalized crossing.
According to Italian road accident and fatalities, about 50% of the road fatalities are related to
vulnerable road users (pedestrians, bicycles, mopeds, and motorcycles). Pedestrians are the most
vulnerable road users with the highest mortality and severe injury index. 75% of fatal or serious
cyclist accidents occur in urban areas in the UK involved collision at or near a road junction in the
UK. Several road safety actions intended at decreasing the driver’s velocity while approaching un-
signalized crosswalks have been evaluated with a consistent result.
4.2. Crossing Elements
Drivers failing to yield for pedestrians at crosswalks are a common cause of crashes. Among injured
pedestrians in traffic in Norway, 23% are killed at un-signalized crosswalks, and 37% in darkness
(Hesjevoll, 2016), where motorist fails to yield for a pedestrian in a situation where a driver looked
but failed to see the pedestrian. These circumstances happen when a motorist does not expect
pedestrians when the motorist is distracted or when it is not easy to observe the pedestrian from the
surroundings (White et al., 2010). The eye-movement recording is currently one of the most useful
techniques that permit an objective quantitative estimate of conspicuity. Many countermeasures tried
at changing the drivers’ velocity behaviour while approaching un-signalized crosswalks have been
studied in the literature. Some of the applied driver-oriented countermeasures
1) Median refuge island: enhance the perceptibility of the crossing;
2) Advanced yield lines, enhance the perceptibility of the crosswalks;
3) Replacement of parking: clear the line of sight to approach vehicles;
4) Placing of curb extensions: improve perceptibility;
5) Installation of pedestrian crossing sign: inform drivers
6) Installation of in-pavement warning lights: warn drivers.
In a complicated street environment, like collector paths, that is hard to have a significant velocity
decrease with a single approach. It is usually required a mixture of various diverse countermeasures
Chapter IV: Vulnerable User Safety at Crossing
59
planned to work several goals. Median Refuge Island decreases traffic because it narrows the road
eliminating long and wide straight sections, and it warns drivers that pedestrians could be crossing
the path. Besides, it contributes a valuable space to pedestrians that can stay on the island and can
divide the crossing into two steps per traffic route. These self-explaining and can produce the visual
impression that the road is not designed for high-speed traffic.
Advanced yield markings consist of a group of triangular pavement signings that located over the
travel lane within 6 and 15 meters in advance of the zebra crossing. A ‘‘Yield to pedestrians” vertical
sign also should place at the location of the markings. Numerous investigations have shown the
effectiveness of this strategy the driver yielding distance to pedestrians was reduced, decreasing the
number of conflicts and improving the number of drivers that yield.
Curb extension is an enlargement of the side of the footpath and usually built along with ways that
provided with parking areas on the path side. The curb enlarges up to the line that divides the way
from parking places on the side of the roadway. The consequences that are supposed from the safety
countermeasure as mentioned earlier to decrease the approaching vehicles, decreasing the pedestrian
vulnerability and enhancing pedestrian perceptibility. Numerous practices proved their effectiveness
in terms of both vehicles operating speed decrease and increase in the number of motorists that yielded
to pedestrians. A study on the curb extension was a countermeasure that influenced suitable driver’s
speed action and the drivers were more ready to yield and that the perceptibility of the pedestrian
increased.
LED flashers can be used to alert drivers of the crosswalk. Numerous practices determined their
effectiveness in terms of operating speed decrease of the vehicle. The emplacement of the flashing
lamp at the un-signalized crosswalk was found significantly useful. The result showed driver yielding
rate at baseline was 18.2% and after placing of the flashing lamps on the vertical sign, yielding
behaviour increased to 81.2%.
In-pavement lights aim to produce a useful warning to motorists that a pedestrian is present in the
nearness of a crosswalk and are principally worthy at night during the lights are most visible.
Researchers studied the combination of a median refuge island and the installation of a ‘‘Yield here
to pedestrians” flashing vertical sign. This intervention on collector roads characterised by low cost,
simple installation and they suggested that it could be of high possible effectiveness on motorist
behaviour (Vignali et al., 2018)
Chapter IV: Vulnerable User Safety at Crossing
60
4.3. Surrogate Measures
Road safety engineers were traditionally been using crash data statistic to evaluate and rank road
safety. However, crash-based safety analysis is hampered by several shortcomings, such as
randomness and rarity of crash occurrences, lack of timeliness, and inconsistency in crash reporting
(lack of details, driver crash avoidance behaviour). The accidents are rare events and are associated
with random variation inherent in a small number. Crash data of few weeks or months are insufficient
for analysis and it needs at some years of the waiting period
Furthermore, the use of crash records for safety analysis is a reactive approach. The number of crashes
needs to be recorded with a significant waiting period before an action can be taken. This also reduces
the ability to examine the safety effects of a recently implemented safety countermeasure. Because
of these issues, road safety researchers have been looking for alternative approaches to estimate safety
without the need to rely on historical crash data.
The alternative for transport safety applications is the observable non-crash traffic events that are
physically related in a predictable way and correspond to a crash frequency or severity. A conflict is
defined as “an observable situation in which two or more road users approach each other in time and
space to such an extent that there is a risk of collision if their movements remain unchanged
Time to Collision is the expected time for two vehicles to collide if they remain at their present speed
and on the same path. This surrogate measure is used to evaluate collision risk of rear-end collisions
(when one vehicle’s front strikes another vehicle travelling in the same direction as the striking
vehicle). Generally, the actual TTC-value used represents the minimum Time-to-collision recorded
during the entire interactive process of the critical safety event, rather than the value recorded at the
time evasive action is first taken as in the traffic conflict technique. The definition of TTC implies
that the reaction time of the road-user is also considered, which in some cases may be important about
the intention and purpose of the safety study.
The severity of a particular TTC-event is implicitly represented by the time-value derived from
measures of velocity and distance. This implies that all minimum TTC-values, for example, 1 second,
have an equal level of severity, regardless of the velocity used in the calculation. The TTC-concept,
therefore, be less useful as a comparative measure of conflict severity. To overcome this problem, an
additional severity structure, such as the required braking rate measure, can be usefully applied.
TTC is the instantaneous ratio of range to range rate. Fig 25 shows a schematic of the vehicle stopped
rear-end collision. When the driver applies the brakes to avoid a collision, the vehicle is travelling at
a velocity of V1,0 and is a distance of L0 from the stopped the struck vehicle. Because the struck
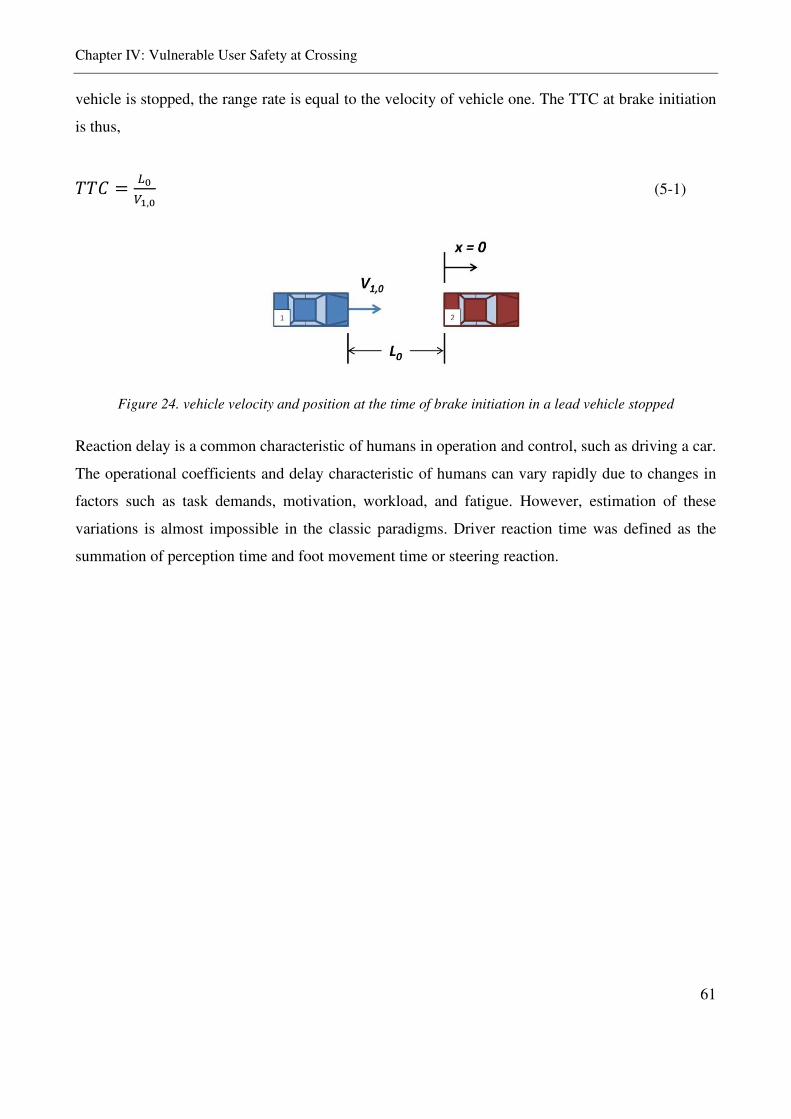
Chapter IV: Vulnerable User Safety at Crossing
61
vehicle is stopped, the range rate is equal to the velocity of vehicle one. The TTC at brake initiation
is thus,
P = c~, (5-1)
Figure 24. vehicle velocity and position at the time of brake initiation in a lead vehicle stopped
Reaction delay is a common characteristic of humans in operation and control, such as driving a car.
The operational coefficients and delay characteristic of humans can vary rapidly due to changes in
factors such as task demands, motivation, workload, and fatigue. However, estimation of these
variations is almost impossible in the classic paradigms. Driver reaction time was defined as the
summation of perception time and foot movement time or steering reaction.
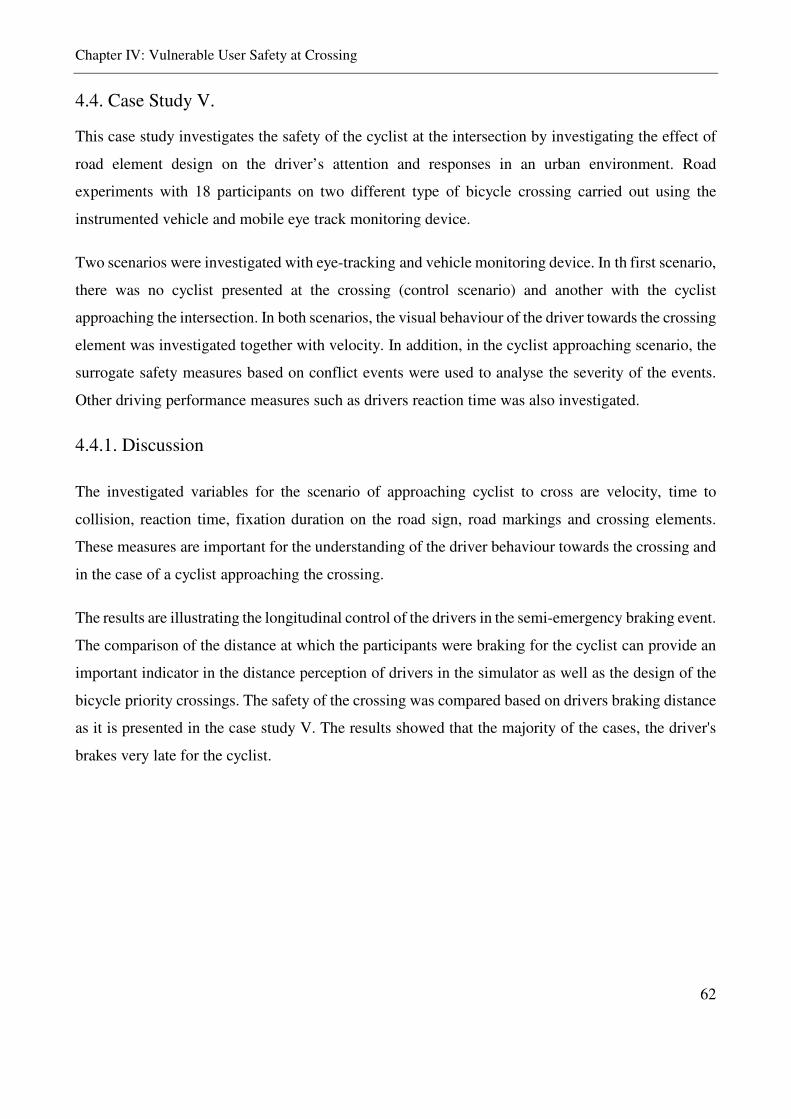
Chapter IV: Vulnerable User Safety at Crossing
62
4.4. Case Study V.
This case study investigates the safety of the cyclist at the intersection by investigating the effect of
road element design on the driver’s attention and responses in an urban environment. Road
experiments with 18 participants on two different type of bicycle crossing carried out using the
instrumented vehicle and mobile eye track monitoring device.
Two scenarios were investigated with eye-tracking and vehicle monitoring device. In th first scenario,
there was no cyclist presented at the crossing (control scenario) and another with the cyclist
approaching the intersection. In both scenarios, the visual behaviour of the driver towards the crossing
element was investigated together with velocity. In addition, in the cyclist approaching scenario, the
surrogate safety measures based on conflict events were used to analyse the severity of the events.
Other driving performance measures such as drivers reaction time was also investigated.
4.4.1. Discussion
The investigated variables for the scenario of approaching cyclist to cross are velocity, time to
collision, reaction time, fixation duration on the road sign, road markings and crossing elements.
These measures are important for the understanding of the driver behaviour towards the crossing and
in the case of a cyclist approaching the crossing.
The results are illustrating the longitudinal control of the drivers in the semi-emergency braking event.
The comparison of the distance at which the participants were braking for the cyclist can provide an
important indicator in the distance perception of drivers in the simulator as well as the design of the
bicycle priority crossings. The safety of the crossing was compared based on drivers braking distance
as it is presented in the case study V. The results showed that the majority of the cases, the driver's
brakes very late for the cyclist.
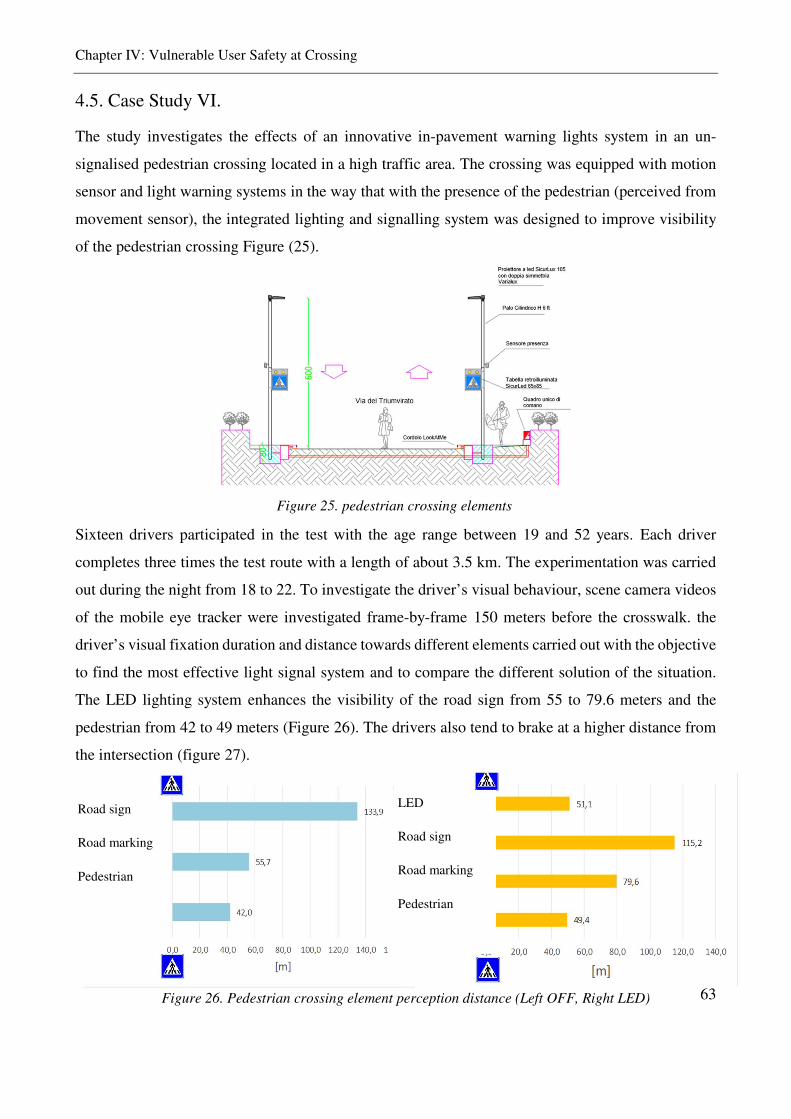
Chapter IV: Vulnerable User Safety at Crossing
63
4.5. Case Study VI.
The study investigates the effects of an innovative in-pavement warning lights system in an un-
signalised pedestrian crossing located in a high traffic area. The crossing was equipped with motion
sensor and light warning systems in the way that with the presence of the pedestrian (perceived from
movement sensor), the integrated lighting and signalling system was designed to improve visibility
of the pedestrian crossing Figure (25).
Sixteen drivers participated in the test with the age range between 19 and 52 years. Each driver
completes three times the test route with a length of about 3.5 km. The experimentation was carried
out during the night from 18 to 22. To investigate the driver’s visual behaviour, scene camera videos
of the mobile eye tracker were investigated frame-by-frame 150 meters before the crosswalk. the
driver’s visual fixation duration and distance towards different elements carried out with the objective
to find the most effective light signal system and to compare the different solution of the situation.
The LED lighting system enhances the visibility of the road sign from 55 to 79.6 meters and the
pedestrian from 42 to 49 meters (Figure 26). The drivers also tend to brake at a higher distance from
the intersection (figure 27).
Figure 25. pedestrian crossing elements
Figure 26. Pedestrian crossing element perception distance (Left OFF, Right LED)
Road sign
Road marking
Pedestrian
LED
Road sign
Road marking
Pedestrian
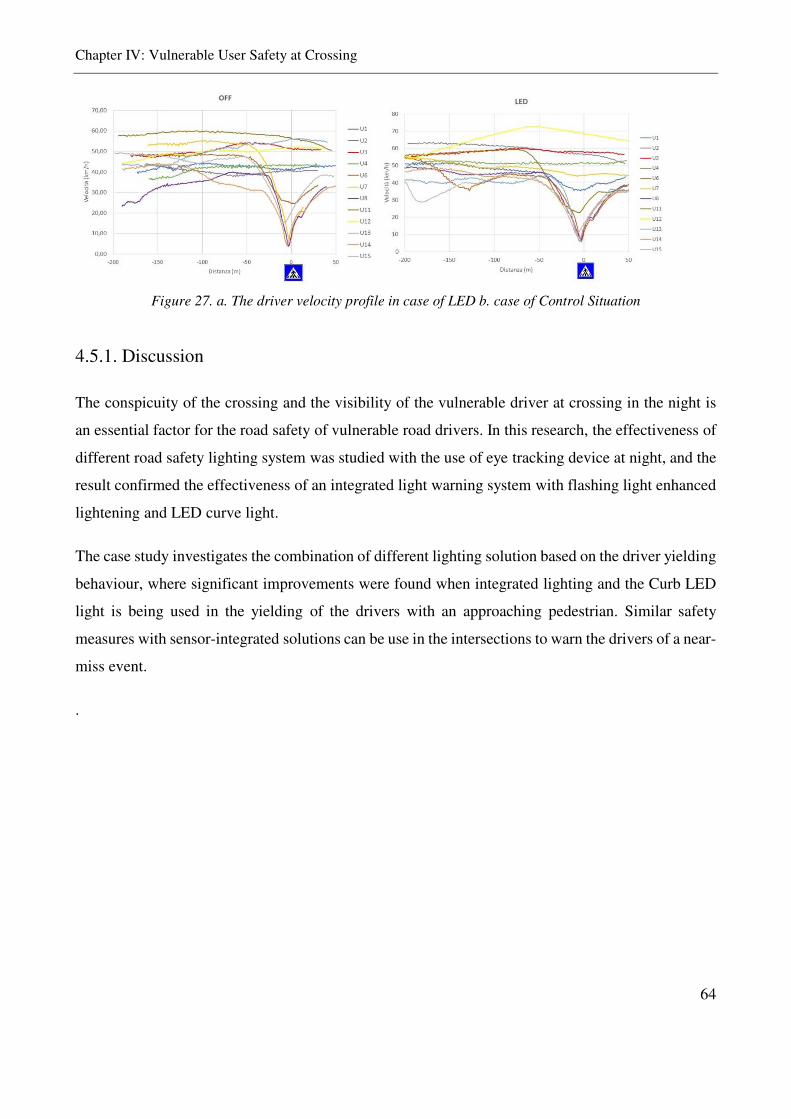
Chapter IV: Vulnerable User Safety at Crossing
64
Figure 27. a. The driver velocity profile in case of LED b. case of Control Situation
4.5.1. Discussion
The conspicuity of the crossing and the visibility of the vulnerable driver at crossing in the night is
an essential factor for the road safety of vulnerable road drivers. In this research, the effectiveness of
different road safety lighting system was studied with the use of eye tracking device at night, and the
result confirmed the effectiveness of an integrated light warning system with flashing light enhanced
lightening and LED curve light.
The case study investigates the combination of different lighting solution based on the driver yielding
behaviour, where significant improvements were found when integrated lighting and the Curb LED
light is being used in the yielding of the drivers with an approaching pedestrian. Similar safety
measures with sensor-integrated solutions can be use in the intersections to warn the drivers of a near-
miss event.
.
Chapter V: Adaptive Cruise Control and Driver Behaviour
65
CHAPTER V
INVESTIGATING THE EFFECT OF ADAPTIVE
CRUISE CONTROL (ACC) ON DRIVER
BEHAVIOUR
Chapter V: Adaptive Cruise Control and Driver Behaviour
66
5.1. Advanced driver assistance system (ADAS)
Advanced driver assistance system (ADAS) is designed to support drivers by reducing the risks of
involving in a crash situation. These systems are able to detect and interpret the vehicle-surrounding
environment through various Lidar, radar, sensors, cameras and can be integrated through
communication system other with vehicles (V2V), Infrastructure (V2I) or other information systems
available (V2X).
The main types of Advanced Driver Assistance Systems are Lane control, velocity regulation system
and visibility improvement system. The Lane control (or Lane-keeping) alerts the driver if the vehicle
approaches or crosses the road lanes. These systems are useful for preventing wrong manoeuvres
caused by fatigue or distraction. The main available types of system are Lane Departure Warning
(LDW) and Lane-Keeping Assist (LKA). LDW is only a warning system and requires the driver to
take corrective action, but LKA generates a corrective manoeuvre that returns the car between the
lanes
Speed regulation systems help the driver to adjust the velocity of the vehicle according to road and
traffic conditions. The Intelligent Velocity Assistance, Collision Avoidance systems and adaptive
cruise control (ACC) are the most frequently used systems in the vehicles. Intelligent Speed
Assistance helps the driver contain velocity within the specified limits of the road by giving the alarm
to the driver in case of speeding. Collision avoidance systems avoid the crash by anticipating the
critical situations, first by alerting the driver; secondly, they reduce the impact of unavoidable
accidents by decreasing the velocity of the collision. Their operation depends on the sensors that are
able to identify obstacles in front of the vehicle The use of ACC and LKA system can significantly
decrease the driver performance errors. One year study of drivers using the driving assistant systems
showed that the velocity-related performance error is significantly fewer than when driving under a
similar condition without the driving assistant system (Dunn et al, 2019).
The Adaptive Cruise Control (ACC) system measures the distance with the front vehicle along the
driving path and adjusts the velocity by adjusting the engine torque and brakes in order to follow the
road and other traffic vehicles with the safe distance. The ACC, while maintaining the velocity set by
the driver is able to adapt the velocity to traffic, by accelerating or decelerating automatically. The
system monitors in front of the vehicle to ensure compliance with the safety distance. This distance
can be adjusted to the preference of the drivers.
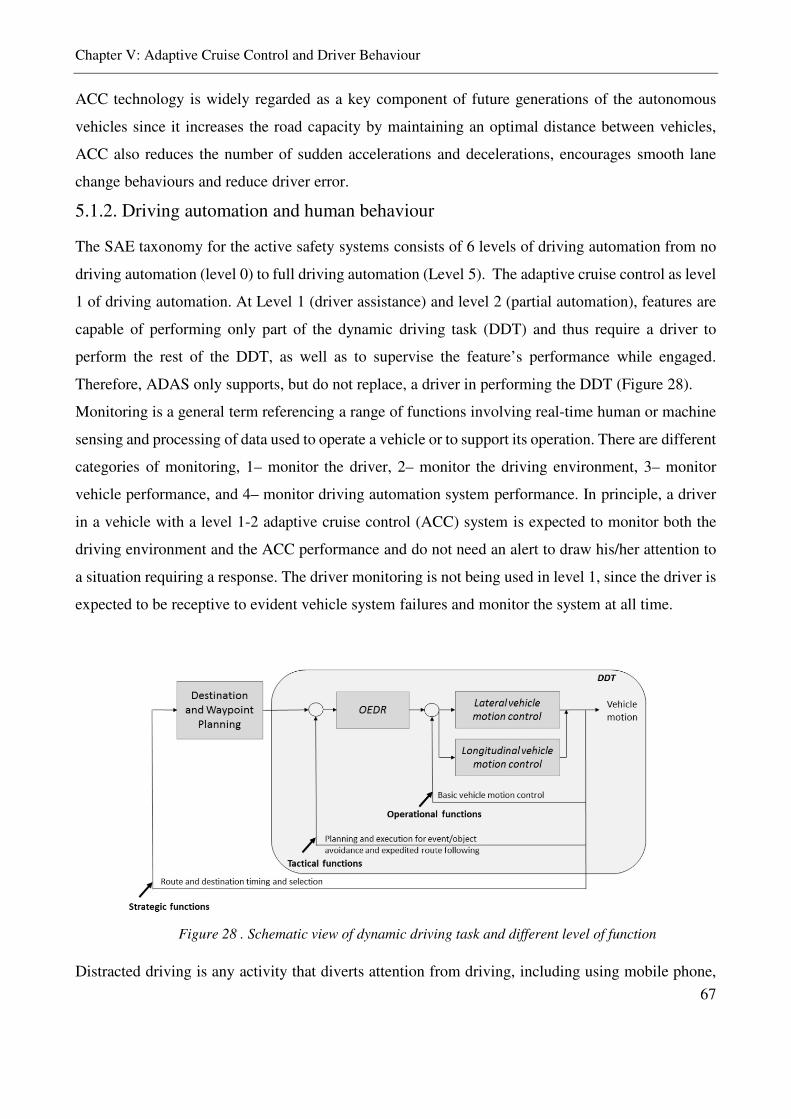
Chapter V: Adaptive Cruise Control and Driver Behaviour
67
ACC technology is widely regarded as a key component of future generations of the autonomous
vehicles since it increases the road capacity by maintaining an optimal distance between vehicles,
ACC also reduces the number of sudden accelerations and decelerations, encourages smooth lane
change behaviours and reduce driver error.
5.1.2. Driving automation and human behaviour
The SAE taxonomy for the active safety systems consists of 6 levels of driving automation from no
driving automation (level 0) to full driving automation (Level 5). The adaptive cruise control as level
1 of driving automation. At Level 1 (driver assistance) and level 2 (partial automation), features are
capable of performing only part of the dynamic driving task (DDT) and thus require a driver to
perform the rest of the DDT, as well as to supervise the feature’s performance while engaged.
Therefore, ADAS only supports, but do not replace, a driver in performing the DDT (Figure 28).
Monitoring is a general term referencing a range of functions involving real-time human or machine
sensing and processing of data used to operate a vehicle or to support its operation. There are different
categories of monitoring, 1– monitor the driver, 2– monitor the driving environment, 3– monitor
vehicle performance, and 4– monitor driving automation system performance. In principle, a driver
in a vehicle with a level 1-2 adaptive cruise control (ACC) system is expected to monitor both the
driving environment and the ACC performance and do not need an alert to draw his/her attention to
a situation requiring a response. The driver monitoring is not being used in level 1, since the driver is
expected to be receptive to evident vehicle system failures and monitor the system at all time.
Distracted driving is any activity that diverts attention from driving, including using mobile phone,
Figure 28 . Schematic view of dynamic driving task and different level of function
Chapter V: Adaptive Cruise Control and Driver Behaviour
68
eating and drinking, stereo or navigation system. Therefore, anything that takes your attention away
from the task of safe driving. In 2016, there were 3,450 people killed in motor vehicle crashes
involving distracted drivers on U.S roads and 562 no occupants (pedestrian, cyclists, etc.) killed in
distraction-affected crashes (NHTSA 2016).
There are different forms of distractions while driving; 1- The visual distraction happens when the
driver's eyes are off the road, such as looking at a cell phone. 2- Physical that takes the driver's hands
off of the wheel, such as sending a text message, navigating a GPS, or surfing the internet. 3-Auditory
distraction occurs when the driver is distracted by ringing of the phone or talking with passenger 4-
Mental (cognitive) that happens when two mental tasks performed at the same time, such as a
telephone while driving.
A conventional driver (level 0) verifies that an engaged ACC system is maintaining an appropriate
gap while following a preceding vehicle. The drivers’ dependence on the ADAS system might induce
negative adaptation behaviour, such as reduced control over the vehicle and reduction of attention on
the road during driving with ACC.
Recent studies on the drivers behaviour with one year use of advance driving assistant system showed
that the simultaneous use of ACC and LKA systems was associated with a 50% increase in the odds
of engaging in any form of secondary task (distracted driving) and an 80% increase in the odds of
engaging in visual and/or manual secondary tasks, compared with when the same drivers who were
not using the automated system. Drivers using both systems simultaneously also took more frequent
and longer glances at non-driving-related tasks and spent less time with their eyes on driving-related
tasks (Dunnet al, 2019).
Potentially, the introduction of driving assistant systems could lead to situations in which the attention
of drivers is diverted from on-road traffic to a secondary task that can distract the attention on the
dynamic driving task. As a result, drivers may be less receptive and show more delay to reach the
event. Therefore, the impacts on the safety of these technologies often do not meet the expected
benefits because the driver's behaviours change with the use of the system. The adaptation of the
drivers to the system needs to take into consideration by various factors such as the role of secondary
driving tasks, acceptance and over-trust.
The possibility of engagement in a second activity can have critical consequences for performing the
dynamic driving task, as it could result in high workload or inability to divide attention between the
tasks performed. Drivers spent more time looking ahead and spent less time searching for peripheral
Chapter V: Adaptive Cruise Control and Driver Behaviour
69
areas. The relationship between human errors and driving performance impairment due to a high
mental workload has been widely investigated by researchers. The driving assistant/automated
solutions to support drivers need to adapt the automation intervention depending on the driver’s
mental status, i.e., mental workload, to keep him/her always “in the loop” (Flumeri et al. 2019).
Another important driver performance indicator that is focused by various researchers in automotive
is the reaction delay and receptiveness of the driver. It has great importance also in road design, for
placing the signals according to the minimum manoeuvring distances required for visibility and
stopping the vehicle. A simulator stud on the ACC failure also showed that when driving with ACC,
the drivers perceived and reacted more slowly to sudden velocity reduction by a preceding car (Park,
2006).
5.2. Methodology
It is argued that driving automation does not necessarily mitigate difficult situations, and
paradoxically that automation can sometimes even make such situations more difficult for the human
operator because of decrease in situation awareness, overreliance on or no confidence in the system.
In the ADAS systems, the driver is still required to monitor that the automated tasks (ACC) are carried
out effectively by the system. However, humans have limited ability in monitoring that should be also
addressed.
The objective of this study is to investigate the effect of ACC on driver Performance, visual
distraction, reaction and workload during the use of level 1 driving automation for the adaptive cruise
control (ACC) system. Two experimentations carried out with drivers in the highway environment,
where the ACC is being used. The first experiment is an On-road ACC scenario with an instrumented
vehicle and driver monitoring devices. The resulting data from the real road test used to simulate
traffic, braking event and the ACC system. The second experiment carried out by a different group
of drivers in the laboratory condition using a 2DOF motion cueing driving simulator. The simulation
of the ACC and the braking events in a driving simulator used to study the effect of ACC on driver
visual behaviour and performance.
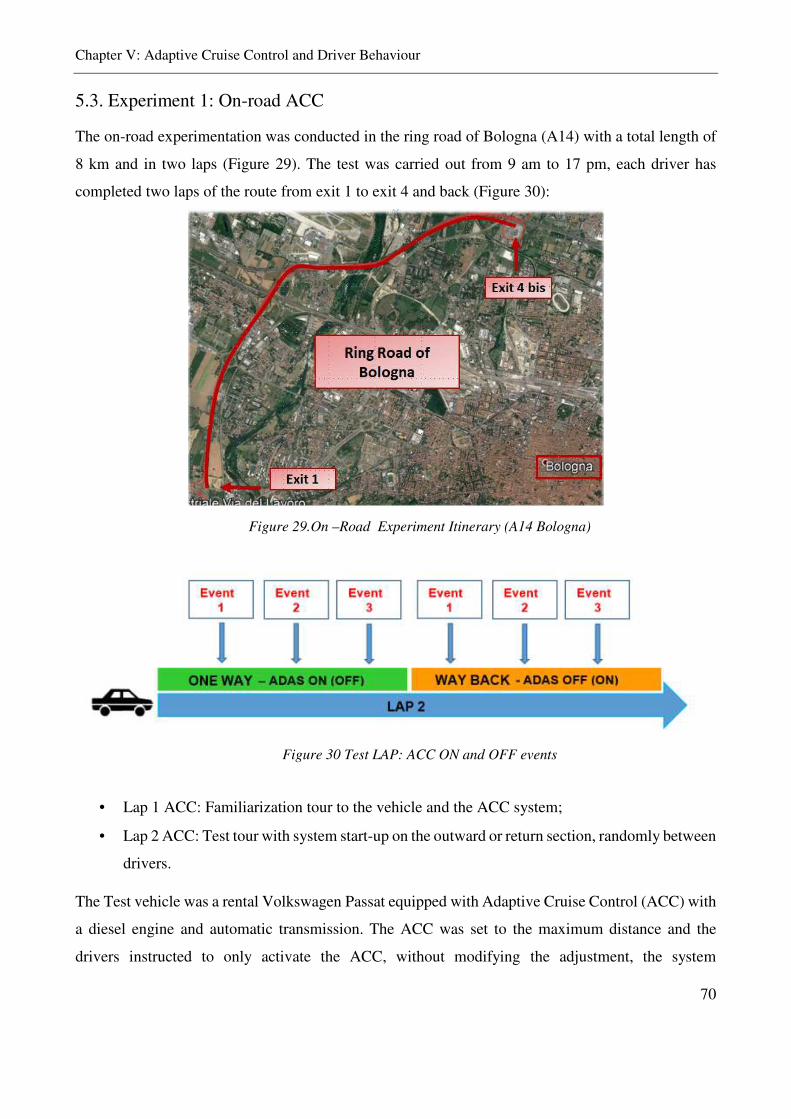
Chapter V: Adaptive Cruise Control and Driver Behaviour
70
5.3. Experiment 1: On-road ACC
The on-road experimentation was conducted in the ring road of Bologna (A14) with a total length of
8 km and in two laps (Figure 29). The test was carried out from 9 am to 17 pm, each driver has
completed two laps of the route from exit 1 to exit 4 and back (Figure 30):
Figure 29.On –Road Experiment Itinerary (A14 Bologna)
Figure 30 Test LAP: ACC ON and OFF events
• Lap 1 ACC: Familiarization tour to the vehicle and the ACC system;
• Lap 2 ACC: Test tour with system start-up on the outward or return section, randomly between
drivers.
The Test vehicle was a rental Volkswagen Passat equipped with Adaptive Cruise Control (ACC) with
a diesel engine and automatic transmission. The ACC was set to the maximum distance and the
drivers instructed to only activate the ACC, without modifying the adjustment, the system
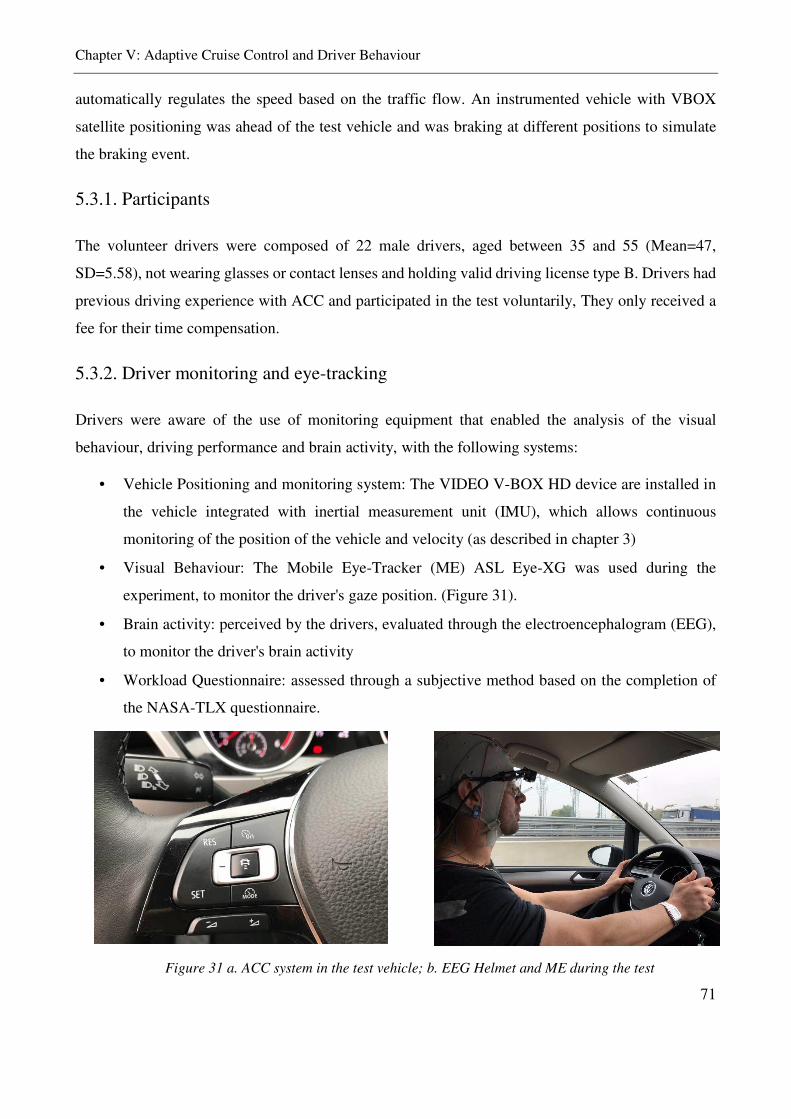
Chapter V: Adaptive Cruise Control and Driver Behaviour
71
automatically regulates the speed based on the traffic flow. An instrumented vehicle with VBOX
satellite positioning was ahead of the test vehicle and was braking at different positions to simulate
the braking event.
5.3.1. Participants
The volunteer drivers were composed of 22 male drivers, aged between 35 and 55 (Mean=47,
SD=5.58), not wearing glasses or contact lenses and holding valid driving license type B. Drivers had
previous driving experience with ACC and participated in the test voluntarily, They only received a
fee for their time compensation.
5.3.2. Driver monitoring and eye-tracking
Drivers were aware of the use of monitoring equipment that enabled the analysis of the visual
behaviour, driving performance and brain activity, with the following systems:
• Vehicle Positioning and monitoring system: The VIDEO V-BOX HD device are installed in
the vehicle integrated with inertial measurement unit (IMU), which allows continuous
monitoring of the position of the vehicle and velocity (as described in chapter 3)
• Visual Behaviour: The Mobile Eye-Tracker (ME) ASL Eye-XG was used during the
experiment, to monitor the driver's gaze position. (Figure 31).
• Brain activity: perceived by the drivers, evaluated through the electroencephalogram (EEG),
to monitor the driver's brain activity
• Workload Questionnaire: assessed through a subjective method based on the completion of
the NASA-TLX questionnaire.
Figure 31 a. ACC system in the test vehicle; b. EEG Helmet and ME during the test
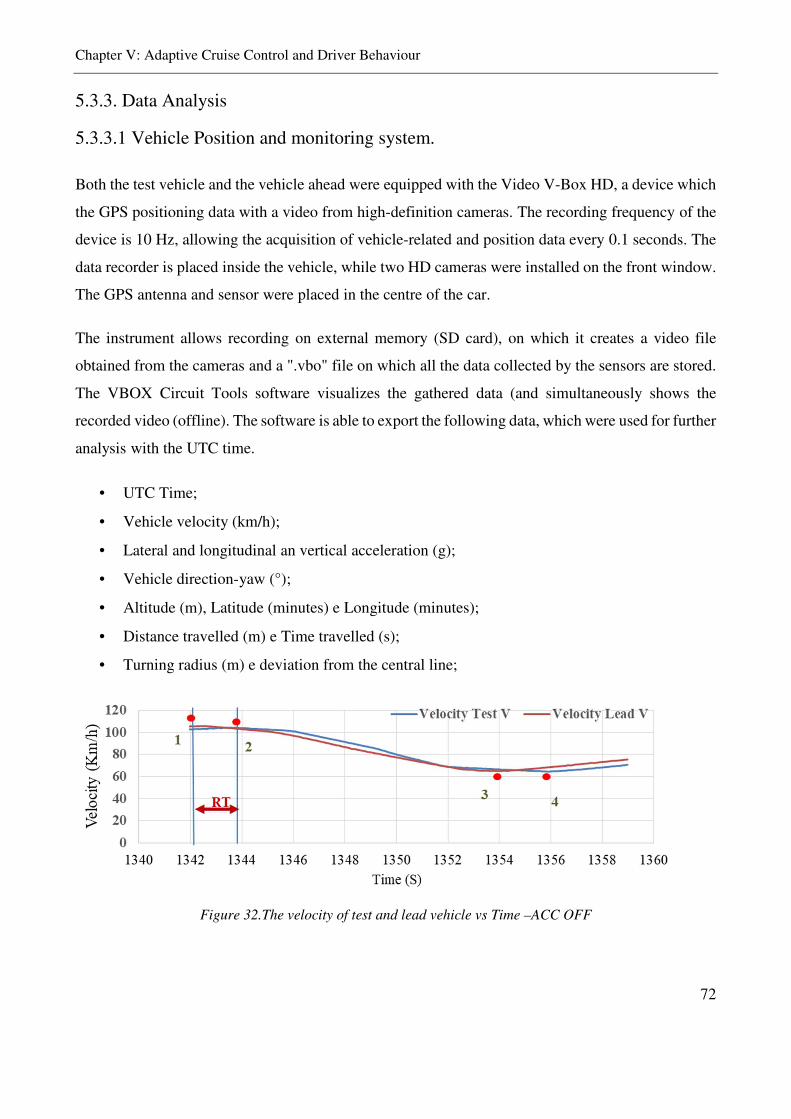
Chapter V: Adaptive Cruise Control and Driver Behaviour
72
5.3.3. Data Analysis
5.3.3.1 Vehicle Position and monitoring system.
Both the test vehicle and the vehicle ahead were equipped with the Video V-Box HD, a device which
the GPS positioning data with a video from high-definition cameras. The recording frequency of the
device is 10 Hz, allowing the acquisition of vehicle-related and position data every 0.1 seconds. The
data recorder is placed inside the vehicle, while two HD cameras were installed on the front window.
The GPS antenna and sensor were placed in the centre of the car.
The instrument allows recording on external memory (SD card), on which it creates a video file
obtained from the cameras and a ".vbo" file on which all the data collected by the sensors are stored.
The VBOX Circuit Tools software visualizes the gathered data (and simultaneously shows the
recorded video (offline). The software is able to export the following data, which were used for further
analysis with the UTC time.
• UTC Time;
• Vehicle velocity (km/h);
• Lateral and longitudinal an vertical acceleration (g);
• Vehicle direction-yaw (°);
• Altitude (m), Latitude (minutes) e Longitude (minutes);
• Distance travelled (m) e Time travelled (s);
• Turning radius (m) e deviation from the central line;
Figure 32.The velocity of test and lead vehicle vs Time –ACC OFF
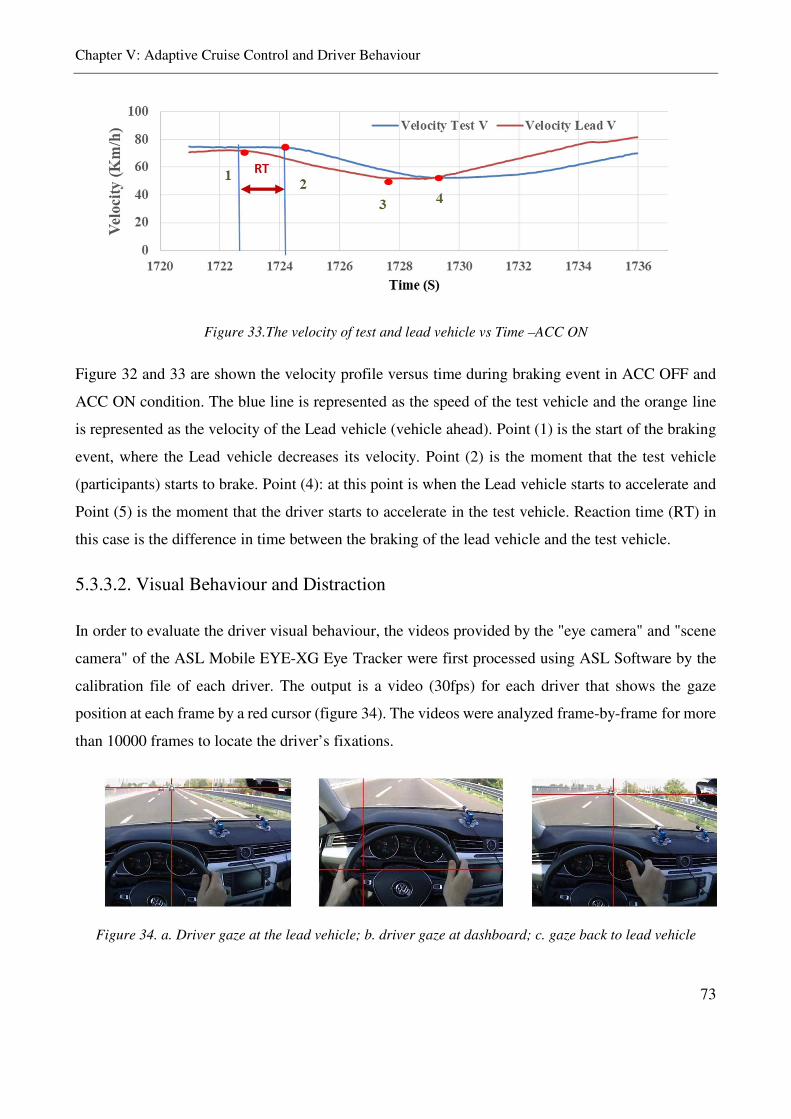
Chapter V: Adaptive Cruise Control and Driver Behaviour
73
Figure 33.The velocity of test and lead vehicle vs Time –ACC ON
Figure 32 and 33 are shown the velocity profile versus time during braking event in ACC OFF and
ACC ON condition. The blue line is represented as the speed of the test vehicle and the orange line
is represented as the velocity of the Lead vehicle (vehicle ahead). Point (1) is the start of the braking
event, where the Lead vehicle decreases its velocity. Point (2) is the moment that the test vehicle
(participants) starts to brake. Point (4): at this point is when the Lead vehicle starts to accelerate and
Point (5) is the moment that the driver starts to accelerate in the test vehicle. Reaction time (RT) in
this case is the difference in time between the braking of the lead vehicle and the test vehicle.
5.3.3.2. Visual Behaviour and Distraction
In order to evaluate the driver visual behaviour, the videos provided by the "eye camera" and "scene
camera" of the ASL Mobile EYE-XG Eye Tracker were first processed using ASL Software by the
calibration file of each driver. The output is a video (30fps) for each driver that shows the gaze
position at each frame by a red cursor (figure 34). The videos were analyzed frame-by-frame for more
than 10000 frames to locate the driver’s fixations.
Figure 34. a. Driver gaze at the lead vehicle; b. driver gaze at dashboard; c. gaze back to lead vehicle
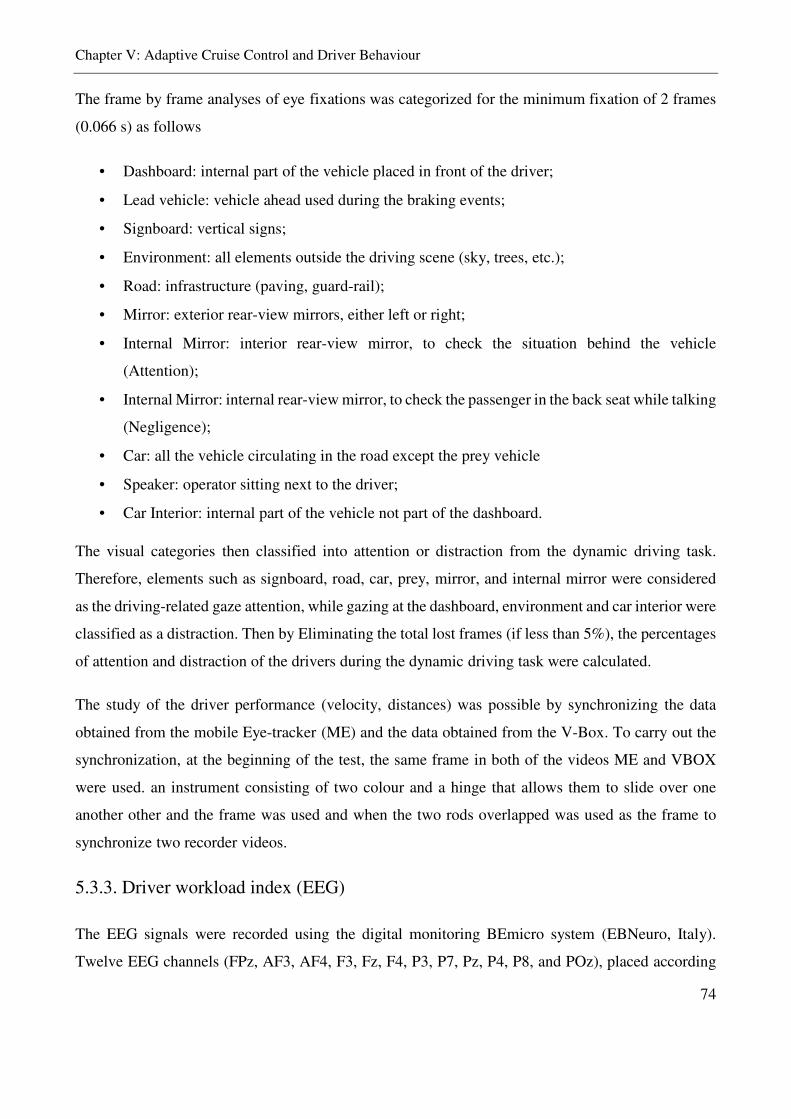
Chapter V: Adaptive Cruise Control and Driver Behaviour
74
The frame by frame analyses of eye fixations was categorized for the minimum fixation of 2 frames
(0.066 s) as follows
• Dashboard: internal part of the vehicle placed in front of the driver;
• Lead vehicle: vehicle ahead used during the braking events;
• Signboard: vertical signs;
• Environment: all elements outside the driving scene (sky, trees, etc.);
• Road: infrastructure (paving, guard-rail);
• Mirror: exterior rear-view mirrors, either left or right;
• Internal Mirror: interior rear-view mirror, to check the situation behind the vehicle
(Attention);
• Internal Mirror: internal rear-view mirror, to check the passenger in the back seat while talking
(Negligence);
• Car: all the vehicle circulating in the road except the prey vehicle
• Speaker: operator sitting next to the driver;
• Car Interior: internal part of the vehicle not part of the dashboard.
The visual categories then classified into attention or distraction from the dynamic driving task.
Therefore, elements such as signboard, road, car, prey, mirror, and internal mirror were considered
as the driving-related gaze attention, while gazing at the dashboard, environment and car interior were
classified as a distraction. Then by Eliminating the total lost frames (if less than 5%), the percentages
of attention and distraction of the drivers during the dynamic driving task were calculated.
The study of the driver performance (velocity, distances) was possible by synchronizing the data
obtained from the mobile Eye-tracker (ME) and the data obtained from the V-Box. To carry out the
synchronization, at the beginning of the test, the same frame in both of the videos ME and VBOX
were used. an instrument consisting of two colour and a hinge that allows them to slide over one
another other and the frame was used and when the two rods overlapped was used as the frame to
synchronize two recorder videos.
5.3.3. Driver workload index (EEG)
The EEG signals were recorded using the digital monitoring BEmicro system (EBNeuro, Italy).
Twelve EEG channels (FPz, AF3, AF4, F3, Fz, F4, P3, P7, Pz, P4, P8, and POz), placed according

Chapter V: Adaptive Cruise Control and Driver Behaviour
75
to the international 10–20 system, were collected with a sampling frequency of 256 Hz, all referenced
to both earlobes, grounded to the Cz site, and with the impedances kept below 20 kΩ. The acquired
EEG signals were digitally bandpass filtered by a fifth-order Butterworth filter [1 - 30 Hz]. The EEG
signal from the remaining 11 electrodes was then segmented in 2-seconds-long epochs. The workload
(WL) index was calculated by using the machine-learning approach proposed and was fixed at 8-
second epochs since this value was shown to be a good trade-off between the resolution and the
accuracy of the measure (Flumeri et al. 2019).
5.3.4. Self-evaluated workload using (NASA_TLX questionnaire)
Drivers were asked to complete the NASA-TLX questionnaires after driving with the vehicle
regarding the use ACC system. The questionnaire consists of 6 questions that allow the driver to
calculate the mental load index self-assessed. The questions that can be answered with a score on a
scale from 0 to 100 are:
• Mental Demand: how do you evaluate mental commitment with the ACC system
• Physical Demand: how do you evaluate the physical demand with the ACC system?
• Temporal Demand: how do you evaluate the time demand of the task?
• Performance: how do you rate your performance during the test?
• Effort: How do you rate, the overall effort with the ACC system?
• Frustration: Did you felt insecure, discouraged, irritated, and stressed during the use of the
system.
5.3.4. Results (On-Road experiment-ACC)
5.3.4.1. Visual attention-distraction
The visual attention indicator of the drivers was investigated during a braking event, therefore for
each braking event; the indicator for visual behaviour is calculated. Figure 35 is showing the average
percentage of the attention and distraction of the drivers with the use of the ACC system and without
for each braking phase.
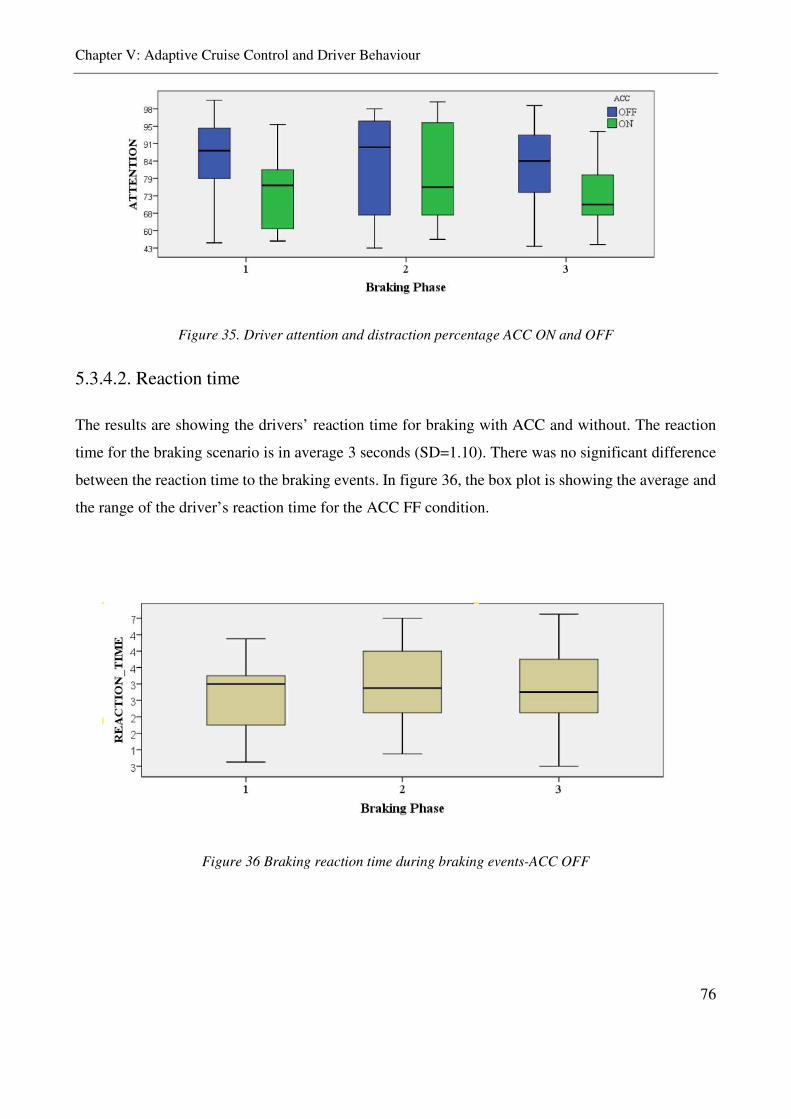
Chapter V: Adaptive Cruise Control and Driver Behaviour
76
Figure 35. Driver attention and distraction percentage ACC ON and OFF
5.3.4.2. Reaction time
The results are showing the drivers’ reaction time for braking with ACC and without. The reaction
time for the braking scenario is in average 3 seconds (SD=1.10). There was no significant difference
between the reaction time to the braking events. In figure 36, the box plot is showing the average and
the range of the driver’s reaction time for the ACC FF condition.
Figure 36 Braking reaction time during braking events-ACC OFF
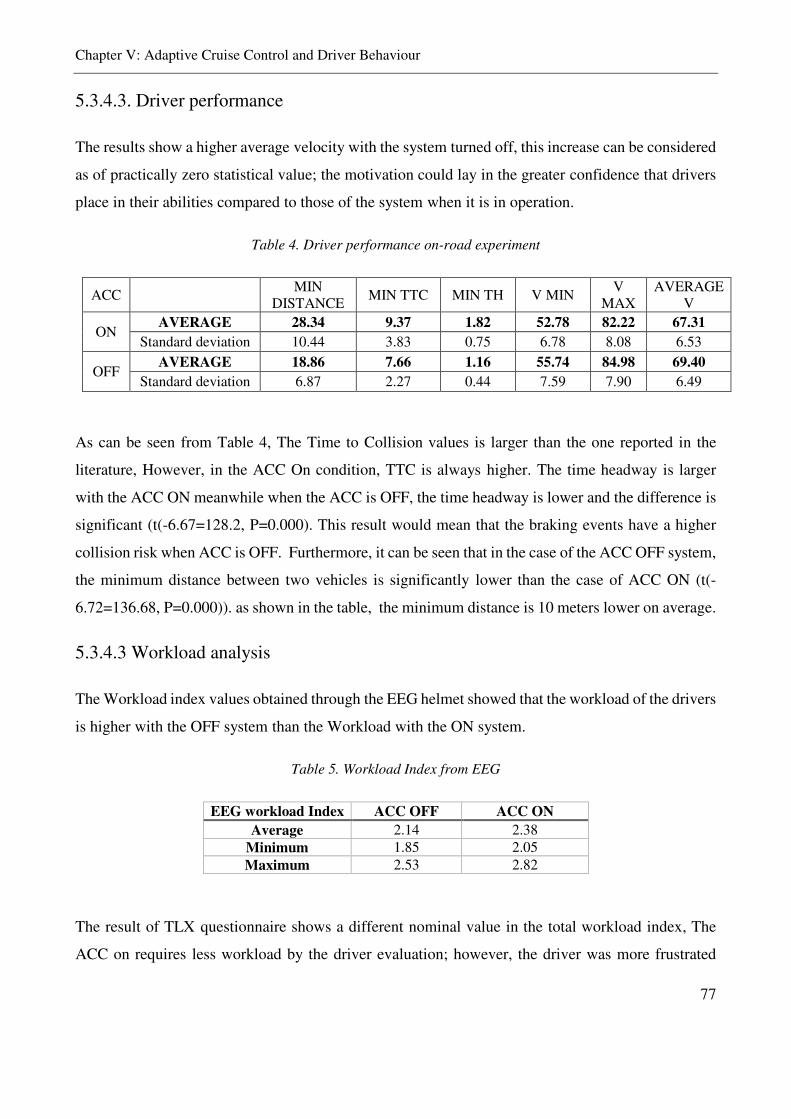
Chapter V: Adaptive Cruise Control and Driver Behaviour
77
5.3.4.3. Driver performance
The results show a higher average velocity with the system turned off, this increase can be considered
as of practically zero statistical value; the motivation could lay in the greater confidence that drivers
place in their abilities compared to those of the system when it is in operation.
Table 4. Driver performance on-road experiment
ACC MIN DISTANCE MIN TTC MIN TH V MIN V
MAX AVERAGE
V
ON AVERAGE 28.34 9.37 1.82 52.78 82.22 67.31
Standard deviation 10.44 3.83 0.75 6.78 8.08 6.53
OFF AVERAGE 18.86 7.66 1.16 55.74 84.98 69.40
Standard deviation 6.87 2.27 0.44 7.59 7.90 6.49
As can be seen from Table 4, The Time to Collision values is larger than the one reported in the
literature, However, in the ACC On condition, TTC is always higher. The time headway is larger
with the ACC ON meanwhile when the ACC is OFF, the time headway is lower and the difference is
significant (t(-6.67=128.2, P=0.000). This result would mean that the braking events have a higher
collision risk when ACC is OFF. Furthermore, it can be seen that in the case of the ACC OFF system,
the minimum distance between two vehicles is significantly lower than the case of ACC ON (t(-
6.72=136.68, P=0.000)). as shown in the table, the minimum distance is 10 meters lower on average.
5.3.4.3 Workload analysis
The Workload index values obtained through the EEG helmet showed that the workload of the drivers
is higher with the OFF system than the Workload with the ON system.
Table 5. Workload Index from EEG
EEG workload Index ACC OFF ACC ON
Average 2.14 2.38 Minimum 1.85 2.05 Maximum 2.53 2.82
The result of TLX questionnaire shows a different nominal value in the total workload index, The
ACC on requires less workload by the driver evaluation; however, the driver was more frustrated
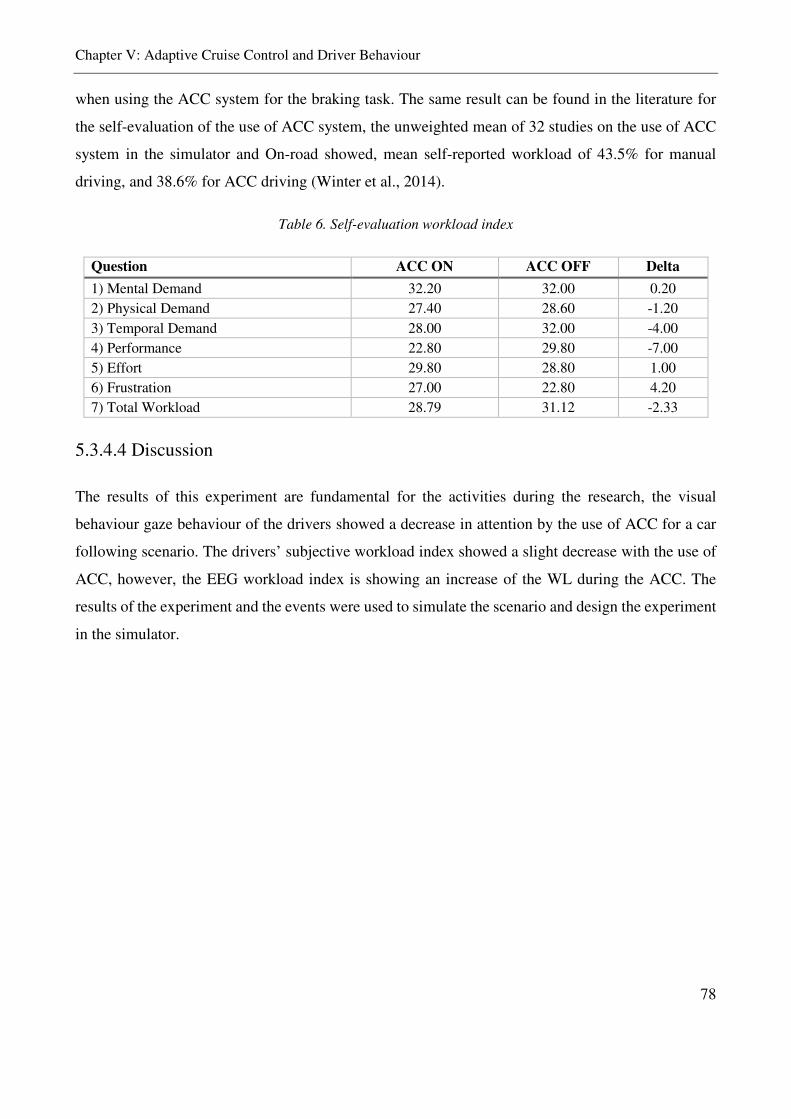
Chapter V: Adaptive Cruise Control and Driver Behaviour
78
when using the ACC system for the braking task. The same result can be found in the literature for
the self-evaluation of the use of ACC system, the unweighted mean of 32 studies on the use of ACC
system in the simulator and On-road showed, mean self-reported workload of 43.5% for manual
driving, and 38.6% for ACC driving (Winter et al., 2014).
Table 6. Self-evaluation workload index
Question ACC ON ACC OFF Delta
1) Mental Demand 32.20 32.00 0.20 2) Physical Demand 27.40 28.60 -1.20 3) Temporal Demand 28.00 32.00 -4.00 4) Performance 22.80 29.80 -7.00 5) Effort 29.80 28.80 1.00 6) Frustration 27.00 22.80 4.20 7) Total Workload 28.79 31.12 -2.33
5.3.4.4 Discussion
The results of this experiment are fundamental for the activities during the research, the visual
behaviour gaze behaviour of the drivers showed a decrease in attention by the use of ACC for a car
following scenario. The drivers’ subjective workload index showed a slight decrease with the use of
ACC, however, the EEG workload index is showing an increase of the WL during the ACC. The
results of the experiment and the events were used to simulate the scenario and design the experiment
in the simulator.
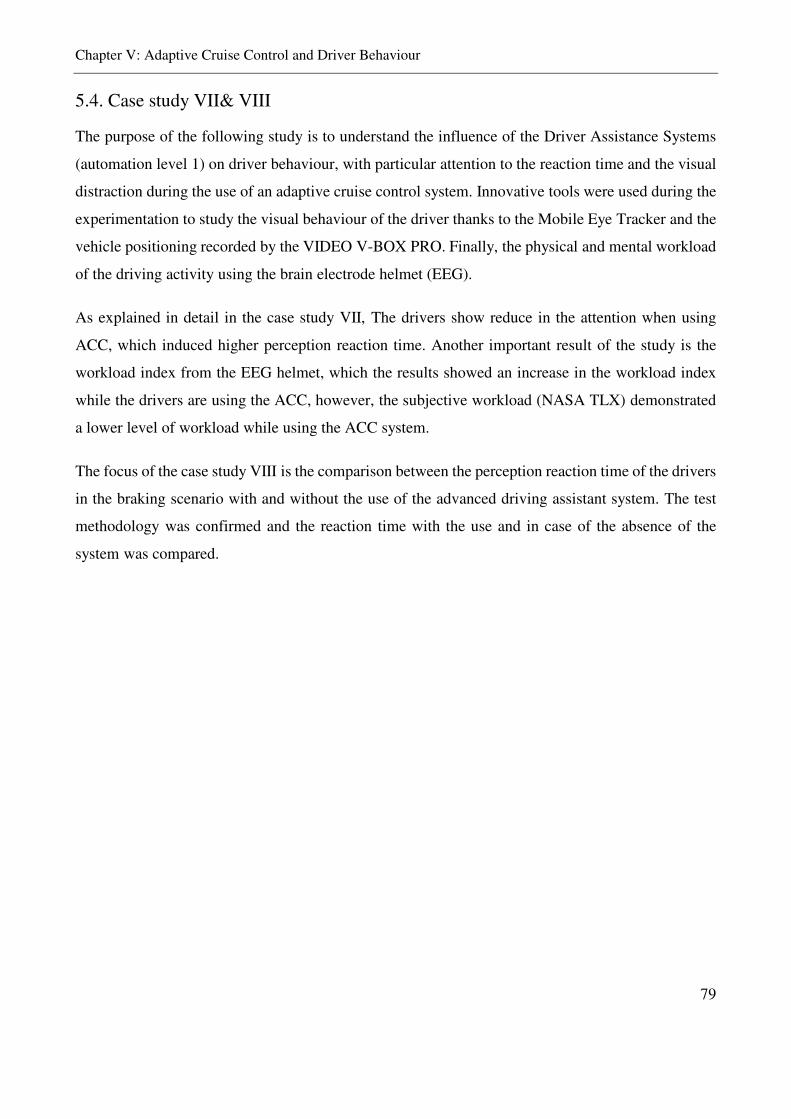
Chapter V: Adaptive Cruise Control and Driver Behaviour
79
5.4. Case study VII& VIII
The purpose of the following study is to understand the influence of the Driver Assistance Systems
(automation level 1) on driver behaviour, with particular attention to the reaction time and the visual
distraction during the use of an adaptive cruise control system. Innovative tools were used during the
experimentation to study the visual behaviour of the driver thanks to the Mobile Eye Tracker and the
vehicle positioning recorded by the VIDEO V-BOX PRO. Finally, the physical and mental workload
of the driving activity using the brain electrode helmet (EEG).
As explained in detail in the case study VII, The drivers show reduce in the attention when using
ACC, which induced higher perception reaction time. Another important result of the study is the
workload index from the EEG helmet, which the results showed an increase in the workload index
while the drivers are using the ACC, however, the subjective workload (NASA TLX) demonstrated
a lower level of workload while using the ACC system.
The focus of the case study VIII is the comparison between the perception reaction time of the drivers
in the braking scenario with and without the use of the advanced driving assistant system. The test
methodology was confirmed and the reaction time with the use and in case of the absence of the
system was compared.
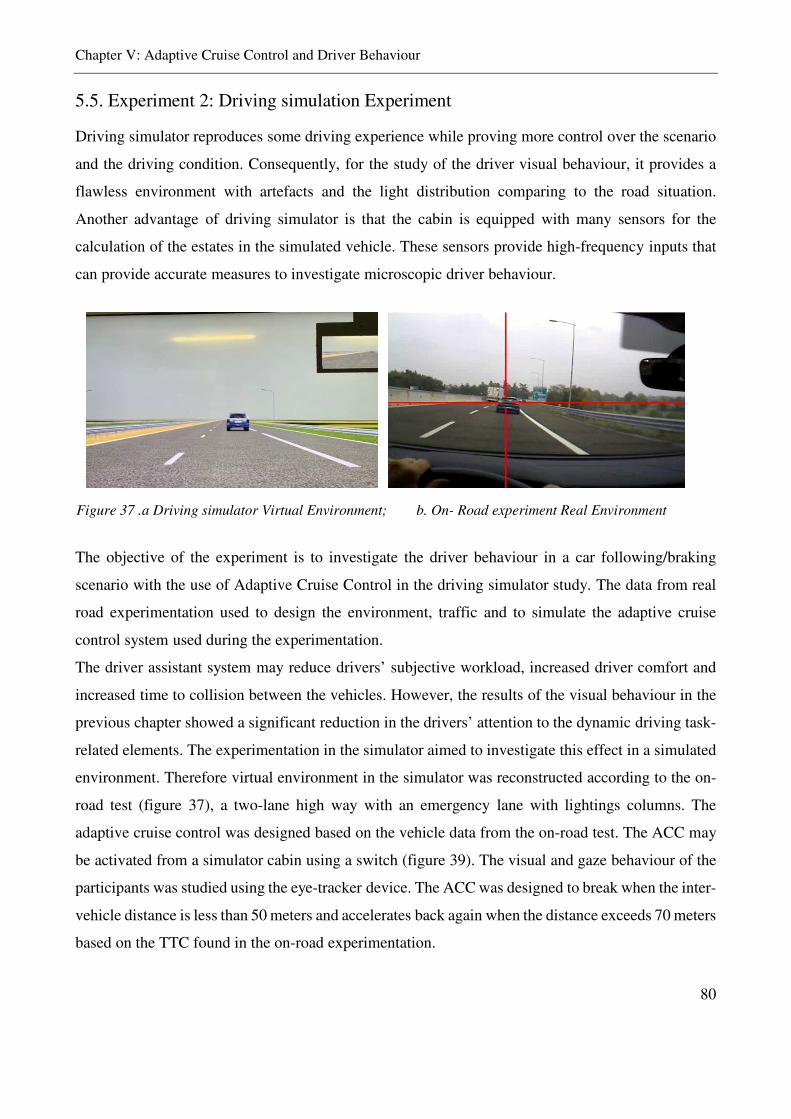
Chapter V: Adaptive Cruise Control and Driver Behaviour
80
5.5. Experiment 2: Driving simulation Experiment
Driving simulator reproduces some driving experience while proving more control over the scenario
and the driving condition. Consequently, for the study of the driver visual behaviour, it provides a
flawless environment with artefacts and the light distribution comparing to the road situation.
Another advantage of driving simulator is that the cabin is equipped with many sensors for the
calculation of the estates in the simulated vehicle. These sensors provide high-frequency inputs that
can provide accurate measures to investigate microscopic driver behaviour.
The objective of the experiment is to investigate the driver behaviour in a car following/braking
scenario with the use of Adaptive Cruise Control in the driving simulator study. The data from real
road experimentation used to design the environment, traffic and to simulate the adaptive cruise
control system used during the experimentation.
The driver assistant system may reduce drivers’ subjective workload, increased driver comfort and
increased time to collision between the vehicles. However, the results of the visual behaviour in the
previous chapter showed a significant reduction in the drivers’ attention to the dynamic driving task-
related elements. The experimentation in the simulator aimed to investigate this effect in a simulated
environment. Therefore virtual environment in the simulator was reconstructed according to the on-
road test (figure 37), a two-lane high way with an emergency lane with lightings columns. The
adaptive cruise control was designed based on the vehicle data from the on-road test. The ACC may
be activated from a simulator cabin using a switch (figure 39). The visual and gaze behaviour of the
participants was studied using the eye-tracker device. The ACC was designed to break when the inter-
vehicle distance is less than 50 meters and accelerates back again when the distance exceeds 70 meters
based on the TTC found in the on-road experimentation.
Figure 37 .a Driving simulator Virtual Environment; b. On- Road experiment Real Environment
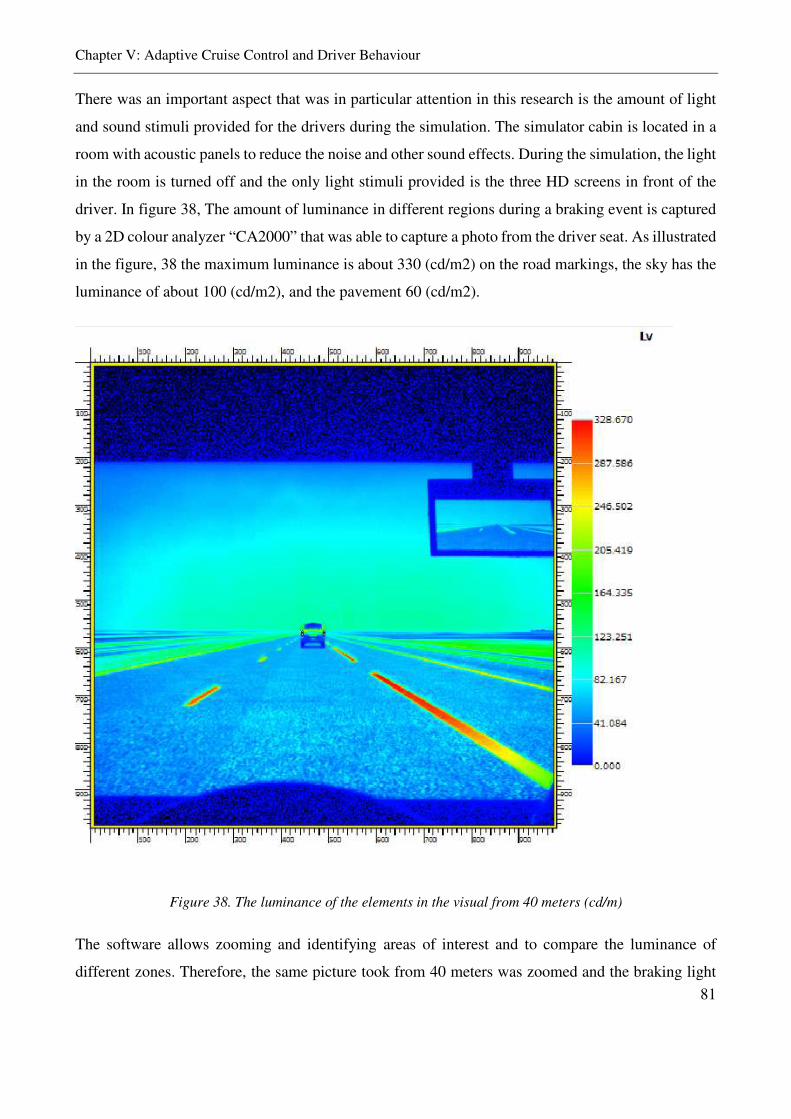
Chapter V: Adaptive Cruise Control and Driver Behaviour
81
There was an important aspect that was in particular attention in this research is the amount of light
and sound stimuli provided for the drivers during the simulation. The simulator cabin is located in a
room with acoustic panels to reduce the noise and other sound effects. During the simulation, the light
in the room is turned off and the only light stimuli provided is the three HD screens in front of the
driver. In figure 38, The amount of luminance in different regions during a braking event is captured
by a 2D colour analyzer “CA2000” that was able to capture a photo from the driver seat. As illustrated
in the figure, 38 the maximum luminance is about 330 (cd/m2) on the road markings, the sky has the
luminance of about 100 (cd/m2), and the pavement 60 (cd/m2).
Figure 38. The luminance of the elements in the visual from 40 meters (cd/m)
The software allows zooming and identifying areas of interest and to compare the luminance of
different zones. Therefore, the same picture took from 40 meters was zoomed and the braking light
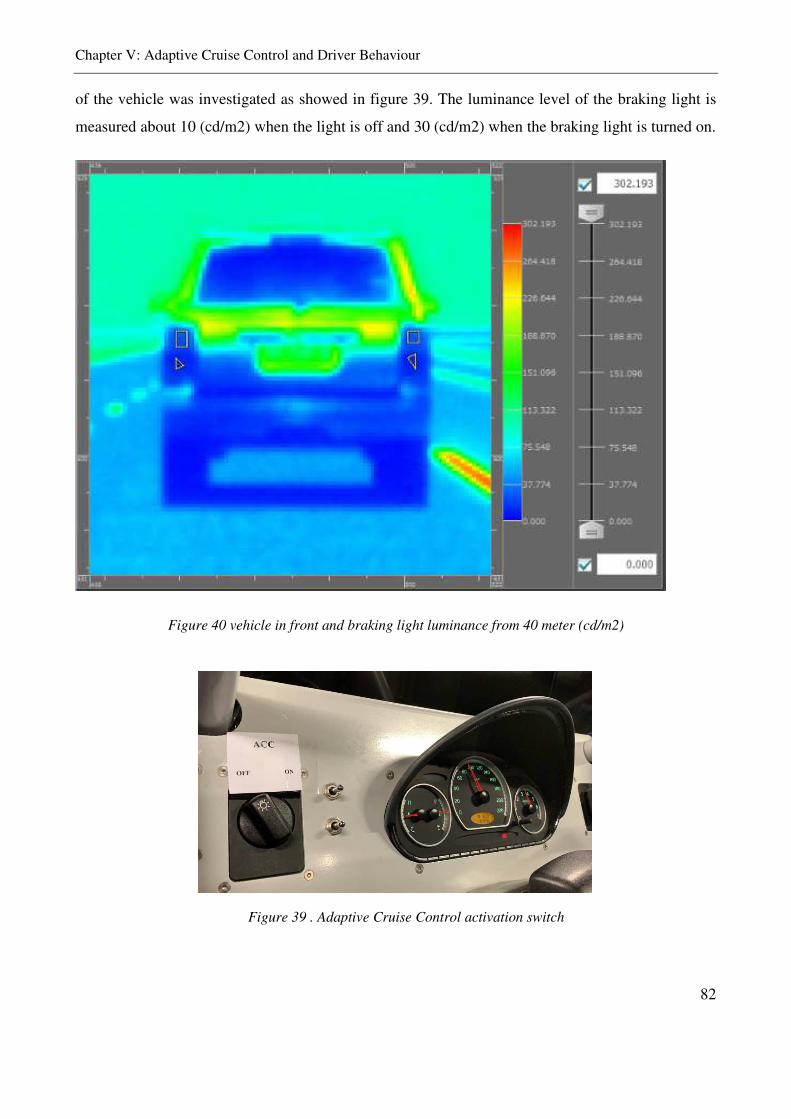
Chapter V: Adaptive Cruise Control and Driver Behaviour
82
of the vehicle was investigated as showed in figure 39. The luminance level of the braking light is
measured about 10 (cd/m2) when the light is off and 30 (cd/m2) when the braking light is turned on.
Figure 40 vehicle in front and braking light luminance from 40 meter (cd/m2)
Figure 39 . Adaptive Cruise Control activation switch
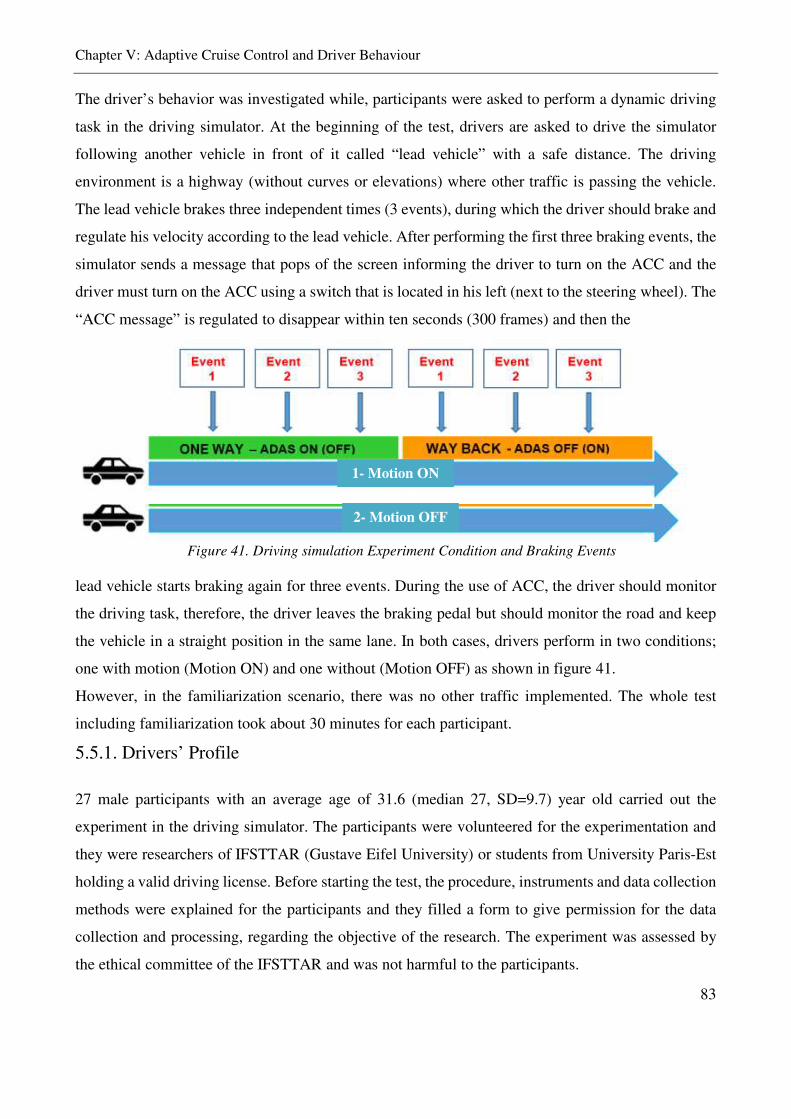
Chapter V: Adaptive Cruise Control and Driver Behaviour
83
The driver’s behavior was investigated while, participants were asked to perform a dynamic driving
task in the driving simulator. At the beginning of the test, drivers are asked to drive the simulator
following another vehicle in front of it called “lead vehicle” with a safe distance. The driving
environment is a highway (without curves or elevations) where other traffic is passing the vehicle.
The lead vehicle brakes three independent times (3 events), during which the driver should brake and
regulate his velocity according to the lead vehicle. After performing the first three braking events, the
simulator sends a message that pops of the screen informing the driver to turn on the ACC and the
driver must turn on the ACC using a switch that is located in his left (next to the steering wheel). The
“ACC message” is regulated to disappear within ten seconds (300 frames) and then the
lead vehicle starts braking again for three events. During the use of ACC, the driver should monitor
the driving task, therefore, the driver leaves the braking pedal but should monitor the road and keep
the vehicle in a straight position in the same lane. In both cases, drivers perform in two conditions;
one with motion (Motion ON) and one without (Motion OFF) as shown in figure 41.
However, in the familiarization scenario, there was no other traffic implemented. The whole test
including familiarization took about 30 minutes for each participant.
5.5.1. Drivers’ Profile
27 male participants with an average age of 31.6 (median 27, SD=9.7) year old carried out the
experiment in the driving simulator. The participants were volunteered for the experimentation and
they were researchers of IFSTTAR (Gustave Eifel University) or students from University Paris-Est
holding a valid driving license. Before starting the test, the procedure, instruments and data collection
methods were explained for the participants and they filled a form to give permission for the data
collection and processing, regarding the objective of the research. The experiment was assessed by
the ethical committee of the IFSTTAR and was not harmful to the participants.
1- Motion ON
2- Motion OFF
Figure 41. Driving simulation Experiment Condition and Braking Events
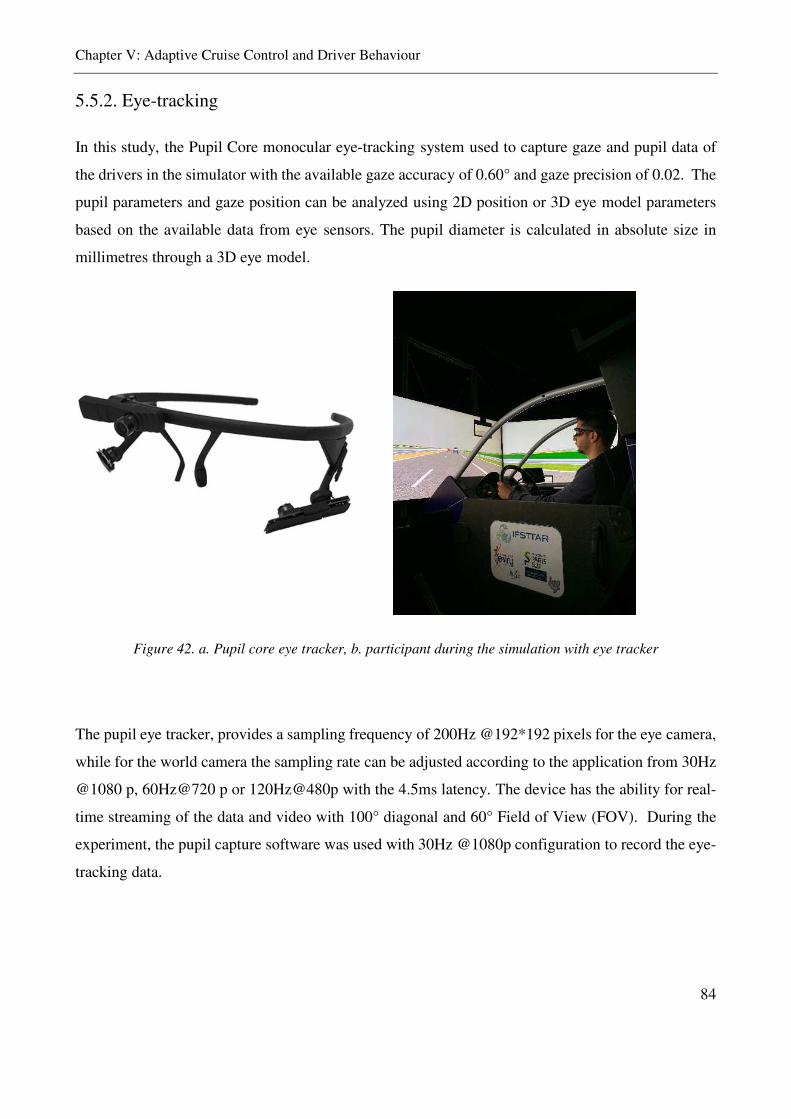
Chapter V: Adaptive Cruise Control and Driver Behaviour
84
5.5.2. Eye-tracking
In this study, the Pupil Core monocular eye-tracking system used to capture gaze and pupil data of
the drivers in the simulator with the available gaze accuracy of 0.60° and gaze precision of 0.02. The
pupil parameters and gaze position can be analyzed using 2D position or 3D eye model parameters
based on the available data from eye sensors. The pupil diameter is calculated in absolute size in
millimetres through a 3D eye model.
Figure 42. a. Pupil core eye tracker, b. participant during the simulation with eye tracker
The pupil eye tracker, provides a sampling frequency of 200Hz @192*192 pixels for the eye camera,
while for the world camera the sampling rate can be adjusted according to the application from 30Hz
@1080 p, 60Hz@720 p or 120Hz@480p with the 4.5ms latency. The device has the ability for real-
time streaming of the data and video with 100° diagonal and 60° Field of View (FOV). During the
experiment, the pupil capture software was used with 30Hz @1080p configuration to record the eye-
tracking data.
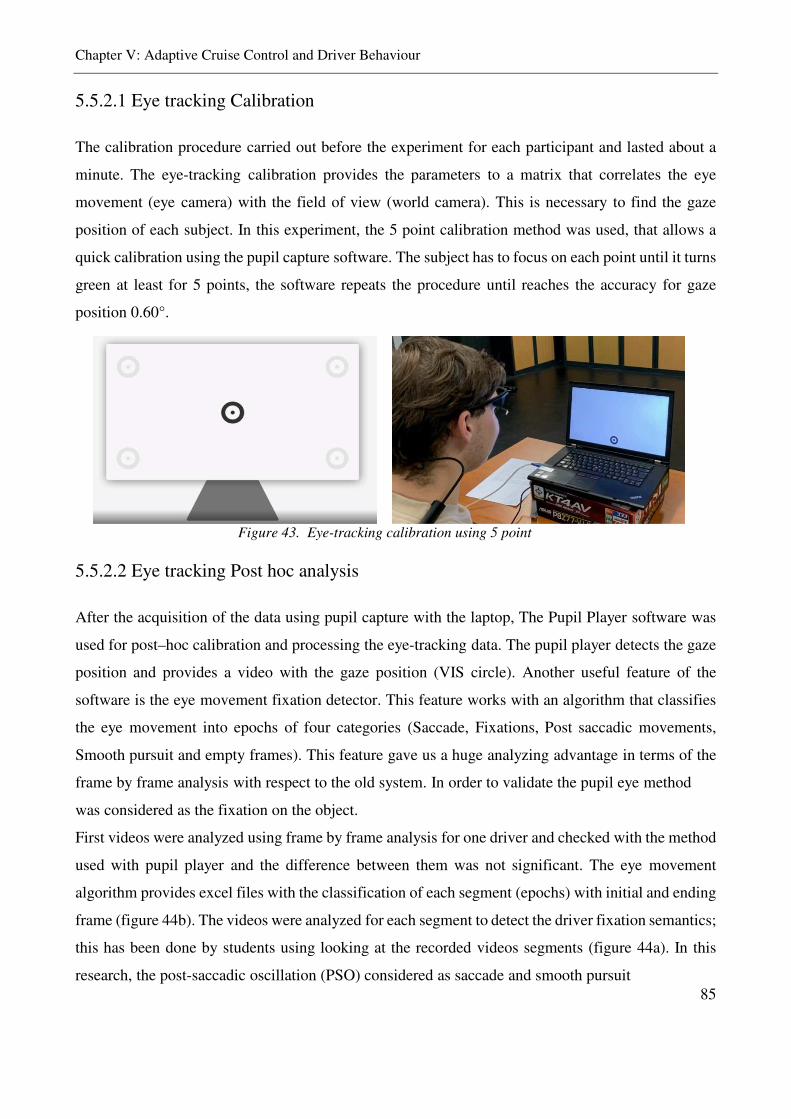
Chapter V: Adaptive Cruise Control and Driver Behaviour
85
5.5.2.1 Eye tracking Calibration
The calibration procedure carried out before the experiment for each participant and lasted about a
minute. The eye-tracking calibration provides the parameters to a matrix that correlates the eye
movement (eye camera) with the field of view (world camera). This is necessary to find the gaze
position of each subject. In this experiment, the 5 point calibration method was used, that allows a
quick calibration using the pupil capture software. The subject has to focus on each point until it turns
green at least for 5 points, the software repeats the procedure until reaches the accuracy for gaze
position 0.60°.
5.5.2.2 Eye tracking Post hoc analysis
After the acquisition of the data using pupil capture with the laptop, The Pupil Player software was
used for post–hoc calibration and processing the eye-tracking data. The pupil player detects the gaze
position and provides a video with the gaze position (VIS circle). Another useful feature of the
software is the eye movement fixation detector. This feature works with an algorithm that classifies
the eye movement into epochs of four categories (Saccade, Fixations, Post saccadic movements,
Smooth pursuit and empty frames). This feature gave us a huge analyzing advantage in terms of the
frame by frame analysis with respect to the old system. In order to validate the pupil eye method
was considered as the fixation on the object.
First videos were analyzed using frame by frame analysis for one driver and checked with the method
used with pupil player and the difference between them was not significant. The eye movement
algorithm provides excel files with the classification of each segment (epochs) with initial and ending
frame (figure 44b). The videos were analyzed for each segment to detect the driver fixation semantics;
this has been done by students using looking at the recorded videos segments (figure 44a). In this
research, the post-saccadic oscillation (PSO) considered as saccade and smooth pursuit
Figure 43. Eye-tracking calibration using 5 point
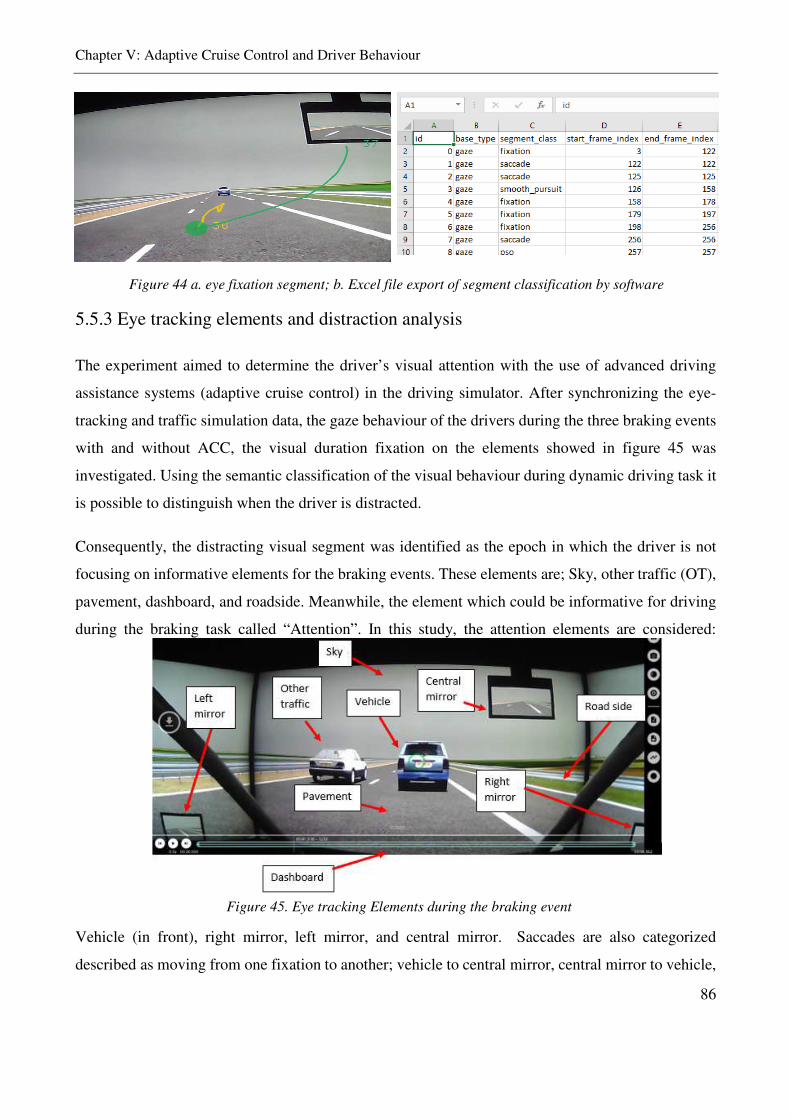
Chapter V: Adaptive Cruise Control and Driver Behaviour
86
5.5.3 Eye tracking elements and distraction analysis
The experiment aimed to determine the driver’s visual attention with the use of advanced driving
assistance systems (adaptive cruise control) in the driving simulator. After synchronizing the eye-
tracking and traffic simulation data, the gaze behaviour of the drivers during the three braking events
with and without ACC, the visual duration fixation on the elements showed in figure 45 was
investigated. Using the semantic classification of the visual behaviour during dynamic driving task it
is possible to distinguish when the driver is distracted.
Consequently, the distracting visual segment was identified as the epoch in which the driver is not
focusing on informative elements for the braking events. These elements are; Sky, other traffic (OT),
pavement, dashboard, and roadside. Meanwhile, the element which could be informative for driving
during the braking task called “Attention”. In this study, the attention elements are considered:
Vehicle (in front), right mirror, left mirror, and central mirror. Saccades are also categorized
described as moving from one fixation to another; vehicle to central mirror, central mirror to vehicle,
Figure 45. Eye tracking Elements during the braking event
Figure 44 a. eye fixation segment; b. Excel file export of segment classification by software
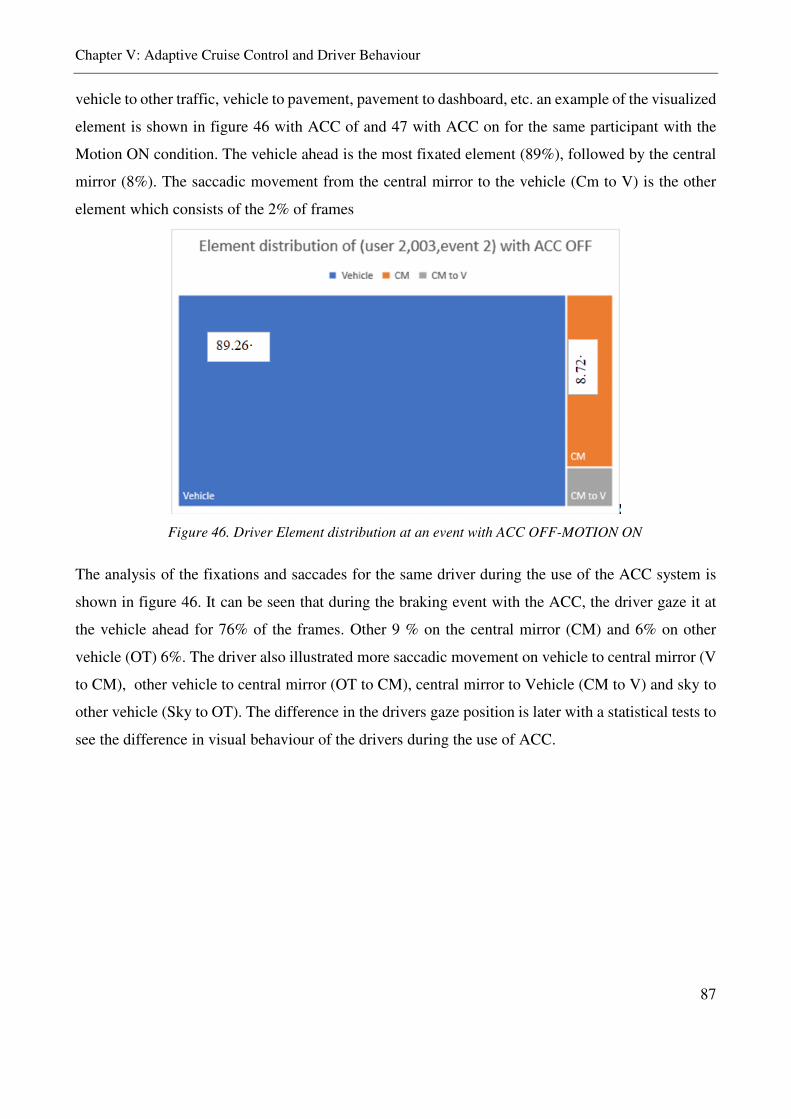
Chapter V: Adaptive Cruise Control and Driver Behaviour
87
vehicle to other traffic, vehicle to pavement, pavement to dashboard, etc. an example of the visualized
element is shown in figure 46 with ACC of and 47 with ACC on for the same participant with the
Motion ON condition. The vehicle ahead is the most fixated element (89%), followed by the central
mirror (8%). The saccadic movement from the central mirror to the vehicle (Cm to V) is the other
element which consists of the 2% of frames
Figure 46. Driver Element distribution at an event with ACC OFF-MOTION ON
The analysis of the fixations and saccades for the same driver during the use of the ACC system is
shown in figure 46. It can be seen that during the braking event with the ACC, the driver gaze it at
the vehicle ahead for 76% of the frames. Other 9 % on the central mirror (CM) and 6% on other
vehicle (OT) 6%. The driver also illustrated more saccadic movement on vehicle to central mirror (V
to CM), other vehicle to central mirror (OT to CM), central mirror to Vehicle (CM to V) and sky to
other vehicle (Sky to OT). The difference in the drivers gaze position is later with a statistical tests to
see the difference in visual behaviour of the drivers during the use of ACC.
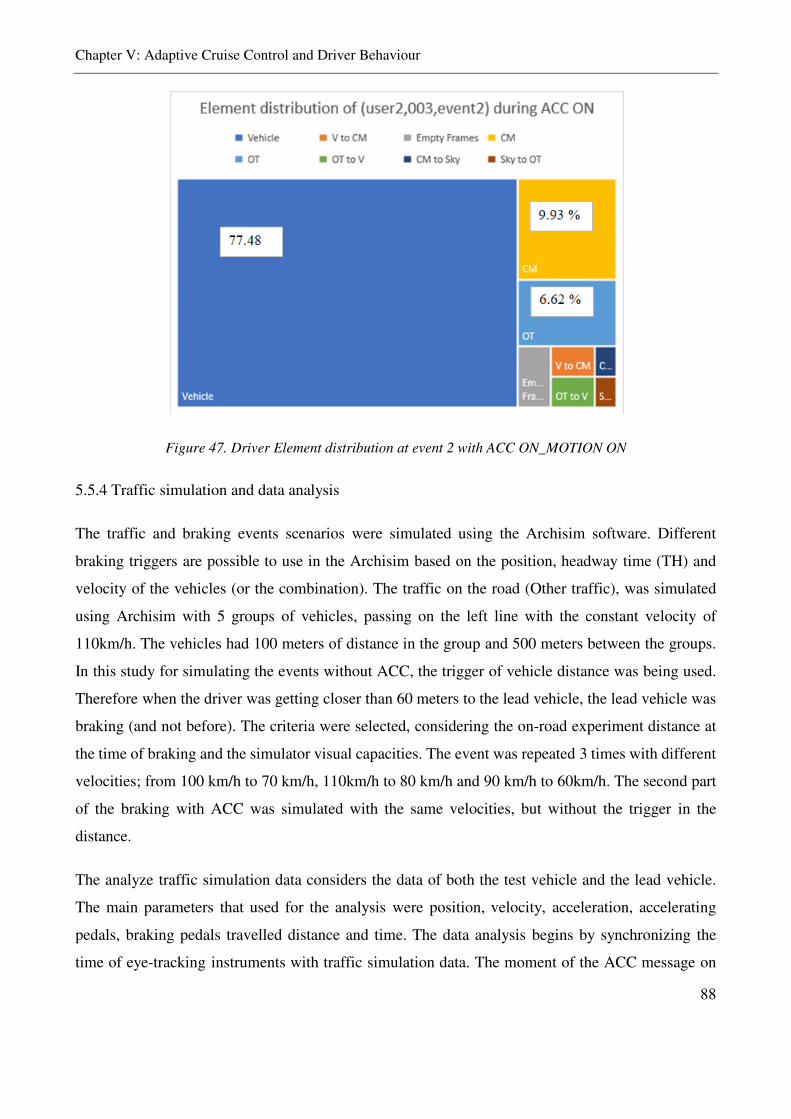
Chapter V: Adaptive Cruise Control and Driver Behaviour
88
Figure 47. Driver Element distribution at event 2 with ACC ON_MOTION ON
5.5.4 Traffic simulation and data analysis
The traffic and braking events scenarios were simulated using the Archisim software. Different
braking triggers are possible to use in the Archisim based on the position, headway time (TH) and
velocity of the vehicles (or the combination). The traffic on the road (Other traffic), was simulated
using Archisim with 5 groups of vehicles, passing on the left line with the constant velocity of
110km/h. The vehicles had 100 meters of distance in the group and 500 meters between the groups.
In this study for simulating the events without ACC, the trigger of vehicle distance was being used.
Therefore when the driver was getting closer than 60 meters to the lead vehicle, the lead vehicle was
braking (and not before). The criteria were selected, considering the on-road experiment distance at
the time of braking and the simulator visual capacities. The event was repeated 3 times with different
velocities; from 100 km/h to 70 km/h, 110km/h to 80 km/h and 90 km/h to 60km/h. The second part
of the braking with ACC was simulated with the same velocities, but without the trigger in the
distance.
The analyze traffic simulation data considers the data of both the test vehicle and the lead vehicle.
The main parameters that used for the analysis were position, velocity, acceleration, accelerating
pedals, braking pedals travelled distance and time. The data analysis begins by synchronizing the
time of eye-tracking instruments with traffic simulation data. The moment of the ACC message on
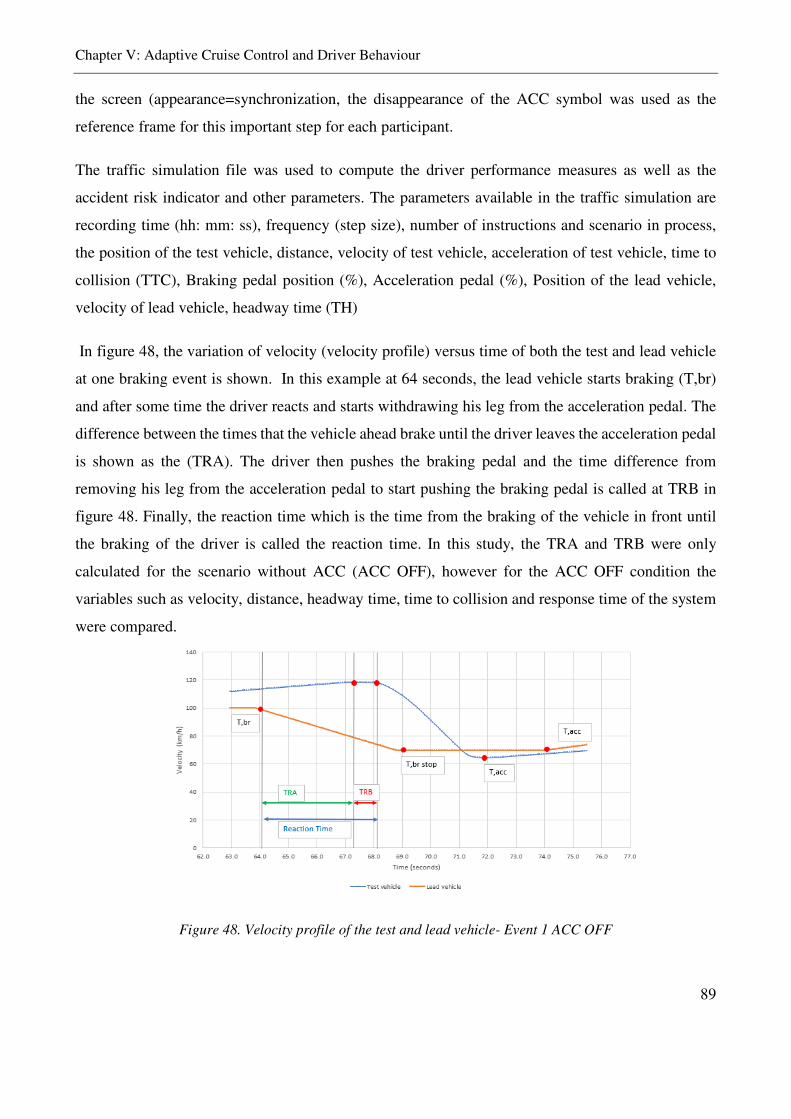
Chapter V: Adaptive Cruise Control and Driver Behaviour
89
the screen (appearance=synchronization, the disappearance of the ACC symbol was used as the
reference frame for this important step for each participant.
The traffic simulation file was used to compute the driver performance measures as well as the
accident risk indicator and other parameters. The parameters available in the traffic simulation are
recording time (hh: mm: ss), frequency (step size), number of instructions and scenario in process,
the position of the test vehicle, distance, velocity of test vehicle, acceleration of test vehicle, time to
collision (TTC), Braking pedal position (%), Acceleration pedal (%), Position of the lead vehicle,
velocity of lead vehicle, headway time (TH)
In figure 48, the variation of velocity (velocity profile) versus time of both the test and lead vehicle
at one braking event is shown. In this example at 64 seconds, the lead vehicle starts braking (T,br)
and after some time the driver reacts and starts withdrawing his leg from the acceleration pedal. The
difference between the times that the vehicle ahead brake until the driver leaves the acceleration pedal
is shown as the (TRA). The driver then pushes the braking pedal and the time difference from
removing his leg from the acceleration pedal to start pushing the braking pedal is called at TRB in
figure 48. Finally, the reaction time which is the time from the braking of the vehicle in front until
the braking of the driver is called the reaction time. In this study, the TRA and TRB were only
calculated for the scenario without ACC (ACC OFF), however for the ACC OFF condition the
variables such as velocity, distance, headway time, time to collision and response time of the system
were compared.
Figure 48. Velocity profile of the test and lead vehicle- Event 1 ACC OFF
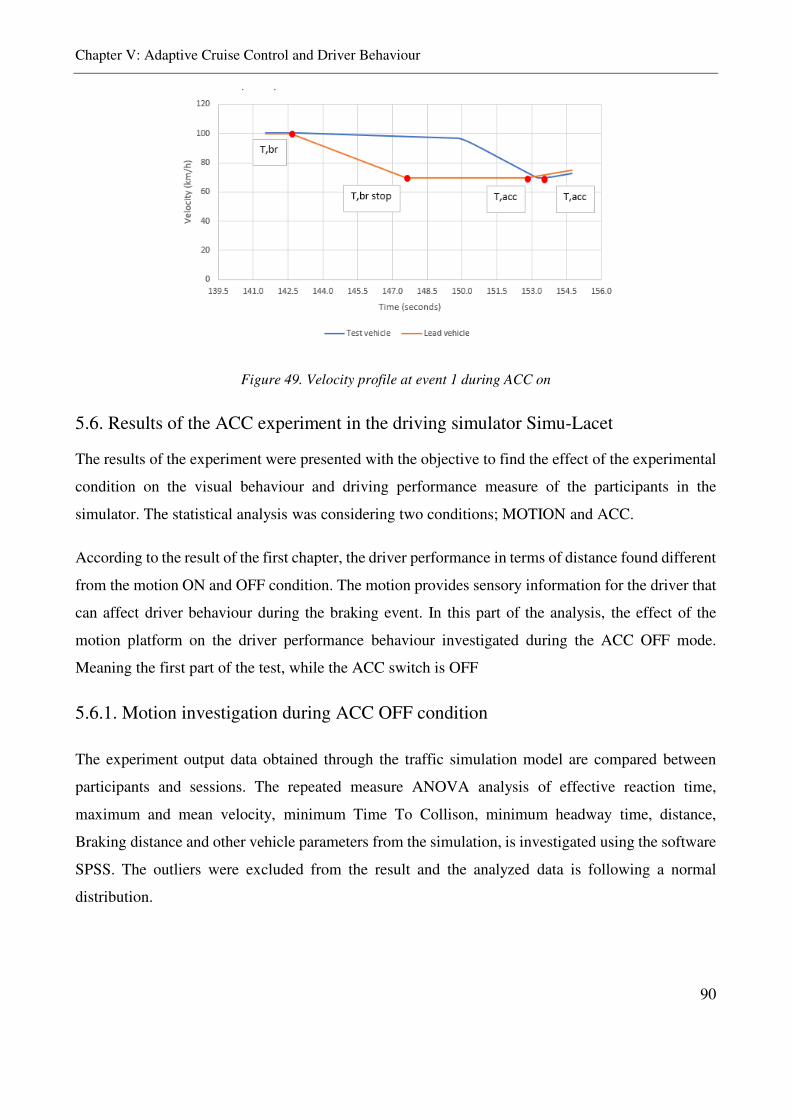
Chapter V: Adaptive Cruise Control and Driver Behaviour
90
Figure 49. Velocity profile at event 1 during ACC on
5.6. Results of the ACC experiment in the driving simulator Simu-Lacet
The results of the experiment were presented with the objective to find the effect of the experimental
condition on the visual behaviour and driving performance measure of the participants in the
simulator. The statistical analysis was considering two conditions; MOTION and ACC.
According to the result of the first chapter, the driver performance in terms of distance found different
from the motion ON and OFF condition. The motion provides sensory information for the driver that
can affect driver behaviour during the braking event. In this part of the analysis, the effect of the
motion platform on the driver performance behaviour investigated during the ACC OFF mode.
Meaning the first part of the test, while the ACC switch is OFF
5.6.1. Motion investigation during ACC OFF condition
The experiment output data obtained through the traffic simulation model are compared between
participants and sessions. The repeated measure ANOVA analysis of effective reaction time,
maximum and mean velocity, minimum Time To Collison, minimum headway time, distance,
Braking distance and other vehicle parameters from the simulation, is investigated using the software
SPSS. The outliers were excluded from the result and the analyzed data is following a normal
distribution.
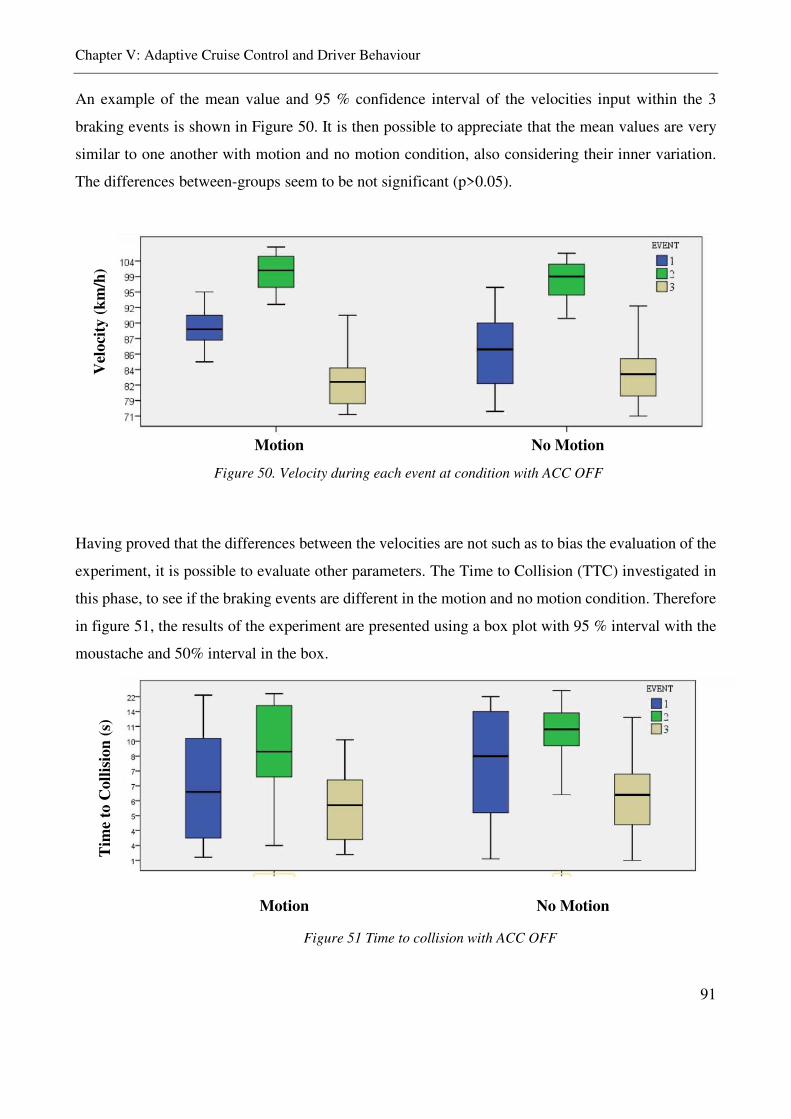
Chapter V: Adaptive Cruise Control and Driver Behaviour
91
An example of the mean value and 95 % confidence interval of the velocities input within the 3
braking events is shown in Figure 50. It is then possible to appreciate that the mean values are very
similar to one another with motion and no motion condition, also considering their inner variation.
The differences between-groups seem to be not significant (p>0.05).
Having proved that the differences between the velocities are not such as to bias the evaluation of the
experiment, it is possible to evaluate other parameters. The Time to Collision (TTC) investigated in
this phase, to see if the braking events are different in the motion and no motion condition. Therefore
in figure 51, the results of the experiment are presented using a box plot with 95 % interval with the
moustache and 50% interval in the box.
Motion No Motion
Vel
oci
ty (
km
/h)
Figure 50. Velocity during each event at condition with ACC OFF
Tim
e to
Coll
isio
n (
s)
Motion No Motion
Figure 51 Time to collision with ACC OFF
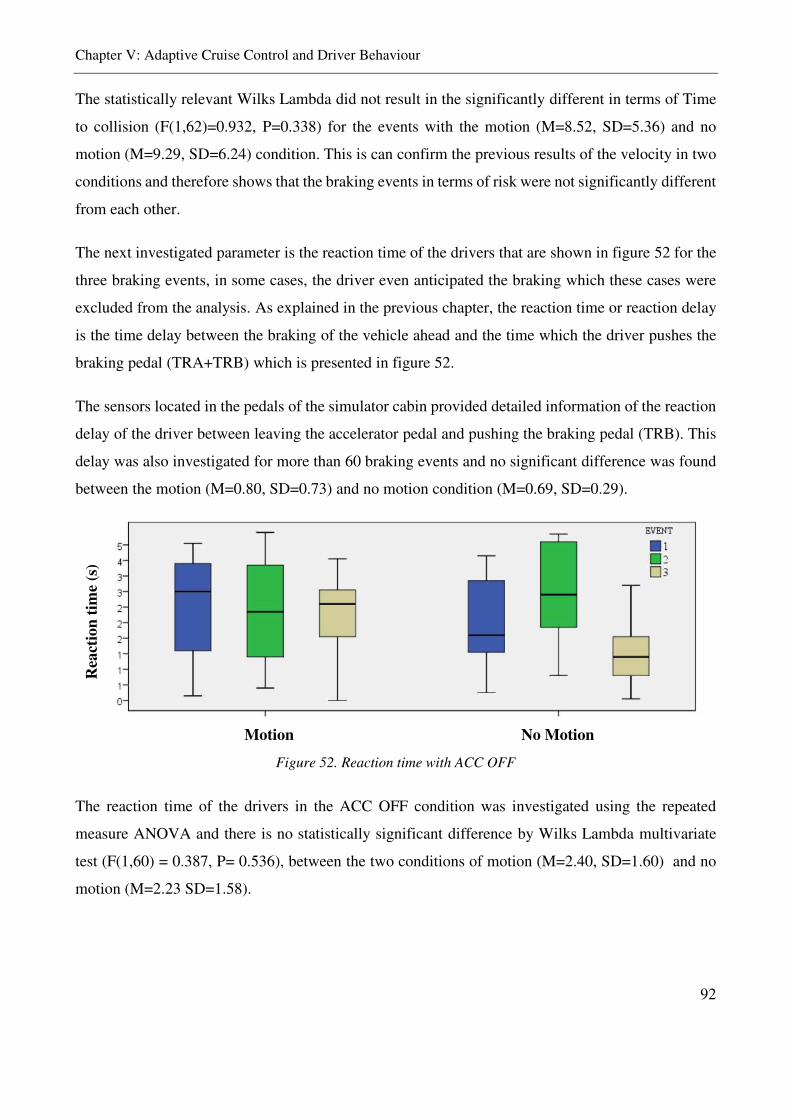
Chapter V: Adaptive Cruise Control and Driver Behaviour
92
The statistically relevant Wilks Lambda did not result in the significantly different in terms of Time
to collision (F(1,62)=0.932, P=0.338) for the events with the motion (M=8.52, SD=5.36) and no
motion (M=9.29, SD=6.24) condition. This is can confirm the previous results of the velocity in two
conditions and therefore shows that the braking events in terms of risk were not significantly different
from each other.
The next investigated parameter is the reaction time of the drivers that are shown in figure 52 for the
three braking events, in some cases, the driver even anticipated the braking which these cases were
excluded from the analysis. As explained in the previous chapter, the reaction time or reaction delay
is the time delay between the braking of the vehicle ahead and the time which the driver pushes the
braking pedal (TRA+TRB) which is presented in figure 52.
The sensors located in the pedals of the simulator cabin provided detailed information of the reaction
delay of the driver between leaving the accelerator pedal and pushing the braking pedal (TRB). This
delay was also investigated for more than 60 braking events and no significant difference was found
between the motion (M=0.80, SD=0.73) and no motion condition (M=0.69, SD=0.29).
The reaction time of the drivers in the ACC OFF condition was investigated using the repeated
measure ANOVA and there is no statistically significant difference by Wilks Lambda multivariate
test (F(1,60) = 0.387, P= 0.536), between the two conditions of motion (M=2.40, SD=1.60) and no
motion (M=2.23 SD=1.58).
Rea
ctio
n t
ime
(s)
Motion No Motion
Figure 52. Reaction time with ACC OFF
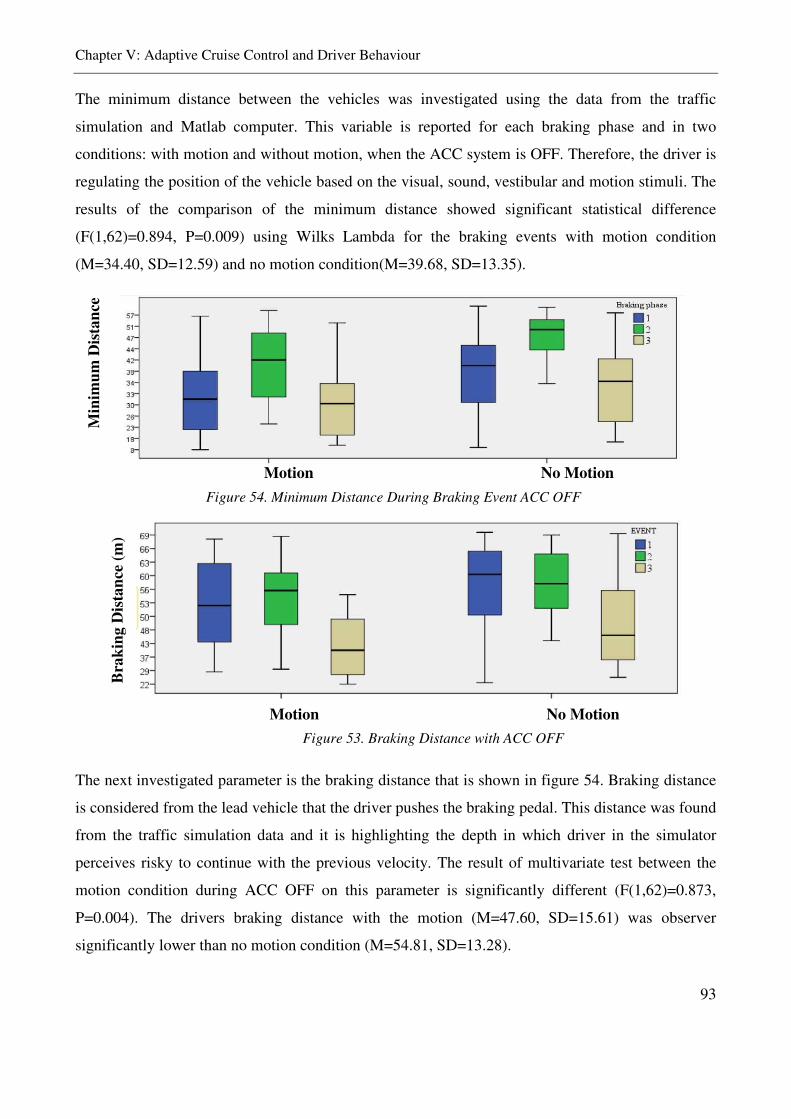
Chapter V: Adaptive Cruise Control and Driver Behaviour
93
The minimum distance between the vehicles was investigated using the data from the traffic
simulation and Matlab computer. This variable is reported for each braking phase and in two
conditions: with motion and without motion, when the ACC system is OFF. Therefore, the driver is
regulating the position of the vehicle based on the visual, sound, vestibular and motion stimuli. The
results of the comparison of the minimum distance showed significant statistical difference
(F(1,62)=0.894, P=0.009) using Wilks Lambda for the braking events with motion condition
(M=34.40, SD=12.59) and no motion condition(M=39.68, SD=13.35).
The next investigated parameter is the braking distance that is shown in figure 54. Braking distance
is considered from the lead vehicle that the driver pushes the braking pedal. This distance was found
from the traffic simulation data and it is highlighting the depth in which driver in the simulator
perceives risky to continue with the previous velocity. The result of multivariate test between the
motion condition during ACC OFF on this parameter is significantly different (F(1,62)=0.873,
P=0.004). The drivers braking distance with the motion (M=47.60, SD=15.61) was observer
significantly lower than no motion condition (M=54.81, SD=13.28).
Min
imu
m D
ista
nce
Motion No Motion
Figure 54. Minimum Distance During Braking Event ACC OFF
Bra
kin
g D
ista
nce
(m
)
Motion No Motion
Figure 53. Braking Distance with ACC OFF
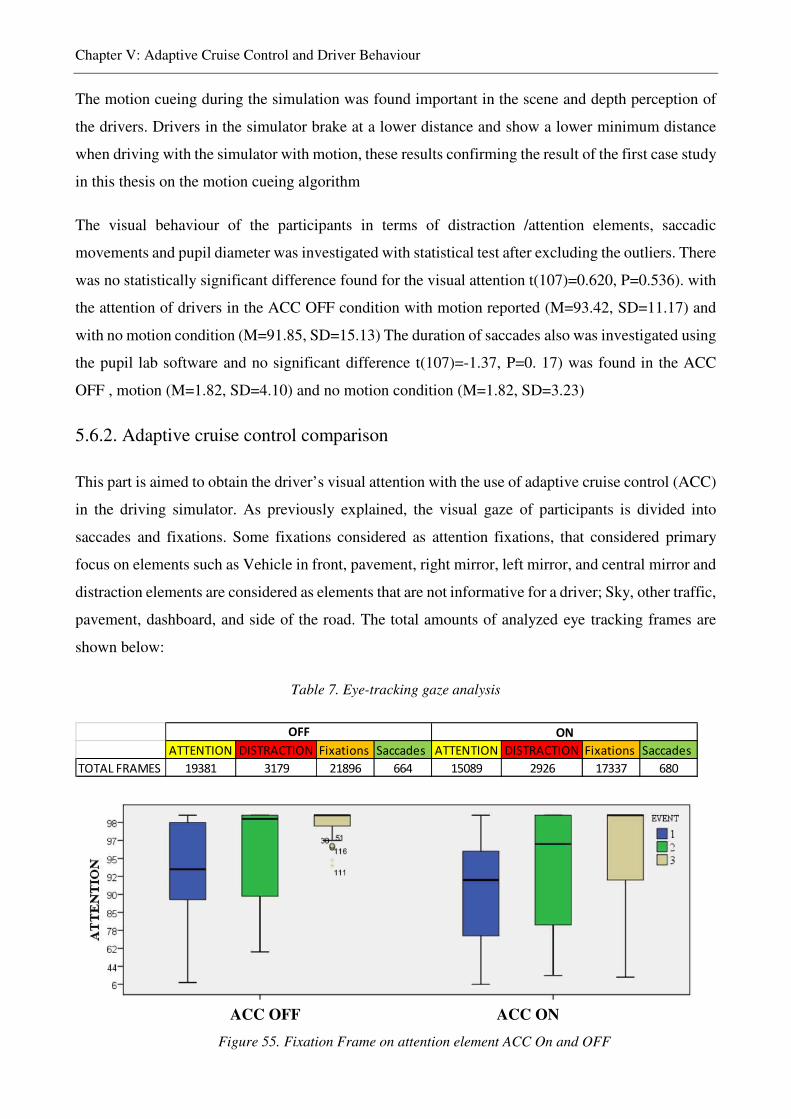
Chapter V: Adaptive Cruise Control and Driver Behaviour
94
The motion cueing during the simulation was found important in the scene and depth perception of
the drivers. Drivers in the simulator brake at a lower distance and show a lower minimum distance
when driving with the simulator with motion, these results confirming the result of the first case study
in this thesis on the motion cueing algorithm
The visual behaviour of the participants in terms of distraction /attention elements, saccadic
movements and pupil diameter was investigated with statistical test after excluding the outliers. There
was no statistically significant difference found for the visual attention t(107)=0.620, P=0.536). with
the attention of drivers in the ACC OFF condition with motion reported (M=93.42, SD=11.17) and
with no motion condition (M=91.85, SD=15.13) The duration of saccades also was investigated using
the pupil lab software and no significant difference t(107)=-1.37, P=0. 17) was found in the ACC
OFF , motion (M=1.82, SD=4.10) and no motion condition (M=1.82, SD=3.23)
5.6.2. Adaptive cruise control comparison
This part is aimed to obtain the driver’s visual attention with the use of adaptive cruise control (ACC)
in the driving simulator. As previously explained, the visual gaze of participants is divided into
saccades and fixations. Some fixations considered as attention fixations, that considered primary
focus on elements such as Vehicle in front, pavement, right mirror, left mirror, and central mirror and
distraction elements are considered as elements that are not informative for a driver; Sky, other traffic,
pavement, dashboard, and side of the road. The total amounts of analyzed eye tracking frames are
shown below:
Table 7. Eye-tracking gaze analysis
ATTENTION DISTRACTION Fixations Saccades ATTENTION DISTRACTION Fixations Saccades
TOTAL FRAMES 19381 3179 21896 664 15089 2926 17337 680
OFF ON
ACC OFF ACC ON
Figure 55. Fixation Frame on attention element ACC On and OFF
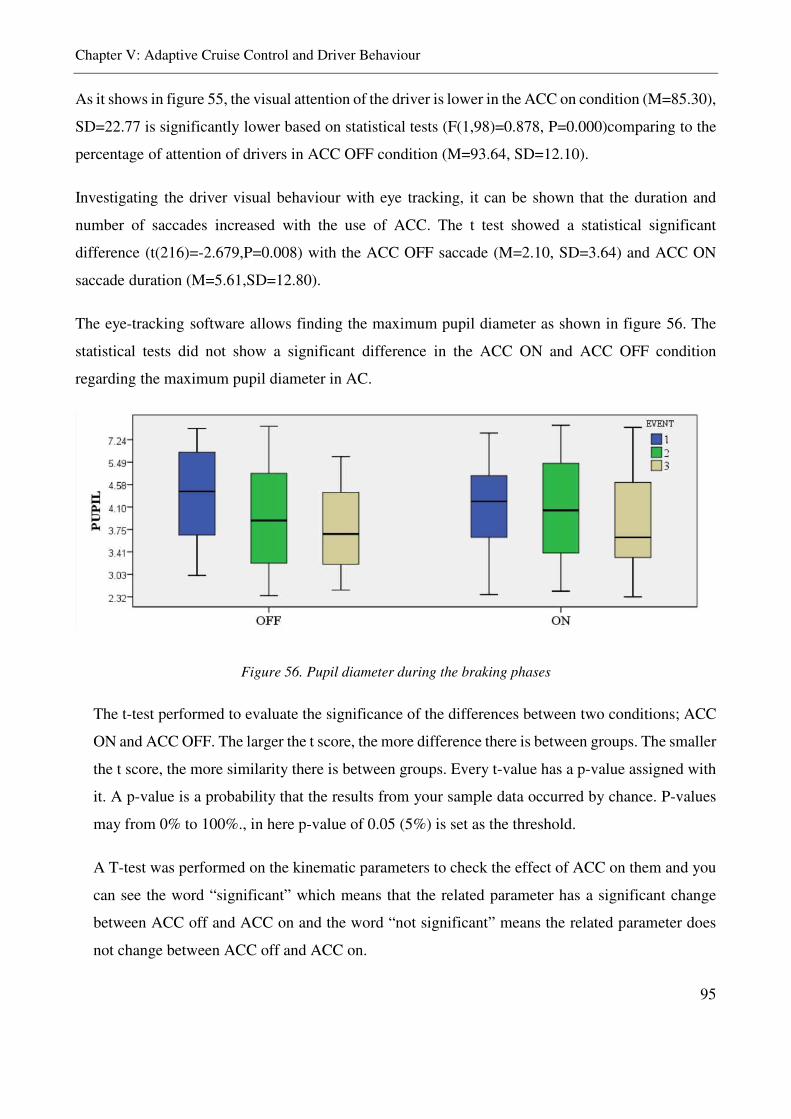
Chapter V: Adaptive Cruise Control and Driver Behaviour
95
As it shows in figure 55, the visual attention of the driver is lower in the ACC on condition (M=85.30),
SD=22.77 is significantly lower based on statistical tests (F(1,98)=0.878, P=0.000)comparing to the
percentage of attention of drivers in ACC OFF condition (M=93.64, SD=12.10).
Investigating the driver visual behaviour with eye tracking, it can be shown that the duration and
number of saccades increased with the use of ACC. The t test showed a statistical significant
difference (t(216)=-2.679,P=0.008) with the ACC OFF saccade (M=2.10, SD=3.64) and ACC ON
saccade duration (M=5.61,SD=12.80).
The eye-tracking software allows finding the maximum pupil diameter as shown in figure 56. The
statistical tests did not show a significant difference in the ACC ON and ACC OFF condition
regarding the maximum pupil diameter in AC.
Figure 56. Pupil diameter during the braking phases
The t-test performed to evaluate the significance of the differences between two conditions; ACC
ON and ACC OFF. The larger the t score, the more difference there is between groups. The smaller
the t score, the more similarity there is between groups. Every t-value has a p-value assigned with
it. A p-value is a probability that the results from your sample data occurred by chance. P-values
may from 0% to 100%., in here p-value of 0.05 (5%) is set as the threshold.
A T-test was performed on the kinematic parameters to check the effect of ACC on them and you
can see the word “significant” which means that the related parameter has a significant change
between ACC off and ACC on and the word “not significant” means the related parameter does
not change between ACC off and ACC on.
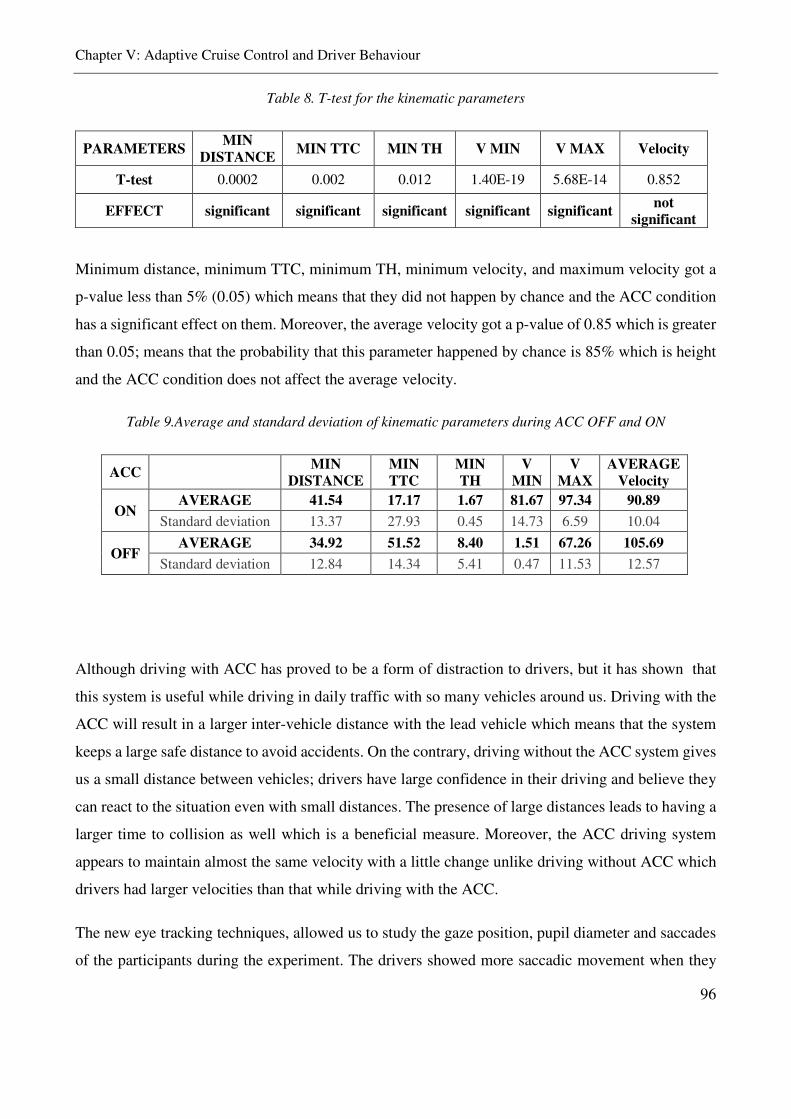
Chapter V: Adaptive Cruise Control and Driver Behaviour
96
Table 8. T-test for the kinematic parameters
PARAMETERS MIN
DISTANCE MIN TTC MIN TH V MIN V MAX Velocity
T-test 0.0002 0.002 0.012 1.40E-19 5.68E-14 0.852
EFFECT significant significant significant significant significant not
significant
Minimum distance, minimum TTC, minimum TH, minimum velocity, and maximum velocity got a
p-value less than 5% (0.05) which means that they did not happen by chance and the ACC condition
has a significant effect on them. Moreover, the average velocity got a p-value of 0.85 which is greater
than 0.05; means that the probability that this parameter happened by chance is 85% which is height
and the ACC condition does not affect the average velocity.
Table 9.Average and standard deviation of kinematic parameters during ACC OFF and ON
ACC MIN
DISTANCE
MIN
TTC
MIN
TH
V
MIN
V
MAX
AVERAGE
Velocity
ON AVERAGE 41.54 17.17 1.67 81.67 97.34 90.89
Standard deviation 13.37 27.93 0.45 14.73 6.59 10.04
OFF AVERAGE 34.92 51.52 8.40 1.51 67.26 105.69
Standard deviation 12.84 14.34 5.41 0.47 11.53 12.57
Although driving with ACC has proved to be a form of distraction to drivers, but it has shown that
this system is useful while driving in daily traffic with so many vehicles around us. Driving with the
ACC will result in a larger inter-vehicle distance with the lead vehicle which means that the system
keeps a large safe distance to avoid accidents. On the contrary, driving without the ACC system gives
us a small distance between vehicles; drivers have large confidence in their driving and believe they
can react to the situation even with small distances. The presence of large distances leads to having a
larger time to collision as well which is a beneficial measure. Moreover, the ACC driving system
appears to maintain almost the same velocity with a little change unlike driving without ACC which
drivers had larger velocities than that while driving with the ACC.
The new eye tracking techniques, allowed us to study the gaze position, pupil diameter and saccades
of the participants during the experiment. The drivers showed more saccadic movement when they
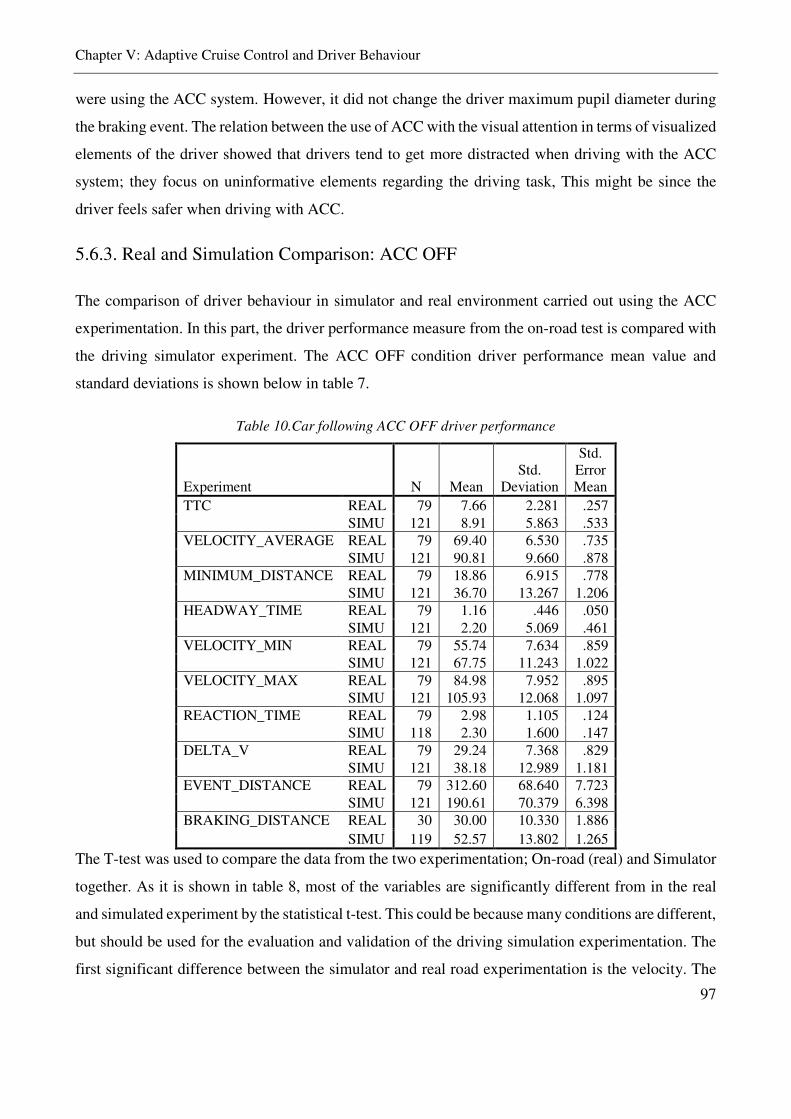
Chapter V: Adaptive Cruise Control and Driver Behaviour
97
were using the ACC system. However, it did not change the driver maximum pupil diameter during
the braking event. The relation between the use of ACC with the visual attention in terms of visualized
elements of the driver showed that drivers tend to get more distracted when driving with the ACC
system; they focus on uninformative elements regarding the driving task, This might be since the
driver feels safer when driving with ACC.
5.6.3. Real and Simulation Comparison: ACC OFF
The comparison of driver behaviour in simulator and real environment carried out using the ACC
experimentation. In this part, the driver performance measure from the on-road test is compared with
the driving simulator experiment. The ACC OFF condition driver performance mean value and
standard deviations is shown below in table 7.
Table 10.Car following ACC OFF driver performance
Experiment N Mean Std.
Deviation
Std. Error Mean
TTC REAL 79 7.66 2.281 .257 SIMU 121 8.91 5.863 .533
VELOCITY_AVERAGE REAL 79 69.40 6.530 .735 SIMU 121 90.81 9.660 .878
MINIMUM_DISTANCE REAL 79 18.86 6.915 .778 SIMU 121 36.70 13.267 1.206
HEADWAY_TIME REAL 79 1.16 .446 .050 SIMU 121 2.20 5.069 .461
VELOCITY_MIN REAL 79 55.74 7.634 .859 SIMU 121 67.75 11.243 1.022
VELOCITY_MAX REAL 79 84.98 7.952 .895 SIMU 121 105.93 12.068 1.097
REACTION_TIME REAL 79 2.98 1.105 .124 SIMU 118 2.30 1.600 .147
DELTA_V REAL 79 29.24 7.368 .829 SIMU 121 38.18 12.989 1.181
EVENT_DISTANCE REAL 79 312.60 68.640 7.723 SIMU 121 190.61 70.379 6.398
BRAKING_DISTANCE REAL 30 30.00 10.330 1.886 SIMU 119 52.57 13.802 1.265
The T-test was used to compare the data from the two experimentation; On-road (real) and Simulator
together. As it is shown in table 8, most of the variables are significantly different from in the real
and simulated experiment by the statistical t-test. This could be because many conditions are different,
but should be used for the evaluation and validation of the driving simulation experimentation. The
first significant difference between the simulator and real road experimentation is the velocity. The
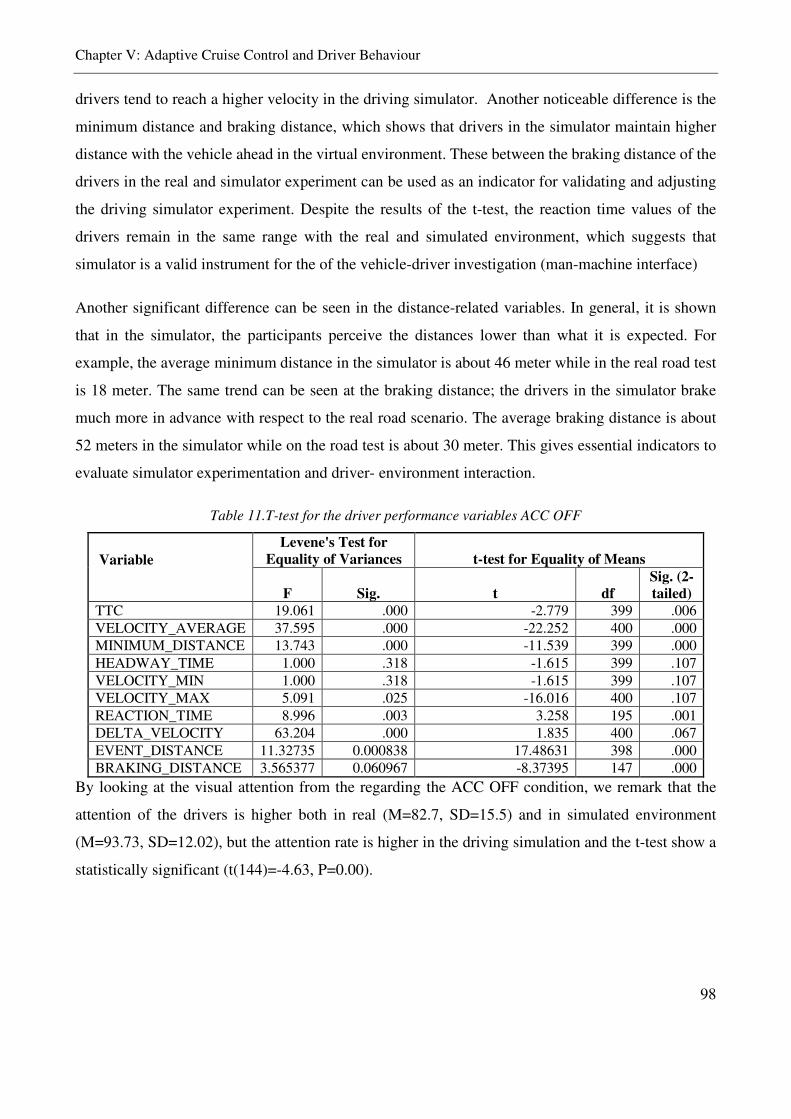
Chapter V: Adaptive Cruise Control and Driver Behaviour
98
drivers tend to reach a higher velocity in the driving simulator. Another noticeable difference is the
minimum distance and braking distance, which shows that drivers in the simulator maintain higher
distance with the vehicle ahead in the virtual environment. These between the braking distance of the
drivers in the real and simulator experiment can be used as an indicator for validating and adjusting
the driving simulator experiment. Despite the results of the t-test, the reaction time values of the
drivers remain in the same range with the real and simulated environment, which suggests that
simulator is a valid instrument for the of the vehicle-driver investigation (man-machine interface)
Another significant difference can be seen in the distance-related variables. In general, it is shown
that in the simulator, the participants perceive the distances lower than what it is expected. For
example, the average minimum distance in the simulator is about 46 meter while in the real road test
is 18 meter. The same trend can be seen at the braking distance; the drivers in the simulator brake
much more in advance with respect to the real road scenario. The average braking distance is about
52 meters in the simulator while on the road test is about 30 meter. This gives essential indicators to
evaluate simulator experimentation and driver- environment interaction.
Table 11.T-test for the driver performance variables ACC OFF
Variable
Levene's Test for
Equality of Variances t-test for Equality of Means
F Sig. t df
Sig. (2-
tailed)
TTC 19.061 .000 -2.779 399 .006 VELOCITY_AVERAGE 37.595 .000 -22.252 400 .000 MINIMUM_DISTANCE 13.743 .000 -11.539 399 .000 HEADWAY_TIME 1.000 .318 -1.615 399 .107 VELOCITY_MIN 1.000 .318 -1.615 399 .107 VELOCITY_MAX 5.091 .025 -16.016 400 .107 REACTION_TIME 8.996 .003 3.258 195 .001 DELTA_VELOCITY 63.204 .000 1.835 400 .067 EVENT_DISTANCE 11.32735 0.000838 17.48631 398 .000 BRAKING_DISTANCE 3.565377 0.060967 -8.37395 147 .000
By looking at the visual attention from the regarding the ACC OFF condition, we remark that the
attention of the drivers is higher both in real (M=82.7, SD=15.5) and in simulated environment
(M=93.73, SD=12.02), but the attention rate is higher in the driving simulation and the t-test show a
statistically significant (t(144)=-4.63, P=0.00).
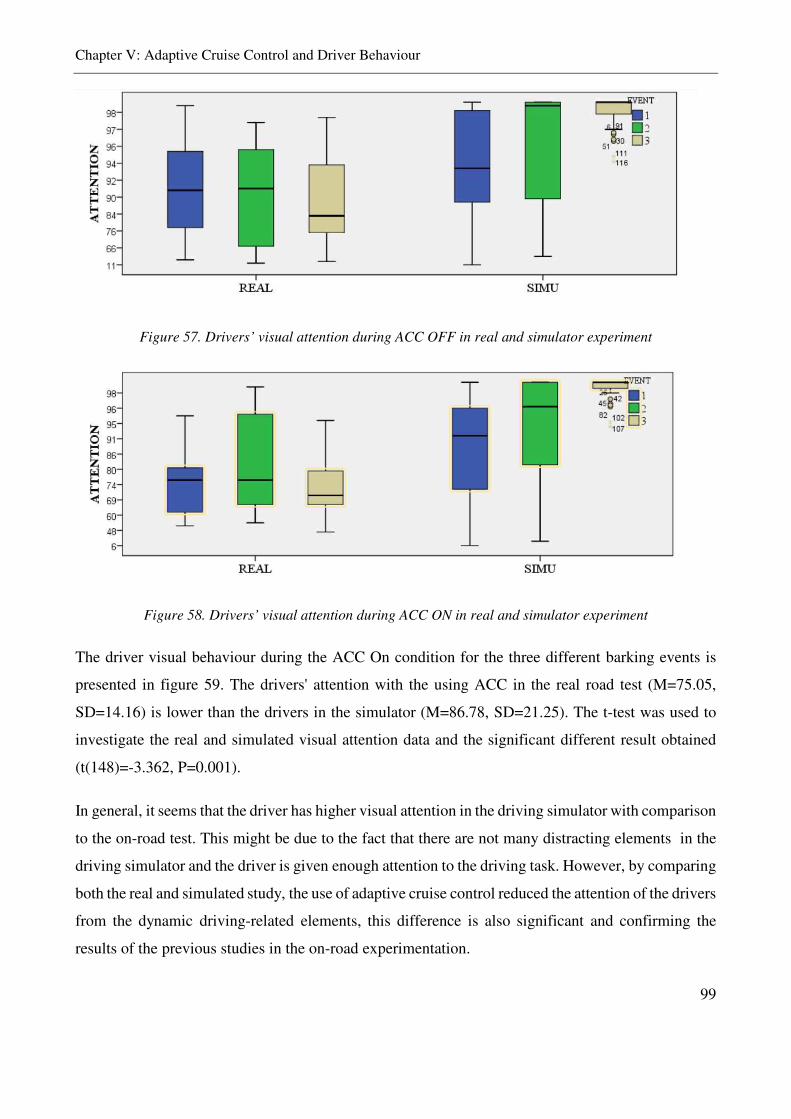
Chapter V: Adaptive Cruise Control and Driver Behaviour
99
Figure 57. Drivers’ visual attention during ACC OFF in real and simulator experiment
Figure 58. Drivers’ visual attention during ACC ON in real and simulator experiment
The driver visual behaviour during the ACC On condition for the three different barking events is
presented in figure 59. The drivers' attention with the using ACC in the real road test (M=75.05,
SD=14.16) is lower than the drivers in the simulator (M=86.78, SD=21.25). The t-test was used to
investigate the real and simulated visual attention data and the significant different result obtained
(t(148)=-3.362, P=0.001).
In general, it seems that the driver has higher visual attention in the driving simulator with comparison
to the on-road test. This might be due to the fact that there are not many distracting elements in the
driving simulator and the driver is given enough attention to the driving task. However, by comparing
both the real and simulated study, the use of adaptive cruise control reduced the attention of the drivers
from the dynamic driving-related elements, this difference is also significant and confirming the
results of the previous studies in the on-road experimentation.
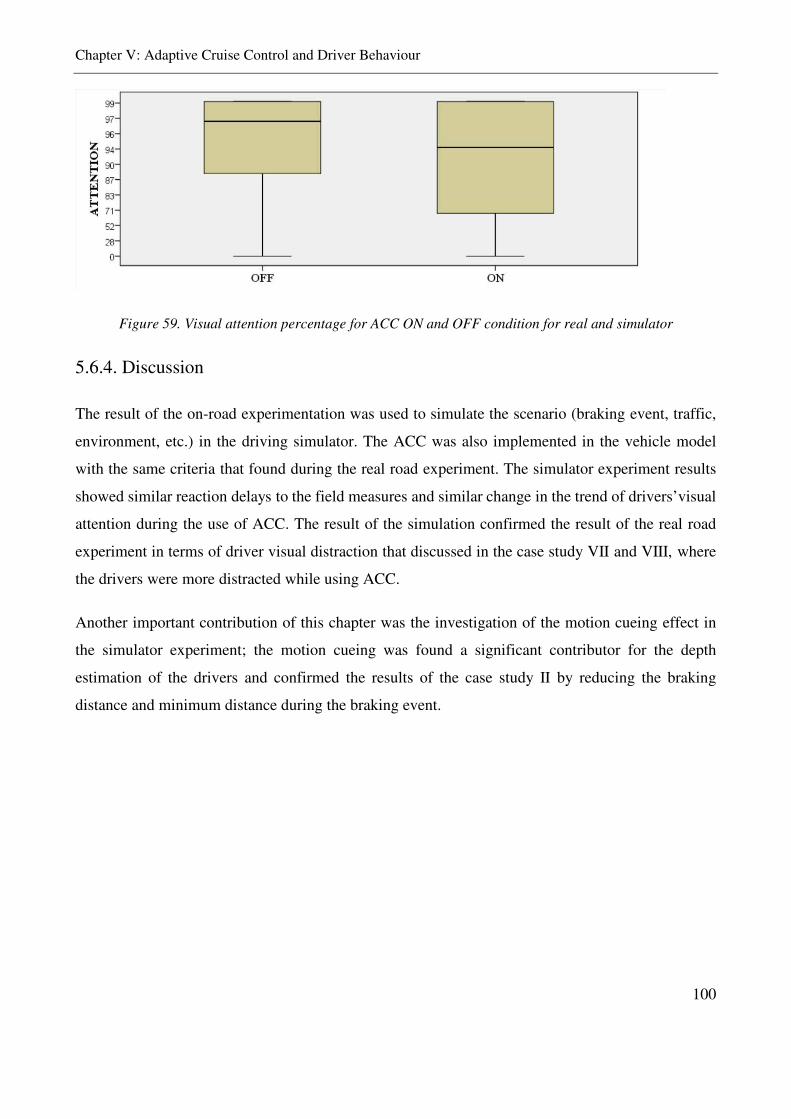
Chapter V: Adaptive Cruise Control and Driver Behaviour
100
Figure 59. Visual attention percentage for ACC ON and OFF condition for real and simulator
5.6.4. Discussion
The result of the on-road experimentation was used to simulate the scenario (braking event, traffic,
environment, etc.) in the driving simulator. The ACC was also implemented in the vehicle model
with the same criteria that found during the real road experiment. The simulator experiment results
showed similar reaction delays to the field measures and similar change in the trend of drivers’visual
attention during the use of ACC. The result of the simulation confirmed the result of the real road
experiment in terms of driver visual distraction that discussed in the case study VII and VIII, where
the drivers were more distracted while using ACC.
Another important contribution of this chapter was the investigation of the motion cueing effect in
the simulator experiment; the motion cueing was found a significant contributor for the depth
estimation of the drivers and confirmed the results of the case study II by reducing the braking
distance and minimum distance during the braking event.

Chapter VI: Conclusion
101
CHAPTER VI
Conclusion
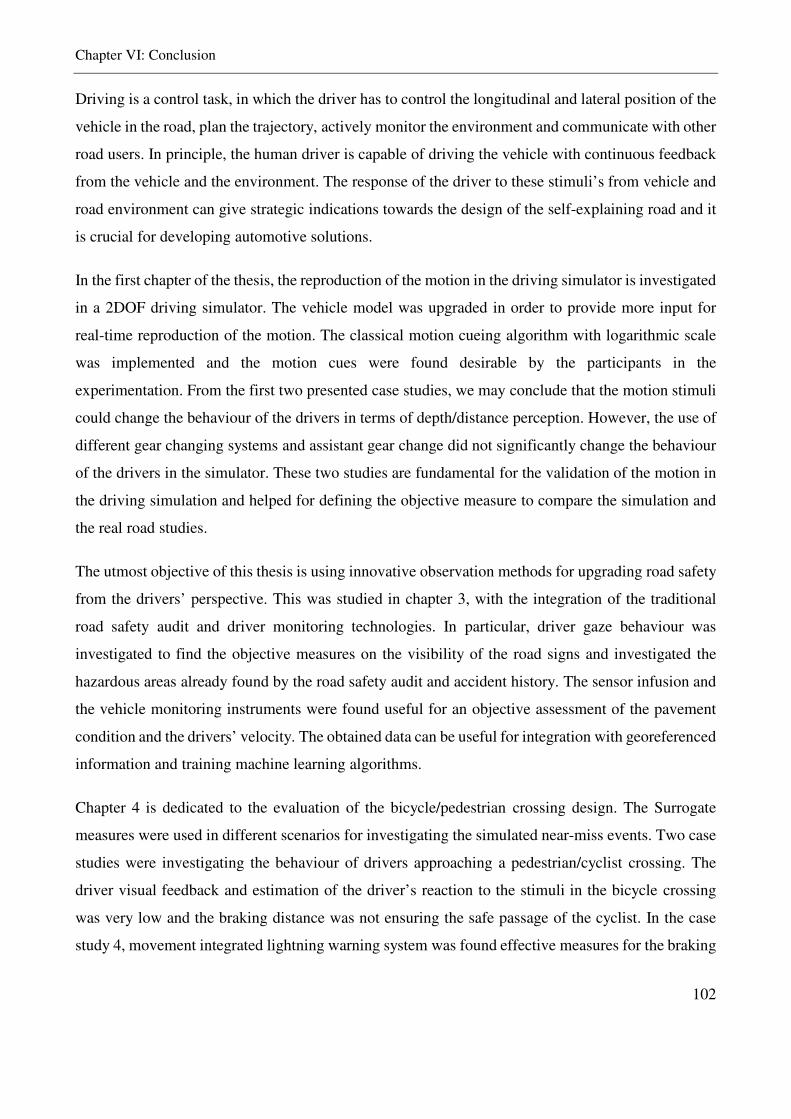
Chapter VI: Conclusion
102
Driving is a control task, in which the driver has to control the longitudinal and lateral position of the
vehicle in the road, plan the trajectory, actively monitor the environment and communicate with other
road users. In principle, the human driver is capable of driving the vehicle with continuous feedback
from the vehicle and the environment. The response of the driver to these stimuli’s from vehicle and
road environment can give strategic indications towards the design of the self-explaining road and it
is crucial for developing automotive solutions.
In the first chapter of the thesis, the reproduction of the motion in the driving simulator is investigated
in a 2DOF driving simulator. The vehicle model was upgraded in order to provide more input for
real-time reproduction of the motion. The classical motion cueing algorithm with logarithmic scale
was implemented and the motion cues were found desirable by the participants in the
experimentation. From the first two presented case studies, we may conclude that the motion stimuli
could change the behaviour of the drivers in terms of depth/distance perception. However, the use of
different gear changing systems and assistant gear change did not significantly change the behaviour
of the drivers in the simulator. These two studies are fundamental for the validation of the motion in
the driving simulation and helped for defining the objective measure to compare the simulation and
the real road studies.
The utmost objective of this thesis is using innovative observation methods for upgrading road safety
from the drivers’ perspective. This was studied in chapter 3, with the integration of the traditional
road safety audit and driver monitoring technologies. In particular, driver gaze behaviour was
investigated to find the objective measures on the visibility of the road signs and investigated the
hazardous areas already found by the road safety audit and accident history. The sensor infusion and
the vehicle monitoring instruments were found useful for an objective assessment of the pavement
condition and the drivers’ velocity. The obtained data can be useful for integration with georeferenced
information and training machine learning algorithms.
Chapter 4 is dedicated to the evaluation of the bicycle/pedestrian crossing design. The Surrogate
measures were used in different scenarios for investigating the simulated near-miss events. Two case
studies were investigating the behaviour of drivers approaching a pedestrian/cyclist crossing. The
driver visual feedback and estimation of the driver’s reaction to the stimuli in the bicycle crossing
was very low and the braking distance was not ensuring the safe passage of the cyclist. In the case
study 4, movement integrated lightning warning system was found effective measures for the braking
Chapter VI: Conclusion
103
behaviour of the drivers. These measures can be used at crossings to improve the safety and
conspicuity of the vulnerable users at the intersections.
The safety assessment during the use of level 1 automated driving “ACC” is discussed in the final
chapter of this thesis with a simulator and on-road experiment. The drivers’ visual behaviour was
investigated in both studies with innovative classification method to find the epochs of the distraction
of the drivers. The behavioural adaptation to ACC showed that drivers may divert their attention away
from the driving task to engage in secondary, non-driving-related tasks (even observing passing
traffic).
Many researchers are focusing on the simulation for the design of automated driving and assistant
systems. In the last chapter, the driver’s adaptation and performance during the use of adaptive cruise
control in the real and simulated environment was compared. The comparison of the real and
simulated experimentation confirmed the relative validity of the simulator. However, the absolute
validity in terms of driver performance did not reach. Driving simulator experimentation results
relating to the vehicle-driver interaction was very similar to the ones experimented on the road. But
for the driver and road (environment) interaction, the measures from the simulator experience were
not similar to the ones in the on-road experiment. The distance/depth estimation and velocity
estimation of the drivers were found significantly different. This issue may be considered in the
design of the driving assistant systems using simulators. Moreover, standard validation method for
the driving simulation experimentation could be suggested in the future.

104
References
105
References
Allen, Merrill J., Richard D. Hazlett, Herman L. Tacker, and Ben V. Graham. 1970. “Actual Pedestrian
Visibility and the Pedestrian’s Estimate of His Own Visibility.” Optometry and Vision Science 47 (1):
44–49. https://doi.org/10.1097/00006324-197001000-00008.
Amundsen, F., Hyden, C. 1977. “The Swedish Traffic Conflict TechniqueNo Title.” First Workshop on Traffic
Conflicts, Institute of Transport Economics, Oslo, Norway, 1–5.
Arioui, Hichem, Salim Hima, Lamri Nehaoua, Hichem Arioui, Salim Hima, Lamri Nehaoua, D O F Low, et
al. 2009. “2 DOF Low Cost Platform for Driving Simulator : Design and Modeling Control.” In The 2009
IEEE/ASME International Conference on Advanced Intelligent Mechatronics, 1206–11. Singapore:
IEEE.
Balachandran, Avinash, and J. Christian Gerdes. 2013. Artificial Steering Feel Design for Steer-by-Wire
Vehicles. IFAC Proceedings Volumes (IFAC-PapersOnline). Vol. 7. IFAC.
https://doi.org/10.3182/20130904-4-JP-2042.00131.
Balk, Stacy A., Richard A. Tyrrell, Johnell O. Brooks, and Thomas L. Carpenter. 2008. “Highlighting Human
Form and Motion Information Enhances the Conspicuity of Pedestrians at Night.” Perception 37 (8):
1276–84. https://doi.org/10.1068/p6017.
Beanland, Vanessa, Michael Fitzharris, Kristie L Young, and Michael G Lenné. 2013. “Driver Inattention and
Driver Distraction in Serious Casualty Crashes : Data from the Australian National Crash In-Depth
Study.” Accident Analysis and Prevention 54: 99–107. https://doi.org/10.1016/j.aap.2012.12.043.
Bella, Francesco, and Manuel Silvestri. 2015. “Effects of Safety Measures on Driver’s Speed Behavior at
Pedestrian Crossings.” Accident Analysis and Prevention. https://doi.org/10.1016/j.aap.2015.07.016.
Berthoz, Alain, Willem Bles, H. H. Bülthoff, B. J.Correia Grácio, Philippus Feenstra, Nicolas Filliard, R.
Hühne, et al. 2013. “Motion Scaling for High-Performance Driving Simulators.” IEEE Transactions on
Human-Machine Systems 43 (3): 265–76. https://doi.org/10.1109/TSMC.2013.2242885.
Biassoni, Federica, Manuela Bina, Federica Confalonieri, and Rita Ciceri. 2018. “Visual Exploration of
Pedestrian Crossings by Adults and Children : Comparison of Strategies.” Transportation Research Part
F: Psychology and Behaviour 56: 227–35. https://doi.org/10.1016/j.trf.2018.04.009.
Bichicchi, A, F Mazzotta, C Lantieri, V Vignali, A Simone, G Dondi, and M Costa. 2017. “The Influence of
Pedestrian Crossing Features on Driving Behavior and Road Safety.” In Proceedings of the AIIT
International Congress, edited by G Dall’Acqua and F Wegman, 741–46. London: CRC Press.
References
106
Bles, Willem, Jelte E Bos, Bernd De Graaf, Eric Groen, and Alexander H Wertheim. 1999. “Motion Sickness
Only One Provocative Conflict” 47 (5): 481–87.
Boer, E.R., and R.V. Kenyon. 1998. “Estimation of Time-Varying Delay Time in Nonstationary Linear
Systems: An Approach to Monitor Human Operator Adaptation in Manual Tracking Tasks.” IEEE
Transactions on Systems, Man, and Cybernetics - Part A: Systems and Humans 28 (1): 89–99.
https://doi.org/10.1109/3468.650325.
Bose, Dipan, Patricio V Marquez, and Soames Job. 2018. “The Cost of Inaction : Can We Afford Not to Invest
in Road Safety ?”
Brady, John, Alison Mills, Jeff Loskorn, Jen Duthie, and Randy Machemehl. 2010. “Effects of Colored Lane
Markings on Bicyclist and Motorist Behavior at Conflict Areas.”
Brooks, J O., R A. Tyrrell, and T A. Frank. 2005. “The Effects of Severe Visual Challenges on Steering
Performance in Visually Healthy Young Drivers.” Optometry and Vision Science 82 (8): 689–97.
https://doi.org/10.1097/01.opx.0000174722.96171.86.
“BS EN 1436 : 2018 BSI Standards Publication Road Marking Materials – Road Marking Performance for
Road Users and Test Methods.” 2018, no. April.
Bucchi, Alberto, Cesare Sangiorgi, and Valeria Vignali. 2012. “Traffic Psychology and Driver Behavior.”
Procedia - Social and Behavioral Sciences 53 (October): 972–79.
https://doi.org/10.1016/j.sbspro.2012.09.946.
Buonarosa, Mary Lynn, James R. Sayer, and Michael J. Flannagan. 2008. “Real-World Frequency of Use of
Automotive Lighting Equipment.” LEUKOS - Journal of Illuminating Engineering Society of North
America 5 (2): 139–46. https://doi.org/10.1582/LEUKOS.2008.05.02.004.
Burghardt, Tomasz E, Anton Pashkevich, and Harald Mosböck. 2019. “Yellow Pedestrian Crossings : From
Innovative Technology for Glass Beads to a New Retroreflectivity Regulation Yellow Pedestrian
Crossings : From Innovative Technology for Glass Beads to a New Retroreflectivity Regulation.” Case
Studies on Transport Policy. https://doi.org/10.1016/j.cstp.2019.07.007.
Caro, Stéphane, Viola Cavallo, Christian Marendaz, Erwin R. Boer, and Fabrice Vienne. 2009. “Can Headway
Reduction in Fog Be Explained by Impaired Perception of Relative Motion?” Human Factors 51 (3):
378–92. https://doi.org/10.1177/0018720809339621.
Cleij, D., J. Venrooij, P. Pretto, M. Katliar, H. H. Bülthoff, D. Steffen, F. W. Hoffmeyer, and H. P. Schöner.
2016. “Comparison between Filter- and Optimization-Based Motion Cueing Algorithms for Driving
Simulation.” Transportation Research Part F: Traffic Psychology and Behaviour.
References
107
https://doi.org/10.1016/j.trf.2017.04.005.
Costa, M, A Simone, V Vignali, C Lantieri, and N Palena. 2018. “Fixation Distance and Fixation Duration to
Vertical Road Signs.” Applied Ergonomics 69 (May): 48–57.
https://doi.org/10.1016/J.APERGO.2017.12.017.
Costa, Marco, Arianna Bichicchi, Mattia Nese, Claudio Lantieri, Valeria Vignali, and Andrea Simone. 2019.
“T-Junction Priority Scheme and Road User’s Yielding Behavior.” Transportation Research Part F:
Traffic Psychology and Behaviour 60: 770–82. https://doi.org/10.1016/j.trf.2018.12.009.
Costa, Marco, Leonardo Bonetti, Valeria Vignali, Arianna Bichicchi, Claudio Lantieri, and Andrea Simone.
2019. “Driver’s Visual Attention to Different Categories of Roadside Advertising Signs.” Applied
Ergonomics 78 (July): 127–36. https://doi.org/10.1016/J.APERGO.2019.03.001.
Costa, Marco, Leonardo Bonetti, Valeria Vignali, Claudio Lantieri, and Andrea Simone. 2018. “The Role of
Peripheral Vision in Vertical Road Sign Identification and Discrimination.” Ergonomics 61 (12): 1619–
34. https://doi.org/10.1080/00140139.2018.1508756.
Costa, Marco, Federico Cuppi, Claudio Lantieri, Andrea Simone, Valeria Vignali, Ennia Acerra, and Arianna
Bichicchi. 2018a. “Effects of Median Refuge Island and Flashing Vertical Sign on Conspicuity and
Safety of Unsignalized Crosswalks.” Transportation Research Part F: Traffic Psychology and Behaviour
60: 427–39. https://doi.org/10.1016/j.trf.2018.10.033.
Costa, Marco, Andrea Simone, Valeria Vignali, Claudio Lantieri, Alberto Bucchi, and Giulio Dondi. 2014.
“Looking Behavior for Vertical Road Signs.” Transportation Research Part F: Traffic Psychology and
Behaviour 23 (March): 147–55. https://doi.org/10.1016/j.trf.2014.01.003.
Dondi, Giulio, Andrea Simone, Claudio Lantieri, and Valeria Vignali. 2011. “Procedia Engineering Bike Lane
Design : The Context Sensitive Approach” 21: 897–906. https://doi.org/10.1016/j.proeng.2011.11.2092.
Espié, S., and J.M. Auberlet. 2007. “ARCHISIM: A Behavioural Multi-Actors Traffic Simulation Model for
the Study of a Traffic System Including ITS Aspects.” International Journal of ITS Research 5: 7–16.
European Road Safety Observatory. 2018a. “Annual Accident Report.” https://doi.org/10.1016/B978-1-
56053-461-7.50039-5.
Fambro, D B, D L Picha, and K Fitzpatrick. n.d. “Driver Perception – Brake Response In,” no. 98: 1–7.
Faure, Vérane, Régis Lobjois, and Nicolas Benguigui. 2016. “The Effects of Driving Environment Complexity
and Dual Tasking on Drivers ’ Mental Workload and Eye Blink Behavior” 40: 78–90.
https://doi.org/10.1016/j.trf.2016.04.007.
References
108
Fekety, Drea K., Darlene E. Edewaard, Ashley A. Stafford Sewall, and Richard A. Tyrrell. 2016.
“Electroluminescent Materials Can Further Enhance the Nighttime Conspicuity of Pedestrians Wearing
Retroreflective Materials.” Human Factors: The Journal of the Human Factors and Ergonomics Society
58 (7): 976–85. https://doi.org/10.1177/0018720816651535.
Fisher, D.L.; Rizzo, M.; Caird, J.K.; Lee, J.D. 2011. Handbook of Driving Simul Ation for Engineering ,
Medicine ,.
Flumeri, Gianluca Di, Gianluca Borghini, Pietro Aricò, Nicolina Sciaraffa, and Paola Lanzi. 2019. EEG-Based
Mental Workload Assessment During Real Driving : A Taxonomic Tool for Neuroergonomics in Highly
Automated Environments. Neuroergonomics: The Brain at Work and in Everyday Life. Elsevier.
https://doi.org/10.1016/B978-0-12-811926-6.00020-8.
Francesco, Giulio, Bianchi Piccinini, and Carlos M Rodrigues. 2012. “Effects on Driving Task and Road
Safety Impact Induced by the Usage of Adaptive Cruise Control ( ACC ): A Focus Groups Study,” no.
January. https://doi.org/10.1504/IJHFE.2012.050870.
Ghasemi, Navid, Ennia Acerra, Valeria Vignali, Claudio Lantieri, and Andrea Simone. 2019. “ScienceDirect
Road Safety Review Update by Using Innovative Technologies to Investigate Driver Behaviour.” In
TISROMA2019, 00:1–8.
Gómez, Radhameris A, Samuel Siby, Matthew R E Romoser, Luis Roman Gerardino, Michael Knodler, John
Collura, and Donald L. Fisher. 2013. “A Driving Simulator Evaluation of Road Markings and Symbolic
Signs on Vehicle-Pedestrian Conflicts.” In , 15–17.
Gonzalo-Orden, Hernán, Heriberto Pérez-Acebo, Alaitz Linares Unamunzaga, and Marta Rojo Arce. 2018.
“Effects of Traffic Calming Measures in Different Urban Areas.” Transportation Research Procedia 33:
83–90. https://doi.org/10.1016/j.trpro.2018.10.079.
Grüner, Markus, and Ulrich Ansorge. 2017. “Mobile Eye Tracking during Real-World Night Driving: A
Selective Review of Findings and Recommendations for Future Research | Journal of Eye Movement
Research.”
Guo, Fu, Yi Ding, Weilin Liu, Chang Liu, and Xuefeng Zhang. 2016. “International Journal of Industrial
Ergonomics Can Eye-Tracking Data Be Measured to Assess Product Design ?: Visual Attention
Mechanism Should Be Considered.” International Journal of Industrial Ergonomics 53: 229–35.
https://doi.org/10.1016/j.ergon.2015.12.001.
Haj-Fraj, A., and F. Pfeiffer. 1998. “Simulation of Gear Shift Operations in Automatic Transmission.” IFAC
Proceedings Volumes 31 (27): 85–90. https://doi.org/10.1016/S1474-6670(17)40010-3.
References
109
Hamed, Mohammed M. 2001. “Analysis of Pedestrians’ Behavior at Pedestrian Crossings.” Safety Science 38
(1): 63–82. https://doi.org/10.1016/S0925-7535(00)00058-8.
Hesjevoll, I. 2016. “Revisjon Av Trafikksikkerhethsåndboken: Kapittel 3.10 Regulering for Fotgjengere
(Revision Ofthe Handbook Ofroad Safety Measures - Chapter 3.10 Pedestrian Crosswalks).” Institute of
Transport Economics - University of Oslo. 2016.
Hoedemaeker, M, and K A Brookhuis. 1998. “Behavioural Adaptation to Driving with an Adaptive Cruise
Control ( ACC )” 1: 95–106.
Hogema, Jeroen, Mark Wentink, and Gary Bertollini. 2012. “Effects of Yaw Motion on Driving Behaviour ,
Comfort and Realism.” Driving Simulation Conference 2012, 1–8.
Houten, Ron Van, Ralph Ellis, and Erick Marmolejo. 2008. “Stutter-Flash Light-Emitting-Diode Beacons to
Increase Yielding to Pedestrians at Crosswalks.” Transportation Research Record: Journal of the
Transportation Research Board 2073 (1): 69–78. https://doi.org/10.3141/2073-08.
Hunter, William W, David L Harkey, J Richard Stewart, and Mia L Birk. 1999. “Evaluation of Blue Bike-
Lane Treatment in Portland , Oregon,” no. 00: 107–15.
Hydén, C. 1987. “The Development of a Method for Traffic Safety Evaluation: The Swedish Traffic Conflict
Technique.,” 16.
Imine, H, Y Delanne, and N K M ’sirdi. 2006. “Vehicle System Dynamics Road Profile Input Estimation in
Vehicle Dynamics Simulation Road Profile Input Estimation in Vehicle Dynamics Simulation.” Vehicle
System Dynamics 44 (4): 285–303. https://doi.org/10.1080/00423110500333840.
Imine, Hocine. 2003. “Observation d ’ États d ’ Un Véhicule Pour l ’ Estimation Du Profil Dans Les Traces
de Roulement Thèse Hocine Imine,” no. december.
Italian Highway Code. 1992a. “D.L. 285, April 30th 1992.”
Johansson, Gunnar, and Kare Rumar. 1971. “Drivers ’ Brake Reaction Times” 13 (1): 23–27.
Jurecki, Rafał S., and Tomasz L. Stańczyk. 2014. “Driver Reaction Time to Lateral Entering Pedestrian in a
Simulated Crash Traffic Situation.” Transportation Research Part F: Traffic Psychology and Behaviour
27 (November): 22–36. https://doi.org/10.1016/J.TRF.2014.08.006.
Kapitaniak, Bronisław, Marta Walczak, Marcin Kosobudzki, and Zbigniew Jóźwiak. 2015. “APPLICATION
OF EYE-TRACKING IN DRIVERS TESTING : A REVIEW OF RESEARCH” 28 (6): 941–54.
Kemeny, Andras, and Francesco Panerai. 2003. “Evaluating Perception in Driving Simulation Experiments.”
Trends in Cognitive Sciences 7 (1): 31–37. https://doi.org/10.1016/S1364-6613(02)00011-6.
References
110
Kennedy, R.S., J.M. Drexler, D.E. Compton, K.M. Stanney, D.S. Lanham, and D.L. Harm. 2003. “Configural
Scoring of Simulator Sickness, Cybersickness and Space Adaptation Syndrome: Similarities and
Differences.” Virtual and Adaptive Environments Applications Implications and Human Performance
Issues, 247–78. https://doi.org/10.1201/9781410608888.ch12.
Kennedy, Robert S, Norman E Lane, S Kevin, and Michael G Lilienthal. 1993. “The International Journal of
Aviation Psychology Simulator Sickness Questionnaire : An Enhanced Method for Quantifying
Simulator Sickness.” The International Journal of Aviation Psychology 3 (3): 203–20.
https://doi.org/10.1207/s15327108ijap0303.
Lackner, J R, and P DiZio. 2006. “Space Motion Sickness.” Exp.Brain Res. 175: 377–99.
Lakerveld, P. R., H. J. Damveld, D. M. Pool, K. van der El, M. M. van Paassen, and M. Mulder. 2016. “The
Effects of Yaw and Sway Motion Cues in Curve Driving Simulation.” IFAC-PapersOnLine 49 (19): 500–
505. https://doi.org/10.1016/j.ifacol.2016.10.640.
Land, Michael F. 2019. “Vision , Eye Movements , and Natural Behavior,” no. May: 51–62.
https://doi.org/10.1017/S0952523808080899.
Lantieri, C., R. Lamperti, A. Simone, M. Costa, V. Vignali, C. Sangiorgi, and G. Dondi. 2015. “Gateway
Design Assessment in the Transition from High to Low Speed Areas.” Transportation Research Part F:
Traffic Psychology and Behaviour 34: 41–53. https://doi.org/10.1016/j.trf.2015.07.017.
Lantieri, Claudio, Andrea Simone, Giulio Dondi, Valeria Vignali, Arianna Bichicchi, and Marco Costa. 2018.
“Road Sign Vision and Driver Behaviour in Work Zones.” Transportation Research Part F: Traffic
Psychology and Behaviour 60: 474–84. https://doi.org/10.1016/j.trf.2018.11.005.
Larsson, Annika F L, Katja Kircher, and Jonas Andersson. 2014. “Learning from Experience : Familiarity with
ACC and Responding to a Cut-in Situation in Automated Driving.” Transportation Research Part F:
Psychology and Behaviour 27: 229–37. https://doi.org/10.1016/j.trf.2014.05.008.
Laureshyn, Aliaksei. 2010. Application of Automated Video Analysis to Road User Behaviour. Lund
University.
Laureshyn, Aliaksei, Maartje de Goede, Nicolas Saunier, and Aslak Fyhri. 2017. “Cross-Comparison of Three
Surrogate Safety Methods to Diagnose Cyclist Safety Problems at Intersections in Norway.” Accident
Analysis & Prevention 105 (August): 11–20. https://doi.org/10.1016/J.AAP.2016.04.035.
Laureshyn, Aliaksei, Maartje De Goede, Nicolas Saunier, and Aslak Fyhri. 2016. “Cross-Comparison of Three
Surrogate Safety Methods to Diagnose Cyclist Safety Problems at Intersections in Norway.” Accident
Analysis and Prevention, 1–10. https://doi.org/10.1016/j.aap.2016.04.035.
References
111
Laureshyn, Aliaksei, Åse Svensson, and Christer Hydén. 2010. “Evaluation of Traffic Safety, Based on Micro-
Level Behavioural Data: Theoretical Framework and First Implementation.” Accident Analysis &
Prevention 42 (6): 1637–46. https://doi.org/10.1016/J.AAP.2010.03.021.
Lee, John D, Daniel V Mcgehee, Timothy L Brown, and Michelle L Reyes. 2002. “Collision Warning Timing
, Driver Distraction , and Driver Response to Imminent Rear-End Collisions in a High-Fidelity Driving
Simulator” 44 (2): 314–34.
Lenné, Michael G, Christina M Rudin-Brown, Jordan Navarro, Jessica Edquist, Margaret Trotter, and Nebojsa
Tomasevic. 2011. “Driver Behaviour at Rail Level Crossings: Responses to Flashing Lights, Traffic
Signals and Stop Signs in Simulated Rural Driving.” Applied Ergonomics 42 (4): 548–54.
https://doi.org/10.1016/j.apergo.2010.08.011.
Li, Xiaomeng, Andry Rakotonirainy, and Xuedong Yan. 2019. “How Do Drivers Avoid Collisions? A Driving
Simulator-Based Study.” Journal of Safety Research 70 (September): 89–96.
https://doi.org/10.1016/J.JSR.2019.05.002.
Lobjois, Régis, Isabelle Anne Siegler, and Franck Mars. 2016. “Effects of Visual Roll on Steering Control and
Gaze Behavior in a Motorcycle Simulator.” Transportation Research Part F: Traffic Psychology and
Behaviour 38: 55–66. https://doi.org/10.1016/j.trf.2016.01.002.
London, Mayor of. 2016. “London Cycling Design Standards.” Vol. 5-Bicycle.
Lotz, Alexander, and Sarah Weissenberger. 2019. “Predicting Take-Over Times of Truck Drivers in
Conditional Autonomous Driving,” July, 329–38. https://doi.org/10.1007/978-3-319-93885-1_30.
Mecheri, Sami, Florence Rosey, and Régis Lobjois. 2017. “The e Ff Ects of Lane Width , Shoulder Width ,
and Road Cross-Sectional Reallocation on Drivers ’ Behavioral Adaptations.” Accident Analysis and
Prevention 104 (March): 65–73. https://doi.org/10.1016/j.aap.2017.04.019.
Michon, John A. n.d. “A CRITICAL VIEW OF DRIVER BEHAVIOR MODELS : WHAT DO WE KNOW ,
WHAT SHOULD WE DO ?,” 516–20.
Ministry of Infrastructures and Transports. 2001. “NORME FUNZIONALI E GEOMETRICHE PER LA
COSTRUZIONE DELLE STRADE.”
Mohellebi, Hakim. 2005. “Conception et Réalisation de Systèmes de Restitution de Mouvement et de Retour
Haptique Pour Un Simulateur de Conduite à Faible Coût Dédié à l’étude Comportementale Du
Conducteur.” ’UNIVERSITE D’EVRY-VAL D’ESSONNE.
Morrison, Christopher N, Jason Thompson, Michelle C Kondo, and Ben Beck. 2019. “On-Road Bicycle Lane
Types , Roadway Characteristics , and Risks for Bicycle Crashes.” Accident Analysis and Prevention
References
112
123 (November 2018): 123–31. https://doi.org/10.1016/j.aap.2018.11.017.
Muttart, Jeffrey W., Swaroop Dinakar, Gregory Vandenberg, and Michael Yosko. 2016. “The Influence of
Driver Expectation When Recognizing Lighted Targets at Nighttime.” Proceedings of the Human Factors
and Ergonomics Society. https://doi.org/10.1177/1541931213601111.
Naomi Dunn, Thomas Dingus, Susan Soccolich. 2019. “Understanding the Impact of Technology : Do
Advanced Driver Assistance and Semi- Automated Vehicle Systems Lead to Improper Driving
Behavior ?”
Nassi, R B. 2001. “Pedestrians.” In Traffic Control Devices Handbook. Washington, DC: Institute of
Transportation Engineers.
Nehaoua, L., A. Amouri, and H. Arioui. 2005. “Classic and Adaptive Washout Comparison for a Low Cost
Driving Simulator.” Proceedings of the 20th IEEE International Symposium on Intelligent Control, ISIC
’05 and the 13th Mediterranean Conference on Control and Automation, MED ’05 2005: 586–91.
https://doi.org/10.1109/.2005.1467080.
Nehaoua, Lamri, Hichem Arioui, Hakim Mohellebi, Stéphane Espié, Lamri Nehaoua, Hichem Arioui, Hakim
Mohellebi, Stéphane Espié, and Motion Cueing. 2009. “Motion Cueing Algorithms for Small Driving
Simulator . To Cite This Version : HAL Id : Hal-00342965 Motion Cueing Algorithms for Small Driving
Simulator.”
NHTSA. 2015. “Critical Reasons for Crashes Investigated in the National Motor Vehicle Crash Causation
Survey.”
Owens, D. Alfred, and Richard A. Tyrrell. 1999. “Effects of Luminance, Blur, and Age on Nighttime Visual
Guidance: A Test of the Selective Degradation Hypothesis.” Journal of Experimental Psychology:
Applied 5 (2): 115–28. https://doi.org/10.1037/1076-898X.5.2.115.
Owens, D. Alfred, Joanne M. Wood, and Justin M. Owens. 2007. “Effects of Age and Illumination on Night
Driving: A Road Test.” Human Factors: The Journal of the Human Factors and Ergonomics Society 49
(6): 1115–31. https://doi.org/10.1518/001872007X249974.
Park, Jooho, Donghyun Sung, and Woon-sung Lee. 2006. “A Driving Simulator Study on Adaptive Cruise
Control Failure.” In SICE-ICASE International Joint Conference, 2138–41. Busan.
PARRISH, R., J. DIEUDONNE, R. BOWLES, and D. MARTIN, JR. 1973. “Coordinated Adaptive Washout
for Motion Simulators.” Visual and Motion Simulation Conference, no. 73.
https://doi.org/10.2514/6.1973-930.
Pauwelussen, Joop P. 2014. Essentials of Vehicle Dynamics. Essentials of Vehicle Dynamics.
References
113
https://doi.org/10.1016/C2014-0-00503-5.
Perdomo, Mario, Ali Rezaei, Zachary Patterson, Nicolas Saunier, and Luis F. Miranda-Moreno. 2014.
“Pedestrian Preferences with Respect to Roundabouts - A Video-Based Stated Preference Survey.”
Accident Analysis and Prevention 70: 84–91. https://doi.org/10.1016/j.aap.2014.03.010.
Pieroni, Alessio, Claudio Lantieri, Hocine Imine, and Andrea Simone. 2016. “Light Vehicle Model for
Dynamic Car Simulator.” Transport 31 (2): 242–49. https://doi.org/10.3846/16484142.2016.1193051.
Plainis, S., and I. J. Murray. 2002. “Reaction Times as an Index of Visual Conspicuity When Driving at Night.”
Ophthalmic and Physiological Optics 22 (5): 409–15. https://doi.org/10.1046/j.1475-1313.2002.00076.x.
Pomarjanschi, Laura, Michael Dorr, and Erhardt Barth. 2012. “Gaze Guidance Reduces the Number of
Collisions with Pedestrians in a Driving Simulator.” ACM Trans. Interact. Intell. Syst. 1 (2): 8:1--8:14.
https://doi.org/10.1145/2070719.2070721.
Pretto, P., M. Vidal, and A. Chatziastros. 2008. “Why Fog Increases the Perceived Speed.” Proceedings of the
Driving Simulation Conference, no. September 2014: 223–35.
Reason, J T. 1978. “Motion Sickness Adaptation: A Neural Mismatch Model.” Journal of the Royal Society
of Medicine 71 (11): 819–29. https://doi.org/10.1177/014107687807101109.
Regan, Michael A, Charlene Hallett, and Craig P Gordon. 2011. “Driver Distraction and Driver Inattention :
Definition , Relationship and Taxonomy.” Accident Analysis and Prevention 43 (5): 1771–81.
https://doi.org/10.1016/j.aap.2011.04.008.
Reid, L. D., and M. A. Nahon. 1985. Flight Simulation Motion-Base Drive Algorithms: Part 1 - Developing
and Testing the Equations. http://repository.tudelft.nl/view/aereports/uuid:45b071c0-0568-4e8f-948f-
dfa52d350665/.
Reymond, Gilles, and Andras Kemeny. 2000. “Motion Cueing in the Renault Driving Simulator.” Vehicle
System Dynamics 34 (4): 249–59. https://doi.org/10.1076/vesd.34.4.249.2059.
Rosey, F., I. Aillerie, S. Espié, and F. Vienne. 2017. “Driver Behaviour in Fog Is Not Only a Question of
Degraded Visibility – A Simulator Study.” Safety Science 95 (March 2018): 50–61.
https://doi.org/10.1016/j.ssci.2017.02.004.
RoSPA. 2017. “Cycling Accidents” 0121 (October): 1–3.
Rothengatter, Talib. 1982. “The Effects of Police Surveillance and Law Enforcement on Driver Behaviour.”
Current Psychological Research 2 (3): 349–58. https://doi.org/10.1007/BF02684467.
Rudin-brown, Christina M, and Heather A Parker. 2004. “Behavioural Adaptation to Adaptive Cruise Control
References
114
( ACC ): Implications for Preventive Strategies” 7: 59–76. https://doi.org/10.1016/j.trf.2004.02.001.
Rumar, K. 1990. “The Basic Driver Error: Late Detection.” Ergonomics 33 (10–11): 1281–90.
https://doi.org/10.1080/00140139008925332.
SAE J3063. 2015. “Taxonomy and Definitions for Terms Related to Driving Automation Systems for On-
Road Motor Vehicles.”
Samuel, Siby, Matthew R. E. Romoser, Luis Roman Gerardino, Malek Hamid, Radhameris A. Gómez,
Michael A. Knodler, John Collura, and Donald L. Fisher. 2013. “Effect of Advance Yield Markings and
Symbolic Signs on Vehicle–Pedestrian Conflicts.” Transportation Research Record: Journal of the
Transportation Research Board 2393 (1): 139–46. https://doi.org/10.3141/2393-16.
Sayed, T. 2000. “ESTIMATING THE SAFETY OF UNSIGNALIZED INTERSECTIONS USING TRAFFIC
CONFLICTS,” January.
Shinar, David. 1984. “Actual versus Estimated Night-Time Pedestrian Visibility.” Ergonomics 27 (8): 863–
71. https://doi.org/10.1080/00140138408963560.
Shurbutt, Jim, Ron Van Houten, Shawn Turner, and Brad Huitema. 2009. “Analysis of Effects of LED
Rectangular Rapid-Flash Beacons on Yielding to Pedestrians in Multilane Crosswalks.” Transportation
Research Record: Journal of the Transportation Research Board 2140 (1): 85–95.
https://doi.org/10.3141/2140-09.
Simone, Andrea, Michele Carpinone, Claudio Lantieri, and Hocine Imine. 2017. “Development and Validation
of a Powertrain Model for Low-Cost Driving Simulators.” Advances in Transportation Studies, 19.
Singh, Sang. 2015. “Critical Reasons for Crashes Investigated in the National Motor Vehicle Crash Causation
Survey. (Traffic Safety Facts Crash•Stats). Washington, DC: National Highway Traffic Safety
Administration.” 13th International IEEE Conference on Intelligent Transportation Systems 812 115
(February): 2–3.
Sivak, Michael, Juha Luoma, Michael J. Flannagan, C. Raymond Bingham, David W. Eby, and Jean T. Shope.
2007. “Traffic Safety in the U.S.: Re-Examining Major Opportunities.” Journal of Safety Research 38
(3): 337–55. https://doi.org/10.1016/j.jsr.2007.05.003.
Sivan, Raphael, Jehuda Ish-Shalom, and Jen Kuang Huang. 1982. “An Optimal Control Approach to the
Design of Moving Flight Simulators.” IEEE Transactions on Systems, Man and Cybernetics 12 (6): 818–
27. https://doi.org/10.1109/TSMC.1982.4308915.
Stanton, N A, M Young, and B Mccaulder. 1997. “DRIVE-BY-WIRE : THE CASE OF DRIVER
WORKLOAD AND RECLAIMING CONTROL WITH ADAPTIVE CRUISE CONTROL” 27 (2):
References
115
149–59.
Sueur, Cédric, Barbara Class, Charlène Hamm, Xavier Meyer, and Marie Pelé. 2013. “Different Risk
Thresholds in Pedestrian Road Crossing Behaviour: A Comparison of French and Japanese Approaches.”
Accident Analysis & Prevention 58 (September): 59–63. https://doi.org/10.1016/j.aap.2013.04.027.
Svensson, Åse. 1998. “Svensson, Å., 1998. A Method for Analysing the Traffic Process in a
SafetyPerspective.” University of Lund, Department of Traffic Planning and Engineering.
Svensson, Åse, and Christer Hydén. 2006. “Estimating the Severity of Safety Related Behaviour.” Accident
Analysis and Prevention 38 (2): 379–85. https://doi.org/10.1016/j.aap.2005.10.009.
Takada, Yuji. 2001. “Evaluation of Driving-Assistance Systems Based on Drivers ’ Workload,” no. August:
208–13.
Telban, Robert J, and Frank Cardullo. 2005. “Motion Cueing Algorithm Development: Human-Centered
Linear and Nonlinear Approaches.” NASA TechReport, no. May: CR-2005-213747.
http://ntrs.nasa.gov/archive/nasa/casi.ntrs.nasa.gov/20050180246.pdf.
Tivesten, Emma, Volvo Car Corporation, Trent Victor, and Volvo Car. 2015. “THE TIMECOURSE OF
DRIVER VISUAL ATTENTION IN NATURALISTIC DRIVING WITH ADAPTIVE CRUISE
CONTROL AND FORWARD COLLISION WARNING,” no. November: 1–12.
Tno, Marieke Martens, Wim Van Winsum Carnetsoft, and Wim Van Winsum. 2016. “Measuring Distraction :
The Peripheral Detection Task,” no. March.
Tomczuk, Piotr, Kazimierz Jamroz, Tomasz Mackun, and Marcin Chrzanowicz. 2019. “Lighting
Requirements for Pedestrian Crossings – Positive Contrast.” Edited by K. Wilde and M.
Niedostatkiewicz. MATEC Web of Conferences 262 (January): 05015.
https://doi.org/10.1051/matecconf/201926205015.
Törnros, Jan. 1995. “Effect of Driving Speed on Reaction Time during Motorway Driving.” Accident Analysis
and Prevention 27 (4): 435–42. https://doi.org/10.1016/0001-4575(94)00084-Y.
Traffic, Safety, and Basic Facts. 2018. “Traffic Safety Basic Facts on Cyclists, European Commission,
Directorate General for Transport,” no. June.
Turner, Shawn, Kay Fitzpatrick, Marcus Brewer, and Eun Park. 2006. “Motorist Yielding to Pedestrians at
Unsignalized Intersections: Findings from a National Study on Improving Pedestrian Safety.”
Transportation Research Record: Journal of the Transportation Research Board 1982 (January): 1–12.
https://doi.org/10.3141/1982-03.
References
116
Underwood, A J. 2006. “Experimental Analyses of the Influences of Topography of the Substratum on
Movements and Density of an Intertidal Snail , Littorina Unifasciata” 134: 175–96.
Vaa, Truls. 1997. “Increased Police Enforcement: Effects on Speed.” Accident Analysis and Prevention 29
(3): 373–85. https://doi.org/10.1016/S0001-4575(97)00003-1.
Venable, W. H., and W. N. Hale. 1996. “Color and Nighttime Pedestrian Safety Markings.” Color Research
& Application 21 (4): 305–9. https://doi.org/10.1002/(SICI)1520-6378(199608)21:4<305::AID-
COL5>3.0.CO;2-U.
Vienne, F, S Caro, L Désiré, J Auberlet M, F Rosey, and Eric Dumont. 2014. “Driving Simulator: An
Innovative Tool to Test New Road Infrastructures,” 10p.
http://tra2014.traconference.eu/papers/pdfs/TRA2014_Fpaper_18336.pdf%5Cnhttps://trid.trb.org/view/
1320194.
Vignali, Valeria, Claudio Lantieri, Marco Costa, Nicola Palena, and Andrea Simone. 2018a. “Fixation
Distance and Fixation Duration to Vertical Road Signs.” Applied Ergonomics 69 (November 2016): 48–
57. https://doi.org/10.1016/j.apergo.2017.12.017.
Villa, Céline, Roland Brémond, and Joffrey Girard. 2018. “High Dynamic Range Displays Improve the
Realism of Motion Cues in Night Driving Simulators.” Displays 52 (March): 30–39.
https://doi.org/10.1016/j.displa.2018.02.006.
Wertheim, Alexander H. 1997. “Human Performance in a Moving Environment,” 1997.
Whetsel Borzendowski, Stephanie A., Rachel L. Rosenberg, Ashley Stafford Sewall, and Richard A. Tyrrell.
2013. “Pedestrians’ Estimates of Their Own Nighttime Conspicuity Are Unaffected by Severe
Reductions in Headlight Illumination.” Journal of Safety Research.
https://doi.org/10.1016/j.jsr.2013.08.007.
White, Cale B., and Jeff K. Caird. 2010. “The Blind Date: The Effects of Change Blindness, Passenger
Conversation and Gender on Looked-but-Failed-to-See (LBFTS) Errors.” Accident Analysis &
Prevention 42 (6): 1822–30. https://doi.org/10.1016/J.AAP.2010.05.003.
Wilschut, Ellen S, and Philippus J Feenstra. n.d. “EVALUATION OF DIFFERENT MODALITIES FOR THE
INTELLIGENT COOPERATIVE INTERSECTION SAFETY SYSTEM ( IRIS ) AND SPEED LIMIT
SYSTEM,” 221–26.
Winsum, Wim van. 1996. “A Model of Driver Behaviour Adaptation.” In Proceedings of the Human Factors
and Ergonomics Society Europe Chapter Annual Meeting in Haren, The Netherlands, 196.
Winter, Joost C F De, Riender Happee, Marieke H Martens, and Neville A Stanton. 2014. “Effects of Adaptive
References
117
Cruise Control and Highly Automated Driving on Workload and Situation Awareness : A Review of the
Empirical Evidence.” Transportation Research Part F: Psychology and Behaviour 27: 196–217.
https://doi.org/10.1016/j.trf.2014.06.016.
Wood, Joanne M., Richard A. Tyrrell, and Trent P. Carberry. 2005. “Limitations in Drivers’ Ability to
Recognize Pedestrians at Night.” Human Factors: The Journal of the Human Factors and Ergonomics
Society 47 (3): 644–53. https://doi.org/10.1518/001872005774859980.
World Health Organization 2018. 2018a. “Global Status Report on Road Safety 2018.”
Zegeer, Charles V., J. Richard Stewart, Herman H. Huang, and Peter A. Lagerwey. 2005. “Safety Effects of
Marked vs Unmarked Crosswalks at Uncontrolled Locations: Executive Summary and Recommended
Guidelines.” Report FHWA-HRT-04-100. FHWA, U.S. Department of Transportation. McLean, VA.
Zito, G A, D Cazzoli, L Scheffler, M Jäger, R M Müri, U P Mosimann, T Nyffeler, and F W Mast. 2015.
“Street Crossing Behavior in Younger and Older Pedestrians : An Eye- and Head-Tracking Study.” BMC
Geriatrics, 1–10. https://doi.org/10.1186/s12877-015-0175-0.

118
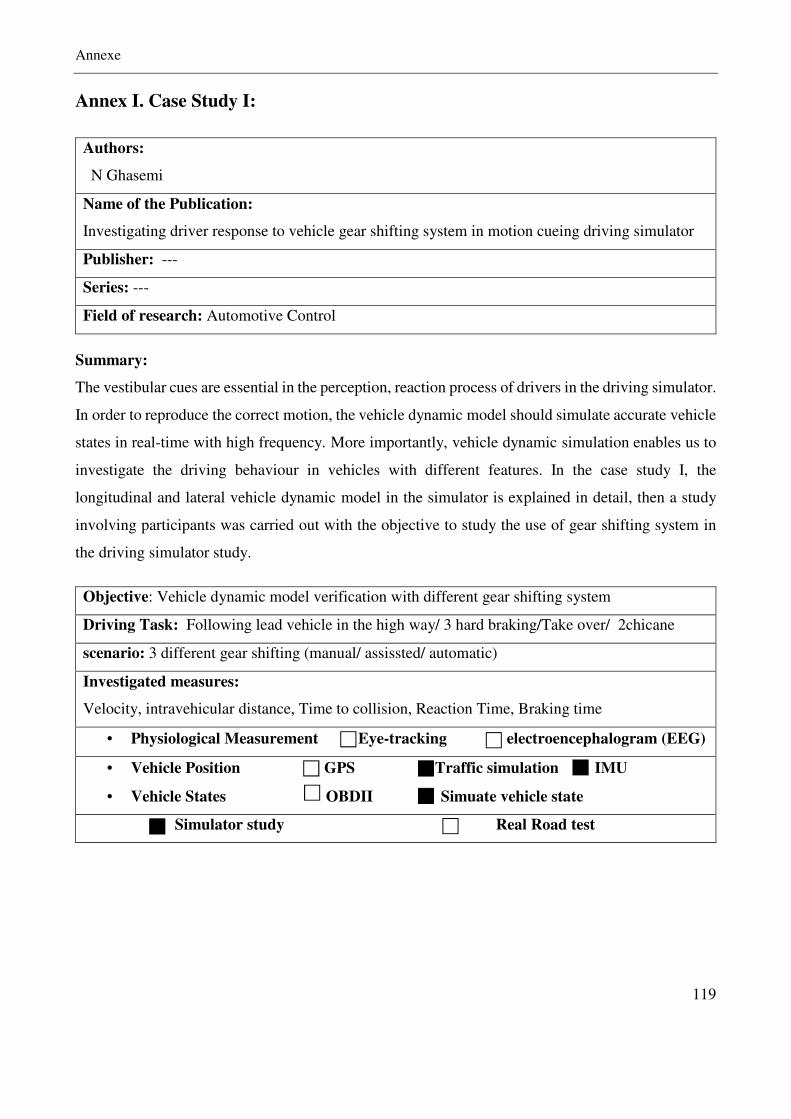
Annexe
119
Annex I. Case Study I:
Authors:
N Ghasemi
Name of the Publication:
Investigating driver response to vehicle gear shifting system in motion cueing driving simulator
Publisher: ---
Series: ---
Field of research: Automotive Control
Summary:
The vestibular cues are essential in the perception, reaction process of drivers in the driving simulator.
In order to reproduce the correct motion, the vehicle dynamic model should simulate accurate vehicle
states in real-time with high frequency. More importantly, vehicle dynamic simulation enables us to
investigate the driving behaviour in vehicles with different features. In the case study I, the
longitudinal and lateral vehicle dynamic model in the simulator is explained in detail, then a study
involving participants was carried out with the objective to study the use of gear shifting system in
the driving simulator study.
Objective: Vehicle dynamic model verification with different gear shifting system
Driving Task: Following lead vehicle in the high way/ 3 hard braking/Take over/ 2chicane
scenario: 3 different gear shifting (manual/ assissted/ automatic)
Investigated measures:
Velocity, intravehicular distance, Time to collision, Reaction Time, Braking time
• Physiological Measurement Eye-tracking electroencephalogram (EEG)
• Vehicle Position GPS Traffic simulation IMU
• Vehicle States OBDII Simuate vehicle state
Simulator study Real Road test
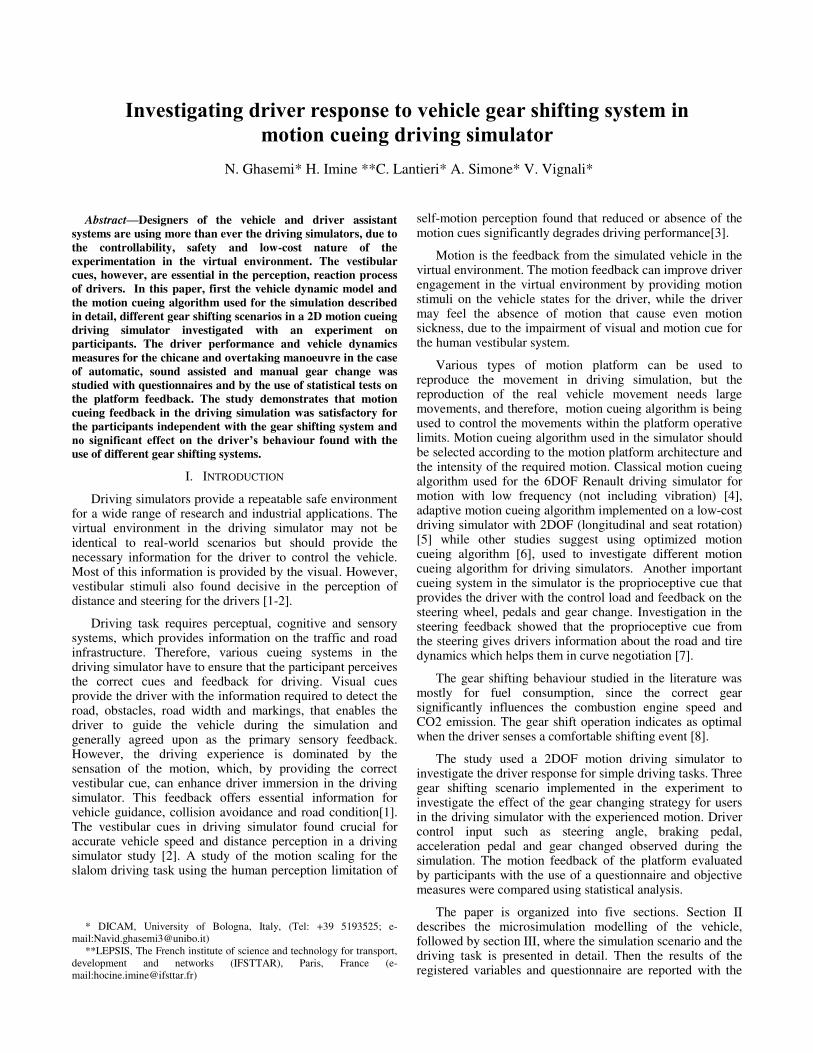
Abstract—Designers of the vehicle and driver assistant
systems are using more than ever the driving simulators, due to
the controllability, safety and low-cost nature of the
experimentation in the virtual environment. The vestibular
cues, however, are essential in the perception, reaction process
of drivers. In this paper, first the vehicle dynamic model and
the motion cueing algorithm used for the simulation described
in detail, different gear shifting scenarios in a 2D motion cueing
driving simulator investigated with an experiment on
participants. The driver performance and vehicle dynamics
measures for the chicane and overtaking manoeuvre in the case
of automatic, sound assisted and manual gear change was
studied with questionnaires and by the use of statistical tests on
the platform feedback. The study demonstrates that motion
cueing feedback in the driving simulation was satisfactory for
the participants independent with the gear shifting system and
no significant effect on the driver’s behaviour found with the
use of different gear shifting systems.
I. INTRODUCTION
Driving simulators provide a repeatable safe environment for a wide range of research and industrial applications. The virtual environment in the driving simulator may not be identical to real-world scenarios but should provide the necessary information for the driver to control the vehicle. Most of this information is provided by the visual. However, vestibular stimuli also found decisive in the perception of distance and steering for the drivers [1-2].
Driving task requires perceptual, cognitive and sensory systems, which provides information on the traffic and road infrastructure. Therefore, various cueing systems in the driving simulator have to ensure that the participant perceives the correct cues and feedback for driving. Visual cues provide the driver with the information required to detect the road, obstacles, road width and markings, that enables the driver to guide the vehicle during the simulation and generally agreed upon as the primary sensory feedback. However, the driving experience is dominated by the sensation of the motion, which, by providing the correct vestibular cue, can enhance driver immersion in the driving simulator. This feedback offers essential information for vehicle guidance, collision avoidance and road condition[1]. The vestibular cues in driving simulator found crucial for accurate vehicle speed and distance perception in a driving simulator study [2]. A study of the motion scaling for the slalom driving task using the human perception limitation of
* DICAM, University of Bologna, Italy, (Tel: +39 5193525; e-
mail:[email protected])
**LEPSIS, The French institute of science and technology for transport,
development and networks (IFSTTAR), Paris, France (e-
mail:[email protected])
self-motion perception found that reduced or absence of the motion cues significantly degrades driving performance[3].
Motion is the feedback from the simulated vehicle in the virtual environment. The motion feedback can improve driver engagement in the virtual environment by providing motion stimuli on the vehicle states for the driver, while the driver may feel the absence of motion that cause even motion sickness, due to the impairment of visual and motion cue for the human vestibular system.
Various types of motion platform can be used to reproduce the movement in driving simulation, but the reproduction of the real vehicle movement needs large movements, and therefore, motion cueing algorithm is being used to control the movements within the platform operative limits. Motion cueing algorithm used in the simulator should be selected according to the motion platform architecture and the intensity of the required motion. Classical motion cueing algorithm used for the 6DOF Renault driving simulator for motion with low frequency (not including vibration) [4], adaptive motion cueing algorithm implemented on a low-cost driving simulator with 2DOF (longitudinal and seat rotation) [5] while other studies suggest using optimized motion cueing algorithm [6], used to investigate different motion cueing algorithm for driving simulators. Another important cueing system in the simulator is the proprioceptive cue that provides the driver with the control load and feedback on the steering wheel, pedals and gear change. Investigation in the steering feedback showed that the proprioceptive cue from the steering gives drivers information about the road and tire dynamics which helps them in curve negotiation [7].
The gear shifting behaviour studied in the literature was mostly for fuel consumption, since the correct gear significantly influences the combustion engine speed and CO2 emission. The gear shift operation indicates as optimal when the driver senses a comfortable shifting event [8].
The study used a 2DOF motion driving simulator to investigate the driver response for simple driving tasks. Three gear shifting scenario implemented in the experiment to investigate the effect of the gear changing strategy for users in the driving simulator with the experienced motion. Driver control input such as steering angle, braking pedal, acceleration pedal and gear changed observed during the simulation. The motion feedback of the platform evaluated by participants with the use of a questionnaire and objective measures were compared using statistical analysis.
The paper is organized into five sections. Section II describes the microsimulation modelling of the vehicle, followed by section III, where the simulation scenario and the driving task is presented in detail. Then the results of the registered variables and questionnaire are reported with the
Investigating driver response to vehicle gear shifting system in motion cueing driving simulator
N. Ghasemi* H. Imine **C. Lantieri* A. Simone* V. Vignali*
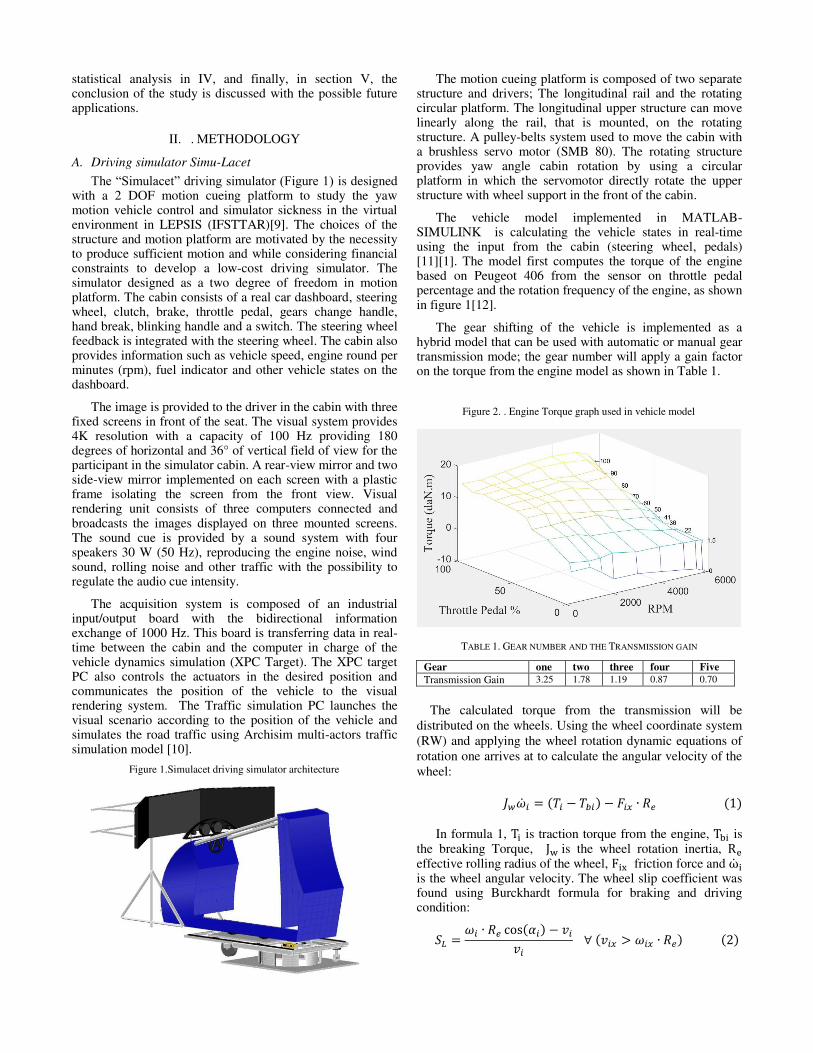
Figure 1.Simulacet driving simulator architecture
Figure 2. . Engine Torque graph used in vehicle model
statistical analysis in IV, and finally, in section V, the conclusion of the study is discussed with the possible future applications.
II. . METHODOLOGY
A. Driving simulator Simu-Lacet
The “Simulacet” driving simulator (Figure 1) is designed with a 2 DOF motion cueing platform to study the yaw motion vehicle control and simulator sickness in the virtual environment in LEPSIS (IFSTTAR)[9]. The choices of the structure and motion platform are motivated by the necessity to produce sufficient motion and while considering financial constraints to develop a low-cost driving simulator. The simulator designed as a two degree of freedom in motion platform. The cabin consists of a real car dashboard, steering wheel, clutch, brake, throttle pedal, gears change handle, hand break, blinking handle and a switch. The steering wheel feedback is integrated with the steering wheel. The cabin also provides information such as vehicle speed, engine round per minutes (rpm), fuel indicator and other vehicle states on the dashboard.
The image is provided to the driver in the cabin with three fixed screens in front of the seat. The visual system provides 4K resolution with a capacity of 100 Hz providing 180 degrees of horizontal and 36° of vertical field of view for the participant in the simulator cabin. A rear-view mirror and two side-view mirror implemented on each screen with a plastic frame isolating the screen from the front view. Visual rendering unit consists of three computers connected and broadcasts the images displayed on three mounted screens. The sound cue is provided by a sound system with four speakers 30 W (50 Hz), reproducing the engine noise, wind sound, rolling noise and other traffic with the possibility to regulate the audio cue intensity.
The acquisition system is composed of an industrial input/output board with the bidirectional information exchange of 1000 Hz. This board is transferring data in real-time between the cabin and the computer in charge of the vehicle dynamics simulation (XPC Target). The XPC target PC also controls the actuators in the desired position and communicates the position of the vehicle to the visual rendering system. The Traffic simulation PC launches the visual scenario according to the position of the vehicle and simulates the road traffic using Archisim multi-actors traffic simulation model [10].
The motion cueing platform is composed of two separate structure and drivers; The longitudinal rail and the rotating circular platform. The longitudinal upper structure can move linearly along the rail, that is mounted, on the rotating structure. A pulley-belts system used to move the cabin with a brushless servo motor (SMB 80). The rotating structure provides yaw angle cabin rotation by using a circular platform in which the servomotor directly rotate the upper structure with wheel support in the front of the cabin.
The vehicle model implemented in MATLAB-SIMULINK is calculating the vehicle states in real-time using the input from the cabin (steering wheel, pedals) [11][1]. The model first computes the torque of the engine based on Peugeot 406 from the sensor on throttle pedal percentage and the rotation frequency of the engine, as shown in figure 1[12].
The gear shifting of the vehicle is implemented as a hybrid model that can be used with automatic or manual gear transmission mode; the gear number will apply a gain factor on the torque from the engine model as shown in Table 1.
TABLE 1. GEAR NUMBER AND THE TRANSMISSION GAIN
Gear one two three four Five
Transmission Gain 3.25 1.78 1.19 0.87 0.70
The calculated torque from the transmission will be
distributed on the wheels. Using the wheel coordinate system
(RW) and applying the wheel rotation dynamic equations of
rotation one arrives at to calculate the angular velocity of the
wheel: 𝐽𝑤𝑖 = (𝑇𝑖 − 𝑇𝑏𝑖) − 𝐹𝑖𝑥 ∙ 𝑅𝑒 (1)
In formula 1, Ti is traction torque from the engine, Tbi is the breaking Torque, Jw is the wheel rotation inertia, Re effective rolling radius of the wheel, Fix friction force and ωi is the wheel angular velocity. The wheel slip coefficient was found using Burckhardt formula for braking and driving condition: 𝑆𝐿 = 𝜔𝑖 ∙ 𝑅𝑒 cos(𝛼𝑖) − 𝑣𝑖𝑣𝑖 ∀ (𝑣𝑖𝑥 > 𝜔𝑖𝑥 ∙ 𝑅𝑒) (2)
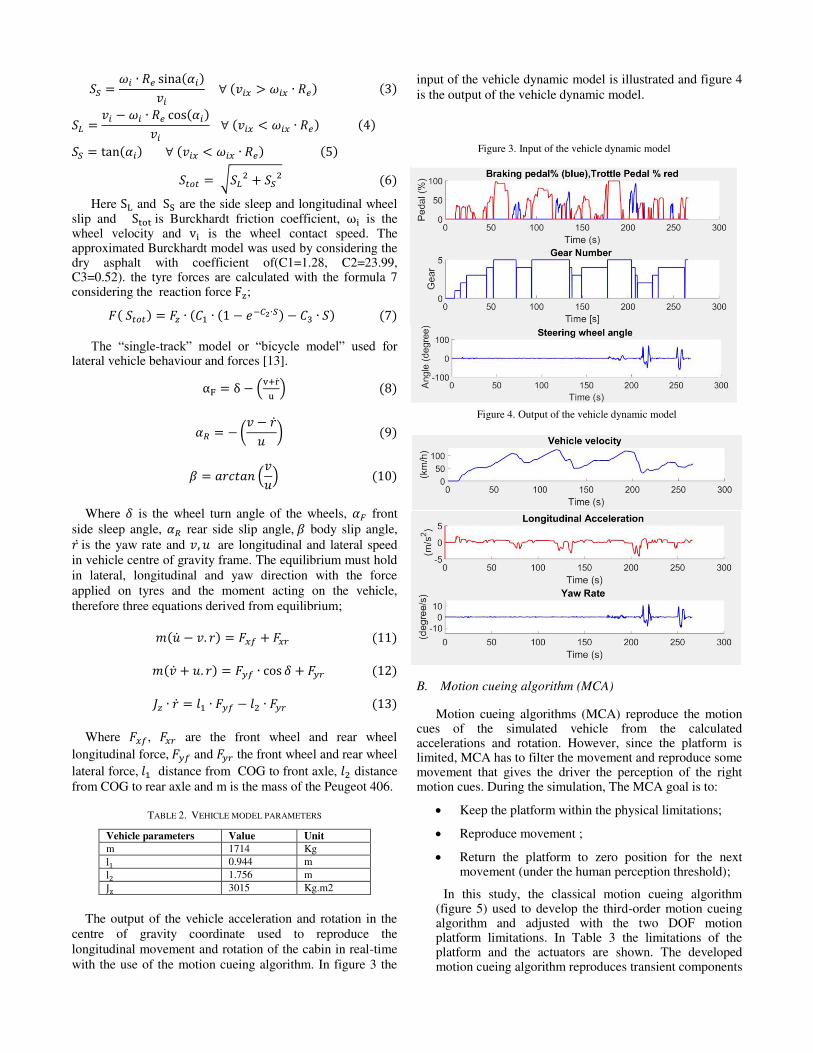
𝑆𝑆 = 𝜔𝑖 ∙ 𝑅𝑒 sina(𝛼𝑖)𝑣𝑖 ∀ (𝑣𝑖𝑥 > 𝜔𝑖𝑥 ∙ 𝑅𝑒) (3) 𝑆𝐿 = 𝑣𝑖 − 𝜔𝑖 ∙ 𝑅𝑒 cos(𝛼𝑖)𝑣𝑖 ∀ (𝑣𝑖𝑥 < 𝜔𝑖𝑥 ∙ 𝑅𝑒) (4) 𝑆𝑆 = tan(𝛼𝑖) ∀ (𝑣𝑖𝑥 < 𝜔𝑖𝑥 ∙ 𝑅𝑒) (5) 𝑆𝑡𝑜𝑡 = √𝑆𝐿2 + 𝑆𝑆2 (6)
Here SL and SS are the side sleep and longitudinal wheel slip and Stot is Burckhardt friction coefficient, ωi is the wheel velocity and vi is the wheel contact speed. The approximated Burckhardt model was used by considering the dry asphalt with coefficient of(C1=1.28, C2=23.99, C3=0.52). the tyre forces are calculated with the formula 7 considering the reaction force Fz; 𝐹( 𝑆𝑡𝑜𝑡) = 𝐹𝑧 ∙ (𝐶1 ∙ (1 − 𝑒−𝐶2∙𝑆) − 𝐶3 ∙ 𝑆) (7)
The “single-track” model or “bicycle model” used for lateral vehicle behaviour and forces [13]. αF = δ − (v+ru ) (8)
𝛼𝑅 = − (𝑣 − 𝑢 ) (9)
𝛽 = 𝑎𝑟𝑐𝑡𝑎𝑛 (𝑣𝑢) (10)
Where 𝛿 is the wheel turn angle of the wheels, 𝛼𝐹 front
side sleep angle, 𝛼𝑅 rear side slip angle, 𝛽 body slip angle, 𝑟 is the yaw rate and 𝑣, 𝑢 are longitudinal and lateral speed
in vehicle centre of gravity frame. The equilibrium must hold
in lateral, longitudinal and yaw direction with the force
applied on tyres and the moment acting on the vehicle,
therefore three equations derived from equilibrium; 𝑚( − 𝑣. 𝑟) = 𝐹𝑥𝑓 + 𝐹𝑥𝑟 (11) 𝑚( + 𝑢. 𝑟) = 𝐹𝑦𝑓 ∙ cos 𝛿 + 𝐹𝑦𝑟 (12) 𝐽𝑧 ∙ = 𝑙1 ∙ 𝐹𝑦𝑓 − 𝑙2 ∙ 𝐹𝑦𝑟 (13)
Where 𝐹𝑥𝑓, 𝐹𝑥𝑟 are the front wheel and rear wheel
longitudinal force, 𝐹𝑦𝑓 and 𝐹𝑦𝑟 the front wheel and rear wheel
lateral force, 𝑙1 distance from COG to front axle, 𝑙2 distance
from COG to rear axle and m is the mass of the Peugeot 406.
TABLE 2. VEHICLE MODEL PARAMETERS
Vehicle parameters Value Unit
m 1714 Kg l1 0.944 m l2 1.756 m Jz 3015 Kg.m2
The output of the vehicle acceleration and rotation in the
centre of gravity coordinate used to reproduce the
longitudinal movement and rotation of the cabin in real-time
with the use of the motion cueing algorithm. In figure 3 the
input of the vehicle dynamic model is illustrated and figure 4
is the output of the vehicle dynamic model.
B. Motion cueing algorithm (MCA)
Motion cueing algorithms (MCA) reproduce the motion cues of the simulated vehicle from the calculated accelerations and rotation. However, since the platform is limited, MCA has to filter the movement and reproduce some movement that gives the driver the perception of the right motion cues. During the simulation, The MCA goal is to:
Keep the platform within the physical limitations;
Reproduce movement ;
Return the platform to zero position for the next movement (under the human perception threshold);
In this study, the classical motion cueing algorithm (figure 5) used to develop the third-order motion cueing algorithm and adjusted with the two DOF motion platform limitations. In Table 3 the limitations of the platform and the actuators are shown. The developed motion cueing algorithm reproduces transient components
Figure 3. Input of the vehicle dynamic model
Figure 4. Output of the vehicle dynamic model
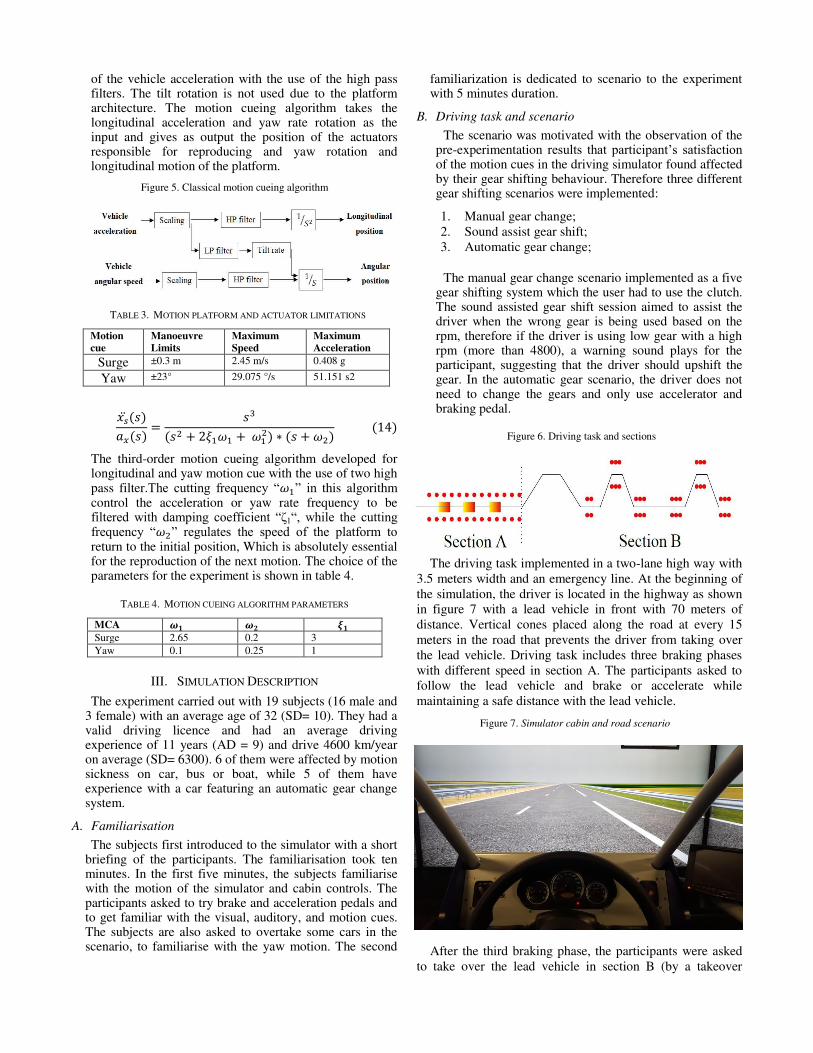
of the vehicle acceleration with the use of the high pass filters. The tilt rotation is not used due to the platform architecture. The motion cueing algorithm takes the longitudinal acceleration and yaw rate rotation as the input and gives as output the position of the actuators responsible for reproducing and yaw rotation and longitudinal motion of the platform.
Figure 5. Classical motion cueing algorithm
TABLE 3. MOTION PLATFORM AND ACTUATOR LIMITATIONS
Motion
cue
Manoeuvre
Limits
Maximum
Speed
Maximum
Acceleration
Surge ±0.3 m 2.45 m/s 0.408 g
Yaw ±23° 29.075 °/s 51.151 s2
𝑥(𝑠)𝑎𝑥(𝑠) = 𝑠3(𝑠2 + 2𝜉1𝜔1 + 𝜔12) ∗ (𝑠 + 𝜔2) (14)
The third-order motion cueing algorithm developed for longitudinal and yaw motion cue with the use of two high pass filter.The cutting frequency “𝜔1” in this algorithm control the acceleration or yaw rate frequency to be filtered with damping coefficient “ζ1“, while the cutting frequency “𝜔2” regulates the speed of the platform to return to the initial position, Which is absolutely essential for the reproduction of the next motion. The choice of the parameters for the experiment is shown in table 4.
TABLE 4. MOTION CUEING ALGORITHM PARAMETERS
MCA 𝝎𝟏 𝝎𝟐 𝝃𝟏
Surge 2.65 0.2 3
Yaw 0.1 0.25 1
III. SIMULATION DESCRIPTION
The experiment carried out with 19 subjects (16 male and 3 female) with an average age of 32 (SD= 10). They had a valid driving licence and had an average driving experience of 11 years (AD = 9) and drive 4600 km/year on average (SD= 6300). 6 of them were affected by motion sickness on car, bus or boat, while 5 of them have experience with a car featuring an automatic gear change system.
A. Familiarisation
The subjects first introduced to the simulator with a short briefing of the participants. The familiarisation took ten minutes. In the first five minutes, the subjects familiarise with the motion of the simulator and cabin controls. The participants asked to try brake and acceleration pedals and to get familiar with the visual, auditory, and motion cues. The subjects are also asked to overtake some cars in the scenario, to familiarise with the yaw motion. The second
familiarization is dedicated to scenario to the experiment with 5 minutes duration.
B. Driving task and scenario
The scenario was motivated with the observation of the pre-experimentation results that participant’s satisfaction of the motion cues in the driving simulator found affected by their gear shifting behaviour. Therefore three different gear shifting scenarios were implemented:
1. Manual gear change;
2. Sound assist gear shift;
3. Automatic gear change;
The manual gear change scenario implemented as a five gear shifting system which the user had to use the clutch. The sound assisted gear shift session aimed to assist the driver when the wrong gear is being used based on the rpm, therefore if the driver is using low gear with a high rpm (more than 4800), a warning sound plays for the participant, suggesting that the driver should upshift the gear. In the automatic gear scenario, the driver does not need to change the gears and only use accelerator and braking pedal.
The driving task implemented in a two-lane high way with
3.5 meters width and an emergency line. At the beginning of
the simulation, the driver is located in the highway as shown
in figure 7 with a lead vehicle in front with 70 meters of
distance. Vertical cones placed along the road at every 15
meters in the road that prevents the driver from taking over
the lead vehicle. Driving task includes three braking phases
with different speed in section A. The participants asked to
follow the lead vehicle and brake or accelerate while
maintaining a safe distance with the lead vehicle.
After the third braking phase, the participants were asked
to take over the lead vehicle in section B (by a takeover
Figure 6. Driving task and sections
Figure 7. Simulator cabin and road scenario
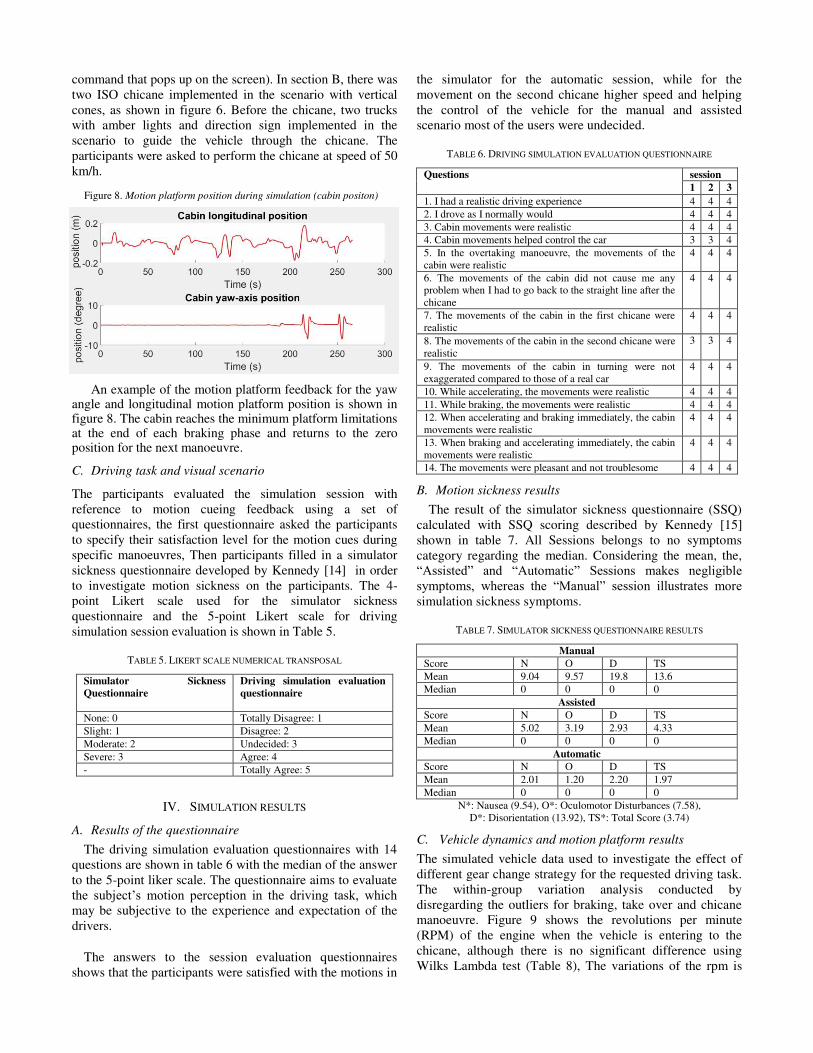
command that pops up on the screen). In section B, there was
two ISO chicane implemented in the scenario with vertical
cones, as shown in figure 6. Before the chicane, two trucks
with amber lights and direction sign implemented in the
scenario to guide the vehicle through the chicane. The
participants were asked to perform the chicane at speed of 50
km/h.
An example of the motion platform feedback for the yaw angle and longitudinal motion platform position is shown in figure 8. The cabin reaches the minimum platform limitations at the end of each braking phase and returns to the zero position for the next manoeuvre.
C. Driving task and visual scenario
The participants evaluated the simulation session with
reference to motion cueing feedback using a set of
questionnaires, the first questionnaire asked the participants
to specify their satisfaction level for the motion cues during
specific manoeuvres, Then participants filled in a simulator
sickness questionnaire developed by Kennedy [14] in order
to investigate motion sickness on the participants. The 4-
point Likert scale used for the simulator sickness
questionnaire and the 5-point Likert scale for driving
simulation session evaluation is shown in Table 5.
TABLE 5. LIKERT SCALE NUMERICAL TRANSPOSAL
Simulator Sickness
Questionnaire
Driving simulation evaluation
questionnaire
None: 0 Totally Disagree: 1
Slight: 1 Disagree: 2
Moderate: 2 Undecided: 3
Severe: 3 Agree: 4
- Totally Agree: 5
IV. SIMULATION RESULTS
A. Results of the questionnaire
The driving simulation evaluation questionnaires with 14
questions are shown in table 6 with the median of the answer
to the 5-point liker scale. The questionnaire aims to evaluate
the subject’s motion perception in the driving task, which may be subjective to the experience and expectation of the
drivers.
The answers to the session evaluation questionnaires
shows that the participants were satisfied with the motions in
the simulator for the automatic session, while for the
movement on the second chicane higher speed and helping
the control of the vehicle for the manual and assisted
scenario most of the users were undecided.
TABLE 6. DRIVING SIMULATION EVALUATION QUESTIONNAIRE
Questions session
1 2 3
1. I had a realistic driving experience 4 4 4
2. I drove as I normally would 4 4 4
3. Cabin movements were realistic 4 4 4
4. Cabin movements helped control the car 3 3 4
5. In the overtaking manoeuvre, the movements of the
cabin were realistic
4 4 4
6. The movements of the cabin did not cause me any
problem when I had to go back to the straight line after the
chicane
4 4 4
7. The movements of the cabin in the first chicane were
realistic
4 4 4
8. The movements of the cabin in the second chicane were
realistic
3 3 4
9. The movements of the cabin in turning were not
exaggerated compared to those of a real car
4 4 4
10. While accelerating, the movements were realistic 4 4 4
11. While braking, the movements were realistic 4 4 4
12. When accelerating and braking immediately, the cabin
movements were realistic
4 4 4
13. When braking and accelerating immediately, the cabin
movements were realistic
4 4 4
14. The movements were pleasant and not troublesome 4 4 4
B. Motion sickness results
The result of the simulator sickness questionnaire (SSQ)
calculated with SSQ scoring described by Kennedy [15]
shown in table 7. All Sessions belongs to no symptoms
category regarding the median. Considering the mean, the,
“Assisted” and “Automatic” Sessions makes negligible
symptoms, whereas the “Manual” session illustrates more simulation sickness symptoms.
TABLE 7. SIMULATOR SICKNESS QUESTIONNAIRE RESULTS
Manual Score N O D TS
Mean 9.04 9.57 19.8 13.6
Median 0 0 0 0
Assisted
Score N O D TS
Mean 5.02 3.19 2.93 4.33
Median 0 0 0 0
Automatic
Score N O D TS
Mean 2.01 1.20 2.20 1.97
Median 0 0 0 0
N*: Nausea (9.54), O*: Oculomotor Disturbances (7.58),
D*: Disorientation (13.92), TS*: Total Score (3.74)
C. Vehicle dynamics and motion platform results
The simulated vehicle data used to investigate the effect of
different gear change strategy for the requested driving task.
The within-group variation analysis conducted by
disregarding the outliers for braking, take over and chicane
manoeuvre. Figure 9 shows the revolutions per minute
(RPM) of the engine when the vehicle is entering to the
chicane, although there is no significant difference using
Wilks Lambda test (Table 8), The variations of the rpm is
Figure 8. Motion platform position during simulation (cabin positon)
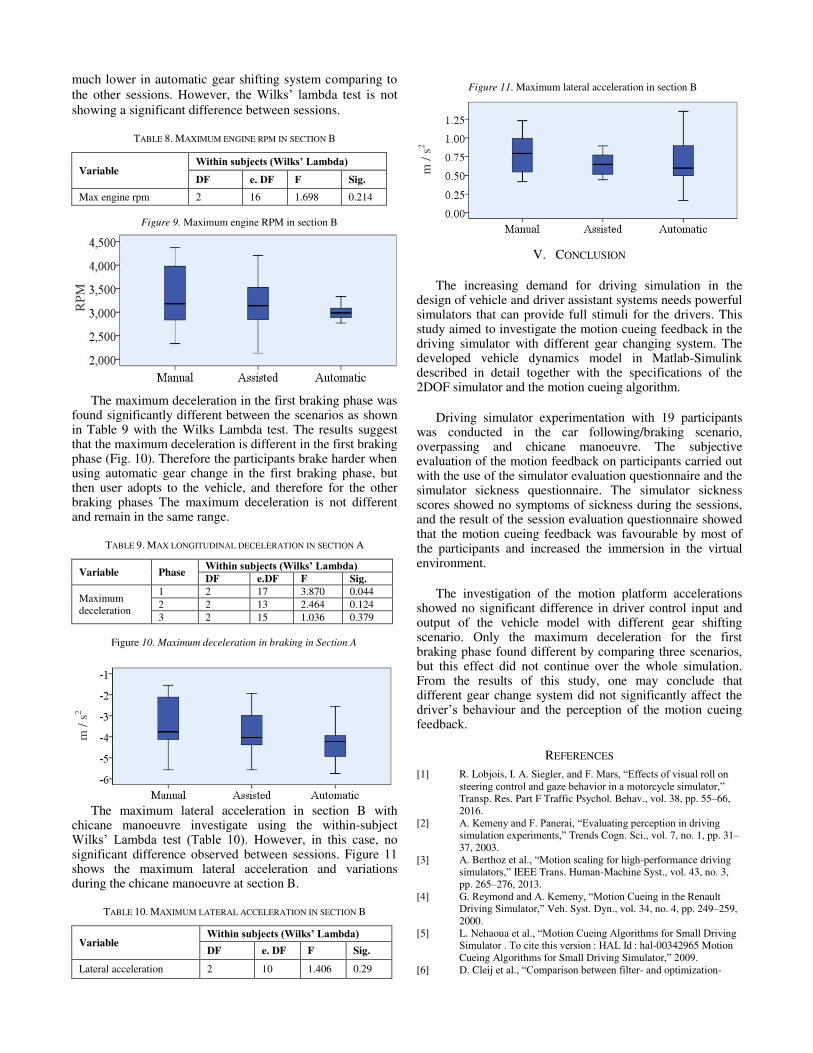
much lower in automatic gear shifting system comparing to
the other sessions. However, the Wilks’ lambda test is not
showing a significant difference between sessions.
TABLE 8. MAXIMUM ENGINE RPM IN SECTION B
Variable Within subjects (Wilks’ Lambda) DF e. DF F Sig.
Max engine rpm 2 16 1.698 0.214
The maximum deceleration in the first braking phase was found significantly different between the scenarios as shown in Table 9 with the Wilks Lambda test. The results suggest that the maximum deceleration is different in the first braking phase (Fig. 10). Therefore the participants brake harder when using automatic gear change in the first braking phase, but then user adopts to the vehicle, and therefore for the other braking phases The maximum deceleration is not different and remain in the same range.
TABLE 9. MAX LONGITUDINAL DECELERATION IN SECTION A
Variable Phase Within subjects (Wilks’ Lambda) DF e.DF F Sig.
Maximum
deceleration
1 2 17 3.870 0.044
2 2 13 2.464 0.124
3 2 15 1.036 0.379
The maximum lateral acceleration in section B with chicane manoeuvre investigate using the within-subject Wilks’ Lambda test (Table 10). However, in this case, no significant difference observed between sessions. Figure 11 shows the maximum lateral acceleration and variations during the chicane manoeuvre at section B.
TABLE 10. MAXIMUM LATERAL ACCELERATION IN SECTION B
Variable Within subjects (Wilks’ Lambda) DF e. DF F Sig.
Lateral acceleration 2 10 1.406 0.29
V. CONCLUSION
The increasing demand for driving simulation in the design of vehicle and driver assistant systems needs powerful simulators that can provide full stimuli for the drivers. This study aimed to investigate the motion cueing feedback in the driving simulator with different gear changing system. The developed vehicle dynamics model in Matlab-Simulink described in detail together with the specifications of the 2DOF simulator and the motion cueing algorithm.
Driving simulator experimentation with 19 participants was conducted in the car following/braking scenario, overpassing and chicane manoeuvre. The subjective evaluation of the motion feedback on participants carried out with the use of the simulator evaluation questionnaire and the simulator sickness questionnaire. The simulator sickness scores showed no symptoms of sickness during the sessions, and the result of the session evaluation questionnaire showed that the motion cueing feedback was favourable by most of the participants and increased the immersion in the virtual environment.
The investigation of the motion platform accelerations showed no significant difference in driver control input and output of the vehicle model with different gear shifting scenario. Only the maximum deceleration for the first braking phase found different by comparing three scenarios, but this effect did not continue over the whole simulation. From the results of this study, one may conclude that different gear change system did not significantly affect the driver’s behaviour and the perception of the motion cueing feedback.
REFERENCES
[1] R. Lobjois, I. A. Siegler, and F. Mars, “Effects of visual roll on steering control and gaze behavior in a motorcycle simulator,” Transp. Res. Part F Traffic Psychol. Behav., vol. 38, pp. 55–66,
2016.
[2] A. Kemeny and F. Panerai, “Evaluating perception in driving simulation experiments,” Trends Cogn. Sci., vol. 7, no. 1, pp. 31–37, 2003.
[3] A. Berthoz et al., “Motion scaling for high-performance driving
simulators,” IEEE Trans. Human-Machine Syst., vol. 43, no. 3,
pp. 265–276, 2013.
[4] G. Reymond and A. Kemeny, “Motion Cueing in the Renault
Driving Simulator,” Veh. Syst. Dyn., vol. 34, no. 4, pp. 249–259,
2000.
[5] L. Nehaoua et al., “Motion Cueing Algorithms for Small Driving Simulator . To cite this version : HAL Id : hal-00342965 Motion
Cueing Algorithms for Small Driving Simulator,” 2009. [6] D. Cleij et al., “Comparison between filter- and optimization-
Figure 9. Maximum engine RPM in section B
RP
M
m /
s2
Figure 10. Maximum deceleration in braking in Section A
Figure 11. Maximum lateral acceleration in section B
m /
s2
based motion cueing algorithms for driving simulation,” Transp.
Res. Part F Traffic Psychol. Behav., 2016.
[7] A. Balachandran and J. Christian Gerdes, Artificial steering feel
design for steer-by-wire vehicles, vol. 7, no. PART 1. IFAC,
2013.
[8] A. Haj-Fraj and F. Pfeiffer, “Simulation of Gear Shift Operations in Automatic Transmission,” IFAC Proc. Vol., vol. 31, no. 27, pp.
85–90, 1998.
[9] F. Vienne, S. Caro, L. Désiré, J. Auberlet M, F. Rosey, and E.
Dumont, “Driving simulator: an innovative tool to test new road infrastructures,” p. 10p, 2014.
[10] S. Espié and J. M. Auberlet, “ARCHISIM: a behavioural multi-actors traffic simulation model for the study of a traffic system
including ITS aspects,” Int. J. ITS Res., vol. 5, pp. 7–16, 2007.
[11] A. Pieroni, C. Lantieri, H. Imine, and A. Simone, “Light vehicle model for dynamic car simulator,” Transport, vol. 31, no. 2, pp.
242–249, 2016.
[12] A. Simone, M. Carpinone, C. Lantieri, and H. Imine,
“Development and validation of a powertrain model for low-cost
driving simulators,” Adv. Transp. Stud., p. 19, 2017.
[13] J. P. Pauwelussen, Essentials of vehicle dynamics. 2014.
[14] R. S. Kennedy, J. M. Drexler, D. E. Compton, K. M. Stanney, D.
S. Lanham, and D. L. Harm, “Configural scoring of simulator sickness, cybersickness and space adaptation syndrome:
similarities and differences,” Virtual Adapt. Environ. Appl.
Implic. Hum. Perform. Issues, pp. 247–278, 2003.
[15] R. S. Kennedy, N. E. Lane, S. Kevin, and M. G. Lilienthal, “The International Journal of Aviation Psychology Simulator Sickness
Questionnaire : An Enhanced Method for Quantifying Simulator Sickness,” Int. J. Aviat. Psychol., vol. 3, no. 3, pp. 203–220,
1993.
[16] Simone, A., Vignali, V., Lantieri, C., Sangiorgi, C., Bonino., T.
(2014) " New methodologies for the analysis of the interaction-
road users in urban areas "." PIARC technical book for National
Conference 2014, Rome 17-18 Novembre.codice ISBN: 978-88-
99161-16-3, ISBN-A Code: 10.978.8899161 / 163
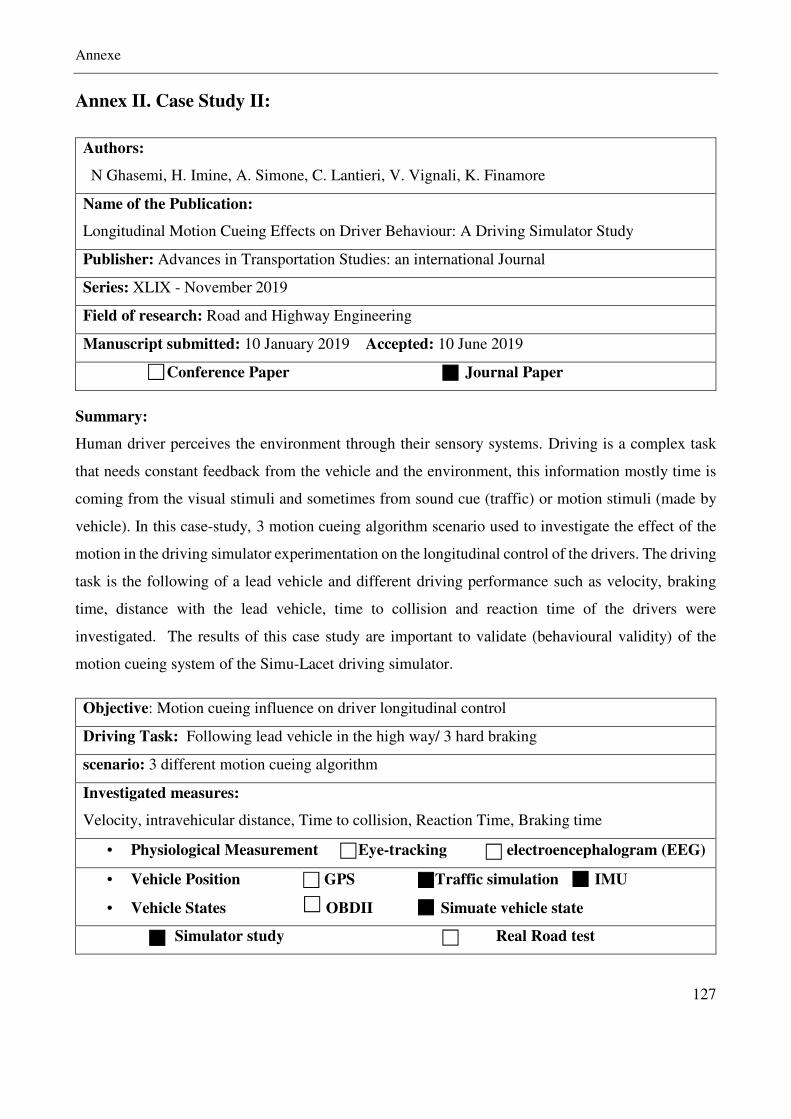
Annexe
127
Annex II. Case Study II:
Authors:
N Ghasemi, H. Imine, A. Simone, C. Lantieri, V. Vignali, K. Finamore
Name of the Publication:
Longitudinal Motion Cueing Effects on Driver Behaviour: A Driving Simulator Study
Publisher: Advances in Transportation Studies: an international Journal
Series: XLIX - November 2019
Field of research: Road and Highway Engineering
Manuscript submitted: 10 January 2019 Accepted: 10 June 2019
Conference Paper Journal Paper
Summary:
Human driver perceives the environment through their sensory systems. Driving is a complex task
that needs constant feedback from the vehicle and the environment, this information mostly time is
coming from the visual stimuli and sometimes from sound cue (traffic) or motion stimuli (made by
vehicle). In this case-study, 3 motion cueing algorithm scenario used to investigate the effect of the
motion in the driving simulator experimentation on the longitudinal control of the drivers. The driving
task is the following of a lead vehicle and different driving performance such as velocity, braking
time, distance with the lead vehicle, time to collision and reaction time of the drivers were
investigated. The results of this case study are important to validate (behavioural validity) of the
motion cueing system of the Simu-Lacet driving simulator.
Objective: Motion cueing influence on driver longitudinal control
Driving Task: Following lead vehicle in the high way/ 3 hard braking
scenario: 3 different motion cueing algorithm
Investigated measures:
Velocity, intravehicular distance, Time to collision, Reaction Time, Braking time
• Physiological Measurement Eye-tracking electroencephalogram (EEG)
• Vehicle Position GPS Traffic simulation IMU
• Vehicle States OBDII Simuate vehicle state
Simulator study Real Road test
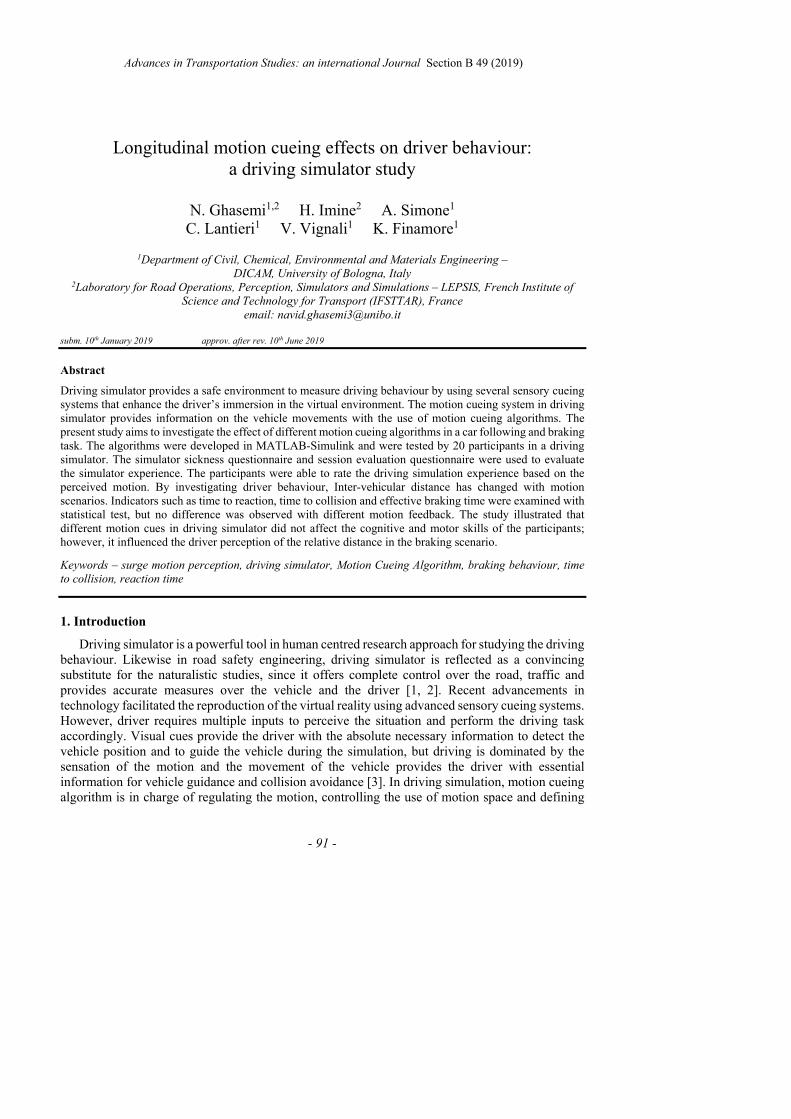
Advances in Transportation Studies: an international Journal Section B 49 (2019)
- 91 -
Longitudinal motion cueing effects on driver behaviour: a driving simulator study
N. Ghasemi1,2 H. Imine2 A. Simone1
C. Lantieri1 V. Vignali1 K. Finamore1
1Department of Civil, Chemical, Environmental and Materials Engineering –
DICAM, University of Bologna, Italy 2Laboratory for Road Operations, Perception, Simulators and Simulations – LEPSIS, French Institute of
Science and Technology for Transport (IFSTTAR), France
email: [email protected]
subm. 10th January 2019 approv. after rev. 10th June 2019 Abstract Driving simulator provides a safe environment to measure driving behaviour by using several sensory cueing systems that enhance the driver’s immersion in the virtual environment. The motion cueing system in driving simulator provides information on the vehicle movements with the use of motion cueing algorithms. The present study aims to investigate the effect of different motion cueing algorithms in a car following and braking task. The algorithms were developed in MATLAB-Simulink and were tested by 20 participants in a driving simulator. The simulator sickness questionnaire and session evaluation questionnaire were used to evaluate the simulator experience. The participants were able to rate the driving simulation experience based on the perceived motion. By investigating driver behaviour, Inter-vehicular distance has changed with motion scenarios. Indicators such as time to reaction, time to collision and effective braking time were examined with statistical test, but no difference was observed with different motion feedback. The study illustrated that different motion cues in driving simulator did not affect the cognitive and motor skills of the participants; however, it influenced the driver perception of the relative distance in the braking scenario. Keywords – surge motion perception, driving simulator, Motion Cueing Algorithm, braking behaviour, time
to collision, reaction time
1. Introduction
Driving simulator is a powerful tool in human centred research approach for studying the driving behaviour. Likewise in road safety engineering, driving simulator is reflected as a convincing substitute for the naturalistic studies, since it offers complete control over the road, traffic and provides accurate measures over the vehicle and the driver [1, 2]. Recent advancements in technology facilitated the reproduction of the virtual reality using advanced sensory cueing systems. However, driver requires multiple inputs to perceive the situation and perform the driving task accordingly. Visual cues provide the driver with the absolute necessary information to detect the vehicle position and to guide the vehicle during the simulation, but driving is dominated by the sensation of the motion and the movement of the vehicle provides the driver with essential information for vehicle guidance and collision avoidance [3]. In driving simulation, motion cueing algorithm is in charge of regulating the motion, controlling the use of motion space and defining
Advances in Transportation Studies: an international Journal Section B 49 (2019)
- 92 -
the speed of the motion platform. The selection and tuning of the motion cueing algorithm is strongly related to the platform dynamic and to the required driving task.
In this study, the effect of different motion cueing algorithm on driver behaviour and self-motion perception in a car following and braking scenario is investigated using subjective measures (questionnaires ) and objective measures such as reaction time, time to collision and braking behaviour.
2. Literature review 2.1. Human and moving environment
Moving environment is known to affect humans from the beginning of the transport systems. Seasickness is a common symptom of motion during a sea trip, where passenger experiences nausea due to the movement of the vessel. During space explorations, many of the space travellers also demonstrated motion sickness symptoms during their first days in the microgravity [4].
The human vestibular system is the organ responsible for the motion perception which is located in the inner ear. This organ consists of semi-circular canals with the ability to perceive angular motion and otolith organs that are able to detect linear motion.
The effects of moving environment on human can be classified into two categories of general and specific. General effects are the ones referring to any performance such as fatigue, sickness and loss of balance, while specific effects are the ones relating to the interference with human mental activities such as perception, cognition and action [5]. The specific effect of the motion in human mental performance can affect three main tasks: Cognitive tasks (attention, memory and pattern recognition), Motor tasks (manual tracking, fast button press reaction) and perceptual tasks (visual or auditory detection).
Regarding general effects of the moving environment, the motion sickness sensory mismatch theory explains that motion sickness occurs when the vestibular apparatus provides self-motion information that does not match with the other sensory systems (visual) or what is expected from previous experience of the user [5,6]. Physical fatigue and balance problems are well-known motion induced interruptions. One study by Wertheim suggests that working in a moving environment might be twice fatiguing than stable environment [5].
Studies on the specific effects of the motion exhibited no reduction on cognitive skills and mild effects on the motor skills of the participants. However, regarding perceptual tasks some participants’ behaviour was influenced by motion. A study by Bles et al. investigated the cognitive memory skills of participants subjected to the ship movement where no significant difference in performance has been observed. Similar studies also confirmed the results for motor task and found no difference in performance while participants subjected to the motion [5,7]. Regarding the perceptual performance of the human in a complex task requiring oculomotor control, subjects were showed reduced performance which might be related to biomechanical factors that indirectly are affected by the motion [5].
Motion perception in driving simulator refers to the perception of self-motion or other moving objects in the virtual environment, where the perception of the motion of the surrounding objects is dominated by the visual stimuli [8], and the self-motion perception depends on inertial stimuli and the visual stimuli [2]. The motion cueing effect on driving behaviour has been investigated by many researchers. Hogema et al. used “Desdemona research simulator” to test various motion cueing algorithm for the urban curve driving and they concluded that the participants found the simulation with longitudinal motion more realistic [9]. In another research by Lakerveld on yaw and tilt motion, this kind of movements were found necessary for a realistic driving experience [10].
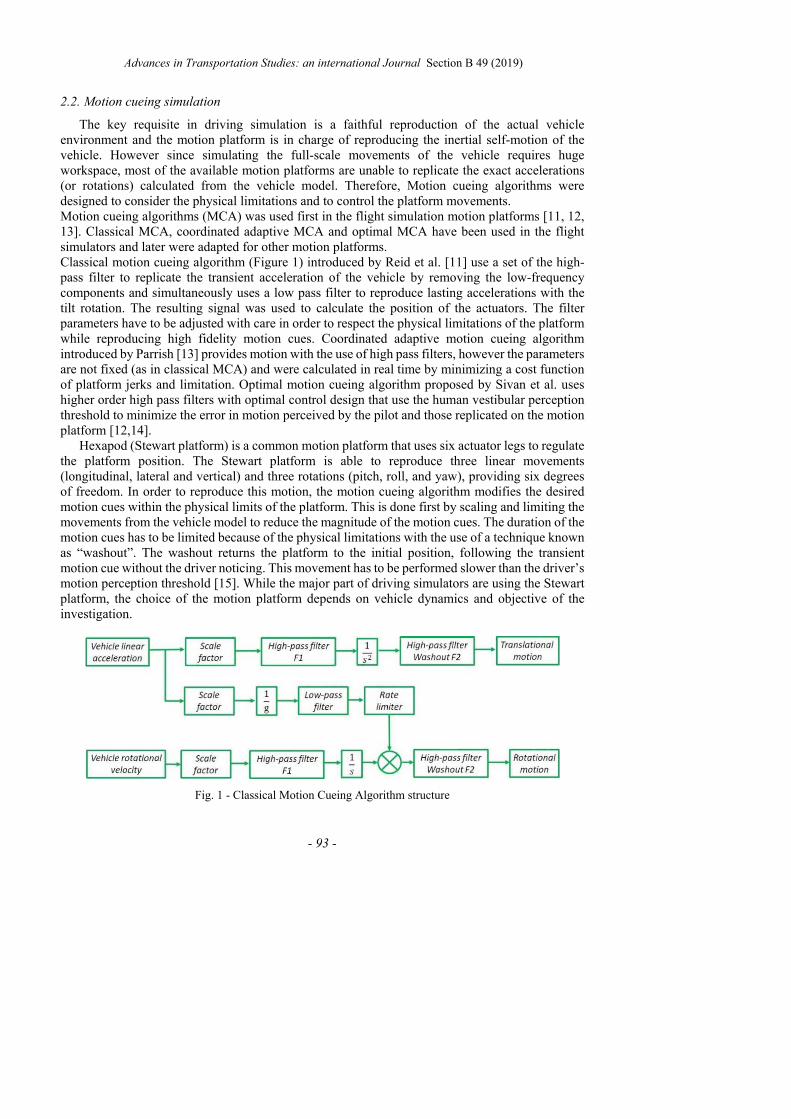
Advances in Transportation Studies: an international Journal Section B 49 (2019)
- 93 -
2.2. Motion cueing simulation
The key requisite in driving simulation is a faithful reproduction of the actual vehicle environment and the motion platform is in charge of reproducing the inertial self-motion of the vehicle. However since simulating the full-scale movements of the vehicle requires huge workspace, most of the available motion platforms are unable to replicate the exact accelerations (or rotations) calculated from the vehicle model. Therefore, Motion cueing algorithms were designed to consider the physical limitations and to control the platform movements. Motion cueing algorithms (MCA) was used first in the flight simulation motion platforms [11, 12, 13]. Classical MCA, coordinated adaptive MCA and optimal MCA have been used in the flight simulators and later were adapted for other motion platforms. Classical motion cueing algorithm (Figure 1) introduced by Reid et al. [11] use a set of the high-pass filter to replicate the transient acceleration of the vehicle by removing the low-frequency components and simultaneously uses a low pass filter to reproduce lasting accelerations with the tilt rotation. The resulting signal was used to calculate the position of the actuators. The filter parameters have to be adjusted with care in order to respect the physical limitations of the platform while reproducing high fidelity motion cues. Coordinated adaptive motion cueing algorithm introduced by Parrish [13] provides motion with the use of high pass filters, however the parameters are not fixed (as in classical MCA) and were calculated in real time by minimizing a cost function of platform jerks and limitation. Optimal motion cueing algorithm proposed by Sivan et al. uses higher order high pass filters with optimal control design that use the human vestibular perception threshold to minimize the error in motion perceived by the pilot and those replicated on the motion platform [12,14].
Hexapod (Stewart platform) is a common motion platform that uses six actuator legs to regulate the platform position. The Stewart platform is able to reproduce three linear movements (longitudinal, lateral and vertical) and three rotations (pitch, roll, and yaw), providing six degrees of freedom. In order to reproduce this motion, the motion cueing algorithm modifies the desired motion cues within the physical limits of the platform. This is done first by scaling and limiting the movements from the vehicle model to reduce the magnitude of the motion cues. The duration of the motion cues has to be limited because of the physical limitations with the use of a technique known as “washout”. The washout returns the platform to the initial position, following the transient motion cue without the driver noticing. This movement has to be performed slower than the driver’s motion perception threshold [15]. While the major part of driving simulators are using the Stewart platform, the choice of the motion platform depends on vehicle dynamics and objective of the investigation.
Fig. 1 - Classical Motion Cueing Algorithm structure
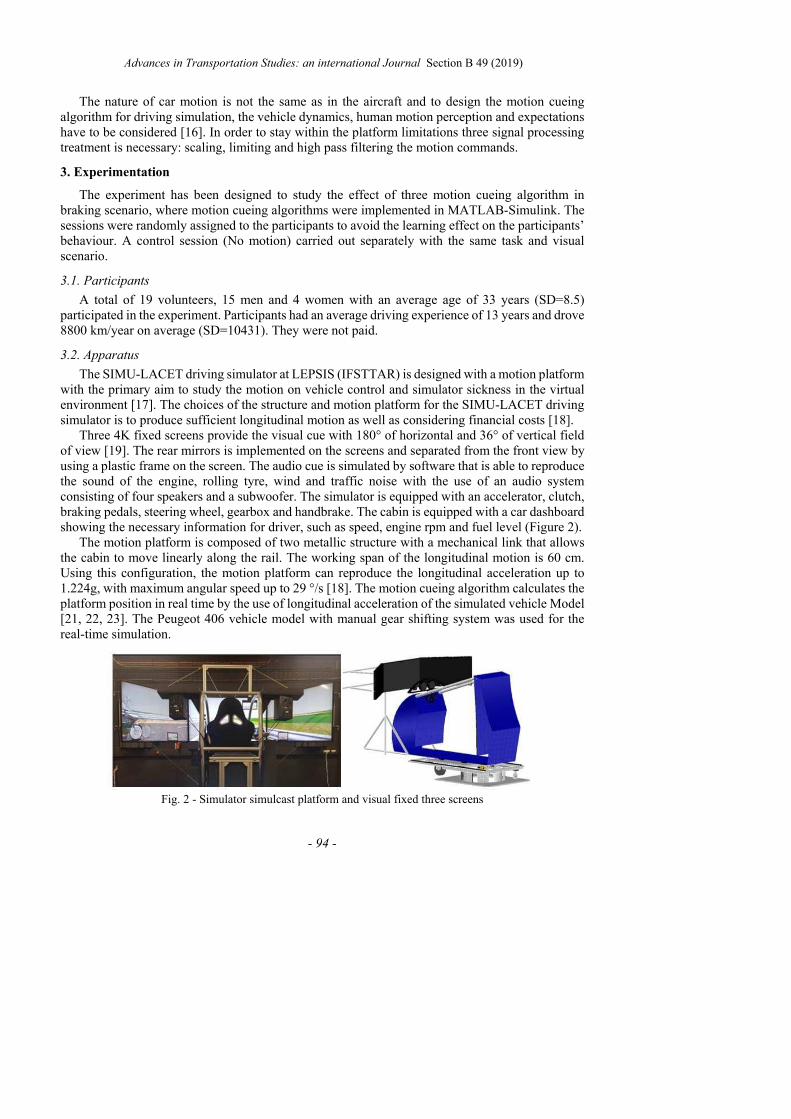
Advances in Transportation Studies: an international Journal Section B 49 (2019)
- 94 -
The nature of car motion is not the same as in the aircraft and to design the motion cueing algorithm for driving simulation, the vehicle dynamics, human motion perception and expectations have to be considered [16]. In order to stay within the platform limitations three signal processing treatment is necessary: scaling, limiting and high pass filtering the motion commands.
3. Experimentation The experiment has been designed to study the effect of three motion cueing algorithm in
braking scenario, where motion cueing algorithms were implemented in MATLAB-Simulink. The sessions were randomly assigned to the participants to avoid the learning effect on the participants’ behaviour. A control session (No motion) carried out separately with the same task and visual scenario.
3.1. Participants
A total of 19 volunteers, 15 men and 4 women with an average age of 33 years (SD=8.5) participated in the experiment. Participants had an average driving experience of 13 years and drove 8800 km/year on average (SD=10431). They were not paid.
3.2. Apparatus
The SIMU-LACET driving simulator at LEPSIS (IFSTTAR) is designed with a motion platform with the primary aim to study the motion on vehicle control and simulator sickness in the virtual environment [17]. The choices of the structure and motion platform for the SIMU-LACET driving simulator is to produce sufficient longitudinal motion as well as considering financial costs [18].
Three 4K fixed screens provide the visual cue with 180° of horizontal and 36° of vertical field of view [19]. The rear mirrors is implemented on the screens and separated from the front view by using a plastic frame on the screen. The audio cue is simulated by software that is able to reproduce the sound of the engine, rolling tyre, wind and traffic noise with the use of an audio system consisting of four speakers and a subwoofer. The simulator is equipped with an accelerator, clutch, braking pedals, steering wheel, gearbox and handbrake. The cabin is equipped with a car dashboard showing the necessary information for driver, such as speed, engine rpm and fuel level (Figure 2).
The motion platform is composed of two metallic structure with a mechanical link that allows the cabin to move linearly along the rail. The working span of the longitudinal motion is 60 cm. Using this configuration, the motion platform can reproduce the longitudinal acceleration up to 1.224g, with maximum angular speed up to 29 °/s [18]. The motion cueing algorithm calculates the platform position in real time by the use of longitudinal acceleration of the simulated vehicle Model [21, 22, 23]. The Peugeot 406 vehicle model with manual gear shifting system was used for the real-time simulation.
Fig. 2 - Simulator simulcast platform and visual fixed three screens
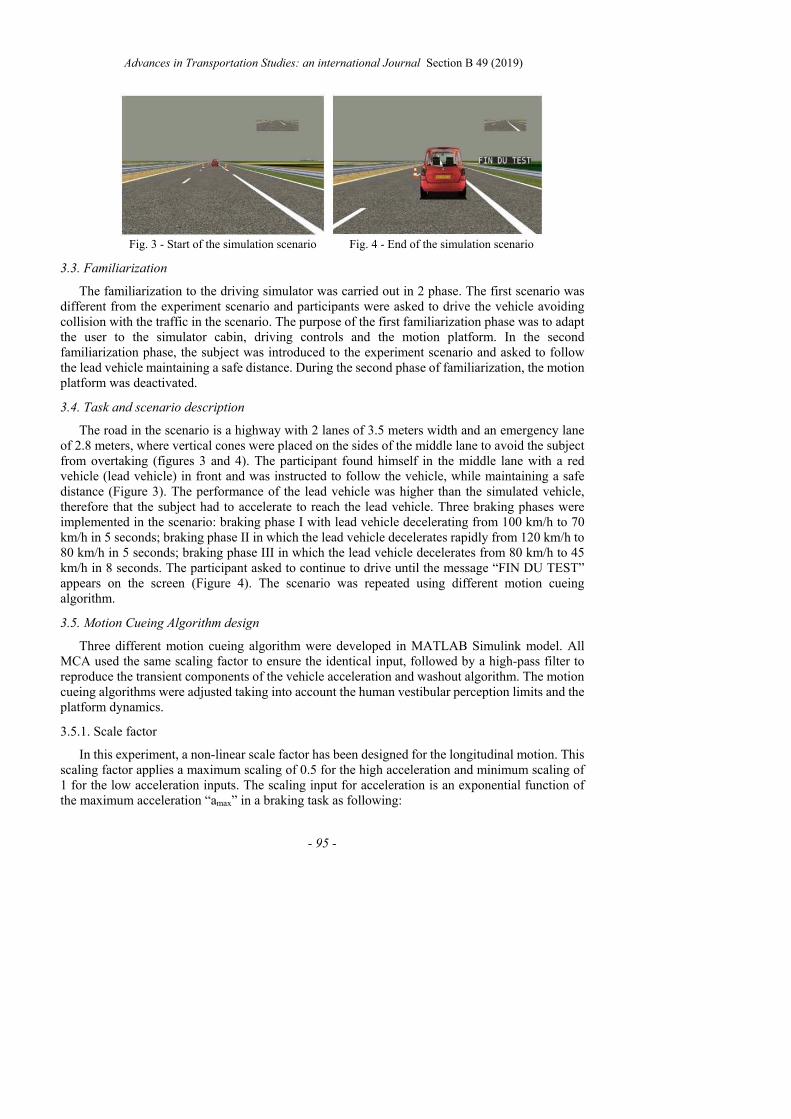
Advances in Transportation Studies: an international Journal Section B 49 (2019)
- 95 -
Fig. 3 - Start of the simulation scenario Fig. 4 - End of the simulation scenario
3.3. Familiarization
The familiarization to the driving simulator was carried out in 2 phase. The first scenario was different from the experiment scenario and participants were asked to drive the vehicle avoiding collision with the traffic in the scenario. The purpose of the first familiarization phase was to adapt the user to the simulator cabin, driving controls and the motion platform. In the second familiarization phase, the subject was introduced to the experiment scenario and asked to follow the lead vehicle maintaining a safe distance. During the second phase of familiarization, the motion platform was deactivated.
3.4. Task and scenario description
The road in the scenario is a highway with 2 lanes of 3.5 meters width and an emergency lane of 2.8 meters, where vertical cones were placed on the sides of the middle lane to avoid the subject from overtaking (figures 3 and 4). The participant found himself in the middle lane with a red vehicle (lead vehicle) in front and was instructed to follow the vehicle, while maintaining a safe distance (Figure 3). The performance of the lead vehicle was higher than the simulated vehicle, therefore that the subject had to accelerate to reach the lead vehicle. Three braking phases were implemented in the scenario: braking phase I with lead vehicle decelerating from 100 km/h to 70 km/h in 5 seconds; braking phase II in which the lead vehicle decelerates rapidly from 120 km/h to 80 km/h in 5 seconds; braking phase III in which the lead vehicle decelerates from 80 km/h to 45 km/h in 8 seconds. The participant asked to continue to drive until the message “FIN DU TEST” appears on the screen (Figure 4). The scenario was repeated using different motion cueing algorithm.
3.5. Motion Cueing Algorithm design
Three different motion cueing algorithm were developed in MATLAB Simulink model. All MCA used the same scaling factor to ensure the identical input, followed by a high-pass filter to reproduce the transient components of the vehicle acceleration and washout algorithm. The motion cueing algorithms were adjusted taking into account the human vestibular perception limits and the platform dynamics.
3.5.1. Scale factor
In this experiment, a non-linear scale factor has been designed for the longitudinal motion. This scaling factor applies a maximum scaling of 0.5 for the high acceleration and minimum scaling of 1 for the low acceleration inputs. The scaling input for acceleration is an exponential function of the maximum acceleration “amax” in a braking task as following:
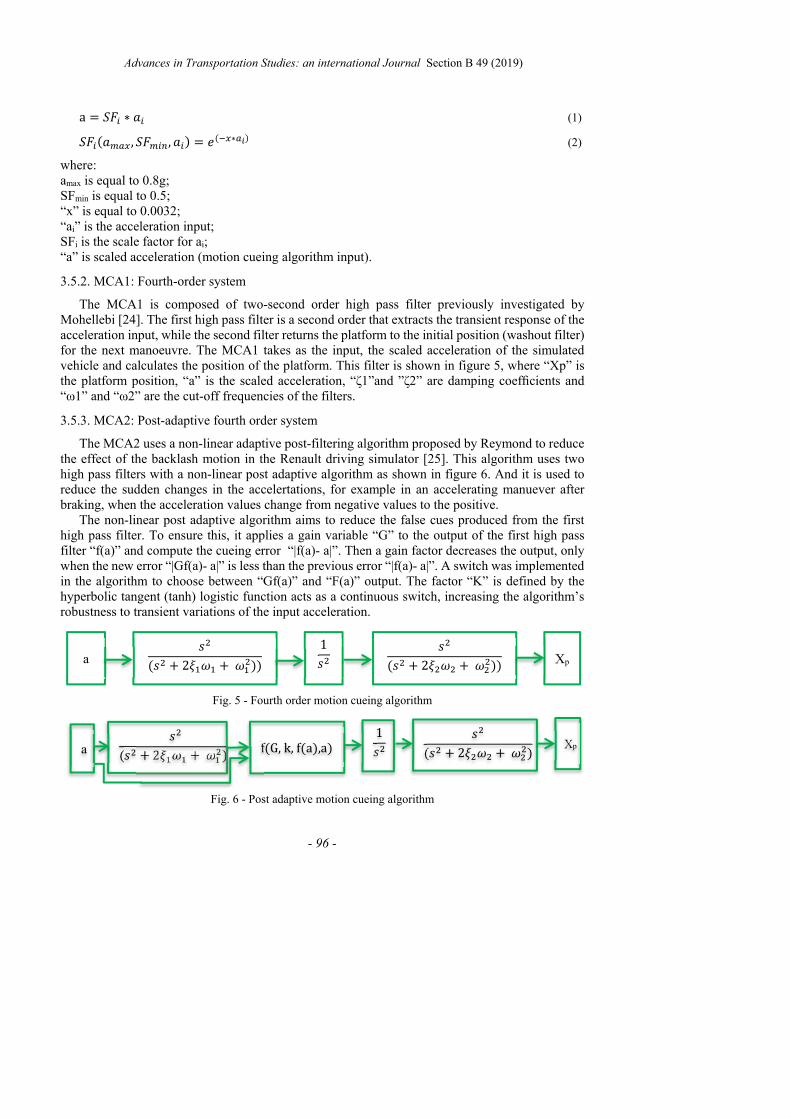
Advances in Transportation Studies: an international Journal Section B 49 (2019)
- 96 -
a 𝑆𝐹 ∗ 𝑎 (1) 𝑆𝐹 𝑎 , 𝑆𝐹 , 𝑎 𝑒 ∗ (2)
where: amax is equal to 0.8g; SFmin is equal to 0.5; “x” is equal to 0.0032; “ai” is the acceleration input; SFi is the scale factor for ai; “a” is scaled acceleration (motion cueing algorithm input).
3.5.2. MCA1: Fourth-order system
The MCA1 is composed of two-second order high pass filter previously investigated by Mohellebi [24]. The first high pass filter is a second order that extracts the transient response of the acceleration input, while the second filter returns the platform to the initial position (washout filter) for the next manoeuvre. The MCA1 takes as the input, the scaled acceleration of the simulated vehicle and calculates the position of the platform. This filter is shown in figure 5, where “Xp” is the platform position, “a” is the scaled acceleration, “ζ1”and ”ζ2” are damping coefficients and “ω1” and “ω2” are the cut-off frequencies of the filters.
3.5.3. MCA2: Post-adaptive fourth order system
The MCA2 uses a non-linear adaptive post-filtering algorithm proposed by Reymond to reduce the effect of the backlash motion in the Renault driving simulator [25]. This algorithm uses two high pass filters with a non-linear post adaptive algorithm as shown in figure 6. And it is used to reduce the sudden changes in the accelertations, for example in an accelerating manuever after braking, when the acceleration values change from negative values to the positive.
The non-linear post adaptive algorithm aims to reduce the false cues produced from the first high pass filter. To ensure this, it applies a gain variable “G” to the output of the first high pass filter “f(a)” and compute the cueing error “|f(a)- a|”. Then a gain factor decreases the output, only when the new error “|Gf(a)- a|” is less than the previous error “|f(a)- a|”. A switch was implemented in the algorithm to choose between “Gf(a)” and “F(a)” output. The factor “K” is defined by the hyperbolic tangent (tanh) logistic function acts as a continuous switch, increasing the algorithm’s robustness to transient variations of the input acceleration.
Fig. 5 - Fourth order motion cueing algorithm
Fig. 6 - Post adaptive motion cueing algorithm
f G, k, f a ,aa 𝑠𝑠 2𝜉 𝜔 𝜔 1𝑠
𝑠𝑠 2𝜉 𝜔 𝜔 Xp
a 𝑠𝑠 2𝜉 𝜔 𝜔
1𝑠 𝑠𝑠 2𝜉 𝜔 𝜔 Xp
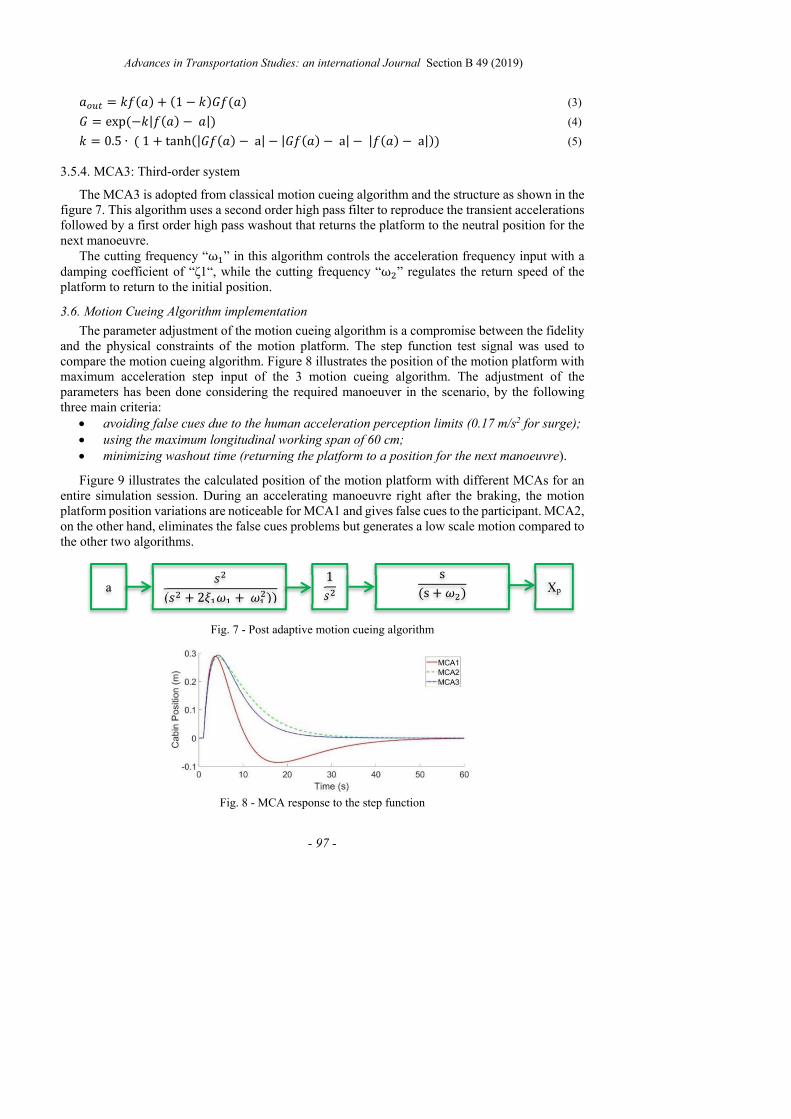
Advances in Transportation Studies: an international Journal Section B 49 (2019)
- 97 -
𝑎 𝑘𝑓 𝑎 1 𝑘 𝐺𝑓 𝑎 (3) 𝐺 exp 𝑘|𝑓 𝑎 𝑎| (4) 𝑘 0.5 ∙ 1 tanh |𝐺𝑓 𝑎 a| |𝐺𝑓 𝑎 a| |𝑓 𝑎 a| (5)
3.5.4. MCA3: Third-order system
The MCA3 is adopted from classical motion cueing algorithm and the structure as shown in the figure 7. This algorithm uses a second order high pass filter to reproduce the transient accelerations followed by a first order high pass washout that returns the platform to the neutral position for the next manoeuvre.
The cutting frequency “ω ” in this algorithm controls the acceleration frequency input with a damping coefficient of “ζ1“, while the cutting frequency “ω ” regulates the return speed of the platform to return to the initial position.
3.6. Motion Cueing Algorithm implementation
The parameter adjustment of the motion cueing algorithm is a compromise between the fidelity and the physical constraints of the motion platform. The step function test signal was used to compare the motion cueing algorithm. Figure 8 illustrates the position of the motion platform with maximum acceleration step input of the 3 motion cueing algorithm. The adjustment of the parameters has been done considering the required manoeuver in the scenario, by the following three main criteria:
avoiding false cues due to the human acceleration perception limits (0.17 m/s2 for surge);
using the maximum longitudinal working span of 60 cm;
minimizing washout time (returning the platform to a position for the next manoeuvre).
Figure 9 illustrates the calculated position of the motion platform with different MCAs for an entire simulation session. During an accelerating manoeuvre right after the braking, the motion platform position variations are noticeable for MCA1 and gives false cues to the participant. MCA2, on the other hand, eliminates the false cues problems but generates a low scale motion compared to the other two algorithms.
Fig. 7 - Post adaptive motion cueing algorithm
Fig. 8 - MCA response to the step function
a 𝑠𝑠 2𝜉 𝜔 𝜔
1𝑠 ss 𝜔 Xp
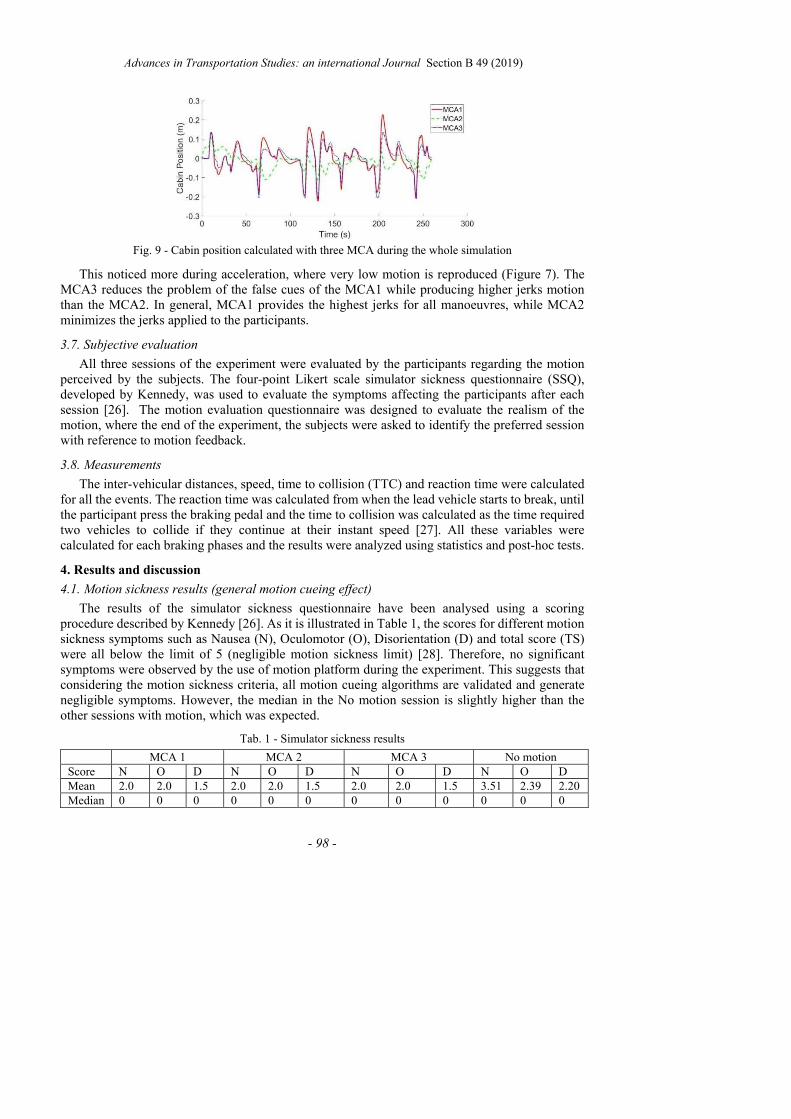
Advances in Transportation Studies: an international Journal Section B 49 (2019)
- 98 -
Fig. 9 - Cabin position calculated with three MCA during the whole simulation
This noticed more during acceleration, where very low motion is reproduced (Figure 7). The MCA3 reduces the problem of the false cues of the MCA1 while producing higher jerks motion than the MCA2. In general, MCA1 provides the highest jerks for all manoeuvres, while MCA2 minimizes the jerks applied to the participants.
3.7. Subjective evaluation
All three sessions of the experiment were evaluated by the participants regarding the motion perceived by the subjects. The four-point Likert scale simulator sickness questionnaire (SSQ), developed by Kennedy, was used to evaluate the symptoms affecting the participants after each session [26]. The motion evaluation questionnaire was designed to evaluate the realism of the motion, where the end of the experiment, the subjects were asked to identify the preferred session with reference to motion feedback.
3.8. Measurements
The inter-vehicular distances, speed, time to collision (TTC) and reaction time were calculated for all the events. The reaction time was calculated from when the lead vehicle starts to break, until the participant press the braking pedal and the time to collision was calculated as the time required two vehicles to collide if they continue at their instant speed [27]. All these variables were calculated for each braking phases and the results were analyzed using statistics and post-hoc tests.
4. Results and discussion 4.1. Motion sickness results (general motion cueing effect)
The results of the simulator sickness questionnaire have been analysed using a scoring procedure described by Kennedy [26]. As it is illustrated in Table 1, the scores for different motion sickness symptoms such as Nausea (N), Oculomotor (O), Disorientation (D) and total score (TS) were all below the limit of 5 (negligible motion sickness limit) [28]. Therefore, no significant symptoms were observed by the use of motion platform during the experiment. This suggests that considering the motion sickness criteria, all motion cueing algorithms are validated and generate negligible symptoms. However, the median in the No motion session is slightly higher than the other sessions with motion, which was expected.
Tab. 1 - Simulator sickness results
MCA 1 MCA 2 MCA 3 No motion Score N O D N O D N O D N O D Mean 2.0 2.0 1.5 2.0 2.0 1.5 2.0 2.0 1.5 3.51 2.39 2.20 Median 0 0 0 0 0 0 0 0 0 0 0 0
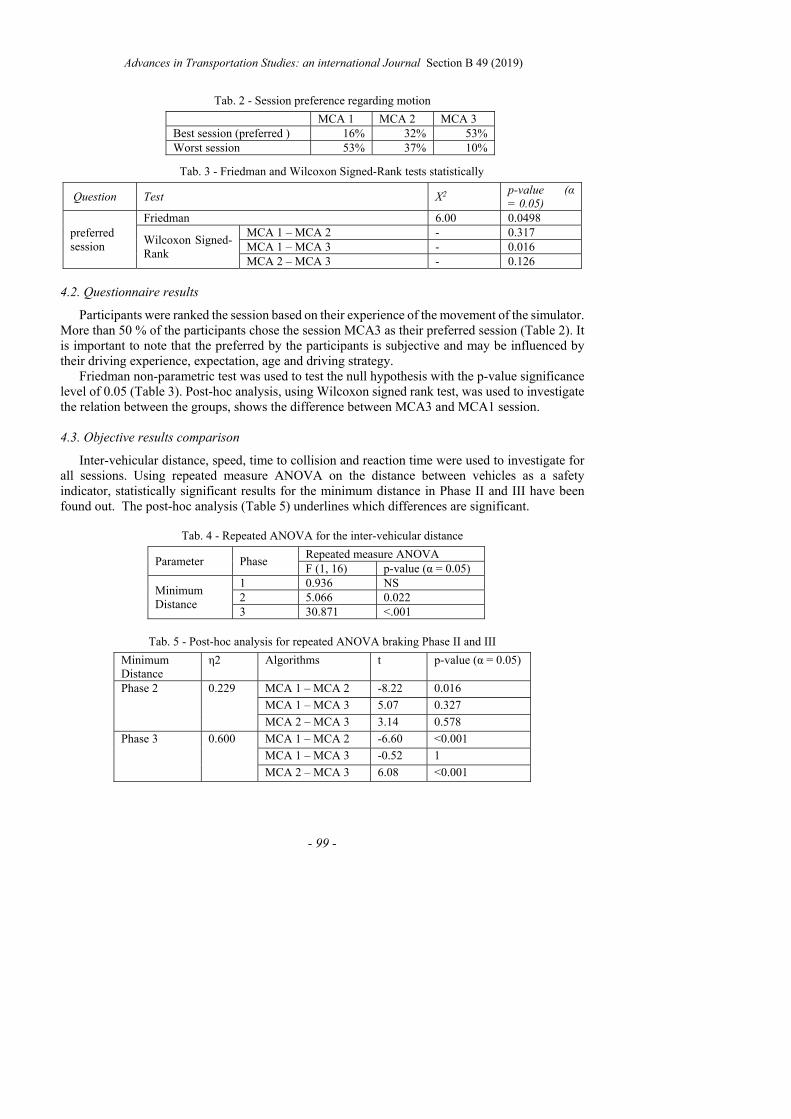
Advances in Transportation Studies: an international Journal Section B 49 (2019)
- 99 -
Tab. 2 - Session preference regarding motion MCA 1 MCA 2 MCA 3 Best session (preferred ) 16% 32% 53% Worst session 53% 37% 10%
Tab. 3 - Friedman and Wilcoxon Signed-Rank tests statistically
Question Test Χ2 p-value (α
= 0.05)
preferred session
Friedman 6.00 0.0498
Wilcoxon Signed-Rank
MCA 1 – MCA 2 - 0.317 MCA 1 – MCA 3 - 0.016 MCA 2 – MCA 3 - 0.126
4.2. Questionnaire results
Participants were ranked the session based on their experience of the movement of the simulator. More than 50 % of the participants chose the session MCA3 as their preferred session (Table 2). It is important to note that the preferred by the participants is subjective and may be influenced by their driving experience, expectation, age and driving strategy.
Friedman non-parametric test was used to test the null hypothesis with the p-value significance level of 0.05 (Table 3). Post-hoc analysis, using Wilcoxon signed rank test, was used to investigate the relation between the groups, shows the difference between MCA3 and MCA1 session.
4.3. Objective results comparison
Inter-vehicular distance, speed, time to collision and reaction time were used to investigate for all sessions. Using repeated measure ANOVA on the distance between vehicles as a safety indicator, statistically significant results for the minimum distance in Phase II and III have been found out. The post-hoc analysis (Table 5) underlines which differences are significant.
Tab. 4 - Repeated ANOVA for the inter-vehicular distance
Parameter Phase Repeated measure ANOVA F (1, 16) p-value (α = 0.05)
Minimum Distance
1 0.936 NS 2 5.066 0.022 3 30.871 <.001
Tab. 5 - Post-hoc analysis for repeated ANOVA braking Phase II and III
Minimum Distance
η2 Algorithms t p-value (α = 0.05)
Phase 2 0.229 MCA 1 – MCA 2 -8.22 0.016 MCA 1 – MCA 3 5.07 0.327 MCA 2 – MCA 3 3.14 0.578
Phase 3 0.600 MCA 1 – MCA 2 -6.60 <0.001 MCA 1 – MCA 3 -0.52 1 MCA 2 – MCA 3 6.08 <0.001
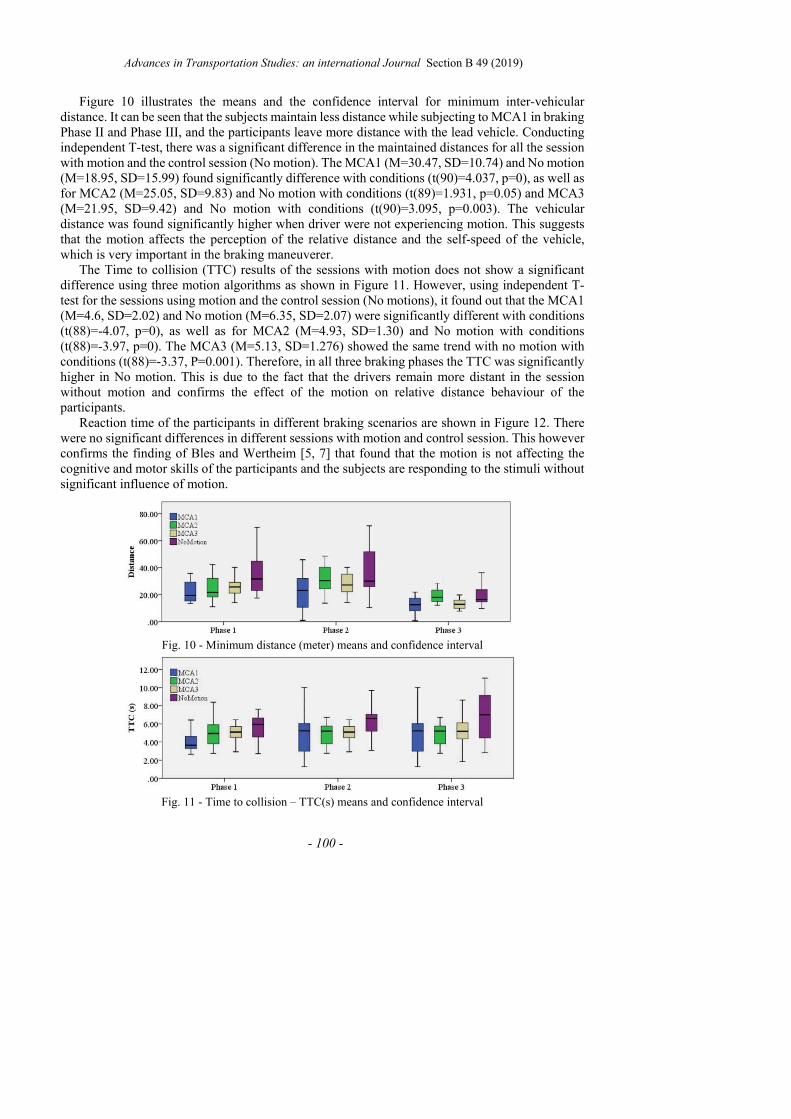
Advances in Transportation Studies: an international Journal Section B 49 (2019)
- 100 -
Figure 10 illustrates the means and the confidence interval for minimum inter-vehicular distance. It can be seen that the subjects maintain less distance while subjecting to MCA1 in braking Phase II and Phase III, and the participants leave more distance with the lead vehicle. Conducting independent T-test, there was a significant difference in the maintained distances for all the session with motion and the control session (No motion). The MCA1 (M=30.47, SD=10.74) and No motion (M=18.95, SD=15.99) found significantly difference with conditions (t(90)=4.037, p=0), as well as for MCA2 (M=25.05, SD=9.83) and No motion with conditions (t(89)=1.931, p=0.05) and MCA3 (M=21.95, SD=9.42) and No motion with conditions (t(90)=3.095, p=0.003). The vehicular distance was found significantly higher when driver were not experiencing motion. This suggests that the motion affects the perception of the relative distance and the self-speed of the vehicle, which is very important in the braking maneuverer.
The Time to collision (TTC) results of the sessions with motion does not show a significant difference using three motion algorithms as shown in Figure 11. However, using independent T-test for the sessions using motion and the control session (No motions), it found out that the MCA1 (M=4.6, SD=2.02) and No motion (M=6.35, SD=2.07) were significantly different with conditions (t(88)=-4.07, p=0), as well as for MCA2 (M=4.93, SD=1.30) and No motion with conditions (t(88)=-3.97, p=0). The MCA3 (M=5.13, SD=1.276) showed the same trend with no motion with conditions (t(88)=-3.37, P=0.001). Therefore, in all three braking phases the TTC was significantly higher in No motion. This is due to the fact that the drivers remain more distant in the session without motion and confirms the effect of the motion on relative distance behaviour of the participants.
Reaction time of the participants in different braking scenarios are shown in Figure 12. There were no significant differences in different sessions with motion and control session. This however confirms the finding of Bles and Wertheim [5, 7] that found that the motion is not affecting the cognitive and motor skills of the participants and the subjects are responding to the stimuli without significant influence of motion.
Fig. 10 - Minimum distance (meter) means and confidence interval
Fig. 11 - Time to collision – TTC(s) means and confidence interval
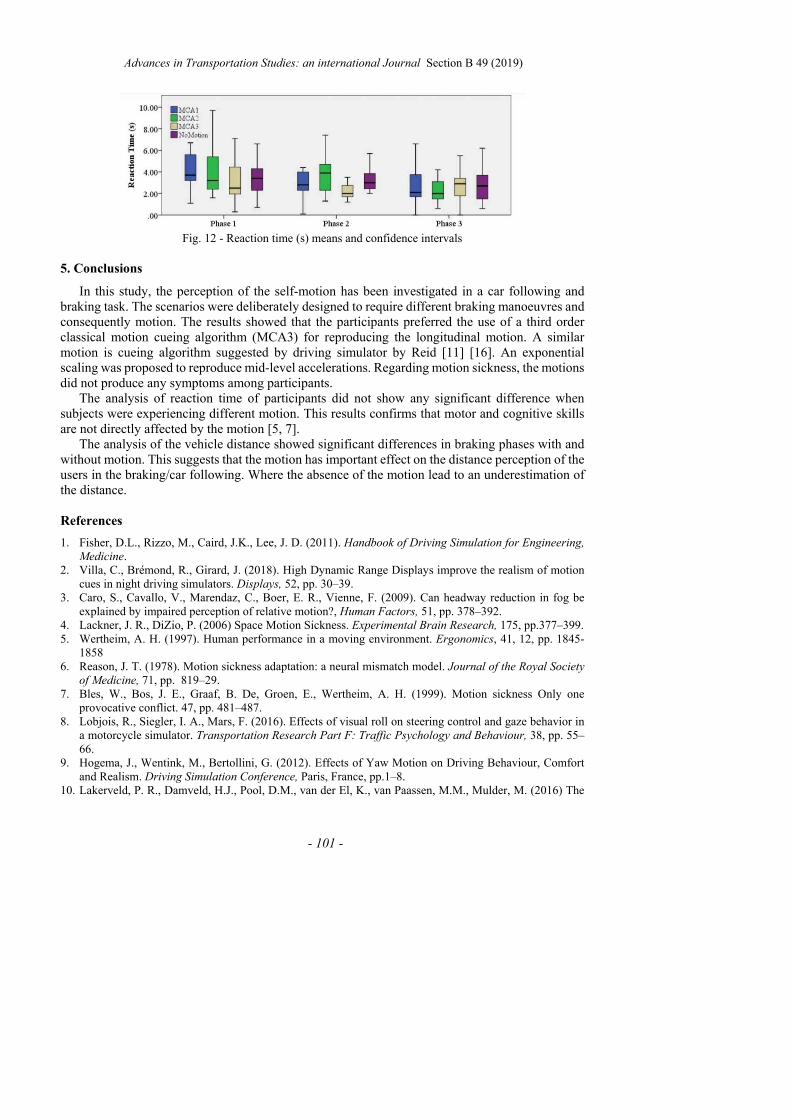
Advances in Transportation Studies: an international Journal Section B 49 (2019)
- 101 -
Fig. 12 - Reaction time (s) means and confidence intervals
5. Conclusions
In this study, the perception of the self-motion has been investigated in a car following and braking task. The scenarios were deliberately designed to require different braking manoeuvres and consequently motion. The results showed that the participants preferred the use of a third order classical motion cueing algorithm (MCA3) for reproducing the longitudinal motion. A similar motion is cueing algorithm suggested by driving simulator by Reid [11] [16]. An exponential scaling was proposed to reproduce mid-level accelerations. Regarding motion sickness, the motions did not produce any symptoms among participants.
The analysis of reaction time of participants did not show any significant difference when subjects were experiencing different motion. This results confirms that motor and cognitive skills are not directly affected by the motion [5, 7].
The analysis of the vehicle distance showed significant differences in braking phases with and without motion. This suggests that the motion has important effect on the distance perception of the users in the braking/car following. Where the absence of the motion lead to an underestimation of the distance. References 1. Fisher, D.L., Rizzo, M., Caird, J.K., Lee, J. D. (2011). Handbook of Driving Simulation for Engineering,
Medicine. 2. Villa, C., Brémond, R., Girard, J. (2018). High Dynamic Range Displays improve the realism of motion
cues in night driving simulators. Displays, 52, pp. 30–39. 3. Caro, S., Cavallo, V., Marendaz, C., Boer, E. R., Vienne, F. (2009). Can headway reduction in fog be
explained by impaired perception of relative motion?, Human Factors, 51, pp. 378–392. 4. Lackner, J. R., DiZio, P. (2006) Space Motion Sickness. Experimental Brain Research, 175, pp.377–399. 5. Wertheim, A. H. (1997). Human performance in a moving environment. Ergonomics, 41, 12, pp. 1845-
1858 6. Reason, J. T. (1978). Motion sickness adaptation: a neural mismatch model. Journal of the Royal Society
of Medicine, 71, pp. 819–29. 7. Bles, W., Bos, J. E., Graaf, B. De, Groen, E., Wertheim, A. H. (1999). Motion sickness Only one
provocative conflict. 47, pp. 481–487. 8. Lobjois, R., Siegler, I. A., Mars, F. (2016). Effects of visual roll on steering control and gaze behavior in
a motorcycle simulator. Transportation Research Part F: Traffic Psychology and Behaviour, 38, pp. 55–66.
9. Hogema, J., Wentink, M., Bertollini, G. (2012). Effects of Yaw Motion on Driving Behaviour, Comfort and Realism. Driving Simulation Conference, Paris, France, pp.1–8.
10. Lakerveld, P. R., Damveld, H.J., Pool, D.M., van der El, K., van Paassen, M.M., Mulder, M. (2016) The

Advances in Transportation Studies: an international Journal Section B 49 (2019)
- 102 -
Effects of Yaw and Sway Motion Cues in Curve Driving Simulation. IFAC-PapersOnLine, 49, pp.500–505.
11. Reid, L. D. & Nahon, M. A. (1985). Flight Simulation Motion-Base Drive Algorithms: Part 1 - Developing
and Testing the Equations., University of Toronto, Canada 12. Sivan, R., Ish-Shalom, J., Huang, J. K. (1982). An Optimal Control Approach to the Design of Moving
Flight Simulators. IEEE Transactions on Systems, Man and Cybernetics, 12, pp.818–827. 13. Parrish, R., Dieudonne, J., Bowles, R., Martin, Jr., D. (1973). Coordinated adaptive washout for motion
simulators. Visual and Motion Simulation Conference., Palo Alto,California,U.S.A. 14. Nehaoua, L., Amouri, A., Arioui, H. (2005). Classic and adaptive washout comparison for a low cost
driving simulator. Proceedings of the 20th IEEE International Symposium on Intelligent Control, ISIC '05
and the 13th Mediterranean Conference on Control and Automation, pp. 586–591. 15. Telban, R. J., Cardullo, F. (2005). Motion cueing algorithm development: Human-centered linear and
nonlinear approaches. NASA TechReport CR-2005-213747. 16. Nehaoua, L., Arioui H., Espie, S., Mohellebi, H. (2009). Motion Cueing Algorithms for Small Driving
Simulator IEEE International Conference in Robotics and Automation (ICRA06), Orlando, Florida, United States. pp. 3189–3194.
17. Vienne, F., Caro, S., Désiré, L., Auberlet, J. M., Rosey, F., Dumont, E. (2014). Driving simulator: an innovative tool to test new road infrastructures. TRA - Transport Research Arena., Paris, France
18. Arioui, H., Hima, S., Nehaoua., L., (2009). 2 DOF Low Cost Platform for Driving Simulator : Design and Modeling Control. IEEE/ASME International Conference on Advanced Intelligent Mechatronics, pp. 1206–1211.
19. Rosey, F., Aillerie, I., Espié, S., Vienne, F. (2017). Driver behaviour in fog is not only a question of degraded visibility – A simulator study. Safety Science, 95, pp. 50-61.
20. Imine, H. (2003), Observation d ’ états d ’ un véhicule pour l ’ estimation du profil dans les traces de roulement, Thèse Hocine Imine, Université de Versailles-St Quentin en Yvelines , France
21. Imine, H., Delanne, Y. , M ’sirdi, N. K. (2006). Vehicle System Dynamics Road profile input estimation in vehicle dynamics simulation Road profile input estimation in vehicle dynamics simulation. Vehicle
System Dynamics, 44, pp. 285–303. 22. Pieroni, A., Lantieri, C., Imine, H., Simone, A. (2016). Light vehicle model for dynamic car simulator.
Transport, 31, pp. 242–249. 23. Simone, A., Carpinone, M., Lantieri, C., Imine, H. (2017). Development and validation of a powertrain
model for low-cost driving simulators. Advances in Transportation Studies, 41, pp.85-100 24. Mohellebi, H. (2005) Conception et réalisation de systèmes de restitution de mouvement et de retour
haptique pour un simulateur de conduite à faible coût dédié à l’étude comportementale du conducteur. , Thèse Mohellebi, Université d’evry-Val D’essonne, France
25. Reymond, G., Kemeny, A. (2000). Motion Cueing in the Renault Driving Simulator. Vehicle System
Dynamics, 34, pp. 249–259. 26. Kennedy, R. S., Lane, N. E., Kevin, S., Lilienthal, M. G. (1993). Simulator Sickness Questionnaire : An
Enhanced Method for Quantifying Simulator Sickness. The International Journal of Aviation Psychology, 3, pp. 203–220.
27. Laureshyn, A., Goede, M. De, Saunier, N., Fyhri, A. (2016). Cross-comparison of three surrogate safety methods to diagnose cyclist safety problems at intersections in Norway. Accident Analysis and
Prevention.,105, pp.11–20. 28. Kennedy, R. S., Drexler, J. M., Compton, D. E., Stanney, K. M., Lanham, D. S., Harm, D. L. (2003).
Configural scoring of simulator sickness, cybersickness, and space adaptation syndrome: Similarities and differences., Virtual and Adaptive Environments Applications Implications and Human Performance
Issues, pp. 247-278.
Annexe
141
Annex III. Case Study III:
Authors:
N. Ghasemi, E. Acerra, V. Vignali, C. Lantieri, A. Simone, H. Imine
Name of the Publication:
Road safety review update by using innovative technologies to investigate driver behaviour
Publisher: TIS ROM- AIT
Series: AIIT 2ND INTERNATIONAL CONGRESS
Field of research: Road and Highway Engineering
Manuscript submitted: 15 July 2019 Accepted: 23 September 2019
Conference Paper Journal Paper
Summary:
The urban highways consist of ramps, roundabouts and elements which may increase the accident
probabilities, considering the high-speed passage of the drivers. The Urban Arterial Roads
investigated in this case study by the traditional road safety review, accident analysis and site test
with different participants. By analyzing the vehicle trajectory and velocity of the participants it
found out that the driver exceeded the velocity limits of the road in major part of the road and
considering the identified critical points, the drivers did not perceive the risk in the road or did not
feel the necessity to reduce the velocity. The Inertial Measurement Unit used to investigate the quality
of the pavement. The vibrations of the vertical axis were much higher when there is damaged
pavement and it, therefore, the site experimentation can be used to identify the damaged pavement
from the accelerometer.
The eye-tracking data in this paper was used to investigate the visual driver behaviour toward the
road. In particular, the fixation duration of the drivers on road sign with low visibility was studied
and the results showed that the presence of trees and vegetation reduced significantly the driver
fixation on the sign.
The behaviour of the drivers in the proximity of the speed trap showed that drivers were increasing
their velocity just after the speed trap and the operating velocity was remain higher than what was
suggested by the road design. Also, the camera was a distractive element for the drivers since they
might look at the camera.
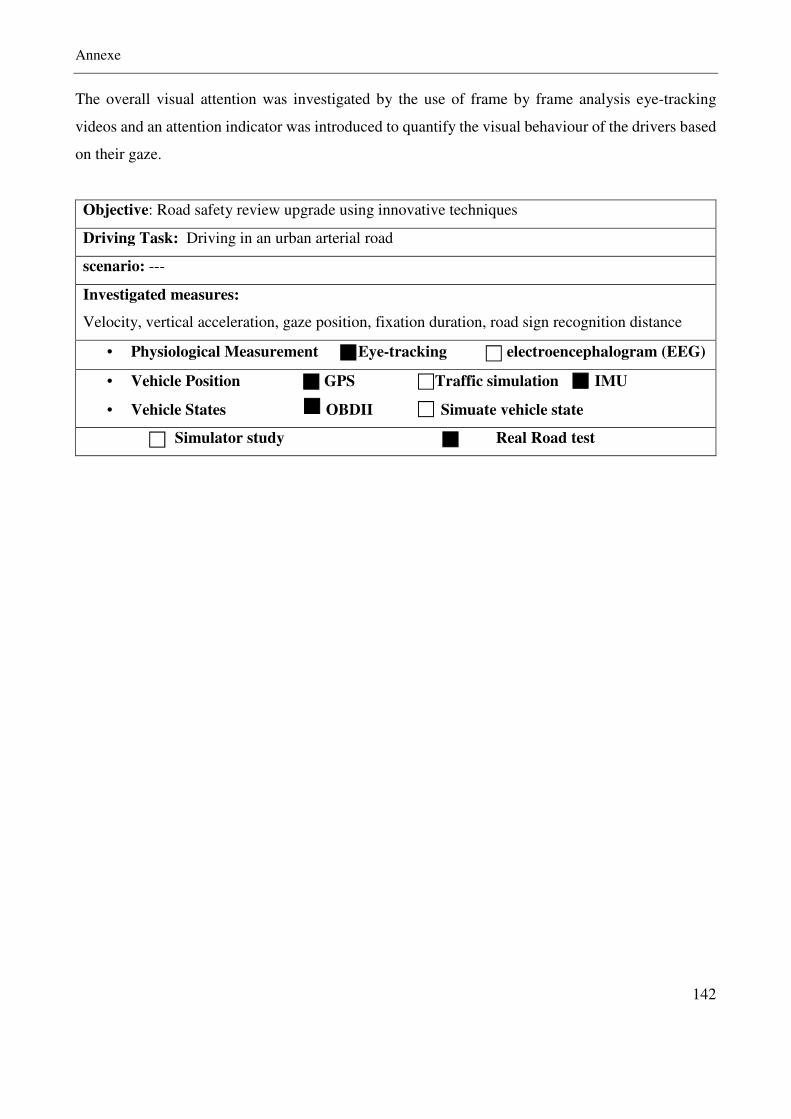
Annexe
142
The overall visual attention was investigated by the use of frame by frame analysis eye-tracking
videos and an attention indicator was introduced to quantify the visual behaviour of the drivers based
on their gaze.
Objective: Road safety review upgrade using innovative techniques
Driving Task: Driving in an urban arterial road
scenario: ---
Investigated measures:
Velocity, vertical acceleration, gaze position, fixation duration, road sign recognition distance
• Physiological Measurement Eye-tracking electroencephalogram (EEG)
• Vehicle Position GPS Traffic simulation IMU
• Vehicle States OBDII Simuate vehicle state
Simulator study Real Road test
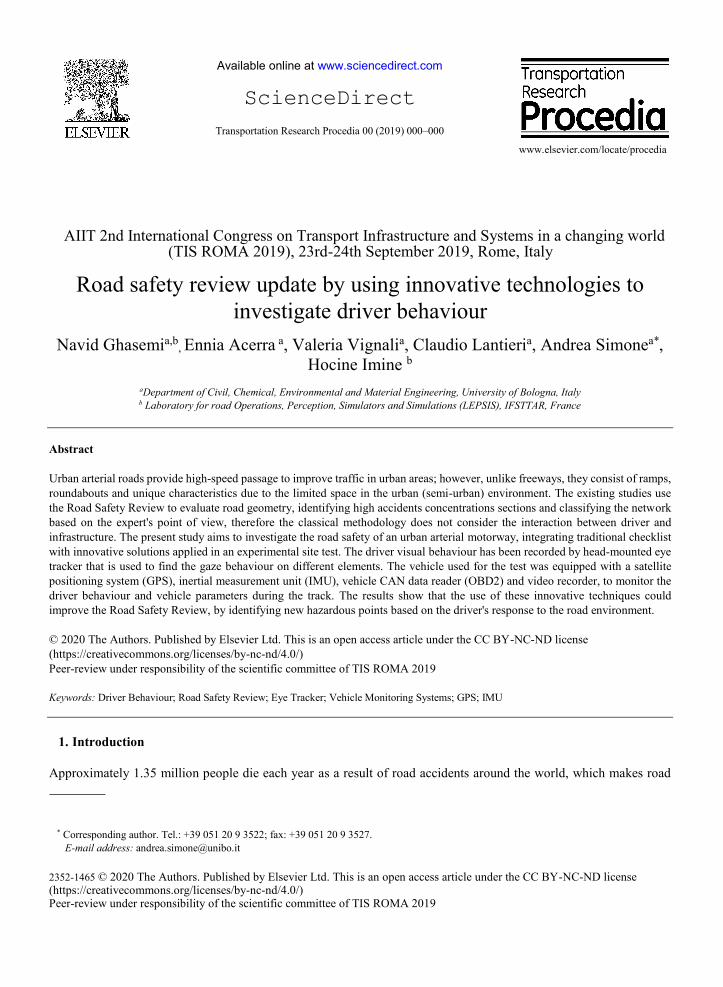
Available online at www.sciencedirect.com
ScienceDirect
Transportation Research Procedia 00 (2019) 000–000
www.elsevier.com/locate/procedia
2352-1465 © 2020 The Authors. Published by Elsevier Ltd. This is an open access article under the CC BY-NC-ND license (https://creativecommons.org/licenses/by-nc-nd/4.0/) Peer-review under responsibility of the scientific committee of TIS ROMA 2019
AIIT 2nd International Congress on Transport Infrastructure and Systems in a changing world (TIS ROMA 2019), 23rd-24th September 2019, Rome, Italy
Road safety review update by using innovative technologies to
investigate driver behaviour
Navid Ghasemia,b, Ennia Acerra a, Valeria Vignalia, Claudio Lantieria, Andrea Simonea*,
Hocine Imine b
aDepartment of Civil, Chemical, Environmental and Material Engineering, University of Bologna, Italy b Laboratory for road Operations, Perception, Simulators and Simulations (LEPSIS), IFSTTAR, France
Abstract
Urban arterial roads provide high-speed passage to improve traffic in urban areas; however, unlike freeways, they consist of ramps,
roundabouts and unique characteristics due to the limited space in the urban (semi-urban) environment. The existing studies use
the Road Safety Review to evaluate road geometry, identifying high accidents concentrations sections and classifying the network
based on the expert's point of view, therefore the classical methodology does not consider the interaction between driver and
infrastructure. The present study aims to investigate the road safety of an urban arterial motorway, integrating traditional checklist
with innovative solutions applied in an experimental site test. The driver visual behaviour has been recorded by head-mounted eye
tracker that is used to find the gaze behaviour on different elements. The vehicle used for the test was equipped with a satellite
positioning system (GPS), inertial measurement unit (IMU), vehicle CAN data reader (OBD2) and video recorder, to monitor the
driver behaviour and vehicle parameters during the track. The results show that the use of these innovative techniques could
improve the Road Safety Review, by identifying new hazardous points based on the driver's response to the road environment.
© 2020 The Authors. Published by Elsevier Ltd. This is an open access article under the CC BY-NC-ND license
(https://creativecommons.org/licenses/by-nc-nd/4.0/)
Peer-review under responsibility of the scientific committee of TIS ROMA 2019
Keywords: Driver Behaviour; Road Safety Review; Eye Tracker; Vehicle Monitoring Systems; GPS; IMU
1. Introduction
Approximately 1.35 million people die each year as a result of road accidents around the world, which makes road
* Corresponding author. Tel.: +39 051 20 9 3522; fax: +39 051 20 9 3527.
E-mail address: [email protected]
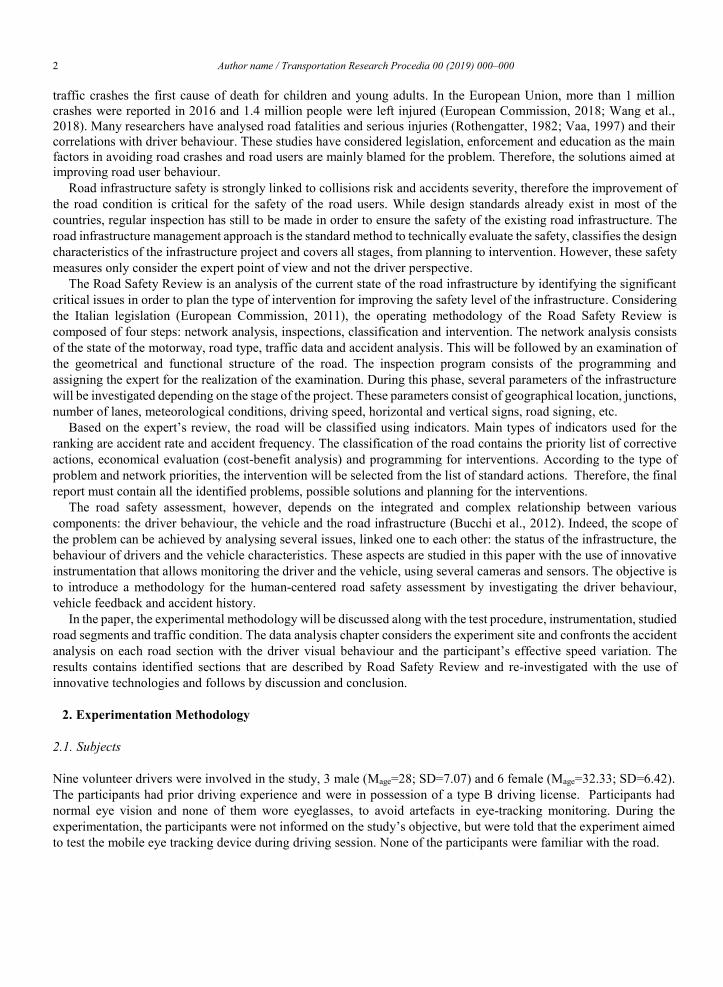
2 Author name / Transportation Research Procedia 00 (2019) 000–000
traffic crashes the first cause of death for children and young adults. In the European Union, more than 1 million
crashes were reported in 2016 and 1.4 million people were left injured (European Commission, 2018; Wang et al.,
2018). Many researchers have analysed road fatalities and serious injuries (Rothengatter, 1982; Vaa, 1997) and their
correlations with driver behaviour. These studies have considered legislation, enforcement and education as the main
factors in avoiding road crashes and road users are mainly blamed for the problem. Therefore, the solutions aimed at
improving road user behaviour.
Road infrastructure safety is strongly linked to collisions risk and accidents severity, therefore the improvement of
the road condition is critical for the safety of the road users. While design standards already exist in most of the
countries, regular inspection has still to be made in order to ensure the safety of the existing road infrastructure. The
road infrastructure management approach is the standard method to technically evaluate the safety, classifies the design
characteristics of the infrastructure project and covers all stages, from planning to intervention. However, these safety
measures only consider the expert point of view and not the driver perspective.
The Road Safety Review is an analysis of the current state of the road infrastructure by identifying the significant
critical issues in order to plan the type of intervention for improving the safety level of the infrastructure. Considering
the Italian legislation (European Commission, 2011), the operating methodology of the Road Safety Review is
composed of four steps: network analysis, inspections, classification and intervention. The network analysis consists
of the state of the motorway, road type, traffic data and accident analysis. This will be followed by an examination of
the geometrical and functional structure of the road. The inspection program consists of the programming and
assigning the expert for the realization of the examination. During this phase, several parameters of the infrastructure
will be investigated depending on the stage of the project. These parameters consist of geographical location, junctions,
number of lanes, meteorological conditions, driving speed, horizontal and vertical signs, road signing, etc.
Based on the expert’s review, the road will be classified using indicators. Main types of indicators used for the
ranking are accident rate and accident frequency. The classification of the road contains the priority list of corrective
actions, economical evaluation (cost-benefit analysis) and programming for interventions. According to the type of
problem and network priorities, the intervention will be selected from the list of standard actions. Therefore, the final
report must contain all the identified problems, possible solutions and planning for the interventions.
The road safety assessment, however, depends on the integrated and complex relationship between various
components: the driver behaviour, the vehicle and the road infrastructure (Bucchi et al., 2012). Indeed, the scope of
the problem can be achieved by analysing several issues, linked one to each other: the status of the infrastructure, the
behaviour of drivers and the vehicle characteristics. These aspects are studied in this paper with the use of innovative
instrumentation that allows monitoring the driver and the vehicle, using several cameras and sensors. The objective is
to introduce a methodology for the human-centered road safety assessment by investigating the driver behaviour,
vehicle feedback and accident history.
In the paper, the experimental methodology will be discussed along with the test procedure, instrumentation, studied
road segments and traffic condition. The data analysis chapter considers the experiment site and confronts the accident
analysis on each road section with the driver visual behaviour and the participant’s effective speed variation. The
results contains identified sections that are described by Road Safety Review and re-investigated with the use of
innovative technologies and follows by discussion and conclusion.
2. Experimentation Methodology
2.1. Subjects
Nine volunteer drivers were involved in the study, 3 male (Mage=28; SD=7.07) and 6 female (Mage=32.33; SD=6.42).
The participants had prior driving experience and were in possession of a type B driving license. Participants had
normal eye vision and none of them wore eyeglasses, to avoid artefacts in eye-tracking monitoring. During the
experimentation, the participants were not informed on the study’s objective, but were told that the experiment aimed
to test the mobile eye tracking device during driving session. None of the participants were familiar with the road.
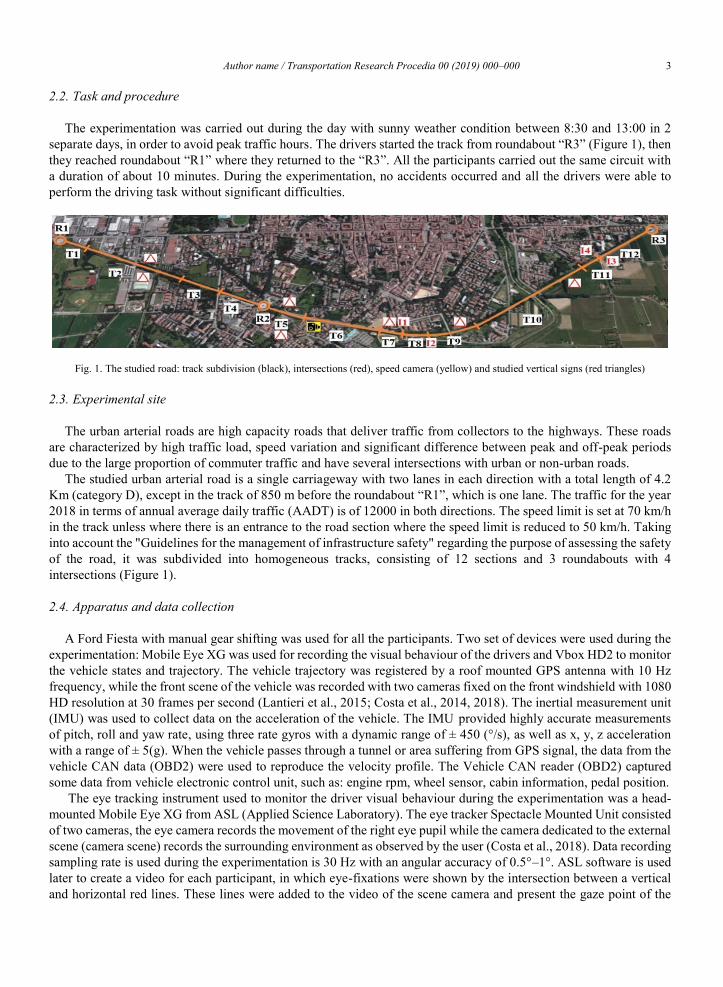
Author name / Transportation Research Procedia 00 (2019) 000–000 3
2.2. Task and procedure
The experimentation was carried out during the day with sunny weather condition between 8:30 and 13:00 in 2
separate days, in order to avoid peak traffic hours. The drivers started the track from roundabout “R3” (Figure 1), then they reached roundabout “R1” where they returned to the “R3”. All the participants carried out the same circuit with
a duration of about 10 minutes. During the experimentation, no accidents occurred and all the drivers were able to
perform the driving task without significant difficulties.
Fig. 1. The studied road: track subdivision (black), intersections (red), speed camera (yellow) and studied vertical signs (red triangles)
2.3. Experimental site
The urban arterial roads are high capacity roads that deliver traffic from collectors to the highways. These roads
are characterized by high traffic load, speed variation and significant difference between peak and off-peak periods
due to the large proportion of commuter traffic and have several intersections with urban or non-urban roads.
The studied urban arterial road is a single carriageway with two lanes in each direction with a total length of 4.2
Km (category D), except in the track of 850 m before the roundabout “R1”, which is one lane. The traffic for the year
2018 in terms of annual average daily traffic (AADT) is of 12000 in both directions. The speed limit is set at 70 km/h
in the track unless where there is an entrance to the road section where the speed limit is reduced to 50 km/h. Taking
into account the "Guidelines for the management of infrastructure safety" regarding the purpose of assessing the safety
of the road, it was subdivided into homogeneous tracks, consisting of 12 sections and 3 roundabouts with 4
intersections (Figure 1).
2.4. Apparatus and data collection
A Ford Fiesta with manual gear shifting was used for all the participants. Two set of devices were used during the
experimentation: Mobile Eye XG was used for recording the visual behaviour of the drivers and Vbox HD2 to monitor
the vehicle states and trajectory. The vehicle trajectory was registered by a roof mounted GPS antenna with 10 Hz
frequency, while the front scene of the vehicle was recorded with two cameras fixed on the front windshield with 1080
HD resolution at 30 frames per second (Lantieri et al., 2015; Costa et al., 2014, 2018). The inertial measurement unit
(IMU) was used to collect data on the acceleration of the vehicle. The IMU provided highly accurate measurements
of pitch, roll and yaw rate, using three rate gyros with a dynamic range of ± 450 (°/s), as well as x, y, z acceleration
with a range of ± 5(g). When the vehicle passes through a tunnel or area suffering from GPS signal, the data from the
vehicle CAN data (OBD2) were used to reproduce the velocity profile. The Vehicle CAN reader (OBD2) captured
some data from vehicle electronic control unit, such as: engine rpm, wheel sensor, cabin information, pedal position.
The eye tracking instrument used to monitor the driver visual behaviour during the experimentation was a head-
mounted Mobile Eye XG from ASL (Applied Science Laboratory). The eye tracker Spectacle Mounted Unit consisted
of two cameras, the eye camera records the movement of the right eye pupil while the camera dedicated to the external
scene (camera scene) records the surrounding environment as observed by the user (Costa et al., 2018). Data recording
sampling rate is used during the experimentation is 30 Hz with an angular accuracy of 0.5°–1°. ASL software is used
later to create a video for each participant, in which eye-fixations were shown by the intersection between a vertical
and horizontal red lines. These lines were added to the video of the scene camera and present the gaze point of the
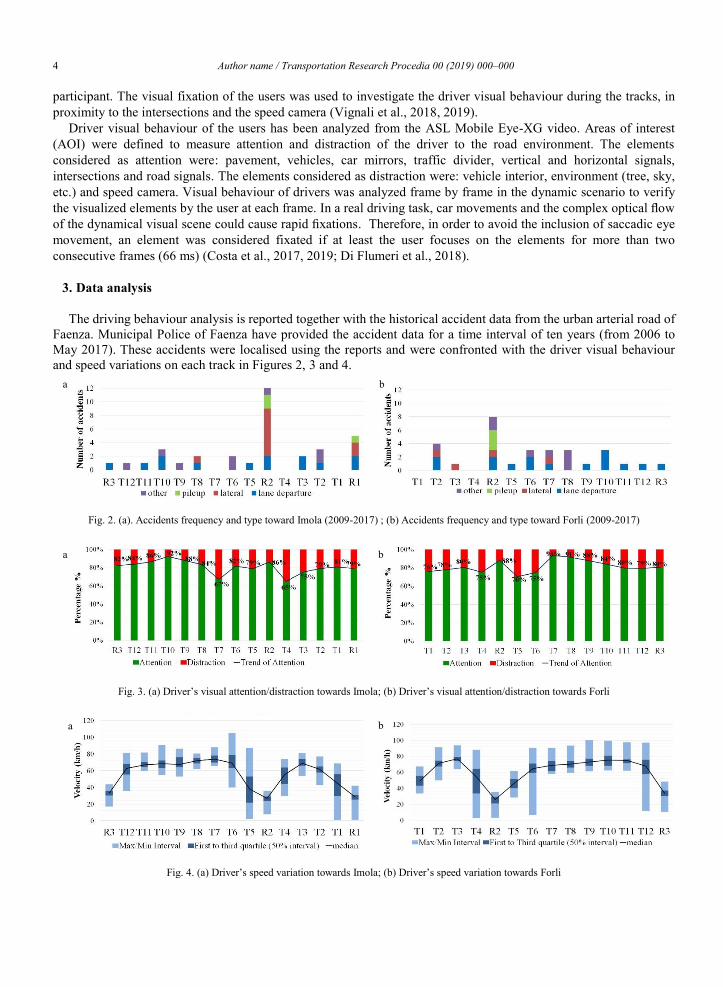
4 Author name / Transportation Research Procedia 00 (2019) 000–000
participant. The visual fixation of the users was used to investigate the driver visual behaviour during the tracks, in
proximity to the intersections and the speed camera (Vignali et al., 2018, 2019).
Driver visual behaviour of the users has been analyzed from the ASL Mobile Eye-XG video. Areas of interest
(AOI) were defined to measure attention and distraction of the driver to the road environment. The elements
considered as attention were: pavement, vehicles, car mirrors, traffic divider, vertical and horizontal signals,
intersections and road signals. The elements considered as distraction were: vehicle interior, environment (tree, sky,
etc.) and speed camera. Visual behaviour of drivers was analyzed frame by frame in the dynamic scenario to verify
the visualized elements by the user at each frame. In a real driving task, car movements and the complex optical flow of the dynamical visual scene could cause rapid fixations. Therefore, in order to avoid the inclusion of saccadic eye
movement, an element was considered fixated if at least the user focuses on the elements for more than two
consecutive frames (66 ms) (Costa et al., 2017, 2019; Di Flumeri et al., 2018).
3. Data analysis
The driving behaviour analysis is reported together with the historical accident data from the urban arterial road of
Faenza. Municipal Police of Faenza have provided the accident data for a time interval of ten years (from 2006 to
May 2017). These accidents were localised using the reports and were confronted with the driver visual behaviour
and speed variations on each track in Figures 2, 3 and 4.
Fig. 2. (a). Accidents frequency and type toward Imola (2009-2017) ; (b) Accidents frequency and type toward Forli (2009-2017)
Fig. 3. (a) Driver’s visual attention/distraction towards Imola; (b) Driver’s visual attention/distraction towards Forli
Fig. 4. (a) Driver’s speed variation towards Imola; (b) Driver’s speed variation towards Forli
b a
a b
a b
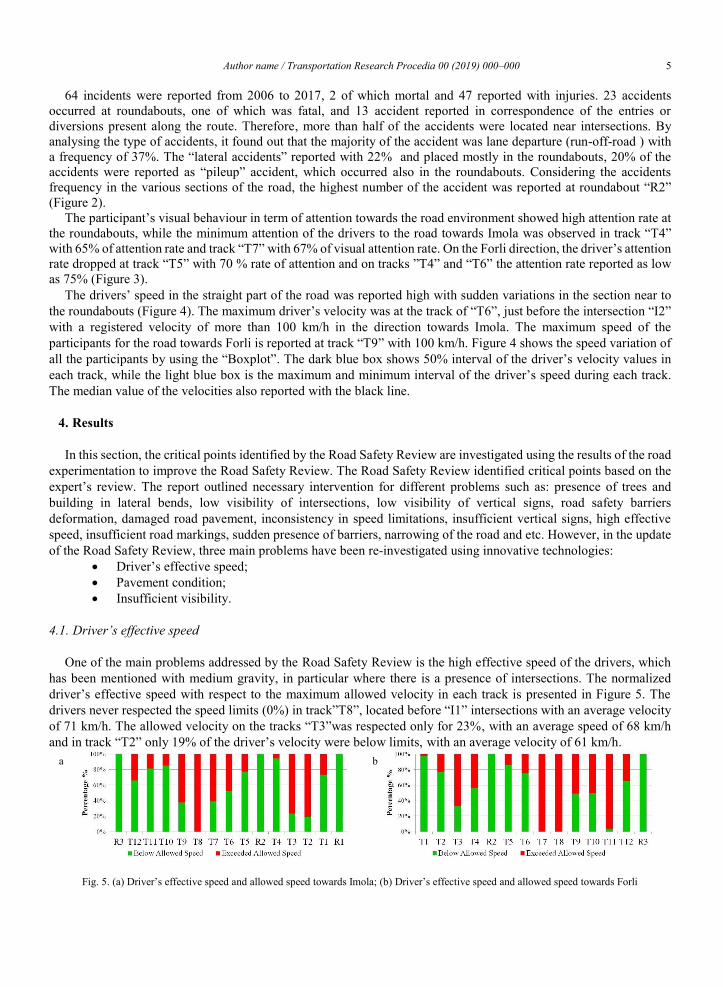
Author name / Transportation Research Procedia 00 (2019) 000–000 5
64 incidents were reported from 2006 to 2017, 2 of which mortal and 47 reported with injuries. 23 accidents
occurred at roundabouts, one of which was fatal, and 13 accident reported in correspondence of the entries or
diversions present along the route. Therefore, more than half of the accidents were located near intersections. By
analysing the type of accidents, it found out that the majority of the accident was lane departure (run-off-road ) with
a frequency of 37%. The “lateral accidents” reported with 22% and placed mostly in the roundabouts, 20% of the
accidents were reported as “pileup” accident, which occurred also in the roundabouts. Considering the accidents
frequency in the various sections of the road, the highest number of the accident was reported at roundabout “R2”
(Figure 2).
The participant’s visual behaviour in term of attention towards the road environment showed high attention rate at
the roundabouts, while the minimum attention of the drivers to the road towards Imola was observed in track “T4” with 65% of attention rate and track “T7” with 67% of visual attention rate. On the Forli direction, the driver’s attention
rate dropped at track “T5” with 70 % rate of attention and on tracks ”T4” and “T6” the attention rate reported as low
as 75% (Figure 3).
The drivers’ speed in the straight part of the road was reported high with sudden variations in the section near to
the roundabouts (Figure 4). The maximum driver’s velocity was at the track of “T6”, just before the intersection “I2”
with a registered velocity of more than 100 km/h in the direction towards Imola. The maximum speed of the
participants for the road towards Forli is reported at track “T9” with 100 km/h. Figure 4 shows the speed variation of
all the participants by using the “Boxplot”. The dark blue box shows 50% interval of the driver’s velocity values in
each track, while the light blue box is the maximum and minimum interval of the driver’s speed during each track.
The median value of the velocities also reported with the black line.
4. Results
In this section, the critical points identified by the Road Safety Review are investigated using the results of the road
experimentation to improve the Road Safety Review. The Road Safety Review identified critical points based on the
expert’s review. The report outlined necessary intervention for different problems such as: presence of trees and
building in lateral bends, low visibility of intersections, low visibility of vertical signs, road safety barriers
deformation, damaged road pavement, inconsistency in speed limitations, insufficient vertical signs, high effective
speed, insufficient road markings, sudden presence of barriers, narrowing of the road and etc. However, in the update
of the Road Safety Review, three main problems have been re-investigated using innovative technologies:
Driver’s effective speed;
Pavement condition;
Insufficient visibility.
4.1. Driver’s effective speed
One of the main problems addressed by the Road Safety Review is the high effective speed of the drivers, which
has been mentioned with medium gravity, in particular where there is a presence of intersections. The normalized
driver’s effective speed with respect to the maximum allowed velocity in each track is presented in Figure 5. The
drivers never respected the speed limits (0%) in track”T8”, located before “I1” intersections with an average velocity
of 71 km/h. The allowed velocity on the tracks “T3”was respected only for 23%, with an average speed of 68 km/h
and in track “T2” only 19% of the driver’s velocity were below limits, with an average velocity of 61 km/h.
Fig. 5. (a) Driver’s effective speed and allowed speed towards Imola; (b) Driver’s effective speed and allowed speed towards Forli
a b
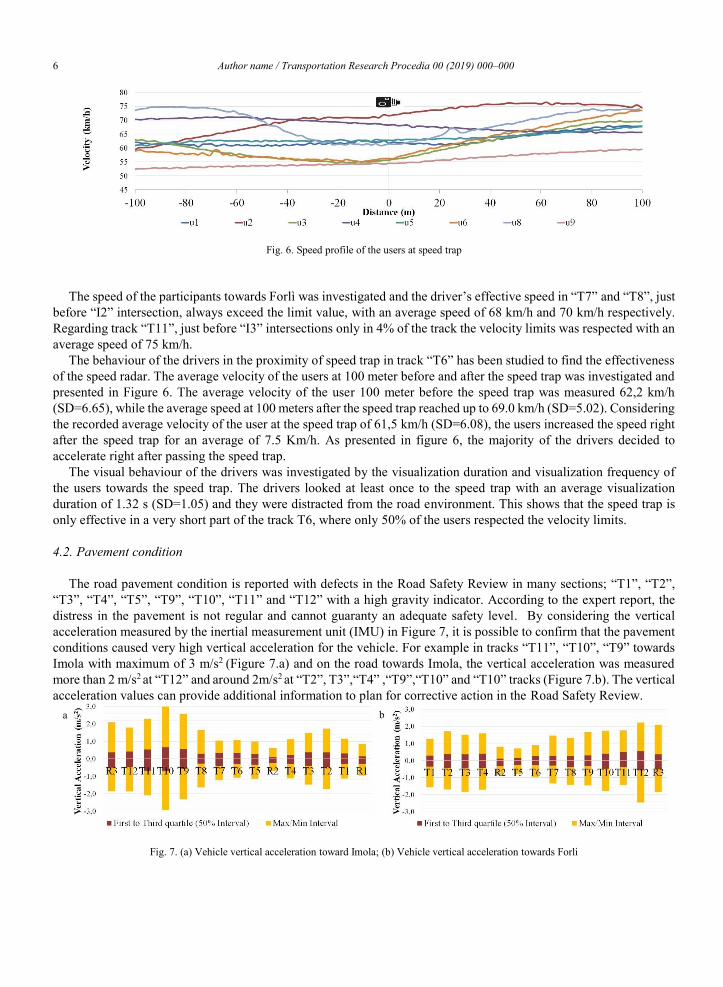
6 Author name / Transportation Research Procedia 00 (2019) 000–000
Fig. 6. Speed profile of the users at speed trap
The speed of the participants towards Forlì was investigated and the driver’s effective speed in “T7” and “T8”, just
before “I2” intersection, always exceed the limit value, with an average speed of 68 km/h and 70 km/h respectively.
Regarding track “T11”, just before “I3” intersections only in 4% of the track the velocity limits was respected with an
average speed of 75 km/h.
The behaviour of the drivers in the proximity of speed trap in track “T6” has been studied to find the effectiveness of the speed radar. The average velocity of the users at 100 meter before and after the speed trap was investigated and
presented in Figure 6. The average velocity of the user 100 meter before the speed trap was measured 62,2 km/h
(SD=6.65), while the average speed at 100 meters after the speed trap reached up to 69.0 km/h (SD=5.02). Considering
the recorded average velocity of the user at the speed trap of 61,5 km/h (SD=6.08), the users increased the speed right
after the speed trap for an average of 7.5 Km/h. As presented in figure 6, the majority of the drivers decided to
accelerate right after passing the speed trap.
The visual behaviour of the drivers was investigated by the visualization duration and visualization frequency of
the users towards the speed trap. The drivers looked at least once to the speed trap with an average visualization
duration of 1.32 s (SD=1.05) and they were distracted from the road environment. This shows that the speed trap is
only effective in a very short part of the track T6, where only 50% of the users respected the velocity limits.
4.2. Pavement condition
The road pavement condition is reported with defects in the Road Safety Review in many sections; “T1”, “T2”, “T3”, “T4”, “T5”, “T9”, “T10”, “T11” and “T12” with a high gravity indicator. According to the expert report, the
distress in the pavement is not regular and cannot guaranty an adequate safety level. By considering the vertical
acceleration measured by the inertial measurement unit (IMU) in Figure 7, it is possible to confirm that the pavement
conditions caused very high vertical acceleration for the vehicle. For example in tracks “T11”, “T10”, “T9” towards Imola with maximum of 3 m/s2 (Figure 7.a) and on the road towards Imola, the vertical acceleration was measured
more than 2 m/s2 at “T12” and around 2m/s2 at “T2”, T3”,“T4” ,“T9”,“T10” and “T10” tracks (Figure 7.b). The vertical
acceleration values can provide additional information to plan for corrective action in the Road Safety Review.
Fig. 7. (a) Vehicle vertical acceleration toward Imola; (b) Vehicle vertical acceleration towards Forli
a b
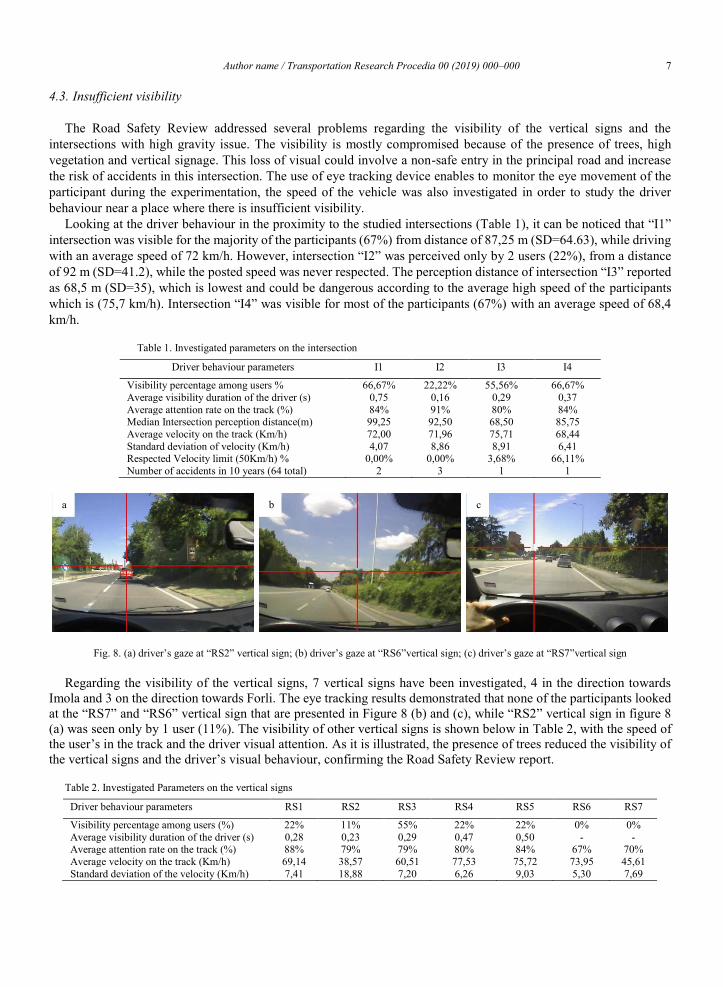
Author name / Transportation Research Procedia 00 (2019) 000–000 7
4.3. Insufficient visibility
The Road Safety Review addressed several problems regarding the visibility of the vertical signs and the
intersections with high gravity issue. The visibility is mostly compromised because of the presence of trees, high
vegetation and vertical signage. This loss of visual could involve a non-safe entry in the principal road and increase
the risk of accidents in this intersection. The use of eye tracking device enables to monitor the eye movement of the
participant during the experimentation, the speed of the vehicle was also investigated in order to study the driver
behaviour near a place where there is insufficient visibility.
Looking at the driver behaviour in the proximity to the studied intersections (Table 1), it can be noticed that “I1”
intersection was visible for the majority of the participants (67%) from distance of 87,25 m (SD=64.63), while driving
with an average speed of 72 km/h. However, intersection “I2” was perceived only by 2 users (22%), from a distance
of 92 m (SD=41.2), while the posted speed was never respected. The perception distance of intersection “I3” reported
as 68,5 m (SD=35), which is lowest and could be dangerous according to the average high speed of the participants
which is (75,7 km/h). Intersection “I4” was visible for most of the participants (67%) with an average speed of 68,4
km/h.
Table 1. Investigated parameters on the intersection
Driver behaviour parameters I1 I2 I3 I4
Visibility percentage among users % 66,67% 22,22% 55,56% 66,67%
Average visibility duration of the driver (s) 0,75 0,16 0,29 0,37
Average attention rate on the track (%) 84% 91% 80% 84% Median Intersection perception distance(m) 99,25 92,50 68,50 85,75
Average velocity on the track (Km/h) 72,00 71,96 75,71 68,44
Standard deviation of velocity (Km/h) 4,07 8,86 8,91 6,41 Respected Velocity limit (50Km/h) % 0,00% 0,00% 3,68% 66,11%
Number of accidents in 10 years (64 total) 2 3 1 1
Fig. 8. (a) driver’s gaze at “RS2” vertical sign; (b) driver’s gaze at “RS6”vertical sign; (c) driver’s gaze at “RS7”vertical sign
Regarding the visibility of the vertical signs, 7 vertical signs have been investigated, 4 in the direction towards
Imola and 3 on the direction towards Forli. The eye tracking results demonstrated that none of the participants looked
at the “RS7” and “RS6” vertical sign that are presented in Figure 8 (b) and (c), while “RS2” vertical sign in figure 8
(a) was seen only by 1 user (11%). The visibility of other vertical signs is shown below in Table 2, with the speed of
the user’s in the track and the driver visual attention. As it is illustrated, the presence of trees reduced the visibility of
the vertical signs and the driver’s visual behaviour, confirming the Road Safety Review report.
Table 2. Investigated Parameters on the vertical signs
Driver behaviour parameters RS1 RS2 RS3 RS4 RS5 RS6 RS7
Visibility percentage among users (%) 22% 11% 55% 22% 22% 0% 0%
Average visibility duration of the driver (s) 0,28 0,23 0,29 0,47 0,50 - - Average attention rate on the track (%) 88% 79% 79% 80% 84% 67% 70%
Average velocity on the track (Km/h) 69,14 38,57 60,51 77,53 75,72 73,95 45,61
Standard deviation of the velocity (Km/h) 7,41 18,88 7,20 6,26 9,03 5,30 7,69
a b c
8 Author name / Transportation Research Procedia 00 (2019) 000–000
Discussion and Conclusions
In this paper, several problems indicated by the Road Safety Review of an urban arterial road were integrated with
the result of experimentation using innovative techniques. Detailed analysis of the driver behaviour not only confirmed
the identified sections of the road, but provided additional measures for the assessment of the existing problem and to
plan the required interventions. The use of satellite positioning device and related modules made it possible to measure
the effective speed of the drivers in all the track and to identify the sections in which the drivers tend to drive with a
higher velocity. Also in the track where there was a speed trap, the speed profile of the users demonstrated that the
driver tends to increase their speed only 100 m after the radar location. The vehicle vertical acceleration investigated
by the use of IMU sensor, measuring the vertical acceleration during all the tracks, confirmed the identified section
of the Road Safety Review where the pavement is damaged. The use of eye tracking device allowed to monitor the
driver visual behaviour during the entire road. The driver attention/distraction indicator towards the road environment,
analyzed frame by frame for all the users and the part of the road where the attention of the driver was low have been
identified. The vertical signs which were not visible for the users have been identified and the average fixation duration
was also compared in different vertical signs. The presence of several intersections was reported in the Road Safety
Review as one of the major hazardous points. The analyze of the speed revealed that the driver’s effective speed is very high near the intersections and the visual behavior of the driver showed that some drivers were unable to see the
intersections, because of the lack of visibility caused by high vegetation.
References
Bucchi, A., Sangiorgi, C., Vignali, V., 2012. Traffic Psychology and Driver Behaviour. Procedia - Social and Behavioural Sciences 53, 972–979.
Costa, M., Bichicchi, A., Mazzotta, F., Lantieri, C., Vignali, V., Simone, A., Dondi, G., 2017. The influence of pedestrian crossings features on
driving behavior and road safety. AIIT International Congress on Transport Infrastructure and Systems, TIS 2017, Rome, Italy.
Costa, M., Bichicchi, A., Nese, M., Lantieri, C., Vignali, V., Simone, A., 2019. T-junction priority scheme and road user's yielding behavior.
Transportation Research Part F: Traffic Psychology and Behaviour 60, 770-782.
Costa, M., Bonetti, L., Bellelli, M., Lantieri, C., Vignali, V., Simone, A. 2017. Reflective tape applied to bicycle frame and conspicuity enhancement
at night. Human Factors 59, 485-500.
Costa, M., Bonetti, L., Vignali, V., Bichicchi, A., Lantieri, C., Simone, A., 2019. Driver's visual attention to different categories of roadside
advertising signs. Applied Ergonomics, 78, 127-136.
Costa, M., Bonetti, L., Vignali, V., Lantieri, C., Simone, A., 2018. The role of peripheral vision in vertical road sign identification and
discrimination. Ergonomics 61, 12, 1619-1634.
Costa, M., Simone, A., Vignali, V., Lantieri, C., Bucchi, A., Dondi, G., 2014. Looking behavior for vertical road signs. Transportation Research
Part F: Traffic Psychology and Behaviour 23, 147-155.
Costa, M., Simone, A., Vignali, V., Lantieri, C., Palena, N., 2018. Fixation distance and fixation duration to vertical road signs. Applied Ergonomics
69, 48–57.
Di Flumeri, G., Borghini, G., Aricò, P., Sciaraffa, N., Lanzi, P., Pozzi, S., Vignali, V., Lantieri, C., Bichicchi, A., Simone, A., Babiloni, F., 2018.
EEG-based mental workload neurometric to evaluate the impact of different traffic and road conditions in real driving settings. Frontiers in Human
Neuroscience, 12.
European Commission, 2008. Annual Accident Report.
European Commission, 2011. Directive 2008/96/EC on road infrastructure safety management.
Lantieri, C., Lamperti, R., Simone, A., Costa, M., Vignali, V., Sangiorgi, C., Dondi, G., 2015. Gateway design assessment in the transition from
high to low speed areas. Transportation Research Part F: Traffic Psychology and Behaviour 34, 41–53.
Rothengatter, T., 1982. The effects of police surveillance and law enforcement on driver behaviour. Current Psychological Research 2, 349–358.
Vaa, T., 1997. Increased police enforcement: effects on speed. Accident Analysis and Prevention 29, 3.
Vignali, V., Bichicchi, A., Simone, A., Lantieri, C., Dondi, G., Costa, M., 2019. Road sign vision and driver behaviour in work zones. Transportation
Research Part F: Traffic Psychology and Behaviour 60, 474-484.
Vignali, V., Cuppi, F., Acerraa, E., Bichicchi, A., Lantieri, C., Simone, A., Costa, M., 2018. Effects of median refuge island and flashing vertical
sign on conspicuity and safety of unsignalized crosswalks. Transportation Research Part F: Traffic Psychology and Behaviour 60, 427–439.
Wang, X., Zhoua. Q., Quddus, M., Fan, T., Fang,S., 2018. Speed, speed variation and crash relationships for urban arterials. Accident Analysis and
Prevention 113, 236–243.
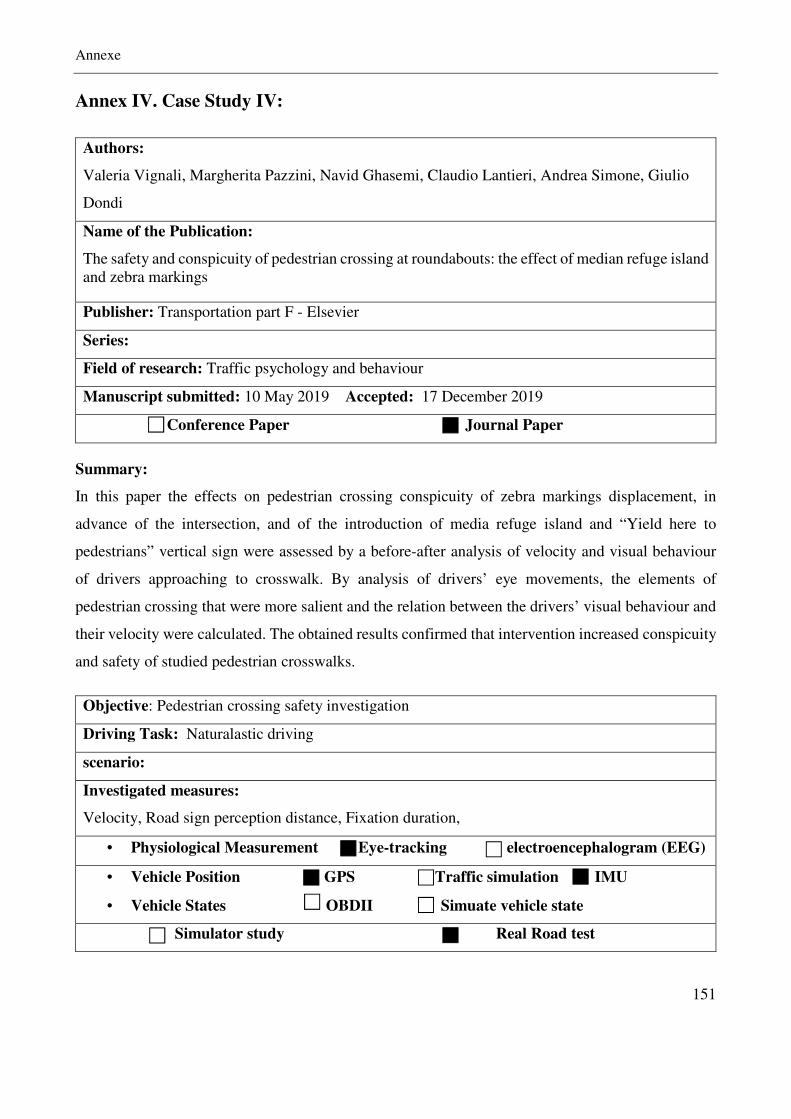
Annexe
151
Annex IV. Case Study IV:
Authors:
Valeria Vignali, Margherita Pazzini, Navid Ghasemi, Claudio Lantieri, Andrea Simone, Giulio
Dondi
Name of the Publication:
The safety and conspicuity of pedestrian crossing at roundabouts: the effect of median refuge island
and zebra markings
Publisher: Transportation part F - Elsevier
Series:
Field of research: Traffic psychology and behaviour
Manuscript submitted: 10 May 2019 Accepted: 17 December 2019
Conference Paper Journal Paper
Summary:
In this paper the effects on pedestrian crossing conspicuity of zebra markings displacement, in
advance of the intersection, and of the introduction of media refuge island and “Yield here to
pedestrians” vertical sign were assessed by a before-after analysis of velocity and visual behaviour
of drivers approaching to crosswalk. By analysis of drivers’ eye movements, the elements of
pedestrian crossing that were more salient and the relation between the drivers’ visual behaviour and
their velocity were calculated. The obtained results confirmed that intervention increased conspicuity
and safety of studied pedestrian crosswalks.
Objective: Pedestrian crossing safety investigation
Driving Task: Naturalastic driving
scenario:
Investigated measures:
Velocity, Road sign perception distance, Fixation duration,
• Physiological Measurement Eye-tracking electroencephalogram (EEG)
• Vehicle Position GPS Traffic simulation IMU
• Vehicle States OBDII Simuate vehicle state
Simulator study Real Road test
The safety and conspicuity of pedestrian crossing atroundabouts: The effect of median refuge island and zebramarkings
Valeria Vignali ⇑, Margherita Pazzini, Navid Ghasemi, Claudio Lantieri, Andrea Simone,Giulio Dondi
Department of Civil, Chemical, Environmental and Material Engineering (DICAM), University of Bologna, Viale Risorgimento 2, 40136 Bologna, Italy
a r t i c l e i n f o
Article history:
Received 10 May 2019Received in revised form 17 December 2019Accepted 17 December 2019Available online 24 December 2019
Keywords:
Eye trackingPedestriansDriver behaviorRoundaboutMedian refuge islandZebra markingsUrban roadConspicuityRoad safetyVertical sign
a b s t r a c t
Roundabouts are one of the most used road intersections because, compared to signalizedones, they reduce conflict points between traffic flows and moderate driving speed. Greatattention should also be paid to vulnerable road users at roundabouts. According to acci-dent statistics, in fact, accessibility of pedestrians and cyclists is not always ensured.This paper has evaluated the effects on the visibility of pedestrian crossing before and
after the displacement of zebra markings, moved before intersections, and the introductionof media refuge islands and ‘‘Yield here to pedestrians” vertical signs. The above effectshave been assessed by before-after analysis of speed and visual behaviour of driversapproaching the crosswalk.Moreover, the analysis of the drivers’ eye movements has highlighted the most salient
elements of the pedestrian crossing. The relation between the drivers’ visual behaviourand the vehicle speed have also been calculated. Results have confirmed that the interven-tion carried out has increased both visibility and safety of the studied pedestrian cross-walks.Zebra markings and the median refuge island have turned out to be the most glanced ele-
ments, respectively seen by 93.75% and 56.25% of the drivers, followed by the ‘‘Yield hereto pedestrians” vertical sign. The mean distance of first fixation of the crosswalk increasedfrom 21.98 m before the intervention, to 40.69 m after it. The drivers perceived the pedes-trian crossings from a longer distance after the intervention, and they continued to glanceat the crosswalk while approaching it, enhancing their visual attention.
2019 Elsevier Ltd. All rights reserved.
1. Introduction
Road safety is influenced by road design and signalling which affect the drivers’ perception of the external environmentand the possible dangerous situations (Bucchi, Sangiorgi, & Vignali, 2012; Dondi, Simone, Lantieri, & Vignali, 2011). In recentyears an increasing attention has been paid to traffic problems which could modify the drivers’ cognitive and emotional con-dition (Chu, Wu, Atombo, Zhang, & Özkan, 2019). Driving is a complex situation, requiring a constant attention and promptreactions to fast changes. During long trips, the drivers’ behaviour might result into stressful responses due to an excessivecognitive workload (Ringhand & Vollrath, 2019).
https://doi.org/10.1016/j.trf.2019.12.0071369-8478/ 2019 Elsevier Ltd. All rights reserved.
⇑ Corresponding author.
Transportation Research Part F 68 (2020) 94–104
Contents lists available at ScienceDirect
Transportation Research Part F
journal homepage: www.elsevier .com/locate / t r f
In order to increase safety, fluidity of road traffic and to reduce the velocity, roundabouts are often built especially inurban areas (Hydén & Várhelyi, 2000). They allow a higher entry capacity than grade intersections and a reduction of conflictpoints, from 32 for a grade intersection, to 8 in case of a roundabout (Gross, Lyon, Persaud, & Srinivasan, 2013; Turner, 2011).In addition to facilitating the traffic flow, roundabouts also reduce the velocity and the drivers’ stress (Hydén & Várhelyi,2000). The negative aspects of roundabouts are linked to crosswalks which reduce the roundabout capability and are criticalpoints as far as pedestrian safety is concerned (Bergman, Olstam, & Allström, 2011; Meneguzzer & Rossi, 2011;Vijayawargiya & Rokade, 2017). Studies related to roundabout safety have generally focused on drivers, overlooking theimportance of safety of the vulnerable users, pedestrians and cyclists (Perdomo, Rezaei, Patterson, Saunier, & Miranda-Moreno, 2014). In urban areas, pedestrians need to cross at intersections, and zebra crossings are often present close toaccess and exit ramps of roundabouts. Pedestrian crosswalks at roundabouts are useful for pedestrians and increase safety.They should be placed in a proper way both to attract the maximum number of pedestrians, who would otherwise cross thestreet at random, and to give drivers enough time to stop safely (Cohen, Bar-Gera, Parmet, & Ronen, 2013).
Recent studies have shown the importance of a correct design for pedestrian crossings at the intersections. More atten-tion should be paid to pedestrian safety, as the number of victims among people crossing at intersections is constantlyincreasing year after year (Bungum, Day, & Henry, 2005; Olszewski, Szagała, Wolanski, & Zielinska, 2015). Literature doesnot suggest many countermeasures aimed at reducing the problems for pedestrians crossing at roundabouts (Perdomoet al., 2014). Anyway, a significant reduction of speed of vehicles in a complex road environment, such as collector roadsprovided with signalled intersections, roundabouts, road circles or stop signs, would be highly recommended and it can onlybe obtained with different multi-purpose countermeasures.
A refuge island, for example, makes the road narrower thus slowing the traffic. It also helps drivers to realize that pedes-trians are crossing the road. Pedestrians may also stop on a refuge island and cross the road in two stages, increasing theattention paid at the traffic in both directions. Refuge islands are widely self-explaining, and they immediately give the ideaof a not fast traffic road (Leden, Gårder, & Johansson, 2006; Sanca, 2002). Literature shows evidence of a significant speedreduction of vehicles in the presence of a refuge island (Fildes, Fletcher, & Corrigan, 1987; Kolsrud, 1985; Vey & Ferreri,1968; Yagar & Van Aerde, 1983). Mako (2015) has shown that implementation of refuge islands at pedestrian crossingshas reduced the number of fatalities for pedestrians by 64%. Without a refuge island the drivers’ movement is 4% more irreg-ular than in presence of a refuge island. As for pedestrians, without a refuge island they tend to cross irregularly instead ofwaiting for a vehicle to stop giving them the priority.
Curb extensions may also help vehicles to slow down while approaching a pedestrian crossing. Extensions of a sidewalkedge are commonly present along roads with parking areas on the lane side. These extensions increase the visibility of pedes-trians and reduce the drivers’ speed behaviour inducing prompt yielding (Hawley, Henson, Hulse, & Brindle, 1992; Huang &Cynecki, 2001; Macbeth, 1995; Replogle, 1992). Bella and Silvestri (2015) have proved that more than 80% of the drivers theytested clearly perceived the effectiveness of curb extensions. This means that, in presence of curb extensions, the driverswere much more prompt to yield since pedestrian crossings were better seen.
Prompt yielding is often the response to ‘‘Yield here to pedestrians” vertical signs. These are mounted on poles on theright side at crosswalks or on supporting arms over the traffic lanes (Beeber, 2011). To improve their visibility, LED flasheswith an irregular flash pattern can be mounted, too. Van Houten, Ellis, and Marmolejo (2008) showed that LED flashersinstalled on simple pedestrian signs, increased the drivers’ yielding and reduced evasive manoeuvres as well as the numberof pedestrians trapped in crosswalks at the centre of the road without a refuge island. Sherbutt, Van Houten, Turner, andHuitema (2009) carried out three different experiments on the effects of flashing pedestrian vertical signs on drivers’ beha-viour. The results showed an increase of yielding from 18.2% to 81.2%. Bram De Brabander Lode Vereeck have shown that thenumber of accidents with serious injuries involving vulnerable road users increased at intersections with no signalizationbefore the roundabout.
A further countermeasure may be guardrails at roundabouts. These direct pedestrians to safe crossing areas and preventbursting into the road (Retting, Ferguson, & McCartt, 2003). The main benefits of installing guardrails are channeling pedes-trians to the crossing (Stewart, 2007) and making footpaths safer. Cohen et al. (2013) have shown that the number of pedes-trians jaywalking with no guardrails at a roundabout exceeds 20–30% the number of pedestrians committing the sameviolation when guardrails are installed.
Although any countermeasures aiming at increasing safety of pedestrian crossings are very important, the drivers’ beha-viour should also be taken into consideration. Getting closer to a roundabout, drivers are often distracted and do not payattention to the road environment, including crosswalks. Inattention of drivers causes most of the accidents (Xu et al.,2018). Electronic and radio devices present inside the vehicle and used while driving, in addition to other distractors includ-ing the road environment, are the main causes of the drivers’ inattention and carelessness (Oviedo-Trespalacios, Haque, King,& Washington, 2017). High speed of vehicles approaching a roundabout along with drivers’ lack of attention represent themain problems for the safety of pedestrians crossing at roundabouts (Fortuijn, 2003; Gross et al., 2013; Vijayawargiya &Rokade, 2017). Speed reduction of vehicles is one of the key elements to reduce the probability of death of pedestriansinvolved in an accident (Gonzalo-Orden, Pérez-Acebo, Unamunzaga, & Arce, 2018; Guo, Liu, Liang, & Wang, 2016;Hakkert, Gitelman, & Ben-Shabat, 2002; Haleem, Alluri, & Gan, 2015; Kröyer, Jonsson, & Várhelyi, 2014; Rosén & Sander,2009; Rosén, Stigson, & Sander, 2011; Tefft, 2013; Zeeger & Bushell, 2012).
However, the present traffic safety laws (road safety measures) are not to be the only instrument capable of reducing thenumber of accidents and fatalities (Ward, Linkenbach, Keller, & Otto, 2010). In fact, a road safety culture should be estab-
V. Vignali et al. / Transportation Research Part F 68 (2020) 94–104 95
lished, both for drivers and pedestrians (Chu et al., 2019; Obeng-Atuah, Poku-Boansi, & Cobbinah, 2017). A road safety cul-ture, deep-rooted in society, sounds like a long-term project not easy to be achieved, anyway. On the contrary, road infras-tructure, especially at crosswalks near roundabouts, might be immediately improved in order to increase pedestrian safetyand drivers’ perception of the risk. Many studies with positive results have been taken into account aiming at improving roadsafety while reducing drivers’ speed in proximity of pedestrian crossings (Bella & Silvestri, 2015; Gonzalo-Orden et al., 2018).These studies usually rely on motion parameters, such as the operating speed or the stopping distance. They do not considerthe drivers’ behaviour in terms of detection and perception of crosswalk elements at the roundabout, whereas these param-eters are very important to assess the drivers’ attention level and hazard anticipation. An eye-movement recording tool canbe very useful for this purpose since it allows a quantitative assessment of the drivers’ risk anticipation when approaching aroundabout (Costa et al., 2017; Ghasemi, Acerra, Vignali, Lantieri, Simone, & Imine, 2019; Kapitaniak, Walczak, Kosobudzki,Jozwiak, & Bortkiewicz, 2015; Taylor et al., 2013; Topolšek, Areh, & Cvahte, 2016).
Assessing the driver’s vision may be useful to point out safe or unsafe behaviours on roads. Eye tracking is used to eval-uate the drivers’ perception and acknowledgments of the road elements as well as to develop driving strategies and preventcrashes. According to several studies, the drivers’ visual inattention is responsible for a large amount of traffic accidents(Bongiorno, Bosurgi, Pellegrino, & Sollazzo, 2017; Costa, Bichicchi, et al., 2019; Costa, Boneti, et al., 2019; Costa et al.,2014; Costa, Bonetti, Vignali, Lantieri, & Simone, 2018; Costa, Simone, Vignali, Lantieri, & Palena, 2018; Di Flumeri et al.,2018; Inman, 2012; Kapitaniak et al., 2015; Lantieri et al., 2015; Mantuano, Bernardi, & Rupi, 2017; Vignali, Cuppi, et al.,2019; Vignali, Bichicchi, et al., 2019). In order to prevent those accidents, some studies have been carried out about the driv-ing behaviour using the mobile eye tracking tool. This methodology is particularly interesting when analysing the driver-pedestrian interaction. Only a few studies have applied this method by now (Trefzger, Blascheck, Raschke, Hausmann, &Schlegel, 2018) most of which take only the pedestrian behaviour into consideration (Biassoni, Confalonieri, & Ciceri,2018; Bock, Brustio, & Borisova, 2015; Davoudian & Raynham, 2012; Fotios, Uttley, & Hara, 2013; Trefzger et al., 2018;Zito et al., 2015). An exam of the drivers’ behaviour when approaching a crosswalk was carried out by Ciceri, Ruscio,Confalonieri, Vangi, and Virga (2013). They set different road situations and the outcome was that a complex street environ-ment, with a lot of road signs, resulted into a lack of attention from the driver towards the pedestrian. The driver, in fact,realized the movement of pedestrians on the crosswalks quite late.
Moreover, using the eye tracking measurements Grüner and Ansorge (2017) studied the difference between the driver’sbehaviour in urban and rural roads. The results showed a higher number of driver’s eye movements in residential areas com-pared to city roads. This means that the less the traffic is, the higher the driver’s expectation of a careless behaviour of pedes-trians when crossing roads will be.
In addition to this, according to the studies carried out by Dukic, Ahlstrom, Patten, Kettwich, and Kircher (2013) andMaxera, Kledus, and Semela (2015), eye tracking measurement proved that drivers always detected pedestrians late whendriving at night. Increasing size and visibility of an object, making it more illuminated and salient for example, proved to beuseful to avoid the problem. This can be applied both to objects and pedestrians by using different marking patterns(Crescenzo et al., 2019; Muttart, Dinakar, Vandenberg, & Yosko, 2016).
Using a simulator, Fisher and Garay-Vega (2012) compared the drivers’ behaviour at crosswalks signalized by mid-blocks,advanced yield markings and ‘‘Yield here to pedestrians” vertical signs to crosswalks showing just standard markings. In theformer situations the drivers’ behaviour consistently changed reducing pedestrian-vehicle crashes and increasing the dri-vers’ attention towards pedestrians. The distance at which a pedestrian was first seen increased and the drivers performeda prompt yielding. Gómez, Siby, Romoser, Gerardino, Knodler, Collura, and Fisher (2013) confirmed the above issues. Withadvance yielding markings fewer accidents occurred and drivers payed a higher attention to pedestrians. Most of these stud-ies, anyway, used eye-movement tracking with simulators but not in real traffic environments. Moreover, while using thesame methodology, these research studies have analysed the detection of pedestrians by drivers but only few of themfocused the attention on factors improving the real crosswalk conspicuity.
The aim of the present study, on the contrary, was a before-after evaluation of a combined intervention on pedestriancrossings near roundabouts in a real road context, assessing both vehicle speed and eye-movements approaching a sequenceof crosswalks before and after the intervention.
Four crosswalks were included in the study. Specifically, the crosswalks were moved further before the intersection, med-ian islands were added, and a ‘‘Yield here to pedestrians” vertical sign was added. This intervention at roundabouts is of sim-ple installation and it may be of high effectiveness on the drivers’ behaviour.
2. Materials and methods
2.1. The experimental protocol
Ten drivers, 3 males (Mage = 28.87 years, range: 23–39, SD = 8.96) and 7 females (Mage = 35.86 years, range: 25–52,SD = 10.79), were recruited and involved on a voluntary basis in this study. They had normal vision and none of them woreeyeglasses or lenses, to avoid artefacts in eye-movement monitoring. All participants had a Category-B driving license (forcars) and no prior driving experience on the road segment object of study, in order to control the effect of familiarizationwith the road environment.
96 V. Vignali et al. / Transportation Research Part F 68 (2020) 94–104
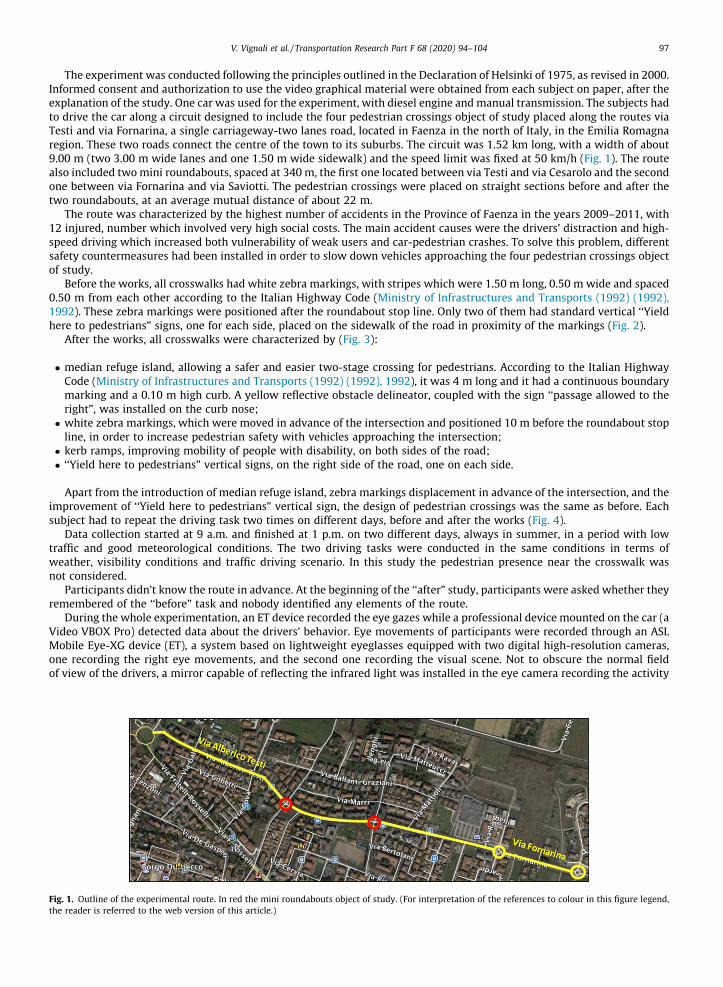
The experiment was conducted following the principles outlined in the Declaration of Helsinki of 1975, as revised in 2000.Informed consent and authorization to use the video graphical material were obtained from each subject on paper, after theexplanation of the study. One car was used for the experiment, with diesel engine and manual transmission. The subjects hadto drive the car along a circuit designed to include the four pedestrian crossings object of study placed along the routes viaTesti and via Fornarina, a single carriageway-two lanes road, located in Faenza in the north of Italy, in the Emilia Romagnaregion. These two roads connect the centre of the town to its suburbs. The circuit was 1.52 km long, with a width of about9.00 m (two 3.00 m wide lanes and one 1.50 m wide sidewalk) and the speed limit was fixed at 50 km/h (Fig. 1). The routealso included twomini roundabouts, spaced at 340 m, the first one located between via Testi and via Cesarolo and the secondone between via Fornarina and via Saviotti. The pedestrian crossings were placed on straight sections before and after thetwo roundabouts, at an average mutual distance of about 22 m.
The route was characterized by the highest number of accidents in the Province of Faenza in the years 2009–2011, with12 injured, number which involved very high social costs. The main accident causes were the drivers’ distraction and high-speed driving which increased both vulnerability of weak users and car-pedestrian crashes. To solve this problem, differentsafety countermeasures had been installed in order to slow down vehicles approaching the four pedestrian crossings objectof study.
Before the works, all crosswalks had white zebra markings, with stripes which were 1.50 m long, 0.50 m wide and spaced0.50 m from each other according to the Italian Highway Code (Ministry of Infrastructures and Transports (1992) (1992),1992). These zebra markings were positioned after the roundabout stop line. Only two of them had standard vertical ‘‘Yieldhere to pedestrians” signs, one for each side, placed on the sidewalk of the road in proximity of the markings (Fig. 2).
After the works, all crosswalks were characterized by (Fig. 3):
median refuge island, allowing a safer and easier two-stage crossing for pedestrians. According to the Italian HighwayCode (Ministry of Infrastructures and Transports (1992) (1992), 1992), it was 4 m long and it had a continuous boundarymarking and a 0.10 m high curb. A yellow reflective obstacle delineator, coupled with the sign ‘‘passage allowed to theright”, was installed on the curb nose;
white zebra markings, which were moved in advance of the intersection and positioned 10 m before the roundabout stopline, in order to increase pedestrian safety with vehicles approaching the intersection;
kerb ramps, improving mobility of people with disability, on both sides of the road; ‘‘Yield here to pedestrians” vertical signs, on the right side of the road, one on each side.
Apart from the introduction of median refuge island, zebra markings displacement in advance of the intersection, and theimprovement of ‘‘Yield here to pedestrians” vertical sign, the design of pedestrian crossings was the same as before. Eachsubject had to repeat the driving task two times on different days, before and after the works (Fig. 4).
Data collection started at 9 a.m. and finished at 1 p.m. on two different days, always in summer, in a period with lowtraffic and good meteorological conditions. The two driving tasks were conducted in the same conditions in terms ofweather, visibility conditions and traffic driving scenario. In this study the pedestrian presence near the crosswalk wasnot considered.
Participants didn’t know the route in advance. At the beginning of the ‘‘after” study, participants were asked whether theyremembered of the ‘‘before” task and nobody identified any elements of the route.
During the whole experimentation, an ET device recorded the eye gazes while a professional device mounted on the car (aVideo VBOX Pro) detected data about the drivers’ behavior. Eye movements of participants were recorded through an ASLMobile Eye-XG device (ET), a system based on lightweight eyeglasses equipped with two digital high-resolution cameras,one recording the right eye movements, and the second one recording the visual scene. Not to obscure the normal fieldof view of the drivers, a mirror capable of reflecting the infrared light was installed in the eye camera recording the activity
Fig. 1. Outline of the experimental route. In red the mini roundabouts object of study. (For interpretation of the references to colour in this figure legend,the reader is referred to the web version of this article.)
V. Vignali et al. / Transportation Research Part F 68 (2020) 94–104 97
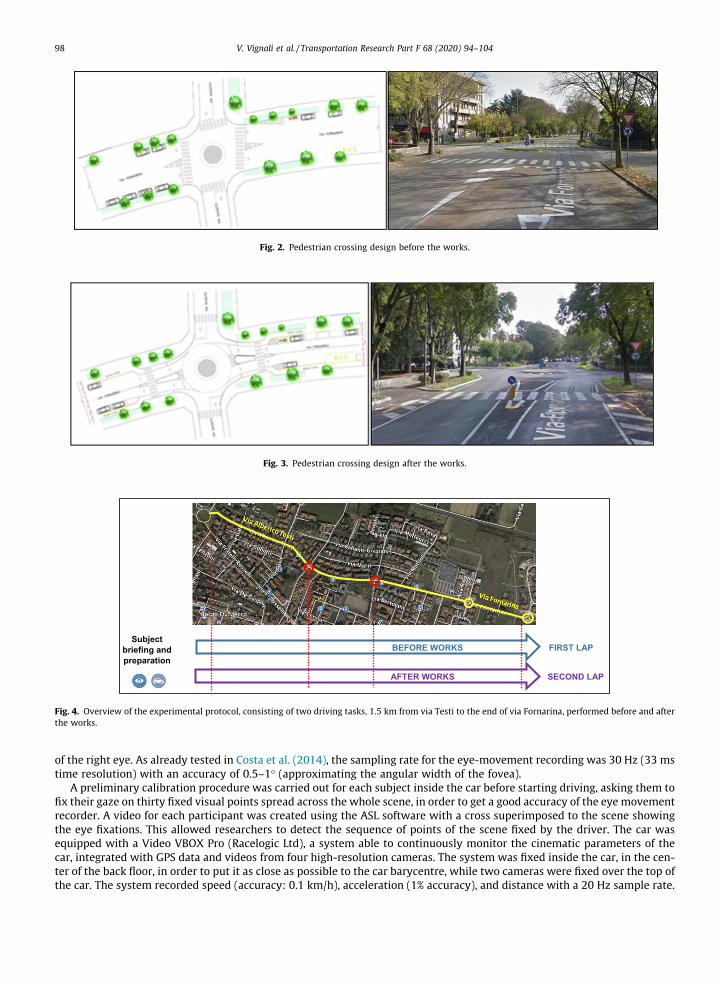
of the right eye. As already tested in Costa et al. (2014), the sampling rate for the eye-movement recording was 30 Hz (33 mstime resolution) with an accuracy of 0.5–1 (approximating the angular width of the fovea).
A preliminary calibration procedure was carried out for each subject inside the car before starting driving, asking them tofix their gaze on thirty fixed visual points spread across the whole scene, in order to get a good accuracy of the eye movementrecorder. A video for each participant was created using the ASL software with a cross superimposed to the scene showingthe eye fixations. This allowed researchers to detect the sequence of points of the scene fixed by the driver. The car wasequipped with a Video VBOX Pro (Racelogic Ltd), a system able to continuously monitor the cinematic parameters of thecar, integrated with GPS data and videos from four high-resolution cameras. The system was fixed inside the car, in the cen-ter of the back floor, in order to put it as close as possible to the car barycentre, while two cameras were fixed over the top ofthe car. The system recorded speed (accuracy: 0.1 km/h), acceleration (1% accuracy), and distance with a 20 Hz sample rate.
Fig. 2. Pedestrian crossing design before the works.
Fig. 3. Pedestrian crossing design after the works.
AFTER WORKS SECOND LAP
BEFORE WORKS FIRST LAPSubject
briefing and
preparation
Fig. 4. Overview of the experimental protocol, consisting of two driving tasks, 1.5 km from via Testi to the end of via Fornarina, performed before and afterthe works.
98 V. Vignali et al. / Transportation Research Part F 68 (2020) 94–104
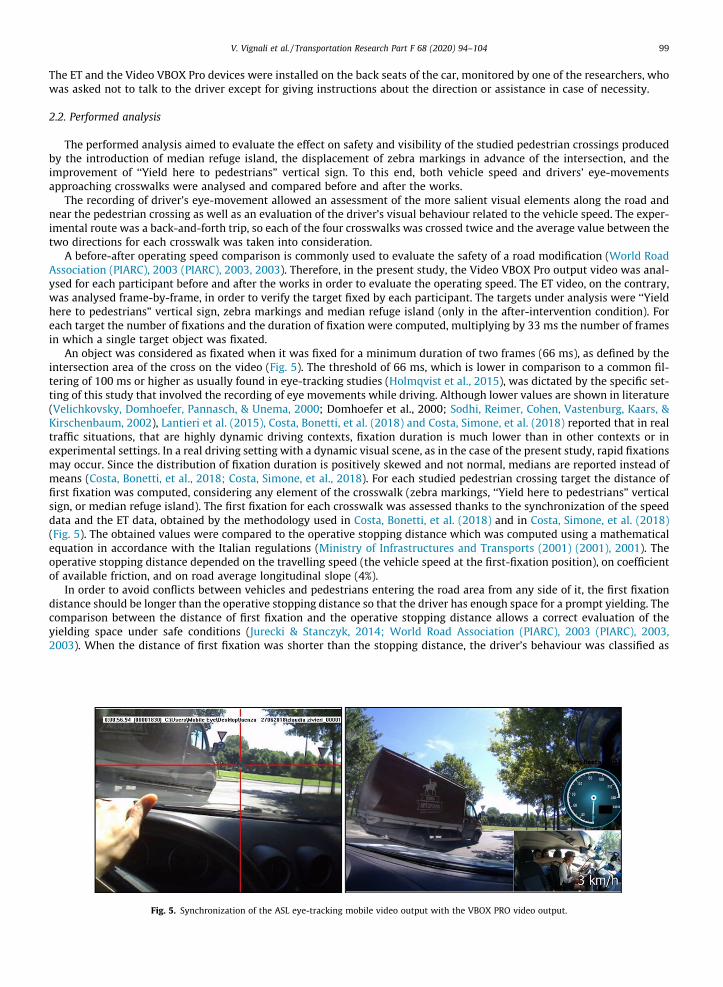
The ET and the Video VBOX Pro devices were installed on the back seats of the car, monitored by one of the researchers, whowas asked not to talk to the driver except for giving instructions about the direction or assistance in case of necessity.
2.2. Performed analysis
The performed analysis aimed to evaluate the effect on safety and visibility of the studied pedestrian crossings producedby the introduction of median refuge island, the displacement of zebra markings in advance of the intersection, and theimprovement of ‘‘Yield here to pedestrians” vertical sign. To this end, both vehicle speed and drivers’ eye-movementsapproaching crosswalks were analysed and compared before and after the works.
The recording of driver’s eye-movement allowed an assessment of the more salient visual elements along the road andnear the pedestrian crossing as well as an evaluation of the driver’s visual behaviour related to the vehicle speed. The exper-imental route was a back-and-forth trip, so each of the four crosswalks was crossed twice and the average value between thetwo directions for each crosswalk was taken into consideration.
A before-after operating speed comparison is commonly used to evaluate the safety of a road modification (World RoadAssociation (PIARC), 2003 (PIARC), 2003, 2003). Therefore, in the present study, the Video VBOX Pro output video was anal-ysed for each participant before and after the works in order to evaluate the operating speed. The ET video, on the contrary,was analysed frame-by-frame, in order to verify the target fixed by each participant. The targets under analysis were ‘‘Yieldhere to pedestrians” vertical sign, zebra markings and median refuge island (only in the after-intervention condition). Foreach target the number of fixations and the duration of fixation were computed, multiplying by 33 ms the number of framesin which a single target object was fixated.
An object was considered as fixated when it was fixed for a minimum duration of two frames (66 ms), as defined by theintersection area of the cross on the video (Fig. 5). The threshold of 66 ms, which is lower in comparison to a common fil-tering of 100 ms or higher as usually found in eye-tracking studies (Holmqvist et al., 2015), was dictated by the specific set-ting of this study that involved the recording of eye movements while driving. Although lower values are shown in literature(Velichkovsky, Domhoefer, Pannasch, & Unema, 2000; Domhoefer et al., 2000; Sodhi, Reimer, Cohen, Vastenburg, Kaars, &Kirschenbaum, 2002), Lantieri et al. (2015), Costa, Bonetti, et al. (2018) and Costa, Simone, et al. (2018) reported that in realtraffic situations, that are highly dynamic driving contexts, fixation duration is much lower than in other contexts or inexperimental settings. In a real driving setting with a dynamic visual scene, as in the case of the present study, rapid fixationsmay occur. Since the distribution of fixation duration is positively skewed and not normal, medians are reported instead ofmeans (Costa, Bonetti, et al., 2018; Costa, Simone, et al., 2018). For each studied pedestrian crossing target the distance offirst fixation was computed, considering any element of the crosswalk (zebra markings, ‘‘Yield here to pedestrians” verticalsign, or median refuge island). The first fixation for each crosswalk was assessed thanks to the synchronization of the speeddata and the ET data, obtained by the methodology used in Costa, Bonetti, et al. (2018) and in Costa, Simone, et al. (2018)(Fig. 5). The obtained values were compared to the operative stopping distance which was computed using a mathematicalequation in accordance with the Italian regulations (Ministry of Infrastructures and Transports (2001) (2001), 2001). Theoperative stopping distance depended on the travelling speed (the vehicle speed at the first-fixation position), on coefficientof available friction, and on road average longitudinal slope (4%).
In order to avoid conflicts between vehicles and pedestrians entering the road area from any side of it, the first fixationdistance should be longer than the operative stopping distance so that the driver has enough space for a prompt yielding. Thecomparison between the distance of first fixation and the operative stopping distance allows a correct evaluation of theyielding space under safe conditions (Jurecki & Stanczyk, 2014; World Road Association (PIARC), 2003 (PIARC), 2003,2003). When the distance of first fixation was shorter than the stopping distance, the driver’s behaviour was classified as
Fig. 5. Synchronization of the ASL eye-tracking mobile video output with the VBOX PRO video output.
V. Vignali et al. / Transportation Research Part F 68 (2020) 94–104 99
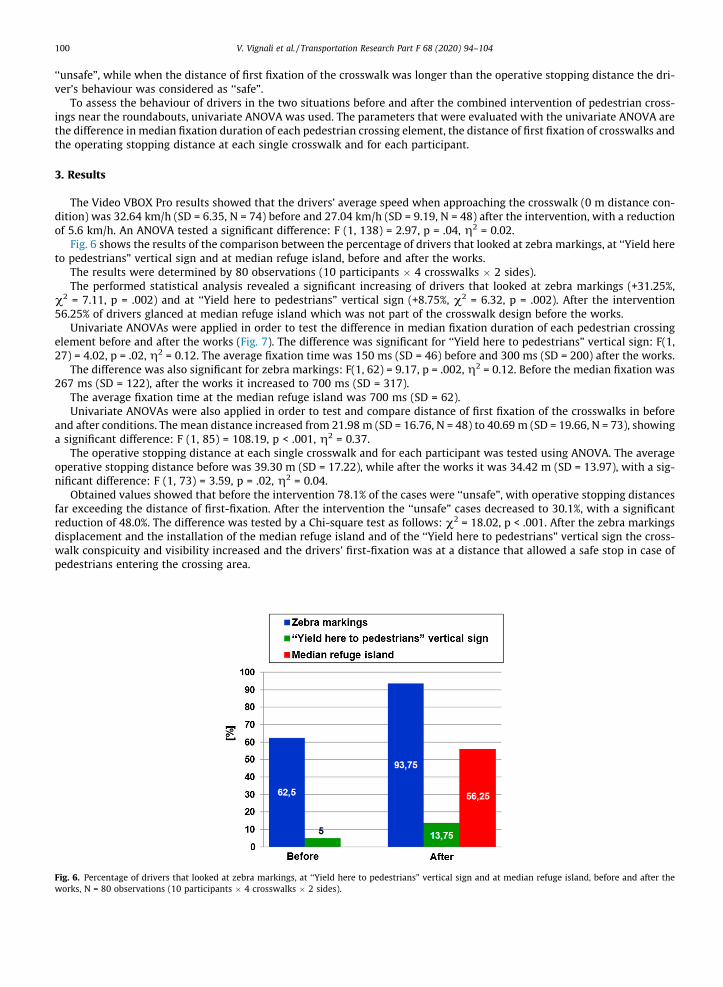
‘‘unsafe”, while when the distance of first fixation of the crosswalk was longer than the operative stopping distance the dri-ver’s behaviour was considered as ‘‘safe”.
To assess the behaviour of drivers in the two situations before and after the combined intervention of pedestrian cross-ings near the roundabouts, univariate ANOVA was used. The parameters that were evaluated with the univariate ANOVA arethe difference in median fixation duration of each pedestrian crossing element, the distance of first fixation of crosswalks andthe operating stopping distance at each single crosswalk and for each participant.
3. Results
The Video VBOX Pro results showed that the drivers’ average speed when approaching the crosswalk (0 m distance con-dition) was 32.64 km/h (SD = 6.35, N = 74) before and 27.04 km/h (SD = 9.19, N = 48) after the intervention, with a reductionof 5.6 km/h. An ANOVA tested a significant difference: F (1, 138) = 2.97, p = .04, g2 = 0.02.
Fig. 6 shows the results of the comparison between the percentage of drivers that looked at zebra markings, at ‘‘Yield hereto pedestrians” vertical sign and at median refuge island, before and after the works.
The results were determined by 80 observations (10 participants 4 crosswalks 2 sides).The performed statistical analysis revealed a significant increasing of drivers that looked at zebra markings (+31.25%,
v2 = 7.11, p = .002) and at ‘‘Yield here to pedestrians” vertical sign (+8.75%, v2 = 6.32, p = .002). After the intervention56.25% of drivers glanced at median refuge island which was not part of the crosswalk design before the works.
Univariate ANOVAs were applied in order to test the difference in median fixation duration of each pedestrian crossingelement before and after the works (Fig. 7). The difference was significant for ‘‘Yield here to pedestrians” vertical sign: F(1,27) = 4.02, p = .02, g2 = 0.12. The average fixation time was 150 ms (SD = 46) before and 300 ms (SD = 200) after the works.
The difference was also significant for zebra markings: F(1, 62) = 9.17, p = .002, g2 = 0.12. Before the median fixation was267 ms (SD = 122), after the works it increased to 700 ms (SD = 317).
The average fixation time at the median refuge island was 700 ms (SD = 62).Univariate ANOVAs were also applied in order to test and compare distance of first fixation of the crosswalks in before
and after conditions. The mean distance increased from 21.98 m (SD = 16.76, N = 48) to 40.69 m (SD = 19.66, N = 73), showinga significant difference: F (1, 85) = 108.19, p < .001, g2 = 0.37.
The operative stopping distance at each single crosswalk and for each participant was tested using ANOVA. The averageoperative stopping distance before was 39.30 m (SD = 17.22), while after the works it was 34.42 m (SD = 13.97), with a sig-nificant difference: F (1, 73) = 3.59, p = .02, g2 = 0.04.
Obtained values showed that before the intervention 78.1% of the cases were ‘‘unsafe”, with operative stopping distancesfar exceeding the distance of first-fixation. After the intervention the ‘‘unsafe” cases decreased to 30.1%, with a significantreduction of 48.0%. The difference was tested by a Chi-square test as follows: v2 = 18.02, p < .001. After the zebra markingsdisplacement and the installation of the median refuge island and of the ‘‘Yield here to pedestrians” vertical sign the cross-walk conspicuity and visibility increased and the drivers’ first-fixation was at a distance that allowed a safe stop in case ofpedestrians entering the crossing area.
Fig. 6. Percentage of drivers that looked at zebra markings, at ‘‘Yield here to pedestrians” vertical sign and at median refuge island, before and after theworks, N = 80 observations (10 participants 4 crosswalks 2 sides).
100 V. Vignali et al. / Transportation Research Part F 68 (2020) 94–104
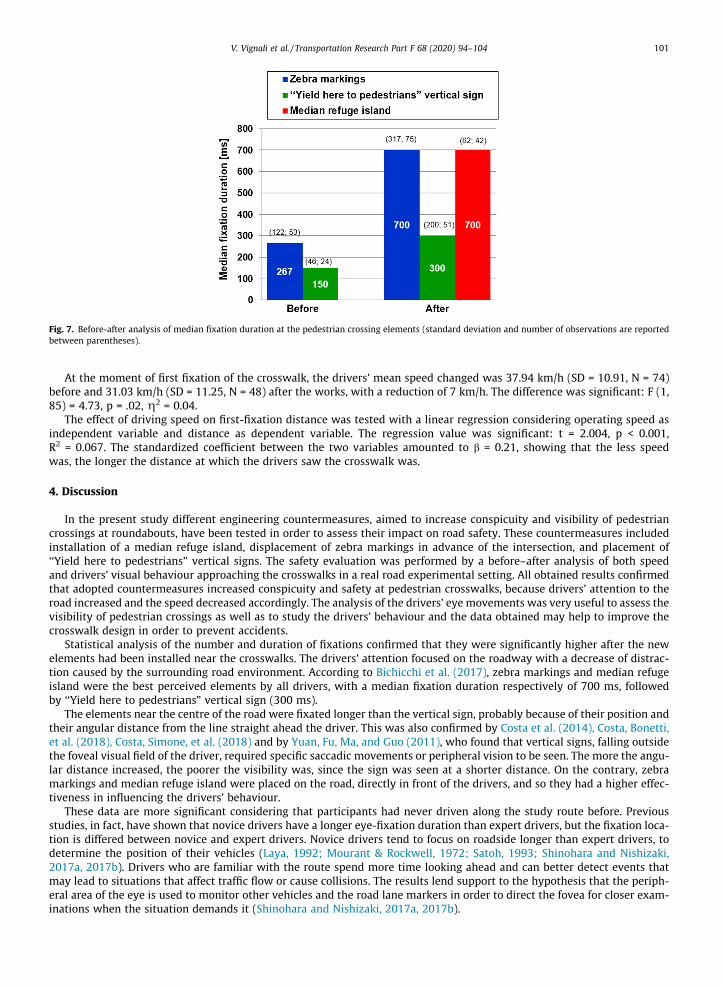
At the moment of first fixation of the crosswalk, the drivers’ mean speed changed was 37.94 km/h (SD = 10.91, N = 74)before and 31.03 km/h (SD = 11.25, N = 48) after the works, with a reduction of 7 km/h. The difference was significant: F (1,85) = 4.73, p = .02, g2 = 0.04.
The effect of driving speed on first-fixation distance was tested with a linear regression considering operating speed asindependent variable and distance as dependent variable. The regression value was significant: t = 2.004, p < 0.001,R2 = 0.067. The standardized coefficient between the two variables amounted to b = 0.21, showing that the less speedwas, the longer the distance at which the drivers saw the crosswalk was.
4. Discussion
In the present study different engineering countermeasures, aimed to increase conspicuity and visibility of pedestriancrossings at roundabouts, have been tested in order to assess their impact on road safety. These countermeasures includedinstallation of a median refuge island, displacement of zebra markings in advance of the intersection, and placement of‘‘Yield here to pedestrians” vertical signs. The safety evaluation was performed by a before–after analysis of both speedand drivers’ visual behaviour approaching the crosswalks in a real road experimental setting. All obtained results confirmedthat adopted countermeasures increased conspicuity and safety at pedestrian crosswalks, because drivers’ attention to theroad increased and the speed decreased accordingly. The analysis of the drivers’ eye movements was very useful to assess thevisibility of pedestrian crossings as well as to study the drivers’ behaviour and the data obtained may help to improve thecrosswalk design in order to prevent accidents.
Statistical analysis of the number and duration of fixations confirmed that they were significantly higher after the newelements had been installed near the crosswalks. The drivers’ attention focused on the roadway with a decrease of distrac-tion caused by the surrounding road environment. According to Bichicchi et al. (2017), zebra markings and median refugeisland were the best perceived elements by all drivers, with a median fixation duration respectively of 700 ms, followedby ‘‘Yield here to pedestrians” vertical sign (300 ms).
The elements near the centre of the road were fixated longer than the vertical sign, probably because of their position andtheir angular distance from the line straight ahead the driver. This was also confirmed by Costa et al. (2014), Costa, Bonetti,et al. (2018), Costa, Simone, et al. (2018) and by Yuan, Fu, Ma, and Guo (2011), who found that vertical signs, falling outsidethe foveal visual field of the driver, required specific saccadic movements or peripheral vision to be seen. The more the angu-lar distance increased, the poorer the visibility was, since the sign was seen at a shorter distance. On the contrary, zebramarkings and median refuge island were placed on the road, directly in front of the drivers, and so they had a higher effec-tiveness in influencing the drivers’ behaviour.
These data are more significant considering that participants had never driven along the study route before. Previousstudies, in fact, have shown that novice drivers have a longer eye-fixation duration than expert drivers, but the fixation loca-tion is differed between novice and expert drivers. Novice drivers tend to focus on roadside longer than expert drivers, todetermine the position of their vehicles (Laya, 1992; Mourant & Rockwell, 1972; Satoh, 1993; Shinohara and Nishizaki,2017a, 2017b). Drivers who are familiar with the route spend more time looking ahead and can better detect events thatmay lead to situations that affect traffic flow or cause collisions. The results lend support to the hypothesis that the periph-eral area of the eye is used to monitor other vehicles and the road lane markers in order to direct the fovea for closer exam-inations when the situation demands it (Shinohara and Nishizaki, 2017a, 2017b).
Fig. 7. Before-after analysis of median fixation duration at the pedestrian crossing elements (standard deviation and number of observations are reportedbetween parentheses).
V. Vignali et al. / Transportation Research Part F 68 (2020) 94–104 101
After the intervention all the drivers detected the crosswalks in advance, since the mean distance of first fixation of cross-walk increased accordingly. They were seen at a longer distance increasing hazard anticipation and detection. Before theworks, drivers saw the crosswalk at a very shorter distance (21.98 m), which didn’t allow them to adjust speed and slowdown their velocity. After the countermeasures, drivers perceived the pedestrian crossings from a longer distance(40.69 m), and they continued to glance at the crosswalks while approaching them, enhancing their visual attention. Thiswas due also to the average speed reduction approaching the crosswalk. After the works, in fact, the drivers perceived inadvance the crosswalk presence and therefore they decelerated earlier reducing the probability of fatal accidents. The dri-vers’ average speed reduction was of 5.6 km/h after the intervention.
The lower the speed, the longer the distance of crosswalks detection was. At a low speed the driver may tend to look atand monitor the road more carefully than at a high speed, better perceiving any critical element placed ahead. The longer thedistance of first fixation of crosswalk, the longer the operative stopping distance of the drivers was. After the works, a reduc-tion of 48.0% of the ‘‘unsafe” cases were obtained.
As said above, these data are very interesting considering that participants had never driven the study route before.Several previous studies, in fact, have found that familiarity with the driving situation has a great influence on the driving
speed. Expert drivers tend to drive faster than the novice drivers and, under increased speed conditions, subject tended tofixate relevant items near the centre of the road with increased frequency (Spijkers, 1992). Drivers detect fewer elements inthe central visual field when driving slowly and they detect fewer elements in peripheral vision when driving fast (Kayser &Hess, 1991; Miura, 1985, 1987; Rogé et al., 2004).
A relatively small sample of drivers and situations was considered in this study and future studies will test the effects of asimilar intervention on a larger sample. Nevertheless, the significant variations in the drivers’ behaviour recorded after theworks were particularly remarkable in terms of crosswalk visibility and conspicuity. Future researches might evaluate dri-vers’ behaviour in the presence of a pedestrian on the crosswalk area.
CRediT authorship contribution statement
Valeria Vignali: Conceptualization, Methodology, Investigation. Margherita Pazzini: Investigation, Writing - originaldraft. Navid Ghasemi: Investigation, Data curation. Claudio Lantieri:Writing - original draft. Andrea Simone: Data curation,Writing - original draft. Giulio Dondi: Writing - review & editing.
Acknowledgements
This work was supported by the Municipality of Faenza. The authors thank Davide Parmeggiani and Patrizia Barchi fortheir support in this study.
References
Beeber, J. (2011). Maximizing safety at signalized intersections through increased yellow and all-red signal phases. Los Angeles: Safer Streets.Bella, F., & Silvestri, M. (2015). Effects of safety measures on driver’s speed behaviour at pedestrian crossings. Accident Analysis and Prevention, 83, 111–124.
https://doi.org/10.1016/j.aap.2015.07.016.Bergman, A., Olstam, J., & Allström, A. (2011). Analytical traffic models for roundabouts with pedestrian crossings. Procedia – Social and Behavioral Sciences,
16, 697–708. https://doi.org/10.1016/j.sbspro.2011.04.489.Biassoni, M., Confalonieri, F., & Ciceri, R. (2018). Visual exploration of pedestrian crossings by adults and children: Comparison of strategies. Transportation
Research Part F, 56, 227–235. https://doi.org/10.1016/j.trf.2018.04.009.Bichicchi, A., Mazzotta, F., Lantieri, C., Vignali, V., Simone, A., Dondi, G., & Costa, M. (2017). The influence of pedestrian crossings features on driving behavior
and road safety. In Proceedings of AIIT international congress TIS Rome 2017, April 10–12. https://doi.org/10.1201/9781315281896-96.Bock, O., Brustio, P. R., & Borisova, S. (2015). Age-related differences of the gaze pattern in a realistic pedestrian traffic task. International Journal of Applied
Psychology, 5, 13–19. https://doi.org/10.5923/j.ijap.20150501.03.Bongiorno, N., Bosurgi, G., Pellegrino, O., & Sollazzo, G. (2017). How is the driver’s workload influenced by the road environment? Procedia Engineering, 187,
5–13. https://doi.org/10.1016/j.proeng.2017.04.343.Bucchi, A., Sangiorgi, C., & Vignali, V. (2012). Traffic Psychology and Driver Behavior. Procedia – Social and Behavioral Sciences, 53, 972–979. https://doi.org/
10.1016/j.sbspro.2012.09.946.Bungum, T. J., Day, C., & Henry, L. J. (2005). The association of distraction and caution displayed by pedestrians at a lighted crosswalk. Journal of Community
Health, 30(4), 269–279. https://doi.org/10.1007/s10900-005-3705-4.Ciceri, M., Ruscio, D., Confalonieri, F., Vangi, D., & Virga, A. (2013). Hazard detection in driving context and braking reaction time. Proceedings of the 22nd EVU
annual congress.Chu, W., Wu, C., Atombo, C., Zhang, H., & Özkan, T. (2019). Traffic climate, driver behaviour, and accidents involvement in China. Accident Analysis and
Prevention, 122(1178), 119–126. https://doi.org/10.1016/j.aap.2018.09.007.Cohen, A., Bar-Gera, H., Parmet, Y., & Ronen, A. (2013). Guardrail influence on pedestrian crossing behavior at roundabouts. Accident Analysis and Prevention,
59(2013), 452–458.Costa, M., Bichicchi, A., Nese, M., Lantieri, C., Vignali, V., & Simone, A. (2019). T-junction priority scheme and road user’s yielding behavior. Transportation
Research Part F, 60, 770–782. https://doi.org/10.1016/j.trf.2018.12.009.Costa, M., Bonetti, L., Vignali, V., Bichicchi, A., Lantieri, C., & Simone, A. (2019). Driver’s visual attention to different categories of roadside advertising signs.
Applied Ergonomics, 78, 127–136. https://doi.org/10.1016/j.apergo.2019.03.001.Costa, M., Bonetti, L., Bellelli, M., Lantieri, C., Vignali, V., & Simone, A. (2017). Reflective tape applied to bicycle frame and conspicuity enhancement at night.
Human Factors, 59, 485–500. https://doi.org/10.1177/0018720816677145.Costa, M., Bonetti, L., Vignali, V., Lantieri, C., & Simone, A. (2018). The role of peripheral vision in vertical road sign identification and discrimination.
Ergonomics. https://doi.org/10.1080/00140139.2018.1508756.
102 V. Vignali et al. / Transportation Research Part F 68 (2020) 94–104

Costa, M., Simone, A., Vignali, V., Lantieri, C., Bucchi, A., & Dondi, G. (2014). Looking behaviour for vertical road signs. Transportation Research Part F, 23,147–155. https://doi.org/10.1016/j.trf.2014.01.003.
Costa, M., Simone, A., Vignali, V., Lantieri, C., & Palena, N. (2018). Fixation distance and fixation duration to vertical road signs. Applied Ergonomics, 69, 48–57.https://doi.org/10.1016/j.apergo.2017.12.017.
Crescenzo, G., Villa, C., Brémond, R., Vignali, V., Lantieri, C., & Simone, A. (2019). The shape of road markings for visibility computation. In Proceedings of the
Institution of Civil Engineers – Transport. https://doi.org/10.1016/B978-0-12-811926-6.00020-8.Davoudian, N., & Raynham, P. (2012). What do pedestrians look at night? Lighting, Research & Technology, 44, 438–448. https://doi.org/10.1177/
1477153512437157.Di Flumeri, G., Borghini, G., Aricò, P., Sciaraffa, N., Lanzi, P., Pozzi, S., ... Babiloni, F. (2018). EEG-based mental workload neurometric to evaluate the impact of
different traffic and road conditions in real driving settings. Frontiers in Human Neuroscience, 12, 1–18. https://doi.org/10.3389/fnhum.2018.00509.Dondi, G., Simone, A., Lantieri, C., & Vignali, V. (2011). Bike lane design: The context sensitive approach. Procedia Engineering, 21, 897–906. https://doi.org/
10.1016/j.proeng.2011.11.2092.Dukic, T., Ahlstrom, C., Patten, C., Kettwich, C., & Kircher, K. (2013). Effects of electronic billboards on driver distraction. Traffic Injury Prevention, 14(5),
469–476. https://doi.org/10.1080/15389588.2012.731546.Fildes, B. N., Fletcher, M. R., & Corrigan, J. M. (1987). Speed perception: Drivers’ judgements of safety and speed on urban and rural straight roads. Report CR
54. Canberra, Australia: Department of Transport & Communication.Fisher, D., & Garay-Vega, L. (2012). Advance yield markings and drivers’ performance in response to multiple-threat scenarios at mid-block crosswalks.
Accident Analysis and Prevention, 44, 35–41. https://doi.org/10.1016/j.aap.2010.11.030.Fortuijn, L. G. H. (2003). Pedestrian and Bicycle-Friendly Roundabouts; Dilemma of Comfort and Safety. In Annual Meeting 2003 of the Institute of
Transportation Engineers (ITE) (pp. 1–20).Fotios, S., Uttley, J., & Hara, N. (2013). Critical pedestrian tasks: Using eye-tracking within a dual task paradigm. In Proceedings of the CIE centenary
conference ‘‘Towards a New Century of Light”. Paris, 15–16 April.Ghasemi, N., Acerra, E., Vignali, V., Lantieri, C., Simone, A., & Imine, H. (2019). Road safety review update by using innovative technologies to investigate
driver behaviour. In AIIT 2nd International Congress on Transport Infrastructure and Systems in a changing world (TIS ROMA 2019), 23-24 September2019, Rome, Italy.
Gómez, R. A., Siby, S., Romoser, M. R. E., Gerardino, L. R., Knodler, M., Collura, J., & Fisher, D. L. (2013). Proceedings of the 16th road safety on four continentsconference, Beijing.
Gonzalo-Orden, H., Pérez-Acebo, H., Unamunzaga, A. L., & Arce, M. R. (2018). Effects of traffic calming measures in different urban areas. TransportationResearch Procedia, 33, 83–90. https://doi.org/10.1016/j.trpro.2018.10.079.
Gross, F., Lyon, C., Persaud, B., & Srinivasan, R. (2013). Safety effectiveness of converting signalized intersections to roundabouts. Accident Analysis andPrevention, 50, 234–241. https://doi.org/10.1016/j.aap.2012.04.012.
Grüner, M., & Ansorge, U. (2017). Mobile eye tracking during real-world night driving. Journal of Eye Movement Research, 10(2), 1–18. https://doi.org/10.16910/jemr.10.2.1.
Guo, Y., Liu, P., Liang, Q., & Wang, W. (2016). Effects of parallelogram-shaped pavement markings on vehicle speed and safety of pedestrian crosswalks onurban roads in China. Accident Analysis and Prevention, 95, 438–447. https://doi.org/10.1016/j.aap.2015.07.001.
Hakkert, A. S., Gitelman, V., & Ben-Shabat, E. (2002). An evaluation of crosswalk warning systems: Effects on pedestrian and vehicle behaviour.Transportation Research Part F: Traffic Psychology and Behaviour, 5(4), 275–292. https://doi.org/10.1016/S1369-8478(02)00033-5.
Haleem, K., Alluri, P., & Gan, A. (2015). Analysing pedestrian crash injury severity at signalized and non-signalized locations. Accident Analysis and Prevention,
81, 14–23.Hawley, L., Henson, C., Hulse, A., & Brindle, R. (1992). Towards traffic calming: A practitioners’ manual of implemented local area traffic management and
blackspot devices. Publication No. CR 126. Canberra, Australia: Federal Office of Road Safety.Holmqvist, K., Nystrom, M., Andersson, R., Dewhurst, R., Jarodzka, H., & van DeWeijer, J. (2015). Eye tracking: A comprehensive guide to methods and measures.
Oxford: Oxford University Press.Huang, H., & Cynecki, M. (2001). The effects of traffic calming measures on pedestrian and motorist behavior. Federal Highway Administration, FHWA-RD-
00- 104.Hydén, C., & Várhelyi, A. (2000). The effects on safety, time consumption and environment of large scale use of roundabouts in an urban area: A case study.
Accident Analysis and Prevention, 32(1), 11–23. https://doi.org/10.1016/S0001-4575(99)00044-5.Inman, V. W. (2012). Conspicuity of traffic signs assessed by eye tracking and immediate recall. In Proceedings of the human factors and ergonomics society,
56th annual meeting (pp. 2251–2255).Jurecki, R. S., & Stanczyk, T. L. (2014). Driver reaction time to lateral entering pedestrian in a simulated crash traffic situation. Transportation Research Part F,
27, 22–36. https://doi.org/10.1016/j.trf.2014.08.006.Kapitaniak, B., Walczak, M., Kosobudzki, M., Jozwiak, Z., & Bortkiewicz, A. (2015). Application of eye tracking in drivers testing: A review of research.
International Journal of Occupational Medicine and Environmental Health, 28, 941–954. https://doi.org/10.13075/ijomeh.1896.00317.Kayser, H. J., & Hess, M. (1991). The dependency of drivers viewing behaviour on speed and street environment structure. In A. G. Gale (Ed.), Vision in vehicles
III. Elsevier Publishers: North-Holland.Kolsrud, B. (1985). Speeds in rural traffic: The influence of various factors on car speeds on straight level roads. VTI Meddelande 390, Sweden.Kröyer, H. R. G., Jonsson, T., & Várhelyi, A. (2014). Relative fatality risk curve to describe the effect of change in the impact speed on fatality risk of
pedestrians struck by a motor vehicle. Accident Analysis and Prevention, 62, 143–152. https://doi.org/10.1016/j.aap.2013.09.007.Lantieri, C., Lamperti, R., Simone, A., Costa, M., Vignali, V., Sangiorgi, C., & Dondi, G. (2015). Gateway design assessment in the transition from high to low
speed areas. Transportation Research Part F, 34, 41–53. https://doi.org/10.1016/j.trf.2015.07.017.Laya (1992). Eye movements in actual and simulated curve negotiation task. ITASS Research, 16(1), 15–26.Leden, L., Gårder, P., & Johansson, C. (2006). Safe pedestrian crossings for children and elderly. Accident Analysis and Prevention, 38, 289–294. https://doi.org/
10.1016/j.aap.2005.09.012.Macbeth, A. (1995). Balliol Street, City of Toronto. Traffic engineering committee workshop. In Proceedings of the Ontario traffic conference, Toronto,
Ontario, Canada.Mako, E. (2015). Evaluation of human behaviour at pedestrian crossings. In 2015 6th IEEE International Conference on Cognitive Infocommunications
(CogInfoCom) (pp. 443–447). https://doi.org/10.1109/CogInfoCom.2015.7390634.Mantuano, A., Bernardi, S., & Rupi, F. (2017). Cyclist gaze behavior in urban space: An eye-tracking experiment on the bicycle network of Bologna. Case
Studies on Transport Policy, 5, 408–416. https://doi.org/10.1016/j.cstp.2016.06.001.Maxera, P., Kledus, R., & Semela, M. (2015). Analysis of drivers’ conduct while driving over pedestrian crossing by using eye-tracking method. In Proceedings
of the international scientific conference modern safety technologies in transportation. Košice, Slovakia.Meneguzzer, C., & Rossi, R. (2011). Evaluating the impact of pedestrian crossings on roundabout entry capacity. Procedia – Social and Behavioral Sciences, 20,
69–78. https://doi.org/10.1016/j.sbspro.2011.08.012.Ministry of Infrastructures and Transports (1992). Codice della strada [Highway code]. Rome (in Italian).Ministry of Infrastructures and Transports (2001). Decreto Ministeriale del 5/11/2001 Norme funzionali e geometriche per la costruzione delle strade. Rome
(in Italian).Miura, T. (1985). What is the narrowing of visual field with the increase of speed? Paper presented at the 10th congress of the international association for
accident and traffic medicine.
V. Vignali et al. / Transportation Research Part F 68 (2020) 94–104 103
Miura, T. (1987). Behavior orientation vision: Functional field of view and processing resources. In J. K. OReagan & A. Levy-Schoen (Eds.), Eye movements:From physiology to cognition. Elsevier Publishers.
Mourant & Rockwell (1972). Strategies of visual search by novice and experienced drivers, human factors. The Journal of the Human Factors and ErgonomicsSociety, 14–4, 325–335.
Muttart, J. W., Dinakar, S., Vandenberg, G., & Yosko, M. (2016). The influence of driver expectation when recognizing lighted targets at nighttime. InProceedings of the Human Factors and Ergonomics Society. https://doi.org/10.1177/1541931213601111.
Obeng-Atuah, D., Poku-Boansi, M., & Cobbinah, P. B. (2017). Pedestrian crossing in urban Ghana: Safety implications. Journal of Transport and Health, 5,55–69. https://doi.org/10.1016/j.jth.2016.06.007.
Olszewski, P., Szagała, P., Wolanski, M., & Zielinska, A. (2015). Pedestrian fatality risk in accidents at unsignalized zebra crosswalks in Poland. AccidentAnalysis and Prevention, 84, 83–91. https://doi.org/10.1016/j.aap.2015.08.008.
Oviedo-Trespalacios, O., Haque, M. M., King, M., & Washington, S. (2017). Effects of road infrastructure and traffic complexity in speed adaptation behaviourof distracted drivers. Accident Analysis and Prevention, 101, 67–77. https://doi.org/10.1016/j.aap.2017.01.018.
Perdomo, M., Rezaei, A., Patterson, Z., Saunier, N., & Miranda-Moreno, L. F. (2014). Pedestrian preferences with respect to roundabouts – A video-basedstated preference survey. Accident Analysis and Prevention, 70, 84–91. https://doi.org/10.1016/j.aap.2014.03.010.
Replogle, M. (1992). Bicycle and pedestrian policies and programs in Asia, Australia, and New Zealand: Case Study 17. National Bicycling andWalking Study.Report No. FHWA-PD-93-016. Washington, DC: Federal Highway Administration.
Retting, R. A., Ferguson, S. A., & McCartt, A. T. (2003). A review of evidence-based traffic engineering measures designed to reduce pedestrian–motor vehiclecrashes. American Journal of Public Health, 93(9), 1456–1463.
Ringhand, M., & Vollrath, M. (2019). Effect of complex traffic situations on route choice behaviour and driver stress in residential areas. TransportationResearch Part F: Traffic Psychology and Behaviour, 60, 274–287. https://doi.org/10.1016/j.trf.2018.10.023.
Rogé, J., Pébayle, T., Lambilliotte, E., Spitzenstetter, F., Giselbrecht, D., & Muzet, A. (2004). Influence of age, speed and duration of monotonous driving task intraffic on the drivers useful visual field. Vision Research, 44, 2737–2744.
Rosén, E., & Sander, U. (2009). Pedestrian fatality risk as a function of car impact speed. Accident Analysis and Prevention, 41, 536–542.Rosén, E., Stigson, H., & Sander, U. (2011). Literature review of pedestrian fatality risk as a function of car impact speed. Accident Analysis and Prevention, 43,
25–33.Sanca, M. (2002). Application of design for safer urban roads and junctions: Selected countermeasures. Sweden: Linkoping University.Satoh, K. (1993). Visual search and peripheral vision performance by novice and experienced drivers. IATSS Review, 19.Sherbutt, J., Van Houten, R., Turner, S., & Huitema, B. (2009). Analysis of effects of LED rectangular rapid-flash beacons on yielding to pedestrians in
multilane crosswalks. Transportation Research Record, 2140, 85–95. https://doi.org/10.3141/2140-09.Shinohara & Nishizaki (2017a). Where do drivers look when driving in a foreign country? Studies in Computational Intelligence, 721, 151–164.Shinohara & Nishizaki (2017b). Effects of driving situation and driving experience on eye moments. Information Engineering Express International Institute of
Applied Informatics, 3(3), 31–40.Sodhi, M., Reimer, B., Cohen, J. L., Vastenburg, E., Kaars, R., & Kirschenbaum, S. (2002). On-road driver eye movement tracking using head-mounted devices.
In Proceedings of the 2002 symposium on eye tracking research & applications (pp. 61–68).Spijkers, W. (1992). Distribution of eye-fixations during driving. IATSS Research, 16(1), 27–34.Stewart, D. (2007). A clearer vision for pedestrian guardrails. Civil Engineering, 160(CE3), 131–136.Taylor, T., Pradhan, A. K., Divekar, G., Romoser, M., Muttart, J., Gomez, R., ... Fisher, D. L. (2013). The view from the road: The contribution of on road glance-
monitoring technologies to understanding driver behavior. Accident Analysis and Prevention, 58, 175–186. https://doi.org/10.1016/j. aap.2013.02.008.Tefft, B. C. (2013). Impact speed and a pedestrian’s risk of severe injury or death. Accident Analysis and Prevention, 50, 871–878. https://doi.org/10.1016/j.
aap.2012.07.022.Topolšek, D., Areh, I., & Cvahte, T. (2016). Examination of driver detection of roadside traffic signs and advertisements using eye tracking. Transportation
Research Part F: Traffic Psychology and Behaviour, 43, 212–224. https://doi.org/10.1016/j.trf.2016.10.002.Trefzger, M., Blascheck, T., Raschke, M., Hausmann, S., Schlegel, T., 2018. A visual comparison of gaze behavior from pedestrians and cyclists. In Symposium
on eye tracking research and applications, Warsaw, Poland.Turner, D. (2011). Roundabouts: A Literature Review (December) (pp. 1–17).Van Houten, R., Ellis, R., & Marmolejo, E. (2008). Stutter-flash light-emitting-diode beacons to increase yielding to pedestrians at crosswalks. Transportation
Research Record, 2073, 69–78. https://doi.org/10.3141/2073-08.Velichkovsky, B., Domhoefer, S. M., Pannasch, S., & Unema, J. A. (2000). Visual fixations and level of attentional processing. Proceedings of the eye tracking
research & application symposium, ETRA 2000, Palm Beach Gardens.Vey, A. H., & Ferreri, M. G. (1968). The effect of lane width on traffic operation. Traffic Engineering, 38, 22–27.Vignali, V., Cuppi, F., Acerra, E., Bichicchi, A., Lantieri, C., Simone, A., & Costa, M. (2019). Effects of median refuge island and flashing vertical sign on
conspicuity and safety of unsignalized crosswalks. Transportation Research Part F: Traffic Psychology and Behaviour, 60, 427–439. https://doi.org/10.1016/j.trf.2018.10.033.
Vignali, V., Bichicchi, A., Simone, A., Lantieri, C., Dondi, G., & Costa, M. (2019). Road sign vision and driver behavior in work zones. Transportation ResearchPart F, 60, 474–484. https://doi.org/10.1016/j.trf.2018.11.005.
Vijayawargiya, V., & Rokade, S. (2017). Identification of factors affecting pedestrian level of service of crosswalks at roundabouts. International ResearchJournal of Engineering and Technology (IRJET), 4(6), 342–346.
Ward, N. J., Linkenbach, J., Keller, S. N., & Otto, J. (2010). White paper on traffic safety culture.World Road Association (PIARC), 2003. Road safety manual.Xu, J., Liu, J., Qu, W., Ge, Y., Sun, X., & Zhang, K. (2018). Comparison of pedestrian behaviors between drivers and non-drivers in Chinese sample.
Transportation Research Part F: Traffic Psychology and Behaviour, 58, 1053–1060. https://doi.org/10.1016/j.trf.2018.05.034.Yagar, S., & Van Aerde, M. (1983). Geometric and environmental effects on speeds on 2-lane rural roads. Transportation Research Record, 17A, 315.Yuan, W., Fu, R., Ma, Y., & Guo, Y. S. (2011). Effects of vehicle speed and traffic sign text height on drivers’ visual search patterns. Journal of Traffic and
Transportation Engineering, 11, 119–126.Zeeger, C. V., & Bushell, M. (2012). Pedestrian crash trends and potential countermeasures from around the world. Accident Analysis and Prevention, 44, 3–11.
https://doi.org/10.1016/j.aap.2010.12.007.Zito, G. A., Cazzoli, D., Scheffler, L., Jäger, M., Müri, R. M., Mosimann, U. P., & Nef, T. (2015). Street crossing behavior in younger and older pedestrians: An eye
and head-tracking study. BMC Geriatrics, 15, 176. https://doi.org/10.1186/s12877-015-0175-0.
104 V. Vignali et al. / Transportation Research Part F 68 (2020) 94–104
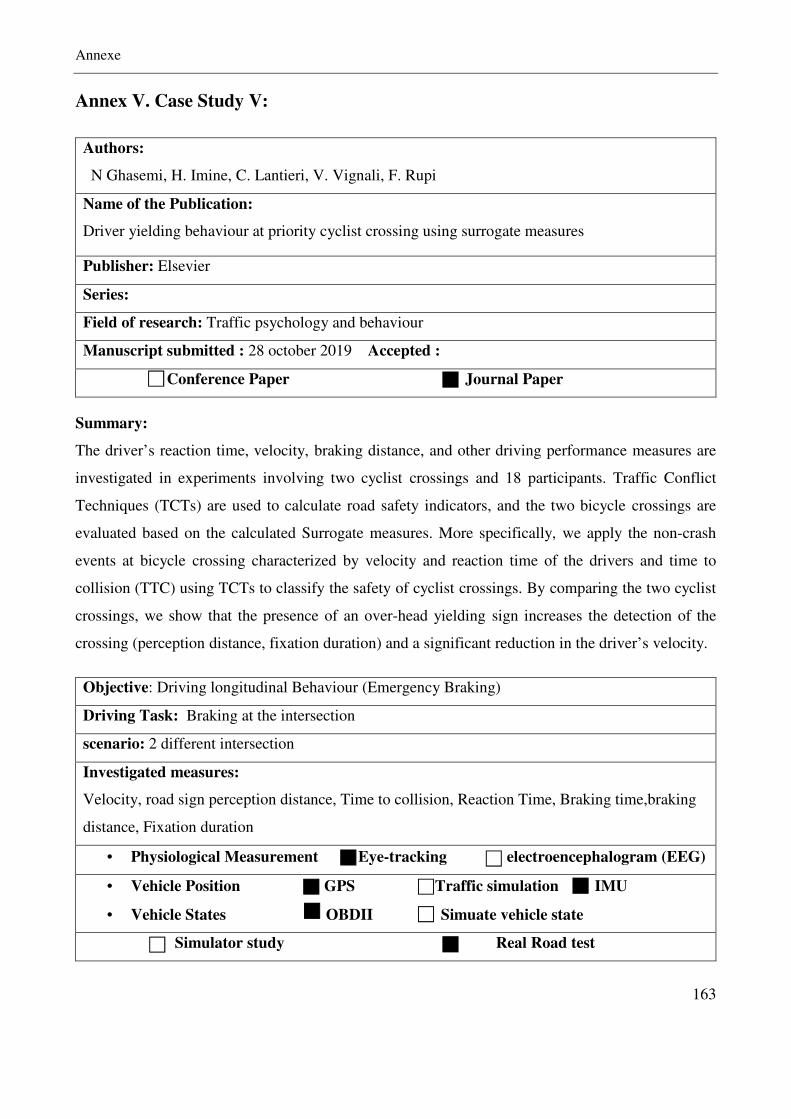
Annexe
163
Annex V. Case Study V:
Authors:
N Ghasemi, H. Imine, C. Lantieri, V. Vignali, F. Rupi
Name of the Publication:
Driver yielding behaviour at priority cyclist crossing using surrogate measures
Publisher: Elsevier
Series:
Field of research: Traffic psychology and behaviour
Manuscript submitted : 28 october 2019 Accepted :
Conference Paper Journal Paper
Summary:
The driver’s reaction time, velocity, braking distance, and other driving performance measures are
investigated in experiments involving two cyclist crossings and 18 participants. Traffic Conflict
Techniques (TCTs) are used to calculate road safety indicators, and the two bicycle crossings are
evaluated based on the calculated Surrogate measures. More specifically, we apply the non-crash
events at bicycle crossing characterized by velocity and reaction time of the drivers and time to
collision (TTC) using TCTs to classify the safety of cyclist crossings. By comparing the two cyclist
crossings, we show that the presence of an over-head yielding sign increases the detection of the
crossing (perception distance, fixation duration) and a significant reduction in the driver’s velocity.
Objective: Driving longitudinal Behaviour (Emergency Braking)
Driving Task: Braking at the intersection
scenario: 2 different intersection
Investigated measures:
Velocity, road sign perception distance, Time to collision, Reaction Time, Braking time,braking
distance, Fixation duration
• Physiological Measurement Eye-tracking electroencephalogram (EEG)
• Vehicle Position GPS Traffic simulation IMU
• Vehicle States OBDII Simuate vehicle state
Simulator study Real Road test
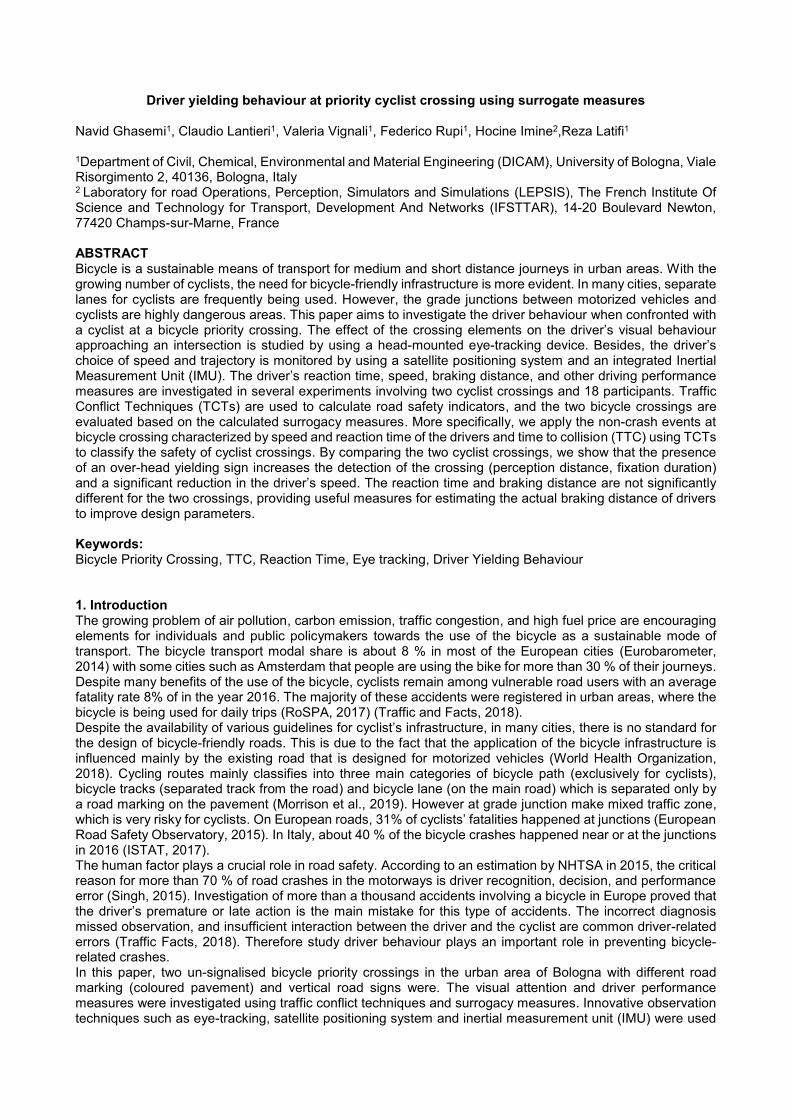
Driver yielding behaviour at priority cyclist crossing using surrogate measures
Navid Ghasemi1, Claudio Lantieri1, Valeria Vignali1, Federico Rupi1, Hocine Imine2,Reza Latifi1 1Department of Civil, Chemical, Environmental and Material Engineering (DICAM), University of Bologna, Viale Risorgimento 2, 40136, Bologna, Italy 2 Laboratory for road Operations, Perception, Simulators and Simulations (LEPSIS), The French Institute Of Science and Technology for Transport, Development And Networks (IFSTTAR), 14-20 Boulevard Newton, 77420 Champs-sur-Marne, France ABSTRACT Bicycle is a sustainable means of transport for medium and short distance journeys in urban areas. With the growing number of cyclists, the need for bicycle-friendly infrastructure is more evident. In many cities, separate lanes for cyclists are frequently being used. However, the grade junctions between motorized vehicles and cyclists are highly dangerous areas. This paper aims to investigate the driver behaviour when confronted with a cyclist at a bicycle priority crossing. The effect of the crossing elements on the driver’s visual behaviour approaching an intersection is studied by using a head-mounted eye-tracking device. Besides, the driver’s choice of speed and trajectory is monitored by using a satellite positioning system and an integrated Inertial Measurement Unit (IMU). The driver’s reaction time, speed, braking distance, and other driving performance measures are investigated in several experiments involving two cyclist crossings and 18 participants. Traffic Conflict Techniques (TCTs) are used to calculate road safety indicators, and the two bicycle crossings are evaluated based on the calculated surrogacy measures. More specifically, we apply the non-crash events at bicycle crossing characterized by speed and reaction time of the drivers and time to collision (TTC) using TCTs to classify the safety of cyclist crossings. By comparing the two cyclist crossings, we show that the presence of an over-head yielding sign increases the detection of the crossing (perception distance, fixation duration) and a significant reduction in the driver’s speed. The reaction time and braking distance are not significantly different for the two crossings, providing useful measures for estimating the actual braking distance of drivers to improve design parameters. Keywords: Bicycle Priority Crossing, TTC, Reaction Time, Eye tracking, Driver Yielding Behaviour 1. Introduction The growing problem of air pollution, carbon emission, traffic congestion, and high fuel price are encouraging elements for individuals and public policymakers towards the use of the bicycle as a sustainable mode of transport. The bicycle transport modal share is about 8 % in most of the European cities (Eurobarometer, 2014) with some cities such as Amsterdam that people are using the bike for more than 30 % of their journeys. Despite many benefits of the use of the bicycle, cyclists remain among vulnerable road users with an average fatality rate 8% of in the year 2016. The majority of these accidents were registered in urban areas, where the bicycle is being used for daily trips (RoSPA, 2017) (Traffic and Facts, 2018). Despite the availability of various guidelines for cyclist’s infrastructure, in many cities, there is no standard for the design of bicycle-friendly roads. This is due to the fact that the application of the bicycle infrastructure is influenced mainly by the existing road that is designed for motorized vehicles (World Health Organization, 2018). Cycling routes mainly classifies into three main categories of bicycle path (exclusively for cyclists), bicycle tracks (separated track from the road) and bicycle lane (on the main road) which is separated only by a road marking on the pavement (Morrison et al., 2019). However at grade junction make mixed traffic zone, which is very risky for cyclists. On European roads, 31% of cyclists’ fatalities happened at junctions (European Road Safety Observatory, 2015). In Italy, about 40 % of the bicycle crashes happened near or at the junctions in 2016 (ISTAT, 2017). The human factor plays a crucial role in road safety. According to an estimation by NHTSA in 2015, the critical reason for more than 70 % of road crashes in the motorways is driver recognition, decision, and performance error (Singh, 2015). Investigation of more than a thousand accidents involving a bicycle in Europe proved that the driver’s premature or late action is the main mistake for this type of accidents. The incorrect diagnosis missed observation, and insufficient interaction between the driver and the cyclist are common driver-related errors (Traffic Facts, 2018). Therefore study driver behaviour plays an important role in preventing bicycle-related crashes. In this paper, two un-signalised bicycle priority crossings in the urban area of Bologna with different road marking (coloured pavement) and vertical road signs were. The visual attention and driver performance measures were investigated using traffic conflict techniques and surrogacy measures. Innovative observation techniques such as eye-tracking, satellite positioning system and inertial measurement unit (IMU) were used
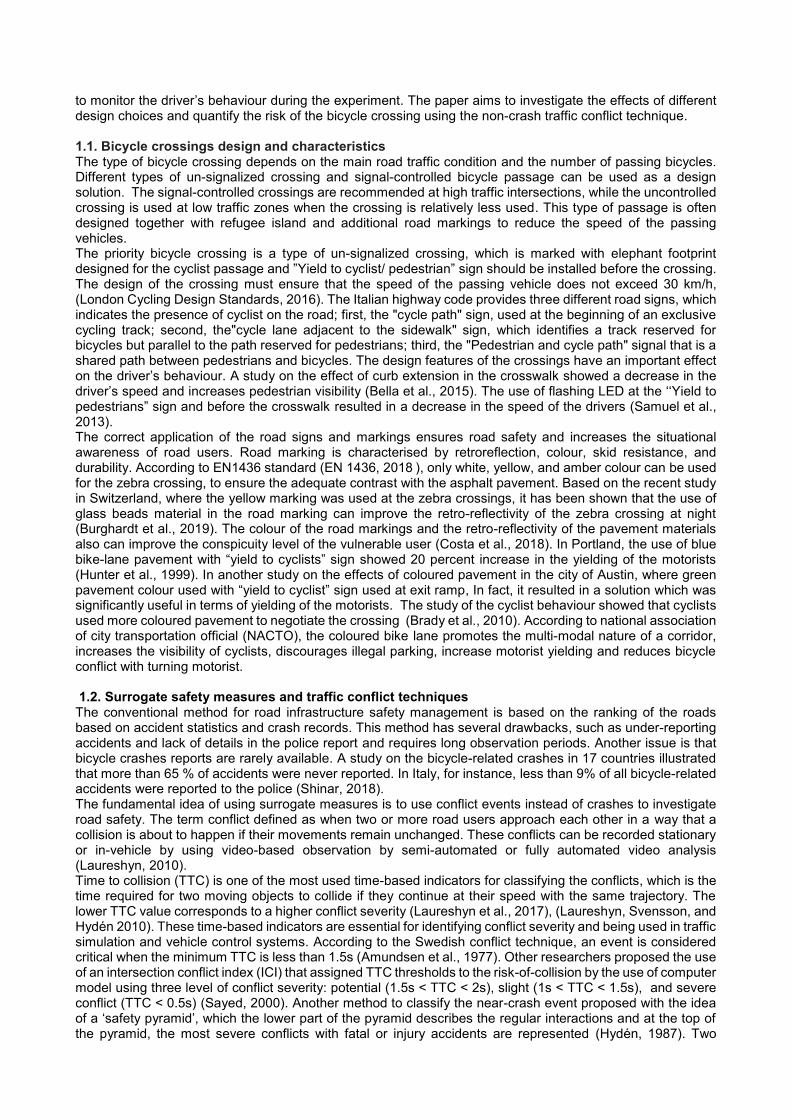
to monitor the driver’s behaviour during the experiment. The paper aims to investigate the effects of different design choices and quantify the risk of the bicycle crossing using the non-crash traffic conflict technique. 1.1. Bicycle crossings design and characteristics The type of bicycle crossing depends on the main road traffic condition and the number of passing bicycles. Different types of un-signalized crossing and signal-controlled bicycle passage can be used as a design solution. The signal-controlled crossings are recommended at high traffic intersections, while the uncontrolled crossing is used at low traffic zones when the crossing is relatively less used. This type of passage is often designed together with refugee island and additional road markings to reduce the speed of the passing vehicles. The priority bicycle crossing is a type of un-signalized crossing, which is marked with elephant footprint designed for the cyclist passage and ”Yield to cyclist/ pedestrian” sign should be installed before the crossing. The design of the crossing must ensure that the speed of the passing vehicle does not exceed 30 km/h, (London Cycling Design Standards, 2016). The Italian highway code provides three different road signs, which indicates the presence of cyclist on the road; first, the "cycle path" sign, used at the beginning of an exclusive cycling track; second, the"cycle lane adjacent to the sidewalk" sign, which identifies a track reserved for bicycles but parallel to the path reserved for pedestrians; third, the "Pedestrian and cycle path" signal that is a shared path between pedestrians and bicycles. The design features of the crossings have an important effect on the driver’s behaviour. A study on the effect of curb extension in the crosswalk showed a decrease in the driver’s speed and increases pedestrian visibility (Bella et al., 2015). The use of flashing LED at the ‘‘Yield to pedestrians” sign and before the crosswalk resulted in a decrease in the speed of the drivers (Samuel et al., 2013). The correct application of the road signs and markings ensures road safety and increases the situational awareness of road users. Road marking is characterised by retroreflection, colour, skid resistance, and durability. According to EN1436 standard (EN 1436, 2018 ), only white, yellow, and amber colour can be used for the zebra crossing, to ensure the adequate contrast with the asphalt pavement. Based on the recent study in Switzerland, where the yellow marking was used at the zebra crossings, it has been shown that the use of glass beads material in the road marking can improve the retro-reflectivity of the zebra crossing at night (Burghardt et al., 2019). The colour of the road markings and the retro-reflectivity of the pavement materials also can improve the conspicuity level of the vulnerable user (Costa et al., 2018). In Portland, the use of blue bike-lane pavement with “yield to cyclists” sign showed 20 percent increase in the yielding of the motorists (Hunter et al., 1999). In another study on the effects of coloured pavement in the city of Austin, where green pavement colour used with “yield to cyclist” sign used at exit ramp, In fact, it resulted in a solution which was significantly useful in terms of yielding of the motorists. The study of the cyclist behaviour showed that cyclists used more coloured pavement to negotiate the crossing (Brady et al., 2010). According to national association of city transportation official (NACTO), the coloured bike lane promotes the multi-modal nature of a corridor, increases the visibility of cyclists, discourages illegal parking, increase motorist yielding and reduces bicycle conflict with turning motorist. 1.2. Surrogate safety measures and traffic conflict techniques The conventional method for road infrastructure safety management is based on the ranking of the roads based on accident statistics and crash records. This method has several drawbacks, such as under-reporting accidents and lack of details in the police report and requires long observation periods. Another issue is that bicycle crashes reports are rarely available. A study on the bicycle-related crashes in 17 countries illustrated that more than 65 % of accidents were never reported. In Italy, for instance, less than 9% of all bicycle-related accidents were reported to the police (Shinar, 2018). The fundamental idea of using surrogate measures is to use conflict events instead of crashes to investigate road safety. The term conflict defined as when two or more road users approach each other in a way that a collision is about to happen if their movements remain unchanged. These conflicts can be recorded stationary or in-vehicle by using video-based observation by semi-automated or fully automated video analysis (Laureshyn, 2010). Time to collision (TTC) is one of the most used time-based indicators for classifying the conflicts, which is the time required for two moving objects to collide if they continue at their speed with the same trajectory. The lower TTC value corresponds to a higher conflict severity (Laureshyn et al., 2017), (Laureshyn, Svensson, and Hydén 2010). These time-based indicators are essential for identifying conflict severity and being used in traffic simulation and vehicle control systems. According to the Swedish conflict technique, an event is considered critical when the minimum TTC is less than 1.5s (Amundsen et al., 1977). Other researchers proposed the use of an intersection conflict index (ICI) that assigned TTC thresholds to the risk-of-collision by the use of computer model using three level of conflict severity: potential (1.5s < TTC < 2s), slight (1s < TTC < 1.5s), and severe conflict (TTC < 0.5s) (Sayed, 2000). Another method to classify the near-crash event proposed with the idea of a ‘safety pyramid’, which the lower part of the pyramid describes the regular interactions and at the top of the pyramid, the most severe conflicts with fatal or injury accidents are represented (Hydén, 1987). Two
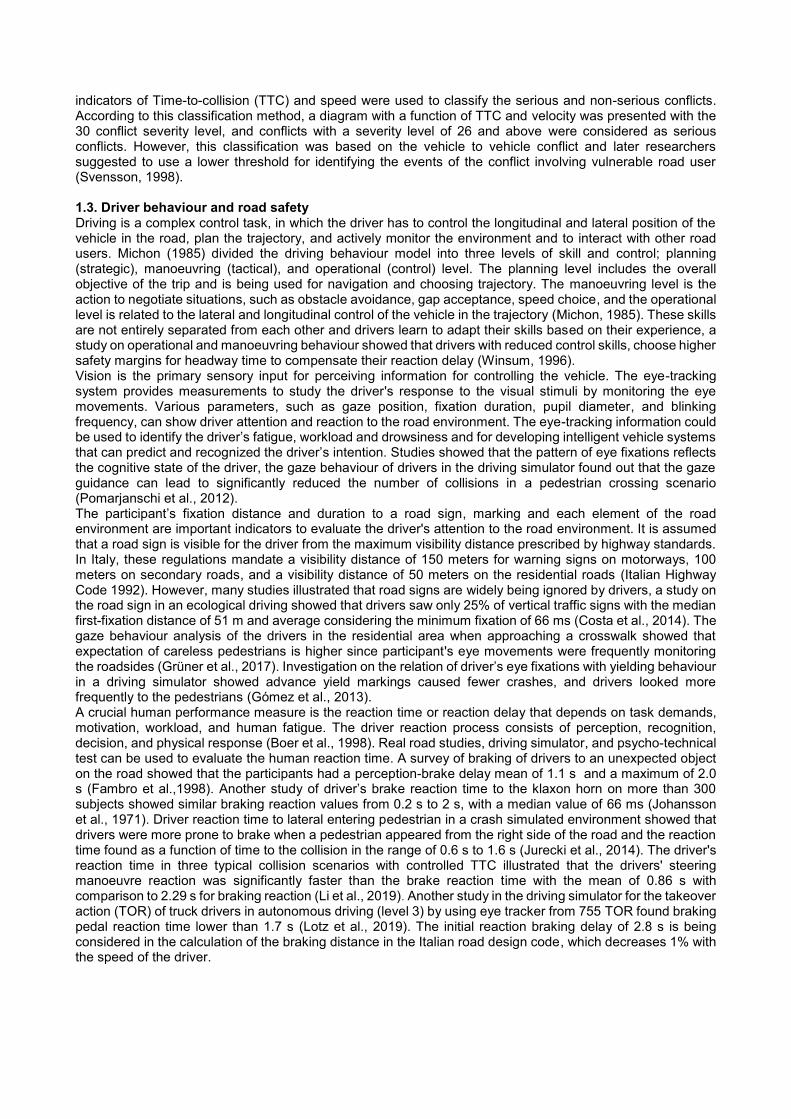
indicators of Time-to-collision (TTC) and speed were used to classify the serious and non-serious conflicts. According to this classification method, a diagram with a function of TTC and velocity was presented with the 30 conflict severity level, and conflicts with a severity level of 26 and above were considered as serious conflicts. However, this classification was based on the vehicle to vehicle conflict and later researchers suggested to use a lower threshold for identifying the events of the conflict involving vulnerable road user (Svensson, 1998). 1.3. Driver behaviour and road safety Driving is a complex control task, in which the driver has to control the longitudinal and lateral position of the vehicle in the road, plan the trajectory, and actively monitor the environment and to interact with other road users. Michon (1985) divided the driving behaviour model into three levels of skill and control; planning (strategic), manoeuvring (tactical), and operational (control) level. The planning level includes the overall objective of the trip and is being used for navigation and choosing trajectory. The manoeuvring level is the action to negotiate situations, such as obstacle avoidance, gap acceptance, speed choice, and the operational level is related to the lateral and longitudinal control of the vehicle in the trajectory (Michon, 1985). These skills are not entirely separated from each other and drivers learn to adapt their skills based on their experience, a study on operational and manoeuvring behaviour showed that drivers with reduced control skills, choose higher safety margins for headway time to compensate their reaction delay (Winsum, 1996). Vision is the primary sensory input for perceiving information for controlling the vehicle. The eye-tracking system provides measurements to study the driver's response to the visual stimuli by monitoring the eye movements. Various parameters, such as gaze position, fixation duration, pupil diameter, and blinking frequency, can show driver attention and reaction to the road environment. The eye-tracking information could be used to identify the driver’s fatigue, workload and drowsiness and for developing intelligent vehicle systems that can predict and recognized the driver’s intention. Studies showed that the pattern of eye fixations reflects the cognitive state of the driver, the gaze behaviour of drivers in the driving simulator found out that the gaze guidance can lead to significantly reduced the number of collisions in a pedestrian crossing scenario (Pomarjanschi et al., 2012). The participant’s fixation distance and duration to a road sign, marking and each element of the road environment are important indicators to evaluate the driver's attention to the road environment. It is assumed that a road sign is visible for the driver from the maximum visibility distance prescribed by highway standards. In Italy, these regulations mandate a visibility distance of 150 meters for warning signs on motorways, 100 meters on secondary roads, and a visibility distance of 50 meters on the residential roads (Italian Highway Code 1992). However, many studies illustrated that road signs are widely being ignored by drivers, a study on the road sign in an ecological driving showed that drivers saw only 25% of vertical traffic signs with the median first-fixation distance of 51 m and average considering the minimum fixation of 66 ms (Costa et al., 2014). The gaze behaviour analysis of the drivers in the residential area when approaching a crosswalk showed that expectation of careless pedestrians is higher since participant's eye movements were frequently monitoring the roadsides (Grüner et al., 2017). Investigation on the relation of driver’s eye fixations with yielding behaviour in a driving simulator showed advance yield markings caused fewer crashes, and drivers looked more frequently to the pedestrians (Gómez et al., 2013). A crucial human performance measure is the reaction time or reaction delay that depends on task demands, motivation, workload, and human fatigue. The driver reaction process consists of perception, recognition, decision, and physical response (Boer et al., 1998). Real road studies, driving simulator, and psycho-technical test can be used to evaluate the human reaction time. A survey of braking of drivers to an unexpected object on the road showed that the participants had a perception-brake delay mean of 1.1 s and a maximum of 2.0 s (Fambro et al.,1998). Another study of driver’s brake reaction time to the klaxon horn on more than 300 subjects showed similar braking reaction values from 0.2 s to 2 s, with a median value of 66 ms (Johansson et al., 1971). Driver reaction time to lateral entering pedestrian in a crash simulated environment showed that drivers were more prone to brake when a pedestrian appeared from the right side of the road and the reaction time found as a function of time to the collision in the range of 0.6 s to 1.6 s (Jurecki et al., 2014). The driver's reaction time in three typical collision scenarios with controlled TTC illustrated that the drivers' steering manoeuvre reaction was significantly faster than the brake reaction time with the mean of 0.86 s with comparison to 2.29 s for braking reaction (Li et al., 2019). Another study in the driving simulator for the takeover action (TOR) of truck drivers in autonomous driving (level 3) by using eye tracker from 755 TOR found braking pedal reaction time lower than 1.7 s (Lotz et al., 2019). The initial reaction braking delay of 2.8 s is being considered in the calculation of the braking distance in the Italian road design code, which decreases 1% with the speed of the driver.
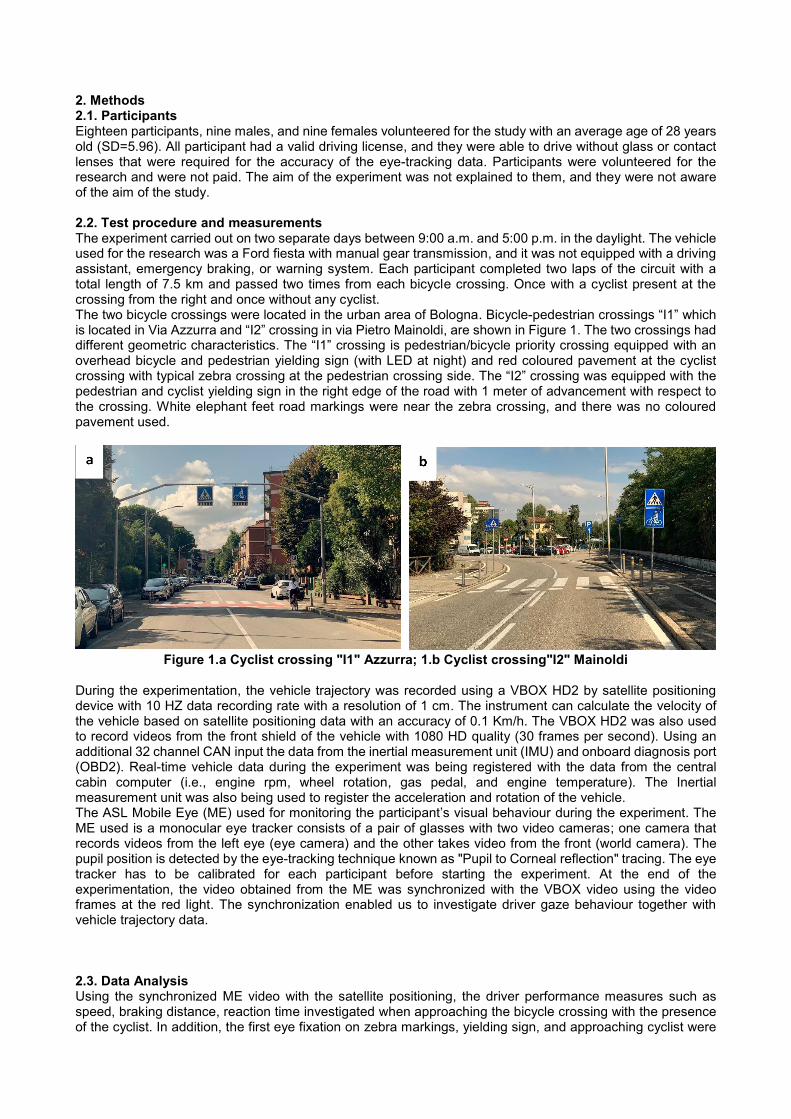
2. Methods 2.1. Participants Eighteen participants, nine males, and nine females volunteered for the study with an average age of 28 years old (SD=5.96). All participant had a valid driving license, and they were able to drive without glass or contact lenses that were required for the accuracy of the eye-tracking data. Participants were volunteered for the research and were not paid. The aim of the experiment was not explained to them, and they were not aware of the aim of the study. 2.2. Test procedure and measurements The experiment carried out on two separate days between 9:00 a.m. and 5:00 p.m. in the daylight. The vehicle used for the research was a Ford fiesta with manual gear transmission, and it was not equipped with a driving assistant, emergency braking, or warning system. Each participant completed two laps of the circuit with a total length of 7.5 km and passed two times from each bicycle crossing. Once with a cyclist present at the crossing from the right and once without any cyclist. The two bicycle crossings were located in the urban area of Bologna. Bicycle-pedestrian crossings “I1” which is located in Via Azzurra and “I2” crossing in via Pietro Mainoldi, are shown in Figure 1. The two crossings had different geometric characteristics. The “I1” crossing is pedestrian/bicycle priority crossing equipped with an overhead bicycle and pedestrian yielding sign (with LED at night) and red coloured pavement at the cyclist crossing with typical zebra crossing at the pedestrian crossing side. The “I2” crossing was equipped with the pedestrian and cyclist yielding sign in the right edge of the road with 1 meter of advancement with respect to the crossing. White elephant feet road markings were near the zebra crossing, and there was no coloured pavement used.
Figure 1.a Cyclist crossing "I1" Azzurra; 1.b Cyclist crossing"I2" Mainoldi
During the experimentation, the vehicle trajectory was recorded using a VBOX HD2 by satellite positioning device with 10 HZ data recording rate with a resolution of 1 cm. The instrument can calculate the velocity of the vehicle based on satellite positioning data with an accuracy of 0.1 Km/h. The VBOX HD2 was also used to record videos from the front shield of the vehicle with 1080 HD quality (30 frames per second). Using an additional 32 channel CAN input the data from the inertial measurement unit (IMU) and onboard diagnosis port (OBD2). Real-time vehicle data during the experiment was being registered with the data from the central cabin computer (i.e., engine rpm, wheel rotation, gas pedal, and engine temperature). The Inertial measurement unit was also being used to register the acceleration and rotation of the vehicle. The ASL Mobile Eye (ME) used for monitoring the participant’s visual behaviour during the experiment. The ME used is a monocular eye tracker consists of a pair of glasses with two video cameras; one camera that records videos from the left eye (eye camera) and the other takes video from the front (world camera). The pupil position is detected by the eye-tracking technique known as "Pupil to Corneal reflection" tracing. The eye tracker has to be calibrated for each participant before starting the experiment. At the end of the experimentation, the video obtained from the ME was synchronized with the VBOX video using the video frames at the red light. The synchronization enabled us to investigate driver gaze behaviour together with vehicle trajectory data. 2.3. Data Analysis Using the synchronized ME video with the satellite positioning, the driver performance measures such as speed, braking distance, reaction time investigated when approaching the bicycle crossing with the presence of the cyclist. In addition, the first eye fixation on zebra markings, yielding sign, and approaching cyclist were
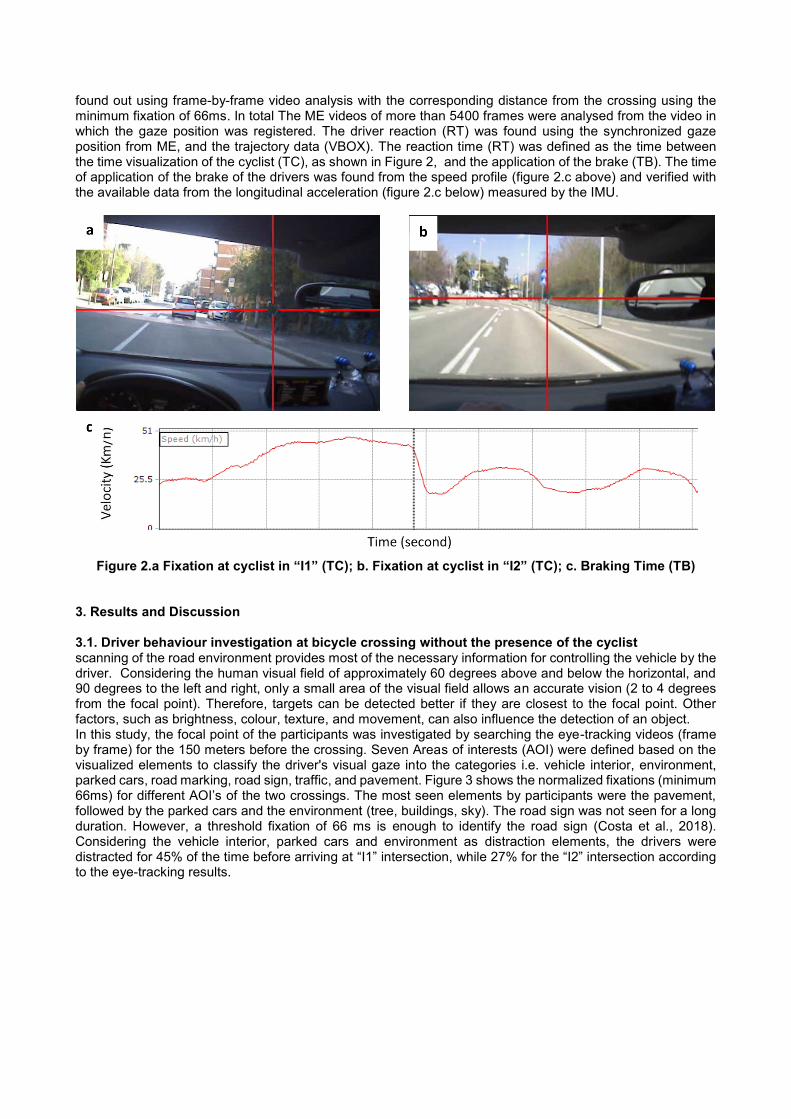
found out using frame-by-frame video analysis with the corresponding distance from the crossing using the minimum fixation of 66ms. In total The ME videos of more than 5400 frames were analysed from the video in which the gaze position was registered. The driver reaction (RT) was found using the synchronized gaze position from ME, and the trajectory data (VBOX). The reaction time (RT) was defined as the time between the time visualization of the cyclist (TC), as shown in Figure 2, and the application of the brake (TB). The time of application of the brake of the drivers was found from the speed profile (figure 2.c above) and verified with the available data from the longitudinal acceleration (figure 2.c below) measured by the IMU.
Figure 2.a Fixation at cyclist in “I1” (TC); b. Fixation at cyclist in “I2” (TC); c. Braking Time (TB)
3. Results and Discussion 3.1. Driver behaviour investigation at bicycle crossing without the presence of the cyclist scanning of the road environment provides most of the necessary information for controlling the vehicle by the driver. Considering the human visual field of approximately 60 degrees above and below the horizontal, and 90 degrees to the left and right, only a small area of the visual field allows an accurate vision (2 to 4 degrees from the focal point). Therefore, targets can be detected better if they are closest to the focal point. Other factors, such as brightness, colour, texture, and movement, can also influence the detection of an object. In this study, the focal point of the participants was investigated by searching the eye-tracking videos (frame by frame) for the 150 meters before the crossing. Seven Areas of interests (AOI) were defined based on the visualized elements to classify the driver's visual gaze into the categories i.e. vehicle interior, environment, parked cars, road marking, road sign, traffic, and pavement. Figure 3 shows the normalized fixations (minimum 66ms) for different AOI’s of the two crossings. The most seen elements by participants were the pavement, followed by the parked cars and the environment (tree, buildings, sky). The road sign was not seen for a long duration. However, a threshold fixation of 66 ms is enough to identify the road sign (Costa et al., 2018). Considering the vehicle interior, parked cars and environment as distraction elements, the drivers were distracted for 45% of the time before arriving at “I1” intersection, while 27% for the “I2” intersection according to the eye-tracking results.
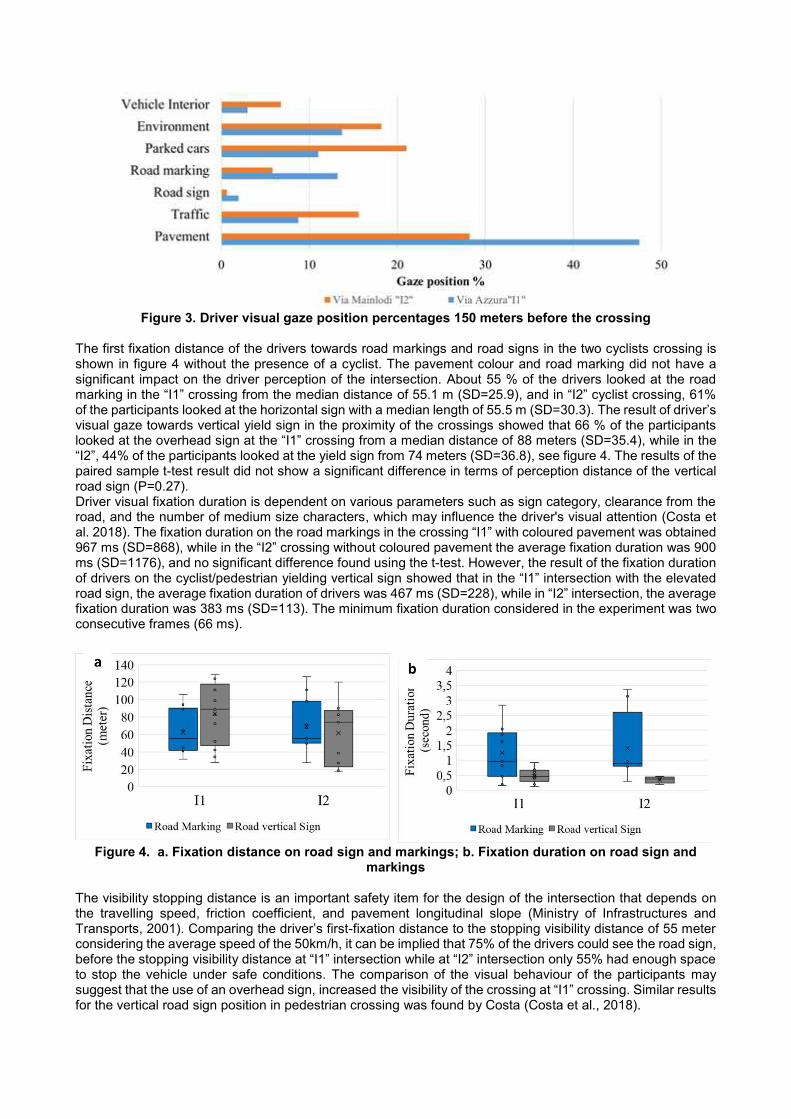
Figure 3. Driver visual gaze position percentages 150 meters before the crossing
The first fixation distance of the drivers towards road markings and road signs in the two cyclists crossing is shown in figure 4 without the presence of a cyclist. The pavement colour and road marking did not have a significant impact on the driver perception of the intersection. About 55 % of the drivers looked at the road marking in the “I1” crossing from the median distance of 55.1 m (SD=25.9), and in “I2” cyclist crossing, 61% of the participants looked at the horizontal sign with a median length of 55.5 m (SD=30.3). The result of driver’s visual gaze towards vertical yield sign in the proximity of the crossings showed that 66 % of the participants looked at the overhead sign at the “I1” crossing from a median distance of 88 meters (SD=35.4), while in the “I2”, 44% of the participants looked at the yield sign from 74 meters (SD=36.8), see figure 4. The results of the paired sample t-test result did not show a significant difference in terms of perception distance of the vertical road sign (P=0.27). Driver visual fixation duration is dependent on various parameters such as sign category, clearance from the road, and the number of medium size characters, which may influence the driver's visual attention (Costa et al. 2018). The fixation duration on the road markings in the crossing “I1” with coloured pavement was obtained 967 ms (SD=868), while in the “I2” crossing without coloured pavement the average fixation duration was 900 ms (SD=1176), and no significant difference found using the t-test. However, the result of the fixation duration of drivers on the cyclist/pedestrian yielding vertical sign showed that in the “I1” intersection with the elevated road sign, the average fixation duration of drivers was 467 ms (SD=228), while in “I2” intersection, the average fixation duration was 383 ms (SD=113). The minimum fixation duration considered in the experiment was two consecutive frames (66 ms).
Figure 4. a. Fixation distance on road sign and markings; b. Fixation duration on road sign and
markings
The visibility stopping distance is an important safety item for the design of the intersection that depends on the travelling speed, friction coefficient, and pavement longitudinal slope (Ministry of Infrastructures and Transports, 2001). Comparing the driver’s first-fixation distance to the stopping visibility distance of 55 meter considering the average speed of the 50km/h, it can be implied that 75% of the drivers could see the road sign, before the stopping visibility distance at “I1” intersection while at “I2” intersection only 55% had enough space to stop the vehicle under safe conditions. The comparison of the visual behaviour of the participants may suggest that the use of an overhead sign, increased the visibility of the crossing at “I1” crossing. Similar results for the vertical road sign position in pedestrian crossing was found by Costa (Costa et al., 2018).
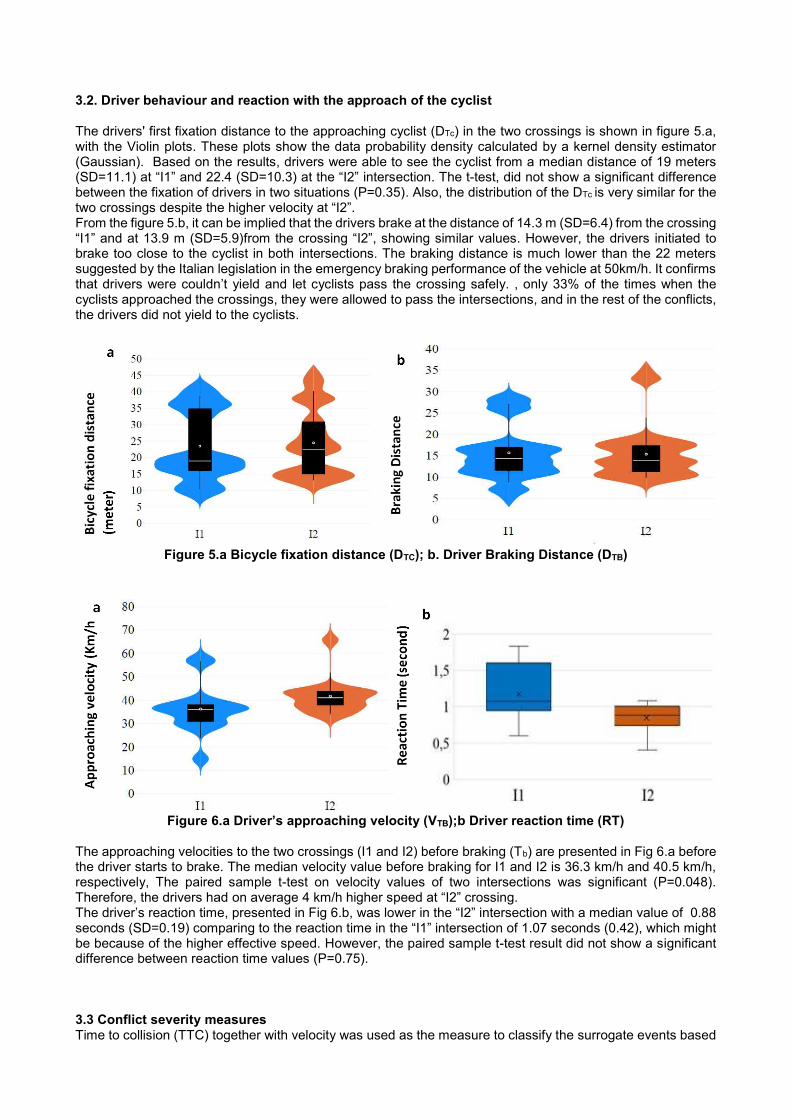
3.2. Driver behaviour and reaction with the approach of the cyclist The drivers' first fixation distance to the approaching cyclist (DTc) in the two crossings is shown in figure 5.a, with the Violin plots. These plots show the data probability density calculated by a kernel density estimator (Gaussian). Based on the results, drivers were able to see the cyclist from a median distance of 19 meters (SD=11.1) at “I1” and 22.4 (SD=10.3) at the “I2” intersection. The t-test, did not show a significant difference between the fixation of drivers in two situations (P=0.35). Also, the distribution of the DTc is very similar for the two crossings despite the higher velocity at “I2”. From the figure 5.b, it can be implied that the drivers brake at the distance of 14.3 m (SD=6.4) from the crossing “I1” and at 13.9 m (SD=5.9)from the crossing “I2”, showing similar values. However, the drivers initiated to brake too close to the cyclist in both intersections. The braking distance is much lower than the 22 meters suggested by the Italian legislation in the emergency braking performance of the vehicle at 50km/h. It confirms that drivers were couldn’t yield and let cyclists pass the crossing safely. , only 33% of the times when the cyclists approached the crossings, they were allowed to pass the intersections, and in the rest of the conflicts, the drivers did not yield to the cyclists.
Figure 5.a Bicycle fixation distance (DTC); b. Driver Braking Distance (DTB)
Figure 6.a Driver’s approaching velocity (VTB);b Driver reaction time (RT)
The approaching velocities to the two crossings (I1 and I2) before braking (Tb) are presented in Fig 6.a before the driver starts to brake. The median velocity value before braking for I1 and I2 is 36.3 km/h and 40.5 km/h, respectively, The paired sample t-test on velocity values of two intersections was significant (P=0.048). Therefore, the drivers had on average 4 km/h higher speed at “I2” crossing. The driver’s reaction time, presented in Fig 6.b, was lower in the “I2” intersection with a median value of 0.88 seconds (SD=0.19) comparing to the reaction time in the “I1” intersection of 1.07 seconds (0.42), which might be because of the higher effective speed. However, the paired sample t-test result did not show a significant difference between reaction time values (P=0.75). 3.3 Conflict severity measures Time to collision (TTC) together with velocity was used as the measure to classify the surrogate events based
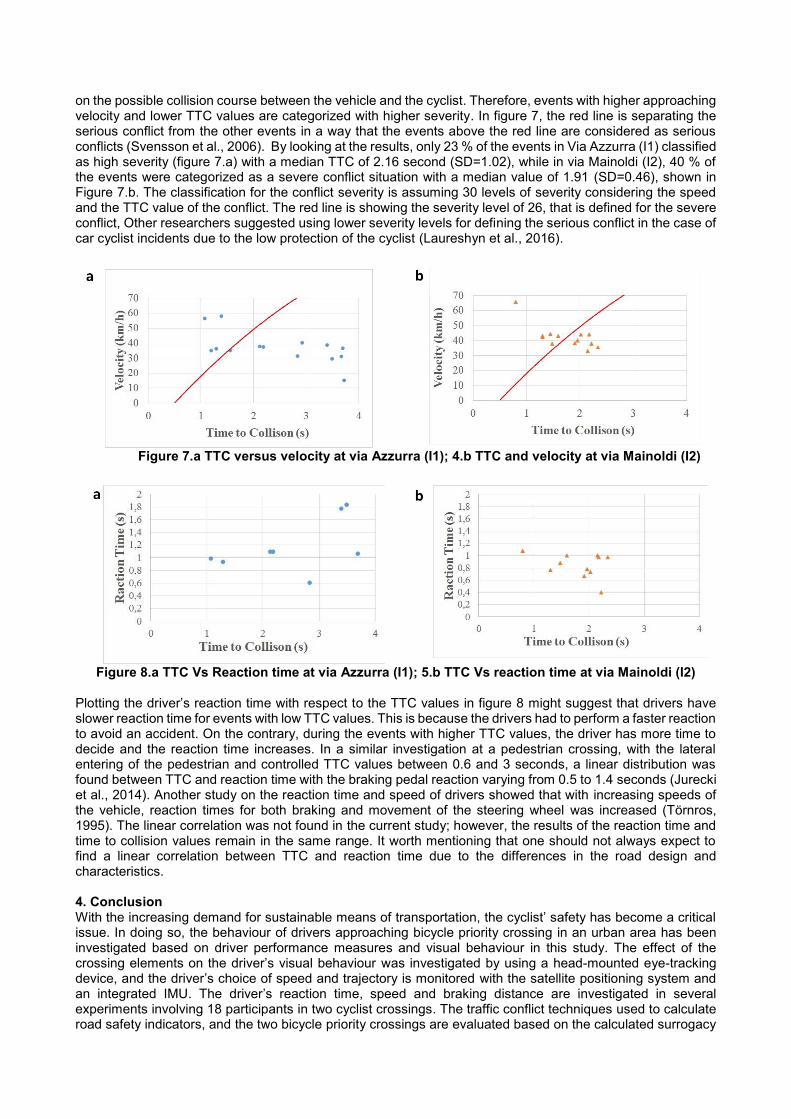
on the possible collision course between the vehicle and the cyclist. Therefore, events with higher approaching velocity and lower TTC values are categorized with higher severity. In figure 7, the red line is separating the serious conflict from the other events in a way that the events above the red line are considered as serious conflicts (Svensson et al., 2006). By looking at the results, only 23 % of the events in Via Azzurra (I1) classified as high severity (figure 7.a) with a median TTC of 2.16 second (SD=1.02), while in via Mainoldi (I2), 40 % of the events were categorized as a severe conflict situation with a median value of 1.91 (SD=0.46), shown in Figure 7.b. The classification for the conflict severity is assuming 30 levels of severity considering the speed and the TTC value of the conflict. The red line is showing the severity level of 26, that is defined for the severe conflict, Other researchers suggested using lower severity levels for defining the serious conflict in the case of car cyclist incidents due to the low protection of the cyclist (Laureshyn et al., 2016).
Figure 7.a TTC versus velocity at via Azzurra (I1); 4.b TTC and velocity at via Mainoldi (I2)
Figure 8.a TTC Vs Reaction time at via Azzurra (I1); 5.b TTC Vs reaction time at via Mainoldi (I2)
Plotting the driver’s reaction time with respect to the TTC values in figure 8 might suggest that drivers have slower reaction time for events with low TTC values. This is because the drivers had to perform a faster reaction to avoid an accident. On the contrary, during the events with higher TTC values, the driver has more time to decide and the reaction time increases. In a similar investigation at a pedestrian crossing, with the lateral entering of the pedestrian and controlled TTC values between 0.6 and 3 seconds, a linear distribution was found between TTC and reaction time with the braking pedal reaction varying from 0.5 to 1.4 seconds (Jurecki et al., 2014). Another study on the reaction time and speed of drivers showed that with increasing speeds of the vehicle, reaction times for both braking and movement of the steering wheel was increased (Törnros, 1995). The linear correlation was not found in the current study; however, the results of the reaction time and time to collision values remain in the same range. It worth mentioning that one should not always expect to find a linear correlation between TTC and reaction time due to the differences in the road design and characteristics. 4. Conclusion With the increasing demand for sustainable means of transportation, the cyclist’ safety has become a critical issue. In doing so, the behaviour of drivers approaching bicycle priority crossing in an urban area has been investigated based on driver performance measures and visual behaviour in this study. The effect of the crossing elements on the driver’s visual behaviour was investigated by using a head-mounted eye-tracking device, and the driver’s choice of speed and trajectory is monitored with the satellite positioning system and an integrated IMU. The driver’s reaction time, speed and braking distance are investigated in several experiments involving 18 participants in two cyclist crossings. The traffic conflict techniques used to calculate road safety indicators, and the two bicycle priority crossings are evaluated based on the calculated surrogacy
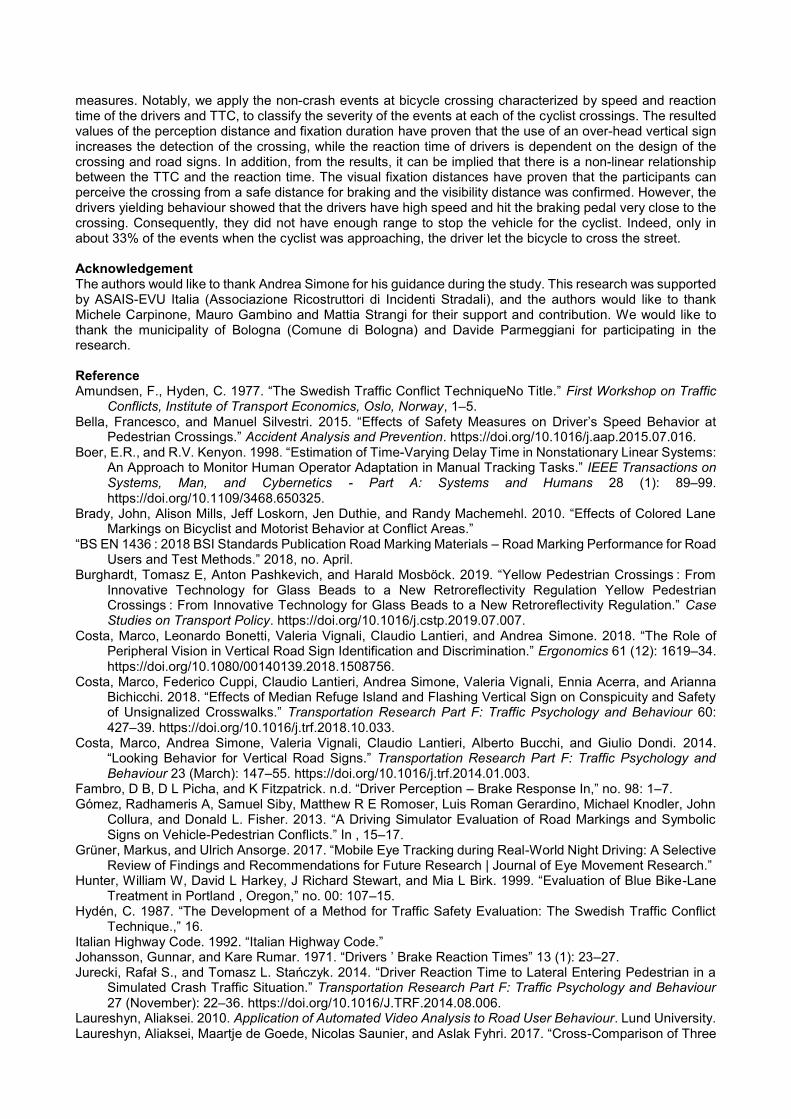
measures. Notably, we apply the non-crash events at bicycle crossing characterized by speed and reaction time of the drivers and TTC, to classify the severity of the events at each of the cyclist crossings. The resulted values of the perception distance and fixation duration have proven that the use of an over-head vertical sign increases the detection of the crossing, while the reaction time of drivers is dependent on the design of the crossing and road signs. In addition, from the results, it can be implied that there is a non-linear relationship between the TTC and the reaction time. The visual fixation distances have proven that the participants can perceive the crossing from a safe distance for braking and the visibility distance was confirmed. However, the drivers yielding behaviour showed that the drivers have high speed and hit the braking pedal very close to the crossing. Consequently, they did not have enough range to stop the vehicle for the cyclist. Indeed, only in about 33% of the events when the cyclist was approaching, the driver let the bicycle to cross the street. Acknowledgement The authors would like to thank Andrea Simone for his guidance during the study. This research was supported by ASAIS-EVU Italia (Associazione Ricostruttori di Incidenti Stradali), and the authors would like to thank Michele Carpinone, Mauro Gambino and Mattia Strangi for their support and contribution. We would like to thank the municipality of Bologna (Comune di Bologna) and Davide Parmeggiani for participating in the research. Reference Amundsen, F., Hyden, C. 1977. “The Swedish Traffic Conflict TechniqueNo Title.” First Workshop on Traffic
Conflicts, Institute of Transport Economics, Oslo, Norway, 1–5. Bella, Francesco, and Manuel Silvestri. 2015. “Effects of Safety Measures on Driver’s Speed Behavior at
Pedestrian Crossings.” Accident Analysis and Prevention. https://doi.org/10.1016/j.aap.2015.07.016. Boer, E.R., and R.V. Kenyon. 1998. “Estimation of Time-Varying Delay Time in Nonstationary Linear Systems:
An Approach to Monitor Human Operator Adaptation in Manual Tracking Tasks.” IEEE Transactions on Systems, Man, and Cybernetics - Part A: Systems and Humans 28 (1): 89–99. https://doi.org/10.1109/3468.650325.
Brady, John, Alison Mills, Jeff Loskorn, Jen Duthie, and Randy Machemehl. 2010. “Effects of Colored Lane Markings on Bicyclist and Motorist Behavior at Conflict Areas.”
“BS EN 1436 : 2018 BSI Standards Publication Road Marking Materials – Road Marking Performance for Road Users and Test Methods.” 2018, no. April.
Burghardt, Tomasz E, Anton Pashkevich, and Harald Mosböck. 2019. “Yellow Pedestrian Crossings : From Innovative Technology for Glass Beads to a New Retroreflectivity Regulation Yellow Pedestrian Crossings : From Innovative Technology for Glass Beads to a New Retroreflectivity Regulation.” Case Studies on Transport Policy. https://doi.org/10.1016/j.cstp.2019.07.007.
Costa, Marco, Leonardo Bonetti, Valeria Vignali, Claudio Lantieri, and Andrea Simone. 2018. “The Role of Peripheral Vision in Vertical Road Sign Identification and Discrimination.” Ergonomics 61 (12): 1619–34. https://doi.org/10.1080/00140139.2018.1508756.
Costa, Marco, Federico Cuppi, Claudio Lantieri, Andrea Simone, Valeria Vignali, Ennia Acerra, and Arianna Bichicchi. 2018. “Effects of Median Refuge Island and Flashing Vertical Sign on Conspicuity and Safety of Unsignalized Crosswalks.” Transportation Research Part F: Traffic Psychology and Behaviour 60: 427–39. https://doi.org/10.1016/j.trf.2018.10.033.
Costa, Marco, Andrea Simone, Valeria Vignali, Claudio Lantieri, Alberto Bucchi, and Giulio Dondi. 2014. “Looking Behavior for Vertical Road Signs.” Transportation Research Part F: Traffic Psychology and Behaviour 23 (March): 147–55. https://doi.org/10.1016/j.trf.2014.01.003.
Fambro, D B, D L Picha, and K Fitzpatrick. n.d. “Driver Perception – Brake Response In,” no. 98: 1–7. Gómez, Radhameris A, Samuel Siby, Matthew R E Romoser, Luis Roman Gerardino, Michael Knodler, John
Collura, and Donald L. Fisher. 2013. “A Driving Simulator Evaluation of Road Markings and Symbolic Signs on Vehicle-Pedestrian Conflicts.” In , 15–17.
Grüner, Markus, and Ulrich Ansorge. 2017. “Mobile Eye Tracking during Real-World Night Driving: A Selective Review of Findings and Recommendations for Future Research | Journal of Eye Movement Research.”
Hunter, William W, David L Harkey, J Richard Stewart, and Mia L Birk. 1999. “Evaluation of Blue Bike-Lane Treatment in Portland , Oregon,” no. 00: 107–15.
Hydén, C. 1987. “The Development of a Method for Traffic Safety Evaluation: The Swedish Traffic Conflict Technique.,” 16.
Italian Highway Code. 1992. “Italian Highway Code.” Johansson, Gunnar, and Kare Rumar. 1971. “Drivers ’ Brake Reaction Times” 13 (1): 23–27. Jurecki, Rafał S., and Tomasz L. Stańczyk. 2014. “Driver Reaction Time to Lateral Entering Pedestrian in a
Simulated Crash Traffic Situation.” Transportation Research Part F: Traffic Psychology and Behaviour 27 (November): 22–36. https://doi.org/10.1016/J.TRF.2014.08.006.
Laureshyn, Aliaksei. 2010. Application of Automated Video Analysis to Road User Behaviour. Lund University. Laureshyn, Aliaksei, Maartje de Goede, Nicolas Saunier, and Aslak Fyhri. 2017. “Cross-Comparison of Three
Surrogate Safety Methods to Diagnose Cyclist Safety Problems at Intersections in Norway.” Accident Analysis & Prevention 105 (August): 11–20. https://doi.org/10.1016/J.AAP.2016.04.035.
Laureshyn, Aliaksei, Maartje De Goede, Nicolas Saunier, and Aslak Fyhri. 2016. “Cross-Comparison of Three Surrogate Safety Methods to Diagnose Cyclist Safety Problems at Intersections in Norway.” Accident Analysis and Prevention, 1–10. https://doi.org/10.1016/j.aap.2016.04.035.
Laureshyn, Aliaksei, Åse Svensson, and Christer Hydén. 2010. “Evaluation of Traffic Safety, Based on Micro-Level Behavioural Data: Theoretical Framework and First Implementation.” Accident Analysis & Prevention 42 (6): 1637–46. https://doi.org/10.1016/J.AAP.2010.03.021.
Li, Xiaomeng, Andry Rakotonirainy, and Xuedong Yan. 2019. “How Do Drivers Avoid Collisions? A Driving Simulator-Based Study.” Journal of Safety Research 70 (September): 89–96. https://doi.org/10.1016/J.JSR.2019.05.002.
London, Mayor of. 2016. “London Cycling Design Standards.” Vol. 5-Bicycle. Lotz, Alexander, and Sarah Weissenberger. 2019. “Predicting Take-Over Times of Truck Drivers in Conditional
Autonomous Driving,” July, 329–38. https://doi.org/10.1007/978-3-319-93885-1_30. Michon, John A. n.d. “A CRITICAL VIEW OF DRIVER BEHAVIOR MODELS : WHAT DO WE KNOW , WHAT
SHOULD WE DO ?,” 516–20. Ministry of Infrastructures and Transports. 2001. “NORME FUNZIONALI E GEOMETRICHE PER LA
COSTRUZIONE DELLE STRADE.” Morrison, Christopher N, Jason Thompson, Michelle C Kondo, and Ben Beck. 2019. “On-Road Bicycle Lane
Types , Roadway Characteristics , and Risks for Bicycle Crashes.” Accident Analysis and Prevention 123 (November 2018): 123–31. https://doi.org/10.1016/j.aap.2018.11.017.
Pomarjanschi, Laura, Michael Dorr, and Erhardt Barth. 2012. “Gaze Guidance Reduces the Number of Collisions with Pedestrians in a Driving Simulator.” ACM Trans. Interact. Intell. Syst. 1 (2): 8:1--8:14. https://doi.org/10.1145/2070719.2070721.
RoSPA. 2017. “Cycling Accidents” 0121 (October): 1–3. Samuel, Siby, Matthew R. E. Romoser, Luis Roman Gerardino, Malek Hamid, Radhameris A. Gómez, Michael
A. Knodler, John Collura, and Donald L. Fisher. 2013. “Effect of Advance Yield Markings and Symbolic Signs on Vehicle–Pedestrian Conflicts.” Transportation Research Record: Journal of the Transportation Research Board 2393 (1): 139–46. https://doi.org/10.3141/2393-16.
Sayed, T. 2000. “ESTIMATING THE SAFETY OF UNSIGNALIZED INTERSECTIONS USING TRAFFIC CONFLICTS,” January.
Singh, Sang. 2015. “Critical Reasons for Crashes Investigated in the National Motor Vehicle Crash Causation Survey. (Traffic Safety Facts Crash•Stats). Washington, DC: National Highway Traffic Safety Administration.” 13th International IEEE Conference on Intelligent Transportation Systems 812 115 (February): 2–3.
Svensson, Åse. 1998. “Svensson, Å., 1998. A Method for Analysing the Traffic Process in a SafetyPerspective.” University of Lund, Department of Traffic Planning and Engineering.
Svensson, Åse, and Christer Hydén. 2006. “Estimating the Severity of Safety Related Behaviour.” Accident Analysis and Prevention 38 (2): 379–85. https://doi.org/10.1016/j.aap.2005.10.009.
Törnros, Jan. 1995. “Effect of Driving Speed on Reaction Time during Motorway Driving.” Accident Analysis and Prevention 27 (4): 435–42. https://doi.org/10.1016/0001-4575(94)00084-Y.
Traffic, Safety, and Basic Facts. 2018. “Traffic Safety Basic Facts on Cyclists, European Commission, Directorate General for Transport,” no. June.
Vignali, Valeria, Claudio Lantieri, Marco Costa, Nicola Palena, and Andrea Simone. 2018. “Fixation Distance and Fixation Duration to Vertical Road Signs.” Applied Ergonomics 69 (November 2016): 48–57. https://doi.org/10.1016/j.apergo.2017.12.017.
Winsum, Wim van. 1996. “A Model of Driver Behaviour Adaptation.” In Proceedings of the Human Factors and Ergonomics Society Europe Chapter Annual Meeting in Haren, The Netherlands, 196.
World Health Organization 2018. 2018. “Global Status Report on Road Safety 2018.” http://e-journal.uajy.ac.id/14649/1/JURNAL.pdf.
Annexe
175
Annex VI. Case Study VI:
Authors:
Marco Costa, Claudio Lantieri, Valeria Vignali, Navid Ghasemi, Andrea Simone
Name of the Publication:
Evaluation of an integrated lighting-warning system on motorists’ yielding at unsignalized
crosswalks during nighttime
Publisher: Transportation part F
Series:
Field of research: Traffic psychology and behaviour
Manuscript submitted : Accepted :
Conference Paper Journal Paper
Summary:
In this paper, the effects of an integrated lighting warning system at a pedestrian crossing conspicuity
of zebra markings displacement is studied with different design solutions. The LED curb light and
the enhanced lighting system was improving significantly the yielding behaviour o the participants.
The frequency of drivers’ yielding was computed for each condition. A significant increase for
yielding compliance was recorded from standard road lighting to enhanced dedicated lighting, and
from enhanced dedicated lighting to the seventh condition with the flashing beacons and the flashing
in-curb LED strips activated .
Objective: Pedestrian crossing safety investigation
Driving Task: Natural driving
scenario:
Investigated measures:
Velocity, road sign perception distance, Fixation duration
• Physiological Measurement Eye tracking electroencephalogram (EEG)
• Vehicle Position GPS Traffic simulation IMU
• Vehicle States OBDII Simuate vehicle state
Simulator study Real Road test
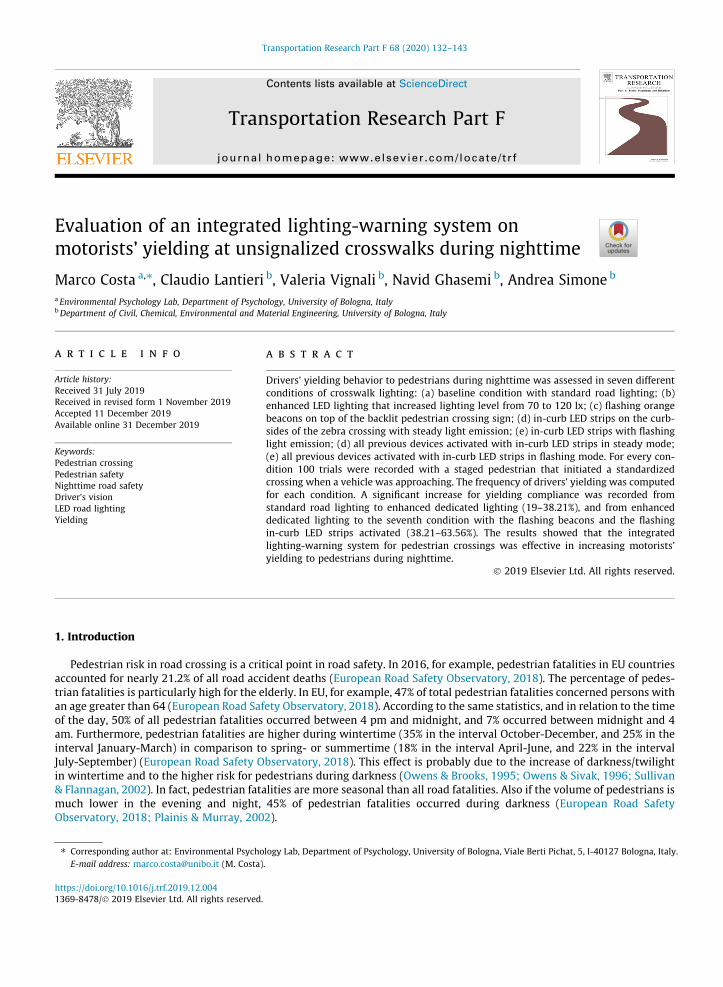
Evaluation of an integrated lighting-warning system onmotorists’ yielding at unsignalized crosswalks during nighttime
Marco Costa a,⇑, Claudio Lantieri b, Valeria Vignali b, Navid Ghasemi b, Andrea Simone b
a Environmental Psychology Lab, Department of Psychology, University of Bologna, ItalybDepartment of Civil, Chemical, Environmental and Material Engineering, University of Bologna, Italy
a r t i c l e i n f o
Article history:
Received 31 July 2019
Received in revised form 1 November 2019
Accepted 11 December 2019
Available online 31 December 2019
Keywords:
Pedestrian crossing
Pedestrian safety
Nighttime road safety
Driver’s vision
LED road lighting
Yielding
a b s t r a c t
Drivers’ yielding behavior to pedestrians during nighttime was assessed in seven different
conditions of crosswalk lighting: (a) baseline condition with standard road lighting; (b)
enhanced LED lighting that increased lighting level from 70 to 120 lx; (c) flashing orange
beacons on top of the backlit pedestrian crossing sign; (d) in-curb LED strips on the curb-
sides of the zebra crossing with steady light emission; (e) in-curb LED strips with flashing
light emission; (d) all previous devices activated with in-curb LED strips in steady mode;
(e) all previous devices activated with in-curb LED strips in flashing mode. For every con-
dition 100 trials were recorded with a staged pedestrian that initiated a standardized
crossing when a vehicle was approaching. The frequency of drivers’ yielding was computed
for each condition. A significant increase for yielding compliance was recorded from
standard road lighting to enhanced dedicated lighting (19–38.21%), and from enhanced
dedicated lighting to the seventh condition with the flashing beacons and the flashing
in-curb LED strips activated (38.21–63.56%). The results showed that the integrated
lighting-warning system for pedestrian crossings was effective in increasing motorists’
yielding to pedestrians during nighttime.
2019 Elsevier Ltd. All rights reserved.
1. Introduction
Pedestrian risk in road crossing is a critical point in road safety. In 2016, for example, pedestrian fatalities in EU countries
accounted for nearly 21.2% of all road accident deaths (European Road Safety Observatory, 2018). The percentage of pedes-
trian fatalities is particularly high for the elderly. In EU, for example, 47% of total pedestrian fatalities concerned persons with
an age greater than 64 (European Road Safety Observatory, 2018). According to the same statistics, and in relation to the time
of the day, 50% of all pedestrian fatalities occurred between 4 pm and midnight, and 7% occurred between midnight and 4
am. Furthermore, pedestrian fatalities are higher during wintertime (35% in the interval October-December, and 25% in the
interval January-March) in comparison to spring- or summertime (18% in the interval April-June, and 22% in the interval
July-September) (European Road Safety Observatory, 2018). This effect is probably due to the increase of darkness/twilight
in wintertime and to the higher risk for pedestrians during darkness (Owens & Brooks, 1995; Owens & Sivak, 1996; Sullivan
& Flannagan, 2002). In fact, pedestrian fatalities are more seasonal than all road fatalities. Also if the volume of pedestrians is
much lower in the evening and night, 45% of pedestrian fatalities occurred during darkness (European Road Safety
Observatory, 2018; Plainis & Murray, 2002).
https://doi.org/10.1016/j.trf.2019.12.004
1369-8478/ 2019 Elsevier Ltd. All rights reserved.
⇑ Corresponding author at: Environmental Psychology Lab, Department of Psychology, University of Bologna, Viale Berti Pichat, 5, I-40127 Bologna, Italy.
E-mail address: [email protected] (M. Costa).
Transportation Research Part F 68 (2020) 132–143
Contents lists available at ScienceDirect
Transportation Research Part F
journal homepage: www.elsevier .com/locate / t r f
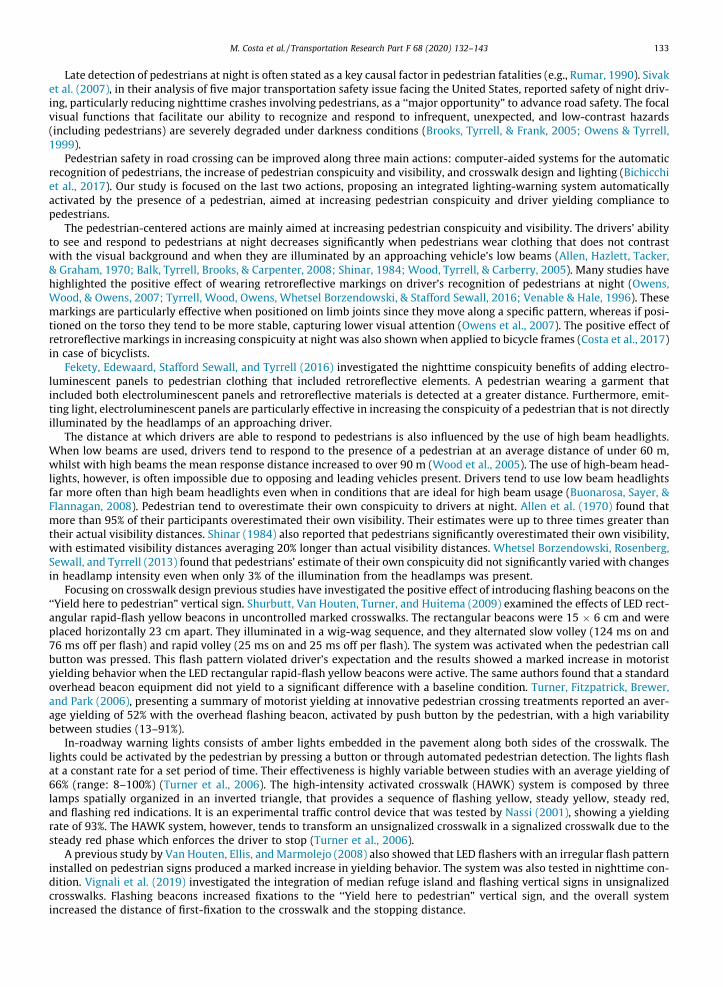
Late detection of pedestrians at night is often stated as a key causal factor in pedestrian fatalities (e.g., Rumar, 1990). Sivak
et al. (2007), in their analysis of five major transportation safety issue facing the United States, reported safety of night driv-
ing, particularly reducing nighttime crashes involving pedestrians, as a ‘‘major opportunity” to advance road safety. The focal
visual functions that facilitate our ability to recognize and respond to infrequent, unexpected, and low-contrast hazards
(including pedestrians) are severely degraded under darkness conditions (Brooks, Tyrrell, & Frank, 2005; Owens & Tyrrell,
1999).
Pedestrian safety in road crossing can be improved along three main actions: computer-aided systems for the automatic
recognition of pedestrians, the increase of pedestrian conspicuity and visibility, and crosswalk design and lighting (Bichicchi
et al., 2017). Our study is focused on the last two actions, proposing an integrated lighting-warning system automatically
activated by the presence of a pedestrian, aimed at increasing pedestrian conspicuity and driver yielding compliance to
pedestrians.
The pedestrian-centered actions are mainly aimed at increasing pedestrian conspicuity and visibility. The drivers’ ability
to see and respond to pedestrians at night decreases significantly when pedestrians wear clothing that does not contrast
with the visual background and when they are illuminated by an approaching vehicle’s low beams (Allen, Hazlett, Tacker,
& Graham, 1970; Balk, Tyrrell, Brooks, & Carpenter, 2008; Shinar, 1984; Wood, Tyrrell, & Carberry, 2005). Many studies have
highlighted the positive effect of wearing retroreflective markings on driver’s recognition of pedestrians at night (Owens,
Wood, & Owens, 2007; Tyrrell, Wood, Owens, Whetsel Borzendowski, & Stafford Sewall, 2016; Venable & Hale, 1996). These
markings are particularly effective when positioned on limb joints since they move along a specific pattern, whereas if posi-
tioned on the torso they tend to be more stable, capturing lower visual attention (Owens et al., 2007). The positive effect of
retroreflective markings in increasing conspicuity at night was also shownwhen applied to bicycle frames (Costa et al., 2017)
in case of bicyclists.
Fekety, Edewaard, Stafford Sewall, and Tyrrell (2016) investigated the nighttime conspicuity benefits of adding electro-
luminescent panels to pedestrian clothing that included retroreflective elements. A pedestrian wearing a garment that
included both electroluminescent panels and retroreflective materials is detected at a greater distance. Furthermore, emit-
ting light, electroluminescent panels are particularly effective in increasing the conspicuity of a pedestrian that is not directly
illuminated by the headlamps of an approaching driver.
The distance at which drivers are able to respond to pedestrians is also influenced by the use of high beam headlights.
When low beams are used, drivers tend to respond to the presence of a pedestrian at an average distance of under 60 m,
whilst with high beams the mean response distance increased to over 90 m (Wood et al., 2005). The use of high-beam head-
lights, however, is often impossible due to opposing and leading vehicles present. Drivers tend to use low beam headlights
far more often than high beam headlights even when in conditions that are ideal for high beam usage (Buonarosa, Sayer, &
Flannagan, 2008). Pedestrian tend to overestimate their own conspicuity to drivers at night. Allen et al. (1970) found that
more than 95% of their participants overestimated their own visibility. Their estimates were up to three times greater than
their actual visibility distances. Shinar (1984) also reported that pedestrians significantly overestimated their own visibility,
with estimated visibility distances averaging 20% longer than actual visibility distances. Whetsel Borzendowski, Rosenberg,
Sewall, and Tyrrell (2013) found that pedestrians’ estimate of their own conspicuity did not significantly varied with changes
in headlamp intensity even when only 3% of the illumination from the headlamps was present.
Focusing on crosswalk design previous studies have investigated the positive effect of introducing flashing beacons on the
‘‘Yield here to pedestrian” vertical sign. Shurbutt, Van Houten, Turner, and Huitema (2009) examined the effects of LED rect-
angular rapid-flash yellow beacons in uncontrolled marked crosswalks. The rectangular beacons were 15 6 cm and were
placed horizontally 23 cm apart. They illuminated in a wig-wag sequence, and they alternated slow volley (124 ms on and
76 ms off per flash) and rapid volley (25 ms on and 25 ms off per flash). The system was activated when the pedestrian call
button was pressed. This flash pattern violated driver’s expectation and the results showed a marked increase in motorist
yielding behavior when the LED rectangular rapid-flash yellow beacons were active. The same authors found that a standard
overhead beacon equipment did not yield to a significant difference with a baseline condition. Turner, Fitzpatrick, Brewer,
and Park (2006), presenting a summary of motorist yielding at innovative pedestrian crossing treatments reported an aver-
age yielding of 52% with the overhead flashing beacon, activated by push button by the pedestrian, with a high variability
between studies (13–91%).
In-roadway warning lights consists of amber lights embedded in the pavement along both sides of the crosswalk. The
lights could be activated by the pedestrian by pressing a button or through automated pedestrian detection. The lights flash
at a constant rate for a set period of time. Their effectiveness is highly variable between studies with an average yielding of
66% (range: 8–100%) (Turner et al., 2006). The high-intensity activated crosswalk (HAWK) system is composed by three
lamps spatially organized in an inverted triangle, that provides a sequence of flashing yellow, steady yellow, steady red,
and flashing red indications. It is an experimental traffic control device that was tested by Nassi (2001), showing a yielding
rate of 93%. The HAWK system, however, tends to transform an unsignalized crosswalk in a signalized crosswalk due to the
steady red phase which enforces the driver to stop (Turner et al., 2006).
A previous study by Van Houten, Ellis, and Marmolejo (2008) also showed that LED flashers with an irregular flash pattern
installed on pedestrian signs produced a marked increase in yielding behavior. The system was also tested in nighttime con-
dition. Vignali et al. (2019) investigated the integration of median refuge island and flashing vertical signs in unsignalized
crosswalks. Flashing beacons increased fixations to the ‘‘Yield here to pedestrian” vertical sign, and the overall system
increased the distance of first-fixation to the crosswalk and the stopping distance.
M. Costa et al. / Transportation Research Part F 68 (2020) 132–143 133
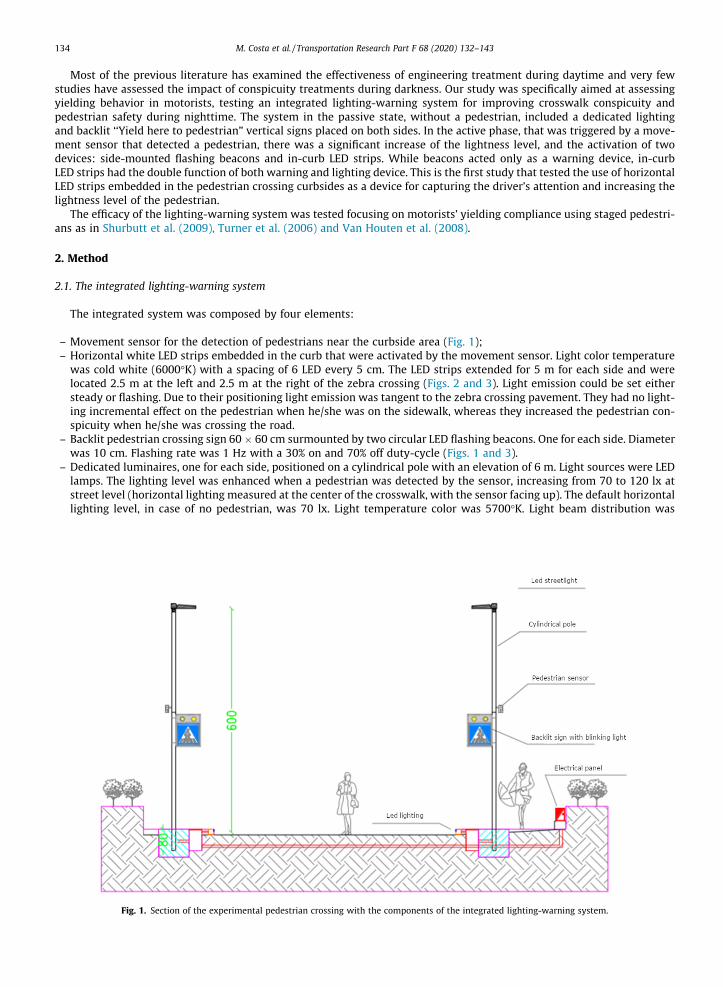
Most of the previous literature has examined the effectiveness of engineering treatment during daytime and very few
studies have assessed the impact of conspicuity treatments during darkness. Our study was specifically aimed at assessing
yielding behavior in motorists, testing an integrated lighting-warning system for improving crosswalk conspicuity and
pedestrian safety during nighttime. The system in the passive state, without a pedestrian, included a dedicated lighting
and backlit ‘‘Yield here to pedestrian” vertical signs placed on both sides. In the active phase, that was triggered by a move-
ment sensor that detected a pedestrian, there was a significant increase of the lightness level, and the activation of two
devices: side-mounted flashing beacons and in-curb LED strips. While beacons acted only as a warning device, in-curb
LED strips had the double function of both warning and lighting device. This is the first study that tested the use of horizontal
LED strips embedded in the pedestrian crossing curbsides as a device for capturing the driver’s attention and increasing the
lightness level of the pedestrian.
The efficacy of the lighting-warning system was tested focusing on motorists’ yielding compliance using staged pedestri-
ans as in Shurbutt et al. (2009), Turner et al. (2006) and Van Houten et al. (2008).
2. Method
2.1. The integrated lighting-warning system
The integrated system was composed by four elements:
– Movement sensor for the detection of pedestrians near the curbside area (Fig. 1);
– Horizontal white LED strips embedded in the curb that were activated by the movement sensor. Light color temperature
was cold white (6000K) with a spacing of 6 LED every 5 cm. The LED strips extended for 5 m for each side and were
located 2.5 m at the left and 2.5 m at the right of the zebra crossing (Figs. 2 and 3). Light emission could be set either
steady or flashing. Due to their positioning light emission was tangent to the zebra crossing pavement. They had no light-
ing incremental effect on the pedestrian when he/she was on the sidewalk, whereas they increased the pedestrian con-
spicuity when he/she was crossing the road.
– Backlit pedestrian crossing sign 60 60 cm surmounted by two circular LED flashing beacons. One for each side. Diameter
was 10 cm. Flashing rate was 1 Hz with a 30% on and 70% off duty-cycle (Figs. 1 and 3).
– Dedicated luminaires, one for each side, positioned on a cylindrical pole with an elevation of 6 m. Light sources were LED
lamps. The lighting level was enhanced when a pedestrian was detected by the sensor, increasing from 70 to 120 lx at
street level (horizontal lighting measured at the center of the crosswalk, with the sensor facing up). The default horizontal
lighting level, in case of no pedestrian, was 70 lx. Light temperature color was 5700K. Light beam distribution was
Fig. 1. Section of the experimental pedestrian crossing with the components of the integrated lighting-warning system.
134 M. Costa et al. / Transportation Research Part F 68 (2020) 132–143
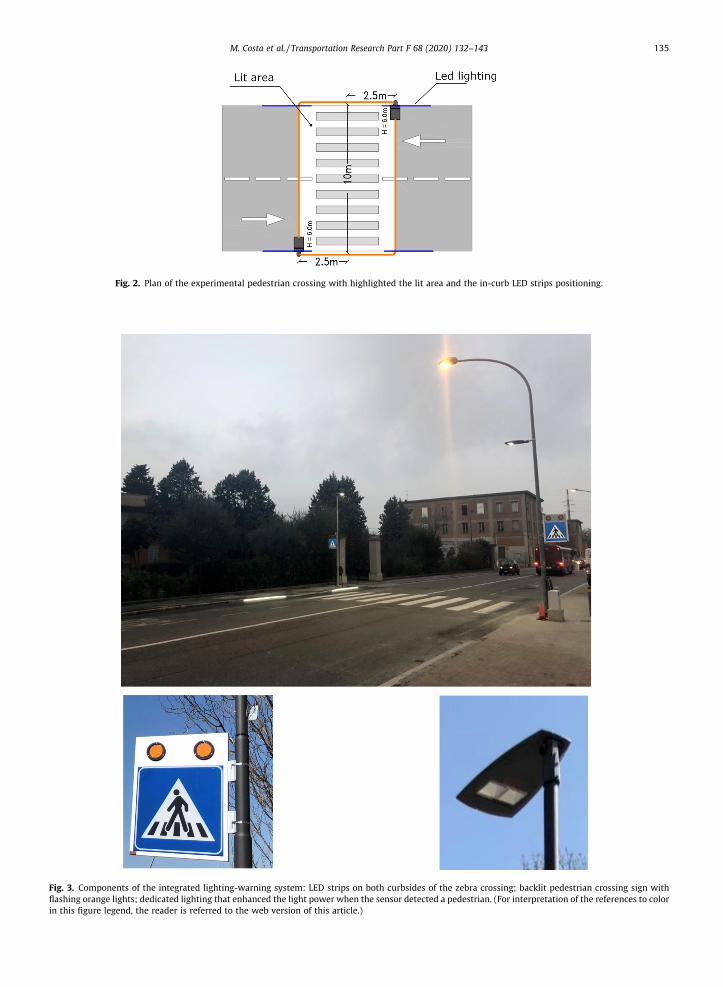
Fig. 2. Plan of the experimental pedestrian crossing with highlighted the lit area and the in-curb LED strips positioning.
Fig. 3. Components of the integrated lighting-warning system: LED strips on both curbsides of the zebra crossing; backlit pedestrian crossing sign with
flashing orange lights; dedicated lighting that enhanced the light power when the sensor detected a pedestrian. (For interpretation of the references to color
in this figure legend, the reader is referred to the web version of this article.)
M. Costa et al. / Transportation Research Part F 68 (2020) 132–143 135
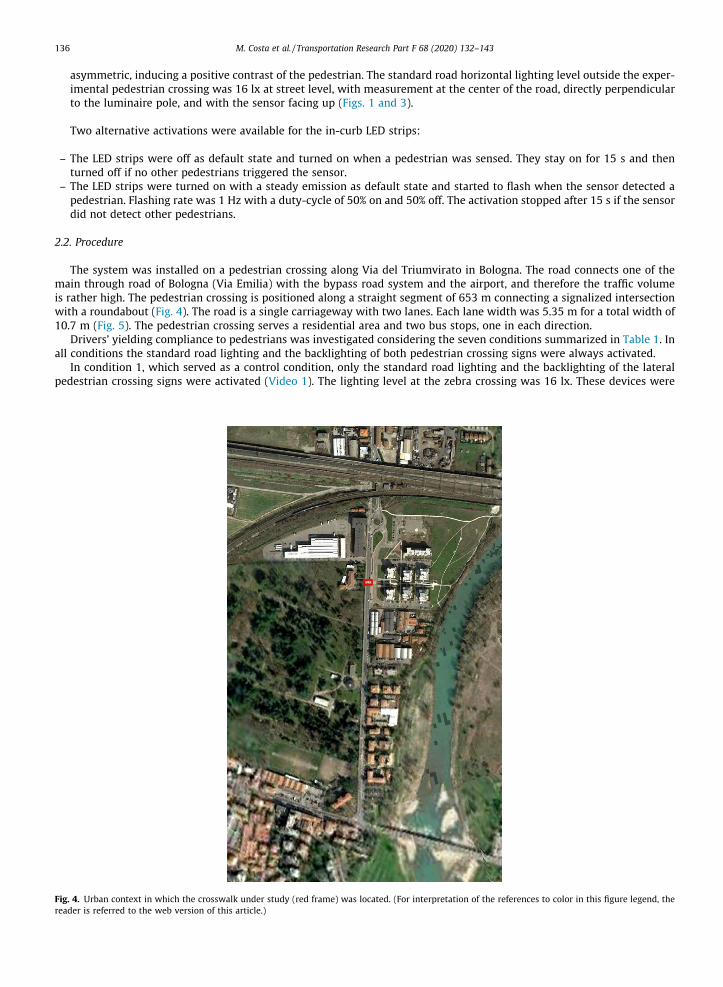
asymmetric, inducing a positive contrast of the pedestrian. The standard road horizontal lighting level outside the exper-
imental pedestrian crossing was 16 lx at street level, with measurement at the center of the road, directly perpendicular
to the luminaire pole, and with the sensor facing up (Figs. 1 and 3).
Two alternative activations were available for the in-curb LED strips:
– The LED strips were off as default state and turned on when a pedestrian was sensed. They stay on for 15 s and then
turned off if no other pedestrians triggered the sensor.
– The LED strips were turned on with a steady emission as default state and started to flash when the sensor detected a
pedestrian. Flashing rate was 1 Hz with a duty-cycle of 50% on and 50% off. The activation stopped after 15 s if the sensor
did not detect other pedestrians.
2.2. Procedure
The system was installed on a pedestrian crossing along Via del Triumvirato in Bologna. The road connects one of the
main through road of Bologna (Via Emilia) with the bypass road system and the airport, and therefore the traffic volume
is rather high. The pedestrian crossing is positioned along a straight segment of 653 m connecting a signalized intersection
with a roundabout (Fig. 4). The road is a single carriageway with two lanes. Each lane width was 5.35 m for a total width of
10.7 m (Fig. 5). The pedestrian crossing serves a residential area and two bus stops, one in each direction.
Drivers’ yielding compliance to pedestrians was investigated considering the seven conditions summarized in Table 1. In
all conditions the standard road lighting and the backlighting of both pedestrian crossing signs were always activated.
In condition 1, which served as a control condition, only the standard road lighting and the backlighting of the lateral
pedestrian crossing signs were activated (Video 1). The lighting level at the zebra crossing was 16 lx. These devices were
Fig. 4. Urban context in which the crosswalk under study (red frame) was located. (For interpretation of the references to color in this figure legend, the
reader is referred to the web version of this article.)
136 M. Costa et al. / Transportation Research Part F 68 (2020) 132–143
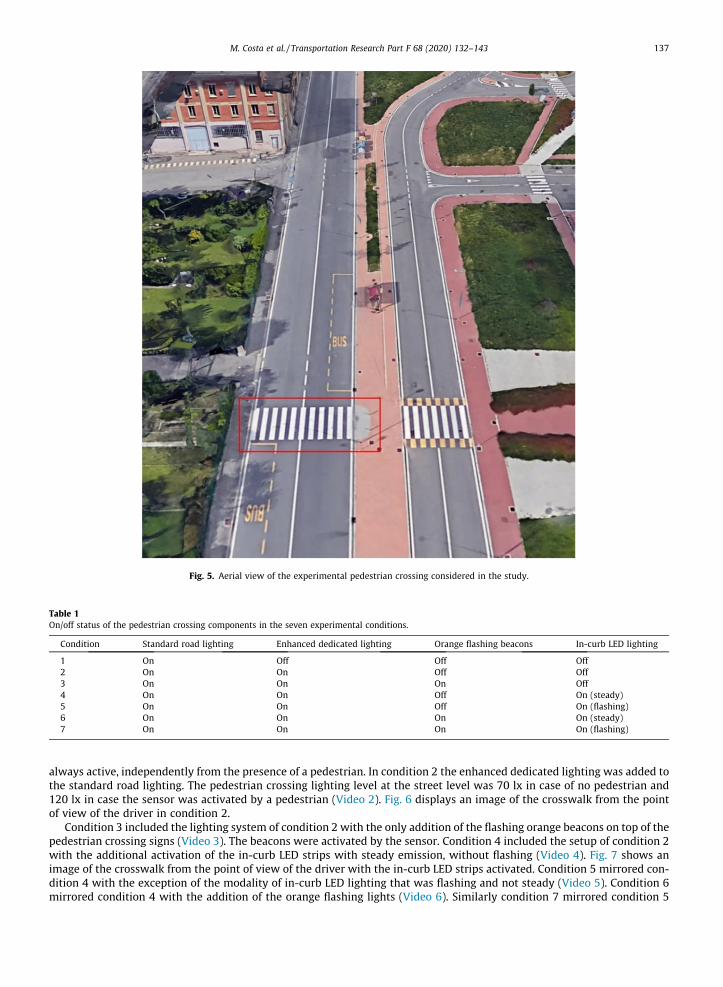
always active, independently from the presence of a pedestrian. In condition 2 the enhanced dedicated lighting was added to
the standard road lighting. The pedestrian crossing lighting level at the street level was 70 lx in case of no pedestrian and
120 lx in case the sensor was activated by a pedestrian (Video 2). Fig. 6 displays an image of the crosswalk from the point
of view of the driver in condition 2.
Condition 3 included the lighting system of condition 2 with the only addition of the flashing orange beacons on top of the
pedestrian crossing signs (Video 3). The beacons were activated by the sensor. Condition 4 included the setup of condition 2
with the additional activation of the in-curb LED strips with steady emission, without flashing (Video 4). Fig. 7 shows an
image of the crosswalk from the point of view of the driver with the in-curb LED strips activated. Condition 5 mirrored con-
dition 4 with the exception of the modality of in-curb LED lighting that was flashing and not steady (Video 5). Condition 6
mirrored condition 4 with the addition of the orange flashing lights (Video 6). Similarly condition 7 mirrored condition 5
Fig. 5. Aerial view of the experimental pedestrian crossing considered in the study.
Table 1
On/off status of the pedestrian crossing components in the seven experimental conditions.
Condition Standard road lighting Enhanced dedicated lighting Orange flashing beacons In-curb LED lighting
1 On Off Off Off
2 On On Off Off
3 On On On Off
4 On On Off On (steady)
5 On On Off On (flashing)
6 On On On On (steady)
7 On On On On (flashing)
M. Costa et al. / Transportation Research Part F 68 (2020) 132–143 137
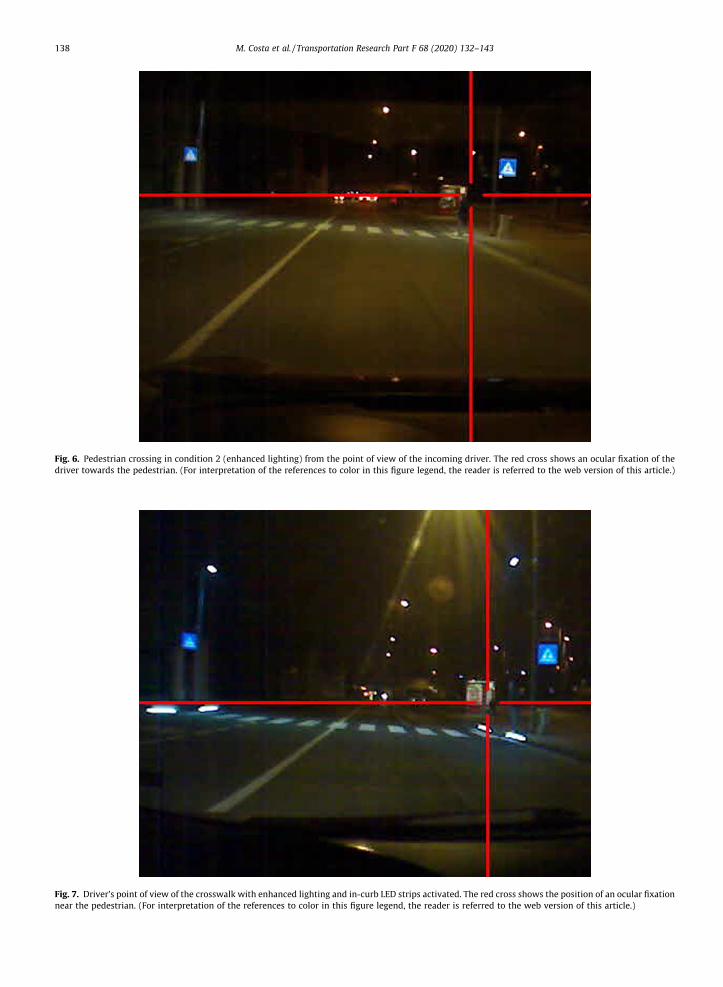
Fig. 6. Pedestrian crossing in condition 2 (enhanced lighting) from the point of view of the incoming driver. The red cross shows an ocular fixation of the
driver towards the pedestrian. (For interpretation of the references to color in this figure legend, the reader is referred to the web version of this article.)
Fig. 7. Driver’s point of view of the crosswalk with enhanced lighting and in-curb LED strips activated. The red cross shows the position of an ocular fixation
near the pedestrian. (For interpretation of the references to color in this figure legend, the reader is referred to the web version of this article.)
138 M. Costa et al. / Transportation Research Part F 68 (2020) 132–143
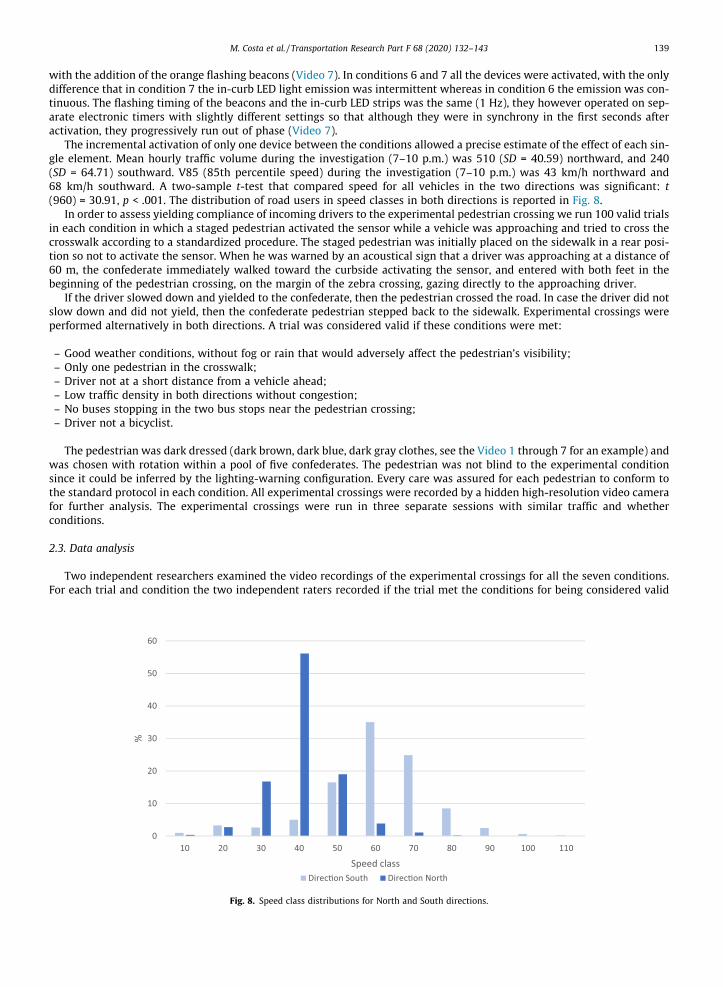
with the addition of the orange flashing beacons (Video 7). In conditions 6 and 7 all the devices were activated, with the only
difference that in condition 7 the in-curb LED light emission was intermittent whereas in condition 6 the emission was con-
tinuous. The flashing timing of the beacons and the in-curb LED strips was the same (1 Hz), they however operated on sep-
arate electronic timers with slightly different settings so that although they were in synchrony in the first seconds after
activation, they progressively run out of phase (Video 7).
The incremental activation of only one device between the conditions allowed a precise estimate of the effect of each sin-
gle element. Mean hourly traffic volume during the investigation (7–10 p.m.) was 510 (SD = 40.59) northward, and 240
(SD = 64.71) southward. V85 (85th percentile speed) during the investigation (7–10 p.m.) was 43 km/h northward and
68 km/h southward. A two-sample t-test that compared speed for all vehicles in the two directions was significant: t
(960) = 30.91, p < .001. The distribution of road users in speed classes in both directions is reported in Fig. 8.
In order to assess yielding compliance of incoming drivers to the experimental pedestrian crossing we run 100 valid trials
in each condition in which a staged pedestrian activated the sensor while a vehicle was approaching and tried to cross the
crosswalk according to a standardized procedure. The staged pedestrian was initially placed on the sidewalk in a rear posi-
tion so not to activate the sensor. When he was warned by an acoustical sign that a driver was approaching at a distance of
60 m, the confederate immediately walked toward the curbside activating the sensor, and entered with both feet in the
beginning of the pedestrian crossing, on the margin of the zebra crossing, gazing directly to the approaching driver.
If the driver slowed down and yielded to the confederate, then the pedestrian crossed the road. In case the driver did not
slow down and did not yield, then the confederate pedestrian stepped back to the sidewalk. Experimental crossings were
performed alternatively in both directions. A trial was considered valid if these conditions were met:
– Good weather conditions, without fog or rain that would adversely affect the pedestrian’s visibility;
– Only one pedestrian in the crosswalk;
– Driver not at a short distance from a vehicle ahead;
– Low traffic density in both directions without congestion;
– No buses stopping in the two bus stops near the pedestrian crossing;
– Driver not a bicyclist.
The pedestrian was dark dressed (dark brown, dark blue, dark gray clothes, see the Video 1 through 7 for an example) and
was chosen with rotation within a pool of five confederates. The pedestrian was not blind to the experimental condition
since it could be inferred by the lighting-warning configuration. Every care was assured for each pedestrian to conform to
the standard protocol in each condition. All experimental crossings were recorded by a hidden high-resolution video camera
for further analysis. The experimental crossings were run in three separate sessions with similar traffic and whether
conditions.
2.3. Data analysis
Two independent researchers examined the video recordings of the experimental crossings for all the seven conditions.
For each trial and condition the two independent raters recorded if the trial met the conditions for being considered valid
0
10
20
30
40
50
60
10 20 30 40 50 60 70 80 90 100 110
%
Speed class
Direcon South Direcon North
Fig. 8. Speed class distributions for North and South directions.
M. Costa et al. / Transportation Research Part F 68 (2020) 132–143 139
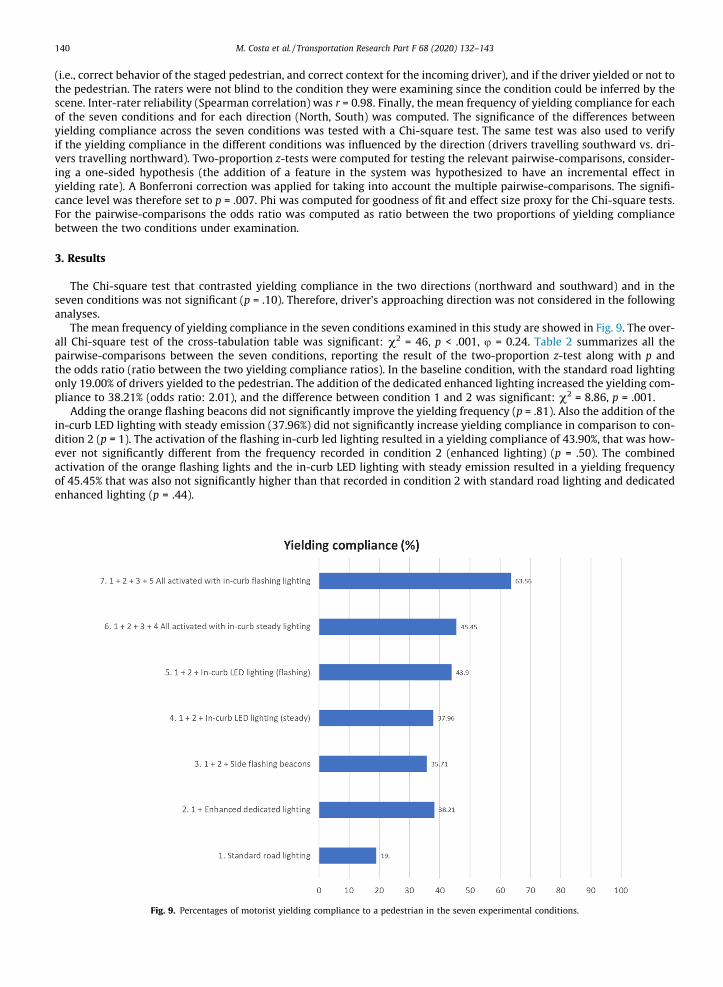
(i.e., correct behavior of the staged pedestrian, and correct context for the incoming driver), and if the driver yielded or not to
the pedestrian. The raters were not blind to the condition they were examining since the condition could be inferred by the
scene. Inter-rater reliability (Spearman correlation) was r = 0.98. Finally, the mean frequency of yielding compliance for each
of the seven conditions and for each direction (North, South) was computed. The significance of the differences between
yielding compliance across the seven conditions was tested with a Chi-square test. The same test was also used to verify
if the yielding compliance in the different conditions was influenced by the direction (drivers travelling southward vs. dri-
vers travelling northward). Two-proportion z-tests were computed for testing the relevant pairwise-comparisons, consider-
ing a one-sided hypothesis (the addition of a feature in the system was hypothesized to have an incremental effect in
yielding rate). A Bonferroni correction was applied for taking into account the multiple pairwise-comparisons. The signifi-
cance level was therefore set to p = .007. Phi was computed for goodness of fit and effect size proxy for the Chi-square tests.
For the pairwise-comparisons the odds ratio was computed as ratio between the two proportions of yielding compliance
between the two conditions under examination.
3. Results
The Chi-square test that contrasted yielding compliance in the two directions (northward and southward) and in the
seven conditions was not significant (p = .10). Therefore, driver’s approaching direction was not considered in the following
analyses.
The mean frequency of yielding compliance in the seven conditions examined in this study are showed in Fig. 9. The over-
all Chi-square test of the cross-tabulation table was significant: v2 = 46, p < .001, u = 0.24. Table 2 summarizes all the
pairwise-comparisons between the seven conditions, reporting the result of the two-proportion z-test along with p and
the odds ratio (ratio between the two yielding compliance ratios). In the baseline condition, with the standard road lighting
only 19.00% of drivers yielded to the pedestrian. The addition of the dedicated enhanced lighting increased the yielding com-
pliance to 38.21% (odds ratio: 2.01), and the difference between condition 1 and 2 was significant: v2 = 8.86, p = .001.
Adding the orange flashing beacons did not significantly improve the yielding frequency (p = .81). Also the addition of the
in-curb LED lighting with steady emission (37.96%) did not significantly increase yielding compliance in comparison to con-
dition 2 (p = 1). The activation of the flashing in-curb led lighting resulted in a yielding compliance of 43.90%, that was how-
ever not significantly different from the frequency recorded in condition 2 (enhanced lighting) (p = .50). The combined
activation of the orange flashing lights and the in-curb LED lighting with steady emission resulted in a yielding frequency
of 45.45% that was also not significantly higher than that recorded in condition 2 with standard road lighting and dedicated
enhanced lighting (p = .44).
Fig. 9. Percentages of motorist yielding compliance to a pedestrian in the seven experimental conditions.
140 M. Costa et al. / Transportation Research Part F 68 (2020) 132–143
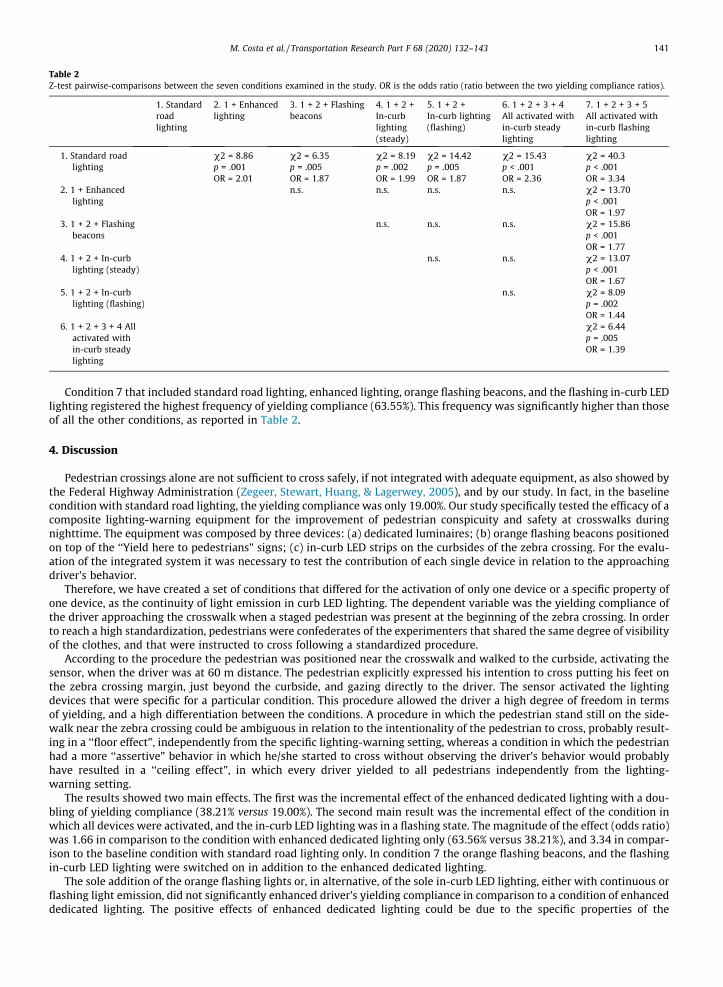
Condition 7 that included standard road lighting, enhanced lighting, orange flashing beacons, and the flashing in-curb LED
lighting registered the highest frequency of yielding compliance (63.55%). This frequency was significantly higher than those
of all the other conditions, as reported in Table 2.
4. Discussion
Pedestrian crossings alone are not sufficient to cross safely, if not integrated with adequate equipment, as also showed by
the Federal Highway Administration (Zegeer, Stewart, Huang, & Lagerwey, 2005), and by our study. In fact, in the baseline
condition with standard road lighting, the yielding compliance was only 19.00%. Our study specifically tested the efficacy of a
composite lighting-warning equipment for the improvement of pedestrian conspicuity and safety at crosswalks during
nighttime. The equipment was composed by three devices: (a) dedicated luminaires; (b) orange flashing beacons positioned
on top of the ‘‘Yield here to pedestrians” signs; (c) in-curb LED strips on the curbsides of the zebra crossing. For the evalu-
ation of the integrated system it was necessary to test the contribution of each single device in relation to the approaching
driver’s behavior.
Therefore, we have created a set of conditions that differed for the activation of only one device or a specific property of
one device, as the continuity of light emission in curb LED lighting. The dependent variable was the yielding compliance of
the driver approaching the crosswalk when a staged pedestrian was present at the beginning of the zebra crossing. In order
to reach a high standardization, pedestrians were confederates of the experimenters that shared the same degree of visibility
of the clothes, and that were instructed to cross following a standardized procedure.
According to the procedure the pedestrian was positioned near the crosswalk and walked to the curbside, activating the
sensor, when the driver was at 60 m distance. The pedestrian explicitly expressed his intention to cross putting his feet on
the zebra crossing margin, just beyond the curbside, and gazing directly to the driver. The sensor activated the lighting
devices that were specific for a particular condition. This procedure allowed the driver a high degree of freedom in terms
of yielding, and a high differentiation between the conditions. A procedure in which the pedestrian stand still on the side-
walk near the zebra crossing could be ambiguous in relation to the intentionality of the pedestrian to cross, probably result-
ing in a ‘‘floor effect”, independently from the specific lighting-warning setting, whereas a condition in which the pedestrian
had a more ‘‘assertive” behavior in which he/she started to cross without observing the driver’s behavior would probably
have resulted in a ‘‘ceiling effect”, in which every driver yielded to all pedestrians independently from the lighting-
warning setting.
The results showed two main effects. The first was the incremental effect of the enhanced dedicated lighting with a dou-
bling of yielding compliance (38.21% versus 19.00%). The second main result was the incremental effect of the condition in
which all devices were activated, and the in-curb LED lighting was in a flashing state. The magnitude of the effect (odds ratio)
was 1.66 in comparison to the condition with enhanced dedicated lighting only (63.56% versus 38.21%), and 3.34 in compar-
ison to the baseline condition with standard road lighting only. In condition 7 the orange flashing beacons, and the flashing
in-curb LED lighting were switched on in addition to the enhanced dedicated lighting.
The sole addition of the orange flashing lights or, in alternative, of the sole in-curb LED lighting, either with continuous or
flashing light emission, did not significantly enhanced driver’s yielding compliance in comparison to a condition of enhanced
dedicated lighting. The positive effects of enhanced dedicated lighting could be due to the specific properties of the
Table 2
Z-test pairwise-comparisons between the seven conditions examined in the study. OR is the odds ratio (ratio between the two yielding compliance ratios).
1. Standard
road
lighting
2. 1 + Enhanced
lighting
3. 1 + 2 + Flashing
beacons
4. 1 + 2 +
In-curb
lighting
(steady)
5. 1 + 2 +
In-curb lighting
(flashing)
6. 1 + 2 + 3 + 4
All activated with
in-curb steady
lighting
7. 1 + 2 + 3 + 5
All activated with
in-curb flashing
lighting
1. Standard road
lighting
v2 = 8.86
p = .001
OR = 2.01
v2 = 6.35
p = .005
OR = 1.87
v2 = 8.19
p = .002
OR = 1.99
v2 = 14.42
p = .005
OR = 1.87
v2 = 15.43
p < .001
OR = 2.36
v2 = 40.3
p < .001
OR = 3.34
2. 1 + Enhanced
lighting
n.s. n.s. n.s. n.s. v2 = 13.70
p < .001
OR = 1.97
3. 1 + 2 + Flashing
beacons
n.s. n.s. n.s. v2 = 15.86
p < .001
OR = 1.77
4. 1 + 2 + In-curb
lighting (steady)
n.s. n.s. v2 = 13.07
p < .001
OR = 1.67
5. 1 + 2 + In-curb
lighting (flashing)
n.s. v2 = 8.09
p = .002
OR = 1.44
6. 1 + 2 + 3 + 4 All
activated with
in-curb steady
lighting
v2 = 6.44
p = .005
OR = 1.39
M. Costa et al. / Transportation Research Part F 68 (2020) 132–143 141
luminaires used in this study that included cold white light, a lighting level that reached 120 lx at street level, a shift in
lighting level from 70 to 120 lx when the pedestrian activated the sensor, and an asymmetric beam that illuminated the
pedestrian in positive contrast (Tomczuk, Jamroz, Mackun, & Chrzanowicz, 2019).
In condition 7 the ‘‘warning”, and visual-attentional capture was promoted by the simultaneous activation of two flashing
devices: the orange lamps on top of the pedestrian crossing lateral signs and the in-curb LED strips. Their combined effect
resulted in an incremented yielding compliance of 25.35%. Flashing lights are particularly effective as a bottom-up system to
alert a driver about a potential danger (Vignali et al., 2019), and flashing lights are particularly effective in capturing visual
attention when presented in the visual peripheral field which is more sensitive to the perception of movement and transient
changes (Costa, Bonetti, Vignali, Lantieri, & Simone, 2018). The potential of flashing lights to capture drivers’ attention was
also tested by Lenné et al. (2011) who showed that flashing lights resulted in a significant increase in drivers stopping at a
passive level crossing in comparison to a condition with traffic sign alone.
The flashing pattern for the beacons and the in-curb LED strips was regular and was 1 Hz for both devices. It can be sug-
gested that a more complex and irregular flashing pattern would have increased the yielding compliance. Previous studies
that have tested the high-intensity activated crosswalk (HAWK) (Turner et al., 2006) and the use of wig-wag flashing pat-
terns with alternation of short and long volleys (Shurbutt et al., 2009) have found a very high motorists’ yielding compliance
(93% and 81.5%, respectively).
The in-curb LED lights were cool white. This light spectrumwas chosen in order to increase the lighting level of the cross-
walk, and therefore promote pedestrian’s conspicuity. However, in the flashing condition, the in-curb LED lighting had more
a warning than a lighting purpose. According to the Italian code (Italian Highway Code, 1992), all warning flashing lamps
have to be amber and not white. This resulted in a possible confounding factor for motorists that should be better addressed
in a future research in which the data obtained with the white in-curb LED lighting could be compared with the orange in-
curb LED lighting. The use of orange in-curb LED lights would match with the flashing orange beacons applied on the ‘‘Yield
here to pedestrian” signs, increasing consistency and coherence of the crosswalk design.
Lighting and warning devices for road use have usually a punctiform light source whereas in this case a succession of LEDs
produced a linear contour that could be useful for outlining the shape of an obstacle or delimiter in the road. LED technology
offers now easy-to -use, low-cost and very efficient LED strips that could be used both for lighting or/and for delimiting and
warning purposes. Specifically, in-curb LED strips could direct the driver’s attention to curbsides where pedestrians are more
likely to be positioned. LED strips could be integrated in systems for traffic safety in order to increase the conspicuity of
obstacles and direct the driver’s attention to critical points.
Although the pedestrian safety issues are universal, the specific results have to be interpreted considering the Italian con-
text in which drivers mainly yield when the pedestrian initiates the crossing maneuver and enter the crosswalk. It is well
possible that in other countries with a higher or lower yielding compliance to pedestrians the results could differ. Both dri-
ver’s and pedestrian’s behavior, in fact, are highly influenced by cultural expectations and specific cognitive schemes and
learning experiences (Hamed, 2001; Sueur, Class, Hamm, Meyer, & Pelé, 2013). Future longitudinal studies are needed to
track if the effects highlighted in this study tend persist on a long-time run. The configuration of in-curb LED strips with both
steady or flashing operating mode is new and not expected by drivers since it not included in the Italian Highway Code
within the possible features that could be applied to crosswalks in order to increase their safety. Furthermore, the experi-
mentation was conducted on only one site. Additional studies could test the efficacy of the integrated lighting-warning sys-
tem in a more ample sample of crosswalks differing for their location, traffic volume, speed, pedestrian volume, crosswalk
width and roadside distractions.
Overall it is possible to conclude that the integrated lighting-warning system, in the modality with both the orange flash-
ing beacons and the flashing in-curb LED lighting, it is highly effective in increasing yielding compliance to pedestrians dur-
ing nighttime conditions. Future studies could track the driver’s speed when approaching the pedestrian crossing in the
different lighting-warning conditions and assess the distance at which the pedestrian is first fixated and glanced by the dri-
vers using a methodology of eye movement recording as in Costa, Simone, Vignali, Lantieri, and Palena (2018), Costa et al.
(2019), and Lantieri et al. (2015). The measure of yielding compliance, in fact, cannot disentangle cases in which the driver
has detected the pedestrian but has decided not to yield from cases in which the driver has not detected the pedestrian. An
investigation with eye-movement recording could better explore this distinction, determining exactly when and at what dis-
tance drivers tend to detect the pedestrian, with and without the integrated lighting-warning system.
Acknowledgements
We would like to thank Federico Paveggio, engineer at the Mobility Department of the Municipality of Bologna, for the
proposal to investigate the integrated lighting-warning system and his assistance in collecting the data, and Marco Zambelli
from Zama Impianti, for installing and setting the experimental crosswalk. We are also grateful to Arianna Zapparata, Lauro
Mazzoni and Luigi Rossi for their assistance in collecting and analyzing the data.
Appendix A. Supplementary material
Supplementary data to this article can be found online at https://doi.org/10.1016/j.trf.2019.12.004.
142 M. Costa et al. / Transportation Research Part F 68 (2020) 132–143

References
Allen, M. J., Hazlett, R. D., Tacker, H. L., & Graham, B. V. (1970). Actual pedestrian visibility and the pedestrian’s estimate of his own visibility. Optometry andVision Science, 47(1), 44–49. https://doi.org/10.1097/00006324-197001000-00008.
Balk, S. A., Tyrrell, R. A., Brooks, J. O., & Carpenter, T. L. (2008). Highlighting human form and motion information enhances the conspicuity of pedestrians atnight. Perception, 37(8), 1276–1284. https://doi.org/10.1068/p6017.
Bichicchi, A., Mazzotta, F., Lantieri, C., Vignali, V., Simone, A., Dondi, G., & Costa, M. (2017). The influence of pedestrian crossing features on driving behaviorand road safety. In G. Dall’Acqua & F. Wegman (Eds.), Proceedings of the AIIT International Congress (pp. 741–746). London: CRC Press.
Brooks, J. O., Tyrrell, R. A., & Frank, T. A. (2005). The effects of severe visual challenges on steering performance in visually healthy young drivers. Optometry
and Vision Science, 82(8), 689–697. https://doi.org/10.1097/01.opx.0000174722.96171.86.Buonarosa, M. L., Sayer, J. R., & Flannagan, M. J. (2008). Real-world frequency of use of automotive lighting equipment. LEUKOS - Journal of Illuminating
Engineering Society of North America, 5(2), 139–146. https://doi.org/10.1582/LEUKOS.2008.05.02.004.Costa, M., Bonetti, L., Bellelli, M., Lantieri, C., Vignali, V., & Simone, A. (2017). Reflective tape applied to bicycle frame and conspicuity enhancement at night.
Human Factors, 59(3), 485–500. https://doi.org/10.1177/0018720816677145.Costa, M., Bonetti, L., Vignali, V., Bichicchi, A., Lantieri, C., & Simone, A. (2019). Driver’s visual attention to different categories of roadside advertising signs.
Applied Ergonomics, 78, 127–136. https://doi.org/10.1016/j.apergo.2019.03.001.Costa, M., Bonetti, L., Vignali, V., Lantieri, C., & Simone, A. (2018a). The role of peripheral vision in vertical road sign identification and discrimination.
Ergonomics, 61(12), 1619–1634. https://doi.org/10.1080/00140139.2018.1508756.Costa, M., Simone, A., Vignali, V., Lantieri, C., & Palena, N. (2018b). Fixation distance and fixation duration to vertical road signs. Applied Ergonomics, 69,
48–57. https://doi.org/10.1016/J.APERGO.2017.12.017.European Road Safety Observatory (2018). Traffic safety basic facts 2018. European Commission, Directorate General for Transport.Fekety, D. K., Edewaard, D. E., Stafford Sewall, A. A., & Tyrrell, R. A. (2016). Electroluminescent materials can further enhance the nighttime conspicuity of
pedestrians wearing retroreflective materials. Human Factors: The Journal of the Human Factors and Ergonomics Society, 58(7), 976–985. https://doi.org/10.1177/0018720816651535.
Hamed, M. M. (2001). Analysis of pedestrians’ behavior at pedestrian crossings. Safety Science, 38(1), 63–82. https://doi.org/10.1016/S0925-7535(00)00058-8.
Italian Highway Code (1992). D.L. 285, April 30th 1992.Lantieri, C., Lamperti, R., Simone, A., Costa, M., Vignali, V., Sangiorgi, C., & Dondi, G. (2015). Gateway design assessment in the transition from high to low
speed areas. Transportation Research Part F: Traffic Psychology and Behaviour, 34, 41–53. https://doi.org/10.1016/j.trf.2015.07.017.Lenné, M. G., Rudin-Brown, C. M., Navarro, J., Edquist, J., Trotter, M., & Tomasevic, N. (2011). Driver behaviour at rail level crossings: Responses to flashing
lights, traffic signals and stop signs in simulated rural driving. Applied Ergonomics, 42(4), 548–554. https://doi.org/10.1016/j.apergo.2010.08.011.Nassi, R. B. (2001). Pedestrians. Traffic control devices handbook. Washington, DC: Institute of Transportation Engineers.Owens, D. A., & Brooks, J. C. (1995). Drivers’ vision, age, and gender as factors in twilight road fatalities. Ann Arbor, Michigan.Owens, D. A., & Sivak, M. (1996). Differentiation of visibility and alcohol as contributors to twilight road fatalities. Human Factors, 38(4), 680–689. https://
doi.org/10.1518/001872096778827233.Owens, D. A., & Tyrrell, R. A. (1999). Effects of luminance, blur, and age on nighttime visual guidance: A test of the selective degradation hypothesis. Journal
of Experimental Psychology: Applied, 5(2), 115–128. https://doi.org/10.1037/1076-898X.5.2.115.Owens, D. A., Wood, J. M., & Owens, J. M. (2007). Effects of age and illumination on night driving: A road test. Human Factors: The Journal of the Human Factors
and Ergonomics Society, 49(6), 1115–1131. https://doi.org/10.1518/001872007X249974.Plainis, S., & Murray, I. J. (2002). Reaction times as an index of visual conspicuity when driving at night. Ophthalmic and Physiological Optics, 22(5), 409–415.
https://doi.org/10.1046/j.1475-1313.2002.00076.x.Rumar, K. (1990). The basic driver error: Late detection. Ergonomics, 33(10–11), 1281–1290. https://doi.org/10.1080/00140139008925332.Shinar, D. (1984). Actual versus estimated night-time pedestrian visibility. Ergonomics, 27(8), 863–871. https://doi.org/10.1080/00140138408963560.Shurbutt, J., Van Houten, R., Turner, S., & Huitema, B. (2009). Analysis of effects of LED rectangular rapid-flash beacons on yielding to pedestrians in
multilane crosswalks. Transportation Research Record: Journal of the Transportation Research Board, 2140(1), 85–95. https://doi.org/10.3141/2140-09.Sivak, M., Luoma, J., Flannagan, M. J., Bingham, C. R., Eby, D. W., & Shope, J. T. (2007). Traffic safety in the U.S.: Re-examining major opportunities. Journal of
Safety Research, 38(3), 337–355. https://doi.org/10.1016/j.jsr.2007.05.003.Sueur, C., Class, B., Hamm, C., Meyer, X., & Pelé, M. (2013). Different risk thresholds in pedestrian road crossing behaviour: A comparison of French and
Japanese approaches. Accident Analysis & Prevention, 58, 59–63. https://doi.org/10.1016/j.aap.2013.04.027.Sullivan, J. M., & Flannagan, M. J. (2002). The role of ambient light level in fatal crashes: Inferences from daylight saving time transitions. Accident Analysis
and Prevention, 34(4), 487–498. https://doi.org/10.1016/S0001-4575(01)00046-X.Tomczuk, P., Jamroz, K., Mackun, T., & Chrzanowicz, M. (2019). Lighting requirements for pedestrian crossings – positive contrast.MATEC Web of Conferences,
262, 05015. https://doi.org/10.1051/matecconf/201926205015.Turner, S., Fitzpatrick, K., Brewer, M., & Park, E. (2006). Motorist yielding to pedestrians at unsignalized intersections: Findings from a national study on
improving pedestrian safety. Transportation Research Record: Journal of the Transportation Research Board, 1982, 1–12. https://doi.org/10.3141/1982-03.Tyrrell, R. A., Wood, J. M., Owens, D. A., Whetsel Borzendowski, S., & Stafford Sewall, A. (2016). The conspicuity of pedestrians at night: A review. Clinical and
Experimental Optometry, 99(5), 425–434. https://doi.org/10.1111/cxo.12447.Van Houten, R., Ellis, R., & Marmolejo, E. (2008). Stutter-flash light-emitting-diode beacons to increase yielding to pedestrians at crosswalks. Transportation
Research Record: Journal of the Transportation Research Board, 2073(1), 69–78. https://doi.org/10.3141/2073-08.Venable, W. H., & Hale, W. N. (1996). Color and nighttime pedestrian safety markings. Color Research & Application, 21(4), 305–309. https://doi.org/10.1002/
(SICI)1520-6378(199608)21:4<305::AID-COL5>3.0.CO;2-U.Vignali, V., Cuppi, F., Acerra, E., Bichicchi, A., Lantieri, C., Simone, A., & Costa, M. (2019). Effects of median refuge island and flashing vertical sign on
conspicuity and safety of unsignalized crosswalks. Transportation Research Part F: Traffic Psychology and Behaviour, 60, 427–439. https://doi.org/10.1016/j.trf.2018.10.033.
Whetsel Borzendowski, S. A., Rosenberg, R. L., Sewall, A. S., & Tyrrell, R. A. (2013). Pedestrians’ estimates of their own nighttime conspicuity are unaffectedby severe reductions in headlight illumination. Journal of Safety Research. https://doi.org/10.1016/j.jsr.2013.08.007.
Wood, J. M., Tyrrell, R. A., & Carberry, T. P. (2005). Limitations in drivers’ ability to recognize pedestrians at night. Human Factors: The Journal of the Human
Factors and Ergonomics Society, 47(3), 644–653. https://doi.org/10.1518/001872005774859980.Zegeer, C. V., Stewart, J. R., Huang, H. H., & Lagerwey, P. A. (2005). Safety effects of marked vs unmarked crosswalks at uncontrolled locations: Executive summary
and recommended guidelines Report FHWA-HRT-04-100. McLean, VA: FHWA, U.S. Department of Transportation.
M. Costa et al. / Transportation Research Part F 68 (2020) 132–143 143
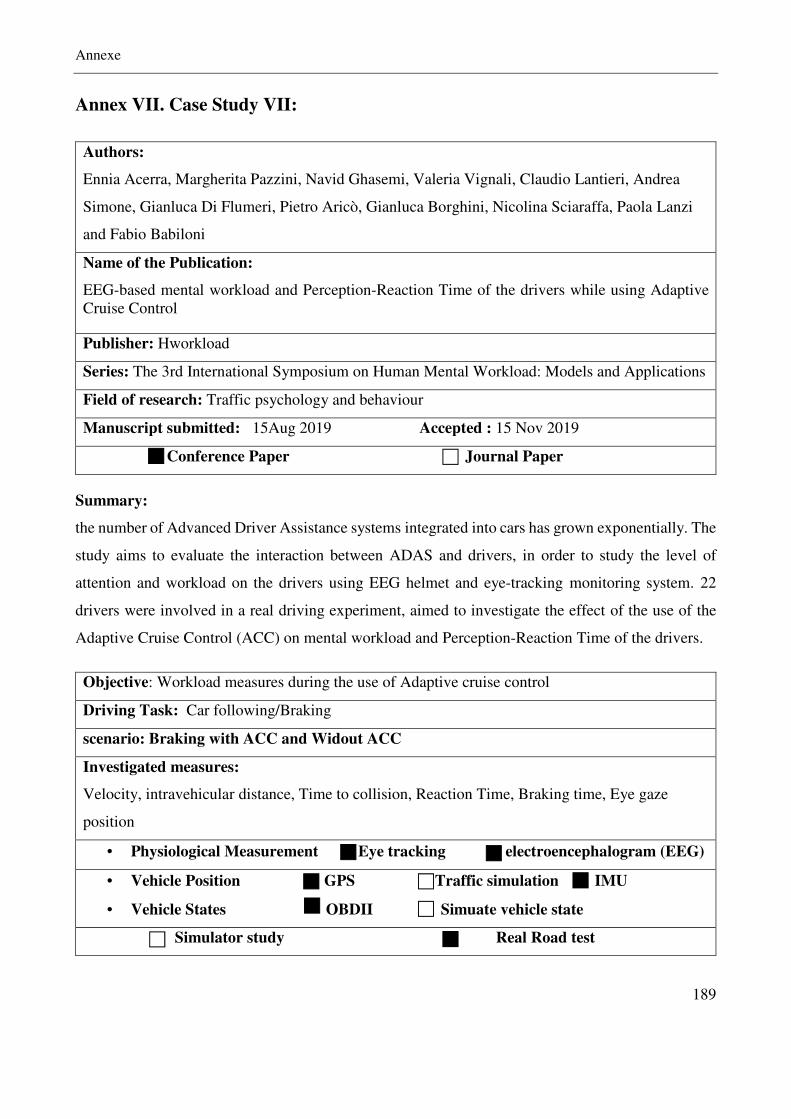
Annexe
189
Annex VII. Case Study VII:
Authors:
Ennia Acerra, Margherita Pazzini, Navid Ghasemi, Valeria Vignali, Claudio Lantieri, Andrea
Simone, Gianluca Di Flumeri, Pietro Aricò, Gianluca Borghini, Nicolina Sciaraffa, Paola Lanzi
and Fabio Babiloni
Name of the Publication:
EEG-based mental workload and Perception-Reaction Time of the drivers while using Adaptive
Cruise Control
Publisher: Hworkload
Series: The 3rd International Symposium on Human Mental Workload: Models and Applications
Field of research: Traffic psychology and behaviour
Manuscript submitted: 15Aug 2019 Accepted : 15 Nov 2019
Conference Paper Journal Paper
Summary:
the number of Advanced Driver Assistance systems integrated into cars has grown exponentially. The
study aims to evaluate the interaction between ADAS and drivers, in order to study the level of
attention and workload on the drivers using EEG helmet and eye-tracking monitoring system. 22
drivers were involved in a real driving experiment, aimed to investigate the effect of the use of the
Adaptive Cruise Control (ACC) on mental workload and Perception-Reaction Time of the drivers.
Objective: Workload measures during the use of Adaptive cruise control
Driving Task: Car following/Braking
scenario: Braking with ACC and Widout ACC
Investigated measures:
Velocity, intravehicular distance, Time to collision, Reaction Time, Braking time, Eye gaze
position
• Physiological Measurement Eye tracking electroencephalogram (EEG)
• Vehicle Position GPS Traffic simulation IMU
• Vehicle States OBDII Simuate vehicle state
Simulator study Real Road test
EEG-Based Mental Workload
and Perception-Reaction Time of the Drivers
While Using Adaptive Cruise Control
Ennia Acerra1, Margherita Pazzini1, Navid Ghasemi1,
Valeria Vignali1, Claudio Lantieri1(&), Andrea Simone1,
Gianluca Di Flumeri2,3, Pietro Aricò2,3, Gianluca Borghini2,3,
Nicolina Sciaraffa2,4, Paola Lanzi5, and Fabio Babiloni2,3
1 Department of Civil, Chemical, Environmental and Materials Engineering
(DICAM), University of Bologna, Viale Risorgimento, 2, 40136 Bologna, Italy
ennia.acerra2,margherita.pazzini2,navid.ghasemi3,
valeria.vignali,claudio.lantieri2,
[email protected] BrainSigns srl, via Sesto Celere, 00152 Rome, Italy
gianluca.diflumeri,pietro.arico,gianluca.borghini,
nicolina.sciaraffa,[email protected] Department of Molecular Medicine, Sapienza University of Rome, Rome, Italy
4 SAIMLAL, Sapienza University of Rome, Rome, Italy5 DeepBlue srl, Piazza Buenos Aires 20, 00185 Rome, Italy
Abstract. Car driving is a complex activity, consisting of an integrated multi-
task behavior and requiring different interrelated skills. Over the last years, the
number of Advanced Driver Assistance systems integrated into cars has grown
exponentially. So it is very important to evaluate the interaction between these
devices and drivers in order to study if they can represent an additional source of
driving-related distraction. In this study, 22 subjects have been involved in a real
driving experiment, aimed to investigate the effect of the use of the Adaptive
Cruise Control (ACC) on mental workload and Perception-Reaction Time of the
drivers. During the test physiological data, in terms of brain activity through
Electroencephalographic technique and eye gaze through Eye-Tracking devices,
and vehicle trajectory data, through a satellite device mounted on the car, have
been recorded. The results obtained show that the use of ACC caused an
increase in mental workload and Perception-Reaction Time of the drivers.
Keywords: Electroencephalography Eye-Tracking Mental workload
Human factor Car driving Road safety Adaptive Cruise Control
Perception-Reaction Time
AQ1
AQ2
© Springer Nature Switzerland AG 2019
L. Longo and M. C. Leva (Eds.): H-WORKLOAD 2019, CCIS 1107, pp. 1–14, 2019.
https://doi.org/10.1007/978-3-030-32423-0_15
Au
tho
r P
ro
of
1 Introduction
The Global status report on road safety 2018, launched by the World Health Organi-
zation (WHO), highlights that the number of annual road traffic deaths has reached 1.35
million. Road traffic injuries may now be considered as the leading causes of death
among people aged 5–29 years [1]. Car driving is a complex activity, consisting in an
integrated multi-task behavior engaging several processes and requiring different
interrelated skills that rely on interconnected visual, motor and cognitive brain systems
[2]. While driving, the interactions between the driver, the vehicle and the environment
are continuous and numerous [3, 4]. Driver’s common errors are largely correlated to
overload, distractions, tiredness, or the simultaneous realization of other activities while
driving. Secondary task distraction is a contributing factor in up to 23% of crashes and
near-crashes [5, 6]. Considering the driver’s error resulting in severe consequences in
road transportations, the development of countermeasures to mitigate the human errors
through training and technology and a better road system becomes critical [7].
Advanced driver assistance systems (ADAS) and Passive Safety Systems (PSS) (e.g.
seatbelts, airbags) are two approaches used in modern vehicles to mitigate the risk of
accidents or casualties resulting from human error. ADAS are electronic control sys-
tems that aid drivers while driving. They are designed to improve driver, passenger and
pedestrian safety by reducing both the severity and the overall number of motor vehicle
accidents. ADAS can warn drivers of potential dangers, intervene to help the driver
remain in control in order to prevent an accident and, if necessary, reduce the severity
of an accident in case if it cannot be avoided. Adaptive cruise control (ACC) is an
ADAS that automatically adjusts the vehicle speed to maintain a safe distance from
vehicles ahead. A vehicle equipped with ACC will thus reduce speed automatically,
within limits, to match the speed of a slower vehicle that is following. ACC automates
the operational control of headway and speed. It should reduce driver stress and human
errors as a result of freeing up visual, cognitive and physical resources [8], and the
number of hard accelerations and decelerations, encourage speed harmonization
between vehicles and enable better merging behaviors [9].
Despite the potential benefits of ACC, negative behavioral adaptation (BA) may
occur with its introduction [10]. Driver may use any freed visual, cognitive and
physical resources to engage in non-driving tasks that he perceives as improving his
productivity. However, these tasks may reduce his vigilance and attention to the pri-
mary driving task, which could result in driver distraction, and a failure to detect and
respond to critical driving situations [11, 12]. When using ACC, drivers are more likely
to perform in-vehicle tasks that they would not normally do [13], and their performance
on a secondary task improves [14]. The visual demand of drivers decreases when they
use ACC, allowing them to pay less attention the road ahead [15]. The main objective
of this study was to investigate whether ACC can induce BA in drivers. 22 subjects
have been involved in a real driving experiment, aimed to investigate the effect of the
use of the Adaptive Cruise Control (ACC) on mental workload and Perception-
Reaction Time of the drivers. Several neurophysiological studies about drivers’
behaviors, in fact, have shown that the same experimental tasks are perceived differ-
ently, in terms of mental workload, if performed in a simulator or in a real environment
[16]. Pierre et al. and Tong et al., moreover, have confirmed that not only the task
2 E. Acerra et al.
Au
tho
r P
ro
of
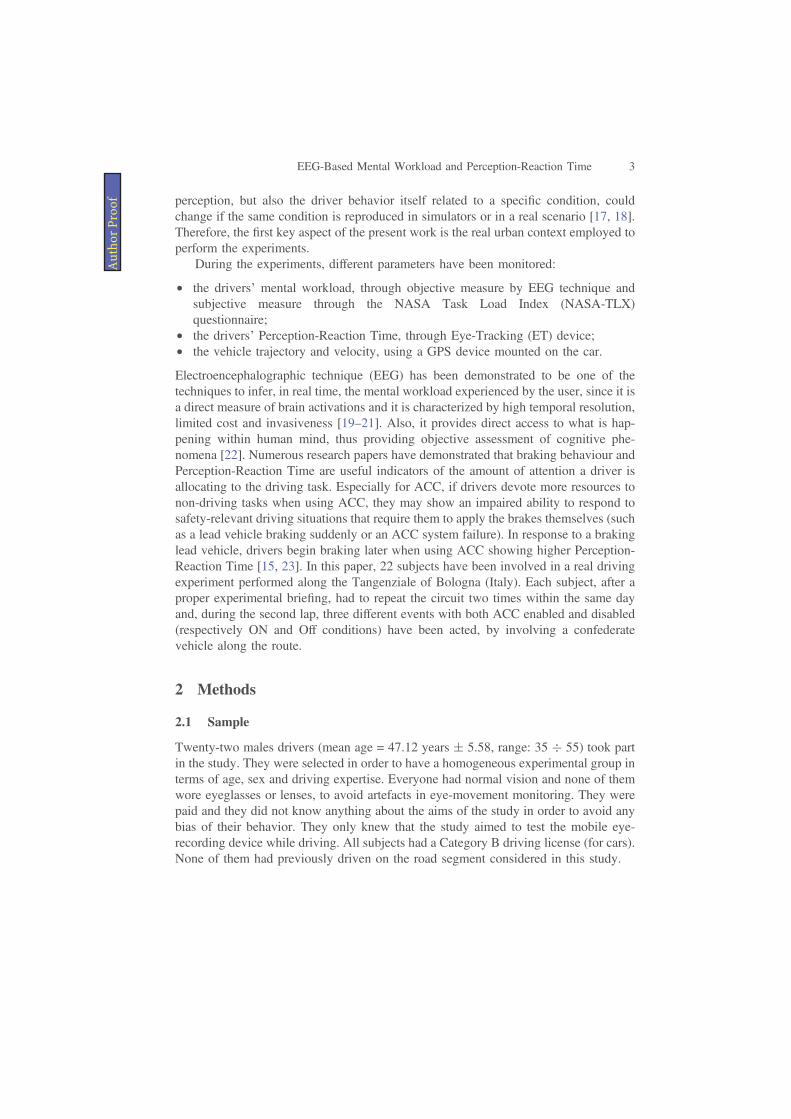
perception, but also the driver behavior itself related to a specific condition, could
change if the same condition is reproduced in simulators or in a real scenario [17, 18].
Therefore, the first key aspect of the present work is the real urban context employed to
perform the experiments.
During the experiments, different parameters have been monitored:
• the drivers’ mental workload, through objective measure by EEG technique and
subjective measure through the NASA Task Load Index (NASA-TLX)
questionnaire;
• the drivers’ Perception-Reaction Time, through Eye-Tracking (ET) device;
• the vehicle trajectory and velocity, using a GPS device mounted on the car.
Electroencephalographic technique (EEG) has been demonstrated to be one of the
techniques to infer, in real time, the mental workload experienced by the user, since it is
a direct measure of brain activations and it is characterized by high temporal resolution,
limited cost and invasiveness [19–21]. Also, it provides direct access to what is hap-
pening within human mind, thus providing objective assessment of cognitive phe-
nomena [22]. Numerous research papers have demonstrated that braking behaviour and
Perception-Reaction Time are useful indicators of the amount of attention a driver is
allocating to the driving task. Especially for ACC, if drivers devote more resources to
non-driving tasks when using ACC, they may show an impaired ability to respond to
safety-relevant driving situations that require them to apply the brakes themselves (such
as a lead vehicle braking suddenly or an ACC system failure). In response to a braking
lead vehicle, drivers begin braking later when using ACC showing higher Perception-
Reaction Time [15, 23]. In this paper, 22 subjects have been involved in a real driving
experiment performed along the Tangenziale of Bologna (Italy). Each subject, after a
proper experimental briefing, had to repeat the circuit two times within the same day
and, during the second lap, three different events with both ACC enabled and disabled
(respectively ON and Off conditions) have been acted, by involving a confederate
vehicle along the route.
2 Methods
2.1 Sample
Twenty-two males drivers (mean age = 47.12 years ± 5.58, range: 35 55) took part
in the study. They were selected in order to have a homogeneous experimental group in
terms of age, sex and driving expertise. Everyone had normal vision and none of them
wore eyeglasses or lenses, to avoid artefacts in eye-movement monitoring. They were
paid and they did not know anything about the aims of the study in order to avoid any
bias of their behavior. They only knew that the study aimed to test the mobile eye-
recording device while driving. All subjects had a Category B driving license (for cars).
None of them had previously driven on the road segment considered in this study.
EEG-Based Mental Workload and Perception-Reaction Time 3
Au
tho
r P
ro
of
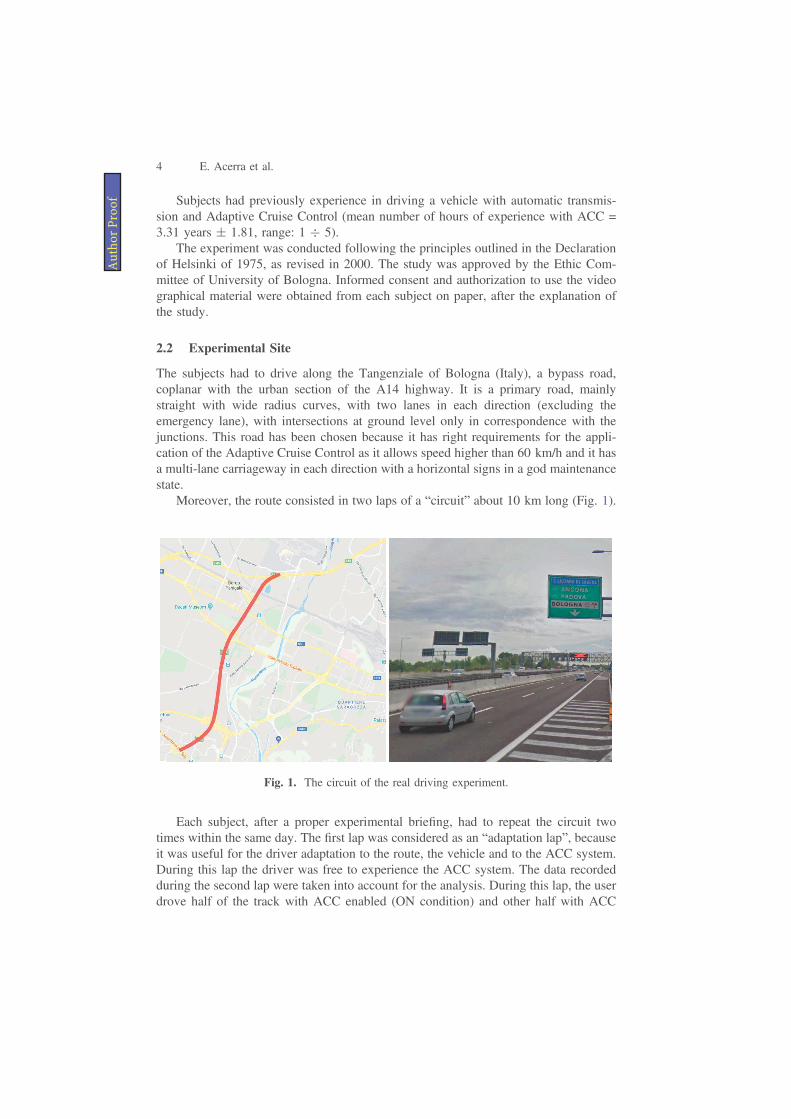
Subjects had previously experience in driving a vehicle with automatic transmis-
sion and Adaptive Cruise Control (mean number of hours of experience with ACC =
3.31 years ± 1.81, range: 1 5).
The experiment was conducted following the principles outlined in the Declaration
of Helsinki of 1975, as revised in 2000. The study was approved by the Ethic Com-
mittee of University of Bologna. Informed consent and authorization to use the video
graphical material were obtained from each subject on paper, after the explanation of
the study.
2.2 Experimental Site
The subjects had to drive along the Tangenziale of Bologna (Italy), a bypass road,
coplanar with the urban section of the A14 highway. It is a primary road, mainly
straight with wide radius curves, with two lanes in each direction (excluding the
emergency lane), with intersections at ground level only in correspondence with the
junctions. This road has been chosen because it has right requirements for the appli-
cation of the Adaptive Cruise Control as it allows speed higher than 60 km/h and it has
a multi-lane carriageway in each direction with a horizontal signs in a god maintenance
state.
Moreover, the route consisted in two laps of a “circuit” about 10 km long (Fig. 1).
Each subject, after a proper experimental briefing, had to repeat the circuit two
times within the same day. The first lap was considered as an “adaptation lap”, because
it was useful for the driver adaptation to the route, the vehicle and to the ACC system.
During this lap the driver was free to experience the ACC system. The data recorded
during the second lap were taken into account for the analysis. During this lap, the user
drove half of the track with ACC enabled (ON condition) and other half with ACC
Fig. 1. The circuit of the real driving experiment.
4 E. Acerra et al.
Au
tho
r P
ro
of
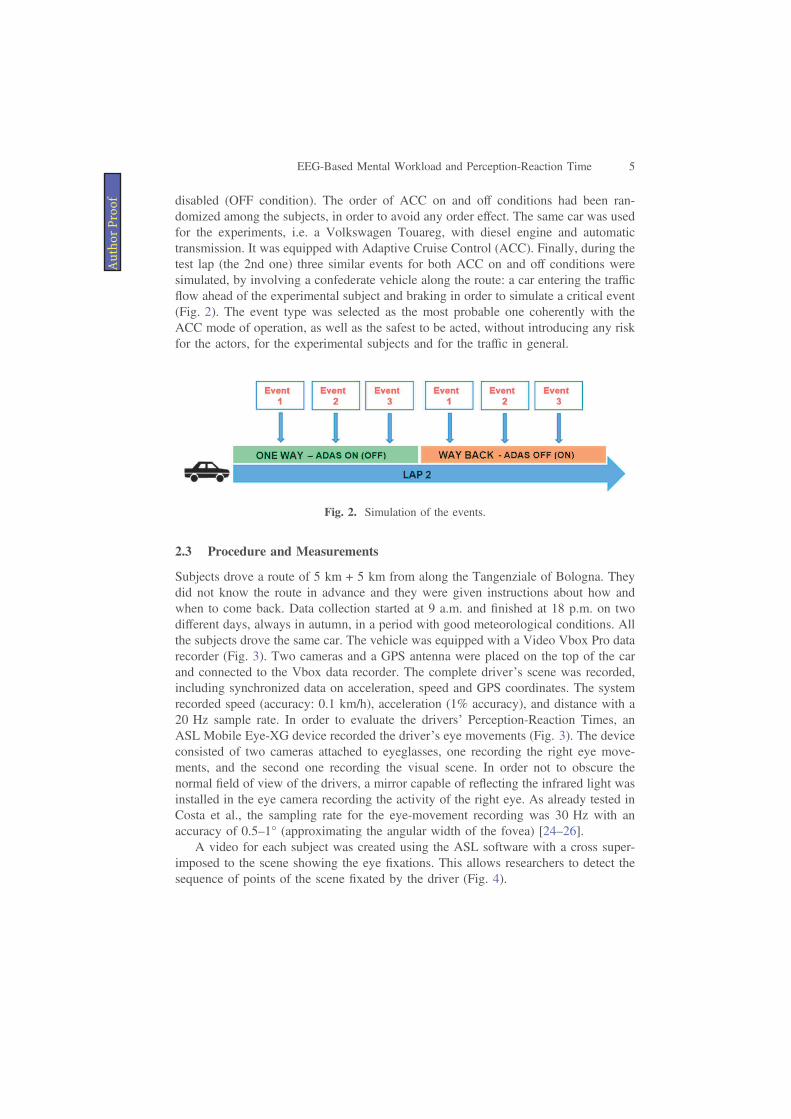
disabled (OFF condition). The order of ACC on and off conditions had been ran-
domized among the subjects, in order to avoid any order effect. The same car was used
for the experiments, i.e. a Volkswagen Touareg, with diesel engine and automatic
transmission. It was equipped with Adaptive Cruise Control (ACC). Finally, during the
test lap (the 2nd one) three similar events for both ACC on and off conditions were
simulated, by involving a confederate vehicle along the route: a car entering the traffic
flow ahead of the experimental subject and braking in order to simulate a critical event
(Fig. 2). The event type was selected as the most probable one coherently with the
ACC mode of operation, as well as the safest to be acted, without introducing any risk
for the actors, for the experimental subjects and for the traffic in general.
2.3 Procedure and Measurements
Subjects drove a route of 5 km + 5 km from along the Tangenziale of Bologna. They
did not know the route in advance and they were given instructions about how and
when to come back. Data collection started at 9 a.m. and finished at 18 p.m. on two
different days, always in autumn, in a period with good meteorological conditions. All
the subjects drove the same car. The vehicle was equipped with a Video Vbox Pro data
recorder (Fig. 3). Two cameras and a GPS antenna were placed on the top of the car
and connected to the Vbox data recorder. The complete driver’s scene was recorded,
including synchronized data on acceleration, speed and GPS coordinates. The system
recorded speed (accuracy: 0.1 km/h), acceleration (1% accuracy), and distance with a
20 Hz sample rate. In order to evaluate the drivers’ Perception-Reaction Times, an
ASL Mobile Eye-XG device recorded the driver’s eye movements (Fig. 3). The device
consisted of two cameras attached to eyeglasses, one recording the right eye move-
ments, and the second one recording the visual scene. In order not to obscure the
normal field of view of the drivers, a mirror capable of reflecting the infrared light was
installed in the eye camera recording the activity of the right eye. As already tested in
Costa et al., the sampling rate for the eye-movement recording was 30 Hz with an
accuracy of 0.5–1° (approximating the angular width of the fovea) [24–26].
A video for each subject was created using the ASL software with a cross super-
imposed to the scene showing the eye fixations. This allows researchers to detect the
sequence of points of the scene fixated by the driver (Fig. 4).
Fig. 2. Simulation of the events.
EEG-Based Mental Workload and Perception-Reaction Time 5
Au
tho
r P
ro
of
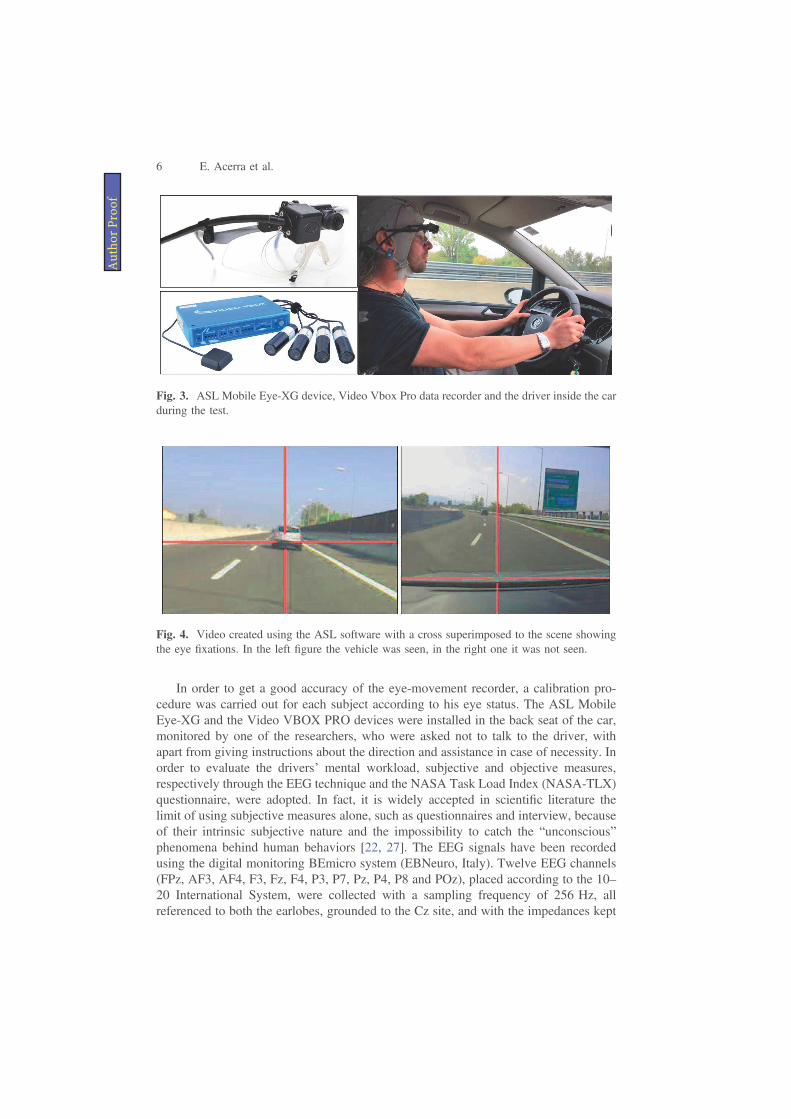
In order to get a good accuracy of the eye-movement recorder, a calibration pro-
cedure was carried out for each subject according to his eye status. The ASL Mobile
Eye-XG and the Video VBOX PRO devices were installed in the back seat of the car,
monitored by one of the researchers, who were asked not to talk to the driver, with
apart from giving instructions about the direction and assistance in case of necessity. In
order to evaluate the drivers’ mental workload, subjective and objective measures,
respectively through the EEG technique and the NASA Task Load Index (NASA-TLX)
questionnaire, were adopted. In fact, it is widely accepted in scientific literature the
limit of using subjective measures alone, such as questionnaires and interview, because
of their intrinsic subjective nature and the impossibility to catch the “unconscious”
phenomena behind human behaviors [22, 27]. The EEG signals have been recorded
using the digital monitoring BEmicro system (EBNeuro, Italy). Twelve EEG channels
(FPz, AF3, AF4, F3, Fz, F4, P3, P7, Pz, P4, P8 and POz), placed according to the 10–
20 International System, were collected with a sampling frequency of 256 Hz, all
referenced to both the earlobes, grounded to the Cz site, and with the impedances kept
Fig. 4. Video created using the ASL software with a cross superimposed to the scene showing
the eye fixations. In the left figure the vehicle was seen, in the right one it was not seen.
Fig. 3. ASL Mobile Eye-XG device, Video Vbox Pro data recorder and the driver inside the car
during the test.
6 E. Acerra et al.
Au
tho
r P
ro
of
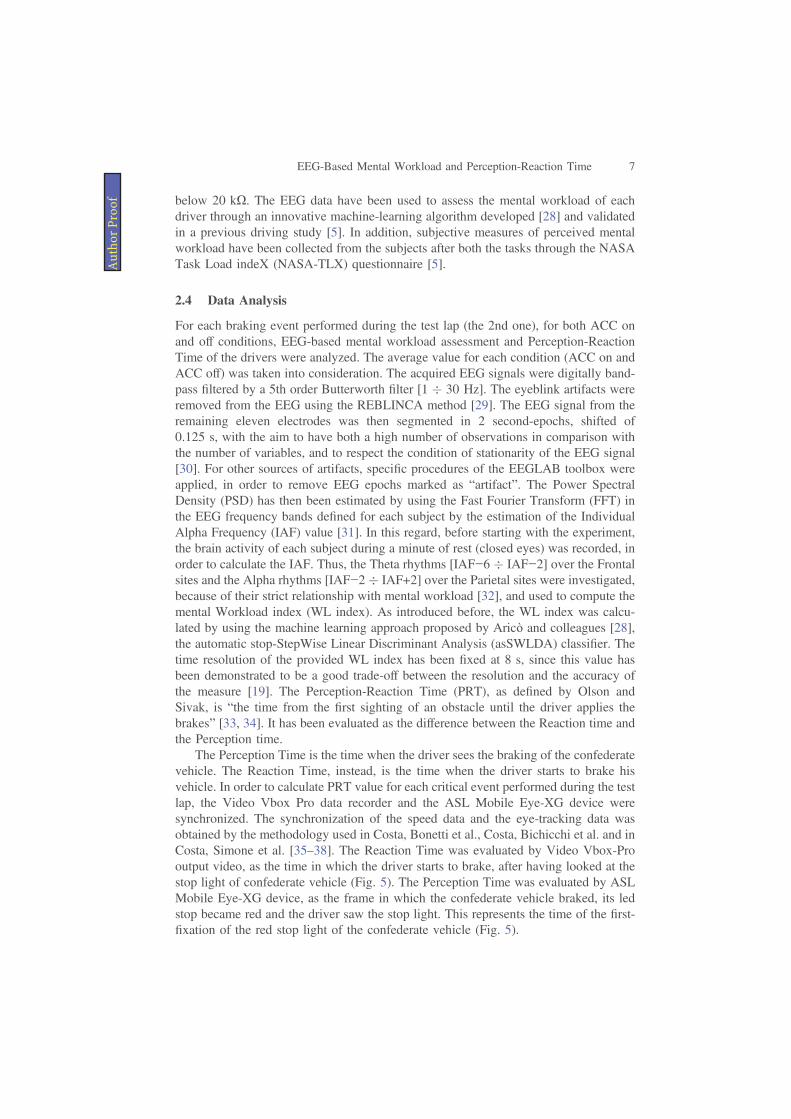
below 20 kX. The EEG data have been used to assess the mental workload of each
driver through an innovative machine-learning algorithm developed [28] and validated
in a previous driving study [5]. In addition, subjective measures of perceived mental
workload have been collected from the subjects after both the tasks through the NASA
Task Load indeX (NASA-TLX) questionnaire [5].
2.4 Data Analysis
For each braking event performed during the test lap (the 2nd one), for both ACC on
and off conditions, EEG-based mental workload assessment and Perception-Reaction
Time of the drivers were analyzed. The average value for each condition (ACC on and
ACC off) was taken into consideration. The acquired EEG signals were digitally band-
pass filtered by a 5th order Butterworth filter [1 30 Hz]. The eyeblink artifacts were
removed from the EEG using the REBLINCA method [29]. The EEG signal from the
remaining eleven electrodes was then segmented in 2 second-epochs, shifted of
0.125 s, with the aim to have both a high number of observations in comparison with
the number of variables, and to respect the condition of stationarity of the EEG signal
[30]. For other sources of artifacts, specific procedures of the EEGLAB toolbox were
applied, in order to remove EEG epochs marked as “artifact”. The Power Spectral
Density (PSD) has then been estimated by using the Fast Fourier Transform (FFT) in
the EEG frequency bands defined for each subject by the estimation of the Individual
Alpha Frequency (IAF) value [31]. In this regard, before starting with the experiment,
the brain activity of each subject during a minute of rest (closed eyes) was recorded, in
order to calculate the IAF. Thus, the Theta rhythms [IAF−6 IAF−2] over the Frontal
sites and the Alpha rhythms [IAF−2 IAF+2] over the Parietal sites were investigated,
because of their strict relationship with mental workload [32], and used to compute the
mental Workload index (WL index). As introduced before, the WL index was calcu-
lated by using the machine learning approach proposed by Aricò and colleagues [28],
the automatic stop-StepWise Linear Discriminant Analysis (asSWLDA) classifier. The
time resolution of the provided WL index has been fixed at 8 s, since this value has
been demonstrated to be a good trade-off between the resolution and the accuracy of
the measure [19]. The Perception-Reaction Time (PRT), as defined by Olson and
Sivak, is “the time from the first sighting of an obstacle until the driver applies the
brakes” [33, 34]. It has been evaluated as the difference between the Reaction time and
the Perception time.
The Perception Time is the time when the driver sees the braking of the confederate
vehicle. The Reaction Time, instead, is the time when the driver starts to brake his
vehicle. In order to calculate PRT value for each critical event performed during the test
lap, the Video Vbox Pro data recorder and the ASL Mobile Eye-XG device were
synchronized. The synchronization of the speed data and the eye-tracking data was
obtained by the methodology used in Costa, Bonetti et al., Costa, Bichicchi et al. and in
Costa, Simone et al. [35–38]. The Reaction Time was evaluated by Video Vbox-Pro
output video, as the time in which the driver starts to brake, after having looked at the
stop light of confederate vehicle (Fig. 5). The Perception Time was evaluated by ASL
Mobile Eye-XG device, as the frame in which the confederate vehicle braked, its led
stop became red and the driver saw the stop light. This represents the time of the first-
fixation of the red stop light of the confederate vehicle (Fig. 5).
EEG-Based Mental Workload and Perception-Reaction Time 7
Au
tho
r P
ro
of
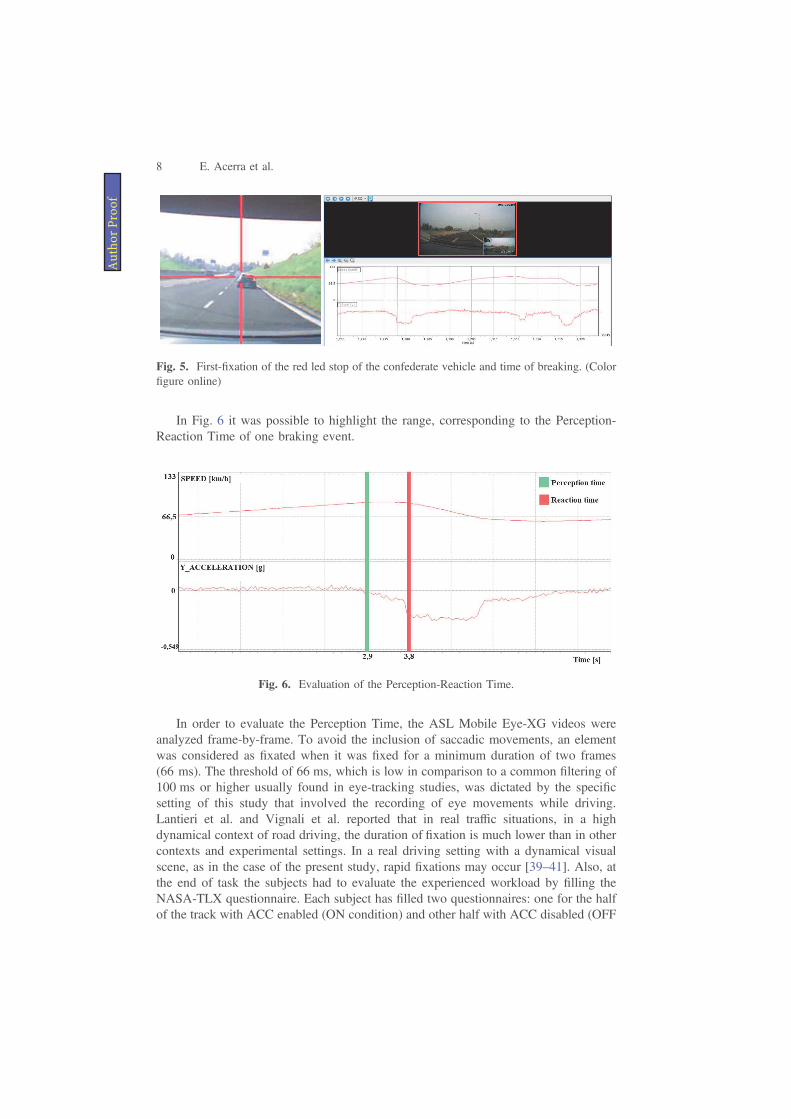
In Fig. 6 it was possible to highlight the range, corresponding to the Perception-
Reaction Time of one braking event.
In order to evaluate the Perception Time, the ASL Mobile Eye-XG videos were
analyzed frame-by-frame. To avoid the inclusion of saccadic movements, an element
was considered as fixated when it was fixed for a minimum duration of two frames
(66 ms). The threshold of 66 ms, which is low in comparison to a common filtering of
100 ms or higher usually found in eye-tracking studies, was dictated by the specific
setting of this study that involved the recording of eye movements while driving.
Lantieri et al. and Vignali et al. reported that in real traffic situations, in a high
dynamical context of road driving, the duration of fixation is much lower than in other
contexts and experimental settings. In a real driving setting with a dynamical visual
scene, as in the case of the present study, rapid fixations may occur [39–41]. Also, at
the end of task the subjects had to evaluate the experienced workload by filling the
NASA-TLX questionnaire. Each subject has filled two questionnaires: one for the half
of the track with ACC enabled (ON condition) and other half with ACC disabled (OFF
Fig. 5. First-fixation of the red led stop of the confederate vehicle and time of breaking. (Color
figure online)
Fig. 6. Evaluation of the Perception-Reaction Time.
8 E. Acerra et al.
Au
tho
r P
ro
of
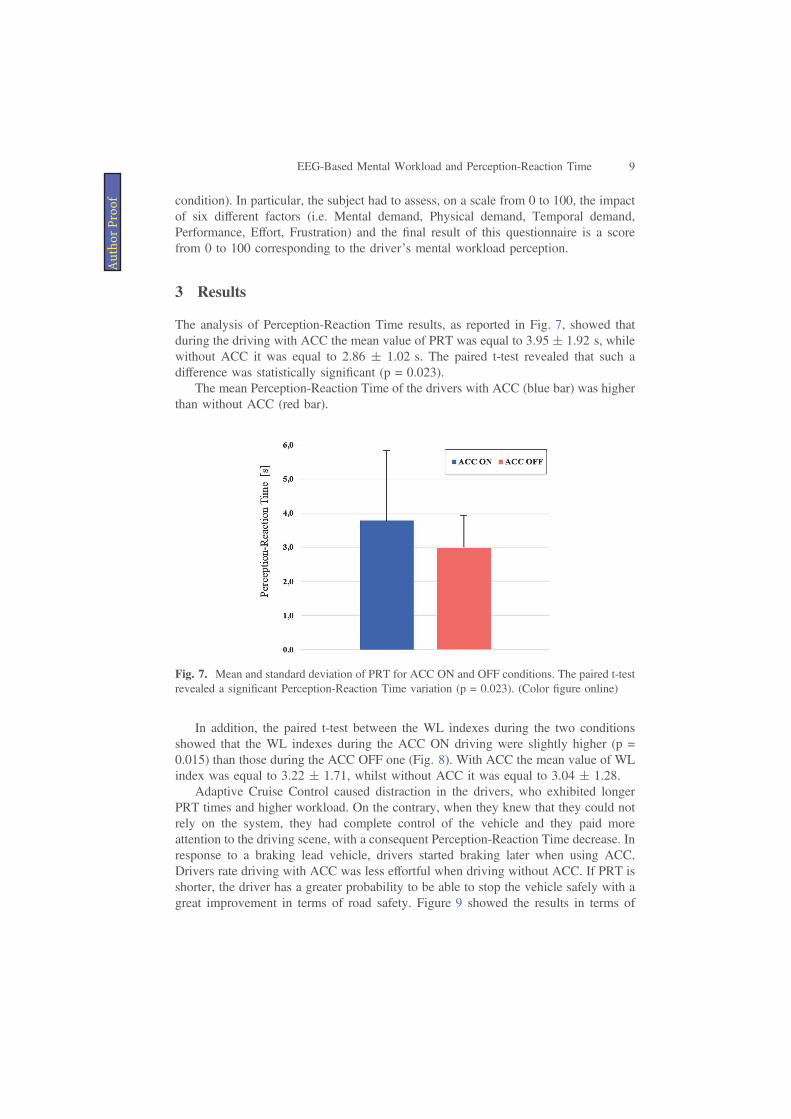
condition). In particular, the subject had to assess, on a scale from 0 to 100, the impact
of six different factors (i.e. Mental demand, Physical demand, Temporal demand,
Performance, Effort, Frustration) and the final result of this questionnaire is a score
from 0 to 100 corresponding to the driver’s mental workload perception.
3 Results
The analysis of Perception-Reaction Time results, as reported in Fig. 7, showed that
during the driving with ACC the mean value of PRT was equal to 3.95 ± 1.92 s, while
without ACC it was equal to 2.86 ± 1.02 s. The paired t-test revealed that such a
difference was statistically significant (p = 0.023).
The mean Perception-Reaction Time of the drivers with ACC (blue bar) was higher
than without ACC (red bar).
In addition, the paired t-test between the WL indexes during the two conditions
showed that the WL indexes during the ACC ON driving were slightly higher (p =
0.015) than those during the ACC OFF one (Fig. 8). With ACC the mean value of WL
index was equal to 3.22 ± 1.71, whilst without ACC it was equal to 3.04 ± 1.28.
Adaptive Cruise Control caused distraction in the drivers, who exhibited longer
PRT times and higher workload. On the contrary, when they knew that they could not
rely on the system, they had complete control of the vehicle and they paid more
attention to the driving scene, with a consequent Perception-Reaction Time decrease. In
response to a braking lead vehicle, drivers started braking later when using ACC.
Drivers rate driving with ACC was less effortful when driving without ACC. If PRT is
shorter, the driver has a greater probability to be able to stop the vehicle safely with a
great improvement in terms of road safety. Figure 9 showed the results in terms of
Fig. 7. Mean and standard deviation of PRT for ACC ON and OFF conditions. The paired t-test
revealed a significant Perception-Reaction Time variation (p = 0.023). (Color figure online)
EEG-Based Mental Workload and Perception-Reaction Time 9
Au
tho
r P
ro
of
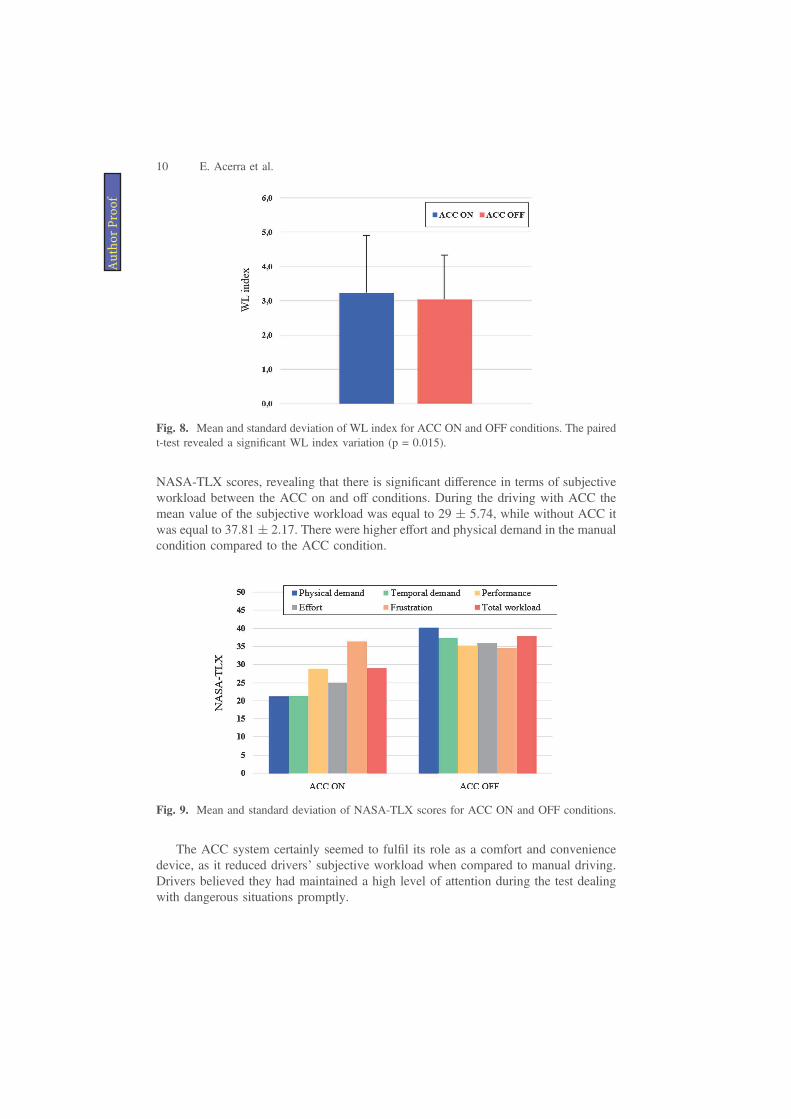
NASA-TLX scores, revealing that there is significant difference in terms of subjective
workload between the ACC on and off conditions. During the driving with ACC the
mean value of the subjective workload was equal to 29 ± 5.74, while without ACC it
was equal to 37.81 ± 2.17. There were higher effort and physical demand in the manual
condition compared to the ACC condition.
The ACC system certainly seemed to fulfil its role as a comfort and convenience
device, as it reduced drivers’ subjective workload when compared to manual driving.
Drivers believed they had maintained a high level of attention during the test dealing
with dangerous situations promptly.
Fig. 8. Mean and standard deviation of WL index for ACC ON and OFF conditions. The paired
t-test revealed a significant WL index variation (p = 0.015).
Fig. 9. Mean and standard deviation of NASA-TLX scores for ACC ON and OFF conditions.
10 E. Acerra et al.
Au
tho
r P
ro
of
This, actually, led to increased distraction and higher Perception – Reaction Times
with ACC. Subjects reacted more slowly to a safety-relevant brake light detection task,
and responded within an unsafe time when using ACC.
4 Discussion and Conclusions
The Advanced Driver-Assistance Systems (ADAS) positively influence the factors
concerning road safety, but they also have effects on the behavior of drivers. In this
paper, an experimental test has been carried out in order to evaluate if the use of the
Adaptive Cruise Control system could influence the Perception-Reaction Times and
mental workload of drivers. The results obtained demonstrated the reliability and
effectiveness of the proposed methodology based on human EEG signals, to objectively
measure driver’s mental workload, and on Mobile Eye-XG device, to evaluate the
Perception-Reaction times of drivers. The proposed approach should allow investi-
gating the relationship between human mental behavior, performance and road safety.
The results achieved showed that the mean Perception-Reaction Time and the mean
mental workload with ACC were higher than without ACC. Results from this study
demonstrate that ACC system induced behavioral adaptation in drivers, in terms of
changes in workload and hazard detection. Subjects reacted more slowly to a safety-
relevant brake task, when using ACC. When the Adaptive Cruise Control was active, it
caused distraction in the drivers who exhibited long reaction times. NASA-TLX
questionnaire, however, showed there was higher subjective workload in the manual
condition compared to the ACC condition. These data are even more significant
considering that subjects wore eye tracking glasses and EEG cap, drove an unfamiliar
car and knew that their driving behavior was being studied. One may assume that their
driving style was more careful than under real-life conditions. From a larger point of
view, the present study also demonstrated how such a multimodal evaluation, inte-
grating traditional measures (e.g. car parameters) with innovative methodologies (i.e.
neurophysiological measures such as EEG and ET), could provide new and more
objective insights. Actually, contrarily to the self-perception, to drive with ACC ON
produced higher workload, probably because the drivers were distracted other actions
within the car. Therefore, the higher workload could be considered as an indirect effect
of ADAS systems, since actually the mere action of driving is perceived as easier by
the drivers. However, this results in larger PRT values and therefore in risky behaviors.
This preliminary study paves the way to the application of these methodologies to
evaluate in real conditions human behavior related to road safety, also considering the
recent technological advancements that are making this instrumentation less invasive
and easier to use [42, 43]. Further studies are encouraged in order to enlarge experi-
mental sample as well as to treat also other kinds of events as well as ADAS
technologies.
Acknowledgments. The authors are grateful to the Unipol Group Spa and, in particular,
ALFAEVOLUTION TECHNOLOGY, for the considerable help given in the research study.
This work has been also co-financed by the European Commission through the Horizon2020
EEG-Based Mental Workload and Perception-Reaction Time 11
Au
tho
r P
ro
of
project H2020-MG-2016 Simulator of behavioural aspects for safer transport, “SimuSafe”, (GA
n. 723386), and the project “BrainSafeDrive: A Technology to detect Mental States During Drive
for improving the Safety of the road” (Italy-Sweden collaboration).
References
1. World Health Organization: Global Status Report on Road Safety 2018
2. Graydon, F.X., et al.: Visual event detection during simulated driving: identifying the neural
correlates with functional neuroimaging. Transp. Res. Part F Traffic Psychol. Behav. 7, 271–
286 (2004)
3. Bucchi, A., Sangiorgi, C., Vignali, V.: Traffic psychology and driver behavior. Procedia Soc.
Behav. Sci. 53, 972–979 (2012)
4. Dondi, G., Simone, A., Lantieri, C., Vignali, V.: Bike lane design: the Context Sensitive
Approach. Procedia Eng. 21, 897–906 (2011)
5. Di Flumeri, G., et al.: EEG-based mental workload neurometric to evaluate the impact of
different traffic and road conditions in real driving settings. Front. Hum. Neurosci. 12, 509
(2018)
6. Fan, J., Smith, A.P.: The impact of workload and fatigue on performance. In: Longo, L.,
Leva, M.C. (eds.) H-WORKLOAD 2017. CCIS, vol. 726, pp. 90–105. Springer, Cham
(2017). https://doi.org/10.1007/978-3-319-61061-0_6
7. Salmon, P.M., Young, K.L., Lenné, M.G., Williamson, A., Tomesevic, N., Rudin-Brown, C.
M.: To err (on the road) is human? An on-road study of driver errors. In: Proceedings of the
Australasian Road Safety Research, Policing and Education Conference, Canberra (2010)
8. Stanton, N.A., Marsden, P.: From fly-by-wire to drive-by-wire: safety implications of
automation in vehicles. Saf. Sci. 24, 35–49 (1996)
9. Chira-Chavala, T., Yoo, S.M.: Potential safety benefits of intelligent cruise control systems.
Accid. Anal. Prev. 26, 135–146 (1994)
10. Rudin-Brown, C.M., Parker, H.A.: Behavioural adaptation to adaptive cruise control (ACC):
implications for preventive strategies. Transp. Res. Part F Traffic Psychol. Behav. 7, 59–76
(2004)
11. Brown, C.M.: The concept of behavioural adaptation: does it occur in response to lane
departure warnings? In: International Conference on Traffic and Transport Psychology,
pp. 1–14 (2000)
12. Smiley, A.: Behavioural adaptation, safety, and intelligent transportation systems.
Transp. Res. Rec. 724, 47–51 (2000)
13. Fancher, P.S., et al.: Intelligent cruise control field operation test. NHTSA Report
No. DOT HS 808 849 (1998)
14. Stanton, N.A., Young, M., McCaulder, B.: Drive-by-wire: the case of driver workload and
reclaiming control with adaptive cruise control. Saf. Sci. 27, 149–159 (1997)
15. Hoedemaeker, M., Kopf, M.: Visual sampling behaviour when driving with adaptive cruise
control. In: Proceedings of the Ninth International Conference on Vision in Vehicles,
Australia, 19–22 August 2001
16. de Winter, J.C.F., Happee, R., Martens, M.H., Stanton, N.A.: Effects of adaptive cruise
control and highly automated driving on workload and situation awareness: a review of the
empirical evidence. Transp. Res. Part F Traffic Psychol. Behav. 27, 196–217 (2014)
17. Pierre, P., et al.: Fatigue, sleepiness, and performance in simulated versus real driving
conditions. Sleep 28, 1511–1516 (2005)
12 E. Acerra et al.
Au
tho
r P
ro
of
18. Tong, S., Helman, S., Balfe, N., Fowler, C., Delmonte, E., Hutchins, R.: Workload
differences between on-road and off-road manoeuvres for motorcyclists. In: Longo, L., Leva,
M.C. (eds.) H-WORKLOAD 2017. CCIS, vol. 726, pp. 239–250. Springer, Cham (2017).
https://doi.org/10.1007/978-3-319-61061-0_16
19. Aricò, P., et al.: Adaptive automation triggered by EEG-based mental workload index: a
passive brain-computer interface application in realistic air traffic control environment.
Front. Hum. Neurosci. 10, 539–552 (2016)
20. Prinzel, L.J., Freeman, F.G., Scerbo, M.W., Mikulka, P.J., Pope, A.T.: A closed-loop system
for examining psychophysiological measures for adaptive task allocation. International
Journal of Aviation Psychology 10, 393–410 (2000)
21. Di Flumeri, G., et al.: Mental workload assessment as taxonomic tool for neuroergonomics.
In: Ayaz, H., Dehais, F. (eds.) Neuroergonomics. The Brain at Work and in Everyday Life.
Elsevier, Amsterdam (2018)
22. Aricò, P., et al.: Human factors and neurophysiological metrics in air traffic control: a critical
review. IEEE Rev. Biomed. Eng. 10, 250–263 (2017)
23. Hogema, J.H., Janssen, W.H., Coemet, M., Soeteman, H.J.: Effects of intelligent cruise
control on driving behaviour: a simulator study. In: Proceedings of the 3rd World Congress
on Intelligent Transport Systems (1996)
24. Costa, M., Bonetti, L., Bellelli, M., Lantieri, C., Vignali, V., Simone, A.: Reflective tape
applied to bicycle frame and conspicuity enhancement at night. Hum. Factors 59, 485–500
(2017)
25. Costa, M., Bonetti, L., Vignali, V., Bichicchi, A., Lantieri, C., Simone, A.: Driver’s visual
attention to different categories of roadside advertising signs. Appl. Ergon. 78, 127–136
(2019)
26. Costa, M., Simone, A., Vignali, V., Lantieri, C., Bucchi, A., Dondi, G.: Looking behavior
for vertical road signs. Transp. Res. Part F Psychol. Behav. 23, 147–155 (2014)
27. Dienes, Z.: Assumptions of subjective measures of unconscious mental states: higher order
thoughts and bias. J. Conscious. Stud. 11, 25–45 (2004)
28. Aricò, P., Borghini, G., Di Flumeri, G., Colosimo, A., Pozzi, S., Babiloni, F.: A passive
brain–computer interface application for the mental workload assessment on professional air
traffic controllers during realistic air traffic control tasks. Prog. Brain Res. 228, 295–328
(2016)
29. Di Flumeri, G., Aricò, P., Borghini, G., Colosimo, A., Babiloni, F.: A new regression-based
method for the eye blinks artifacts correction in the EEG signal, without using any EOG
channel. In: Proceedings of the Annual International Conference of the IEEE Engineering in
Medicine and Biology Society. IEEE Engineering in Medicine and Biology Society (2016)
30. Elul, R.: Gaussian behavior of the electroencephalogram: changes during performance of
mental task. Science 164, 328–331 (1969)
31. Klimesch, W.: EEG alpha and theta oscillations reflect cognitive and memory performance:
a review and analysis. Brain Res. Rev. 29, 2–3 (1999)
32. Borghini, G., Astolfi, L., Vecchiato, G., Mattia, D., Babiloni, F.: Measuring neurophysi-
ological signals in aircraft pilots and car drivers for the assessment of mental workload,
fatigue and drowsiness. Neurosci. Biobehav. Rev. 44, 58–75 (2014)
33. Olson, P.L., Sivak, M.: Perception-response time to unexpected roadway hazards. Hum.
Fact. J. Hum. Fact. Ergon. Soc. 28, 91–96 (1986)
34. Li, Y., Chen, Y.: Driver vision based perception-response time prediction and assistance
model on mountain highway curve. Int. J. Environ. Res. Public Health 14, 1–31 (2017)
35. Costa, M., et al.: The influence of pedestrian crossings features on driving behavior and road
safety. In: Proceedings of the AIIT International Congress on Transport Infrastructure and
Systems, pp. 741–746 (2017)
EEG-Based Mental Workload and Perception-Reaction Time 13
Au
tho
r P
ro
of
36. Costa, M., Bichicchi, A., Nese, M., Lantieri, C., Vignali, V., Simone, A.: T-junction priority
scheme and road user’s yielding behavior. Transp. Res. Part F Traffic Psychol. Behav. 60,
770–782 (2019)
37. Costa, M., Bonetti, L., Vignali, V., Lantieri, C., Simone, A.: The role of peripheral vision in
vertical road sign identification and discrimination. Transp. Res. Part F Traffic Psychol.
Behav. 61, 1619–1634 (2018)
38. Costa, M., Simone, A., Vignali, V., Lantieri, C., Palena, N.: Fixation distance and fixation
duration to vertical road signs. Appl. Ergon. 69, 48–57 (2018)
39. Lantieri, C., et al.: Gateway design assessment in the transition from high to low speed areas.
Transp. Res. Part F Traffic Psychol. Behav. 34, 41–53 (2015)
40. Vignali, V., Bichicchi, A., Simone, A., Lantieri, C., Dondi, G., Costa, M.: Road sign vision
and driver behaviour in work zones. Transp. Res. Part F Traffic Psychol. Behav. 60, 474–484
(2019)
41. Vignali, V., et al.: Effects of median refuge island and flashing vertical sign on conspicuity
and safety of unsignalized crosswalks. Transp. Res. Part F Traffic Psychol. Behav. 60, 427–
439 (2019)
42. Aricò, P., Borghini, G., Di Flumeri, G., Sciaraffa, N., Babiloni, F.: Passive BCI beyond the
lab: current trends and future directions. Physiol. Meas. 39(8), 08TR02 (2018)
43. Di Flumeri, G., Aricò, P., Borghini, G., Sciaraffa, N., Di Florio, A., Babiloni, F.: The dry
revolution: evaluation of three different EEG dry electrode types in terms of signal spectral
features, mental states classification and usability. Sensors 19(6), 1365 (2019)
14 E. Acerra et al.
Au
tho
r P
ro
of
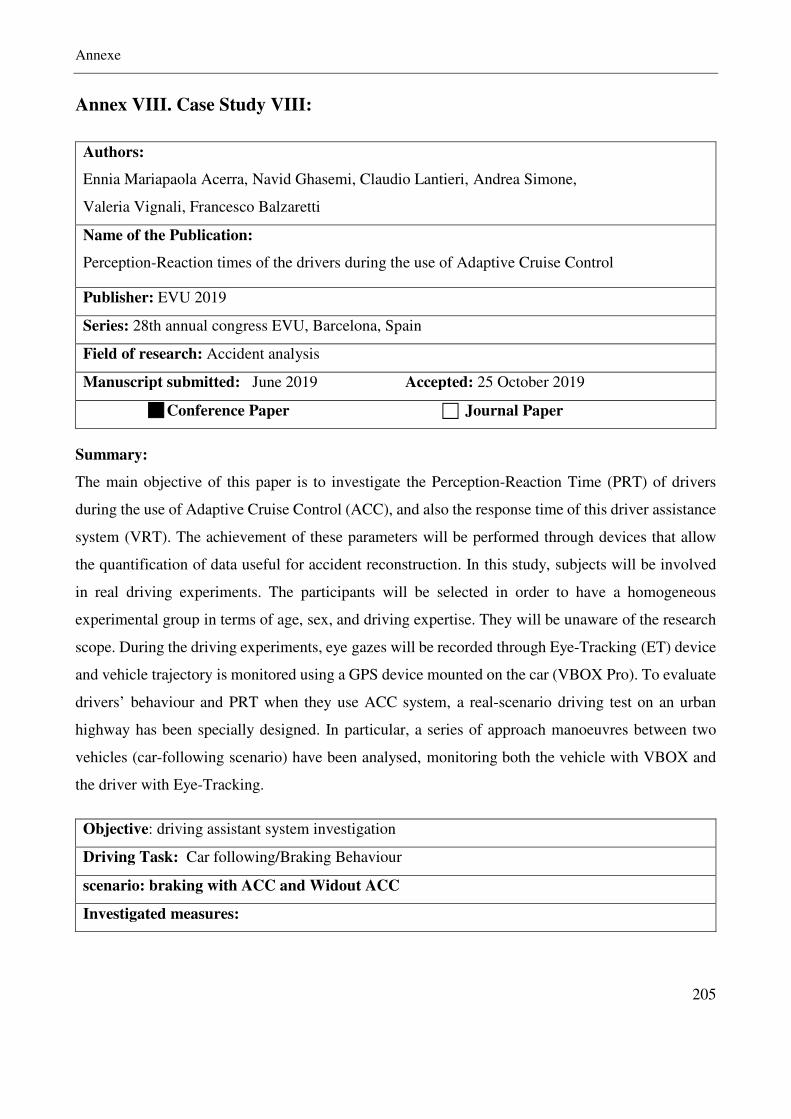
Annexe
205
Annex VIII. Case Study VIII:
Authors:
Ennia Mariapaola Acerra, Navid Ghasemi, Claudio Lantieri, Andrea Simone,
Valeria Vignali, Francesco Balzaretti
Name of the Publication:
Perception-Reaction times of the drivers during the use of Adaptive Cruise Control
Publisher: EVU 2019
Series: 28th annual congress EVU, Barcelona, Spain
Field of research: Accident analysis
Manuscript submitted: June 2019 Accepted: 25 October 2019
Conference Paper Journal Paper
Summary:
The main objective of this paper is to investigate the Perception-Reaction Time (PRT) of drivers
during the use of Adaptive Cruise Control (ACC), and also the response time of this driver assistance
system (VRT). The achievement of these parameters will be performed through devices that allow
the quantification of data useful for accident reconstruction. In this study, subjects will be involved
in real driving experiments. The participants will be selected in order to have a homogeneous
experimental group in terms of age, sex, and driving expertise. They will be unaware of the research
scope. During the driving experiments, eye gazes will be recorded through Eye-Tracking (ET) device
and vehicle trajectory is monitored using a GPS device mounted on the car (VBOX Pro). To evaluate
drivers’ behaviour and PRT when they use ACC system, a real-scenario driving test on an urban
highway has been specially designed. In particular, a series of approach manoeuvres between two
vehicles (car-following scenario) have been analysed, monitoring both the vehicle with VBOX and
the driver with Eye-Tracking.
Objective: driving assistant system investigation
Driving Task: Car following/Braking Behaviour
scenario: braking with ACC and Widout ACC
Investigated measures:
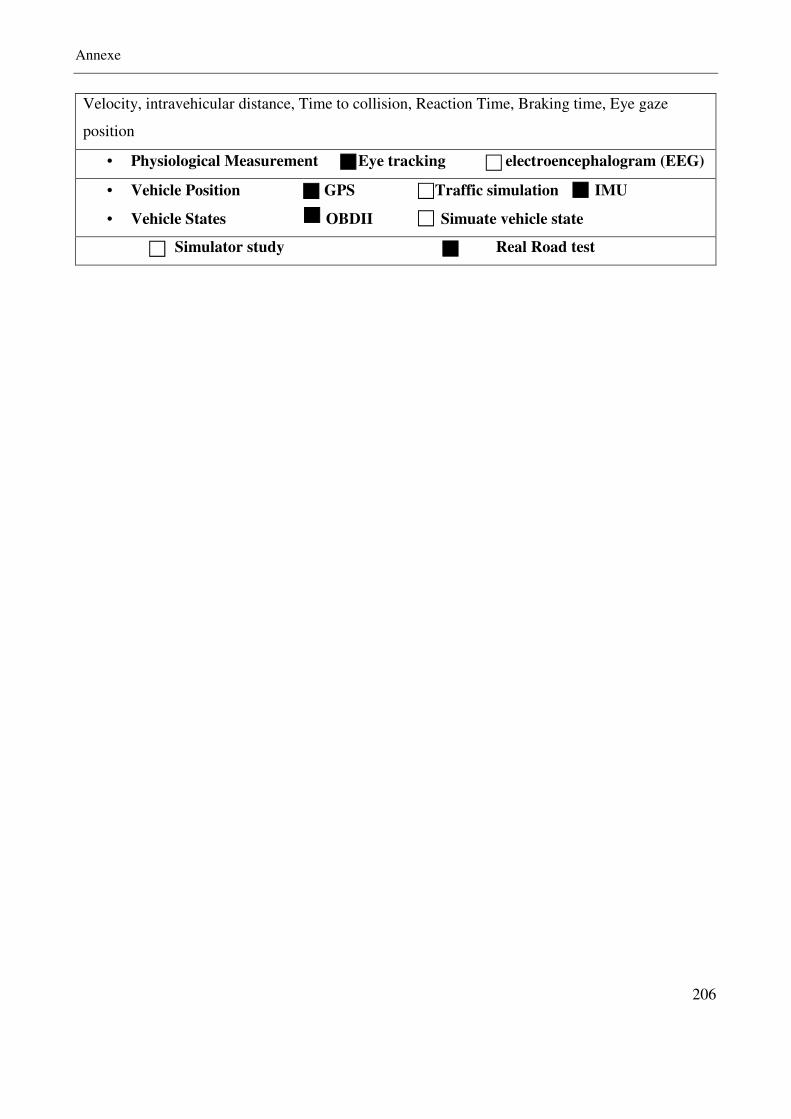
Annexe
206
Velocity, intravehicular distance, Time to collision, Reaction Time, Braking time, Eye gaze
position
• Physiological Measurement Eye tracking electroencephalogram (EEG)
• Vehicle Position GPS Traffic simulation IMU
• Vehicle States OBDII Simuate vehicle state
Simulator study Real Road test
- 1 -
© 2019 by EVU Perception-Reaction times of the drivers during the use of Adaptive Cruise Control
Ennia Mariapaola Acerra1, Navid Ghasemi1, Claudio Lantieri1, Andrea Si-
mone1, Valeria Vignali1, Francesco Balzaretti2 1 Department of Civil, Chemical, Environmental and Material Engineering (DICAM), University of Bologna, Viale Risorgimento 2, 40136, Bologna, Italy 2 ASAIS – EVU Italia
Abstract
Car driving is considered a very complex activity, consisting of different concomitant tasks, thus it is crucial to understand the impact of different factors such as road complexity, traffic, dashboard de-vices, and external events on the driver’s behavior and performance. For this reason, in particular situations the cognitive demand experienced by the driver could be very high, inducing an exces-sive experienced mental workload and consequently an increasing of error commission probability.One of these situations is related to the presence of different Advanced Driver Assistance Systemsinside the car, because the interaction with these devices can represent an additional source of driving-related distraction. The main objective of this paper is to investigate the Perception-Reaction Time (PRT) of drivers during the use of Adaptive Cruise Control (ACC). The achievement of these parameters will be per-formed through devices that allow the quantification of data useful for the accident reconstruction. In this study, subjects will be involved in real driving experiments. The participants will be selected in order to have a homogeneous experimental group in terms of age, sex, and driving expertise. They will be unaware of the research scope. During the driving experiments, eye gazes will be recorded through Eye-Tracking (ET) device and vehicle trajectory is monitored using a GPS device mounted on the car (VBOX Pro). To evaluate drivers’ behaviour and PRT when they use ACC system, a real-scenario driving test on an urban highway has been specially designed. In particular, a series of approach manoeuvres between two vehicles (car-following scenario) have been analysed, monitor-ing both the vehicle with VBOX and the driver with Eye-Tracking.
1. Introduction
The Advanced Driver Assistance Systems (ADAS) are born with the aim of supporting the driver on the road scenario. The aim is to in-crease safety, trying to limit dangerous situa-tions for the driver and for the other protagonists of the road environment. Furthermore, these systems are the beginning for an singular de-velopment of automation.
The ADAS influence positively the factors con-cerning road safety, but they also have effects on the behavior of drivers (Takada, 2001). In-deed, the variation of their attitudes are often very influential, due to the presence of driving support systems (Tno et al., 2016). These spe-cific assessments are attributable to the aware-
ness that these systems could lead to the loss of the attention of the driver from the primary task, i.e. the task of driving.
As a result, the subject may not notice a sudden danger and find himself unprepared to react promptly. The impact on road safety of these technologies does not often meet the expected benefits especially at a behavioral level. (Winter, et al., 2014). This change to their con-duct is called Behavioral Adaptation (BA).
The first studies on automation, with the first versions of the ACC, underscore that drivers of vehicles equipped with such a system were generally slower in their reactions, than those using manual control. This peculiarity emerged during critical traffic situations, such as sudden
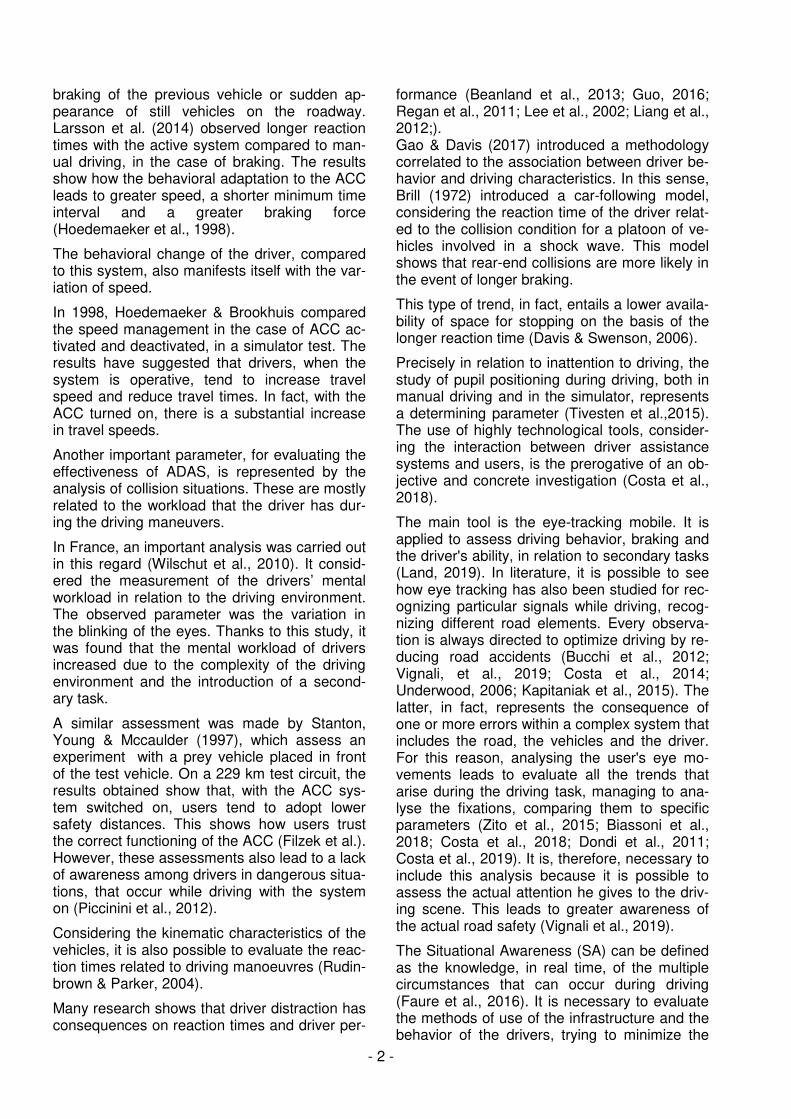
- 2 -
braking of the previous vehicle or sudden ap-pearance of still vehicles on the roadway. Larsson et al. (2014) observed longer reaction times with the active system compared to man-ual driving, in the case of braking. The results show how the behavioral adaptation to the ACC leads to greater speed, a shorter minimum time interval and a greater braking force (Hoedemaeker et al., 1998).
The behavioral change of the driver, compared to this system, also manifests itself with the var-iation of speed.
In 1998, Hoedemaeker & Brookhuis compared the speed management in the case of ACC ac-tivated and deactivated, in a simulator test. The results have suggested that drivers, when the system is operative, tend to increase travel speed and reduce travel times. In fact, with the ACC turned on, there is a substantial increase in travel speeds.
Another important parameter, for evaluating the effectiveness of ADAS, is represented by the analysis of collision situations. These are mostly related to the workload that the driver has dur-ing the driving maneuvers.
In France, an important analysis was carried out in this regard (Wilschut et al., 2010). It consid-ered the measurement of the drivers’ mental workload in relation to the driving environment. The observed parameter was the variation in the blinking of the eyes. Thanks to this study, it was found that the mental workload of drivers increased due to the complexity of the driving environment and the introduction of a second-ary task.
A similar assessment was made by Stanton, Young & Mccaulder (1997), which assess an experiment with a prey vehicle placed in front of the test vehicle. On a 229 km test circuit, the results obtained show that, with the ACC sys-tem switched on, users tend to adopt lower safety distances. This shows how users trust the correct functioning of the ACC (Filzek et al.). However, these assessments also lead to a lack of awareness among drivers in dangerous situa-tions, that occur while driving with the system on (Piccinini et al., 2012).
Considering the kinematic characteristics of the vehicles, it is also possible to evaluate the reac-tion times related to driving manoeuvres (Rudin-brown & Parker, 2004).
Many research shows that driver distraction has consequences on reaction times and driver per-
formance (Beanland et al., 2013; Guo, 2016; Regan et al., 2011; Lee et al., 2002; Liang et al., 2012;). Gao & Davis (2017) introduced a methodology correlated to the association between driver be-havior and driving characteristics. In this sense, Brill (1972) introduced a car-following model, considering the reaction time of the driver relat-ed to the collision condition for a platoon of ve-hicles involved in a shock wave. This model shows that rear-end collisions are more likely in the event of longer braking.
This type of trend, in fact, entails a lower availa-bility of space for stopping on the basis of the longer reaction time (Davis & Swenson, 2006).
Precisely in relation to inattention to driving, the study of pupil positioning during driving, both in manual driving and in the simulator, represents a determining parameter (Tivesten et al.,2015). The use of highly technological tools, consider-ing the interaction between driver assistance systems and users, is the prerogative of an ob-jective and concrete investigation (Costa et al., 2018).
The main tool is the eye-tracking mobile. It is applied to assess driving behavior, braking and the driver's ability, in relation to secondary tasks (Land, 2019). In literature, it is possible to see how eye tracking has also been studied for rec-ognizing particular signals while driving, recog-nizing different road elements. Every observa-tion is always directed to optimize driving by re-ducing road accidents (Bucchi et al., 2012; Vignali, et al., 2019; Costa et al., 2014; Underwood, 2006; Kapitaniak et al., 2015). The latter, in fact, represents the consequence of one or more errors within a complex system that includes the road, the vehicles and the driver. For this reason, analysing the user's eye mo-vements leads to evaluate all the trends that arise during the driving task, managing to ana-lyse the fixations, comparing them to specific parameters (Zito et al., 2015; Biassoni et al., 2018; Costa et al., 2018; Dondi et al., 2011; Costa et al., 2019). It is, therefore, necessary to include this analysis because it is possible to assess the actual attention he gives to the driv-ing scene. This leads to greater awareness of the actual road safety (Vignali et al., 2019).
The Situational Awareness (SA) can be defined as the knowledge, in real time, of the multiple circumstances that can occur during driving (Faure et al., 2016). It is necessary to evaluate the methods of use of the infrastructure and the behavior of the drivers, trying to minimize the
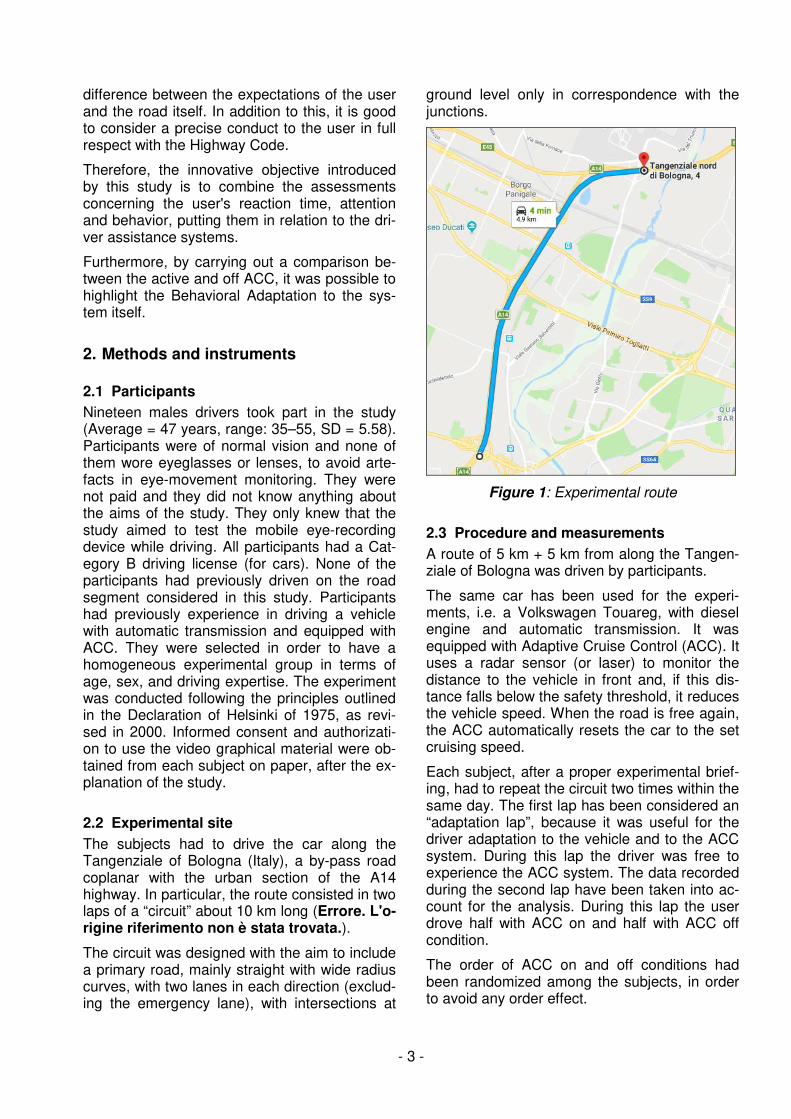
- 3 -
difference between the expectations of the user and the road itself. In addition to this, it is good to consider a precise conduct to the user in full respect with the Highway Code.
Therefore, the innovative objective introduced by this study is to combine the assessments concerning the user's reaction time, attention and behavior, putting them in relation to the dri-ver assistance systems.
Furthermore, by carrying out a comparison be-tween the active and off ACC, it was possible to highlight the Behavioral Adaptation to the sys-tem itself.
2. Methods and instruments
2.1 Participants
Nineteen males drivers took part in the study (Average = 47 years, range: 35–55, SD = 5.58). Participants were of normal vision and none of them wore eyeglasses or lenses, to avoid arte-facts in eye-movement monitoring. They were not paid and they did not know anything about the aims of the study. They only knew that the study aimed to test the mobile eye-recording device while driving. All participants had a Cat-egory B driving license (for cars). None of the participants had previously driven on the road segment considered in this study. Participants had previously experience in driving a vehicle with automatic transmission and equipped with ACC. They were selected in order to have a homogeneous experimental group in terms of age, sex, and driving expertise. The experiment was conducted following the principles outlined in the Declaration of Helsinki of 1975, as revi-sed in 2000. Informed consent and authorizati-on to use the video graphical material were ob-tained from each subject on paper, after the ex-planation of the study.
2.2 Experimental site
The subjects had to drive the car along the Tangenziale of Bologna (Italy), a by-pass road coplanar with the urban section of the A14 highway. In particular, the route consisted in two laps of a “circuit” about 10 km long (Errore. L'o-rigine riferimento non è stata trovata.).
The circuit was designed with the aim to include a primary road, mainly straight with wide radius curves, with two lanes in each direction (exclud-ing the emergency lane), with intersections at
ground level only in correspondence with the junctions.
Figure 1: Experimental route
2.3 Procedure and measurements
A route of 5 km + 5 km from along the Tangen-ziale of Bologna was driven by participants.
The same car has been used for the experi-ments, i.e. a Volkswagen Touareg, with diesel engine and automatic transmission. It was equipped with Adaptive Cruise Control (ACC). It uses a radar sensor (or laser) to monitor the distance to the vehicle in front and, if this dis-tance falls below the safety threshold, it reduces the vehicle speed. When the road is free again, the ACC automatically resets the car to the set cruising speed.
Each subject, after a proper experimental brief-ing, had to repeat the circuit two times within the same day. The first lap has been considered an “adaptation lap”, because it was useful for the driver adaptation to the vehicle and to the ACC system. During this lap the driver was free to experience the ACC system. The data recorded during the second lap have been taken into ac-count for the analysis. During this lap the user drove half with ACC on and half with ACC off condition.
The order of ACC on and off conditions had been randomized among the subjects, in order to avoid any order effect.
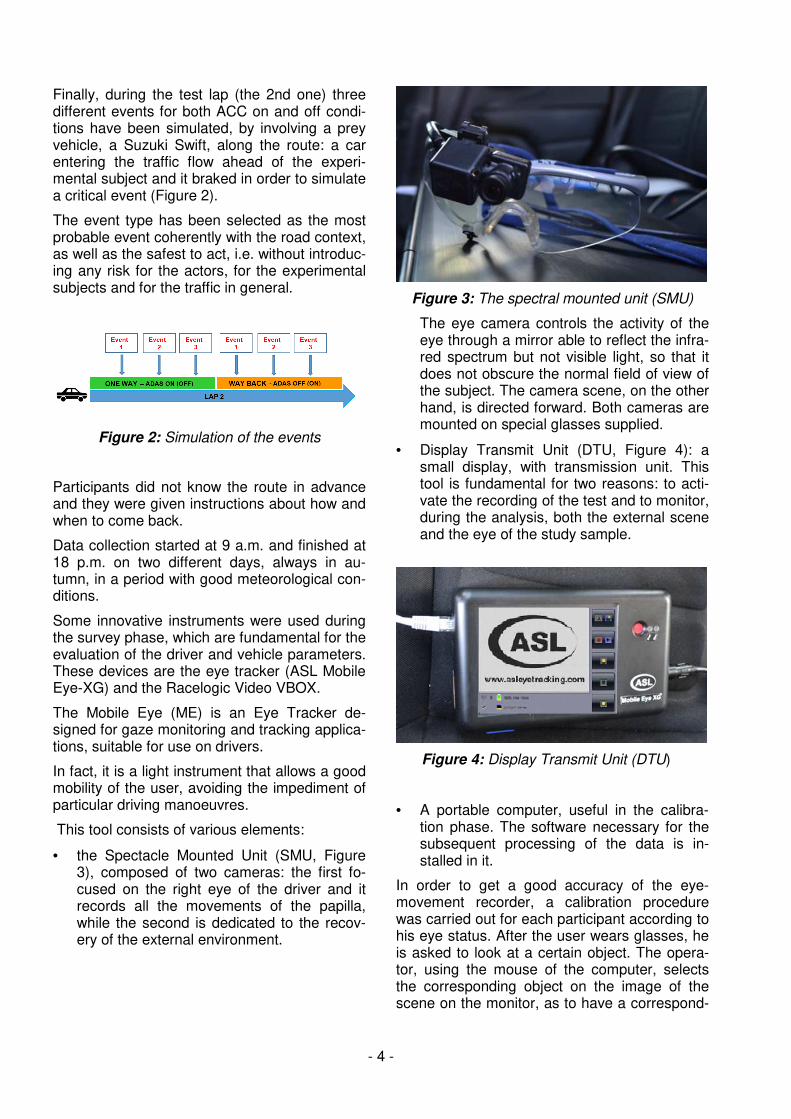
- 4 -
Finally, during the test lap (the 2nd one) three different events for both ACC on and off condi-tions have been simulated, by involving a prey vehicle, a Suzuki Swift, along the route: a car entering the traffic flow ahead of the experi-mental subject and it braked in order to simulate a critical event (Figure 2).
The event type has been selected as the most probable event coherently with the road context, as well as the safest to act, i.e. without introduc-ing any risk for the actors, for the experimental subjects and for the traffic in general.
Figure 2: Simulation of the events
Participants did not know the route in advance and they were given instructions about how and when to come back.
Data collection started at 9 a.m. and finished at 18 p.m. on two different days, always in au-tumn, in a period with good meteorological con-ditions.
Some innovative instruments were used during the survey phase, which are fundamental for the evaluation of the driver and vehicle parameters. These devices are the eye tracker (ASL Mobile Eye-XG) and the Racelogic Video VBOX.
The Mobile Eye (ME) is an Eye Tracker de-signed for gaze monitoring and tracking applica-tions, suitable for use on drivers.
In fact, it is a light instrument that allows a good mobility of the user, avoiding the impediment of particular driving manoeuvres.
This tool consists of various elements:
• the Spectacle Mounted Unit (SMU, Figure 3), composed of two cameras: the first fo-cused on the right eye of the driver and it records all the movements of the papilla, while the second is dedicated to the recov-ery of the external environment.
Figure 3: The spectral mounted unit (SMU)
The eye camera controls the activity of the eye through a mirror able to reflect the infra-red spectrum but not visible light, so that it does not obscure the normal field of view of the subject. The camera scene, on the other hand, is directed forward. Both cameras are mounted on special glasses supplied.
• Display Transmit Unit (DTU, Figure 4): a small display, with transmission unit. This tool is fundamental for two reasons: to acti-vate the recording of the test and to monitor, during the analysis, both the external scene and the eye of the study sample.
Figure 4: Display Transmit Unit (DTU)
• A portable computer, useful in the calibra-tion phase. The software necessary for the subsequent processing of the data is in-stalled in it.
In order to get a good accuracy of the eye-movement recorder, a calibration procedure was carried out for each participant according to his eye status. After the user wears glasses, he is asked to look at a certain object. The opera-tor, using the mouse of the computer, selects the corresponding object on the image of the scene on the monitor, as to have a correspond-
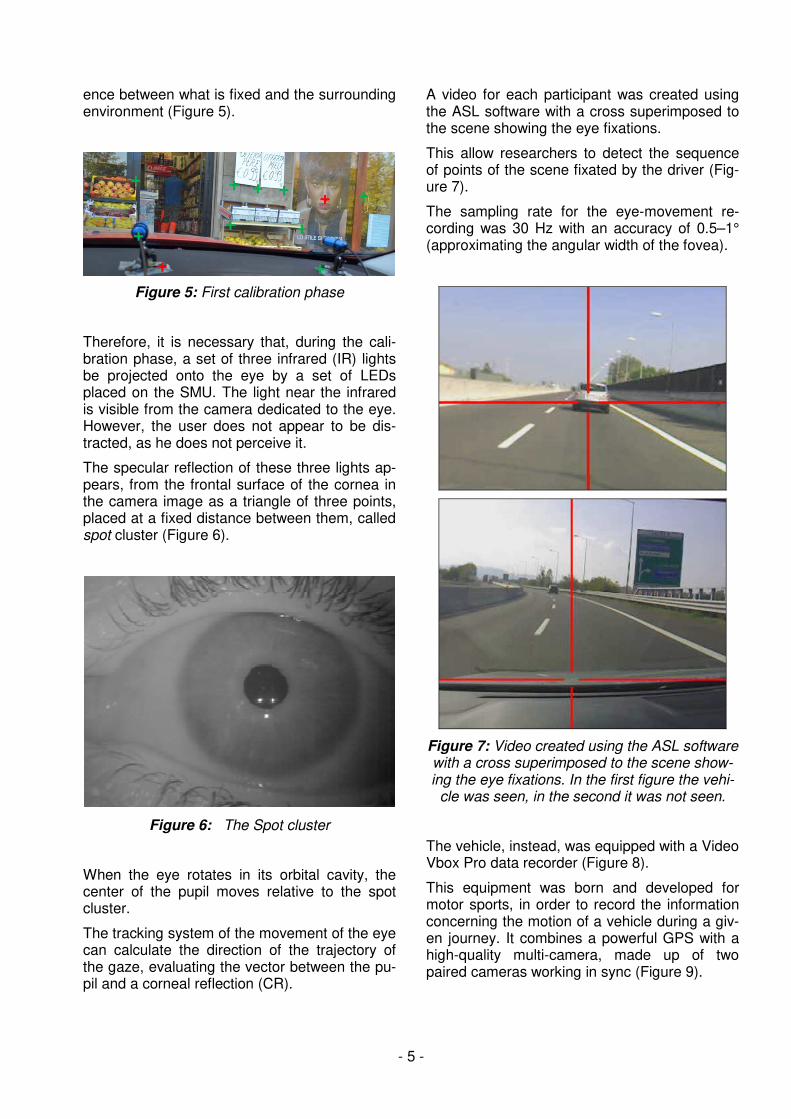
- 5 -
ence between what is fixed and the surrounding environment (Figure 5).
Figure 5: First calibration phase
Therefore, it is necessary that, during the cali-bration phase, a set of three infrared (IR) lights be projected onto the eye by a set of LEDs placed on the SMU. The light near the infrared is visible from the camera dedicated to the eye. However, the user does not appear to be dis-tracted, as he does not perceive it.
The specular reflection of these three lights ap-pears, from the frontal surface of the cornea in the camera image as a triangle of three points, placed at a fixed distance between them, called spot cluster (Figure 6).
Figure 6: The Spot cluster
When the eye rotates in its orbital cavity, the center of the pupil moves relative to the spot cluster.
The tracking system of the movement of the eye can calculate the direction of the trajectory of the gaze, evaluating the vector between the pu-pil and a corneal reflection (CR).
A video for each participant was created using the ASL software with a cross superimposed to the scene showing the eye fixations.
This allow researchers to detect the sequence of points of the scene fixated by the driver (Fig-ure 7).
The sampling rate for the eye-movement re-cording was 30 Hz with an accuracy of 0.5–1° (approximating the angular width of the fovea).
Figure 7: Video created using the ASL software with a cross superimposed to the scene show-ing the eye fixations. In the first figure the vehi-
cle was seen, in the second it was not seen.
The vehicle, instead, was equipped with a Video Vbox Pro data recorder (Figure 8).
This equipment was born and developed for motor sports, in order to record the information concerning the motion of a vehicle during a giv-en journey. It combines a powerful GPS with a high-quality multi-camera, made up of two paired cameras working in sync (Figure 9).
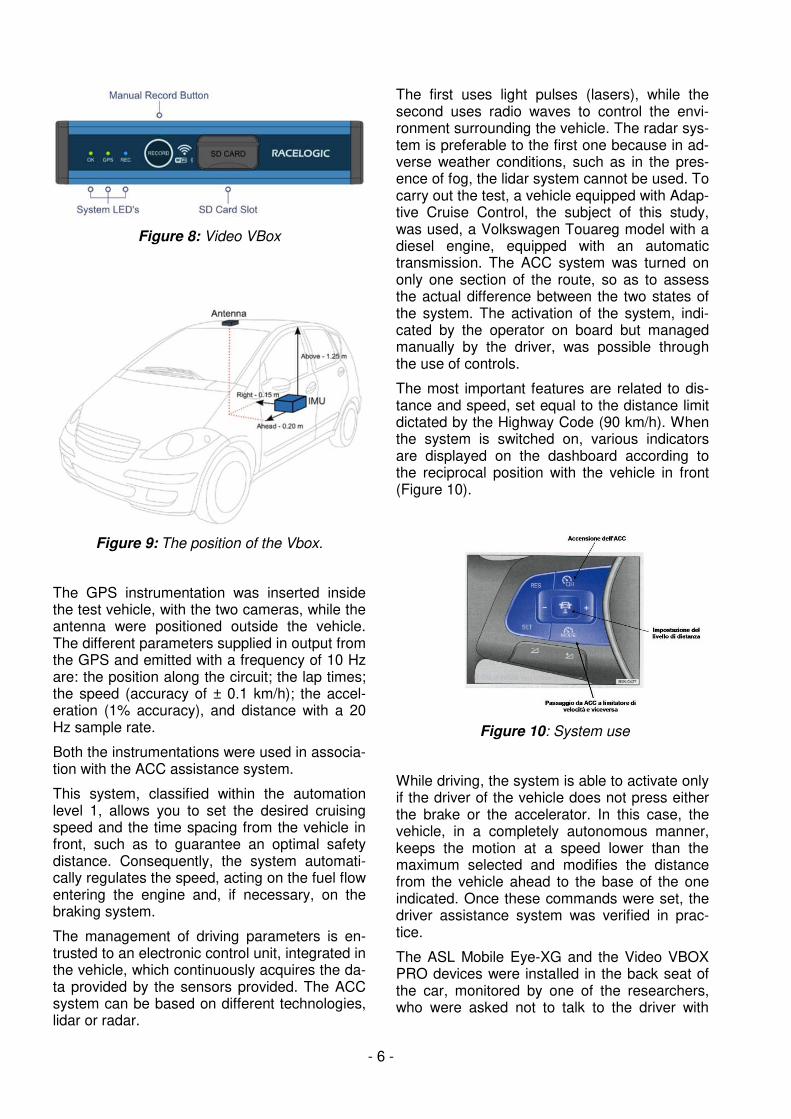
- 6 -
Figure 8: Video VBox
Figure 9: The position of the Vbox.
The GPS instrumentation was inserted inside the test vehicle, with the two cameras, while the antenna were positioned outside the vehicle. The different parameters supplied in output from the GPS and emitted with a frequency of 10 Hz are: the position along the circuit; the lap times; the speed (accuracy of ± 0.1 km/h); the accel-eration (1% accuracy), and distance with a 20 Hz sample rate.
Both the instrumentations were used in associa-tion with the ACC assistance system.
This system, classified within the automation level 1, allows you to set the desired cruising speed and the time spacing from the vehicle in front, such as to guarantee an optimal safety distance. Consequently, the system automati-cally regulates the speed, acting on the fuel flow entering the engine and, if necessary, on the braking system.
The management of driving parameters is en-trusted to an electronic control unit, integrated in the vehicle, which continuously acquires the da-ta provided by the sensors provided. The ACC system can be based on different technologies, lidar or radar.
The first uses light pulses (lasers), while the second uses radio waves to control the envi-ronment surrounding the vehicle. The radar sys-tem is preferable to the first one because in ad-verse weather conditions, such as in the pres-ence of fog, the lidar system cannot be used. To carry out the test, a vehicle equipped with Adap-tive Cruise Control, the subject of this study, was used, a Volkswagen Touareg model with a diesel engine, equipped with an automatic transmission. The ACC system was turned on only one section of the route, so as to assess the actual difference between the two states of the system. The activation of the system, indi-cated by the operator on board but managed manually by the driver, was possible through the use of controls.
The most important features are related to dis-tance and speed, set equal to the distance limit dictated by the Highway Code (90 km/h). When the system is switched on, various indicators are displayed on the dashboard according to the reciprocal position with the vehicle in front (Figure 10).
Figure 10: System use
While driving, the system is able to activate only if the driver of the vehicle does not press either the brake or the accelerator. In this case, the vehicle, in a completely autonomous manner, keeps the motion at a speed lower than the maximum selected and modifies the distance from the vehicle ahead to the base of the one indicated. Once these commands were set, the driver assistance system was verified in prac-tice.
The ASL Mobile Eye-XG and the Video VBOX PRO devices were installed in the back seat of the car, monitored by one of the researchers, who were asked not to talk to the driver with
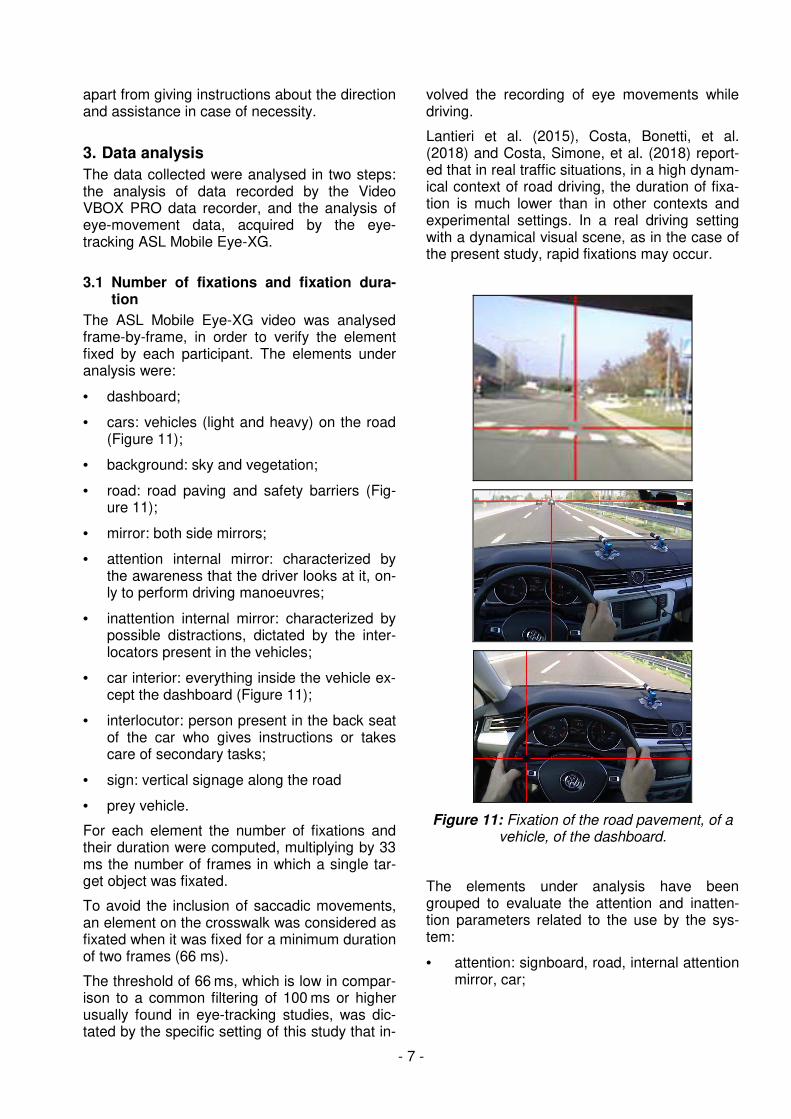
- 7 -
apart from giving instructions about the direction and assistance in case of necessity.
3. Data analysis
The data collected were analysed in two steps: the analysis of data recorded by the Video VBOX PRO data recorder, and the analysis of eye-movement data, acquired by the eye-tracking ASL Mobile Eye-XG.
3.1 Number of fixations and fixation dura-tion
The ASL Mobile Eye-XG video was analysed frame-by-frame, in order to verify the element fixed by each participant. The elements under analysis were:
• dashboard;
• cars: vehicles (light and heavy) on the road (Figure 11);
• background: sky and vegetation;
• road: road paving and safety barriers (Fig-ure 11);
• mirror: both side mirrors;
• attention internal mirror: characterized by the awareness that the driver looks at it, on-ly to perform driving manoeuvres;
• inattention internal mirror: characterized by possible distractions, dictated by the inter-locators present in the vehicles;
• car interior: everything inside the vehicle ex-cept the dashboard (Figure 11);
• interlocutor: person present in the back seat of the car who gives instructions or takes care of secondary tasks;
• sign: vertical signage along the road
• prey vehicle.
For each element the number of fixations and their duration were computed, multiplying by 33 ms the number of frames in which a single tar-get object was fixated.
To avoid the inclusion of saccadic movements, an element on the crosswalk was considered as fixated when it was fixed for a minimum duration of two frames (66 ms).
The threshold of 66 ms, which is low in compar-ison to a common filtering of 100 ms or higher usually found in eye-tracking studies, was dic-tated by the specific setting of this study that in-
volved the recording of eye movements while driving.
Lantieri et al. (2015), Costa, Bonetti, et al. (2018) and Costa, Simone, et al. (2018) report-ed that in real traffic situations, in a high dynam-ical context of road driving, the duration of fixa-tion is much lower than in other contexts and experimental settings. In a real driving setting with a dynamical visual scene, as in the case of the present study, rapid fixations may occur.
Figure 11: Fixation of the road pavement, of a vehicle, of the dashboard.
The elements under analysis have been grouped to evaluate the attention and inatten-tion parameters related to the use by the sys-tem:
• attention: signboard, road, internal attention mirror, car;
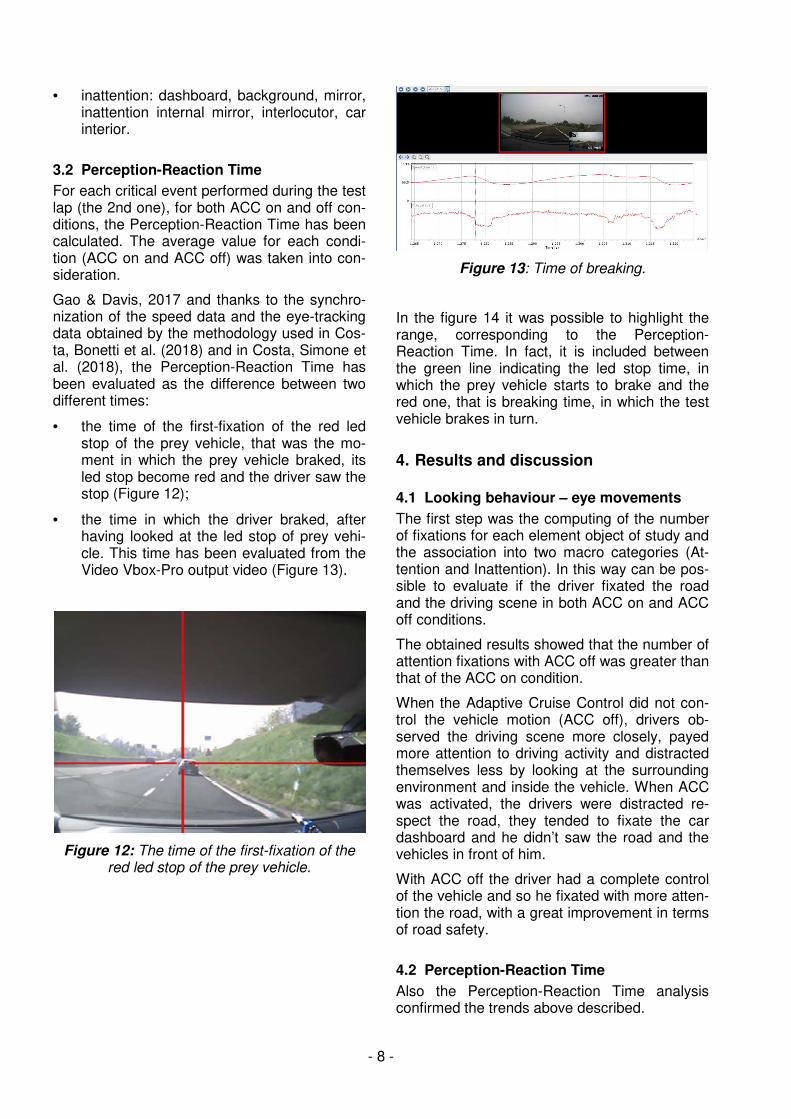
- 8 -
• inattention: dashboard, background, mirror, inattention internal mirror, interlocutor, car interior.
3.2 Perception-Reaction Time
For each critical event performed during the test lap (the 2nd one), for both ACC on and off con-ditions, the Perception-Reaction Time has been calculated. The average value for each condi-tion (ACC on and ACC off) was taken into con-sideration.
Gao & Davis, 2017 and thanks to the synchro-nization of the speed data and the eye-tracking data obtained by the methodology used in Cos-ta, Bonetti et al. (2018) and in Costa, Simone et al. (2018), the Perception-Reaction Time has been evaluated as the difference between two different times:
• the time of the first-fixation of the red led stop of the prey vehicle, that was the mo-ment in which the prey vehicle braked, its led stop become red and the driver saw the stop (Figure 12);
• the time in which the driver braked, after having looked at the led stop of prey vehi-cle. This time has been evaluated from the Video Vbox-Pro output video (Figure 13).
Figure 12: The time of the first-fixation of the red led stop of the prey vehicle.
Figure 13: Time of breaking.
In the figure 14 it was possible to highlight the range, corresponding to the Perception-Reaction Time. In fact, it is included between the green line indicating the led stop time, in which the prey vehicle starts to brake and the red one, that is breaking time, in which the test vehicle brakes in turn.
4. Results and discussion
4.1 Looking behaviour – eye movements
The first step was the computing of the number of fixations for each element object of study and the association into two macro categories (At-tention and Inattention). In this way can be pos-sible to evaluate if the driver fixated the road and the driving scene in both ACC on and ACC off conditions.
The obtained results showed that the number of attention fixations with ACC off was greater than that of the ACC on condition.
When the Adaptive Cruise Control did not con-trol the vehicle motion (ACC off), drivers ob-served the driving scene more closely, payed more attention to driving activity and distracted themselves less by looking at the surrounding environment and inside the vehicle. When ACC was activated, the drivers were distracted re-spect the road, they tended to fixate the car dashboard and he didn’t saw the road and the vehicles in front of him.
With ACC off the driver had a complete control of the vehicle and so he fixated with more atten-tion the road, with a great improvement in terms of road safety.
4.2 Perception-Reaction Time
Also the Perception-Reaction Time analysis confirmed the trends above described.
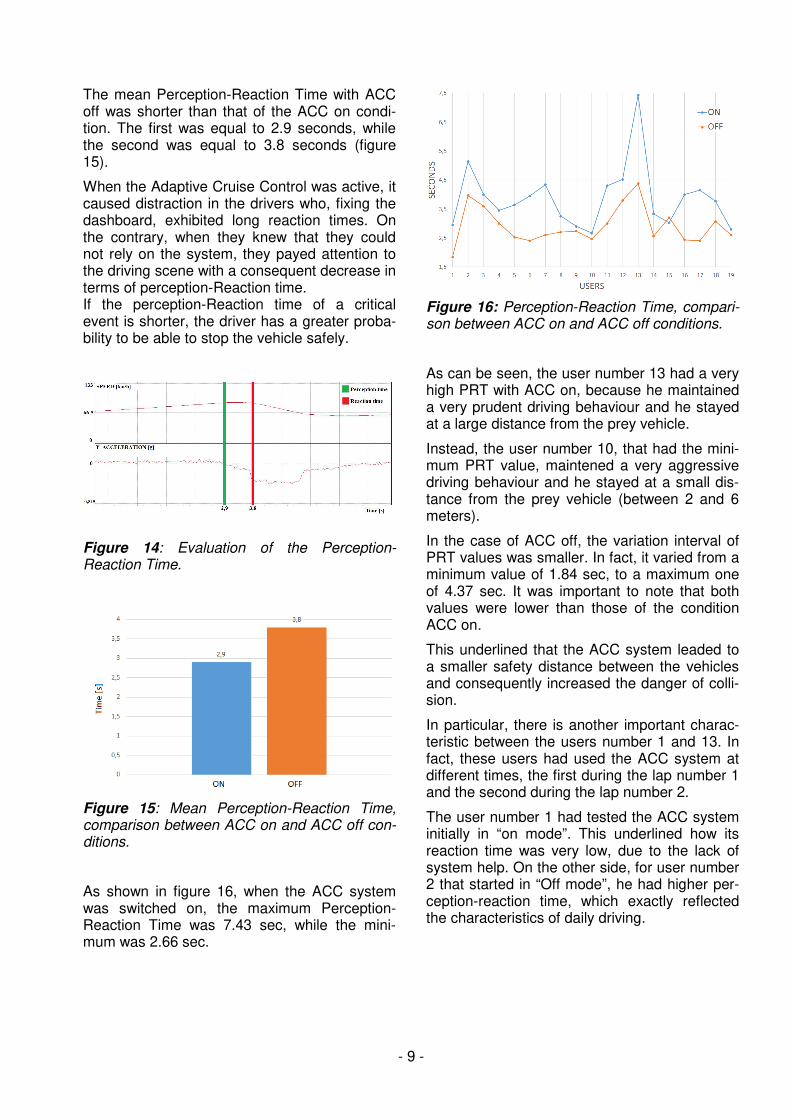
- 9 -
The mean Perception-Reaction Time with ACC off was shorter than that of the ACC on condi-tion. The first was equal to 2.9 seconds, while the second was equal to 3.8 seconds (figure 15).
When the Adaptive Cruise Control was active, it caused distraction in the drivers who, fixing the dashboard, exhibited long reaction times. On the contrary, when they knew that they could not rely on the system, they payed attention to the driving scene with a consequent decrease in terms of perception-Reaction time. If the perception-Reaction time of a critical event is shorter, the driver has a greater proba-bility to be able to stop the vehicle safely.
Figure 14: Evaluation of the Perception-Reaction Time.
Figure 15: Mean Perception-Reaction Time, comparison between ACC on and ACC off con-ditions.
As shown in figure 16, when the ACC system was switched on, the maximum Perception-Reaction Time was 7.43 sec, while the mini-mum was 2.66 sec.
Figure 16: Perception-Reaction Time, compari-son between ACC on and ACC off conditions.
As can be seen, the user number 13 had a very high PRT with ACC on, because he maintained a very prudent driving behaviour and he stayed at a large distance from the prey vehicle.
Instead, the user number 10, that had the mini-mum PRT value, maintened a very aggressive driving behaviour and he stayed at a small dis-tance from the prey vehicle (between 2 and 6 meters).
In the case of ACC off, the variation interval of PRT values was smaller. In fact, it varied from a minimum value of 1.84 sec, to a maximum one of 4.37 sec. It was important to note that both values were lower than those of the condition ACC on.
This underlined that the ACC system leaded to a smaller safety distance between the vehicles and consequently increased the danger of colli-sion.
In particular, there is another important charac-teristic between the users number 1 and 13. In fact, these users had used the ACC system at different times, the first during the lap number 1 and the second during the lap number 2.
The user number 1 had tested the ACC system initially in “on mode”. This underlined how its reaction time was very low, due to the lack of system help. On the other side, for user number 2 that started in “Off mode”, he had higher per-ception-reaction time, which exactly reflected the characteristics of daily driving.
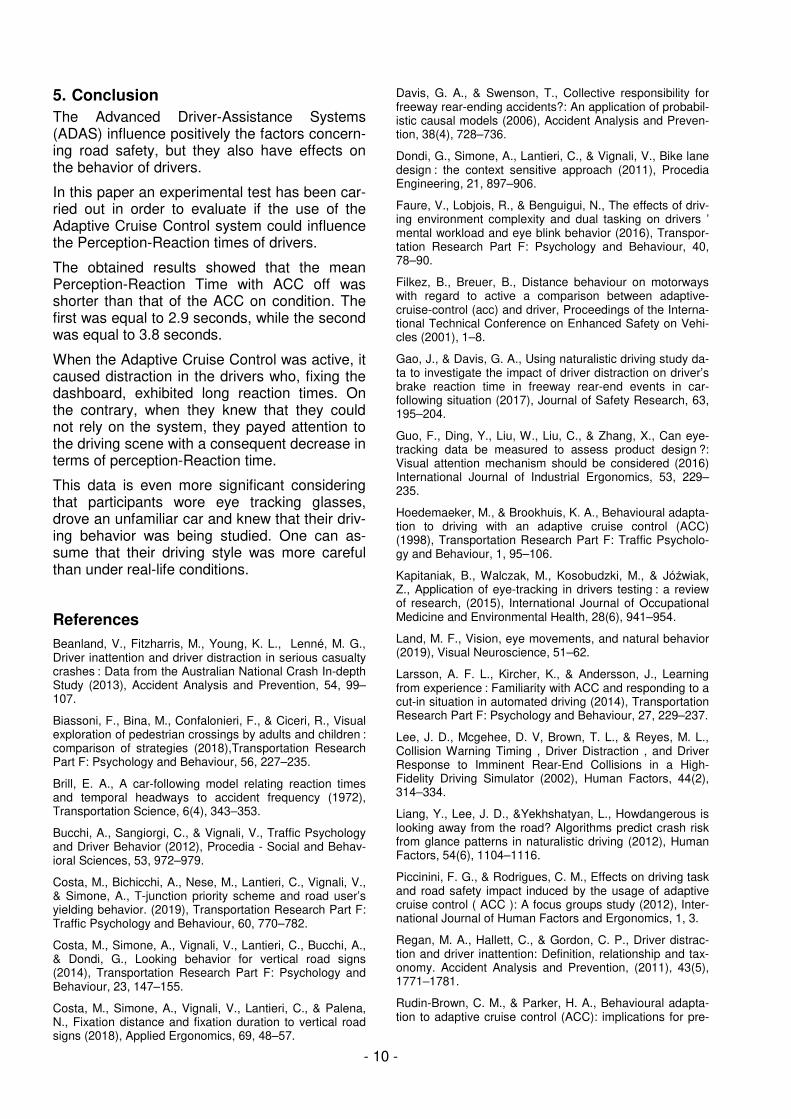
- 10 -
5. Conclusion
The Advanced Driver-Assistance Systems (ADAS) influence positively the factors concern-ing road safety, but they also have effects on the behavior of drivers.
In this paper an experimental test has been car-ried out in order to evaluate if the use of the Adaptive Cruise Control system could influence the Perception-Reaction times of drivers.
The obtained results showed that the mean Perception-Reaction Time with ACC off was shorter than that of the ACC on condition. The first was equal to 2.9 seconds, while the second was equal to 3.8 seconds.
When the Adaptive Cruise Control was active, it caused distraction in the drivers who, fixing the dashboard, exhibited long reaction times. On the contrary, when they knew that they could not rely on the system, they payed attention to the driving scene with a consequent decrease in terms of perception-Reaction time.
This data is even more significant considering that participants wore eye tracking glasses, drove an unfamiliar car and knew that their driv-ing behavior was being studied. One can as-sume that their driving style was more careful than under real-life conditions.
References
Beanland, V., Fitzharris, M., Young, K. L., Lenné, M. G., Driver inattention and driver distraction in serious casualty crashes : Data from the Australian National Crash In-depth Study (2013), Accident Analysis and Prevention, 54, 99–107.
Biassoni, F., Bina, M., Confalonieri, F., & Ciceri, R., Visual exploration of pedestrian crossings by adults and children : comparison of strategies (2018),Transportation Research Part F: Psychology and Behaviour, 56, 227–235.
Brill, E. A., A car-following model relating reaction times and temporal headways to accident frequency (1972), Transportation Science, 6(4), 343–353.
Bucchi, A., Sangiorgi, C., & Vignali, V., Traffic Psychology and Driver Behavior (2012), Procedia - Social and Behav-ioral Sciences, 53, 972–979.
Costa, M., Bichicchi, A., Nese, M., Lantieri, C., Vignali, V., & Simone, A., T-junction priority scheme and road user’s yielding behavior. (2019), Transportation Research Part F: Traffic Psychology and Behaviour, 60, 770–782.
Costa, M., Simone, A., Vignali, V., Lantieri, C., Bucchi, A., & Dondi, G., Looking behavior for vertical road signs (2014), Transportation Research Part F: Psychology and Behaviour, 23, 147–155.
Costa, M., Simone, A., Vignali, V., Lantieri, C., & Palena, N., Fixation distance and fixation duration to vertical road signs (2018), Applied Ergonomics, 69, 48–57.
Davis, G. A., & Swenson, T., Collective responsibility for freeway rear-ending accidents?: An application of probabil-istic causal models (2006), Accident Analysis and Preven-tion, 38(4), 728–736.
Dondi, G., Simone, A., Lantieri, C., & Vignali, V., Bike lane design : the context sensitive approach (2011), Procedia Engineering, 21, 897–906.
Faure, V., Lobjois, R., & Benguigui, N., The effects of driv-ing environment complexity and dual tasking on drivers ’ mental workload and eye blink behavior (2016), Transpor-tation Research Part F: Psychology and Behaviour, 40, 78–90.
Filkez, B., Breuer, B., Distance behaviour on motorways with regard to active a comparison between adaptive-cruise-control (acc) and driver, Proceedings of the Interna-tional Technical Conference on Enhanced Safety on Vehi-cles (2001), 1–8.
Gao, J., & Davis, G. A., Using naturalistic driving study da-ta to investigate the impact of driver distraction on driver’s brake reaction time in freeway rear-end events in car-following situation (2017), Journal of Safety Research, 63, 195–204.
Guo, F., Ding, Y., Liu, W., Liu, C., & Zhang, X., Can eye-tracking data be measured to assess product design ?: Visual attention mechanism should be considered (2016) International Journal of Industrial Ergonomics, 53, 229–235.
Hoedemaeker, M., & Brookhuis, K. A., Behavioural adapta-tion to driving with an adaptive cruise control (ACC) (1998), Transportation Research Part F: Traffic Psycholo-gy and Behaviour, 1, 95–106.
Kapitaniak, B., Walczak, M., Kosobudzki, M., & Jóźwiak, Z., Application of eye-tracking in drivers testing : a review of research, (2015), International Journal of Occupational Medicine and Environmental Health, 28(6), 941–954.
Land, M. F., Vision, eye movements, and natural behavior (2019), Visual Neuroscience, 51–62.
Larsson, A. F. L., Kircher, K., & Andersson, J., Learning from experience : Familiarity with ACC and responding to a cut-in situation in automated driving (2014), Transportation Research Part F: Psychology and Behaviour, 27, 229–237.
Lee, J. D., Mcgehee, D. V, Brown, T. L., & Reyes, M. L., Collision Warning Timing , Driver Distraction , and Driver Response to Imminent Rear-End Collisions in a High-Fidelity Driving Simulator (2002), Human Factors, 44(2), 314–334.
Liang, Y., Lee, J. D., &Yekhshatyan, L., Howdangerous is looking away from the road? Algorithms predict crash risk from glance patterns in naturalistic driving (2012), Human Factors, 54(6), 1104–1116.
Piccinini, F. G., & Rodrigues, C. M., Effects on driving task and road safety impact induced by the usage of adaptive cruise control ( ACC ): A focus groups study (2012), Inter-national Journal of Human Factors and Ergonomics, 1, 3.
Regan, M. A., Hallett, C., & Gordon, C. P., Driver distrac-tion and driver inattention: Definition, relationship and tax-onomy. Accident Analysis and Prevention, (2011), 43(5), 1771–1781.
Rudin-Brown, C. M., & Parker, H. A., Behavioural adapta-tion to adaptive cruise control (ACC): implications for pre-
- 11 -
ventive strategies (2004), Transportation Research Part F: Psychology and Behaviour,7, 59–76.
Stanton, N. A., Young, M., & Mccaulder, B., Drive-by-wire: the case of driver workload and reclaiming control with adaptive cruise control (1997), Safety Science, 27(2), 149–159.
Takada, Y., Evaluation of Driving-Assistance Systems Based on Drivers’ Workload, Proocedings of Driving As-sessment Conference (2001), 208–213.
Tivesten, E., Corporation, V. C., Victor, T., & Car, V., The timecourse of driver visual attention in naturalistic driving with adaptive cruise control and forward collision warning (2015), Proceedings of the 4th International Driver Distrac-tion and Inattention Conference, Sydney, 1–12.
Tno, M. M., Carnetsoft, W. V. W., & Winsum, W. Van., Measuring distraction: the Peripheral Detection Task, (2016).
Vignali, V., Bichicchi, A., Simone, A., Lantieri, C., Dondi, G., & Costa, M., Road sign vision and driver behaviour in work zones (2019), Transportation Research Part F: Traf-fic Psychology and Behaviour, 60, 474–484.
Vignali, V., Cuppi, F., Acerra, E., Bichicchi, A., Lantieri, C., Simone, A., & Costa, M. Effects of median refuge island and flashing vertical sign on conspicuity and safety of un-signalized crosswalks (2019), Transportation Research Part F: Traffic Psychology and Behaviour, 60, 427–439.
Wilschut, E. S., & Feenstra, P. J., Evaluation of different modalities for the intelligent cooperative intersection safety system ( IRIS ) and speed limit system (2010), European Conference on Human Centred Design for Intelligent Transport Systems, Berlin, 221–226.
Winter, J. C. F. De, Happee, R., Martens, M. H., & Stan-ton, N. A., Effects of adaptive cruise control and highly au-tomated driving on workload and situation awareness : A review of the empirical evidence, (2014),Transportation Research Part F: Psychology and Behaviour, 27, 196–217.
Zito, G. A., Cazzoli, D., Scheffler, L., Jäger, M., Müri, R. M., Mosimann, U. P., Mast, F. W., Street crossing behavior in younger and older pedestrians : an eye- and head-tracking study (2015), BMC Geriatrics, 1–10.
Contact Ennia Mariapaola Acerra Via della Grada, 17/2 40122, Bologna, Italy e-mail: [email protected] tel: +39 3475440926

Acknowledgements
219
ACKNOWLEDGEMENTS
I acknowledge the guidance and invaluable advice provided by my supervisors Prof Andrea Simone,
Prof Hocine Imine and Dr Eng. Claudio Lantieri during the course of my PhD studies.
I would like to thank the members of my dissertation committee Prof Hichem Arioui and Dr Eng.
Roland Brémond for their advice, suggestion, and inspiration during the course of this research and
thesis reviewing committee Prof Alessandro Calvi and Prof Gianluca Dell’Acqua for their
constructive feedback.
I am grateful to members of DICAM and PICS-L (LEPSIS) laboratories for their continuous support
especially Prof Valeria Vignali, Prof Marco Costa, Prof Giulio Dondi, Dr Régis Lobjois, Dr Eng. Eric
Dumont and Dr Sami Mecheri for their scientific support that was crucial for completing the research.
In addition, I would like to thank PICS-L (LEPSIS) members Amelie, Céline, Sio-Song, Stéphane,
Mathias, Francois, Nicolas, Daniel, Joffrey, Thomas, Enoch and Fabric for their support during my
research period in Paris.
I should thank all the students who worked with me during the elaboration of the thesis, Kevin,
Margherita, Mattia, Faisal, Martina, Chiara, Laura, Jessica, Alessandro, Maurizio, Cecilia, Leonardo,
Tomasso, Stefano, Arianna, Reza, Murad, Kavya, Behnood, Mohamad, Mahmood and many more.
I appreciate the support and company of my colleagues, especially Margherita Pazzini, Ennia Acerra,
Murad Showman, Michele Carpinone, Arianna Bichicchi, Roberto Battistini, Piergiorgio Tataranni,
Shahin Eskandarsefat, Francesco Mazzotta, Giulia Tarsi, Federico Cuppi and thanks to my family
and friends for all of their love and support.