Driving technology and development – - DIVA
68
DOCTORAL THESIS Driving technology and development – Usability studies of gear shifters with variations in pattern, stability and design Sanna Lohilahti Bladfält Engineering Psychology
-
Upload
khangminh22 -
Category
Documents
-
view
0 -
download
0
Transcript of Driving technology and development – - DIVA

DOCTORA L T H E S I S
Sanna Lohilahti Bladfält D
riving technology and development
Department of Business Administration, Technology and Social SciencesDivision of Humans and Technology
ISSN 1402-1544ISBN 978-91-7790-699-5 (print)ISBN 978-91-7790-700-8 (pdf)
Luleå University of Technology 2020
Driving technology and development – Usability studies of gear
shifters with variations in pattern, stability and design
Sanna Lohilahti Bladfält
Engineering Psychology
131903-LTU-Lohilahti.indd 1-3131903-LTU-Lohilahti.indd 1-3 2020-11-13 13:472020-11-13 13:47

Driving technology and development– Usability studies of gear shifters with variations
in pattern, stability and design
Sanna Lohilahti Bladfält
Luleå University of Technology Department of Business Administration, Technology and Social Sciences
Division of Humans and Technology Engineering Psychology

I rörelse Den mätta dagen, den är aldrig störst. Den bästa dagen är en dag av törst. Nog finns det mål och mening i vår färd – men det är vägen, som är mödan värd. Det bästa målet är en nattlång rast, där elden tänds och brödet bryts i hast. På ställen, där man sover blott en gång, blir sömnen trygg och drömmen full av sång. Bryt upp, bryt upp! Den nya dagen gryr. Oändligt är vårt stora äventyr. Ur Karin Boyes Härdarna, 1927.
Preface This thesis built upon a research project called Life on Board, which was a collaboration between Luleå University of Technology, Kongsberg Automotive and Volvo Cars. The project was also financed by Vinnova and the Strategic vehicle research and innovation programme (FFI). The project had a very niched research focus, namely, the gear shifters in modern cars. The intention of this thesis was to fill the knowledge gap about gear shifter design, especially from a human-machine-interface perspective. My background in psychology, within engineering psychology and work psychology, influenced the content of this thesis and how it was written. My inclination towards interdisciplinary work has also had an influence on the contents. My hope is that this thesis reaches a wide group of readers, both designers and developers of technology as well as readers who are eager to learn more about usability and technological development. Sanna Lohilahti Bladfält
Acknowledgements With just a few months left to write this thesis and a lot of work left to do, I write my preface. It might be a somewhat backward way of doing things, but I hope that by writing my preface now, I will manage to finish this work. It has been a roller coaster of ups and downs, laughter and tears, excitement and confusion. This journey has had its challenges, and not only because I did dive back into academia, the world where I had not been active for many years, which demanded that I become reacquainted with experimental methods, statistics, article writing and interviews. All while doing new things, like teaching university students, I was as student myself. It has also been a personal challenge, requiring me to face my own fears, insecurities, self-imposed and external obstacles, feeling that I am in full control in one moment only to lose control in the next. This journey has also been a source of inspiration, a once in a lifetime experience for which I am very grateful for. I never thought I would grow as much as a person as I did over the last few years. Hopefully, this journey has made me more courageous and confident in life and has given me a fighting spirit that will guide and lift me up to face the challenges of the future. There is much more to discover, so many questions to answer and many more journeys to take. I believe that mine has just begun. I wish to thank my supervisors, Jessica Körning-Ljungberg, Camilla Grane and Lisa Öman Ekervhén, from the bottom of my heart for your support, help and advice. Thank you, Jessica, for guiding me through these last steps on the way and making it possible for me to finalize this work. Thank you, Camilla, for your kindness and structured guidance and for making this possible; without you, I would not be here having this once in a lifetime experience. Thank you, Lisa, for your friendly, consistently positive, and wise way of keeping this work together when I needed it the most. Thank you, Peter Bengtsson, for your patience and calming way of helping me through these years. I would like to thank Jörgen Normark, who believed in me from the beginning and who found ways to help me reach the goal. And a big thank you to Jon Friström for helping me during my first year as a PhD student and teaching me so much about experimental methods. And I would also like to thank Therese Sehlstedt, Eugenia Segerstedt, Maria Johansson, Kristina Johansson, Magnus Nygren, Joel Lööw, Fredrik Sjögren, Lisa Ringblom, Maria Johansson Savilahti, and Martin Karlsson for your help, your understanding, the laughs, the healing words such as “We believe in you”, the hugs, the time you have given so freely to listen and lend your strength. I would like to thank Rickard Nilsson for helping me with statistics; without your help, things would have taken much longer. And a big thank you to Håkan Alm, Lage Burström and Sonya Hörnqwist Bylund, who jumped in and did a lot of reading and commenting during my last PhD year. You gave me the motivation I needed at just the right time. I would like to thank Maria Udén, who listened and supported me when I had new thoughts and ideas for the direction of this thesis work. And a big thank you to all of my great TP and Human Work Science colleagues who have helped me with so many things through the years.

I would also like to thank other friends, family and important people who have shared this journey with me in different ways. Throughout the years, there have been many supportive people who have crossed my path in one way or another. Thank you, Magdalena Forsberg, Emma Bladfält and Coralie Andersson, for standing beside me and cheering me up with fun and laughter. And to my longtime friend Isabell Sjöberg, thank you for always listening. You and I started this journey together a long time ago as students in the psychology program in Luleå. And to Martina Sundström, you have always been there for me, thank you for all your wise and caring words. I would like to thank my parents Helena Lohilahti and Mauri Lohilahti, my sister Maarit Lohilahti Högberg and her husband Fredrik Högberg, as well as Gerd Bladfält and Gudmund Larsson, for all the love and strength you have given so unconditionally. And a thank you to my extended family in both Sweden and Finland. And last, but not least, a few words that are not enough to fully thank the three boys of my life. Thank you, my husband David, for standing by and always believing that this work will be finished. You have guided me with your shining light through all these years. And many loving thanks to my two boys for making me such a happy mother and filling my days with joy, magic and wonder. May you always follow your dreams and do whatever makes your hearts sing. Forward we move on endless roads. Sanna

Abstract Over the last few decades, the development of technology used in cars has moved forward at a very intensive pace. The focus has started to shift from the technology to the human as a user. The work done earlier regarding, for example, driver’s capabilities to process information, has now become a focus when developing modern cars in order to make driving more safe, efficient, and pleasurable. With increased knowledge comes new questions. With advancing technology and opportunities, questions about the user and how to adapt the technology to humans has become increasingly detailed and complex. One of these technological devices is the novel gear shifter used in passenger cars. Today, there is a transition taking place. Traditional gear shifters, which use a mechanical connection to the transmission, are being replaced by gear shifters that rely on electronic systems. This will allow for greater variation in both the function and design of modern cars. However, there is still a lack of knowledge about this new technology; we know little about what effects these variations can have on users. The aim of this thesis is to contribute with knowledge regarding this new technology by studying the conditions for technological development in general and the usability of modern gear shifters in passenger cars in particular. One field study, two laboratory studies and one interview study will be described in this thesis work. The field study, which was conducted with traditional shift-by-wire gear shifters, showed that the joystick shifter was the most preferred gear shifter type since it was familiar, however, the largest number of errors was made with the joystick and stalk shifter. Familiarity and the car environment seemed to influence the overall acceptance and attitude towards the gear shifters. The second and third study showed evidence of driver difficulties with the monostable gear shifters. Difficulties concerned the lack of dedicated positions, which withdrew both visual and haptic aid for the driver and could presumably increase the driver’s cognitive load, causing the driver to feel lost in the shifter pattern and to direct too much attention towards the gear shifter instead of the road. Participants described how extensive use of gear shifter modes that are lined up in a row could be cognitively demanding and that the single fixed position of the gear shifter did not provide the type of haptic or visual feedback that could help the driver become oriented with the shifter pattern. The third study compared the performance of the gear shifters in younger and older participants. The older participants made more errors and had longer task completion times than the younger participants. However, the older participants rated the gear shifters with higher ease-of-use scores than the younger participants. The older participants seemed to learn how to use the polystable gear shifters quite quickly, but not the monostable gear shifters. The fifth paper used a different approach and methodology to describe the complexities of decision-making in the Swedish vehicle industry. It revealed a situation where decision-making was a balancing act between normative and descriptive decision-making, often dependent on available knowledge and guidelines and whether there was time and money to acquire new and complementary

knowledge. If resources for knowledge acquisition were lacking, social networking was described as a way to compensate. Well-functioning communication between teams and key actors in the development process was also revealed to be crucial for efficient decision-making. Also, a more agile way of working has the potential to impact decision-making due to different resource requirements for hardware and software.
Appended papers Paper 1 Field study investigating gear shifter usability in car rental scenario Bladfält, S. L, Grane, C., & Friström, J. (2016). Proceedings of the 48th Annual Conference of Nordic Ergonomics and Human Factors Society. August 2016, Kuopio, Finland. Paper 2 Gear Shifter Design – Lack of Dedicated Positions and the Contribution to Cognitive Load and Inattention Bladfält, S. L, Grane, C., & Bengtsson, P. (2020). Proceedings of the AHFE 2019 International Conference on Human Factors in Transportation. July 2019, Washington D.C., USA. Paper 3 Comparison of Usability between Gear Shifters with Varied Visual and Haptic Patterns and Complexities Bladfält, S. L, Grane, C., & Bengtsson, P. (2020) Multimodal Technologies and Interaction, (4(2). Paper 4 Age differences in gear shifter usability – Comparison of joystick and rotary gear shifter with different visual and haptic movement pattern Journal paper Bladfält, S. L, & Grane, C., & Ekervhén, L. Ö (Submitted for publication). Paper 5 Balancing act – Interview study of decision-making in the Swedish vehicle industry Journal paper Bladfält, S. L, Ekervhén, L. Ö., & Grane, C (Submitted for publication).

TABLE OF CONTENTS 1. INTRODUCTION 1 1.1 Aim and research questions 3 1.2 Limitations 3 2. FRAME OF REFERENCE 4 2.1 The theoretical field – engineering psychology 4 2.2 A research perspective on humans and technology 6 2.2.1 Defining and measuring usability 6 2.3 The human as user 7 2.3.1 User interfaces and mental models 7 2.3.2 Attention and multimodality 8 2.3.3 Attention, vision and haptics 9 2.3.4 Memory 10 2.3.5 Age and memory 11 2.3.6 Types of human error 12 2.4 The technology 12 2.4.1 The tasks of driving a car 12 2.4.2 Gear shifting and the drivers 14 2.5 The context of human machine interaction 15 2.5.1 Technology as artifacts 15 2.5.2 Technology and the world 15 2.5.3 Technology and the user 16 3. METHOD 19 3.1 Participants 19 3.1.1 The first study 19 3.1.2 The second study 20 3.1.3 The third study 20 3.1.4 The fourth study 20 3.2 Study design 21 3.2.1 The first study 21 3.2.2 The second and third study 21 3.2.3 The fourth study 21 3.3 Gear shifters 23 3.4 Gear shifting tasks 27 3.5 Distraction task 29 3.6 Measures 30 3.7 Data analysis 30 4. SUMMARY OF APPENDED PAPERS 32 4.1 Paper 1 32
4.2 Paper 2 33 4.3 Paper 3 34 4.4 Paper 4 35 4.5 Paper 5 36 5. DISCUSSION 37 5.1 The first research question 37 5.2 The second research question 38 5.3 The third research question 39 5.4 The fourth research question 41 5.5 Methodological considerations 42 5.5.1 Reliability and validity 42 5.5.2 Ethics 45 5.5.3 Measures 45 6. CONCLUSIONS 47 7. FUTURE RESEARCH 48 8. REFERENCES 49
1
1 Introduction Think about all the things that you use in your everyday life. Some of them you have used thousands of times before, barely giving them a thought while handling them like a water tap or the door to enter to your local library. However, you will most likely pay attention to a water tap that you cannot figure out how to turn on or a door you cannot enter. Some of all the things you use can be somewhat of a challenge to use during the first encounter. Some of them may still be frustrating, even if you have managed to handle them several times before. It is difficult to make products and systems that can take into account so many different factors such as for example effectiviness, efficiency, satisfaction and production costs as well as it should fit a variety of users. A novice user of a mobile phone application may want basic functions, while an expert user might require more advanced functions and detailed options. These design questions have been discussed many times before (Norman 1992, 1999, 2002, 2013; Norman and Verganti, 2014). This thesis will look further into one of all these things, used by many people every day: the gear shifter in passenger cars. This thesis work originates from a research project called Life on Board that started in 2013 and ended in 2015. It was a collaboration between Luleå University of Technology, Kongsberg Automotive and Volvo Cars. The project also received funding from Traffic safety and automated vehicles, a part of the Strategic vehicle research and innovation program (FFI), which is a part of Vinnova (Sweden’s innovation agency). FFI is a partnership program between the Swedish state and the Swedish automotive industry concerning questions related to environment and safety (Vinnova, 2020). The project worked with comparisons of different gear shifter types, both polystable and monostable, from the point of view of safety and usability. The main reason the project was started was to study shift-by-wire gear shifters. With shift-by-wire technology, there is no mechanical connection between the gear shifter and the gearbox, the connection is electronic (Baronti et al., 2011). There are clear advantages with shift-by-wire technology, such as transmission chain efficiency and savings in fuel consumption (Baronti et al., 2011). This makes it possible to remove the heavy and bulky components of the coupling (Lindner & Tille, 2009). The gear shifter can be constructed and designed in novel ways and does not have to function like the conventional joystick and stalk shifter. The gear shifter is no longer restricted to placement in the center console or the steering wheel, and it is not as noisy as a mechanical gear shifter (Lindner & Tille, 2009). Gear shifters with shift-by-wire are often monostable, meaning that visually and spatially, the gear shifter will always remain in one fixed end-position. That is, the driver can change the position of the gear shifter without changing the end-position of the gear shifter. For example, the driver can push the gear shifter forwards, to the sides or pull it back, with the gear shifter returning to one center position. A traditional polystable gear shifter will stay in the position that the driver moves it to. If the gear shifter is moved forwards in the shifter pattern, it will stay in that

2
position without returning to a center position. With a polystable gear shifter, the driver can receive information about the gear shifter state by looking at the spatial position in the gear shifter pattern, by feeling the gear shifter position and often by looking at the instrument panel and the illumination of the gear shifter pattern on the gear shifter itself. With a monostable gear shifter, the driver is dependent on electronic feedback, i.e., information about the active gear state on the instrument panel and the gear shifter or one of the two. Today, monostable gear shifters are becoming very common, and the development of in-car technology is moving in this direction. However, there have been reported issues regarding the usability and safety aspects of these gear shifters (McHenry, 2016). Even though there are clear benefits in using shift-by-wire systems, there is still a lack in knowledge and experience regarding the different types of gear shifters that are currently being developed. As one of the project leaders from Kongsberg Automotive explained regarding the change to shift-by-wire:
.…the technological change induced many new questions, going from the traditional manual and automatic transmission systems to the electrical, all-electric, then suddenly there are no limitations for how to change gear. This is the underlying driving force for the questions, and then it is the same as with the automatic shifter; why in the world should you pull it when you gear up, and when you want to go forwards, then you pull it towards you. And why is that, yes, because the gear boxes have been constructed so that a wire can be pulled that way, because over fifty years ago, and even more, there was a mechanical solution that had a breakthrough, and then everyone was doing the same thing because anything else felt odd. But when the electrical systems came, you could do whatever you liked. And then the question arose, what is the best solution then? (H. Nilsson, June 5, 2019)
The title of this thesis starts with one thing and ends with another. This shows how my thoughts evolved throughout the years of my thesis. At first glance, “Driving technology and development” would seem to relate to the development of car technology. However, driving in this sense can be both to push something forward as well as to stop the forward movement, and if it necessary, hit the brakes. In this thesis, this “something” is the development of technology. The thesis ends with a paper that studies decision-making in dynamic environments, where the decision to move forward or hit the brakes needs to be made at a rapid pace. The second part of the title “Usability studies of gear shifters with variations in pattern, stability and design” is based on research on the different gear shifter types, showing both the advantages and concerns with existing gear shifter types and prototypes.

3
1.1 Aim and research questions There is a vast amount of research regarding in-car technology. However, not much research has been done on the gear shifter in passenger cars, even though it is crucial for the movement of the car and is thus a critical safety aspect. Most of the available research focuses on engineering, the technical construction and the overall design. There is a knowledge gap regarding modern gear shifters, their users and the usability of these devices. The aim of this thesis is to contribute to the knowledge regarding this technology by studying conditions for technological development in general and the usability of modern gear shifters in passenger cars in particular. Following are the research questions: 1) What usability advantages and concerns can be identified with some of the modern gear shifters of today? 2) What usability advantages and concerns can be found between gear shifters with variations concerning shifter patterns, stability, design and complexity? 3) Are there differences in usability between gear shifters with variations concerning shifter patterns, stability and design at the highest complexity level between different age groups? 4) How are decisions regarding technological development made?
1.2 Limitations This thesis work is limited to the study of gear shifters in passenger cars that were in production when the research project started, and which were the most common concepts. This is why, for example, touch screen technology is not a part of the scope of the thesis. Therefore, the thesis has not studied gear shifters in other types of vehicles, such as construction machines or other engine-driven vehicles, even though shift-by-wire technology is also available in some of these vehicles. Still, the results and conclusions from this thesis could be useful for other types of vehicles with similar gear shifter concepts.

4
2 Frame of reference 2.1 The theoretical field – engineering psychology Engineering psychology falls within the field of human factors, which is a broad field studying how humans interact with technology (Proctor & Vu, 2010; Wickens et al., 2013). In engineering psychology, the focus is mainly on human cognition and behavior, capabilities and limitations, often in relation to the workplace, transportation and to some extent, the home environment. Human factors, on the other hand, is generally focused on issues “below the neck” (Wickens et al. 2013). However, the distinctions between engineering psychology and human factors are not clear cut (Sanders & McGormick, 1993), and there are no shortage of opinions about the distinctions between these two fields. Even though the name of the field includes the word engineering, engineering psychology is not about engineering to the extent that it focuses on the technology in itself, even though technology is a part of the field. Engineering psychology can be seen as a field of study that falls somewhere between engineering and psychology (Stanton, 1996); it falls within the field of psychology but has more of an applied focus. The theoretical framework from psychology is used to study human interactions with technology. For example, how humans perceive, attend to and process information that they receive from their environment (Sanders & McGormick, 1993). A common thread in this field can be humans and their interactions with different machines. These could be different kinds of vehicles where a human is required to attend to both the outside environment and the handling of the vehicle (see Figure 1 for different machines that are handled by humans). Figure 1 Human machine interaction environments
Note. To the left, the interior of a construction machine. To the right, the cockpit of a small airplane.

5
By understanding the human, it is possible to find ways to adapt technology to the users. Different users may have different needs in their interactions with technology, and many difficulties with products and systems can be resolved if they are adjusted to the user (Stanton, 1996). In engineering psychology, human behavior is studied in laboratory settings as well as outside the laboratory, such as human interactions with technology in the workplace. Engineering psychology is largely focused on human interaction with technology in everyday situations, whereby the environment in which this interaction takes place is also important (see Figure 2). This is described by Wickens et al. (2013):
While engineering psychologists do pay attention to statistics and statistical significance, they also realize that without considering practical significance, a particular finding or principle will simply not scale up to the workplace, where it is to be passed onto the human factors engineer, who has the commitment to design …. in designing a task for experimental participants, the engineering psychologist must consider its relevance to tasks beyond the laboratory. The engineering psychologist should know and understand the relevant real-world context and tasks, and this knowledge should inspire the design of the experimental task. (p. 2)
Figure 2 Parts of engineering psychology
Note. Engineering psychology is a field of study that strives to understand the interlinkage between users, technology, and tasks performed in varied contextual settings.
User Technology
Tasks
Context
Engineering Psychology

6
2.2 A research perspective on humans and technology 2.2.1 Defining and measuring usability Technology is often valued in terms of how easy it is to use and how well the intended task can be achieved with the technology, which are aspects that fall under the concept of usability. The concept of usability first came into use in the 1980s (Broström, 2016) by researchers such as Eason (1984) and Shackel (1986). Early definitions of usability were somewhat questioned, since they seemed to overlook some important user characteristics, such as the previous experience of users, how they learn and adapt to technology and what expectations, feelings and attitudes they hold in relation to the technology (Harvey, et al. 2011). After the usability concept was formed, it continued to be developed by Bevan et al. (1991), Bevan (1995; 1999; 2001), Nielsen (1994), Norman (1988; 2002), Schackel and Richardson (1991) among others (see, e.g., Madan & Dubey, 2012, for a more comprehensive review). However, usability is still a concept that is difficult to define since it is dependent on several factors, such as: the product to be used, the users who use the product, the context where the product is used, and the task that will be performed (Harvey, et al. 2011). A well-known model that describes usability is Nielsen’s (1994) model of the attributes of system acceptability. Usability is a part of the usefulness in the model, meaning that in order for usability aspects to become worthy of further investigation, the product first needs to be perceived as useful by the user. According to the International Organization for Standardization (ISO 9241-11: 2018), usability is defined as: “extent to which a system, product or service can be used by specified users to achieve specified goals with effectiveness, efficiency and satisfaction in a specified context of use.” Jordan (1998) describes the three different measures as follows:
• Effectiveness: The extent to which a goal, or task, is achieved with a product or system. Often measured by task completion, i.e. whether a user can complete the intended task. Quality of the output can be also a measure of effectiveness (Jordan, 1998, pp. 18-19).
• Efficiency: The amount of effort required to accomplish a goal. Measured by the “deviations from the critical path,” i.e., whether the user has to perform more steps and/or consume more time than necessary to complete a certain task. Efficiency is often measured by time on task and error rate. A user who makes less errors spends less time and effort correcting errors and is also more efficient. Mental workload is also a measure of efficiency, where increased mental workload due to, for example, multitasking can cause more errors in goal accomplishment (Jordan, 1998, pp. 19-22).
• Satisfaction: The level of comfort the user feels when using a product and how acceptable the product is to users as a vehicle for achieving their goals. Interviews and questionnaires can

7
be used to get an indication of user satisfaction and attitudes toward a product (Jordan, 1998, p. 23).
Another concept that can be seen as intertwined with usability is user experience (UX). This concept is focused more on the actual user experience (Normark, 2014). While usability can be seen as more product oriented, UX metrics are more user oriented. UX metrics are used to describe someone’s personal experience when interacting with a product, for example, attitudes before, during and after interacting with a system. (Albert & Tullis, 2013). According to ISO 9241-11: 2018, UX is defined as a “user’s perceptions and responses that result from the use and/or anticipated use of a system, product or service.” Both usability and UX are relevant when designing products that need to meet the needs of the users. 2. 3 The human as user 2.3.1 User interfaces and mental models A product or system can have many beneficial functions, but this does not matter if the user cannot use the functions. It is therefore important to design an interface that is understandable for the user. The interface is the part of the object that the user can see, hear and touch (Galitz, 2007). This is where the interaction between the user and the object happens, and it is the part that the user will encounter and handle. An interface might be the menu of a software program, the induction cooktop in the kitchen or the gear shifter in a car. Thus, interfaces can come in many variations and be part of different kinds of objects. The interface is the part of an object that informs the user about what can be done with it, what cannot be done with it, what the user should do to use it and what the results will be when using it (Norman, 1992). In relation to machines, for example, industrial machines operated by humans or a passenger car, interfaces are commonly called human-machine interfaces (HMI). When using a product or a system, the user will create a mental model, which is an internal representation and understanding of the object (Carroll & Olson, 1987). These mental models are often incomplete, lacking parts and oversimplified (Johnson-Laird, 1983). A conceptual model is an external representation of a product that is made to help the user understand the product’s functions (Norman, 2013). A user interface that is visible to the user is a representation of the object’s functions, which will provide the user with cues about what a mental model could look like. A gear shifter is the interface that the driver interacts with, and the gearbox will be affected by the movement of the gear shifter. The driver cannot see what happens within the gearbox, but the driver will experience how the car behaves. By driving the car, the driver will learn how the car will behave. The driver does not need to have all the detailed information about how the car is technically constructed to be able to drive the car. However, more experience and knowledge can help the driver to create a more accurate

8
mental model. When using a device correctly for an extended period of time, the memory of how to use it will become stronger and demand less cognitive resources, which will improve the driver experience. Interface design can thus have impact on the driver’s understanding of the system, their acceptance and handling of the system, and whether the system will be a source of distraction (Mcllroy et al., 2013). When designing interfaces, it is therefore beneficial to help the user create mental models that support them in their handling of the device in order to prevent erroneous use. This is, of course, a balancing act to determine the amount of information a user needs; a novice user may require less information, while an expert may require more detailed information, and the other way around. 2.3.2 Attention and multimodality By seeing, hearing, touching, smelling and tasting, humans begin to perceive. Some of the stimuli is brought to our conscious awareness and some is not (Treisman & Gelade, 1980). Earlier knowledge and experience can help us give meaning to what we perceive (Corbetta & Shulman, 2002; Treisman, 1986). We can to some extent select what we become aware of and direct attention towards (Driver, 2010; Posner & Petersen, 1990). However, what we perceive and if we perceive everything has been discussed for long (Lavie, 2010). Attention is often described as selective or divided attention. Selective attention is when we focus on one stimuli and ignore another one. It could be to focus on information from one sensory modality, such as reading a text while ignoring auditory information. In a driving situation, the driver’s attention will shift for short periods of time from the road to different tasks in the car; this is a way to focus on one stimuli and filter others. Divided attention is when attention can be directed to several sources of information at the same time, while maintaining a focus on both. Multiple resource theory describes how we manage to perform several tasks at the same time and how time-sharing can be more or less efficient (Wickens, 2002). Different modalities can be used in combination in order to help the driver focus on the right things in the car. By carefully selecting and using the right kinds of stimuli, for example, sound, vibrations, colors and light, the task can be performed more easily. Vision as a modality is often dominant and may reduce the impact of the other senses. This often occurs when the
information received by the senses is similar; if not, we will be more aware of the other senses. Senses can also compensate for each other, for example, if vision is impaired, other senses can be trained to compensate for the loss of vision. The combination of senses can thus be used to enhance information processing by making the information clearer and easier to perceive (Osvalder & Ulfvengren, 2010). Dual task decrement occurs when there are not enough resources to focus on both tasks and the performance for one or both tasks decreases. For example, driving and having a conversation on a cellular telephone has been studied on several occasions indicating an increased risk for accidents (Alm & Nilsson, 1995; Strayer & Johnston, 2001). The less information or experience the user has with a task and the more complex the task is, the higher the mental workload and the dual task decrement will be. When

9
a task is automatically performed, a smaller amount of attentional resources are needed and more resources are reserved for other tasks (Young et al. 2015). 2.3.3 Attention, vision and haptics Most of the sensory stimuli that humans use is visual. In a driving situation, 90 % of all information that drivers use in a driving situation consists of visual information (Rockwell, 1972). Drivers use both foveal and peripheral vision. Since vision cannot be split, we can only focus on the details of one object at a time (Wierwille, 1993). The information that a driver gathers through vision is related to the driving tasks in the car as well as other vehicles, objects, and people and animals on or nearby the external road environment. Also, information regarding weather and road conditions is partly gathered by vision. Haptic information is received through touch and is divided into both tactile and kinesthetic information, such as motion on the skin surface or the movement of the muscles and joints (Dahiya & Valle, 2013; Proske & Gandevia, 2011). We use haptics to actively explore our environment and to aid other senses, such as vision, by feeling the weight, temperature and structure of the object to be explored. Vibrations or movement force can also be integrated into a product to enforce the feedback to the user (Ho et al., 2005; Osvalder & Ulfvengren, 2010). Norman (2013) gives examples of how memory can be aided to avoid interference. By using different sensory modalities for the information, the interference can be reduced. Haptics can add information and increase the understanding of an object that is difficult to interpret with vision alone (Klatzky et al., 1993; Lederman & Klatzky, 2009). When driving, eyes should focus on the road, therefor, haptics can be a way to maintain eyes on road behavior. For example, Wang at al., (2020) have recently studied how haptics in a shared steering control can assist drivers and lower driver workload and reduce the risk for lane departure. Also vibrotactile information can help pilots when the demands on visual and auditory modalities are high (Rosa et al., 2020). However, it is important to consider how vision and haptics are combined in a driving situation. Studies has shown how some haptic support in a visual menu selection task in a car can increase task performance, however, too complex haptic interfaces can as well be confusing (Grane, 2012). The use of vision for secondary tasks is known to especially interfere with the task of driving (Metz et al., 2009). Since driving is an attention demanding task and requires the extensive use of vision, secondary tasks in driving should require vision as little as possible. Some secondary driving tasks can be done manually without the help of vision. However, many manual tasks require the guidance of vision, such as hand-eye coordination, which increases the visual load (Mourant et al., 1980). This will result in the driver sampling when driving, dividing their attention between the forward view and the device in the vehicle. While simple tasks require a low amount of short glances, more complex tasks require more sampling and may also require longer glances (Wierwille, 1993). According to NHTSA Guidelines (2012), secondary tasks when driving a car should not require glances away from the road exceeding 2 seconds and cumulatively no more than 12 seconds. Harley
10
et al. (2008) assert that additional kinesthetic feedback from the gear shifter can be significant in easing cognitive load and emphasize the importance of end positions in shifter patterns for this feedback. Hayward et al. (2004) also describe how haptic feedback in vehicles can make an interface more intuitive and easier to use. Haptic feedback can provide memory clues and reduce or eliminate the need for visual support for a task, but only if the task can be performed with as little need for vision as possible. Additionally, complex driving tasks that increase cognitive load can be dangerous for a driver possibly resulting in concentrating gaze towards road centre (Engström et al., 2005), and misjudgment of relevant information (Moray, 1981) as well as causing the driver to focus the foveal vision to a specific device instead of scanning the road area (Wierwille, 1993). 2.3.4 Memory The functions of the human memory are important to understand in relation to the usability of products and systems. How people learn to use new products and remember how to use them later on is dependent on the human ability to remember and store knowledge. Models of human information processing attempt to explain what happens with sensory stimuli in greater detail. There are different views regarding types of memory, distinctions and definitions (Cowan, 2008). One of the most influential models is the one first presented by Baddeley and Hitch (1974), which was later on developed. According to the model, sensory stimuli will be held in the short-term sensory store (STSS) for a very short period of time. Some of these incoming stimuli will be meaningful, often dependent on earlier experiences that are stored in long-term memory, and these stimuli will be given attention. Attention will sort out some sensory stimuli for further processing and has an impact on the information throughout the information processing. This will often lead to a response selection and then to a response execution, which may involve movement of muscles to achieve the intended task. However, people do not always act immediately and instead actively hold information for a longer period of time in their working memory. Working memory is where humans are aware of information. Short-term memory is sometimes referred to as a part of the working memory (Baddeley, 1992). Working memory is believed to consist of three subsystems: the visuo-spatial sketchpad which processes visuo-spatial images, the phonological loop which can hold speech-based information active and allows for the rehearsal of information with an inner voice (Baddeley, 1992), and the episodic buffer, which is accessed by conscious awareness and provides a storage site where different parts of the working memory can interact and information from long-term memory can be processed (Baddeley, 2000). Another function is the central executive, that has a supervisory role, directing attention and sorting out distractions in working memory. The executive functions updating, inhibition, and shifting are related to each other as well as they contribute differently to executive tasks (Miyake, et al., 2000).

11
2.3.5 Age and memory With increase in age, vision and hearing acuity will change (Lin et al, 2004). Vision generally starts to decline in the twenties and hearing acuity from the age of 40, with some degree of individual variation. Some of these changes can affect driving, such as the ability to view small objects at a distance, observe and estimate the speed and direction of a moving object, see details in nearby objects, perceive changes in shading, see objects in dimmed light and with changes in illumination, detect objects in the periphery, perceive colors and scan the visual field (Meyer, 2004). Age-related decline is a normal ageing process, and several studies have shown that with increased age there is a decline in many cognitive functions such as episodic memory (e.g., Rönnlund et al, 2005), working memory (e.g., Park et al., 2002; Sander et al., 2012), short-term memory (Nilsson, 2003), visuospatial ability (e.g., Kaufman, 1989; Park et al., 2002), perceptual reasoning (e.g., Baxendale, 2011) and processing speed (Salthouse, 2000; 2006; 2012). Speed difficulties seem to be even more apparent when attention needs to be divided between two tasks, i.e. divided attention (Ponds et al., 1988). However, studies are showing that cognitive ageing is very individual, with some showing decline in cognitive performance and others not (Nyberg et al., 2020). Short-term memory and working memory have been central when studying decline in fluid intelligence with increased age. Fluid intelligence is the ability to apply reason to new problems without significant help from prior knowledge and is an ability that helps human handle novel problems (Horn & Cattell, 1967). Fluid intelligence is important for learning and is believed to be strongly related to heritage (Jaeggi et al., 2008). Crystallized intelligence on the other hand refers to the knowledge we have acquired, such as vocabulary, and is thus important for our semantic memory. It seems as fluid intelligence is more likely to be affected by age, although crystallized intelligence may hide a decline in fluid abilities (O’Shea et al., 2018).
Difficulties with working memory, as noted related to fluid intelligence, can lead to problems remembering recently acquired information, such as route instructions. In addition, limited working memory capacity together with difficulties with long-term memory can cause problems when encoding information, such as when learning new things, or difficulties retrieving information, such as recalling information that was once stored in the memory. For example, an old driver may have very intact procedural memory when it comes to how to drive a car, but may experience difficulties learning a new way of doing things. When information processing slows down with increased age, it can cause longer response times and slower performance. This is particularly evident when encountering e.g., unexpected events in a driving situation (Meyer, 2004). The ability to coordinate tasks is also likely to be affected by advanced age, since task coordination requires working memory (Bopp & Verhaeghen, 2005) and processing speed (Ponds et al., 1988). Limitations in cognitive capacities have thus been singled out as a possible source for dual-task cost. According to a meta-analysis of 33
12
studies, it could be concluded that older adults required more time to perform within dual-task situations than younger adults (Verhaeghen et al., 2003) and other studies have shown that older adults tend to focus only on one task in dual-task situations when the available resources in working memory are restricted (Häuser et al., 2017; Hall et al., 2011). Another aspect of differences in performance between younger and older drivers can be the Speed accuracy tradeoff (SAT), when either speed or accuracy must be reduced in decision-making (Ghisletta et al., 2018). Older adults are typically more prone to prioritize accuracy over speed, and young adults are more prone to favor speed over accuracy (Salthouse, 1979; Wickelgren, 1977). This has not only been explained by behavioral studies, the theory of speed-accuracy tradeoff (SAT), has also gained support in neurological studies arguing that this strategy could be due to age-related decrements in brain connectivity (e.g., Forstmann et al., 2011). 2.3.6 Types of human errors In order to explain and understand some of the problems that can occur with human machine interfaces, it is beneficial to understand human errors that can occur. Errors can be divided in two categories (Jordan, 1998). Slips are errors carrying out an intended method for reaching an objective. Slips can be action-based: the action is not the correct action. Slips can also be memory lapses: the memory fails, and the intended action is not carried out. Mistakes are occasions where the intended goal is wrong. Mistakes can also be rule-based, i.e., when a situation is evaluated correctly but wrong decisions are made in an attempt to reach the goal. Knowledge-based mistakes take place when the user has incomplete or wrong information and is unable to form the right plan. Memory-lapse mistakes occur when memory fails while evaluating a situation, leading the person to form the wrong goal and the wrong plans. Reason (1990) reflects over how mistakes can be more dangerous than slips since they are harder to detect and discover. When making a slip, the user often recognizes the error and understands it to be an error. When a user makes a mistake, they do not necessarily recognize that they have made a mistake. Norman (2013) explains how users often blame themselves for mistakes. The social behavior where users blame mistakes and errors on the themselves, could lead to continued use of devices that are dangerous and inefficient. Norman (2013) also points out that people are often reluctant to report their own errors and admit them in a social context. 2.4 The technology 2.4.1 The tasks of driving a car The task of driving is a perceptual-motor skill (Näätänen & Summala, 1976) requiring the driver to perceive and process stimuli from the driving situation, react upon it and move the body accordingly. Fifty years ago, McKnight and Adams (1970) identified around 1500 tasks
13
that a driver needed to be able to perform when driving a car. In modern times, the task of driving is becoming more mentally demanding than physically demanding (Rumar, 1990). In the future, the task of the human in the car will most likely be more related to monitoring the car than handling it directly. Rasmussen (1990) describes how increased automation could make it more difficult to determine exactly where an error has occurred and whether the error was caused by the human or the machine. Automation also requires a system where the driver can quickly intervene with the machine if needed. Automation can have both positive and negative consequences on factors including driver vigilance. For example, in a simulator study by Strand et al., (2014) it could be confirmed that higher levels of automation had a negative effect on driving performance, making it harder to switch from passive monitoring to active intervention. The advanced driver-assistant systems (ADAS) currently in use today include adaptive cruise control, forward collision warning and lane keeping assist, and the purpose of these systems is to increase safety (NHTSA, 2020) and relieve the driver from certain manual and mental tasks. However, with increased automation, it is important to know what kind of information the driver needs from the vehicle and to identify the tasks involved in driving in order to make the systems as safe as possible. Rumar (1990) presents an operational analysis of driving tasks in order to clarify what kind of information the driver requires and needs to handle (see Figure 3). According to this model, driving consists of eight different tasks; six are operational input tasks, such as strategic planning, which is often carried out before the actual driving and concerns, for example, deciding where to drive, what road to choose; a navigation related task concerns following a route; road related tasks concern positioning the car on the road by following markings, symbols, signs and signals; traffic related tasks consist of interactions with other road users, which are considered difficult tasks due to the large amount of information present in a driver environment (such as the unpredictability of other road users); rule compliance relates to following traffic rules; other tasks refers to tasks that are not directly related to the task of driving, for example, radio or climate control. There are also two output tasks: the vehicle maneuvering task, which is about handling the car in such a way that the operational input tasks can be carried out; navigation is road following, traffic interaction and rule compliance. Speed choice is also a task that concerns choosing a speed that will allow all of the operational input tasks to be carried out and allows for vehicle maneuvering. Driver operations can also be divided in three levels. Steering and using the gear shifter falls under first level operations; changing lane and overtaking are part of the second level; and route planning is part of the third level (Michon, 1985). A novice driver is likely to direct attention towards the most basic tasks, such as learning how to operate the vehicle (Lansdown, 2002). When motor control is developed, attention in this operation can be reduced (Anderson, 1982, 1993). When cognitive resources are freed, the driver can focus on skill acquisition on further levels.

14
Figure 3 Operational analysis of driving tasks
Note. The different driving tasks and relationships between them. Vehicle maneuvering affects the other driving tasks, which consequently influences the choice of suitable speed (Rumar, 1990). One way of viewing the driver behavior is to use Rasmussen’s (1980, 1983) model of analyzing the behavior of machine operators. Rasmussen (1980, 1983) describes different types of human behavior when presented with different tasks, which in turn can have impact on performance. Skill-based behavior does not require high cognitive effort or attention, it is automated and includes tasks such as riding a bike, which is difficult to describe with words. Rule-based behavior is dependent on rules, i.e. previously acquired “know-how,” and can often be described in words. Knowledge-based behavior requires extensive cognitive effort in unfamiliar situations where previously applied rules are not appropriate and a trial and error approach becomes necessary (Rasmussen, 1983). When applying this model on a driver, it is beneficial to make the tasks easy to understand, easy to learn and remember, and more skill- and rule-based than knowledge-based
2.4.2 Gear shifting and the drivers Gear shifting is not a primary task in driving. However, it is still a task that drivers need to perform in order to maneuver the car. Not much research is available on the actual gear shifting task in relation to usability. Most of the existing published work on the topic relates to the technical construction of the gear shifter, rather than how the user handles and experiences the gear shifter. Still, some studies have been done on gear shifting that are
Roadfollowing
Navigation
Trafficinteraction
Nontraffictask
Rulecompliance
Vehiclemanoeuvring Speedchoice
Strategicplanning
15
accessible and public. One such study was done by Harley et al., (2008), who showed that all (except one) of the measured gear shifting errors made by the participants in gear shifting tasks occurred in a hurried situation or in a hurried and distracted situation. Shinar et al. (1998) compared the performance of novice and experienced drivers in cars with manual and automatic transmissions. According to the results, the sign detection for novice drivers became impaired when using manual transmission in comparison with automatic transmission. The manual transmission task was seen as a skill that was not easy to automate, and a task that demanded high levels of attention until it was automated. Another study by Piersma & Waard (2013) compared young and older drivers in a driving simulator study and showed that the older drivers experienced more collisions than the younger drivers when using a manual gear shifter. Overall, the driving performance was worse for the older drivers when using a manual gear shifter. Another pilot study looked at adolescent drivers with ADHD, and indicated that a manual transmission could increase attention for these drivers, which could result in safer driver behavior than an automatic transmission (Cox, et al., 2006). This pilot study shows how important it is to consider the diversity of drivers and needs. 2.5 The context of human machine interaction 2.5.1 Technology as artifacts Technology is all around us and is a fundamental part of modern life. Widmalm (2004) describes how technology as an artifact is shaped by people and how the people are shaped by the artifact. Technology is created and developed in a constantly changing environment. Gullikson and Holmgren (2018) describe how technology and development becomes difficult for users to grasp, since technology just is and is more or less taken for granted. Often, people do not reflect on the technology in their everyday lives, unless they do not work in the way they are supposed to. If a product or system is put in relation to its context of use, it becomes quite clear how diverse the acceptance of a system can be depending on which context it is in. The context, consisting of social values, will impact our understanding and experience of a particular product or system (Mårdsjö & Carlshamre, 2000). The context will also impact how we talk about technology. This line of thought can be fruitful for understanding why and how technology is developed.
2.5.2 Technology and the world The context of use is complex. As Batteau (2010) points out, technological devices can be produced in one context and be adopted in another context with different language and culture, which can cause major accidents in a worst-case scenario. Norman (2013) describes the phenomena of creeping featurism and how products transform from user-friendly to less user-friendly due to contextual circumstances. With the development of advanced technology,

16
the pressure increases to release innovative, useful and attractive products and systems. The same product concept can be under development by different parties, however, whether a product will actually be a success is dependent on many factors, such as timing or the marketing approach. Another factor is whether different parties see the need to develop a certain technology or not. One group might see a need while another, more prominent group might not, and the question thus reaches problem closure (Pinch & Bijker, 1984). Creeping featurism is the tendency to add more functions to an existing product or system. This can make the product much more complex, which can be problematic, especially for a novice user. At times, a product or system might benefit from a redesign because of existing flaws. However, when the developmental process is under pressure, the tendency might be to add new features instead of remedying the flaws. Norman (2013) says, “even the most modern technologies follow this time cycle: fast to be invented, slow to be accepted, even slower to fade away and die” (p. 268). Norman further explains how large companies often have a more conservative way of embracing radical ideas since the risk is ultimately too high. In a competitive market, the developers always need to be one step ahead. For example, while working with one original product intended for commercialization, the engineers may already need to have the following product in mind. This could lead to a drop in the development of new products. Another problem could be that there is a limited amount of time to consider what the customers think about the original product Norman (2013). 2.5.3 Technology and the user A shift in design theory has occurred in recent decades, from a focus on technology in the design process to a greater focus on the users of technology (Oudshoorn et al., 2004). Even though different companies, industries, organizations, etc., may deem user studies to be too big and expensive, the user perspective has become increasingly important. This is partly due to hard market competition and the increased need to go outside the product itself in search of the actual user experience so the product can be made in a way that stands out (Prahalad & Ramaswamy, 2004; Sanders & Stappers, 2008). User participation is thus a way of gaining knowledge about the user environment and thereby improving the technology and its implementation (Bodker, 1996). A variety of studies have been done, some dating back decades, showing the benefits of user involvement in system design. These studies show that knowledge of user requirements leads to better quality, cost savings through the exclusion of unnecessary system features, higher user acceptance, more effective use due to greater understanding of the system and increased participation in decision-making within the workplace (Robey & Farrow, 1982; Damodaran, 1996). The concept of user participation can have varied meanings depending on the theoretical perspective (Symon & Clegg, 2005; Heller et al. 1998). One such concept is the practice of Participatory design (PD), today often called co-design or co-creation, which has been used and studied since the 1970s and is a way of including all presumable stakeholders in the design process of a system or product (Sanders
17
& Stappers, 2008). Sanders and Stappers (2008) define co-design as a part of co-creation, which is a creative act by several people: Thus, co-design is a specific instance of co-creation. Co-design refers, for some people, to the collective creativity of collaborating designers. We use co-design in a broader sense to refer to the creativity of designers and people not trained in design working together in the design development process (p. 6)
Sanders and Stappers (2008) pinpoint the impact of performing user studies in an early stage of development (as well as later on during the process): “In our experience as researchers and practitioners we have seen that co-creation practiced at the early front end of the design development process can have an impact with positive long-range consequences” (p. 9). Early on in a design process, many of the foundational decisions about design are made; only a small amount of developmental costs have occurred, and there is still flexibility to change the design (Davis, 1993). At this stage, user testing can be very beneficial and help avoid user rejection, which is often a main factor affecting the actual success or failure of technology (Davis, 1993). However, the definition of user participation is often criticized as overly vague since the extent that users actually can impact system design and development varies significantly (Iivari, 2006). A part of the problem is that often only a limited number of users are chosen to participate in user studies (Symon & Clegg, 2005). A further aspect that Grint and Woolgar (2013) point out: the users are constructed in the particular setting by the people in that setting. Who should actually represent the user may differ depending on the context and practicalities, such as available and potential sample groups. The time allocated for development is often short, and the input from users is often gathered in a late stage of the development process rather than the beginning when there is still the potential to make an impact (Iivari, 2006). Another factor that prevents a real-world representation of users is that they are often represented by specialists, and the user representatives are not always actively engaged in the process from the beginning. The representatives provide input in the form of comments or test predefined concepts, but they are seldom involved in formulating the concepts. This provides designers with some understanding of their users, but they naturally lack the user’s frame of reference in their role as designers (Cooper & Bowers, 1995). Therefore, the users do not always have the representativeness that would be necessary. And even though a representative group is chosen, user participation is not enough in itself. As Damodoran (1996) points out, the users have to understand their role in the process, what they ought to do, and then have the opportunity to actually do it. Also, participation should be voluntary and meaningful (Damodaran, 1996). The context in which a technology is used often consists of many individuals with different needs and preferences. Bath (2014) discusses how technology can be considered to be neutrally designed (inclusive) but argues that, in fact, it is not. Bath (2014) provides examples from the early speech recognition technologies in Artificial Intelligence, where the technology only recognized male voices even though many of the potential users

18
would have presumably been female. Bath (2014) stresses, much the same as Oudshoorn et al., (2004), the importance of design methodologies that take into account differences among real-life users, such as gender, culture, class and age differences. Much of the technological development we see today is still not representative. The failure to adequately consider real-life end users can affect overall user acceptance, especially if it is an innovation.

19
3 Method
Research methods can vary between disciplines and can also be dependent on what type of questions the researcher wishes to answer. Laboratory experiments, field studies, real world observations and meta-analyses are some of the approaches that can be used to study the psychology of users and the performance of technology (Wickens, et. al., 2013). In engineering psychology, a common approach is to use laboratory experiments. The laboratory environment is often an ideal way to study psychological processes. The laboratory makes it possible to hold environmental factors constant, such as light, sound, temperature and the structure of equipment. This prevents extraneous factors, which can negatively affect the different variables and the results. While laboratory experiments enable a high degree of control, studies outside the laboratory environment can provide a more realistic setting and capture how a user acts in a naturalistic setting (Howitt & Cramer, 2007). In this thesis work, a combination of different methods has been chosen depending on the question to be answered: A field study is used to measure and observe interaction in a naturalistic setting, laboratory experiments to measure relationships between variables, and interviews to explore and gain a deeper understanding of the studied context.
3.1 Participants 3.1.1 The first study In the first study (the field study), eight participants from 19-65 (M = 41, SD = 18) volunteered. Four females and four males. All participants held valid driver’s licenses and had experience with cars with automatic transmissions but no previous experience with the particular gear shifters that were to be tested. The participants were chosen according to convenience sampling with the help of our project partners. The number of participants was considered to be sufficient since this was an initial study intended to explore the directions that would be of interest in the subsequent studies. Throughout the studies, the participants gave their consent to participate and received information regarding the purpose of the research, methods to be used, that participation was voluntary, that they had the possibility to stop participation at any time, who the responsible parties for the studies were and the possibility that motion sickness could occur when participating in the simulator study. The studies complied with Swedish laws regarding research (The Act Concerning the Ethical Review of Research Involving Humans, 2003; Ministry of Education and Research, 2003).
20
3.1.2 The second study In the second study (a laboratory experiment), 36 participants from 19-31 completed the study (M = 23 SD = 3), 29 men and seven women. All participants had a valid driver’s license and drove on a regular basis. All participants, except two, had experience driving with an automatic transmission. The impact on performance due to experience, or lack of experience, driving a car with an automatic transmission was assessed to be insignificant since the research data did not differ from the other participants. The participants were students at Luleå University of Technology who received information about the experiment by e-mail. Participants could sign up to participate if they had a valid driver’s license and were between 19-35 years of age. 3.1.3 The third study In the third study (a laboratory experiment), 24 participants were included in two age groups. The first group consisted of 12 participants, nine males and three females, from 19-30 years of age (M = 23; SD = 3). These participants were all students at Luleå University of Technology who were contacted by e-mail, and participation was voluntary. The second participant group consisted of 12 participants, 10 men and two females, between 51-66 years of age (M = 58; SD = 5). The participants were contacted with information regarding the study either by e-mail or by the test leaders in person. The requirement for participation was that the participant held a valid driver’s license, preferably had experience driving a car with an automatic transmission and was between the ages of 18-35 or 50-70. All of the participants had experience driving a car with an automatic transmission. 3.1.4 The fourth study The fourth study (the interview study), was based on material from nine interviewees, seven men and two females. The interviewees where between 34 and 62 years of age (M = 45; SD = 9). The nine interviewees were chosen based on the fact that they had experience working in research and development within the vehicle industry in Sweden and that they were considered to have a great deal of expertise within the technological field. They were seen as “insider accounts,” who would be able to describe the researched environment in great detail and with a great amount of knowledge (Lööw & Nygren, 2019). Five of the interviewees worked with questions related to human machine interfaces (HMI), either within passenger cars or trucks. One of the interviewees had been working in the development of passenger cars and research questions. Two of the interviewees worked as chief engineers within a subcontractor company that delivered different vehicle parts to the automotive industry. One interviewee was a technical expert in mining machinery. The interviewees were contacted by e-mail with information regarding the study and a request for their participation.

21
3.2 Study design 3.2.1 The first study Different study methods were chosen to meet the different demands of each research question (see summaries of studies in Table 1). The first study was performed as an experimental study conducted outside on a controlled driving track within a gated area. The participants drove three cars currently available on the market; one car was a concept car. No driving occurred on public roads with other vehicles or pedestrians. The cars were driven in a counterbalanced order to avoid learning effects. A single experimental session lasted up to 75 minutes. 3.2.2 The second and third study The second and third studies were laboratory experiments with both within and between subject variables. The second study had shifter type and visibility as within-subject factors. The participants were divided in three levels of complexity and used gear shifters designated to the particular complexity level. Complexity level was a between-subjects factor. The study had a mixed design since a full within-subject design would have most likely been burdensome for the participants. The third study had only one complexity level, meaning that all participants used the gear shifters with the same complexity. Shifter type and visibility were within-subjects factors, and age was a between-subjects factor. In both studies, the order in which the gear shifters were used was counterbalanced between the participants in order to avoid learning effects. The gear shifting instructions also varied between driving sessions. Each participant participated for about 90 minutes. 3.2.3 The fourth study The fourth study was a semi-structured interview study on decision-making in the Swedish car industry. The interviews were done by one interviewer, individually, by phone or via a web-based meeting program (Skype or Zoom). The interviews lasted between 40–120 minutes. An interview guide that covered relevant topics was used during the interviews. The interviews allowed for flexibility, and the interviewees were able to ask questions and answer freely with no time limits. All of the interviews were recorded using a dictaphone.
22
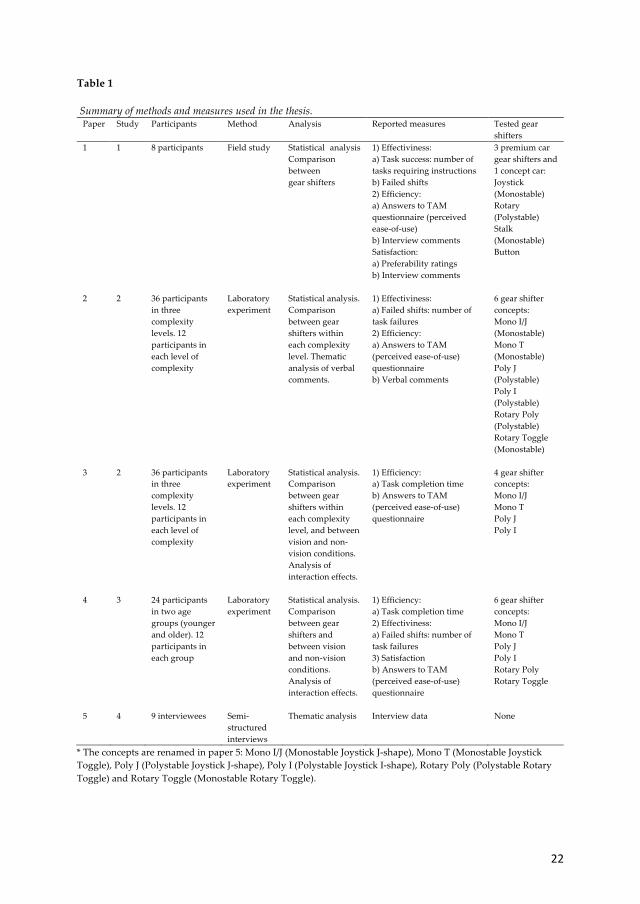
Table 1 Summary of methods and measures used in the thesis.
Paper Study Participants Method Analysis Reported measures Tested gear shifters
1 1 8 participants Field study Statistical analysis Comparison between gear shifters
1) Effectiviness: a) Task success: number of tasks requiring instructions b) Failed shifts 2) Efficiency: a) Answers to TAM questionnaire (perceived ease-of-use) b) Interview comments Satisfaction: a) Preferability ratings b) Interview comments
3 premium car gear shifters and 1 concept car: Joystick (Monostable) Rotary (Polystable) Stalk (Monostable) Button
2 2 36 participants in three complexity levels. 12 participants in each level of complexity
Laboratory experiment
Statistical analysis. Comparison between gear shifters within each complexity level. Thematic analysis of verbal comments.
1) Effectiviness: a) Failed shifts: number of task failures 2) Efficiency: a) Answers to TAM (perceived ease-of-use) questionnaire b) Verbal comments
6 gear shifter concepts: Mono I/J (Monostable) Mono T (Monostable) Poly J (Polystable) Poly I (Polystable) Rotary Poly (Polystable) Rotary Toggle (Monostable)
3 2 36 participants in three complexity levels. 12 participants in each level of complexity
Laboratory experiment
Statistical analysis. Comparison between gear shifters within each complexity level, and between vision and non-vision conditions. Analysis of interaction effects.
1) Efficiency: a) Task completion time b) Answers to TAM (perceived ease-of-use) questionnaire
4 gear shifter concepts: Mono I/J Mono T Poly J Poly I
4 3 24 participants in two age groups (younger and older). 12 participants in each group
Laboratory experiment
Statistical analysis. Comparison between gear shifters and between vision and non-vision conditions. Analysis of interaction effects.
1) Efficiency: a) Task completion time 2) Effectiviness: a) Failed shifts: number of task failures 3) Satisfaction b) Answers to TAM (perceived ease-of-use) questionnaire
6 gear shifter concepts: Mono I/J Mono T Poly J Poly I Rotary Poly Rotary Toggle
5 4 9 interviewees Semi-structured interviews
Thematic analysis Interview data None
* The concepts are renamed in paper 5: Mono I/J (Monostable Joystick J-shape), Mono T (Monostable Joystick Toggle), Poly J (Polystable Joystick J-shape), Poly I (Polystable Joystick I-shape), Rotary Poly (Polystable Rotary Toggle) and Rotary Toggle (Monostable Rotary Toggle).

23
3.3 Gear shifters Four different types of automatic gear shifters were tested in the first study: a monostable joystick shifter (BMW 320d), a polystable rotary shifter with stalk paddles for manual mode (Jaguar XF Sportbrake), a monostable stalk shifter (Mercedes E-class) and a polystable button shifter (Kongsberg Automotive concept car). All gear shifters were standard equipment for the cars used (see gear shifter designs in Figure 4). Figure 4 Gear shifters tested in the field study
Note. The four gear shifters used in the field study with variations in the design of the gear shifter device, shifter patterns and stability (monostable/polystable). The M-function was fragmented (not part of the movement pattern) in the rotary and stalk shifters.
Six different types of gear shifters were used in the second laboratory experiment. The concept selection was made after a trend analysis and the initial field study. The mechanical gear shifter mockup prototypes that were produced were limited to two gear shifter types: joystick and rotary shifters. The joystick was chosen since it is the most common gear shifter type. The rotary gear shifter was chosen since it was assessed to be more relevant to study than the stalk shifter and the button shifter. According to the field study, the stalk shifter was too complex to use in the study and the button shifter was too different from the joystick. In order to avoid introducing an excessive number of differences between the gear shifters, it was also assessed

24
that the joystick and rotary gear shifters would be the most appropriate for comparisons. Visual appearance was similar for each concept. The shifters were made of black 3D printed parts with a neutral design. Since the gear shifters were plain, had a similar appearance in terms of the material, color and texture, and were taken out of an in-car context, they could be studied with no interference from contextual factors that could influence the participant’s subjective measures. Shift forces and patterns were based on the current state of the art. A mount was made on which the joystick or rotary device could be placed. The joystick and rotary device could be exchanged as could the shifting pattern. The shift force was generated by a spring-loaded plunger that was moved through the chosen pattern. The concepts differed in terms of the type of control device, the stability of the movement pattern, the constitution of the movement pattern and the amount of possible gear shifter positions. The type of control device was either a joystick or rotary switch knob (see Figure 5).
Figure 5
The gear shifter concepts in the laboratory experiments
Note. To the left, the joystick gear shifter concept. To the right, the rotary gear shifter concept. The same mockup could be used for all gear shifter concepts.
The same mockup could be used for all gear shifter concepts. The movement patterns were monostable or polystable. With the monostable patterns, the gear shifter could only fix in one or two positions, making the gear shifter spring back to a center position after shifting. The polystable patterns fixed the gear shifter in all shifter positions. The joystick patterns had all shifter positions in a vertical row or in a combination with a J-shape, with Manual mode to the left side. The rotary gear shifters had the pattern in a horizontal line. One of the monostable joysticks and the monostable rotary switch had a toggle function; movement in the shifter pattern could only be done by moving the shifter forward one step at a time, instead of using a sweeping movement between positions. See Figure 6 for examples of exchangeable gear shifter patterns.
25
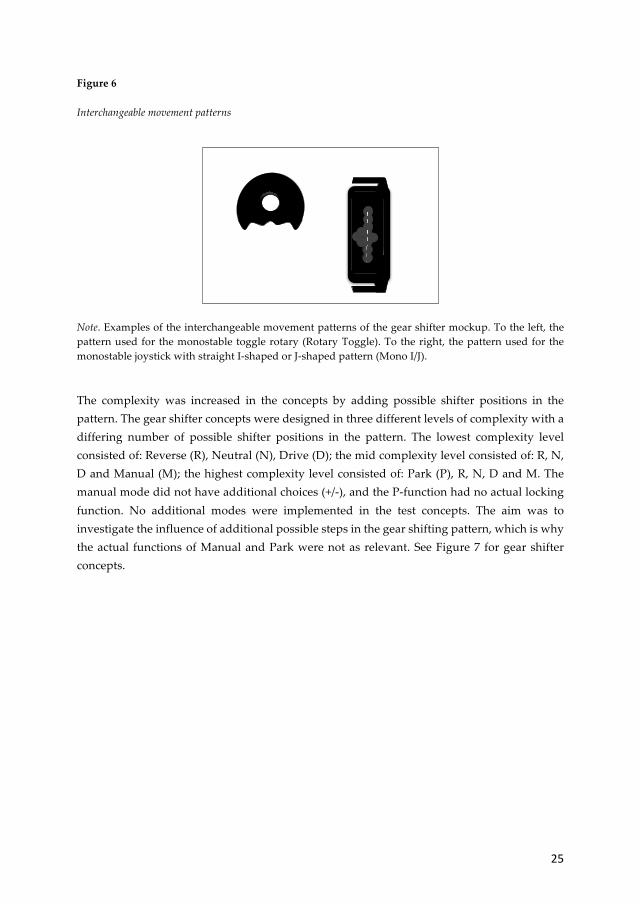
Figure 6 Interchangeable movement patterns
Note. Examples of the interchangeable movement patterns of the gear shifter mockup. To the left, the pattern used for the monostable toggle rotary (Rotary Toggle). To the right, the pattern used for the monostable joystick with straight I-shaped or J-shaped pattern (Mono I/J). The complexity was increased in the concepts by adding possible shifter positions in the pattern. The gear shifter concepts were designed in three different levels of complexity with a differing number of possible shifter positions in the pattern. The lowest complexity level consisted of: Reverse (R), Neutral (N), Drive (D); the mid complexity level consisted of: R, N, D and Manual (M); the highest complexity level consisted of: Park (P), R, N, D and M. The manual mode did not have additional choices (+/-), and the P-function had no actual locking function. No additional modes were implemented in the test concepts. The aim was to investigate the influence of additional possible steps in the gear shifting pattern, which is why the actual functions of Manual and Park were not as relevant. See Figure 7 for gear shifter concepts.

26
Figure 7 Gear shifter types in different complexity levels
Note. All of the gear shifter types used in experimental study 2. The black dots illustrate fixed positions. Complexity levels reached from three choices (low complexity level), four choices (mid complexity level) and 5 choices (high complexity level). In the third laboratory experiment, the same six gear shifter concepts were used as in the second experiment. However, in this study, only the gear shifters at the most complex level were used (see Figure 8). Figure 8 Gear shifter concepts in the second experimental study
Note. The gear shifter concepts used in the second experimental study with only the highest (standard) complexity levels. Black dots illustrate fixed positions.
MonoI/J MonoT PolyJ PolyI RotaryPoly RotaryToggle
3choices RND
RND
RDN
RND
R ND R ND
4choices RN
MD
RNDM
RN
MD
RNDM
RNDM RNDM
5choices PRN
MD
PRNDM
PRN
MD
PRNDM
PRNDM PRNDM
Shifter types
Complexitylevels
PRNDM
PRNDM
PRNDM
PRN
MD
PRNDM
GearshiftersJoystick I-shape Joystick J-shape RotaryI-shape Joystick J-shape Joystick Toggle RotaryToggle
PRNDM
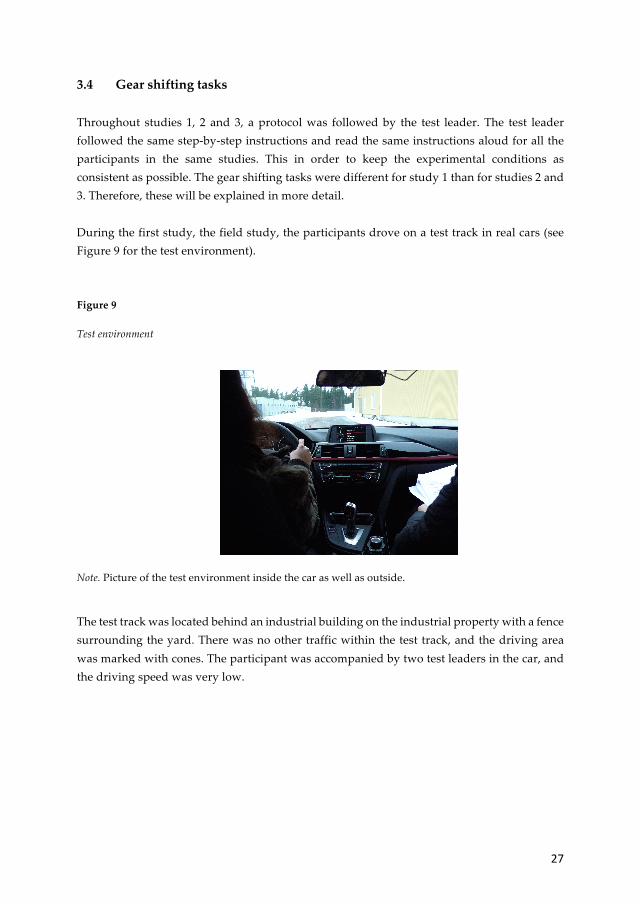
27
3.4 Gear shifting tasks Throughout studies 1, 2 and 3, a protocol was followed by the test leader. The test leader followed the same step-by-step instructions and read the same instructions aloud for all the participants in the same studies. This in order to keep the experimental conditions as consistent as possible. The gear shifting tasks were different for study 1 than for studies 2 and 3. Therefore, these will be explained in more detail. During the first study, the field study, the participants drove on a test track in real cars (see Figure 9 for the test environment). Figure 9 Test environment
Note. Picture of the test environment inside the car as well as outside. The test track was located behind an industrial building on the industrial property with a fence surrounding the yard. There was no other traffic within the test track, and the driving area was marked with cones. The participant was accompanied by two test leaders in the car, and the driving speed was very low.

28
The participants did not receive any instructions regarding the gear shifter functions before the test started nor did they receive instructions during the test, unless they were unable to perform the gear shifting task without guidance. This was done mainly to study the intuitiveness of the different gear shifters. The driving task consisted of the following steps:
1: The participant was asked to select first gear (D) and drive forward 2: The participant was asked to reverse (R) the car a few meters 3: The participant was asked to shift to manual mode (M) and drive forward in first (1) gear 4: The participant was asked to stop, shift to Neutral (N), then shift to drive (D) and drive forward 5: The participant was asked to park the car by shifting to park mode (P)
In the laboratory studies, the participants were seated in a car seat and used gear shifter concepts placed on a mount on the right-hand side of the participant. They also used a steering wheel that was placed in front of the participant while performing the distraction task. The participants were introduced to the functions of each gear shifter before the test sessions started. The test leader explained how to perform shifts with the particular shifter type, and the participant was asked to move the shifter accordingly. In order to verify a basic understanding of the particular gear shifter, the participants had to perform a gear shift test in which they had to successfully perform 10 correct gear shifts in a row (without a time limit) before proceeding with the experiment. The participants then used each gear shifter in both seeing mode and with limited vision. In the limited vision state, a blanket was lowered over the participant’s right shoulder, so they could not see the gear shifter and had no visual cues showing the gear shifter pattern. During the three-minute drive in each seeing-mode, the participants received 9 gear shifting instructions from a computer screen, both with a pre-recorded voice as well as a visual power point letter. At the same time, the participants had to follow 12 different direction signs on a computer screen in front of them (see Figure 10 for the camera views of the experimental set-up).
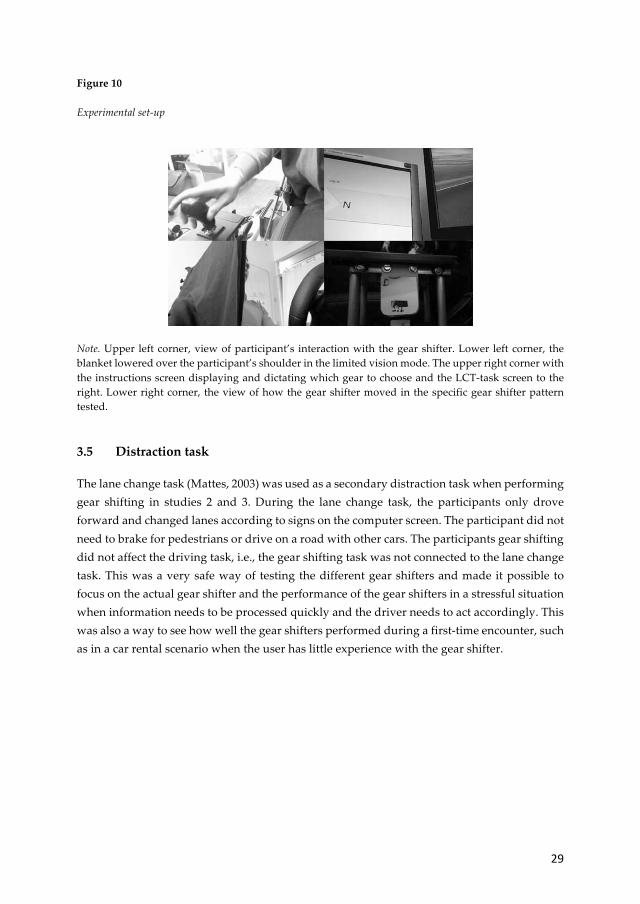
29
Figure 10 Experimental set-up
Note. Upper left corner, view of participant’s interaction with the gear shifter. Lower left corner, the blanket lowered over the participant’s shoulder in the limited vision mode. The upper right corner with the instructions screen displaying and dictating which gear to choose and the LCT-task screen to the right. Lower right corner, the view of how the gear shifter moved in the specific gear shifter pattern tested. 3.5 Distraction task
The lane change task (Mattes, 2003) was used as a secondary distraction task when performing gear shifting in studies 2 and 3. During the lane change task, the participants only drove forward and changed lanes according to signs on the computer screen. The participant did not need to brake for pedestrians or drive on a road with other cars. The participants gear shifting did not affect the driving task, i.e., the gear shifting task was not connected to the lane change task. This was a very safe way of testing the different gear shifters and made it possible to focus on the actual gear shifter and the performance of the gear shifters in a stressful situation when information needs to be processed quickly and the driver needs to act accordingly. This was also a way to see how well the gear shifters performed during a first-time encounter, such as in a car rental scenario when the user has little experience with the gear shifter.
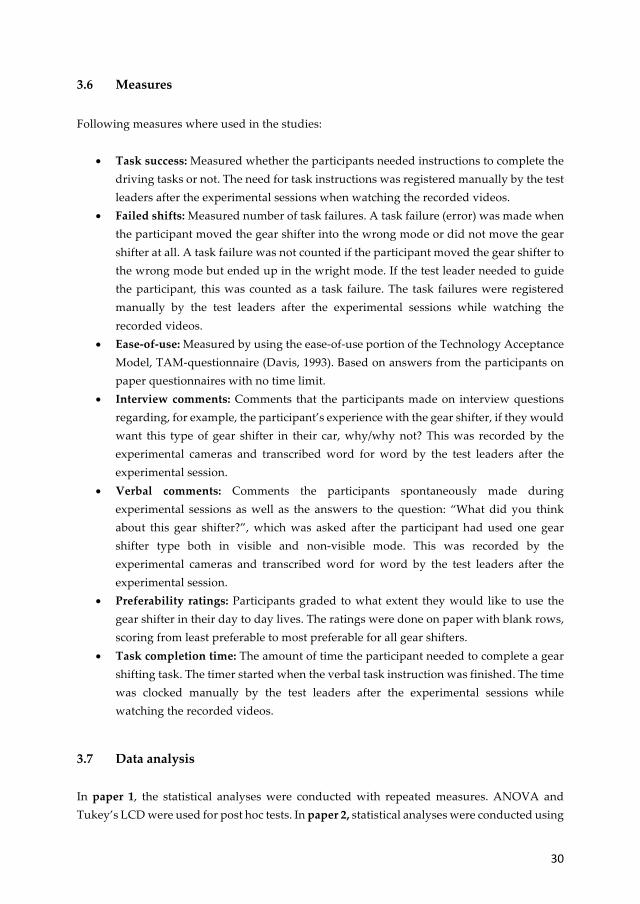
30
3.6 Measures Following measures where used in the studies:
• Task success: Measured whether the participants needed instructions to complete the driving tasks or not. The need for task instructions was registered manually by the test leaders after the experimental sessions when watching the recorded videos.
• Failed shifts: Measured number of task failures. A task failure (error) was made when the participant moved the gear shifter into the wrong mode or did not move the gear shifter at all. A task failure was not counted if the participant moved the gear shifter to the wrong mode but ended up in the wright mode. If the test leader needed to guide the participant, this was counted as a task failure. The task failures were registered manually by the test leaders after the experimental sessions while watching the recorded videos.
• Ease-of-use: Measured by using the ease-of-use portion of the Technology Acceptance Model, TAM-questionnaire (Davis, 1993). Based on answers from the participants on paper questionnaires with no time limit.
• Interview comments: Comments that the participants made on interview questions regarding, for example, the participant’s experience with the gear shifter, if they would want this type of gear shifter in their car, why/why not? This was recorded by the experimental cameras and transcribed word for word by the test leaders after the experimental session.
• Verbal comments: Comments the participants spontaneously made during experimental sessions as well as the answers to the question: “What did you think about this gear shifter?”, which was asked after the participant had used one gear shifter type both in visible and non-visible mode. This was recorded by the experimental cameras and transcribed word for word by the test leaders after the experimental session.
• Preferability ratings: Participants graded to what extent they would like to use the gear shifter in their day to day lives. The ratings were done on paper with blank rows, scoring from least preferable to most preferable for all gear shifters.
• Task completion time: The amount of time the participant needed to complete a gear shifting task. The timer started when the verbal task instruction was finished. The time was clocked manually by the test leaders after the experimental sessions while watching the recorded videos.
3.7 Data analysis In paper 1, the statistical analyses were conducted with repeated measures. ANOVA and Tukey’s LCD were used for post hoc tests. In paper 2, statistical analyses were conducted using

31
the Friedman Test for the analysis of the questionnaire and task success data. Wilcoxon Signed Ranked tests were used to compare the gear shifters within each complexity level. For paper 3, task completion time was analyzed with a mixed model design, ANOVA, with shifter types and visibility as within-subject variables and complexity as the between-subject variable. The data from the ease-of-use questionnaire was analyzed with a mixed model design, ANOVA, with shifter types as a within-subject variable and complexity level as a between-subject variable. Post hoc analyses were made with Tukey’s HSD (Honestly Significant Difference test) for the between-subjects factor, and a Bonferroni correction was used for the within-subject factors and interaction effects. For paper 4, the task completion time was analyzed with a mixed model design, ANOVA, with two within-subject variables and one between-subject variable. Shifter types and visibility were within-subject variables, and age group was the between-subject variable. The Levene’s test of equality of error variances showed significant results in the analysis of task completion times. Therefore, the task completion times were transformed in order to adjust for the variances. The transformed data was then used in the mixed model design ANOVA. The subjective ease-of-use data was analyzed with a mixed model design, ANOVA, with one within-subject variable (gear shifter type) and one between-subject variable (age group). The analyses were calculated with the mixed model design, ANOVA, with the between-subject factor, in the statistical analysis program SPSS. Post hoc analyses were made with Tukey’s HSD for the between-subject factor, and a Bonferroni correction was used for the within-subject factors and interaction effects. A simple contrast was made in the analysis of both task completion times and perceived-ease-of-use, comparing the gear shifters to the baseline, Polystable Joystick I-shape. The errors were measured with a Mann-Whitney U Test by comparing the gear shifters in visible and non-visible modes between the two age groups. The significance level was set to 0.05 throughout the analysis in all studies. The interviews for both papers 2 and 5 were transcribed verbatim, and a rough thematic analysis was done according to the guidelines developed by Braun and Clarke (2006). The transcripts from the interviews were read through multiple times and codes were noted. The codes were discussed between authors and organized into main themes and sub-themes. All themes were refined and checked against the full interview transcripts. The themes were guided by the research questions in both papers 2 and 5. The focus was more on the explicit content of the data. The analysis was done more on a semantic level than a latent level.

32
4 Summary of appended papers 4.1 Paper 1 Field study investigating gear shifter usability in car rental scenario This study was done to identify possible usability profits and concerns with different types of gear shifters with shift-by-wire technology in their natural in-car context. The results provided the basis for the subsequent studies discussed within the thesis
The frequency of failed shifts was significantly higher for the joystick and the stalk shifter than with the button shifter. No difference was found between the rotary shifter and the other shifters. No significant differences could be found between the gear shifters regarding ease-of-use when measured with the Technology Acceptance Model questionnaire. The highest number of instruction-free drives were made with the button shifter. The button shifter was the easiest to understand and use, however, it could also require more eyes-off-road time, since it did not have a movement pattern like the other shifters, i.e. it was not possible to feel what mode was activated. Overall, the rotary device was described as easy to use and simple. The problems with the button and rotary shifter were all related to the task of finding and selecting the manual driving mode (M). The joystick shifter was the most preferred shifter; it felt familiar, even though it generated the most errors and half of the participants could not figure out how to start and select Drive (D). One possible explanation for this was that participants described the shifter as normal, familiar and having an appealing appearance overall. The stalk shifter was the least preferred shifter and also the most difficult to use, since the stalk shifter was behind the steering wheel in a location that the participants were unaccustomed to. This study provided guidance for the subsequent studies. As a result of this study, the stalk shifter was eliminated from subsequent studies, as it was unfamiliar to many Swedish drivers and overall, it was difficult to understand and use. The button shifter was also eliminated since it was not very common and could induce eyes-off-road behavior. Another direction was to compare new gear shifter concepts with more traditional concepts, such as the polystable joystick with fixed positions instead of only one or two fixed positions. A third direction was to compare gear shifters with no contextual factors, such as the interior of a new car or the trademark, that could influence subjective opinions about the gear shifters.

33
4.2 Paper 2 Gear shifter design – Lack of dedicated positions and the contribution to cognitive load and inattention The purpose of this study was to perform a more comprehensive comparison between gear shifters than in the preceding field study. The aim was to find explanations on a more detailed level regarding differences, similarities, benefits, disadvantages and patterns, both between the gear shifters as well as within gear shifters. Gear shifter concepts with exchangeable movement patterns and shifter designs were constructed. The concepts were based on the previous field study described in paper 1. The six gear shifter concepts differed by the type of control device, monostable or polystable pattern, the constitution of the movement pattern and number of possible shifter positions. The six gear shifters were compared at three different levels of complexity. The type of control device was either a joystick or rotary switch. The results showed that the Monostable gear shifter with an I/J-pattern had lower perceived-ease-of-use scores than a Monostable joystick with Toggle function, Polystable joystick with a J-shape and Polystable Rotary shifter, within all levels of complexity. The Monostable Rotary Toggle received low scores across all levels and did not differ significantly from Mono I/J at any level. The total number of failed shifts (73) was not exceptionally high, and significant differences within complexity levels were not found. However, The Rotary Toggle shifter resulted in the highest number of failed shifts. The results showed that here were difficulties with all gear shifter concepts overall, and the same type of difficulties could be seen across all shifter concepts. However, the most striking and obvious difficulties were those experienced and expressed by participants exclusively in relation to the monostable shifters. The difficulties identified exclusively with the monostable gear shifters concerned the lack of dedicated positions, thereby withdrawing both visual and haptic aid for the driver, which could increase the cognitive load of the driver. A consequence of this could be that the drivers in the study felt lost in the shifter pattern and directed too much attention towards the gear shifter instead of the road environment. Since comparisons were only made within complexity levels, one item of interest was studying whether there would be differences between complexity levels or if performance would stay the same for the gear shifters with increased complexity. It was also deemed worthwhile to investigate other performance measures further to see how vision could affect the gear shifter performance. In order to reduce possible variables affecting the analysis, a comparison of only the most common gear shifters, the joysticks, was identified as the best way to move forward.

34
4.3 Paper 3 Comparison of usability between gear shifters with varied visual and haptic patterns and complexities This paper analyzed results from the same study as paper 2. However, the comparisons were made only with four of the gear shifter concepts in order to refine the analysis, and another type of measure, task completion time, was added to the analyses. The analysis was now done across complexity levels instead of within, with visibility and without visibility. The aim of this paper was to evaluate usability aspects of monostable versus polystable joystick gear shifters at different complexity levels, with or without visual feedback. Four different gear shifter types were compared at three complexity levels (Figure 7). All gear shifters had a joystick shape but differed in their movement patterns. Two of the gear shifters had a monostable pattern, and two of the gear shifters had a polystable pattern. The gear shifter types also varied in the shape of the movement pattern. One of the monostable gear shifter types had a toggle function. The results indicated that the Monostable joystick with an I/J-shape had longer task completion times than the Monostable joystick with toggle function, the Polystable joystick with a J-shape and the Polystable joystick with an I-shape. The Monostable joystick with toggle function also had longer task completion times than the two polystable joysticks. The Monostable joystick with an I/J-shape was less efficient and scored lower on ease-of-use than the other three shifters. The Monostable joystick with toggle function was less efficient than the two polystable shifters. The complexity level with five choices, a standard PRNDM shift sequence, was less efficient and had lower ease-of-use scores than the level with three choices, a reduced RND shift sequence. Hence, the Mono joystick with an I/J-shape was more negatively affected by an increased complexity level than the other gear shifters. That is, the Mono joystick with an I/J-shape, at the highest complexity level and with no visual feedback, was clearly less efficient than any other experimental combination.
35
4.4 Paper 4 Age differences in gear shifter usability – Comparison of joystick and rotary gear shifter with different visual and haptic movement patterns The fourth paper compared two different age groups in order to see whether the performance of the gear shifters would change due to age differences. The comparisons were made with all six gear shifter concepts, but complexity was excluded as a variable. All of the gear shifters had the highest complexity. The purpose of this paper was to investigate whether there were differences between joystick and rotary gear shifters with different visual and haptic movement patterns, depending on age of the driver. Overall, the older participant group had longer task completion times than the younger group, irrespective of gear shifter type and visibility mode. The Polystable Joystick with a J-shape had the shortest task completion times of all the gear shifter types, while the Monostable Joystick with a J-shape and the Monostable Rotary Toggle had the longest task completion times overall. The older group had a higher error rate than the younger group when using the Monostable Joystick with a J-shape in both visible mode and in non-visible mode. The older age group also made more errors when using the Monostable Joystick Toggle in visible mode. The older group gave higher subjective ratings for all of the gear shifters compared with the younger group. Overall, the Monostable Joystick with a J-shape received the lowest ease-of-use scores of all the gear shifter types, with the exception of the Monostable Toggle Rotary. In order to assess how different age groups perform with different gear shifter types, further studies that include an older age group would be relevant. Also, further research investigating the differences in learning effects with different gear shifter types would be beneficial to get a more comprehensive understanding of the impact of gear shifter variations in different age groups.
36
4.5 Paper 5 Balancing act – Interview study of decision-making in the Swedish vehicle industry Since usability and safety-related issues were found with some of the gear shifters tested in the previous studies, it was of interest to discuss why these concepts were still implemented. The influence of fast-paced environments on decision-making and, by extension, the products released to the market, became an important aspect to investigate in order to understand and avoid potential negative consequences and identify opportunities for improvement. The purpose of this article was to investigate how nine experts within five different companies in the vehicle industry in Sweden described and experienced the decision-making process in their workplaces. The thematic analysis resulted in five themes: agile way of working and balancing act in decision-making, the available knowledge and knowledge building, resources in terms of time and money and decision-making in groups. This study indicated that decision-making seemed to be a balancing act between normative and descriptive decision-making, according to what was the most efficient path based on the ecological rationality of the situation. Whether decision-making was normative was primarily dependent upon: if the product already exists or if it is new (if standards, regulations, guidelines, know-how and methods already exist in a “normative knowledge bank”) and whether there was adequate time and money to acquire new or complementary knowledge. If decisions were to be made despite a lack of knowledge, money and/or time, social networking, both internally and externally, is clearly an important tool to acquire more information to make the best possible decisions. The existence of teams of people with different backgrounds and knowledge was also expressed as a positive for decision-making in order for the team to see and understand a product in a variety of ways. In order to prevent unwanted consequences from decisions, good communication and understanding between teams and key actors was found to be essential. The understanding of consequences for decision-making under time pressure, for example, was also highly beneficial for maintaining high quality decision-making processes. A more agile way of working also had the potential to impact decision-making in HMI related questions, depending on whether decisions concerned hardware or software. Hardware development could be costlier in terms of time and money in comparison to software development, which was an aspect that was expressed by all of the HMI experts within the car and truck companies.

37
5 Discussion
This thesis work builds upon the project Life on Board. The project was developed due to a paradigm shift in the development of gear shifters in passenger cars. There were many possibilities offered by the new shift-by-wire gear shifters, just as there were potential difficulties. The aim of this thesis was to contribute knowledge regarding this technology by studying conditions for technological development in general and the usability of modern gear shifters in passenger cars in particular. 5.1 The first research question What possible usability advantages and concerns can be identified with some of the modern gear shifters used today? In order to lay a foundation and guide further work in the subject, an initial study in the field was beneficial. This question was studied mainly in paper 1. In the first paper, where drivers used four types of gear shifters in three production cars and one concept car, we observed some interesting tendencies. The joystick gear shifter, which was very traditional and widespread because of its design, was the most preferred shifter, even though the joystick and stalk shifters were objectively the most difficult gear shifters to use. The stalk shifter was the least preferred and was difficult to use. The paddle functions could be mistaken for windshield wiper and were difficult to find. This finding might be different in a country where stalk shifters are more common. The buttons and rotary device were easy to use and understand overall. However, difficulties were experienced when participants needed to find the manual mode. Since this was not a primary task with an automatic gear shifter, it would not be a major safety issue, even though the overall usability could be affected. The button shifter also induced eyes-off-road behavior, which could be problematic if glances exceed, for example, NHTSA Guidelines (2012) on glance behavior while performing secondary tasks. It also appeared that subjective experiences with the joystick were somewhat contradictory to the actual handling of the monostable joystick. This could perhaps be related to the social tendency to blame the error on oneself as a user instead of the product (Norman, 2013). In this respect, the study showed the importance of the in-car context for the participants’ perceptions of the gear shifters. In the following papers, where the gear shifters were not placed in a car-context, the participants had differing perceptions of the joystick shifter.
38
5.2 The second research question What usability advantages and concerns can be found between gear shifters with variations concerning shifter patterns, stability, design and complexity? Once a foundation was built and direction identified in paper 1, decisions could be made regarding what types of gear shifters would be studied in greater depth. This, in order to make an assessment of different gear shifter concepts with variations in complexity. These results could aid in further research by helping to identify which functions and designs should be avoided, enhanced or studied further. The aim of papers 2 and 3 was to answer this question. The second study was comprehensive in that it altered a great variation of usability measures and included six gear shifter concepts with three different complexity levels, providing 18 different gear shifter combinations. Participants expressed that familiarity, such as the familiar joystick, was positive, which could have a beneficial impact on overall acceptability of gear shifters. The Monostable joystick with an I/J-shape was less efficient and was rated lower on ease-of-use than the other three shifters (polystable joysticks and the monostable toggle joystick) in paper 3 when comparing only four gear shifters across complexity levels. The difficulties found exclusively with the monostable gear shifters in papers 2 and 3 concerned the lack of dedicated positions. The Monostable joystick with an I/J-shape was most negatively affected by the highest complexity level and limited vision. This is quite remarkable since the highest complexity level is a common complexity level in many production cars. The drivers described feeling lost and counting steps for themselves during interaction. From what the participants described, it appeared that the drivers had difficulties creating an understanding and a mental model of the gear shifter pattern (Carroll & Olsson, 1987), which required them to process information in their working memory and direct attention to remembering the pattern. Due to the lack of dedicated positions, both visual and haptic aid was withdrawn for the driver. In an actual driving context, the driver would need to rely on additional visual displays that must function reliably. The participants still tried to use endpoints in the monostable patterns to navigate, somewhat similar to the fixed positions in polystable patterns. The M-gate functioned as one such endpoint and divided the long shift pattern into smaller units. The more modes that were placed in a row, the more effort was needed for the participants to navigate in the pattern, both in terms of visualizing the pattern and feeling the number of steps taken during the task. The division of a straight-line pattern would presumably be beneficial to the driver, making it easier to create a mental model, and would also aid in the creation of extra haptic and visual cues while handling a gear shifter, which was also suggested by Harley et al. (2008). Interfaces that lack these types of cues can impact a driver’s understanding of the system. The interface design can be tremendously important in terms of whether it causes a distraction or not, and it can have an impact on the overall system acceptance (Mcllroy, Stanton & Harvey, 2013). A lack of compatibility was expressed as a negative when forward motion required participants to pull the joystick towards them or to

39
turn a rotary knob clockwise, which felt unnatural. These aspects could increase the cognitive effort that the participants needed to invest when using the gear shifters, causing the driver to, for example, task sample to a greater degree (Wierwille, 1993). Interestingly, earlier studies regarding gear shifters with manual and automatic transmissions have produced results in favor of cars with automatic transmissions (Shinar et al., 1998; Piersma & Waard, 2013). According to Shinar et al. (1998), novice drivers became more distracted when using manual transmissions and performed worse in sign detection than they did when using automatic transmissions, and the manual transmission task was regarded as a skill that was difficult to automate. Piersma and Waard (2013) instead concluded that older drivers performed poorer than younger drivers when using manual transmissions. However, it is not the automatic transmission, per se, that is the issue with the gear shifters, it is the monostable shifter pattern. There have been problems related to monostable gear shifters, and there are still issues with modern gear shifters (e.g., NHTSA, 2016, 2018a, 2018b, 2019a, 2019b, 2019c). Still, it is likely that this type of gear shifter will continue to be used in vehicles in the future, even though it may not be as prevalent or executed in the same way in autonomous vehicles. How the overall driving task will change with automation could be put in relation to, for example, Rumars (1990) operational analysis of the driving task. The overall cognitive load in relation to tasks such as navigation, road related tasks, traffic related tasks, rule compliance, maneuvering and navigation will likely decrease. An important aspect of autonomous cars is how the driver is able to get into the loop and how quickly this occurs (Wickens et al., 2013). In a simulator study by Strand et al. (2014), it was confirmed that drivers seemed to perform worse when automation levels increased. When these conditions are combined with complex gear shifters, it could presumably add to the safety risk in an overtaking situation. A gear shifter with an automatic transmission is mostly used when the car is standing still, apart from when the driver activates the manual gear shifting mode. The lower frequency of shifting with an automatic transmission leads to reduced rehearsal occasions than with a manual gear shifter. This could also have impact on the learnability of the gear shifter. It is important to make the gear shifter intuitive and easy to use and learn. The gear shifting task should be designed to be a skill-based task as much as possible, which is in line with Rasmussen’s (1980, 1983) model of analyzing the behavior of machine operators. 5.3 The third research question Are there differences in usability between gear shifters with variations in shifter patterns, stability and design at the highest complexity level between different age groups? Paper 2 and 3 did gave directions about possible difficulties with certain types of gear shifters. Paper 4, studied whether the usability of gear shifters at the most complex level could be affected by age, which was a step towards approaching different types of users and broadening the research field.

40
The fourth paper covered this question by studying a younger and an older group of drivers. In contrast to the speed-accuracy tradeoff theory (Salthouse, 1979; Wickelgren, 1977), the younger participants had shorter task completion times and made fewer errors than the older participants. However, when comparing visible and non-visible modes, the older age group seemed to speed up their use of the polystable gear shifters. This implied a positive learning effect for the older age group with the polystable gear shifters. However, it would be highly interesting to compare the results with age groups above 70 as well, to study potential differences with a third age group. The fact that older participants had longer task completion times is in line with earlier studies, which have shown that information processing slows down with age (Salthouse, 2000, 2006, 2012). Research has also shown how speed-related difficulties in elderly drivers become more obvious when attention is to be divided between tasks (Ponds et al., 1988), and this study supports these findings. Since the experimental study was quite demanding, requiring the participant to both shift gears and follow road signs, the cognitive demand was likely quite high. The older age group also seemed to make the most errors with the Monostable Joystick with a J-shape. This was the gear shifter type that was the most cumbersome for both age groups. This leads to conclusions similar to papers 1, 2 and 3: the lack of dedicated positions seems to be a disadvantage for the monostable gear shifter types, especially for the Monostable joystick with a J-shape, in comparison to the polystable gear shifters. It seems that the lack of haptic guidance, which can also provide additional visual guidance for the spatial position of the gear shifter, negatively affects usability. Another important result was that the older participants rated all of the gear shifters higher than the younger participant group. This could perhaps be related to attitudes in different age groups. As Norman (2013) states, users often tend to blame themselves for mistakes, and people are reluctant to report their own errors and admit to them in a social context. It could also be that the older group behaved more in line with what Norman (2013) describes, and the younger participants were more critical in their overall judgements. This difference is very important to consider when studying systems and products. A possible consequence of a user blaming an error on themselves is that the user continues to use devices that are inefficient or even dangerous and they do not report them or talk about them. In paper 1, the participants preferred the Monostable Joystick with a J-shape the most, even though it was one of the most difficult gear shifters to use. The difference in subjective ratings between the participants who interacted with a real gear shifter in a natural car environment, compared to the neutral gear shifter concepts (in papers 2, 3 and 4) without influencing factors such as knowledge of the car brand or an attractive interior, is also highly notable. This may be evidence of how people can be influenced by the environment in which the gear shifter is placed, possibly perceiving it to be much more effective, efficient and satisfying than it actually is. However, these studies only give indications in this direction, the questions need to be studied with larger samples to assess if this is actually the case.
41
5.4 The fourth research question How are decisions regarding technological development made? Based on the results presented in papers 1, 2, 3 and 4, a fourth research question emerged regarding technological development, which is studied in paper 5. This paper studies how decisions are made in the vehicle industry in Sweden as a way of understanding the developmental path of technology and how different developmental needs becomes more obvious than others. The fifth paper answered the fourth research question. The aim of the fifth paper was to contribute to answering a complex and broad question, rather than answering the question in full. Since difficulties were found with gear shifter concepts that were implemented in cars, it became relevant to ask why technology with known malfunctions was implemented, why the technology was not as “good” as its predecessors, why it is still used and why it has not been improved. This paper moved the focus from a study of the interactions between users and technology (the gear shifters) to a focus on the parties who develop technology, a part of the context of technologies, users and their interactions. The producing parties are those who need and benefit from knowledge about the users and the user perspective (Bodker, 1996; Sanders & Stappers, 2008). This study showed that decision-making could be more or less normative or descriptive, depending on factors such as how much prior knowledge was available regarding a technology, the potential severity of the consequences of a decision and the amount of resources available to the decision-makers to acquire knowledge. Knowledge about and from the users was valued highly, and it was not possible to acquire this knowledge. When knowledge from the users could not be gathered through user studies, for example, social networking became very important as did well-functioning communication between groups and the different skills and competencies of team members that allowed the team to view a technology from different perspectives. These studies show that there is not always knowledge available to decide whether a technology is “good enough” since this knowledge cannot be acquired. This is a complex situation since society expects a rapid pace of technological development. And as history has already shown, some technologies infinitely develop new integrations with more and more complex solutions (Norman, 2013), while others do not, even though they would benefit from it. As Mårdsjö and Carlshamre (2000) state, the context will impact how we view and experience technology. Our knowledge, experiences and motives will also impact how we view a technology. The definition and future of a technology are dependent on those who judge it according to a closure mechanism (Pinch & Bijker, 1984). Complexities in closure mechanisms relate to the fact that they are highly context and time dependent. The closure mechanism can be performed by different groups given a certain degree of prominence at a particular point in time. The acknowledgement of this fact is crucial to understanding why and how technology develops in certain directions

42
and creates awareness of how these processes can impact safe and sustainable development. Within a highly dynamic environment like the vehicle industry, a number of decisions need to be made regarding technology. Decisions made in product development are often made by many different people, in different phases of development and after the development phase is concluded. This can result in fast decision-making with a high degree of uncertainty for those who work in the development of technology. It can be difficult to change the ways large organizations work. However, it became clear in the interviews that a more agile way of working was already implemented or would be implemented within the car and truck companies. This would bring decision-making to the level of the teams who work close to the technology itself and would be beneficial in that decision-making is then moved from higher levels closer to the product. However, as some of the interviewees pointed out, this might not be as beneficial in practice since there are many opinions that need to be considered in the groups and the time schedules for different teams may not synch up. One of the most important overarching aspects in this decision-making process would be the acquisition of knowledge, preferably very early on in a design process, when there is still flexibility to change the system or product. This is also the phase where user testing would be very beneficial (Davis, 1993; Sanders & Stappers, 2008). As Iivari (2006) points out, the time window for development is often very short, yet information from the users is gathered at a late stage in the process. According to Cooper and Bowers (1995); Damodaran (1996); Symon and Clegg (2005) and Bath (2014), it is important to acquire knowledge about people who are representative of the user group and to consider variation between different users. As Batteu (2010) states, a technological product or system might be produced for one context only to be used in another. If the users in the new context were not considered as users in the product development phase, this could cause major accidents or at the very least, result in low user satisfaction.
5.5 Methodological considerations 5.5.1 Reliability and validity To the best of the authors knowledge, the studies in this thesis represent the first of this kind in this field of study. They should be considered basic studies, laying a foundation and guiding further studies. This I believe is very important to keep in mind when reading this work. However, there are some methodological considerations that need to be mentioned. In the first field study, cars that were already in production were used. The gear shifters were in their “natural” environment. A study like this can tell us about the gear shifter in that specific car,

43
with its design and brand. This context will most likely influence the overall impression of the gear shifter. This study can therefore not describe the gear shifter outside this context, since there are many factors that influence the participant’s subjective assessment of the gear shifters. This method has proven reliability and validity for measuring usability of the gear shifters in the specific car context. The number of participants was not high (8). Whether these participants were a large enough sample to generate generalizable results can be questioned. If this were a study that would have been performed later on in the research process, more participants would have been eligible. Since this was the first study within a relatively uncharted field, and the purpose of the study was to provide guidance for further work, the number of participants was considered to be sufficient and the actual time that participants participated was extensive (75 minutes), which resulted in comprehensive data. In order to avoid influencing contextual factors, an experimental design where the researchers have the possibility to control for confounding variables is preferable. If the experimental setup and design is well planned, the researchers can define and explain what variables have been studied with a greater degree of certainty. However, the choice of any experimental setup can have negative aspects. While the first study had high ecological validity and many possible confounding variables, the laboratory experiments in the second and third study had fewer confounding variables and loss of ecological validity. There were some limitations with the laboratory setting, which had an affect the ecological validity of the test set-up. The gear shifters were not electronically coupled to a driving scenery. Thus, the movement of the gear shifter would not affect the movement in LCT. However, drivers using a gear shifter with an automatic transmission seldom shift gears while in movement (activation of PRND-modes). Studying the gear shifters in movement would further reduce the ecological validity. Therefore, in order to study the gear shifters from a more suitable perspective, the focus was on the performance of the gear shifters in a stressed situation, standing still. By receiving several gear shifting tasks in a short period of time while reacting to road signs, the participant needed to quickly process information and act accordingly. This was also a way to see how well the gear shifters performed during a first-time encounter, such as in a car rental scenario, when the user has little experience with the particular gear shifter. The test setups in studies 2 and 3 could therefore indicate the level of performance with the different gear shifter types during a stressed situation as well as how intuitive and easy to learn the gear shifters were when under time pressure and a short period of use. The second study had both within- and between-subject variables. A full within-subjects design would have been the most advantageous way to study the gear shifters. Since the study was very comprehensive, time intensive, included many tasks and lasted a long time (90 min), it was quite demanding for the participants. One solution for a full within-subjects design would have been to take breaks. However, the risk that the participants would receive information that could impact the test results would increase, and the risk for interrupted

44
participation would increase. It would not have been justifiable to increase the test time and tasks for the participants. In studies 2 and 3, the number of participants was not very high (36 and 24). This could also have an impact on reliability and validity. Since the laboratory experiments were quite time consuming for the participants and required the participants to have the vigilance needed to perform the tasks, it was difficult to find participants who had the interest, time and ability to participate. A within-subjects design could have solved this issue by requiring less participants. However, the test would then have required even more time and vigilance from the participants. Since the studies were the first of their kind in the field and the purpose was to provide guidance and lay the foundation for subsequent studies, the number of participants were deemed to be sufficient. The fourth study, the interview study, was conducted with nine experts using insider accounts (Lööw & Nygren, 2019). It could be questioned whether these experts could provide information that fully captures the decision-making process within the Swedish car industry. The aim of the study was not to present solutions; the aim was to describe how experts experienced decision-making. The study interviewed certain experts, describing their view, not the view of all experts within the industry. The paper described patterns that were the same across the descriptions of these experts. The data that was gathered from the interviews was very comprehensive and provided themes that adequately described the context and the tasks which the experts performed. And as with the three previous studies, this study was to be regarded as an explorative study that could add pieces to a larger picture. And with this objective in mind, the study served its purpose. One final note relates to the distribution of participants based on two aspects in particular: gender and age. Overall, most of the participants in the studies (except the first study) were male. In the second and third studies, all of the participants between 19-31 voluntary signed up for participation through a booking system or by contacting the test leaders. Similarly, most of the participants in the 50 and over age group signed up for the participation on their own. The test leaders did not control for gender in any way or sort out participants to achieve a more equal distribution. This was mainly due to time constraints and the fact that it was difficult to find participants; I therefore did not manage to have an equal number of female and male participants in the studies. There were no differences between female and male participants in gear shifter performance in the studies, but in further studies, it would be beneficial to have a more equal distribution. Most of the participants in the laboratory experiments were young (19-31) and were students. This creates an overrepresentation of younger drivers. In the third study, 12 more participants were added who had turned 50 (51-66), but older age groups were not represented. This age group is of interest to study since some cognitive functions begin to decline more rapidly after the age of 50 (Salthouse, 2006); however, this group is often still active in the workforce and maintains or even improves
45
certain cognitive capabilities. An additional age group of older participants would be beneficial in future studies.
5.5.2 Ethics Researchers always need to make ethical considerations before conducting a study. The Swedish Research Council (2017) describes the considerations as follows: A fundamental question in a research ethics review concerns the balance between risk and benefit. This always starts as a negative value, as every study demands time of its participants and exposes them to a certain amount of risk, even if it is sometimes minimal. A necessary condition for a balance to be reached is that the method used answer the question asked. The question should preferably also be important, and its answer clearly and strictly formulated. If a study does not answer its questions, it should not be conducted in its current design. When you decide to begin a research project, you should choose a method with the fewest imaginable harmful consequences on the people and/or animals involved, if the methods are otherwise equal. Additionally, the benefit of the planned research and the scientific value of its expected results should always be weighed against its harmful consequences. (p. 20) In the studies conducted during this work, the potential negative aspects were thoroughly considered. The field study was performed in a safe outdoor environment with no other traffic. The second experimental study was performed in a laboratory environment, which was the safest possible solution, partly because it was a test that was quite demanding for the participant, with little opportunity to attend to other external events. The interview study did not induce any safety risks; however, it was very important to maintain the anonymity of the participants. This is why participants are described with a more general description of their work tasks and roles, and no specific information is given about the participants’ affiliations. 5.5.3 Measures The measures that were used throughout the studies served the purposes of the studies. The same usability measures were used throughout the studies in order to capture efficiency, effectiveness and to some extent satisfaction. These measures were chosen in order to create continuity between the usability studies and to provide a structure that was very much the same across the different papers in order to create a way to compare the studies more easily. Some measures and methods were not included in these usability studies due to the fact that they would add to the complexity and length of the studies and they were not assessed to be more important than the measures and methods that were chosen in these particular studies. For example, cognitive workload is a measure of efficiency. High cognitive workload, i.e., when tasks require an excessive amount of processing capacity (Wickens et al., 2013), can increase the risk for errors (Jordan, 1998). Mental workload can be measured by the Task Load
46
Index (TLX) (Hart & Staveland, 1988), which is a workload measurement tool used to gather information regarding subjectively experienced mental workload of, for example, process control room operators or aircraft pilots (Stanton et al., 2013). Physiological parameters can also be used to measure mental workload, such as heart rate variability, brain rhythm analysis and pupil dilation (Jordan, 1998). The TLX index could have been useful in the studies, potentially providing additional information regarding the participants perceived cognitive workload when using the different gear shifters. Glances at road and glance direction, and time and frequency when a participant directs eyes off road, are very interesting measures that would provide complementary results regarding the gear shifters and how to combine vision and haptics in the most beneficial way. In studies 1, 2 and 3, the eyes of the participants were recorded by video cameras. However, at the time, no eye-tracking system was available. Unfortunately, analyzing this behavior manually can induce errors, since the direction of the eyes is difficult to measure and it is hard to determine where a person is actually looking. With an eye-tracking device, researchers could find very interesting and useful results. In future studies, some or all of the usability measures that were used in studies 1, 2 and 3 could be replaced with those mentioned above to give a fuller picture. Hence, focusing more on physiological reactions and the participants’ subjectively perceived task load, as well as eye-off-road behavior.

47
6 Conclusions The three usability studies and four papers of this thesis contributed by filling parts of the knowledge gap about modern gear shifters, their users and the usability of these devices. The fifth paper focused on decision-making in the Swedish vehicle industry; this paper could add to the understanding of the bigger picture of technology and its development. These studies complemented each other by using different methods that gave a more comprehensive picture of the questions that were studied. The first paper examined gear shifters in their natural in-car context in real-life driving scenarios. This in order to get an understanding about what type of gear shifter concepts would be evaluated further in the subsequent studies. The following three papers examined the gear shifter concepts in an experimental setting instead of a driving context. The context-dependent differences between gear shifters in existing cars were no longer present. The gear shifters were studied on a basic level: they were all made of the same material and did not have any “luxury” traits that could influence the participants and cause them to favor one of the concepts over another. There were some usability aspects that were consistent throughout studies 2 and 3. The monostability of the gear shifter concepts suffered from the lack of dedicated positions. It seemed that a gear shifter would benefit from having polystable patterns in order to reduce the use of vision when performing the secondary task of shifting gears. The polystable pattern would aid the driver by providing additional sensory information through haptics. In a calm situation, with little need for traffic interaction, the drivers could use vision for the task to a greater extent. In a rushed situation, for example, in a city environment with a lot of outside stimuli and the need to make quick decisions, the gear shifting task would benefit from the relief of visual attention. Gear shifter interfaces that are difficult to understand could naturally drain cognitive effort from other driving tasks. How different gear shifter concepts can impact working memory is of special interest in novice drivers and older drivers. Study 3 concluded that the time to accomplish a gear shifting task was longer for the older participants and that this group was more likely to make errors. However, the older participants seemed to learn how to use polystable gear shifters quite quickly, though this was not the case with the monostable gear shifters. As far as we can determine today, gear shifting will be at least some part of the task of driving in the future. When implementing gear shifters, it is important that they are easy to understand and difficult to handle in a way that gives rise to dangerous situations. And it is essential that assistive feedback, such as the visual information regarding the gear shifter modes, cannot malfunction. Based on the research we present here, a polystable functionality is still preferable, even in the coming shift-by-wire gear shifter solutions.

48
7 Future research In future studies, there are many interesting aspects to look into regarding the usability aspects of modern gear shifters. Especially with the more autonomous vehicles. Some suggestions for future research would be to replicate study 3 with an older age group and preferably with more participants. In addition to this study, a follow-up study could be conducted with a passenger car with a connection between the gear shifter and the transmission, i.e., if reverse is chosen, the car will begin to reverse. This could be done in an indoor simulator with a real car in order to maintain the necessary level of safety. This would imply the need for a different experimental set-up since the car would be placed in a road context; the gear shifter concepts would also need an electric connection to the car simulator. However, this is a necessary step to take in the experimental set-up of successive studies. Other interesting studies would be to measure how drivers adjust and learn to use different gear shifters after a period of use in their everyday lives by conducting usability measuring on different occasions of use. Observing the drivers and asking the drivers to keep a driver’s journal could be complementary measures. Further studies investigating how the use, attitudes, needs etc., of the gear shifter will change with a growth in autonomous cars would be highly relevant as well. The decision-making process would also be interesting to study in different organizational settings and teams, and an in-depth investigation of how user participation is used today in the development of, for example, in-car devices is also a topic of interest.

49
8 References
Albert, W., & Tullis, T. (2013). Measuring the user experience: collecting, analyzing, and presenting usability metrics. Newnes. Alm, H., & Nilsson, L. (1995). The effects of a mobile telephone task on driver behaviour in a car following situation. Accident Analysis & Prevention, 27(5), 707-715. Anderson, J. R. (1982). Acquisition of cognitive skill. Psychological Review, 89(4), 369-406. Anderson, J. R., & Bellezza, F. S. (1993). Rules of the mind. Psychology Press. Baddeley, A., & Hitch, G. (1974). Working memory. Psychology of learning and motivation, 8, 47-89. Academic press. Baddeley, A. (1992). Working memory. Science, 255(5044), 556-559. Baddeley, A. (2000). The episodic buffer: a new component of working memory? Trends in Cognitive Sciences, 4(11), 417-423. Baronti, F., Lazzeri, A., Roncella, R., Saletti, R., & Saponara, S. (2011). Design and characterization of a robotized gearbox system based on voice coil actuators for a Formula SAE Race Car. IEEE/ASME Transactions on Mechatronics, 18(1), 53-61. Bath, C. (2014). Searching for methodology. Gender in Science and Technology, pp. 57-78. Batteau, A. W. (2010). Technological peripheralization. Science, Technology, & Human Values, 35(4), 554-574. Baxendale, S. (2011). IQ and ability across the adult life span. Applied neuropsychology, 18(3), 164-167. Bevan, N. (1995). Measuring usability as quality of use. Software Quality Journal, 4(2), 115-130. Bevan, N. (1999). Design for usability. Proceedings of HCI International (pp. 762-766). L. Erlbaum Associates Inc. Bevan, N. (2001). International standards for HCI and usability. International Journal of Human-Computer Studies, 55(4), 533-552. Bodker, S. (1996). Creating conditions for participation: Conflicts and resources in systems development. Human–computer Interaction, 11(3), 215-236. Bopp, K. L., & Verhaeghen, P. (2005). Aging and verbal memory span: A meta-analysis. The Journals of Gerontology Series B: Psychological Sciences and Social Sciences, 60(5), 223-233. Broström, R. (2016). Design implications for visual-manual interfaces in cars (Doctoral dissertation, Luleå tekniska universitet). Carroll, J. M., & Olson, J. R. (1988). Mental models in human-computer interaction. Handbook of human-computer interaction (pp. 45-65). North-Holland. Cooper, G., & Bowers, J. (1995). Representing the user: Notes on the disciplinary rhetoric of human-computer interaction. Cambridge Series on Human Computer Interaction, (pp 48- 66). Corbetta, M., & Shulman, G. L. (2002). Control of goal-directed and stimulus-driven attention in the brain. Nature reviews neuroscience, 3(3), 201-215.

50
Cowan, N. (2008). What are the differences between long-term, short-term, and working memory?. Progress in brain research, 169, 323-338. Cox, D. J., Punja, M., Powers, K., Merkel, R. L., Burket, R., Moore, M., Thorndike, F., & Kovatchev, B. (2006). Manual transmission enhances attention and driving performance of ADHD adolescent males: pilot study. Journal of Attention Disorders, 10(2), 212-216. Dahiya, R. S., & Valle, M. (2013). Tactile sensing: definitions and classification. In Robotic Tactile Sensing. Springer, Dordrecht. Damodaran, L. (1996). User involvement in the systems design process-a practical guide for users. Behaviour & Information Technology, 15(6), 363-377. Davis, F. D. (1993). User acceptance of information technology: system characteristics, user perceptions and behavioral impacts. International Journal of Man-Machine Studies, 38(3), 475-487. Driver, J. (2001). A selective review of selective attention research from the past century. British Journal of Psychology, 92(1), 53-78. Eason, K. D. (1984). Towards the experimental study of usability. Behaviour & Information Technology, 3(2), 133-143. Engström, J., Johansson, E., & Östlund, J. (2005). Effects of visual and cognitive load in real and simulated motorway driving. Transportation research part F: traffic psychology and behaviour, 8(2), 97-120. Forstmann, U. B., Tittgemeyer, M., Wagenmakers, E-J., Derrfuss, J., Imperati, D. & Brown, S. (2011). The speed-accuracy tradeoff in the elderly brain: A structural model-based approach. Journal of neuroscience, 31, 17242-17249. Författningssamling, S. (2003). Lag (2003: 460) om etikprövning av forskning som avser människor (The Act Concerning the Ethical Review of Research Involving Humans). Stockholm: Utbildningsdepartementet Galitz, W. O. (2007). The essential guide to user interface design: an introduction to GUI design principles and techniques. John Wiley & Sons. Ghisletta, P., Joly-Burra, E., Aichele, S., Lindenberger, U., & Schmiedek, F. (2018). Age differences in day-to-day speed-accuracy tradeoffs: Results from the COGITO study. Multivariate Behavioral Research, 53(6), 842-852. Grane, C. (2012). Haptic perception, attention, and effects on performance in a driving context: use of a haptic rotary device in a menu selection task (Doctoral dissertation, Luleå tekniska universitet). Grint, K., & Woolgar, S. (2013). The machine at work: Technology, work and organization. John Wiley & Sons. Gulliksson, H., & Holmgren, U. (2018). Hållbar utveckling: teknik, samhälle och livskvalitet. Studentlitteratur. Hall, C. D., Echt, K. V., Wolf, S. L., & Rogers, W. A. (2011). Cognitive and motor mechanisms underlying older adults' ability to divide attention while walking. Physical Therapy, 91(7), 1039-1050.
51
Harley, E. M., Trachtman, D., Heckman, G. M., & Young, D. E. (2008). Driver Gear-Shifting Behaviors and Errors. Proceedings of the Human Factors and Ergonomics Society Annual Meeting. (pp. 1898-1902). SAGE publications. Harvey, C., Stanton, N. A., Pickering, C. A., McDonald, M., & Zheng, P. (2011). In-vehicle information systems to meet the needs of drivers. International Journal of Human– Computer Interaction, 27(6), 505-522. Hart, S. G., & Staveland, L. E. (1988). Development of NASA-TLX (Task Load Index): Results of empirical and theoretical research. Advances in psychology (pp. 139-183). Elsevier. Hayward, V., Astley, O. R., Cruz-Hernandez, M., Grant, D., & Robles-De-La-Torre, G. (2004). Haptic interfaces and devices. Sensor review. 24(1), 16-29. Heller, F., Pusic, E., Strauss, G., & Wilpert, B. (1998). Organizational participation: Myth and reality. Oxford University Press. Ho, C., Tan, H. Z., & Spence, C. (2005). Using spatial vibrotactile cues to direct visual attention in driving scenes. Transportation Research Part F: Traffic Psychology and Behaviour, 8(6), 397-412. Horn, J. L., & Cattell, R. B. (1967). Age differences in fluid and crystallized intelligence. Acta Psychologica, 26, 107-129. Howitt, D., & Cramer, D. (2007). Introduction to research methods in psychology. Pearson Education. Häuser, K., Demberg, V., & Kray, J. (2017). Age differences in language comprehension during driving: Recovery from prediction errors is more effortful for older adults. Proceeding of the 39th Annual Conference of the Cognitive Science Society (pp. 2156- 2161). Cognitive Science Society. ISO 9241-11:2018, Ergonomics of human-system interaction – part 11: Usability: definitions and concepts. International Organization for Standardization. Iivari, N. (2006). ‘Representing the User’in software development—a cultural analysis of usability work in the product development context. Interacting with Computers, 18(4), 635-664. Jaeggi, S. M., Buschkuehl, M., Jonides, J., & Perrig, W. J. (2008). Improving fluid intelligence with training on working memory. Proceedings of the National Academy of Sciences, 105(19), 6829-6833. Johnson-Laird, P. N. (1983). Mental models: Towards a cognitive science of language, inference, and consciousness. Harvard University Press. Jordan, P. W. (1998). An introduction to usability. CRC Press. Klatzky, R. L., Lederman, S. J., & Matula, D. E. (1993). Haptic exploration in the presence of vision. Journal of Experimental Psychology: Human Perception and Performance, 19(4), 726- 743. Kaufman, A. S., Reynolds, C. R., & McLean, J. E. (1989). Age and WAIS-R intelligence in a national sample of adults in the 20-to 74-year age range: A cross-sectional analysis with educational level controlled. Intelligence, 13(3), 235-253.

52
Lansdown, T. C., Brook-Carter, N., & Kersloot, T. (2002). Primary task disruption from multiple in-vehicle systems. ITS Journal-Intelligent Transportation Systems Journal, 7(2), 151-168. Lavie, N., Hirst, A., De Fockert, J. W., & Viding, E. (2004). Load theory of selective attention and cognitive control. Journal of experimental psychology: General, 133(3), 339-354. Lederman, S. J., & Klatzky, R. L. (2009). Haptic perception: A tutorial. Attention, Perception, & Psychophysics, 71(7), 1439-1459. Lin, M. Y., Gutierrez, P. R., Stone, K. L., Yaffe, K., Ensrud, K. E., Fink, H. A., Sarkisian, C.A., Coleman, A.L., & Mangione, C. M. (2004). Vision impairment and combined vision and hearing impairment predict cognitive and functional decline in older women. Journal of the American Geriatrics Society, 52(12), 1996-2002. Lindner, M., & Tille, T. (2009). Design of highly integrated mechatronic gear selector levers for automotive shift-by-wire systems. IEEE/ASME Transactions on Mechatronics, 15(6), 961-968. Lööw, J., & Nygren, M. (2019). Initiatives for increased safety in the Swedish mining industry: Studying 30 years of improved accident rates. Safety Science, 117, 437-446. Madan, A., & Dubey, S. K. (2012). Usability evaluation methods: a literature review. International Journal of Engineering Science and Technology, 4(2), 590-599. Mchenry, S. (2016). ODI Resume–Investigation EA 16-002; Office of Defects Investigation. National Highway Traffic Safety Administration: Washington, DC, USA, https://static.nhtsa.gov/odi/inv/2016/INOA-EA16002-6630.PDF McKnight, A.J., & Adams. B.B. (1970). Driver education task analysis. Volume I: Task descriptions. Alexandria, VA: Human Resources Research Organization, Final Report, Contract No FH 11 – 7336. McIlroy, R. C., Stanton, N. A., & Harvey, C. (2013). Getting drivers to do the right thing: a review of the potential for safely reducing energy consumption through design. IET Intelligent Transport Systems, 8(4), 388–397. Metz, B., Schömig, N., & Krüger, H. (2011). Attention during visual secondary tasks in driving: Adaptation to the demands of the driving task. Transportation Research Part F: Traffic Psychology and Behaviour, 14(5), 369-380. Meyer, J. (2004). Personal vehicle transportation. Technology for adaptive aging (pp. 253-281). National Academies Press. Michon, J. A. (1985). A critical view of driver behavior models: what do we know, what should we do? Human behavior and traffic safety (pp. 485-524). Springer. Miyake, A., Friedman, N. P., Emerson, M. J., Witzki, A. H., Howerter, A., & Wager, T. D. (2000). The unity and diversity of executive functions and their contributions to complex “frontal lobe” tasks: A latent variable analysis. Cognitive psychology, 41(1), 49- 100.

53
Moray, N. (1981). The role of attention in the detection of errors and the diagnosis of failures in man-machine systems. Human detection and diagnosis of system failures (pp. 185-198). Springer. Mourant, R. R., Herman, M., & Moussa-Hamouda, E. (1980). Direct looks and control location in automobiles. Human Factors, 22(4), 417–425. Mårdsjö, K., & Carlshamre, P. (2000). Retoriken kring tekniken. Studentlitteratur. Nielsen, J. (1994). Usability engineering. Morgan Kaufmann. Nilsson, L. G. (2003). Memory function in normal aging. Acta Neurologica Scandinavica, 107, 7- 13. NHTSA, (2012), Visual-manual NHTSA driver distraction guidelines for in-vehicle electronic devices. National Highway Traffic Safety Administration, Report No. NHTSA- 2010-0053. NHTSA. (2016). Safety recall, NHTSA ID 10863787. Office of Defects Investigation. National Highway Traffic Safety Administration, Washington DC. https://www.nhtsa.gov/recalls#vehicle NHTSA. (2018a). Safety recall, NHTSA ID 11128091. Office of Defects Investigation. National Highway Traffic Safety Administration, Washington DC. https://www.nhtsa.gov/recalls#vehicle NHTSA. (2018b). Safety recall, NHTSA ID 11129089. Office of Defects Investigation. National Highway Traffic Safety Administration, Washington DC. https://www.nhtsa.gov/recalls#vehicle NHTSA. (2019a). Safety recall, NHTSA ID 11205975. Office of Defects Investigation. National Highway Traffic Safety Administration, Washington DC. https://www.nhtsa.gov/recalls#vehicle NHTSA. (2019b). Safety recall, NHTSA ID 11233608. Office of Defects Investigation. National Highway Traffic Safety Administration, Washington DC. https://www.nhtsa.gov/recalls#vehicle NHTSA. (2019c). Safety recall, NHTSA ID 11163797. Office of Defects Investigation. National Highway Traffic Safety Administration, Washington DC. https://www.nhtsa.gov/recalls#vehicle NHTSA (30 October 2010). https://www.nhtsa.gov/technology-innovation/automated- vehicles Norman, D. A. (1988). The psychology of everyday things. Basic books. Norman, D. A. (1992). Design principles for cognitive artifacts. Research in Engineering Design, 4(1), 43-50. Norman, D. A. (1999). Affordance, conventions, and design. Interactions, 6(3), 38-43. Norman, D. (2002). Emotion & design: attractive things work better. Interactions, 9(4), 36-42. Norman, D. (2013). The design of everyday things: Revised and expanded edition. Basic books. Norman, D. A., & Verganti, R. (2014). Incremental and radical innovation: Design research vs. technology and meaning change. Design Issues, 30(1), 78-96.
54
Normark, C. J. (2014). The user as interface designer: Personalizable vehicle user interfaces (Doctoral dissertation, Luleå tekniska universitet). Nyberg, L., Boraxbekk, C. J., Sörman, D. E., Hansson, P., Herlitz, A., Kauppi, K., Ljungberg, J. K., Lövheim, H., Lundquist, A., Adolfsson, A. N., Oudin, A., Pudas, S., Rönnlund, M., Stiernstedt, M., Sundström, A., & Adolfsson, R. (2020). Biological and environmental predictors of heterogeneity in neurocognitive ageing: Evidence from Betula and other longitudinal studies. Ageing Research Reviews, (64), 101184. Näätänen, R., & Summala, H. (1976). Road-user behaviour and traffic accidents. Publication of: North-Holland Publishing Company. O’Shea, D. M., Fieo, R., Woods, A., Williamson, J., Porges, E., & Cohen, R. (2018). Discrepancies between crystallized and fluid ability are associated with frequency of social and physical engagement in community dwelling older adults. Journal of Clinical and Experimental Neuropsychology, 40(10), 963-970. Osvalder, A-L., & Ulfvengren, P. (2010). In M. Bohgard, S. Karlsson, E. Lovén, L. Å. Mikaelsson, L. Mårtensson, L. Osvalder, A-L. Rose, L., & P. Ulfvengren, (Red.), Arbete och teknik på människans villkor (pp. 353-436). Prevent. Oudshoorn, N., Rommes, E., & Stienstra, M. (2004). Configuring the user as everybody: Gender and design cultures in information and communication technologies. Science, Technology, & Human Values, 29(1), 30-63. Park, D. C., Lautenschlager, G., Hedden, T., Davidson, N. S., Smith, A. D., & Smith, P. K. (2002). Models of visuospatial and verbal memory across the adult life span. Psychology and aging, 17(2), 299-320. Payer, D. (2006). Working memory across the adult lifespan. Lifespan cognition: Mechanisms of change (pp. 128-142). Oxford University Press. Piersma, D., & de Waard, D. (2014). Shifting from manual to automatic gear when growing old: good advice? Results from a driving simulator study. Proceedings of the Human Factors and Ergonomics Society Europe, 43-51. Pinch, T. J., & Bijker, W. E. (1984). The social construction of facts and artefacts: Or how the sociology of science and the sociology of technology might benefit each other. Social Studies of Science, 14(3), 399-441. Ponds, R. W., Brouwer, W. H., & Van Wolffelaar, P. C. (1988). Age differences in divided attention in a simulated driving task. Journal of Gerontology, 43(6), 151-156. Posner, M. I., & Petersen, S. E. (1990). The attention system of the human brain. Annual review of neuroscience, 13(1), 25–42. Prahalad, C. K., & Ramaswamy, V. (2004). Co-creation experiences: The next practice in value creation. Journal of Interactive Marketing, 18(3), 5-14. Proctor, R. W., & Vu, K. L. (2010). Cumulative knowledge and progress in human factors. Annual Review of Psychology, 61, 623-651. Proske, U., & Gandevia, S. C. (2011). Kinesthetic senses. Comprehensive Physiology, 8(3), 1157- 1183.

55
Rasmussen, J. (1990a). Human error and the problem of causality in analysis of accidents. Philosophical Transactions of the Royal Society of London. Biological Sciences, 327(1241), 449-462. Rasmussen, J. (1980). The human as a systems component. Human interaction with computers (pp. 67-96). Academic Press. Rasmussen, J. (1983). Skills, rules, and knowledge; signals, signs, and symbols, and other distinctions in human performance models. IEEE Transactions on Systems, Man, and Cybernetics, (3), 257-266. Reason, J. (1990). Human error. Cambridge university press. Robey, D., & Farrow, D. (1982). User involvement in information system development: A conflict model and empirical test. Management Science, 28(1), 73-85. Rockwell, T. (1972). Skills, Judgment and Information, Acquisition in Driving. Human Factors in Highway Traffic Safety Research. (pp. 133-164). Wiley Interscience. Rosa, E., Marsja, E., & Ljungberg, J. K. (2020). Exploring residual capacity: The effectiveness of a vibrotactile warning during increasing levels of mental workload in simulated flight tasks. Aviation Psychology and Applied Human Factors, 10(1), 13. Rumar, K. (1990). Driver requirements and road traffic informatics. Transportation, 17(3), 215- 229. Rönnlund, M., Nyberg, L., Bäckman, L., & Nilsson, L.-G. (2005). Stability, Growth, and Decline in Adult Life Span Development of Declarative Memory: Cross-Sectional and Longitudinal Data From a Population-Based Study. Psychology and Aging, 20, 3–18. Salthouse, T. A. (1979). Adult age and the speed-accuracy trade-off. Ergonomics, 22(7), 811- 821. Salthouse, T. A. (2000). Aging and measures of processing speed. Biological Psychology, 54(1- 3), 35-54. Salthouse, T. A. (2006). Mental exercise and mental aging: Evaluating the validity of the “use it or lose it” hypothesis. Perspectives on Psychological Science, 1(1), 68-87. Salthouse, T. A. (2012). Adult cognition: An experimental psychology of human aging. Springer Science & Business Media. Sanders, M. S., & McCormick, E. J. (1993). Human factors in engineering and design (Seventh edition). Mcgraw-Hill Book Company. Sanders, E. B., & Stappers, P. J. (2008). Co-creation and the new landscapes of design. Co- Design, 4(1), 5-18. Sander, M. C., Lindenberger, U., & Werkle-Bergner, M. (2012). Lifespan age differences in working memory: A two-component framework. Neuroscience & Biobehavioral Reviews, 36(9), 2007-2033. Shinar, D., Meir, M., & Ben-Shoham, I. (1998). How automatic is manual gear shifting? Human Factors, 40(4), 647-654. Stanton, N. (1996). Engineering psychology: another science of common sense? The Psychologist, 9(7), 300-303.

56
Stanton, N., Salmon, P. M., & Rafferty, L. A. (2013). Human factors methods: a practical guide for engineering and design. Ashgate Publishing, Ltd. Strand, N., Nilsson, J., Karlsson, I. M., & Nilsson, L. (2014). Semi-automated versus highly automated driving in critical situations caused by automation failures. Transportation Research Part F: Traffic Psychology and Behaviour, 27, 218-228. Strayer, D. L., & Johnston, W. A. (2001). Driven to distraction: Dual-task studies of simulated driving and conversing on a cellular telephone. Psychological science, 12(6), 462-466. Shackel, B. (1986). Ergonomics in design for usability. Proceedings of the Second Conference of the British Computer Society, Human Computer Interaction Specialist Group on People and Computers: Designing for Usability, (pp. 44-64). Cambridge University Press. Shackel, B., & Richardson, S. J. (1991). Human factors for informatics usability. Cambridge university press. Symon, G., & Clegg, C. (2005). Constructing identity and participation during technological change. Human Relations, 58(9), 1141-1166. Treisman, A. M., & Gelade, G. (1980). A feature-integration theory of attention. Cognitive psychology, 12(1), 97-136. Treisman, A. (1986). Features and objects in visual processing. Scientific American, 255(5), 114- 125. Vetenskapsrådet, R. (2017). God forskningssed. (Good research practice). Sweden: Vetenskapsrådet. Verhaeghen, P., Steitz, D. W., Sliwinski, M. J., & Cerella, J. (2003). Aging and Dual-Task Performance: A Meta-Analysis. Psychology and Aging, 18(3), 443-460. Vinnova. (27 October, 2020). https://www.vinnova.se/m/fordonsstrategisk-forskning-och- innovation/om-ffi2/ Wang, Z., Suga, S., Nacpil, E. J. C., Yan, Z., & Nakano, K. (2020). Adaptive driver-automation shared steering control via forearm surface electromyography measurement. arXiv preprint arXiv:2009.04100. Wickens, C. D. (2002). Multiple resources and performance prediction. Theoretical issues in ergonomics science, 3(2), 159–177. Wickelgren, W. A. (1977). Speed-accuracy tradeoff and information processing dynamics. Acta Psychologica, 41, 67-85. Wickens, C. D., Hollands, J. G., Banbury, S., & Parasuraman, R. (2013). Engineering psychology and human performance (Fourth edition). Boston: Pearson. Widmalm, S. (2004). Artefakter: Industrin, vetenskapen och de tekniska nätverken. Gidlunds. Wierwille, W. W. (1993). Demands on driver resources associated with introducing advanced technology into the vehicle. Transportation Research Part C: Emerging Technologies, 1(2), 133-142. Young, M. S., Brookhuis, K. A., Wickens, C. D., & Hancock, P. A. (2015). State of science: mental workload in ergonomics. Ergonomics, 58(1), 1-17.

DOCTORA L T H E S I S
Sanna Lohilahti Bladfält D
riving technology and development
Department of Business Administration, Technology and Social SciencesDivision of Humans and Technology
ISSN 1402-1544ISBN 978-91-7790-699-5 (print)ISBN 978-91-7790-700-8 (pdf)
Luleå University of Technology 2020
Driving technology and development – Usability studies of gear
shifters with variations in pattern, stability and design
Sanna Lohilahti Bladfält
Engineering Psychology
131903-LTU-Lohilahti.indd 1-3131903-LTU-Lohilahti.indd 1-3 2020-11-13 13:472020-11-13 13:47