Inhibitory control and reward predict risky driving in young novice drivers – a simulator study
9
Available online at www.sciencedirect.com 1877–0428 © 2011 Published by Elsevier Ltd. Selection and/or peer-review under responsibility of the Organizing Committee doi:10.1016/j.sbspro.2011.08.067 Procedia Social and Behavioral Sciences 20 (2011) 604–612 14 th EWGT & 26 th MEC & 1 st RH Inhibitory control and reward predict risky driving in young novice drivers – a simulator study Ellen M.M. Jongen a,* , Kris Brijs a,b , Marcell Komlos a , Tom Brijs a , Geert Wets a a Transportation Research Institute (IMOB), Wetenschapspark 5 bus 6, Hasselt University, Diepenbeek 3590, Belgium b XIOS University College, Department of Constuction Engineering, H-building, Diepenbeek 3590, Belgium Abstract The purpose of our study is to unravel the cognitive mechanisms that underlie risky driving in young novice drivers. We hypothesized that lower capacity for cognitive control and rewards predict risky driving and constitute its cognitive basis. Inhibitory control was measured with the stop signal reaction time (SSRT) task. Measures of risky driving included: standard deviation of lateral position (SDLP), speeding, and red light running. We found that: (1) inhibitory control is still developing within the young driver population; (2) lowered inhibitory control had a driving specific effect: young drivers with lower SSRT had a higher SDLP; (3) a rewarding context predicts risky driving. © 2011 Published by Elsevier Ltd. Selection and/or peer-review under responsibility of the Organizing Committee. Keywords: Young drivers; Inhibitory control; Risky driving; Human factors; Reward; Simulators 1. Introduction 1.1. Young drivers – a highly risk prone population For young drivers, traffic crashes are the leading cause of death in the US and ranked 2 nd globally (responsible for over 350.000 fatalities and over 15 million injuries annually solely in the 15-29 age group) (National Highway Traffic Safety Administration [NHTSA], 2006; World Health Organization [WHO], 2002). Compared to other age groups, young drivers are involved in a disproportionately large number of crashes (Kweon & Kockelman, 2002; Evans, 2004, p. 155) and are also mostly responsible for them (Williams & Shabanovab, 2003). Lack of driving experience certainly has a role here (McKnight & McKnight, 2003). However, research in the field of developmental cognitive neuroscience has led us to focus on other potentially important explanatory factors (Yurgelun-Todd, 2007). * Corresponding author. E-mail address: [email protected] .
-
Upload
independent -
Category
Documents
-
view
6 -
download
0
Transcript of Inhibitory control and reward predict risky driving in young novice drivers – a simulator study

Available online at www.sciencedirect.com
1877–0428 © 2011 Published by Elsevier Ltd. Selection and/or peer-review under responsibility of the Organizing Committeedoi:10.1016/j.sbspro.2011.08.067
Procedia Social and Behavioral Sciences 20 (2011) 604–612
14th EWGT & 26th MEC & 1st RH
Inhibitory control and reward predict risky driving in young novice drivers – a simulator study
Ellen M.M. Jongena,*, Kris Brijsa,b, Marcell Komlosa, Tom Brijsa, Geert Wetsa a Transportation Research Institute (IMOB), Wetenschapspark 5 bus 6, Hasselt University, Diepenbeek 3590, Belgium
b XIOS University College, Department of Constuction Engineering, H-building, Diepenbeek 3590, Belgium
Abstract
The purpose of our study is to unravel the cognitive mechanisms that underlie risky driving in young novice drivers. We hypothesized that lower capacity for cognitive control and rewards predict risky driving and constitute its cognitive basis. Inhibitory control was measured with the stop signal reaction time (SSRT) task. Measures of risky driving included: standard deviation of lateral position (SDLP), speeding, and red light running. We found that: (1) inhibitory control is still developing within the young driver population; (2) lowered inhibitory control had a driving specific effect: young drivers with lower SSRT had a higher SDLP; (3) a rewarding context predicts risky driving. © 2011 Published by Elsevier Ltd. Selection and/or peer-review under responsibility of the Organizing Committee.
Keywords: Young drivers; Inhibitory control; Risky driving; Human factors; Reward; Simulators
1. Introduction
1.1. Young drivers – a highly risk prone population
For young drivers, traffic crashes are the leading cause of death in the US and ranked 2nd globally (responsible for over 350.000 fatalities and over 15 million injuries annually solely in the 15-29 age group) (National Highway Traffic Safety Administration [NHTSA], 2006; World Health Organization [WHO], 2002). Compared to other age groups, young drivers are involved in a disproportionately large number of crashes (Kweon & Kockelman, 2002; Evans, 2004, p. 155) and are also mostly responsible for them (Williams & Shabanovab, 2003). Lack of driving experience certainly has a role here (McKnight & McKnight, 2003). However, research in the field of developmental cognitive neuroscience has led us to focus on other potentially important explanatory factors (Yurgelun-Todd, 2007).
* Corresponding author. E-mail address: [email protected] .
Ellen M.M. Jongen et al. / Procedia Social and Behavioral Sciences 20 (2011) 604–612 605
1.2. The Dual Systems Model of Adolescent Risk-Taking
Adolescence is a period in which the developmental trajectory of cognitive control is diverged from development of the social-emotional system. More specifically, research in the field of developmental cognitive neuroscience has shown that in adolescence: (1) cognitive control is not yet fully developed ; (2) neurobiological changes (for instance changes in the dopaminergic system) lead to higher reward-seeking (Casey, Getz & Galvan., 2008; Steinberg, 2010; Crone, 2009). Cognitive control is important for the regulation of complex behavior including performance of appropriate and inhibition of inappropriate actions (e.g. reward-seeking impulses that conflict with long-term plans). Since cognitive control is not fully developed during adolescence, it may be hypothesized this maturational lack of cognitive control represents an explanation, additional to lack of driving experience, for increased risk behaviour in adolescents relative to adults. In addition, in rewarding contexts, adolescents could be especially prone to risk taking behavior given that their developing cognitive control cannot inhibit their increased reward-seeking impulses.
1.3. Implications of the Dual Systems Model for Driving Behavior
The first study showing evidence for increased risky driving in adolescents versus adults when the social-emotional system is triggered used a driving video game (Gardner & Steinberg, 2005). A stronger increase in risky driving was shown in adolescents than adults when participants played the game in the presence of peers. However, no tests of cognitive control were conducted to verify the suggested developmental differences in cognitive control between adolescents and adults.
A recent study has correlated specific measures of cognitive control (i.e., mental shifting, working memory updating and response inhibition) and driving performance (Mäntylä, Karlsson & Marklund, 2009). As a measure of driving performance, lateral deviation from optimal driving lines was measured in a lane change task. In this study a pc-based low-fidelity setting was used that only required steering (i.e. no other driving operations were included in the simulation) and age effects were not studied.
Other recent studies attempted to go beyond correlation and demonstrate a causal connection between cognitive control and driving performance (i.e., lateral lane position) using the disinhibiting effects of alcohol (Fillmore, Blackburn, & Harrison, 2008) and prefrontal trans-cranial brain stimulation (Beeli, Koenke, Gasser & Jancke, 2008). Age effects were not studied here either.
In summary, to the best of our knowledge, the driving specific implications of the described adolescent developmental factors have not been tested together yet in a factorial design, on a high-fidelity simulator, using different age-groups.
1.4. Hypotheses
Based on the two pillars of the Dual Systems Model of adolescent risk taking, we hypothesize that (1) lower capacity for cognitive control, (2) a rewarding context, and (3) the interaction of these predict risky driving and constitutes part of the cognitive basis for the large number of crashes in the young driver population.
2. Methods
2.1. Participants
Fifty-three young drivers were recruited using three inclusion criteria: (1) age between 17-18 years or 22-24 years, (2) a (full or provisional) driving license, (3) no more than two years driving experience at the time of testing. Participants were not paid but entered a draw for monetary rewards (20, 40, or 60 Euros; see also ‘reward manipulation’ section). All participants gave informed consent; had normal/corrected-to-normal vision and none suffered from simulator sickness. Participants were divided into two groups based on their age (17-18 year-olds: n = 31, mean age 17.9 years, 21 men; 22-24 year-olds: n = 22, mean age 22.6 years, 15 men). These groups were matched in terms of gender ratios and driving experience (i.e., a third of each group were provisionally licensed
606 Ellen M.M. Jongen et al. / Procedia Social and Behavioral Sciences 20 (2011) 604–612
novice drivers, and there was no statistically significant difference in the amount of self-reported driving done by the 17-18 year-olds (5411 km/year) and the 22-24 year-olds (5316 km/year); F(1,51) < 1, p = . 96).
2.2. Driving simulator
The experiment was conducted on a fix-based STISIM M400 driving simulator (System Technology Inc. Hawthorne, CA) with a force-feedback steering wheel, an instrumented dashboard, brake and accelerator pedals. The visual environment was presented on three computer screens (each with 1280 x 800 pixels resolution and 60Hz refresh rate) with rear view and side-view mirror images. Data were collected at frame rate.
2.3. Stop signal paradigm
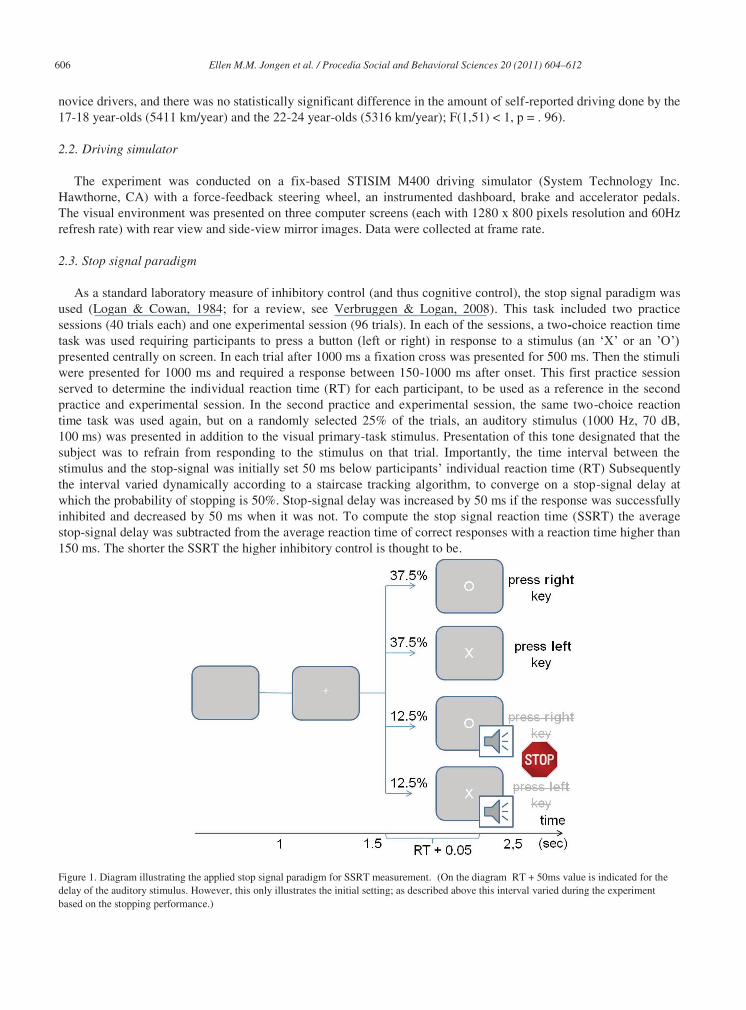
As a standard laboratory measure of inhibitory control (and thus cognitive control), the stop signal paradigm was used (Logan & Cowan, 1984; for a review, see Verbruggen & Logan, 2008). This task included two practice sessions (40 trials each) and one experimental session (96 trials). In each of the sessions, a two-choice reaction time task was used requiring participants to press a button (left or right) in response to a stimulus (an ‘X’ or an ’O’) presented centrally on screen. In each trial after 1000 ms a fixation cross was presented for 500 ms. Then the stimuli were presented for 1000 ms and required a response between 150-1000 ms after onset. This first practice session served to determine the individual reaction time (RT) for each participant, to be used as a reference in the second practice and experimental session. In the second practice and experimental session, the same two-choice reaction time task was used again, but on a randomly selected 25% of the trials, an auditory stimulus (1000 Hz, 70 dB, 100 ms) was presented in addition to the visual primary-task stimulus. Presentation of this tone designated that the subject was to refrain from responding to the stimulus on that trial. Importantly, the time interval between the stimulus and the stop-signal was initially set 50 ms below participants’ individual reaction time (RT) Subsequently the interval varied dynamically according to a staircase tracking algorithm, to converge on a stop-signal delay at which the probability of stopping is 50%. Stop-signal delay was increased by 50 ms if the response was successfully inhibited and decreased by 50 ms when it was not. To compute the stop signal reaction time (SSRT) the average stop-signal delay was subtracted from the average reaction time of correct responses with a reaction time higher than 150 ms. The shorter the SSRT the higher inhibitory control is thought to be.
Figure 1. Diagram illustrating the applied stop signal paradigm for SSRT measurement. (On the diagram RT + 50ms value is indicated for the delay of the auditory stimulus. However, this only illustrates the initial setting; as described above this interval varied during the experiment based on the stopping performance.)

Ellen M.M. Jongen et al. / Procedia Social and Behavioral Sciences 20 (2011) 604–612 607
2.4. Scenarios
The Simulated Driving Task consisted of two practice sessions that served as a warm-up and two experimental sessions. The scenario presented in the experimental sessions was a 28 kilometer daylight driving scenario on a two-lane road with bidirectional traffic, including both inner- and outer-city sections with a speed limit of 50 and 90 km/hour respectively. Twelve critical events were presented (e.g., a pedestrian crossing the road, a car suddenly appearing from behind a building and pulling back at the street). Critical events were calibrated such that crashes could be avoided by braking (when driving at speed limit) or steering around the obstacle. Apart from the critical events, other vehicles were presented on the roadway at random intervals but required no passing or braking on the part of the driver. In the scenario, participants had to drive through 18 intersections equipped with traffic lights (red n=10; green n=4; yellow n=4 in randomized order).
2.5. Reward manipulation
For the first trip, participants were instructed to drive as they would normally do. For the second trip, response conflict was introduced by providing monetary reinforcement for quickly completing the drive, but also for driving safely and not making any violations (i.e., stopping at a red light, not crossing a full line) or collisions (Fillmore et al., 2008). It was explained that participants could increase their chances of earning money by completing the trip in the shortest finish time, but for each violation (except speeding) or collision, one minute of penalty time would be imposed. To provide a point of reference, participants were informed that this trip was of similar length as the first trip and they were told their finish time of the first trip. Travel time was projected on screen during the second trip. In line with Fillmore et al (2008), we chose not to balance the order and always presented the trip without reward first. This decision was based on Fillmore’s pilot studies that showed pronounced performance decrements when participants moved from a rewarded condition to a non-rewarded condition. Such negative contrast effects from removed rewards have been also well-documented in the learning literature in both animals and humans Fillmore (personal communication, December 16, 2011).
2.6. Data collection and analysis
2.6.1. Stop signal reaction time (SSRT) First the average reaction time was computed based on the reaction times on correct responses that were higher
than 150 ms. Then SSRT was calculated by subtracting the average stop signal delay from the average reaction time (Verbruggen & Logan, 2008). The shorter the SSRT, the higher inhibitory control is thought to be. To determine if the two groups were different in terms of inhibitory control, SSRT was analyzed in an ANOVA with age as between-subjects factor.
2.6.2. Risky driving behaviour. Measures of risky driving included responses to critical events (number of collisions), speeding (percentage of
total distance above the speed limit), red light running (number of times) and standard deviation of lateral lane position (SDLP). SDLP has been shown a sensitive measure of driver impairment for example due to increased mental workload and various drugs (De Waard, 1996; Ramaekers, 2003). SDLP was also found to be a reliable characteristic of an individual’s normal driving behavior; test-retest reliability measured from young and middle-aged individuals are generally higher than r = 0.75 (O’Hanlon, Brookhuis, Louwerens, 1986). In the computation of SDLP, segments associated with lane changes were excluded. . A multivariate analysis of variance (MANOVA) was conducted first to provide an overall measure of driver performance as a function of experimental conditions. Univariate statistical analyses were then carried out by entering the different measures of risky driving behavior as dependent measures into four separate repeated measures ANOVAs with within-subjects factor reward (2: no, yes), between-subjects factor age (2: 17-18 year-olds, 22-24 year-olds), and inhibitory control (SSRT) as a continuous predictor variable.

608 Ellen M.M. Jongen et al. / Procedia Social and Behavioral Sciences 20 (2011) 604–612
3. Results
3.1. Inhibitory control
SSRT was significantly lower in the 22-24 year-olds (m = 209 ms; sd = 37 ms) than in the 17-18 year-olds (m = 230 ms; sd = 25) (F(1, 51 ) = 4.860, p = .032) indicating that basic cognitive control (i.e. inhibitory control) still improves within the young driver population.
3.2. Risk Behavior
Results are summarized in Table 1 and 2. Descriptive statistics on different risk behaviours are presented in Table 1 and results of the ANOVAs testing for the effects of inhibitory control, reward and age are in Table 2.
3.2.1. Response to critical events Although the number of critical events resulting in collisions was higher in 17-18 year-olds than 22-24 year-olds
without and with rewards, there were no significant main or interaction effects for the critical events.
3.2.2. Standard Deviation of Lateral Lane Position (SDLP) There was no difference between the 17-18 year-olds and 22-24 year-olds in SDLP without or with reward.
Importantly, there was a main effect of inhibitory control. A correlation analysis between the measure of inhibition (SSRT) and SDLP indicated that with increased inhibitory control there was a decrease in SDLP (r = .443, p = .001). Unexpectedly, SDLP was smaller in the ride with than without the reward.
Figure 2. Scatter plot illustrating the positive correlation between standard deviation of lateral position (SDLP) and inhibitory control (SSRT).
3.2.3. Speeding The percentage of total distance drivers were speeding was higher in 17-18 year-olds than 22-24 year-olds
without and with rewards, but the main effect of age was only marginally significant. In addition, following our expectations, speeding increased when participants were offered a reward relative to no reward (57.5 versus 39.6).

Ellen M.M. Jongen et al. / Procedia Social and Behavioral Sciences 20 (2011) 604–612 609
3.2.4. Red light running Although red light running was more common in 17-18 year-olds than 22-24 year-olds in the ride without reward
it was similar in the ride with reward. There was however no main effect of age or an interaction of age and reward. Following our expectations, red light running increased when participants were offered a reward relative to no reward (.68 versus .15). In the analyses of red light running, data of six participants (two 17-18 year-olds, four 22-24 year-olds) fell outside the tripled inter-quartile range and these were excluded from the analyses as outliers.
Table 1. Means (m) and standard errors (SE) of risky driving behavior by age group and reward condition
No reward Reward
17-18 yr 22-24 yr 17-18 yr 22-24 yr
SDLP (meters)
m=.294 m=.292 m=.279 m=.256
SE=.013 SE=.016 SE=.011 SE=.014
Speeding (% of distance)
m=44,5 m=34,7 m=61.9 m=53.2
SE=4.43 SE=5.3 SE=3.43 SE=4.1
Red light running (# of times)
m=.31 m=0 m=.67 m=.70
SE=.09 SE=.12 SE=.18 SE=.23
Critical events (# of accidents)
m=5.8 m=4.7 m=5.6 m=4.7
SE=.46 SE=.55 SE=.55 SE=.66
Table 2. Univariate main effects (left) and interactions (right). Significant effects in bold.
Effects
inhibitory control reward age inhibitory control
x reward
age x
reward
SDLP (meters)
F=9.9 F=10.1 F<1 F<1 F=1.64
p=.003 p=.003 p=.49 p=.48 p=0.21
Speeding (% of distance)
F<1 F=33.3 F=2.9 F<1 F<1
p=.81 p<.001 p=.095 p=.48 p=.87
Red light running (# of times)
F<1 F=11.4 F<1 F<1 F=1.1
p=.61 p=.002 p=.39 p=.73 p=.30
Critical events (# of accidents)
F=1.26 F<1 F=2.15 F=1.12 F<1
p=.27 p=.77 p=.15 p=.29 p=.80
4. Conclusion
The results show that inhibitory control still improves beyond the age of 18. Others have shown a decrease in impulsivity, which may be regarded the opposite of inhibitory control, with age in a sample of individuals ranging in age from 7 to 29 (Galvan et al., 2007) and between groups from ages 14–16 to 20–22 (Leshem and Glicksohn, 2007). Although this suggests that inhibitory control continues to develop over the course of adolescence and early adulthood, here the comparison of groups between ages 17-18 and 22-24 years showed directly and with objective measures that inhibitory control still improves after 18 years. Although improvements have been demonstrated on various measures of inhibitory control (e.g. stroop-, antisaccade-task) in the field of developmental cognitive neuroscience, to the best of our knowledge these improvements were not demonstrated to extend beyond 18 years

610 Ellen M.M. Jongen et al. / Procedia Social and Behavioral Sciences 20 (2011) 604–612
(Bunge & Crone, 2009). This is most likely due to differences in participant grouping. While we compare 17-18 year olds with 22-24 year olds, others tend to either focus on earlier adolescence (Adelman et al., 2002) or lump participants in wider age groups (Williams, Ponesse, Schachar, Logan, & Tannock, 1999). In the latter study, Williams et al. sampled inhibitory control in all ages between 6-81years using the same stop signal task as we did. However, the participants were grouped using wider age ranges e.g. 13-17 vs. 18-29 years. Although the latter grouping is reasonable for an extensive study on the development of inhibitory control throughout the whole life span, it might miss the fine grained differences that our observations highlight within the young driver population, which are especially relevant from a traffic safety prospective.
In line with our hypothesis that lower capacity for cognitive control predicts risky driving, lowered inhibitory control had a driving specific effect: young drivers with lower inhibitory control (SSRT) drove with higher SDLP. Mäntylä et al. (2009) also studied the relationship between driving performance (i.e. lane change accuracy) and cognitive control but only found a significant overall correlation between driving performance and ‘working memory updating’ – another component of cognitive control. The difference between our results might be due to differences in the participants’ age as well to differences in our driving tasks. They focused on teenagers (15-19) with minimal driving experience (4% held a driving licence) while all of our subjects were either fully (63%) or provisionally (37%) licensed. They used a rudimentary lane changing task in a low-fidelity setting that required no other driving operations than from maneuvering the steering wheel whereas here a more complete driving scenario was implemented on a high-fidelity simulator. Nevertheless, when divided based on computer gaming history, Mäntylä’s “low-game” participants (gaming <1 hour/week) also showed highly correlated inhibitory control and driving task performance.
The results also showed support for our hypothesis that a rewarding context predicts risky driving since speeding and red light running occurred more often in the trip with than without reward. Congruently, Steinberg and his colleagues found that peer-presence (i.e., a potential source of reward) leads to increased risk taking in a driving context (Gardner & Steinberg, 2005; Chein, Albert, O’Brien, Uckert, & Steinberg, 2010 ). However they only studied red-light-running behavior and did so in a highly simplified video game where participants could only control a single response key to activate the brakes of a car that they saw from a third-person view. Our findings thus add to the existing literature by showing the effect of a monetary reward (versus peer presence), including different types of risk behavior, and using a more realistic setting in a high fidelity simulator. The unexpected effect of reward on SDLP might be the result of a learning effect due to not balancing the order of trips across subjects. This part of the procedure was derived from Fillmore et al. (2008) that always presented the trip with reward as second trip. Although not significant, their results show a similar decrease of SDLP in the second trip.
With regard to the hypothesized interaction between reward and inhibitory control, the effects of reward on risky driving behavior were not further modified by our measure of inhibitory control. Fillmore et al. (2008) showed that an increase in SDLP between sessions with versus without alcohol was even more pronounced when a reward was offered and concluded that this was due to the disinhibitory effect of alcohol. Possibly variance in inhibitory control in our study was not large enough for such an interaction to occur. Unfortunately Fillmore et al. (2008) used another measure of inhibition (failures of response inhibition on a go/no-go task) which complicates a direct comparison of our inhibition effects. As inhibitory control increases linearly with aging (Casey et al., 2008), a comparison of age ranges that are further apart probably would increase between-group differences in inhibition. However, selection of age ranges in the present study was limited by licensing age, which is 17 in Belgium. Still we might increase the difference by solely selecting 17 year-olds in the youngest group. An alternative strategy might be to include different measures of inhibition as measures might differ in terms of sensitivity. However, future research is necessary to resolve these issues.
Finally, the data described here were collected in a driving simulator and this may have influenced the experience of driving. First, simulated driving might overestimate reckless driver behavior; since accidents in the simulator can never have equally grave consequences as real crashes, participants might not attain equal degree of motivation in the simulated environments. Second, however, as noted by others, it might also be argued that simulators actually overestimate the level of driver performance, given that much of the daily distractions that divide the driver’s attention in real traffic (e.g. passengers, phone calls) were not present in our study (Fillmore et al., 2008). Finally, certain sensory and perceptual cues are lacking in a fixed based simulator (Kemeny & Panerai, 2003). However, in our experiment the generalizability (relative validity) of differences between compared conditions (i.e., reward, inhibitory control, age) is more important than absolute correspondence of the speeds and other driving parameters

Ellen M.M. Jongen et al. / Procedia Social and Behavioral Sciences 20 (2011) 604–612 611
obtained in simulation to those obtained on real roads (Charlton, 2007; Godley, Triggs, and Fildes, 2002).Therefore, it can be concluded that the results are relevant as the different patterns of results are expected to occur outside the simulator, in reality. In fact, recent reviews and studies evaluating the behavioral validity of simulators already provide some evidence for simulator validity in domains such as speed, lateral position, brake onset, divided attention, driving errors and risky traffic behavior assessment (Fisher, Rizzo, Caird & Lee, 2011; Shechtman, Classen, Awadzi, & Mann, 2009). Still, future research aimed at validation of our simulator data on a real road track will be necessary to bolster this conclusion (Young, Regan, & Lee, 2009).
4.1. Applications
Recent research has shown that cognitive control functions are flexible and can be trained, leading to improvements in performance (Cassavaugh & Kramer, 2009). To date, driver training or interventions could not be designed to target exact cognitive mechanisms. By pinpointing the cognitive and affective mechanisms of risky driving behavior (i.e. the role of inhibitory control and rewards), these can become specific targets of improvement in future driver training programs aimed at safe driving and the decrease of fatalities in young novice drivers.
Acknowledgements
We would like to thank Ron Hellenbrand and Dirk Roox for technical assistance and Kurt Marquet for his help in data collection.
References
Adleman, N. E., Menon, V., Blasey, C.M., White, C., Warsofolsky I., Glover, G., Reiss, A. (2002) A developmental fMRI study of the Stroop color-word task. Neuroimage, 16, 61–75.
Beeli, G., Koeneke, S., Gasser, K., & Jancke , L. (2008). Brain stimulation modulates driving behavior. Behavioral and Brain Functions, 4, 34. Bunge, S.A. & Crone, E.A. (2009) Neural correlates of the development of cognitive control. In: Neuroimaging in Developmental Clinical
Neuroscience. J. Rumsey, & M. Ernst, Eds. New York: Cambridge University Press. Cassavaugh, N. D., & Kramer, A. F. (2009). Transfer of computer-based training to simulated driving in older adults. Applied Ergonomics, 40,
943-952. Charlton, S.G. (2007). The role of attention in horizontal curves: A comparison of advance warning, delineation, and road marking treatments.
Accident Analysis and Prevention, 39, 873-885. Chein, J., Albert, D., O’Brien, L., Uckert, K., & Steinberg, L. (2010). Peers increase adolescent risk taking by enhancing activity in the brain’s
reward circuitry. Developmental Science, 14, F1-F10. Crone, E. A. (2009). Executive functions in adolescence: inferences from brain and behavior. Developmental Science, 12, 825-830. De Waard, D. (1996). The measurement of drivers' mental workload. (Unpublished Doctoral Dissertation). University of Groningen, Haren, The
Netherlands: University of Groningen, Traffic Research Centre. Fillmore, M. T., Blackburn, J. S., & Harrison, E. L. R. (2008). Acute disinhibiting effects of alcohol as a factor in risky driving behavior. Drug
and Alcohol Dependence, 95, 97-106. Fisher D.L., Rizzo M., Caird J.K., and Lee J.D. (Eds.) (2011). Handbook of Driving Simulation for Engineering, Medicine, and
Psychology. Boca Raton, FL: CRC Press/Taylor and Francis. Evans, L. (2004). Traffic safety. Michigan: Science Serving Society. Galván, A., Hare, T. A., Voss, H., Glover, G., and Casey, B. J. (2007). Risk-taking and the adolescent brain: who is at risk? Developmental
Science, 10, 1–7. Gardner, M., & Steinberg, L. (2005). Peer influence on risk taking, risk preference, and risky decision making in adolescence and adulthood: an
experimental study. Developmental Psychology, 41, 625-635. Godley, S.T., Triggs, T.J., and Fildes, B.N. (2002). Driving simulator validation for speed research. Accident Analysis and Prevention, 34, 589-
600. Kemeny, A. & Panerai, F. (2003). Evaluating perception in driving simulation experiments. Trends in Cognitive Sciences, 7, 31-37. Kweon, Y.J., & Kockelman, K. M. (2002). Overall injury risk to different drivers: combining exposure, frequency, and severity models. Accident
Analysis & Prevention, 35, 441-450. Leshem, R. & Glicksohn, J. (2007). The construct of impulsivity revisited. Personality and Individual Differences, 43, 681-691. Logan, G.D. and Cowan, W.B. (1984). On the ability to inhibit thought and action: a theory of an act of control. Psychological Review, 91, 295–
327. Mäntylä, T., Karlsson, M.J., & Marklund, M. (2009). Executive control functions in simulated driving. Applied Neuropsychology, 16, pp. 11-18.
612 Ellen M.M. Jongen et al. / Procedia Social and Behavioral Sciences 20 (2011) 604–612
McKnight, A. J., & McKnight, A. S. (2003). Young novice drivers: careless or clueless? Accident Analysis and Prevention, 35, 921-925. National Highway Traffic Safety Administration. (2006). Traffic safety facts - Motor Vehicle Traffic Crashes as a Leading Cause of Death in the
United States, 2003. Washington, DC: U.S. Department of Transportation, National Center for Statistics and Analysis. O’Hanlon JF, Brookhuis K, Louwerens J, et al. (1986). Performance testing as part of drug registration. In: Drugs and Driving. O’Hanlon, J. F.,
De Grier, J. J. (Eds.). London, England: Taylor& Francis, pp.311-327. World Health Organization. (2002). Injury: A leading cause of the global burden of disease. Geneva: WHO. Ramaekers, J. G. (2003). Antidepressants and driver impairment: empirical evidence from a standard on-the-road test. The Journal of Clinical
Psychiatry, 64, 20-29. Rhodes, N., Brown, B., & Edison, A. (2005). Approaches to understanding young driver risk taking. Journal of Safety Research, 36, 497-499. Shechtman, O., Classen, S., Awadzi, K., & Mann, W. (2009). Comparison of driving errors between on-the-road and simulated driving
assessment: a validation study. Traffic Injury Prevention, 10, 379-385. Steinberg, L. (2008). A social neuroscience perspective on adolescent risk-taking. Developmental Review, 28, 78–106. Steinberg, L., Albert, D., Cauffman, E., Banich, M., Graham,S., & Woolard, J. (2008). Age differences in sensation seeking and impulsivity as
indexed by behavior and selfreport: evidence for a dual systems model. Developmental Psychology, 44, 1764–1778. Steinberg, L. (2010). A dual systems model of adolescent risk-taking. Developmental Psychobiology, 52, 216-224. Verbruggen, F., & Logan, G. D. (2008). Response inhibition in the stop-signal paradigm. Trends in Cognitive Sciences, 12, 418-424. Williams, A. F., & Shabanovab, V. I. (2003). Responsibility of drivers, by age and gender, for motor-vehicle crash deaths. Journal of Safety
Research, 34, 527-531. Williams, B. R., Ponesse, J. S., Schachar, R. J., Logan, G. D., & Tannock, R. (1999). Development of inhibitory control across the life span.
Developmental Psychology, 35, 205-213. Yurgelun-Todd, D. (2007). Emotional and cognitive changes during adolescence. Current Opinion in Neurobiology, 17, 251-257.