Are sustainable companies less risky and more profitable?
15
Available in: http://www.redalyc.org/articulo.oa?id=223423659007 Red de Revistas Científicas de América Latina, el Caribe, España y Portugal Sistema de Información Científica Silva Nunes, Tânia Cristina; Casa Nova, Silvia; Cornacchione, Edgard; Garcia, Solange Are sustainable companies less risky and more profitable? Revista de Administração - RAUSP, vol. 47, núm. 3, julio-septiembre, 2012, pp. 422-435 Universidade de São Paulo São Paulo, Brasil How to cite Complete issue More information about this article Journal's homepage Revista de Administração - RAUSP, ISSN (Printed Version): 0080-2107 [email protected] Universidade de São Paulo Brasil www.redalyc.org Non-Profit Academic Project, developed under the Open Acces Initiative
Transcript of Are sustainable companies less risky and more profitable?
Available in: http://www.redalyc.org/articulo.oa?id=223423659007
Red de Revistas Científicas de América Latina, el Caribe, España y Portugal
Sistema de Información Científica
Silva Nunes, Tânia Cristina; Casa Nova, Silvia; Cornacchione, Edgard; Garcia, Solange
Are sustainable companies less risky and more profitable?
Revista de Administração - RAUSP, vol. 47, núm. 3, julio-septiembre, 2012, pp. 422-435
Universidade de São Paulo
São Paulo, Brasil
How to cite Complete issue More information about this article Journal's homepage
Revista de Administração - RAUSP,
ISSN (Printed Version): 0080-2107
Universidade de São Paulo
Brasil
www.redalyc.orgNon-Profit Academic Project, developed under the Open Acces Initiative

422 R.Adm., São Paulo, v.47, n.3, p.422-435, jul./ago/set. 2012
ISSN 0080-2107
Recebido em 28/fevereiro/2012Aprovado em 23/julho/2012
Sistema de Avaliação: Double Blind ReviewEditor Científico: Nicolau Reinhard
DOI: 10.5700/rausp1048
Tânia Cristina Silva Nunes, é Bacharel em Ciências Contábeis, Mestre em Controladoria e Contabilidade pela Faculdade de Economia, Administração e Contabilidade da Universidade de São Paulo, Especialista em Produtos Financeiros e Gestão de Risco pela Fundação Instituto de Administração, é Doutoranda em Controladoria e Contabilidade na Faculdade de Economia, Administração e Contabilidade da Universidade de São Paulo (CEP 05508-010 – São Paulo/SP, Brasil)E-mail: [email protected] Endereço:Universidade de São Paulo Faculdade de Economia, Administração e ContabilidadeAvenida Professor Luciano Gualberto, 908 – Prédio FEA-3Cidade Universitária – Butantã 05508-010 – São Paulo – SP
Silvia Casa Nova, Graduada em Administração Pública pela Escola de Administração de Empresas de São Paulo da Fundação Getulio Vargas, Mestre e Doutora em Controladoria e Contabilidade pela Universidade de São Paulo, Pós-Doutora pela Escola de Administração de Empresas de São Paulo da Fundação Getulio Vargas, é Professora Doutora e Coordenadora do Programa de Pós-Graduação em Controladoria e Contabilidade do Departamento de Contabilidade e Atuária da Faculdade de Economia, Administração e Contabilidade da Universidade de São Paulo (CEP 05508-010 – São Paulo/SP, Brasil). E-mail: [email protected]
Edgard Cornacchione, Bacharel, Mestre, Doutor e Livre- -Docente em Ciências Contábeis pela Faculdade de Economia, Administração e Contabilidade da Universidade de São Paulo e Ph.D. em Educação pela University of Illinois (Estados Unidos), é Professor Titular da Faculdade de Economia, Administração e Contabilidade da Universidade de São Paulo (CEP 05508-010 – São Paulo/SP, Brasil), e atual Chefe do Departamento de Contabilidade e Atuária e Diretor Científico da ANPCONT. E-mail: [email protected]
Solange Garcia, Graduada em Matemática pela Universidade Estadual Paulista Júlio de Mesquita Filho, Mestre em Matemática pela Universidade de Brasília, Doutora em Controladoria e Contabilidade pela Universidade de São Paulo, é Professora do Departamento de Contabilidade e Atuária da Faculdade de Economia, Administração e Contabilidade de Ribeirão Preto da Universidade de São Paulo (CEP 14040-900 – Ribeirão Preto/SP, Brasil) e Professora convidada no Programa Multiinstitucional e Inter-Regional de Pós-Graduação em Ciências Contábeis de Universidade de Brasília, Universidade Federal da Paraíba e Universidade Federal do Rio Grande do Norte.E-mail: [email protected]
RES
UM
O
Are sustainable companies less risky and more profitable?
Tânia Cristina Silva NunesSilvia Casa Nova
Edgard CornacchioneSolange Garcia
As empresas sustentáveis são realmente mais rentáveis e seu nível de risco é menor?
O objetivo neste trabalho foi verificar se havia diferenças signifi-cativas nos indicadores contábeis das empresas sustentáveis em relação a outras companhias não reconhecidas como sustentáveis. O Índice de Sustentabilidade Empresarial (ISE) da BM&FBovespa foi o critério selecionado para separação da amostra em empresas sustentáveis ou não. Os indicadores contábeis analisados foram divididos em duas categorias: risco (taxa de pagamento de divi-dendos, crescimento percentual do ativo, alavancagem financeira, liquidez corrente, tamanho do ativo, variabilidade do lucro, beta contábil) e retorno (ROA, ROE, giro do ativo, margem líquida), identificados na revisão da literatura. Foram analisadas, individual-mente, companhias do setor de energia elétrica e do setor bancário, além de ter sido realizada uma análise sem divisão setorial para a carteira 2008/2009 do ISE. Para verificação da diferença de médias entre os grupos foi utilizado o teste de Mann-Whitney (α ≤ 0,05). Os resultados, de maneira geral, e feitas as devidas considerações sobre o método utilizado e o período estudado, indicam que não há diferenças, medidas pelos indicadores contábeis selecionados, entre as empresas sustentáveis e as que não são assim consideradas.
Palavras-chave: sustentabilidade, risco, retorno, empresas sustentáveis.
1. INTRODUCTION
Enterprises have a political and social role and society cannot accept that their only goal is to maximize profits and comply with the law; they must be more responsible (BORGER, 2001). However, Bansal (2002) says that only a
R.Adm., São Paulo, v.47, n.3, p.422-435, jul./ago/set. 2012 423
ArE SuSTAiNAblE CompANiES lESS riSky ANd morE profiTAblE?
few enterprises can be considered a model of incorporation of sustainability in their strategy.
In theory, a sustainable company would be able to make money and to protect the social and environmental resources it uses as inputs. Such a company would probably be successful and would remain prosperous for generations (SAVITZ, 2007). It would be acceptable to assume this kind of company would be less risky, since it manages its social and environmental impacts; thus, the investors would rather invest in it, as they prefer the option that minimizes risk, according Markovitz (SANVICENTE and MELLAGI FILHO, 1996).
Some research studies compare the performance of sus-tainable companies with the market in general. Most of these studies measure market value (stock prices) in their analysis, but a few others (LÓPEZ, GARCIA, and RODRIGUES, 2007; MACEDO et al., 2008) use accounting measures – profit, revenues and other factors. Their results are different: some show that sustainable companies are more profitable (LÓPEZ, GARCIA, and RODRIGUES, 2007), while others show the opposite (LEE, FAFF, and LANGFIELD-SMITH, 2009). Fur-thermore, there are some, such as Macedo et al. (2008), that do not observe significant differences in performance between the sustainable companies and the market.
1.1. Objective, justification and hypothesis
Manteaw (2008) states that, as the discourse of sustainable development or sustainability solidifies, it is clear that people need to know and to understand its implications, to be able to undertake the necessary actions on environmental, economic and social justice issues. Therefore, sustainable development is an educational issue. It must be defended by all the institutions related to the production of knowledge, such as schools, busi-nesses and civil society (MANTEAW, 2008). This paper aims to contribute to this process of awareness, and it can be used by managers and directors to support the decision to integrate sustainability into business strategy.
Even if the decision to integrate sustainability into the busi-ness strategy of the company is not driven by financial reasons, it is important to be aware of its impact on accounting indicators, because these measures, which indicate how well a system ope-rates, are of interest to a wide range of users, from researchers to corporate managers (CONNOLLY and DEUTSCH, 1980).
Given this context, the purpose of this paper is to answer the following question:● Are there significant differences between the accounting
indicators of sustainable enterprises and those of other com-panies that are not recognized as sustainable?
The general hypothesis of the study is:● GH – There are significant differences between the ac
counting indicators of sustainable enterprises and those of enterprises that are not recognized as sustainable.
Regarding the risk analysis, the words accounting indicators are replaced by a specific ratio in each specific hypothesis, as follows:● Hypothesis of Risk 1 – There are significant differences
between the dividend payout of sustainable enterprises and that of enterprises that are not recognized as sustainable.
● Hypothesis of Risk 2 – There are significant differences between the growth of sustainable enterprises and that of enterprises that are not recognized as sustainable.
● Hypothesis of Risk 3 – There are significant differences between the leverage of sustainable enterprises and that of enterprises that are not recognized as sustainable.
● Hypothesis of Risk 4 – There are significant differences between the liquidity of sustainable enterprises and that of enterprises that are not recognized as sustainable.
● Hypothesis of Risk 5 – There are significant differences be-tween the variability of earnings of sustainable enterprises and that of enterprises that are not recognized as sustainable.
● Hypothesis of Risk 6 – There are significant differences between the accounting beta of sustainable enterprises and that of enterprises that are not recognized as sustainable.
The same is done to the profitability analysis, as follow:● Hypothesis of Profitability 1 – There are significant differ-
ences between the return on assets (ROA) of sustainable enterprises and that of enterprises that are not recognized as sustainable.
● Hypothesis of Profitability 2 – There are significant differ-ences between the return on equity (ROE) of sustainable enterprises and that of enterprises that are not recognized as sustainable.
● Hypothesis of Profitability 3 – There are significant differ-ences between the assets turnover of sustainable enterprises and that of enterprises that are not recognized as sustainable.
● Hypothesis of Profitability 4 – There are significant dif-ferences between the net profit margin of sustainable enterprises and that of enterprises that are not recognized as sustainable.
2. THEORETICAL BASIS
There are some theories that support the examination of this theme and they are briefly listed below.
● Theory of Legitimation (TL) – it derives from the idea of social contract between business and society (BRANCO and RODRIGUES, 2006; MAGNESS, 2006). Legitimacy is a sta-tus of harmony between corporate values and those of society. When there is no such harmony, companies are exposed to the risk of being forced out of business (LINDBLOM, 1994, as cited in LÓPEZ, GARCIA, and RODRIGUES, 2007). TL, which concerns the external legitimation of the organization, is the basis for certain studies about social responsibility,

424 R.Adm., São Paulo, v.47, n.3, p.422-435, jul./ago/set. 2012
Tânia Cristina Silva Nunes, Silvia Casa Nova, Edgard Cornacchione, and Solange Garcia
such as those of Branco and Rodrigues (2006), Magness (2006), Cho and Patten (2007). The survival and growth of a company depends on its ability to produce something of social interest and to distribute economic, social or politi-cal benefits to the groups from which its power originates (SHOCKER and SETHI, 1974, as cited in MAGNESS, 2006). It is assumed that civil society allows companies to exist and to have rights, because it expects, in turn, that enterprises meet its expectations about how their operations should be conducted. Thus, companies’ activities should be seen as compatible with the values and norms of society (BRANCO and RODRIGUES, 2006). The current changes in society’s values cause a change in the risk profiles of companies, in that they are under pressure to become more involved in solving social and environmental problems, and even to adopt more stringent laws regarding these topics (LÓPEZ, GARCIA, and RODRIGUES, 2007).
● Shareholder Theory (wealth maximization) – it states that a company’s decisions must consider exclusively the interests of its shareholders (BREALEY and MYERS, 2000). For Macedo et al. (2008), this theory assumes a negative rela-tion between social responsibility and financial performance, since commitments that do not intend to increase financial results put companies at a disadvantage relative to those companies that do not spend on social responsibility activi-ties.
● Stakeholder Theory – it considers that the success of any enterprise depends on the participation of its stakeholders; therefore it is necessary to ensure that the expectations and interests of all stakeholders are known and taken into ac-count by management. Broadly speaking, these expectations involve satisfaction of needs, financial compensation and ethical behavior. Rowley and Hovland (1999) characterize a stakeholder as any person or entity whose power, legitimacy and urgency can influence the organizational context in the pursuit of its goals. The examples of stakeholders encompass internal employees, customers, local governments, state and federal governments, civil society, shareholders, suppliers, the surrounding community, trade unions, business asso-ciations, competitors, etc. Some authors, such as Freeman (1994), support the Stakeholder Theory.
2.1. Previous researches
Margolis and Walsh (2003) reviewed 127 papers from 1972 to 2002 on the relation between companies’ social responsibi-lity and their financial performance. About half of those studies showed a positive association between these two variables, just a few found a negative association and the balance reported a mixed set of findings or non-significant association. One of the papers reviewed, by Orlitzky, Schmidit and Rynes (2003),
also analyzed 30 years of research, comprising 52 studies. The authors did a meta-analysis (the most sophisticated research integration technique available at present) and the findings indicate that the corporate social and the corporate financial performances are positively correlated (this relation is two- -directional and simultaneous).
Bertagnolli (2006) studied the influence of social and environmental investments on the net revenue and operating profit of companies. He used the social balance sheet model of IBASE (Instituto Brasileiro de Análises Sociais e Econômicas, i.e., the Brazilian Institute of Social and Economic Analysis) to collect the data of his sample. Through multiple regression tests, he investigated what kind of social and environmental investments has the greatest influence on net revenue and op-erating profit, such as: the package of employee benefits and investment in culture and education. However, the said study, like many others found, differs from the proposal of this paper because it did not analyze sustainability integrated with the company’s strategy, but the effect of isolated actions (social or environmental).
López, Garcia, and Rodrigues (2007) investigated whether business performance is affected by the adoption of corporate social responsibility practices, examining the relation between these indicators and certain accounting indicators related to revenue and profit. In their study, they claim that embracing socially responsible behavior can provide a company with com-petitive advantage, a priority in a complex global environment. Their study focused on the Dow Jones Sustainability Index (DJSI), which the authors call a multidimensional construct, because it is based on economic, environmental and social indicators. They analyzed 55 European companies in the DJSI and 55 that were unlisted because they did not meet the listing requirements. The analysis covered the 1998 to 2004 period. The authors sought to obtain empirical evidence showing that the adoption of sustainable practices has an impact on account-ing indicators. In order for policies on Corporate Responsibility (CR) to be lasting, they must be strategic and integrated into the key policies and business issues, besides being present in every major decision of the company. First, the authors examined the possible link between CR practices and business performance through regression analysis, using pre-tax earnings as the de-pendent variable and, as independent variables, income and a dummy to indicate whether the company was in the DJSI or not, in addition to magnitude of assets, risk (in the form of debt over total assets) and the sector of activity as control variables. Subsequently, other measures (such as cost of capital, return on equity, profit margin, and return on assets) were also used as the dependent variable, one at a time, while maintaining the independent variables. The authors also analyzed whether there were differences in the evolution of these performance indicators between companies that adopted sustainability cri-teria and others, by applying a nonparametric test to verify if these differences persisted over time. They observed that, in

R.Adm., São Paulo, v.47, n.3, p.422-435, jul./ago/set. 2012 425
ArE SuSTAiNAblE CompANiES lESS riSky ANd morE profiTAblE?
the short term, there is a negative impact on performance of the companies that adopt CR practices, but this is reversed in their favor in the long run. The authors concluded that this is a potential source of differentiation.
Macedo et al. (2008) analyzed the accounting and financial performance of socially responsible companies through their liquidity, leverage and profitability indicators. Their sample consisted of non-financial firms in the 2006 ISE (Índice de Sus-tentabilidade Empresarial or Corporate Sustainability Index), which were compared to 24 firms in the Melhores e Maiores (Biggest and Best) listing of the Brazilian Revista Exame, re-sorting to a statistical analysis of the difference between means, using the Chebyshev inequality test. There were no significant differences between the two groups.
Lee, Faff, and Langfiels-Smith (2009) examined whether higher corporate social performance leads to optimization of fi-nancial performance, comparing leading companies listed in the DJSI sustainability listing with others that were unlisted. In their method, using probit regression, they found contrasting results: using market data, they obtained a negative association between corporate social performance and financial performance; but using of accounting data (return on sales, ROA, and ROE, with company size as a control variable) they were unable to find an association between social and financial performance. The authors credited this difference to the quality, relevance and predictability of earnings (FRANCIS et al., 2004, as cited in LEE, FAFF, and LANGFIELD-SMITH, 2009) or to the absence of a linear relation between both measures – accounting versus market data (SUBRAMANYAM, 1996, as cited in LEE, FAFF, and LANGFIELD-SMITH, 2009).
2.2. Accounting indicators measuring risk and return
The expected return of an asset is the average of its ex-pected returns weighted by the probability of these returns materializing, which is associated with certain events and circumstances that affect the performance of the asset, such as economic recession or expansion (ASSAF NETO, 2003). Expected return denotes the average rate of return that covers possible economic scenarios; it should neither be confused with the return that investors would like or expect to obtain, nor with the most likely outcome (BODIE, KANE, and MARCUS, 2000). Another important factor in the evaluation of an invest-ment is risk, which can be defined as uncertainty regarding future payments (REILLY and NORTON, 2008). According to Elton, Gruber, and Brown (2004), investors like high returns, but dislike high risks.
In order to analyze the relation between accounting indicators and market betas of Brazilian companies traded on BM&FBovespa, Oda et al. (2005) used the accounting measures presented by Beaver, Kettler, and Scholes (1970) to estimate the cyclical risk of the company. Beaver, Kettler, and Scholes (1970), in their study on the association between
accounting and market risk measures, found a high degree of association for the following.● Dividend payout – low rates of payout may be associated
with riskier firms, showing the management’s perception of the uncertainty of the company’s profits.
● Growth – excessive levels of growth of total asset is caused by excessive advantageous opportunities of investment, con-secutive, higher than expected rates of return, and retention of profits greater than average.
● Leverage – as debts increase, the gain to shareholders be-comes more volatile, with a positive association between debt (total debt) and risk.
● Liquidity (current ratio) – non-current assets have more volatile returns than current assets.
● Asset size – Horrigan (1966, as cited in BEAVER, KETTLER, and SCHOLES, 1970) showed that the magnitude of total assets is the main predictive variable of the rating of debts, in turn related to the relative frequency of default (HICKMAN, 1958, as cited in BEAVER, KETTLER, and SCHOLES, 1970).
● Variability of earnings (standard deviation of earnings/price ratio, obtained by dividing net earnings by the market value of the stock) – which represents the total risk that the share-holder decides to take when investing in a company and is the accounting variable most strongly related to the cyclical risk of stocks.
● Covariability of earnings (accounting beta) – which is the beta estimated from the accounting returns (regression between the variability of earnings and the simple arithmetic average of this measure for all firms).
Rangel, Dalmácio, and Teixeira (2004) investigated the relevance of accounting indicators for the estimation of stock returns and found evidence to support this hypothesis (that these ratios intend to estimate the return on stocks) in most of the years analyzed. To examine the profitability, the following were used:● return on assets (ROA), which corresponds to net profit
divided by total assets;● return on equity (ROE), calculated by dividing net profit by
equity;● asset turnover, resulting from the ratio between net sales and
total assets;● net margin, equivalent to the ratio between net profit and net
sales.
3. ISE (ÍNDICE DE SUSTENTABILIDADE EMPRESARIAL) – CORPORATE SUSTAINABILITY INDEX
After observing the characteristics of the sustainability indi-cators found around the world, ISE was chosen as the criterion for the selection of the companies for the sample of this paper,

426 R.Adm., São Paulo, v.47, n.3, p.422-435, jul./ago/set. 2012
Tânia Cristina Silva Nunes, Silvia Casa Nova, Edgard Cornacchione, and Solange Garcia
because it was developed in the same country as the companies studied, and it is related to the Brazilian capital market.
ISE was created in 2005 and aims to reflect the return of a portfolio composed of stocks of companies highly com-mitted to social responsibility and to corporate sustainability (BM&FBOVESPA, n.d.). The selection process of the compa-nies in the index is coordinated by the Advisory Board chaired by BM&FBovespa, and comprised of institutions such as ABRAPP (Associação Brasileira de Entidades Fechadas de Previdência Privada) or Brazilian Association of Closed Enti-ties of Private Pension), ANBIMA (Associação Brasileira das Entidades dos Mercados Financeiros e de Capitais or Brazil-ian Association of Financial and Capital Markets), APIMEC (Associação dos Analistas e Profissionais de Investimento do Mercado de Capitais or Association of Investment Analysts and Capital Market Professionals), IBGC (Instituto Brasileiro de Governança Corporativa or Brazilian Institute of Corporate Governance), IFC (International Finance Corporation), Instituto ETHOS de Empresas e Responsabilidade Social (Ethos Institute for Business and Social Responsibility), and the Ministry of Environment. The ISE methodology was designed by GVces – Centre for Sustainability Studies of the São Paulo School of Business Administration of the Getulio Vargas Foundation (FGV-EAESP). These are some of the key features of ISE:● it is comprised of up to 40 companies, selected among
the holders of the 150 stocks that are traded the most on BM&FBovespa;
● its methodology is based on a questionnaire developed through a participatory process;
● participation is voluntary (usually, less than half of the companies invited replies to the questionnaire sent by BM&FBovespa);
● there is an annual review of the portfolio, which is effective as of December 1, and valid up to November 30.
From the creation of ISE (November 30, 2005) until July 31, 2009, one can observe great adherence between its cumulative profitability and the Bovespa index (Ibovespa), with alternat-ing periods of dominance. However, the advantage lies with Ibovespa, which accrued a positive fluctuation of 71.6% vs. 53.9% for the ISE firms.
Lately, ISE has been studied in several Brazilian papers, such as those of Machado et al. (2010), who examined the rela-tion between environmental investments and the inclusion of companies in the ISE, finding that those that invest resources in the community are more likely to be included in the ISE listing; the research of Santos et al. (2009), who investigated the profile of companies that were in the ISE since its first edition; and the dissertation of Barbosa (2007), in which he examines the suitability of the ISE as a reference for improving the sustain-able management of companies and for selection of investment portfolios with an ethical profile, concluding that it seems to be an index more suitable for investors than for managers.
4. METHOD
4.1. Definition of the samples
The samples used in this study are described in the next three items.
4.1.1. 2008/2009 ISE Portfolio – eligible versus selected companies
Since the creation of the ISE, the number of companies that answered the questionnaire has been at most 52% of those in-vited. As previously mentioned, the ISE can cover up to 40 most sustainable companies according its criteria, but it has never reached this number, having included from 28 to 33 companies so far. Therefore, one can conclude that the companies that answered the questionnaire and were rejected lacked even the minimum qualifications required to be in the portfolio, since the intended number (40 companies) was not achieved. This eliminates the possibility that rejected companies might have the minimum qualifications, but are not in ISE because others ranked better than they did.
It would be interesting to compare ISE-listed firms with the turned down companies. However, no disclosure is made of the rejects, i.e., firms that seemed eligible (meaning that they met the requirements to be invited, by being, for instance, among the 150 most traded stocks), answered the questionnaire, but were not classified and, therefore, are not in the ISE portfolio. Nor is there a release of the list of companies that answered the questionnaire, since it would be sufficient to exclude from this group the firms in the ISE listing to find out, by elimina-tion, which were the rejects. Maybe there is no such disclosure because the idea is to reward sustainable companies rather than punish those that do not fulfill the minimum ISE requirements. In any case, this is a suggestion for future studies if the rejects list stops being confidential in the future.
Given these circumstances, we propose to compare com-panies in ISE to those eligible but not in the ISE listing, ei - ther because they were turned down or because they did not fill out the questionnaire. This was done for the 2008/2009 port- folio.
In the BM&FBovespa website, only the list of companies eligible for the next edition of the portfolio is available. The list of eligible companies for previous years was requested to the manager in charge, but was not supplied. As it was impos-sible to obtain this official information, and since the base for the 2010/2011 list is Apr. 30, 2010, in this paper the number of trades is based on Apr. 30, 2008 and is related to the eligible companies in the 2008/2009 portfolio – the data collected are from Dec. 31, 2009. Thus, we emphasize that there may be divergences, as the trading base may have been another, or the liquidity index may not have been the number of tradings, but the volume traded, for example.

R.Adm., São Paulo, v.47, n.3, p.422-435, jul./ago/set. 2012 427
ArE SuSTAiNAblE CompANiES lESS riSky ANd morE profiTAblE?
In sum, the comparison was undertaken among the 34 stocks of the ISE companies and the 117 securities of eligible companies that were not in the ISE (emphasizing again: either because they were rejected, or because they did not fill out the questionnaire). In this sample, several sectors are being con-sidered in the same group, so that differences due to industry factors are not being controlled.
4.1.2. Energy sector
According FTSE4Good (n.d., as cited in BARBOSA, 2007), in terms of environmental criteria, the power generation sector is classified as having a high impact on the environment.
In the current composition of the ISE portfolio, 14 of the 43 stocks listed (about one third) belong to the energy sector. Since each company may have more than one kind of share traded, the ISE’s total number of companies is actually 33, of which 11 in the energy subsector, keeping the same percentage obtained in the calculation of representativeness per share.
The share of the number of companies from the energy sec-tor in the ISE portfolio ranged from 25% to 37% in the period covered by this study. To the Superintendent of Operations at BM&FBovespa, the weight of the energy sector in sustainabi-lity indices is a Brazilian feature. He attributes this fact to the country’s tradition of hydropower and to the strong demands made by the government and civil society organizations for best practices in this sector (LAGE and BILLI, 2007). Only Companhia Energética de Minas Gerais (CEMIG), Companhia Paulista de Força e Luz (CPFL), Eletropaulo and Tractebel appear in all the annual ISE listings. However, all the others are present in at least three of the five years of the index. To make the comparison, in the editions in which a company was not in the ISE, its accounting indicators of risk and return will be considered as belonging to the “non-ISE Group”. Thus, a given company can be in the ISE Group in a year, if it is in the ISE portfolio of this year, and be in the Non-ISE Group the next year, if it is not in the ISE portfolio anymore.
Starting with the set of companies in the energy sector listed with BM&FBovespa, the selection of companies for the Non-ISE Group, to be compared with the group of the 11 ISE enterprises for the 2005/2006 to 2009/2010 period comprised the following steps:● Step 1 – Exclusion of firms that are holding companies, as
part of their subsidiaries, sometimes, conduct activities in other sectors, such as operations related to the gas sector.
● Step 2 – Separation of companies, according to the magni-tude of their total assets, into three categories: greater than R$100 billion, between R$1 and R$100 billion and below R$1 billion, to isolate the interference of the size factor, for the years 2004 to 2009. There were no companies in the ISE listing with total assets below R$1 billion, and the only one with more than R$100 billion in assets (Eletrobras – Centrais Elétricas Brasileiras) is in the ISE. In the sample, only the
intermediate group was included, i.e., companies with total assets between R$1 billion and R$100 billion. To be precise, none of the firms in this intermediate group surpassed R$30 billion in assets throughout the period, making the group more homogeneous.
● Step 3 – The companies were classified by the geographic area of their operation (South, Southeast, Midwest, Northeast or North), to avoid differences in the results derived from this geographical factor. Therefore, both groups (the ISE Group and the Non-ISE Group) were intended to have the same distribution of companies regarding their geographic area of operation.
● Step 4 – In Brazil, companies in the energy sector can ope-ra te in four areas: generation, distribution, transmission, and energy trading. Again, to avoid differences in results derived from this operational factor, both groups (the ISE Group and the Non-ISE Group) were intended to have companies with the same distribution, regarding the specific kind of operation (generation, distribution, transmission, or trading).
After these steps, the general characteristics of the com-panies were verified, through an analysis of the profile and history of each one, based on information available on their own websites, as well as in BM&FBovespa data.
Thus, there were two kinds of samples for the energy sector:● 7 x 7 – After those four steps, there were seven companies
that remained in the ISE Group. Then, seven other companies were selected to be in the non-ISE Group, with a similar geographic coverage and type of operation relative to the companies in the ISE Group that were preferred (in other words, if there were four companies from the Southeast in the ISE Group, four other companies from the Southeast were chosen to be in the non-ISE Group, for example; or, if there were two companies operating only with energy distribution, two other companies focused on energy distribution were chosen to be in the non-ISE Group).
● 7 x 13 – As previously mentioned, after those four steps, there were seven companies that remained in the ISE Group. The total number of companies left out of the ISE Group was 13, and all of them were put in the non-ISE Group this time. Thus, there was no filter by geographic region or by specific activity performed this time.
4.1.3. Banking sector
Within BM&FBovespa, the bank segment is part of the financial and other sector, “financial intermediaries” subsector, with 30 elements nowadays. In the current ISE portfolio, six of the 43 listed shares are banks (14%). Since each company may trade more than one kind of share, the total number of ISE companies is 33 and 4 of them are banks (approximately 12%). The percentage of banks in the ISE portfolio ranged from 9% to 19% during the analyzed period.

428 R.Adm., São Paulo, v.47, n.3, p.422-435, jul./ago/set. 2012
Tânia Cristina Silva Nunes, Silvia Casa Nova, Edgard Cornacchione, and Solange Garcia
Banco do Brasil, Bradesco and Itaubanco appear in all editions of the portfolio; Itausa, in three of the five years; Unibanco was not on the 2007/2008 list, and in 2009/2010 it was merged with Itaubanco, giving rise to ItauUnibanco. The database consulted had no information about the holding company Itausa Investimentos Itau SA, so it was excluded from the tests. As additional information, even though the sample consisted only of banks, there were two other financial firms already in the ISE: Ultrapar (2006/2007 portfolio), a holding company with operations in commercial and industrial sectors as well; and Redecard (2009/2010 portfolio), which operates with payment cards.
The banks listed on BM&FBovespa were divided into two groups: banks listed in the ISE (ISE banks) and banks that were never part of the index in the 2005/2006 to 2009/2010 period (non-ISE banks). As the database consulted shows the Itau-banco and Unibanco information concentrated in the merged company that they formed, ItauUnibanco, only the information on the latter was used. Banco da Patagonia, traded in form of DRs (Depositary Receipts), was discarded, to keep only Bra-zilian banks in the study. No data were obtained on Banco de Brasília and Consórcio Alfa de Administração, so neither are in the sample. Thus, the comparison was performed between the three institutions listed in the ISE (Bradesco, Banco do Brasil and ItauUnibanco) – which were in all the portfolios (2005/2006 to 2009/2010), considering the exception con-nected with the ItauUnibanco merger – and the other 21 banks that were never included in ISE.
4.2. Methodological procedures
First, the analysis was concentrated in the energy sector, which had the highest number of ISE listed companies, thus avoiding any differences in the ratios due to the specific na-ture of the sectors. After that, the analysis was concentrated in the banking sector, which had the second largest number of ISE listed companies. Finally, the testing was performed with eligible versus selected companies, including all sectors of eligible companies from BM&FBovespa and from the ISE 2008/2009 portfolio.
To compare the groups, the Mann-Whitney test was used, a non-parametrical statistical hypothesis test to verify the independence of the samples. The significance level was set at 5% (α ≤ 0.05), meaning that if the result was greater, the hypothesis would be rejected.
Based on the rejection or not of each of the specific hyp-othesis (see all the specific hypotheses in item 1.1), one can consider the general hypothesis true or not, indicating whether there are significant differences in the accounting indicators of sustainable enterprises in relation to those of other companies that are not recognized as sustainable.
To make the analysis of the general hypothesis practical and feasible, when more than half of the specific hypotheses
regarding risk were not rejected, the conclusion was that there were significant differences in accounting indicators of sustain-able enterprises in relation to other companies not recognized as sustainable. The same rationale applied to the specific hyp-otheses on returns. In the case of a draw, meaning that three of the risk hypotheses were rejected and three were not, for example, the result was deemed inconclusive.
This test was first performed for the energy sector (twice: one for the 7x7 sample, and again for the 7x13 sample), then repeated for the bank sector and, last, for the entire ISE portfolio of 2008/2009 (comparing eligible versus selected companies).
4.3. Research limitations
The criterion to separate the companies into sustainable and non-sustainable was the ISE portfolio of BM&FBovespa. A different criterion for this division might yield different results.
The analyzed time span was the period of ISE’s existence, starting with the first portfolio (2005/2006) and extending up to 2009/2010. The length of the period may have had some influence on the outcome: the positive results arising from the integration of sustainability into business strategy might take a long time to materialize and the five years analyzed might be too short a period.
5. RESULTS
The results are presented separately for each sample: the en-ergy sector (7x7 sample and 7x13 sample), the bank sector, and the 2008/2009 ISE portfolio. The results of the Mann-Whitney test are shown in tables 1 to 8 and are arranged according the level of significance, from the smallest to the largest. The first column of each table shows the name of the ratio; the next column, the type of ratio, i.e., concerning risk or return (except for the tables of “additional ratios”, which are explained below); the following columns show the Z value, the significance level, and the result (rejection or not) for the hypothesis, respectively.
5.1. Energy sector
The results of the Mann-Whitney test for the 7x7 sample are shown in Table 1. The results of the Mann-Whitney test for the 7x13 sample are shown in Table 2.
Just as Lee, Faff, and Langfield-Smith (2009), who found different results using accounting indicators as compared to the results based on market data, in this paper, the differences between the mean of the ratios calculated are for those that make use of price in the calculation, as indicated by earnings/price and the accounting beta (covariability in earnings), for both samples: 7x7 or 7x13.
All the other accounting indicators (dividend payout, asset growth, leverage, liquidity, ROA, ROE, asset turnover, and net margin) showed no significant differences between their means,

R.Adm., São Paulo, v.47, n.3, p.422-435, jul./ago/set. 2012 429
ArE SuSTAiNAblE CompANiES lESS riSky ANd morE profiTAblE?
calculated using annual data from 2005 to 2009. Of these, the one closest to reflecting any difference between the ISE and the Non-ISE groups was the leverage ratio – if the level of significance had been 10%, the result for the 7x13 sample (α = 0.064) would lead to non-rejection of the hypothesis. At the other extreme, one can see that the asset turnover is very similar in both groups, especially in the 7x13 sample (α = 1).
In general, there is a slight concentration of accounting indicators of risk near the region of the level of significance, to not reject the hypothesis, whereas the rates of return are substantially far from it. In other words, the level of signifi-cance (sig.) for the risk measures tended, subtly, to be smaller
than of the levels of significance of the return. However, this separation did not appear as clearly defined.
The negative relation between social responsibility and financial performance, consistent with the discourse of Share-holder Theory, was not confirmed in this study, since none of the four return indicators (ROA, ROE, turnover, and net margin) revealed differences between the means of both groups (ISE and non-ISE). Concerning only the ratios, period of time and companies reviewed here, one can state that the fact that a company is considered as sustainable (according to the criterion of being listed in the ISE or not) does not make it more or less profitable than the others in its industry.
Table 1
Energy Sector (7x7 Sample): Mann-Whitney Test (α ≤ 0.05)
Ratio Kind of Ratio Z Sig. HypothesisAccounting Beta Risk -2,441 0,015 Not RejectedEarnings / Price Risk -2,258 0,024 Not RejectedLeverage Risk -1,045 0,296 RejectedROE Return -0,805 0,421 RejectedROA Return -0,677 0,498 RejectedDividend Payout Risk -0,649 0,516 RejectedLiquidity Risk -0,376 0,707 RejectedNet Profit Margin Return -0,350 0,726 RejectedAssets Turnover Return -0,288 0,773 RejectedGrowth Risk -0,279 0,780 Rejected
Table 2
Energy Sector (7x13 Sample): Mann-Whitney Test (α ≤ 0.05)
Ratio Kind of Ratio Z Sig. HypothesisEarnings / Price Risk -2,683 0,007 Not RejectedAccounting Beta Risk -2,038 0,042 Not RejectedLeverage Risk -1,856 0,064 RejectedGrowth Risk -0,902 0,367 Rejectedliquidity Risk -0,899 0,369 RejectedNet Profit Margin Return -0,806 0,420 RejectedROA Return -0,687 0,492 RejectedDividend Payout Risk -0,537 0,591 RejectedROE Return -0,066 0,947 RejectedAssets Turnover Return 0,000 1,000 Rejected
430 R.Adm., São Paulo, v.47, n.3, p.422-435, jul./ago/set. 2012
Tânia Cristina Silva Nunes, Silvia Casa Nova, Edgard Cornacchione, and Solange Garcia
If, as established by the Stakeholder Theory and supported by Freeman (1994), the management considers that the organ-ization’s responsibility goes beyond profit maximization, and chooses to integrate sustainability into the business strategy, according to the findings of this research, there is no impact (positive or negative) upon the return indicators. The fact that there is no profitability increase indicates that this is not a differential financial advantage; on the other hand, as there is no drop in profitability, one can conclude that this may be the case for reasons other than economic ones, without giving up shareholder income to achieve this. According to the results obtained, the fact of being sustainable and, therefore, of having greater support from society in general did not affect company success, in terms of performance (risk and return), restricted to what can be measured by the accounting indicators used herein. This result neither corroborates what is established in the Theory of Legitimation (CAMPBELL, CRAVEN, and SHRIVES, 2003) nor the findings of Orlitzky, Schmidit, and Rynes (2003).
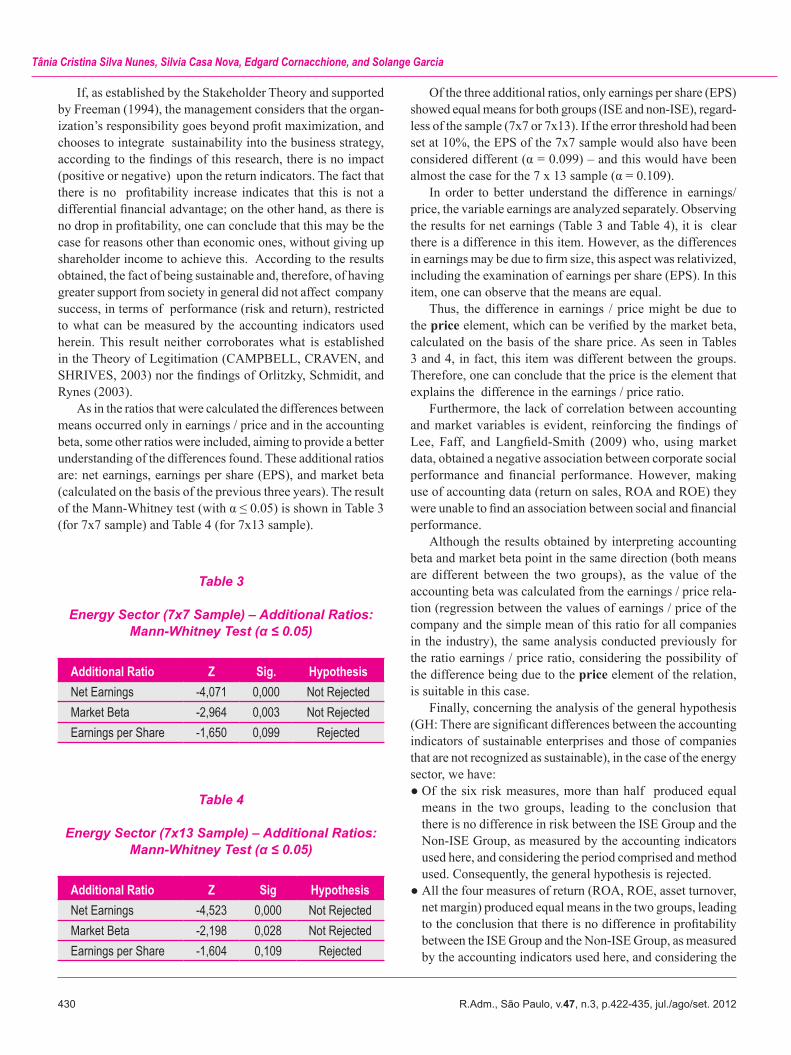
As in the ratios that were calculated the differences between means occurred only in earnings / price and in the accounting beta, some other ratios were included, aiming to provide a better understanding of the differences found. These additional ratios are: net earnings, earnings per share (EPS), and market beta (calculated on the basis of the previous three years). The result of the Mann-Whitney test (with α ≤ 0.05) is shown in Table 3 (for 7x7 sample) and Table 4 (for 7x13 sample).
Of the three additional ratios, only earnings per share (EPS) showed equal means for both groups (ISE and non-ISE), regard-less of the sample (7x7 or 7x13). If the error threshold had been set at 10%, the EPS of the 7x7 sample would also have been considered different (α = 0.099) – and this would have been almost the case for the 7 x 13 sample (α = 0.109).
In order to better understand the difference in earnings/price, the variable earnings are analyzed separately. Observing the results for net earnings (Table 3 and Table 4), it is clear there is a difference in this item. However, as the differences in earnings may be due to firm size, this aspect was relativized, including the examination of earnings per share (EPS). In this item, one can observe that the means are equal.
Thus, the difference in earnings / price might be due to the price element, which can be verified by the market beta, calculated on the basis of the share price. As seen in Tables 3 and 4, in fact, this item was different between the groups. Therefore, one can conclude that the price is the element that explains the difference in the earnings / price ratio.
Furthermore, the lack of correlation between accounting and market variables is evident, reinforcing the findings of Lee, Faff, and Langfield-Smith (2009) who, using market data, obtained a negative association between corporate social performance and financial performance. However, making use of accounting data (return on sales, ROA and ROE) they were unable to find an association between social and financial performance.
Although the results obtained by interpreting accounting beta and market beta point in the same direction (both means are different between the two groups), as the value of the accounting beta was calculated from the earnings / price rela-tion (regression between the values of earnings / price of the company and the simple mean of this ratio for all companies in the industry), the same analysis conducted previously for the ratio earnings / price ratio, considering the possibility of the difference being due to the price element of the relation, is suitable in this case.
Finally, concerning the analysis of the general hypothesis (GH: There are significant differences between the accounting indicators of sustainable enterprises and those of companies that are not recognized as sustainable), in the case of the energy sector, we have: ● Of the six risk measures, more than half produced equal
means in the two groups, leading to the conclusion that there is no difference in risk between the ISE Group and the Non-ISE Group, as measured by the accounting indicators used here, and considering the period comprised and method used. Consequently, the general hypothesis is rejected.
● All the four measures of return (ROA, ROE, asset turnover, net margin) produced equal means in the two groups, leading to the conclusion that there is no difference in profitability between the ISE Group and the Non-ISE Group, as measured by the accounting indicators used here, and considering the
Table 3
Energy Sector (7x7 Sample) – Additional Ratios: Mann-Whitney Test (α ≤ 0.05)
Additional Ratio Z Sig. HypothesisNet Earnings -4,071 0,000 Not RejectedMarket Beta -2,964 0,003 Not RejectedEarnings per Share -1,650 0,099 Rejected
Table 4
Energy Sector (7x13 Sample) – Additional Ratios: Mann-Whitney Test (α ≤ 0.05)
Additional Ratio Z Sig HypothesisNet Earnings -4,523 0,000 Not RejectedMarket Beta -2,198 0,028 Not RejectedEarnings per Share -1,604 0,109 Rejected

R.Adm., São Paulo, v.47, n.3, p.422-435, jul./ago/set. 2012 431
ArE SuSTAiNAblE CompANiES lESS riSky ANd morE profiTAblE?
period comprised and method used. Consequently, the gen-eral hypothesis is rejected.
5.2. Banking sector
The results of the Mann-Whitney test for the banking sector are shown in Table 5.
Significant differences were observed in the ratios of total assets, ROE and asset turnover. Regarding total assets, we emphasize that segregation by size was not conducted as in the sample of the energy sector, because the three banks in ISE are giants in relation to the others. Thus, the difference observed for total assets merely confirms what was expected. In this study, ROE and asset turnover ratios represent a measure of return using accounting variables. The asset turnover was significantly lower for banks of the ISE Group also due to the magnitude of their assets relative to those of the banks in the other group. ROE was significantly higher for the ISE banks, which is relevant, because although it is expected that banks with higher total assets produce major net profit in absolute terms, this measure is weighted by equity in ROE (= net profit / equity). This contradicts Shareholder Theory, indicating that one can meet the requirements other interest groups (as proposed by Stakeholder Theory) without adversely affecting the outcome for the shareholder.
The measures of earnings / price and net margin would also be considered significantly different between the groups for an acceptance level of 10% (α = 0.059 and 0.077, respec-tively). Earnings / price is a risk ratio that contains a market variable (stock price), whereas net margin is a financial return ratio. These findings are different from those of Lee, Faff, and Langfield-Smith (2009), who obtained different results using accounting indicators from those obtained using market data.
They also differ from the results of this study for the energy sector, although an explanation for this fact has not been found.
Macedo et al. (2008) did not observe significant differences in ratios of liquidity, leverage and profitability, when they com-pared ISE companies with the others listed on BM&FBovespa for 2006. In their sample, they excluded the financial sector. In the present study, examining the banking sector, it is possible to observe differences (for an acceptance level of 10%) for profit-ability (as measured by ROE), net margin and asset turnover.
We collected data on net earnings and earnings per share (EPS) for the banking sector (the results are shown in Table 6). As some of the banks researched have few data about the price of shares, so few that this overcomes the tolerance of the database system, it was impossible to calculate the result of the market beta.
As previously mentioned, because the ISE banks are the largest ones, it makes sense to obtain higher values of net earn-ings for this group. Earnings weighted by the number of shares traded were also higher for banks in the ISE Group.
Table 5
Banking Sector: Mann-Whitney Test (α ≤ 0.05)
Ratio Kind of Ratio Z Sig. HypothesisTotal Assets Risk -6,075 0,000 Not RejectedROE Return -3,674 0,000 Not RejectedAssets Turnover Return -3,459 0,001 Not RejectedEarnings / Price Risk -1,889 0,059 RejectedNet Profit Margin Return -1,768 0,077 RejectedGrowth Risk -0,962 0,336 RejectedDividend Payout Risk -0,814 0,416 RejectedLiquidity Risk -0,206 0,837 RejectedROA Return -0,174 0,862 Rejected
Table 6
Banking Sector – Additional Ratios: Mann-Whitney Test (α ≤ 0.05)
Additional Ratio Z Sig. HypothesisNet Earnings -6,206 0,000 Not RejectedEarnings per Share -4,012 0,000 Not Rejected

432 R.Adm., São Paulo, v.47, n.3, p.422-435, jul./ago/set. 2012
Tânia Cristina Silva Nunes, Silvia Casa Nova, Edgard Cornacchione, and Solange Garcia
Finally, for the analysis of the general hypothesis in the case of the banking sector, we have:● Of the five risk measures (dividend payout, asset growth,
liquidity, magnitude of total assets, and variability of earnings – the database consulted, Economática, does not calculate the leverage ratio for the financial sector), more than half pro-duced equal means in both groups, leading to the conclusion that there is no difference in risk between the ISE Group and the Non-ISE Group, as measured by the accounting indicators used here, and considering the period comprised and method used. Consequently, the general hypothesis is rejected.
● Regarding the ratios of return, there was a tie, so the result was considered inconclusive.
5.3. 2008/2009 ISE portfolio – eligible versus selected companies
In the database consulted (Economática), there were no data about dividend payout available for the period of time analyzed here. The accounting beta was also not calculated. The results of the Mann-Whitney test for the 2008/2009 ISE portfolio are shown in Table 7.
Only the total assets and liquidity ratios, both of which are risk measures, yielded a significant difference. The magnitude of total assets is the main predictive variable for the rating of the debt (HORRIGAN, 1966, as cited in BEAVER, KET-TLER, and SCHOLES, 1970), which is related to the relative frequency of default (HICKMAN, 1958, as cited in BEAVER, KETTLER, and SCHOLES, 1970). As larger firms have lower risk than smaller ones (BEAVER, KETTLER, and SCHOLES, 1970), the difference in favor of ISE selected companies for total assets in the Mann-Whitney test allows one to infer that sustainable enterprises have a lower level of risk, consider-
ing the comparison between ISE companies and the selected companies, as regards this measure, in the period analyzed (portfolio 2008/2009).
Regarding the liquidity ratio, the average is higher for the group of ISE eligible-but-not-selected companies. For Beaver, Kettler, and Scholes (1970), assets with greater liquidity have lower volatility of returns; therefore, the higher the current ratio, the lower the risk of the company. In the case of the comparison between eligible and selected companies, those on the ISE port-folio have higher risk, according to the result obtained for the period analyzed (portfolio 2008/2009). This result contradicts that which was observed analyzing the total assets.
The other risk ratios (financial leverage, earnings / price, growth), as well as all measures of return, showed no significant p-value. This indicates that being a sustainable company has no negative (or positive) impact on returns, contrary to Shareholder Theory, which states that, to maximize shareholder profit the interest of other groups of stakeholders should be disregarded. However, the positive association between corporate social performance and corporate financial performance found in other studies (ORLITZKY, SCHMIDIT, and RYNES, 2003) could not be confirmed either.
The result of the Mann-Whitney test (with α ≤ 0.05) for the additional ratios is shown in Table 8.
According to the results, the three additional ratios differ between the groups. The ISE companies generate higher net earnings, higher earnings per share, and have a lower market beta. Higher profit measures indicate a greater return, while the lowest market beta may indicate a lower level of risk relative to that of the group of eligible companies.
Finally, for the analysis of the general hypothesis (GH: There are significant differences between the accounting indi-c ators of sustainable enterprises and those of other companies
Table 7
Eligible versus Selected Companies (2008/2009 ISE): Mann-Whitney Test (α ≤ 0.05)
Ratio Kind of Ratio Z Sig. HypothesisTotal Assets Risk -5,074 0,000 Not RejectedLiquidy Risk -2,683 0,007 Not RejectedLeverage Risk -1,539 0,124 RejectedEarnings / Price Risk -1,328 0,184 RejectedAssets Turnover Return -1,021 0,307 RejectedGrowth Risk -0,688 0,492 RejectedROA Return -0,617 0,537 RejectedNet Profit Margin Return -0,246 0,806 RejectedROE Return -0,120 0,904 Rejected

R.Adm., São Paulo, v.47, n.3, p.422-435, jul./ago/set. 2012 433
ArE SuSTAiNAblE CompANiES lESS riSky ANd morE profiTAblE?
that are not recognized as sustainable), in the case of the 2008/2009 ISE portfolio, we have:● Of the five risk measures, more than half yielded equal
means for the groups, leading to the conclusion that there is no difference in risk between the ISE Group and the Non-ISE Group, when risk is measured by the accounting indicators used here, and considering the period comprised and method used. Consequently, the general hypothesis is rejected.
● All the four measures of return (ROA, ROE, asset turnover, net profit margin) yielded equal means for the two groups, leading to the conclusion that there is no difference in profit-ability between the ISE Group and the Non-ISE Group, when profitability is measured by the accounting indicators used here, and considering the period comprised and method used. Consequently, the general hypothesis is rejected.
6. CONCLUSION
As a whole and consistently, no differences were found between sustainable and non-sustainable companies, based on the accounting indicators analyzed. However, for those ratios in which a difference was observed individually, wheth - er in favor of sustainable companies or not, we suggest that future studies should conduct more specific and in-depth re-search.
If, from the results obtained, it was impossible to consider that the integration of sustainability into corporate strategy is favorable from the financial point of view, on the other hand, neither can one claim that this implies in a negative financial outcome. This may indicate that the arguments to encourage businesses to integrate sustainability into their strategy should be of a non-financial nature; or it may mean that the costs of this integration are offset by other gains, so as not to adversely affect the final financial results. We hope that this result is of interest to civil society institutions that work towards sustain-able development, guiding their action strategy.
As a last thought, according Savitz (2007), managing a business sustainably generates more profit for businesses and greater economic, social and environmental prosperity for so-ciety in the long term, so that the time factor may have some influence on the outcome: perhaps, the positive potential results of integrating sustainability into business strategy might take longer to come to light. Thus, we recommend that this study be reproduced to cover a longer time span, for example, when ISE has existed for a few decades.
Table 8
Eligible versus Selected Companies (2008/2009 ISE) – Additional Ratios: Mann-Whitney
Test (α ≤ 0.05)
Additional Ratio Z Sig. HypothesisMarket Beta -3,736 0,000 Not RejectedNet Earnings -3,631 0,000 Not RejectedEarnings per Share -2,173 0,030 Not Rejected
ASSAF NETO, A. Finanças corporativas e valor. São Paulo: Atlas, 2003.
BANSAL, P. The corporate challenges of sustainable development. The Academy of Management Executive, v.16, n.2, p.122-131, May 2002.
BARBOSA, P.R.A. Índice de sustentabilidade empresarial da Bolsa de Valores de São Paulo (ISE-Bovespa): exame da adequação como referência para aperfeiçoamento da gestão sustentável das empresas e para formação de carteiras de investimento orientadas por princípios de sustentabilidade corporativa. 2007. Dissertação (Mestrado em Administração) – Instituto COPPEAD de Administração, Universidade Federal do Rio de Janeiro, Rio de Janeiro, Rio de Janeiro, Brasil, 2007.
BEAVER, W.H.; KETTLER, P.; SCHOLES, M. The association between market determined and accounting
determined risk measures. The Accounting Review, v.45, p.654-682, Oct. 1970.
BERTAGNOLLI, D.D.O. Estudo sobre a influência dos investimentos sociais e ambientais no desempenho econômico das empresas. 2006. Dissertação (Mestrado) – Universidade do Vale do Rio dos Sinos, São Leopoldo, Rio Grande do Sul, Brasil, 2006.
BM&FBOVESPA. Informações. 2010. At: <www.bmfbovespa.com.br>. Retrieved on: Mar. 2010.
BODIE, Z.; KANE, A.; MARCUS, A.J. Fundamentos de investimentos. 3.ed. Porto Alegre: Bookman, 2000.
BORGER, F.G. Responsabilidade social: efeitos da atuação social na dinâmica empresarial. 2001. Tese (Doutorado) – Faculdade de Economia, Administração e Contabilidade da Universidade de São Paulo, São Paulo, São Paulo, Brasil, 2001.
REF
EREN
CES
434 R.Adm., São Paulo, v.47, n.3, p.422-435, jul./ago/set. 2012
Tânia Cristina Silva Nunes, Silvia Casa Nova, Edgard Cornacchione, and Solange Garcia
BRANCO, M.C.; RODRIGUES, L.L. Communication of corporate social responsibility by Portuguese banks: a legitimacy theory perspective. Corporate Communications: An International Journal, v.11, n.3, p.232-248, 2006.
BREALEY, R.A.; MYERS, S.C. Principles of corporate finance. Boston: McGraw-Hill, 2000.
CAMPBELL, D.; CRAVEN, B.; SHRIVES, P. Voluntary social reporting in three FTSE sectors: a comment on perception and legitimacy. Accounting, Auditing and Accountability Journal, v.16, n.4, p.558-581, 2003.
CHO, C.H.; PATTEN, D.M. The role of environmental disclosures as tools of legitimacy: a research note. Accounting, Organizations and Society, v.32, n.7/8, p.639, Oct./Nov. 2007.
CONNOLLY, T.; DEUTSCH, S.J. Performance measurement: conceptual issues. Evaluation and Program Planning, v.3, n.1, p.35-43, 1980.
ELTON, E.J.; GRUBER, M.J.; BROWN, S.J. Moderna teoria de carteiras e análise de investimentos. São Paulo: Atlas, 2004.
FREEMAN, R.E. The politics of stakeholder theory: some future directions. Business Ethics Quarterly, v.4, n.4, p.409-422, 1994.
LAGE, J.; BILLI, M. Sustentabilidade pega (e paga) bem. Revista da Folha, São Paulo, 16 abr. 2007.
LEE, D.D.; FAFF, R.W.; LANGFIELD-SMITH, K. Revisiting the vexing question: does superior corporate social performance lead to improved financial performance? Australian Journal of Management, v.34, n.1, p.21-49, July 2009.
LÓPEZ, M.V.; GARCIA, A.; RODRIGUES, R. Sustainable development and corporate performance: a study based on the Dow Jones Sustainability Index. Journal of Business Ethics, v.75, n.3, p.285-300, 2007.
MACEDO, M.A.S.; SOUSA, A.C.; SOUSA, A.C.C.; CIPOLA, F.C. Análise comparativa do desempenho contábil-financeiro de empresas socialmente responsáveis. In: CONGRESSO USP DE CONTABILIDADE, 2008, São Paulo. Anais... São Paulo: FEA-USP, 2008.
MACHADO, M.A.V.; MACEDO, M.A.S.; MACHADO, M.R.; SIQUEIRA, J.R.M. Análise da relação entre investimentos socioambientais e a inclusão de empresas no Índice de Sustentabilidade Empresarial (ISE) da BM&FBovespa. In: CONGRESSO USP DE CONTROLADORIA E CONTABILIDADE, 2010, São Paulo. Anais… São Paulo: FEA-USP, 2010.
MAGNESS, V. Strategic posture, financial performance and environmental disclosure: an empirical test of legitimacy theory. Accounting, Auditing and Accountability Journal, v.19, n.4, p.540-563, 2006.
MANTEAW, B.O. Education for sustainable development: an emergent discourse for multi-sector learning and action. 2008. Tese (PhD em Educação) – Washington State University, United States of America, 2008.
MARGOLIS, J.D.; WALSH, J.P. Misery loves companies: rethinking social initiatives by business. Administrative Science Quarterly, v.48, n.2, p.268-305, Jan. 2003.
ODA, A.L.; YOSHINAGA, C.E.; OKIMURA, R.T.; SECURATO, J.R. Análise da relação entre indicadores contábeis e betas de mercado das empresas brasileiras negociadas na Bolsa de Valores de São Paulo no período 1995 – 2003. In: SEMEAD – SEMINÁRIOS DE ADMINISTRAÇÃO, 8., 2005, São Paulo. Anais... São Paulo: FEA-USP, 2005.
ORLITZKY, M.; SCHMIDIT, F.L.; RYNES, S.L. Corporate social and financial performance: a meta-analysis. Organization Studies, v.24, n.3, p.403-441, 2003.
RANGEL, L.L.; DALMÁCIO, F.Z.; TEIXEIRA, A.J.C. A relevância dos indicadores contábeis para estimativa de retorno das ações negociadas na Bovespa: um estudo empírico no setor de metalurgia e siderurgia. 2004. Dissertação (Mestrado) – Fundação Instituto Capixaba de Pesquisas em Contabilidade, Economia e Finanças (Fucape), Vitória, Espírito Santo, Brasil, 2004.
REILLY, F.K.; NORTON, E.A. Investimentos. São Paulo: Cengage Learning, 2008.
ROWLEY, T.; HOVLAND, J. Stakeholder thinking and management practices in North America. Canada: Rotman School of Management – University of Toronto, 1999.
SANTOS, C.A.; COSTA, F.M.G.; ESPEJO, M.M.S.B.; PANHOCA, L. Índice de Sustentabilidade Empresarial: evolução das práticas de sustentabilidade empresarial 2005 a 2008. In: SOUTH AMERICA CSEAR, 1., 2009, Rio de Janeiro. Anais... Rio de Janeiro: UFRJ, 2009.
SANVICENTE, A.Z.; MELLAGI FILHO, A. Mercado de capitais e estratégias de investimento. São Paulo: Atlas, 1996.
SAVITZ, A.W. A empresa sustentável: o verdadeiro sucesso é o lucro com responsabilidade social e ambiental. 2.ed. Rio de Janeiro: Campus/Elsevier, 2007.
REF
EREN
CES

R.Adm., São Paulo, v.47, n.3, p.422-435, jul./ago/set. 2012 435
ArE SuSTAiNAblE CompANiES lESS riSky ANd morE profiTAblE?
Are sustainable companies less risky and more profitable?
The purpose of this study was to determine whether there were significant differences in accounting indicators when comparing sustainable enterprises to other similar companies that are not considered as sustainable. The Corporate Sustainability Index of BM&FBovespa (São Paulo Stock, Commodities and Futures Exchange) was the criterion selected to break down the samples into sustainable and non-sustainable enterprises. The accounting indicators were separated into two kinds: risk (dividend payout, percentage growth of assets, financial leverage, current liquidity, asset size, variability of earnings, and accounting beta) and return (ROA, ROE, asset turnover, and net margin). We individually analyzed the companies in the energy sector, followed by those in the banking sector, as well as the entire ISE portfolio as of 2008/2009, including all the sectors. Mann-Whitney tests were performed in order to verify the difference of the means between the groups (ISE and non-ISE). The results, considering the method chosen and the time span covered by the study, indicate that there are no differences between sustainable companies and the others, when they are assessed by the accounting indicators used here.
Keywords: sustainability, risk, profitability, sustainable companies.
¿Las empresas sostenibles son efectivamente más rentables y menos riesgosas?
El objetivo en este estudio fue determinar si existían diferencias significativas en los indicadores contables de las empresas sostenibles en relación con otras empresas no reconocidas como sostenibles. El Índice de Sostenibilidad Empresarial (ISE) de BM&FBovespa fue el criterio utilizado para dividir la muestra en empresas sostenibles o no. Se dividieron los indicadores contables analizados en dos categorías: de riesgo (tasa de pago de dividendos, porcentaje de crecimiento de activos, apalancamiento financiero, liquidez corriente, tamaño de los activos, variabilidad de los ingresos y beta contable) y de retorno (ROA, ROE, rotación de activos, margen neto), identificados en la revisión de la literatura. Se analizaron, de forma individual, empresas del sector de electricidad y de la banca, además, se hizo un análisis sin división sectorial de la cartera 2008/2009 del ISE. Para la verificación de la diferencia de medias entre los grupos se utilizó el test de Mann-Whitney. Los resultados, en general, y teniendo en cuenta el método utilizado y el período estudiado, indican que no hay diferencias, medidas por los indicadores contables seleccionados, entre las empresas sostenibles y las que no son así consideradas.
Palabras clave: sostenibilidad, riesgo, retorno, empresas sostenibles.
AB
STR
AC
TR
ESU
MEN