The Global Economic Crisis Smash Effect Simulator (GECSE-Simulator)
7
IJER, Vol. 10, No. 2, July-December, 2013, pp. 269-275 THE GLOBAL ECONOMIC CRISIS SMASH EFFECT SIMULATOR (GECSE-SIMULATOR) MARIO ARTURO RUIZ ESTRADA Institute of China Studies (ICS) & Faculty of Economics and Administration (FEA), University of Malaya, 50603 Kuala Lumpur, Malaysia, (E-mail: [email protected]) ABSTRACT This paper proposes the uses of the global economic crisis smash effect simulator as a theoretical framework to evaluate the final effects of any global financial crisis on the world economy. We present different scenarios and results according to different levels of devastation that the global financial crisis can generate on world economy. It is based on the evaluation of unemployment and world wide poverty dissemination. The global economic crisis smash effect simulator requires the use of economic modeling in real time and multi-dimensional economic modeling to visualize different scenarios and evaluate the final impact of any global financial crisis. JEL: B40. KEYWORDS: Econographicology, Multidimensional Coordinate Spaces and Graphical Modeling for Economics. 1. INTRODUCTION TO THE GLOBAL ECONOMIC CRISIS SMASH EFFECT SIMULATOR (GECSE-SIMULATOR) The construction of the global economic crisis smash effect simulator (GECSE-Simulator) is based on the application of economic waves modeling (Ruiz Estrada, 2009). To build each economic wave in our simulation, we suggest the simultaneous application of the inter-linkage coordinate space and economic modeling in real time. Initially, the GECSE-simulator uses n-number of economies “E” in its analysis. Each economy has its general axis; at the same time, each general axis can show a large number of sub-axes. All these sub-axes are interconnected by straight lines until they reach the last sub-axis. A reminder: each sub-axis runs with different multi-dimensional partial differentiation(s) (�Y/�X) in real time ( ) (Ruiz Estrada, 2009). The idea of applying a large number of partial differentiation(s) successively is to generate an effect of movement of different economic waves in the same graphical space. According to the GECSE-simulator, each sub-axis is interconnected into the same general axis by the application of the inter-linking sub-axis system “>”. The function of this is to join each sub-axis into the same general axis. Finally, all general axes and
Transcript of The Global Economic Crisis Smash Effect Simulator (GECSE-Simulator)

IJER, Vol. 10, No. 2, July-December, 2013, pp. 269-275
THE GLOBAL ECONOMIC CRISIS SMASH EFFECTSIMULATOR (GECSE-SIMULATOR)
MARIO ARTURO RUIZ ESTRADAInstitute of China Studies (ICS) & Faculty of Economics and Administration (FEA),
University of Malaya, 50603 Kuala Lumpur, Malaysia, (E-mail: [email protected])
ABSTRACT
This paper proposes the uses of the global economic crisis smash effect simulator as atheoretical framework to evaluate the final effects of any global financial crisis on theworld economy. We present different scenarios and results according to different levels ofdevastation that the global financial crisis can generate on world economy. It is based onthe evaluation of unemployment and world wide poverty dissemination. The globaleconomic crisis smash effect simulator requires the use of economic modeling in real timeand multi-dimensional economic modeling to visualize different scenarios and evaluatethe final impact of any global financial crisis.
JEL: B40.
KEYWORDS: Econographicology, Multidimensional Coordinate Spaces and GraphicalModeling for Economics.
1. INTRODUCTION TO THE GLOBAL ECONOMIC CRISIS SMASH EFFECTSIMULATOR (GECSE-SIMULATOR)
The construction of the global economic crisis smash effect simulator (GECSE-Simulator)is based on the application of economic waves modeling (Ruiz Estrada, 2009). Tobuild each economic wave in our simulation, we suggest the simultaneous applicationof the inter-linkage coordinate space and economic modeling in real time. Initially,the GECSE-simulator uses n-number of economies “E” in its analysis. Each economyhas its general axis; at the same time, each general axis can show a large number ofsub-axes. All these sub-axes are interconnected by straight lines until they reach thelast sub-axis. A reminder: each sub-axis runs with different multi-dimensional partialdifferentiation(s) (�Y/�X) in real time ( ) (Ruiz Estrada, 2009). The idea of applying alarge number of partial differentiation(s) successively is to generate an effect ofmovement of different economic waves in the same graphical space.
According to the GECSE-simulator, each sub-axis is interconnected into the samegeneral axis by the application of the inter-linking sub-axis system “>”. The functionof this is to join each sub-axis into the same general axis. Finally, all general axes and

270 Mario Arturo Ruiz Estrada
sub-axes are joined at all levels of analysis under the application of the fixedexponential “�” in different periods of time (t+1). However, the assumption is that allsub-axes and the general axis are moving under the application of economic modelingin real time “ ” (see Expression 1). We also suggest the application of the OmniaMobilis assumption (Ruiz Estrada, Yap and Nagaraj, 2008) to help in the relaxation ofeach sub-axis. This is to reduce the use of the Ceteris Paribus assumption in oursimulator. Finally, we observe a large number of surfaces (economic waves) inpermanent movement using the GECSE-simulator. The movement of these surfacesstarts from the epicenter of the inter-linkage coordinate space until its end in the lastsub-axis into the same general axis. The real impact of this simulator is located on thelast sub-axis (see Figure 1). The final analysis in the GECSE-simulator is based on theanalysis of different surfaces displayed in different parts of the inter-linkagecoordinate space.
�t+1 E1 = [�Yi1-0/�X i
1-0]*Lj > [�Yi1-1/�Xi
1-1]*Lj > [�Yi1-2/�Xi
1-2]*Lj >…> [�Yi1-�/�Xi
1-�]*Lj
E2 = [�Yi2-0/�X i
2-0]*Lj > [�Yi2-1/�Xi
2-1]*Lj > [�Yi2-2/�Xi
2-2]*Lj >…> [�Yi2-�/�Xi
2-�]*Lj
S = •
E� = [�Yi�-0/�X i
�-0i]*Lj > [�Yi
�-1/�Xi�-1]*Lj > [�Yi
�-2/�Xi�-2]*Lj >…> [�Yi
�-�/�Xi�-�]*Lj
Partial differentiation: i= {o,1,2,3…�} and Level: j = {o,1,2,3…�}
Figure 1The GECSE-Simulator Coordinate System
(1)

The Global Economic Crisis Smash Effect Simulator (GECSE-Simulator) 271
2. THE APPLICATION OF THE GECSE-SIMULATOR
The GECSE-simulator will be applied to five different economies simultaneously.These five economies are preceded by the first one, the United States economy, whichis fixed as the epicenter in the GECSE-simulator. Additionally, we include the otherfour economies distributed into four general axes respectively; these four economiesare the ASEAN economy (E1), Chinese economy (E2), European economy (E3) andJapanese economy (E4) (see Expression 2). Basically, the GECSE-Simulator uses sixvariables: the GDP growth rate(s) of the United States economy (GDPUS), the importsgrowth rate(s) of the United States from these four economies (M), the foreign directinvestment growth rate(s) (FDI) from the United States to these four economies andvice versa, the stock market exchange growth rate(s) between the United States andthese four economies (SM), the unemployment growth rate(s) from these foureconomies (UE) and finally the poverty growth rate(s) of these four economies (P).Each sub-axis is multiplied by a coefficient that is called the level of devastation of theglobal financial crisis (L).
The devastation of the global financial crisis (L) is a coefficient is a discount ratethat aids in observing the final impact of the global financial crisis in differenteconomies and the global economy. We apply partial differentiation(s) in real timebetween the GDP growth rate(s) of the U.S. and imports growth rate(s) (M) on thefirst sub-axis, GDP growth rate(s) of the U.S. and foreign direct investment growthrate(s) (FDI) on the second sub-axis, GDP growth rate(s) of the U.S. and the stockmarket exchange growth rate(s) (SM) on the third sub-axis, GDP growth rate(s) ofthe U.S. and unemployment growth rate(s) (UE) on the fourth sub-axis, GDPgrowth rate(s) of the U.S. and poverty growth rate(s) (P) on the fifth sub-axis in thesame general axis. Each partial differentiation(s) is multiplied by the level ofdevastation of the global financial crisis (L). This is to generate different scenariosunder different levels of impact of the global financial crisis on each economy in theanalysis simultaneously. At the same time, we suggest applying an exponential ofreal time ( �t+1) to join all partial differentiation(s) in each sub-axis and general axisuntil we can build a single surface. If we observe this on a large screen, it is possibleto observe a large number of surfaces (economic waves) moving like waves in thesame space and at the same time from the epicenter to the last sub-axis in the samegeneral axis.
The final objective for using the GECSE-simulator is to show differentscenarios and the impact of the global financial crisis according to the level ofdevastation of the global financial crisis (L). Now it is possible to visualize thenegative effects of a global financial crisis from a global perspective. Hence,this simulator permits the representation of different scenarios and effects of theglobal financial crisis on the world economy within the same graphical space and time(see Figure 3).

272 Mario Arturo Ruiz Estrada
�t+1 E1 = [�GDPUSi/�M1
i]*Lj > [�GDPUSi /�FDI1
i]*Lj> [�GDPUSi/�SM1
i]*Lj > [�GDPUSi/�UE1
i]* Lj
> [�GDPUSi/�P1
i]*Lj
E2= [�GDPUSi/�M2
i]*Lj> [�GDPUSi /�FDI2
i]*Lj> [�GDPUSi/�SM2
i]*Lj> [�GDPUSi/�UE2
i]*Lj
> [�GDPUSi /�P2
i]*Lj
s= E3= [�GDPUSi/�M3
i ]*Lj> [�GDPUSi /�FDI3
i]*Lj> [�GDPUSi /�SM3
i]*Lj> [�GDPUSi /�UE3
i]*Lj
> [�GDPUSi /�P3
i]*Lj
E4= [�GDPUSi /�M4
i]*Lj> [�GDPUSi /�FDI4
i ]*Lj> [�GDPUSi/�SM4
i]*Lj> [�GDPUSi /�UE4
i]*Lj
> [�GDPUSi/�P4
i]*Lj
(2)
Figure 2The GECSE-Simulator: Graphical Modeling
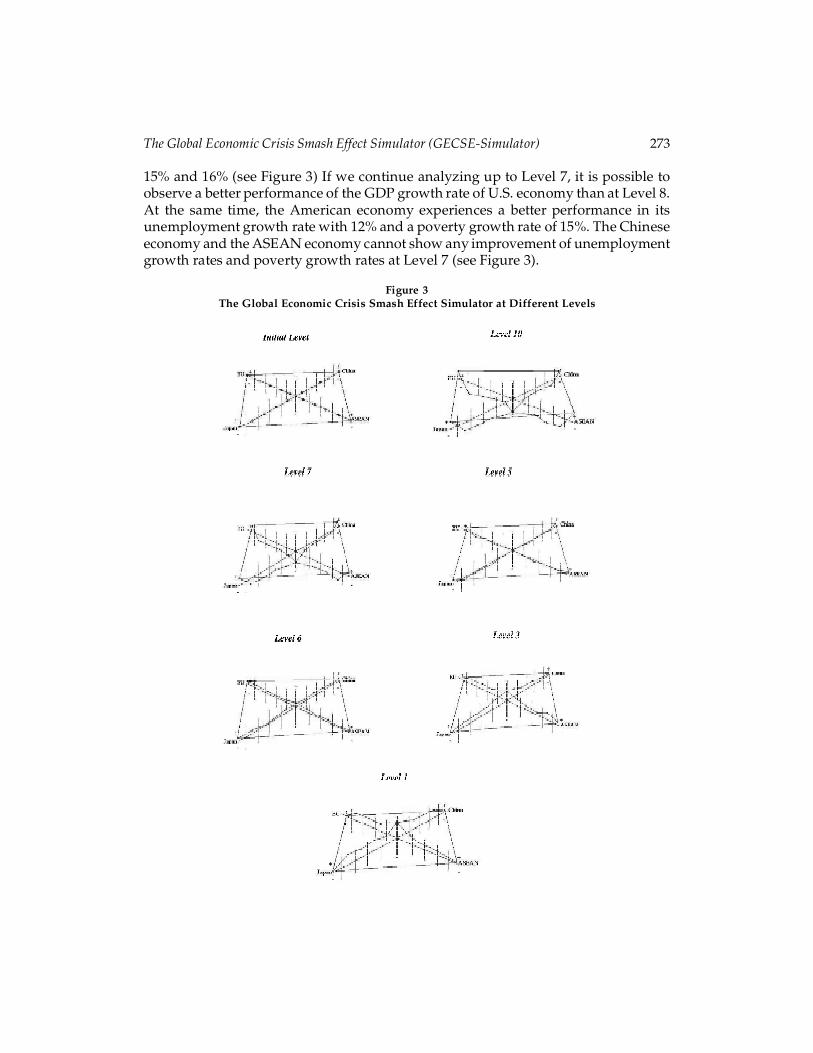
The level of devastation of the global financial crisis (L) is classified into ten levels,from Level 1 (low impact) to Level 10 (high impact). We observe in Figure 3 that aLevel 10 impact is the highest level of devastation brought about by the globalfinancial crisis on the world economy. We can also observe that the levels ofunemployment growth rates among the four economies in analysis such as theASEAN economy (E1), Chinese economy (E2), European economy (E3) and Japaneseeconomy (E4) are located between 15% to 20% and the poverty growth rates arelocated between 20% and 25%; both indicators show the higher levels ofunemployment and poverty rates in case of a deep global financial crisis. Theeconomies which are more affected by the global financial crisis at Level 10 are theEuropean economy and the Japanese economy. This is due to the strong trade andinvestment relationship that exists between them and the American economyaccording to the GECSE-Simulator. The Chinese economy and ASEAN economyshow large amounts of unemployment and poverty but this is proportionately lessthan the European economy and the Japanese economy. In the case of the Chineseeconomy and ASEAN economy, the unemployment growth rates are located between9% and 11% respectively, but the poverty growth rates for both economies is equal to
The Global Economic Crisis Smash Effect Simulator (GECSE-Simulator) 273
15% and 16% (see Figure 3) If we continue analyzing up to Level 7, it is possible toobserve a better performance of the GDP growth rate of U.S. economy than at Level 8.At the same time, the American economy experiences a better performance in itsunemployment growth rate with 12% and a poverty growth rate of 15%. The Chineseeconomy and the ASEAN economy cannot show any improvement of unemploymentgrowth rates and poverty growth rates at Level 7 (see Figure 3).
Figure 3The Global Economic Crisis Smash Effect Simulator at Different Levels

274 Mario Arturo Ruiz Estrada
At Level 5, it is possible to observe that the GDP growth rate of the U.S. economyis equal to 0. But the unemployment growth rate of the U.S. is equal to 8% and thepoverty growth rate of the U.S. economy is 13%. Level 5 also shows a minimumimpact on the European economy and Japanese economy with insignificantreductions in the unemployment and poverty growth rates located between 15%and 17%. But in the case of the ASEAN economy and Chinese economy theimpact is less because the unemployment and poverty growth rates only show 10%and 15%. We can say that the European economy and Japanese economy havea high dependence upon the good performance of the GDP growth rate of the U.S.economy than upon the Chinese and ASEAN economies (see Figure 3). According tothe simulation, Level 6 shows a positive but weak GDP growth rate of the U.S.economy: the levels of unemployment and poverty growth rates in the Americaneconomy show a better performance, but are only a little higher, with 7% forunemployment growth rates and 11% for poverty growth rates. The Chineseeconomy and ASEAN economy show a better performance than beforebut the unemployment growth rates only decrease from 10% to 8% respectively(see Figure 3).
Finally, the simulation at Level 3 and Level 0 show the lowest devastation ratesof the global financial crisis on the world economy. These levels are exceptional buthard to be aspired to by the American economy because we are referring to a hugeexpansion of the GDP growth rates, i.e. between 11% and 15%, annually. And thefinal impact of a huge expansion of the GDP growth rate of the U.S. economy on theEuropean economy and Japanese economy can reduce its unemployment growthrates to between 0.5% and 1.5% and the poverty growth rate to levels of 5%. We canobserve that among the four economies mentioned, those who receive the mostbenefit from a higher performance of the GDP growth rate of the U.S. economy are,in order, the European economy, Japanese economy, Chinese economy and theASEAN economy respectively. Under Level 3 and Level 0, both the Chineseeconomy and the ASEAN economy can decrease their unemployment growth ratesto between 3% and 5%, but the level of poverty growth rates in the Chineseeconomy and ASEAN economy can only decrease from 12% to 7% (see Figure 3)according to this simulation.
3. CONCLUDING REMARKS
This paper offers policy makers, central banks, academics and students of economicsan alternative multi-dimensional graphical modeling approach to analyze the finalimpact of a global financial crisis from a multi-dimensional perspective. The GECSE-simulator can generate a large number of scenarios originating from a global financialcrisis, according to the level of devastation of the global financial crisis (L) coefficient.The main objective of this is to create different simulations and measure thecatastrophic(s) effect(s) of any global financial crisis upon the world economy withinthe same graphical space.

The Global Economic Crisis Smash Effect Simulator (GECSE-Simulator) 275
REFERENCES
Printed SourcesRuiz Estrada, M.A., Yap, S.F. and Nagaraj, S. (2008), “Beyond the Ceteris Paribus Assumption:
Modeling Demand and Supply Assuming Omnia Mobilis”, International Journal ofEconomic Research (IJER), 5(2), pp. 185-194.
Ruiz Estrada, M.A. (2009), “The Economic Waves Effect of the U.S. Economy on the WorldEconomy”, FEA-Working Paper No. 2009-2, pp. 1-5.
Ruiz Estrada, M. A. (2009), “Multi-dimensional Economic Modeling”, FEA-Working PaperNo. 2009-7, pp. 1-10.
Electronic SourcesASEAN (2009), General Information and Database Statistics.http: www.aseansec.orgAsian Development Bank (2009), General Information and Database Statistics. http://www.adb.orgEuropean Union (2009), General Information and Database Statistics. http://www.europa.eu.intInternational Monetary Found (2009), General Information and Database Statistics. http://
www.imf.orgNBER (2009), National Bureau Economic Research. http://www.nber.orgThe Federal Reserves System (2009), General Information and Database Statistics. http://
www.federalreserve.gov/pf/pf.htmlUnited Nations (2009), General Information and Database Statistics. http://www.un.orgWorld Bank (2009), General Information and Database Statistics. http://www.worldbank.org