Variations in upper crustal structure due to variable mantle temperature along the Southeast Indian...
21
Variations in upper crustal structure due to variable mantle temperature along the Southeast Indian Ridge Janet M. Baran, James R. Cochran, Suzanne M. Carbotte, and Mladen R. Nedimovic ´ Lamont-Doherty Earth Observatory of Columbia University, 61 Route 9W, Palisades, New York 10964, USA ([email protected]) [1] There is a systematic variation in axial morphology and axial depth along the Southeast Indian Ridge (SEIR) with distance away from the Australian Antarctic Discordance, an area of cold uppermost mantle. Since spreading rate (72–76 mm/yr) and mantle geochemistry appear constant along this portion of the SEIR, the observed variations in axial morphology and axial depth are attributed to a gradient in mantle temperature. In this study, we report results from a multichannel seismic investigation of on-axis crustal structure along this portion of the SEIR. Three distinct forms of ridge crest morphology are found within our study area: axial highs, rifted axial highs, and shallow axial valleys. Axial highs have a shallow (1500 m below seafloor (bsf)) magma lens and a thin (300 m) layer 2A along the ridge crest. Rifted axial highs have a deeper (2100 m bsf) magma lens and thicker (450 m) layer 2A on-axis. Beneath shallow axial valleys, no magma lens is imaged, and layer 2A is thick (450 + m). There are step-like transitions in magma lens depth and layer 2A thickness with changes in morphology along the SEIR. The transitions between the different modes of axial morphology and shallow structure are abrupt, suggesting a threshold-type mechanism. Variations in crustal structure along the SEIR appear to be steady state, persisting for at least 1 m.y. Portions of segments in which a magma lens is found are characterized by lower relief abyssal hills on the ridge flank, shallower ridge flank depths, and at the location of along-axis Mantle Bouguer Anomaly (MBA) lows. The long-wavelength variation in ridge morphology along the SEIR from axial high segments to the west to axial valley segments to the east is linked to the regional gradient in mantle temperature. Superimposed on the long-wavelength trend are segment to segment variations that are related to the absolute motion of the SEIR to the northeast which influence mantle melt production and delivery to the ridge. Components: 10,963 words, 9 figures. Keywords: Layer 2A; magma chambers; mid-ocean ridge processes; Southeast Indian Ridge. Index Terms: 3025 Marine Geology and Geophysics: Marine seismics (0935, 7294); 3035 Marine Geology and Geophysics: Midocean ridge processes; 3045 Marine Geology and Geophysics: Seafloor morphology, geology, and geophysics. Received 18 February 2005; Revised 21 July 2005; Accepted 2 September 2005; Published 4 November 2005. Baran, J. M., J. R. Cochran, S. M. Carbotte, and M. R. Nedimovic ´ (2005), Variations in upper crustal structure due to variable mantle temperature along the Southeast Indian Ridge, Geochem. Geophys. Geosyst., 6, Q11002, doi:10.1029/ 2005GC000943. 1. Introduction [2] The worldwide system of mid-ocean ridges shows a systematic pattern of morphological and structural characteristics that has been related to spreading rate. Fast spreading ridges are character- ized by axial highs, low-relief abyssal hills, magma lenses at shallow depths in the crust, and thin layer 2A at the ridge-axis that thickens off-axis [e.g., Menard, 1960; MacDonald, 1989; Detrick et al., 1987, 1993; Christeson et al., 1996; Hooft et al., 1996]. Slow spreading ridges are characterized G 3 G 3 Geochemistry Geophysics Geosystems Published by AGU and the Geochemical Society AN ELECTRONIC JOURNAL OF THE EARTH SCIENCES Geochemistry Geophysics Geosystems Article Volume 6, Number 11 4 November 2005 Q11002, doi:10.1029/2005GC000943 ISSN: 1525-2027 Copyright 2005 by the American Geophysical Union 1 of 21
Transcript of Variations in upper crustal structure due to variable mantle temperature along the Southeast Indian...
Variations in upper crustal structure due to variable mantletemperature along the Southeast Indian Ridge
Janet M. Baran, James R. Cochran, Suzanne M. Carbotte, and Mladen R. NedimovicLamont-Doherty Earth Observatory of Columbia University, 61 Route 9W, Palisades, New York 10964, USA([email protected])
[1] There is a systematic variation in axial morphology and axial depth along the Southeast Indian Ridge(SEIR) with distance away from the Australian Antarctic Discordance, an area of cold uppermost mantle.Since spreading rate (72–76 mm/yr) and mantle geochemistry appear constant along this portion of theSEIR, the observed variations in axial morphology and axial depth are attributed to a gradient in mantletemperature. In this study, we report results from a multichannel seismic investigation of on-axis crustalstructure along this portion of the SEIR. Three distinct forms of ridge crest morphology are found withinour study area: axial highs, rifted axial highs, and shallow axial valleys. Axial highs have a shallow(�1500 m below seafloor (bsf)) magma lens and a thin (�300 m) layer 2A along the ridge crest. Riftedaxial highs have a deeper (�2100 m bsf) magma lens and thicker (�450 m) layer 2A on-axis. Beneathshallow axial valleys, no magma lens is imaged, and layer 2A is thick (�450 + m). There are step-liketransitions in magma lens depth and layer 2A thickness with changes in morphology along the SEIR. Thetransitions between the different modes of axial morphology and shallow structure are abrupt, suggesting athreshold-type mechanism. Variations in crustal structure along the SEIR appear to be steady state,persisting for at least 1 m.y. Portions of segments in which a magma lens is found are characterized bylower relief abyssal hills on the ridge flank, shallower ridge flank depths, and at the location of along-axisMantle Bouguer Anomaly (MBA) lows. The long-wavelength variation in ridge morphology along theSEIR from axial high segments to the west to axial valley segments to the east is linked to the regionalgradient in mantle temperature. Superimposed on the long-wavelength trend are segment to segmentvariations that are related to the absolute motion of the SEIR to the northeast which influence mantle meltproduction and delivery to the ridge.
Components: 10,963 words, 9 figures.
Keywords: Layer 2A; magma chambers; mid-ocean ridge processes; Southeast Indian Ridge.
Index Terms: 3025 Marine Geology and Geophysics: Marine seismics (0935, 7294); 3035 Marine Geology and
Geophysics: Midocean ridge processes; 3045 Marine Geology and Geophysics: Seafloor morphology, geology, and
geophysics.
Received 18 February 2005; Revised 21 July 2005; Accepted 2 September 2005; Published 4 November 2005.
Baran, J. M., J. R. Cochran, S. M. Carbotte, and M. R. Nedimovic (2005), Variations in upper crustal structure due to
variable mantle temperature along the Southeast Indian Ridge, Geochem. Geophys. Geosyst., 6, Q11002, doi:10.1029/
2005GC000943.
1. Introduction
[2] The worldwide system of mid-ocean ridgesshows a systematic pattern of morphological andstructural characteristics that has been related tospreading rate. Fast spreading ridges are character-
ized by axial highs, low-relief abyssal hills, magmalenses at shallow depths in the crust, and thinlayer 2A at the ridge-axis that thickens off-axis[e.g., Menard, 1960; MacDonald, 1989; Detrick etal., 1987, 1993; Christeson et al., 1996; Hooft etal., 1996]. Slow spreading ridges are characterized
G3G3GeochemistryGeophysics
Geosystems
Published by AGU and the Geochemical Society
AN ELECTRONIC JOURNAL OF THE EARTH SCIENCES
GeochemistryGeophysics
Geosystems
Article
Volume 6, Number 11
4 November 2005
Q11002, doi:10.1029/2005GC000943
ISSN: 1525-2027
Copyright 2005 by the American Geophysical Union 1 of 21
by axial valleys, large abyssal hills, and thick on-axis layer 2A that does not thicken off-axis [e.g.,Heezen, 1960; MacDonald, 1986; Hussenoeder etal., 2002]. No magma lens has been conclusivelyimaged to date at a ridge with a well-developedaxial valley [Detrick et al., 1990; Calvert, 1995,1997] although a zone of low seismic velocitiespresumably associated with melt within the crusthas been detected deeper in the crust than at fastspreading ridges [Canales et al., 2000].
[3] Phipps Morgan and Chen [1993] presented amodel for crustal accretion in which the thermalstructure at the ridge axis is governed by thebalance between heat input to the crust throughmagma injection and heat removal through hydro-thermal circulation. This model predicts that themagma lens will become deeper with decreasingspreading rate. Purdy et al. [1992] have presentedobservations that suggest a systematic relationshipbetween spreading rate, and magma lens depthsupporting a Phipps Morgan and Chen [1993] typemodel. At a given spreading rate, the PhippsMorgan and Chen [1993] model is very sensitiveto magma supply to the crust (crustal thickness)because of the critical role that the latent heat ofcrystallization plays in maintaining the magmalens.
[4] The morphology and crustal structure observedat fast spreading and at slow-spreading ridge axesrepresent two very different and distinct modes ofridge axis structure. It is of importance in under-standing ridge axis processes to determine how andunder what circumstances one mode passes into theother. Acquiring this knowledge requires examina-tion of intermediate spreading rate ridges. Ridgeaxis morphology at intermediate ridges is found torange from axial highs to axial valleys and includesmorphologies that are transitional between thesetwo end-members. Intermediate spreading ridgesthus present an opportunity to examine the natureof the transition between different forms of mor-phology and the sensitivity of ridge structure tosmall changes in parameters such as spreadingrates, melt supply and mantle temperature.
[5] The Southeast Indian Ridge (SEIR) is an inter-mediate spreading ridge (55–76 mm/yr) that dis-plays both axial high and axial valley morphologies[Small and Sandwell, 1989; Malinverno, 1993;Small, 1994; Ma and Cochran, 1996]. In our studyarea, from 100�E to 112�E, spreading rate variesbetween 72–76 mm/yr, and the axial morphologyvaries from axial highs to axial valleys. Thesevariations in morphology have been interpreted as
due to changes in the magma supply (caused byvariations in mantle temperature) [Cochran et al.,1997; Sempere et al., 1997]. The SEIR thuspresents an ideal spreading center to study therelationship between changes in shallow crustalstructure and magma supply at a ridge where itappears that only mantle temperature varies alongthe axis. We conducted a multichannel seismicsurvey between 100�E–112�E to image the shallowcrustal structure of the SEIR ridge axis and flanks.In this paper we investigate variations in shallowcrustal structure (magma lens and layer 2A) alongthe SEIR axis and how changes in axial morphol-ogy, Mantle Bouguer Anomaly (MBA), ridge flankdepth and abyssal hill relief relate to variations inthe depth and distribution of magma lenses detectedin reflection seismic data, and the thickness andgeometry of seismic layer 2A. By studying theSEIR, we can assess the effects of changes inmantle temperature on crustal structure independentof chemical variation and spreading rate.
2. Tectonic Setting
[6] The SEIR is the boundary between the Austra-lian and Antarctic plates, extending from theRodriguez Triple Junction, located east of Mada-gascar at 25�S, 70�E to the Macquarie TripleJunction south of New Zealand at 63�S, 165�E.Our study area between 47�S, 100�E and 50�S,112�E (Figure 1) is at the equator to the openingpole and as a result the spreading rate only variesby a few mm/yr through the entire region. Thespreading center in this region has had a spreadingrate of �72 mm/yr since the Oligocene [Royer andSandwell, 1989; Demets et al., 1994].
[7] Two hot spots located to the west of our studyarea have been suggested to influence mantletemperature along the SEIR [Mahoney et al.,2002]. Amsterdam-St. Paul is a weak near-axishot spot located at �77.5�–78.5�E [Conder etal., 2000]. The Kerguelen and Heard hot spotgroup (46�S, 65�E to 64�S, 85�E) is situatedapproximately 1500 km south of the SEIR, buthas been argued to feed material to the ridge axisnear 84�E [Small, 1995; Ma and Cochran, 1996;Yale and Phipps Morgan, 1998].
[8] The Australian-Antarctic Discordance (AAD)(120�E–129�E) is located to the east of the studyarea. It is a very deep area with rough topographyand a well-developed rift valley [Palmer et al.,1993; Christie et al., 1998] that has been inter-preted as an area of cold asthenospheric conver-
GeochemistryGeophysicsGeosystems G3G3
baran et al.: southeast indian ridge crustal structure 10.1029/2005GC000943
2 of 21
gence [Weissel and Hayes, 1974; West et al., 1994,1997; Klein et al., 1988]. This interpretation issupported by shear wave studies that reveal fasterthan normal velocities indicative of a colder thannormal mantle [Forsyth et al., 1987]. Gravity datasuggests a thin crust and low mantle temperatureswithin the AAD [West et al., 1994]. These infer-ences are consistent with seismic refraction results,which indicate a crustal thickness of only 4.2 km[Tolstoy et al., 1995]. Within the AAD, Fe and Siabundances suggest a shallow solidus depth, fur-ther supporting a colder mantle source [Klein et al.,1991; Pyle, 1994]. Within the AAD, there is anisotopic boundary near 126�E interpreted as aboundary between Indian Ocean and Pacific Oceangeochemical provinces [Klein et al., 1988; Pyle,1994].
3. Morphology of the SEIR
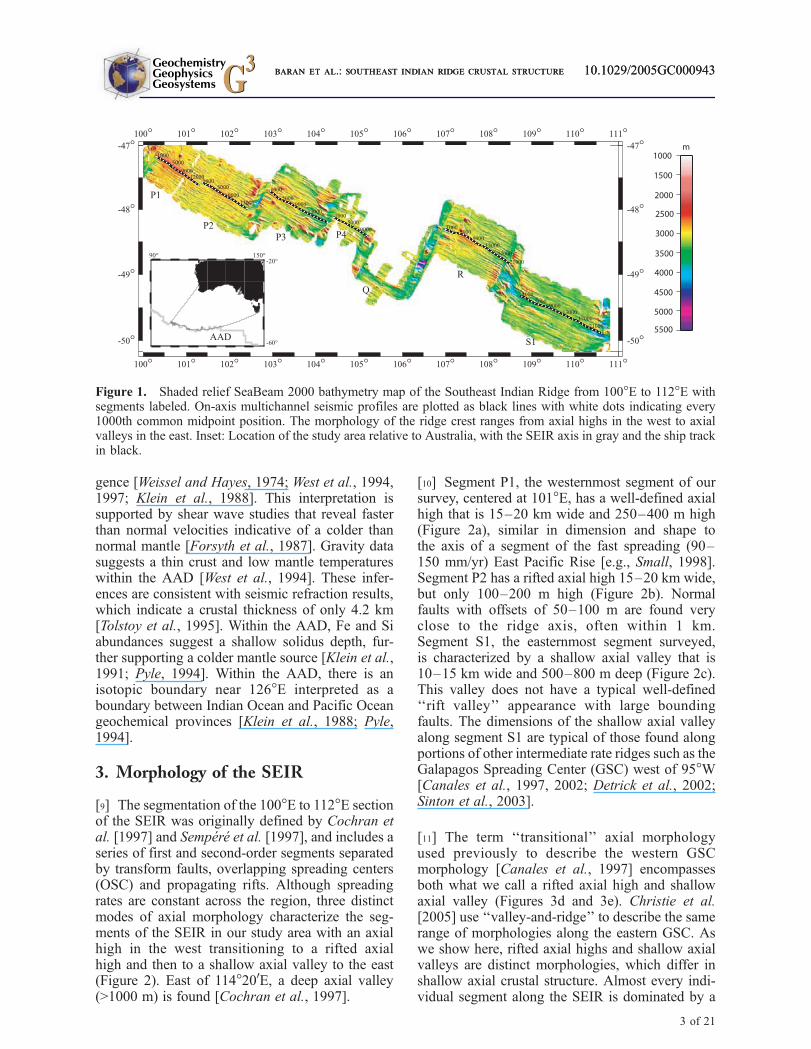
[9] The segmentation of the 100�E to 112�E sectionof the SEIR was originally defined by Cochran etal. [1997] and Sempere et al. [1997], and includes aseries of first and second-order segments separatedby transform faults, overlapping spreading centers(OSC) and propagating rifts. Although spreadingrates are constant across the region, three distinctmodes of axial morphology characterize the seg-ments of the SEIR in our study area with an axialhigh in the west transitioning to a rifted axialhigh and then to a shallow axial valley to the east(Figure 2). East of 114�200E, a deep axial valley(>1000 m) is found [Cochran et al., 1997].
[10] Segment P1, the westernmost segment of oursurvey, centered at 101�E, has a well-defined axialhigh that is 15–20 km wide and 250–400 m high(Figure 2a), similar in dimension and shape tothe axis of a segment of the fast spreading (90–150 mm/yr) East Pacific Rise [e.g., Small, 1998].Segment P2 has a rifted axial high 15–20 km wide,but only 100–200 m high (Figure 2b). Normalfaults with offsets of 50–100 m are found veryclose to the ridge axis, often within 1 km.Segment S1, the easternmost segment surveyed,is characterized by a shallow axial valley that is10–15 km wide and 500–800 m deep (Figure 2c).This valley does not have a typical well-defined‘‘rift valley’’ appearance with large boundingfaults. The dimensions of the shallow axial valleyalong segment S1 are typical of those found alongportions of other intermediate rate ridges such as theGalapagos Spreading Center (GSC) west of 95�W[Canales et al., 1997, 2002; Detrick et al., 2002;Sinton et al., 2003].
[11] The term ‘‘transitional’’ axial morphologyused previously to describe the western GSCmorphology [Canales et al., 1997] encompassesboth what we call a rifted axial high and shallowaxial valley (Figures 3d and 3e). Christie et al.[2005] use ‘‘valley-and-ridge’’ to describe the samerange of morphologies along the eastern GSC. Aswe show here, rifted axial highs and shallow axialvalleys are distinct morphologies, which differ inshallow axial crustal structure. Almost every indi-vidual segment along the SEIR is dominated by a
Figure 1. Shaded relief SeaBeam 2000 bathymetry map of the Southeast Indian Ridge from 100�E to 112�E withsegments labeled. On-axis multichannel seismic profiles are plotted as black lines with white dots indicating every1000th common midpoint position. The morphology of the ridge crest ranges from axial highs in the west to axialvalleys in the east. Inset: Location of the study area relative to Australia, with the SEIR axis in gray and the ship trackin black.
GeochemistryGeophysicsGeosystems G3G3
baran et al.: southeast indian ridge crustal structure 10.1029/2005GC000943baran et al.: southeast indian ridge crustal structure 10.1029/2005GC000943
3 of 21
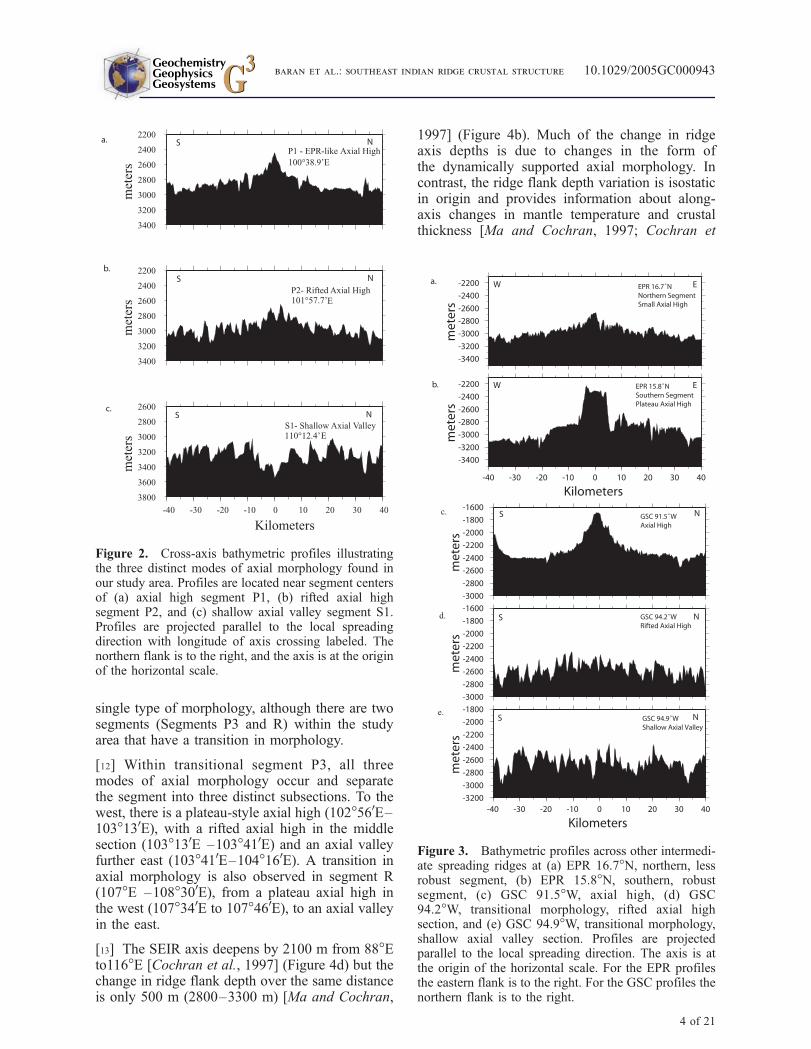
single type of morphology, although there are twosegments (Segments P3 and R) within the studyarea that have a transition in morphology.
[12] Within transitional segment P3, all threemodes of axial morphology occur and separatethe segment into three distinct subsections. To thewest, there is a plateau-style axial high (102�560E–103�130E), with a rifted axial high in the middlesection (103�130E –103�410E) and an axial valleyfurther east (103�410E–104�160E). A transition inaxial morphology is also observed in segment R(107�E –108�300E), from a plateau axial high inthe west (107�340E to 107�460E), to an axial valleyin the east.
[13] The SEIR axis deepens by 2100 m from 88�Eto116�E [Cochran et al., 1997] (Figure 4d) but thechange in ridge flank depth over the same distanceis only 500 m (2800–3300 m) [Ma and Cochran,
1997] (Figure 4b). Much of the change in ridgeaxis depths is due to changes in the form ofthe dynamically supported axial morphology. Incontrast, the ridge flank depth variation is isostaticin origin and provides information about along-axis changes in mantle temperature and crustalthickness [Ma and Cochran, 1997; Cochran et
Figure 2. Cross-axis bathymetric profiles illustratingthe three distinct modes of axial morphology found inour study area. Profiles are located near segment centersof (a) axial high segment P1, (b) rifted axial highsegment P2, and (c) shallow axial valley segment S1.Profiles are projected parallel to the local spreadingdirection with longitude of axis crossing labeled. Thenorthern flank is to the right, and the axis is at the originof the horizontal scale.
Figure 3. Bathymetric profiles across other intermedi-ate spreading ridges at (a) EPR 16.7�N, northern, lessrobust segment, (b) EPR 15.8�N, southern, robustsegment, (c) GSC 91.5�W, axial high, (d) GSC94.2�W, transitional morphology, rifted axial highsection, and (e) GSC 94.9�W, transitional morphology,shallow axial valley section. Profiles are projectedparallel to the local spreading direction. The axis is atthe origin of the horizontal scale. For the EPR profilesthe eastern flank is to the right. For the GSC profiles thenorthern flank is to the right.
GeochemistryGeophysicsGeosystems G3G3
baran et al.: southeast indian ridge crustal structure 10.1029/2005GC000943
4 of 21
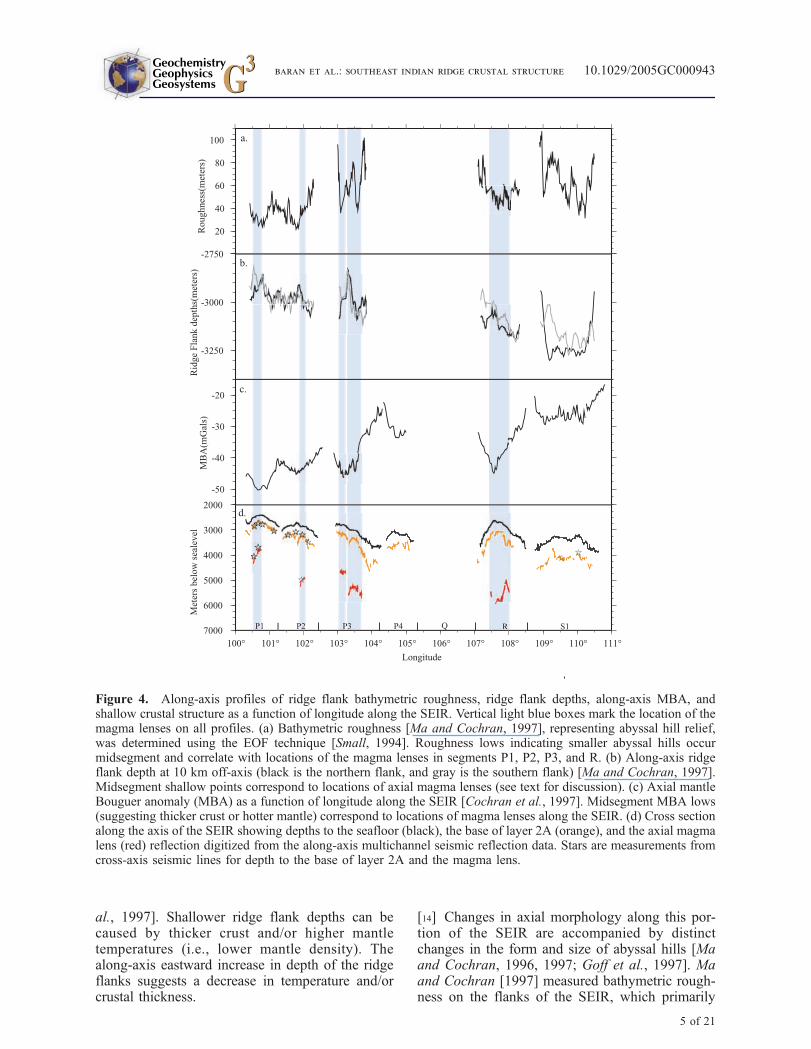
al., 1997]. Shallower ridge flank depths can becaused by thicker crust and/or higher mantletemperatures (i.e., lower mantle density). Thealong-axis eastward increase in depth of the ridgeflanks suggests a decrease in temperature and/orcrustal thickness.
[14] Changes in axial morphology along this por-tion of the SEIR are accompanied by distinctchanges in the form and size of abyssal hills [Maand Cochran, 1996, 1997; Goff et al., 1997]. Maand Cochran [1997] measured bathymetric rough-ness on the flanks of the SEIR, which primarily
Figure 4. Along-axis profiles of ridge flank bathymetric roughness, ridge flank depths, along-axis MBA, andshallow crustal structure as a function of longitude along the SEIR. Vertical light blue boxes mark the location of themagma lenses on all profiles. (a) Bathymetric roughness [Ma and Cochran, 1997], representing abyssal hill relief,was determined using the EOF technique [Small, 1994]. Roughness lows indicating smaller abyssal hills occurmidsegment and correlate with locations of the magma lenses in segments P1, P2, P3, and R. (b) Along-axis ridgeflank depth at 10 km off-axis (black is the northern flank, and gray is the southern flank) [Ma and Cochran, 1997].Midsegment shallow points correspond to locations of axial magma lenses (see text for discussion). (c) Axial mantleBouguer anomaly (MBA) as a function of longitude along the SEIR [Cochran et al., 1997]. Midsegment MBA lows(suggesting thicker crust or hotter mantle) correspond to locations of magma lenses along the SEIR. (d) Cross sectionalong the axis of the SEIR showing depths to the seafloor (black), the base of layer 2A (orange), and the axial magmalens (red) reflection digitized from the along-axis multichannel seismic reflection data. Stars are measurements fromcross-axis seismic lines for depth to the base of layer 2A and the magma lens.
GeochemistryGeophysicsGeosystems G3G3
baran et al.: southeast indian ridge crustal structure 10.1029/2005GC000943
5 of 21
reflects abyssal hill height. They found lowerbathymetric roughness (lower relief abyssal hills)associated with axial high segments and higherroughness (larger abyssal hills) at axial valleysegments.
[15] A pronounced west to east regional increase inMBA gravity anomalies occurs along the SEIRfrom ��65 mGals at 88�E to ��40 mGals at103�E at the western end of segment P3 [Cochranet al., 1997] (Figure 4c). There is a sharp 10 mGalstep in MBAwithin segment P3. To the east of thissegment, axial MBA increase more gradually to�17 mGals in segment S1 at 112�E [Cochran etal., 1997]. Since spreading rates and mantle sourceare both nearly constant along our study area[Royer and Sandwell, 1989; Mahoney et al.,2002], Cochran and Sempere [1997] and Sempereet al. [1997] attribute the regional gradients indepth and gravity to a gradient in mantle temper-ature from hotter in the west to cooler in the east.The changes in gravity and depth between 88�Eand 116�E can be explained by a west to eastdecrease in crustal thickness of 1.7–2.4 km, or a55–100�C decrease in mantle temperature or somecombination of the two [Cochran et al., 1997].
4. Methods
[16] During December 2001 and January 2002, amultichannel seismic (MCS) survey was conductedfrom the R/V Maurice Ewing along the SEIRfrom 100�E to 112�E (Figure 1). The experimentconsisted of detailed seismic reflection surveyswith both on-axis and cross-axis (extending�50 km away from the ridge axis) profiles withinsegments P1, P2, and S1. Additional on-axisseismic reflection profiles were collected alongsegments P3, P4, and R during transits betweenthe main survey areas.
[17] Seismic reflection data were collected using a6 km-long digital hydrophone streamer with480 channels and a group spacing of 12.5 m. Theseismic source was a tuned 10-gun, 3050 in3 arraythat was towed at a depth of 8 m. Data wererecorded at 2 ms sample rate for 12 seconds. Anominal shot interval of 50 m was used for oursurveys of segments P1, P2, and P3 and a 37.5 mshot interval was used for segments P4, R and S1.The recorded signal has a bandwidth of about 2–100 Hz. The nominal common midpoint (CMP)spacing is 6.25 m and the data trace fold is 61 forsegments P1, P2 and P3, and 81 for segments P4, Rand S1.
[18] Extremely harsh weather conditions in theSouthern Ocean resulted in a degraded signal-to-noise ratio during data acquisition, in particularduring the first part of the cruise. Furthermore,poor streamer balancing also resulted in higherlevels of streamer noise and significant imagingproblems during surveys of segments P1 and P2.
[19] Seismic data were processed using Land-mark’s ProMAX seismic data processing package.Bandpass (2–7–100–125 Hz) and f-k filters onshot gathers were applied to remove cable noiseand to improve signal-to-noise ratio. The datatraces were then amplitude normalized, decon-volved, edited and sorted to CMP gathers. Thiswas followed by velocity analysis, normal moveout(NMO) correction, stacking, f–k migration, andmild coherency filtering of the final reflectionimage. For on-axis lines semblance analysis wasused to identify two-way travel time (twtt) to themagma lens reflection. Optimal stacking velocityfunctions for the axial profiles were constructedusing the on-axis velocity solution from the EastPacific rise at 9� N [Vera et al., 1990], modified forthe observed travel times to the magma lensreflection and hung from the seafloor. On cross-axis lines, the on-axis velocity function was usedin the axial region (1000 CMPs closest to theridge axis). Farther off-axis, the stacking velocityfunction was formed using a simplified velocityfunction marking major velocity gradients inthe crust. For the sedimented areas, the stackingvelocities to the top of the igneous basementwere determined using the velocity spectrummethod.
[20] The base of layer 2A is marked by a velocitygradient that may correspond with the boundarybetween intrusives and extrusives in the oceaniccrust [Harding et al., 1993; Vera and Diebold,1994; Christeson et al., 1996]. This velocity gra-dient zone causes refracted or turning waves, thatare recorded at far source-receiver offsets (usually>1.5 km) and can be stacked. Optimal stackingvelocities for the layer 2A event are chosen frombandpass filtered (2–7–40–60 Hz) constant veloc-ity stacks confined to the far offset traces (2–4 km),along with examination of CMP gathers. As thelayer 2A event can typically be well imaged at arange of velocities, care must be taken to useconsistent criteria in choosing stacking velocities.Here we selected the lowest velocities that opti-mize the 2A event stack. The stacked section wasf–k migrated and mildly coherency filtered. A60 ms window encompassing the 2A event wasthen merged into the main migrated stack section.
GeochemistryGeophysicsGeosystems G3G3
baran et al.: southeast indian ridge crustal structure 10.1029/2005GC000943
6 of 21
By using the ‘‘pick and paste’’ method of imagingthe layer 2A arrival, the layer 2A event is optimizedbecause the image is constrained to the far offsetswhere the arrival is observed [e.g., Vera andDiebold, 1994; Carbotte et al., 2000].
[21] Two-way travel time to the layer 2A andmagma lens events were converted to depth usinga constant velocity of 3 km/s for layer 2A, and5.5 km/s for the section between the base oflayer 2A and the magma lens (layer 2B). Theseare typical crustal velocities [e.g., Vera et al., 1990;Harding et al., 1993; Hooft et al., 1996; Detrick etal., 2002] and have been confirmed through a 1-Dvelocity analysis (unpublished work). Uncertaintiesin our estimates of depth to the magma lens andlayer 2A thickness arise from picking errors, anduncertainties in stacking velocities and in velocitiesused for depth conversion. We estimate pickingerrors of ±8 ms and errors due to inaccuratestacking velocities on the order of 40 ms for thelayer 2A event. Considering the range of plausibleinterval velocities for depth conversion, we esti-mate uncertainties of ±80 m for magma lens depth,and ±100 m for layer 2A.
5. Results
[22] The magma lens and the base of layer 2Aevents were digitized for all along-axis MCSprofiles. Figure 4d shows these picks, convertedto meters below sea level. Figure 5 shows a map ofeach individual segment, with the correspondingon-axis seismic section. We report average magmalens depth and average on-axis layer 2A thicknessfor each segment in twtt and converted to depthusing the constant velocities noted earlier, andprovide the uncertainties as standard deviation.Layer 2A thicknesses for the ridge flanks arereported in twtt only.
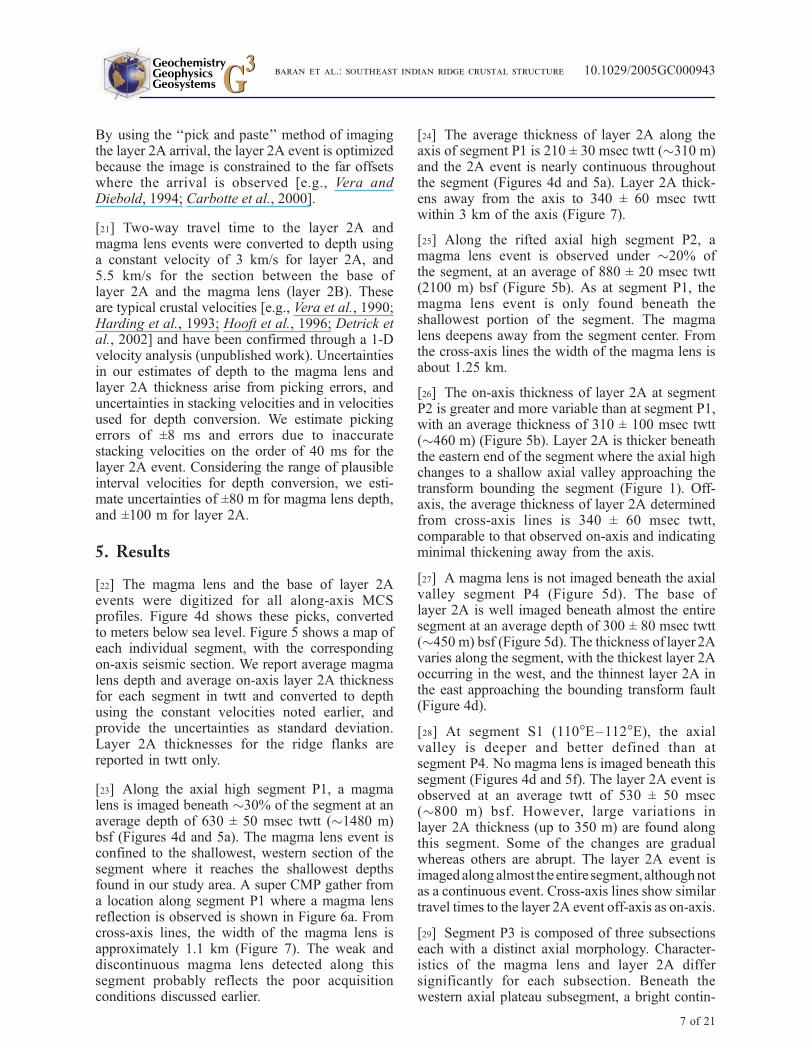
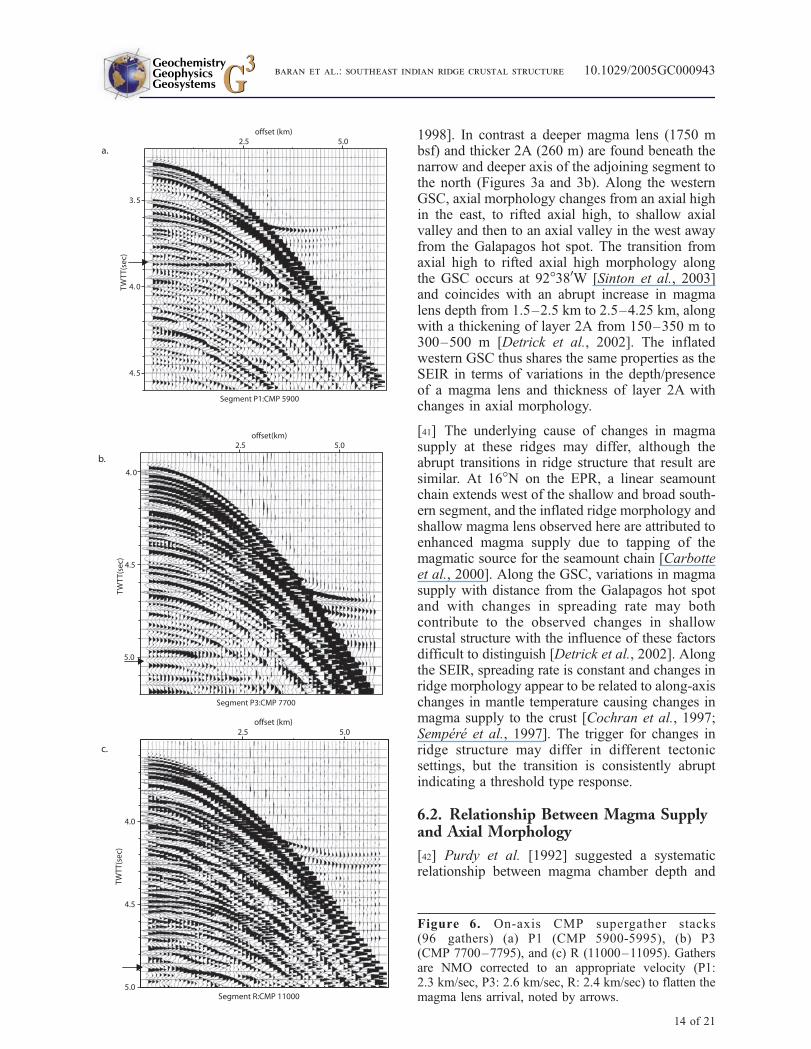
[23] Along the axial high segment P1, a magmalens is imaged beneath �30% of the segment at anaverage depth of 630 ± 50 msec twtt (�1480 m)bsf (Figures 4d and 5a). The magma lens event isconfined to the shallowest, western section of thesegment where it reaches the shallowest depthsfound in our study area. A super CMP gather froma location along segment P1 where a magma lensreflection is observed is shown in Figure 6a. Fromcross-axis lines, the width of the magma lens isapproximately 1.1 km (Figure 7). The weak anddiscontinuous magma lens detected along thissegment probably reflects the poor acquisitionconditions discussed earlier.
[24] The average thickness of layer 2A along theaxis of segment P1 is 210 ± 30 msec twtt (�310 m)and the 2A event is nearly continuous throughoutthe segment (Figures 4d and 5a). Layer 2A thick-ens away from the axis to 340 ± 60 msec twttwithin 3 km of the axis (Figure 7).
[25] Along the rifted axial high segment P2, amagma lens event is observed under �20% ofthe segment, at an average of 880 ± 20 msec twtt(2100 m) bsf (Figure 5b). As at segment P1, themagma lens event is only found beneath theshallowest portion of the segment. The magmalens deepens away from the segment center. Fromthe cross-axis lines the width of the magma lens isabout 1.25 km.
[26] The on-axis thickness of layer 2A at segmentP2 is greater and more variable than at segment P1,with an average thickness of 310 ± 100 msec twtt(�460 m) (Figure 5b). Layer 2A is thicker beneaththe eastern end of the segment where the axial highchanges to a shallow axial valley approaching thetransform bounding the segment (Figure 1). Off-axis, the average thickness of layer 2A determinedfrom cross-axis lines is 340 ± 60 msec twtt,comparable to that observed on-axis and indicatingminimal thickening away from the axis.
[27] A magma lens is not imaged beneath the axialvalley segment P4 (Figure 5d). The base oflayer 2A is well imaged beneath almost the entiresegment at an average depth of 300 ± 80 msec twtt(�450 m) bsf (Figure 5d). The thickness of layer 2Avaries along the segment, with the thickest layer 2Aoccurring in the west, and the thinnest layer 2A inthe east approaching the bounding transform fault(Figure 4d).
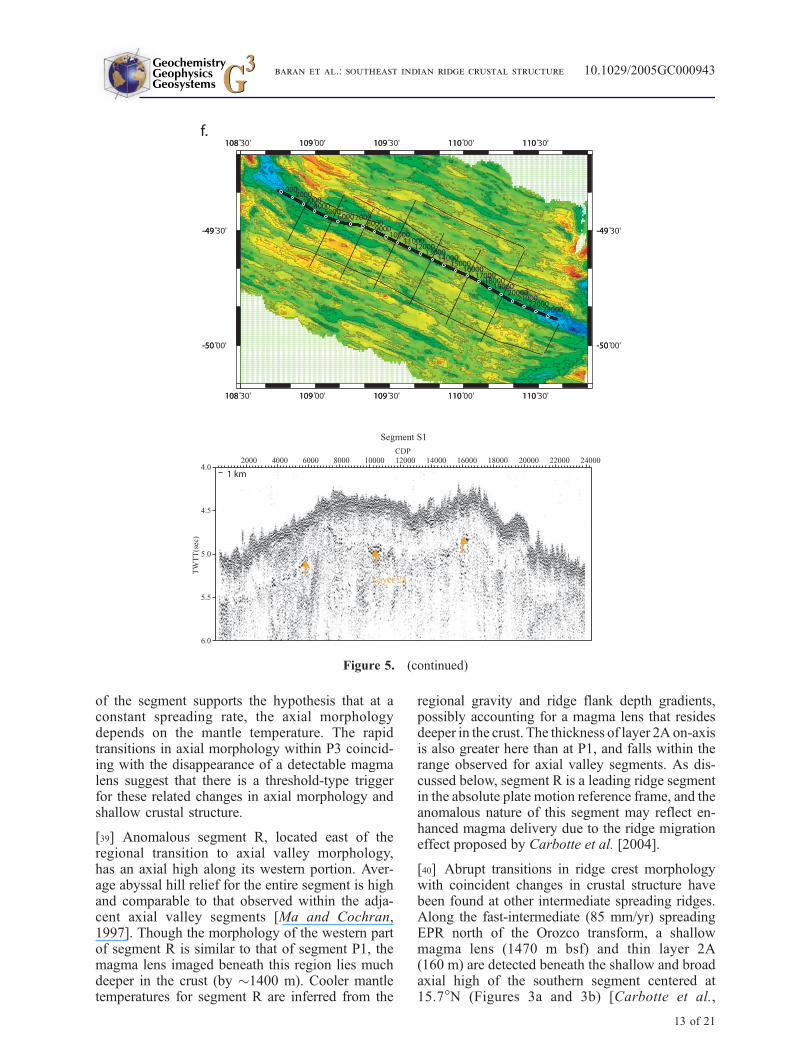
[28] At segment S1 (110�E–112�E), the axialvalley is deeper and better defined than atsegment P4. No magma lens is imaged beneath thissegment (Figures 4d and 5f). The layer 2A event isobserved at an average twtt of 530 ± 50 msec(�800 m) bsf. However, large variations inlayer 2A thickness (up to 350 m) are found alongthis segment. Some of the changes are gradualwhereas others are abrupt. The layer 2A event isimagedalongalmost theentire segment, althoughnotas a continuous event. Cross-axis lines show similartravel times to the layer 2A event off-axis as on-axis.
[29] Segment P3 is composed of three subsectionseach with a distinct axial morphology. Character-istics of the magma lens and layer 2A differsignificantly for each subsection. Beneath thewestern axial plateau subsegment, a bright contin-
GeochemistryGeophysicsGeosystems G3G3
baran et al.: southeast indian ridge crustal structure 10.1029/2005GC000943
7 of 21
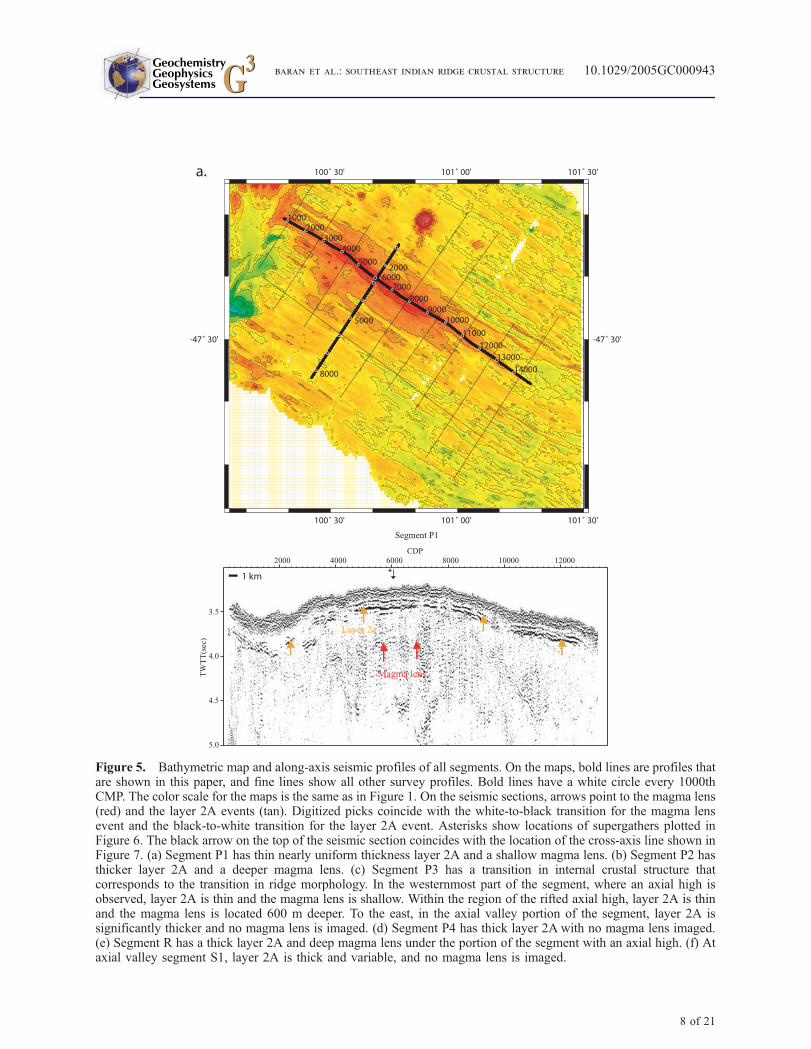
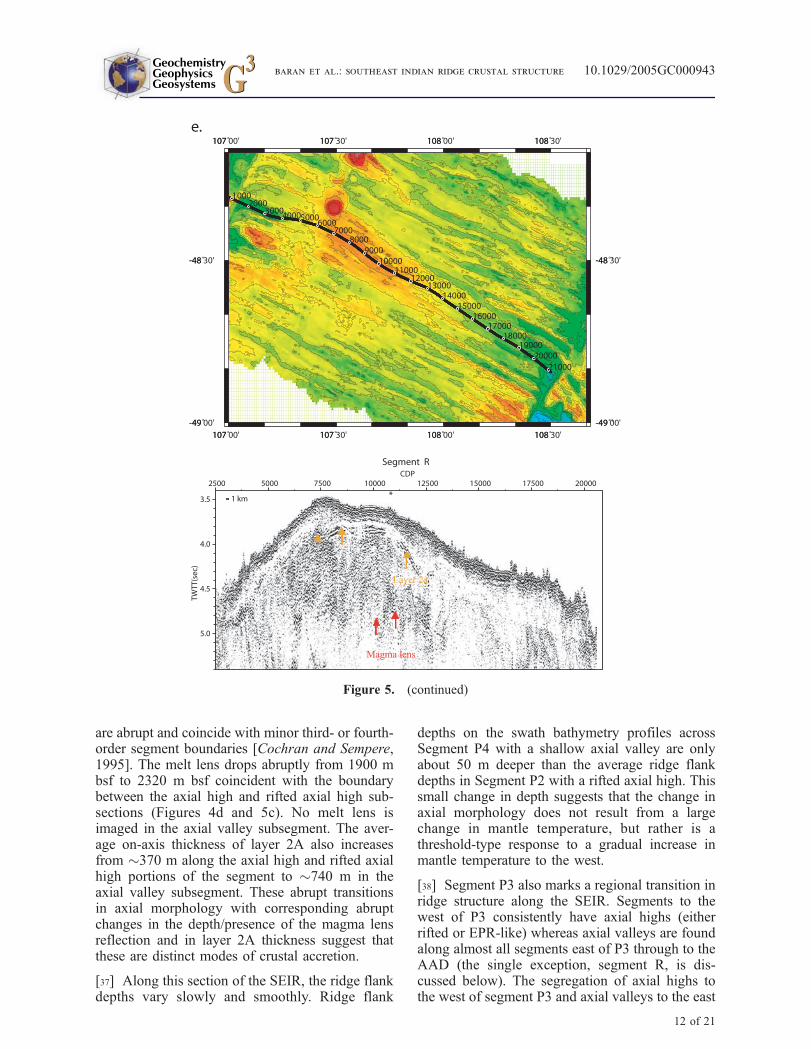
Figure 5. Bathymetric map and along-axis seismic profiles of all segments. On the maps, bold lines are profiles thatare shown in this paper, and fine lines show all other survey profiles. Bold lines have a white circle every 1000thCMP. The color scale for the maps is the same as in Figure 1. On the seismic sections, arrows point to the magma lens(red) and the layer 2A events (tan). Digitized picks coincide with the white-to-black transition for the magma lensevent and the black-to-white transition for the layer 2A event. Asterisks show locations of supergathers plotted inFigure 6. The black arrow on the top of the seismic section coincides with the location of the cross-axis line shown inFigure 7. (a) Segment P1 has thin nearly uniform thickness layer 2A and a shallow magma lens. (b) Segment P2 hasthicker layer 2A and a deeper magma lens. (c) Segment P3 has a transition in internal crustal structure thatcorresponds to the transition in ridge morphology. In the westernmost part of the segment, where an axial high isobserved, layer 2A is thin and the magma lens is shallow. Within the region of the rifted axial high, layer 2A is thinand the magma lens is located 600 m deeper. To the east, in the axial valley portion of the segment, layer 2A issignificantly thicker and no magma lens is imaged. (d) Segment P4 has thick layer 2A with no magma lens imaged.(e) Segment R has a thick layer 2A and deep magma lens under the portion of the segment with an axial high. (f) Ataxial valley segment S1, layer 2A is thick and variable, and no magma lens is imaged.
GeochemistryGeophysicsGeosystems G3G3
baran et al.: southeast indian ridge crustal structure 10.1029/2005GC000943
8 of 21
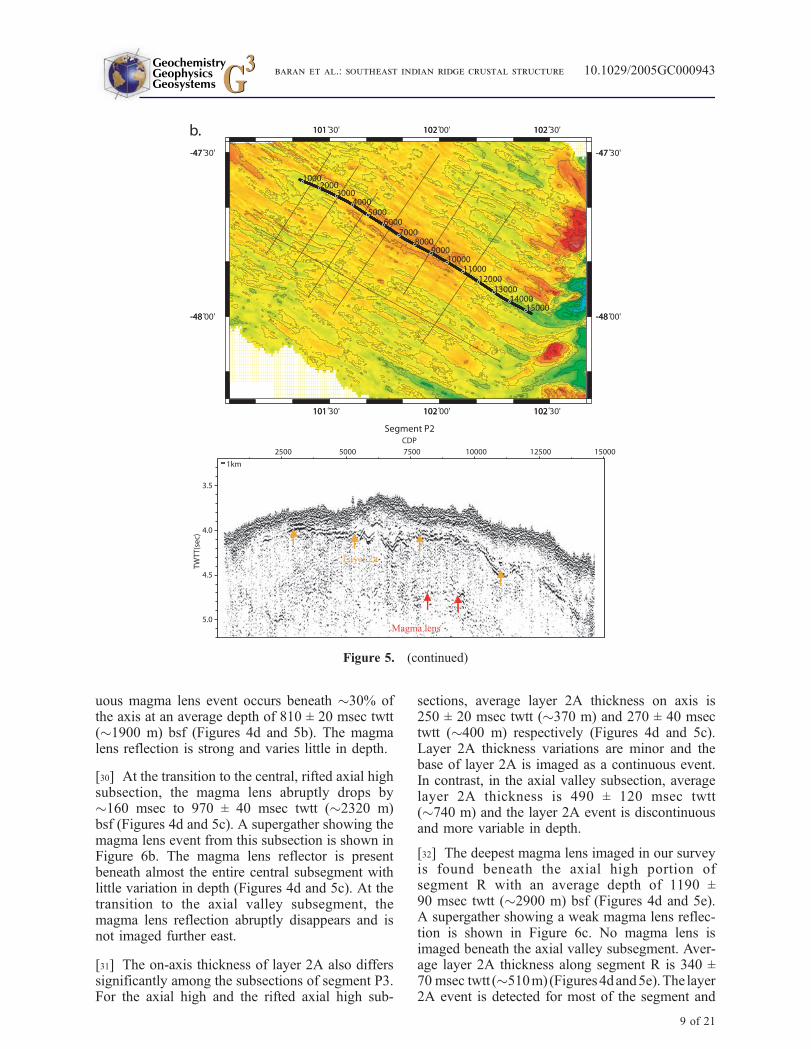
uous magma lens event occurs beneath �30% ofthe axis at an average depth of 810 ± 20 msec twtt(�1900 m) bsf (Figures 4d and 5b). The magmalens reflection is strong and varies little in depth.
[30] At the transition to the central, rifted axial highsubsection, the magma lens abruptly drops by�160 msec to 970 ± 40 msec twtt (�2320 m)bsf (Figures 4d and 5c). A supergather showing themagma lens event from this subsection is shown inFigure 6b. The magma lens reflector is presentbeneath almost the entire central subsegment withlittle variation in depth (Figures 4d and 5c). At thetransition to the axial valley subsegment, themagma lens reflection abruptly disappears and isnot imaged further east.
[31] The on-axis thickness of layer 2A also differssignificantly among the subsections of segment P3.For the axial high and the rifted axial high sub-
sections, average layer 2A thickness on axis is250 ± 20 msec twtt (�370 m) and 270 ± 40 msectwtt (�400 m) respectively (Figures 4d and 5c).Layer 2A thickness variations are minor and thebase of layer 2A is imaged as a continuous event.In contrast, in the axial valley subsection, averagelayer 2A thickness is 490 ± 120 msec twtt(�740 m) and the layer 2A event is discontinuousand more variable in depth.
[32] The deepest magma lens imaged in our surveyis found beneath the axial high portion ofsegment R with an average depth of 1190 ±90 msec twtt (�2900 m) bsf (Figures 4d and 5e).A supergather showing a weak magma lens reflec-tion is shown in Figure 6c. No magma lens isimaged beneath the axial valley subsegment. Aver-age layer 2A thickness along segment R is 340 ±70 msec twtt (�510m)(Figures4dand5e).The layer2A event is detected for most of the segment and
Figure 5. (continued)
GeochemistryGeophysicsGeosystems G3G3
baran et al.: southeast indian ridge crustal structure 10.1029/2005GC000943
9 of 21
varies little in depth but disappears at the easternmostend, where the axial valley becomes pronounced.
6. Discussion
6.1. Relationship Between CrustalStructure and Axial Morphology
6.1.1. Axial High
[33] Segment P1, with a well-developed 400 m‘‘EPR-like’’ axial high (Figures 1 and 2), has theshallowest magma lens (�1480 m bsf) of any of
the segments studied and the thinnest on-axislayer 2A (average thickness �310 m) (Figure 4).The magma lens is �1 km wide and presentbeneath �30% of the segment (poor data acquisi-tion conditions likely contribute to this limitedextent as discussed earlier). The shallow crustalstructure of segment P1 is comparable to the fastspreading EPR, where magma bodies are imaged atdepths of 1200–1600 m bsf with an average widthof �725 m [Hooft et al., 1997]. Thin layer 2A(200–300 m) is found on-axis at the EPR, whichapproximately doubles in thickness away from theaxis [Hooft et al., 1997].
Figure 5. (continued)
GeochemistryGeophysicsGeosystems G3G3
baran et al.: southeast indian ridge crustal structure 10.1029/2005GC000943
10 of 21
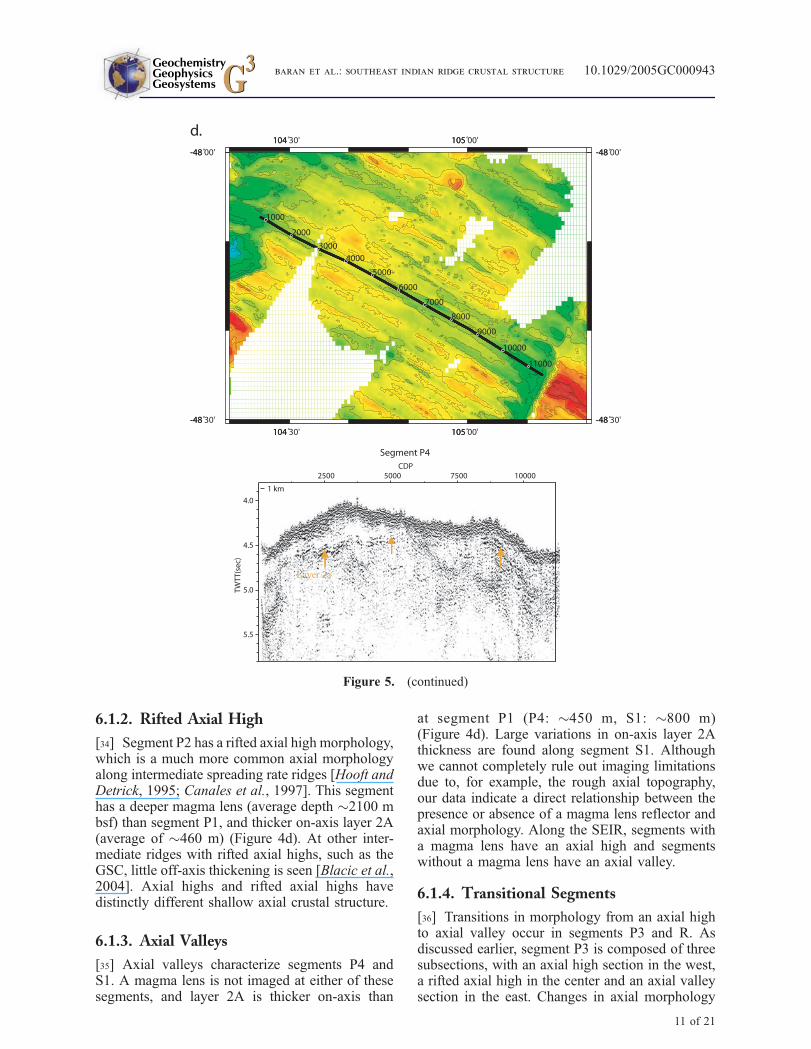
6.1.2. Rifted Axial High
[34] Segment P2 has a rifted axial high morphology,which is a much more common axial morphologyalong intermediate spreading rate ridges [Hooft andDetrick, 1995; Canales et al., 1997]. This segmenthas a deeper magma lens (average depth �2100 mbsf) than segment P1, and thicker on-axis layer 2A(average of �460 m) (Figure 4d). At other inter-mediate ridges with rifted axial highs, such as theGSC, little off-axis thickening is seen [Blacic et al.,2004]. Axial highs and rifted axial highs havedistinctly different shallow axial crustal structure.
6.1.3. Axial Valleys
[35] Axial valleys characterize segments P4 andS1. A magma lens is not imaged at either of thesesegments, and layer 2A is thicker on-axis than
at segment P1 (P4: �450 m, S1: �800 m)(Figure 4d). Large variations in on-axis layer 2Athickness are found along segment S1. Althoughwe cannot completely rule out imaging limitationsdue to, for example, the rough axial topography,our data indicate a direct relationship between thepresence or absence of a magma lens reflector andaxial morphology. Along the SEIR, segments witha magma lens have an axial high and segmentswithout a magma lens have an axial valley.
6.1.4. Transitional Segments
[36] Transitions in morphology from an axial highto axial valley occur in segments P3 and R. Asdiscussed earlier, segment P3 is composed of threesubsections, with an axial high section in the west,a rifted axial high in the center and an axial valleysection in the east. Changes in axial morphology
Figure 5. (continued)
GeochemistryGeophysicsGeosystems G3G3
baran et al.: southeast indian ridge crustal structure 10.1029/2005GC000943
11 of 21
are abrupt and coincide with minor third- or fourth-order segment boundaries [Cochran and Sempere,1995]. The melt lens drops abruptly from 1900 mbsf to 2320 m bsf coincident with the boundarybetween the axial high and rifted axial high sub-sections (Figures 4d and 5c). No melt lens isimaged in the axial valley subsegment. The aver-age on-axis thickness of layer 2A also increasesfrom �370 m along the axial high and rifted axialhigh portions of the segment to �740 m in theaxial valley subsegment. These abrupt transitionsin axial morphology with corresponding abruptchanges in the depth/presence of the magma lensreflection and in layer 2A thickness suggest thatthese are distinct modes of crustal accretion.
[37] Along this section of the SEIR, the ridge flankdepths vary slowly and smoothly. Ridge flank
depths on the swath bathymetry profiles acrossSegment P4 with a shallow axial valley are onlyabout 50 m deeper than the average ridge flankdepths in Segment P2 with a rifted axial high. Thissmall change in depth suggests that the change inaxial morphology does not result from a largechange in mantle temperature, but rather is athreshold-type response to a gradual increase inmantle temperature to the west.
[38] Segment P3 also marks a regional transition inridge structure along the SEIR. Segments to thewest of P3 consistently have axial highs (eitherrifted or EPR-like) whereas axial valleys are foundalong almost all segments east of P3 through to theAAD (the single exception, segment R, is dis-cussed below). The segregation of axial highs tothe west of segment P3 and axial valleys to the east
Figure 5. (continued)
GeochemistryGeophysicsGeosystems G3G3
baran et al.: southeast indian ridge crustal structure 10.1029/2005GC000943
12 of 21
of the segment supports the hypothesis that at aconstant spreading rate, the axial morphologydepends on the mantle temperature. The rapidtransitions in axial morphology within P3 coincid-ing with the disappearance of a detectable magmalens suggest that there is a threshold-type triggerfor these related changes in axial morphology andshallow crustal structure.
[39] Anomalous segment R, located east of theregional transition to axial valley morphology,has an axial high along its western portion. Aver-age abyssal hill relief for the entire segment is highand comparable to that observed within the adja-cent axial valley segments [Ma and Cochran,1997]. Though the morphology of the western partof segment R is similar to that of segment P1, themagma lens imaged beneath this region lies muchdeeper in the crust (by �1400 m). Cooler mantletemperatures for segment R are inferred from the
regional gravity and ridge flank depth gradients,possibly accounting for a magma lens that residesdeeper in the crust. The thickness of layer 2A on-axisis also greater here than at P1, and falls within therange observed for axial valley segments. As dis-cussed below, segment R is a leading ridge segmentin the absolute plate motion reference frame, and theanomalous nature of this segment may reflect en-hanced magma delivery due to the ridge migrationeffect proposed by Carbotte et al. [2004].
[40] Abrupt transitions in ridge crest morphologywith coincident changes in crustal structure havebeen found at other intermediate spreading ridges.Along the fast-intermediate (85 mm/yr) spreadingEPR north of the Orozco transform, a shallowmagma lens (1470 m bsf) and thin layer 2A(160 m) are detected beneath the shallow and broadaxial high of the southern segment centered at15.7�N (Figures 3a and 3b) [Carbotte et al.,
Figure 5. (continued)
GeochemistryGeophysicsGeosystems G3G3
baran et al.: southeast indian ridge crustal structure 10.1029/2005GC000943
13 of 21
1998]. In contrast a deeper magma lens (1750 mbsf) and thicker 2A (260 m) are found beneath thenarrow and deeper axis of the adjoining segment tothe north (Figures 3a and 3b). Along the westernGSC, axial morphology changes from an axial highin the east, to rifted axial high, to shallow axialvalley and then to an axial valley in the west awayfrom the Galapagos hot spot. The transition fromaxial high to rifted axial high morphology alongthe GSC occurs at 92�380W [Sinton et al., 2003]and coincides with an abrupt increase in magmalens depth from 1.5–2.5 km to 2.5–4.25 km, alongwith a thickening of layer 2A from 150–350 m to300–500 m [Detrick et al., 2002]. The inflatedwestern GSC thus shares the same properties as theSEIR in terms of variations in the depth/presenceof a magma lens and thickness of layer 2A withchanges in axial morphology.
[41] The underlying cause of changes in magmasupply at these ridges may differ, although theabrupt transitions in ridge structure that result aresimilar. At 16�N on the EPR, a linear seamountchain extends west of the shallow and broad south-ern segment, and the inflated ridge morphology andshallow magma lens observed here are attributed toenhanced magma supply due to tapping of themagmatic source for the seamount chain [Carbotteet al., 2000]. Along the GSC, variations in magmasupply with distance from the Galapagos hot spotand with changes in spreading rate may bothcontribute to the observed changes in shallowcrustal structure with the influence of these factorsdifficult to distinguish [Detrick et al., 2002]. Alongthe SEIR, spreading rate is constant and changes inridge morphology appear to be related to along-axischanges in mantle temperature causing changes inmagma supply to the crust [Cochran et al., 1997;Sempere et al., 1997]. The trigger for changes inridge structure may differ in different tectonicsettings, but the transition is consistently abruptindicating a threshold type response.
6.2. Relationship Between Magma Supplyand Axial Morphology
[42] Purdy et al. [1992] suggested a systematicrelationship between magma chamber depth and
Figure 6. On-axis CMP supergather stacks(96 gathers) (a) P1 (CMP 5900-5995), (b) P3(CMP 7700–7795), and (c) R (11000–11095). Gathersare NMO corrected to an appropriate velocity (P1:2.3 km/sec, P3: 2.6 km/sec, R: 2.4 km/sec) to flatten themagma lens arrival, noted by arrows.
GeochemistryGeophysicsGeosystems G3G3
baran et al.: southeast indian ridge crustal structure 10.1029/2005GC000943
14 of 21
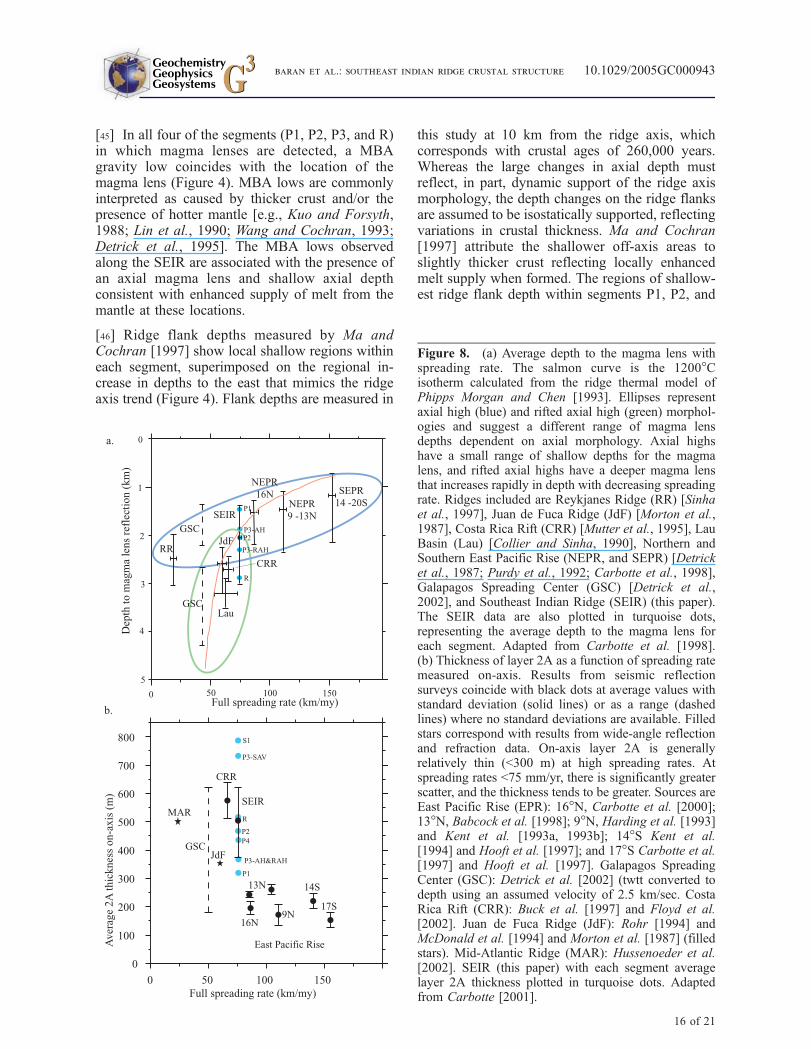
spreading rate, with faster spreading rate ridgeshaving shallow magma lenses, and slower spread-ing rate ridges having deeper magma lenses.Figure 8a shows AMC depths plotted as a functionof spreading rate redrawn from Carbotte et al.[1998] with our data from the SEIR included. Inthis figure we distinguish data from axial high(blue oval) and rifted axial high (green oval) seg-ments. Also shown is the predicted depth to themagma lens reflector (salmon-colored curve), as-sumed to be the freezing horizon for melts, with theassumption of a 6 km-thick crust from PhippsMorgan and Chen [1993]. The Phipps Morganand Chen model predicts a rapid increase in thedepth to the magma lens reflector at intermediaterates, as is generally observed. Depth to the magmalens for segments with well-developed axial highsdecreases slowly with decreasing spreading rate.Along the Reykjanes Ridge, a well-developed axialhigh and a shallow magma body are observed[Sinha et al., 1997] despite slow spreading rates.At rifted axial high segments, depth to the magmalens reflector increases rapidly with decreasingspreading rate and rifted axial highs have not beenmapped at spreading rates less than �45 mm/yr(Figure 8a). Individual segments of the SEIR fitwith these global mid-ocean ridge trends. Both theaxial high and the rifted axial high segments of theSEIR and GSC occur at a range of depths, com-parable to other mid-ocean ridges. Segment R plotswithin the rifted axial high field reflecting itstransition in morphology. On the other hand, P3has distinctly different subsegments, including an
axial high and rifted axial high subsegment thatplot within the ranges observed elsewhere for thesemorphologies.
[43] The on-axis thickness of layer 2A also varieswith axial morphology (Figure 8b). At axial highsegments at both fast and intermediate spreadingridges, layer 2A is thin on-axis. For segments withan axial valley or a rifted axial high, layer 2A isthicker and/or more variable in thickness on-axis.This difference is most likely due to the presence ofinward-facing faults near the axis at ridges axeswith rifted highs or axial valleys. These faultsprevent flow of magma downhill away from theaxis, so layer 2A reaches its full thickness on-axis.
6.3. Steady State Nature of AccretionAlong the SEIR
[44] Along the SEIR we find an excellent correla-tion between the location of magma lenses andMBA gravity lows at the axis, shallower depths onthe ridge flanks, and lower bathymetric roughnessfor crust up to 1 m.y. in age (Figure 4). Both theMCS image and the MBA gravity give a picture ofcrustal and mantle structure at the present time,whereas ridge flank depths and bathymetric rough-ness reflect crustal accretion conditions in the past.The correlation of ridge axis properties with ridgeflank properties suggest that patterns of accretionalong the SEIR are steady state; that locations ofvigorous mantle supply of melt have not changedwith time over the past 1 m.y.
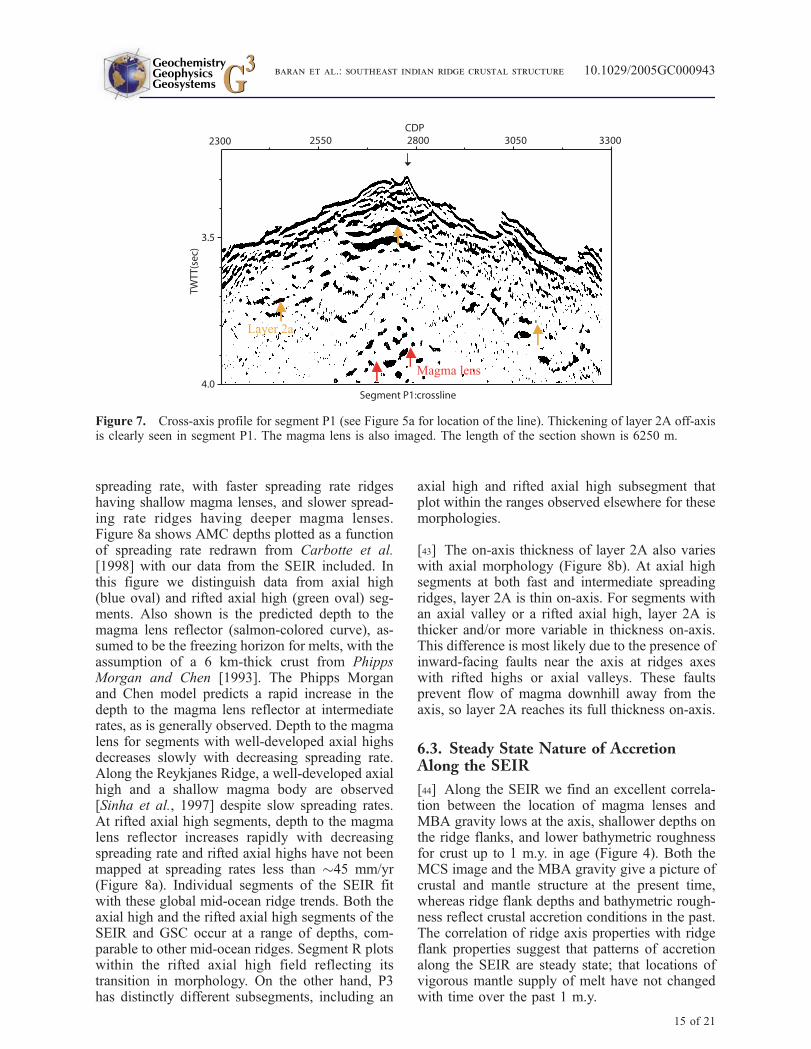
Figure 7. Cross-axis profile for segment P1 (see Figure 5a for location of the line). Thickening of layer 2A off-axisis clearly seen in segment P1. The magma lens is also imaged. The length of the section shown is 6250 m.
GeochemistryGeophysicsGeosystems G3G3
baran et al.: southeast indian ridge crustal structure 10.1029/2005GC000943
15 of 21
[45] In all four of the segments (P1, P2, P3, and R)in which magma lenses are detected, a MBAgravity low coincides with the location of themagma lens (Figure 4). MBA lows are commonlyinterpreted as caused by thicker crust and/or thepresence of hotter mantle [e.g., Kuo and Forsyth,1988; Lin et al., 1990; Wang and Cochran, 1993;Detrick et al., 1995]. The MBA lows observedalong the SEIR are associated with the presence ofan axial magma lens and shallow axial depthconsistent with enhanced supply of melt from themantle at these locations.
[46] Ridge flank depths measured by Ma andCochran [1997] show local shallow regions withineach segment, superimposed on the regional in-crease in depths to the east that mimics the ridgeaxis trend (Figure 4). Flank depths are measured in
this study at 10 km from the ridge axis, whichcorresponds with crustal ages of 260,000 years.Whereas the large changes in axial depth mustreflect, in part, dynamic support of the ridge axismorphology, the depth changes on the ridge flanksare assumed to be isostatically supported, reflectingvariations in crustal thickness. Ma and Cochran[1997] attribute the shallower off-axis areas toslightly thicker crust reflecting locally enhancedmelt supply when formed. The regions of shallow-est ridge flank depth within segments P1, P2, and
Figure 8. (a) Average depth to the magma lens withspreading rate. The salmon curve is the 1200�Cisotherm calculated from the ridge thermal model ofPhipps Morgan and Chen [1993]. Ellipses representaxial high (blue) and rifted axial high (green) morphol-ogies and suggest a different range of magma lensdepths dependent on axial morphology. Axial highshave a small range of shallow depths for the magmalens, and rifted axial highs have a deeper magma lensthat increases rapidly in depth with decreasing spreadingrate. Ridges included are Reykjanes Ridge (RR) [Sinhaet al., 1997], Juan de Fuca Ridge (JdF) [Morton et al.,1987], Costa Rica Rift (CRR) [Mutter et al., 1995], LauBasin (Lau) [Collier and Sinha, 1990], Northern andSouthern East Pacific Rise (NEPR, and SEPR) [Detricket al., 1987; Purdy et al., 1992; Carbotte et al., 1998],Galapagos Spreading Center (GSC) [Detrick et al.,2002], and Southeast Indian Ridge (SEIR) (this paper).The SEIR data are also plotted in turquoise dots,representing the average depth to the magma lens foreach segment. Adapted from Carbotte et al. [1998].(b) Thickness of layer 2A as a function of spreading ratemeasured on-axis. Results from seismic reflectionsurveys coincide with black dots at average values withstandard deviation (solid lines) or as a range (dashedlines) where no standard deviations are available. Filledstars correspond with results from wide-angle reflectionand refraction data. On-axis layer 2A is generallyrelatively thin (<300 m) at high spreading rates. Atspreading rates <75 mm/yr, there is significantly greaterscatter, and the thickness tends to be greater. Sources areEast Pacific Rise (EPR): 16�N, Carbotte et al. [2000];13�N, Babcock et al. [1998]; 9�N, Harding et al. [1993]and Kent et al. [1993a, 1993b]; 14�S Kent et al.[1994] and Hooft et al. [1997]; and 17�S Carbotte et al.[1997] and Hooft et al. [1997]. Galapagos SpreadingCenter (GSC): Detrick et al. [2002] (twtt converted todepth using an assumed velocity of 2.5 km/sec. CostaRica Rift (CRR): Buck et al. [1997] and Floyd et al.[2002]. Juan de Fuca Ridge (JdF): Rohr [1994] andMcDonald et al. [1994] and Morton et al. [1987] (filledstars). Mid-Atlantic Ridge (MAR): Hussenoeder et al.[2002]. SEIR (this paper) with each segment averagelayer 2A thickness plotted in turquoise dots. Adaptedfrom Carbotte [2001].
GeochemistryGeophysicsGeosystems G3G3
baran et al.: southeast indian ridge crustal structure 10.1029/2005GC000943
16 of 21
P3 coincide with on-axis MBA lows, and magmalens location (Figure 4) supporting the idea of along-lived enhanced melt supply in these particularlocations.
[47] In their analysis of bathymetric roughnesson the flanks of the SEIR, Ma and Cochran[1997] found v-shaped lows in roughness roughlycentered on segment midpoints (Figure 4a,Segments P1, P2 and R). They attributed theseregions of lower abyssal hill relief to weaker axiallithosphere resulting in smaller throw faults. Theyfurther speculated that each of these roughnesslows might be associated with a melt body on-axis. Our work indicates that each of the bathy-metric roughness minima in segments P1, P2 and Rdoes indeed coincide with the location of a meltlens on-axis. Remarkably, two roughness minimaare observed in segment P3 that coincide with thetwo western subsegments of P3, both of which havean axial magma lens. The roughness estimates inMaand Cochran [1997] are averaged over 40 kmperpendicular to the axis, representing over 1 mil-lion years. The persistence of the bathymetricroughness minima at the same location over 1 m.y.suggests that the magmatic centers of these seg-ments have remained constant over this time.
6.4. Local Controls on Melt SupplyAlong the SEIR
[48] The large-scale regional changes in ridge axisdepth and morphology observed along the SEIRare associated with a west to east decrease inmantle temperature approaching the AAD inferredfrom axial gravity data with presumed changes inmagma supply to the crust [e.g., Cochran et al.,1997; Sempere et al., 1997]. Superimposedon this long wavelength trend are local, shorter-wavelength, variations in axial depth and morphol-ogy. These inter-segment variations may reflectlocal differences in magma supply to ridge seg-ments associated with the ridge migration effectproposed by Carbotte et al. [2004]. From a studyof changes in axial depth across ridge-axis discon-tinuities, Carbotte et al. [2004] find that ridgesegments offset in the direction of ridge migrationover the deep mantle (termed ‘‘leading’’ segments)are typically the shallower and morphologicallyrobust segments. Carbotte et al. [2004] proposethat asymmetric mantle upwelling and melt pro-duction due to ridge migration combined with 3Dmelt tapping from this asymmetric melt productionzone, may account for these observations. Intheir model, magma supply to leading segments
across a discontinuity is enhanced by preferentialentrainment of melts from the faster upwelling,more melt rich mantle beneath an advancingplate.
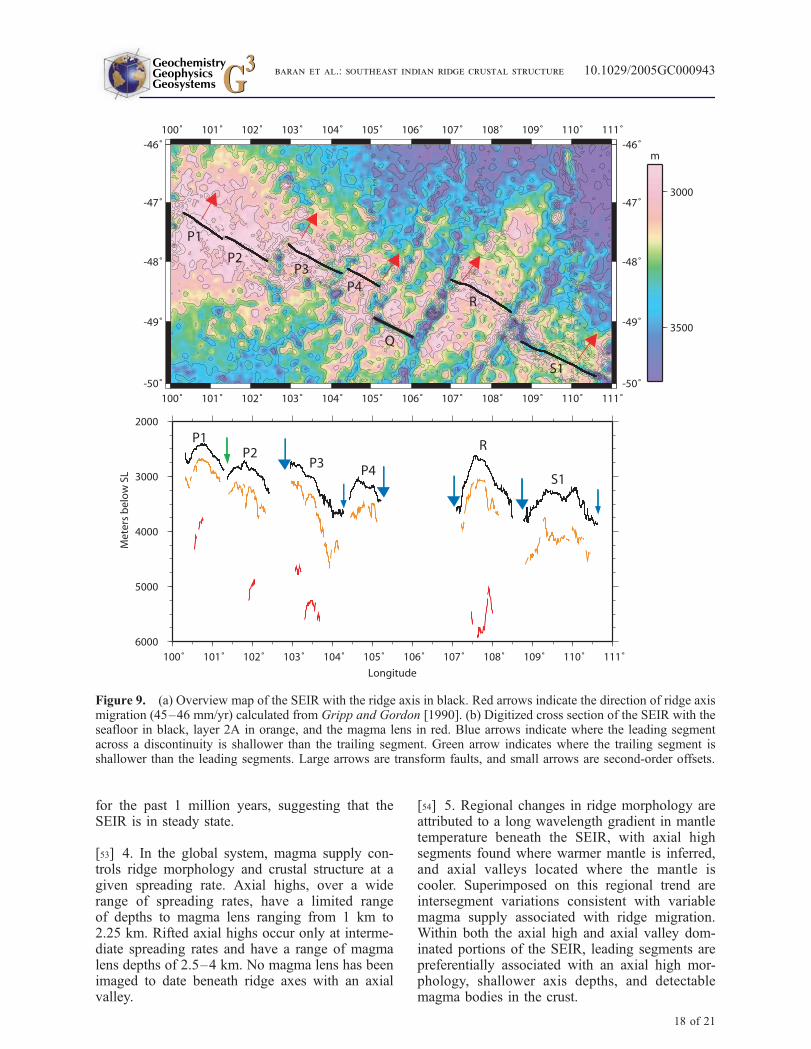
[49] The SEIR is migrating to the northeast in theabsolute motion reference frame (Figure 9) [e.g.,Small and Danyushevsky, 2003]. Hence leadingsegments across discontinuities of this ridge arethose that are offset to the north (i.e., P3, R)(Figure 9). Within our study area, axial highs arefound preferentially along leading segments and inmost cases leading segments are shallower thanadjacent trailing segments (Figure 9). Additionally,magma bodies in the crust are found preferentiallyat leading segments. Beneath leading segment P3,a bright continuous magma lens is found at thenorthwestern end of the segment, reaching shal-lower depths in the crust than the isolated magmalens detected beneath adjacent trailing segment P2.All segments east of P3 display axial valleys, exceptfor segment R, which is also a leading segment(Figure 9). A deep magma lens is found beneath theaxial high portion of this segment, whereas there isno evidence for magma in the crust beneath theadjacent trailing segment S1. These observationssupport the notion that magma supply to leadingsegments is enhanced and are consistent with pre-dictions of the ridge migration model for segment-scale variations in magma supply.
7. Conclusions
[50] 1. Along the SEIR, axial morphology is directlyrelated to shallow crustal structure, suggesting dis-tinct modes of crustal accretion. Axial highs alongthe SEIR have shallow magma lenses, and thin on-axis layer 2A. Rifted axial highs have deeper magmalenses, and thicker on-axis layer 2A. Magma lensesare not detected beneath segments with axialvalleys, and layer 2A is thick on-axis.
[51] 2. Changes in axial morphology along theSEIR are abrupt, suggesting a small change inmantle temperature causes a large change in crustalstructure. Abrupt changes in axial morphology arealso seen between segments at other ridges.
[52] 3. Current variations in axial crustal structurealong the SEIR appear to persist through time, atleast for the past 1 m.y. Locations of magma lensesalong axis correspond to MBA gravity lows as wellas off-axis features of shallower ridge flank depths,and lower relief abyssal hills. It appears thatmagma lenses have existed in the same locationfor at least the last �250,000 years and probably
GeochemistryGeophysicsGeosystems G3G3
baran et al.: southeast indian ridge crustal structure 10.1029/2005GC000943
17 of 21
for the past 1 million years, suggesting that theSEIR is in steady state.
[53] 4. In the global system, magma supply con-trols ridge morphology and crustal structure at agiven spreading rate. Axial highs, over a widerange of spreading rates, have a limited rangeof depths to magma lens ranging from 1 km to2.25 km. Rifted axial highs occur only at interme-diate spreading rates and have a range of magmalens depths of 2.5–4 km. No magma lens has beenimaged to date beneath ridge axes with an axialvalley.
[54] 5. Regional changes in ridge morphology areattributed to a long wavelength gradient in mantletemperature beneath the SEIR, with axial highsegments found where warmer mantle is inferred,and axial valleys located where the mantle iscooler. Superimposed on this regional trend areintersegment variations consistent with variablemagma supply associated with ridge migration.Within both the axial high and axial valley dom-inated portions of the SEIR, leading segments arepreferentially associated with an axial high mor-phology, shallower axis depths, and detectablemagma bodies in the crust.
Figure 9. (a) Overview map of the SEIR with the ridge axis in black. Red arrows indicate the direction of ridge axismigration (45–46 mm/yr) calculated from Gripp and Gordon [1990]. (b) Digitized cross section of the SEIR with theseafloor in black, layer 2A in orange, and the magma lens in red. Blue arrows indicate where the leading segmentacross a discontinuity is shallower than the trailing segment. Green arrow indicates where the trailing segment isshallower than the leading segments. Large arrows are transform faults, and small arrows are second-order offsets.
GeochemistryGeophysicsGeosystems G3G3
baran et al.: southeast indian ridge crustal structure 10.1029/2005GC000943
18 of 21
Acknowledgments
[55] This work was supported by National Science Founda-
tion grant 99-11720. We would like to thank Captain Mark
Landow and the officers, crew, and scientific staff of R/V
Maurice Ewing for their assistance under often extremely
difficult weather and sea conditions. We thank David Christie
and an anonymous reviewer for their helpful comments.
J.M.B. thanks M.S., A.G., and J.P.S. The GMT software
package [Wessel and Smith, 1998] was used extensively in
the preparation of figures. This is LDEO contribution 6824.
References
Babcock, J. M., A. J. Harding, G. M. Kent, and J. A. Orcutt(1998), An examination of along-axis variation of magmachamber width and crustal structure on the East Pacific Risebetween 13�300N and 12�200N, J. Geophys. Res., 103(B12),30,451–30,468.
Blacic, T. M., G. Ito, J. P. Canales, R. S. Detrick, and J. Sinton(2004), Constructing the crust along the Galapagos Spread-ing Center 91.3�–95.5�W: Correlation of seismic layer 2Awith axial magma lens and topographic characteristics,J. Geophys. Res., 109, B10310, doi:10.1029/2004JB003066.
Buck, W. R., S. M. Carbotte, and C. Z. Mutter (1997), Controlson extrusion at mid-ocean ridges, Geology, 25, 935–938.
Calvert, A. J. (1995), Seismic evidence for a magma chamberbeneath the slow-spreading Mid-Atlantic Ridge, Nature,377(6548), 410–414.
Calvert, A. J. (1997), Backscattered coherent noise and seismicreflection imaging of the oceanic crust: An example from therift valley of the Mid-Atlantic Ridge at 23�N, J. Geophys.Res., 102(B3), 5119–5134.
Canales, J. P., J. J. Danobeitia, R. S. Detrick, E. E. E. Hooft,R. Bartolome, and D. F. Naar (1997), Variations in axialmorphology along the Galapagos spreading center and theinfluence of the Galapagos hotspot, J. Geophys. Res.,102(B12), 27,341–27,354.
Canales, J. P., J. A. Collins, J. Escartın, and R. S. Detrick(2000), Seismic structure across the rift valley of the Mid-Atlantic Ridge at 23�200 (MARK area): Implications forcrustal accretion processes at slow spreading ridges, J. Geo-phys. Res., 105(B12), 28,411–28,426.
Canales, J. P., G. Ito, R. S. Detrick, and J. Sinton (2002),Crustal thickness along the western Galapagos SpreadingCenter and the compensation of the Galapagos hotspot swell,Earth Planet. Sci. Lett, 203, 311–327.
Carbotte, S. M. (2001), Mid-ocean ridge seismic structure, inEncyclopedia of Ocean Sciences, pp. 1788–1798, Elsevier,New York.
Carbotte, S. M., J. C. Mutter, and L. Xu (1997), Contributionof volcanism and tectonism to axial and flank morphology ofthe southern East Pacific Rise, 17�100-17�400S, from a studyof layer 2A geometry, J. Geophys. Res., 102(B5), 10,165–10,184.
Carbotte, S. M., C. Z. Mutter, J. Mutter, and L. Wu (1998),Insights from a fast-intermediate spreading ridge on theinfluence of magma supply and spreading rate on crustalmagma bodies and emplacement of the extrusive layer, Geol-ogy, 26, 455–458.
Carbotte, S. M., A. Solomon, and G. Ponce-Correa (2000),Evaluation of morphological indicators of magma supplyand segmentation from a seismic reflection study of the East
Pacific Rise at 15�300-17�N, J. Geophys. Res., 105, 2737–2759.
Carbotte, S. M., C. Small, and K. Donnelly (2004), The influ-ence of ridge migration of the magmatic segmentation ofmid-ocean ridges, Nature, 429, 743–746.
Christeson, G. L., G. M. Kent, G. M. Purdy, and R. S. Detrick(1996), Extrusive thickness variability at the East PacificRise, 9�–10�N: Constraints from seismic techniques, J. Geo-phys. Res., 101, 2859–2873.
Christie, D. M., B. P. West, D. G. Pyle, and B. B. Hanan(1998), Chaotic topography, mantle flow and mantle migra-tion in the Australian-Antarctic discordance, Nature, 394,637–644.
Christie, D. M., R. Werner, F. Hauff, K. Hoernle, and B. B.Hanan (2005), Morphological and geochemical variationsalong the eastern Galapagos Spreading Center, Geochem.Geophys. Geosyst., 6, Q01006, doi:10.1029/2004GC000714.
Cochran, J. R., and J. C. Sempere (1995), Cruise Report:Geophysical Study of the Southeast Indian Ridge Between90� and 120� EWest 09MV Fremantle (Australia) - Fremantle(Australia), December 10, 1994–January 23, 1995, 89 pp.,Columbia Univ., New York.
Cochran J. R., J. Sempere, and SEIR Scientific Team (1997),The Southeast Indian Ridge between 88�E and 118�E: Gravityanomalies and crustal accretion at intermediate spreadingrates, J. Geophys. Res., 102(B7), 15,463–15,487.
Collier, J., and M. C. Sinha (1990), Seismic images of amagma chamber beneath the Lau Basin back-arc spreadingcenter, Nature, 346(6285), 646–648.
Conder, J. A., D. S. Scheirer, and D. W. Forsyth (2000),Seafloor spreading on the Amsterdam-St. Paul hotspotplateau, J. Geophys. Res., 105, 8263–8277.
DeMets, C., R. G. Gordon, D. F. Argus, and S. Stein (1994),Effect of recent revisions to the geomagnetic reversal timescale on estimates of current plate motions, Geophys. Res.Lett., 21, 2191–2194.
Detrick, R. S., P. Buhl, E. E. Vera, J. C. Mutter, J. A. Orcutt,J. A. Madsen, and T. M. Brocher (1987), Multichannel seis-mic imaging of the axial magma chamber along the EastPacific Rise between 9�N and 13�N, Nature, 326, 35–41.
Detrick, R. S., J. C. Mutter, P. Buhl, and I. I. Kim (1990), Noevidence from multichannel reflection data for a crustal mag-ma chamber in the MARK area on the Mid-Atlantic Ridge,Nature, 347, 61–64.
Detrick, R. S., A. J. Harding, G. M. Kent, J. A. Orcutt, J. C.Mutter, and P. Buhl (1993), Seismic structure of the southernEast Pacific Rise, Science, 259, 499–503.
Detrick, R. S., H. D. Needham, and V. Renard (1995), Gravityanomalies and crustal thickness variations along the Mid-Atlantic Ridge between 33�N and 40�N, J. Geophys. Res.,100, 3767–3787.
Detrick, R. S., J. M. Sinton, G. Ito, J. P. Canales, M. Behn,T. Blacic, B. Cushman, J. E. Dixon, D. W. Graham, and J. J.Mahoney (2002), Correlated geophysical, geochemical, andvolcanological manifestations of plume-ridge interactionalong the Galapagos Spreading Center, Geochem. Geophys.Geosyst., 3(10), 8501, doi:10.1029/2002GC000350.
Floyd, J. S., J. C. Mutter, and S. M. Carbotte (2002), Seismicreflection imaging of the evolution of oceanic crustal struc-ture at the intermediate rate spreading Costa Rica Rift, EosTrans. AGU, 83(47), Fall Meet. Suppl., Abstract T12B-1318.
Forsyth, D. W., R. L. Ehrenbard, and S. Chapin (1987), Anom-alous upper mantle beneath the Australian-Antarctic Discor-dance, Earth Planet. Sci. Lett., 84, 471–478.
Goff, J. A., Y. Ma, A. Shah, J. R. Cochran, and J.-C. Sempere(1997), Stochastic analysis of seafloor morphology on the
GeochemistryGeophysicsGeosystems G3G3
baran et al.: southeast indian ridge crustal structure 10.1029/2005GC000943
19 of 21
flanks of the Southeast Indian Ridge: The influence of ridgemorphology on the formation of abyssal hills, J. Geophys.Res., 102, 15,521–15,534.
Gripp, A. E., and G. R. Gordon (1990), Current plate velocitiesrelative to the hotspots incorporating the NUVEL-1 globalplate motion model, Geophys. Res. Lett., 17(8), 1109–1112.
Harding, A. J., G. M. Kent, and J. A. Orcutt (1993), A multi-channel seismic investigation of the upper crustal structure at9�N on the East Pacific Rise: Implications for crustal accre-tion, J. Geophys. Res., 98, 13,925–13,944.
Heezen, B. C. (1960), The rift in the ocean floor, Sci. Am., 203,99–110.
Hooft, E. E., and R. S. Detrick (1995), Relationship betweenaxial morphology, crustal thickness, and mantle temperaturealong the Juan de Fuca and Gorda Ridges, J. Geophys. Res.,100, 22,499–22,508.
Hooft, E. E. E., H. Schouten, and R. S. Detrick (1996), Con-straining crustal emplacement processes from the variationof seismic layer 2A thickness at the East Pacific Rise, EarthPlanet. Sci. Lett., 142, 289–310.
Hooft, E. E., R. E. Detrick, and G. M. Kent (1997), Seismicstructure and indicators of magma budget along the southernEast Pacific Rise, J. Geophys. Res., 102, 27,319–27,340.
Hussenoeder, S. A., G. M. Kent, and R. S. Detrick (2002),Upper crustal seismic structure of the slow spreading Mid-Atlantic Ridge, 35�N: Constraints on volcanic emplacementprocesses, J. Geophys. Res., 107(B8), 2156, doi:10.1029/2001JB001691.
Kent, G. M., A. J. Harding, and J. A. Orcutt (1993a), Distribu-tion of magma beneath the East Pacific Rise between theClipperton transform and the 9�170N deval from forwardmodeling of common depth point data, J. Geophys. Res.,98, 13,945–13,969.
Kent, G. M., A. J. Harding, and J. A. Orcutt (1993b), Distribu-tion of magma beneath the East Pacific Rise near the 9�030Noverlapping spreading center from forward modeling ofcommon depth point data, J. Geophys. Res., 98, 13,971–13,995.
Kent, G. M., A. J. Harding, J. A. Orcutt, R. S. Detrick, J. C.Mutter, and P. Buhl (1994), Uniform accretion of oceaniccrust south of the Garrett transform at 14�150S on the EastPacific Rise., J. Geophys. Res., 99, 9097–9116.
Klein, E. M., C. H. Langmuir, A. Zindler, H. Staudigel, andB. Hamelin (1988), Isotopic evidence of a mantle convectingboundary at the Australian-Antarctic discordance, Nature,333, 623–629.
Klein, E. M., C. H. Langmuir, and H. Staudigel (1991), Geo-chemistry of basalts from the Southeast Indian Ridge, 115�E-138�E, J. Geophys. Res., 96, 2089–2108.
Kuo, B. Y., and D. W. Forsyth (1988), Gravity anomalies ofthe ridge-transform system in the south Atlantic between 31and 34.5�S: Upwelling centers and variations in crustalthickness, Mar. Geophys. Res., 10, 205–232.
Lin, J., G. M. Purdy, H. Schouten, J. C. Sempere, and C. Zervas(1990), Evidence from gravity data for focused magmaticaccretion along the Mid-Atlantic Ridge, Nature, 344, 627–632.
Ma, Y., and J. R. Cochran (1996), Transitions in axial mor-phology along the Southeast Indian Ridge, J. Geophys. Res.,101, 15,849–15,866.
Ma, Y., and J. R. Cochran (1997), Bathymetric roughness ofthe Southeast Indian Ridge: Implications for crustal accretionat intermediate spreading rate mid-ocean ridges, J. Geophys.Res., 102, 17,697–17,711.
MacDonald, K. C. (1986), The crest of the Mid-AtlanticRidge: Models for crustal generation processes and tectonics,
in The Western North Atlantic Region, edited by P. Vogt andB. Tucholke, pp. 51–68, Geol. Soc. of Am., Boulder, Colo.
MacDonald, K. C. (1989), Tectonic and magmatic processeson the East Pacific Rise, in The Eastern Pacific Ocean andHawaii, edited by E. L. Winterer, D. M. Hussong, and R. W.Decker, pp. 93–110, Geol. Soc. of Am., Boulder, Colo.
Mahoney, J. J., D. W. Graham, D. M. Christie, K. T. M.Johnson, L. S. Hall, and D. L. Vonderhaar (2002), Betweena hotspot and a cold spot: Isotopic variation in the SoutheastIndian Ridge asthenosphere, 86�E-118�E, J. Petrol., 43,1155–1176.
Malinverno, A. (1993), Transition between a valley and a highat the axis of the mid-ocean ridges, Geology, 21, 639–642.
McDonald, M. A., S. C. Webb, J. A. Hildebrand, B. D.Cornuelle, and C. G. Fox (1994), Seismic structure andanisotropy of the Juan de Fuca ridge at 45�N, J. Geophys.Res., 99, 4857–4873.
Menard, H. W. (1960), The East Pacific Rise, Science, 132,1737–1746.
Morton, J. L., N. H. Sleep, W. R. Normark, and D. H.Tompkins (1987), Structure of the southern Juan de FucaRidge from seismic reflection records, J. Geophys. Res.,92, 11,315–11,326.
Mutter, J. C., S. M. Carbotte, W. Su, L. Xu, P. Buhl, R. S.Detrick, G. A. Kent, J. A. Orcutt, and A. J. Harding (1995),Seismic images of active magma systems beneath the EastPacific Rise between 17�050 and 17�350S, Science, 268,391–395.
Palmer, J., J. C. Sempere, D. M. Christie, and J. PhippsMorgan (1993), Morphology and tectonics of the Australian-Antarctic Discordance between 123�E and 128�E, Mar.Geophys. Res., 15, 121–152.
Phipps Morgan, J., and Y. J. Chen (1993), Dependence ofridge-axis morphology on magma supply and spreading rate,Nature, 364, 706–708.
Purdy, G. M., L. S. L. Kong, G. L. Christeson, and S. C.Solomon (1992), Relationship between spreading rate andthe seismic structure of mid-ocean ridges, Nature, 355,815–817.
Pyle, D. G. (1994), Geochemistry of mid-ocean ridge basaltwithin and surrounding the Australian-Antarctic Discor-dance, Ph.D. thesis, Oregon State Univ., Corvallis.
Rohr, K. M. M. (1994), Increase of seismic velocities in uppercrust and hydrothermal circulation in the Juan de Fuca plate,Geophys Res. Lett., 21, 2163–2166.
Royer, J. Y., and D. T. Sandwell (1989), Evolution of theeastern Indian Ocean since the late Cretaceous: Constraintsfrom Geosat altimetry, J. Geophys. Res., 94, 13,755–13,782.
Sempere, J., J. R. Cochran, and SEIR Scientific Team (1997),The Southeast Indian Ridge between 88�E and 118�E:Variations in crustal accretion at constant spreading rate,J. Geophys. Res., 102(B7), 15,489–15,506.
Sinha, M. C., D. A. Navin, L. M. MacGregor, S. Constable,C. Pierce, A. White, G. Heinson, and M. A. Inglis (1997),Evidence for accumulated melt beneath the slow spreadingMid-Atlantic Ridge, in Mid-Ocean Ridges: Dynamics ofProcesses Associated With Creation of New Ocean Crust,edited by J. R. Cann, H. Elderfield, and A. Laughton, Philos.Trans. R. Soc. London, Ser. A, 355, 233–253.
Sinton, J., R. Detrick, J. P. Canales, G. Ito, and M. Behn(2003), Morphology and segmentation of the western Gala-pagos Spreading Center, 90.5�–98�W: Plume-ridge interac-tion at an intermediate spreading ridge, Geochem. Geophys.Geosyst., 4(12), 8515, doi:10.1029/2003GC000609.
Small, C. (1994), A global analysis of mid-ocean ridge axialtopography, Geophys. J. Int., 116, 64–84.
GeochemistryGeophysicsGeosystems G3G3
baran et al.: southeast indian ridge crustal structure 10.1029/2005GC000943
20 of 21
Small, C. (1995), Observations of ridge-hotspot interactionsin the Southern Ocean, J. Geophys. Res., 100, 17,931–17,946.
Small, C. (1998), Global systematics of mid-ocean ridge axialmorphology, in Faulting and Magmatism at Mid-OceanRidges, Geophys. Monogr. Ser., vol. 106, edited by W. R.Buck et al., pp. 1–26, AGU, Washington, D. C.
Small, C., and L. V. Danyushevsky (2003), Plate-kinematicexplanation for mid-oceanic-ridge depth discontinuities,Geology, 31(5), 399–402.
Small, C., and D. T. Sandwell (1989), An abrupt change inridge axis gravity with spreading rate, J. Geophys. Res., 94,17,383–17,392.
Tolstoy, M., A. J. Harding, J. A. Orcutt, and J. Phipps Morgan(1995), Crustal thickness at the Australian Antarctic Discor-dance and neighboring Southeast Indian Ridge, Eos Trans.AGU, 76(46), Fall Meet. Suppl., F570.
Vera, E. E., and J. B. Diebold (1994), Seismic imaging oflayer 2A between 9�300N and 10�N on the East Pacific Risefrom two-ship wide-aperture profiles, J. Geophys. Res., 99,3031–3041.
Vera, E. E., J. C. Mutter, P. Buhl, J. A. Orcutt, A. J. Harding,M. E. Kappus, R. S. Detrick, and T. M. Brocher (1990), Thestructure of 0- to 0.2-m.y.-old oceanic crust at 9�N on the
East Pacific Rise from expanded spread profiles, J. Geophys.Res., 95, 15,529–15,556.
Wang, X., and J. R. Cochran (1993), Gravity anomalies,isostasy and mantle flow at the East Pacific Rise crest,J. Geophys. Res., 98, 19,505–19,531.
Weissel, J. K., and D. E. Hayes (1974), The AustralianAntarctic Discordance: New results and implications, J. Geo-phys. Res., 79, 2579–2587.
Wessel, P., and W. H. F. Smith (1998), New improved versionof Generic Mapping Tools released, Eos Trans. AGU, 79,579.
West, B. P., J.-C. Sempere, D. G. Pyle, J. Phipps Morgan, andD. M. Christie (1994), Evidence for variable upper mantletemperature and crustal thickness in and near the Australian-Antarctic Discordance, Earth Planet. Sci. Lett., 128, 135–153.
West, B. P., W. S. D. Wilcock, and J.-C. Sempere (1997),Three-dimensional structure of asthenospheric flow beneaththe Southeast Indian Ridge, J. Geophys. Res., 102, 7783–7802.
Yale, M. M., and J. Phipps Morgan (1998), Asthenosphereflow model of hotspot-ridge interactions: A comparison ofIceland and Kerguelen, Earth Planet. Sci. Lett, 161(1–4),45–56.
GeochemistryGeophysicsGeosystems G3G3
baran et al.: southeast indian ridge crustal structure 10.1029/2005GC000943
21 of 21