Energy Spectra of Developed Turbulence in Helium Superfluids
Upload
independentCategory
view
0download
0
www.elsevier.com/locate/epsl
Earth and Planetary Science Le
2-D numerical simulations of groundwater flow, heat transfer and4He transport — implications for the He terrestrial budget and the
mantle helium–heat imbalance
Maria Clara Castro a,*, Delphine Patriarche a,1, Patrick Goblet b,2
aUniversity of Michigan, Department of Geological Sciences, 2534 C. C. Little Building, Ann Arbor, MI 48109-1005, United StatesbEcole des Mines de Paris, Centre d’Informatique Geologique, 77305 Fontainebleau, France
Received 31 January 2005; received in revised form 15 May 2005; accepted 8 June 2005
Available online 9 August 2005
Editor: S. King
Abstract
Because helium and heat production results from a common source, a continental 4He crustal flux of 4.65*10�14 mol m�2
s�1 has been estimated based on heat flow considerations. In addition, because the observed mantle He /heat flux ratio at the
proximity of mid-ocean ridges (6.6*10�14 mol J�1) is significantly lower than the radiogenic production ratio (1.5*10�12 mol
J�1), the presence of a terrestrial helium–heat imbalance was suggested. The latter could be explained by the presence of a
layered mantle in which removal of He is impeded from the lower mantle [R.K. O’Nions, E.R. Oxburgh. Heat and helium in the
Earth, Nature 306 (1983) 429–431; E.R. Oxburgh, R.K. O’Nions, Helium loss, tectonics, and the terrestrial heat budget, Science
237 (1987) 1583–1588]. van Keken et al. [P.E. van Keken, C.J. Ballentine, D. Porcelli, A dynamical investigation of the heat
and helium imbalance, Earth Planet. Sci. Lett. 188 (2001) 421–434] have recently claimed that the helium–heat imbalance
remains a robust observation. Such conclusions, however, were reached under the assumption that a steady-state regime was in
place for both tracers and that their transport properties are similar at least in the upper portion of the crust. Here, through 2-D
simulations of groundwater flow, heat transfer and 4He transport carried out simultaneously in the Carrizo aquifer and
surrounding formations in southwest Texas, we assess the legitimacy of earlier assumptions. Specifically, we show that the
driving transport mechanisms for He and heat are of a fundamentally different nature for a high range of permeabilities
(kV10�16 m2) found in metamorphic and volcanic rocks at all depths in the crust. The assumption that transport properties for
these two tracers are similar in the crust is thus unsound. We also show that total 4He /heat flux ratios lower than radiogenic
production ratios do not reflect a He deficit in the crust or mantle original reservoir. Instead, they reflect the combined impact of
air saturated water (ASW), advection, conduction, and diffusion when steady-state is reached for both tracers. We thus argue
that the observed low mantle He /heat flux ratio in the oceans might be, at least partially, the result of processes occurring in the
oceanic crust similar to those occurring in the continental crust, rather than deeper into the mantle.
0012-821X/$ - s
doi:10.1016/j.ep
* Correspondi
E-mail addre1 Tel.: +1 7342 Tel.: +33 1 6
tters 237 (2005) 893–910
ee front matter D 2005 Elsevier B.V. All rights reserved.
sl.2005.06.037
ng author. Tel.: +1 734 615 3812; fax: +1 734 763 4690.
sses: [email protected] (M.C. Castro), [email protected] (D. Patriarche), [email protected] (P. Goblet).
647 5732; fax: +1 734 763 4690.
4 69 47 49; fax: +33 1 64 69 47 03.
M.C. Castro et al. / Earth and Planetary Science Letters 237 (2005) 893–910894
Our simulations also indicate that in order for both heat and He to be in steady-state in recently formed crust, the presence of
an advective dominated regime is required (kz10�16 m2). Under these conditions, only in total absence of contact with ASW
(e.g., an atmospheric component provided by freshwater or seawater) is the total 4He /heat flux ratio expected to equal the
radiogenic production ratio. Lower 4He /heat fluxes in an advective dominated regime require the incorporation of an ASW
component. We argue that the observed low ocean mantle 4He /heat flux results, at least partially, from sea water incorporation
within mid-ocean ridge basalts. Our simulations also suggest that 4He transport is in transient state in recently formed crust for
permeabilities V10�17 m2. Under these conditions, low to very low mantle He excesses and thus total He /heat fluxes of up to
several orders of magnitude lower than the radiogenic production ratios are expected.
D 2005 Elsevier B.V. All rights reserved.
Keywords: helium–heat imbalance; 4He /heat flux ratios; groundwater flow modeling; hydraulic conductivity; gulf Coast Basin
1. Introduction
The study of helium isotopes and heat flow offers
a powerful tool to investigate a diversity of pro-
blems, from the deep Earth’s interior to its surface,
as well as the evolution of the atmosphere [4,5].
Among its numerous applications, the study of
these two distinct tracers in large-scale groundwater
systems can enhance our understanding of both
groundwater flow [6–9], and crust and mantle dy-
namics through quantification of helium and heat
fluxes [1,2,10–12].
He concentrations in groundwaters usually exceed
those expected for water in solubility equilibrium with
the atmosphere (ASW). With the exception of very
shallow aquifers or recharge areas, the observed He
excesses result from two main sources: a) U and Th
decay in addition to 6Li(n,a) 3H(3He) reaction giving
origin to crustally produced (in-situ and deep crust)
radiogenic 4He and nucleogenic 3He, respectively; b)
mantle contributions to both 3He and 4He. Similarly,
in old Precambrian regions, two components of heat
flow are present: a) a radiogenic (crustal) component
resulting from U, Th (~85%), and K (~15%) decay,
and; b) a background component which originates in
the mantle. In Cenozoic terrains, a cooling component
might also be present [4].
Because helium and heat production results from a
common source, a continental 4He crustal flux of
4.65*10�14 mol m�2 s�1 could be estimated [1]
using an estimated U content derived from continental
radiogenic heat flow. Such calculation was performed
under the assumption that a steady-state regime was in
place for both tracers and that their transport properties
are similar at least in the upper portion of the crust. In
addition, based on the observed low mantle He /heat
flux (6.6*10�14 mol J�1) at the proximity of mid-
ocean ridges, it was concluded [1,2] that the amount of
U and Th required to support the oceanic radiogenic
He flux would only provide ~5% of the mantle heat
flux. The latter is based on the presence of an oceanic
crust strongly depleted in He, in addition to assump-
tions previously made for the continental crust. To
account for this bhelium–heat imbalanceQ, the presenceof a layered mantle was suggested in which removal of
He is impeded from the lower mantle from which most
of the heat lost through ocean basins would originate
[1,2]. The terrestrial bhelium–heat imbalanceQ problemremains unresolved at present (see, e.g., Anderson
[13], van Keken et al. [3], Albarede [14], Anderson
[15]).
In the last two decades, numerical simulations have
become important tools to test conceptual basin-scale
models of fluid migration, heat flow and reactive
chemical transport [16–18]. Traditionally, such simu-
lations were aimed at unraveling the evolution of
sedimentary basins, as well as hydrocarbon and min-
eral deposits generation and migration. More recently,
basin-scale numerical simulations of coupled water
flow and He transport were conducted [10,11].
These were aimed at improving our understanding
of both water dynamics and He transport in these
regional systems, in addition to quantifying the mag-
nitude of the crustal He flux. Specifically, the magni-
tude of the crustal 4He flux determined underneath the
Paris Basin [11] was found to be a factor of ~3 times
greater than the 4He crustal flux previously estimated
by [1] based on radiogenic heat flow considerations.
In order to understand the behavior of the helium–heat
couple in the crust, it is necessary to simultaneously
M.C. Castro et al. / Earth and Planetary Science Letters 237 (2005) 893–910 895
account for transport processes of these two tracers, in
addition to fluid flow.
Here, through a series of simultaneous 2-D water
flow–heat transfer–4He transport simulations in the
regional Carrizo aquifer and surrounding formations
in southwestern Texas, we aim at clarifying some
apparent observed thermal and He inconsistencies in
continental areas (e.g., [19]), as well as to shed some
light on the mantle helium–heat imbalance problem.
Specifically, by analyzing the driving transport
mechanisms of these two tracers, we assess the legit-
imacy of earlier assumptions [1,2]. The role played by
advection, conduction, and diffusion on vertical trans-
port as well as its dependency on formation perme-
abilities and hydraulic conductivities is analyzed.
Transition from transient to steady-state regimes for
heat transfer and He transport under different ground-
water flow scenarios is also investigated. It will be
shown that the driving transport mechanisms for heat
and 4He in the crust are of a fundamentally different
nature. In addition, we show that the impact of ASW
on both heat and He leads to significantly lower He /
heat fluxes as compared to radiogenic production
ratios. Our simulations indicate that, unlike heat
flow, 4He transport will not be at steady-state in low
permeability, recently formed crust of Miocene–Plio-
cene–Quaternary age. Thus, and unlike O’Nions and
Oxburgh [1], Oxburgh and O’Nions [2], and van
Keken et al. [3], we argue that there is at present no
sound basis to support the existence of a mantle
helium–heat imbalance, and thus, the existence of an
impermeable layer between the upper and lower man-
tle to He transport.
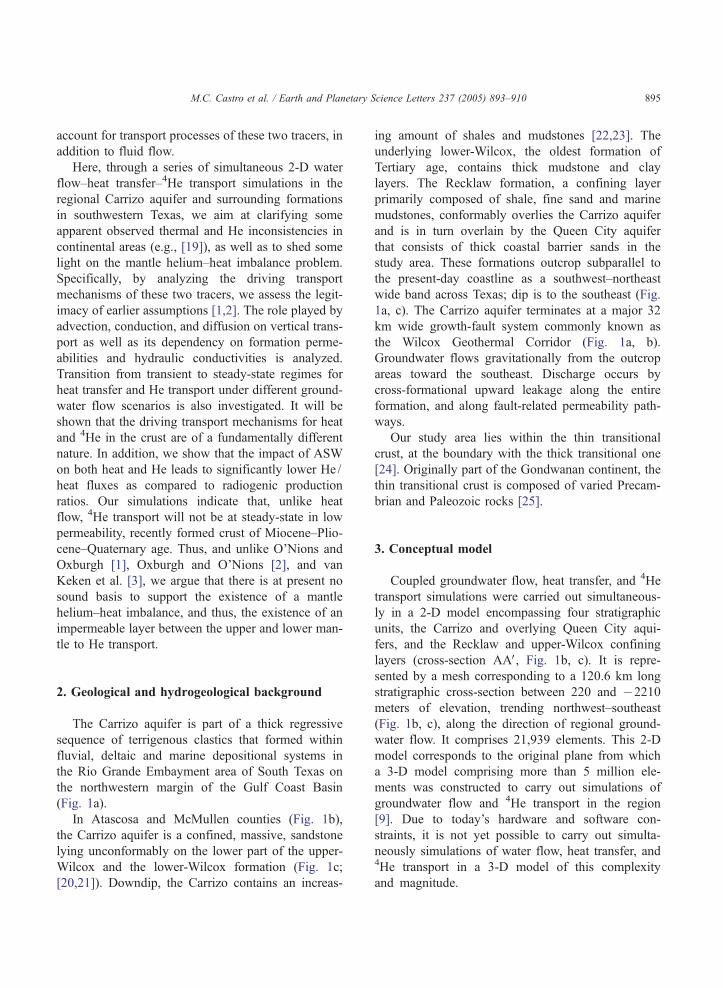
2. Geological and hydrogeological background
The Carrizo aquifer is part of a thick regressive
sequence of terrigenous clastics that formed within
fluvial, deltaic and marine depositional systems in
the Rio Grande Embayment area of South Texas on
the northwestern margin of the Gulf Coast Basin
(Fig. 1a).
In Atascosa and McMullen counties (Fig. 1b),
the Carrizo aquifer is a confined, massive, sandstone
lying unconformably on the lower part of the upper-
Wilcox and the lower-Wilcox formation (Fig. 1c;
[20,21]). Downdip, the Carrizo contains an increas-
ing amount of shales and mudstones [22,23]. The
underlying lower-Wilcox, the oldest formation of
Tertiary age, contains thick mudstone and clay
layers. The Recklaw formation, a confining layer
primarily composed of shale, fine sand and marine
mudstones, conformably overlies the Carrizo aquifer
and is in turn overlain by the Queen City aquifer
that consists of thick coastal barrier sands in the
study area. These formations outcrop subparallel to
the present-day coastline as a southwest–northeast
wide band across Texas; dip is to the southeast (Fig.
1a, c). The Carrizo aquifer terminates at a major 32
km wide growth-fault system commonly known as
the Wilcox Geothermal Corridor (Fig. 1a, b).
Groundwater flows gravitationally from the outcrop
areas toward the southeast. Discharge occurs by
cross-formational upward leakage along the entire
formation, and along fault-related permeability path-
ways.
Our study area lies within the thin transitional
crust, at the boundary with the thick transitional one
[24]. Originally part of the Gondwanan continent, the
thin transitional crust is composed of varied Precam-
brian and Paleozoic rocks [25].
3. Conceptual model
Coupled groundwater flow, heat transfer, and 4He
transport simulations were carried out simultaneous-
ly in a 2-D model encompassing four stratigraphic
units, the Carrizo and overlying Queen City aqui-
fers, and the Recklaw and upper-Wilcox confining
layers (cross-section AAV, Fig. 1b, c). It is repre-
sented by a mesh corresponding to a 120.6 km long
stratigraphic cross-section between 220 and �2210
meters of elevation, trending northwest–southeast
(Fig. 1b, c), along the direction of regional ground-
water flow. It comprises 21,939 elements. This 2-D
model corresponds to the original plane from which
a 3-D model comprising more than 5 million ele-
ments was constructed to carry out simulations of
groundwater flow and 4He transport in the region
[9]. Due to today’s hardware and software con-
straints, it is not yet possible to carry out simulta-
neously simulations of water flow, heat transfer, and4He transport in a 3-D model of this complexity
and magnitude.

0
+200
-200
-400
-600
-800
-1000
-1200
-1400
-1600
-1800
-2000
-2200
Ele
vatio
n (m
)
10 km
approximate land surface
sea level
A
1
2
34
A'
c)
28°30'
28°15'
98°45' 98°30' 98°15' 98°99° 97°45'
Upper Wilcoxoutcrop
Carrizo outcrop
Recklaw
Queen Cityoutcrop
20 kmN
Wilcox Geothermal
Corridor
A
A’
McMullen County
Atascosa County
Live Oak County Bee County
La SalleCounty
Karnes County
San PatricioCounty
Bexar County
FrioCounty
San Antonio
Poteet
Direction ofwater flow
Tx04
Tx06
Tx27
Tx26
Tx29Tx33
Tx20
Tx21
Tx25
Tx24
Tx32 Tx02
Tx28
Tx22
Tx18
Tx14
Tx13
Tx12
Tx11
Tx08
Tx03
Tx01
28°45'
RioGrandeEmbayment
b)
29∞0
29∞1SanAntonio
Houston
Balcones Fault Zone
Updip limitof Tertiary
Gulf o
f Mex
ico
0
0
200 mi
300 km
Texas
EastTexasBasin
Sabine Uplift
WilcoxOutcrop
Austin
WilcoxGeothermal
Corridor
a)
1. Queen City aquifer2. Recklaw Formation3. Carrizo aquifer4. Wilcox Formation
Jourdanton
outcrop
Fig. 1. a) Location and tectonic setting of the study area in southwest Texas after [21]. b) Detailed representation of the study area with location
of cross-section (AAV) along which simulations were carried out; locations of water sampled for analysis of 4He (closed circles) and measured
temperatures are shown (crosses). c) Simplified representation of the mesh along AAV representing the Carrizo aquifer (3) and surrounding
formations; 1: Queen City aquifer, 2: Recklaw Formation, and 4: undifferentiated lower part of upper-Wilcox and lower-Wilcox.
M.C. Castro et al. / Earth and Planetary Science Letters 237 (2005) 893–910896
M.C. Castro et al. / Earth and Planetary Science Letters 237 (2005) 893–910 897
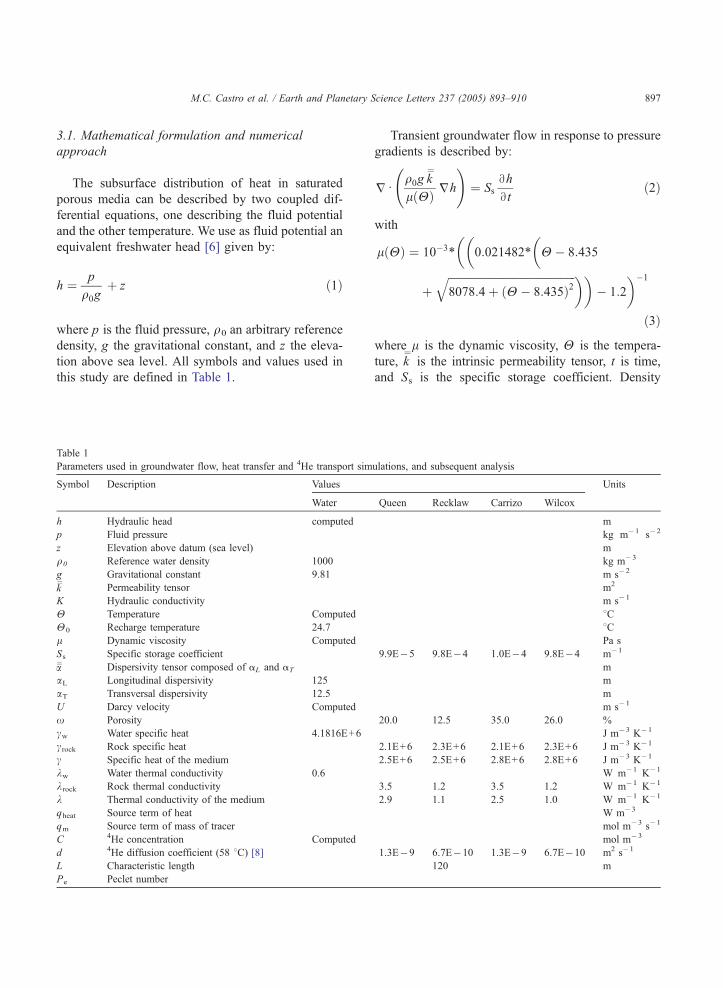
3.1. Mathematical formulation and numerical
approach
The subsurface distribution of heat in saturated
porous media can be described by two coupled dif-
ferential equations, one describing the fluid potential
and the other temperature. We use as fluid potential an
equivalent freshwater head [6] given by:
h ¼ p
q0gþ z ð1Þ
where p is the fluid pressure, q0 an arbitrary reference
density, g the gravitational constant, and z the eleva-
tion above sea level. All symbols and values used in
this study are defined in Table 1.
Table 1
Parameters used in groundwater flow, heat transfer and 4He transport sim
Symbol Description Values
Water
h Hydraulic head computed
p Fluid pressure
z Elevation above datum (sea level)
q0 Reference water density 1000
g Gravitational constant 9.81
k¼
Permeability tensor
K Hydraulic conductivity
H Temperature Computed
H0 Recharge temperature 24.7
l Dynamic viscosity Computed
Ss Specific storage coefficient
a¼ Dispersivity tensor composed of aL and aT
aL Longitudinal dispersivity 125
aT Transversal dispersivity 12.5
U Darcy velocity Computed
x Porosity
cw Water specific heat 4.1816E+6
crock Rock specific heat
c Specific heat of the medium
kw Water thermal conductivity 0.6
krock Rock thermal conductivity
k Thermal conductivity of the medium
qheat Source term of heat
qm Source term of mass of tracer
C 4He concentration Computed
d 4He diffusion coefficient (58 8C) [8]L Characteristic length
Pe Peclet number
Transient groundwater flow in response to pressure
gradients is described by:
jdq0g k
¼
l Hð Þ jh
!¼ Ss
Bh
Bt
ð2Þ
with
l Hð Þ ¼ 10�3T��
0:021482T�
H � 8:435
þffiffiffiffiffiffiffiffiffiffiffiffiffiffiffiffiffiffiffiffiffiffiffiffiffiffiffiffiffiffiffiffiffiffiffiffiffiffiffiffiffiffiffiffiffiffi8078:4þ ðH � 8:435Þ2
q ��� 1:2
��1
ð3Þ
where l is the dynamic viscosity, H is the tempera-
ture, k¼is the intrinsic permeability tensor, t is time,
and Ss is the specific storage coefficient. Density
ulations, and subsequent analysis
Units
Queen Recklaw Carrizo Wilcox
m
kg m�1 s�2
m
kg m�3
m s�2
m2
m s�1
8C8CPa s
9.9E�5 9.8E�4 1.0E�4 9.8E�4 m�1
m
m
m
m s�1
20.0 12.5 35.0 26.0 %
J m�3 K�1
2.1E+6 2.3E+6 2.1E+6 2.3E+6 J m�3 K�1
2.5E+6 2.5E+6 2.8E+6 2.8E+6 J m�3 K�1
W m�1 K�1
3.5 1.2 3.5 1.2 W m�1 K�1
2.9 1.1 2.5 1.0 W m�1 K�1
W m�3
mol m�3 s�1
mol m�3
1.3E�9 6.7E�10 1.3E�9 6.7E�10 m2 s�1
120 m
M.C. Castro et al. / Earth and Planetary Science Letters 237 (2005) 893–910898
variations are not accounted for in our simulations as
the maximum combined effect of salinity and temper-
ature on density in our domain is negligible (b1%).
Because salinity effects on l in our freshwater-dom-
inated system are equally negligible, l is treated as
function of temperature alone.
The transient heat transfer equation accounting for
advection, kinematic dispersion, and conduction is
given by:
jd�
a¼
cwU þ k�jH � cwU
YH
�¼ c
BHBt
þ qheat
�ð4Þ
with
k ¼ xkw þ 1� xð Þkrock ð5Þ
and
c ¼ xcw þ 1� xð Þcrock ð6Þ
where a¼
is the dispersivity tensor, k is the thermal
conductivity of the medium, kw and krock are the
thermal conductivities of water and the rock, respec-
tively; c is the specific heat of the medium, cw and
crock are the specific heat of the water and rock,
respectively; x is the porosity, and qheat is a source
term corresponding to the added (or withdrawn) heat
per unit volume per unit of time.
To account for advection, kinematic dispersion,
and molecular diffusion the 4He transport equation
is expressed as:
jd�
a¼U þ xd
�jC � CU
Y�
¼ xBC
Btþ qm
�ð7Þ
where UY
is the Darcy velocity, d is the diffusion
coefficient in porous media (diffusion coefficient in
pure water multiplied by the tortuosity coefficient), C
is the concentration of 4He in water, and qm is a
source term corresponding to the added or withdrawn
mass of tracer per unit volume per unit of time.
All 2-D simulations were conducted in transient
state with the finite element code METIS3 [26]. The
time discretization for the resolution of the transient
coupled simulations of water flow, heat transfer, and4He transport obeys a centered (Crank–Nicholson)
3 Modelisation des Ecoulements et des Transferts avec Interaction
en milieu Sature.
scheme. The time step is automatically calculated in
order to maintain the time truncation error at a fixed
level.
3.2. Initial and boundary conditions
Groundwater flow boundary conditions include
hydraulic heads prescribed on the outcrop areas of
all formations as well as on top of the Queen City
aquifer obtained using a step-by-step procedure
through geostatistical modeling [9]. A no-flow bound-
ary condition was imposed at the base of the Wilcox.
In addition, a high intrinsic permeability value of
3*10�13 m2 was imposed in the Wilcox Geothermal
Corridor area. The latter allows for the water to be
evacuated upward, translating to the situation occur-
ring at the major growth-fault system. Intrinsic per-
meabilities within the Carrizo, Recklaw and Queen
City Formations are our calibration parameter. In the
Wilcox, to maintain a low hydraulic conductivity
value [9] despite a decrease of dynamic viscosity
with depth due to increased temperatures, an intrinsic
permeability of 10�18 m2 was imposed in the outcrop
area, and a decrease factor given by kw=10�18
exp((z� zw) /500) was applied, where z and zw are
the altitudes at the center of the elements at a location
of interest, and that on the outcrop, respectively.
A temperature H0 of 24.7 8C in the recharge areas
of all four formations corresponding to the average of
a total of 48 available measurements within the 3-D
model domain recharge area was imposed [27,9]. This
is the initial condition applied in all 2-D heat flow
simulations. An outlet condition at the top of the
confined Queen City aquifer allows heat to be evac-
uated upward by advection. Indeed, due to the high
hydraulic conductivities (K) in place in this aquifer
(K N2.2*10�5 m s�1), advection is the dominant heat
transport mechanism here. A heat flux representing
the external heat contribution from the underlying
crust and/or mantle was imposed at the base of the
Carrizo aquifer; this is our heat flow calibration pa-
rameter. Inside the domain, a source term representing
radiogenic in-situ heat production was imposed and
calculated following [28]:
Pheat ¼ 10�11TqrockT 9:52 U½ � þ 2:56 Th½ � þ 3:48 K½ �ð Þð8Þ
Table 2
Th, U, and K contents in the reservoir rocks of the Queen City, Recklaw Formation, and Carrizo Aquifer as well as density and calculated 4He
and heat production rates
Formation Th U K qrocka P
4
He Pheat4He /heat
(ppm) (ppm) (%) (kg m�3) (mol m�3rock s
�1) (W m�3rock) (mol J�1)
Queenb 6.85 2.08 1.865 2400 1.49E�18 1.05E�6 1.42E�12
Recklawb 9.425 2.89 2.7 1700 1.45E�18 1.04E�6 1.40E�12
Carrizo 2.9c 7.50c 0.6702d 2400 3.33E�18 1.95E�6 1.71E�12
a Density of rocks estimated after Handbook of Physical Constants, Volume II, CRC Press, Florida, 1966.b Values estimated from average lithologic composition of each formation and after Parker [29].c Measured U and Th concentrations in the reservoir rock (Castro et al. [30]).d Average value on 26 measurements in the Carrizo aquifer [31].
Table 3
Temperature measurements [27] used for calibration of the 2�D
Model
Well
name
Well
number
Formation Bottom well
elevation ASL*
(m)
Temperature
(8C)
AL001 6859401 Carrizo 41.8 26.0
AL006 7811603 Carrizo �614.2 38.0
AL033 7803509 Carrizo �296.3 30.0
AL034 7803507 Carrizo �294.1 33.0
AL048 7803201 Carrizo �129.5 29.0
AL170 6858607 Carrizo 55.2 25.0
AL189 6859804 Carrizo �74.4 27.5
AL193 6859822 Carrizo �73.2 28.0
AL253 7803503 Carrizo �216.4 33.0
AL258 7803807 Carrizo �503.5 37.0
AL319 7811604 Carrizo �606.6 41.0
SU009 7828603 Carrizo �1079.7 52.0
SU013 7828101 Carrizo �1123.2 48.2
SU397 7828602 Carrizo �1144.0 49.5
SU402 7837602 Carrizo �1596.5 72.0
AL260 7803902 Queen City �127.1 27.0
AL316 7811305 Queen City �113.1 27.0
AL317 7811309 Queen City �163.4 28.0
AL320 7812105 Queen City �228.0 28.8
AL340 7820703 Queen City �571.8 37.0
AL341 7820801 Queen City �605.0 39.3
*Above sea level.
M.C. Castro et al. / Earth and Planetary Science Letters 237 (2005) 893–910 899
where [U], [Th] and [K] represent the U, Th, and K
content of the different formations, and qrock their
respective densities (Table 2).
For the transport model an ASW 4He concentra-
tion of 2.01*10�6 mol m�3 was imposed on all
outcrop areas. This value corresponds also to the
initial condition applied for all simulations. On top
of the Queen City an outlet condition was prescribed,
which allows 4He to be evacuated upward by advec-
tion. A 4He flux representing the external contribution
from the underlying crust and/or mantle was imposed
at the base of the Carrizo aquifer. This upward exter-
nal flux is our 4He transport calibration parameter. A
term representing in-situ 4He production (Table 2)
was also imposed in the Carrizo, Recklaw and
Queen City units; these were calculated using decay
constants given by Steiger and Jager [32]:
P4
He ¼ 103TqrockT 1:71T10�25 U½ �þ4:06T10�26 Th½ �:
ð9Þ
For all simulations it is assumed that in-situ produced4He is released to the water at the production rate
[29].
3.3. Calibration data
Calibration of the groundwater flow model was
achieved based on 34 hydraulic head measurements
available in the Carrizo aquifer, located in the prox-
imity of the 2-D model (AAV, Fig. 1b). These data
belong to a total of 149 available head measurements
within the 3-D model domain (AL1–8, 26–35, 37–40,
42–45, 47–48, 52, 56; SU9,10,13,14, cf. [9]).
Calibration of the heat flow model was obtained
based on 21 temperature measurements available in
the confined portions of the Carrizo and Queen City
aquifers, in the proximity of the 2-D model (Fig. 1b,
Table 3).
Calibration of the 4He transport model was
achieved using 11 samples located in the proximity
of the 2-D model (Fig. 1b, Table 4). These are part of
a total of 22 wells previously sampled in the Carrizo
aquifer for analysis of noble gases ([30,33]; Fig. 1b).
Previous analysis of different helium components has
Table 4
Measured 4He concentrations in the Carrizo aquifera
Well name Well
number
Bottom well
elevation ASL
(m)
4He
(10�6 mol m�3)
TX 02 6851803 154.0 2.07
TX 04 7820301 �787.0 16.80
TX 06 7803601 �302.7 3.24
TX 20 7827501 �942.5 54.15
TX 21 7804803 �451.1 4.87
TX 25 7828501 �1063.5 73.06
TX 26 7836201 �1218.3 200.42
TX 27 7836902 �1330.5 265.27
TX 29 7828603 �1079.7 79.54
TX 32 6851701 140.2 1.86
TX 33 7828101 �1123.2 52.25
ASW (18 8C)b 2.010
a See Castro et al. [30]. The name, number, and bottom well
elevation above sea level of well samples are indicated.b After Stute et al. [33].
M.C. Castro et al. / Earth and Planetary Science Letters 237 (2005) 893–910900
shown 4He excesses with respect to ASW by up to
two orders of magnitude (Table 4, [30]).
4 This calculation assumes a sedimentary sequence above the 2-D
domain shale (50%) and sandstone (50%) dominated, with compo-
sitions represented by the Recklaw and Carrizo formations, respec-
tively (Table 2).
4. Model results and discussion
In the following sections we present and analyze
simulations carried out simultaneously for groundwa-
ter flow, heat transfer and 4He transport in transient
state. As stated earlier, the primary goal of this study
is to analyze the transport behavior of heat and 4He
under similar groundwater flow regimes in the crust.
Therefore, emphasis will be placed on the analysis of
the coupled 4He-heat pair rather than at achieving a
perfect fit as was previously done for 4He through 3-D
modeling and geostatistical analysis [9].
4.1. Groundwater, heat and 4He calibrated model —4He versus heat fluxes
Simultaneous calibration on measured hydraulic
heads, temperatures and 4He concentrations was
obtained by implementing the exponential decrease
of intrinsic permeability (k) with depth in the Carrizo
and Recklaw formations previously obtained through
3-D modeling [9]. This decrease results from differ-
ential compaction of the media as well as downdip
lithological changes. For the Queen City aquifer
where temperature measurements are also available
(Table 3), an exponential decrease of k with depth
was also applied, but the factor was less pronounced.
These relationships are given by:
kc ¼ 5T10�11exp z� zcð Þ=243:1ð Þ
kr ¼ 2:1T10�15exp z� zrð Þ=264ð Þ
kq ¼ 2:5T10�11exp z� zq
=500
ð10Þ
where zc, zr, and zq are the altitudes at the center of the
element located on the outcrops of the Carrizo, Reck-
law, and Queen City, respectively. Initial k values
(outcrop areas) for the Carrizo, Recklaw, and Queen
City are 5*10�11, 2.1*10�15, and 2.5*10�11 m2,
respectively. The obtained fit for calculated and mea-
sured hydraulic heads is very good, with r2=0.98 (not
shown).
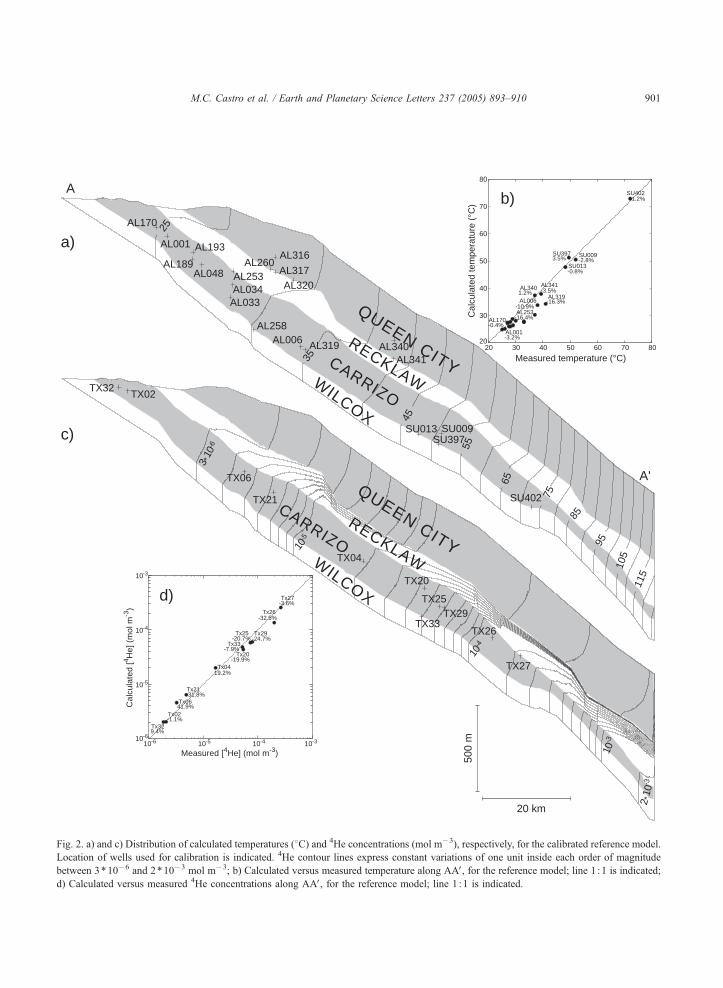
Fig. 2a shows the calculated thermal field obtained
through calibration of the heat flow model. Distribu-
tion of isotherms clearly shows the impact of recharge
water entering the outcrop areas, which leads to a slow
temperature increase and thus, low geothermal gradi-
ent (~1.3 8C/100 m) within the first ~50 km from the
outcrop area. As water velocity decreases with in-
creased recharge distance, heat accumulation in the
system, due particularly to the external heat flux en-
tering the base of the Carrizo aquifer, becomes more
prominent. Irregular distribution of isotherms in the
system is the combined result of downward recharge
water movement, variable hydraulic gradient (steeper
in the recharge area) and changes in formation dip
(Fig. 1c; see also [6]). The fit obtained between calcu-
lated and measured temperatures is good (r2=0.96,
Fig. 2b). Calibration was achieved for an external
heat flux entering the base of the Carrizo of 35 mW
m�2. If one takes into account the radiogenic heat
production within our 2-D system above the base of
the Carrizo (~700 m thick) as well as production in the
remaining sedimentary sequence up to the surface
(~1.6 km), this will correspond to an estimated surface
heat flux of ~38 mW m�2 (Table 2).4 Such low heat
fluxes are typical of old continental and oceanic
regions (Section 2; [4]).
a)
c)
TX06
TX04
TX20
TX21
TX25
TX26
TX27
TX29
TX32
TX33
TX02
A'
b)
20
30
40
50
60
70
80
20 30 40 50 60 70 80
Cal
cula
ted
tem
pera
ture
(°C
)
Measured temperature (°C)
SU013 -0.8%
AL319 -16.3%
AL170 -0.4%
SU397 3.5% SU009
-2.8%
AL001 -3.2%
AL253 -16.4%
AL006 -10.9%
SU402 1.2%
AL340 1.2%
AL341 -3.5%
QUEEN CITYRECKLAW
CARRIZOW
ILCOX
QUEEN CITYRECKLAW
CARRIZOW
ILCOX
115
105
95
85
75
65
55
45
35
25
SU013
AL319
AL170
SU397SU009
AL033
AL001
AL253
AL258AL006
AL034
AL189
AL193
AL048
SU402
AL340AL341
AL316
AL317AL260
AL320
Tx02 -1.1%
Tx04 19.2%
Tx06 41.9%
Tx20 -19.9%
Tx21 31.8%
Tx25 -20.7%
Tx26 -32.5%
Tx27 -3.6%
Tx29 -24.7%
Tx32 9.4%
Tx33 -7.9%
10-6
10-5
10-4
10-3
10-6 10-5 10-4 10-3
Measured [4He] (mol m-3)
Cal
cula
ted
[4 He]
(m
ol m
-3)
d)
A
500
m
20 km
3*10
-6
10-5
10-4
2 *10
-3
10-3
Fig. 2. a) and c) Distribution of calculated temperatures (8C) and 4He concentrations (mol m�3), respectively, for the calibrated reference model.
Location of wells used for calibration is indicated. 4He contour lines express constant variations of one unit inside each order of magnitude
between 3*10�6 and 2*10�3 mol m�3; b) Calculated versus measured temperature along AAV, for the reference model; line 1 :1 is indicated;
d) Calculated versus measured 4He concentrations along AAV, for the reference model; line 1 :1 is indicated.
M.C. Castro et al. / Earth and Planetary Science Letters 237 (2005) 893–910 901
M.C. Castro et al. / Earth and Planetary Science Letters 237 (2005) 893–910902
Calibration of the 4He transport model (Fig. 2c)
was achieved by prescribing a flux entering the base
of the Carrizo aquifer of 2.6*10�15 mol m�2 s�1.
Note that this flux is not representative of the terres-
trial 4He flux. Indeed, as shown by Castro et al.
[10,11], 4He fluxes decrease rapidly toward the sur-
face as a result of progressive dilution by recharge
water present in deeper aquifers / formations. Calcu-
lated and measured concentrations are also well cor-
related (r2=0.96; Fig. 2d). Progressive down dip
increase of 4He concentrations in the Carrizo is
apparent from the vertical concentration contour
lines (Fig. 2c). In a similar manner to that of heat
accumulation, the increase rate is slower near re-
charge areas where water movement is faster and
the atmospheric component has a strong dilution
effect on 4He concentrations. In the central part of
the system 4He accumulates more rapidly due both to
the external flux entering the Carrizo aquifer and in-
situ production, as hydraulic conductivities and water
velocities progressively decrease and thus, effect a
smaller amount of dilution by the atmospheric com-
ponent. In contrast to the Carrizo aquifer, 4He con-
centrations persist over long distances within the
Recklaw Formation because hydraulic conductivities
and therefore water velocities greatly decrease with
distance and depth, and are a factor of ~3 orders of
magnitude smaller than those in place in the Carrizo
aquifer.
This calibrated model represents one of the best fits
obtained simultaneously for groundwater flow, heat
transfer and 4He transport models and is our
breferenceQ in the discussion that follows. Note that
small variations of both heat and 4He external fluxes
lead to equally good fits. Nevertheless, both heat and4He fluxes entering the base of the Carrizo are well
Table 5
Th, U, and K content of the continental and oceanic crust as well as dens
Th U K qrock
(ppm) (ppm) (%) (kg m�
Upper crust* 10.7 2.8 2.80 2600
Lower crust* 1.06 0.28 0.28 3300
Oceanic crust* 0.22 0.1 0.12 3000
Densities after Clark and Ringwood [34].
*Taylor and McLennan [35].
constrained in the system within a small range of
values.
It is important to note upfront that our resulting
calibrated 4He /heat flux ratio entering the base of the
Carrizo aquifer is 7.4*10�14 mol J�1, a value signif-
icantly lower than radiogenic production ratios in the
area (1.5*10�12 mol J�1; Table 2), as well as that of
the crust as a whole (1.4*10�12 mol J�1; Table 5). By
contrast, and although at first view unrelated, it is of
relevance to mention that the external 4He /heat flux
ratio entering the base of the Carrizo aquifer is ex-
tremely close (indistinguishable) to the mantle He /
heat flux value of 6.6*10�14 mol J�1 reported in the
oceans [1,2], at the proximity of mid-ocean ridges.
The latter, which is thus also over one order of
magnitude lower than the radiogenic production
ratio is at the center of the so-called mantle heli-
um–heat imbalance and the theory of a layered
mantle with an impermeable boundary to He that
could explain the discrepancy observed [1,2].
These apparently contradictory results raise two
critical questions: a) why is the 4He /heat flux
ratio entering the Carrizo aquifer over one order
of magnitude smaller as compared to the relatively
homogeneous terrestrial radiogenic production ratio
of ~10�12 mol J�1?, and; b) is it a simple and
striking coincidence that both 4He /heat flux ratios
entering the Carrizo aquifer and the observed oce-
anic mantle ratio yield indistinguishable values?
Note that both observed and computed He /heat
flux ratios were made either within the upper
crust close to land surface (this work), or just
above the crust (ocean mantle flux ratio [1,2]),
rather than in the deep crust or directly in the
mantle. Below, we take a closer look at possible
reasons for such discrepancies.
ity, and 4He and heat production rates
P4
He Pheat4He /heat
3) (mol m�3rock s
�1) (W m�3rock) (mol J�1)
2.37E�18 1.66E�06 1.43E�12
3.00E�19 2.10E�07 1.43E�12
7.80E�20 5.80E�08 1.35E�12
-200
-100
0
100
200
300
400
500
600
700
800
-25
-20
-15
-10
-5
0
5
10
150
Distance to the outcrop (km)10 20 30 40 50 60 70 80 90 100 110 120
0Distance to the outcrop (km)
10 20 30 40 50 60 70 80 90 100 110 120
a)
b)
Tem
pera
ture
dev
iatio
ns (
%)
com
pare
d to
ref
eren
ce m
odel
4 H
e co
ncen
tratio
n de
viat
ions
(%) c
ompa
red
to re
fere
nce
mod
el
referencek/10k/5k/2k*2k*5k*10
referencek/10k/5k/2k*2k*5k*10
Fig. 3. a) and b) Temperature and 4He concentration deviations (%)
in the Carrizo aquifer plotted for kc and kr values (k) 2, 5 and 10
times smaller, as well as 2, 5, and 10 fold with respect to our
reference model as a function of the distance to the Carrizo outcrop,
respectively.
M.C. Castro et al. / Earth and Planetary Science Letters 237 (2005) 893–910 903
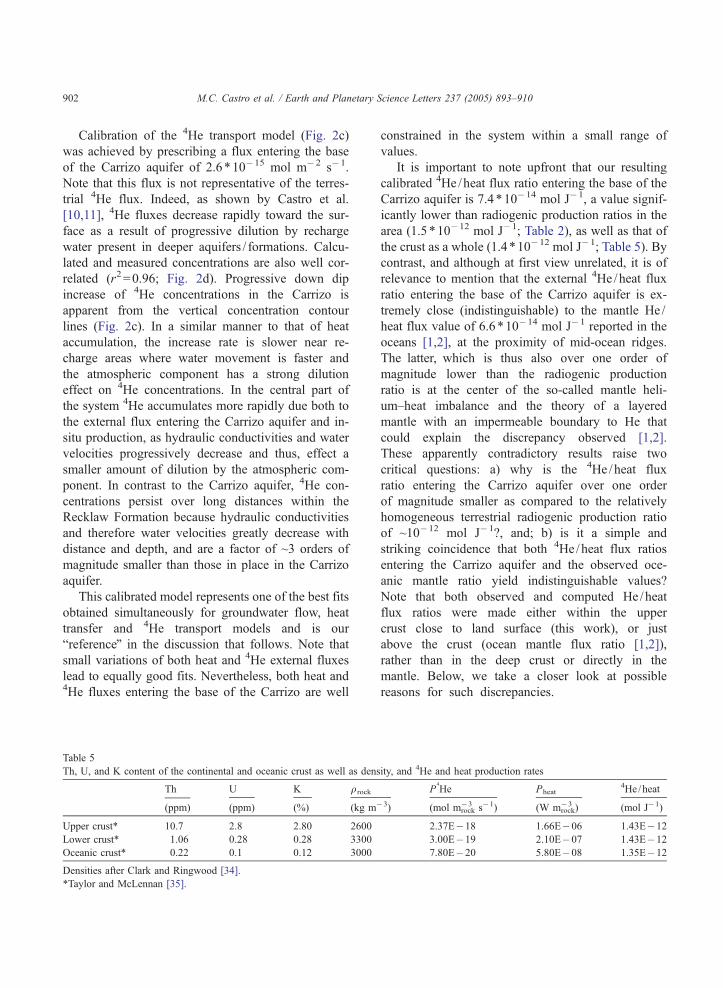
4.2. Sensitivity analysis to hydraulic conductivity —
advective versus conductive and diffusive flow
regimes
Although some similarities are observed between
heat and 4He transport at the proximity of the out-
crops (Fig. 2a, c) where the influence of recharge
water is strong (e.g., slow accumulation of both heat
and 4He), 2-D simulations highlighted in a clear
fashion some striking behavioral differences between
these two tracers. Specifically, low sensitivity of heat
flow to low permeability and thus hydraulic conduc-
tivity values, by contrast to a much stronger depen-
dency of 4He to this same parameter and range of
values.
Fig. 3a, b where temperature and 4He concentra-
tion deviations (%) in the Carrizo aquifer are plotted
for kc and kr values (k) 2, 5 and 10 times smaller, as
well as 2, 5, and 10 fold with respect to our reference
model, illustrate in a clear fashion the distinct re-
sponse of these two tracers to permeability (k) and
hydraulic conductivity (K) values. Specifically, sce-
narios k / 2, k / 5, and k / 10 show in a clear fashion the
independent nature of heat flow to low permeabilities
and thus, hydraulic conductivities. Indeed, as k
decreases with depth and thus, with distance from
the outcrop, temperature deviations become very
small (V3%, ~50 km from the outcrop; Fig. 3a), to
almost completely vanish at ~90 km away from the
recharge area. The opposite situation is observed with4He concentrations (Fig. 3b), as deviations from the
reference model become stronger with decreasing K,
and reach a maximum of ~700% for k / 10 simula-
tions at ~70 km. By contrast, for k 2, 5, and 10 fold,
heat flow and 4He transport display a more similar
behavior (Fig. 3a, b). Here, although 4He deviations
remain stronger, deviations increase for both tracers.
Such behavior can be understood in terms of the
advective /diffusive (4He) and advective / conductive
(heat) flux ratios in place in the Recklaw, the confin-
ing layer above the Carrizo aquifer where heat flow
and 4He transport are essentially vertical, upward.
Indeed it has been shown [8,9] that upward 4He
movement in this 2-D system is mostly controlled
by permeabilities and hydraulic conductivies in this
confining layer. Dispersive flux is minor with respect
to the advective, conductive and diffusive compo-
nents, and thus it will not be discussed here.
Advective and diffusive fluxes for 4He and heat are
given respectively by:
/adv ¼ UYC /adv ¼ cwU
YH
/diff ¼ � xddCdz
/cond ¼ � kdHdz
: ð11Þ
M.C. Castro et al. / Earth and Planetary Science Letters 237 (2005) 893–910904
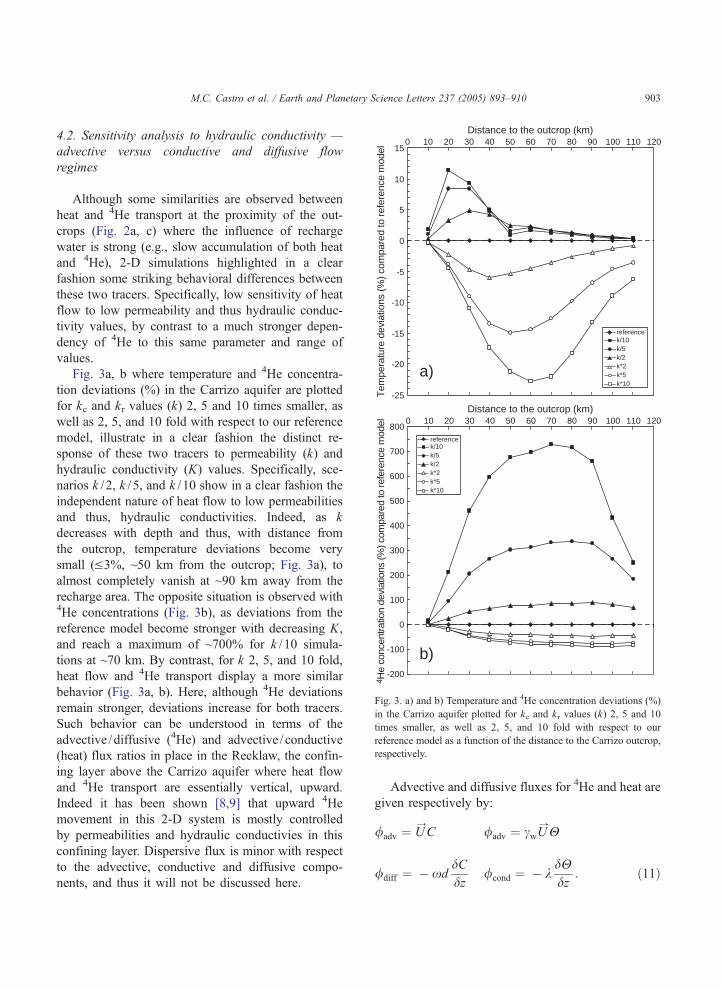
Fig. 4 represents the 4He advective /diffusive and
heat advective /conductive flux ratios computed in the
Recklaw as a function of distance from the outcrop
(recharge distance), intrinsic permeabilities (k) and
corresponding hydraulic conductivities (K). It is appar-
ent that both ratios decrease with increasing recharge
distance and decreasing K. However, while advection
largely dominates transport of 4He (advective /diffu-
sive fluxH1) throughout most of the formation, the
shift from advective to conductive heat flow (advec-
tive / conductive fluxc1) takes place at ~55 km, where
K~1.5*10�9 m s�1, and k~10�16 m2. Conduction
becomes the dominant transport mechanism (advec-
tive / conductive fluxc0.1) for K~2.1*10�10 m s�1
(k=8.9*10�18 m2) at ~90 km, entirely dominating
heat flow (advective / conductive fluxV0.01) for KV4.7*10�11 m s�1 (kV1.2*10�18 m2) at a distance of
~110 km. This contrasts markedly with the dominant
advective 4He transport over most of the domain (Fig.
4). Only for K =4.7*10�11 m s�1 at ~110 km does the
diffusive flux equals the advective one, and only at the
very end of the 2-D domain (K =3.9*10�11 m s�1;
0.001
0.01
0.1
1
10
100
1000
10000
1000000
Distance to the 10 20 30 40 50 60
φ4Headv/φ4Hediff
φheatadv/φheatcond
< ><<
advective heat flow
advective h
K (m s-1) 1.4*10-8 4.8*10-9 2*10-9 10-9
k>10 -16 m2
k (m2) 1.2*10-15 3.9*10-16 1.5*10-16 8.1*10
Fig. 4. 4He advective /diffusive /4Headv //4Hediff (closed squares), and
ratios computed in the Recklaw formation for our reference model as a fun
intrinsic permeabilities (k), and corresponding hydraulic conductivities (K
helium transport are indicated.
k =9.3*10�19 m2) does the diffusive flux become
dominant (advective /diffusive fluxc0.1). Even
here, the dominance of the conductive over the advec-
tive flux is stronger as compared to the diffusive versus
advective flux.
Our results are similar in nature to Bickle and
McKenzie [36] who, through a 1-D analysis, simulat-
ed heat and solute transport under conditions repre-
senting rocks undergoing metamorphism. These
authors subdivided fluid flow regimes into three clas-
ses (page 389): bone in which advection of both heat
and matter predominate, a second in which heat is
largely conducted but matter is advected, and a third
in which advection of both heat and matter is insig-
nificantQ. Here, we find these same three classes for
heat and 4He transport in the Recklaw Formation for
which the threshold between each class corresponds to
a specific k value. Threshold between the first and
second classes takes place at k~10�16 m2, and thresh-
old between the second and third classes takes place at
k~10�18 m2 (Fig. 4). The threshold value found in the
Recklaw for advective versus conductive heat flow is
outcrop (km)70 80 90 100 110 120
0.01
0.1
<>>
conductive heat flow
elium transport diffusive
10-104.4*10-10 2.1*10-10
conductive
10-16>k> ~10-18 m2
k< ~10-18 m2
-17 3.3*10-18 1.2*10-182.2*10-17 8.9*10-18
4.7*10-11
heat advective / conductive /heatadv //heatcond (open squares) flux
ction distance from the Carrizo outcrop (recharge distance), Recklaw
). Advective, conductive, and diffusive regimes for heat transfer and
M.C. Castro et al. / Earth and Planetary Science Letters 237 (2005) 893–910 905
also in agreement with findings by Smith and Chap-
man [6], as well as those found in many magmatic-
hydrothermal systems (see Manning and Ingebritsen
[37]).
The at least two order of magnitude difference
found between the permeability threshold for heat con-
duction (k~10�16 m2) and 4He diffusion (k~10�18 m2)
in the Recklaw Formation indicates that vertical heat
flow is far more independent of low permeabilities
and thus, hydraulic conductivities than 4He trans-
port. Consequently, the ability for heat to move
upward within at least this permeability range values
(10�16zkz10�18 m2) is far greater than that of4He (Fig. 4). Among geological formations that
typically lie on these low hydraulic conductivity /
permeability category are many igneous and meta-
morphic rocks (e.g., granites, basalts, gneiss, see
[37]) both in the near-surface and deep crust. We
now analyze the implications of these findings on
the observed 4He /heat flux ratios.
0
Distance to the10 20 30 40 50 6
k (m2) 1.2*10-15 3.9*10-16 1.5*10-16 8.1*1
10-11
10-12
10-13
10-17
10-16
10-15
10-14
φ4 He/
φhea
t (m
ol J
-1)
Study area (1.5*10-12)
Crust (cont. + oceans, 1.4*10-12)
Base Carrizo (7.4*10-14)
Mantle oceans(6.6*10-14)O'Nions & Oxburgh (1983)Oxburgh & O'Nions (1987)
< ><<
advective heat flow
advective
k>10 -16 m2
Crustal produc
Fig. 5. Steady-state advective 4He /heat (/4He //heat)adv (closed square
(closed triangles, solid line), and total 4He /heat (/4He //heat)total (closed b
Formation with respect to the distance from the Carrizo outcrop, and perm
(1.5*10�12 mol J�1; Table 2) as well as for the crust (1.4*10�12 mol J�1;
of the Carrizo (7.4*10�14 mol J�1), and that observed at the proximity of t
heat fluxes are also indicated for 4He transient state transport and heat flow4He /heat fluxes observed for transient 4He transport while under a steady
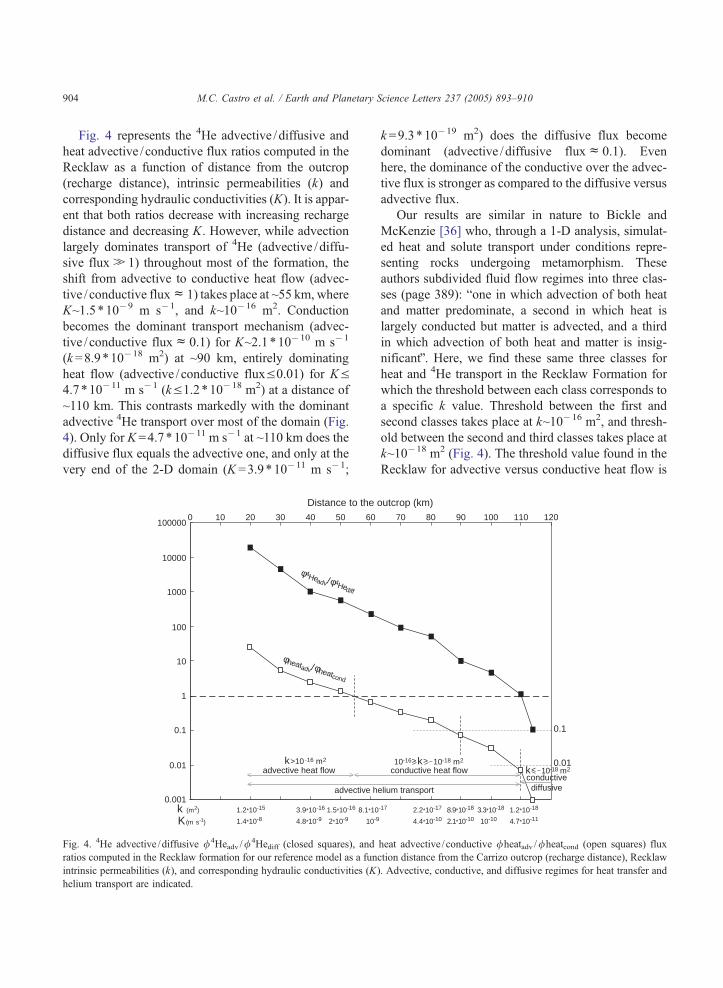
4.3. Impact of ASW, diffusion and conduction on
observed 4He /heat flux ratios
Fig. 5 represents the advective 4He /heat, 4He dif-
fusive /heat conductive, and the total 4He /heat verti-
cal flux ratios computed in the Recklaw Formation
with respect to distance from the outcrop, and perme-
abilities (k). Total 4He /heat flux remains unchanged
with or without dispersive flux. The following is
apparent: a) Advective 4He /heat flux ratios are
much lower than radiogenic crustal production ratios
(1.4–1.5*10�12 mol J�1) at the proximity of the
outcrop area (2.5*10�14 mol J�1, ~20 km; k =
1.2*10�15 m2). Here advection is the main transport
mechanism for both 4He and heat and advective 4He /
heat flux ratio equals that of total 4He /heat flux. Low
flux ratios are the result of ASW dilution exerted by
recharge water (atmospheric component) on 4He con-
centrations as opposed to its much smaller impact on
the thermal field (see Section 4.2, Fig. 3a, b). The
outcrop (km)0 70 80 90 100 110 120
0-17 3.3*10-18 1.2*10-18 2.2*10-17 8.9*10-18
(φ4He/φheat)total
4He transient state205 kyrsφ4Hediff
/φheatcond
(φ4He/φheat)adv
(φ4He/φheat)total
<>>
conductive heat flow
helium transport
conductivediffusive
10-16>k> ~10-18 m2 k< ~10-18 m2
tion ratio
s, solid line), 4He diffusive /heat conductive (/4Hediff //heatcond)
lack circles, solid line) vertical flux ratios computed in the Recklaw
eabilities (k). Crustal radiogenic production ratios for the study area
Table 5) are indicated. External total 4He /heat flux entering the base
he ocean ridges [1,2] are indicated (6.6*10�14 mol J�1). Total 4He /
steady-state at ~205 kyrs (dashed line, closed gray circles). Low total
-state heat flow regime are also indicated (gray area).
M.C. Castro et al. / Earth and Planetary Science Letters 237 (2005) 893–910906
greater impact of ASW on He as compared to heat in
an advective dominated regime such as the recharge
area can be understood in terms of the respective
diffusive (He) and thermal (heat) Peclet numbers,
given respectively by [38]:
Pediffusive ¼UL
xdPethermal
¼ cwUL
kð12Þ
where L is a characteristic length of the porous media
(thickness of the Recklaw Formation, for example). If
both Peclet numbers are H1 both heat and He ad-
vective fluxes entirely dominate with respect to the
conductive and diffusive fluxes. At the proximity of
the recharge area, however, where the Darcy velocity
is ~2.4*10�9 ms�1 and L~120 m, the diffusive Peclet
number is much greater (~3460) than the thermal one
(~1.1). Thus, while advection entirely dominates over
diffusion, thermal conduction plays a non-negligible
role with respect to advection. This greater dominance
of advection over diffusion as compared to conduction
in the recharge area is precisely at the origin of the
greater ASW impact on He concentrations as com-
pared to temperatures and translates directly into a
much greater diffusive Peclet number as compared to
the thermal one. As impact of ASW decreases due to
permeability and hydraulic conductivity decrease, ad-
vective 4He /heat flux ratios increase steadily by up to
about two orders of magnitude to approach radiogenic
production values only when the impact of ASW
water (not shown) on both tracers is negligible
(b1%), with kV3.3*10�18 m2 (100–110 km). Trans-
port by advection however, is insignificant in this area
(Fig. 5); b) In contrast to advection, diffusion and
conduction play a negligible role on 4He and heat
transport at the proximity of the outcrop (~20 km;
Figs. 4 and 5) and 4He diffusive /heat conductive flux
ratios display extremely small values in this area
(7.8*10�17 mol J�1, Fig. 5). A stronger 4He concen-
tration than temperature gradient increase leads to a
steady increase of this ratio with permeability and
hydraulic conductivity decrease, of up to 2.4*10�14
mol J�1 (113.75 km; k =9.3*10�19 m2). Here, trans-
port by diffusion and conduction is dominant and 4He
diffusive /heat conductive flux equals that of total4He /heat flux ratios.
It can also be seen that although advective 4He /
heat and diffusive 4He /conductive heat fluxes vary
over several orders of magnitude, total 4He /heat flux
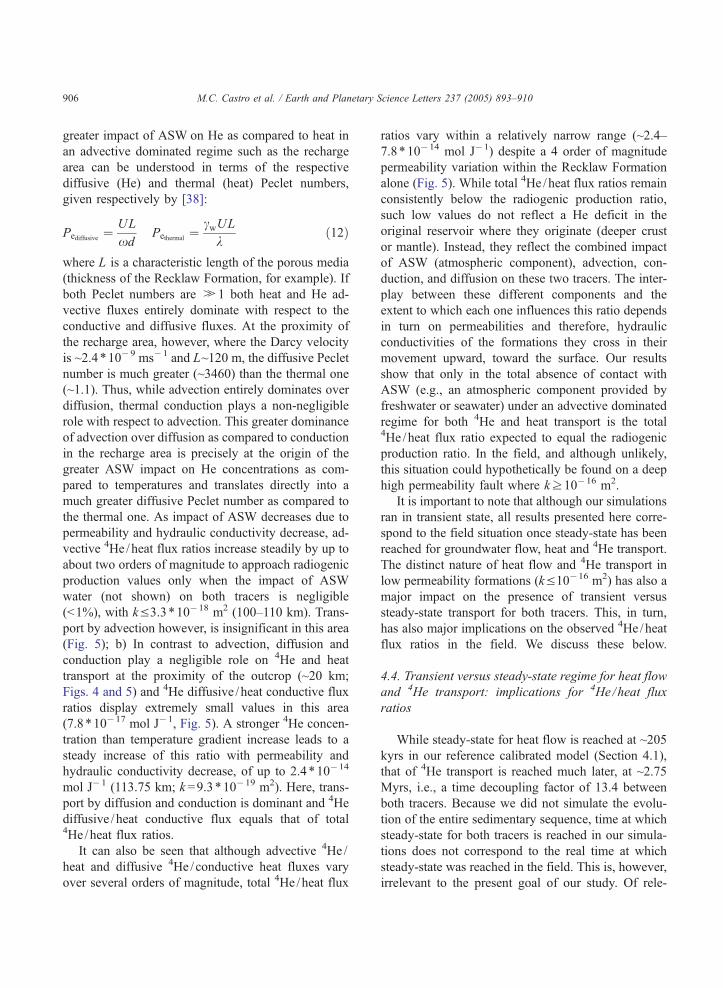
ratios vary within a relatively narrow range (~2.4–
7.8*10�14 mol J�1) despite a 4 order of magnitude
permeability variation within the Recklaw Formation
alone (Fig. 5). While total 4He /heat flux ratios remain
consistently below the radiogenic production ratio,
such low values do not reflect a He deficit in the
original reservoir where they originate (deeper crust
or mantle). Instead, they reflect the combined impact
of ASW (atmospheric component), advection, con-
duction, and diffusion on these two tracers. The inter-
play between these different components and the
extent to which each one influences this ratio depends
in turn on permeabilities and therefore, hydraulic
conductivities of the formations they cross in their
movement upward, toward the surface. Our results
show that only in the total absence of contact with
ASW (e.g., an atmospheric component provided by
freshwater or seawater) under an advective dominated
regime for both 4He and heat transport is the total4He /heat flux ratio expected to equal the radiogenic
production ratio. In the field, and although unlikely,
this situation could hypothetically be found on a deep
high permeability fault where kz10�16 m2.
It is important to note that although our simulations
ran in transient state, all results presented here corre-
spond to the field situation once steady-state has been
reached for groundwater flow, heat and 4He transport.
The distinct nature of heat flow and 4He transport in
low permeability formations (kV10�16 m2) has also a
major impact on the presence of transient versus
steady-state transport for both tracers. This, in turn,
has also major implications on the observed 4He /heat
flux ratios in the field. We discuss these below.
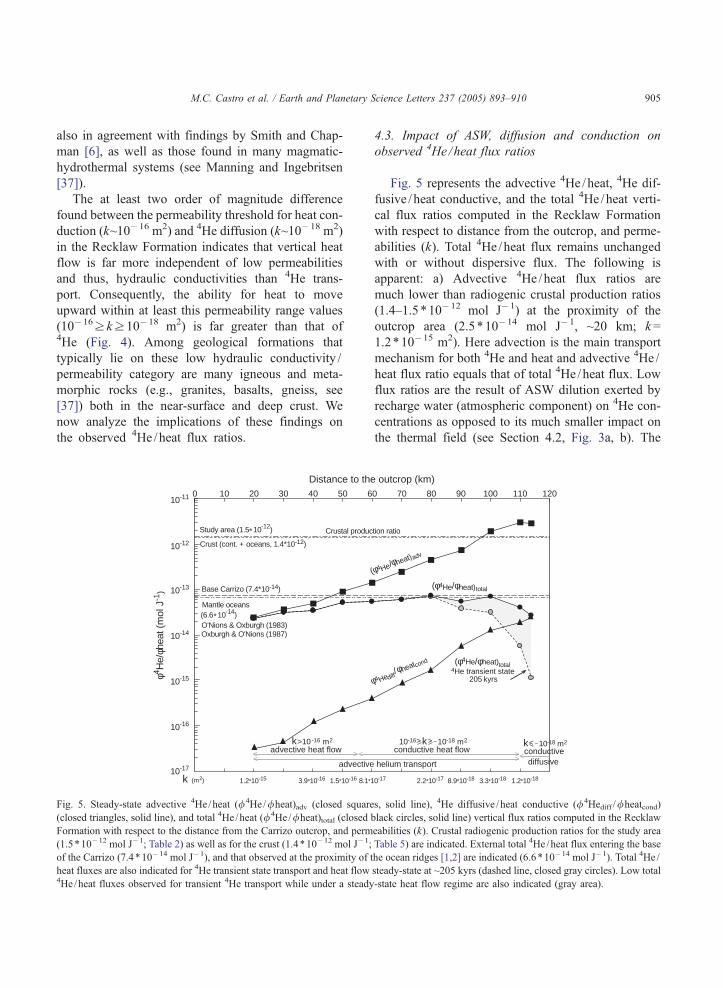
4.4. Transient versus steady-state regime for heat flow
and 4He transport: implications for 4He /heat flux
ratios
While steady-state for heat flow is reached at ~205
kyrs in our reference calibrated model (Section 4.1),
that of 4He transport is reached much later, at ~2.75
Myrs, i.e., a time decoupling factor of 13.4 between
both tracers. Because we did not simulate the evolu-
tion of the entire sedimentary sequence, time at which
steady-state for both tracers is reached in our simula-
tions does not correspond to the real time at which
steady-state was reached in the field. This is, however,
irrelevant to the present goal of our study. Of rele-
0
10
20
30
40
50
60
70
80
90
100
0
Distance to the outcrop (km)10 20 30 40 50 60 70 80 90 100 110 120
% o
f ste
ady
stat
e 4 H
e co
ncen
trat
ion
reac
hed
at 2
05 k
yrs
< >< >k>10-16 m2 10-16>k>~ 10-17 m2 k<~ 10-17 m2
<
Fig. 6. Percentage of 4He concentrations at ~205 kyrs (heat flow
steady-state) with respect to total 4He concentrations at ~2.75 Myrs
(4He steady-state transport) as a function of distance from the
Carrizo outcrop area and permeabilities (k).
M.C. Castro et al. / Earth and Planetary Science Letters 237 (2005) 893–910 907
vance is the deep decoupling in time and space
displayed between these two tracers under certain
initial and boundary conditions within similar geo-
logical and hydrogeological contexts. Such decou-
pling is controlled by the permeabilities and
hydraulic conductivities of the formations in place,
and relates also directly to the thermal and helium
diffusivities in areas in which conduction and diffu-
sion are the dominant transport mechanisms of these
two tracers. If one considers a simple monodimen-
sional analysis thus, neglecting effects in place in a
real 2- or 3-D system such as those resulting from
cross-formational flow, decoupling of heat and He
can be investigated by looking at the diffusivity ratio
(dimensionless) of these two tracers given by:
thermal diffusivity
helium diffusivity¼ k=c
d: ð13Þ
Estimation of the diffusivity ratio for the Recklaw
Formation (Table 1) yields a value of ~662. Thus, if
advection were to be negligible over the entire do-
main, and heat and He transport by conduction and
diffusion were entirely dominant, a time decoupling
factor of ~662 between these two tracers would be
observed. Advection, however, the dominant trans-
port mechanism for He over most of the domain’s
extent (e.g., Fig. 4), greatly reduces the observed
decoupling factor in our reference model (~13). Sen-
sitivity tests have shown that as hydraulic conduc-
tivities increase (e.g., Fig. 3a, b), thus enhancing the
role of advection for both tracers, decoupling be-
tween these two tracers greatly decreases. Indeed,
steady-state is reached simultaneously for both tra-
cers in areas where kz10�16 m2 (Fig. 6), i.e., in
areas where transport is dominated by advection. By
contrast, time decoupling between these tracers
increases as k decreases. Fig. 6 shows the percentage
of 4He concentrations at ~205 kyrs (heat flow
steady-state) with respect to total 4He concentrations
at ~2.75 Myrs (4He steady-state transport) as a func-
tion of distance from the outcrop area and perme-
abilities. The latter illustrates space decoupling in a
clear fashion. Specifically, decoupling of 4He
becomes particularly strong at ~90 km for k~10�17
m2 (~92%), and increases steeply with k decrease,
to reach only ~7% of total 4He at 113.75 km
(k =9.3*10�19 m2). As k further decreases, the
time decoupling factor between these two tracers
increases. For example, heat and 4He are decoupled
by a time factor of 30 in scenario k / 10 (see Section
4.2), with steady-state for heat and 4He reached at
~430 kyrs and ~13 Myrs, respectively.
Absence of 4He transport steady-state directly
impacts total 4He /heat fluxes. Indeed, while steady-
sate for heat flow is in place at ~205 kyrs (reference
model) and heat fluxes remain unchanged, 4He fluxes
are much lower in areas with 10�17zkz9.3*10�19
m2 leading to total 4He /heat fluxes of over an order of
magnitude smaller (dashed line, Fig. 5) than those
corresponding to steady-state for both tracers (solid
line, Fig. 5). Thus, total 4He /heat flux values as low
as 10�15 mol J�1 can be found in the presence of 4He
transient state (~205 kyrs–2.75 Myrs) under this par-
ticular scenario.
Because many igneous and metamorphic forma-
tions display k b10�17 m2, this steep time decoupling
directly impacts 4He /heat flux ratios in areas of recent
(Miocene, Pliocene, Quaternary) magmatic or volca-
nic activity. Indeed, with the exception of fault areas
where transport is by advection (kz10�16 m2), pos-
itive thermal anomalies might be observed while in
total absence (or slight presence) of a mantle He
component in such areas. For example, heat and
M.C. Castro et al. / Earth and Planetary Science Letters 237 (2005) 893–910908
helium patterns observed in the central European
Rhine Graben (e.g., [19]) might be the result of
such temporal decoupling. By contrast, areas in
which magmatic chambers that cooled at earlier
times are located might give rise to observed positive
mantle He anomalies while in the total absence of
thermal anomalies.
4.5. Low 4He /heat flux ratios — implications for the
terrestrial He budget and the mantle helium–heat
imbalance
Two decades ago, based on the observed low man-
tle He /heat flux value of 6.6*10�14 mol J�1 at the
proximity of mid-ocean ridges [1,2] concluded that
the amount of U and Th required to support the
oceanic radiogenic He flux would only provide ~5%
of the mantle heat flux. This low He /heat flux ratio is
at the origin of the mantle helium–heat imbalance and
the theory of a layered mantle with an impermeable
boundary to He that could explain the discrepancy
observed [1,2]. Recently, van Keken et al. [3] claimed
once again that the mantle helium–heat imbalance
remains a robust observation. However, the assump-
tions behind their study were similar to those adopted
by [1,2], i.e., similar transport efficiencies for He and
heat transport in the crust in addition to the presence
of a steady-state transport regime. These authors thus
conclude (page 423): bTherefore, the issue of separa-
tion of heat from helium centers only on the mantle
fluxesQ.We have shown that transport of 4He and heat is of a
different nature for a high range of permeability values
(kV10�16 m2) found in metamorphic and igneous
rocks at all depths in the crust [37]. Consequently, the
assumption behind the continental 4He crustal flux
estimation by [1] based on similar transport properties
of both heat and He in the crust is invalidated. We have
also shown that total 4He /heat flux ratios lower than
radiogenic production ratios do not reflect a He deficit
in the original reservoir (deep crust or mantle) as com-
pared to heat. Instead, they reflect the combined impact
of ASW, advection, conduction, and diffusion when
steady-state is reached for both tracers in addition to the
presence of a possible transient state regime for He
transport alone (Fig. 5). We thus argue that the ob-
served low mantle He /heat flux ratio observed in the
oceans (see Table 5, Fig. 5) might be, at least partially,
the result of processes occurring in the oceanic crust
similar to those occurring in the continental crust,
rather than deeper into the mantle.
Our simulations indicate that in order for both heat
and He to be in steady-state in recently formed crust,
the presence of an advective dominated regime is
required (kz10�16 m2, Fig. 6, Section 4.4). Under
these conditions, only in total absence of contact with
ASW (e.g., an atmospheric component provided by
seawater) is the total 4He /heat flux ratio expected to
equal the radiogenic production ratio (1.5*10�12 mol
J�1, Fig. 5). Lower 4He /heat flux ratios in an advec-
tive dominated regime require the incorporation of an
ASW component. We thus argue that the observed
low ocean mantle 4He /heat flux [1,2] results, at least
partially, from sea water incorporation within mid-
ocean ridge basalts (MORB). Our findings are strong-
ly supported by noble gas data from a number of
MORB glasses for which Fisher [39] concluded that
only the presence of variable but non-zero amounts of
atmospheric /hydrospheric noble gases can explain the
measured He, Ar, and Xe in a coherent manner.
Our simulations also suggest that 4He transport is in
transient state in recently formed crust for kV10�17 m2
(Fig. 6), i.e., likely in most active sea-floor spreading
centers. Under these conditions, low to very low man-
tle He excesses and thus total He /heat fluxes up to
several orders of magnitude lower than the radiogenic
production ratios are likely to be observed (e.g., Fig. 5,
gray area). These findings are also supported by direct
field observations. Indeed, the mantle He /heat flux
ratio reported by [1,2] as representative of the Earth’s
mantle comes from one single spreading center, the
East Pacific Rise, from samples collected at the triple-
junction of the Pacific, Cocos and Nazca Plate by
Craig et al. [40]. These authors point out that much
smaller mantle He anomalies were found in the Atlan-
tic, and that no maximum 3He / 4He ratio anomalies
could be identified in the South Pacific. It is also of
interest to note the contrast between observed4He / 40Ar ratios in basalts from the Mid-Atlantic
Ridge (MAR) and those from the East Pacific Rise
(EPR) [39]. While the first are consistently greater than
mean radiogenic production ratios, EPR 4He / 40Ar
ratios are, for the most part, close to the mean radio-
genic production value. Comparable 4He / 40Ar values
to those of MAR were also found in the Paris Basin
[10,11]. Such decoupling between 4He and 40Ar is due
M.C. Castro et al. / Earth and Planetary Science Letters 237 (2005) 893–910 909
to preferential transport by diffusion of 4He in a low
permeability formation (k~4*10�19 m2). Decoupling
of 4He / 40Ar in the MAR thus suggests the presence of
a low permeability oceanic crust in the area, and thus,
the presence of transient state for 4He transport as
opposed to a potential 4He steady-state in a more
permeable EPR crust.
5. Summary
Simulations of groundwater flow, heat transfer and4He transport were conducted simultaneously in the
Carrizo aquifer and surrounding formations in south-
west Texas. Results indicate that the driving transport
mechanisms for He and heat are of a fundamentally
different nature in the crust, thus rendering assump-
tions made by O’Nions and Oxburgh [1] and Oxburgh
and O’Nions [2] for estimation of the terrestrial crustal4He flux based on heat considerations unsound.
It is shown that 4He /heat flux ratios below the
radiogenic production ratio do not reflect a He deficit
in the original reservoir where they originate (deeper
crust or mantle). Instead, they reflect the combined
impact of ASW, advection, conduction, and diffusion
on these two tracers. The interplay between these
different components and the extent to which each
one influences this ratio depends on permeabilities
and therefore, hydraulic conductivities of the forma-
tions they cross in their movement toward the surface.
Our results show that only in total absence of contact
with ASW (e.g., an atmospheric component provided
by freshwater or seawater) under an advective domi-
nated regime for both 4He and heat transport is the
total 4He /heat flux ratio expected to equal the radio-
genic production ratio. Our simulations also suggest
that 4He transport is in transient state in recently
formed low permeability crust leading to low He /
heat flux ratios in these formations.
Low mantle He /heat flux ratios reported at the
proximity of mid-ocean ridges might be, at least par-
tially, the result of processes occurring in the oceanic
crust similar to those occurring in the continental crust,
rather than deeper into the mantle. Overall, and with-
out consideration for additional processes that might
affect these two tracers in the mantle (e.g., Albarede
[14], Anderson [15]), our simulations show that there
is at present no scientific basis to support the existence
of a mantle helium–heat imbalance and consequently,
the presence of a layered mantle in which removal of
He is impeded from the lower mantle [1,2]. Anderson
[13,41] has previously suggested that both He and CO2
may be trapped in the shallow mantle, a hypothesis
that is consistent with our simulation results for low
permeability and hydraulic conductivity formations.
Alternative mantle structures and convection models
are possible for which the presence of a deep imper-
meable boundary to He is not required (see e.g.,
Albarede [14], Anderson [15]).
Acknowledgments
The authors thank F. Albarede and D.L. Anderson
for their constructive comments which lead to a much
improved final version of this manuscript. The authors
also thank S. King for the editorial handling of this
manuscript. Financial support by the U.S. National
Science Foundation grant EAR-03087 07, the Eliza-
beth Caroline Crosby Research Award (NSF AD-
VANCE at the University of Michigan), and the
bMinistere des Affaires EtrangeresQ, France, for D.
Patriarche through the program bBourse LavoisierQ,is greatly appreciated.
References
[1] R.K. O’Nions, E.R. Oxburgh, Heat and helium in the Earth,
Nature 306 (1983) 429–431.
[2] E.R. Oxburgh, R.K. O’Nions, Helium loss, tectonics, and the
terrestrial heat budget, Science 237 (1987) 1583–1588.
[3] P.E. van Keken, C.J. Ballentine, D. Porcelli, A dynamical
investigation of the heat and helium imbalance, Earth Planet.
Sci. Lett. 188 (2001) 421–434.
[4] H.N. Pollack, The heat flow from the earth: a review, in: P.A.
Davies, S.K. Runcorn (Eds.), Mechanisms of Continental
Drift and Plate Tectonics, Academic Press, London, 1980,
pp. 183–192.
[5] M. Ozima, F.A. Podosek, Noble Gas Geochemistry, Cam-
bridge University Press, New York, 2002, 286 pp.
[6] L. Smith, D.S. Chapman, On the thermal effects of ground-
water-flow: 1. Regional scale systems, J. Geophys. Res. 88
(B1) (1983) 593–608.
[7] D. Deming, Regional permeability estimates from investiga-
tions of coupled heat and groundwater-flow, North Slope of
Alaska, J. Geophys. Res. 98 (B9) (1993) 16271–16286.
[8] M.C. Castro, P. Goblet, Calibration of regional groundwater
flow models — working toward a better understanding of site-
M.C. Castro et al. / Earth and Planetary Science Letters 237 (2005) 893–910910
specific systems, Water Resour. Res. 39 (6) (2003) 1172,
doi:10.1029/2002WR001653.
[9] D. Patriarche, M.C. Castro, P. Goblet, Large-scale hydraulic
conductivities inferred from three-dimensional groundwater
flow and 4He transport modeling in the Carrizo aquifer,
Texas, J. Geophys. Res. 109 (2004) B11202, doi:10.1029/
2004JB003173.
[10] M.C. Castro, A. Jambon, G. de Marsily, P. Schlosser, Noble
gases as natural tracers of water circulation in the Paris Basin:
1. Measurements and discussion of their origin and mechan-
isms of vertical transport in the basin, Water Resour. Res. 34
(10) (1998) 2443–2466.
[11] M.C. Castro, P. Goblet, E. Ledoux, S. Violette, G. de Marsily,
Noble gases as natural tracers of water circulation in the Paris
Basin: 2. Calibration of a groundwater flow model using
noble gas isotope data, Water Resour. Res. 34 (10) (1998)
2467–2483.
[12] M.C. Castro, Helium sources in passive margin aquifers —
new evidence for a significant mantle 3He source in aquifers
with unexpectedly low in-situ 3He / 4He production, Earth
Planet. Sci. Lett. 222 (2004) 897–913.
[13] D.L. Anderson, A model to explain the various paradoxes
associated with mantle noble gas geochemistry, Proc. Natl.
Acad. Sci. U. S. A. 95 (1998) 9087–9092.
[14] F. Albarede, The survival of mantle geochemical heterogene-
ities, AGU Monograph, in press.
[15] D.L. Anderson, Self-gravity, Self-consistency and Self-organi-
zation in Geodynamics and Geochemistry, AGU Monograph
Series, in press.
[16] G. Garven, R.A. Freeze, Theoretical analysis of the role of
groundwater flow in the genesis of strata bound ore deposits 1.
Mathematical and numerical model, Am. J. Sci. 284 (1984)
1085–1124.
[17] G. Garven, Continental-scale groundwater flow and geologic
processes, Annu. Rev. Earth Planet. Sci. 23 (1995) 89–117.
[18] M. Person, J.P. Raffensperger, S.M. Ge, G. Garven, Basin-scale
hydrogeologic modeling, Rev. Geophys. 34 (1) (1996) 61–87.
[19] C. Clauser, E. Griesshaber, H.J. Neugebauer, Decoupled ther-
mal and mantle helium anomalies: implications for the trans-
port regime in continental rift zones, J. Geophys. Res. 107
(B11) (2002) 2269, doi:10.1029/2001JB000675.
[20] D.G. Bebout, V.J. Gavenda, A.R. Gregory, Geothermal
Resources, Wilcox Group, Texas Gulf Coast, Bur. Econ.
Geol., Univ. Texas, Austin, 1978, 82 pp.
[21] H.S. Hamlin, Depositional and groundwater flow systems of
the Carrizo–Upper Wilcox, South Texas, Bur. Econ. Geol,
Rep. of Invest., vol. 175, 61 pp.
[22] H.B. Harris, Groundwater resources of LaSalle and McMullen
Counties, Texas, Texas Water Development Board Bulletin,
vol. 6520, 1965, 9 pp.
[23] W.H. Alexander, D.E. White, Groundwater resources of Atas-
cosa and Frio Counties, Rep., vol. 32, Texas Water Develop-
ment Board, Texas, 1966, 211 pp.
[24] D.S. Sawyer, R.T. Buffler, R.H. Jr. Pilger, The crust under
the Gulf of Mexico Basin, The Geology of North America,
vol. J, The Gulf of Mexico Basin, Geol. Soc. Am. (1991)
53–72.
[25] W.R. Dickinson, T.F. Lawton, Carboniferous to Cretaceous
assembly and fragmentation of Mexico, GSA Bull. 113 (9)
(2001) 1142–1160.
[26] P. Goblet, Programme METIS: Simulation d’ecoulement et de
Transport Miscible en Milieu Poreux et Fracture – Notice de
conception – Mise a jour au 1er/11/99, 1999 (Rapport CIG/
LHM/RD/99/38).
[27] Texas Water Development Board, Ground-Water Data-
base, Texas Water Development Board, 2003 (http://www.
twdb.state.tx.us/publications/reports/GroundWaterReports/
GWDatabaseReports/GWdatabaserpt.htm).
[28] L. Rybach, L. Stegena, R. Haenel, Determination of heat
production rate, in: R. Haenel, L. Rybach, L. Stegena (Eds.),
Handbook of Terrestrial Heat-Flow Density Determination,
Kluwer Academic Publishers, Dordrecht, 1988, pp. 125–142.
[29] R.L. Parker, Composition of the Earth’s crust, Data of Geo-
chemistry, 6th edition. U.S. Geological Survey Professional
Paper, 1967, pp. 1–19, Chapter D, U.S.G.S. 0440-D.
[30] M.C. Castro, M. Stute, P. Schlosser, Comparison of 4He and14C ages in simple aquifer systems: implications for ground-
water flow and chronologies, Appl. Geochem. 15 (2000)
1137–1167.
[31] S.M. Smith, National Geochemical Database: Reformatted
data from the National Uranium Resource Evaluation
(NURE) Hydrogeochemical and Stream Sediment Recon-
naissance (HSSR) Program, Version 1.30, Open-File Report
97–492, U.S. Geological Survey, 2001 (WWW release
only: http://greenwood.cr.usgs.gov/pub/open-file-reports/ofr-
97-0492/index.html).
[32] R.H. Steiger, E. Jager, Subcomission on geochronology: con-
vention on the use of decay constant in gas and cosmochro-
nology, Earth Planet, Sci. Lett. 36 (1977) 359–362.
[33] M. Stute, P. Schlosser, J.F. Clark,W.S. Broecker, Paleotempera-
tures in the southwestern United States derived from noble gas
measurements in groundwater, Science 256 (1992) 1000–1003.
[34] S.P. Clark Jr., A.E. Ringwood, Density distribution and con-
stitution of the mantle, Rev. Geophys. 2 (1964) 35–88.
[35] S.R. Taylor, S.M. McLennan, The Continental Crust: Its Com-
position and Evolution: Blackwell Scientific, Mass, Oxford,
1985, 312 pp.
[36] M.J. Bickle, D. McKenzie, The transport of heat and matter by
fluids during metamorphism, Contrib. Mineral Petrol. 95
(1987) 384–392.
[37] C.E. Manning, S.E. Ingebritsen, Permeability of the continen-
tal crust: implications of geothermal data and metamorphic
systems, Rev. Geophys. 37 (1) (1999) 127–150.
[38] G. de Marsily, Quantitative Hydrogeology, Academic Press,
London, 1986, 440 pp.
[39] D.E. Fisher, Rare gas abundances in MORB, Geochim. Cos-
mochim. Acta 50 (1986) 2531–2541.
[40] H. Craig, W.B. Clarke, M.A. Beg, Excess 3He in deep water
on the East Pacific Rise, Earth Planet. Sci. Lett. 26 (1975)
125–132.
[41] D.L. Anderson, A theory of the Earth: Hutton and Humpty-
Dumpty and Holmes, in: G.Y. Craig, J.H. Hull (Eds.), James
Hutton — Present and Future, Special Publications, vol. 150,
Geological Society, London, 1999, pp. 13–35.
Copyright © 2022 FDOKUMEN