Laser-rf creation and diagnostics of seeded atmospheric pressure air and nitrogen plasmas
Upload
independentCategory
view
2download
0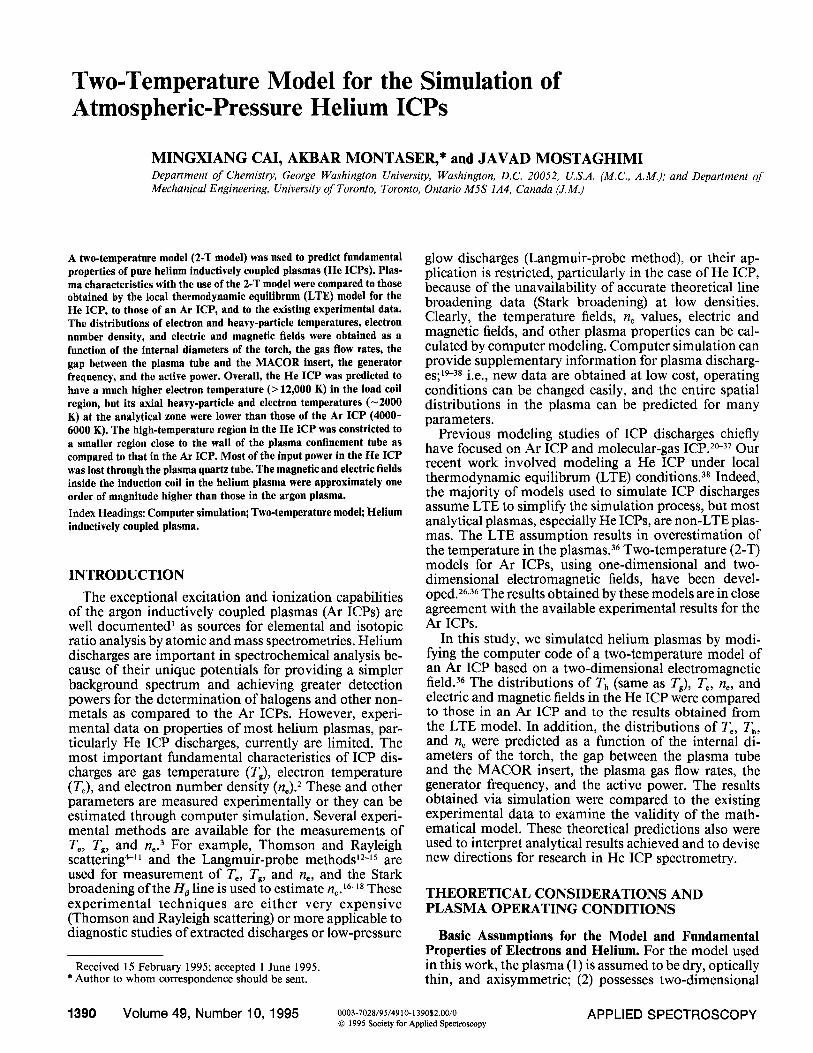
Two-Temperature Model for the Simulation of Atmospheric-Pressure Helium ICPs
MINGXIANG CAI, AKBAR MONTASER,* and J A V A D M O S T A G H I M I Department of Chemistry, George Washington University, Washington, D.C. 20052, U.S.A. (M.C., A.M.); and Department of Mechanical Engineering, University of Toronto, Toronto, Ontario M5S 1A4, Canada (J.M.)
A two-temperature model (2-T model) was used to predict fundamental properties of pure helium inductively coupled plasmas (He ICPs). Plas- ma characteristics with the use of the 2-T model were compared to those obtained by the local thermodynamic equilibrum (LTE) model for the He ICP, to those of an Ar ICP, and to the existing experimental data. The distributions of electron and heavy-particle temperatures, electron number density, and electric and magnetic fields were obtained as a function of the internal diameters of the torch, the gas flow rates, the gap between the plasma tube and the MACOR insert, the generator frequency, and the active power. Overall, the He ICP was predicted to have a much higher electron temperature (>12,000 K) in the load coil region, but its axial heavy-particle and electron temperatures (~2000 K) at the analytical zone were lower than those of the Ar ICP (4000- 6000 K). The high-temperature region in the He ICP was constricted to a smaller region close to the wall of the plasma confinement tube as compared to that in the Ar ICP. Most of the input power in the He ICP was lost through the plasma quartz tube. The magnetic and electric fields inside the induction coil in the helium plasma were approximately one order of magnitude higher than those in the argon plasma.
Index Headings: Computer simulation; Two-temperature model; Helium inductively coupled plasma.
INTRODUCTION
The exceptional excitation and ionization capabilities of the argon inductively coupled plasmas (At ICPs) are well documented ~ as sources for elemental and isotopic ratio analysis by atomic and mass spectrometries. Helium discharges are important in spectrochemical analysis be- cause of their unique potentials for providing a simpler background spectrum and achieving greater detection powers for the determination of halogens and other non- metals as compared to the Ar ICPs. However, experi- mental data on properties of most helium plasmas, par- ticularly He ICP discharges, currently are limited. The most important fundamental characteristics of ICP dis- charges are gas temperature (Tg), electron temperature (T~), and electron number density (no). 2 These and other parameters are measured experimentally or they can be estimated through computer simulation. Several experi- mental methods are available for the measurements of Te, Tg, and no. 3 For example, Thomson and Rayleigh scattering 4-~ and the Langmuir-probe methods t2-15 are used for measurement of To, Tg, and n~, and the Stark broadening of the H a line is used to estimate ne. t6-~s These exper imental techniques are either very expensive (Thomson and Rayleigh scattering) or more applicable to diagnostic studies of extracted discharges or low-pressure
Received 15 February 1995; accepted 1 June 1995. * Author to whom correspondence should be sent.
glow discharges (Langmuir-probe method), or their ap- plication is restricted, particularly in the case of He ICP, because of the unavailability of accurate theoretical line broadening data (Stark broadening) at low densities. Clearly, the temperature fields, ne values, electric and magnetic fields, and other plasma properties can be cal- culated by computer modeling. Computer simulation can provide supplementary information for plasma discharg- es; ~9-3s i.e., new data are obtained at low cost, operating conditions can be changed easily, and the entire spatial distributions in the plasma can be predicted for many parameters.
Previous modeling studies of ICP discharges chiefly have focused on Ar ICP and molecular-gas ICP? °-37 Our recent work involved modeling a He ICP under local thermodynamic equilibrum (LTE) conditions. 38 Indeed, the majority of models used to simulate ICP discharges assume LTE to simplify the simulation process, but most analytical plasmas, especially He ICPs, are non-LTE plas- mas. The LTE assumption results in overestimation of the temperature in the plasmas. 36 Two-temperature (2-T) models for Ar ICPs, using one-dimensional and two- dimensional electromagnetic fields, have been devel- oped? 6,36 The results obtained by these models are in close agreement with the available experimental results for the Ar ICPs.
In this study, we simulated helium plasmas by modi- fying the computer code of a two-temperature model of an Ar ICP based on a two-dimensional electromagnetic field. 36 The distributions of T h (same as T,), T¢, no, and electric and magnetic fields in the He ICP were compared to those in an Ar ICP and to the results obtained from the LTE model. In addition, the distributions of To, Th, and n~ were predicted as a function of the internal di- ameters of the torch, the gap between the plasma tube and the MACOR insert, the plasma gas flow rates, the generator frequency, and the active power. The results obtained via simulation were compared to the existing experimental data to examine the validity of the math- ematical model. These theoretical predictions also were used to interpret analytical results achieved and to devise new directions for research in He ICP spectrometry.
THEORETICAL CONSIDERATIONS AND PLASMA OPERATING CONDITIONS
Basic Assumptions for the Model and Fundamental Properties of Electrons and Helium. For the model used in this work, the plasma (1) is assumed to be dry, optically thin, and axisymmetric; (2) possesses two-dimensional
1390 Volume 49, Number 10, 1995 0003-7028/95/4910.139052.00/0 APPLIED SPECTROSCOPY © 1995 Society for Applied Spectroscopy
Model Experiment
t = i i i i-q t =
Rc
R3 ;
i,
II VT1
Q1
. . . . . . . . . . . . . . . . . . T . . . .
Z3
. . . . . . . . . .
Zl
VI2
FIG. 1. Schematic diagrams of the torches used in (left) the simulation charges.45-s
9-18 mm ~',
Quartz tube
Induction coil, l~j- 'J 4.5-turn
z ~roove depth ,45 mm
D ~ O-dngs e > >
I > I ~ > > >
'
> Oas > >
> >
Injector gas of the He ICP and (right) the experimental studies of the He ICP dis-
fields for gas flow, free electrons, temperatures, and elec- tromagnetic radiation; and (3) exhibits a Maxwellian ve- locity distribution for the electron. Finally, a collision- dominated plasma gas also is assumed. The present model cannot predict the effect of capacitive coupling, the im- pedance matching network, and the type of grounding for the load coil on the properties of the plasma.
The two-temperature model for He ICPs is the mod- ified version of that originally developed for the Ar ICP. 36 The results predicted in this study for the Ar ICP were obtained by applying the original model. 36 The recom- bination and ambipolar diffusion coefficients, the mo- mentum-transfer cross sections for electron collisions with atoms and molecules, and the partition functions of He and He + are taken from Refs. 39--42. Radiative losses for helium are not readily available, and thus they are as- sumed to be 1% of values reported for argon. 3s,43 The emissivity of helium is more than two orders of magni-
tudes less than that of argon. 43 Because emissivity is di- rectly proportional to radiative loss, radiative loss of he- lium should be less than 1% of total plasma energy. As shown previously (see figure 2 in Ref. 38), the effect of radiative loss on the distribution of heat in the He plasma is negligible. The equations for the conservation of mass, momentum, and boundary conditions are given in the appendix of Ref. 3 8. The electromagnetic fields, the equa- tions for conservation of energy (electron and atom/ion), and the ambipolar equation for predicting electron num- ber density in the plasma are presented elsewhere. 26,36 The calculation domain is 31 x 20 grids in the axial and radial directions, respectively. To monitor the convergence of the simulation, one uses two measures after each itera- tion: (1) the difference between active power before and after calculation, and (2) the sum of residuals for all fields. Normally, the simulation is terminated when the power difference and the sum of residuals for all the fields are
APPLIED SPECTROSCOPY 1391

70
E 60 E
50 . m
O 40
O
E 30 O i m
20
I
10
0
LTE
Temperatures 2-T
Streamlines LTE 2-T
-6 -3 0 3 6 -6 -3 0 3 6 -6 -3 0 3 6
T, Te & Th kK
1 l 2 l 3 l 4
6 8 10
i 12
Streamlines
0.1 l 0,2 l 0 .3 i 0,4 -,:~,~ ~ 0.5
0.6 l 0,7
0,8 0,9
Radius (mm) FIG. 2. Temperature distribution (left) and streamlines (right) in the He ICP obtained by the LTE model 38 and the two-temperature model. T = LTE temperature; Th = heavy-particle temperature; To = electron temperature; active power = 600 W; and torch i.d. = 13 mm. For the streamlines, 0.1 and 0.9 indicate ¼0th and ~0th, respectively, of the total helium mass flow rate between the axial channel and the corresponding streamline. The temperature steps are 1000 K for Th and 2000 K for To.
less than 5% and 1%, respectively. In this study, the typ- ical number of iterations is approximately 400 when a previous solution is used as a starting guess.
Torch Geometry and Operating Conditions. Schematic diagrams of torches used for the computer simulation and experiment are shown in Fig. 1 along with symbols for all relevant dimensions. The torch used in the experiment consists of three components: a high-precision quartz tube as the plasma confinement tube, a MACOR base, and a MACOR threaded insert. The plasma gas is tangentially introduced into the plasma along the threaded grooves, and the sample is carried into the plasma by the injector gas through the orifice at the center of the insert. The most critical parameters in the torch design are the ge- ometry of the grooves and the dimension of the grooves on the MACOR insert, which determine the flow pattern and total gas flow for sustaining the He ICP. For all pre- vious experimental studies of He ICP, the depth of the V-shaped groove cut on the MACOR insert was 0.45 mm.
Table I includes a list of typical operating conditions and the dimensions of the torches used in the simulation. The symbols R and Q refer to torch radius and gas flow rate, respectively. To simplify the simulation, it is as-
sumed that the intermediate tube is straight rather than threaded, and a 5-turn induction coil that is symmetric with respect to the axial channel is used instead of the 4.5-turn spiral coil used in the experiments.
RESULTS AND DISCUSSION
Comparison of the Temperature Fields Simulated by LTE and non-LTE Models. The two-dimensional LTE model was used in the previous simulation of the He ICP) s The LTE results predicted that the He ICP has a higher temperature than that of an Ar ICP. However, the high-temperature region was located in a small region close to the axial channel within the induction coil. These initial results did not agree well with the observed prop- erties of He ICPs generated in our laboratory. 44-51 For example, the actual plasma has a relatively wide axial channel, and the most intense emission from the plasma itself is found at the edge of the discharge.
The distributions of LTE temperature (T) and non-LTE temperatures (To and Th) are shown in Fig. 2 for an active power of 600 W. The highest LTE T in the He ICP is approximately 10,000 K, similar to the Te predicted by
1392 Volume 49, Number 10, 1995

H e A r H e A r 70
E 60 E
5O
. ~
0 4O
0
3O
E o
- -20 m
. m
"~10 I o
._1
-6 -3 o 3 8 - 9 - 6 - 3 o 3 6 9 -6 -3 o 3 o 9
R a d i u s ( m m )
To& Th, kK 1
l 2 l 3 l 4 l 5
6 l 7
8 10
i 12
Loglo(no), n'f 3
15 I l l 16 l 17
18 19
l 20 l 21 l 22
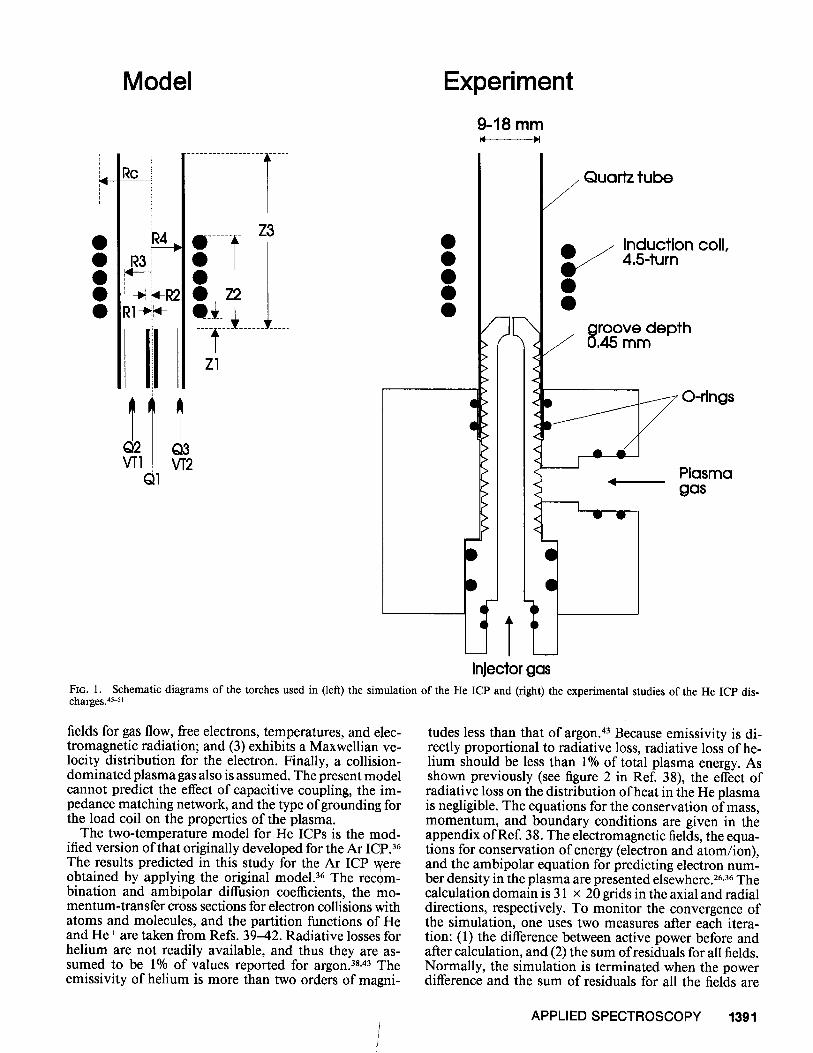
FIG. 3. Electron number density and temperature distributions in the He and the Ar ICP discharges at an active power of 800 W. Heavy-particle temperature (Th) and electron temperature (Te) in the He ICP (left) and in the Ar ICP (center). Electron number density distribution in the He and the Ar ICPs (right). Torch inner diameters are 13 and 18 mm for the He and the Ar ICPs, respectively. The temperature step of Th is 1000 K. The temperature steps of To are 1000 K and 2000 K for the Ar ICP and the He ICP, respectively. The step for log,o(no) is 1.
the non-LTE model. The heavy-particle temperature (Th), which is close to the gas-kinetic temperature (Tg), is much lower than Te or T and it is approximately 2000 K. The high-temperature regions for both To and Th are located far from the axial channel, close to the plasma confine- ment tube. These predicted results are in better agreement with our experimental observations.
The streamlines of He ICP are also shown in Fig. 2 (right) for the LTE and 2-T models. The scale on the figure for the streamlines indicates the fraction of total mass flow of helium; i.e., 0.1 indicates that l/~o, . of the helium mass flow rate is confined between the axial chan-
in our previous studies 44-5~) and 18 mm, respectively. The total gas flow rate is 8 and 16 L/min for He and Ar ICPs, respectively.
Electron temperature in the He ICP is much higher (inside load coil, off center) than that in the Ar ICP. Indeed, the highest electron temperatures in the two plas- mas are 4000 K apart, and they occur within the induction
TABLE I. Typical operating conditions and torch dimensions used in simulation of He and Ar ICP discharges.
nel and corresponding streamline. A laminar flow is ob- Torch internal diameter (mm) 9 13 18 18
served, and the recirculation eddys are found in the bot- R1 (mm) 0.25 0.25 0.25 0.50 tom of plasma for both models. In the LTE model, the R2 (mm) 3.8 5.8 8.1 2.3 hottest core is located at the center of the plasma, and in R3 (mm) 4.1 6.1 8.6 8.0 this region the magnitude of the streamlines is small. For R4 (mm) 4.5 6.5 9.0 9.0 the 2-T model, a smaller fraction of the total helium flows Rc (mm) 7.0 8.0 13.0 13.0
Z1 (mm) 3.0 3.0 3.0 3.0 close to the wall of the plasma torch in comparison to z2 (mm) 20.0 20.0 20.0 13.0 the flow predicted by the LTE model. The 2-T model z3 (mm) 70.0 70.0 100.0 100.0 presents a more realistic picture for the streamlines in the QI (L/min) 1 1 1 1 He ICP. Q2 (L/min) 0 0 0 0
Comparison of Predicted Properties of He and Ar ICP Q3 (L/min) 6 7 13 15 Plasma pressure (atm) 1 1 1 1
Discharges. Predicted contour lines of To, Th, and ne for Number for induction coil He and Ar ICP discharges are illustrated in Fig. 3 at an (turns) 5 5 5 3 active power of 800 W. The torch diameters for He and Active power (W) 600 800 1200 800 Ar plasmas are 13 mm (the most commonly used torch Radio frequency (MHz) 27.1 27.1 27.1 27.1
Parameters He ICPs Ar ICP
APPLIED SPECTROSCOPY 1393
He Ar He Ar 70
tE 60 v
¢.n 50
0 Q. 40 0
30
E 0
~ ....... - 2 0
..c N
I 10 0
._1
E x l 0 : (V/m) Hr x 1 03(A/m) Hz x 1 03 (A/m)
~ 2 ~ 0.2 ~ 1 ~ 4 4 ~=:~ 0.4 ~ 2 8 6 0.6 3 12 8 0.8 ~ 4 16 10 m 1.0 / 5 m 20
Hr x 103(A/m)
0.2 0.4 0.6 0.8
/ 1.0
Hz x 103(A/m)
0.4 0.8 1.2 1.6 2.0
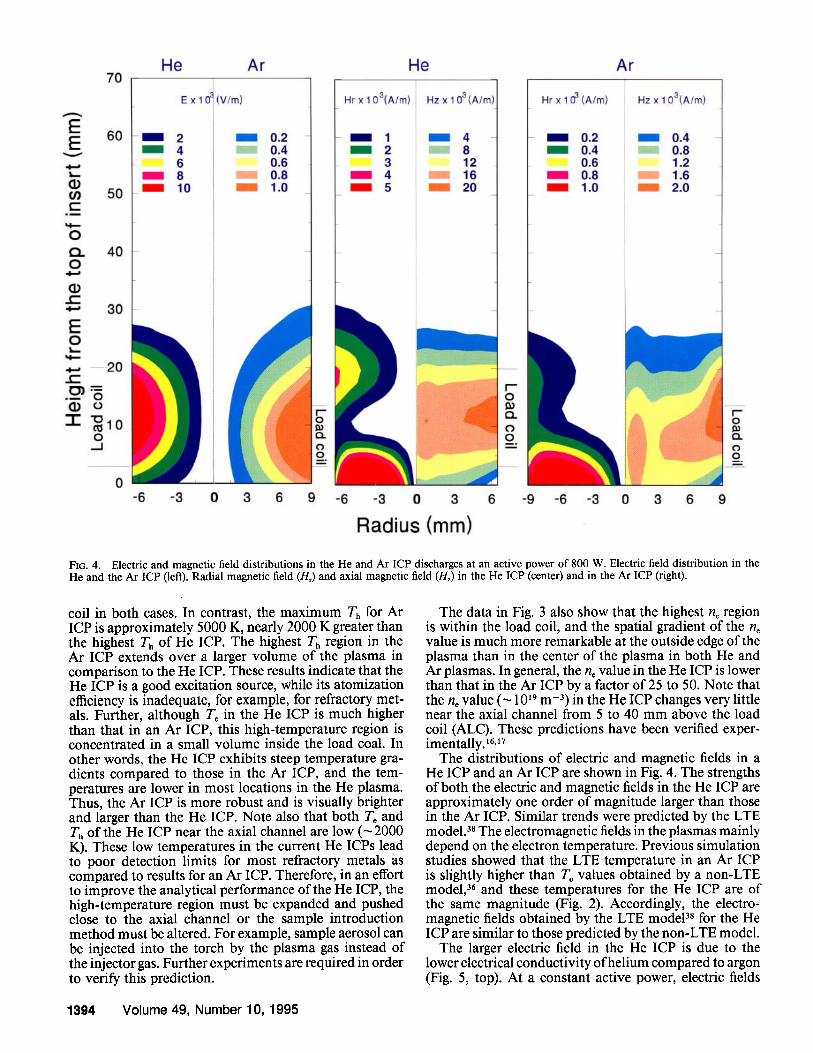
FIo. 4. He and the Ar ICP (left). Radial magnetic field (Hr) and axial magnetic field (Hz) in the He ICP (center) and in the Ar ICP (right).
-6 -3 0 3 6 9 -6 -3 0 3 6 -9 -6 -3 0 3 6 9
Radius (mm) Electric and magnetic field distributions in the He and Ar ICP discharges at an active power of 800 W. Electric field distribution in the
coil in both cases. In contrast, the maximum Th for Ar ICP is approximately 5000 K, nearly 2000 K greater than the highest Th of He ICP. The highest Th region in the Ar ICP extends over a larger volume of the plasma in comparison to the He ICP. These results indicate that the He ICP is a good excitation source, while its atomization efficiency is inadequate, for example, for refractory met- als. Further, although T~ in the He ICP is much higher than that in an Ar ICP, this high-temperature region is concentrated in a small volume inside the load coal. In other words, the He ICP exhibits steep temperature gra- dients compared to those in the Ar ICP, and the tem- peratures are lower in most locations in the He plasma. Thus, the Ar ICP is more robust and is visually brighter and larger than the He ICP. Note also that both Te and Th of the He ICP near the axial channel are low (~ 2000 K). These low temperatures in the current He ICPs lead to poor detection limits for most refractory metals as compared to results for an Ar ICP. Therefore, in an effort to improve the analytical performance of the He ICP, the high-temperature region must be expanded and pushed close to the axial channel or the sample introduction method must be altered. For example, sample aerosol can be injected into the torch by the plasma gas instead of the injector gas. Further experiments are required in order to verify this prediction.
The data in Fig. 3 also show that the highest no region is within the load coil, and the spatial gradient of the ne value is much more remarkable at the outside edge of the plasma than in the center of the plasma in both He and Ar plasmas. In general, the ne value in the He ICP is lower than that in the Ar ICP by a factor of 25 to 50. Note that the no value (~ 1019 m -3) in the He ICP changes very little near the axial channel from 5 to 40 mm above the load coil (ALC). These predictions have been verified exper- imentally. ,6., 7
The distributions of electric and magnetic fields in a He ICP and an Ar ICP are shown in Fig. 4. The strengths of both the electric and magnetic fields in the He ICP are approximately one order of magnitude larger than those in the Ar ICP. Similar trends were predicted by the LTE model. 38 The electromagnetic fields in the plasmas mainly depend on the electron temperature. Previous simulation studies showed that the LTE temperature in an Ar ICP is slightly higher than To values obtained by a non-LTE mode l , 36 and these temperatures for the He ICP are of the same magnitude (Fig. 2). Accordingly, the electro- magnetic fields obtained by the LTE model 38 for the He ICP are similar to those predicted by the non-LTE model.
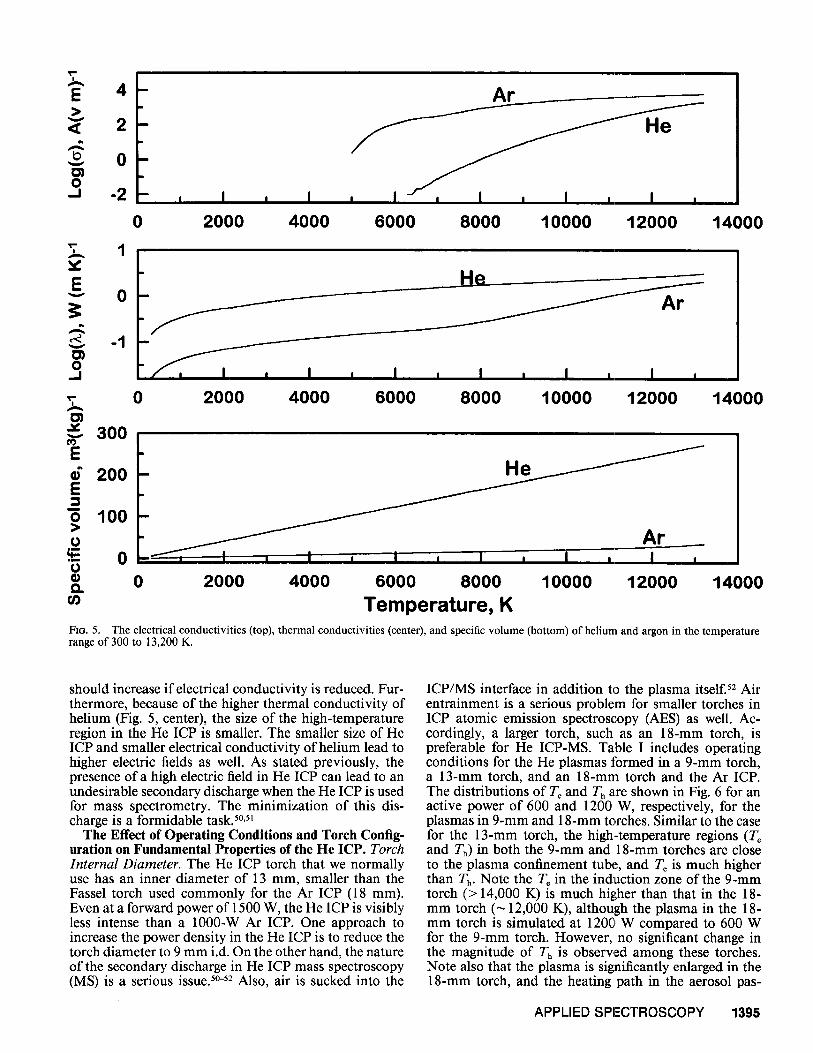
The larger electric field in the He ICP is due to the lower electrical conductivity of helium compared to argon (Fig. 5, top). At a constant active power, electric fields
1394 Volume 49, Number 10, 1995
' T "
E >
V
<
0 - I
0
- 2
i
2
, I
0 2 0 0 0
Ar
'
4 0 0 0 6 0 0 0 8 0 0 0 1 0 0 0 0 1 2 0 0 0 1 4 0 0 0
E v 0
v
0 --I
H e , _ r
1 l j A r
, I , I , I , I , I ,
• - 0 2 0 0 0 4 0 0 0 6 0 0 0 8 0 0 0 1 0 0 0 0 1 2 0 0 0 1 4 0 0 0 O)
.-.'¢ 3 0 0 O3
E 200 H e l ~ 1 1
E ~ ~
>o 1 0 0
A r ~
. - - i I , I , I , I , I , I , 0 ¢ 0 2 0 0 0 4 0 0 0 6 0 0 0 8 0 0 0 1 0 0 0 0 1 2 0 0 0 1 4 0 0 0 Q.
0o Temperature, K FIG. 5. The electrical conductivities (top), thermal conductivities (center), and specific volume (bottom) of helium and argon in the temperature range of 300 to 13,200 K.
should increase if electrical conductivity is reduced. Fur- thermore, because of the higher thermal conductivity of helium (Fig. 5, center), the size of the high-temperature region in the He ICP is smaller. The smaller size of He ICP and smaller electrical conductivity of helium lead to higher electric fields as well. As stated previously, the presence of a high electric field in He ICP can lead to an undesirable secondary discharge when the He ICP is used for mass spectrometry. The minimization of this dis- charge is a formidable task? °,sL
The Effect of Operating Conditions and Torch Config- uration on Fundamental Properties of the He ICP. Torch Internal Diameter. The He ICP torch that we normally use has an inner diameter of 13 mm, smaller than the Fassel torch used commonly for the Ar ICP (18 mm). Even at a forward power of 1500 W, the He ICP is visibly less intense than a 1000-W Ar ICP. One approach to increase the power density in the He ICP is to reduce the torch diameter to 9 mm i.d. On the other hand, the nature of the secondary discharge in He ICP mass spectroscopy (MS) is a serious issue, s°-52 Also, air is sucked into the
ICP/MS interface in addition to the plasma itself? 2 Air entrainment is a serious problem for smaller torches in ICP atomic emission spectroscopy (AES) as well. Ac- cordingly, a larger torch, such as an 18-mm torch, is preferable for He ICP-MS. Table I includes operating conditions for the He plasmas formed in a 9-mm torch, a 13-mm torch, and an 18-mm torch and the Ar ICP. The distributions of Te and Th are shown in Fig. 6 for an active power of 600 and 1200 W, respectively, for the plasmas in 9-mm and 18-mm torches. Similar to the case for the 13-ram torch, the high-temperature regions (Te and Th) in both the 9-mm and 18-mm torches are close to the plasma confinement tube, and To is much higher than Th. Note the To in the induction zone of the 9-mm torch (> 14,000 K) is much higher than that in the 18- mm torch (~ 12,000 K), although the plasma in the 18- mm torch is simulated at 1200 W compared to 600 W for the 9-mm torch. However, no significant change in the magnitude of Th is observed among these torches. Note also that the plasma is significantly enlarged in the 18-mm torch, and the heating path in the aerosol pas-
APPLIED SPECTROSCOPY 1395
70
60
E 5O
E v 40
30 t / ) C
• -- 20
0 10 Q..
0 0
(D
70 E 0 6O
4-' 50
O) "~ 40 I
30
20
10
0
Temperatures
Te& Th, kK 1 2 3 4 6 8 10 12 14
Electron number density
-4 -2 0 2 4 0 2 4
Log lo (ne ) , m -3
15 16 17 18
.... , ~ 19 20
9-mm torch
1 8-mm torch
-9 -6 -3 0 3 6 9 0 3 6 9
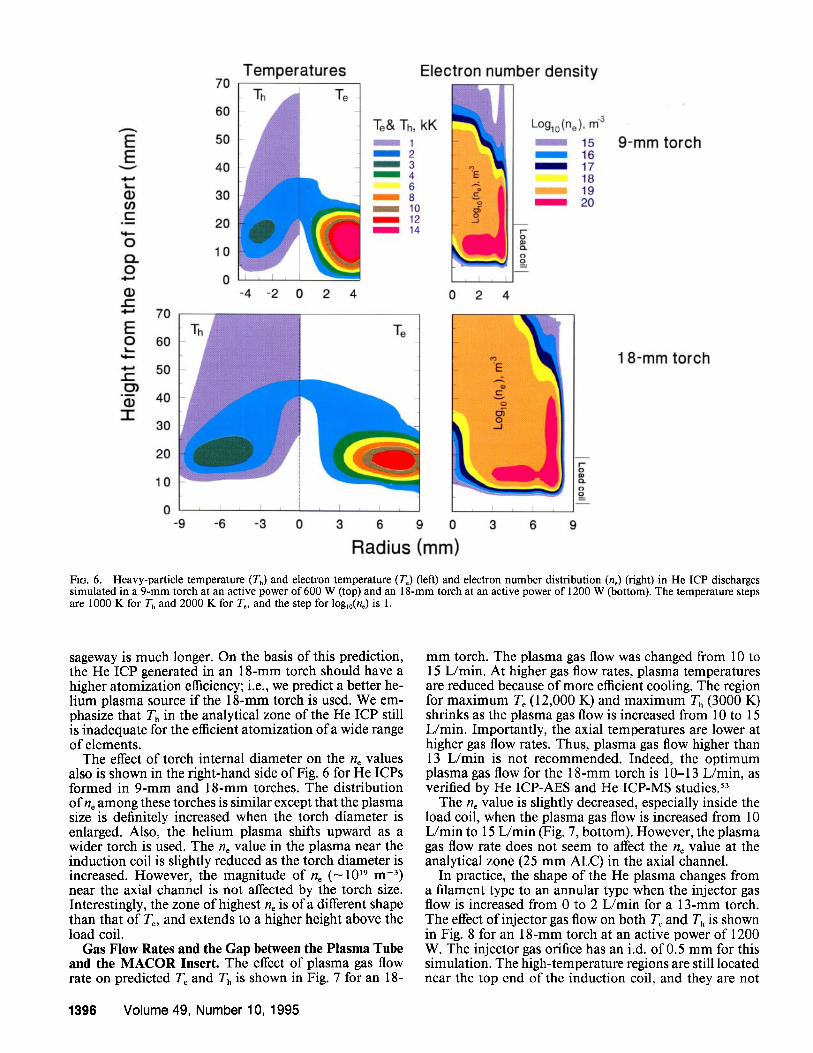
Radius (mm) FIG. 6. Heavy-particle temperature (Th) and electron temperature (To) (left) and electron number distribution (no) (right) in He ICP discharges simulated in a 9-mm torch at an active power of 600 W (top) and an 18-ram torch at an active power of 1200 W (bottom). The temperature steps are 1000 K for Th and 2000 K for To, and the step for logao(no) is 1.
sageway is much longer. On the basis of this prediction, the He ICP generated in an 18-mm torch should have a higher atomization efficiency; i.e., we predict a better he- lium plasma source if the 18-mm torch is used. We em- phasize that Th in the analytical zone of the He ICP still is inadequate for the efficient atomization of a wide range of elements.
The effect of torch intemal diameter on the ne values also is shown in the right-hand side of Fig. 6 for He ICPs formed in 9-mm and 18-mm torches. The distribution of n~ among these torches is similar except that the plasma size is definitely increased when the torch diameter is enlarged. Also, the helium plasma shifts upward as a wider torch is used. The ne value in the plasma near the induction coil is slightly reduced as the torch diameter is increased. However, the magnitude of ne (~1019 m -3) near the axial channel is not affected by the torch size. Interestingly, the zone of highest ne is of a different shape than that of T~, and extends to a higher height above the load coil.
Gas Flow Rates and the Gap between the Plasma Tube and the MACOR Insert. The effect of plasma gas flow rate on predicted T~ and Th is shown in Fig. 7 for an 18-
mm torch. The plasma gas flow was changed from 10 to 15 L/min. At higher gas flow rates, plasma temperatures are reduced because of more efficient cooling. The region for maximum Te (12,000 K) and maximum Th (3000 K) shrinks as the plasma gas flow is increased from 10 to 15 L/min. Importantly, the axial temperatures are lower at higher gas flow rates. Thus, plasma gas flow higher than 13 L/min is not recommended. Indeed, the optimum plasma gas flow for the 18-mm torch is 10-13 L/min, as verified by He ICP-AES and He ICP-MS studies23
The ne value is slightly decreased, especially inside the load coil, when the plasma gas flow is increased from 10 L/min to 15 L/min (Fig. 7, bottom). However, the plasma gas flow rate does not seem to affect the no value at the analytical zone (25 mm ALC) in the axial channel.
In practice, the shape of the He plasma changes from a filament type to an annular type when the injector gas flow is increased from 0 to 2 L/rain for a 13-mm torch. The effect of injector gas flow on both To and Th is shown in Fig. 8 for an 18-mm torch at an active power of 1200 W. The injector gas orifice has an i.d. of 0.5 mm for this simulation. The high-temperature regions are still located near the top end of the induction coil, and they are not
1396 Volume 49, Number 10, 1995

E E
v
c
O O. O
.E
E O
.E
I
70
60
50
40
80
20
10
0 -9
Q = 1 0 L/min
-6 -3 0 3 6 9
Q = 1 3 L/min Q = 1 5 L/min
Te& Th, kK 1
l 2 l 3 l 4
6 8 10
l 12
70
60
50
40
30
20
10
0
Loglo(ne) , n'f 3
15 l 16 l 17
18 19
l 20
0 3 6 9 Radius (mm)
FiG. 7. Effect of plasma gas flow rate on the temperature distributions (Th and Te) (top) and electron number distribution (ne) (bottom) in the He ICP discharges simulated in an 18-mm torch at an active power of 1200 W. The plasma gas flow is changed from 10 to 15 L/rain. The tangential velocities are 40 (left), 50 (center), and 60 (fight) m/s, respectively. The temperature steps are 1000 K for Th and 2000 K for T,, and the step for lo&o(no) is'l.
affected by the injector gas flow. As expected, the axial channel, however, becomes wider and the axial temper- atures are decreased as the injector gas flow is increased. For conservation of power, Joule heating should increase in regions not affected by the injector flow rates. Thus, the temperatures off-center inside the load coil are slightly increased (ATe = 300 K and ATh = 210 K) at high injector gas flow (Fig. 8). Actually, for the 18-mm torch used in He ICP-MS experiment, the best detection limit for Pb is obtained at 600-800 W forward power and at an in- jector gas flow of 2.6 L/min 54 instead of the 1 L/min used in most previous experiments.
The ne value inside the induction coil is slightly in- creased (Ano = 4 x 10¹⁸ m -3) when the injector gas is varied from 0 L/min to 2 L/min (Fig. 8, bottom). How- ever, the no value in the axial channel near the injector tube decreases as gas flow rates increase. Similar to the effect of plasma gas flow rate, the injector gas flow rate does not seem to affect the no value predicted for the axial channel at the analytical zone (25 mm ALC).
The effect of the gap between the plasma tube and the MACOR insert is shown in Fig. 9 for an 18-mm torch. The groove depth is 0.45 mm for the torch used in our laboratory (Fig. 1). Different gaps have no significant ef-
fect on the temperatures near the plasma confinement tube. The heavy-particle temperature and electron tem- perature at the wall in the induction coil region still are over 1000 and 10,000 K, respectively, as the gap between the insert and the plasma confinement tube is changed from 0.2 to 0.8 mm. The high-temperature regions for both Th and To, located near the top end of the induction coil, are not affected as the gap is increased, except that To shifts toward the plasma confinement tube. Because of the low density or the high specific volume of helium (Fig. 5, bottom), the incoming flow has low momentum. While, under constant flow rate, the momentum increases as the gap becomes smaller, the plasma gas momentum still is too low for the He ICP. Furthermore, because of the high thermal conductivities of helium (Fig. 5, center), heat conduction effects always will dominate the energy equation. Thus, the temperature fields are not signifi- cantly affected by small changes in the gap. Note that the axial temperature is significantly reduced as a larger gap is used. Therefore, reducing the gap does not increase the cooling efficiency for the quartz tube but enhances the axial temperatures (Fig. 9). In short, one should expect a better analytical performance when the gap between the MACOR insert and quartz tube is reduced.
APPLIED SPECTROSCOPY 1397

E E
v
O tn
, m
O o . O
E O
N k ~
..C
I
70
60
50
40
30
20
10
0
Gas flow = 0 L/min
-9 -6 -8 0 3 6 9
Gas flow = 0.5 L/min Gas flow = 2.0 L/min
Te& Th, kK ~ i 1 i 2 I 3 l 4
6 8
I 10 l 12
70
60
50
40
30
20
10
0 0
Loglo(ne), rfi 3
15 l 16 l 17
18 ,:,-~:~;. 19
20
3 6 9 Radius (mm)
FIG. 8. Effect of the injector gas flow rate on the temperature distributions (Th and To) (top) and electron number distribution (no) (bottom) for the He ICP discharges simulated in an 18-mm torch at an active power of 1200 W. The injector gas flow is changed from 0 to 2 L/min. The temperature steps are 1000 K for Th and 2000 K for To, and the step for logl0(n¢) is 1.
The effect of the gap on the ne values is also shown in Fig. 9 (bottom). The electron number density is not af- fected by the gap, except for a small region inside the load coil at radius of 6 to 7 ram. In this region, the no value is decreased when the gap is enlarged.
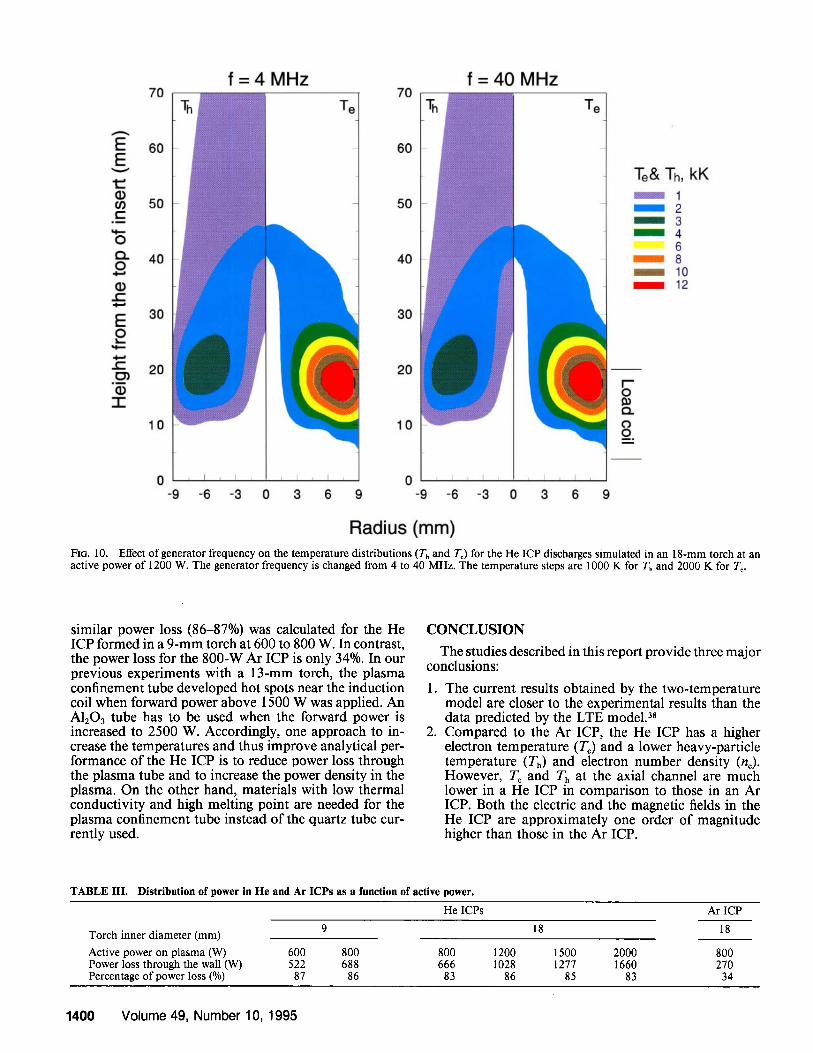
Generator Frequency and Active Power. Frequency is an important factor for forming a doughnut-shaped ICP discharge. Normally, the skin depth is reduced as the radio frequency (rf) is increased. For Ar ICP discharges, higher induction frequency can reduce the continuum background emission and improve the signal-to-back- ground ratio and power transfer efficiency, especially for atomic emission spectrometry? 5 Previous studies 3s,49 have shown that frequency changes in the range of 6.8 to 40.6 MHz have little effect on properties of the He ICP. The distributions of Th and To at different rf are illustrated in Fig. 10. Clearly, no change is found for the temperature distributions at 4 MHz and 40 MHz. The same trends are obtained for the distributions of he. This prediction agrees with our experimental results. 49
The axial he, Te, and Th distributions are shown in Fig. 11 at active powers of 800 to 2000 W for a He ICP generated in an 18-mm torch. Both Th and To are pre- dicted to increase as the active power increases. For com-
parison, the axial no, To, and Th distributions of an Ar plasma at 800 W are also plotted in Fig. 11. Compared to the temperatures for the Ar ICP at 800 W, both Th and To, near the analytical zone in the He ICPs, are much lower at power levels of 800 to 2000 W. At 800 W active power, the highest axial Tos in Ar ICP and He ICP are 6000 and 2000 K, respectively. The highest axial To and no predicted here for the 800-W Ar ICP are comparable, with some extrapolation, to the data computed by Yang and Barnes (see figure 18 in Ref. 35) for a 1-kW Ar ICP. These predicted results are also close to the recent ex- perimental data lab for an Ar ICP operated at 1.25 kW forward power. The magnitudes of Th and To in the He ICP are similar in the axial channel, suggesting that some regions around the central channel of helium plasma may be close to the LTE state. Note that the no value in the He ICP is predicted to increase with the height at the torch inlet, followed by relative constancy at heights above 45 mm (also see Figs. 6-9). Apparently, active power has no significant effect on no values at heights above 45 mm, and the most significant changes are found at the bottom of the plasma. The magnitude of no (4.5 x 10¹⁹ m -3) for the He ICP is predicted to be the same as that for the Ar ICP at 800 W in the respective analytical zones (25 mm
1398 Volume 49, Number 10, 1995

70
60
50
E 40 E
v 30
I1~ 20
"-- 10 O ~ 0 O
E O
I
Gap = 0.2 mm
-9 -6 -3 0 3 6 9
70
60
50
40
30
20
10
0 -9
Gap = 0.8 mm
-6 -3 0 3 6 9
Te& Th, kK 1 2 3 4 6 8 10 12
70
60
50
40
30
20
10
0 0 3
70
60
50
40
30
20
10
0 6 9 0 3 6 9
Radius (mm)
Loglo (ne), rrf 3
15 m i l l 16 m 17
18 19 2O
Fio. 9. Effect of the gap between the quartz tube and the MACOR insert on the temperature distributions (Th and To) (top) and electron number distribution (no) (bottom) for the He ICP discharges simulated in an 18-mm torch at an active power of 1200 W. The gap is changed from 0.2 to 0.8 mm. The temperature steps are 1000 K for Th and 2000 K for T~, and the step for iog,o(no) is 1.
and 15 m m ALC for He and Ar ICPs, respectively). This predict ion is in contrast to the exper imenta l results. 16,~7 Currently, the effective no value in the He ICP is 25 t imes smaller than that in the Ar ICP 17,49 at the analytical ob- servat ion height. Radial ly resolved exper imenta l data for He ICP are needed for compar i son with the theoretical predictions. For the sake o f this discussion, predicted and exper imenta l results 49 are compa red in Table II. C o m - par ison with these exper imenta l results mus t be made with ex t reme caut ion for two main reasons. First, exper- imenta l data are "ave rage" rather than radial values. Sec- ond, the exper imenta l and the s imulated data were ob- ta ined for a wet and a dry He plasma, respectively. The
ne value increases as water aerosol is int roduced into the plasma. 16,~7 Despi te these shortcomings, the LTE model clearly overes t imates the T~. Both ne and Th obta ined by the 2-T mode l s imulat ion agree with our exper imenta l results at 25 m m ALC. Unfor tunate ly , no data are cur- rently avai lable on Te values, radial temperatures , and radial ne values for the H e ICP discharges. Fur ther work in these areas is in progress.
The dis tr ibut ion o f power in the He and Ar ICP dis- charges is listed on Table I I I as a function o f active power. For the H e ICPs, more than 80% of the power is lost through the wall (quartz tube) for an active power level in the range o f 800 to 2000 W for an 18 -mm torch. A
TABLE II. Simulated and experimental data for n° and Th at 25 mm ALC for a He ICP.
Non-LTE model LTE model 38 Experimental results 49
Power (W) a 600 800 1200 1500 600 1500 2500 b ne x 1019 (m -3) 2.1 2.7 3.7 5.0 -- 4.2-5.6 10 Tg (Th) X 103 (K) 1.4 1.6 1.9 2.1 2.5 1.8-2.1 2.3-2.5
"The power used for simulation represents active power for a dry plasma. Experimental results were obtained for a wet plasma at forward power of 1500 and 2500 W. 49
b An alumina tube is used as the plasma confinement tube at 2500 W.
APPLIED SPECTROSCOPY 1399
f = 4 MHz f = 40 MHz
E E
O Q. O
E O
o3 = ~
I
70
60
50
40
30
20
10
70
60
50
40
30
20
10
0 0 -9 -6 -3 0 3 6 9 -9 -6 -3 0 3 6 9
Te& Th, kK 1 2 3 4 6 8
i 10 12
r - o
E% o o
Radius (ram) FIO. 10. Effect of generator frequency on the temperature distributions (Th and To) for the He ICP discharges simulated in an 18-mm torch at an active power of 1200 W. The generator frequency is changed from 4 to 40 MHz. The temperature steps are 1000 K for Th and 2000 K for To.
similar power loss (86-87%) was calculated for the He ICP formed in a 9-mm torch at 600 to 800 W. In contrast, the power loss for the 800-W Ar ICP is only 34%. In our previous experiments with a 13-mm torch, the plasma confinement tube developed hot spots near the induction coil when forward power above 1500 W was applied. An m 1 2 0 3 tube has to be used when the forward power is increased to 2500 W. Accordingly, one approach to in- crease the temperatures and thus improve analytical per- formance of the He ICP is to reduce power loss through the plasma tube and to increase the power density in the plasma. On the other hand, materials with low thermal conductivity and high melting point are needed for the plasma confinement tube instead of the quartz tube cur- rently used.
C O N C L U S I O N
The studies described in this report provide three major conclusions:
.
.
The current results obtained by the two-temperature model are closer to the experimental results than the data predicted by the LTE model. 3s Compared to the Ar ICP, the He ICP has a higher electron temperature (To) and a lower heavy-particle temperature (Th) and electron number density (no). However, To and Th at the axial channel are much lower in a He ICP in comparison to those in an Ar ICP. Both the electric and the magnetic fields in the He ICP are approximately one order of magnitude higher than those in the Ar ICP.
TABLE I lL Distribution of power in He and Ar ICPs as a function of active power.
Torch inner diameter (mm)
Active power on plasma (W) 600 800 Power loss through the wall (W) 522 688 Percentage of power loss (%) 87 86
He ICPs
18
800 666
83
1200 1028
86
1500 1277
85
2000 1660
83
Ar ICP
18
800 270
34
1400 Volume 49, Number 10, 1995

20 E ,4 18
% 16 oT O
14
/ / / /'
I , I , ' I , I , I
6
X k ~B~B~B~EI_.L__." I 0...4 " f • _._l_. [ 3 ~
- i [ , , I
X
[ O _ . _ _ . _ , ~ 0 '~ ¢ 0 "----41, ~ - ~ i , / [
• /
2 • _ 0 / ~ / . ~ / A , _ / y
00 " Ar--*l 9 0 Ar 40 He 60 ~- He, load coil -R
- - D - - H e ICP, 2 0 0 0 W - - e - - H e ICP, 1 5 0 0 W - - A - - H e ICP, 1 2 0 0 W - - V - - H e ICP, 8 0 0 W - - . - - A r ICP, 8 0 0 W
80
Height from the top of insert (mm) FIG. 11. Effect of active power on axial distributions of ne (top), To (center) and T, (bottom) for the He ICP discharges simulated in an 18-mm torch with plots for an 800-W Ar ICP. The power is changed from 800 to 2000 W for the He ICP. The generator frequency is 27 MHz, and total gas flow rates are 8 and 16 L/min for the He and the Ar ICPs, respectively. Dashed lines are the optimal observation heights in experiments for the He and the Ar ICPs, respectively.
. On the basis of the 2-T model, the hottest region of the He plasma is restricted to a small region inside the load coil, close to the wall of the plasma tube. Most of the input power in a He ICP is lost through the plasma confinement tube when a quartz tube is used.
ACKNOWLEDGMENTS
This research was sponsored by the U.S. Department of Energy under Grant No. DE-FG02-93ER14320. We thank R. S. Houk of Iowa State University (Ames, Iowa) and D. W. Golightly of Ross Laboratories (Columbus, Ohio) for their constructive comments in the preparation of this manuscript.
1. Inductively Coupled Plasmas in Analytical Atomic Spectrometry, A. Montaser and D. W. Golightly, Eds. (VCH, New York, 1992), 2nd ed.
2. A. Montaser, "Assessment of the Potentials and Limitations of Plasma Sources Compared to ICP Discharges for Analytical Spec- trometry", in Inductively Coupled Plasmas in Analytical Atomic Spectrometry, A. Montaser and D. W. Golightly, Eds. (VCH, New York, 1992), 2nd ed., pp. 1-52.
3. T. Hasegawa, M. Umemoto, H. Haraguchi, C. Hsiech, and A. Mon- taser, "Fundamental Properties of Inductively Coupled Plasmas", in Inductively Coupled Plasmas in Analytical Atomic Spectrometry, A. Montaser and D. W. Golightly, Eds. (VCH, New York, 1992), 2nd ed., pp. 373-449 and references therein.
4. M. Huang and G. M. Hieftje, Spectrochim. Acta 40B, 1387 (1985). 5. K. A. Marshall and G. M. Hieftje, J. Anal. At. Spectrom. 2, 567
(1987). 6. K. A. Marshall and G. M. Hieftje, Spectrochim. Acta 43B, 841
(1988). 7. K. A. Marshall and G. M. Hieftje, Spectrochim. Acta 43B, 851
(1988). 8. M. Huang and G. M. Hieftje, Spectrochim. Acta 44B, 291 (1989). 9. M. Huang, D. S. Hanselman, and G. M. Hieftje, Spectrochim. Acta
45B, 511 (1990). 10. M. Huang, P. Y. Yang, D. S. Hanselman, C. A. Monnig, and
G. M. Hieftje, Spectrochim. Acta 45B, 1339 (1990). 11. (a) G. M. Hieftje, Spectrochim. Acta 47B, 3 (1992); (b) N. N. Sesi,
A. MacKenzie, K. E. Shanks, P. Yang, and G. M. Hieftje, Spectro- chim. Acta 49B, 1259 (1994).
12. H. B. Lim, R. S. Houk, and J. S. Crain, Spectrochim. Acta 44B, 989 (1989).
13. H. B. Lim and R. S. Houk, Spectrochim. Acta 45B, 453 (1990). 14. D. Fang and R. K. Marcus, Spectrochim. Acta 45B, 1053 (1990). 15. H. S. Niu, K. Hu, and R. S. Houk, Spectrochim. Acta 46B, 805
(1991). 16. S.-K. Chan and A. Montaser, Spectrochim. Acta 43B, 175 (1989). 17. H. Zhang, C. Hsiech, I. Ishii, Z. Zeng, and A. Montaser, Spectro-
chim. Acta 49B, 817 (1994). 18. C. A. Bye and A. Scheeline, Spectrochim. Acta 48B, 1593 (1993). 19. S. V. Patankar, Numerical lteat Transfer and FluM Flow (Hemi-
sphere Publishing Company, New York, 1980). 20. R. M. Barnes and S. Nikdel, J. Appl. Phys. 47, 3929 (1976). 21. R. M. Barnes and S. Nikdel, Appl. Spectrosc. 30, 310 (1976).
APPLIED S P E C T R O S C O P Y 1401

22. C. D. Allemand and R. M. Barnes, Appl. Spectrosc. 31,434 (1977). 23. J. Mostaghimi, P. Proulx, and M. I. Boulos, Plasma Chem. Plasma
Process. 4, 199 (1984). 24. J. Mostaghimi, P. Proulx, and M. I. Boulos, Num. Heat Trans. 8,
187 (1985). 25. M. I. Boulos, Pure & Appl. Chem. 57, 1321 (1985). 26. J. Mostaghimi, P. Proulx, and M. I. Boulos, J. Appl. Phys. 61, 1753
(1987). 27. P. Proulx, J. Mostaghimi, and M. I. Boulos, Plasma Chem. Plasma
Process. 7, 29 (1987). 28. M. I. Boulos and R. M. Barnes, "Plasma Modeling and Computer
Simulation", in Inductively Coupled Plasma Emission Spectros- copy, P. W. J. M. Boumans, Ed. (Wiley, New York, 1987), pp. 289-352.
29. J. W. Mckelliget and N. E1-Kaddah, J. Appl. Phys. 64, 2948 (1988). 30. J. Mostaghimi and M. I. Boulos, J. Plasma Chem. Plasma Process.
9, 25 (1989). 31. M. EI-Hage, J. Mostaghimi, and M. I. Boulos, J. Appl. Phys. 65,
4178 (1989). 32. J. Mostaghimi and M. I. Boulos, Plasma Chem. Plasma Process.
9, 25 (1989). 33. P. Yang, R. M. Barnes, J. Mostaghimi, and M. I. Boulos, Spectro-
chim. Acta 44B, 657 (1989). 34. P. Yang and R. M. Barnes, Spectrochim. Acta 44B, 1081 (1989). 35. P. Yang and R. M. Barnes, Spectrochim. Acta Rev. 13, 275 (1990). 36. J. Mostaghimi and M. I. Boulos, J. Appl. Phys. 68, 2643 (1990). 37. J. Mostaghimi and M. I. Boulos, "Mathematical Modeling of In-
ductively Coupled Plasmas", in Inductively Coupled Plasmas in AnalyticalAtomic Spectrometry, A. Montaser and D. W. Golightly, Eds. (VCH, New York, 1992), 2nd ed., pp. 949-984.
38. M. Cai, A. Montaser, and J. Mostaghimi, Spectrochim. Acta 48B, 789 (1993).
39. E. Hinnov and J. G. Hirschberg, Phys. Rev. 125(3), 795 (1962). 40. R. S. Devoto and C. P. Li, J. Plas. Phys. 2(1), 17 (1968).
41. B. Plenkiewicz, P. Plenkiewicz, and J.-P. Jay-Gerin, Can. J. Phys. 6g(1), 104 (1990).
42. H.-W. Drain and P. Felenbok, Data for Plasmas in Local Ther- modynamic Equilibrium, (Gauthier-Villars, Paris, 1965).
43. Yu. V. Moskvin, High Temp. 6, 1 (1968). 44. S.-K. Chan and A. Montaser, Spectrochim. Acta 40B, 1467 (1985). 45. S.-K. Chan, R. L. Van Haven, and A. Montaser, Anal. Chem. 58,
2342 (1986). 46. S.-K. Chan and A. Montaser, Spectrochim. Acta 42B, 591 (1987). 47. H. Tan, S.-K. Chan, and A. Montaser, Anal. Chem. 60, 2542 (1988). 48. S.-K. Chan, H. Tan, and A. Montaser, Appl. Spectrosc. 43, 92
(1989). 49. I. Ishii, H. Tan, S.-K. Chan, and A. Montaser, Spectrochim. Acta
46B, 901 (1991) and references therein. 50. S. Nam, W. R. L. Masamba, and A. Montaser, Anal. Chem. 65,
2784 (1993). 51. S. Nam, W. R. L. Massamba, and A. Montaser, Spectrochim. Acta
49B, 1325 (1994). 52. D.J. Douglas, "Fundamental Aspects of Inductively Coupled Plas-
ma-Mass Spectrometry", in Inductively Coupled Plasmas in Ana- lyticalAtomic Spectrometry, A. Montaser and D. W. Golightly, Eds. (VCH, New York, 1992), 2rid ed., pp. 613-650 and references therein.
53. M. Cai, S. Nam, and A. Montaser, unpublished data. 54. S. Nam, H. Zhang, M. Cai, J. Lim, and A. Montaser, "Elemental
Analysis at Picogram/Milliliter Levels with Helium Inductively Coupled Plasma-Mass Spectrometry", submitted to Anal. Chem.
55. S. Greenfield and A. Montaser, "Common RF Generators, Torches, and Sample Introduction Systems", in Inductively Coupled Plasmas in Analytical Atomic Spectrometry, A. Montaser and D. W. Go- lightly, Eds. (VCH, New York, 1992), 2nd ed., pp. 187-247 and references therein.
1402 Volume 49, Number 10, 1995
Copyright © 2022 FDOKUMEN