Job strain, effort-reward imbalance, and stress at work: competing or complementary models?
Upload
khangminh22Category
view
1download
0
The Pivotal Role of Nitric Oxide and Peroxynitrite Imbalance in Epileptic Seizures
A dissertation presented to
the faculty of
the College of Arts and Sciences of Ohio University
In partial fulfillment
of the requirements for the degree
Doctor of Philosophy
Lu-Lin Jiang
August 2014
© 2014 Lu-Lin Jiang. All Rights Reserved.

2
This dissertation titled
The Pivotal Role of Nitric Oxide and Peroxynitrite Imbalance in Epileptic Seizures
by
LU-LIN JIANG
has been approved for
the Department of Chemistry and Biochemistry
and the College of Arts and Sciences by
Tadeusz Malinski
Marvin & Ann Dilley White Distinguished Professor of Chemistry and Biochemistry
Robert Frank
Dean, College of Arts and Sciences

3
ABSTRACT
JIANG, LU-LIN, Ph.D., August 2014, Chemistry
The Pivotal Role of Nitric Oxide and Peroxynitrite Imbalance in Epileptic Seizures
Director of Dissertation: Tadeusz Malinski
Epilepsy is one of the most severe neurological disorders. However, the detailed
molecular mechanism in triggering epileptic seizures is still unclear. Nitric oxide (NO) is
a versatile neurotransmitter in the brain; it acts as a messenger and antiplatelet
aggregation agent in the cerebral vasculature. Peroxynitrite (ONOO-), a cytotoxic
compound, can be easily produced by the diffusion-controlled reaction between NO and
superoxide anion (O2·-).
This study used a nanomedical approach to elucidate the role of NO and ONOO-
in epileptic seizures. The nanomedical approach involving a system of nanosensors
(diameter 200 300nm) has been used to measure directly in vivo release of NO and
ONOO- in the brains of Sprague-Dawley (SD) rats during the process of pilocarpine-
induced epileptic seizure events. Seizure events were simultaneously monitored by
electroencephalography (EEG). Pilocarpine stimulated both NO and ONOO- production
in the brain. The ratio of NO to ONOO- concentration ([NO]/ [ONOO-]) that reflected the
balance between NO and ONOO- shifted with time. Epileptic seizures were observed
only at the relatively low ratio of [NO]/ [ONOO-]. The latency, duration, and frequency
of seizure events have also been influenced by the balance between NO and ONOO-.

4
DEDICATION
To my family,
To my beloved ones,
To my friends.

5
ACKNOWLEDGMENTS
I would like to first thank my advisor, Dr. Tadeusz Malinski. He gave me this
great opportunity to work in his lab and a wonderful challenging project to work with.
Every time when I had problem, he was always there trying to help me, give me the ideas,
and lead me to think. His working attitude inspired me a lot. I really appreciate the great
support from him for all these years.
I also would like to thank my dissertation committee members, Dr. Marcia J.
Kieliszewski, Dr. Lauren E. H. McMills, and Dr. Tiao J. Chang. They helped me on my
research, and encouraged me when I have difficulties. Thank you very much for your
guidance.
I would like to thank Dr. Ruslan Kubant, Dr. Adam Jacoby, and Dr. Krystian
Jasinski for teaching me all the techniques in the lab and much discussion on my project
when I just started here. I would like to thank Dr. Jose Corbalan and Farina Mahmood for
all the help on animal protocols and animal surgeries. I also would like to thank Daniel
Nething and Michael Wagner for proof-reading my dissertation. And I would like to
thank all my labmates and many others in the Department of Chemistry and Biochemistry:
Dr. Han Wang, Yuanyuan Tang, Jiangzhou Hua, Elaine Saulinskas, Collin Arocho, Dr.
Salah Awad, Dr. Frazier Nyasulu, Dr. Barlag Rebecca, Paul Schmittauer, French Bascom,
Aaron Dillon, Rollie Merriman, Marlene Jenkins, Carolyn Khurshid, etc. I’m so proud to
work with you as a team.

6
My special thanks to Paula Hale for all her support that helped me to conquer
many difficulties. Paula, you will be always in my heart. I will remember the kindness
and courage that you gave me.
Last but not least, I would like to thank all my family members for your great
support and encouragement. I would also like to thank my fiancé, Dening Ye. I’m so
thankful that I came here and met you. We’ve gone through a lot, and we will get through
more and more. Thank you for being with me. And I would like to thank all my friends.
I’ve learned a lot from you. Thank you for making me to be a better one.
I cannot finish this work without the help from all of you.

7
TABLE OF CONTENTS
Page
Abstract ..................................................................................................................................... 3
Dedication ................................................................................................................................. 4
Acknowledgments .................................................................................................................... 5
List of Tables .......................................................................................................................... 11
List of Figures......................................................................................................................... 12
List of Abbreviations ............................................................................................................. 20
1. Introduction .................................................................................................................... 24
1.1 Epilepsy ........................................................................................................................ 24
1.1.1 The Classification of Epileptic Seizures ............................................................. 24
1.1.2 The Pathogenesis of Epileptic Seizures .............................................................. 27
1.2 Nitric Oxide.................................................................................................................. 30
1.2.1 The Physics and Chemistry of Nitric Oxide ....................................................... 30
1.2.2 The Biological Synthesis of NO .......................................................................... 31
1.2.3 The Biological Function of Nitric Oxide ............................................................ 34
1.3 Peroxynitrite (ONOO-) ................................................................................................ 37
1.4 Oxidative/ Nitroxidative Stress ................................................................................... 39
1.5 Epilepsy and Nitric Oxide ........................................................................................... 41

8
1.6 Research Goals............................................................................................................. 45
1.6.1 Goal 1: To Understand the Role of NO and ONOO- in the Mechanism of
Epileptic Eeizures .......................................................................................................... 46
1.6.2 Goal 2: To Elucidate the Effect of [NO] / [ONOO-] Balance in Epileptic
Seizures ........................................................................................................................... 46
1.6.3 Goal 3: To Study an Environmental Effect of Different Molecules on NO/
ONOO- Balance in Epileptic Seizures .......................................................................... 46
1.6.4 Goal 4: To Propose the Potential Pharmacological Method of Intervention to
Minimize/ Eliminate Epileptic Seizures ....................................................................... 47
2. Materials and Methods .................................................................................................. 48
2.1 Nanosensor Fabrication ............................................................................................... 48
2.2 NO Nano-sensor Preparation ...................................................................................... 49
2.3 Preparation of NO Standard Solution ......................................................................... 50
2.4 NO Sensor Calibration ................................................................................................ 54
2.5 ONOO- Nano-sensors Preparation .............................................................................. 57
2.6 ONOO- Standard Solution Synthesis .......................................................................... 58
2.7 ONOO- Sensors Calibration ........................................................................................ 61
2.8 Animal Surgery ............................................................................................................ 64
2.9 Animal Models and Treatments .................................................................................. 66

9
2.10 NO and ONOO- in vivo Measurement ..................................................................... 69
2.12 Protein Sample Preparation ....................................................................................... 72
2.13 Total Protein Concentration Measurement .............................................................. 72
2.14 Immunoblotting ......................................................................................................... 73
2.15 Statistical Analysis .................................................................................................... 77
3. Results............................................................................................................................. 79
3.1 NO and ONOO- Release in the Brain after PILO Induced Seizure. ......................... 79
3.2 Modulation of Seizure Events by Regulating the Release of NO and ONOO- ....... 89
3.2.1 L-Arg Treatment ................................................................................................... 90
3.2.2 L-NAME Treatment ............................................................................................. 95
3.2.3 MnTBAP Treatment ............................................................................................. 99
3.2.4 VAS2870 Treatment........................................................................................... 103
3.3 cNOS and NADPH Oxidase Protein Expression................................................. 106
3.3.1 eNOS Expression ................................................................................................ 107
3.3.2 nNOS Expression ............................................................................................... 108
3.3.3 NADPH Oxidase Expression ............................................................................. 109
3.4 Seizure Episodes Triggered by Artifact NO / ONOO- Ratio .................................. 111
3.4.1 SIN-1 Treatment ................................................................................................. 112
3.4.2 Synthetic NO and ONOO- Solution Treatment ................................................ 115

10
3.4.3 O2·- Treatment ..................................................................................................... 119
4. Discussion..................................................................................................................... 124
4.1 The Establishment of Nanomedical System to Measure NO and ONOO - Release in
vivo during Epileptic Seizures ......................................................................................... 124
4.2 Abnormal NO and ONOO- Release in PILO Induced Epileptic Seizures. ............ 125
4.3 PILO-induced Epileptic Seizures Can be Regulated by the [NO]/ [ONOO-]
Modulators........................................................................................................................ 128
4.3.1 The Effect of NOS Modulators in PILO-induced Epileptic Seizures ............. 128
4.3.2 The Effect of ONOO- Scavenger in PILO-induced Epileptic Seizures .......... 130
4.3.3 The Effect of NADPH Oxidase Inhibitor in PILO-induced Epileptic Seizures
....................................................................................................................................... 131
4.4 Low [NO]/ [ONOO-] Can Trigger Seizures. ............................................................ 133
4.4.1 Low [NO]/ [ONOO-] Induced by SIN-1 Triggered Seizure-like Events ........ 133
4.4.2 Exogenous Low [NO]/ [ONOO-] Triggered Seizure-like Events ................... 134
4.4.3 Endogenous Low [NO]/ [ONOO-] Induced by O2·- Triggered Seizure-like
Events ........................................................................................................................... 135
4.5 Conclusion.................................................................................................................. 135
5. References .................................................................................................................... 137
11
LIST OF TABLES
Page
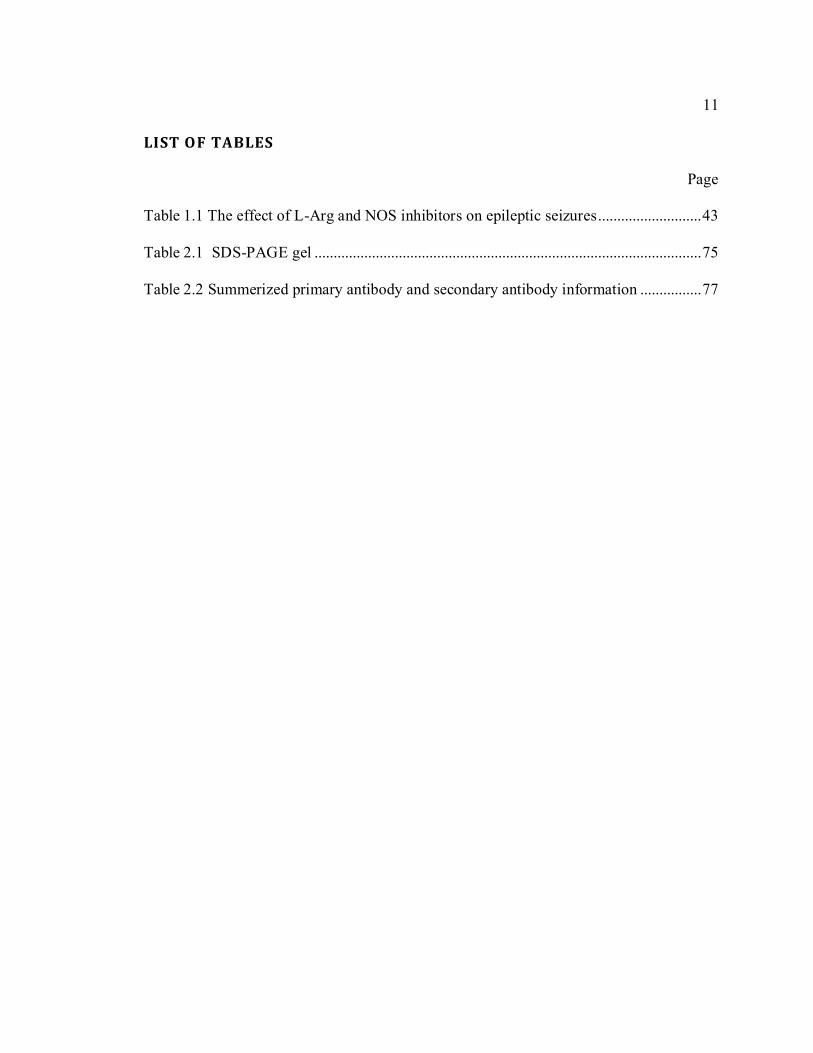
Table 1.1 The effect of L-Arg and NOS inhibitors on epileptic seizures ........................... 43
Table 2.1 SDS-PAGE gel ..................................................................................................... 75
Table 2.2 Summerized primary antibody and secondary antibody information ................ 77

12
LIST OF FIGURES
Page
Figure 1.1Classification of Epilepsy (adapted and modified from ILAE commission
report) 4 ................................................................................................................................... 26
Figure 1.2 Mutation of ion channels alters the ion channels function (adapted and
modified from Steinlein, O. K., Genetic mechanisms that underlie epilepsy. Nat Rev
Neurosci 2004, 5 (5), 400-8)7 ................................................................................................ 29
Figure 1.3 The Lewis structure of NO .................................................................................. 31
Figure 1.4 The biosynthesis of NO (adapted and modified from Freire, M. A.; Guimaraes,
J. S.; Leal, W. G.; Pereira, A., Pain modulation by nitric oxide in the spinal cord. Front
Neurosci 2009, 3 (2), 175-81) 26 ........................................................................................... 32
Figure 1.5 Structure of nitric oxide synthase (NOS) monomer .......................................... 33
Figure 1.6 The Biological Function of NO in Nerve System (adapted and modified from
Boehning, D.; Snyder, S. H., Novel neural modulators. Annu Rev Neurosci 2003, 26, 105-
31)38 ......................................................................................................................................... 37
Figure 1.7 The interplay of nitric oxide, superoxide anion, and peroxynitrite (adapted and
modified from Malinski, T., Nitric oxide and nitroxidative stress in Alzheimer's disease. J
Alzheimers Dis 2007, 11 (2), 207-18)21 ................................................................................ 39
Figure 2.1 Schematic diagram of NO nanosensor (adapted and modified from Malinski,
T.; Taha, Z., Nitric oxide release from a single cell measured in situ by a porphyrinic-
based microsensor. Nature 1992, 358 (6388), 676-8)19 ....................................................... 50

13
Figure 2.2 Schematic diagram of set-up for NO synthesis (adapted and modified from
Malinski, T.; Huk, I., Measurement of nitric oxide in single cells and tissue using a
porphyrinic microsensor. Curr Protoc Neurosci 2001, Chapter 7, Unit7, 14) 111 ............. 52
Figure 2.3 An example of UV-Vis spectra of (a) oxyHb and (b) metHb solutions in PB
buffer ....................................................................................................................................... 54
Figure 2.4 Three-Electrode electrochemical system used for NO calibration ................... 55
Figure 2.5 (a) A typical NO response curve, (b) The calibration curve of NO standard
solution (R2=0.9586). ............................................................................................................. 56
Figure 2.6 Schematic diagram of ONOO- nanosensor (adapted and modified from
Malinski, T.; Taha, Z., Nitric oxide release from a single cell measured in situ by a
porphyrinic-based microsensor. Nature 1992, 358 (6388), 676-8 and Xue, J.; Ying, X.;
Chen, J.; Xian, Y.; Jin, L., Amperometric ultramicrosensors for peroxynitrite detection
and its application toward single myocardial cells. Anal Chem 2000, 72 (21), 5313-21)
19,113 ......................................................................................................................................... 58
Figure 2.7 Schematic diagram of set-up for ONOO- synthesis (adapted and modified from
Koppenol, W. H.; Kissner, R.; Beckman, J. S., Syntheses of peroxynitrite: to go with the
flow or on solid grounds? Methods Enzymol 1996, 269, 296-302 and Reed, J. W.; Ho, H.
H.; Jolly, W. L., Chemical Syntheses with a Quenched Flow Reactor -
Hydroxytrihydroborate and Peroxynitrite. Journal of the American Chemical Society
1974, 96 (4), 1248-1249) 114-115 ............................................................................................. 60
Figure 2.8 A UV-Vis spectrum of ONOO- (λmax= 302nm) solution in PB buffer ............. 61

14
Figure 2.9 (a) A typical amperogram showing nanosensor response to ONOO- response
after ONOO- standard solution injection, (b) A calibration curve of ONOO- (R2=0.9911).
................................................................................................................................................. 63
Figure 2.10 The schematic diagram showing NO, ONOO- and EEG electrodes
localization in a brain. ............................................................................................................ 65
Figure 2.11 The flowchart for animal treatment .................................................................. 71
Figure 3.1 Typical amperograms showing real-time NO and ONOO- release during
normal brain activity in the SD rat brain .............................................................................. 80
Figure 3.2 Typical amperograms showing NO and ONOO- real-time release during
epileptic seizures induced by PILO (300 mg/kg, IP) in the SD rat brain. .......................... 81
Figure 3.3 (a) Typical amperograms showing NO and ONOO- real-time release during
epileptic seizures induced by PILO (1.6 mg/kg, IH) in the SD rat brain. (b) The high
resolution amperograms and EEG signals of NO and ONOO- release during one seizure
episode onset (the time frame between vertical red dot line in Figure 3.3 a)..................... 83
Figure 3.4 (a) Maximal NO and (b) ONOO- concentration produced in the brains of SD
rats in the absence or presence of epileptic seizures. Epileptic seizures were induced by
0.82 mg/kg; or 1.6 mg/kg PILO injected IH, or 300 mg/kg PILO injected IP (**p < 0.01,
***p< 0.0001 vs saline group). (c) The ratio of NO to ONOO- maximal concentration
measured in the brains of SD rats in the absence of or the presence of epileptic seizures.
Epileptic seizures were induced by 0.82 mg/kg, or 1.6 mg/kg PILO injected IH, or 300
mg/kg PILO injected IP (*p< 0.05, **p < 0.01, ***p< 0.0001 vs saline group). .............. 86

15
Figure 3.5 Seizure events induced by PILO at the dosage of 0.82 mg/kg (solid bar), 1.6
mg/kg (gray bar) PILO through IH injection or PILO at the dosage of 300mg/kg (open
bar) through IP injection. (a) Latency from PILO injection to the first seizure event onset.
(b) Seizure duration (***p<0.0001 vs PILO IP group). (c) Number of seizure events per
hour (frequency of seizure events). ....................................................................................... 89
Figure 3.6 (a) Maximal NO and (b) ONOO- concentration produced in brains of epileptic
SD rats. Epileptic seizures were induced by IH injection of 1.6 mg/kg PILO in the
absence or presence of L-Arg (***p< 0.0001, vs saline group, ^^^p<0.0001 vs PILO
group). (c) The ratio of maximal NO to ONOO- concentration released in the brains of
epileptic SD rats. Epileptic seizures were induced by IH injection of 1.6 mg/kg PILO in
the absence or presence of L-Arg (***p< 0.0001 vs saline group). ................................... 92
Figure 3.7 Epileptic seizure events were observed in the brain of a SD rat induced by
PILO (1.6 mg/kg, IH) in the presence of L-Arg (5.7 μg/kg). .............................................. 93
Figure 3.8 Seizure events induced by PILO (1.6 mg/kg) through IH injection in the
absence (close bar) or presence (open bar) of L-Arg (5.7 μg/kg). (a)Latency from PILO
injection to the first seizure event onset. (b) Seizure duration (*p<0.05 vs PILO group).
(c) Number of seizure events per hour (frequency of seizure events). ............................... 94
Figure 3.9 (a) Maximal NO and (b) maximal ONOO- concentration produced in the
brains of epileptic SD rats. Epileptic seizures were induced by PILO (1.6 mg/kg, IH) in
the absence or presence of L-NAME (*p<0.05, ***p< 0.0001, vs saline group,
^^^p<0.0001 vs PILO group). (c) The ratio of maximal NO to ONOO- concentration

16
released from the epileptic SD rats induced by PILO (1.6 mg/kg, IH) in the absence or
presence of L-NAME (***p< 0.0001 vs saline group, ^^^p<0.0001 vs PILO group). ..... 96
Figure 3.10 Epileptic seizure events were observed in the brain of SD rat induced by
PILO (1.6 mg/kg, IH) in the presence of L-NAME (7.3 μg/kg). ........................................ 97
Figure 3.11 Seizure events were induced by PILO (1.6 mg/kg, IH) in the absence (close
bar) or presence (open bar) of L-NAME (7.3 μg/kg). (a) Latency from PILO injection to
the first seizure event onset (*p<0.05 vs PILO group). (b) Seizure duration (*p<0.05 vs
PILO group). (c) Number of seizure events per hour. ......................................................... 98
Figure 3.12 (a) Maximal NO and (b) maximal ONOO- concentration produced in the
brains of epileptic SD rats. Epileptic seizures were induced by PILO (1.6 mg/kg, IH) in
the absence or presence of MnTBAP (***p< 0.0001 vs saline group, ^^^p<0.0001 vs
PILO group). (c) The ratio of maximal NO to ONOO- concentration released from
epileptic SD rats induced by PILO (1.6 mg/kg, IH) in the absence or presence of
MnTBAP (***p< 0.0001 vs saline group, ^^p< 0.01 vs PILO group). ............................ 100
Figure 3.13 Epileptic seizure in the brain of SD rat induced by PILO (1.6 mg/kg, IH) in
the presence of MnTBAP (64 μg/kg). ................................................................................. 101
Figure 3.14 Seizure events were induced by PILO (1.6 mg/kg, IH) in the absence (close
bar) or presence (open bar) of MnTBAP. (a) Latency from PILO injection to the first
seizure event onset. (b) Seizure duration. (c) Number of seizure events per hour (*p< 0.05
vs PILO group). .................................................................................................................... 102
Figure 3.15 (a) Maximal NO and (b) maximal ONOO- concentration produced in the
brains of epileptic SD rats. Epileptic seizures were induced by PILO (1.6 mg/kg, IH) in

17
the absence or presence of VAS2870 (***p< 0.0001 vs saline group, ^^^p<0.0001 vs
PILO group). (c) The ratio of maximal NO to ONOO- concentration released in the
epileptic brain of SD rats. Epileptic seizures were induced by PILO (1.6 mg/kg, IH) in the
absence or presence of VAS2870 (***p< 0.0001 vs saline group, ^^^p< 0.0001 vs PILO
group). ................................................................................................................................... 105
Figure 3.16 Epileptic seizure in the brain of a SD rat induced by 1.6 mg/kg PILO in the
presence of VAS2870 and 1.6 mg/kg PILO. ...................................................................... 106
Figure 3.17 eNOS expression in native form (dimer and monomer) and eNOS total
expression level. ................................................................................................................... 108
Figure 3.18 nNOS expression in native form (dimer and monomer) and nNOS total
expression level. ................................................................................................................... 109
Figure 3.19 NOX4 expression in the absence or presence of modulators after PILO-
induced epileptic sezures. .................................................................................................... 110
Figure 3.20 p67phox expression in the absence or presence of modulators after PILO-
induced epileptic sezures. .................................................................................................... 111
Figure 3.21 Example amprograms showing NO and ONOO - release measured with
nanosensors, and EEG showing brain activity change after SIN-1 (1.2 µg/kg, IH) injected
into the brain of a SD rat...................................................................................................... 113
Figure 3.22 Maximal NO (close bar) and ONOO- (open bar) concentration produced in
the brains of SD rats during the epileptic seizure-like events induced by 0.6 µg/kg and 1.2
µg/kg SIN-1 IH..................................................................................................................... 114

18
Figure 3.23 The ratio of NO to ONOO- concentration released from SD rats during
seizure events induced by 0.6 µg/kg and 1.2 µg/kg SIN-1 (close bar) and induced by 1.6
mg/kg PILO (open bar) . ...................................................................................................... 114
Figure 3.24 The duration of seizure events induced by 0.6 µg/kg and 1.2 µg/kg SIN-1
(close bar) and induced by 1.6 mg/kg PILO (open bar). ................................................... 115
Figure 3.25 Seizure episodes triggered by the artifact change of the [NO] / [ONOO-].
Example of amperograms (a) NO and (b) ONOO- release after the exogenous injection of
NO and ONOO- solution (verticle dot lines represent the time when injection done). (c)
EEG recording shows seizure-like brain discharge (I, II, III) and non-seizure-like brain
discharge (IV) after each injection. ..................................................................................... 117
Figure 3.26 NO (open bars) and ONOO- (solid bars) concentration measured by
nanosensors during the time of seizure-like events. .......................................................... 118
Figure 3.27 The ratio of maximal NO to ONOO- concentration measured in the presence
or absence of seizure-like events. ........................................................................................ 118
Figure 3.28 Duration for seizure-like events after each injection. .................................... 119
Figure 3.29 Seizure-like episodes triggered by exogenous O2·-. Amperograms of (a) NO
and (b) ONOO- release after exogenous injection of O2·- solution (vertically dotted lines
indicate the time of injection, arrows indicate the time of seizure-like events). (c) EEG
recording shows two seizure-like brain discharges change (I and II) after injections of
O2·-. ........................................................................................................................................ 121
Figure 3.30 Maximal NO (open bars) and ONOO- (solid bars) concentration measured by
nanosensors at when seizure-like events were observed. .................................................. 122

19
Figure 3.31 The ratio of maximal NO to ONOO- concentration measured at when seizure-
like events were observed. ................................................................................................... 122
Figure 3.32 Duration for seizure-like events after O2∙- (0.52 µg, IH) injection. .............. 123
Figure 4.1 Schematic diagram of the role of NO and ONOO- imbalance in PILO induced
epileptic seizures. ................................................................................................................. 127
Figure 4.2 Schematic diagram showing the mechanism of the prevention of epileptic
seizures by VAS 2870 (NADPH oxidase inhibitor) .......................................................... 133

20
LIST OF ABBREVIATIONS
Ach acetylcholine
ALS amyotrophic lateral sclerosis
APS ammonium persulfate
BCA bicinchoninic acid
BH4 tetrahydrobiopterin
BSA bovine serum albumin
CaM calmodulin
cGMP cyclic guanosine-3’,5’-monophosphate
CLC voltage-gated chloride channel
cNOS constitutive nitric oxide synthase
C-terminal carboxyl terminal
CV cyclic voltammetry
DMSO dimethyl sulfoxide
EDRF endothelium-derived relaxing factor
EEG electroencephalogram
eNOS or NOS III endothelial nitric oxide synthase
FAD flavin adenine dinucleotide
FMN flavin mononucleotide
GABA γ-aminobutyric acid
GABAA subtype A of γ-aminobutyric acid receptor
GOF gain of function

21
GSH glutathione
GSNO S-nitrosoglutathione
Hb hemoglobin
HPLC high-performance liquid chromatography
IBE International Bureau for Epilepsy
IH interhippocampus(ly)
ILAE International League Against Epilepsy
iNOS or NOS II inducible nitric oxide synthase
IP intraperitoneal(ly)
KCNQ voltage-gated potassium channel
L-Arg L-arginine
L-NAME L-NG- nitroarginine methyl ester
L-NMMA L-NG-monomethylarginine
L-NNA L-nitroarginine
LOF loss of function
LPS lipopolysaccharide
MES maximal electroshock
metHb methemoglobin
Mn porphrin manganese (III)- [2, 2] paracyclophenyl-porphyrin
MnTBAP manganese (III) tetrakis (4-benzoic acid) porphyrin chloride
MPT mitochondrial permeability transition
mtDNA mitochondrial DNA

22
nAChR neuronal nicotinic acetylcholine receptor
NADPH nicotinamide adenine dinucleotide phosphate
Ni porphyrin nickel (II) tetrakis (3-methoxy-4-hydroxyphenyl) porphyrin
NMDA N-methyl-D-aspartate
nNOS or NOS I neuronal nitric oxide synthase
NOS nitric oxide synthase
N-terminal amino terminal
oxyHb oxyhemoglobin
PB phosphate buffer
PILO pilocarpine
pKa logarithmic acid dissociation constant
PSD95 postsynaptic density protein
PTZ pentylenetetrazol
PVDF polyvinyl difluoride
PVP poly (4-vinylpyridine)
RIPA radioimmunoprecipitation
RNS reactive nitrogen species
ROS reactive oxygen species
SCN voltage-gated sodium channel
SD Sprague-Dawley
SDS-PAGE sodium dodecyl sulfate polyacrylamide
SEM standard error of the mean

23
sGC soluble guanylate cyclase
SIN-1 3-Morpholinosydnonimine
SOD superoxide dismutase
TBAP tetrabutylammonium perchlorate
TBI traumatic brain injury
TBS tris-buffered saline
TBST TBS solution with 0.1 % tween-20
TEMED tetramethylethylenediamine
TG tris/glycine
TGS tris/glycine/SDS solution
TLE temporal lobe epilepsy
VAS 2870 1,3-benzoxazol-2-yl-3-benzyl-3H-[1,2,3] triazolo [4,5-d]-
pyrimidin-7-yl sulfide

24
1. INTRODUCTION
1.1 Epilepsy
Epilepsy is one of the most severe health problems around the world. There are
about 65 million people worldwide1 and about 3 million people in the United States2
suffering from epileptic seizures. About 200,000 new cases of epileptic seizures occur
every year2.
The word epilepsy comes from Ancient Greek, which means “to seize”. The
definition for “epilepsy” proposed by the International League Against Epilepsy (ILAE)
and the International Bureau for Epilepsy (IBE) is “a disorder of the brain characterized
by an enduring predisposition to generate epileptic seizures and by the neurobiologic,
cognitive, psychological, and social consequences of this condition”3. A diagnosis of
epilepsy requires a history of at least one seizure, and evidence of enduring alteration to
the brain that increases the possibility of future seizures, as well as other associated
symptoms. These symptoms can be neurobiological, cognitive, psychological, and
social3. Therefore, epilepsy describes a family of neurological disorders that
predisposition to seizures is increased abnormally, and is accompanied by cognitive
impairment and behavior problems3.
1.1.1 The Classification of Epileptic Seizures
Based on the ILAE and IBE report, the definition of an epileptic seizure is “a
transient occurrence of signs and/or symptoms due to abnormal excessive or synchronous
neuronal activity in the brain”3. Mode of onset and termination, clinical manifestations,
and abnormal enhanced synchrony are essential to define an epileptic seizure3. Thus, the

25
ILAE has proposed the classification (Figure 1.1) of epileptic seizures based on the
clinical symptoms and electroencephalogram (EEG).
The two main classes of seizures are generalized seizures and focal seizures.
Generalized seizures are seizures originating within bilaterally distributed networks and
rapidly spread to the whole hemispheres. The bilateral networks may include both
cortical and subcortical structures. Individual generalized seizures may differ from case
to case because the location and lateralization may not be consistent between seizures4.
Focal epileptic seizures may originate in subcortical structures. The onset of a focal
seizure is more likely to be consistent in all subtypes4.
Any seizures not falling under generalized or focal are in a third “unknown”
classification, due to lack of knowledge about the seizure type. This mainly covers
epileptic spasms. Epileptic spasms, like infantile spasms, may happen during infancy.
More work is needed to be done to decide the classification of this type of epileptic
seizure.

26
Figure 1.1Classification of Epilepsy (adapted and modified from ILAE commission report) 4
Epileptic seizures
Generalized seizures
Tonic-clonic
Absense
Typical
Atypical
Absence with special features
Myoclonic absence
Eyelid myoclonia
Myoclonic
Myoclonic
Myoclonic atonic
Myoclonic tonic
Clonic
Tonic
Atonic
Focal seizures
Unknown Epileptic spasms

27
1.1.2 The Pathogenesis of Epileptic Seizures
Epilepsy is a dynamic disease, and progresses with time5. Recurrent epileptic
seizures can cause apoptosis and necrosis of neurons in the brain6. Neuronal networks can
be permanently altered7, especially after status epilepticus, a neurologic emergency
caused when the brain is in a state of prolonged seizures. This process may affect
emotional, cognitive and behavioral characteristics and even cause death8.
Many factors may cause epilepsy, such as genetic mutation, developmental
conditions, tumors, head trauma and central nervous system infection6. Based on the
etiology, underlying causes of epilepsy can be classified as genetic,
“structural/metabolic”, and “unknown cause”. The best understood form is genetic
epilepsy, in which seizures are “the core symptom of the disorder”3. More than 200 single
gene disorders have been identified in association with epilepsy7, which include genes
that encode ion channels or their subunits. Mutations in any of the following may be
associated with genetic epilepsy (Figure 1.2)7: neuronal nicotinic acetylcholine receptor
(nAChR); subtype A of γ-aminobutyric acid receptor, (GABAA,); voltage-gated sodium
channel (SCN); voltage-gated potassium channel (KCNQ); voltage-gated chloride
channel (CLC) . Since neuronal communication and signal transduction are based on the
action of various ion channels, mutant channels may alter ion permeability of the
membrane, change excitability of the membrane, and regulate neurotransmitter release.
When the balance between excitatory and inhibitory synaptic input of the brain is
disrupted, uncontrolled hyperexcitability accompanys, which part of the brain may
receive excessive excitatory synaptic input9. As a result, seizures may occur.

28
“Structural/metabolic” epilepsy may be caused by structural lesions such as those caused
by stroke, trauma and infection4; these are collectively known as acquired epilepsy. It has
been reported that approximately 60% of all cases of epilepsy are acquired epilepsy10.
Status epilepticus, stroke and traumatic brain injury (TBI) are the common brain lesions
which may lead to the development of acquired epilepsy11. Studies have shown a
common molecular mechanism that induces brain damage after these brain lesions. Under
the pathogenic conditions, the increase in extracellular glutamate concentration
associated with calcium ion (Ca2+) overflow into neurons resulted in neuronal death and
brain damage, which is also known as excitotoxicity12. Conditions like these can
gradually elevate the risk of epilepsy onset. Forms of epilepsy with “Unknown cause”
may have a genetic defect or the consequence of a disorder that has not been recognized
yet4.
Epilepsy is one of the oldest recognized disorders, which was first described by
Hippocrates in the 5th century BC13. Much effort has been contributed to investigate new
types of antiepileptic drugs or antiepileptic treatments to decrease the frequency and
severity of seizures in people with epilepsy since potassium bromide was introduced as
the first anti-seizure drug in 185714. Unfortunately, about one third of epileptic patients
are not responsive to the current medications14-15. It is urgent to find innovative direction
for more effective and better tolerated treatments that can prevent, stop, or reverse the
development of epilepsy13-15.

29
Normal
nAChR GABAA SCN KCNQ CLC
K+; Ca2+ ; Na+
Cl- Na+
K+ Cl-
Mutant
GOF LOF LOF LOF GOF
K+; Ca2+ ; Na+
Cl- Na+
K+ Cl-Type of Mutation:
Figure 1.2 Mutation of ion channels alters the ion channels function (adapted and
modified from Steinlein, O. K., Genetic mechanisms that underlie epilepsy. Nat Rev
Neurosci 2004, 5 (5), 400-8)7
GOF, Gain of function; LOF, Loss of Function; nAChR, neuronal nicotinic acetylcholine
receptor; GABAA, subtype A of γ-aminobutyric acid receptor; SCN, voltage-gated
sodium channel; KCNQ, voltage-gated potassium channel; CLC, voltage-gated chloride
channel.
30
1.2 Nitric Oxide
1.2.1 The Physics and Chemistry of Nitric Oxide
Nitric oxide (NO) is one of the simplest biologically active molecules. Despite its
simplicity, this molecule has very complicated biosynthesis and regulation systems inside
the biological systems16. The rate of NO production, distance of diffusion, rate of
consumption, and local microenvironment all contribute to the role that NO plays in
physiological and pathological responses17.
NO is a colorless gas at room temperature, but it can react rapidly and
spontaneously with oxygen (O2) to form nitrogen dioxide (NO2), a brown gas, the main
component of air pollution18. The solubility of NO in water at room temperature is low,
about 2mM17. NO is a lipophilic molecule, so it is more concentrated in hydrophobic
regions (such as membranes) rather than aqueous regions19. This allows NO to easily
diffuse through cell membranes and act as a signaling molecule over distances in the
body20.
The Lewis structure (Figure 1.3) of NO reveals that NO has one unpaired
electron. NO can react quickly with other radicals, such as ·NO2, O2, and superoxide
anion (O2·-)21, to terminate radical chain reactions20. Therefore, NO is considered as an
antioxidant. NO can also serve as a ligand in several metal complexes17. One of the
important metal complexes that NO binds strongly to is the ferrous ion (Fe2+) – heme
complex. The binding between NO and Fe2+–heme groups allows conformation changes
in the enzyme that initializes activation17. And the high-affinity of NO for Fe2+ – heme
groups allows NO targets to be in other cells or even different tissue20. The Fe2+ – heme

31
containing protein includes soluble guanylate cyclase (sGC), cytochrome P-450, nitric
oxide synthase (NOS), and hemoglobin17, 20. The reactions between NO and Fe2+ – heme
containing protein are of biological significance. For example, the NO/sGC/ cyclic
guanosine-3’,5’-monophosphate (cGMP) pathway has been found to be vitally important
in preventing platelet aggregation and inhibition of platelet adhesion to endothelium
cells22. Additionally, oxidation of NO can yield electrophilic nitrosating species, such as
dinitrogen trioxide (N2O3), which can nitrosate thiols to form S-nitrosothiol compounds
(RS-NO)17. This process has been thought to play an important role in regulating both the
oxidative/nitroxidative stress phenomenon and protein misfolding23.
Figure 1.3 The Lewis structure of NO
1.2.2 The Biological Synthesis of NO
In the biological system, NO is produced by a five-electron oxidation of L-
arginine (L-Arg) to L-citrulline. This oxidation reaction involves O2 and is catalyzed by
nitric oxide synthase (NOS) (Figure 1.4). There are three types of NOS found in
biological systems: neuronal NOS (nNOS or NOS I); inducible NOS (iNOS or NOS II);
and endothelial NOS (eNOS or NOS III). NOSs have been named according to the order
and primary localization that they have been isolated and purified. These three isozymes

32
share 5 60 % amino acid sequence identity, retaining almost identical domain structure
and catalytic mechanisms24.
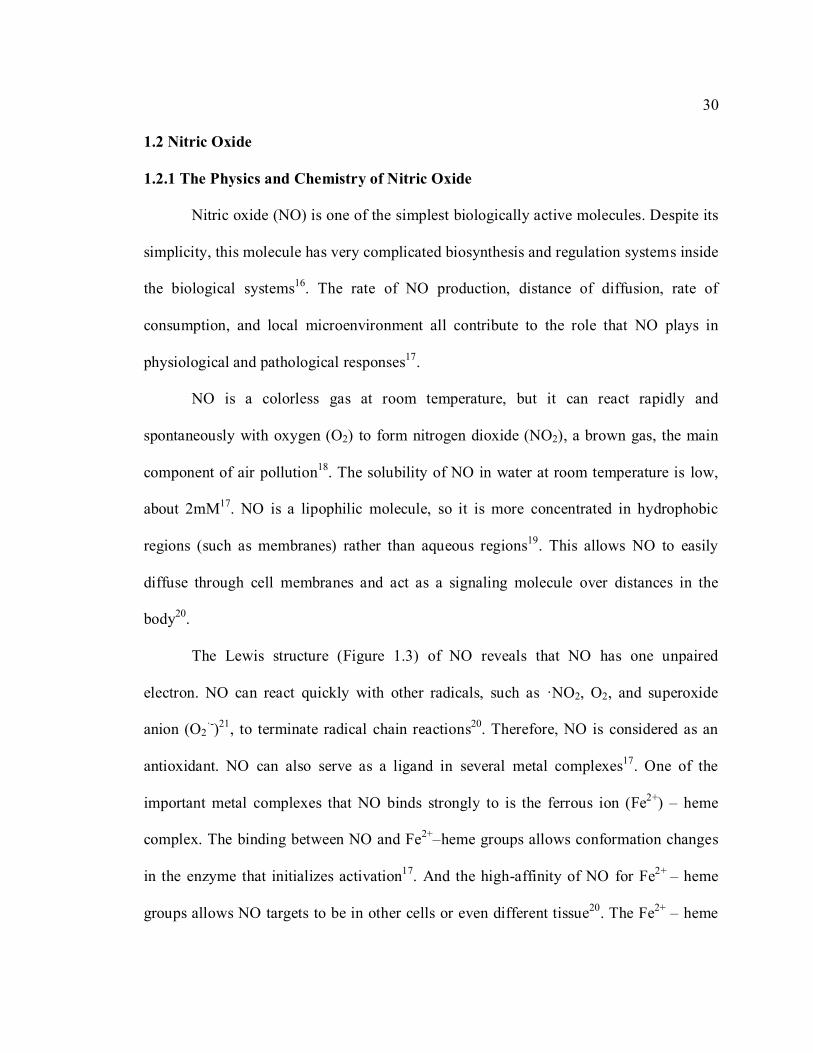
In NOS, the amino terminal (N-terminal) is an oxygenase domain and the
carboxyl terminal (C-terminal) is a reductase domain. There is a binding site for heme on
the oxygenase domain. Flavin mononucleotide (FMN), flavin adenine dinucleotide
(FAD), and nicotinamide adenine dinucleotide phosphate (NADPH) can bind to the
reductase domain of NOS. In between the oxygenase and reductase domains, there is a
binding site for calmodulin (CaM) (Figure 1.5).
Gel filtration experiments reveal that the molecular mass for the nNOS monomer
is 161 kDa, while the iNOS monomer is 131 kDa, and the eNOS monomer is 133 kDa17.
The catalytically active form of each enzyme is a homodimer, so functional NOS units
should be twice as large. This dimerization involves a cofactor called tetrahydrobiopterin
(BH4), and its binding is essential for NOS dimerization25. There are also additional
differences among the three enzymes besides molecular weight.
Figure 1.4 The biosynthesis of NO (adapted and modified from Freire, M. A.; Guimaraes,
J. S.; Leal, W. G.; Pereira, A., Pain modulation by nitric oxide in the spinal cord. Front
Neurosci 2009, 3 (2), 175-81) 26
33
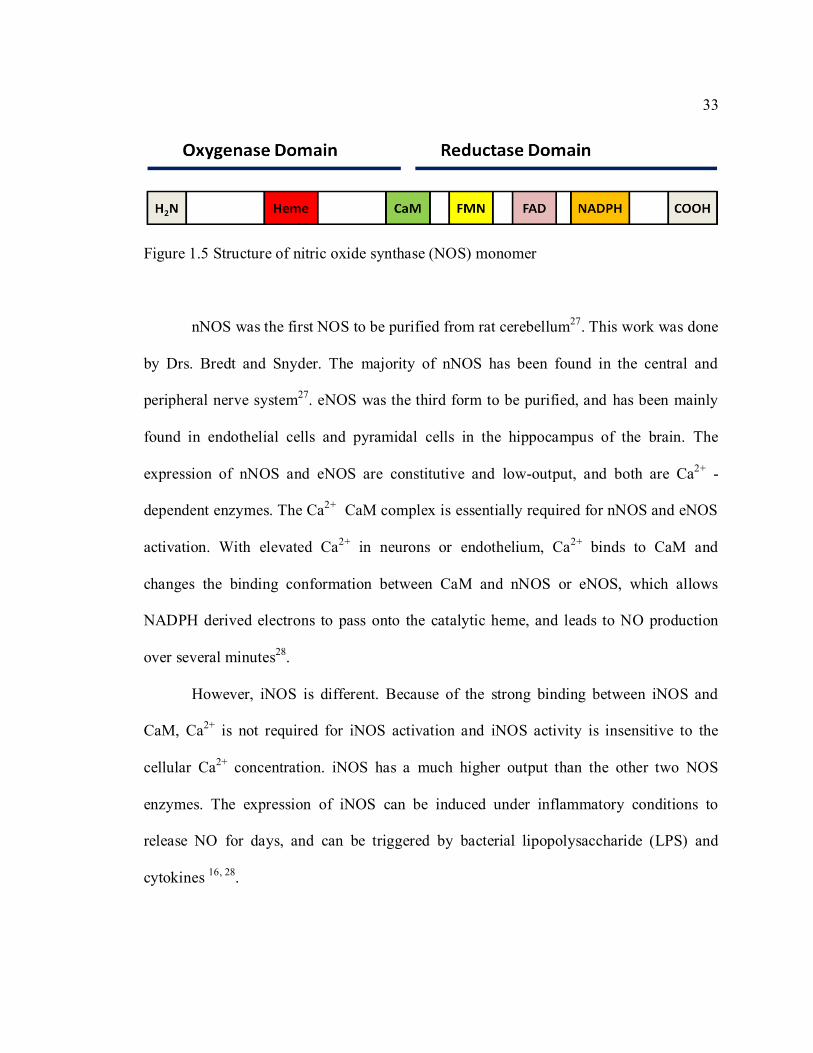
Figure 1.5 Structure of nitric oxide synthase (NOS) monomer
nNOS was the first NOS to be purified from rat cerebellum27. This work was done
by Drs. Bredt and Snyder. The majority of nNOS has been found in the central and
peripheral nerve system27. eNOS was the third form to be purified, and has been mainly
found in endothelial cells and pyramidal cells in the hippocampus of the brain. The
expression of nNOS and eNOS are constitutive and low-output, and both are Ca2+ -
dependent enzymes. The Ca2+ CaM complex is essentially required for nNOS and eNOS
activation. With elevated Ca2+ in neurons or endothelium, Ca2+ binds to CaM and
changes the binding conformation between CaM and nNOS or eNOS, which allows
NADPH derived electrons to pass onto the catalytic heme, and leads to NO production
over several minutes28.
However, iNOS is different. Because of the strong binding between iNOS and
CaM, Ca2+ is not required for iNOS activation and iNOS activity is insensitive to the
cellular Ca2+ concentration. iNOS has a much higher output than the other two NOS
enzymes. The expression of iNOS can be induced under inflammatory conditions to
release NO for days, and can be triggered by bacterial lipopolysaccharide (LPS) and
cytokines 16, 28.

34
In addition to the component mentioned above, NOSs are subject to many
modifications that affect their function. Certain posttranslational modifications, such as
phosphorylation, are required for NOS activity16, 29. eNOS is also myristoylated, which
anchors eNOS to the membrane. Acylation, palmitoylation, and Golgi localization are
required for eNOS function and subcellular distribution17. Moreover, the presence of a
zinc-sulfur (Zn-S) cluster can help to stabilize the binding between BH4 and NOS
dimer30.
1.2.3 The Biological Function of Nitric Oxide
Nitrocompounds have been used to clinically treat angina pectoris for over 100
years without knowing the mechanisms involved17. Later, researchers found that
regulation of cGMP concentration in mammalian tissues can cause vascular smooth
muscle relaxation and increase in blood flow31. The link between nitrocompounds and
cGMP was the next connection. Drs. Furchgott and Zawadzki did pioneering work in
noticing an endothelium-derived relaxing factor (EDRF) that could be produced by
acetylcholine-treated endothelial cells to relax blood vessels through activating guanylate
cyclase32. In 1986, Drs. Furchgott33, Ignarro34, and Moncada35 proposed that NO was the
EDRF. In 1992, Dr. Malinski used a porphyrin-based microsensor to measure NO release
in situ, which was the first time NO has been measured from biological milieu and
provided the final proof that NO was EDRF19.
NO has been found to regulate several biological systems. The circulatory system
aspects of NO were the first to be discovered. NO can inhibit platelet aggregation,
regulate blood pressure, prevent platelet adhesion to endothelial cells, and relax smooth

35
muscle cells in the cardiovascular systems22. NO is also a mediator in the immune system
that responds to cytokine stimulation16, 28.
In the nervous system, NO serves as a neurological messenger involved in
excitatory signaling transduction pathway36-37. This gas molecule is different from other
biogenic transmitters, such as glutamate and γ-aminobutyric acid (GABA). NO does not
require synaptic vehicles for storage38. NO is hydrophobic, and it can easily diffuse
through the cell lipid bilayers and affect adjacent cells. All three NOS isoforms exist in
the brain, but the predominant source of NO is provided by nNOS in neurons23. The PDZ
binding domain on the C-terminal of nNOS helps it to bind to the N-methyl-D-aspartate
(NMDA) receptor through postsynaptic density protein PSD95. NMDA receptor is a
predominant ion channel that is involved in synaptic plastics, learning, and memory.
NMDA receptors are highly permeable to Ca2+. Excitatory neurotransmitters, like
glutamate, bind to NMDA receptor and activate the receptor, which causes the receptor
open. Extracellular Ca2+ enters into the cytosol, and Ca2+ – CaM complex is formed to
activate nNOS to produce NO release27, 36 (Figure 1.6).
NO participates in signal transduction pathways by binding to sGC. With NO
binding to the heme-containing transition metal (Fe2+) center, the structural conformation
of sGC changes to stimulate cGMP production. cGMP is found to mediate NO-dependent
vasodilation and neuronal plasticity38-39. This signal transduction pathway is essential for
synaptic development, neuronal plasticity, learning, and memory.
NO can also react with the sulfhydryl groups on proteins to form nitrosothiol
compounds (SNOs). This post-translational modification is known as S-nitrosylation.

36
Research suggests this modification may have a similar function to phosphorylation in
signal transduction processes40-44. The Lipton group was the first to find that excessive
activity of the NMDA receptor can be downregulated by S-nitrosylation on cysteine
residue (Cys399) in the NR2A subunit of NMDA receptor45, in which glutamate induced
excitotoxity can be inhibited; NO yields a neuroprotective effect. Moreover, NO can also
S-nitrosylate caspases, which can inhibit the protease activity of caspases, and prevent
neuronal cell apoptotic death46. S-nitrosoglutathione (GSNO), which is the product from
reduced glutathione (GSH) S-nitrosylation, has been found to have 100 times more
effective antioxidant ability than GSH in suppressing iron-induced generation of
hydroxyl radical (·OH) 47, the major toxin produced in vivo20.
In addition, NO produced by eNOS from the brain serves as a modulator in
neurogenic vasodilation48.

37
CaM nNOS
PSD95
NMDA receptor
Ca2+
Glutamate
NO
L-Arginine L-Citrulline
sGC GTP
cGMP
Presynaptic Neuron
Postsynaptic Neuron
Figure 1.6 The Biological Function of NO in Nerve System (adapted and modified from
Boehning, D.; Snyder, S. H., Novel neural modulators. Annu Rev Neurosci 2003, 26, 105-
31)38
1.3 Peroxynitrite (ONOO-)
At the time when EDRF was discovered, it was also found that addition of
superoxide dismutase (SOD) could extend the half-life of EDRF49. Since SOD can
diminish endogenous superoxide anion (O2·-) production, O2
·- was involved in the
breakdown of EDRF. The protective effect from EDRF was considered to scavenge O2·-,
which was also one of the criterions of EDRF20. After NO was identified as the EDRF,
38
peroxynitrite (ONOO-), the product from the reaction between NO and O2·-, was also
noticed to yield many cytotoxic effects50-51.
Peroxynitrite (ONOO-) is produced by reaction between NO and O2·-, which is
controlled by diffusion (average rate at 6.7 ± 0.9×10⁹ M-1s-1 )52 (Figure 1.7). This anion
has a short half-life, less than 1 second. The logarithmic acid dissociation constant (pKa)
of ONOO- is 6.8. Thus, there are two forms, peroxynitrite anion (ONOO-) and
peroxynitrous acid (ONOOH) under physiological conditions (pH 7.4) 50. ONOO-/
ONOOH are strong oxidants that can directly react with biomolecules, such as
metalloproteins and protein thiols. ONOO- can rapidly react with carbon dioxide (CO2) to
form ·NO2 and a carbonate radical (CO3·-). ONOOH, the protonated form of ONOO-, can
readily produce ·OH and ·NO2 through homolytic cleavage, hydroxide ion (OH-) and
nitronium ion (NO2+) through heterolytic cleavage, and hydrogen ion (H+) and nitrate ion
(NO3-) by isomerization (Figure 1.7). The radical products from ONOO-, such as ·NO2;
CO3·- and ·OH, are more potent oxidants than ONOO - itself, which contributes to the
oxidative/nitroxidative stress on the system21.

39
NO + O2·-
ONOO-
ONOOH HO· + · NO2
ONOOCO2- CO3
·- + · NO2CO2
H+
HO- + NO2+
H+ + NO3-
Homolytic cleavageHeterolytic cleavage
Isomerization
Figure 1.7 The interplay of nitric oxide, superoxide anion, and peroxynitrite (adapted and
modified from Malinski, T., Nitric oxide and nitroxidative stress in Alzheimer's disease. J
Alzheimers Dis 2007, 11 (2), 207-18)21
1.4 Oxidative/ Nitroxidative Stress
Reactive oxygen species (ROS), such as O2·-, ·OH, and hydrogen peroxide
(H2O2), are important molecules that are involved in both normal cell function and the
development of disease53. Oxidative stress describes the imbalance between ROS and
antioxidants in the biological system. Overproduction of ROS, especially the formation
of O2·- , has been found in many diseases, such as Parkinson’s54, Alzheimer’s disease55,
amyotrophic lateral sclerosis (ALS)56, and a majority of cardiovascular diseases57, like
atherosclerosis, heart failure and hypertension. O2·- itself can serve as an oxidant (by
accepting an electron) or as a reducing agent (by donating an electron). In fact, O2·- acts
as a mild reductant under physiological conditions, and becomes a strong oxidant when it
binds to proteins20. In biological systems, O2·- is the precursor to produce other ROS.

40
Since O2·- cannot freely diffuse across the cells like NO and has to permeate through
anion channels58, the function of O2·- is limited to the location where it was produced.
O2·- is primarily produced in mitochondria as a byproduct of the mitochondrial respiration
chain. Under physiological conditions, SOD inside the mitochondria can scavenge O2·- to
detoxify the cells. If mitochondria become dysfunctional, or other oxidases (such as
NADPH oxidase or xanthine oxidase) are activated under certain conditions, O2·- and
ROS are overexpressed59. This imbalance between active oxidants and endogenous
antioxidants induces oxidative stress.
The non-enzymatic interaction between NO and O2·- is so rapid that it can
outcompete O2·- scavenger action from SOD20. As a result, when cellular oxidative stress
increases, excessive O2·- can react with NO to synthesize ONOO-. ONOO- is a more
powerful oxidant species than O2·- and NO. It was first found to trigger cell death by
necrosis60. Later, more studies revealed ONOO- is also involved in cell apoptosis by
inducing mitochondrial permeability transition (MPT)20, which is the prominent feature
of ONOO- mediated cell apoptosis. The efflux of proapoptotic signaling molecules from
mitochondria to the cytosol can induce cell death. This occurs through permeability
transition pores during MPT61. ONOO- can also react directly with electron-rich groups,
such as sulfhydryls, iron-sulfur clusters, zinc-thiolates, and the active sulfhydryl groups
in tyrosine phosphatases.
ONOO- has a number of downstream impacts once present in the cell. First,
ONOO- can readily oxidize transition metals, such as iron, zinc, and copper. Those metals
are usually cofactors in certain enzymes, like copper, zinc, and manganese based SODs.

41
The oxidation reaction between ONOO- and SOD would deactivate the enzyme, which
can cause cells to lose the ability to diminish ROS damage62-63. Second, ONOO- can also
react with eNOS, which triggers eNOS uncoupling and switches eNOS from NO
producing enzyme to synthesize O2·-64. Third, ONOO- can react with lipid to cause lipid
peroxidation, which can alter membrane bilayers integrity to trigger cell apoptosis62.
Fourth, ONOO- can cause mitochondrial dysfunction by reacting with mitochondrial
cytochrome oxidase (Complex I and Complex III)65. Finally, ONOO- can react with
purine nucleotides in DNA, which causes DNA strands to break66.
The homolytic and heterolytic cleavage products from ONOO-/ ONOOH, such as
·NO2 and NO2+; are more potent oxidants than ONOO- itself21. Collectively, these
compounds contribute to the nitroxidative stress of the biological system. Oxidative/
nitroxidative stress together shift the redox state of the biological milieu. The resulting
overproduction of ROS and reactive nitrogen species (RNS) has been found to play a
vital role in vascular disease67, neurodegenerative disease21, and aging68.
1.5 Epilepsy and Nitric Oxide
Excitotoxicity is a term used to describe the neuronal damage caused by excessive
activation of glutamate receptors, including the NMDA receptor69-70. Neurological
damage caused by epileptic seizures has been strongly linked to excessive excitatory
amino acid neurotransmitters69, 71-73. The release of NO is also thought to be the result of
NMDA receptor activation27. When excitatory amino acids and neurotransmitters, such as
glutamate, bind to NMDA receptors, Ca2+ influx is stimulated. Then, the Ca2+ -sensitive
nNOS and eNOS are activated to release NO74-76.

42
V. Mollace et.al77 published the first paper about the role of NO in epilepsy in
1991. They injected L-Arg prior to NMDA injection into rat brains, and found the
convulsant effect from NMDA had been significantly potentiated. L-Arg can lower the
threshold of epileptic seizure events induced by NMDA. Thus, L-Arg serves as a
proconvulsant agent77.
Later, many scientists studied the effect of NO in seizures, NO precursors, NO
donors, and NOS inhibitors on living organisms. The results turned out to be
controversial. Table 1 summarized the studies on regulation of NO levels in different
epileptic models. Pentylenetetrazol (PTZ), a GABA antagonist, and maximal
electroshock (MES) therapies have been used to induce generalized seizures in rodents.
Pilocarpine (acetylcholine agonist), kainic acid (glutamate agonist), and NMDA
(glutamate agonist) have been used to induce temporal lobe epileptic seizure in rodents.
The elevation of NO levels showed proepileptic, antiepileptic or even no effect
depending on models.
Due to the short half-life (3 5 s), no direct methods were used to measure in situ
NO release in epileptic brain. NO production was estimated through NOS expression
measured by NADPH-diaphorase histology methods78-79. Other methods measured the
concentration of L-Arg, L-citrulline and cGMP by microdialysis through high-
performance liquid chromatography (HPLC) or by radiological tracking of the activity of
NOS80. NO metabolites, NO2- and NO3
- (NOx), were also measured as indirect
quantifications of NO production during the seizures81. Moreover, fewer interests have

43
been addressed on ONOO- production in epileptic conditions due to lack of direct
methods to measure ONOO-.
Table 1.1 The effect of L-Arg and NOS inhibitors on epileptic seizures Epileptic
animal models
PTZ Pilocarpine Kainic
acid
NMDA MES
L-Arg -82 -83 +77
L-NAME
(NOS
inhibitor)
-84-85
+86
+83, 87-88
-89
+90
-77
No effect91
L-NNA
(NOS
inhibitor)
No
effect 92
+86, 93
+74, 93 +74, 94 No effect92
L-NMMA
(NOS
inhibitor)
-85 +83
7-nitroindazole
(nNOS
inhibitor)
-95 +87 +90
“+” sign indicates the severity of seizure events has been increased.
“-” sign indicates the severity of seizure events has been decreased.
L-NAME: L-NG- nitroarginine methyl ester
L-NNA: L-nitroarginine
L-NMMA: L -NG-monomethylarginine

44
Since there was no direct evidence to show NO production during seizures, the
role of NO in epilepsy can be argued. The effect of NO may result from drug interactions
and pharmokinetics92, 96-97. NOS inhibitors themselves may react with other chemicals
that induce epilepsy in animals. This means that the anticonvulsant or proconvulsant
effects from NOS inhibitor can be NO independent. The route of drug delivery (systemic
versus central), and animal species were also considered to contribute to differing
results81, 96.
Several studies also suggested oxidative stress was involved in the development
of epileptic seizures. After prolonged epileptic seizures, ROS production increased 98, 99-
100. Oxidative damage was observed as a decrease of mitochondrial DNA (mtDNA) copy
number, deactivation of Complex I and Complex IV of respiration chain101, and lipid
peroxidation102.
With the presence of excessive O2·-, it is very likely that NO could react with O2
·-
to form ONOO-. However, fewer studies were conducted to investigate the effect of
ONOO- in epilepsy. The indirect measurement methods of NO mentioned above cannot
distinguish between the effects of NO and ONOO- in seizures. This may explain a
controversial effect of NO. ue to the short half-life (3 5 s) and rapid-diffusion of NO,
and also extremely short life (< 1.0 s) of ONOO-, no direct in situ measurements of NO
and ONOO- concentration in epileptic brains have been reported. This study is the first
one to apply nanomedical approach on direct measurement of NO and ONOO - in
epileptic brain.

45
1.6 Research Goals
Temporal lobe epilepsy (TLE) is a form of focal seizure which often happens in
adults, and is the most frequent form of acquired epilepsy in humans. An initial injury,
such as an episode of prolonged seizures or status epilepticus, hypoxia, or trauma may
precede the onset of the disease103. Head trauma and stroke are thought to be the cause of
a majority of TLE cases 104. The onset area of TLE is believed to be in the
hippocampus105, which plays an important role in learning and memory. A unique pattern
of hippocampal damage is found in most TLE patients 104. Continuous abnormal
hippocampal discharge causes significant cerebral damage, resulting in long-term
behavioral changes and cognitive decline 106-107. This type of epilepsy is poorly controlled
with current anticonvulsant drugs. Severe TLE patients may need surgical removal of
lesion foci.
Most epileptic studies are focused on the regulation of ion channels and receptors
to alter net excitability in the brain. Antiepileptic drugs were also designed to modulate
the function of ion channels and receptors to restore the ion balance. However, seizures
are not quite controlled in a third of all affected individuals14. A new insight in epilepsy
research has been proposed to emphasize the prevention of chronic epilepsy development
rather than controlling seizures per se with antiepileptic drugs14, 103. In order to achieve
the goal, the mechanism in the development of epileptic seizures should be addressed and
new biomarker is also needed for prediction of the disease108.
In the study presented here, pilocarpine (PILO), a muscarinic receptor agonist, has
been used to induce epileptic seizure events in Sprague-Dawey (SD) rats. The usage of

46
PILO in rodents has been found to develop similar epileptic seizure characteristics when
compared to temporal lobe epilepsy in humans. This includes neuronal loss and aberrant
mossy fibers sprouting in hippocampus. Electroencephalography (EEG) was used to
monitor rat brain activity for the whole study.
1.6.1 Goal 1: To Understand the Role of NO and ONOO- in the Mechanism of
Epileptic Eeizures
It is crucially important to know about minute level of NO and ONOO- during the
epileptic seizure events. Therefore, a nanomedical system has been prepared to measure
NO and ONOO- directly in the brain in this study. Two types of nanoscale porphyrin-
based electrochemical nanosensors (diameter 200 300 nm) were used to monitor NO and
ONOO- release in vivo, which helped us to better understand the role of NO and ONOO-
in epileptic seizures.
1.6.2 Goal 2: To Elucidate the Effect of [NO] / [ONOO-] Balance in Epileptic
Seizures
Since the function of NO can be altered by the rate of NO production, distance of
diffusion, rate of consumption, and redox cellular states, a ratio of NO concentration to
ONOO- concentration ([NO]/ [ONOO-] ) was used as a criterion to evaluate the
relationship between cytoprotective NO and cytotoxic ONOO- in epileptic seizures.
1.6.3 Goal 3: To Study an Environmental Effect of Different Molecules on NO/
ONOO- Balance in Epileptic Seizures
Nitric oxide synthase (NOS) substrate, L-Arg; nonselective NOS inhibitor, L-
NAME; NADPH oxidase inhibitor, 1,3-Benzoxazol-2-yl-3-benzyl-3H-

47
[1,2,3]triazolo[4,5-d]pyrimidin-7-yl sulfide (VAS 2870); cell-permeable superoxide
dismutase (SOD) mimetic and ONOO- scavenger, Mn(III)tetrakis(4-benzoic
acid)porphyrin Chloride (MnTBAP); ONOO- donor, 3-Morpholinosydnonimine (SIN-1);
synthetic solution of NO, ONOO- , and O2·- have been administered into the brain to
study the change of NO and ONOO- concentrations and their influence on epileptic
seizures. [NO]/ [ONOO-] release was directly correlated with the severity and intensity of
epileptic seizures.
1.6.4 Goal 4: To Propose the Potential Pharmacological Method of Intervention to
Minimize/ Eliminate Epileptic Seizures
Current anticonvulsant medications have saved the lives of many epileptic people,
but the medications target the suppression of seizure severity. In this study, the pivotal
role of NO, ONOO-, and their imbalance in epileptic seizures was addressed. A new
pharmacological intervention by increasing/restoring a balance between NO and ONOO-
and reducing an effectiveness of the oxidative stress was proposed to provide a pathway
for mollification and treatment of epileptic seizures.

48
2. MATERIALS AND METHODS
2.1 Nanosensor Fabrication
Real-time NO and ONOO- release was measured with nanosensors (diameter 200
300 nm). The design of the nanosensors was based on previously developed chemically
modified carbon fiber technology 19, 109.
1. The glass capillary (KIMAX-51, Kimble Glass, INC.) with 1.5 ~ 1.8mm
diameter open-end was heated in a Bunsen burner flame and pulled. A
300-µm-diameter tip was formed.
2. Single carbon fiber (original diameter ~ 7 µm) were put through the end of the
capillary with 1~2 cm of the fiber protruding.
3. The carbon fiber was sealed and electrically connected to copper wires with
conductive sliver epoxy.
4. Assembled electrode was cured in the vacuum oven at ~ 80 ºC for 3 hrs.
5. The interstitial space between glass tip and the carbon fibers was sealed by
bee wax and rosin.
6. The diameter of carbon fiber tip was reduced to ~ 300 nm and the length of
carbon fiber tip was reduced to ~ 0.5 cm by gradual burning of the fiber using
propane microburner.
7. The assembled electrodes were kept in 0.10 M sodium hydroxide (NaOH)
before the poly-metalloporphyrin coating to remove extra beeswax and other
organic residues.

49
2.2 NO Nano-sensor Preparation
After the electrodes have been assembled, a three-electrode cell set-up as
following was used to coat the sensors: a platinum wire served as a counter electrode; a
silver/ silver chloride (Ag/AgCl) was the reference electrode; the assembled carbon fiber
as the working electrode. The exposed suface of the conical shape of the carbon fiber tip
was electrochemically cleaned in 0.10 M NaOH while potential was alternatively kept at
1.5 V or - 1.5 V vs Ag/AgCl to remove the impurities. Then, the carbon fiber tip was
electrochemically covered with conductive polymeric porphyrin: polymeric nickel (II)
tetrakis (3-methoxy-4-hydroxyphenyl) porphyrin (Ni porphyrin, Frontier Scientific) for
NO sensors in the repeated cyclic voltammetry (CV) mode. The potential from - 0.20 V
to + 1.0 V vs Ag/AgCl and the scan rate of 100 mV/sec were applied. Two glowing
voltammetric peaks were observed at 0.54 V and 0.40 V vs Ag/AgCl, which indicated the
amount of polyporphyrin film that had been deposited. After the Ni porphyrin coating,
the electrode was covered with another thin layer of Nafion (Sigma-Aldrich) by
immersing the electrodes in 1% Nafion solution (5% Nafion solution mixed with absolute
ehanol and stir for ≥ 1 hr) for ~ 10 sec. and repeated 3 times. The integrity of Nafion
coating can be also tested by CV in 0.10M NaOH from – 0.2 V to 0.8 V vs Ag/AgCl at
100 mV/sec scan rate. The absence of peaks at 0.54 V and 0.4 V vs Ag/AgCl can confirm
the good coating of Nafion110.
As Figure 2.1 shows, Nafion is negative charged, which can repel NO2-, NO3
-
species but highly permeable to NO. High conductive Ni polyporphyrin serves as a

50
catalyst in NO oxidation reaction, which allows the rapid movement of the electrons.
Both of the factors ensure the sensors are highly selective and rapidly responsive to NO.
Figure 2.1 Schematic diagram of NO nanosensor (adapted and modified from Malinski,
T.; Taha, Z., Nitric oxide release from a single cell measured in situ by a porphyrinic-
based microsensor. Nature 1992, 358 (6388), 676-8)19
2.3 Preparation of NO Standard Solution
The sensors were calibrated by using NO standard solution. NO gas was
generated by dripping 6M sulfuric acid (H2SO4, Fisher) into the solid sodium nitrite

51
(NaNO2, Sigma-Aldrich) in the presence of iron sulfate (FeSO4, Sigma-Aldrich) as a
catalyst (Equation 2.1).
The setup for NO synthesis is shown in Figure 2.2. The whole setup was
deo ygenated for .5 1 hr by flowing through nitrogen (N2) gas before starting and
during the reaction to prevent NO from rapidly oxidation to form NO2, a brown gas.
NaNO2 (4 50g) and FeSO4·7H2O (10 15g) was added into the dry two-arm flask.
Vacuum grease and parafilm were applied on all the connections to prevent gas leakage.
The speed of H2SO4 dripping into NaNO2 was adjusted to 1 drop every 10 seconds. Later,
the mixture gas produced by the reaction between NaNO2 and H2SO4 accompanied with
N2 went through two reaction vessels which contain 4M and 2M NaOH respectively to
remove the impurities produced by the reaction, such as NO2, NO3, N2O3 and N2O5. NO
was collected in a 5-mL conical Pyrex reaction vial with a rubber septum in the ice bath.
Each of the collecting vials was filled with 3 mL 0.1 M sodium phosphate buffer (PB, pH
7.4) and deoxygenated for ~ 20 min before the collection. NO was collected for ~ 15 min
in each vial with stirring all the time.

52
Figure 2.2 Schematic diagram of set-up for NO synthesis (adapted and modified from Malinski, T.; Huk, I., Measurement of
nitric oxide in single cells and tissue using a porphyrinic microsensor. Curr Protoc Neurosci 2001, Chapter 7, Unit7, 14) 111

53
After the collection, the vials of NO solution were kept in the refrigerator. The
concentration of the standard solution was measured by the oxyhemoglobin (oxyHb)
assay112. The assay is based on the reaction shown below:
Hemoglobin (Hb, Sigma-Aldrich, 20mg) was dissolved in 1 mL nanopure water.
A small amount (about 10 µg) of sodium hydrosulfite (Na2S2O4, Sigma-Aldrich) was
added to Hb solution to reduce iron (III) to iron (II). The pink solution of reduced Hb was
oxygenated by O2 for ~ 20min until the solution turned bright red. UV-vis
spectrophotometer (DU 640, Beckman Coulter) has been used to record the absorbance
from 380 nm to 450 nm wavelength (Figure 2.3). Absorbance change at wavelength
401nm before and after NO addition (ΔA401nm (metHb-oxyHb)) reflects the concentration
change of methemoglobin (metHb). The isobestic point of oxyHb and metHb is at
wavelength 410.5nm.
The concentration of metHb ([metHb]) that formed was based on the amount of
NO solution. Knowing the molar absorptivitity coefficient (ε) for oxyHb is 131.0 mM -
1cm-1 and for metHb is 49 mM-1 cm-1, NO concentration ([NO]) can be determined by the
following equations:
(2.4)
(2.3)
(2.2)

54
Figure 2.3 An example of UV-Vis spectra of (a) oxyHb and (b) metHb solutions in PB
buffer
In the presence of NO, oxyHb is converted to metHb; the spectrum of oxyHb
shifts to left and becomes the spectrum of metHb. The difference in absorbance of metHb
and oxyHb at wavelength 401 nm (ΔA401nm (metHb-oxyHb)) was taken to calculate the
concentration of metHb and the concentration of NO.
2.4 NO Sensor Calibration
The calibration of the sensor was performed by using the aliquots of NO standard
solution to the electrolytic cell. A three-electrode system was utilized for
amperometerically record of NO release (Figure 2.4). Platinum wire was used as a
counter electrode, Ag/AgCl was used as a reference electrode, and NO sensor was the
working electrode. Gamry VFP600 multichannel potentiastat was used to record the NO
response curve at a constant potential of 700mV vs Ag/AgCl. A linear calibration curve

55
was constructed for each sensor in the range of 20 nM to 1 µM using NO standard
solution (Figure 2.5 a and b).
Figure 2.4 Three-Electrode electrochemical system used for NO calibration

56
Figure 2.5 (a) A typical NO response curve, (b) The calibration curve of NO standard
solution (R2=0.9586).
y = 577.55x + 0.5307 R² = 0.9586
0
50
100
150
200
250
300
0 0.1 0.2 0.3 0.4 0.5
Cu
rre
nt (
nA
)
[NO] µM
a)
b)

57
2.5 ONOO- Nano-sensors Preparation
The design of ONOO- electrodes was based on Xue et.al.113 with some
modification (Figure 2.6). The assembled carbon fiber electrode was electrochemically
cleaned in 0.50 M H2SO4. The potential range from - 1.0 V to + 1.0 V vs Ag/AgCl and
the scan rate of 100 mV/sec have been used to remove impurities from the surface of
carbon fibers. Then, the carbon fiber tip was electrochemically covered with a film of
conductive polymeric porphyrin: manganese(III)-[2,2] paracyclophenyl-porphyrin (Mn
porphrin, Frontier Scientific). A solution of monomer Mn porphrin (5 mM) dissolved in
dimethyl sulfoxide (DMSO, Sigma-Aldrich) and 0.1 M tetrabutylammonium perchlorate
(TBAP) as a supporting electrolyte was used in this process. The potential from - 0.50 V
to + 1.0 V vs Ag/AgCl and the rate of 100 mV/sec were applied for electrochemical
coating. After cleaning with acetone and distilled water, the electrode was immersed in
poly (4-vinylpyridine) (PVP) solution (1% w/v, PVP/methanol) for ~10 sec. This process
was repeated 3 times and allowed to dry in between. The last step for ONOO- nanosensor
preparation involved a repeating CV scan - 0.2 V to 1.0V vs Ag/AgCl (scan rate of 100
mV/sec) in buffer solution (PB solution, pH 7.4) for ~ 5 min to activate the surface
coating of the electrode.
Figure 2.6 shows the diagram of the construction and mechanism for ONOO-
measurement. Mn polyporphyrin is selective to ONOO-. PVP is positively charged
barrier and prevents diffusion of positively charged molecules like dopamine interference
to the sensor.

58
Figure 2.6 Schematic diagram of ONOO- nanosensor (adapted and modified from
Malinski, T.; Taha, Z., Nitric oxide release from a single cell measured in situ by a
porphyrinic-based microsensor. Nature 1992, 358 (6388), 676-8 and Xue, J.; Ying, X.;
Chen, J.; Xian, Y.; Jin, L., Amperometric ultramicrosensors for peroxynitrite detection
and its application toward single myocardial cells. Anal Chem 2000, 72 (21), 5313-21)
19,113
2.6 ONOO- Standard Solution Synthesis
ONOO- can be synthesized by following fast reaction (equation 2.5, 2.6 and 2.7)
between hydrogen peroxide (H2O2) and NaNO2, and then quenched by NaOH solution.

59
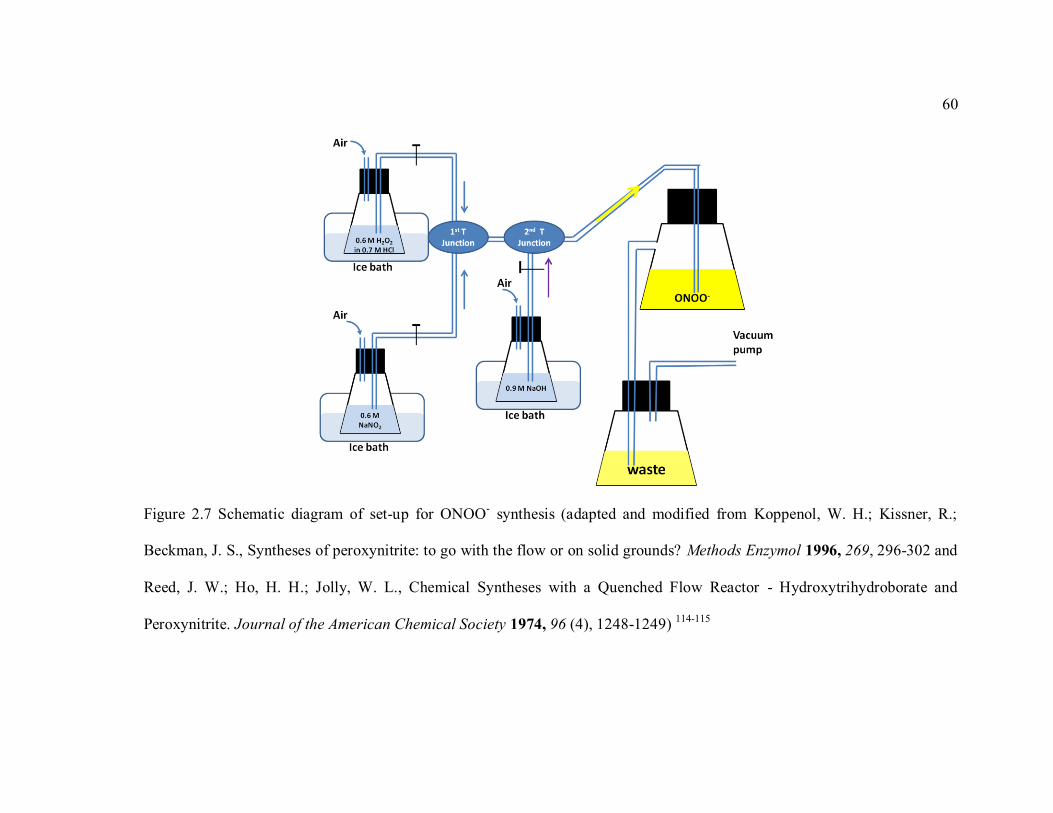
Figure 2.7 shows the setup for ONOO- synthesis. 0.6 M H2O2 was made with 0.7
M hydrochloride (HCl) solution. 0.6 M NaNO2 and 0.9 M NaOH solution were made
with distilled water. All the solution was kept in ice or fridge after preparation to lower
the temperature to 0 ºC. A vacuum pump was used in the end of the system to drive H2O2
and NaNO2 to the first T-junction at where ONOOH solution was formed. The flow
speed of H2O2 and NaNO2 solution was adjusted to ensure the two reagents arrival in that
T-junction at the same time. The formed ONOOH solution kept flowing to the second T-
junction and was quenched by excess NaOH to stabilize ONOO- anion. A strong yellow
product solution indicated the formation of ONOO - was collected in the end of the
system. Other gas phase waste was collected in the waste container. After the synthesis,
ONOO- standard solution was stored in the - 80 ºC freezer to prevent ONOO-
decomposing to NO2- and O2.
(2.7)
60
Figure 2.7 Schematic diagram of set-up for ONOO- synthesis (adapted and modified from Koppenol, W. H.; Kissner, R.;
Beckman, J. S., Syntheses of peroxynitrite: to go with the flow or on solid grounds? Methods Enzymol 1996, 269, 296-302 and
Reed, J. W.; Ho, H. H.; Jolly, W. L., Chemical Syntheses with a Quenched Flow Reactor - Hydroxytrihydroborate and
Peroxynitrite. Journal of the American Chemical Society 1974, 96 (4), 1248-1249) 114-115
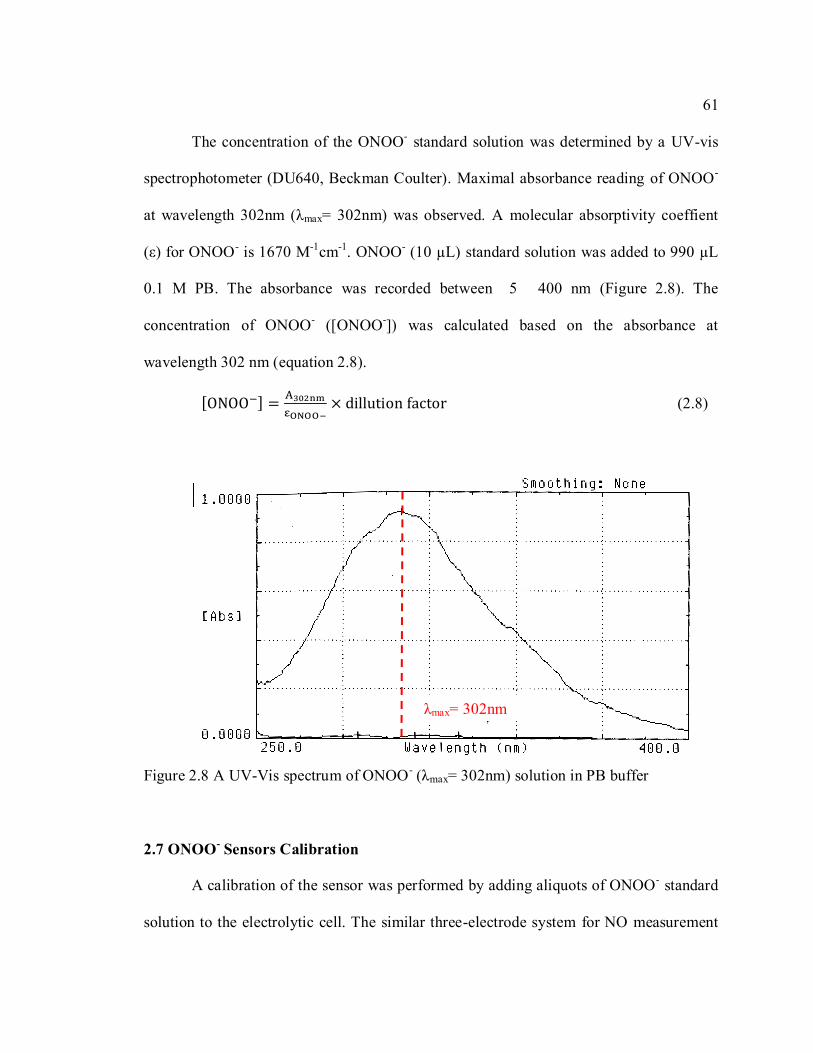
61
The concentration of the ONOO- standard solution was determined by a UV-vis
spectrophotometer (DU640, Beckman Coulter). Maximal absorbance reading of ONOO-
at wavelength 302nm (λmax= 302nm) was observed. A molecular absorptivity coeffient
(ε) for ONOO- is 1670 M-1cm-1. ONOO- (10 µL) standard solution was added to 990 µL
0.1 M PB. The absorbance was recorded between 5 400 nm (Figure 2.8). The
concentration of ONOO- ([ONOO-]) was calculated based on the absorbance at
wavelength 302 nm (equation 2.8).
(2.8)
Figure 2.8 A UV-Vis spectrum of ONOO- (λmax= 302nm) solution in PB buffer
2.7 ONOO- Sensors Calibration
A calibration of the sensor was performed by adding aliquots of ONOO- standard
solution to the electrolytic cell. The similar three-electrode system for NO measurement
λmax= 302nm

62
was utilized to amperometerically record ONOO- release. Gamry VFP600 multichannel
potentiastat has been used to record the ONOO- response curve at a consant potential at -
450mV vs Ag/AgCl. A linear calibration curve was constructed for each sensor in the
range from 1 µM to 10 µM of ONOO- standard solution (Figure 2.9 a and b).
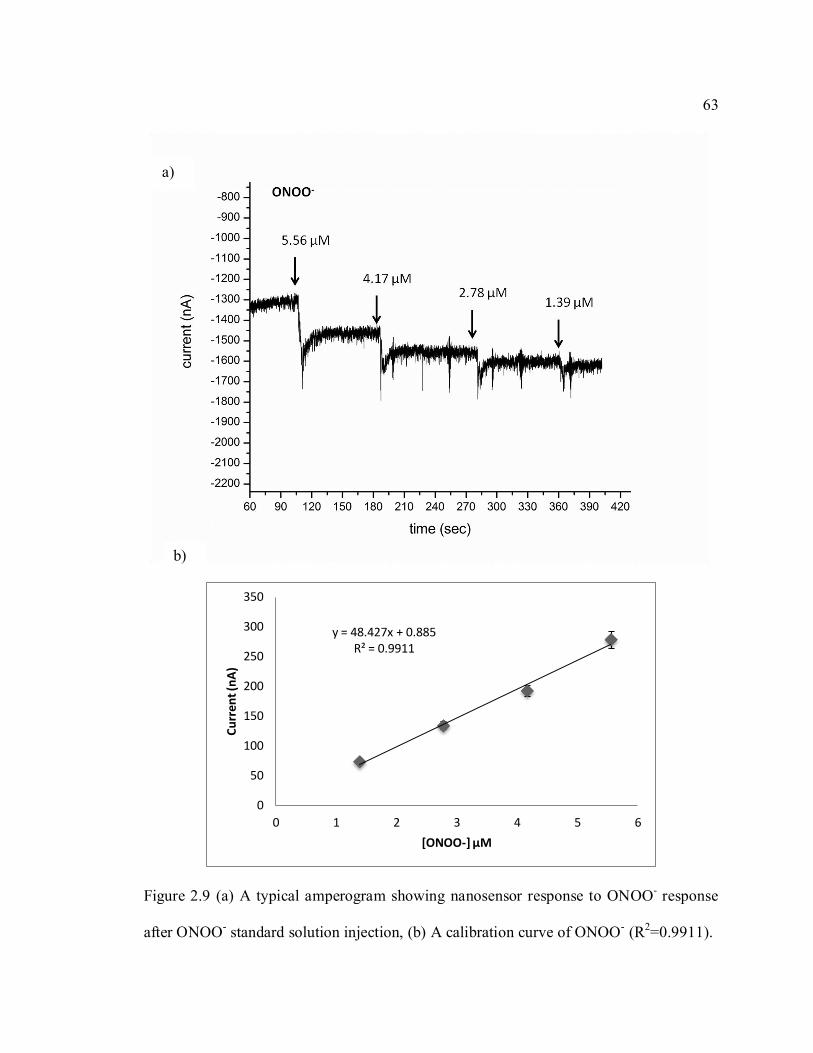
63
Figure 2.9 (a) A typical amperogram showing nanosensor response to ONOO- response
after ONOO- standard solution injection, (b) A calibration curve of ONOO- (R2=0.9911).
y = 48.427x + 0.885 R² = 0.9911
0
50
100
150
200
250
300
350
0 1 2 3 4 5 6
Cu
rren
t (n
A)
[ONOO-] µM
a)
b)

64
2.8 Animal Surgery
Male Spragure- Dawey (SD) rats (Harlan, Indianapolis, IN) 5 350g were used
in our study and were provided with standard chow and water ad libitum. All procedures
were approved by the Institutional Animal Care and Use Committee and complied with
the National Institutes of Health standard. All the animals were anesthetized by Ketamine and Xylazine (100mg/kg
+10mg/kg, intramuscular). The animals were placed on the stereotaxic frame (Nashique,
Japan) when lack of corneal reflex and toe pinch were found. Five holes were drilled in
the skull by a sterile dental drill with a drill stopper to avoid brain piercing: (I) the hole
for NO/ONOO- working electrode, AP - 4.3mm posterior to bregma, ML + 2.0mm lateral
to the midline of the skull, V 2.5mm ventral to the dura surface, according to the
stereotactic atlas of rat brain. (II) The hole for drug delivering IH, AP - 4.3mm, ML
0mm, V 2.5mm. (III) The hole for reference and counter electrode, AP - 10mm, ML +
2.7mm, V 2mm. (IV) the hole for electroencephalography (EEG) measurement electrode,
AP - 4.3mm, ML - 3.0mm, and V 2.5mm. (V) The hole for EEG measurement reference
electrode, AP -10mm, ML 0mm, and V 2.5mm. (Figure 2.10)

65
Figure 2.10 The schematic diagram showing NO, ONOO- and EEG electrodes localization in a brain.
66
2.9 Animal Models and Treatments
Pilocarpine (PILO, Sigma-Aldrich) was used to induce epileptic seizures events in
SD rats. PILO is a muscarinic acetylcholine (Ach) receptor agonist. Dr. Turski et. al. first
found that PILO injections can generate acute epileptic seizures in naïve, healthy (non-
epileptic) animals116. Later, many studies were done on the usage of PILO in rodents.
They revealed that the epileptic seizures induced by PILO developed the similar epileptic
seizure aspects as temporal lobe epilepsy in humans, such as neuronal loss and aberrant
mossy fiber sprouting. Therefore, the PILO model has been widely used to study the
cellular and molecular mechanism of temporal lobe epilepsy, one of the most common
and severe type of seizures that occurs in adults.
Two drug delivery routes for PILO have been used in this study. 300mg/kg PILO
dissolved in 0.9% sterile physiological saline has been administered into the animal
intraperitoneally (IP). The IP injection has been considered as a systemic delivering
method. The drug was delivered into the peritoneum and reached the brain by blood
circulation. Another route is 0.16, 0.82, or 1.6mg/kg PILO dissolved in 2 µL 0.9% sterile
physiological saline injected interhippocampusly (IH) into animals. The IH injection was
a central drug delivery method in which the drug was directly applied into the
hippocampus; the area that has been thought to be one of the initiation places of epileptic
seizures. The results using both delivery methods have been compared in this study.
Several treatments have been utilized to modulate the production of NO and
ONOO- in the epileptic brain.

67
L-arginine (L-Arg, Sigma-Aldrich) is the substrate of NOS. 5.7 µg/kg of L-Arg
was dissolved in 2 µL 0.9% sterile physiological saline and injected into the animal brain
by IH.
L-NG-nitroarginine methyl ester (L-NAME, Santa Cruz) is a non-selective
inhibitor of nitric oxide synthase (NOS). L-NAME (7.3 µg/kg) was dissolved in 2µL 0.9%
sterile physiological saline and injected into the animal brain by IH.
1,3-Benzoxazol-2-yl-3-benzyl-3H-[1,2,3]triazolo[4,5-d]pyrimidin-7-yl sulfide
(VAS2870) is an inhibitor for NADPH oxidase. VAS2870 (35 µg/kg) was dissolved in
2µL DMSO and injected into the animal brain by IH.
Mn(III)tetrakis(4-benzoic acid)porphyrin chloride (MnTBAP) is a cell-permeable
SOD mimetic and ONOO- scavenger. MnTBAP (64 µg/kg) was dissolved in 2µL DMSO
and injected into the animal brain by IH.
Since the brain is in a sealed environment, adding too much liquid would increase
intracranial pressure and cause brain damage. The volume for each injection in this study
was limited to 2 µL. An injection of modulator was performed 10min ahead of the PILO
injection.
3-Morpholinosydnonimine (SIN-1) is a ONOO- donor. Two different dosages of
SIN-1, 1.2 µg/kg and 0.6 µg/kg, dissolved in 2 µL 0.9% sterile physiological saline were
administrated to the animal brain by IH respectively.
Synthetic NO and ONOO- standard solution in physiological solution at different
concentrations were injected simultaneously into the animal brain by IH to increase
exogenous NO and ONOO- concentration in the brain.

68
O2·- standard solution of 3.6 mM was made by adding 5 g potassium superoxide
(KO2) to 5 mL dry DMSO with strong vortex mixing for 1 min under room temperature,
and then centrifuged at 1000 × g for 5 min to remove the excess solid of KO2117. In our
study, different dosages of O2·- standard solution have been injected into the animal brain
by IH.
ONOO- donor and standard solutions of NO, ONOO-, and O2·- were also used in
the absence of a PILO injection to investigate the relation between NO, ONOO- and O2·-
in the initiation of epileptic seizure events.
The summarized information below includes the different treatments. SD rats
(250-350g) were randomly assigned to 13 groups (n=8~10 in each group): Group , vehicle control ( μL, IH 0.9% sterile physiological saline);
Group 2, PILO (300 mg/kg, IP)-treated animals;
Group 3, PILO (1.6 mg/kg, 2 µL, IH)-treated animals;
Group 4, PILO (0.82 mg/kg, 2 µL, IH)-treated animals;
Group 5, PILO (0.16 mg/kg, 2 µL, IH)-treated animals;
Group 6, L-Arg (5.7 µg/kg, 2 µL, IH) + PILO (1.6 mg/kg, 2 µL, IH)-treated
animals;
Group 7, L-NAME (7.3 µg/kg, 2 µL, IH) + PILO (1.6 mg/kg, 2 µL, IH)-treated
animals;
Group 8, MnTBAP (64 µg/kg, 2 µL, IH) + PILO (1.6 mg/kg, 2 µL, IH)-treated
animals;

69
Group 9, VAS2870 (35 µg/kg, 2 µl, IH) + PILO (1.6 mg/kg, 2 µl, IH)-treated
animals;
Group 10, SIN-1 (1.2 µg/kg, 2 µL, IH)-treated animals;
Group 11, SIN-1 (0.6 µg/kg, 2 µL, IH) -treated animals;
Group 12, NO + ONOO- solution-treated animals.
Group 13, O2·- solution-treated animals.
Animals received DMSO (2 µL) in the absence or presence of 1.6 mg/kg PILO.
There was no obvious difference in EEG compared to those animals received saline or
1.6 mg/kg PILO. Those animals were grouped into group 1 (saline) and group 3 (1.6
mg/kg PILO). Therefore, DMSO (2 µL) did not interfere with the experiments. DMSO (2
µL) was used as the solvent for VAS2870 and MnTBAP.
2.10 NO and ONOO- in vivo Measurement
A Gamry 600 multichannel potentiostat was used to monitor in vivo the
simultaneous NO/ ONOO- release. The NO/ ONOO- concentrations were measured
continuously for a total of 90 min. After 10 min, the baseline stabilized, and the animals
from group 9 received saline, PILO, L-Arg, L-NAME, MnTBAP and VAS 2870,
respectively. Ten minutes after the first injection, PILO was administered to the animals
from group 6 9 and the NO/ ONOO- release was monitored for an additional 70 minutes.
Animals from group 10 and 11 received SIN-1 injection after baseline stabilized (~ 10
min), and the NO/ONOO- release was monitored for 80min without PILO injection.
Group 12 animals received the NO and ONOO- standard solution simultaneously every
15 min without PILO injection. Group 13 animals received the O2·- standard solution

70
every 15 min without PILO injection. NO/ONOO- release from Group 12 and 13 was
monitored for 90min. The flowchart for each group has been summarized in Figure 2.11.
2.11 EEG monitoring
The brain electrical activity was monitored by using a time-locked EEG
monitoring system (Pinnacle Technologies) at the same time when NO and ONOO- were
recorded (Figure 2.11). Two sterile, stainless steel bone screws were used (Figure 2.10).
Electrodes were locked in place by using dental acrylic. High-frequency, high voltage
synchronized polyspike or paroxysmal sharp waves with amplitude ≥ 2-fold of
background discharge that lasted for more than 6 sec were considered as seizure
episodes118.

71
Figure 2.11 The flowchart for animal treatment

72
2.12 Protein Sample Preparation
After the NO, ONOO- and EEG measurements, the rats were euthanized by
exsanguinations under anesthesia (Ketamine + Xylazine 100mg/kg + 10mg/kg, IM).
Brain hippocampus samples were quickly dissected on ice and washed with PB solution.
Ice-cold radioimmunoprecipitation (RIPA) buffer (1mL) (Cat# 24948, Santa
Cruz) with a HaltTM protease inhibitor cocktail solution (Cat# 1860932, Thermo) was
added to every hipposcampus sample. Samples were homogenized by ultra-turrax t8
homogenizer (IKA LABORTECHNIK) at maximal speed (3 × 5sec), with resting on ice
in between to prevent protein degradation caused by heat. After homogenizing, the
sample mixture was kept for mild shaking in the cold room for 2 hrs. Samples were later
centrifuged at 40,000 × g under 4 ºC for 20 min. Supernatant was collected and kept in
the - 80 º C freezer.
2.13 Total Protein Concentration Measurement
The total protein concentration from each sample was tested based on the
bicinchoninic acid (BCA) method. A PierceTM BCA protein assay kit (Cat# 23225,
Thermo) was utilized. The procedure has followed the manufacturer’s suggestion.
A set of calibration standard solutions were prepared from bovine serum albumin
(BSA) protein stock standard solutions (2000 µg/mL) diluted in nanopure water to yield
eight different concentrations of BSA standard solutions (2000, 1500, 1000, 750, 500,
250, 125, 25 µg/mL). The protein samples for testing were defrosted on ice. Each
standard solution was added (25 µL) in duplicate to a 96-cell microplate.

73
A protein sample (2 µL) was added in triplicate to the microplate with additional
23 µl of nanopure water (total volume 25 µL). 200 µL Working solution (200 µL) (made
by mixing BCA reagent A and regent B at ratio of 50:1) was added into each vial
(working solution: sample = 8:1). The plate was covered and shook on a plate shaker for
30 sec to mix the solution inside the vials. Then the plate was incubated at 37ºC for 30
min, and cooled down for 5 min. Absorbance at 562 nm was measured by a plate reader
(BioTek, Synergy HT). A calibration curve was plotted as absorbance versus BSA
protein concentration. The total protein concentration was calculated based on this
calibration curve.
2.14 Immunoblotting
Chemicals and Solution: 4×laemmli sample buffer (Cat# 161-0747, Bio-Rad); β-
mercaptoethanol (sigma-aldrich); sodium dodecyl sulfate (SDS, Cat# 161-0416, Bio-
Rad); ammonium persulfate (APS, Cat# 161-0700, Bio-Rad);
tetramethylethylenediamine (TEMED, Cat# BP 150-20, Fisher); 1.5M Tris-HCl (pH 8.8,
resolving gel buffer, Cat# 161-0798, Bio-Rad); 0.5M Tris-HCl (pH 6.8, stacking gel
buffer, Cat# 161-0799, Bio-Rad); 30% acrylamide/bis solution (29:1, Cat# 161-0156,
Bio-Rad); precision plus proteinTM dual color standard (protein ladder, Cat# 161-0374,
Bio-Rad); tris/glycine/SDS solution (TGS, Cat# 161-0772, Bio-Rad); tris/glycine (TG,
Cat# 161-0771, Bio-Rad); 10% Tween-20 (Cat# 161-0781, Bio-Rad); blotting-grade
blocker (non-fat milk, Cat# 170-6404, Bio-Rad); tris-buffered saline (TBS, Cat# 97062-
370, VWR); polyvinyl difluoride (PVDF) membrane (0.45 µm, Cat# 88518, Thermo);
SuperSignal West Pico chemiluminescent substrate (Cat# 34080, Thermo); HyBlot CL®

74
autoradiography film (E3012, Denvillie Scientific); Carestream® Kodak®
autoradiography GBX developer/replenisher (Cat# P4042, Sigma-Aldrich); Carestream®
Kodak® autoradiography GBX fixer/replenisher (Cat# P7167, Sigma-Aldrich).
After testing the total protein concentration, protein samples for electrophoresis
were prepared by mixing with 4 × volumes of laemmli solution plus 10% β-
mercaptoethanol. Denatured samples were boiled at 95 ºC for 5min. A discontinuous
electrophoresis system was utilized. Table 2.2 shows the composition of sodium dodecyl
sulfate polyacrylamide (SDS-PAGE) gel. Protein samples (60 µg ) were loaded in each
well and separated on a 7.5% SDS-PAGE gel for non-denatured samples (without
boiling) and 8% gels for denatured samples in TGS solution (25mM Tris, 192mM
Glycine, 0.1% (w/v) SDS, pH 7.4) for 120 min with a constant voltage at 120V and low
temperature at 4 ºC.
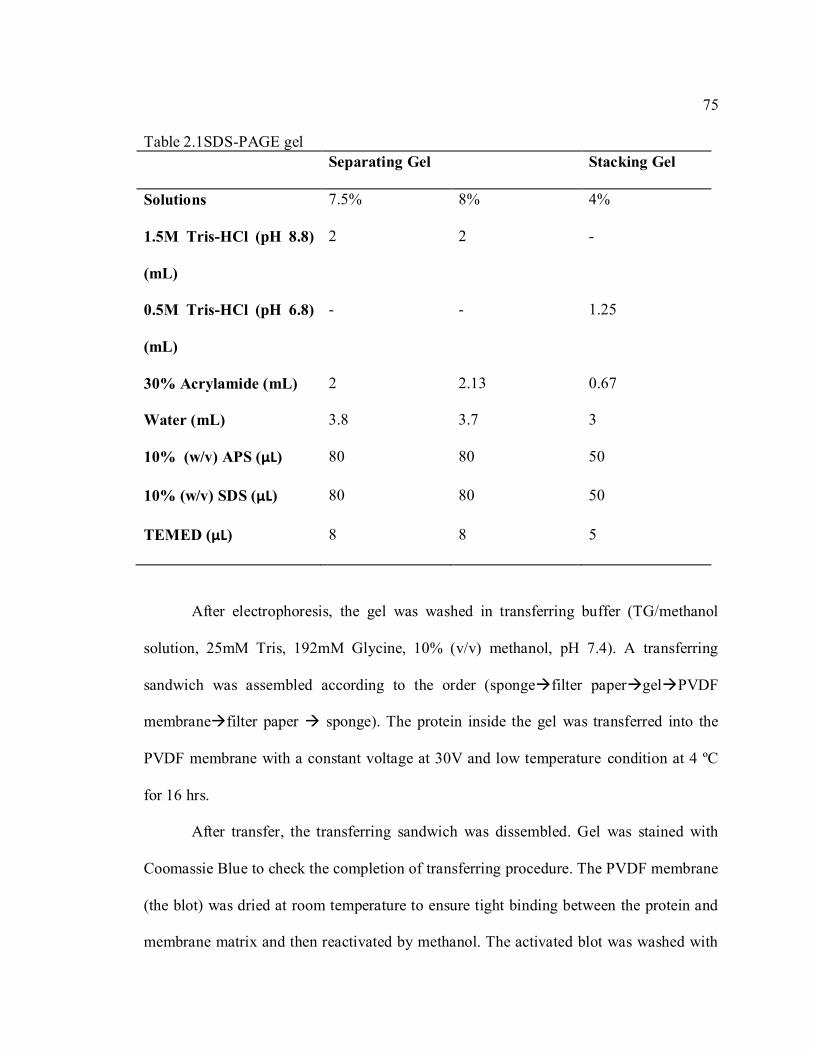
75
Table 2.1SDS-PAGE gel Separating Gel Stacking Gel
Solutions 7.5% 8% 4%
1.5M Tris-HCl (pH 8.8)
(mL)
2 2 -
0.5M Tris-HCl (pH 6.8)
(mL)
- - 1.25
30% Acrylamide (mL) 2 2.13 0.67
Water (mL) 3.8 3.7 3
10% (w/v) APS (µL) 80 80 50
10% (w/v) SDS (µL) 80 80 50
TEMED (µL) 8 8 5
After electrophoresis, the gel was washed in transferring buffer (TG/methanol
solution, 25mM Tris, 192mM Glycine, 10% (v/v) methanol, pH 7.4). A transferring
sandwich was assembled according to the order (spongefilter papergelPVDF
membranefilter paper sponge). The protein inside the gel was transferred into the
PVDF membrane with a constant voltage at 30V and low temperature condition at 4 ºC
for 16 hrs.
After transfer, the transferring sandwich was dissembled. Gel was stained with
Coomassie Blue to check the completion of transferring procedure. The PVDF membrane
(the blot) was dried at room temperature to ensure tight binding between the protein and
membrane matrix and then reactivated by methanol. The activated blot was washed with

76
nanopure water (2 × 5min) and washing solution (TBS solution with 0.1 % tween-20
(TBST), 1 × 5min) on the plate shaker to remove excess methanol from the membrane.
Then the blot was incubated in 5% non-fat milk made with TBST solution at room
temperature for 1 hr to block the non-specific protein binding sites.
After blocking, the blot was rinsed with TBST and then incubated with the
primary antibody (table 2.3) overnight at 4 °C. The next day, blots were washed with
TBST solution (4 × 5min) and incubated with secondary antibody (table) at room
temperature for 1 hr. Later, the blots were washed with TBST solution (4 × 5min) and
TBS solution (2 × 5min).
Last, the blots were incubated with West Pico SuperSignal chemiluminescence
reagent for 5 min in room temperature. The blot was put in the HypercassetteTM cassette,
and the autoradiography film was put on top of the blot. The film was exposed,
developed in the developing solution, and fixed in the fixing solution.
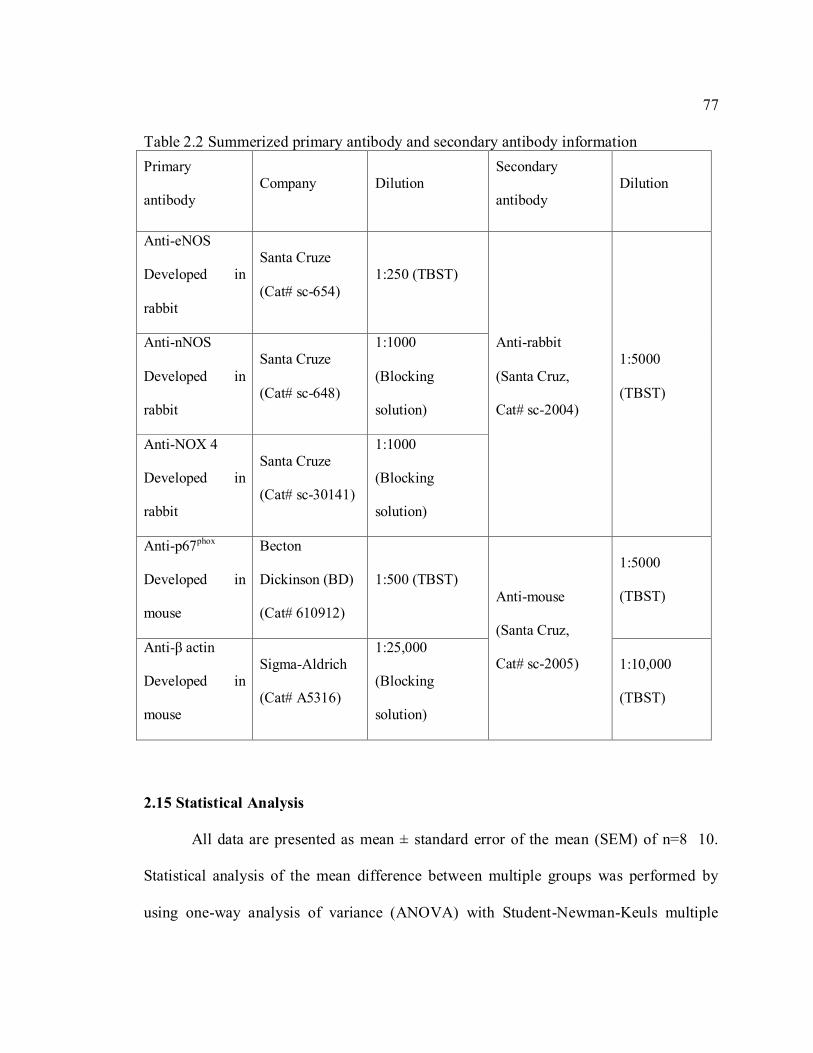
77
Table 2.2 Summerized primary antibody and secondary antibody information Primary
antibody Company Dilution
Secondary
antibody Dilution
Anti-eNOS
Developed in
rabbit
Santa Cruze
(Cat# sc-654) 1:250 (TBST)
Anti-rabbit
(Santa Cruz,
Cat# sc-2004)
1:5000
(TBST)
Anti-nNOS
Developed in
rabbit
Santa Cruze
(Cat# sc-648)
1:1000
(Blocking
solution)
Anti-NOX 4
Developed in
rabbit
Santa Cruze
(Cat# sc-30141)
1:1000
(Blocking
solution)
Anti-p67phox
Developed in
mouse
Becton
Dickinson (BD)
(Cat# 610912)
1:500 (TBST) Anti-mouse
(Santa Cruz,
Cat# sc-2005)
1:5000
(TBST)
Anti-β actin
Developed in
mouse
Sigma-Aldrich
(Cat# A5316)
1:25,000
(Blocking
solution)
1:10,000
(TBST)
2.15 Statistical Analysis
All data are presented as mean ± standard error of the mean (SEM) of n=8 10.
Statistical analysis of the mean difference between multiple groups was performed by
using one-way analysis of variance (ANOVA) with Student-Newman-Keuls multiple

78
comparisons post hoc analysis; and between two groups, using two-tailed Student’s t-test.
The alpha level for all the tests was 0.05. A P value < 0.05 was considered to be
statistically significant. All statistical analyses were performed with Origin (v 6.1 for
Windows; OriginLab, Northampton, MA).

79
3. RESULTS
3.1 NO and ONOO- Release in the Brain after PILO Induced Seizure.
In vivo production of NO and ONOO- has never been measured in the epileptic
brain. Therefore, the data presented here are the first ever reported. Our first question was
whether NO and ONOO- were produced during PILO-induced epileptic seizure events. In
order to monitor the release of NO and ONOO- during PILO-induced seizure, both NO
and ONOO- nanosensors were placed above the ipsilateral side of the hippocampus CA1
region. An EEG recording electrode was implanted above the contralateral side of
hippocampus CA1 region to record the brain activity to identify seizure episodes.
Two delivery routes for PILO—interhippocampal (IH) administration of PILO
and intraperitoneal (IP) injection of PILO— were utilized for different drug delivery. The
release of NO and ONOO- were monitored continuously together with EEG recording.
Figure 3.1 shows a typical current/ concentration vs time amperometric curve that
reflects near real time changes of NO and ONOO- in the brain after saline (2 µL) IH
injection. The simultaneously recorded EEG signal is also shown. About 2 min after the
saline injection, a NO peak was observed and the maximal NO concentration reached 814
± 16 nM. A small ONOO- peak with maximal concentration of 636 ± 117 nM was
recorded about 20 min after the saline injection. Normal brain discharge was showed in
the EEG signals. There was no difference in the amplitude and frequency of the EEG
signals before and after the saline injection.

80
Figure 3.1 Typical amperograms showing real-time NO and ONOO- release during
normal brain activity in the SD rat brain
Figure 3.2 shows a typical amperometric curves that reflect near real time changes
of NO and ONOO- in the brain after a PILO (300mg/kg) IP injection. The simultaneously
recorded EEG signal is also shown. A NO peak was observed about 4min after the PILO
injection, and the maximal NO concentration reached 753 ± 113 nM. The NO production
decayed to 234 ± 30 nM in 10 min. At the same time, ONOO- production increased
significantly; the maximal ONOO- production was recorded at 3392 ± 318 nM. Abnormal
discharges characterized as high-frequency and high-amplitude polyspikes were observed

81
simultaneously. The first seizure event occurred at 552 ± 42 s after the PILO IP injection;
the time when NO production decayed and ONOO- production increased.
Figure 3.2 Typical amperograms showing NO and ONOO- real-time release during
epileptic seizures induced by PILO (300 mg/kg, IP) in the SD rat brain.
Figure 3.3a shows the amperometric curves of NO and ONOO- in the brain after
PILO (1.6mg/kg) IH injection. The simultaneously recorded EEG signal is also shown. A
NO peak was observed about 4 min after the PILO injection into the hippocampus, and
the maximal NO concentration reached 826 ± 88 nM. The first seizure event was
observed at 18 ± 4 min after the PILO injection, when NO decreased to 283 ± 26 nM. NO
production was accompanied by a high production of ONOO- at 2181 ± 161 nM. A

82
ONOO- peak was observed coincident with the seizure onset (Fig 3.3 b). Maximal NO or
ONOO- concentration were measured at the onset of the seizures.
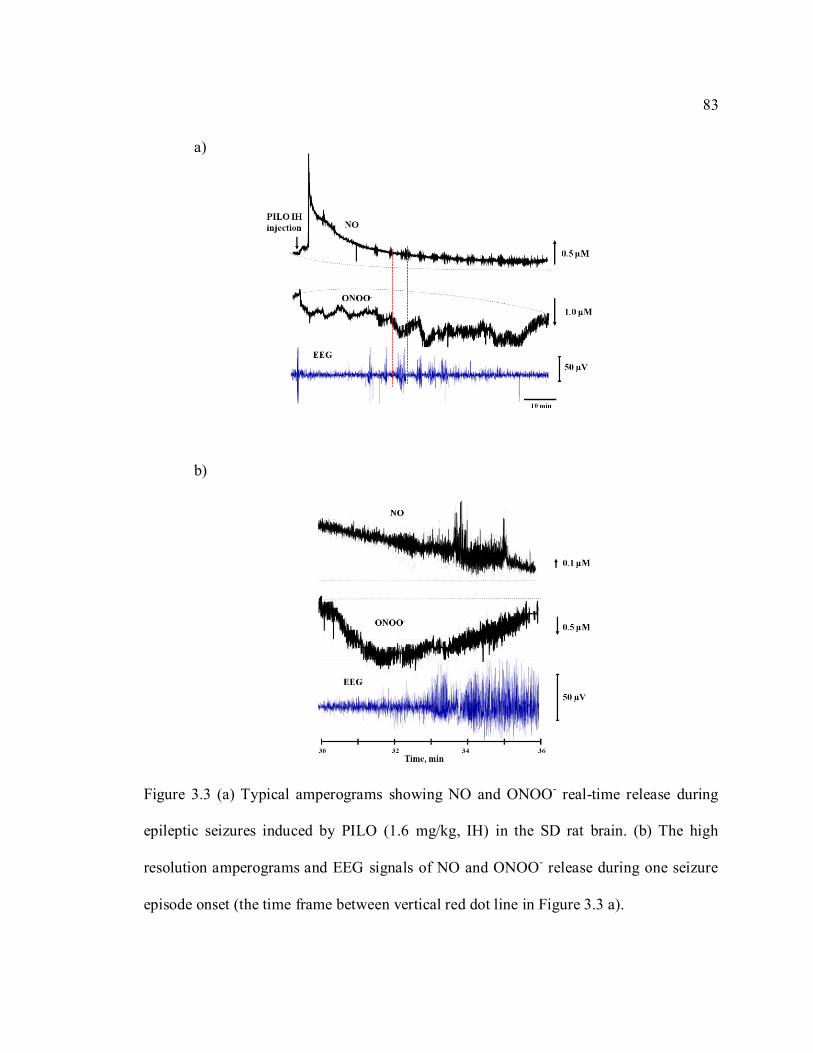
83
Figure 3.3 (a) Typical amperograms showing NO and ONOO- real-time release during
epileptic seizures induced by PILO (1.6 mg/kg, IH) in the SD rat brain. (b) The high
resolution amperograms and EEG signals of NO and ONOO- release during one seizure
episode onset (the time frame between vertical red dot line in Figure 3.3 a).
b)
a)

84
Three dosages of PILO, 0.16 mg/kg; 0.82 mg/kg; and 1.6 mg/kg, were
administered into the animals through IH injection. The forth dosage of PILO, 300 mg/kg,
was injected into the animals through IP. The effect of these two different drug delivery
routes, IH and IP, were compared. No epileptic seizures were observed in the 0.16 mg/kg
PILO IH group. Maximal NO release was recorded at 722 ± 41 nM from this group.
However, all other PILO dosages we used induced epileptic seizures in SD rats. In 0.82
mg/kg PILO IH group, maximal NO release during the seizure was 566 ± 18 nM. In the
1.6 mg/kg PILO IH group, maximal NO release during the seizure was 283 ± 26 nM; and
in the 300mg/kg PILO IP injection group, maximal NO release was 234 ± 30 nM (Fig
3.4a). The NO production significantly reduced with the increase in PILO dosages
compared to the saline group accompanied by a dramatic elevation in ONOO- production
during the seizures (Fig 3.4b). Maximal ONOO- release increased with the increase in
PILO dosages. In 0.16 mg/kg PILO IH group, the ONOO- release was 1075 ± 37 nM. In
the 0.82 mg/kg PILO IH group, the maximal ONOO- release during the seizure events
was recorded as 1307 ± 72 nM. In the 1.6 mg/kg PILO IH group, the amount of ONOO-
release reached 2181 ± 161 nM, and the ONOO- concentration was measured at 3392 ±
318 nM in the PILO IP group. Additionally, the ratio between NO and ONOO- from
different groups was calculated: 1.37 ± 0.26 in the saline group, 0.67 ± 0.05 in the 0.16
mg/kg PILO IH group, 0.45 ± 0.01 in the 0.82 mg/kg PILO IH group, 0.15 ± 0.02 in the
1.6 mg/kg PILO IH group, and 0.07 ± 0.008 in the 300mg/kg PILO IP group (Fig 3.4c).
The ratio of the [NO]/ [ONOO-] decreased with the increase in dosage of PILO.

85
a)
b)

86
Figure 3.4 (a) Maximal NO and (b) ONOO- concentration produced in the brains
of SD rats in the absence or presence of epileptic seizures. Epileptic seizures were
induced by 0.82 mg/kg; or 1.6 mg/kg PILO injected IH, or 300 mg/kg PILO injected IP
(**p < 0.01, ***p< 0.0001 vs saline group). (c) The ratio of NO to ONOO- maximal
concentration measured in the brains of SD rats in the absence of or the presence of
epileptic seizures. Epileptic seizures were induced by 0.82 mg/kg, or 1.6 mg/kg PILO
injected IH, or 300 mg/kg PILO injected IP (*p< 0.05, **p < 0.01, ***p< 0.0001 vs
saline group).
EEG results from PILO IH groups and IP group were also compared. Seizure
episodes were defined as high-frequency, high-voltage synchronized polyspikes or
paroxysmal sharp waves with amplitude 2-fold greater than background discharge which
lasted more than 6 sec118. In the saline and 0.16 mg/kg PILO IH group, no seizure events
c)

87
were observed, while all other PILO dosages administrations successfully induced
epileptic seizures in the animals. To analyze the severity and intensity of the seizure
events, three characteristics were measured: latency from the PILO injection to first
seizure onset; duration for seizure events; and number of seizure events occurring per
hour (frequency of seizure events occurring). The latency in the IP group was reduced
compared to the two PILO IH injection groups but with no significance (p> 0.05, Fig 3.5
a). However, the duration in the IP group was significantly longer compared to the two
IH groups (Fig 3.5 b), which also resulted in a lower number of seizure events occurring
per hour (frequency of seizure events) in PILO IP group compared to the IH groups (Fig
3.5 c). Between the two IH injection groups, a shorter latency; a longer duration; and a
higher frequency of seizure events were observed in the 1.6 mg/kg PILO IH group
compared to the 0.82 mg/kg PILO IH groups (Fig 3.5 a, b and c). Thus, the IP injection
caused more severe seizure events than the IH injection. Within the PILO IH groups,
epileptic seizure events induced by PILO can be enhanced with the increase in the dosage
of PILO.
In order to limit drug usage to prevent the drug interaction that may affect the
results, PILO was used solely to induce epileptic seizures in animals, and no other drugs
were used to reduce mortality. Due to the high mortality (3/5 SD rats) in the PILO IP
injection group, we used a PILO IH injection at the dosage of 1.6m/kg as our study
model, which can also successfully induce seizure in SD rats, but with low mortality (0 /
10 SD rats) compared to the IP injection group.

88
a)
b)

89
Figure 3.5 Seizure events induced by PILO at the dosage of 0.82 mg/kg (solid bar), 1.6
mg/kg (gray bar) PILO through IH injection or PILO at the dosage of 300mg/kg (open
bar) through IP injection. (a) Latency from PILO injection to the first seizure event onset.
(b) Seizure duration (***p<0.0001 vs PILO IP group). (c) Number of seizure events per
hour (frequency of seizure events).
3.2 Modulation of Seizure Events by Regulating the Release of NO and ONOO-
In previous studies, low NO and high ONOO- production were observed
accompanying with the PILO-induced epileptic seizure events. Epileptic seizures
occurred at the time when NO production decreased and ONOO- production increased.
Our next question was whether the regulation of NO and ONOO- release can modulate
the intensity and severity of PILO-induced epileptic seizures. In order to investigate the
effect of the different amount of NO and ONOO- production endogenously in modulating
c)

90
seizure events, NOS substrate, NOS inhibitor, ONOO- scavenger, and NADPH oxidase
inhibitor were utilized to regulate the release of NO and ONOO- during the seizures.
3.2.1 L-Arg Treatment
L-Arg is the substrate for nitric oxide synthase (NOS). In the presence of elevated
L-Arg, endogenous NO production should increase. L-Arg (5.7 μg/kg) dissolved in
physical saline solution (2 µL) was injected IH after 10 min of baseline recording. Later,
PILO (1.6 mg/kg) was injected 10min after the L-Arg injection. Maximal NO release
increased from 283 ± 26 nM in the absence of L-Arg to 615 ± 52 nM in the presence of
L-Arg during the seizure events (Fig 3.6 a). NO production during the epileptic seizures
was significantly enhanced in the presence of L-Arg. This increase in NO was
accompanied with an increase in ONOO- production simultaneously from 2181 ± 161 nM
in the absence of L-Arg to 5005 ± 420 nM in the presence of L-Arg (Fig 3.6 b). The ratio
between the NO and ONOO- concentration was 0.14 ± 0.02 in the presence of L-Arg,
which was very close to the ratio of the [NO]/[ONOO-] (0.15 ± 0.02) in the absence of L-
Arg. Both of the ratios were significantly lower than the ratio that we found in saline
group (Fig 3.6 c).

91
a)
b)

92
Figure 3.6 (a) Maximal NO and (b) ONOO- concentration produced in brains of epileptic
SD rats. Epileptic seizures were induced by IH injection of 1.6 mg/kg PILO in the
absence or presence of L-Arg (***p< 0.0001, vs saline group, ^^^p<0.0001 vs PILO
group). (c) The ratio of maximal NO to ONOO- concentration released in the brains of
epileptic SD rats. Epileptic seizures were induced by IH injection of 1.6 mg/kg PILO in
the absence or presence of L-Arg (***p< 0.0001 vs saline group).
Example EEG signal in the presence of L-Arg is shown in Figure 3.7. The latency
from PILO injection to the first seizure onset was reduced from 1103 ± 246 sec in the
c)

93
absence of L-Arg to 355 ± 164 sec in the presence of L-Arg (Fig 3.8 a). The duration of
the seizure episode was significantly extended from 112 ± 12 sec in the absence of L-Arg
to 186 ± 38 sec in the presence of L-Arg (Fig 3.8b). However, the number of seizure
events occurring per hour was reduced in the presence of L-Arg compared to the number
in the absence of L-Arg, which may be caused by the longer duration for each seizure
episode (Fig 3.8 c). Therefore, elevated L-arg did not suppress the PILO-induced seizure
events, but lowered the threshold of seizure onset.
Figure 3.7 Epileptic seizure events were observed in the brain of a SD rat induced by
PILO (1.6 mg/kg, IH) in the presence of L-Arg (5.7 μg/kg).

94
Figure 3.8 Seizure events induced by PILO (1.6 mg/kg) through IH injection in the
absence (close bar) or presence (open bar) of L-Arg (5.7 μg/kg). (a)Latency from PILO
injection to the first seizure event onset. (b) Seizure duration (*p<0.05 vs PILO group).
(c) Number of seizure events per hour (frequency of seizure events).
a)
b)
c)

95
3.2.2 L-NAME Treatment
L-NAME is a non-selective NOS inhibitor. In the presence of L-NAME, NOS
activity was inhibited, which could cause endogenous NO production to reduce. This may
result in a decrease in ONOO- production. L-NAME (7.3 μg/kg) dissolved in physical
saline solution (2 µL) was injected IH into the animal after 10 min of baseline recording.
PILO (1.6 mg/kg) was injected IH into the animal 10 min after the L-NAME injection.
The maximal NO release during the seizure was significantly reduced from 283 ± 26 nM
in the absence of L-NAME to 65 ± 5 nM in the presence of L-NAME (Fig 3.9 a). A
significant decrease in maximal ONOO- release was also recorded to be 1099 ± 77 nM
during the seizures (Fig 3.9 b). The ratio between the NO and ONOO- concentrations in
the presence of L-NAME treatment was 0.06 ± 0.005, which was significantly lower than
the value that we found in the PILO (1.6 mg/kg, IH) group in the absence of L-NAME
(Fig 3.9 c).
a)

96
Figure 3.9 (a) Maximal NO and (b) maximal ONOO- concentration produced in the
brains of epileptic SD rats. Epileptic seizures were induced by PILO (1.6 mg/kg, IH) in
the absence or presence of L-NAME (*p<0.05, ***p< 0.0001, vs saline group,
^^^p<0.0001 vs PILO group). (c) The ratio of maximal NO to ONOO- concentration
released from the epileptic SD rats induced by PILO (1.6 mg/kg, IH) in the absence or
presence of L-NAME (***p< 0.0001 vs saline group, ^^^p<0.0001 vs PILO group).
b)
c)

97
An example EEG signal in the presence of L-NAME is shown in Figure 3.10. The
latency to seizure onset was significantly reduced from 1103 ± 246 in the absence of L-
NAME to 91 ± 26 sec in the presence of L-NAME (Fig 3.11 a). The seizure duration also
increased from 186 ± 38 in the absence of L-NAME to 211 ± 61 sec in the presence of L-
NAME (Fig 3.11 b). The number of seizure episodes per hour was reduced in the
presence of L-NAME, which may be caused by the longer duration of epileptic seizure
events in the presence of L-NAME (Fig 3.11 c). Thus, the presence of L-NAME assisted
PILO to induce epileptic seizures in the animals.
Figure 3.10 Epileptic seizure events were observed in the brain of SD rat induced by
PILO (1.6 mg/kg, IH) in the presence of L-NAME (7.3 μg/kg).

98
Figure 3.11 Seizure events were induced by PILO (1.6 mg/kg, IH) in the absence (close
bar) or presence (open bar) of L-NAME (7.3 μg/kg). (a) Latency from PILO injection to
the first seizure event onset (*p<0.05 vs PILO group). (b) Seizure duration (*p<0.05 vs
PILO group). (c) Number of seizure events per hour.
a)
b)
c)

99
3.2.3 MnTBAP Treatment
In this study, the production of ONOO- was observed at a high concentration of
2181 ± 161 nM when seizures onset. Thus, a cell-permeable superoxide dismutase (SOD)
mimetic, MnTBAP, was used as an antioxidant and ONOO- scavenger to reduce the
amount of ONOO-. MnTBAP (64 μg/kg) dissolved in DMSO (2 µL) and was injected into
the animal after 10 min of baseline recording. PILO (1.6 mg/kg) was injected into the
animal 10 min after the MnTBAP injection. NO production was recorded as 118 ± 20 nM
in the presence of MnTBAP (Fig 3.12 a), and ONOO- production was 426 ± 45 nM (Fig
3.12 b). Both NO and ONOO- production were reduced significantly in the presence of
MnTBAP compared to those produced from the PILO (1.6 mg/kg, IH) group in the
absence of MnTBAP. The [NO]/ [ONOO-] ratio increased from 0.15 ± 0.02 in the
absence of MnTBAP to 0.26 ± 0.03 in the presence of MnTBAP, which was still
significantly lower than the value we found in the saline group (Fig 3.12 c).
a)

100
Figure 3.12 (a) Maximal NO and (b) maximal ONOO- concentration produced in the
brains of epileptic SD rats. Epileptic seizures were induced by PILO (1.6 mg/kg, IH) in
the absence or presence of MnTBAP (***p< 0.0001 vs saline group, ^^^p<0.0001 vs
PILO group). (c) The ratio of maximal NO to ONOO- concentration released from
epileptic SD rats induced by PILO (1.6 mg/kg, IH) in the absence or presence of
MnTBAP (***p< 0.0001 vs saline group, ^^p< 0.01 vs PILO group).
b)
c)

101
Electrographic seizures were still observed but with reduced intensity (Fig 3.13).
The latency to seizure onset was 628 ± 152 sec (Fig 3.14 a), which was reduced but
without significant difference from the latency in the absence of MnTBAP. However, the
duration of the seizure episodes was recorded as 81 ± 23 sec, which was reduced
compared to the one from the PILO (1.6 mg/kg, IH) group (Fig 3.14 b). The frequency of
the seizure events was significantly reduced as well (Fig 3.14 c). Thus, the severity and
intensity of epileptic seizure events were suppressed in the presence of MnTBAP, but the
onset of seizure cannot be prevented by MnTBAP.
Figure 3.13 Epileptic seizure in the brain of SD rat induced by PILO (1.6 mg/kg, IH) in
the presence of MnTBAP (64 μg/kg).

102
Figure 3.14 Seizure events were induced by PILO (1.6 mg/kg, IH) in the absence (close
bar) or presence (open bar) of MnTBAP. (a) Latency from PILO injection to the first
seizure event onset. (b) Seizure duration. (c) Number of seizure events per hour (*p< 0.05
vs PILO group).
a)
b)
c)

103
3.2.4 VAS2870 Treatment
NADPH oxidase is a family of oxidase which has been found in the cell
membrane, and can exclusively produce O2·-119. Since ONOO- is formed by the diffusion-
controlled reaction between NO and O2·-, a NADPH oxidase inhibitor---VAS2870---was
used to inhibit O2·- formation. Therefore, ONOO- production was expected to be reduced
in the presence of VAS2870. VAS2870 (35 µg/kg) was dissolved in DMSO (2 µL) and
injected IH into the animal after 10 min of baseline recording. PILO (1.6 mg/kg) was
injected IH into the animal 10 min after the VAS2870 injection. The amount of NO
release in the presence of VAS2870 was 679 ± 78 nM (Fig 3.15 a) accompanied by the
production of ONOO- at 719 ± 71 nM (Fig 3.15 b). The NO production in the presence of
VAS2870 was significantly recovered compared to the abnormal NO production in the
absence of VAS2870 during the epileptic seizures. The production of ONOO- in the
presence of VAS2870 was also significantly reduced compared to the ONOO- production
measured during the epileptic seizures in the 1.6 mg/kg PILO group. The [NO]/ [ONOO-]
ratio significantly increased from 0.15 ± 0.02 in the absence of VAS2870 to 1.14 ± 0.25
in the presence of VAS2870 (Fig 3.15 c), which indicated that the ONOO- production
was successfully suppressed by inhibiting the production of O2·-, and the amount of NO
can be restored by preventing ONOO- production.

104
a)
b)

105
Figure 3.15 (a) Maximal NO and (b) maximal ONOO- concentration produced in the
brains of epileptic SD rats. Epileptic seizures were induced by PILO (1.6 mg/kg, IH) in
the absence or presence of VAS2870 (***p< 0.0001 vs saline group, ^^^p<0.0001 vs
PILO group). (c) The ratio of maximal NO to ONOO- concentration released in the
epileptic brain of SD rats. Epileptic seizures were induced by PILO (1.6 mg/kg, IH) in the
absence or presence of VAS2870 (***p< 0.0001 vs saline group, ^^^p< 0.0001 vs PILO
group).
Moreover, no severe seizure episodes were observed in the EEG results (Fig
3.16). Only some oscillations at high frequency (~12 Hz) but with low amplitude (~ -10
c)

106
to 10 μV) were noticed. In the presence of VAS2870, the [NO]/ [ONOO-] ratio was
restored, and the seizure onset was prevented also.
Figure 3.16 Epileptic seizure in the brain of a SD rat induced by 1.6 mg/kg PILO in the
presence of VAS2870 and 1.6 mg/kg PILO.
3.3 cNOS and NADPH Oxidase Protein Expression
In previous sections, we showed that the NO production was significantly
suppressed during the process of PILO-induced epileptic seizures, while the ONOO-
production was significantly enhanced. The severity, intensity, and the onset of epileptic
seizures can be regulated by different agents which modulated NO and ONOO -
production. The activity and expression of proteins involved in the production of NO and
ONOO- were analyzed by western blotting. The optical density of each band was read by
ImageJ (NIH, MD). All the bands were normalized to the optical density of the internal
control, β-actin.

107
3.3.1 eNOS Expression
Two constitutive NOSs can be found to produce NO in the brain. NO produced by
endothelial NOS (eNOS) is involved in the regulation of cerebral blood flow. The
hippocampus samples were dissected quickly from the SD rats after the NO and ONOO-
measurement, and homogenized in RIPA buffer. Prepared protein samples were separated
by SDS-PAGE based on the molecular weight. Two different types of protein samples---
denatured (boiled) and native (non-boiled) ---were used to test the expression and activity
of eNOS respectively in the study.
Denatured protein samples were boiled at 95 °C for 5 min, which were used to
analyze the total expression level of eNOS. The expression level of eNOS in the absence
or presence of different treatments is showed in Figure 3.17. PILO didn’t induce the
change in eNOS expression compared to the control group. L-Arg, L-NAME, and
VAS2870 cannot alter the expression level of eNOS after exposure to PILO. However,
the expression of eNOS was inhibited by MnTBAP, which could explain the low
production of NO in the presence of MnTBAP during PILO-induced epileptic seizures.
Native protein samples without boiling treatment were used to analyze the
expression of functional and dysfunctional forms of eNOS. The functional form of eNOS
in the biological system is the homodimer, which is a SDS-resistant but temperature-
sensitive structure. The dysfunctional form of eNOS is the monomer under the natural
condition. The optical density ratio between the dimer and monomer bands was used to
analyze the functional state of eNOS. Native protein samples were separated in the low
temperature SDS-PAGE. PILO induced an increase in the dysfunctional state of eNOS

108
(dimer/monomer = 1.28) compared to the saline (dimer/monomer = 2.78). The
dysfunctional state of eNOS after PILO exposure can be reduced in the presence of L-
Arg, MnTBAP, or VAS2870. VAS2870 was the most efficient agent in improving the
dysfunctional eNOS to functional one. However, L-NAME induced an increase in
dysfunctional eNOS expression level even compared to PILO, which suggested the
inhibition of NO production through L-NAME was due to the alternation of functional
form of eNOS.
Figure 3.17 eNOS expression in native form (dimer and monomer) and eNOS total
expression level.
3.3.2 nNOS Expression
NO produced by neuronal NOS (nNOS) acts as a neurotransmitter in the
biological system. The nNOS total expression was up-regulated after PILO induced
epileptic seizures compared to that of saline samples (Fig 3.18). The up-regulation

109
expression level was enhanced in the presence of L-Arg, L-NAME, MnTBAP, or
VAS2870 after PILO exposure.
The functional nNOS structure in the biological system is a homodimer, which is
a SDS-resistant but temperature-sensitive structure, the same as eNOS dimer. PILO-
induced epileptic seizures increased the production of the dysfunctional nNOS (nNOS
monomer) compared to the control group. This increase can be reduced in the presence of
L-Arg, L-NAME, MnTBAP, or VAS2870 with different degrees.
Figure 3.18 nNOS expression in native form (dimer and monomer) and nNOS total
expression level.
3.3.3 NADPH Oxidase Expression
NADPH oxidase is a family of proteins which was found to be in the cell
membrane, and exclusively produce O2·- with the downstream reactive oxygen species120.
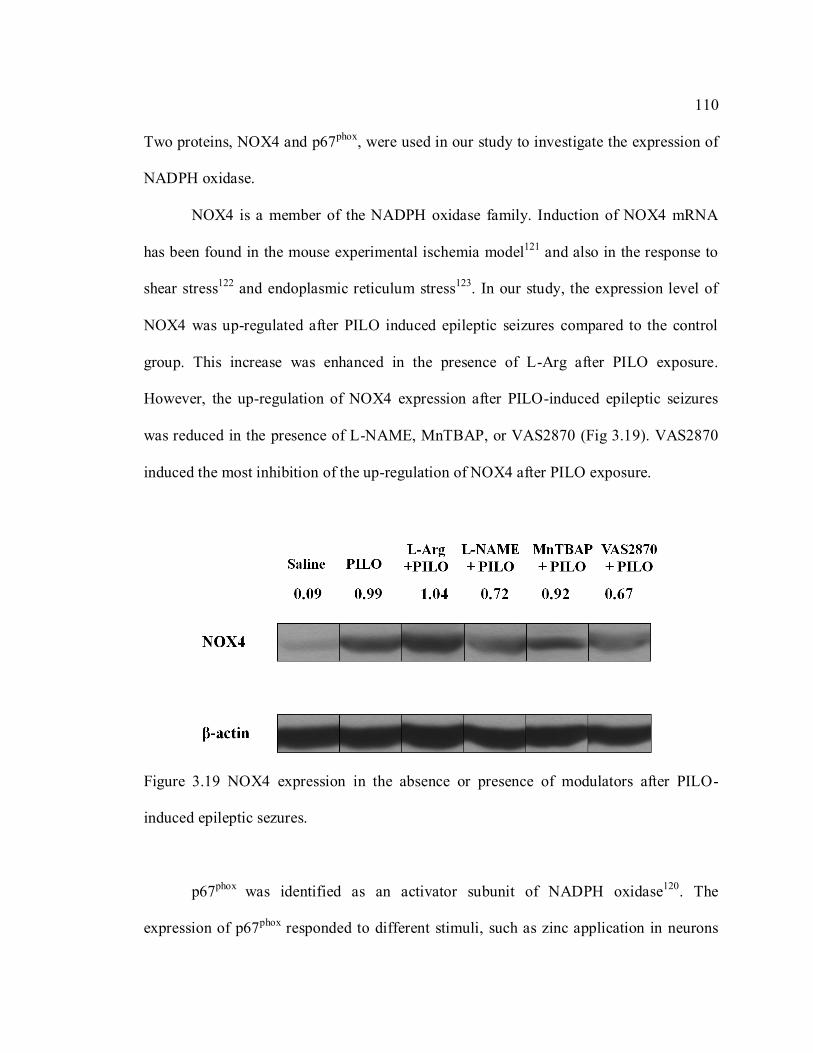
110
Two proteins, NOX4 and p67phox, were used in our study to investigate the expression of
NADPH oxidase.
NOX4 is a member of the NADPH oxidase family. Induction of NOX4 mRNA
has been found in the mouse experimental ischemia model121 and also in the response to
shear stress122 and endoplasmic reticulum stress123. In our study, the expression level of
NOX4 was up-regulated after PILO induced epileptic seizures compared to the control
group. This increase was enhanced in the presence of L-Arg after PILO exposure.
However, the up-regulation of NOX4 expression after PILO-induced epileptic seizures
was reduced in the presence of L-NAME, MnTBAP, or VAS2870 (Fig 3.19). VAS2870
induced the most inhibition of the up-regulation of NOX4 after PILO exposure.
Figure 3.19 NOX4 expression in the absence or presence of modulators after PILO-
induced epileptic sezures.
p67phox was identified as an activator subunit of NADPH oxidase120. The
expression of p67phox responded to different stimuli, such as zinc application in neurons

111
and astrocytes124. In our study, an increase in the expression of p67phox after PILO
induced epileptic seizures compared to the control group. But this up-regulation after
PILO exposure was reduced in the presence of L-Arg, L-NAME, MnTBAP, or VAS2870
(Fig 3.20). In the presence of L-NAME. MnTBAP or VAS2870, the expression level of
p67phox was even lower than the one in the control group.
Figure 3.20 p67phox expression in the absence or presence of modulators after PILO-
induced epileptic sezures.
3.4 Seizure Episodes Triggered by Artifact NO / ONOO- Ratio
In previous sections, the fact that the severity and intensity of PILO-induced
epileptic seizures can be modulated by the regulation of endogenous NO and ONOO-
production through different modulators was described. The negative correlation between
the ratio of NO and ONOO- production and seizure events was noticed. With a lower
[NO]/ [ONOO-] established, more server and intense epileptic seizures were recorded.
However, whether a low [NO]/ [ONOO-] can trigger seizure episodes was still unknown.

112
In order to answer this question, another three sets of experiments were performed:
ONOO- donor, SIN-1; synthetic NO and ONOO- standard solution mixture; and an O2·-
standard solution; were injected in the absence of PILO into animals IH, respectively.
The exogenous and artificial [NO]/ [ONOO-] was built to mimic the condition of the
abnormal endogenous NO and ONOO- production after PILO exposure.
3.4.1 SIN-1 Treatment
SIN-1 can readily produce both NO and O2·- under physiological conditions,
which leads to the production of ONOO-. In our study, two dosages of SIN-1 solution,
0.6 µg/kg and 1.2 µg/kg, were used to increase exogenous ONOO- concentration in the
brain of SD rats. During the measurement, SIN-1 (2 µL ) was injected after the 10 min of
baseline recording in the absence of a PILO injection.
Figure 3.21 shows the example amperometric curves for NO and ONOO-
production after SIN-1 (1.2 µg/kg) injection IH. The brain activity was also continuously
monitored by EEG (Fig 3.21). A seizure-like EEG signal was observed at ~ 100 sec after
the SIN-1 injection. This abnormal EEG signal disappeared at ~ 600 sec after the SIN-1
injection. Both of NO and ONOO- production during the abnormal EEG signal period are
shown in Figure 3.22. NO production was not affected by different dosages of SIN-1; the
release of NO was about the same in the presence of 0.6 µg/kg SIN-1 or 1.2 µg/kg SIN-1.
However, ONOO- production increased with higher dosage of SIN-1. The ratio of the NO
to ONOO- concentration found in the two SIN-1 groups was compared with the ratio we
found in the PILO (1.6 mg/kg) group (Fig 3.23). The [NO]/ [ONOO-] decreased with an

113
increase dosage of SIN-1, but the ratio was still higher than the one found in the PILO
group.
The abnormal seizure-like EEG signals were noticed after the injection of SIN-1
simultaneously. The duration of the seizure events was recorded to analyze the severity of
the seizure events (Fig 3.24). The duration of the seizure events increased with the
increase in dosage of SIN-1, but lower than the duration of seizure events which were
induced by PILO. Thus, SIN-1 can induce similar seizure brain activities like PILO.
More severe seizure events were found in higher dosage of SIN-1.
Figure 3.21 Example amprograms showing NO and ONOO- release measured with
nanosensors, and EEG showing brain activity change after SIN-1 (1.2 µg/kg, IH) injected
into the brain of a SD rat.

114
Figure 3.22 Maximal NO (close bar) and ONOO- (open bar) concentration produced in
the brains of SD rats during the epileptic seizure-like events induced by 0.6 µg/kg and 1.2
µg/kg SIN-1 IH.
Figure 3.23 The ratio of NO to ONOO- concentration released from SD rats during
seizure events induced by 0.6 µg/kg and 1.2 µg/kg SIN-1 (close bar) and induced by 1.6
mg/kg PILO (open bar) .

115
Figure 3.24 The duration of seizure events induced by 0.6 µg/kg and 1.2 µg/kg SIN-1
(close bar) and induced by 1.6 mg/kg PILO (open bar).
3.4.2 Synthetic NO and ONOO- Solution Treatment
Next, synthetic NO and ONOO- standard solutions were used to increase the
exogenous amount of NO and ONOO- in the hippocampus region of SD rats. After
surgery, the synthetic NO and ONOO- standard solution mixture was injected into animal
IH after 15 min of baseline recording. Due to the short half-lives for both compounds,
different compositions of NO and ONOO- mixture solutions were injected repeatly into
the animal every 15 min with a total volume of 2 µl each time. The example
amperometric curves for NO and ONOO- concentration after the injection and brain
activity is shown in Figure 3.25. Vertically-dotted lines in amperometric curves indicate
the time when the injections were done. The high resolution EEG signals were shown in
Figure 3.25c (I, II, III, and IV) during the time of the seizure-like events after the mixture
of NO and ONOO- solutions were injected. The concentration of NO and ONOO- were
measured simultaneously (Fig 3.26). The [NO]/ [ONOO-] ratio at the injection time was

116
calculated (Fig 3.27). At I, NO was measured at 194 nM and ONOO - was 466 nM. The
[NO]/ [ONOO-] ratio was at 0.42. The seizure episode lasted for 18 s after this injection
(Fig 3.28). At II, NO was measured at 76 nM and ONOO- was 1639 nM. The [NO]/
[ONOO-] ratio was at 0.05. The duration of this seizure event increased to 95 s compared
to the injection I (Fig 3.28). At III, NO was recorded as 87 nM, while ONOO- was 1215
nM. The [NO]/ [ONOO-] ratio was at 0.07. The duration of the seizure event after the
injection was 97 s (Fig 3.28). All seizure-like events were observed right after the
injection of the NO and ONOO- mixture solution. The amplitude of the EEG signals
stayed high during the period from III to IV, which indicated the activation of abnormal
brain waves under the low [NO]/ [ONOO-] condition. However, at IV, a high amount of
NO was injected with a low amount of ONOO-, which increased the [NO]/ [ONOO-]
ratio to 0.74. The abnormal high brain activity was suppressed (Fig 3.25c IV).
Therefore, a low [NO]/ [ONOO-] can trigger the onset of abnormal brain activities.
The lower [NO]/ [ONOO-] was applied, the longer duration of the abnormal seizure-like
events were recorded. With a restoration of a high [NO]/ [ONOO-] (>0.7), the abnormal
seizure-like events can be suppressed.

117
5 sec
50 µV
20 sec
50 µV
20 sec
50 µV
20 sec
50 µV
III
II
I
IV
Figure 3.25 Seizure episodes triggered by the artifact change of the [NO] / [ONOO-].
Example of amperograms (a) NO and (b) ONOO- release after the exogenous injection of
NO and ONOO- solution (verticle dot lines represent the time when injection done). (c)
EEG recording shows seizure-like brain discharge (I, II, III) and non-seizure-like brain
discharge (IV) after each injection.
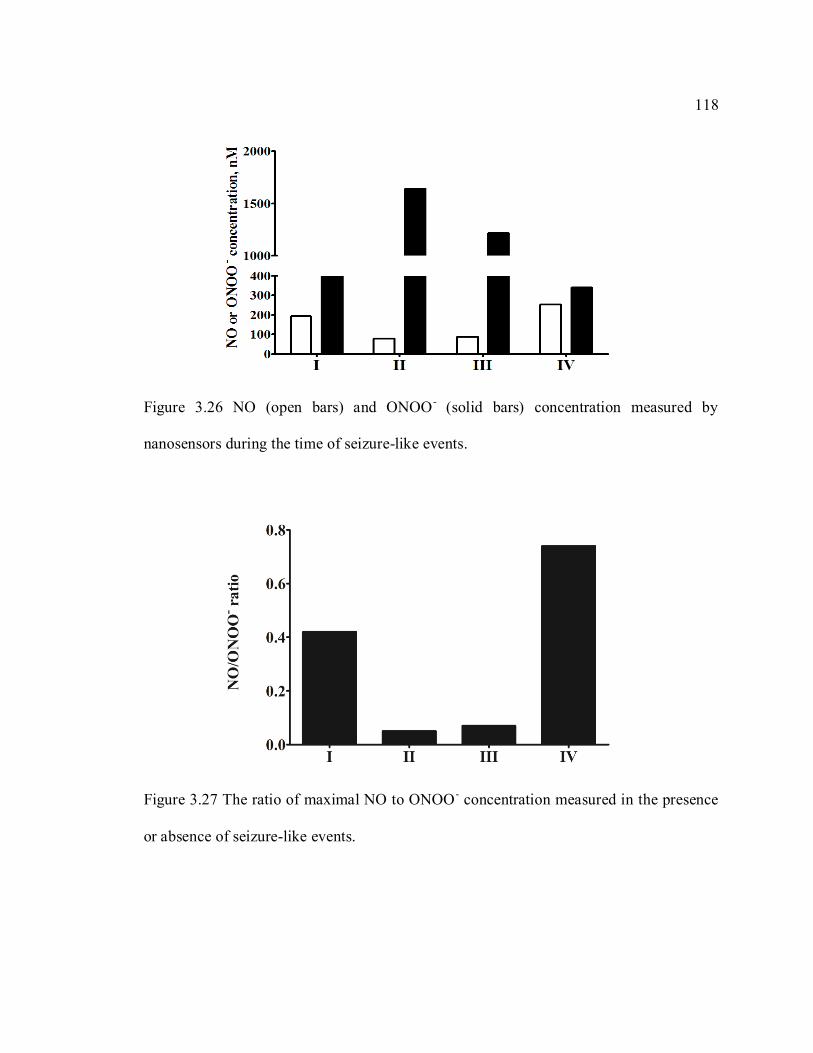
118
Figure 3.26 NO (open bars) and ONOO- (solid bars) concentration measured by
nanosensors during the time of seizure-like events.
Figure 3.27 The ratio of maximal NO to ONOO- concentration measured in the presence
or absence of seizure-like events.

119
Figure 3.28 Duration for seizure-like events after each injection.
3.4.3 O2·- Treatment
Superoxide anion (O2·-) solution was also injected into animals IH in the absence
of PILO to investigate the relationship among NO, ONOO - and O2·-. After surgery, O2
·-
solution was injected into the animal IH after 15 min of baseline recording and the
injection repeatedly performed every 15 min with different O2·- dosage. Example
amperometric curves for NO and ONOO- production and EEG signal after the injection
are shown in Figure 3.29. Vertically dotted lines in the amperometric curves indicate the
time when the injections were performed. Red arrows indicate the time when abnormal
EEG signals were observed. The high resolution of EEG graphs were shown in Figure
3.29c (I and II) during the seizure-like events were observed after the O2·- solution was
injected. The abnormal brain discharges were shown ~ 270 s after a O2·- solution IH
injection at the dosage of 0.52 μg (Fig 3.29c). NO and ONOO- production were measured

120
at when epileptic seizure-like events were observed (Fig 3.30). The ratio of [NO]/
[ONOO-] dropped below 0.30 at when the epileptic seizure-like events were observed
(Fig 3.31). The duration of the seizure events extended with a lower ratio of [NO]/
[ONOO-] was observed (Fig 3.32). Thus, O2·- induced epileptic seizure-like events with
~270 sec delay after injection and low [NO]/ [ONOO -] was recorded when the seizure-
like events were observed.

121
I
50 µV
20 sec
50 µV
50 sec
II
Figure 3.29 Seizure-like episodes triggered by exogenous O2·-. Amperograms of (a) NO
and (b) ONOO- release after exogenous injection of O2·- solution (vertically dotted lines
indicate the time of injection, arrows indicate the time of seizure-like events). (c) EEG
recording shows two seizure-like brain discharges change (I and II) after injections of
O2·-.

122
Figure 3.30 Maximal NO (open bars) and ONOO- (solid bars) concentration measured by
nanosensors at when seizure-like events were observed.
Figure 3.31 The ratio of maximal NO to ONOO- concentration measured at when seizure-
like events were observed.

123
Figure 3.32 Duration for seizure-like events after O2∙- (0.52 µg, IH) injection.

124
4. DISCUSSION
The study presented here shows for the first time the pivotal role of the
concentration of NO and the concentration of ONOO- imbalance in epileptic seizures;
that seizures can be triggered at a concentration ratio of [NO]/ [ONOO-] lower than 0.7;
and seizure events become more intense and frequent with the decrease of [NO]/ [ONOO-
]. This study also explains a controversial role of NO in epilepsy published previously by
others. Both NO and ONOO- are the crucial molecules that maintain epileptic or
antiepileptic redox environment in the brain and link the effect of both nitroxidative and
oxidative stress under pathogenic conditions.
4.1 The Establishment of Nanomedical System to Measure NO and ONOO- Release
in vivo during Epileptic Seizures
The nanomedical system we developed including the electrochemical sensors for
both NO and ONOO- with diameters less than 300 nm was used as an efficient system to
study the real time NO and ONOO- in vivo release during the process of epileptic seizures.
There was no previous data in NO and ONOO- release during the seizures being reported.
Indirect methods, such as NOS expression analysis, production of L-citrulline, and
fluorescent dyes for free radicals staining, were used to estimate the production of NO.
The effect of ONOO- cannot be separated from the effect of NO through the indirect
measurements. Furthermore, the effect of ONOO- may be wrongly attributed to the effect
of NO in epilepsy and the controversial effects of NO in epileptic seizures reported
previously. Our nanomedical system is able to measure NO and ONOO- real time release

125
in vivo during the seizure events and to analyze the contribution of ONOO- and NO
separately.
Moreover, the nanomedical system with EEG measuring system applied together
in the animal study revealed the real time release of NO and ONOO- accompanied with
the abnormal brain activity during seizures. The direct evidence for free radicals release
in the seizure events was provided.
Thus, the same or similar nanomedical system can be applied to other epileptic
studies, or other in vivo neurological disorder studies to measure the real time free
radicals release. More detailed molecular mechanism can be studied with the utilization
of this nanomedical system compared to the indirect methods.
4.2 Abnormal NO and ONOO- Release in PILO Induced Epileptic Seizures.
Our in vivo measurements showed that NO production was abnormally
suppressed but ONOO- production was significantly enhanced during the onset of PILO
induced epileptic seizures. The protein expression results also showed that nNOS, NOX4
and p67phox expression level were upregulated responding to the seizures, which indicated
the activation of NO and O2∙- production system during the seizures. Due to the diffusion-
controlled reaction between NO and O2∙-, the likelihood for ONOO- production under the
condition of elevated NO and O2∙- was high. The ONOO- real-time-measurement results
proved our thought (Fig 3.4 b). The production of ONOO- was elevated as the increase in
PILO dosage, with which more severe and intense epileptic seizures were observed (Fig
3.5). Also, more dysfunctional monomers of eNOS and nNOS were found in the native
eNOS and nNOS structures after PILO induced epileptic seizures, which also indicated
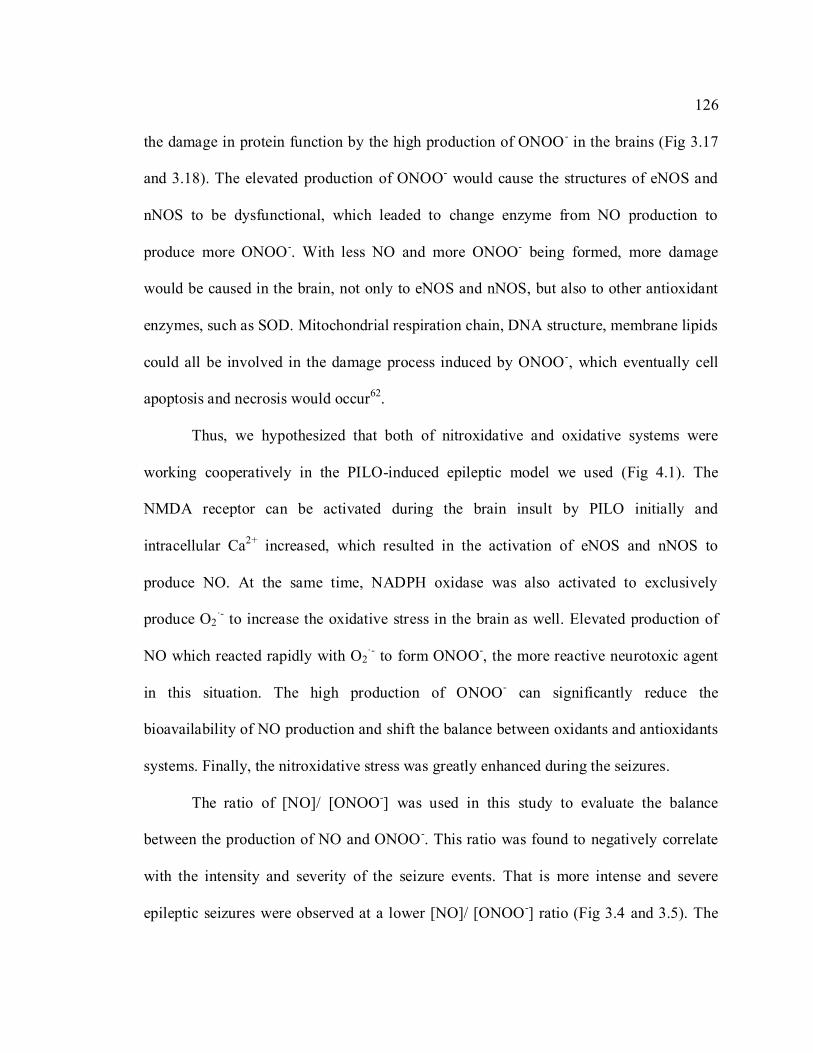
126
the damage in protein function by the high production of ONOO- in the brains (Fig 3.17
and 3.18). The elevated production of ONOO- would cause the structures of eNOS and
nNOS to be dysfunctional, which leaded to change enzyme from NO production to
produce more ONOO-. With less NO and more ONOO- being formed, more damage
would be caused in the brain, not only to eNOS and nNOS, but also to other antioxidant
enzymes, such as SOD. Mitochondrial respiration chain, DNA structure, membrane lipids
could all be involved in the damage process induced by ONOO-, which eventually cell
apoptosis and necrosis would occur62.
Thus, we hypothesized that both of nitroxidative and oxidative systems were
working cooperatively in the PILO-induced epileptic model we used (Fig 4.1). The
NMDA receptor can be activated during the brain insult by PILO initially and
intracellular Ca2+ increased, which resulted in the activation of eNOS and nNOS to
produce NO. At the same time, NADPH oxidase was also activated to exclusively
produce O2·- to increase the oxidative stress in the brain as well. Elevated production of
NO which reacted rapidly with O2·- to form ONOO-, the more reactive neurotoxic agent
in this situation. The high production of ONOO- can significantly reduce the
bioavailability of NO production and shift the balance between oxidants and antioxidants
systems. Finally, the nitroxidative stress was greatly enhanced during the seizures.
The ratio of [NO]/ [ONOO-] was used in this study to evaluate the balance
between the production of NO and ONOO-. This ratio was found to negatively correlate
with the intensity and severity of the seizure events. That is more intense and severe
epileptic seizures were observed at a lower [NO]/ [ONOO-] ratio (Fig 3.4 and 3.5). The

127
lowest ratio of [NO]/ [ONOO-] below 0.3 found in our study indicated the most severe
redox imbalance state which was accompanying with the most severe epileptic seizure
events.
Figure 4.1 Schematic diagram of the role of NO and ONOO- imbalance in PILO induced
epileptic seizures.
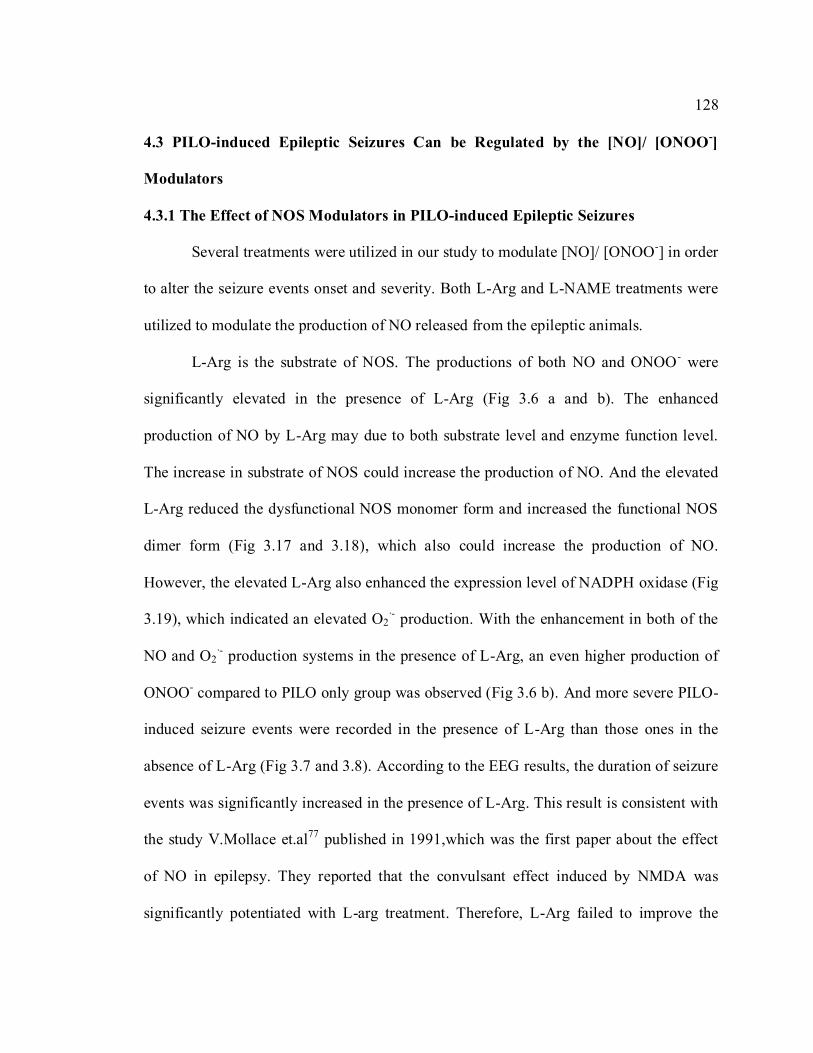
128
4.3 PILO-induced Epileptic Seizures Can be Regulated by the [NO]/ [ONOO-]
Modulators
4.3.1 The Effect of NOS Modulators in PILO-induced Epileptic Seizures
Several treatments were utilized in our study to modulate [NO]/ [ONOO-] in order
to alter the seizure events onset and severity. Both L-Arg and L-NAME treatments were
utilized to modulate the production of NO released from the epileptic animals.
L-Arg is the substrate of NOS. The productions of both NO and ONOO- were
significantly elevated in the presence of L-Arg (Fig 3.6 a and b). The enhanced
production of NO by L-Arg may due to both substrate level and enzyme function level.
The increase in substrate of NOS could increase the production of NO. And the elevated
L-Arg reduced the dysfunctional NOS monomer form and increased the functional NOS
dimer form (Fig 3.17 and 3.18), which also could increase the production of NO.
However, the elevated L-Arg also enhanced the expression level of NADPH oxidase (Fig
3.19), which indicated an elevated O2∙- production. With the enhancement in both of the
NO and O2∙- production systems in the presence of L-Arg, an even higher production of
ONOO- compared to PILO only group was observed (Fig 3.6 b). And more severe PILO-
induced seizure events were recorded in the presence of L-Arg than those ones in the
absence of L-Arg (Fig 3.7 and 3.8). According to the EEG results, the duration of seizure
events was significantly increased in the presence of L-Arg. This result is consistent with
the study V.Mollace et.al77 published in 1991,which was the first paper about the effect
of NO in epilepsy. They reported that the convulsant effect induced by NMDA was
significantly potentiated with L-arg treatment. Therefore, L-Arg failed to improve the

129
severity of the epileptic seizures but enhanced it may due to the higher production of
ONOO- in the presence of L-Arg, which the low [NO]/ [ONOO-] was still existing.
L-NAME is a non-selective inhibitor of NOS. In our study, the production of NO
and ONOO- was significantly reduced in the presence of L-NAME during the PILO-
induced epileptic seizures (Fig 3.9). The inhibition in NO production was more
efficiently than the inhibition in ONOO- production. L-NAME is an arginine-based
inhibitor, which blocks the binding side of L-Arg in the NOS and thus inhibits the
production of NO. With the reduced amount of NO, less ONOO - was formed accordingly.
But the expression level of NADPH oxidase in the presence of L-NAME was still
upregulated compared to saline group. The O2∙- production system was still activated.
Huge amount of O2∙- reacted with NO, which still produced a large amount of ONOO-
and reduced bioavailable NO even more. The activity of eNOS and nNOS was not only
inhibited by L-NAME, but also ONOO- produced in the system. More dysfunctional
monomers of NOS (eNOS and nNOS) and less functional dimmers of them were found in
the brain hippocampus samples after PILO-induced epileptic seizures in the presence of
L-NAME. The ratio of [NO]/ [ONOO-] decreased significantly to 0.06 ± 0.005. More
severe and intense seizure events were observed in this treatment (Fig 3.10). The latency
of the seizure events was significantly reduced in the presence of L-NAME compared to
the one in the absence of L-NAME. The duration of the seizure events also significantly
increased (Fig 3.11). The failure of L-NAME in reducing PILO-induced epileptic
seizures may result from both of the two conditions: cytotoxic ONOO- remained high and
the neuroprotective NO depleted.

130
The presence of L-Arg or L-NAME decreased the frequency of seizure events
occurring because of the longer duration of each seizure event compared to the PILO
group. The modulation of NO level by L-arg or L-NAME cannot prevent the epileptic
seizure events’ onset nor reduce the severity of the seizure. The regulation in NO
production system was not efficient enough to improve the low [NO]/ [ONOO-] and to
reduce the intensity and severity of PILO-induced epileptic seizures.
4.3.2 The Effect of ONOO- Scavenger in PILO-induced Epileptic Seizures
In our study, the elevation of ONOO- production was found to accompany
suppressed NO production during the PILO-induced epileptic seizures. Therefore,
MnTBAP as an antioxidant and a ONOO- scavenger was used to reduce ONOO-
concentration to restore the low [NO]/ [ONOO-]. The release of ONOO- was significantly
lower in the presence of MnTBAP with suppressed NO release and seizure episodes (Fig
3.12). The reduction of ONOO- by MnTBAP was as expected. The dysfunctional
structures of eNOS and nNOS after the PILO exposure were restored to the functional
dimer forms in the presence of MnTBAP. No obvious change in NADPH oxidase
expression was observed in the samples of MnTBAP group compared to those of PILO
group, which indicated the effect of MnTBAP in reducing ONOO- was not via the
inhibition of O2∙- production system but through the scavenging of ONOO- itself. The
ratio of [NO]/ [ONOO-] was significantly improved in the presence of MnTBAP during
the PILO-induced epileptic seizures compared the one found in PILO group. Both
duration and frequency of seizures events were reduced significantly in the presence of
MnTBAP (Fig 3.14). However, the initiation of the seizure episode was not prevented,

131
which is consistent with previous reports that oxidative stress and hippocampus damage
were reduced but behavior seizures were still observed with MnTBAP treatment98. Since
NO reacts with O2·- to form ONOO- under a diffusion-controlled rate (6.7 ± 0.9×10⁹ M-1
s-1 )52, MnTBAP scavenged a huge amount of ONOO- produced from the reaction of NO
and O2·-. But the bioavailability of NO was still not recovered, which could result in the
failure of preventing epileptic seizure initiation. The ratio of [NO]/ [ONOO-] at 0.26 ±
0.03 still indicated a significant dysfunctional imbalance of nitroxidative and oxidative
stress.
Moreover, the treatment of MnTBAP indicated the reduction of ONOO- amount
was able to improve the severity and intensity of the seizure events but not efficient
enough to inhibit the seizures. In order to prevent the onset of epileptic seizures, both of
the inhibition in ONOO- production and the restoration in NO release should be achieved
at the same time.
4.3.3 The Effect of NADPH Oxidase Inhibitor in PILO-induced Epileptic Seizures
In order to achieve the inhibition of ONOO- production and the restoration of NO
bioavailability at the same time, the usage of VAS2870 was applied to inhibit the activity
of NADPH oxidase in our study. It has been reported after NMDA receptor activation,
O2·- was primarily produced by NADPH oxidase119. VAS2870 is an inhibitor for NADPH
oxidase to inhibit the production of O2·- and to reduce the oxidative stress in many
diseases125-126. In our study, ONOO- production was significantly inhibited with a
significantly restored NO release in the presence of VAS 2870 (Fig 3.15). A significantly
improved ratio of [NO]/ [ONOO-] was at 1.14 ± 0.25, at which condition no obvious

132
seizure episodes were observed (Fig 3.16). This proved the hypothesis above: with
elevation of NO production and suppression of ONOO- release occurring simultaneously,
epileptic seizures can be prevented.
Furthermore, the inhibition of the O2·- producing enzyme is more effective than
the usage of antioxidants in reducing the production of O2·-. In the presence of VAS2870,
less O2·- being formed can limit the production of ONOO -. As a consequence, less NO
would react with less O2·-. The NO can be returned to perform physiological functions,
such as S-nitrosylating NMDA receptor NR1 and NR2 subunits44 to inhibit the
excitotoxicity due to the excessive activation of NMDA receptor, which epileptic seizures
can be prevented. Therefore, NADPH oxidase can be a potential therapeutic target for
antiepileptic drug development.

133
Figure 4.2 Schematic diagram showing the mechanism of the prevention of epileptic
seizures by VAS 2870 (NADPH oxidase inhibitor)
4.4 Low [NO]/ [ONOO-] Can Trigger Seizures.
Artifact [NO] / [ONOO-] in the absence of a proepiletic agent mimicked the
process of the seizure onset which indicated the pivotal role of the imbalance between
NO and ONOO- in epilepstic seizure. Three sets of solutions were used: ONOO- donors;
synthetic NO and ONOO- standard solutions; and O2·- standard solutions.
4.4.1 Low [NO]/ [ONOO-] Induced by SIN-1 Triggered Seizure-like Events
Two dosages of SIN-1 solution were administrated into SD rats IH. Seizure-llike
events were observed in ~ 200 sec after the SIN-1 injection due to the kinetics of ONOO-
formation from SIN-1. In the physiological condition, SIN-1 first decomposes into NO

134
and O2·-, which then reacts to form ONOO-. With a higher SIN-1 dosage used, higher
ONOO- production was observed, and a lower [NO]/ [ONOO -] ratio was noticed (Fig
3.23). Seizure events with longer duration induced by SIN-1 at the dosage of 1.2 µg/kg
were recorded. The abnormal brain signals, which were seizure-like events, lasted for
~500 sec. Later, the brain activity returned to normal ~700 sec after the SIN-1 injection
resulted from the depletion of SIN-1. Therefore, seizure-like events triggered by SIN-1
may due to the low [NO]/ [ONOO-] induced by SIN-1. The duration of the events was
correlated with the ratio of [NO]/ [ONOO-].
4.4.2 Exogenous Low [NO]/ [ONOO-] Triggered Seizure-like Events
The synthetic NO and ONOO- standard solutions at different compositions were
injected into animals. Due to the short half-life for these two molecules, repeat injections
were done every 15 min. It was clearly revealed that when a ratio of [NO]/ [ONOO-]
reaches below 0.7, seizure-like events were observed immediately (Fig 3.25 I, II, and III).
The duration for each seizure event correlated with the ratio of [NO]/ [ONOO-]. The
smaller the ratio of [NO]/ [ONOO-] recorded, the longer the duration of seizure event
observed (Fig 3.27 and 3.28). However, when high doses of NO solution were combined
with low doses of ONOO- solution and injected ([NO]/ [ONOO-] = 0.74), normal brain
discharge was restored (Fig 3.25 IV). Therefore, the low ratio of [NO]/ [ONOO-] which
indicated the imbalance between NO and ONOO- did induce epileptic seizure-like events.
When the [NO]/ [ONOO-] got extreme low, the duration of the seizure events was
prolonged. This was the similar situation which was observed in the regulation of PILO-
induced epileptic seizures via different modulators.

135
4.4.3 Endogenous Low [NO]/ [ONOO-] Induced by O2·- Triggered Seizure-like
Events
Superoxide anion (O2·-) standard solutions were also injected into animals IH in
the absence of PILO to investigate the relationship among NO, ONOO- and O2·-. The
abnormal brain discharges were shown ~ 270 s after 0.52 μg of O2·- standard solution IH
injection (Fig 3.30c). When the epileptic seizure-like events were observed, the ratio of
[NO]/ [ONOO-] dropped below 0.30 (Fig 3.31). The same tendency was also observed
with respect to seizure duration: when a smaller NO/ONOO- ratio was recorded, a longer
seizure was observed (Fig 3.32). The similar pattern of [NO]/ [ONOO-] and seizure
events was found in both NO and ONOO- mixture solution treatment and O2·- treatment.
However, the delayed abnormal brain signals induced by O2·- could suggest that O2
·- can
also induce epileptic seizure events but through an indirect route by reacting with NO to
form ONOO-. The role of O2·- in epileptic seizures involved the enhanced production of
ONOO- and reduction of NO release. And overall, the ratio of [NO]/ [ONOO-] reduced
and the frequency and severity of epileptic seizures increased.
4.5 Conclusion
Our study here revealed the cross-linking between oxidative and nitroxidative
stress in the pathogenesis of epileptic seizures. The ratio of [NO]/ [ONOO-] determine the
redox environment in the brain and at the ratio of [NO]/ [ONOO -] below 0.7, epileptic
seizures are triggered. The further decrease of the ratio of [NO]/ [ONOO-] below 0.7, the
more increase in the frequency and severity of epileptic seizures. Therefore, in order to
prevent the onset of epileptic seizures, the reduction in ONOO- production and elevation

136
of NO release would be required. Successful pharmacological treatments should involve
interventions leading to increase [NO]/ [ONOO-] in the brain. The inhibition of O2∙-
production is more efficient than increase of NO production or scavenging ONOO -
concentration in the restoration of [NO]/ [ONOO-] balance. NADPH oxidase inhibitors
may be potential prime therapeutic agents to prevent seizure onset.

5. REFERENCES
1. "About Epilepsy". http://www.epilepsyfoundation.org/aboutepilepsy/index.cfm
(accessed 12/16/2013).
2. "Incidence and Prevalence". http://www.epilepsyfoundation.org/aboutepilepsy/
whatisepilepsy/statistics.cfm (accessed 01/05/2014).
3. Fisher, R. S.; van Emde Boas, W.; Blume, W.; Elger, C.; Genton, P.; Lee, P.;
Engel, J., Jr., Epileptic seizures and epilepsy: definitions proposed by the International
League Against Epilepsy (ILAE) and the International Bureau for Epilepsy (IBE).
Epilepsia 2005, 46 (4), 470-2.
4. Berg, A. T.; Berkovic, S. F.; Brodie, M. J.; Buchhalter, J.; Cross, J. H.; van Emde
Boas, W.; Engel, J.; French, J.; Glauser, T. A.; Mathern, G. W.; Moshe, S. L.; Nordli, D.;
Plouin, P.; Scheffer, I. E., Revised terminology and concepts for organization of seizures
and epilepsies: report of the ILAE Commission on Classification and Terminology, 2005-
2009. Epilepsia 2010, 51 (4), 676-85.
5. Milton, J., Epilepsy as a Dynamic Disease. Springer: 2003.
6. Reynolds, E. H.; Rodin, E., The clinical concept of epilepsy. Epilepsia 2009, 50
Suppl 3, 2-7.
7. Steinlein, O. K., Genetic mechanisms that underlie epilepsy. Nat Rev Neurosci
2004, 5 (5), 400-8.
8. Wasterlain, C. G.; Fujikawa, D. G.; Penix, L.; Sankar, R., Pathophysiological
mechanisms of brain damage from status epilepticus. Epilepsia 1993, 34 Suppl 1, S37-53.
138
9. Kumar, S. S.; Buckmaster, P. S., Hyperexcitability, interneurons, and loss of
GABAergic synapses in entorhinal cortex in a model of temporal lobe epilepsy. J
Neurosci 2006, 26 (17), 4613-23.
10. Delgado-Escueta, A. V.; Wilson, W. A.; Olsen, R. W.; Porter, R. J., New waves
of research in the epilepsies: crossing into the third millennium. Adv Neurol 1999, 79, 3-
58.
11. Delorenzo, R. J.; Sun, D. A.; Deshpande, L. S., Cellular mechanisms underlying
acquired epilepsy: the calcium hypothesis of the induction and maintainance of epilepsy.
Pharmacol Ther 2005, 105 (3), 229-66.
12. Choi, D. W., Glutamate receptors and the induction of excitotoxic neuronal death.
Prog Brain Res 1994, 100, 47-51.
13. Pitkanen, A.; Lukasiuk, K., Mechanisms of epileptogenesis and potential
treatment targets. Lancet Neurol 2011, 10 (2), 173-86.
14. Galanopoulou, A. S.; Buckmaster, P. S.; Staley, K. J.; Moshe, S. L.; Perucca, E.;
Engel, J., Jr.; Loscher, W.; Noebels, J. L.; Pitkanen, A.; Stables, J.; White, H. S.; O'Brien,
T. J.; Simonato, M., Identification of new epilepsy treatments: issues in preclinical
methodology. Epilepsia 2012, 53 (3), 571-82.
15. Loscher, W.; Schmidt, D., Modern antiepileptic drug development has failed to
deliver: ways out of the current dilemma. Epilepsia 2011, 52 (4), 657-78.
16. Nathan, C.; Xie, Q. W., Nitric oxide synthases: roles, tolls, and controls. Cell
1994, 78 (6), 915-8.

139
17. Ignarro, L. J., Nitric oxide : biology and pathobiology. 1st ed.; Academic Press:
San Diego, 2000; p xvii, 1003 p., [10] p. of col. plates.
18. "Nitrogen Dioxide" http://www.epa.gov/air/nitrogenoxides/. (accessed
01/03/2014).
19. Malinski, T.; Taha, Z., Nitric oxide release from a single cell measured in situ by
a porphyrinic-based microsensor. Nature 1992, 358 (6388), 676-8.
20. Pacher, P.; Beckman, J. S.; Liaudet, L., Nitric oxide and peroxynitrite in health
and disease. Physiol Rev 2007, 87 (1), 315-424.
21. Malinski, T., Nitric oxide and nitroxidative stress in Alzheimer's disease. J
Alzheimers Dis 2007, 11 (2), 207-18.
22. Ignarro, L. J., Endothelium-derived nitric oxide: actions and properties. FASEB J
1989, 3 (1), 31-6.
23. Nakamura, T.; Cho, D. H.; Lipton, S. A., Redox regulation of protein misfolding,
mitochondrial dysfunction, synaptic damage, and cell death in neurodegenerative
diseases. Exp Neurol 2012, 238 (1), 12-21.
24. Venema, R. C.; Ju, H.; Zou, R.; Ryan, J. W.; Venema, V. J., Subunit interactions
of endothelial nitric-oxide synthase. Comparisons to the neuronal and inducible nitric-
oxide synthase isoforms. J Biol Chem 1997, 272 (2), 1276-82.
25. Groves, J. T.; Wang, C. C., Nitric oxide synthase: models and mechanisms. Curr
Opin Chem Biol 2000, 4 (6), 687-95.
26. Freire, M. A.; Guimaraes, J. S.; Leal, W. G.; Pereira, A., Pain modulation by
nitric oxide in the spinal cord. Front Neurosci 2009, 3 (2), 175-81.

140
27. Bredt, D. S.; Hwang, P. M.; Glatt, C. E.; Lowenstein, C.; Reed, R. R.; Snyder, S.
H., Cloned and expressed nitric oxide synthase structurally resembles cytochrome P-450
reductase. Nature 1991, 351 (6329), 714-8.
28. Nathan, C.; Xie, Q. W., Regulation of biosynthesis of nitric oxide. J Biol Chem
1994, 269 (19), 13725-8.
29. Bredt, D. S.; Ferris, C. D.; Snyder, S. H., Nitric oxide synthase regulatory sites.
Phosphorylation by cyclic AMP-dependent protein kinase, protein kinase C, and
calcium/calmodulin protein kinase; identification of flavin and calmodulin binding sites.
J Biol Chem 1992, 267 (16), 10976-81.
30. Raman, C. S.; Li, H.; Martasek, P.; Kral, V.; Masters, B. S.; Poulos, T. L., Crystal
structure of constitutive endothelial nitric oxide synthase: a paradigm for pterin function
involving a novel metal center. Cell 1998, 95 (7), 939-50.
31. Ignarro, L. J.; Harbison, R. G.; Wood, K. S.; Kadowitz, P. J., Activation of
purified soluble guanylate cyclase by endothelium-derived relaxing factor from
intrapulmonary artery and vein: stimulation by acetylcholine, bradykinin and arachidonic
acid. J Pharmacol Exp Ther 1986, 237 (3), 893-900.
32. Furchgott, R. F.; Zawadzki, J. V., The obligatory role of endothelial cells in the
relaxation of arterial smooth muscle by acetylcholine. Nature 1980, 288 (5789), 373-6.
33. Furchgott, R. F.; Carvalho, M. H.; Khan, M. T.; Matsunaga, K., Evidence for
endothelium-dependent vasodilation of resistance vessels by acetylcholine. Blood Vessels
1987, 24 (3), 145-9.

141
34. Ignarro, L. J.; Adams, J. B.; Horwitz, P. M.; Wood, K. S., Activation of soluble
guanylate cyclase by NO-hemoproteins involves NO-heme exchange. Comparison of
heme-containing and heme-deficient enzyme forms. J Biol Chem 1986, 261 (11), 4997-
5002.
35. Palmer, R. M.; Ferrige, A. G.; Moncada, S., Nitric oxide release accounts for the
biological activity of endothelium-derived relaxing factor. Nature 1987, 327 (6122), 524-
6.
36. Garthwaite, J., Glutamate, nitric oxide and cell-cell signalling in the nervous
system. Trends Neurosci 1991, 14 (2), 60-7.
37. Bredt, D. S.; Hwang, P. M.; Snyder, S. H., Localization of nitric oxide synthase
indicating a neural role for nitric oxide. Nature 1990, 347 (6295), 768-70.
38. Boehning, D.; Snyder, S. H., Novel neural modulators. Annu Rev Neurosci 2003,
26, 105-31.
39. Chiueh, C. C., Neurobiology of NO. and .OH: basic research and clinical
relevance. Ann N Y Acad Sci 1994, 738, 279-81.
40. Chung, K. K.; Thomas, B.; Li, X.; Pletnikova, O.; Troncoso, J. C.; Marsh, L.;
Dawson, V. L.; Dawson, T. M., S-nitrosylation of parkin regulates ubiquitination and
compromises parkin's protective function. Science 2004, 304 (5675), 1328-31.
41. Gu, Z.; Kaul, M.; Yan, B.; Kridel, S. J.; Cui, J.; Strongin, A.; Smith, J. W.;
Liddington, R. C.; Lipton, S. A., S-nitrosylation of matrix metalloproteinases: signaling
pathway to neuronal cell death. Science 2002, 297 (5584), 1186-90.

142
42. Lipton, S. A.; Choi, Y. B.; Pan, Z. H.; Lei, S. Z.; Chen, H. S.; Sucher, N. J.;
Loscalzo, J.; Singel, D. J.; Stamler, J. S., A redox-based mechanism for the
neuroprotective and neurodestructive effects of nitric oxide and related nitroso-
compounds. Nature 1993, 364 (6438), 626-32.
43. Stamler, J. S.; Toone, E. J.; Lipton, S. A.; Sucher, N. J., (S)NO signals:
translocation, regulation, and a consensus motif. Neuron 1997, 18 (5), 691-6.
44. Jaffrey, S. R.; Erdjument-Bromage, H.; Ferris, C. D.; Tempst, P.; Snyder, S. H.,
Protein S-nitrosylation: a physiological signal for neuronal nitric oxide. Nat Cell Biol
2001, 3 (2), 193-7.
45. Choi, Y. B.; Tenneti, L.; Le, D. A.; Ortiz, J.; Bai, G.; Chen, H. S.; Lipton, S. A.,
Molecular basis of NMDA receptor-coupled ion channel modulation by S-nitrosylation.
Nat Neurosci 2000, 3 (1), 15-21.
46. Mannick, J. B.; Schonhoff, C.; Papeta, N.; Ghafourifar, P.; Szibor, M.; Fang, K.;
Gaston, B., S-Nitrosylation of mitochondrial caspases. J Cell Biol 2001, 154 (6), 1111-6.
47. Rauhala, P.; Lin, A. M.; Chiueh, C. C., Neuroprotection by S-nitrosoglutathione
of brain dopamine neurons from oxidative stress. FASEB J 1998, 12 (2), 165-73.
48. Chiueh, C. C., Neuroprotective properties of nitric oxide. Ann N Y Acad Sci 1999,
890, 301-11.
49. Gryglewski, R. J.; Palmer, R. M.; Moncada, S., Superoxide anion is involved in
the breakdown of endothelium-derived vascular relaxing factor. Nature 1986, 320 (6061),
454-6.
50. Beckman, J. S., Ischaemic injury mediator. Nature 1990, 345 (6270), 27-8.

143
51. Beckman, J. S.; Beckman, T. W.; Chen, J.; Marshall, P. A.; Freeman, B. A.,
Apparent hydroxyl radical production by peroxynitrite: implications for endothelial
injury from nitric oxide and superoxide. Proc Natl Acad Sci U S A 1990, 87 (4), 1620-4.
52. Beckman, J. S.; Koppenol, W. H., Nitric oxide, superoxide, and peroxynitrite: the
good, the bad, and ugly. Am J Physiol 1996, 271 (5 Pt 1), C1424-37.
53. Schramm, A.; Matusik, P.; Osmenda, G.; Guzik, T. J., Targeting NADPH
oxidases in vascular pharmacology. Vascul Pharmacol 2012, 56 (5-6), 216-31.
54. Mythri, R. B.; Venkateshappa, C.; Harish, G.; Mahadevan, A.; Muthane, U. B.;
Yasha, T. C.; Srinivas Bharath, M. M.; Shankar, S. K., Evaluation of markers of
oxidative stress, antioxidant function and astrocytic proliferation in the striatum and
frontal cortex of Parkinson's disease brains. Neurochem Res 2011, 36 (8), 1452-63.
55. Ansari, M. A.; Scheff, S. W., Oxidative stress in the progression of Alzheimer
disease in the frontal cortex. J Neuropathol Exp Neurol 2010, 69 (2), 155-67.
56. Barber, S. C.; Shaw, P. J., Oxidative stress in ALS: key role in motor neuron
injury and therapeutic target. Free Radic Biol Med 2010, 48 (5), 629-41.
57. Schnabel, R.; Blankenberg, S., Oxidative stress in cardiovascular disease:
successful translation from bench to bedside? Circulation 2007, 116 (12), 1338-40.
58. Fridovich, I., Superoxide radical and superoxide dismutases. Annu Rev Biochem
1995, 64, 97-112.
59. Xu, J.; Zou, M. H., Molecular insights and therapeutic targets for diabetic
endothelial dysfunction. Circulation 2009, 120 (13), 1266-86.
144
60. Bonfoco, E.; Krainc, D.; Ankarcrona, M.; Nicotera, P.; Lipton, S. A., Apoptosis
and necrosis: two distinct events induced, respectively, by mild and intense insults with
N-methyl-D-aspartate or nitric oxide/superoxide in cortical cell cultures. Proc Natl Acad
Sci U S A 1995, 92 (16), 7162-6.
61. Bouchier-Hayes, L.; Lartigue, L.; Newmeyer, D. D., Mitochondria:
pharmacological manipulation of cell death. J Clin Invest 2005, 115 (10), 2640-7.
62. Szabo, C.; Ischiropoulos, H.; Radi, R., Peroxynitrite: biochemistry,
pathophysiology and development of therapeutics. Nat Rev Drug Discov 2007, 6 (8),
662-80.
63. Alvarez, B.; Demicheli, V.; Duran, R.; Trujillo, M.; Cervenansky, C.; Freeman,
B. A.; Radi, R., Inactivation of human Cu,Zn superoxide dismutase by peroxynitrite and
formation of histidinyl radical. Free Radic Biol Med 2004, 37 (6), 813-22.
64. Forstermann, U.; Munzel, T., Endothelial nitric oxide synthase in vascular
disease: from marvel to menace. Circulation 2006, 113 (13), 1708-14.
65. Radi, R.; Cassina, A.; Hodara, R.; Quijano, C.; Castro, L., Peroxynitrite reactions
and formation in mitochondria. Free Radic Biol Med 2002, 33 (11), 1451-64.
66. Niles, J. C.; Wishnok, J. S.; Tannenbaum, S. R., Peroxynitrite-induced oxidation
and nitration products of guanine and 8-oxoguanine: structures and mechanisms of
product formation. Nitric Oxide 2006, 14 (2), 109-21.
67. Drummond, G. R.; Selemidis, S.; Griendling, K. K.; Sobey, C. G., Combating
oxidative stress in vascular disease: NADPH oxidases as therapeutic targets. Nat Rev
Drug Discov 2011, 10 (6), 453-71.

145
68. Finkel, T.; Holbrook, N. J., Oxidants, oxidative stress and the biology of ageing.
Nature 2000, 408 (6809), 239-47.
69. Meldrum, B.; Garthwaite, J., Excitatory Amino-Acid Neurotoxicity and
Neurodegenerative Disease. Trends in Pharmacological Sciences 1990, 11 (9), 379-387.
70. Olney, J. W., Brain lesions, obesity, and other disturbances in mice treated with
monosodium glutamate. Science 1969, 164 (3880), 719-21.
71. Kabuto, H.; Yokoi, I.; Habu, H.; Willmore, L. J.; Mori, A.; Ogawa, N., Reduction
in nitric oxide synthase activity with development of an epileptogenic focus induced by
ferric chloride in the rat brain. Epilepsy Res 1996, 25 (2), 65-8.
72. Hicks, T. P.; Conti, F., Amino acids as the source of considerable excitation in
cerebral cortex. Can J Physiol Pharmacol 1996, 74 (4), 341-61.
73. Aamodt, S. M.; Constantine-Paton, M., The role of neural activity in synaptic
development and its implications for adult brain function. Adv Neurol 1999, 79, 133-44.
74. Maggio, R.; Fumagalli, F.; Donati, E.; Barbier, P.; Racagni, G.; Corsini, G. U.;
Riva, M., Inhibition of nitric oxide synthase dramatically potentiates seizures induced by
kainic acid and pilocarpine in rats. Brain Res 1995, 679 (1), 184-7.
75. Lapouble, E.; Montecot, C.; Sevestre, A.; Pichon, J., Phosphinothricin induces
epileptic activity via nitric oxide production through NMDA receptor activation in adult
mice. Brain Res 2002, 957 (1), 46-52.
76. Noyan, B.; Jensen, M. S.; Danscher, G., The lack of effects of zinc and nitric
oxide in initial state of pilocarpine-induced seizures. Seizure 2007, 16 (5), 410-6.

146
77. Mollace, V.; Bagetta, G.; Nistico, G., Evidence That L-Arginine Possesses
Proconvulsant Effects Mediated through Nitric-Oxide. Neuroreport 1991, 2 (5), 269-272.
78. Hamani, C.; Tenorio, F.; Mendez-Otero, R.; Mello, L. E., Loss of NADPH
diaphorase-positive neurons in the hippocampal formation of chronic pilocarpine-
epileptic rats. Hippocampus 1999, 9 (3), 303-13.
79. Nagatomo, I.; Akasaki, Y.; Uchida, M.; Tominaga, M.; Kuchiiwa, S.; Nakagawa,
S.; Takigawa, M., Kainic and domoic acids differentially affect NADPH-diaphorase
neurons in the mouse hippocampal formation. Brain Res Bull 1999, 48 (3), 277-82.
80. Fedele, E.; Raiteri, M., In vivo studies of the cerebral glutamate
receptor/NO/cGMP pathway. Prog Neurobiol 1999, 58 (1), 89-120.
81. Uchida, M.; Nagatomo, I.; Akasaki, Y.; Tominaga, M.; Hashiguchi, W.;
Kuchiiwa, S.; Nakagawa, S.; Takigawa, M., Nitric oxide production is decreased in the
brain of the seizure susceptible EL mouse. Brain Res Bull 1999, 50 (4), 223-7.
82. Tsuda, M.; Shimizu, N.; Yajima, Y.; Suzuki, T.; Misawa, M., Role of nitric oxide
in the hypersusceptibility to pentylenetetrazole-induced seizure in diazepam-withdrawn
mice. Eur J Pharmacol 1998, 344 (1), 27-30.
83. Przegalinski, E.; Baran, L.; Siwanowicz, J., The role of nitric oxide in the kainate-
induced seizures in mice. Neurosci Lett 1994, 170 (1), 74-6.
84. Kaputlu, I.; Uzbay, T., L-NAME inhibits pentylenetetrazole and strychnine-
induced seizures in mice. Brain Res 1997, 753 (1), 98-101.

147
85. Osonoe, K.; Mori, N.; Suzuki, K.; Osonoe, M., Antiepileptic effects of inhibitors
of nitric oxide synthase examined in pentylenetetrazol-induced seizures in rats. Brain Res
1994, 663 (2), 338-40.
86. Tsuda, M.; Suzuki, T.; Misawa, M., Aggravation of DMCM-induced seizure by
nitric oxide synthase inhibitors in mice. Life Sci 1997, 60 (23), PL339-43.
87. Kirkby, R. D.; Carroll, D. M.; Grossman, A. B.; Subramaniam, S., Factors
determining proconvulsant and anticonvulsant effects of inhibitors of nitric oxide
synthase in rodents. Epilepsy Res 1996, 24 (2), 91-100.
88. Kashihara, K.; Sakai, K.; Marui, K.; Shohmori, T., Kainic acid may enhance
hippocampal NO generation of awake rats in a seizure stage-related fashion. Neurosci
Res 1998, 32 (3), 189-94.
89. Takei, Y.; Takashima, S.; Ohyu, J.; Takami, T.; Miyajima, T.; Hoshika, A.,
Effects of nitric oxide synthase inhibition on the cerebral circulation and brain damage
during kainic acid-induced seizures in newborn rabbits. Brain Dev 1999, 21 (4), 253-9.
90. Przegalinski, E.; Baran, L.; Siwanowicz, J., The role of nitric oxide in chemically-
and electrically-induced seizures in mice. Neurosci Lett 1996, 217 (2-3), 145-8.
91. Borowicz, K. K.; Starownik, R.; Kleinrok, Z.; Czuczwar, S. J., The influence of
L-NG-nitroarginine methyl ester, an inhibitor of nitric oxide synthase, upon the
anticonvulsive activity of conventional antiepileptic drugs against maximal electroshock
in mice. J Neural Transm 1998, 105 (1), 1-12.

148
92. Urbanska, E. M.; Drelewska, E.; Borowicz, K. K.; Blaszczak, P.; Kleinrok, Z.;
Czuczwar, S. J., NG-nitro-L-arginine, a nitric oxide synthase inhibitor, and seizure
susceptibility in four seizure models in mice. J Neural Transm 1996, 103 (10), 1145-52.
93. Del-Bel, E. A.; Oliveira, P. R.; Oliveira, J. A.; Mishra, P. K.; Jobe, P. C.; Garcia-
Cairasco, N., Anticonvulsant and proconvulsant roles of nitric oxide in experimental
epilepsy models. Braz J Med Biol Res 1997, 30 (8), 971-9.
94. Rigaud-Monnet, A. S.; Heron, A.; Seylaz, J.; Pinard, E., Effect of inhibiting NO
synthesis on hippocampal extracellular glutamate concentration in seizures induced by
kainic acid. Brain Res 1995, 673 (2), 297-303.
95. Van Leeuwen, R.; De Vries, R.; Dzoljic, M. R., 7-Nitro indazole, an inhibitor of
neuronal nitric oxide synthase, attenuates pilocarpine-induced seizures. Eur J Pharmacol
1995, 287 (2), 211-3.
96. Alexander, C. B.; Ellmore, T. M.; Kokate, T. G.; Kirkby, R. D., Further studies on
anti- and proconvulsant effects of inhibitors of nitric oxide synthase in rodents. Eur J
Pharmacol 1998, 344 (1), 15-25.
97. Proctor, M. R.; Fornai, F.; Afshar, J. K.; Gale, K., The role of nitric oxide in
focally-evoked limbic seizures. Neuroscience 1997, 76 (4), 1231-6.
98. Liang, L. P.; Ho, Y. S.; Patel, M., Mitochondrial superoxide production in
kainate-induced hippocampal damage. Neuroscience 2000, 101 (3), 563-70.
99. Sashindranath, M.; McLean, K. J.; Trounce, I. A.; Cotton, R. G.; Cook, M. J.,
Early hippocampal oxidative stress is a direct consequence of seizures in the rapid
electrical amygdala kindling model. Epilepsy Res 2010, 90 (3), 285-94.
149
100. Patel, M., Mitochondrial dysfunction and oxidative stress: cause and consequence
of epileptic seizures. Free Radic Biol Med 2004, 37 (12), 1951-62.
101. Kudin, A. P.; Kudina, T. A.; Seyfried, J.; Vielhaber, S.; Beck, H.; Elger, C. E.;
Kunz, W. S., Seizure-dependent modulation of mitochondrial oxidative phosphorylation
in rat hippocampus. Eur J Neurosci 2002, 15 (7), 1105-14.
102. Patel, M.; Liang, L. P.; Hou, H.; Williams, B. B.; Kmiec, M.; Swartz, H. M.;
Fessel, J. P.; Roberts, L. J., 2nd, Seizure-induced formation of isofurans: novel products
of lipid peroxidation whose formation is positively modulated by oxygen tension. J
Neurochem 2008, 104 (1), 264-70.
103. Rowley, S.; Patel, M., Mitochondrial involvement and oxidative stress in
temporal lobe epilepsy. Free Radic Biol Med 2013, 62, 121-31.
104. Seegers, U.; Potschka, H.; Loscher, W., Transient increase of P-glycoprotein
expression in endothelium and parenchyma of limbic brain regions in the kainate model
of temporal lobe epilepsy. Epilepsy Res 2002, 51 (3), 257-68.
105. Nagatomo, I.; Akasaki, Y.; Uchida, M.; Kuchiiwa, S.; Nakagawa, S.; Takigawa,
M., Influence of dietary zinc on convulsive seizures and hippocampal NADPH
diaphorase-positive neurons in seizure susceptible EL mouse. Brain Res 1998, 789 (2),
213-20.
106. Chuang, Y. C.; Chen, S. D.; Lin, T. K.; Liou, C. W.; Chang, W. N.; Chan, S. H.;
Chang, A. Y., Upregulation of nitric oxide synthase II contributes to apoptotic cell death
in the hippocampal CA3 subfield via a cytochrome c/caspase-3 signaling cascade

150
following induction of experimental temporal lobe status epilepticus in the rat.
Neuropharmacology 2007, 52 (5), 1263-73.
107. Cendes, F., Febrile seizures and mesial temporal sclerosis. Curr Opin Neurol
2004, 17 (2), 161-4.
108. Engel, J., Jr.; Pitkanen, A.; Loeb, J. A.; Dudek, F. E.; Bertram, E. H., 3rd; Cole,
A. J.; Moshe, S. L.; Wiebe, S.; Jensen, F. E.; Mody, I.; Nehlig, A.; Vezzani, A., Epilepsy
biomarkers. Epilepsia 2013, 54 Suppl 4, 61-9.
109. Brovkovych, V.; Patton, S.; Brovkovych, S.; Kiechle, F.; Huk, I.; Malinski, T., In
situ measurement of nitric oxide, superoxide and peroxynitrite during endotoxemia. J
Physiol Pharmacol 1997, 48 (4), 633-44.
110. Malinski, T.; Taha, Z.; Grunfeld, S.; Burewicz, A.; Tomboulian, P.; Kiechle, F.,
Measurements of Nitric-Oxide in Biological-Materials Using a Porphyrinic Microsensor.
Analytica Chimica Acta 1993, 279 (1), 135-140.
111. Malinski, T.; Huk, I., Measurement of nitric oxide in single cells and tissue using
a porphyrinic microsensor. Curr Protoc Neurosci 2001, Chapter 7, Unit7 14.
112. Martin Feelisch, J. S. S., The Oxyhemoglobin Assay. John Wiley & Sons Ltd:
1996; p 455-478.
113. Xue, J.; Ying, X.; Chen, J.; Xian, Y.; Jin, L., Amperometric ultramicrosensors for
peroxynitrite detection and its application toward single myocardial cells. Anal Chem
2000, 72 (21), 5313-21.
114. Koppenol, W. H.; Kissner, R.; Beckman, J. S., Syntheses of peroxynitrite: to go
with the flow or on solid grounds? Methods Enzymol 1996, 269, 296-302.

151
115. Reed, J. W.; Ho, H. H.; Jolly, W. L., Chemical Syntheses with a Quenched Flow
Reactor - Hydroxytrihydroborate and Peroxynitrite. Journal of the American Chemical
Society 1974, 96 (4), 1248-1249.
116. Turski, W. A.; Cavalheiro, E. A.; Schwarz, M.; Czuczwar, S. J.; Kleinrok, Z.;
Turski, L., Limbic seizures produced by pilocarpine in rats: behavioural,
electroencephalographic and neuropathological study. Behav Brain Res 1983, 9 (3), 315-
35.
117. Reiter, C. D.; Teng, R. J.; Beckman, J. S., Superoxide reacts with nitric oxide to
nitrate tyrosine at physiological pH via peroxynitrite. J Biol Chem 2000, 275 (42), 32460-
6.
118. Zhao, R.; Zhang, X. Y.; Yang, J.; Weng, C. C.; Jiang, L. L.; Zhang, J. W.; Shu, X.
Q.; Ji, Y. H., Anticonvulsant effect of BmK IT2, a sodium channel-specific neurotoxin, in
rat models of epilepsy. Br J Pharmacol 2008, 154 (5), 1116-24.
119. Brennan, A. M.; Suh, S. W.; Won, S. J.; Narasimhan, P.; Kauppinen, T. M.; Lee,
H.; Edling, Y.; Chan, P. H.; Swanson, R. A., NADPH oxidase is the primary source of
superoxide induced by NMDA receptor activation. Nat Neurosci 2009, 12 (7), 857-63.
120. Bedard, K.; Krause, K. H., The NOX family of ROS-generating NADPH
oxidases: physiology and pathophysiology. Physiol Rev 2007, 87 (1), 245-313.
121. Vallet, P.; Charnay, Y.; Steger, K.; Ogier-Denis, E.; Kovari, E.; Herrmann, F.;
Michel, J. P.; Szanto, I., Neuronal expression of the NADPH oxidase NOX4, and its
regulation in mouse experimental brain ischemia. Neuroscience 2005, 132 (2), 233-8.

152
122. Hwang, J.; Ing, M. H.; Salazar, A.; Lassegue, B.; Griendling, K.; Navab, M.;
Sevanian, A.; Hsiai, T. K., Pulsatile versus oscillatory shear stress regulates NADPH
oxidase subunit expression: implication for native LDL oxidation. Circ Res 2003, 93
(12), 1225-32.
123. Pedruzzi, E.; Guichard, C.; Ollivier, V.; Driss, F.; Fay, M.; Prunet, C.; Marie, J.
C.; Pouzet, C.; Samadi, M.; Elbim, C.; O'Dowd, Y.; Bens, M.; Vandewalle, A.;
Gougerot-Pocidalo, M. A.; Lizard, G.; Ogier-Denis, E., NAD(P)H oxidase Nox-4
mediates 7-ketocholesterol-induced endoplasmic reticulum stress and apoptosis in human
aortic smooth muscle cells. Mol Cell Biol 2004, 24 (24), 10703-17.
124. Noh, K. M.; Koh, J. Y., Induction and activation by zinc of NADPH oxidase in
cultured cortical neurons and astrocytes. J Neurosci 2000, 20 (23), RC111.
125. Stielow, C.; Catar, R. A.; Muller, G.; Wingler, K.; Scheurer, P.; Schmidt, H. H.;
Morawietz, H., Novel Nox inhibitor of oxLDL-induced reactive oxygen species
formation in human endothelial cells. Biochem Biophys Res Commun 2006, 344 (1), 200-
5.
126. ten Freyhaus, H.; Huntgeburth, M.; Wingler, K.; Schnitker, J.; Baumer, A. T.;
Vantler, M.; Bekhite, M. M.; Wartenberg, M.; Sauer, H.; Rosenkranz, S., Novel Nox
inhibitor VAS2870 attenuates PDGF-dependent smooth muscle cell chemotaxis, but not
proliferation. Cardiovasc Res 2006, 71 (2), 331-41.

!!!!!!!!!!!!!!!!!!!!!!!!!!!!!!!!!!!!!!!
!!
Thesis and Dissertation Services
Copyright © 2022 FDOKUMEN