Pressure effects on martian crustal magnetization near large impact basins
Upload
kenyattauniversityCategory
view
0download
0
Icarus 202 (2009) 429–443
Contents lists available at ScienceDirect
Icarus
www.elsevier.com/locate/icarus
Towards self-consistent modeling of the martian dichotomy: The influence ofone-ridge convection on crustal thickness distribution
Tobias Keller ∗, Paul J. Tackley
Institute of Geophysics, Sonneggstrasse 5, ETH Zurich, 8092 Zurich, Switzerland
a r t i c l e i n f o a b s t r a c t
Article history:Received 5 November 2008Revised 5 March 2009Accepted 23 March 2009Available online 27 March 2009
Keywords:GeophysicsPlanetary dynamicsMars
In order to find an explanation for the origin of the martian crustal dichotomy, a number of recentpapers have examined the effect of layered viscosity on the evolution of a degree-1 mantle convection,e.g. Roberts and Zhong [Roberts, J.H., Zhong, S., 2006. J. Geophys. Res. 111. E06013] and Yoshida andKageyama [Yoshida, M., Kageyama, A., 2006. J. Geophys. Res. 111, doi:10.1029/2005JB003905. B03412]. Itwas found that a mid-mantle viscosity jump, combined with highly temperature- and depth-dependentrheology, are effective in developing a degree-1 convection within a short timescale. Such a layeredviscosity profile could be justified by martian mineralogy. However, the effect of a degree-1 convectiveplanform on the crustal thickness distribution has not yet been demonstrated. It is not obvious whethera thinner crust, due to sublithospheric erosion and crustal thinning, or a thicker crust, due to enhancedcrustal production, would form above the hemisphere of mantle upwelling. Also, the general shapeof the dichotomy, which is not strictly hemispherical, has not yet been fully investigated. Here wepropose a model of the crustal patterns produced by numerical simulations of martian mantle convection,using the finite-volume multigrid code StagYY [Tackley, P.J., 2008. Phys. Earth Planet. Int. 107, 7–18,doi:10.1016/j.pepi.2008.08.005] A self-consistent treatment of melting, crustal formation and chemicaldifferentiation has been added to models of three-dimensional thermal convection. This allows us toobtain global maps of the crustal thickness distribution as it evolves with time. The obtained resultsdemonstrate that it is indeed possible to form a crustal dichotomy as a consequence of near degree-1mantle convection early in Mars’ history. We find that some of the observed patterns show intriguingfirst order similarities to the elliptical shape of the martian dichotomy. In all models, the region of thickcrust is located over the region of mantle upwelling, which itself is a ridge-like structure spread overroughly one half of the planet, a planform we describe as “one-ridge convection.”
© 2009 Elsevier Inc. All rights reserved.
1. Introduction
One of the most striking features of the martian surface is itscrustal dichotomy, i.e. the fact that the planet shows a more or lesshemispherical contrast in topography, crustal thickness and craterdensity. Since this surprising feature of the martian crust was firstidentified by the Mariner 9 spacecraft (Hartmann, 1973), both en-dogenic, as for example in Wise et al. (1979), Sleep (1994) andZhong and Zuber (2001), as well as exogenic processes have beenproposed to explain its origin. Exogenic explanations suggest sin-gle (Wilhelms and Squyres, 1984) or multiple (Frey and Schultz,1988) large impacts. Two recent studies addressed this issue andshowed that it would be possible to explain the elliptical shape ofthe dichotomy through one giant impact (Marinova et al., 2008;Nimmo et al., 2008). However, an impact origin may lead to cer-tain difficulties in explaining recent Mars Global Surveyor obser-
* Corresponding author.E-mail address: [email protected] (T. Keller).
0019-1035/$ – see front matter © 2009 Elsevier Inc. All rights reserved.doi:10.1016/j.icarus.2009.03.029
vations indicating a gradual pole to pole variation in topographyand crustal thickness rather than a sudden jump as expected foran impact origin (Zuber, 2001).
In this study we follow on from a number of recent papersto investigate the early evolution of a low-degree convection asa possible explanation for the observed features of the martiancrust. Based on martian stratigraphy derived from crater densityanalysis, it was suggested that the age of the dichotomy reachesback into the Early Noachian, the oldest epoch of the planet’s his-tory (Nimmo and Tanaka, 2005). Thus, the bulk of the martiancrust as well as the dichotomy itself are thought to have formedlargely during the first 300 Myr after core-formation. There are in-dications, such as buried impact craters, which suggest that thebasement crust underlying the smooth sediments of the northernhemisphere is of a similar age as the southern crust (Watters etal., 2006; Frey et al., 2002).
In a recent study, Roberts and Zhong (2006) showed that itis possible to obtain a reduction of convective degree to l = 1in only a few hundred million years by assuming a mid-mantleviscosity jump and a relatively low viscosity upper mantle. The
430 T. Keller, P.J. Tackley / Icarus 202 (2009) 429–443
general effect of layered viscosity profiles on inducing low degreemantle convection in Earth-like planets have been discussed byseveral studies such as Tackley (1996a), Bunge et al. (1996) andYoshida and Kageyama (2006). It was found that strongly depth-and temperature-dependent viscosity in terrestrial planets is a re-liable mechanism to reduce convective degree. Another possibleexplanation for a reduction of the number of plumes is an en-dothermic phase transition to perovskite in the lowermost man-tle of Mars, which also has a stabilizing effect on the thermalboundary layer above the CMB (Harder and Christensen, 1996;Harder, 1998). A deep mantle perovskite transition, however, is notfully supported by all models of martian interior (Sohl and Spohn,1997) and therefore we will concentrate our study on the effect ofa layered viscosity profile.
In order to focus on the mechanisms of crust formation and thecrustal thickness distribution produced by low-degree convection,we limit this study to a rather narrow range of parameters, sug-gested by studies like Roberts and Zhong (2006) to produce low-degree convective planforms. Their study also showed that for aconsiderable range of viscosity parameters, the number of plumeswas not reduced to one single plume. Instead, a stable ridge-shaped upwelling was obtained, the surface expression of whichwe expect to be close to elliptical in shape (Andrews-Hanna et al.,2008) and could therefore serve as a possible mechanism leadingto an elliptically shaped dichotomy. We will call this type of con-vective planform one-ridge convection in analogy to the commonlyused term one-plume convection.
Since Mars, like all terrestrial planets except Earth, lacks platetectonics and is in a rigid-lid regime, the convection would gener-ally be dominated by small scale downwellings dropping from be-neath the stable lithosphere. A high viscosity lower mantle, how-ever, will lead to only a small number of upwellings, which in theend will be collected into one single upwelling region. This featurewill eventually overrule the influence of small scale downwellingstypical for a rigid-lid. The physical reason for this transition inconvective degree to occur is to be found in the partially decou-pled convective behavior caused by the viscosity layering (Buffetet al., 1994). As the characteristic wavelength of convection de-pends strongly on the vertical viscosity structure, the dominantwavelength of convection in the upper mantle will be significantlyshorter than in the lower mantle (Ramberg, 1967). Due to bot-tom heating, the low-degree upwelling, however, develops enoughmomentum to overrule the small-scale structures in the uppermantle. As a justification for a mid-mantle viscosity jump, onlyfew explanations have been proposed so far, e.g. Zhong and Zuber(2001), suggesting the presence of a weak asthenosphere causedby partial melting of the upper mantle. We do not follow the sameapproach, since, in our models, partial melting is constrained toa rather thin band below the lithosphere and it does not occurevenly throughout the mantle. Thus it does not appear to be a vi-able option to globally influence the pattern of convection. Instead,we introduce a mid-mantle viscosity jump linked to the martianmineralogical transition zone below 1000 km depth, which is dis-cussed into more detail below.
With a low-degree convective planform seemingly being a rea-sonable assumption for physical conditions in the martian mantle,it still remains to be demonstrated whether this convective patternwould indeed produce the observed distribution of crustal thick-ness on the planet’s surface. In order to investigate the evolutionof crust formation in space and time, we added a self-consistenttreatment of melting, chemical differentiation and fractionation ofheat producing elements as well as of melt extraction and eruptionto models of mantle convection. The investigation and discussionof the coupling of melting and crust formation to the thermal evo-lution as well as the evolution of crustal thickness in space andtime thus will be the main foci of this study.
2. Model and methods
2.1. Physical model
To compute thermo-chemical convection in three-dimensionalspherical geometry, the finite volume multigrid code StagYY wasused. Spherical geometry is modeled using the so-called yin–yanggrid, consisting of two identically formed half-grids, each similarto a low-latitude part of a polar coordinate grid (Kageyama andSato, 2004). The physical model includes a self-consistent treat-ment to allow for melting, chemical differentiation, fractionationof heat producing elements into the crust and multimineralogicalphase transitions. To account for the nondiffusive nature of com-positional variations, chemical tracers are used to track the changeof local composition with time. Features specific to this study havebeen added to the more general discussion of the code given inprevious publications, e.g. Tackley (2008) and Nakagawa and Tack-ley (2005).
2.2. Equations
In StagYY, the infinite Prandtl number and compressible anelas-tic approximations are applied. The equations, nondimensionalizedto the mantle depth D , thermal diffusion time-scale D2/κ (whereκ is the thermal diffusivity), and superadiabatic temperature drop�Tsa, are:
1. Conservation of mass
�∇ · (ρ�v) = 0. (1)
2. Conservation of momentum
�∇ ·[η
(vi, j + v j,i − 2
3vk,kδi j
)]− �∇p = Ra�zρ(C, z, T )
�ρthermal. (2)
3. Conservation of energy
ρC pDT
Dt= −DisαρT vz + �∇(k∇T ) + H R + H S + HPh. (3)
4. Conservation of bulk chemistry
∂C
∂t= −�v∇C . (4)
The two nondimensional numbers governing the equations of con-vection are:
1. Surface dissipation number Dis
Dis = αs g D
C p. (5)
2. Reference Rayleigh number Ra
Ra = ρs gαs�Tsa D3
η(T , z)κs. (6)
The energy equation is given in its full form, including convection,diffusion, adiabatic effects and three source terms including inter-nal heating, dissipation or shear heating and latent heat of phasetransitions defined as follows.
Radioactive heating (discussed into more detail below).
H R = ρH . (7)
Viscous dissipation, obtained by multiplying the strain rate withthe stress tensor.
H S = Dis
Raη
(vi, j + v j,i − 2
3vk,kδi j
)vi, j . (8)
Influence of one-ridge convection on crustal thickness 431
Table 1Physical parameters for Mars.
Parameter Symb. Value Units
Depth of mantle D 1700 kmPlanet radius Rc 3400 kmSuperadiabatic T -drop �Tsa 2000 KSurface temperature Ts 200 KMantle density ρs 3500 kg m−3
Surface gravity gs 3.72 m s−2
Surface expansivity αs 3.0 × 10⁻⁵ K−1
Surface conductivity ks 4.2 W m−1 K−1
Surface diffusivity κs 1.0 × 10⁻⁶ m2 s−1
Heat capacity C p 1200 J kg−1 K−1
Activation energy Eη 200 kJ mol−1 K−1
Activation volume Vη 4.5 cm3 mol−1
Latent heat of melting L 550 J kg−1
Internal heating H init 2.0857 × 10⁻¹¹ W kg−1
Heating half-life τ1/2 2.25 GyrCrust enrichment factor Λ 10 –Surf. dissipation number Dis 0.158 –
Latent heat release or consumption of mineralogical phase transi-tions summed up over all mineral phases.
HPh = C pDis T
ρ
nphase∑i=1
f i P idΓi
dzvz. (9)
The variables are temperature T , composition C , velocity �v , andpressure p. The governing parameters are Rayleigh number Ra, in-ternal heating rate H , and surface dissipation number Dis . Materialproperties with overbars (density ρ , thermal expansivity α andthermal conductivity k) vary with depth only. Specific heat capac-ity C p is held constant, �ρthermal is the fractional density variationwith temperature (= αdim. · �Tdim.) and ρ(C, z, T ) is the densityfunction depending on composition, depth and temperature. �z isthe unit vector in the vertical direction and g is the gravitationalacceleration. For the ith phase change, Pi is the phase buoyancyparameter, f i is the fraction of the relevant mineralogical com-ponent in the assemblage and Γi is the depth-dependent phasefunction. Table 1 lists the physical parameters for Mars used in ourmodels.
Values of density ρ , thermal expansivity α, thermal diffusiv-ity κ and thermal conductivity k vary with depth due to pressure,temperature and the mineralogical phase transitions implementedin this model. The composition-dependence of density in specificwill be discussed in the section on the chemical model. Thermalexpansivity α decreases with depth, whereas both conductivity kand thermal diffusivity κ increase with depth. The exact curveschosen as reference state are given in Fig. 1, how these are calcu-lated is discussed in Tackley (1996b).
The top and bottom boundary conditions are free slip andisothermal. Cooling of the core due to heat conducted into themantle is accounted for using a parametrized model in which theCMB temperature decreases according to the amount of heat re-moved during one timestep (Xie and Tackley, 2004; Steinbach andYuen, 1994). The initial CMB temperature depends on the imposedinitial temperature field which is governed by the chosen supera-diabatic temperature drop �Tsa. The thermal initial conditions areset up using thermal boundary layers at the surface and the CMB,an internal mantle temperature between 1500 and 1600 K and atotal superadiabatic temperature-drop of 2000 K over the mantle.Random perturbations with an amplitude of 20 K are added to theinitial T -field.
2.3. Heat producing elements
Since the enrichment of heat producing elements in crustal ma-terials has a significant influence on the thermal evolution of the
planet’s interior and thus also influences the crustal growth (Hauckand Phillips, 2002), heat producing elements are assumed to frac-tionate into the crust with a factor of Λ = 10 according to thelinear relationship
H(C) = Hmean1 + C(Λ − 1)
1 + Cmean(Λ − 1).
The internal heat production in basaltic crust (C = 1) will con-sequently be increased by a factor of 10 compared to depletedmantle composition (C = 0). Cmean is the value of mean compo-sition, which stays constant over the whole domain in order tosatisfy conservation of bulk chemistry. The value for the meaninternal heating Hmean is derived from the present chondritic heat-ing rate Hchondritic = 5.2034 × 10⁻¹² W kg−1. It decays exponen-tially with time with a half-life of τ1/2 = 2.247 Ga, a value de-rived from the half-lifes of chondritic radiogenic isotopes. Thus,our models start off with an initially more intense heating ofH init = 2.0857 × 10⁻¹¹ W kg−1. These values compare very wellto values derived specifically for Mars as in Wänke and Dreibus(1994).
2.4. Chemical model, melting and eruption
To track compositional changes in the mantle, a two-componentchemical system is assumed with a variable C going from C = 0 forperidotite to C = 1 for basaltic crust/eclogite. The value of C rep-resents the fraction of crustal material in the mantle and is initial-ized at Cmean = 0.25 everywhere. As the condition of conservationof bulk composition is maintained, this value of Cmean will stayconstant over the whole domain, whereas local values of C changedue to melting and eruption. The chosen value for Cmean is simi-lar to values used in parametrized models with coupled convectionand melting done by Breuer and Spohn (2006). It corresponds to apotential crustal thickness of 280 km and approximately representsthe volume of basaltic crust that can be produced from a pyro-lite mantle by melting the garnet/pyroxene fraction (McKenzie andBickle, 1988). Basaltic crust is formed self-consistently by melt-ing, differentiation and eruption, which is calculated as a separatesubstep to solving Eqs. (1)–(4). The compositional model further-more contains a simplified description of the two main mineralsystems in the martian mantle, olivine and garnet/pyroxene. Thetotal fractions of both mineral systems in our models are cho-sen to represent estimates of martian mantle mineralogy based onSNC meteorites as given by Bertka and Fei (1997), i.e. fol = 0.55and fgt–px = 1 − fol = 0.45. The fraction of olivine in harzbur-gite thus will be 0.733. These mineral fractions also determine thecomposition-dependence of density. Local density is calculated ac-cording to the sum of the fractions of both mineral componentsmultiplied with their respective densities.
If after one timestep the temperature of a grid cell exceedsthe experimental solidus implemented in this model (Herzberget al., 2000), the fraction fmelt will be released as melt, bring-ing the temperature back to the solidus by compensating for theloss of latent heat L (set to be constant at 550 kJ kg−1). Withthis approach, residue from melting will not necessarily be C = 0harzburgite, because it is only depleted by the amount needed togenerate the melt fraction according to temperature overshoot. Ifthe melting occurs above a depth of 600 km, which is thought tobe the critical depth below which melt has a negative buoyancy(Ohtani et al., 1998), the entire melt is removed as basaltic crustto the surface and set to surface temperature, thus losing energyC P (Tsurf − Tsolidus) per unit mass. In order to calculate the totalheat flow due to melting and eruption we use:
Q erupt = M(L + C P (Tsolidus − Tsurf)
),

432 T. Keller, P.J. Tackley / Icarus 202 (2009) 429–443
Fig. 1. Adiabatic reference state for the olivine (dashed line) and the garnet–pyroxene (dotted line) system. The total mantle density ρ varies from 3304 kg m−3 at the surfaceto 4113 kg m−3 at the CMB; thermal expansivity α varies from 3 × 10⁻⁵ to 1.8 × 10⁻⁵ K−1; thermal diffusivity κ from 1 × 10⁻⁶ to 1.33 × 10⁻⁶ m2/s; thermal conductivityk from 3.96 to 6.58 W m−1 K−1.
where M is the mass flux through melting and eruption generatedper unit time, L is the latent heat per unit mass and C P (Tsolidus −Tsurf) the heat loss representing the fast radiative heat loss of hoterupted melts exposed on the surface per unit mass.
One drawback of instant eruption of all the generated meltis that it will slightly overestimate the thermal impact of erup-tion heat flux. A more realistic treatment would account for heattransported into the lithosphere by intrusions, since a certain per-centage of melt will get stuck on the way to the surface. This hasfor the moment been neglected for simplicity, but will be a ma-jor focus in future studies on melting/eruption treatment, whichwill also involve more systematic sampling of the parameter spaceconcerned. If melt is intruded into the crust rather than erupted,its latent heat is still removed from the source region and so thefirst term in the heat loss equation remains unchanged. In caseof intrusion, however, the second term (excess thermal energy) isnot needed. Instead of immediately radiating energy to space, thesurrounding crust is heated up, thus altering the geotherm and re-sulting in higher local surface heat flux. The excess thermal energydelivered by intrusion of melt therefore results in increased heatloss from thermal conduction. To summarize, the effective heatloss through magmatism would probably be similar, but some ofit would be counted as conductive heat loss rather than radiativeheat loss from surface lava flows. Additionally, a recent study on2D-models with self-consistent melt propagation prior to eruptionhas shown that eruption efficiencies are in the order of 80 percentof melt production (O’Neill et al., 2007). Although another studyderived eruption efficiencies of only 5–20 percent based on obser-vation on volcanic lava flows (Kiefer, 2003), we are confident thatour simplification will not cause dramatic errors in total surface
heat flux values, although it will slightly overestimate the thermalimpact of melting and eruption on the model evolution.
In their recent study, O’Neill et al. (2007) showed that thechoice of the solidus has by far the most sensitive influence onmelt production in the model. Therefore we chose our meltingmodel to be well within the physical constraints given by lab-oratory results. To do so, we use a dry mantle solidus fromHerzberg et al. (2000) applied to a reference pressure profile ob-tained from a SNC-type martian density profile (Bertka and Fei,1998). The solidus temperature is 1143 ◦C at 0 GPa, which is at thelower end of constraints obtained in experimental studies rang-ing from 1100 ◦C in Bertka and Holloway (1994) up to 1400 ◦C inMusselwhite et al. (2006). Additionally, the solidus is allowed toreact to depletion of the source region by linearly increasing thesolidus by up to 60 degrees as C decreased from 0.25 to 0 in thesource material (McKenzie and Bickle, 1988). This results in basaltmelting out of an almost depleted mantle source at 60 degreeshigher than from a fertile source at the same pressure.
Based on geophysical and geochemical constraints as well ason the results of parameterized mantle convection models (Breuerand Spohn, 2006; Hauck and Phillips, 2002), the crustal growth isgenerally thought to take place largely during the first 500 Myr ofthe planetary evolution, and the mean crustal thickness to be be-tween 50 and 100 km. Our model prescription measures crustalthickness at the depth where composition is C = 0.75. We chosethis value based on tests where we inserted a crust of knownthickness into the model and then used our algorithm to retrievethe crustal thickness. However, the high value chosen for potentialcrustal thickness and the instantaneous eruption treatment renderit more likely than not, that we will overestimate crustal thick-
Influence of one-ridge convection on crustal thickness 433
Table 2Phase transition properties for Mars.
i Minerals d [km] T [K] �ρ [ kgm3 ] γ [ MPa
K ] �η w [km]
Olivine system1 β-spinel → γ -spinel 1173 1600 150 +5.0 10 852 olivine → β-spinel 1007 1600 252 +2.5 30 51
Garnet–pyroxene system1 garnet/pyroxene → majorite 1055 1600 150 +1.0 40 1702 basalt → eclogite 158 0 350 0 0 34
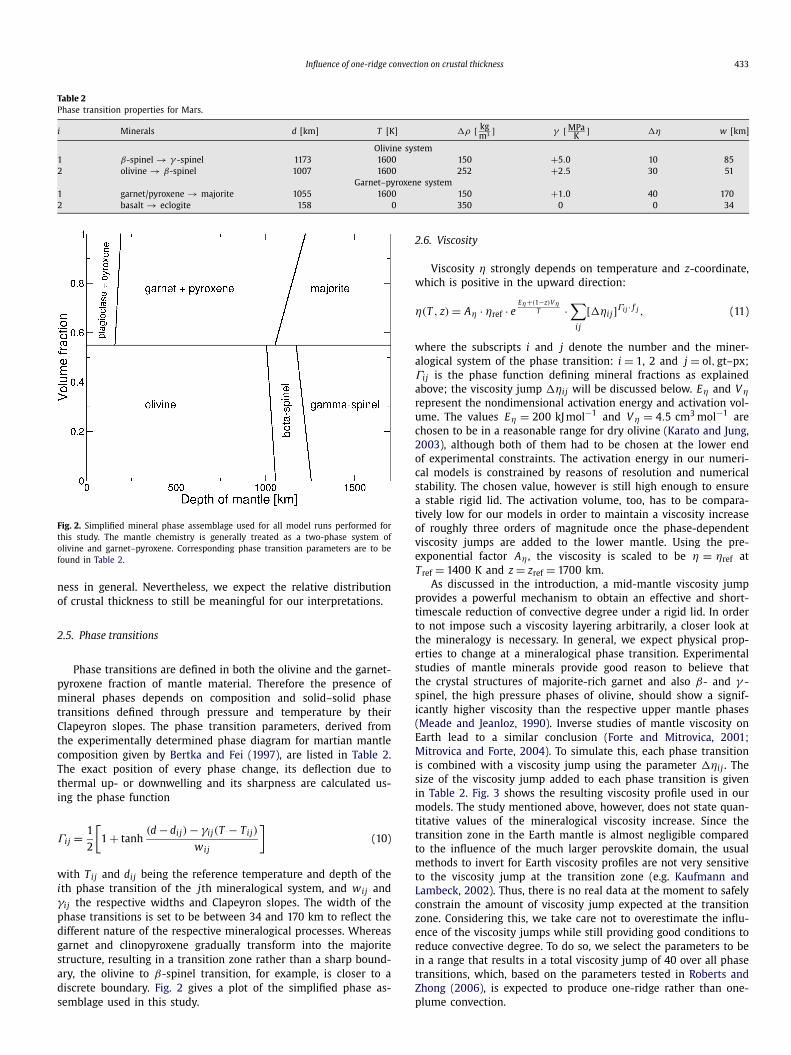
Fig. 2. Simplified mineral phase assemblage used for all model runs performed forthis study. The mantle chemistry is generally treated as a two-phase system ofolivine and garnet–pyroxene. Corresponding phase transition parameters are to befound in Table 2.
ness in general. Nevertheless, we expect the relative distributionof crustal thickness to still be meaningful for our interpretations.
2.5. Phase transitions
Phase transitions are defined in both the olivine and the garnet-pyroxene fraction of mantle material. Therefore the presence ofmineral phases depends on composition and solid–solid phasetransitions defined through pressure and temperature by theirClapeyron slopes. The phase transition parameters, derived fromthe experimentally determined phase diagram for martian mantlecomposition given by Bertka and Fei (1997), are listed in Table 2.The exact position of every phase change, its deflection due tothermal up- or downwelling and its sharpness are calculated us-ing the phase function
Γi j = 1
2
[1 + tanh
(d − dij) − γi j(T − Tij)
wij
](10)
with Tij and dij being the reference temperature and depth of theith phase transition of the jth mineralogical system, and wij andγi j the respective widths and Clapeyron slopes. The width of thephase transitions is set to be between 34 and 170 km to reflect thedifferent nature of the respective mineralogical processes. Whereasgarnet and clinopyroxene gradually transform into the majoritestructure, resulting in a transition zone rather than a sharp bound-ary, the olivine to β-spinel transition, for example, is closer to adiscrete boundary. Fig. 2 gives a plot of the simplified phase as-semblage used in this study.
2.6. Viscosity
Viscosity η strongly depends on temperature and z-coordinate,which is positive in the upward direction:
η(T , z) = Aη · ηref · eEη+(1−z)Vη
T ·∑
i j
[�ηi j]Γi j · f j , (11)
where the subscripts i and j denote the number and the miner-alogical system of the phase transition: i = 1, 2 and j = ol,gt–px;Γi j is the phase function defining mineral fractions as explainedabove; the viscosity jump �ηi j will be discussed below. Eη and Vη
represent the nondimensional activation energy and activation vol-ume. The values Eη = 200 kJ mol−1 and Vη = 4.5 cm3 mol−1 arechosen to be in a reasonable range for dry olivine (Karato and Jung,2003), although both of them had to be chosen at the lower endof experimental constraints. The activation energy in our numeri-cal models is constrained by reasons of resolution and numericalstability. The chosen value, however is still high enough to ensurea stable rigid lid. The activation volume, too, has to be compara-tively low for our models in order to maintain a viscosity increaseof roughly three orders of magnitude once the phase-dependentviscosity jumps are added to the lower mantle. Using the pre-exponential factor Aη , the viscosity is scaled to be η = ηref atTref = 1400 K and z = zref = 1700 km.
As discussed in the introduction, a mid-mantle viscosity jumpprovides a powerful mechanism to obtain an effective and short-timescale reduction of convective degree under a rigid lid. In orderto not impose such a viscosity layering arbitrarily, a closer look atthe mineralogy is necessary. In general, we expect physical prop-erties to change at a mineralogical phase transition. Experimentalstudies of mantle minerals provide good reason to believe thatthe crystal structures of majorite-rich garnet and also β- and γ -spinel, the high pressure phases of olivine, should show a signif-icantly higher viscosity than the respective upper mantle phases(Meade and Jeanloz, 1990). Inverse studies of mantle viscosity onEarth lead to a similar conclusion (Forte and Mitrovica, 2001;Mitrovica and Forte, 2004). To simulate this, each phase transitionis combined with a viscosity jump using the parameter �ηi j . Thesize of the viscosity jump added to each phase transition is givenin Table 2. Fig. 3 shows the resulting viscosity profile used in ourmodels. The study mentioned above, however, does not state quan-titative values of the mineralogical viscosity increase. Since thetransition zone in the Earth mantle is almost negligible comparedto the influence of the much larger perovskite domain, the usualmethods to invert for Earth viscosity profiles are not very sensitiveto the viscosity jump at the transition zone (e.g. Kaufmann andLambeck, 2002). Thus, there is no real data at the moment to safelyconstrain the amount of viscosity jump expected at the transitionzone. Considering this, we take care not to overestimate the influ-ence of the viscosity jumps while still providing good conditions toreduce convective degree. To do so, we select the parameters to bein a range that results in a total viscosity jump of 40 over all phasetransitions, which, based on the parameters tested in Roberts andZhong (2006), is expected to produce one-ridge rather than one-plume convection.

434 T. Keller, P.J. Tackley / Icarus 202 (2009) 429–443
Fig. 3. Reference viscosity profile of all runs. Dashed box marks the martian transi-tion zone in the lower mantle, where occurring phase transitions cause a viscosityincrease.
Table 3List of runs employed in this study.
Case ID Ras ηref [Pa s] T init [K] Melting
REF_NOMELT 3 × 10⁶ 1.28 × 10²¹ 1600 OffREF_MELT 3 × 10⁶ 1.28 × 10²¹ 1600 OnMID_RA 5 × 10⁶ 7.68 × 10²⁰ 1600 OnHIGH_RA/HIGH_TMP 7 × 10⁶ 5.48 × 10²⁰ 1600 OnMID_TMP 7 × 10⁶ 5.48 × 10²⁰ 1550 OnLOW_TMP 7 × 10⁶ 5.48 × 10²⁰ 1500 On
2.7. Method
All cases are computed at a resolution of 96 × 288 × 64 × 2 gridpoints, giving a total of 3.54 million cells. The grid is refined atthe surface and the mid-mantle phase transitions. Resolution testsshow that this resolution is necessary to appropriately model thelow viscosity upper mantle dynamics, where melting takes place.To track melting and composition, 50 million tracer particles areneeded. Calculations are done on 64 CPUs of a dual Opteron clus-ter. One model calculation consists of up to 22,000 timesteps andruns for around four full days.
The parameters for the runs performed for this study are listedin Table 3. The runs are organized in two series of three runs. Inthe first series, the Rayleigh number is increased with an intervalof 2 × 10⁶, between Ra = 3.0 × 10⁶ and Ra = 7.0 × 10⁶. Preliminarycases in 2D indicate that Ra is the parameter with the most signif-icant accelerating effect on the evolution of a degree-1 convection.Even very small changes in Ra are expected to alter the timescaleof this process by several 10s of Myrs. In the second series, westudy the coupling of initial potential temperature with meltingand crust formation by choosing initial temperatures of 1500, 1550and 1600 K. The narrow parameter range of only 100 K for ini-tial temperature is chosen to demonstrate how crust formationreacts even to rather small differences in early thermal evolution.To quantify the important influence of melting and eruption onthermal evolution of the model, one reference case was computedwith melting and differentiation switched off.
With the goal to focus on the earliest episode of martian his-tory, all models are run for 1 Gyr model time.
3. Results
The results of the model runs are presented focusing mainly onthe reduction of convective degree with time and on the evolution
of crustal thickness distribution in space and with time. Finally, wewill briefly discuss the influence of melting and magmatism on thethermal evolution of Mars.
3.1. Reduction of convective degree with time
All models, independent of their Ra, are observed to be domi-nated by the following two characteristic processes.
Firstly, small-scale downwellings in the form of interconnectedsheets drop from beneath the rigid-lid lithosphere into the lowviscosity upper mantle. Secondly, quite different from this is thestructure of the upwellings. Due to the higher viscosity of themartian transition zone (from 1007 km depth downwards), thedominant wavelength for Rayleigh–Taylor instabilities in the lowermantle is much higher than in the upper mantle, hence the largescale difference of upwelling features compared to downwellings.Mantle upwellings are few but strong, enough to soon overrulethe small-scale downwelling geometry in the upper mantle. Down-wellings are then collected between strong upwellings and theirgeometry becomes linearly stretched in shape, aligning with theoutwards flow of the plume heads spreading out below the litho-sphere.
However, the typical upwelling structures in our models do notsatisfy standard circular plume geometry, but rather resemble in-terconnected, ridge-like structures spanning large regions of thelower mantle. These upwellings rapidly converge into one singleridge, which may transit through a state of near degree two (ring-shaped ridge covering between 270 to a full 360 degrees aroundthe core) and eventually contracts into a sometimes slightly bentridge of 90 to 120 degrees in length. The intensity of the upwelling,however, is not homogeneous along the ridge, but is concentratedtowards both ends, with one end often being more vigorous thanthe other. The existence of such patterns has already been ob-served for similar model settings by Roberts and Zhong (2006).
As we will demonstrate below, this convective planform repre-sents an intermediate state between l = 2 and l = 1 convective de-gree. We will use the term one-ridge convection introduced aboveto refer to this specific kind of convective planform. Our modelssuggest that such convective planforms may be stable for severalhundreds of Myrs.
The influence of Ra on the evolution of convective planformfound by previous studies (e.g. Roberts and Zhong, 2006) is con-firmed by our results. Due to complex time-dependent behavior,no strict scaling law was obtained to describe the reduction oftimescale with Rayleigh number for a stable low-degree convec-tion to arise. It is clear, however, that more vigorous convectionsignificantly speeds up all processes leading to a reduction of con-vective degree. For example, the transition to a subhemispheri-cal ridge-like upwelling takes 125 Myr in the case with highestRa (HIGH_RA) compared to more than 300 Myr in the referencecase with lowest Ra (REF_MELT). Fig. 4 gives four timeframes ofthe model run HIGH_RA to demonstrate the quick reduction ofconvective degree and the evolution of a stable one-ridge up-welling.
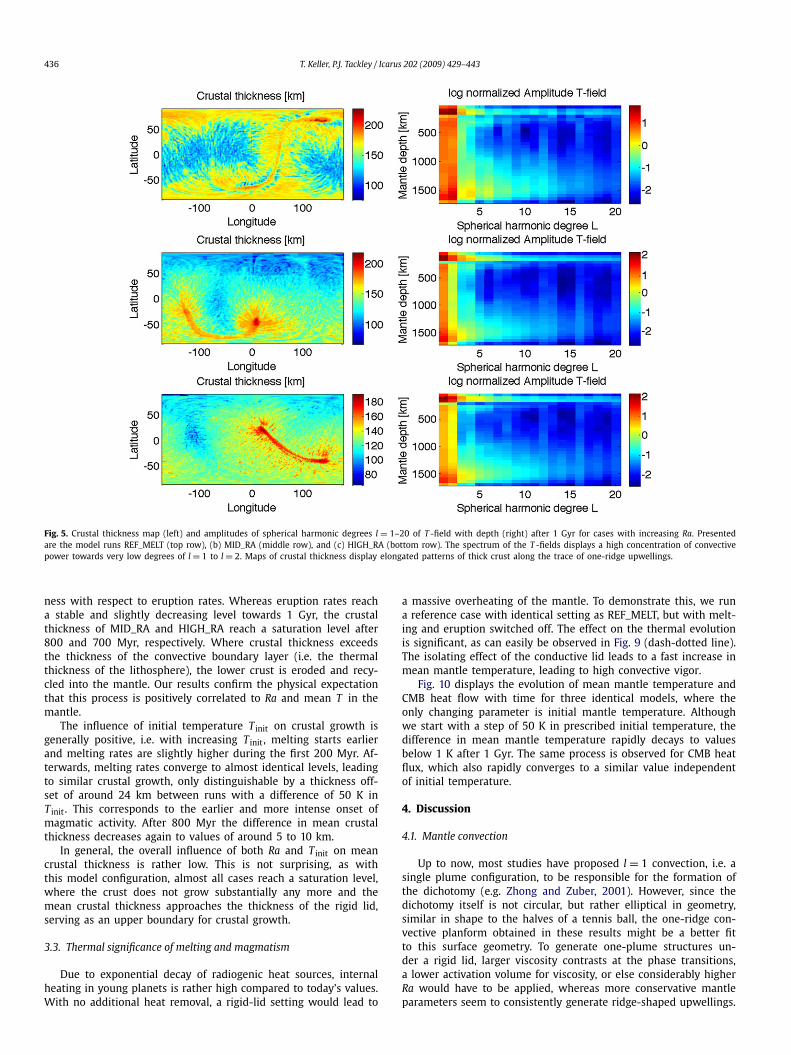
Fig. 5 gives plots of the relative amplitudes of spherical har-monic degrees with depth for the T -field of the three runs withvarying Ra, REF_MELT, MID_RA and HIGH_RA (right column), takenat end time t = 1 Gyr. For all three cases, the spectrum is mainlyconcentrated on l = 1 and l = 2, as predicted by the shape of theone-ridge upwelling. In this context, an increasing length of theupwelling ridge shifts the spectrum slightly away from l = 1 to-wards l = 2. This trend can be followed in these cases, where thelowest Ra (uppermost plot in Fig. 5) results in the longest ridgeand also in an almost even distribution of convective degree onl = 1 and l = 2.

Influence of one-ridge convection on crustal thickness 435
Fig. 4. Four frames at times t of case HIGH_RA. Shown are isosurfaces of temperature T , each taken at a level appropriate to display the upwelling structure of mantleconvection. First frame, (a) at t = 100 Myrs and T = 1550 K, (b) t = 500 Myrs and T = 1520 K, (c) t = 750 Myrs and T = 1510 K, and of the final state of the model runat t = 1 Gyr and T = 1500 K. The typical one-ridge structure of convection is stable in shape but not position over several 100 Myrs. After only 100 Myrs, all upwellingsare concentrated into one hemisphere and after 250 Myrs, the one-ridge planform is well established. Note that downwellings cannot be easily displayed because of theirsmall-scale structure. They are not similar in shape to the one-ridge upwelling.
3.2. Crustal thickness distribution
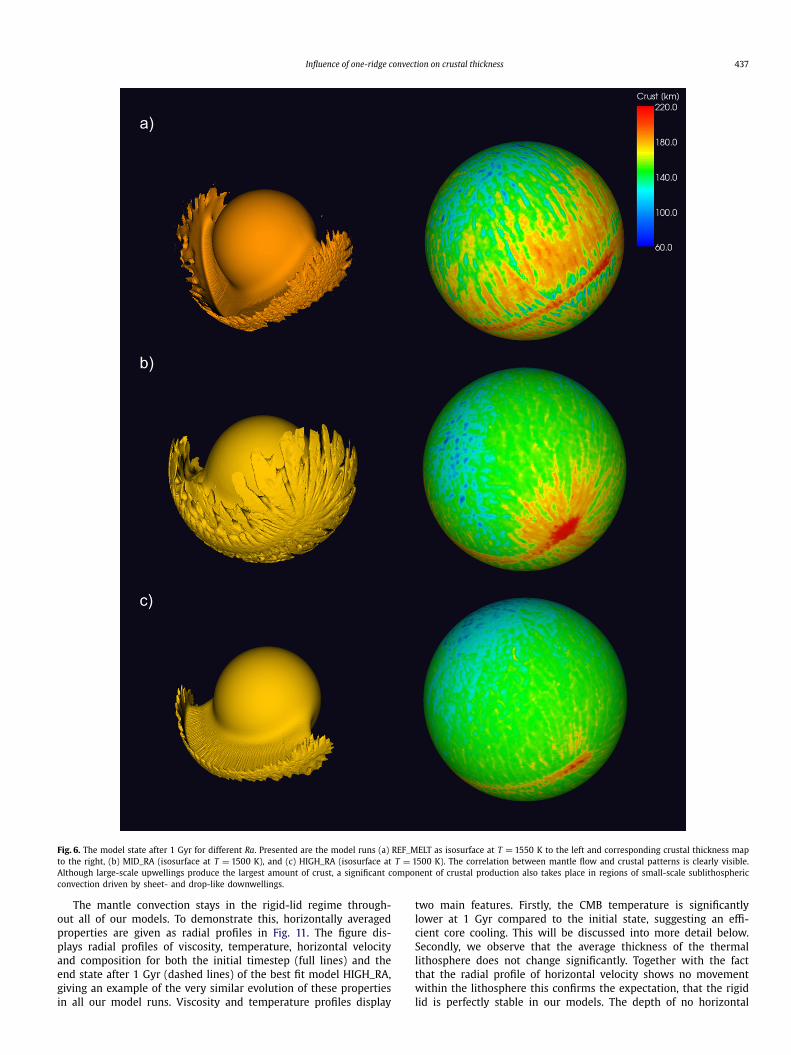
Apart from the spherical harmonics spectrum, Fig. 5 also dis-plays the crustal thickness in a map projection for the same threecases with varying Ra (left column of plots). To demonstrate howthese patterns of crustal thickness distribution are correlated tounderlying convectional features, Fig. 6 shows output frames ofboth upwelling planform and crustal thickness at 1 Gyr model timeof the cases REF_MELT, MID_RA and HIGH_RA. We observe twomain crustal signatures in all of the results. Firstly, massive pilesof crust often exceeding 100 km in thickness form above majorupwellings. These patches of thick crust reflect the shape and in-tensity of the underlying convective feature. The melting and crustformation at times even extends as far away from the center ofthe upwelling as the influence of the plume head is the significantfeature of mantle flow.
Secondly, we also see a signature of the previously mentionedsublithospheric small-scale convection. The crust produced by thisconvective feature is found on the entire surface of the planet,
starting at the boundaries of plume heads and from there ex-tending out in linear features, spanning over the hemisphere ofdownwelling. Generally, the geometry of these small-scale convec-tion cells is of an approximately hexagonal geometry, defined bythe structure of sheet-like cold downwellings dropping from therigid lid. In regions close to upwellings, however, these featuresare extended by mantle flow into linear shapes pointing away fromthe center of upwelling.
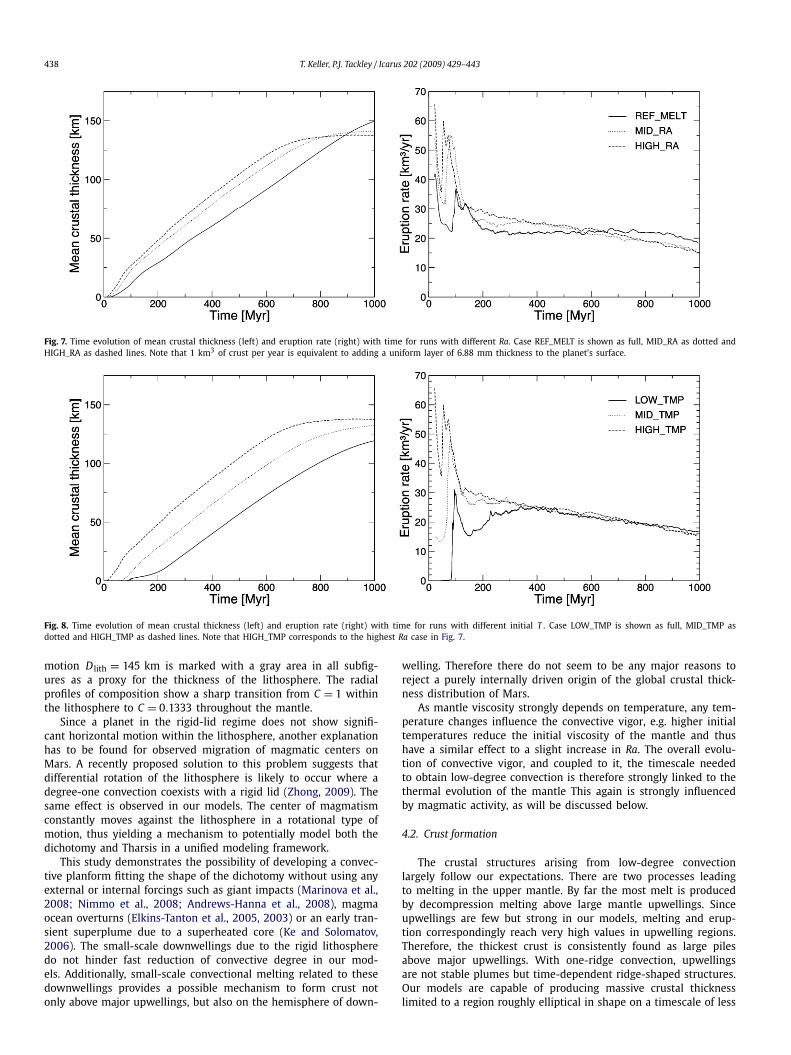
The evolution of mean crustal thickness and eruption rates ofall model settings are given in Figs. 7 and 8. The influence of in-creasing Rayleigh number on crustal production consists largely ofan earlier onset and higher melting rates, which leads to a fasterdepletion and cooling of the source region. This eventually leadsto a decrease in melting rates again. The increase in convectivevigor with increasing Ra also leads to an increasing amount ofsublithospheric erosion and crustal recycling. Therefore the meancrustal thickness of the high Ra case HIGH_RA in the end is lowerthan in corresponding lower Ra cases REF_MELT and MID_RA. Withtime, there is an observed decorrelation of the mean crustal thick-
436 T. Keller, P.J. Tackley / Icarus 202 (2009) 429–443
Fig. 5. Crustal thickness map (left) and amplitudes of spherical harmonic degrees l = 1–20 of T -field with depth (right) after 1 Gyr for cases with increasing Ra. Presentedare the model runs REF_MELT (top row), (b) MID_RA (middle row), and (c) HIGH_RA (bottom row). The spectrum of the T -fields displays a high concentration of convectivepower towards very low degrees of l = 1 to l = 2. Maps of crustal thickness display elongated patterns of thick crust along the trace of one-ridge upwellings.
ness with respect to eruption rates. Whereas eruption rates reacha stable and slightly decreasing level towards 1 Gyr, the crustalthickness of MID_RA and HIGH_RA reach a saturation level after800 and 700 Myr, respectively. Where crustal thickness exceedsthe thickness of the convective boundary layer (i.e. the thermalthickness of the lithosphere), the lower crust is eroded and recy-cled into the mantle. Our results confirm the physical expectationthat this process is positively correlated to Ra and mean T in themantle.
The influence of initial temperature T init on crustal growth isgenerally positive, i.e. with increasing T init , melting starts earlierand melting rates are slightly higher during the first 200 Myr. Af-terwards, melting rates converge to almost identical levels, leadingto similar crustal growth, only distinguishable by a thickness off-set of around 24 km between runs with a difference of 50 K inT init . This corresponds to the earlier and more intense onset ofmagmatic activity. After 800 Myr the difference in mean crustalthickness decreases again to values of around 5 to 10 km.
In general, the overall influence of both Ra and T init on meancrustal thickness is rather low. This is not surprising, as withthis model configuration, almost all cases reach a saturation level,where the crust does not grow substantially any more and themean crustal thickness approaches the thickness of the rigid lid,serving as an upper boundary for crustal growth.
3.3. Thermal significance of melting and magmatism
Due to exponential decay of radiogenic heat sources, internalheating in young planets is rather high compared to today’s values.With no additional heat removal, a rigid-lid setting would lead to
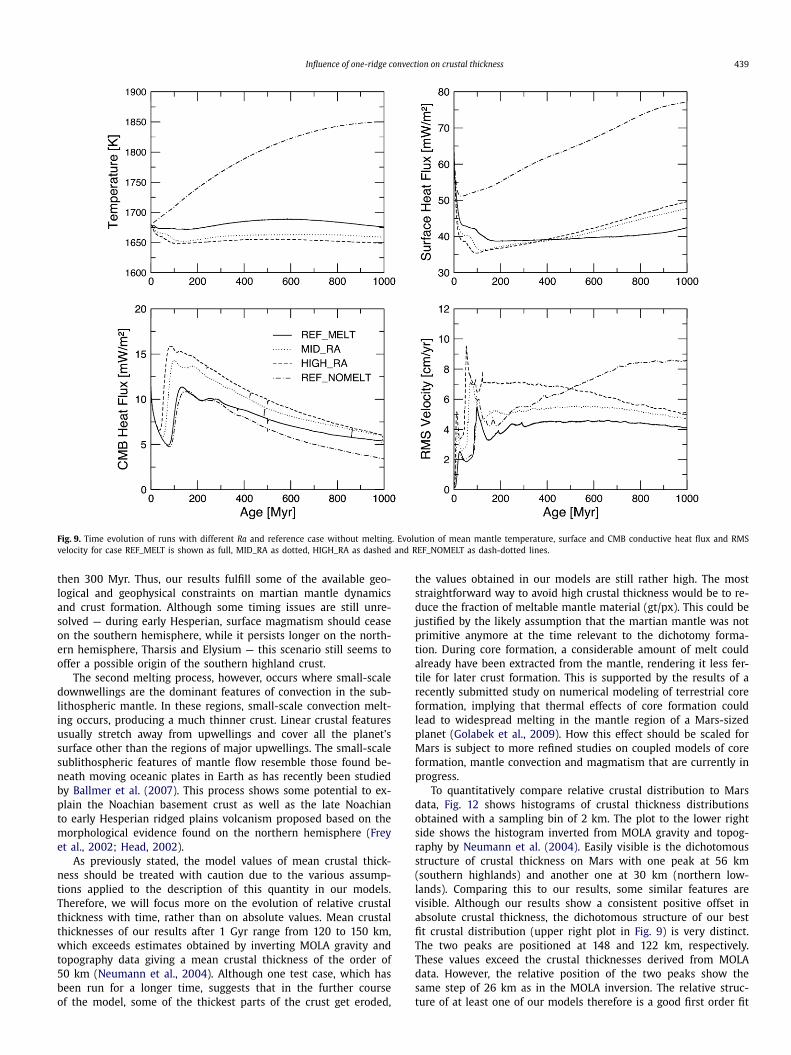
a massive overheating of the mantle. To demonstrate this, we runa reference case with identical setting as REF_MELT, but with melt-ing and eruption switched off. The effect on the thermal evolutionis significant, as can easily be observed in Fig. 9 (dash-dotted line).The isolating effect of the conductive lid leads to a fast increase inmean mantle temperature, leading to high convective vigor.
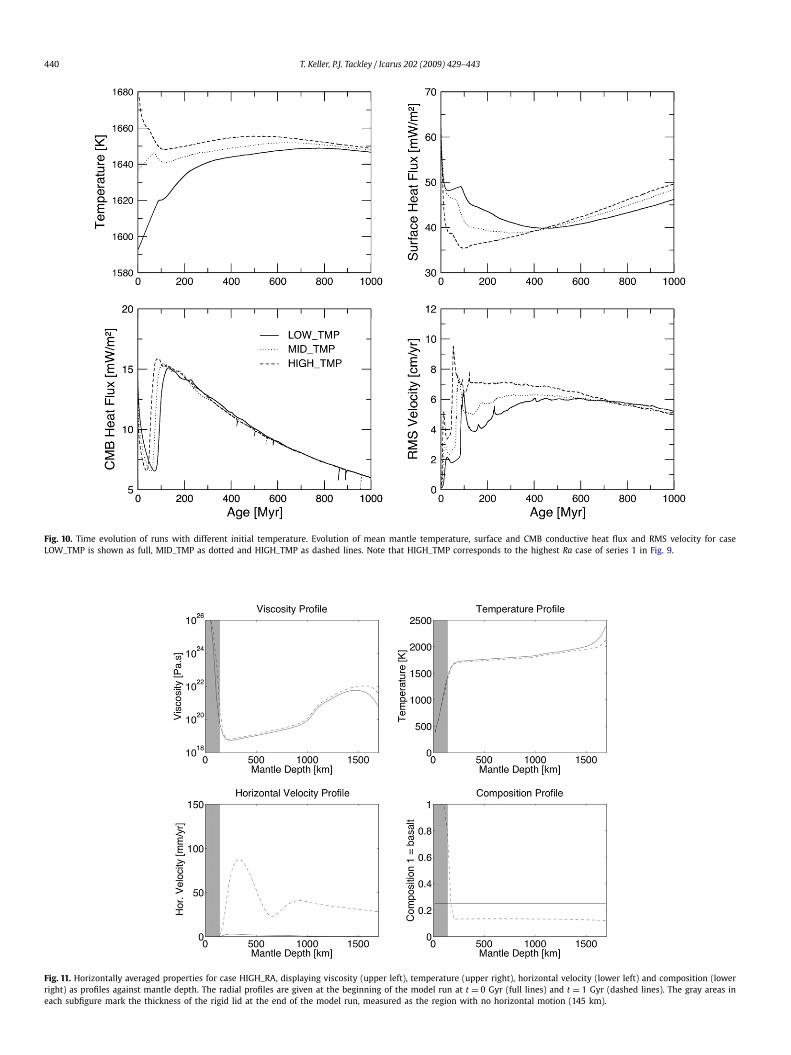
Fig. 10 displays the evolution of mean mantle temperature andCMB heat flow with time for three identical models, where theonly changing parameter is initial mantle temperature. Althoughwe start with a step of 50 K in prescribed initial temperature, thedifference in mean mantle temperature rapidly decays to valuesbelow 1 K after 1 Gyr. The same process is observed for CMB heatflux, which also rapidly converges to a similar value independentof initial temperature.
4. Discussion
4.1. Mantle convection
Up to now, most studies have proposed l = 1 convection, i.e. asingle plume configuration, to be responsible for the formation ofthe dichotomy (e.g. Zhong and Zuber, 2001). However, since thedichotomy itself is not circular, but rather elliptical in geometry,similar in shape to the halves of a tennis ball, the one-ridge con-vective planform obtained in these results might be a better fitto this surface geometry. To generate one-plume structures un-der a rigid lid, larger viscosity contrasts at the phase transitions,a lower activation volume for viscosity, or else considerably higherRa would have to be applied, whereas more conservative mantleparameters seem to consistently generate ridge-shaped upwellings.
Influence of one-ridge convection on crustal thickness 437
Fig. 6. The model state after 1 Gyr for different Ra. Presented are the model runs (a) REF_MELT as isosurface at T = 1550 K to the left and corresponding crustal thickness mapto the right, (b) MID_RA (isosurface at T = 1500 K), and (c) HIGH_RA (isosurface at T = 1500 K). The correlation between mantle flow and crustal patterns is clearly visible.Although large-scale upwellings produce the largest amount of crust, a significant component of crustal production also takes place in regions of small-scale sublithospheric
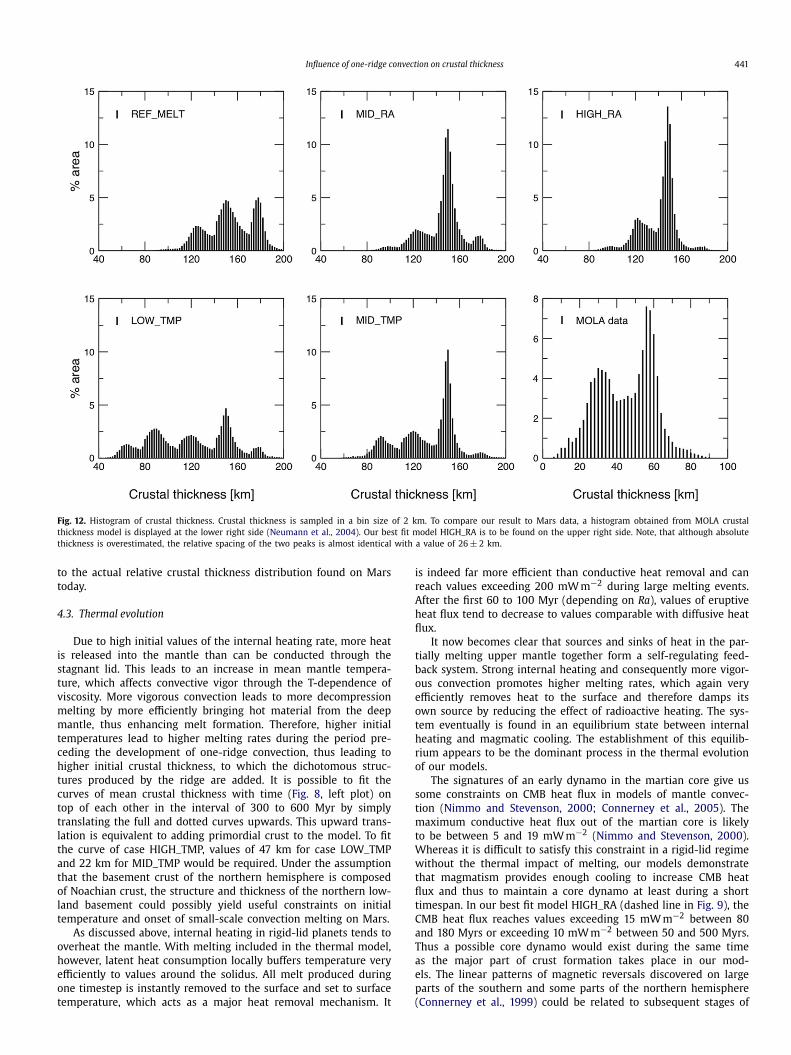
convection driven by sheet- and drop-like downwellings.The mantle convection stays in the rigid-lid regime through-out all of our models. To demonstrate this, horizontally averagedproperties are given as radial profiles in Fig. 11. The figure dis-plays radial profiles of viscosity, temperature, horizontal velocityand composition for both the initial timestep (full lines) and theend state after 1 Gyr (dashed lines) of the best fit model HIGH_RA,giving an example of the very similar evolution of these propertiesin all our model runs. Viscosity and temperature profiles display
two main features. Firstly, the CMB temperature is significantlylower at 1 Gyr compared to the initial state, suggesting an effi-cient core cooling. This will be discussed into more detail below.Secondly, we observe that the average thickness of the thermallithosphere does not change significantly. Together with the factthat the radial profile of horizontal velocity shows no movementwithin the lithosphere this confirms the expectation, that the rigidlid is perfectly stable in our models. The depth of no horizontal
438 T. Keller, P.J. Tackley / Icarus 202 (2009) 429–443
Fig. 7. Time evolution of mean crustal thickness (left) and eruption rate (right) with time for runs with different Ra. Case REF_MELT is shown as full, MID_RA as dotted andHIGH_RA as dashed lines. Note that 1 km3 of crust per year is equivalent to adding a uniform layer of 6.88 mm thickness to the planet’s surface.
Fig. 8. Time evolution of mean crustal thickness (left) and eruption rate (right) with time for runs with different initial T . Case LOW_TMP is shown as full, MID_TMP asdotted and HIGH_TMP as dashed lines. Note that HIGH_TMP corresponds to the highest Ra case in Fig. 7.
motion D lith = 145 km is marked with a gray area in all subfig-ures as a proxy for the thickness of the lithosphere. The radialprofiles of composition show a sharp transition from C = 1 withinthe lithosphere to C = 0.1333 throughout the mantle.
Since a planet in the rigid-lid regime does not show signifi-cant horizontal motion within the lithosphere, another explanationhas to be found for observed migration of magmatic centers onMars. A recently proposed solution to this problem suggests thatdifferential rotation of the lithosphere is likely to occur where adegree-one convection coexists with a rigid lid (Zhong, 2009). Thesame effect is observed in our models. The center of magmatismconstantly moves against the lithosphere in a rotational type ofmotion, thus yielding a mechanism to potentially model both thedichotomy and Tharsis in a unified modeling framework.
This study demonstrates the possibility of developing a convec-tive planform fitting the shape of the dichotomy without using anyexternal or internal forcings such as giant impacts (Marinova et al.,2008; Nimmo et al., 2008; Andrews-Hanna et al., 2008), magmaocean overturns (Elkins-Tanton et al., 2005, 2003) or an early tran-sient superplume due to a superheated core (Ke and Solomatov,2006). The small-scale downwellings due to the rigid lithospheredo not hinder fast reduction of convective degree in our mod-els. Additionally, small-scale convectional melting related to thesedownwellings provides a possible mechanism to form crust notonly above major upwellings, but also on the hemisphere of down-
welling. Therefore there do not seem to be any major reasons toreject a purely internally driven origin of the global crustal thick-ness distribution of Mars.
As mantle viscosity strongly depends on temperature, any tem-perature changes influence the convective vigor, e.g. higher initialtemperatures reduce the initial viscosity of the mantle and thushave a similar effect to a slight increase in Ra. The overall evolu-tion of convective vigor, and coupled to it, the timescale neededto obtain low-degree convection is therefore strongly linked to thethermal evolution of the mantle This again is strongly influencedby magmatic activity, as will be discussed below.
4.2. Crust formation
The crustal structures arising from low-degree convectionlargely follow our expectations. There are two processes leadingto melting in the upper mantle. By far the most melt is producedby decompression melting above large mantle upwellings. Sinceupwellings are few but strong in our models, melting and erup-tion correspondingly reach very high values in upwelling regions.Therefore, the thickest crust is consistently found as large pilesabove major upwellings. With one-ridge convection, upwellingsare not stable plumes but time-dependent ridge-shaped structures.Our models are capable of producing massive crustal thicknesslimited to a region roughly elliptical in shape on a timescale of less
Influence of one-ridge convection on crustal thickness 439
Fig. 9. Time evolution of runs with different Ra and reference case without melting. Evolution of mean mantle temperature, surface and CMB conductive heat flux and RMSvelocity for case REF_MELT is shown as full, MID_RA as dotted, HIGH_RA as dashed and REF_NOMELT as dash-dotted lines.
then 300 Myr. Thus, our results fulfill some of the available geo-logical and geophysical constraints on martian mantle dynamicsand crust formation. Although some timing issues are still unre-solved — during early Hesperian, surface magmatism should ceaseon the southern hemisphere, while it persists longer on the north-ern hemisphere, Tharsis and Elysium — this scenario still seems tooffer a possible origin of the southern highland crust.
The second melting process, however, occurs where small-scaledownwellings are the dominant features of convection in the sub-lithospheric mantle. In these regions, small-scale convection melt-ing occurs, producing a much thinner crust. Linear crustal featuresusually stretch away from upwellings and cover all the planet’ssurface other than the regions of major upwellings. The small-scalesublithospheric features of mantle flow resemble those found be-neath moving oceanic plates in Earth as has recently been studiedby Ballmer et al. (2007). This process shows some potential to ex-plain the Noachian basement crust as well as the late Noachianto early Hesperian ridged plains volcanism proposed based on themorphological evidence found on the northern hemisphere (Freyet al., 2002; Head, 2002).
As previously stated, the model values of mean crustal thick-ness should be treated with caution due to the various assump-tions applied to the description of this quantity in our models.Therefore, we will focus more on the evolution of relative crustalthickness with time, rather than on absolute values. Mean crustalthicknesses of our results after 1 Gyr range from 120 to 150 km,which exceeds estimates obtained by inverting MOLA gravity andtopography data giving a mean crustal thickness of the order of50 km (Neumann et al., 2004). Although one test case, which hasbeen run for a longer time, suggests that in the further courseof the model, some of the thickest parts of the crust get eroded,
the values obtained in our models are still rather high. The moststraightforward way to avoid high crustal thickness would be to re-duce the fraction of meltable mantle material (gt/px). This could bejustified by the likely assumption that the martian mantle was notprimitive anymore at the time relevant to the dichotomy forma-tion. During core formation, a considerable amount of melt couldalready have been extracted from the mantle, rendering it less fer-tile for later crust formation. This is supported by the results of arecently submitted study on numerical modeling of terrestrial coreformation, implying that thermal effects of core formation couldlead to widespread melting in the mantle region of a Mars-sizedplanet (Golabek et al., 2009). How this effect should be scaled forMars is subject to more refined studies on coupled models of coreformation, mantle convection and magmatism that are currently inprogress.
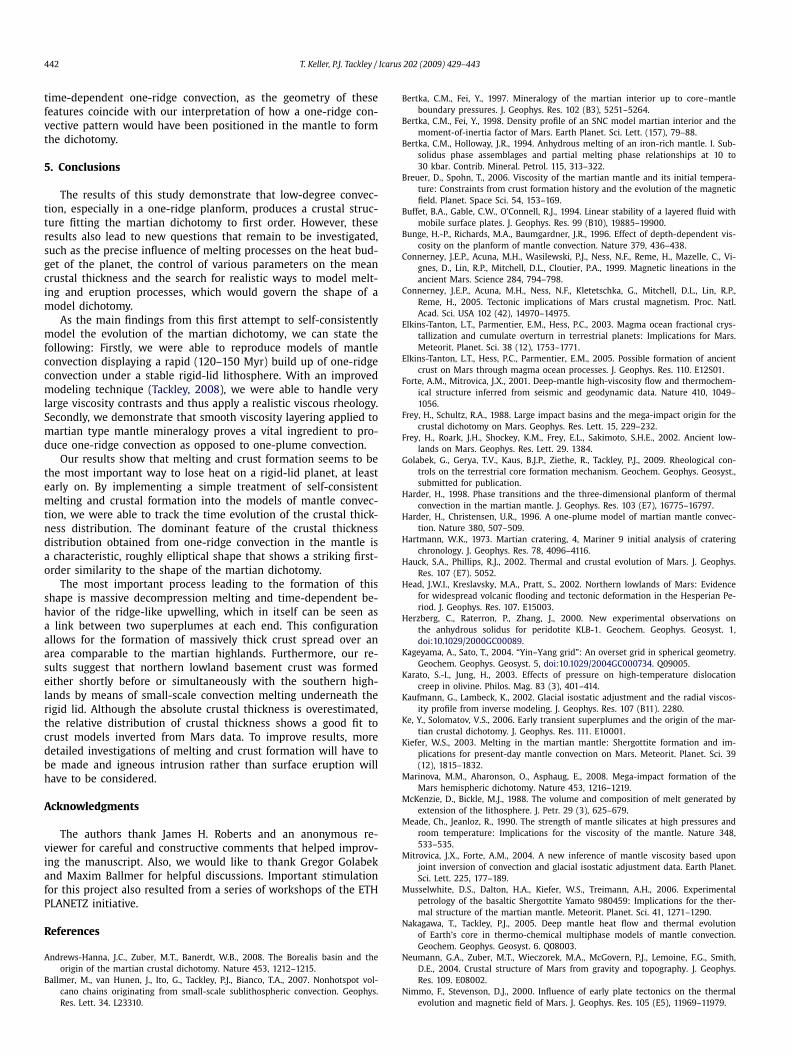
To quantitatively compare relative crustal distribution to Marsdata, Fig. 12 shows histograms of crustal thickness distributionsobtained with a sampling bin of 2 km. The plot to the lower rightside shows the histogram inverted from MOLA gravity and topog-raphy by Neumann et al. (2004). Easily visible is the dichotomousstructure of crustal thickness on Mars with one peak at 56 km(southern highlands) and another one at 30 km (northern low-lands). Comparing this to our results, some similar features arevisible. Although our results show a consistent positive offset inabsolute crustal thickness, the dichotomous structure of our bestfit crustal distribution (upper right plot in Fig. 9) is very distinct.The two peaks are positioned at 148 and 122 km, respectively.These values exceed the crustal thicknesses derived from MOLAdata. However, the relative position of the two peaks show thesame step of 26 km as in the MOLA inversion. The relative struc-ture of at least one of our models therefore is a good first order fit
440 T. Keller, P.J. Tackley / Icarus 202 (2009) 429–443
Fig. 10. Time evolution of runs with different initial temperature. Evolution of mean mantle temperature, surface and CMB conductive heat flux and RMS velocity for caseLOW_TMP is shown as full, MID_TMP as dotted and HIGH_TMP as dashed lines. Note that HIGH_TMP corresponds to the highest Ra case of series 1 in Fig. 9.
Fig. 11. Horizontally averaged properties for case HIGH_RA, displaying viscosity (upper left), temperature (upper right), horizontal velocity (lower left) and composition (lowerright) as profiles against mantle depth. The radial profiles are given at the beginning of the model run at t = 0 Gyr (full lines) and t = 1 Gyr (dashed lines). The gray areas ineach subfigure mark the thickness of the rigid lid at the end of the model run, measured as the region with no horizontal motion (145 km).
Influence of one-ridge convection on crustal thickness 441
Fig. 12. Histogram of crustal thickness. Crustal thickness is sampled in a bin size of 2 km. To compare our result to Mars data, a histogram obtained from MOLA crustalthickness model is displayed at the lower right side (Neumann et al., 2004). Our best fit model HIGH_RA is to be found on the upper right side. Note, that although absolutethickness is overestimated, the relative spacing of the two peaks is almost identical with a value of 26 ± 2 km.
to the actual relative crustal thickness distribution found on Marstoday.
4.3. Thermal evolution
Due to high initial values of the internal heating rate, more heatis released into the mantle than can be conducted through thestagnant lid. This leads to an increase in mean mantle tempera-ture, which affects convective vigor through the T-dependence ofviscosity. More vigorous convection leads to more decompressionmelting by more efficiently bringing hot material from the deepmantle, thus enhancing melt formation. Therefore, higher initialtemperatures lead to higher melting rates during the period pre-ceding the development of one-ridge convection, thus leading tohigher initial crustal thickness, to which the dichotomous struc-tures produced by the ridge are added. It is possible to fit thecurves of mean crustal thickness with time (Fig. 8, left plot) ontop of each other in the interval of 300 to 600 Myr by simplytranslating the full and dotted curves upwards. This upward trans-lation is equivalent to adding primordial crust to the model. To fitthe curve of case HIGH_TMP, values of 47 km for case LOW_TMPand 22 km for MID_TMP would be required. Under the assumptionthat the basement crust of the northern hemisphere is composedof Noachian crust, the structure and thickness of the northern low-land basement could possibly yield useful constraints on initialtemperature and onset of small-scale convection melting on Mars.
As discussed above, internal heating in rigid-lid planets tends tooverheat the mantle. With melting included in the thermal model,however, latent heat consumption locally buffers temperature veryefficiently to values around the solidus. All melt produced duringone timestep is instantly removed to the surface and set to surfacetemperature, which acts as a major heat removal mechanism. It
is indeed far more efficient than conductive heat removal and canreach values exceeding 200 mW m−2 during large melting events.After the first 60 to 100 Myr (depending on Ra), values of eruptiveheat flux tend to decrease to values comparable with diffusive heatflux.
It now becomes clear that sources and sinks of heat in the par-tially melting upper mantle together form a self-regulating feed-back system. Strong internal heating and consequently more vigor-ous convection promotes higher melting rates, which again veryefficiently removes heat to the surface and therefore damps itsown source by reducing the effect of radioactive heating. The sys-tem eventually is found in an equilibrium state between internalheating and magmatic cooling. The establishment of this equilib-rium appears to be the dominant process in the thermal evolutionof our models.
The signatures of an early dynamo in the martian core give ussome constraints on CMB heat flux in models of mantle convec-tion (Nimmo and Stevenson, 2000; Connerney et al., 2005). Themaximum conductive heat flux out of the martian core is likelyto be between 5 and 19 mW m−2 (Nimmo and Stevenson, 2000).Whereas it is difficult to satisfy this constraint in a rigid-lid regimewithout the thermal impact of melting, our models demonstratethat magmatism provides enough cooling to increase CMB heatflux and thus to maintain a core dynamo at least during a shorttimespan. In our best fit model HIGH_RA (dashed line in Fig. 9), theCMB heat flux reaches values exceeding 15 mW m−2 between 80and 180 Myrs or exceeding 10 mW m−2 between 50 and 500 Myrs.Thus a possible core dynamo would exist during the same timeas the major part of crust formation takes place in our mod-els. The linear patterns of magnetic reversals discovered on largeparts of the southern and some parts of the northern hemisphere(Connerney et al., 1999) could be related to subsequent stages of
442 T. Keller, P.J. Tackley / Icarus 202 (2009) 429–443
time-dependent one-ridge convection, as the geometry of thesefeatures coincide with our interpretation of how a one-ridge con-vective pattern would have been positioned in the mantle to formthe dichotomy.
5. Conclusions
The results of this study demonstrate that low-degree convec-tion, especially in a one-ridge planform, produces a crustal struc-ture fitting the martian dichotomy to first order. However, theseresults also lead to new questions that remain to be investigated,such as the precise influence of melting processes on the heat bud-get of the planet, the control of various parameters on the meancrustal thickness and the search for realistic ways to model melt-ing and eruption processes, which would govern the shape of amodel dichotomy.
As the main findings from this first attempt to self-consistentlymodel the evolution of the martian dichotomy, we can state thefollowing: Firstly, we were able to reproduce models of mantleconvection displaying a rapid (120–150 Myr) build up of one-ridgeconvection under a stable rigid-lid lithosphere. With an improvedmodeling technique (Tackley, 2008), we were able to handle verylarge viscosity contrasts and thus apply a realistic viscous rheology.Secondly, we demonstrate that smooth viscosity layering applied tomartian type mantle mineralogy proves a vital ingredient to pro-duce one-ridge convection as opposed to one-plume convection.
Our results show that melting and crust formation seems to bethe most important way to lose heat on a rigid-lid planet, at leastearly on. By implementing a simple treatment of self-consistentmelting and crustal formation into the models of mantle convec-tion, we were able to track the time evolution of the crustal thick-ness distribution. The dominant feature of the crustal thicknessdistribution obtained from one-ridge convection in the mantle isa characteristic, roughly elliptical shape that shows a striking first-order similarity to the shape of the martian dichotomy.
The most important process leading to the formation of thisshape is massive decompression melting and time-dependent be-havior of the ridge-like upwelling, which in itself can be seen asa link between two superplumes at each end. This configurationallows for the formation of massively thick crust spread over anarea comparable to the martian highlands. Furthermore, our re-sults suggest that northern lowland basement crust was formedeither shortly before or simultaneously with the southern high-lands by means of small-scale convection melting underneath therigid lid. Although the absolute crustal thickness is overestimated,the relative distribution of crustal thickness shows a good fit tocrust models inverted from Mars data. To improve results, moredetailed investigations of melting and crust formation will have tobe made and igneous intrusion rather than surface eruption willhave to be considered.
Acknowledgments
The authors thank James H. Roberts and an anonymous re-viewer for careful and constructive comments that helped improv-ing the manuscript. Also, we would like to thank Gregor Golabekand Maxim Ballmer for helpful discussions. Important stimulationfor this project also resulted from a series of workshops of the ETHPLANETZ initiative.
References
Andrews-Hanna, J.C., Zuber, M.T., Banerdt, W.B., 2008. The Borealis basin and theorigin of the martian crustal dichotomy. Nature 453, 1212–1215.
Ballmer, M., van Hunen, J., Ito, G., Tackley, P.J., Bianco, T.A., 2007. Nonhotspot vol-cano chains originating from small-scale sublithospheric convection. Geophys.Res. Lett. 34. L23310.
Bertka, C.M., Fei, Y., 1997. Mineralogy of the martian interior up to core–mantleboundary pressures. J. Geophys. Res. 102 (B3), 5251–5264.
Bertka, C.M., Fei, Y., 1998. Density profile of an SNC model martian interior and themoment-of-inertia factor of Mars. Earth Planet. Sci. Lett. (157), 79–88.
Bertka, C.M., Holloway, J.R., 1994. Anhydrous melting of an iron-rich mantle. I. Sub-solidus phase assemblages and partial melting phase relationships at 10 to30 kbar. Contrib. Mineral. Petrol. 115, 313–322.
Breuer, D., Spohn, T., 2006. Viscosity of the martian mantle and its initial tempera-ture: Constraints from crust formation history and the evolution of the magneticfield. Planet. Space Sci. 54, 153–169.
Buffet, B.A., Gable, C.W., O’Connell, R.J., 1994. Linear stability of a layered fluid withmobile surface plates. J. Geophys. Res. 99 (B10), 19885–19900.
Bunge, H.-P., Richards, M.A., Baumgardner, J.R., 1996. Effect of depth-dependent vis-cosity on the planform of mantle convection. Nature 379, 436–438.
Connerney, J.E.P., Acuna, M.H., Wasilewski, P.J., Ness, N.F., Reme, H., Mazelle, C., Vi-gnes, D., Lin, R.P., Mitchell, D.L., Cloutier, P.A., 1999. Magnetic lineations in theancient Mars. Science 284, 794–798.
Connerney, J.E.P., Acuna, M.H., Ness, N.F., Kletetschka, G., Mitchell, D.L., Lin, R.P.,Reme, H., 2005. Tectonic implications of Mars crustal magnetism. Proc. Natl.Acad. Sci. USA 102 (42), 14970–14975.
Elkins-Tanton, L.T., Parmentier, E.M., Hess, P.C., 2003. Magma ocean fractional crys-tallization and cumulate overturn in terrestrial planets: Implications for Mars.Meteorit. Planet. Sci. 38 (12), 1753–1771.
Elkins-Tanton, L.T., Hess, P.C., Parmentier, E.M., 2005. Possible formation of ancientcrust on Mars through magma ocean processes. J. Geophys. Res. 110. E12S01.
Forte, A.M., Mitrovica, J.X., 2001. Deep-mantle high-viscosity flow and thermochem-ical structure inferred from seismic and geodynamic data. Nature 410, 1049–1056.
Frey, H., Schultz, R.A., 1988. Large impact basins and the mega-impact origin for thecrustal dichotomy on Mars. Geophys. Res. Lett. 15, 229–232.
Frey, H., Roark, J.H., Shockey, K.M., Frey, E.L., Sakimoto, S.H.E., 2002. Ancient low-lands on Mars. Geophys. Res. Lett. 29. 1384.
Golabek, G., Gerya, T.V., Kaus, B.J.P., Ziethe, R., Tackley, P.J., 2009. Rheological con-trols on the terrestrial core formation mechanism. Geochem. Geophys. Geosyst.,submitted for publication.
Harder, H., 1998. Phase transitions and the three-dimensional planform of thermalconvection in the martian mantle. J. Geophys. Res. 103 (E7), 16775–16797.
Harder, H., Christensen, U.R., 1996. A one-plume model of martian mantle convec-tion. Nature 380, 507–509.
Hartmann, W.K., 1973. Martian cratering, 4, Mariner 9 initial analysis of crateringchronology. J. Geophys. Res. 78, 4096–4116.
Hauck, S.A., Phillips, R.J., 2002. Thermal and crustal evolution of Mars. J. Geophys.Res. 107 (E7). 5052.
Head, J.W.I., Kreslavsky, M.A., Pratt, S., 2002. Northern lowlands of Mars: Evidencefor widespread volcanic flooding and tectonic deformation in the Hesperian Pe-riod. J. Geophys. Res. 107. E15003.
Herzberg, C., Raterron, P., Zhang, J., 2000. New experimental observations onthe anhydrous solidus for peridotite KLB-1. Geochem. Geophys. Geosyst. 1,doi:10.1029/2000GC00089.
Kageyama, A., Sato, T., 2004. “Yin–Yang grid”: An overset grid in spherical geometry.Geochem. Geophys. Geosyst. 5, doi:10.1029/2004GC000734. Q09005.
Karato, S.-I., Jung, H., 2003. Effects of pressure on high-temperature dislocationcreep in olivine. Philos. Mag. 83 (3), 401–414.
Kaufmann, G., Lambeck, K., 2002. Glacial isostatic adjustment and the radial viscos-ity profile from inverse modeling. J. Geophys. Res. 107 (B11). 2280.
Ke, Y., Solomatov, V.S., 2006. Early transient superplumes and the origin of the mar-tian crustal dichotomy. J. Geophys. Res. 111. E10001.
Kiefer, W.S., 2003. Melting in the martian mantle: Shergottite formation and im-plications for present-day mantle convection on Mars. Meteorit. Planet. Sci. 39(12), 1815–1832.
Marinova, M.M., Aharonson, O., Asphaug, E., 2008. Mega-impact formation of theMars hemispheric dichotomy. Nature 453, 1216–1219.
McKenzie, D., Bickle, M.J., 1988. The volume and composition of melt generated byextension of the lithosphere. J. Petr. 29 (3), 625–679.
Meade, Ch., Jeanloz, R., 1990. The strength of mantle silicates at high pressures androom temperature: Implications for the viscosity of the mantle. Nature 348,533–535.
Mitrovica, J.X., Forte, A.M., 2004. A new inference of mantle viscosity based uponjoint inversion of convection and glacial isostatic adjustment data. Earth Planet.Sci. Lett. 225, 177–189.
Musselwhite, D.S., Dalton, H.A., Kiefer, W.S., Treimann, A.H., 2006. Experimentalpetrology of the basaltic Shergottite Yamato 980459: Implications for the ther-mal structure of the martian mantle. Meteorit. Planet. Sci. 41, 1271–1290.
Nakagawa, T., Tackley, P.J., 2005. Deep mantle heat flow and thermal evolutionof Earth’s core in thermo-chemical multiphase models of mantle convection.Geochem. Geophys. Geosyst. 6. Q08003.
Neumann, G.A., Zuber, M.T., Wieczorek, M.A., McGovern, P.J., Lemoine, F.G., Smith,D.E., 2004. Crustal structure of Mars from gravity and topography. J. Geophys.Res. 109. E08002.
Nimmo, F., Stevenson, D.J., 2000. Influence of early plate tectonics on the thermalevolution and magnetic field of Mars. J. Geophys. Res. 105 (E5), 11969–11979.

Influence of one-ridge convection on crustal thickness 443
Nimmo, F., Tanaka, K.L., 2005. Early crustal evolution of Mars. Annu. Rev. EarthPlanet. Sci. 33, 133–161.
Nimmo, F., Hart, S.D., Korycanksy, D.G., Agnor, C.B., 2008. Implications of an impactorigin for the martian hemispheric dichotomy. Nature 453, 1220–1223.
Ohtani, E., Suzuki, A., Kato, T., 1998. Flotation of olivine and diamond in mantlemelt at high pressure: Implications for fractionation in the deep mantle andultradeep origin of diamond. In: Manghnani, M.H., Yagi, T. (Eds.), Properties ofEarth and Planetary Materials at High Pressure and Temperature. In: Geophysi-cal Monographs, vol. 101. AGU, Washington, pp. 227–239.
O’Neill, C., Lenardic, A., Jellinek, A.M., Kiefer, W.S., 2007. Melt propagation and vol-canism in mantle convection simulations, with application for martian volcanicand atmospheric evolution. J. Geophys. Res. 112. E07003.
Ramberg, H., 1967. Fluid dynamics of layered systems in the field of gravity, a the-oretical basis for certain global structures and isostatic adjustment. Phys. EarthPlanet. Int. 1 (2), 63–87.
Roberts, J.H., Zhong, S., 2006. Degree-1 convection in the martian mantle and theorigin of the hemispheric dichotomy. J. Geophys. Res. 111. E06013.
Sleep, N.H., 1994. Martian plate tectonics. J. Geophys. Res. 99 (E3), 5639–5655.Sohl, F., Spohn, T., 1997. The interior structure of Mars: Implications from SNC me-
teorites. J. Geophys. Res. 102 (E1), 1613–1635.Steinbach, V., Yuen, D.A., 1994. Effects of depth-dependent properties on the ther-
mal anomalies produced in flush instabilities from phase transitions. Phys. EarthPlanet. Int. 86, 165–183.
Tackley, P.J., 1996a. On the ability of phase transitions and viscosity layering to in-duce long wavelength heterogeneity in the mantle. Geophys. Res. Lett. 23 (15),1985–1988.
Tackley, P.J., 1996b. Effects of strongly variable viscosity on three-dimensional com-pressible convection in planetary mantles. J. Geophys. Res. 101 (B2), 3311–3332.
Tackley, P.J., 2008. Modeling compressible mantle convection with large viscositycontrasts in a three-dimensional spherical shell using the Yin–Yang grid. Phys.Earth Planet. Int. 107, 7–18, doi:10.1016/j.pepi.2008.08.005.
Wänke, H., Dreibus, G., 1994. Chemistry and accretion of Mars. Philos. Trans. R. Soc.London (349), 2134–2137.
Watters, T.R., Leuschen, C.J., Plaut, J.J., Picardi, G., Safaeinili, A., Clifford, S.M., Far-rell, W.M., Ivanov, A.B., Phillips, R.J., Stofan, E.R., 2006. MARSIS radar sounderevidence of buried basins in the northern lowlands of Mars. Nature 444, 905–908.
Wilhelms, D.E., Squyres, S.W., 1984. The martian hemispheric dichotomy could bedue to a giant impact. Nature 309, 138–140.
Wise, D.U., Golombek, M.P., McGill, G.E., 1979. Tectonic evolution of Mars. J. Geo-phys. Res. 84, 7934–7939.
Xie, S., Tackley, P.J., 2004. Evolution of U-Pb and Sm–Nd systems in numerical mod-els of mantle convection and plate tectonics. J. Geophys. Res. 109. B11204.
Yoshida, M., Kageyama, A., 2006. Low-degree mantle convection with stronglytemperature- and depth-dependent viscosity in a three-dimensional sphericalshell. J. Geophys. Res. 111, doi:10.1029/2005JB003905. B03412.
Zhong, S., 2009. Migration of Tharsis volcanism on Mars caused by differential rota-tion of the lithosphere. Nat. Geosci. 2, 19–23.
Zhong, S., Zuber, M.T., 2001. Degree-1 mantle convection and the crustal dichotomyon Mars. Earth Planet. Sci. Lett. 189, 75–84.
Zuber, M.T., 2001. The crust and mantle of Mars. Nature 412, 220–227.
Copyright © 2022 FDOKUMEN