Hedge funds strategies -are they consistent
26
C I G E CENTRO DE INVESTIGAÇÃO EM GESTÃO E ECONOMIA UNIVERSIDADE PORTUCALENSE – INFANTE D. HENRIQUE DOCUMENTOS DE TRABALHO WORKING PAPERS n. 10 | 2009 Hedge funds strategies-are they consistent? Mafalda M. Ribeiro Universidade Lusófona do Porto (ULP) Rua Augusto Rosa, 24 4000-098 Porto Portugal e-mail [email protected] C. Machado-Santos Professor of Finance at UTAD and ULP Director of the Research Institute at ULP Nov/2009
-
Upload
independent -
Category
Documents
-
view
4 -
download
0
Transcript of Hedge funds strategies -are they consistent
C I G E
CENTRO DE INVESTIGAÇÃO EM GESTÃO E ECONOMIA
UNIVERSIDADE PORTUCALENSE – INFANTE D. HENRIQUE
DOCUMENTOS DE TRABALHO
WORKING PAPERS
n. 10 | 2009
Hedge funds strategies-are they consistent?
Mafalda M. Ribeiro
Universidade Lusófona do Porto (ULP)
Rua Augusto Rosa, 24
4000-098 Porto
Portugal
e-mail [email protected]
C. Machado-Santos
Professor of Finance at UTAD and ULP
Director of the Research Institute at ULP
Nov/2009
2
“Hedge funds strategies-are they consistent?”
Mafalda M. Ribeiro a & C. Machado-Santos
b
Abstract
Alternative investment has grown considerably, transforming this industry in the
forefront of investment innovation. Despite their public acknowledgment and
profound influence in the financial market, there is still relative small understanding
about hedge funds strategies style.
This paper intends to determine whether stylistic characterization exists across hedge
fund strategies, by comparing, for the period of 1998 to 2008, the performance of the
EDHEC indices with one of the most representative indices of hedge funds, the
CSFB/Tremont index, regarding seven main strategies.
The results do not reject the hypothesis of equal mean monthly returns on every
strategy, comparing the two data sources, showing that there is no significant
differences between the strategies analyzed, suggesting that the purity in each style is
not as developed and accurate as we may suppose.
Keywords: Hedge funds, strategies and style, consistency, purity, bias
a Corresponding author: Universidade Lusófona do Porto (ULP); Rua Augusto Rosa, 24; 4000-098 Porto - Portugal;
e-mail [email protected].
b Professor of Finance at UTAD and ULP. Director of the Research Institute at ULP.
We thank EDHEC RISK for supplying de database and PhD João Duque, PhD Luis Pacheco, Engº Angelina Santos as well as some anonymous referees for insightful comments and suggestions.
3
INTRODUCTION
Over the past 60 years the alternative investment industry has grown considerably,
transforming this industry in the forefront of investment innovation. Despite their
public acknowledgment and despite their profound influence in the financial market,
there is still relative small understanding about hedge funds strategies style.
The first mention of Hedge Fund remounts to 1949, when Alfred Winslow Jones
launched an equity fund called A.W.Jones&Co.1 His main objective was to make small
net profits in all markets using leverage and combining short and long positions.
Today, the term hedge fund includes several investment strategies styles, and is best
defined by their freedom from regulatory controls stipulated by the Investment
Company Act of 1940. Accordingly to the National Securities Markets Improvement Act
of 1996, hedge funds provide exemption from regulatory oversight and investment
restrictions implies restrictions on public advertising and solicitation of investors.
Despite the special media and regulatory attention, the term “Hedge Fund” has yet no
precise legal definition. Nevertheless, the new hedge fund industry shares a series of
common characteristics that distinguishes them from more traditional investment
funds (long only strategies). Although these characteristics should not be considered as
absolute signals, we can identify several of them: hedge funds are actively managed,
have flexible investment policies, use unusual legal structures, offer limited liquidity
most of the times, have limited transparency and target specific investors.
The variety of hedge funds strategies is challenging both to academics as to
practitioners, which lies in understanding and benchmarking managers strategies
whose underlying operations are essentially opaque, whose instruments vary widely
and who in general have historically outperformed the underlying market.
However, in 2008 almost hedge strategies posted their worst losses2. Regarding the
index of funds of hedge funds as an aggregate view of this industry performance, it is
1 See A. Jones(1949)
2 See Hedge Fund Week, as of 17.02.09, based on a report from Edhec Risk and Asset Management
4
the first time since 1997 that this index has posted negative returns. The recent events
marked by the worldwide financial crisis had a significant impact on hedge funds
returns. Can this mean that finally hedge funds have followed strategic style purity,
enabling us to detect style consistency and style deviation?
The purpose of this paper is to determine if stylistic characterization exists across
hedge fund strategies. To do so, we ask two questions: Do the widely variety of hedge
funds strategies follows basic styles? And if so, are pure style indices able to capture a
significant percentage of the behaviour of the time-series of competitive indices?
To address these questions we study the performance of the “index of the existing
indices”, the EDHEC indices3 and compare it with one of the most representative
indices of hedge funds, the CSFB/Tremont index, regarding seven main strategies:
Convertible arbitrage, Emerging markets, Event driven, Fixed income arbitrage, Global
macro, Long/Short Equity and Market neutral, during the period 1998 to 2008.
Our results may suggest that the purity in each studied hedge fund strategic style is
not as developed and accurate as we may at first glance believe.
This paper is structured as follows. The next Section presents a literature review on the
main issues of Hedge Funds, considering different strategies and the difficulties that
arise from the biases in data. Section three describes the data and methodology of our
work. Section four reports the results of our empirical analysis and Section five
concludes.
1. LITERATURE REVIEW
Hedge Funds Strategies and Style
The first issue to address is that hedge funds through time failed to be a homogeneous
group and are now a diversified range of investment strategies with very different risks
and return characteristics. However, trying to understand their common nature and
3 Source: EDHEC RISK
5
the differences between their strategies are crucial for the investors to follow a
coherent investment plan. In order to do so it is necessary to segregate their universe
into a range of standardized investment styles Lhabitant [2006]. According to a survey
launched by the Alternative Investment Management Association in 2003, 47% of the
respondents use already one or more outside classification systems. Among this group,
the source of outside classifications relies in CSFB/Tremont (27%), Hedge Fund
Research (27%) and MSCI (23%), followed by others.
Understanding the universe of hedge funds styles is complex, but for the sake of
simplicity we decided to consider two important indices, the CSFB/Tremont and the
EHDCE Alternative Indices, with historical data performance from 1998 till 2008. We do
not aim to claim that these existing sources of outside classification are better than the
existing others, but those are two indices that consider simultaneously the seven main
strategies regarded in our study.
An extended academic research has been made through time regarding performance
consistency in hedge funds strategies or styles.
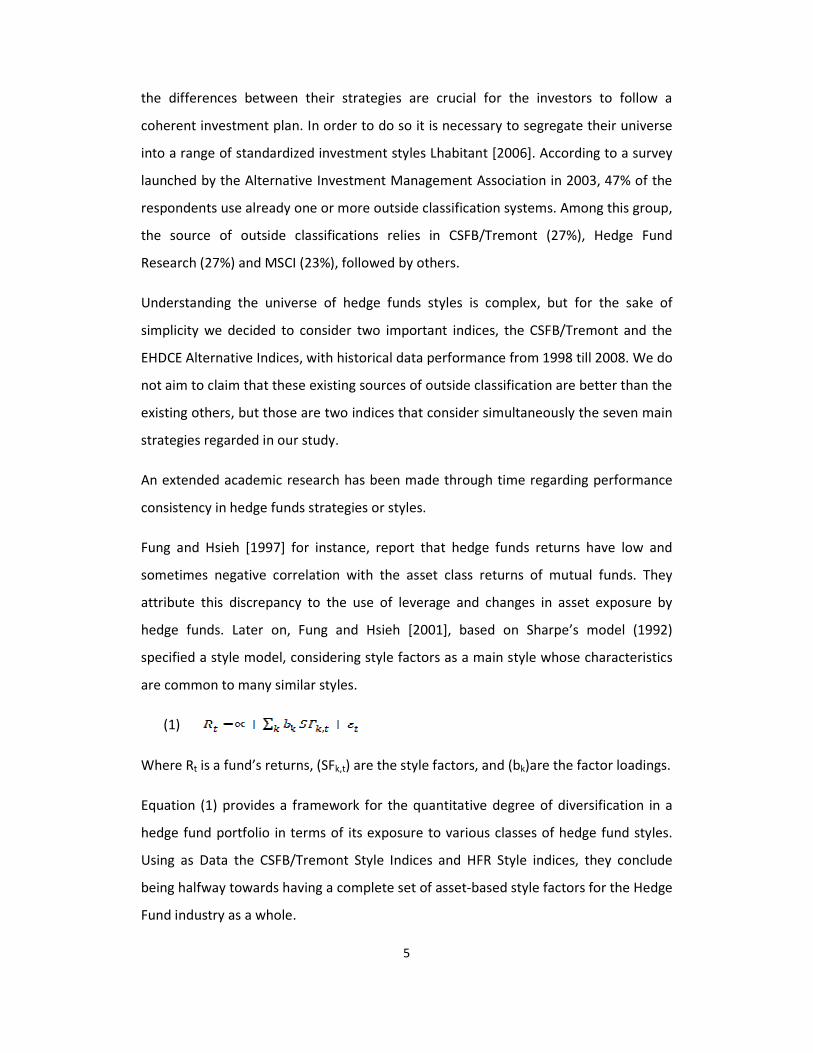
Fung and Hsieh [1997] for instance, report that hedge funds returns have low and
sometimes negative correlation with the asset class returns of mutual funds. They
attribute this discrepancy to the use of leverage and changes in asset exposure by
hedge funds. Later on, Fung and Hsieh [2001], based on Sharpe’s model (1992)
specified a style model, considering style factors as a main style whose characteristics
are common to many similar styles.
(1)
Where Rt is a fund’s returns, (SFk,t) are the style factors, and (bk)are the factor loadings.
Equation (1) provides a framework for the quantitative degree of diversification in a
hedge fund portfolio in terms of its exposure to various classes of hedge fund styles.
Using as Data the CSFB/Tremont Style Indices and HFR Style indices, they conclude
being halfway towards having a complete set of asset-based style factors for the Hedge
Fund industry as a whole.
6
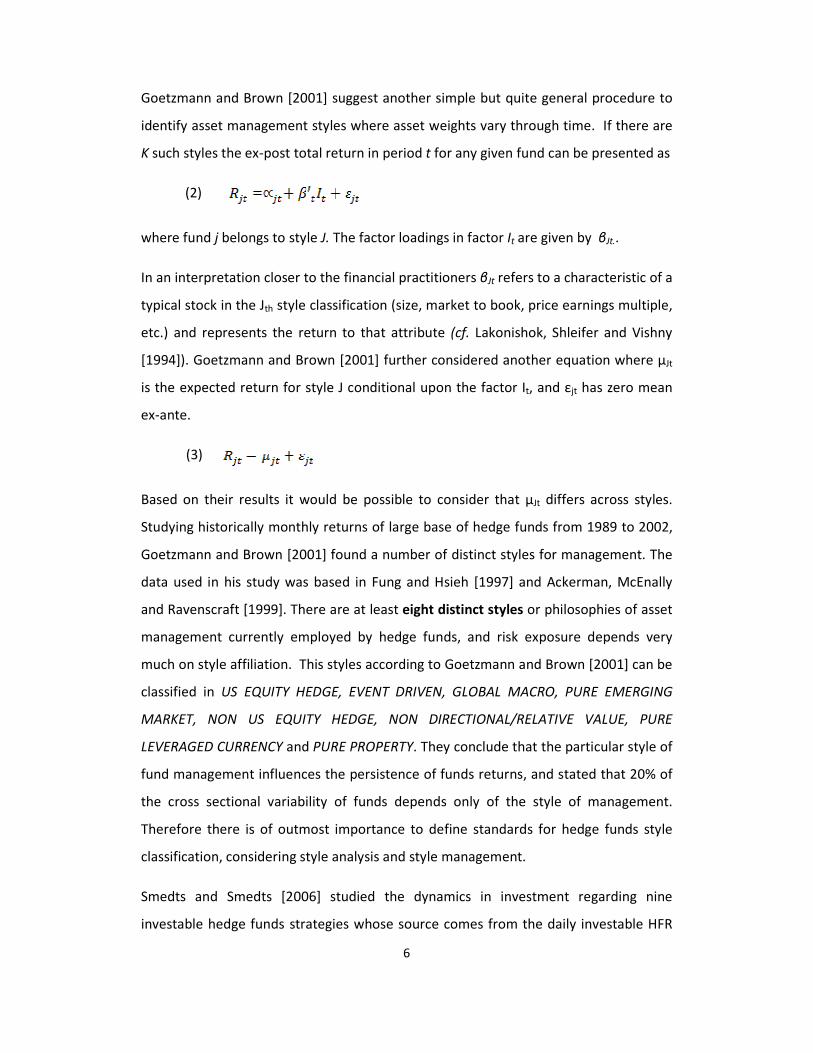
Goetzmann and Brown [2001] suggest another simple but quite general procedure to
identify asset management styles where asset weights vary through time. If there are
K such styles the ex-post total return in period t for any given fund can be presented as
(2)
where fund j belongs to style J. The factor loadings in factor It are given by βJt..
In an interpretation closer to the financial practitioners βJt refers to a characteristic of a
typical stock in the Jth style classification (size, market to book, price earnings multiple,
etc.) and represents the return to that attribute (cf. Lakonishok, Shleifer and Vishny
[1994]). Goetzmann and Brown [2001] further considered another equation where µJt
is the expected return for style J conditional upon the factor It, and εjt has zero mean
ex-ante.
(3)
Based on their results it would be possible to consider that µJt differs across styles.
Studying historically monthly returns of large base of hedge funds from 1989 to 2002,
Goetzmann and Brown [2001] found a number of distinct styles for management. The
data used in his study was based in Fung and Hsieh [1997] and Ackerman, McEnally
and Ravenscraft [1999]. There are at least eight distinct styles or philosophies of asset
management currently employed by hedge funds, and risk exposure depends very
much on style affiliation. This styles according to Goetzmann and Brown [2001] can be
classified in US EQUITY HEDGE, EVENT DRIVEN, GLOBAL MACRO, PURE EMERGING
MARKET, NON US EQUITY HEDGE, NON DIRECTIONAL/RELATIVE VALUE, PURE
LEVERAGED CURRENCY and PURE PROPERTY. They conclude that the particular style of
fund management influences the persistence of funds returns, and stated that 20% of
the cross sectional variability of funds depends only of the style of management.
Therefore there is of outmost importance to define standards for hedge funds style
classification, considering style analysis and style management.
Smedts and Smedts [2006] studied the dynamics in investment regarding nine
investable hedge funds strategies whose source comes from the daily investable HFR
7
indices for eight single strategies: CONVERTIBLE ARBITRAGE, DISTRESS SECURITIES,
EQUITY HEDGE, EQUITY MARKET NEUTRAL, EVENT-DRIVEN, MACRO, MERGER
ARBITRAGE and RELATIVE VALUE ARBITRAGE. Lastly they considered Funds of Funds.
They conclude that hedge funds managers can indeed outperform the market, but this
is only due to one of the main characteristics of hedge funds strategies, that is, their
ability to successfully regard market timing. They consider that market timing is
inherent to the concept of hedge fund industry.
We hope our research, using two sets of transparent, rule-based indices, will help
investor to better understand hedge fund industry.
The Biases in Hedge Funds Databases
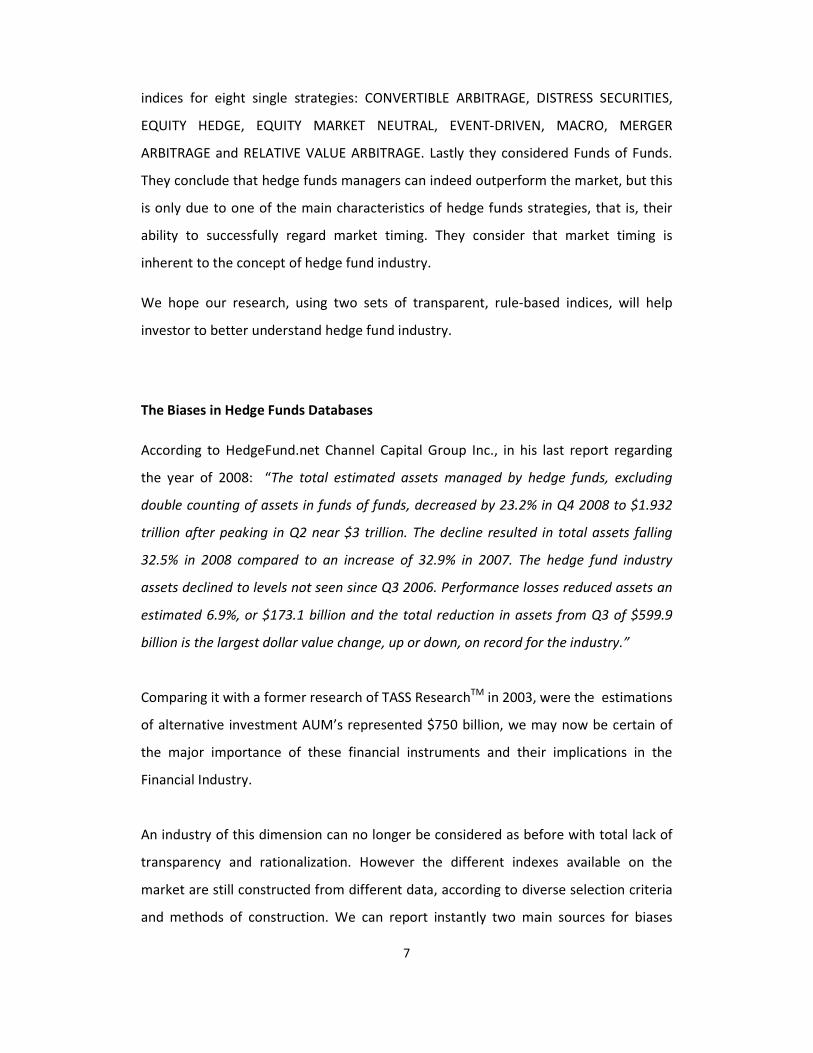
According to HedgeFund.net Channel Capital Group Inc., in his last report regarding
the year of 2008: “The total estimated assets managed by hedge funds, excluding
double counting of assets in funds of funds, decreased by 23.2% in Q4 2008 to $1.932
trillion after peaking in Q2 near $3 trillion. The decline resulted in total assets falling
32.5% in 2008 compared to an increase of 32.9% in 2007. The hedge fund industry
assets declined to levels not seen since Q3 2006. Performance losses reduced assets an
estimated 6.9%, or $173.1 billion and the total reduction in assets from Q3 of $599.9
billion is the largest dollar value change, up or down, on record for the industry.”
Comparing it with a former research of TASS ResearchTM in 2003, were the estimations
of alternative investment AUM’s represented $750 billion, we may now be certain of
the major importance of these financial instruments and their implications in the
Financial Industry.
An industry of this dimension can no longer be considered as before with total lack of
transparency and rationalization. However the different indexes available on the
market are still constructed from different data, according to diverse selection criteria
and methods of construction. We can report instantly two main sources for biases
8
regarding (i): the different way each database is constructed (i.e. net versus total fees,
etc…) and (ii): by the fact that data/prices are supplied by the hedge funds individually
regarded, meaning this a considerably lack of reliability due to lack of transparency. On
the other hand, some Hedge Funds indices demands audit financial statements which
will help in some way to reduce this lack of transparency and the manipulation of
prices.
An objective judgment of the best existing index is difficult to find, therefore, the use
of some combination of competing indexes will allow us to reach a better
understanding of investment style purity.
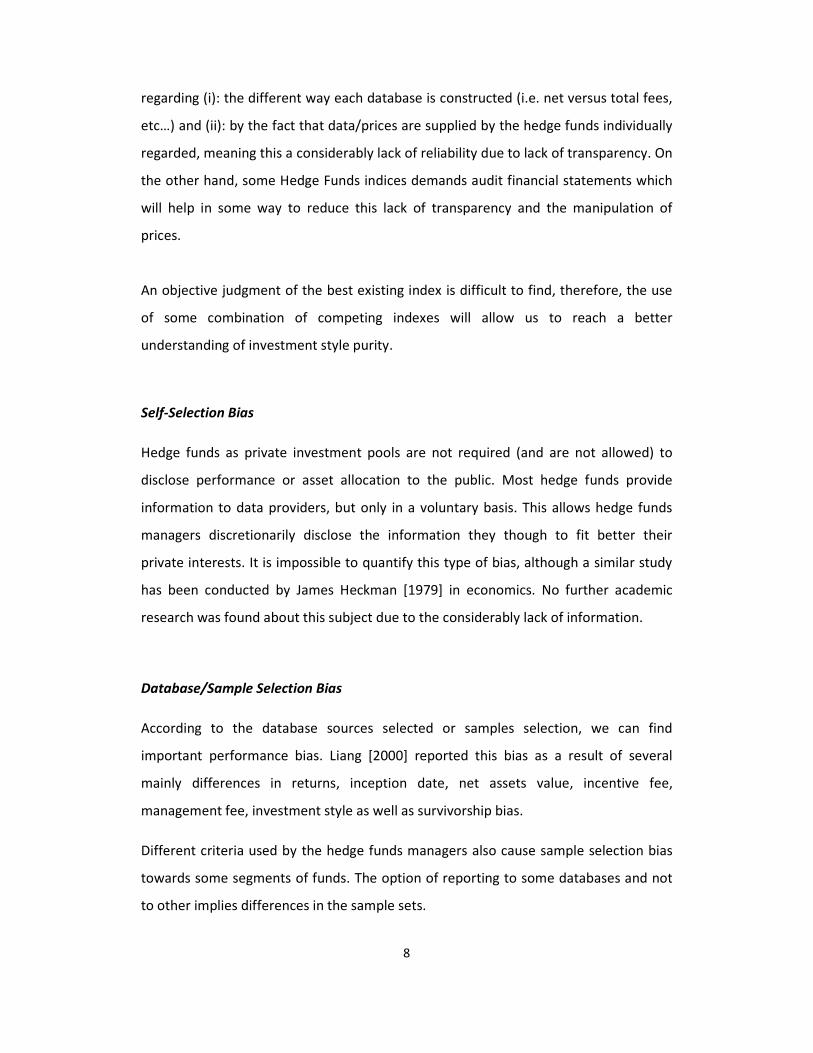
Self-Selection Bias
Hedge funds as private investment pools are not required (and are not allowed) to
disclose performance or asset allocation to the public. Most hedge funds provide
information to data providers, but only in a voluntary basis. This allows hedge funds
managers discretionarily disclose the information they though to fit better their
private interests. It is impossible to quantify this type of bias, although a similar study
has been conducted by James Heckman [1979] in economics. No further academic
research was found about this subject due to the considerably lack of information.
Database/Sample Selection Bias
According to the database sources selected or samples selection, we can find
important performance bias. Liang [2000] reported this bias as a result of several
mainly differences in returns, inception date, net assets value, incentive fee,
management fee, investment style as well as survivorship bias.
Different criteria used by the hedge funds managers also cause sample selection bias
towards some segments of funds. The option of reporting to some databases and not
to other implies differences in the sample sets.
9
Differences in data collection methods between databases are also other important
source of sample selection bias.
Survivorship Bias
Survivorship bias is other common problem when regarding historical data returns. A
simple definition regards the fact that large number of hedge funds has disappeared or
stops reporting information to data vendors during the time sample, and this may
overstated the historical returns while understating historical risk. Therefore it is
important to consider that hedge funds that contribute to the successfully
performance over the past 10 years are not the same through time, and this
constitutes a bias in the sample. Brown et al. [2001] observed that 50% of hedge fund
managers disappear within 30 months, and only 4% have been in business for 10 years.
Gregoriou [2002] based on the Zurich Capital Markets database in the 90’s concluded
that funds tend to fail more in the first year, and that the median life of a hedge fund is
5.5 years.
Other studies have been conducted through time. Malkiel [1995] started a survey on
mutual funds, and concluded that in traditional asset management there is
survivorship bias of 0,5% to 1,5% per annum. Regarding hedge funds there is a large
literature on this subject, the most relevant dated from 1999 till 2003. Ackerman,
McNally and Ravenchaft [1999] studied the HFR and MAR databases, including funds of
funds, from 1989 till 1999, and found a survivorship bias of 0,16% per annum. Later on,
Fung and Hsieh [2000b, 2001], based on TASS data base, from 1994 till 1998, detected
a higher value of 3%. Barry [2003] studied the same database from almost the same
period, (1994-2001) and reported a survivorship bias of only 1,4%. What can explain
those differences? Liang [2000] demonstrates in his study that the differences in
database construction, the inclusion of funds of funds in data and the time differences
in the samples, explain these discrepancies. This attrition rate tends to increase in bull
or bear markets, as is stated by Brown and Goetzmann [1995] and Brown et al. [2001].
They illustrated that this rate is influenced during higher moments of the distribution
of returns and impacts the degree of serial correlation.
10
Backfill or Instant History Bias
Backfill or Instant History Bias happens when a hedge fund allows the managers to
backfill their historical returns, considering that they do not exist in the database since
their inception. Of course the mangers only choose to do so when this is favorable to
their results, which provides bias to the past performance upwards. Barry [2003]
studied the TASS database and observed that 80% of hedge funds backfill at least six
months of data, 65% of all funds backfill at least 12 months and 50% backfill more than
two years.
Academic research, Fung and Hsieh [2000b,2001], Edwards and Caglayan [2001] and
Barry [2003], using several data bases during an average period of 1994 till
2001,suggest an estimate bias of 1,2% to 1,4% per annum, comparing the average
returns since inception data with the average returns since the fund’s reported data.
The CSFB/TREMONT INDEX does not suffer from this bias, since they do not allow data
do be backfill.
Infrequent Pricing and Illiquidity Bias
Most hedge funds due to their strategy hold illiquid securities or securities that are
difficult to price, causing the marking to market of this assets very difficult. Possible
solutions found by the managers are not reliable, since it depends very widely on their
personal opinions. Rahl [2001] discussed the results obtained by a survey of Capital
Market Risk Advisors (CMRA) on NAV/fair value prices and found considerable
differences in valuation result from different prices approaches.
Asness, Krail and Liew [2001] studied the risk-adjustment returns when a manager
tries to smooth his returns, and found that adjusting data rises significantly the
effective risk (market exposure) of the that fund.
11
Other academic studies, conducted by Ackermann et al. [1999] and Fung and Hsieh
[200a, 2000b] suggest that a hedge fund must have an historical period analysis
sufficient large with observations of at least 24 months or 36 months, respectively.
Different Indices, Different Performance Bias
Several academic studies, namely those of Brooks and Kat [2001] and Fung and Hsieh
[2002] provide information about the difficulties in measurement and interpretation of
the results of hedge fund indices. The heterogeneity existing in between all existing
hedge funds indices was first documented by Amenc and Martellini [2001, 2003]. They
found that the average correlation between the indices that focus on the same
strategy/style, are usually at an acceptable level and the low correlations appears on
strategies of pure alpha, such as Fixed Income Arbitrage, Equity Market Neutral,
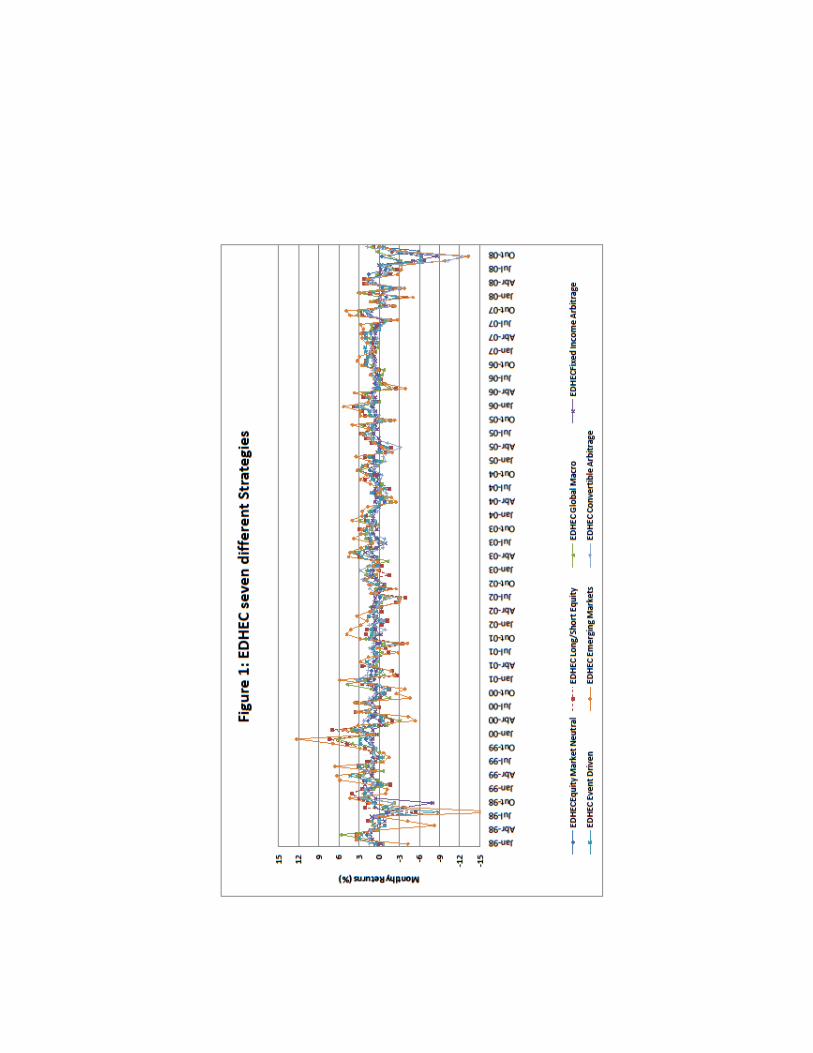
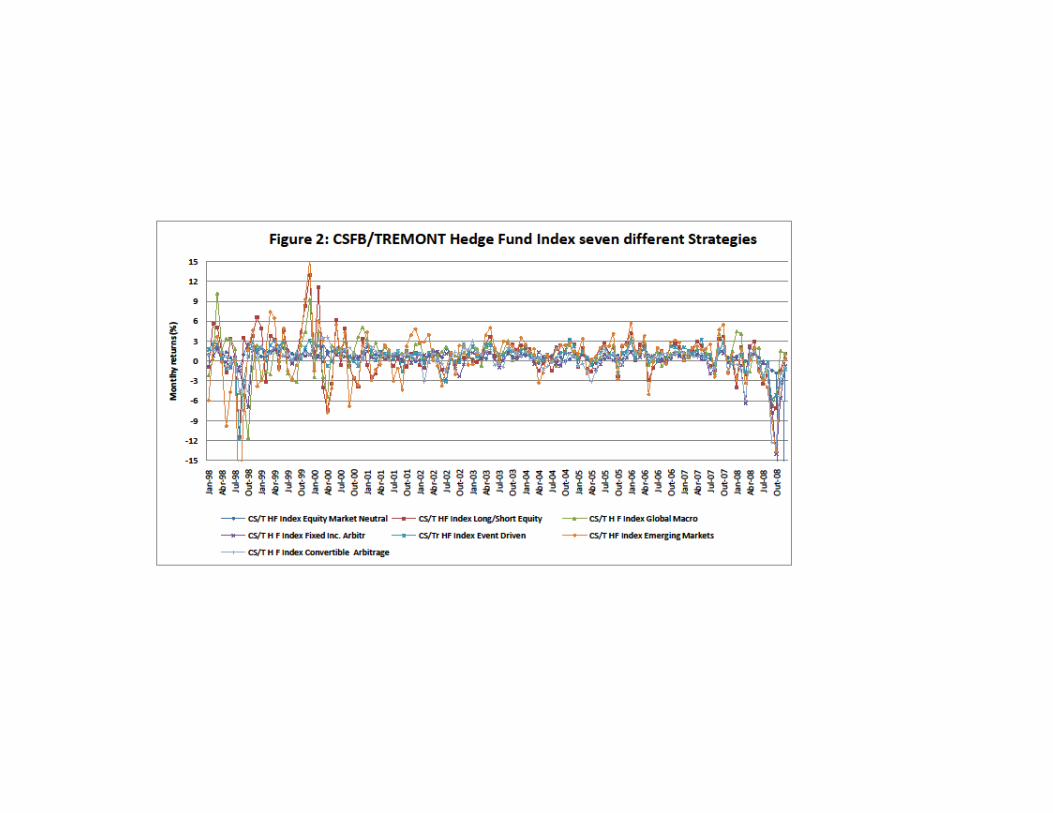
Long/Short Equities and Global Macro. Furthermore, the major inconsistencies seem
to appear in market crisis such as occurred in 1998 till 2000 and August 1997 till
Dec2008. (See ANNEX, Figure 1 and 2)
12
2. DATA AND METHODOLOGY
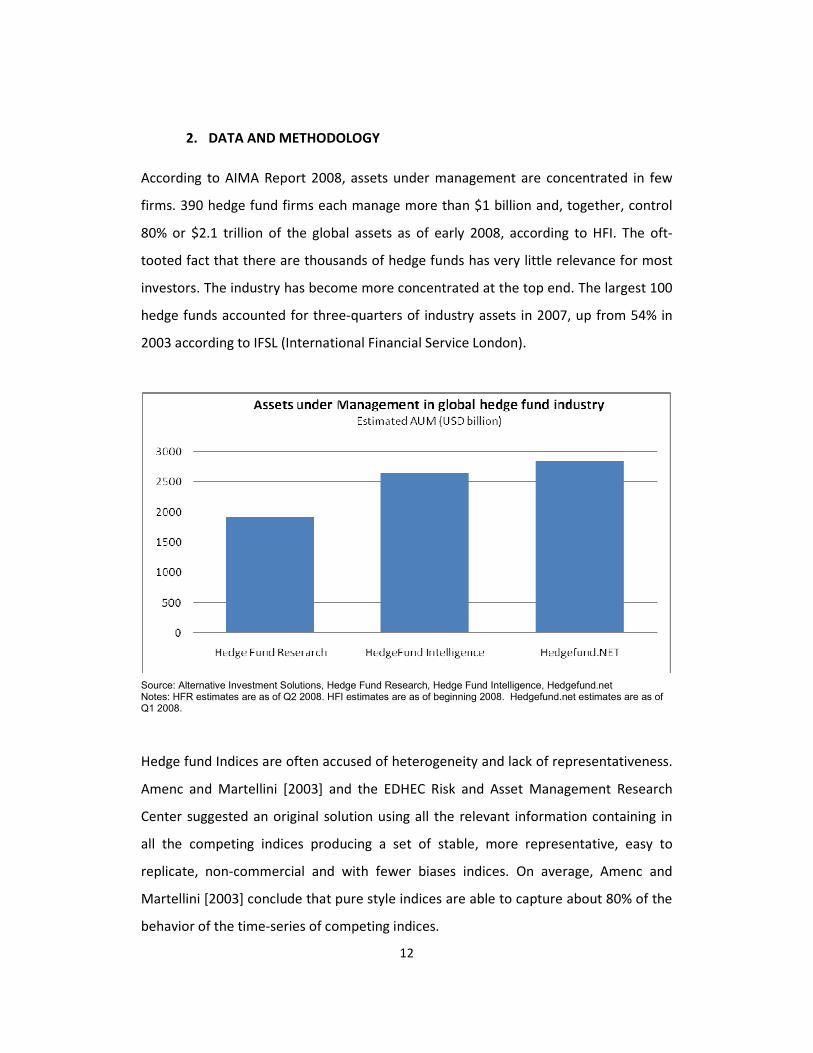
According to AIMA Report 2008, assets under management are concentrated in few
firms. 390 hedge fund firms each manage more than $1 billion and, together, control
80% or $2.1 trillion of the global assets as of early 2008, according to HFI. The oft-
tooted fact that there are thousands of hedge funds has very little relevance for most
investors. The industry has become more concentrated at the top end. The largest 100
hedge funds accounted for three-quarters of industry assets in 2007, up from 54% in
2003 according to IFSL (International Financial Service London).
Source: Alternative Investment Solutions, Hedge Fund Research, Hedge Fund Intelligence, Hedgefund.net Notes: HFR estimates are as of Q2 2008. HFI estimates are as of beginning 2008. Hedgefund.net estimates are as of Q1 2008.
Hedge fund Indices are often accused of heterogeneity and lack of representativeness.
Amenc and Martellini [2003] and the EDHEC Risk and Asset Management Research
Center suggested an original solution using all the relevant information containing in
all the competing indices producing a set of stable, more representative, easy to
replicate, non-commercial and with fewer biases indices. On average, Amenc and
Martellini [2003] conclude that pure style indices are able to capture about 80% of the
behavior of the time-series of competing indices.
13
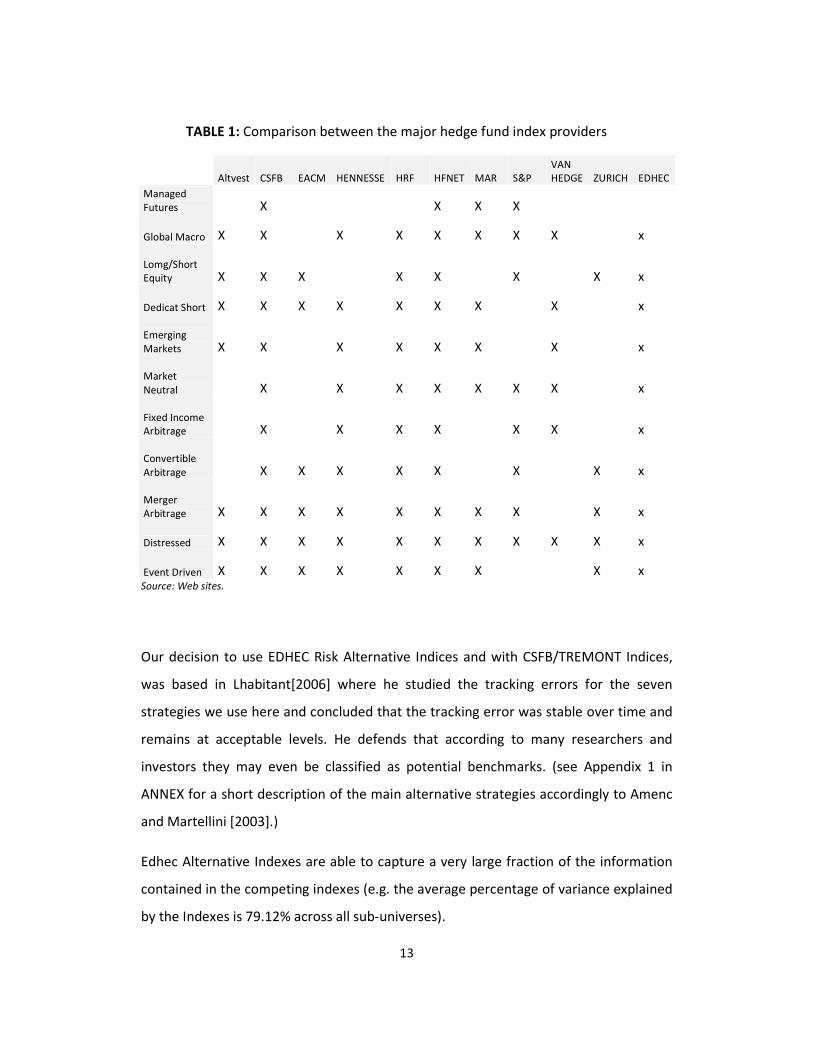
TABLE 1: Comparison between the major hedge fund index providers
Altvest CSFB EACM HENNESSE HRF HFNET MAR S&P VAN HEDGE ZURICH EDHEC
Managed Futures X X X X
Global Macro X X X X X X X X x
Lomg/Short Equity X X X X X X X x
Dedicat Short X X X X X X X X x Emerging Markets X X X X X X X x Market
Neutral X X X X X X X x
Fixed Income Arbitrage X X X X X X x Convertible
Arbitrage X X X X X X X x
Merger Arbitrage X X X X X X X X X x
Distressed X X X X X X X X X X x
Event Driven X X X X X X X X x Source: Web sites.
Our decision to use EDHEC Risk Alternative Indices and with CSFB/TREMONT Indices,
was based in Lhabitant[2006] where he studied the tracking errors for the seven
strategies we use here and concluded that the tracking error was stable over time and
remains at acceptable levels. He defends that according to many researchers and
investors they may even be classified as potential benchmarks. (see Appendix 1 in
ANNEX for a short description of the main alternative strategies accordingly to Amenc
and Martellini [2003].)
Edhec Alternative Indexes are able to capture a very large fraction of the information
contained in the competing indexes (e.g. the average percentage of variance explained
by the Indexes is 79.12% across all sub-universes).

14
On the one hand Edhec Alternative Indexes generated as the first component in a
factor analysis have a built-in element of optimality, since there is no other linear
combination of competing indexes that implies a lower information loss. Since
competing indexes are affected differently by measurement biases, searching for the
linear combination of competing indexes that implies a maximization of the variance
explained, leads implicitly to a minimization of the bias. As a result, Edhec Alternative
Indexes tend to be very stable over time and, as a result, easily replicable.
Credit Suisse/Tremont Hedge Fund Index is compiled by Credit Suisse Tremont Index
LLC. It is an asset-weighted hedge fund index and includes only funds, as opposed to
separate accounts. The Index uses the Credit Suisse/Tremont database, which tracks
over 5000 funds, and consists only of funds with a minimum of US$50 million under
management, a 12-month track record, and audited financial statements. It is
calculated and rebalanced on a monthly basis, and shown net of all performance fees
and expenses. It is the exclusive property of Credit Suisse Tremont Index LLC.
Our main objective is to determine if different hedge funds strategies achieve
statistical significant different media monthly returns through time or if we can not
statistically confirm that. Therefore we use a test T of Student, for comparison of
means of two pair’s samples. We determined the p-value, as the probability associated
with pair upped test T of Student with a distribution bi-variant. Generally, one rejects
the null hypothesis if the p-value is smaller than or equal to the significance level.
We tested the null hypothesis with a significance level of 5%.
Where Δi = Xi-Yi, being Xi and Yi the two values of the pair number i, to compare.
i = 1 to 7, being:

15
1= Equity Market Neutral;2= Long/Short Equities;3= Global Macro;4= Fixed Income
Arbitrage;5= Event Driven; 6= Emerging Markets;7= Convertible Arbitrage
This T test has been applied both in comparison of different strategies and in
comparison of the two different sources of data used. It was not necessary to verify
the assumption of the monthly returns normality because the test used does not
require so when the number of samples is superior to 30, accordingly with the Central
Limit Theorem.
3. EMPIRICAL RESULTS
These results must be taken with precaution, since from August 2007 till December
2008, this period can be classified as an abnormal situation, in sequence of the
subprime crises in USA, as well as the years of 1998 and following, due mainly to the
debt market crisis. (See figures 1 and 2, in Annex).
We are aware that the analysis developed in this paper could be improved in a number
of ways, but our aim is quite simple for now: are hedge funds strategies consistent,
producing different medias monthly returns in our sample, considering the monthly
returns in percentage or not?
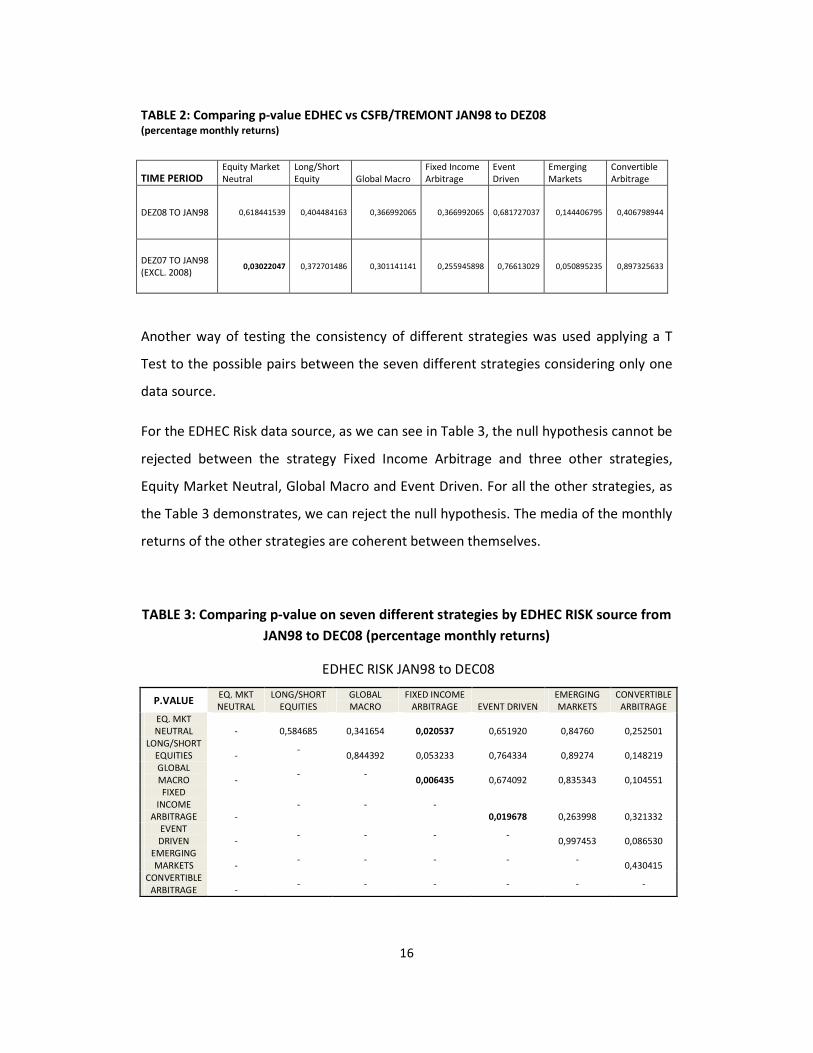
According to Table 2, we may not reject the null hypothesis of equal media monthly
returns on every strategy comparing the two sources of data. From Jan 98 till Dec 08,
the difference is not statistically significant, with a significance level of 0,05.
More information can be detected when regarding the sample and excluding the year
of 2008, where we may reject the null hypothesis for the strategy Equity Market
Neutral.
16
TABLE 2: Comparing p-value EDHEC vs CSFB/TREMONT JAN98 to DEZ08 (percentage monthly returns)
Another way of testing the consistency of different strategies was used applying a T
Test to the possible pairs between the seven different strategies considering only one
data source.
For the EDHEC Risk data source, as we can see in Table 3, the null hypothesis cannot be
rejected between the strategy Fixed Income Arbitrage and three other strategies,
Equity Market Neutral, Global Macro and Event Driven. For all the other strategies, as
the Table 3 demonstrates, we can reject the null hypothesis. The media of the monthly
returns of the other strategies are coherent between themselves.
TABLE 3: Comparing p-value on seven different strategies by EDHEC RISK source from
JAN98 to DEC08 (percentage monthly returns)
EDHEC RISK JAN98 to DEC08
P.VALUE EQ. MKT NEUTRAL
LONG/SHORT EQUITIES
GLOBAL MACRO
FIXED INCOME ARBITRAGE EVENT DRIVEN
EMERGING MARKETS
CONVERTIBLE ARBITRAGE
EQ. MKT NEUTRAL - 0,584685 0,341654 0,020537 0,651920 0,84760 0,252501
LONG/SHORT EQUITIES -
- 0,844392 0,053233 0,764334 0,89274 0,148219
GLOBAL
MACRO - - -
0,006435 0,674092 0,835343 0,104551 FIXED
INCOME ARBITRAGE -
- - - 0,019678 0,263998 0,321332
EVENT
DRIVEN - - - - -
0,997453 0,086530 EMERGING
MARKETS - - - - - -
0,430415
CONVERTIBLE
ARBITRAGE - - - - - - -
TIME PERIOD Equity Market Neutral
Long/Short Equity Global Macro
Fixed Income Arbitrage
Event Driven
Emerging Markets
Convertible Arbitrage
DEZ08 TO JAN98 0,618441539 0,404484163 0,366992065 0,366992065 0,681727037 0,144406795 0,406798944
DEZ07 TO JAN98 (EXCL. 2008)
0,03022047 0,372701486 0,301141141 0,255945898 0,76613029 0,050895235 0,897325633
17
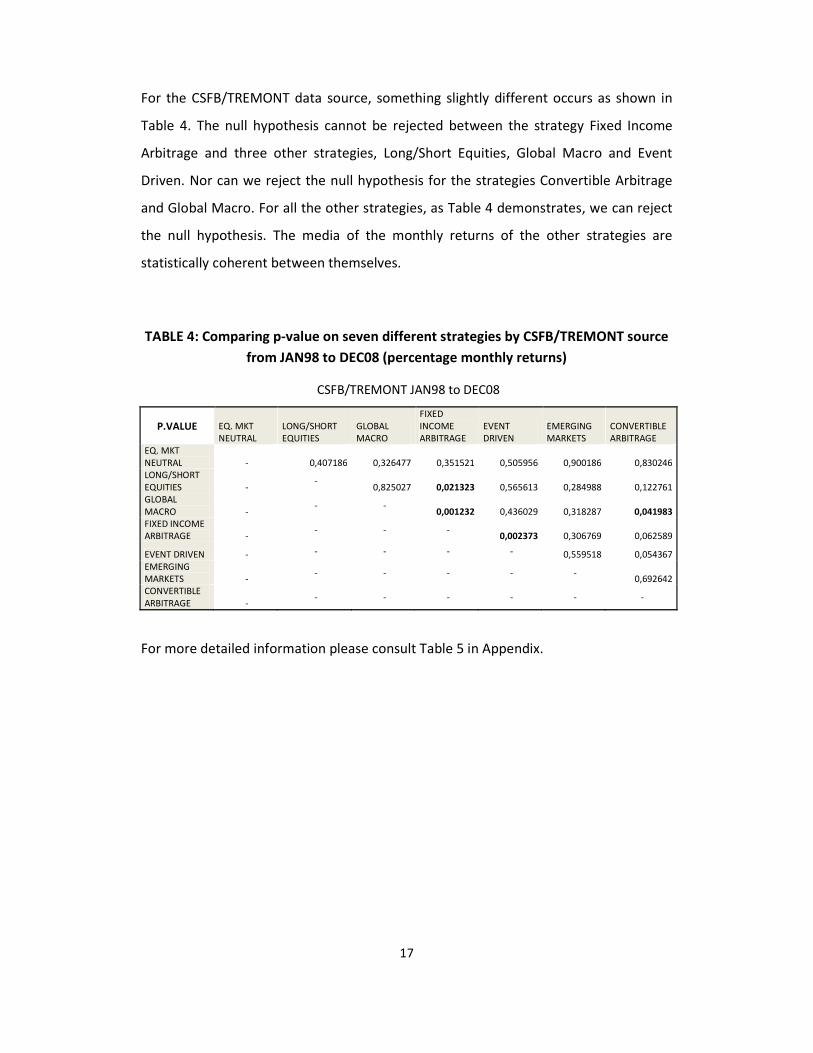
For the CSFB/TREMONT data source, something slightly different occurs as shown in
Table 4. The null hypothesis cannot be rejected between the strategy Fixed Income
Arbitrage and three other strategies, Long/Short Equities, Global Macro and Event
Driven. Nor can we reject the null hypothesis for the strategies Convertible Arbitrage
and Global Macro. For all the other strategies, as Table 4 demonstrates, we can reject
the null hypothesis. The media of the monthly returns of the other strategies are
statistically coherent between themselves.
TABLE 4: Comparing p-value on seven different strategies by CSFB/TREMONT source
from JAN98 to DEC08 (percentage monthly returns)
CSFB/TREMONT JAN98 to DEC08
P.VALUE EQ. MKT NEUTRAL
LONG/SHORT EQUITIES
GLOBAL MACRO
FIXED
INCOME ARBITRAGE
EVENT DRIVEN
EMERGING MARKETS
CONVERTIBLE ARBITRAGE
EQ. MKT
NEUTRAL - 0,407186 0,326477 0,351521 0,505956 0,900186 0,830246 LONG/SHORT
EQUITIES - -
0,825027 0,021323 0,565613 0,284988 0,122761 GLOBAL
MACRO - - -
0,001232 0,436029 0,318287 0,041983
FIXED INCOME ARBITRAGE -
- - - 0,002373 0,306769 0,062589
EVENT DRIVEN - - - - - 0,559518 0,054367
EMERGING MARKETS -
- - - - - 0,692642
CONVERTIBLE
ARBITRAGE - - - - - - -
For more detailed information please consult Table 5 in Appendix.
18
4. CONCLUDING REMARKS
While there has been significant literature regarding new models to predict hedge
fund returns, quite little is known about the different strategies used and their
coherence in the mean monthly returns.
According to our results we may not reject the null hypothesis of equal mean monthly
returns on every strategy comparing the two data sources, EDHEC RISK and
CSFB/TREMONT. From Jan. 1998 till Dec. 2008, our sample period, the differences are
not statistically significant at a significance level of 5%.
We may then conclude that, between 1998 and 2008, we found no statistically
significant differences between the mean monthly returns in the seven strategies
analyzed. These does not means that there are no differences at all. We can see some
differences in volatility, for instance, accordingly to Figure 1 and Figure 2 in Annex, but
these are not the main subject studied in this paper.
Special reference must be made when comparing the two different data sources, or
when we exclude the year of 2008 from our sample period. For these cases we suggest
that some strategies should be studied more deeply, namely, the Fixed Income
Arbitrage strategy, Equity Market Neutral and Event Driven, which, when comparing to
several other strategies, reveal as being able to reject the null hypothesis. However
we must not forget that the year of 2008 was known for special abnormal period in
financial markets, and this of course is the main play field for hedge funds if the
strategies are consistent.
Our conclusion remarks may suggest that the purity in each studied style is not as
developed and accurate as we may at first glance suppose.
19
5. REFERENCES
Ackermann C., McEnally R., and Ravenscraft D (1999), “The performance of hedge funds: risk,
return and incentives”, Journal of Finance, 54 (3), 833-874
The Alternative Investment Management Association Ltd (AIMA), by Drago Indjic and Aasmund Heen, Fauchier Partners Ltd , (2003) “AIMA SURVEY OF HEDGE FUND CLASSIFICATION PRACTICE”, AIMA Journal, September 2003.
Amenc N. and Martellini L., (2001), “The brave new world of hedge funds indexes”, Working
Paper, EDHEC-MISYS Risk and Asset Management Research Center.
Amenc N., Bied, S. and Martellini L., (2002), "Evidence of Predictability in Hedge Fund Returns
and Multi-Style Multi-Class Tactical Asset Allocation Decisions," The Journal of Alternative
Investments, Summer 2002.
Amenc N. and Martellini L., ( 2003), “Desperately Seeking Pure Style indices”, Working Paper,
EDHEC-MISYS Risk and Asset Management Research Center.
Asness C., Krail R. and Liew J.,( 2001), “Do hedge funds hedge?”, Journal of Portfolio
Management, 28 (1), 6-19.
Barry R., (2003), “Hedge funds: a walk through the graveyard”, Working Paper, Ross Barry
Macquarie Applied Finance Centre.
Brooks C. and Kat H., (2001), “The statistical properties of hedge fund index returns and their
implications for investors”, Working Paper, The University of Reading, ISMA Centre.
Brown S. and Goetzmann W., (1995), “Performance Persistence”, Journal of Finance, 50 (3),
679-698.
Brown S., Goetzmann W. and Park J.M., (2001), “Careers and survival: Competition and risk in
the hedge fund and CTA industry”, Journal of Finance, 53 (5), 1869-1886.
Brown S., Goetzmann W. (2003), “Hedge funds with style”, Journal of Portfolio Management, V29 (2, Winter), 101-112.
Edwards F. and Caglayan M.,(2001), “Hedge fund performance and managerial skill”, Journal of
Futures Markets, Volume 21, Issue 11, 1003-1028.
Fung W. and Hsieh D., (1997), “Survivorship bias and investment style in the returns of CTAs”,
Working Paper, Duke University
Fung W. and Hsieh D., 2000a, “Measuring the market impact of hedge funds”, Journal of
Empirical Finance, 7 (1), 1-36.
Fung W. and Hsieh D., 2000b, “Performance characteristics of hedge funds and commodity funds: natural versus spurious biases”, Journal of Financial and Quantitative Analysis, 35, 291-
307.
Fung W. and Hsieh D., (2001), “The risk in hedge funds strategies: theory and evidence from
trend followers”, Review of Financial Studies, 14 (2), 313-341.
20
Fung W. and Hsieh D., (2002), “Benchmarks of hedge fund performance: information content
and measurements bias”, Working Paper
Gregoriou G., (2002), “Hedge fund survival lifetimes”, Journal of Asset Management, 3 (3), 237-252.
Heckman, J. (1979) “Sample selection bias as a specification error”, Econometrica, 47, 153–61.
Lakonishok J., Shleifer A. and Vishny R., (1994), “Contrarian investment, extrapolation and
risk”, Journal of Finance, 49, 1541-1578.
Lhabitant F., (2006), “Handbook of hedge funds”, John Wiley & Sons, Ltd.
Liang B., (2000)”Hedge funds: the living and the dead”, Journal of Financial and Quantitative
Analysis, 35, 309-336.
Malkiel B., (1995), “Returns from investing in equity mutual funds 1971 to 1991”, Journal of
Finance, 50 (2), 549-72.
Rahl L., (2001), “NAV/Fair value practices survey results”, Journal of Alternative Investments, Winter, 55-58.
Sharpe W., (1992), “Asset allocation: management style and performance measurement”,
Journal of Portfolio Management, 18 (2), 7-19.
Smedts K. and Smedts J., (2006), “Dynamic Investment Strategies of Hedge Funds”, FETEW
Research Report AFI_0622, pp. 1-27. Leuven: K.U.Leuven.
Lipper TASS Asset Flows Report

21
ANNEX
TABLE 5: Comparing p-value on seven different strategies by CSFB/TREMONT source
from JAN93 to JAN09 (percentage monthly returns)
CSFB/TREMONT JAN09 to JAN93
P.VALUE EQ. MKT
NEUTRAL
LONG/SHORT
EQUITIES
GLOBAL
MACRO
FIXED
INCOME
ARBITRAGE
EVENT
DRIVEN
EMERGING
MARKETS
CONVERTIBLE
ARBITRAGE EQ. MKT
NEUTRAL - 0,32606044 0,105913456 0,329350072 0,274249845 0,759632908 0,899339163 LONG/SHORT EQUITIES -
- 0,331920823 0,014799197 0,84129996 0,513185704 0,120127488
GLOBAL MACRO -
- - 0,000511013 0,22258487 0,205420243 0,014238528
FIXED
INCOME ARBITRAGE -
- - - 0,000147736 0,273916251 0,047903262
EVENT DRIVEN -
- - - - 0,600173444 0,014759256
EMERGING
MARKETS - - - - - -
0,625940052 CONVERTIBLE
ARBITRAGE - - - - - - -
Appendix 1
Information on hedge fund strategies accordingly with Martellini, Bied and Amenc
[2002]
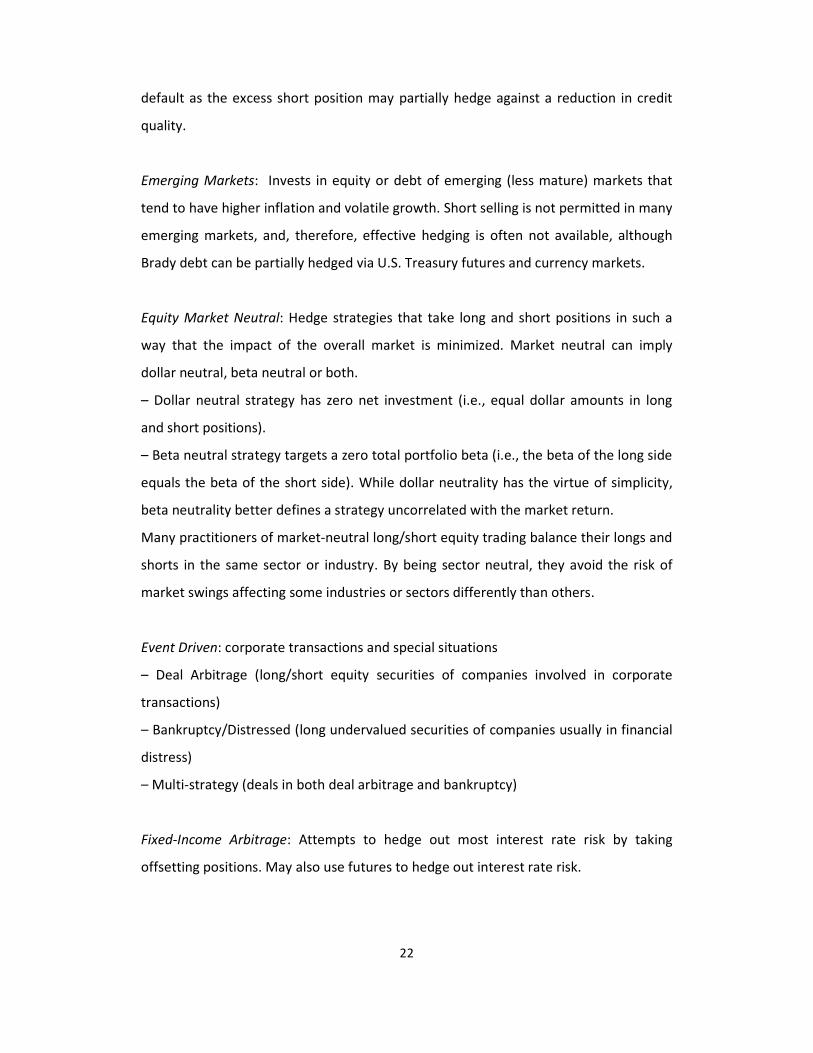
Convertible Arbitrage: Attempts to exploit anomalies in prices of corporate securities
that are convertible into common stocks (convertible bonds, warrants, convertible
preferred stocks). Convertible bonds tend to be under-priced because of market
segmentation; investors discount securities that are likely to change types: if issuer
does well, convertible bond behaves like a stock; if issuer does poorly, convertible
bond behaves like distressed debt. Managers typically buy (or sometimes sell) these
securities and then hedge part of or all of associated risks by shorting the stock. Delta
neutrality is often targeted. Over-hedging is appropriate when there is concern about
22
default as the excess short position may partially hedge against a reduction in credit
quality.
Emerging Markets: Invests in equity or debt of emerging (less mature) markets that
tend to have higher inflation and volatile growth. Short selling is not permitted in many
emerging markets, and, therefore, effective hedging is often not available, although
Brady debt can be partially hedged via U.S. Treasury futures and currency markets.
Equity Market Neutral: Hedge strategies that take long and short positions in such a
way that the impact of the overall market is minimized. Market neutral can imply
dollar neutral, beta neutral or both.
– Dollar neutral strategy has zero net investment (i.e., equal dollar amounts in long
and short positions).
– Beta neutral strategy targets a zero total portfolio beta (i.e., the beta of the long side
equals the beta of the short side). While dollar neutrality has the virtue of simplicity,
beta neutrality better defines a strategy uncorrelated with the market return.
Many practitioners of market-neutral long/short equity trading balance their longs and
shorts in the same sector or industry. By being sector neutral, they avoid the risk of
market swings affecting some industries or sectors differently than others.
Event Driven: corporate transactions and special situations
– Deal Arbitrage (long/short equity securities of companies involved in corporate
transactions)
– Bankruptcy/Distressed (long undervalued securities of companies usually in financial
distress)
– Multi-strategy (deals in both deal arbitrage and bankruptcy)
Fixed-Income Arbitrage: Attempts to hedge out most interest rate risk by taking
offsetting positions. May also use futures to hedge out interest rate risk.
23
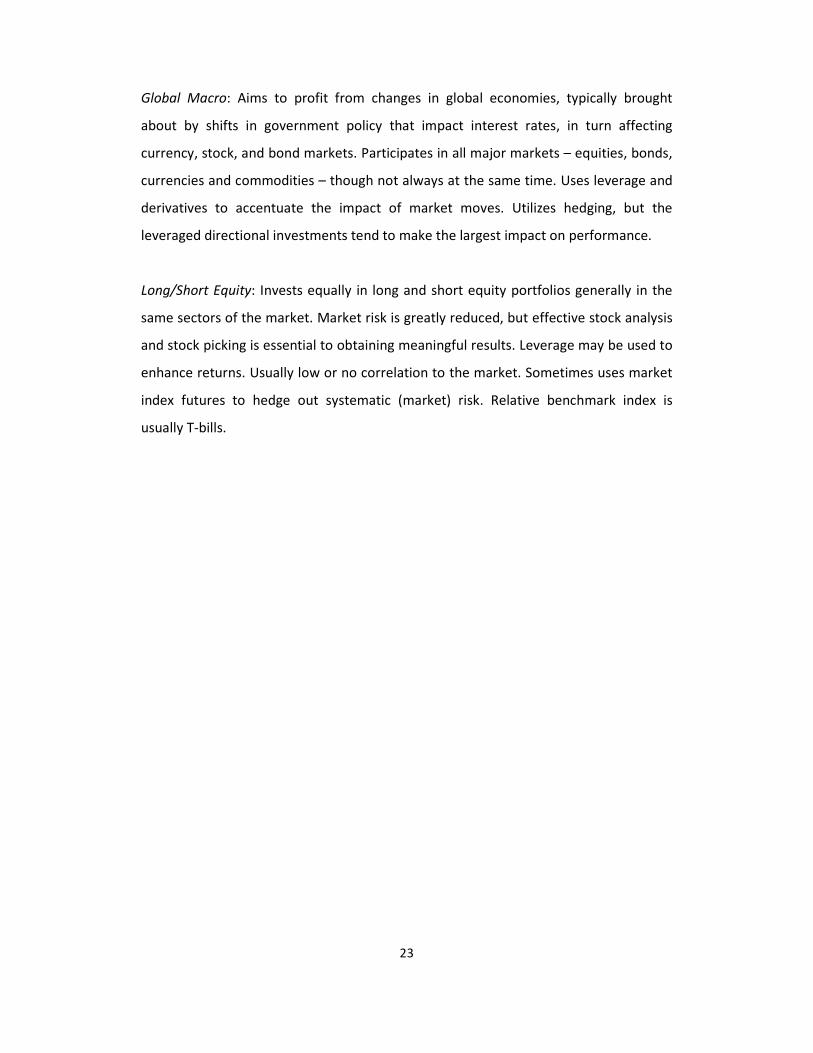
Global Macro: Aims to profit from changes in global economies, typically brought
about by shifts in government policy that impact interest rates, in turn affecting
currency, stock, and bond markets. Participates in all major markets – equities, bonds,
currencies and commodities – though not always at the same time. Uses leverage and
derivatives to accentuate the impact of market moves. Utilizes hedging, but the
leveraged directional investments tend to make the largest impact on performance.
Long/Short Equity: Invests equally in long and short equity portfolios generally in the
same sectors of the market. Market risk is greatly reduced, but effective stock analysis
and stock picking is essential to obtaining meaningful results. Leverage may be used to
enhance returns. Usually low or no correlation to the market. Sometimes uses market
index futures to hedge out systematic (market) risk. Relative benchmark index is
usually T-bills.

CIGE – Centro de Investigação em Gestão e Economia
Universidade Portucalense – Infante D. Henrique
Rua Dr. António Bernardino de Almeida, 541/619
4200-072 PORTO
PORTUGAL
http://www.upt.pt
ISSN 1646-8953