SACOMAR Technologies for Safe and Controlled Martian Entry
40
SACOMAR Technologies for Safe and Controlled Martian Entry SPA.2010.3.2-04 EU-Russia Cooperation for Strengthening Space Foundations (SICA) Re-entry Technologies and Tools Theme 9 - Space Activity 9.3 - Cross-Cutting-Activities Area 9.3.2 - International Cooperation Deliverable Reference Number: D5.4 Deliverable Title: Report: Results of experimental study in the IPG-4 facility Project Management Due date of deliverable: 30 th September 2011 Actual submission date: 28 th November 2011 Start date of project: 20 th January 2011 Duration: 18 months Organisation name of lead contractor for this deliverable: IPM Revision 1: Final report Project co-funded by the European Commission within the Seventh Framework Programme Dissemination Level PU Public X PP Restricted to other programme participants (including the Commission Services) RE Restricted to a group specified by the consortium (including the Commission Services) CO Confidential, only for members of the consortium (including the Commission Services)
-
Upload
khangminh22 -
Category
Documents
-
view
0 -
download
0
Transcript of SACOMAR Technologies for Safe and Controlled Martian Entry

SACOMAR
Technologies for Safe and Controlled Martian Entry
SPA.2010.3.2-04
EU-Russia Cooperation for Strengthening Space Foundations (SICA)
Re-entry Technologies and Tools
Theme 9 - Space Activity 9.3 - Cross-Cutting-Activities Area 9.3.2 - International Cooperation
Deliverable Reference Number: D5.4 Deliverable Title: Report: Results of experimental study in the IPG-4 facility
Project Management
Due date of deliverable: 30th September 2011
Actual submission date: 28th November 2011
Start date of project: 20th January 2011
Duration: 18 months
Organisation name of lead contractor for this deliverable: IPM
Revision 1: Final report
Project co-funded by the European Commission within the Seventh Framework Programme
Dissemination Level
PU Public X
PP Restricted to other programme participants (including the Commission Services)
RE Restricted to a group specified by the consortium (including the Commission Services)
CO Confidential, only for members of the consortium (including the Commission Services)
APPROVAL
Title
Results of experimental study in the IPG-4 facility
issue
2
revision
1
Author(s)
A. Kolesnikov, A. Gordeev, S. Vasil’evskii
30-09-2011
Approved by
Deputy Director of IPM S. Surzhikov
Date
28-11-2011
SACOMAR Deliverable No. D5.4 Results of experimental study in the IPG-4 facility - i
Table of Contents
1 Executive summary 1
1.1 Scope of the deliverable 1
1.2 Results 1
1.3 Specific highlights 2
1.4 Forms of integration within the work package and with other WPs 2
1.5 Problem areas 2
2 Introduction 2
3 The Plasmatron IPG-4 4
4 Test model and heat flux probes 9
5 Test matrix 10
6 Measurements of stagnation point heat flux 10
7 Measurements of dynamic and stagnation pressures 14
8 Determination of flow enthalpy 15
8.1 Issues of enthalpy measurement in CO2 plasma flows 15
8.2 Rebuilding the flow enthalpy and reference flow velocity in subsonic CO2 free stream 16
9 Nonequilibrium boundary layer equations with account for finite layer thickness and surface catalycity 17
9.1 Governing equations 17
9.2 Assumptions on the heterogeneous processes 18
9.3 Dimensionless governing equations 19
9.4 Input data for the boundary layer equations solution 21
9.5 Numerical solution technique 21
10 Selection of the test regimes 22
11 Heat flux measurements to surfaces of different materials at selected test regimes 25
12 Emission spectroscopy of CO2 + N2 subsonic flow field 27
13 Calculation of the surface temperature of the quartz probe 30
14 Conclusions 33
15 References 33

SACOMAR Deliverable No. D5.4 Results of experimental study in the IPG-4 facility - ii
List of figures
Figure 1: Appearance of the IPG-4 plasmatron. 4
Figure 2: Schematic diagram of the IPG-4 plasmatron. 5
Figure 3: Schematic diagram of test chamber and ICP torch of the IPG-4 plasmatron. 6
Figure 4: Inductor chamber and top interface of ICP torch. 7
Figure 5: Quartz discharge channel and inductor of the IPG-4 plasmatron. 7
Figure 6: Inductively coupled CO2 plasma flow stabilized by swirling. 8
Figure 7: Subsonic flow of CO2 plasma around the thermal protection tile. 8
Figure 8: Test model with heat flux probe. 9
Figure 9: Water-flow heat flux probe made of stainless steel. 10
Figure 10: Heat flux to different surfaces vs anode power of RF-generator. 11
Figure 11: Stationary water-cooled calorimeter with massive silver surface,
a – before experiment, b – after oxidizing in CO2 plasma flow. 12
Figure 12: Time history of silver surface oxidation in CO2 plasma flow. 12
Figure 13: Heat flux to water-cooled silver surface vs Nap at Ptc=76 hPa. 13
Figure 14: Heat flux to water-cooled silver surface vs distance from exit section of nozzle
to heat flux probe at Ptc=36 hPa. 13
Figure 15: Dynamic pressure vs distance Z to Pitot probe at Ptc = 36 hPa. 14
Figure 16: Dynamic pressure vs anode power at Ptc = 76 hPa. 15
Figure 17: Schematic of subsonic flow over the model and boundary layer 17
Figure 18: Enthalpy at the edge of boundary layer vs anode power at Pitot pressure 80 hPa,
Z = 40 mm 23
Figure 19: Enthalpy along jet axis at Pitot pressure 40 hPa and anode power 35 MJ/kg. 24
Figure 20: Heat fluxes to silver, copper, stainless steel and quartz surfaces for the
two regimes Nap=40.4 and 34 kW (squares), and heat flux to silver surface
used for selection of the test regimes (red circles); P = 80 hPa. 26
Figure 21: Heat fluxes to silver, copper, stainless steel and quartz surfaces for Nap = 35 kW
for the two distances Z=72 and 122 mm (squares), and heat flux to silver surface
used for selection of the test regimes (red circles); P = 40 hPa. 27
Figure 22: Optical scheme for boundary layer spectra recording. 28
Figure 23: Raw spectra of air plasma subsonic jet and boundary layer in wavelength band
300-360 nm. 29
Figure 24: Spectra of 97%CO2+3%N2 plasma jet and boundary layer in wavelength band
340-580 nm. 29
Figure 25: Comparison of the final approximation (black curve) for fused quartz
thermal conductivity with different experimental data. 32

SACOMAR Deliverable No. D5.4 Results of experimental study in the IPG-4 facility - iii
List of tables
Table 1: IPG-4 technical parameters. 6
Table 2: Test matrix. 10
Table 3: Parameters of test performance at Pitot pressure 80 hPa. 22
Table 4: Parameters of test performance at Pitot pressure 40 hPa. 22
Table 5: Selected subsonic test regimes. 25
Table 6: Specified and actual enthalpies and stagnation pressures for selected test regimes. 25
Table 7: Calculated temperature of the quartz probe external surface. 31
Nomenclature Ci - Mass fraction of the i-th species
Dm [m] Diameter of testing model
G [g/s] Mass flow rate of working gas in plasmatron
h [MJ/kg] Enthalpy
M - Mach number
m [kg/mol] Molar mass of gas mixture
Nap [kW] Anode power of RF-generator
Npl [kW] Power input in plasma
p [Pa] Pressure
Pdyn [Pa] Velocity head (or dynamic pressure) at the flow axis
Ptc [Pa] Pressure in test chamber
qw [W/cm2] Stagnation point heat flux
qws [W/cm2] Stagnation point heat flux measured to standard high catalytic material
Rg [J/mol/K] Universal gas constant
Rm [m] Radius of testing model
Re - Reynolds number
T [K] Temperature
Vx, Vy [m/s] Velocity components
Vs [m/s] Reference velocity
x, y [m] Coordinates along the model surface and normal to the model surface
Z [m] Distance from discharge channel exit to the model
w - Catalytic efficiency of surface recombination reactions
[kg/m3] Density
Subscripts 0 Stagnation condition
Free stream
Pitot Pitot measurement
e External edge of boundary layer
w Surface of testing model

SACOMAR Deliverable No. D5.4 Results of experimental study in the IPG-4 facility - iv
Acronyms
CFD Computational Fluid Dynamics
DLR German Aerospace Centre
IPG-4 RF-plasmatron of IPM, Moscow
IPM Institute for Problems in Mechanics
WP Work Package
RF Radio-frequency
TPM Thermal protection material
ICP Inductively coupled plasma

SACOMAR Deliverable No. D5.4 Results of experimental study in the IPG-4 facility - Page 1 of 34
1 Executive summary
1.1 Scope of the deliverable
Manufacturing of the test model for experiments in IPG-4
Measurement of the free stream and boundary layer spectra with emission spectroscopy
Measurement of enthalpy in plasma free stream
Measurement of the heat flux rate to the model and to the reference probe with silver coating (fully catalytic) and quartz coating (non-catalytic surface)
1.2 Results
A. A 50-mm-diam water-cooled test model from copper and brass, and water-flow heat flux probe from stainless steel are manufactured in the Laboratory for Plasma/Surface Interaction.
B. Subsonic heat transfer tests with pure CO2 plasma have been performed in the wide range of enthalpy (4 – 17 MJ/kg), stagnation pressure (80 and 40 hPa) and gas flow rate (2.0 – 2.8 g/s).
C. The special water-cooled cylindrical nozzle was used, and generator power, pressure in test chamber, and distance from model surface to the nozzle were altered in order to meet requirements of the test plan. The four tests regimes were selected and realized according the test plan at the specified enthalpy and stagnation pressure.
D. Measurements of the heat flux rates to the model with the reference probe with silver surface at selected generator power and stagnation pressures have been performed. Evidence of silver surface oxidation was observed. The time history of the stagnation point heat flux to the silver wall was registered. The saturation time for reaching maximum heat flux is found to be about 20 min.
E. Indirect numerical rebuilding by GAMMA CFD code of the flow enthalpy through calculated heat flux rates to cooled fully catalytic wall and comparison with the data of stagnation point heat fluxes to oxidized stable silver surface of the reference probe was carried out.
F. Measurements of the stagnation heat flux to Ag, Cu, stainless steel and quartz at the pressure 80 hPa as functions of the generator power have been performed. Significant heating effect of surface catalycity in dissociated carbon dioxide was demonstrated.
G. Measurements of the stagnation heat flux to silver, copper, stainless steel and quartz surfaces at the pressures 80hPa and 40hPa have been performed in all the four selected regimes. In all the subsonic CO2 + N2 flow regimes the materials are arranged in the order Ag Cu stainless steel SiO2 in terms of stagnation point heat fluxes.
H. Registration of the emission spectra in subsonic free streams and boundary layers was carried out in 97%CO2+3%N2 mixture and air. It is found that in air spectra of boundary layer the intensities of some spectral bands increase in 2 – 3 times, but in CO2+N2 intensities of all molecular bands decrease monotonously from free stream to model surface.

SACOMAR Deliverable No. D5.4 Results of experimental study in the IPG-4 facility - Page 2 of 34
I. For the all specified four test regimes the temperatures of the external surface of the quartz probe are determined through numerical solution of 1D nonlinear differential equation. Quartz surface temperature can not be considered as constant varies in the range 500 – 755 K.
1.3 Specific highlights
The special attention must be paid to heat flux probe with silver coating. Different effect of oxidation on stable heat transfer to silver surface was indicated depending on initial condition of the surface (preliminary oxidized or cleaned).
1.4 Forms of integration within the work package and with other WPs
The D5.4 provides heat flux data for the D6.4, D7.11 and D7.12.
1.5 Problem areas
Selection of the reference heat flux probe with stable high catalytic surface still remains an important issue. Perhaps strongly enough oxidized silver surface could be solution.
2 Introduction
The objective of the Task 5.4 are characterization of subsonic CO2 (97%)+ N2 (3%) plasma flow fields in IPG-4 facility and stagnation point heat transfer to cooled walls made of different materials at specified test conditions. The long run plasmatron IPG-4 is in operation in the Laboratory for Plasma/Surface Interaction (IPM RAS). This facility is intended for the experimental simulation of the re-entry radiative & convective heating, testing ablative and reusable thermal protection materials (TPM), and study of surface catalysis in terms of catalytic heating due to recombination of atoms. Subsonic and supersonic regimes of operating with different gases supported by independent smooth regulation of the operating pressure and power make the plasmatron quite flexible and powerful tool for simulation of plasma/surface interaction in the wide range of aerospace applications. The design decisions (optical windows, mechanical, water and gas interfaces, vacuum system) make the maintenance of the facility and experimental works to be quite efficient. The task 5.4 is important and very timing due to the following. At the present time several Mars exploration missions are under development. EXOMARS Program is considering aerocapture scheme for mission to Mars. For aerocapture entry, the selection of an appropriate TPS material, as well as the required mass of the TPS, is determined by the aerothermal environment encountered by the vehicle during the entry. This aerothermal environment depends on the vehicle geometry and trajectory. CFD aeroheating prediction for Mars entry is necessary for design and construction of TPS. In many papers aerothermodynamics of Mars entry has been investigated using different CFD codes [1-3]. Aeroheating predictions made from this CFD analysis depend on the physical, chemical and numerical models employed. The inevitable uncertainty in these predictions is due to uncertainties of input parameters, such as gas-phase reaction rates, relaxation times, transport properties, and wall catalycity [4].
In order to reduce the uncertainty limits the ground-tests using appropriate high-enthalpy facilities are necessary. It is well known that it is impossible to duplicate all aerothermal factors for all flow regimes, but we should use all capabilities available in terms of aerothermal testing of TPM samples and local simulation of aeroheating especially in stagnation point configuration. Though flow field environment in any facility introduces additional uncertainties, for example in free stream.
Among the physical phenomena that play a critical role in the laminar heating rates in the absence of shock-layer radiation, laminar-turbulent transition and TPM ablation, the surface catalysis contributes a large portion of the heat flux especially in the moderately catalytic regime [4]. The catalytic reaction rates should be rebuild together with high-enthalpy flow parameters using indirect approach through comparison of the measured and calculated stagnation point heat flux rates. In fact in this approach we have deal with test-to-code validation at test condition relevant to the flight regime in terms of total enthalpy and stagnation pressure. The main goal of the Project is to obtain comparable data of surface catalycity at different facilities at the same enthalpy and stagnation

SACOMAR Deliverable No. D5.4 Results of experimental study in the IPG-4 facility - Page 3 of 34
pressure. However, the stagnation point heat flux rates could be different due to different velocity gradients due to different geometry of the flow fields.
In the Task 5.4 the experiments and subsonic free stream parameters rebuilding are performed using the inductively heated plasmatron IPG-4 in CO2 and CO2+N2 high-enthalpy environment at four test conditions specified in terms of total enthalpy and Pitot pressure. Task 5.4 includes the items as follows:
Manufacturing of the water-cooled test model
Measurement of the heat flux rate to the model and to the reference probe with silver coating (fully catalytic) and quartz coating (non-catalytic surface)
Measurement of the stagnation pressure at the model location in the free stream
Measurement of enthalpy in plasma free stream
Measurement of the free stream and boundary layer spectra with emission spectroscopy
The tests have been performed using newly manufactured water cooled 50-mm diameter test model with rounded edges (so called euromodel). The stagnation point heat fluxes were measured using four different calorimeters made of quartz (the pure catalyst), stainless steel, copper and silver (the best catalyst). Stagnation and dynamic pressures have been measured, and the total enthalpy was numerically rebuilt through comparison of the heat fluxes to silver surface and ones calculated for fully catalytic wall at the temperature 300 K. Indirect rebuilding enthalpy is the key point of applied methodology including an assumption that silver is fully catalytic material with respect of O and CO recombination. The heat flux data are collected for further validation of CFD codes, surface chemistry model and rebuilding surface recombination coefficients of O atoms and CO molecules.
The emission spectroscopy measurements have been performed in the CO2 free stream and within air boundary layer on the special test model with purpose to compare with other data obtained on other high-enthalpy facilities at the same or close test conditions in terms of enthalpy and stagnation pressure.

SACOMAR Deliverable No. D5.4 Results of experimental study in the IPG-4 facility - Page 4 of 34
3 The Plasmatron IPG-4
The 100-kW IPG-4 plasmatron with 80-mm diameter discharge channel [5-10] has been in operation since 1988 up to now. This R&D facility operates in the pressure range 10-1000 hPa with different gases (air, nitrogen, oxygen, carbon dioxide, argon). It has been used for investigations of plasma/surface interaction including heating effect of the heterogeneous recombination of atoms on thermal protection coatings for the Earth and Mars atmospheric entry conditions [5, 6]. Thermochemical stability of borosilicate and carbon-carbon BURAN TPM have been studied including determination of the maximum working temperature of TPM, aging tests, studies of surface degradation coupled with evolution of the surface emissivity and catalycity as functions of temperature and time [7-10]. Distinctive feature of the IPG-4 plasmatron is using the quartz discharge channels without any forced cooling system. Transparent discharge channel together with large diameter optical windows of the test chamber reveal quite wide access to observe discharges by photo- and video-cameras and spectroscopic devices. Outward appearance, schematic diagram and schematic of test chamber of the IPG-4 plasmatron are presented in Figs. 1 - 3.
Figure 1: Appearance of the IPG-4 plasmatron.

SACOMAR Deliverable No. D5.4 Results of experimental study in the IPG-4 facility - Page 5 of 34
Figure 2: Schematic diagram of the IPG-4 plasmatron.
Notations to Fig.2: 1 – RF-generator, 2 – unit for matching of plasma load with oscillation circuit, 3 – control panel, 4–test chamber, 5 – water-cooled vacuum line, 6 – plasma-water heat exchanger, 7 – vacuum valves, 8 – vacuum line, 9 – vacuum pumps, 10 – exhaust line, 11 – exhaust fun, 12 – data acquisition system, 13 - thermovisor, 14- pyrometer, 15 - spectrometer.

SACOMAR Deliverable No. D5.4 Results of experimental study in the IPG-4 facility - Page 6 of 34
Figure 3: Schematic diagram of test chamber and ICP torch of the IPG-4 plasmatron.
Notations to Fig.3: 1 – test chamber, 2 – inductor chamber for providing atmospheric pressure around inductor, 3 – nozzle unit, 4 – quartz discharge channel, 5 – gas injection system, 6, 7 – positioning devices for introduction/withdrawing of samples and probes, 8 – water-cooled screens.
Main parameters of the IPG-4 plasmatron are given in the Table 1.
Table 1: IPG-4 technical parameters.
Parameter IPG-4
Maximum anode power, kW 76
Frequency, MHz 1.76
Discharge channel diameter, mm 80
Pressure in test chamber, hPa 6-1000
Mass flow rate of air and nitrogen, g/s 2-6
Working gases air, N2, O2, CO2, Ar
Flow regimes subsonic and supersonic
Enthalpy of air flow, MJ/kg 5-50

SACOMAR Deliverable No. D5.4 Results of experimental study in the IPG-4 facility - Page 7 of 34
The inductor chamber, discharge channel and inductively coupled plasma stabilized by swirling CO2 flow are shown in Figs. 4 - 6 respectively.
Figure 4: Inductor chamber and top interface of ICP torch.
Figure 5: Quartz discharge channel and inductor of the IPG-4 plasmatron.
SACOMAR Deliverable No. D5.4 Results of experimental study in the IPG-4 facility - Page 8 of 34
Figure 6: Inductively coupled CO2 plasma flow stabilized by swirling.
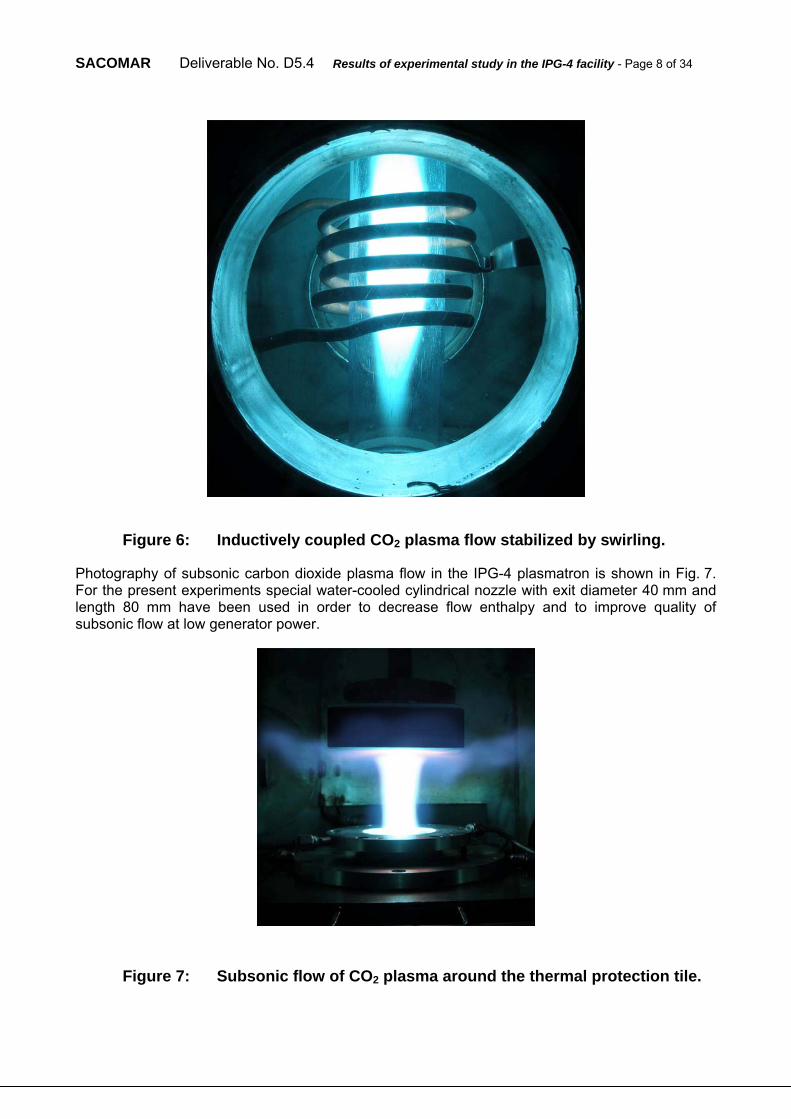
Photography of subsonic carbon dioxide plasma flow in the IPG-4 plasmatron is shown in Fig. 7. For the present experiments special water-cooled cylindrical nozzle with exit diameter 40 mm and length 80 mm have been used in order to decrease flow enthalpy and to improve quality of subsonic flow at low generator power.
Figure 7: Subsonic flow of CO2 plasma around the thermal protection tile.

SACOMAR Deliverable No. D5.4 Results of experimental study in the IPG-4 facility - Page 9 of 34
Data acquisition system is based on PC-computer with Pentium-IV/1.8GHz and the E-270 ADC (15-bit, 16 channels, 100 Hz/channel, USB interface, manufacturer: L-Card, Russia). It is possible to reconfigure this ADC using plug-in modules such as 0-5 V, 5 V, 0-10 V, 5 V, 0-20 mA. Modules for 100 Ohm thermistor and thermocouples are available, too. “AC-Test” program is used for data acquisition programming before experiment and for data acquisition control during experiment.
4 Test model and heat flux probes
The 50-mm-diam water cooled model with rounded edge and stain lees heat flux probe have been manufactured in the Laboratory for Plasma/Surface Interaction of IPM. The model was made from copper and brass. Schematics of the model and heat flux probe are shown in Fig. 8. The test model is to be easy for exploitation and simple for assembling/disassembling. In the stagnation point configuration, the following optimum subsonic test conditions were realized: 1) axially symmetric flow past a model, 2) flow perturbations induced by the model not reaching the discharge channel, 3) high stability of free stream conditions, 4) uniform heat loading on the heat probe (calorimeter) surface, and 5) good reproducibility of stagnation point heat transfer.
Figure 8: Test model with heat flux probe.
For the stagnation point heat flux measurements, the water flow steady-state calorimeters made of copper, stainless steel monoliths, quartz of high chemical purity were applied along with the calorimeter with silver front face. The heat reception surfaces of the calorimeters were polished up to mirror quality.

SACOMAR Deliverable No. D5.4 Results of experimental study in the IPG-4 facility - Page 10 of 34
Figure 9: Water-flow heat flux probe made of stainless steel.
5 Test matrix
Test matrix is presented in Table 2. It contains the test conditions in terms of enthalpy and Pitot
pressure. These conditions provide partial simulation of the stagnation point heat transfer because
the velocity gradient could be different from flight conditions.
Table 2: Test matrix.
enthalpy Pitot pressure model diameter Test facility Test condition
[MJ/kg] [hPa] [mm]
FC-1 13.8 80, 40 50 IPG-4
FC-2 9.0 80, 40 50
For the IPG-4 facility specified enthalpy value is identical to the total enthalpy in the subsonic free stream close to the model’s surface.
6 Measurements of stagnation point heat flux
Methodology developed for characterization of the heat transfer in subsonic high-enthalpy flows [6, 11] was used to measure stagnation point heat fluxes to different cold surfaces in the subsonic CO2 plasma flows. The stagnation point heat fluxes were measured by the stationary water-cooled copper calorimeter with 5% accuracy (Tw 300 K). Mass flow of cooling water was measured using
SACOMAR Deliverable No. D5.4 Results of experimental study in the IPG-4 facility - Page 11 of 34
individually calibrated rotameter. Temperature difference between input and output cooling water was measured using shielded differential thermocouple of K type.
The same model was used as Pitot and model for heat flux measurements (diameter of models is Dm = 50 mm and radius of rounded edge rm =11.5 mm). Central hole diameter is 14 mm. This flat-faced cylindrical model was used together with the calorimeter of 13.8-mm diameter. Schematic drawing of model equipped with calorimeter was shown on Fig. 8. Four materials were used in presented work as follows: Ag, Cu, stainless steel, quartz. Silver plate was soldered to copper calorimeter, other calorimeters were made of monolithic pieces of materials in question.
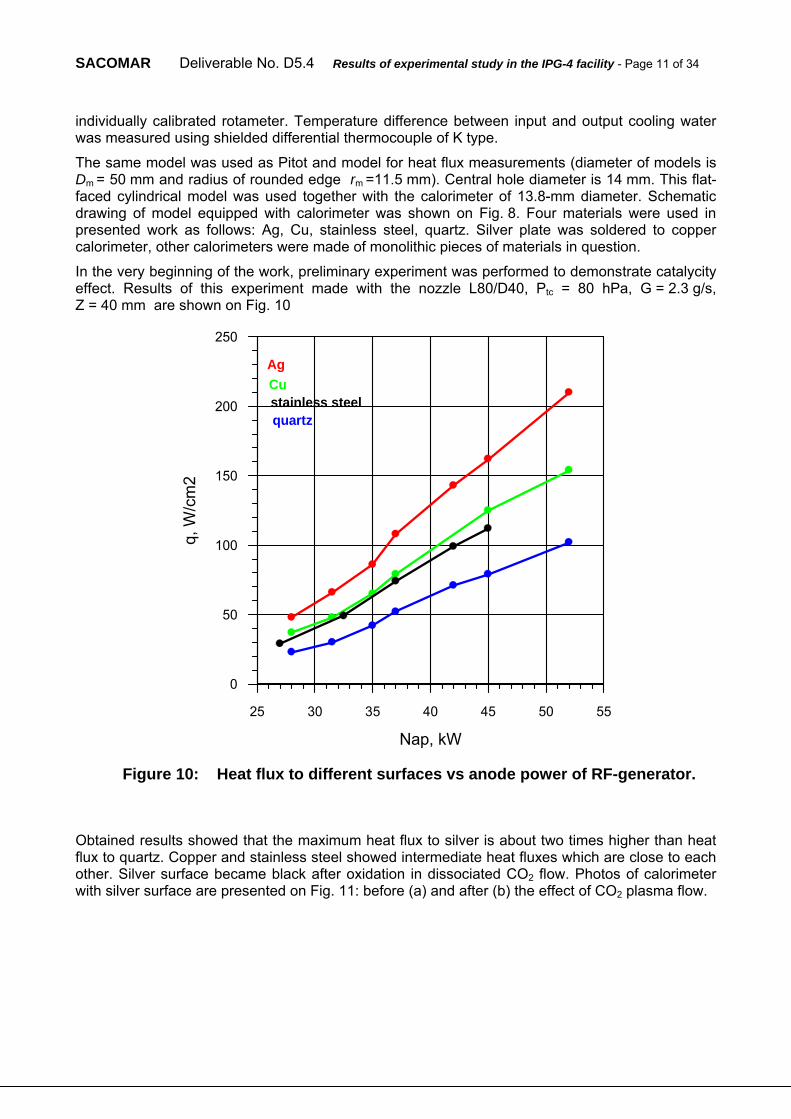
In the very beginning of the work, preliminary experiment was performed to demonstrate catalycity effect. Results of this experiment made with the nozzle L80/D40, Ptc = 80 hPa, G = 2.3 g/s, Z = 40 mm are shown on Fig. 10
25 30 35 40 45 50 55
Nap, kW
0
50
100
150
200
250
q, W
/cm
2
Cu
Ag
quartzstainless steel
Figure 10: Heat flux to different surfaces vs anode power of RF-generator.
Obtained results showed that the maximum heat flux to silver is about two times higher than heat flux to quartz. Copper and stainless steel showed intermediate heat fluxes which are close to each other. Silver surface became black after oxidation in dissociated CO2 flow. Photos of calorimeter with silver surface are presented on Fig. 11: before (a) and after (b) the effect of CO2 plasma flow.

SACOMAR Deliverable No. D5.4 Results of experimental study in the IPG-4 facility - Page 12 of 34
a b
Figure 11: Stationary water-cooled calorimeter with massive silver surface, a – before experiment, b – after oxidizing in CO2 plasma flow.
Time history of silver oxidation is given in Fig. 12 for the regime Ptc = 76 hPa, Nap = 45 kW. The saturation time for reaching maximum heat flux is found to be about 15 min.
0 100 200 300 400 500 600 700 800 900
t, s
0
20
40
60
80
100
120
140
160
180
q, W
/cm
2
Figure 12: Time history of silver surface oxidation in CO2 plasma flow.
Calibration experiments were made in pure CO2 plasma flow, because electric and transport properties of mixture 97%CO2+3%N2 are practically identical to those of pure CO2.
Heat flux to silver surface as a function of anode power Nap of RF-generator is given on Fig. 13 for pressure in test chamber Ptc = 76 hPa, for the nozzle L80/D40, G=2.8 g/s, Z = 40 mm.

SACOMAR Deliverable No. D5.4 Results of experimental study in the IPG-4 facility - Page 13 of 34
20 25 30 35 40 45 50
Nap, kW
0
20
40
60
80
100
120
140
160
180
q, W
/cm
2
Figure 13: Heat flux to water-cooled silver surface vs Nap at Ptc=76 hPa.
Heat flux to silver surface as a function of distance Z from exit section of nozzle to heat flux probe is given on Fig. 14 for pressure in test chamber Ptc = 36 hPa, for the nozzle L80/D40, G=2.0 g/s, Nap = 35 kW.
Z, mm
Figure 14: Heat flux to water-cooled silver surface vs distance from exit section of nozzle to heat flux probe at Ptc=36 hPa.

SACOMAR Deliverable No. D5.4 Results of experimental study in the IPG-4 facility - Page 14 of 34
7 Measurements of dynamic and stagnation pressures
The Pitot is used for stagnation pressure measurement and form of this water-cooled Pitot nose is identical to form of ESA standard model for testing of materials and to form of heat flux probe used in presented work (diameter of models is Dm = 50 mm and radius of rounded edge rm =11.5 mm). Pitot aperture is 14 mm.
Static pressure Ptc on the wall of test chamber was measured by the pressure converter of ELEMER type. The ELEMER AIR-20/M2-DA model 15 pressure converter was used with full scale 100 hPa and accuracy of pressure measurements P = ±0.3 hPa.
Dynamic pressure Pdyn was measured as difference between Pitot pressure and static pressure on the wall of test chamber. The ELEMER AIR-20/M2-DD model 400 differential pressure converter with full scale of pressure difference 10 hPa and accuracy of measurements P = ±0,02 hPa was used for these measurements.
Total pressure at stagnation point of the model was determined as sum of static pressure on the wall of test chamber and dynamic pressure. Summation result together with static pressure and dynamic pressure was showed on display in window of AC-TEST data acquisition code as plots of time history and in numerical format.
Experimental data on dynamic pressure measurements during calibration experiment at total pressure 41hPa is shown on Fig. 15 for the nozzle L80/D40, Nap=35 kW, Ptc = 36 hPa, G=2.0 g/s. Pitot probe was moved upstream along flow axis with velocity 0.2 mm/s. Pressure decrease is insignificant and it confirms high quality of CO2 plasma jet.
60 70 80 90 100 110 120 130 14050 150
Z, mm
50
100
150
200
250
300
350
400
450
0
500
Pdy
n, P
a
Figure 15: Dynamic pressure vs distance Z to Pitot probe at Ptc = 36 hPa.

SACOMAR Deliverable No. D5.4 Results of experimental study in the IPG-4 facility - Page 15 of 34
Data on dynamic pressure as a function of anode power of RF-generator are shown on Fig. 16 for the nozzle L80/D40, Ptc = 76 hPa, G = 2.8 g/s, Z = 40 mm.
25 30 35 40 4520 50
Nap, kW
50
100
150
200
250
300
350
400
450
0
500
Pdy
n, P
a
Figure 16: Dynamic pressure vs anode power at Ptc = 76 hPa.
8 Determination of flow enthalpy
8.1 Issues of enthalpy measurement in CO2 plasma flows
When making enthalpy measurements in subsonic plasma flow of carbon dioxide, dissociated fractions of cooled sampled gas could be frozen due to low pressure, thin boundary layer and very quick cooling of the sampled gas inside calorimetric tube. If recombination of dissociated CO2 components is not completed in calorimetric tube of enthalpy-meter, one has sampled gas as follows:
CO2 CO + O (heating in inductively coupled plasma)
CO + O (1 - )CO2 + CO + (/2)O2 (cooling in enthalpy-meter)
where 0≤≤1 - dissociation degree of CO2 in cooled gas mixture. CO radical can form a stable gas (dangerous, but commercially available in bottles) and atomic oxygen is to be fully recombined to O2 at considered pressures and room temperature.
Molecular mass of considered mixture is
mix = CO2/(1 + /2)
Since mass flow rate of sampled gas G is determined using rate of pressure increase in a bottle with calibrated volume, one has
Gsampled ~ ~ mix(1 + /2)/CO2
where G – flow rate of sampled gas, mix - density of sampled mixture.

SACOMAR Deliverable No. D5.4 Results of experimental study in the IPG-4 facility - Page 16 of 34
And last but not least it is necessary to take into account that energy input to obtain high-temperature dissociated CO2 is not equal to heat received with calorimetric tube of enthalpy-meter during cooling of sampled gas. Actually, to return sampled gas to its initial state (to gaseous CO2 injected into discharge channel) it is necessary to burn virtually CO in 1/2O2 at temperature and pressure of sampled gas:
CO + 1/2O2 CO2 + Q
where Q is heat of combustion and for reaction in question Q = 283 kJ/mole, so final equation for determination of enthalpy in the case of partially dissociated sampled CO2 is as follows
H = (1 + /2)Qcal/GCO2 + Q /CO2 = (1 + /2)HCO2 + Q/CO2
where Qcal is heat received with calorimetric tube of enthalpy-meter and HCO2 – enthalpy determined under assumption that sampled gas is fully recombinated CO2. It is easy to see that H depends linearly on dissociation degree .
Preliminary experiments on search of CO in sampled gas were made chemical indicator tubes and it was detected presence of CO in exhaust gas with concentrations of CO turned out significantly higher than upper limit of this device.
8.2 Rebuilding the flow enthalpy and reference flow velocity in subsonic CO2 free stream
The flow enthalpy he is one of the key parameters both to determine the conditions for material testing and to determine surface catalycity of a material.
In framework of IPMech approach the enthalpy he can be either measured by means of enthalpy-meter or rebuilt by the heat flux qws measured to the standard high catalytic material.
The direct enthalpy measurement is the best way when it could be made with a good accuracy. But there are principal difficulties in the direct measurement of he in dissociated CO2 flow that could lead to significant inaccuracy as discussed above. So in the present tests the enthalpy he was rebuilt using GAMMA code by the measured heat flux qws to the water-cooled calorimeter with oxidized silver surface.
The algorithm of the enthalpy rebuilding is as follows:
The heat flux qws is measured at specified stagnation pressure for different anode power (step by step approach).
Velocity head Pdyn is measured for the same operating conditions to provide the input data for GAMMA code. The reference velocity Vs will be rebuilt by Pdyn.
GAMMA code is used to obtain he from the solution of inverse problem with assumption that the calculated heat flux to fully catalytic surface qwcalc is equal to the measured qws:
qwcalc (he, ws, Tws) = qws.
Here Tws=300 K is the surface temperature, ws=1 is the net catalytic efficiency of surface with respect to CO, O and C recombination.
The assumptions used in frameworks of this approach are the following:
the cool silver surface is assumed to be full catalytic one, it is confirmed by literature data [12];
the subsonic dissociated CO2 jet flow is assumed to be equilibrium at the boundary layer external edge in front of the model, though the bulk boundary layer flow is under chemical non-equilibrium;
the surface catalytic reactions are the first order ones and are described by the simple model with the single effective parameter w - the catalytic efficiency of surface recombination reactions, that means: O = CO = C = w.

SACOMAR Deliverable No. D5.4 Results of experimental study in the IPG-4 facility - Page 17 of 34
For the IPG-4 experimental conditions the boundary layer in front of the model is essentially nonequilibrium or even frozen and it could not be treated as infinitely thin one, its relative thickness /Rm ~ 0.30.4. So we use the 1D model of boundary layer [6] that provides the due account for its finite thickness and flow vorticity at its external edge.
GAMMA code was developed to realize numerical solution of the 1D nonequilibrium boundary layer equations with account for finite layer thickness and surface catalycity. It provides both the rebuilding of the flow enthalpy he and calculation of heat flux qw (Tw, w) in the model stagnation point as function of surface temperature Tw and effective catalytic efficiency w (heat flux abacus).
9 Nonequilibrium boundary layer equations with account for finite layer thickness and surface catalycity
Stationary axisymmetric laminar flow of dissociated gas mixture near the blunted model is considered. Cylindrical coordinate system (x, y) associated with the model flat face surface is shown in the Fig. 17.
Figure 17: Schematic of subsonic flow over the model and boundary layer
The following problem formulation is presented for the case of nonequilibrium dissociated carbon dioxide mixture that consists of the 5 components: molecules CO2, O2, CO and atoms C and O [6]. It is assumed that molecules vibrations are in equilibrium excitation and chemical kinetics is one temperature.
9.1 Governing equations
Flow in the boundary layer (it’s thickness is ~ Rm Re-1/2) in the vicinity of the symmetry axis is governed with accuracy of O(Re-1/2) by the following set of equations.
Equation of continuity:
0
yx Vxy
Vxx

SACOMAR Deliverable No. D5.4 Results of experimental study in the IPG-4 facility - Page 18 of 34
Momentum equation (x-component):
yxV
ydx
xdP
xxV
xV
yxV
yV
)(
Energy equation written through the temperature:
5
1i
5
1
wPr i
i
p
ipiipy
hdy
dTC
dy
d
dy
dTCJ
dy
dTCV
Diffusion equations for mass concentrations of CO, C and O (i=3,4,5)
w1
idydCi
Scidy
d
dydCi
yV
Equation of state:
5
1
1,
i i
ig
m
C
mT
m
RP
Conditions of mass conservation and conservation of chemical elements O and C are used also to close the equations.
The following gas-phase chemical reactions proceed in the dissociated CO2 boundary layer flow [6]:
CO2 + M ↔ CO + O + M
CO2 + O ↔ CO + O2
CO + M ↔ C + O + M
O2 + M ↔ O + O + M
CO + O ↔ C + O2
(M = CO2, O2, CO, C, O)
The data on rate constants for the gas-phase reactions were taken from [13].
Flow is assumed to be in chemical equilibrium at the external edge of boundary layer. Equilibrium values of spices concentrations Cie are calculated by the values of pressure P and the enthalpy he. The gas temperature Te is calculated along with enthalpy he from the flow equilibrium condition in the process of he rebuilding.
Heat transfer to the model stagnation point is determined by the formula:
hcdydCc
Schcody
dCcoSc
hodydCo
Scdy
dTμC p 000
ccooPrwwww
qw
Here 0Oh ,
0
ÑOh ,
0
Ñh are standard specific enthalpies of formation of O, CO, C.
9.2 Assumptions on the heterogeneous processes
The following simple macrokinetic model for the surface catalytic reactions is used.
1) The adsorption of O atoms predominates over other species adsorption. The adsorption of O atoms and desorption of products from the surface are fast reactions.

SACOMAR Deliverable No. D5.4 Results of experimental study in the IPG-4 facility - Page 19 of 34
2) Heterogeneous surface recombination reactions of CO, O and C follow the simple model of Eley-Rideal mechanism [14]:
O + S OS,
O + OS O2 + S, CO + OS CO2 + S, C + 2OS CO2 + 2S
where S is the site, OS is the adsorbed O atom (adatom). We assume also that the fraction of surface already covered by OS adatoms 1.
3) The effective probability w is introduced to describe in total the effect of catalytic reactions: w = wO = wCO = wC. In this way we introduce the average efficiency of recombination w. The reason for this simplification is that we have only one measured parameter qW to rebuild the surface catalycity.
So, reactions of surface recombination of O and C atoms and CO molecules are of the first order. Respectively, boundary conditions at the surface (=0) for mass concentrations of CO molecules, O and C atoms are the following:
COC
COK
COJ
w
OC
OK
OJ
w
CCC
KCJ
w-
iM
kT
iK
2
w
w2
w2
w
Here Ji is the diffusion mass flux for i-th species, Kwi is the catalytic recombination rate coefficient for i-th species. Note that the catalytic recombination of C atoms gives a small input to the total heat flux for the test conditions in question due to the small concentration of C atoms. So, the effective value w describes the effective surface recombination of O atoms and CO molecules.
When the boundary layer equations are solving in order to rebuild the flow enthalpy he, the effective probability w is set equal to 1.
9.3 Dimensionless governing equations
Stream function (x, y) is determined by the relations:
xyVx
yVx
x
,
Dimensionless variables and parameters are determined as follows:
sysxmm VVVVVURyyRxx /,/,/,/
Here Rm is the model radius, Vs is the reference velocity.
All upper primes are omitted in further formulas. The new independent variable is determined:
y
dy0
12
Also, the dimensionless stream function F(1) is determined:
VFFxVRyxsem
)(),(5.0),(11
22

SACOMAR Deliverable No. D5.4 Results of experimental study in the IPG-4 facility - Page 20 of 34
Here gas parameters at the external edge of boundary layer are denoted by index "e".
Then the additional dimensionless variables are introduced - the dimensionless velocity gradient u, stream function f and independent variable :
eeeu
Ff
u
uu
111
1 ,
, 10,/11
e
x
V
V
Ryxuu x
s
m
),(
11 , e
x
s
mee x
V
V
Ryyxuu
),(
11
0
12 dy
e , e
eee
uu
11
1Re2
2
Re
, e
mseRV
Re , meRy /
Finally a system of ordinary differential equations for boundary layer flow at the axis of symmetry (x=0) can be written with use of previously determined dimensionless variables:
02
1
2
1 2
eu
d
duf
d
dul
d
d, d
dfu
0w)(5
1i
5
1
i
ii
i
iipi
p hd
dT
d
dC
Sc
lfCC
d
dT
Pr
lC
d
d
0wi
d
dCf
d
dC
Sc
l
d
d ii
i, i = O, CO, C
The coefficients in these equations are determined as follows:
2
e
l
,
d
dy,
1
0
1
d , ee
m
s
ee y
u
u
R
V
V
12
1
Here e is the parameter to account for the external flow vorticity, Cpi and Cp are the specific heats of i-th species and gas mixture, Pr is the mixture Prandtl number, Sci is the Schmidt number of i-th
species, hi is the enthalpy of i-th species, iw is the source term for i-th species production in the gas-phase reactions.
Additional equations to close the system are:
m
T
1
,
5
1iiihCh ,
Boundary conditions at external edge of boundary layer (=1) are:
u = T = 1, Ci = Cie
Boundary conditions at the surface (=0) are:
u = f = y = 0, T = Tw /Te
Re5.01
1
wOe
ee
O
sO
uu
C
V
KI
Re5.01
1
wCOe
ee
CO
sCO
uu
C
V
KI

SACOMAR Deliverable No. D5.4 Results of experimental study in the IPG-4 facility - Page 21 of 34
Re5.01
1
wCe
ee
C
sC
uu
C
V
KI
Here Ii is the dimensionless diffusion flux for i-th species:
ddC
Sc
lI i
ii
9.4 Input data for the boundary layer equations solution
The input data for the solution of boundary value problem for the boundary layer equations are the flow pressure P, reference velocity Vs, flow temperature Te and species concentrations Cie at the boundary layer external edge.
The flow pressure P is measured for the IPG-4 test conditions.
The reference velocity Vs is rebuilt by the measured velocity head Pdyn with use of the following empiric formula:
2dyn 5.0 sep VkP
Here kp= kp (Re) is the empiric coefficient, kp1, depending on the Reynolds number. In our calculations kp varies from 1.05 to 1.1. Pdyn is measured by the Pitot tube at the flow axis at the position Z where the testing model will be placed in future testing of material.
Temperature Te is obtained along with rebuilding the enthalpy he from the condition of chemical equilibrium at the boundary layer external edge.
Species concentrations Cie are obtained from the condition of chemical equilibrium at the boundary layer external edge for the specified values of the pressure P and temperature Te (or enthalpy he).
Also, it is necessary to provide the equations with the boundary layer thickness =/Rm and with the dimensionless parameters at the jet axis at the boundary layer external edge:
V
V
s
e
- velocity at the boundary layer external edge Ve related to the reference velocity Vs;
e
x
s
me x
V
V
Ru
1 - dimensionless velocity gradient;
em y
uR
1
- second velocity derivative to determine the flow vorticity at the boundary layer
external edge and e parameter.
In IPM approach, these dimensionless parameters are determined in advance from the solution of Navier-Stokes equations for jet flow over the testing model. This Navier-Stokes solution is made with Beta code just for the experimental conditions.
9.5 Numerical solution technique
The Gamma code was developed to realize numerical solution of the dimensionless nonequilibrium boundary layer equations along the flow axis from the boundary layer external edge to the model surface with account for finite layer thickness and surface catalycity. It provides the rebuilding of flow enthalpy he at the external boundary layer edge and calculation of heat flux qw (Tw, w) in the model stagnation point as function of the surface temperature Tw and effective catalycity w (heat flux abacus).

SACOMAR Deliverable No. D5.4 Results of experimental study in the IPG-4 facility - Page 22 of 34
Finite difference scheme [15] is used to solve the one-dimensional boundary layer problem. The equation for the dimensionless stream function f (third order) and the equations for the temperature T and diffusion equations for the species concentrations CO, CCO, CC are solved with the scheme [15] with the 4-th order of approximation by η coordinate.
The total system of equations is solved by iterations. The under-relaxation technique is used to provide the convergence.
This numerical method is realized in GAMMA code and makes possible to provide calculations up to P=1 atm, i.e. up to near-equilibrium regimes. Normally the 22 grid points are used across the boundary layer. It takes a few seconds to rebuild the flow enthalpy and calculate the heat flux envelope for one typical IPG-4 regime with GAMMA code.
10 Selection of the test regimes
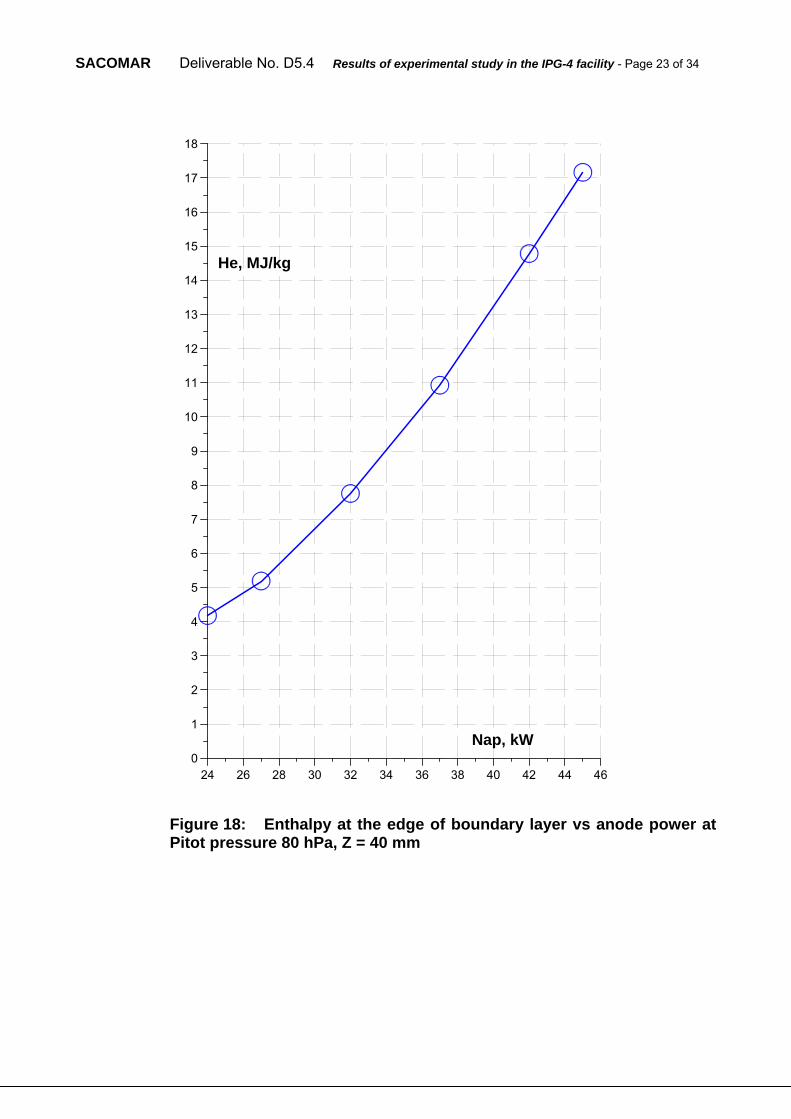
In the present experiments in stagnation point configuration at the Pitot pressure 80 hPa the distance between nozzle exit and model surface was Z = 40 mm. The test regimes have been changed due to variation of generator anode power Nap in the range 24 – 45 kW. The results of measurements of stagnation point heat flux to the probe with silver surface and flow enthalpy at Z = 40 mm rebuilt as described above are presented in Table 3. Here Eff=Nap/Npl is the plasmatron efficiency.
Table 3: Parameters of test performance at Pitot pressure 80 hPa.
Nap Eff Npl qw (silver) Pdyn he
45 0.507 22.81 174 468 17.2
42 0.5035 21.15 148 462 14.9
37 0.494 18.28 112 444 10.9
32 0.475 15.2 82 422 7.8
27 0.447 12.0 52 389 5.2
24 0.425 10.2 38.5 347 4.2
From Table 3 one can see that the enthalpy range he = 4.2 – 17.2 MJ/kg contains the specified in the Test matrix values 9 and 13.8 MJ/kg.
In experiments at the stagnation pressure 40 hPa the different technical approach has been used for selection of the specified test conditions. The anode power was kept constant Nap = 35 kW, but the distance between nozzle exit and model surface was altered in the range Z = 60 – 140 mm. In accordance with this distance the enthalpy decreased along jet axis from 14.7 down to 7.5 MJ/kg. Obviously (see Table 4), this interval contains specified enthalpy values 13.8 and 9 MJ/kg. The calibration curves appears as dependences of the enthalpy at the edge of boundary layer as function he = he(Nap) at Pitot pressure 80 hPa and constant Z = 40 mm (Fig.18) and he = he(Z) at Pitot pressure 40 hPa and constant generator anode power 35 kW (Fig. 19).
Table 4: Parameters of test performance at Pitot pressure 40 hPa.
Z qw (silver) Pdyn he
60 129 488 14.7
80 114 488 13.2
100 95 488 11.1
120 76 485 9.2
140 59 460 7.5
SACOMAR Deliverable No. D5.4 Results of experimental study in the IPG-4 facility - Page 23 of 34
24 26 28 30 32 34 36 38 40 42 44 460
1
2
3
4
5
6
7
8
9
10
11
12
13
14
15
16
17
18
Nap, kW
He, MJ/kg
Figure 18: Enthalpy at the edge of boundary layer vs anode power at Pitot pressure 80 hPa, Z = 40 mm

SACOMAR Deliverable No. D5.4 Results of experimental study in the IPG-4 facility - Page 24 of 34
60 80 100 120 1404
6
8
10
12
14
16
Zm, mm
He, MJ/kg
Figure 19: Enthalpy along jet axis at Pitot pressure 40 hPa and anode power 35 MJ/kg.
Using calibration curves in Figs.18 and 19 finally we have found the test conditions FC-1 and FC-2 in terms of Pitot pressure, anode power and distance Z from nozzle exit to model surface, which are presented in Table 5 (see next paragraph).

SACOMAR Deliverable No. D5.4 Results of experimental study in the IPG-4 facility - Page 25 of 34
11 Heat flux measurements to surfaces of different materials at selected test regimes
Technical approach to enthalpy determination and procedure of test regimes selection are presented in the above sections. Finally, the selected test regimes are shown in Table 5.
Table 5: Selected subsonic test regimes.
Stagnation pressure, hPa Enthalpy, MJ/kg Anode power, kW Distance Z, mm
80 13.8, 9.0 40.4, 34 40
40 13.8, 9.0 35 72, 122
Heat fluxes to silver surface for 4 test regimes were measured, and the found values turned out to be a little higher than calibration curves for both pressures. Therefore dynamic pressures were additionally measured for 4 test regimes too. It allowed to determined enthalpy just in 4 test regimes which were used for heat flux measurements. Obtained results are presented in Table 6. Deviation of actual enthalpies from specified values varies from 1.4% to 5.6%.
Table 6: Specified and actual enthalpies and stagnation pressures for selected test regimes.
Parameter Enthalpy, MJ/kg Stagnation pressure, hPa
Regime specified actual specified actual
Regime 1 13.8 14.0 80 80.1
Regime 2 9 8.8 80 79.9
Regime 3 13.8 14.4 40 39.8
Regime 4 9 9.5 40 39.8
Fig. 20 shows (with multi-color squares) the heat flux measured in 97%CO2+3%N2 mixture to silver, copper, stainless steel and quartz surfaces for the two test regimes (Nap = 40.4 and 34 kW) at P = 80 hPa, G = 2.8 g/s, Z = 40 mm. Fig. 20 shows also (with red circles) the heat flux to silver surface which was used for selection of test regimes.

SACOMAR Deliverable No. D5.4 Results of experimental study in the IPG-4 facility - Page 26 of 34
20 25 30 35 40 45 50
Nap, kW
0
20
40
60
80
100
120
140
160
180
q, W
/cm
2
Ag (calibration)
Ag
Cu
Stainlesssteel
SiO2
Figure 20: Heat fluxes to silver, copper, stainless steel and quartz surfaces for the two regimes Nap=40.4 and 34 kW (squares), and heat flux to silver surface used for selection of the test regimes (red circles); P = 80 hPa.
Fig. 21 shows (with multi-color squares) the heat flux measured in 97%CO2+3%N2 mixture at P = 40 hPa to silver, copper, stainless steel and quartz surfaces for the two test regimes (Z = 72 and 122 mm) at Nap = 35 kW, G = 2.0 g/s. Fig. 21 shows also (with red circles) the heat flux to silver surface which was used for selection of test regimes.
It is clear from the Figs. 20, 21, that in all the four test regimes the experimental points are located in the same order in terms of the heat flux: Ag Cu stainless steel SiO2.

SACOMAR Deliverable No. D5.4 Results of experimental study in the IPG-4 facility - Page 27 of 34
40 60 80 100 120 140
Z, mm
0
20
40
60
80
100
120
140q,
W/c
m2
Ag(calibration)
Ag
Cu
Stainlesssteel
SiO2
Figure 21: Heat fluxes to silver, copper, stainless steel and quartz surfaces for Nap = 35 kW for the two distances Z=72 and 122 mm (squares), and heat flux to silver surface used for selection of the test regimes (red circles); P = 40 hPa.
12 Emission spectroscopy of CO2 + N2 subsonic flow field
Water-cooled flat plate with cylindrical nose of 15mm radius was made of copper and this model was used for qualitative study of boundary layer spectra. Actually, such model allows to see radiation of boundary layer without hot plasma flow along optical axis because element of cylindrical surface is longer than diameter of hot core of plasma flow. Optical scheme used for spectra recording is shown in Fig. 22. Optical axis is parallel to spread line of model. Since qualitative experiment was made, scanning across boundary layer was realized using axial moving of the model but not optical system as it is shown on Fig. 22 by arrow. Widely used compact spectrometer HR4000 with flexible quartz light guide was used to record spectra. Spectrometer was connected with PC using USB interface. The HR4000 has a 3648-element CCD-array detector from Toshiba which is responsive from 200-1100 nm, but the specific range and resolution depend

SACOMAR Deliverable No. D5.4 Results of experimental study in the IPG-4 facility - Page 28 of 34
on your grating and entrance slit choices. Two devices with operational ranges 200-650 nm and 200-1100nm and 5m slit are available in IPM.
The notations in Fig. 22: 1 – CO2 plasma flow, 2 – water-cooled plate with cylindrical nose r15mm, 3 – quartz optical window of test chamber, 4 – spherical mirror R1m, 5 – flexible quartz lightguide d200m, 6 – HR4000 spectrometer, 7 – PC.
Figure 22: Optical scheme for boundary layer spectra recording.
Demonstration of technical approach was made with use of air plasma flow. Obtained raw spectra of plasma jet and boundary layer are given in Fig. 23 for narrow wavelength band 300-360nm. It is seen from presented spectra some molecular bands demonstrate significant intensity decrease with approach to model surface and significant intensity increase of another bands. Intensities of some molecular bands in boundary layer are 2 - 3 times higher than those in free jet.

SACOMAR Deliverable No. D5.4 Results of experimental study in the IPG-4 facility - Page 29 of 34
300 305 310 315 320 325 330 335 340 345 350 355 360
Wavelength, nm
0
2000
4000
6000
8000
10000
12000
14000
Cou
nts
Free jet of air plasma
Boundary layer - 3mm from surface
Boundary layer - 5mm from surface
Figure 23: Raw spectra of air plasma subsonic jet and boundary layer in wavelength band 300-360 nm.
Experiments with recording spectra of CO2 + N2 mixture were carried out with the nozzle L40mm/D40mm. Fig. 24 shows spectra of 97%CO2+3%N2 mixture subsonic plasma flow and boundary layer at P = 80 hPa, Nap = 45 kW, G = 2.8 g/s. In CO2+N2 mixture intensities of all molecular bands decrease monotonously from free stream to model surface.
Figure 24: Spectra of 97%CO2+3%N2 plasma jet and boundary layer in wavelength band 340-580 nm.
340 360 380 400 420 440 460 480 500 520 540 560 580
Wavelength, nm
0
2000
4000
6000
8000
10000
Cou
nts
y=-0.5mm
y=1.5mmy=2.5mmy=3.5mm - plasma flow
CN 388.6nm (0-0)
C2 - Svan bands

SACOMAR Deliverable No. D5.4 Results of experimental study in the IPG-4 facility - Page 30 of 34
13 Calculation of the surface temperature of the quartz probe
The temperature TwQuartz of the external heat-receptive surface of the quartz probe was calculated under the assumption that the heat losses in radial direction are negligible in comparison with the heat transfer in axial direction, i.e. across the quartz probe wall. Then the problem of TwQuartz calculation is reduced to the solution of 1D differential equation for temperature distribution T(y) across the quartz wall:
Quartz)( wqdy
dTT , (1)
with the boundary condition: y=0: T=T0w.
Here 0 ≤ y ≤ d is the coordinate normal to the quartz probe surface measured from its internal water-cooling surface, so y=0 and y=d correspond to the internal and external quartz probe surfaces; d=1.08 mm is the quartz wall thickness; T0w is the temperature of the internal water-cooling surface of quartz probe; is the fused quartz thermal conductivity; qwQuartz is the heat flux to the external surface of the quartz probe, measured in the IPG-4 tests.
After solution of the equation (1), the required temperature TwQuartz is determined as follows:
TwQuartz = T(y=d).
Temperature T0w depends on test conditions. Water heating temperature T = (T0w - Twaterinlet) is measured during each test. Here Twaterinlet = 8 C = 281 K is the temperature of water that flows into the cooling chamber volume from the external water-supply system. So, values of T0w were calculated for all test regimes by the measured values of T presented in the Table 7.
The fused quartz thermal conductivity is a function of temperature: =(T). The data on (T) for the low temperature region (up to 500 K) were taken from the report [16] issued in 1966.
For high temperature range (from 600 K to 1400 K) the data [17] were used instead of the data [16], because the later data [17] were obtained with due account for radiation heat transfer (in addition to thermal conductivity) across the quartz sample during the experiments on (T) measurement.
The final combined polynomial function (T) for the whole temperature range was obtained to provide smooth and accurate approximation for both data [16] (low temperature range) and [17] (high temperature range). This approximation was used in the solution of 1D equation (1).
Fig. 25 shows the comparison of the combined polynomial function (T) (black curve) with different experimental data: high temperature data [17] (green curve and pluses), and low temperature data [16] (magenta curve and triangles), [18] (cyan curve), [19] (orange curve), [20] (blue square). The discrepancy of the data in low temperature range can be explained by the experimental inaccuracies and the difference in quartz samples purity and quality. In the high temperature range the data [17] lays essentially lower than data obtained without account for the radiation heat transfer (e.g. [16]).
The non-linear equation (1) was solved numerically starting from the quartz probe internal surface (y=0, T=T0w). The implicit finite-difference scheme with internal iterations in each step was used to account for the temperature dependence of .
The calculated temperature TwQuartz of external surface of quartz probe is presented in Table 7 for the four IPG-4 test regimes with the specified Pitot pressure P, anode power Nap, distance from the channel exit to the testing model Z. Values of the measured water heating temperature T, heat fluxes to silver surface qws and to quartz surface qwQuartz are presented also.

SACOMAR Deliverable No. D5.4 Results of experimental study in the IPG-4 facility - Page 31 of 34
Table 7: Calculated temperature of the quartz probe external surface.
P
hPa
Nap
kW
Z
mm
qws
W/cm2
qwQuartz
W/cm2
T
K
TwQuartz
K
80 40.4 40 142 70 6.8 755
80 34.0 40 93 45 4.3 599
40 35.0 72 125 46 4.4 606
40 35.0 122 78 30 2.9 500

SACOMAR Deliverable No. D5.4 Results of experimental study in the IPG-4 facility - Page 32 of 34
200 300 400 500 600 700 800 9001.3
1.4
1.5
1.6
1.7
1.8
1.9
2
T, K
LamW/m/K
Magenta - NSRDS-NBS (1966)
Accuratus Web-data (room T)
Green - Bityukov and Petrov (2000)
Orange - Sugawara (1968)
Cyan - Sergeev et.al. (1982)
Fused quartz thermal conductivity
Black curve - final approximation in whole region
Figure 25: Comparison of the final approximation (black curve) for fused quartz thermal conductivity with different experimental data.
SACOMAR Deliverable No. D5.4 Results of experimental study in the IPG-4 facility - Page 33 of 34
14 Conclusions
A 50-mm-diam water-cooled test model from copper and brass, and water-flow heat flux probe from stainless steel are manufactured in the Laboratory for Plasma/Surface Interaction.
Subsonic heat transfer tests with pure CO2 and CO2 + N2 plasmas have been performed in the wide range of enthalpy (4 – 17 MJ/kg), stagnation pressure (80 and 40 hPa) and gas flow rate (2.0 and 2.8 g/s).
The special water-cooled cylindrical nozzle was used, and generator power, pressure in test chamber, and distance from model surface to the nozzle were altered in order to meet requirements of the test plan. The four tests regimes were selected and realized according the test plan at the specified enthalpy, stagnation pressure and distance from nozzle exit to model surface.
Measurements of the heat flux rates to the model with the reference probe with silver surface at selected generator power and stagnation pressures have been performed. Evidence of silver surface oxidation was observed. The time history of the stagnation point heat flux to the silver wall was registered. The saturation time for reaching maximum heat flux is found to be about 20 min.
Indirect numerical rebuilding flow enthalpy by GAMMA CFD code through calculated heat flux rates to cooled fully catalytic wall and comparison with the data of stagnation point heat fluxes to oxidized stable silver surface of the reference probe was carried out.
Measurements of the stagnation heat flux to silver, copper, stainless steel and quartz surfaces at the pressures 80hPa and 40hPa have been performed in all the four selected regimes. In all the subsonic CO2 + N2 flow regimes the materials are arranged in the order Ag Cu stainless steel SiO2 in terms of stagnation point heat fluxes.
Control experiments and calculations were carried out to define enthalpy more precisely. Obtained results are within 1.4-5.6% accuracy in comparison with the specified test parameters.
Registration of the emission spectra in subsonic free streams and boundary layers was carried out in 97%CO2+3%N2 mixture and air. It is found that in air spectra of boundary layer the intensities of some spectral bands increase in 2 – 3 times, but in CO2+N2 intensities of all molecular bands decrease monotonously from free stream to model surface.
For the all specified four test regimes the temperatures of the external surface of the quartz probe are determined through numerical solution of 1D nonlinear differential equation. Quartz surface temperature can not be considered as constant varies in the range 500 – 755 K.
15 References
[1] Chen, Y.-K., Henline, W.D., and Tauber, M.E., Mars Pathfinder Trajectory-Based Heating and Ablation Calculations, Journal of Spacecraft and Rockets, Vol. 32, No. 2, 1995, pp225-230
[2] Mitcheltree, R.A., and Gnoffo, P.A., Wake Flow About the Mars Pathfinder Entry Vehicle, Journal of Spacecraft and Rockets, Vol. 32, No. 5, 1995, pp771-776
[3] Chen, Y.-K., Henline, W.D., Stewart, D.A., and Candler, G.V., Navier-Stokes Solutions with Surface Catalysis for Martian Atmosphere Entry, Journal of Thermophysics and Heat Transfer, Vol. 30, No. 1, 1993, pp45-52
[4] Bose, D., Wright, M.J., and Palmer, G.E., Uncertainty Analysis of Laminar Aeroheating Predictions for Mars Entries, Journal of Thermophysics and Heat Transfer, Vol. 20, No. 4, 2006, pp652-662
[5] Kolesnikov, A., Yakushin, M., Pershin, I., Heat Transfer Simulation and Surface Catalycity Prediction at the Martian Atmosphere Entry Conditions, AIAA 99-4892, 1999
SACOMAR Deliverable No. D5.4 Results of experimental study in the IPG-4 facility - Page 34 of 34
[6] Kolesnikov, A.F., Pershin, I.S., Vasil’evskii, S.A., and Yakushin, M.I., Study of Quartz Surface Catalycity in Dissociated Carbon Dioxide Subsonic Flows, Journal of Spacecraft and Rockets, Vol. 37, No. 5, pp573-579
[7] Vasil'evskii, S.A., Kolesnikov, A.F., Yakushin M.I., Determination of the Effective Probabilities of the Heterogeneous Recombination of Atoms When Heat Flow is Influenced by Gas-Phase Reactions, High Temperature, Vol. 29, No. 3, 1991, pp.411-419
[8] Gordeev, A.N., Kolesnikov, A.F., and Yakushin, M.I., An Induction Plasma Application to "Buran's" Heat Protection Tiles Ground Tests, SAMPE Journal, Vol. 28, No. 3, 1992, pp29-33.
[9] Gordeev, A.N., Yakushin, M.I., The Thermochemical Stability of Carbon-Carbon Using an Antioxidation Coating for Buran, Part II, SAMPE Journal, Vol. 29, No. 2, 1993, pp27-31
[10] Gordeev, A.N., Yakushin, M.I., Kravetskii, G.A. et. Al, Antioxidation Glass-Silicide Coating for Carbon-Carbon Materials and its Aging in Air Plasma Flow, Proceedings of the 2nd European Workshop on Thermal Protection Systems & 3rd European Workshop on High Temperature Materials, Stuttgart, 23-27 October 1995, pp217-224
[11] Gordeev A.N., Kolesnikov A.F., Yakushin M.I. Investigation of Heat Transfer on Models in Subsonic Jets of an Induction Plasmatron, Fluid Dynamics, 1983, Vol. 18, N. 6, pp.942-948
[12] Cauquot, P., Cavadias, S., and Amouroux, J., Thermal Energy Accommodation from Oxygen Atoms Recombination on Metallic Surfaces, Journal of Thermophysics and Heat Transfer, Vol. 12, No. 2, 1998, pp206-213
[13] Park, C., Howe, J. T., Jaffe, R. L., and Candler, G. V., Review of Chemical-Kinetic Problems of Future NASA Missions, II: Mars Entries, Journal of Thermophysics and Heat Transfer, Vol.8, No.1, 1996, pp9–23
[14] Hardy, W.A., and Linnett, J.W., Mechanism of Atom Recombination on Surface, Proceedings of 11-th International Symposium on Combustion. Combustion Inst., Pittsburgh, PA, 1966, pp167-179
[15] Petukhov, I.V., Numerical solution of two-dimensional boundary layer flows, In: Numerical methods for solution of differential and integral equations and quadrature formulas. Moscow, Nauka Publishing, 1964, pp304-325 (in Russian)
[16] Powell R.W., Ho C.Y., and Liley P.E. Thermal Conductivity of Selected Materials, National Standard Reference Data Series - National Bureau of Standards - 8. NSRDS-NBS-8. 1966
[17] Bityukov V.K., Petrov V.A. Optical quartz glass as a reference substance for the thermal conductivity coefficient of partially transparent materials, High Temperature, 2000, Vol. 38, No. 2, pp.293-299.
[18] Sergeev O.A., Shashkov A.G., Umansky A.C. Thermophysical properties of fused quartz, Inzhenerno-Fizicheskii Zhurnal, 1982, V.43, No.6, pp.960-970. (In Russian)
[19] Sugawara A. The Precise Determination of Thermal Conductivity of Pure Fused Quartz, Journal of Applied Physics, 1968, V.39, No.13, pp.5994-5997
[20] Fused Silica Engineering Properties. (2002) http://accuratus.com/fused.html. Accuratus Corporation, Phillipsburg, NJ, USA.