BLUE RIDGE HIGH SCHOOL
71
Page 1 of 71 BLUE RIDGE HIGH SCHOOL PRINCIPAL: REENA WATSON DISTRICT: GREENVILLE COUNTY SCHOOLS SUPERINTENDENT: BURKE ROYSTER 2018- 2023
-
Upload
khangminh22 -
Category
Documents
-
view
2 -
download
0
Transcript of BLUE RIDGE HIGH SCHOOL
Page 1 of 71
BLUE RIDGE HIGH SCHOOL
PRINCIPAL: REENA WATSON
DISTRICT: GREENVILLE COUNTY SCHOOLS SUPERINTENDENT: BURKE ROYSTER
2018- 2023
Page 3 of 71
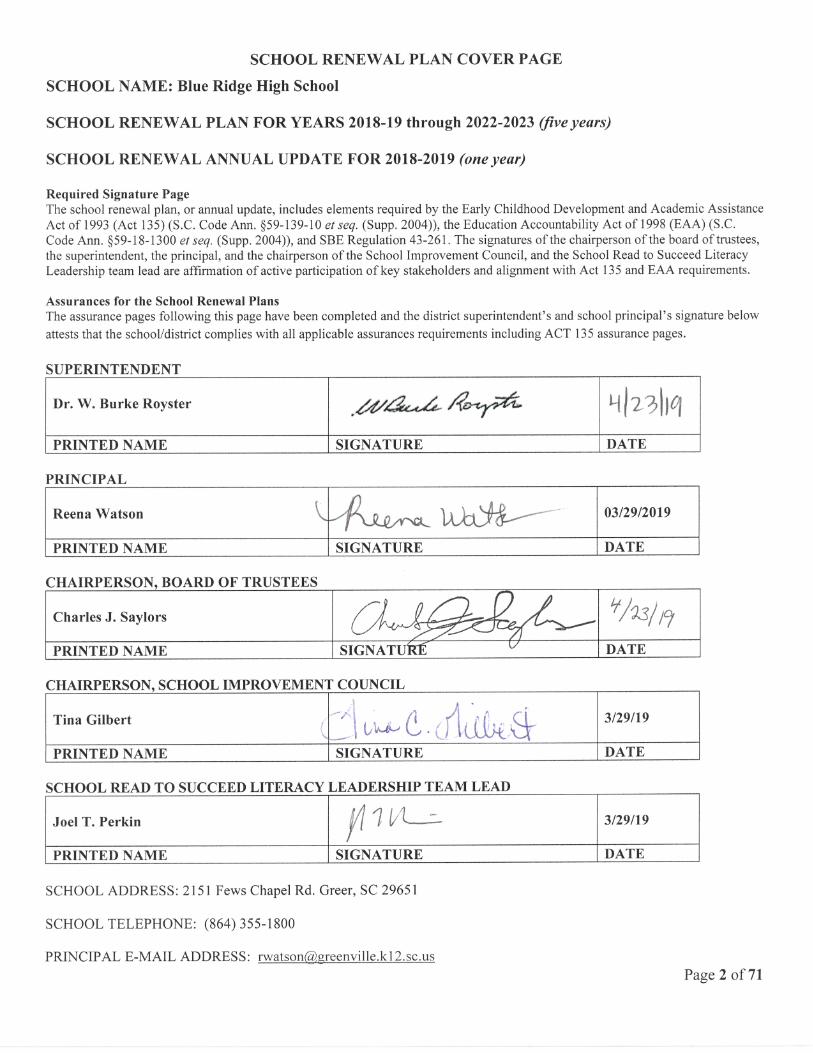
STAKEHOLDER INVOLVEMENT FOR SCHOOL PLAN
(Mandated Component)
POSITION NAME
1. Principal Reena Watson
2. Teacher Allison Skinner
3. Parent/Guardian Tina Gilbert
4. Community Member Amy Lynn
5. Paraprofessional Richard Stevens
6. School Improvement Council Member Austin Abercrombie
7. Read to Succeed Reading Coach Catie Lynch-Miner
8. School Read to Succeed Literacy Leadership Team Lead Joel T. Perkin
9. School Read to Succeed Literacy Leadership Team Member Elizabeth Roberts
OTHERS (May include school board members, district or school administrators, students, PTO members, agency representatives, university partners, Head Start representatives, First Step representatives, etc.)
** Must include the School Literacy Leadership Team for Read to Succeed
POSITION NAME
Assistant Principal/ Reading Coach Catie Lynch-Miner
Read to Succeed Literacy Leadership Team Chrystal Winzenried
Read to Succeed Literacy Leadership Team Elizabeth Roberts
Read to Succeed Literacy Leadership Team Brianna Kellett
Read to Succeed Literacy Leadership Team Danial Vanaman
Read to Succeed Literacy Leadership Team Marcie Case
Read to Succeed Literacy Leadership Team Steven Coy
Read to Succeed Literacy Leadership Team Frances Stephenson
Page 4 of 71
ASSURANCES FOR SCHOOL PLAN (Mandated Component)
Act 135 Assurances Assurances, checked by the principal, attest that the district complies with all applicable Act 135 requirements. _____ Academic Assistance, PreK–3 The school makes special efforts to assist children in PreK–3 who demonstrate a need for extra or
alternative instructional attention (e.g., after-school homework help centers, individual tutoring, and group remediation).
__X__ Academic Assistance, Grades 4–12 The school makes special efforts to assist children in grades 4–12 who demonstrate a need for extra or
alternative instructional attention (e.g., after-school homework help centers, individual tutoring, and group remediation).
__X__ Parent Involvement The school encourages and assists parents in becoming more involved in their children’s education.
Some examples of parent involvement initiatives include making special efforts to meet with parents at times more convenient for them, providing parents with their child’s individual test results and an interpretation of the results, providing parents with information on the district’s curriculum and assessment program, providing frequent, two-way communication between home and school, providing parents an opportunity to participate on decision-making groups, designating space in schools for parents to access educational resource materials, including parent involvement expectations as part of the principal’s and superintendent’s evaluations, and providing parents with information pertaining to expectations held for them by the school system, such as ensuring attendance and punctuality of their children.
__X___ Staff Development The school provides staff development training for teachers and administrators in the teaching
techniques and strategies needed to implement the school/district plan for the improvement of student academic performance. The staff development program reflects requirements of Act 135, the EAA, and the National Staff Development Council’s revised Standards for Staff Development.
__X___ Technology The school integrates technology into professional development, curriculum development, and
classroom instruction to improve teaching and learning.
N/A___ Innovation The school uses innovation funds for innovative activities to improve student learning and accelerate
the performance of all students. Provide a good example of the use of innovation funds.
_____ Recruitment The district makes special and intensive efforts to recruit and give priority to serving those parents or
guardians of children, ages birth through five years, who are considered at-risk of school failure. “At-risk children are defined as those whose school readiness is jeopardized by any of, but no limited to, the following personal or family situation(s): Educational level of parent below high school graduation,
Page 5 of 71
poverty, limited English proficiency, significant developmental delays, instability or inadequate basic capacity within the home and/or family, poor health (physical, mental, emotional) and/or child abuse and neglect.
___X__ Collaboration The school (regardless of the grades served) collaborates with health and human services agencies
(e.g., county health departments, social services departments, mental health departments, First Steps, and the family court system).
_____ Developmental Screening The school ensures that the young child receives all services necessary for growth and development.
Instruments are used to assess physical, social, emotional, linguistic, and cognitive developmental levels. This program normally is appropriate at primary and elementary schools, although screening efforts could take place at any location.
_____ Half-Day Child Development The school provides half-day child development programs for four-year-olds (some districts fund full-
day programs). The programs usually function at primary and elementary schools, although they may be housed at locations with other grade levels or completely separate from schools.
_____ Developmentally Appropriate Curriculum for PreK–3 The school ensures that the scope and sequence of the curriculum for PreK–3 are appropriate for the
maturation levels of students. Instructional practices accommodate individual differences in maturation level and take into account the student's social and cultural context.
_____ Parenting and Family Literacy The school provides a four component program that integrates all of the following activities:
interactive literacy activities between parents and their children (Interactive Literacy Activities); training for parents regarding how to be the primary teachers for their children and full partners in the education of their children (parenting skills for adults, parent education); parent literacy training that leads to economic self-sufficiency (adult education); and an age-appropriated education to prepare children for success in school and life experiences (early childhood education). Family Literacy is not grade specific, but generally is most appropriate for parents of children at the primary and elementary school levels and below, and for secondary school students who are parents. Family Literacy program goals are to strengthen parent involvement in the learning process of preschool children ages birth through five years; promote school readiness of preschool children; offer parents special opportunities to improve their literacy skills and education, a chance to recover from dropping out of school; and identify potential developmental delays in preschool children by offering developmental screening.
__X___ Coordination of Act 135 Initiatives with Other Federal, State, and District Programs The district ensures as much program effectiveness as possible by developing a district-wide/school-
wide coordinated effort among all programs and funding. Act 135 initiatives are coordinated with programs such as Head Start, First Steps, Title I, and programs for students with disabilities.
Page 6 of 71
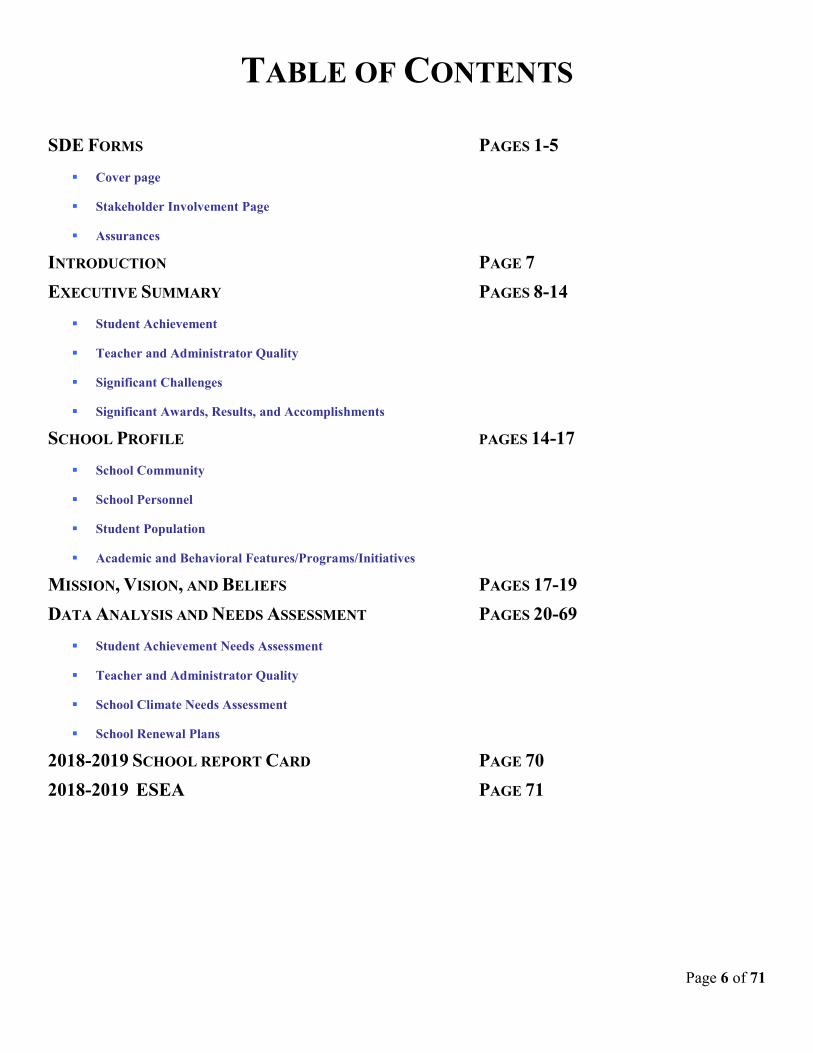
TABLE OF CONTENTS SDE FORMS PAGES 1-5
Cover page
Stakeholder Involvement Page
Assurances
INTRODUCTION PAGE 7 EXECUTIVE SUMMARY PAGES 8-14
Student Achievement
Teacher and Administrator Quality
Significant Challenges
Significant Awards, Results, and Accomplishments
SCHOOL PROFILE PAGES 14-17 School Community
School Personnel
Student Population
Academic and Behavioral Features/Programs/Initiatives
MISSION, VISION, AND BELIEFS PAGES 17-19 DATA ANALYSIS AND NEEDS ASSESSMENT PAGES 20-69
Student Achievement Needs Assessment
Teacher and Administrator Quality
School Climate Needs Assessment
School Renewal Plans
2018-2019 SCHOOL REPORT CARD PAGE 70 2018-2019 ESEA PAGE 71
Page 7 of 71
Introduction
to the Blue Ridge High School Portfolio The Blue Ridge High School portfolio was developed to document the changes and progress our school has made while working to continuously improve everything we do. The portfolio provides our staff, students, parents, and community with an ongoing means of self-assessment, communication, continuous improvement, and accountability.
This school portfolio is a living document that describes Blue Ridge High School and includes actual evidence of our work. It describes who we are, our vision for the school, goals, plans, progress, achievements in the context of client demographics and needs, and school partnerships. The portfolio also describes how we build and utilize our overall school plan for the purpose of improving student achievement – our ultimate outcome. It is in this portfolio that one can see an overview of all the progress and changes we have been able to accomplish within each section and throughout our school during this time. It also shows how all of the parts fit together to make our school a positive place for our students.
A team of teachers were involved in developing the narrative for our portfolio based on input from the staff, along with students, parents, and members of the community. Much of the narrative content came from staff discussions in the process of evaluating our work. These discussions and assessments asked staff to contribute “evidence” of our progress.
Please enjoy this comprehensive treasure as it provides the story of who we are and how we work together to continuously improve what we do to prepare our students to become successful citizens and participants in the present and future world!
Page 8 of 71
EXECUTIVE SUMMARY
Welcome to Blue Ridge High School! Located at the foothills of the Blue Ridge Mountains, Blue Ridge High School serves over 1,000 students, most of whom live in a rural community. Exhibiting southern hospitality at its best, our community prides itself on its open and welcoming atmosphere. As the school’s population has continued to grow, so has our cultural and ethnic diversity, thus illustrating our commitment to educate students from all backgrounds.
We have created our mission statement based on a shared vision which coordinates our goals, our school plan and our professional development. We have a clearer understanding of state and national learning standards. We are making instructional decisions based on student achievement data and our stakeholders are better informed about school processes. The EOC scores of our students continue to increase and Blue Ridge High School is preparing its students for life after graduation whether that involves continuing education, the military, or entering the work force. In spite of these gains, our school earned an “Average” ranking last year. In order to better serve the needs of our students, we have continued to analyze data from the school report card and align our portfolio and teachers’ student achievement goals with this information.
Blue Ridge High School offers quality electives to enrich the lives of our students. Our Fine Arts program has been the recipient of numerous awards in Marching Band, Concert Band, Choir, and Orchestra. Students in our Future Farmers of American and Future Business Leaders of America programs have also brought home awards and represented “The Ridge” with pride.
Although every student has been issued a Personalized Learning Device (Dell Chromebook) efforts still need to be made to improve the quality of lessons in regards to appropriate usage of technology. In order to meet the needs of our students, we must continue to raise student test scores each year. In addition, we will continue our efforts towards improved parent communication.
The administration collaborates as a unit along with the faculty to ensure our students are learning in an orderly, safe, and pleasant environment.
Student Achievement Results
In accordance with South Carolina Curriculum Standards, Blue Ridge High School (BRHS) gathers and analyzes data on student academic achievement through standardized test results and other student performance sources. Examples of these standardized tests include the American College Test (ACT), Scholastic Aptitude Test (SAT), and the WIN (Worldwide Interactive Network Ready to Work assessment) as the main indicators of measuring student achievement. It is mandatory that all students in their third year of high school take the WIN. The ACT and SAT are taken voluntarily by any junior or senior. In addition, students who are enrolled in Algebra I, English I, Biology, and US History are assessed using End-of-Course Exams. A summary of BRHS students’ scores follows. Finally, BRHS teachers use formative and summative assessments to regularly monitor student progress and modify instruction as needed. These assessments provide a variety of evidence that achievement goals have
Page 9 of 71
been met. Throughout each semester, teachers communicate and collaborate with colleagues in order to improve student performance.
For the purpose of this report, Blue Ridge High School’s student achievement results have been divided into six categories:
• ACT
• SAT
• WIN
• End of Course Exams
• Advanced Placement Exams
• Graduation Rate
The ACT and SAT are intended to help evaluate the College Preparatory programs specifically. The WIN and EOC Exams are intended as an evaluation of the minimum program. The AP, in turn, is intended to help evaluate the honors and AP program.
ACT The ACT is currently designated as one South Carolina’s optional college readiness assessments that were added to accountability measures in 2015.
The composite score for ACT in 2017 was 17.2; in 2018 the composite score was 18.4, which is a 1.2 point increase.
SAT Over the past three years Blue Ridge’s average composite SAT score has remained about the same. In 2018 our average composite score was 1068. The district’s average composite score was 1089 and the state’s was 1064.
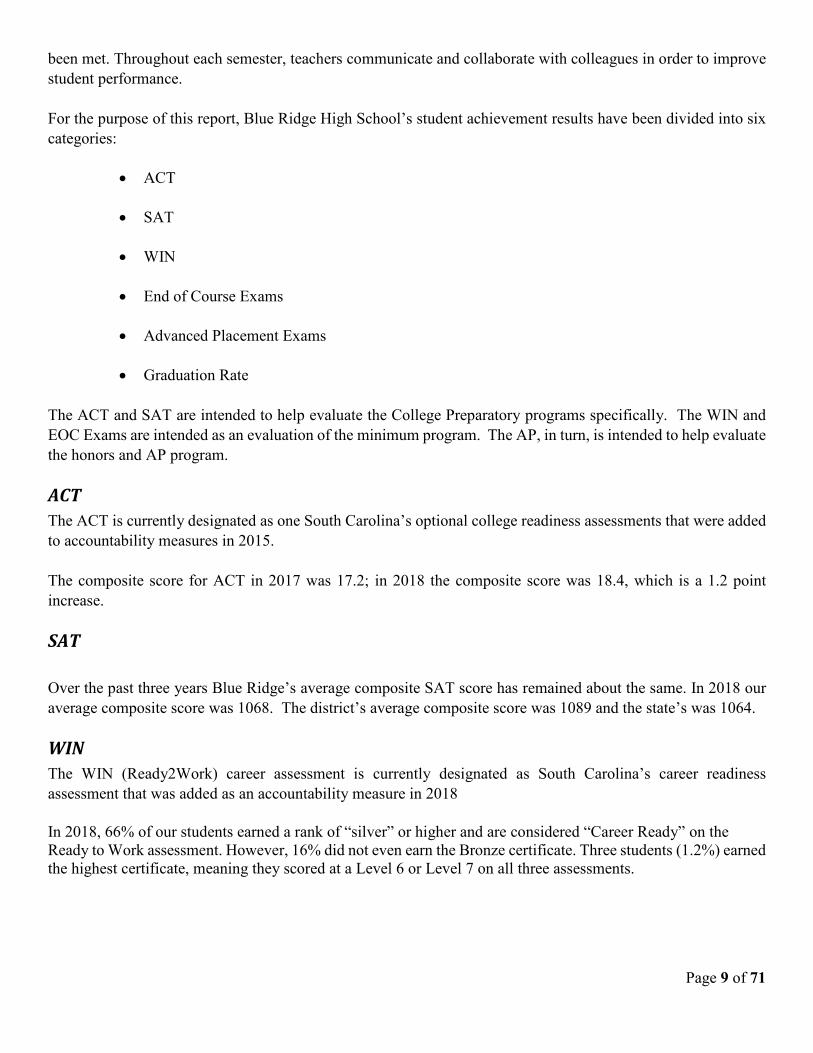
WIN The WIN (Ready2Work) career assessment is currently designated as South Carolina’s career readiness assessment that was added as an accountability measure in 2018
In 2018, 66% of our students earned a rank of “silver” or higher and are considered “Career Ready” on the Ready to Work assessment. However, 16% did not even earn the Bronze certificate. Three students (1.2%) earned the highest certificate, meaning they scored at a Level 6 or Level 7 on all three assessments.
Page 10 of 71
End of Course Exams The percentage of students passing the Algebra I EOC has decreased in the past three years. In 2016 the passage rate was 81.8%, decreased to 73.2% in 2017, and decreased to 65.4% in 2018.
The percentage of students passing the English I EOC has increased within the past year. In 2016 the passage rate was 68.6%, decreased to 66.7% in 2017, and increased to 79.4% in 2018.
The percentage of students passing the Biology I EOC has decreased in the past three years. In 2016 the passage rate was 83.2%, decreased to 77%% in 2016, and decreased to 59.3% in 2018.
The percentage of students passing the US History EOC has steadily climbed in the past three years. In 2016 the passage rate was 84%%, moved up to 84.3% in 2017, and 84.6% in 2018.
Advanced Placement Exams Blue Ridge has been fortunate in the last few years to be able to teach a variety of advanced placement courses. Not all classes are taught each year, but the subjects include:
• AP Calculus AB • AP Calculus BC • AP Statistics • AP English Literature • AP English Language • AP European History • AP US History • AP European History • AP Human Geography • AP US Government • AP Macroeconomics • AP Spanish • AP Biology • AP Chemistry • AP Physics • AP Environmental Science • AP Computer Science
The number of AP classes offered decreased from 18 to 17 courses in 2017. The overall passage rate (Score 3-5) is 49% for 2018, which is up from 43% in 2017.
High School Graduation Rate
Page 11 of 71
The on-time graduation rate has decreased over the past three years. In 2016 the graduation rate was 89.1%, in 2017 the graduation rate was 85.3%, and then decreased to 83.4% in 2018.
Teacher and Administrator Quality In 2018-2019 school year the faculty was comprised of 42% males and 58% females.
In 2018, there were 83% Caucasian, 14% African American, and 3% Latin American faculty members (teachers, guidance counselors, media specialist, IC, TIS, and administrators) on staff.
63% of the BRHS faculty have advanced degrees. 5% of the faculty is not certified due to ROTC or PACE positions. All certified personnel are required to attend at least 24 hours of professional development each year. The certified faculty averages over 14 years of experience in education.
The principal has been in education for twenty-seven years with thirteen of them as principal of the school. The three assistant principals have a combined total of 18 years’ experience as administrators. All administrators are certified as secondary administrators.
Significant Challenges BRHS draws from a geographically large and diverse community. Some students who attend BRHS are reared in low socioeconomic environments such as subsidized housing and foster homes. Other students live within a high socio-economic bracket; however, families with blue-collar jobs are more prevalent. Many families live on large plots of land and work in a family business. In many cases the skills needed to work in the family business have been taught and passed down thus making not making education a necessity to continue the business. An emphasis on education is most likely to be seen in families that have moved into the area due to a job relocation or upper middle class and above families, which are not the majority of the student population.
One attitude of the community is a number of parents view vocational skills as being more important than academic skills. A large number of BRHS parents have an education level at or below a High School Diploma. As a result, parents may not set high educational expectations for their own children. For instance, this includes lack of encouragement for them to earn a High School Diploma or to pursue a higher education beyond high school. To offset this socio-economic gap in achievement, BRHS staff and teachers must strive to instill the value of education through positive role modeling, guest speakers and special events for parents and students.
Significant Awards, Results, and Accomplishments
2018 Ms. Emily Thompson was awarded the “Frameworks Grant” in the amount of $250.00 for the second year in a row. Mrs. Leslie Susie was awarded $784.00 from the Greater Greer Foundation Grant for a math and reading center in her classroom.
Page 12 of 71
Congratulations to Coach Austin Weathers for being selected to coach in the 2019 SCWCA Best Western North South All Star classic. Mr. Travis Farnham was awarded the Golden Apple Teacher of the Week in December of 2018. Three BRHS students make the top 5 in the J. Harley Bonds Career Center “Amazing Shake” challenge - and the overall winner is a Blue Ridge Tiger. One of our students won a $20,000 AFJROTC Chief of Staff Flight Academy Private Pilot Scholarship. She will attend a nine-week flight training program with 120 other high school students across the United States who will earn their private pilot’s license and up to 12 college credits. At the 2019 FBLA Districts we had seven students place first in an event, one student place second, two students place third, and three students place fifth. The first through fourth place winners will be traveling to San Antonio, Texas this summer to compete at the 2019 National Conference. Our Orchestra program had three students make the Region Honors Orchestra and one student was an alternate. Two students made the All-County Honors Orchestra. Eighteen students made the South Carolina Allstate Chorus – the most students from one school in Greenville County.
2017 Emily Thompson was awarded “Frameworks Grant” in the amount of $250.00 Congratulations to Ms. Hernandez-Ross for being awarded $500 from the Taylors Walmart in response to her Community Grant application Mr. Farnham received a $1,000.00 grant from the Greater Greer Foundation is for his plan for a comprehensive broadcast journalism program The Spanish Club raised $1,285 from their Pulsera project sales. These funds will have a profound impact on countless lives in Nicaragua and Guatemala. The BRHS Corp of Cadets finished FIRST in class at the James F. Byrnes competition ♦ Finished FIRST in class at the Blythewood competition ♦ Finished third overall at the Upper State competition, and FIRST in Visual Performance ♦ Finished sixth out of 33 bands at the State Competition. 26 students made Allstate Chorus this year, one the highest years for us here at BRHS and the 5th largest from any school in the state A student received a Presidential Fellows Scholarship from Anderson University. This is a full tuition with room and board for four years at Anderson University. All FLBA students who competed in the 2018 FBLA District Conference placed! All FBLA student who competed in the 2018 FBLA State Conference placed with many winning 1st place!!
Page 13 of 71
BRHS Corp of Cadets finished FIRST in class at the James F. Byrnes competition, FIRST in class at the Blythewood competition, third overall at Upper State, and FIRST in Visual Performance. The Corp of Cadets finished 6th out of 33rd band at the State Competition. The BRHS orchestra competed in the Fiesta-Val at the Clayton Performing Arts Center in Atlanta, GA. They were awarded 1st Place with a Superior Rating in Division IV String Orchestra. This is the highest rating you can receive from the judges. Great job orchestra students! 26 students made Allstate Chorus this year, one the highest years for us here at BRHS and the 5th largest from any school in the state. AFJROTC established the first CyberPatriot Team in the GSC school district; participated in the Gold category at state level competitions. Sherry Thornton was selected as one of ten outstanding GCS employees to receive the Spring 2018 Employee Spotlight Award presented by Horace Mann.
2016 AFJROTC continues to provide support to the school and community through extensive training, volunteerism, community service, and fundraising. Science Teacher Emily Annas earned funding at DonorsChoose.org for a classroom project called “Let’s Get Cooking with a GO Sun Solar Stove!”. A student received a laptop scholarship at the 25th Spirit Fest 2016 at Furman University. A student represented Blue Ridge High School and the State of South Carolina at the Congress for Future Medical Leader in Boston, Massachusetts, in June and received the Award of Excellence. Two students were selected by the National Academy of Future Scientist and Technologists Award of Excellence for outstanding academic achievement, leadership potential, and determination to serve humanity in the field of science and technology. An English teacher received a grant to purchase standing desks for her classroom. Special Education teachers received a grant to receive iPods and Virtual Reality Head Sets for student to take virtual field trips and gain access to a whole new world of experiences and a grant from the Greater Greer Foundation for $1,200 for “Cooking in the Classroom” to assist with buying food so that her students can learn to cook n and easy recipes. JV and Varsity cheerleaders brought home first place at the Carolina Classic. Varsity cheerleaders won the region championship. This was the third region championship in a row for the Tigers. Varsity Cheerleader qualified for the State playoffs. The boys and girls cross country team placed 8th and 3rd, respectively, at the state meet. Three students placed high enough to be considered All-State!
Page 14 of 71
The varsity volleyball team qualified for the State playoffs. Girl’s golf qualified for Upper State. The Corp of Cadets won it class at the James F Byrnes Tournament of Bands. The band also took 1st place in class in musical performance, overall effect, and guard. Overall, the Corps of Cadets finished in a tie for 3rd place out of 24 bands who performed and was 2nd on the day in visual effects. The Corp of Cadets finished 3rd out of 20 bands for the Honors concert Choir to perform for the Choral division at the 2017 conference of the South Carolina Music Educators Association. BRHS orchestra program was awarded a $500 grant through the Music Club of Greenville. Seven student competed in the Palmetto Dramatic Association in February. Over the course of the first semester our cadets accumulated over 860 hours of community service. We purchased sabres and established our first ever Sabre Team. Our cadets led the North Greenville University Homecoming Parade and provided a sabre team for their Homecoming ceremony.
SCHOOL PROFILE
School Community Blue Ridge High School is located in a rural community situated in the northern portion of Greenville County, South Carolina. It is nestled in the foothills of the Blue Ridge Mountains near the North Carolina border, between the cities of Greer and Travelers Rest. Though the school is not located in a designated town, it is within a close-knit community. Blue Ridge High School is one of 14 traditional high schools in Greenville County.
Blue Ridge High School was first established in 1955. The original building was located on Tyger Bridge Road. The current building was constructed in 1986 and the renovation/expansion project was completed in January 2006. When Blue Ridge High School first opened its doors, there were 339 grade eight through twelve students enrolled. Upon completion of the renovation project, the building capacity is now 1,300 students, grades nine through twelve. There are currently approximately 1,024 students and 72 certified personnel.
The Blue Ridge High School attendance area is one of the largest geographical areas in the Greenville County School District. It covers approximately 186 square miles and makes up approximately 23 percent of the entire county. Most families living in the community of Blue Ridge have a long ancestral history, dating back for several generations. However, there is a steady influx of new families with many new subdivisions being built in the area.
The economic status of the region runs the gamut from low to upper income brackets. Due to the rural setting of the school, many workers travel to other locales to work in businesses and industries. This relationship allows Blue Ridge High to foster many contacts within the surrounding business community.
Page 15 of 71
The Blue Ridge area is served by a variety of higher education facilities. North Greenville University, Furman University, and the Greer campus of Greenville Technical College are located in close proximity to Blue Ridge High School. Additional educational opportunities are available in the Greenville area through the University Center of Greenville and various other organizations. The convenience of the higher learning facilities allows easy access and familiarity to the students.
School Personnel In addition to the 72 certified faculty members; which include teachers, guidance counselors, athletic director, assistant athletic director, administrators, and media specialists, the following classified employees serve in support roles for the school:
• Guidance clerk • Attendance clerk • Instructional Coach • Technology Integration Specialist • School Resource Officer • Licensed nurse • Receptionist • Bookkeeper • Secretary • Certified athletic trainer • In-School Suspension (ISS) facilitator
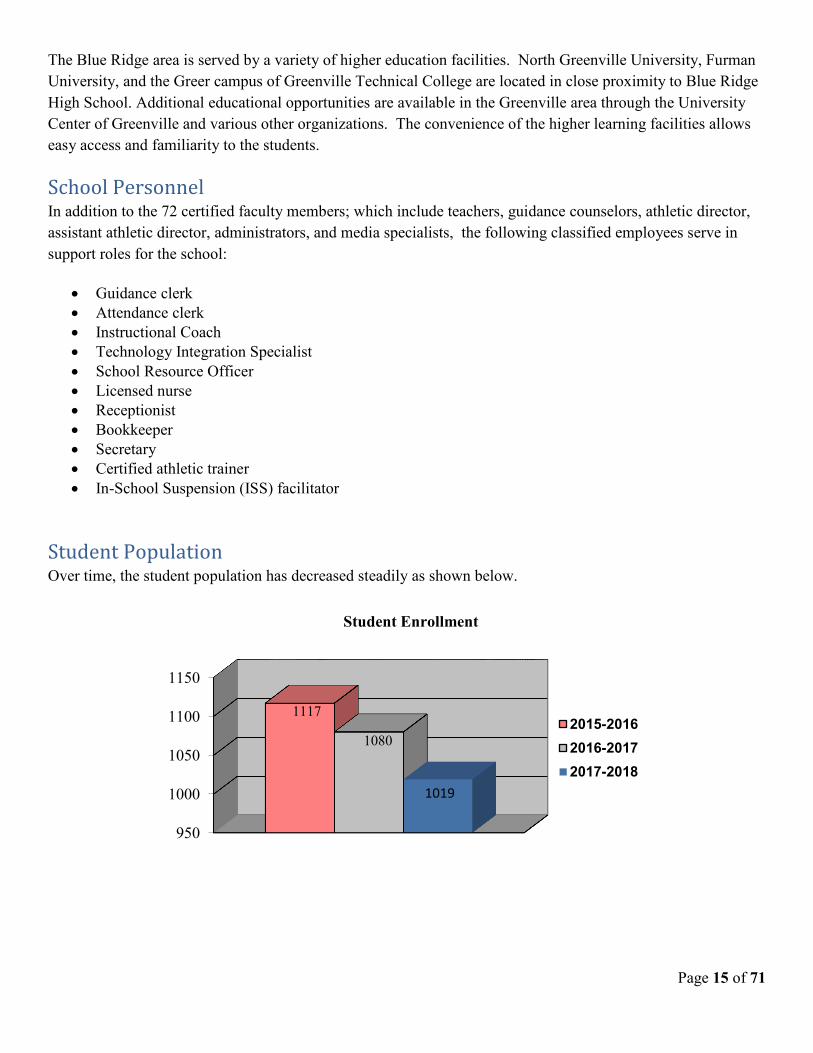
Student Population Over time, the student population has decreased steadily as shown below.
950
1000
1050
1100
1150
1117
1080
Student Enrollment
2015-20162016-20172017-2018
1019
Page 16 of 71
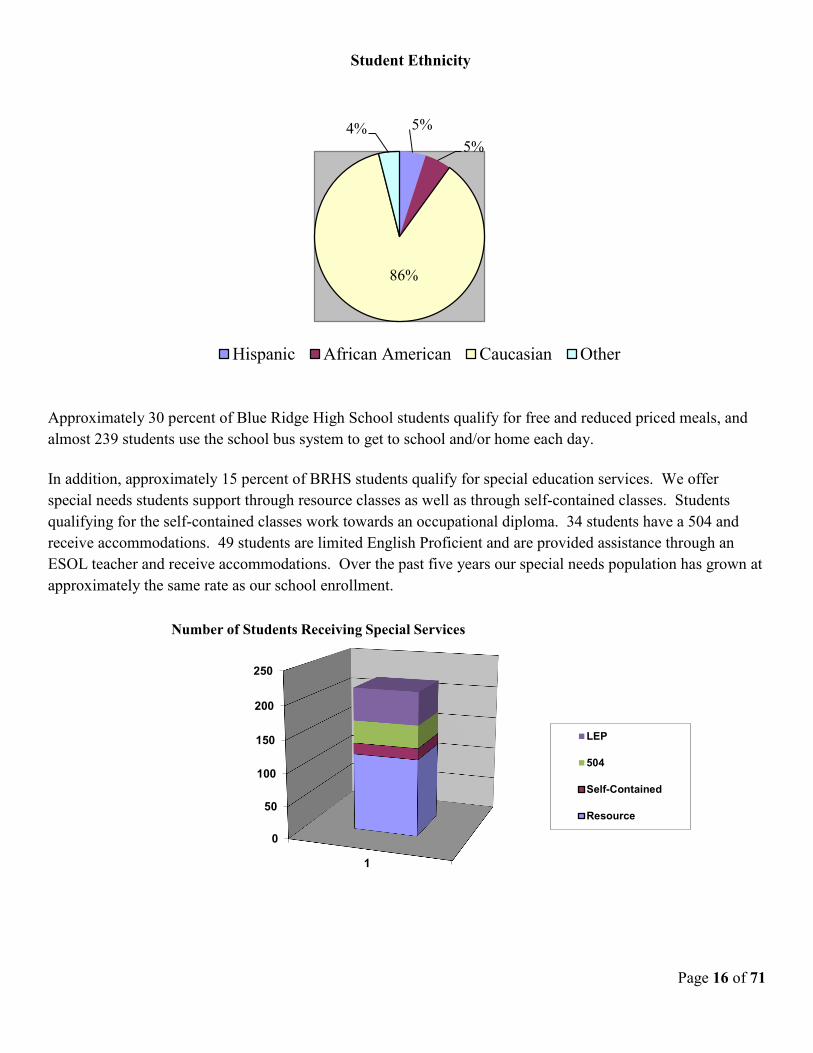
Approximately 30 percent of Blue Ridge High School students qualify for free and reduced priced meals, and almost 239 students use the school bus system to get to school and/or home each day.
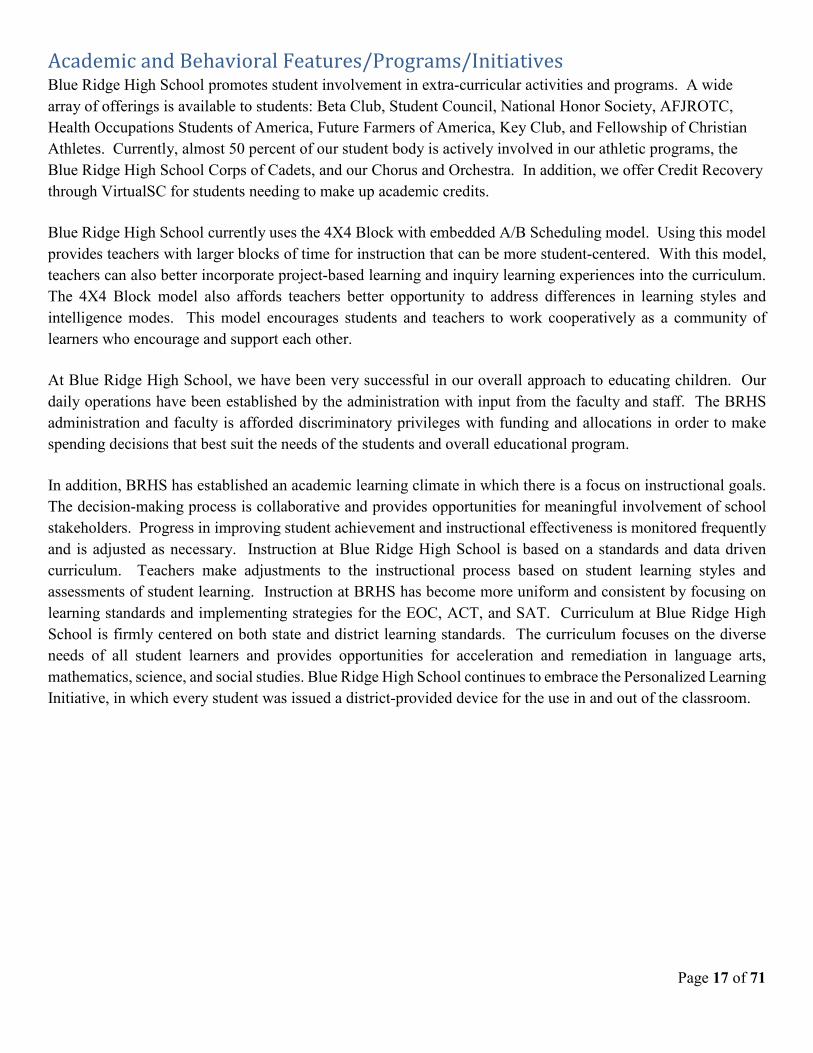
In addition, approximately 15 percent of BRHS students qualify for special education services. We offer special needs students support through resource classes as well as through self-contained classes. Students qualifying for the self-contained classes work towards an occupational diploma. 34 students have a 504 and receive accommodations. 49 students are limited English Proficient and are provided assistance through an ESOL teacher and receive accommodations. Over the past five years our special needs population has grown at approximately the same rate as our school enrollment.
5%5%
86%
4%
Student Ethnicity
Hispanic African American Caucasian Other
0
50
100
150
200
250
1
Number of Students Receiving Special Services
LEP
504
Self-Contained
Resource
Page 17 of 71
Academic and Behavioral Features/Programs/Initiatives Blue Ridge High School promotes student involvement in extra-curricular activities and programs. A wide array of offerings is available to students: Beta Club, Student Council, National Honor Society, AFJROTC, Health Occupations Students of America, Future Farmers of America, Key Club, and Fellowship of Christian Athletes. Currently, almost 50 percent of our student body is actively involved in our athletic programs, the Blue Ridge High School Corps of Cadets, and our Chorus and Orchestra. In addition, we offer Credit Recovery through VirtualSC for students needing to make up academic credits.
Blue Ridge High School currently uses the 4X4 Block with embedded A/B Scheduling model. Using this model provides teachers with larger blocks of time for instruction that can be more student-centered. With this model, teachers can also better incorporate project-based learning and inquiry learning experiences into the curriculum. The 4X4 Block model also affords teachers better opportunity to address differences in learning styles and intelligence modes. This model encourages students and teachers to work cooperatively as a community of learners who encourage and support each other.
At Blue Ridge High School, we have been very successful in our overall approach to educating children. Our daily operations have been established by the administration with input from the faculty and staff. The BRHS administration and faculty is afforded discriminatory privileges with funding and allocations in order to make spending decisions that best suit the needs of the students and overall educational program.
In addition, BRHS has established an academic learning climate in which there is a focus on instructional goals. The decision-making process is collaborative and provides opportunities for meaningful involvement of school stakeholders. Progress in improving student achievement and instructional effectiveness is monitored frequently and is adjusted as necessary. Instruction at Blue Ridge High School is based on a standards and data driven curriculum. Teachers make adjustments to the instructional process based on student learning styles and assessments of student learning. Instruction at BRHS has become more uniform and consistent by focusing on learning standards and implementing strategies for the EOC, ACT, and SAT. Curriculum at Blue Ridge High School is firmly centered on both state and district learning standards. The curriculum focuses on the diverse needs of all student learners and provides opportunities for acceleration and remediation in language arts, mathematics, science, and social studies. Blue Ridge High School continues to embrace the Personalized Learning Initiative, in which every student was issued a district-provided device for the use in and out of the classroom.
Page 18 of 71
MISSION, VISION, AND BELIEFS We, the faculty and staff of Blue Ridge High, believe our purpose is to serve the community by preparing the successful adults of tomorrow. This purpose is very important for creating the mission, vision, and beliefs of Blue Ridge High.
During this self-study for SACS, our mission, vision, and beliefs were revisited to determine if any changes were necessary. Blue Ridge High School's vision portrays what the school will be like when the mission is achieved. In our SACS study committee we discussed the beliefs to determine their continuing relevance to us. After minor revisions, the mission, vision, and beliefs were reviewed and agreed upon by the faculty and staff.
Our mission is…
…to offer each student interdisciplinary experiences that develop intellectual, social, physical, creative, and technological potential
in a safe environment.
Our vision at Blue Ridge High School is to create a school where:
• Each student will feel that the curriculum has prepared him or her for college and/or the workforce.
• The curriculum will be relevant, challenging and interesting.
• The curriculum will be always expanding, never stagnant, and changing to meet the needs of the student.
• Instruction will value student input.
• Instruction will be enhanced with technology when applicable.
• Instruction will be accurate, well-planned, professional, and effective.
• Each student will be assessed proportionately on content and skills taught in the instructional process.
• Each student will be aware of the expectations that will be assessed.
• A variety of assessment techniques will be used.
• Assessment will be fair, accurate, and will require critical thinking.
• Students, teachers, and administration will feel pride and ownership in Blue Ridge High School.

Page 19 of 71
• Blue Ridge High School will be safe, clean, comfortable, and provide an environment that is conducive to learning.
• Blue Ridge High’s environment will reflect student accomplishments.
• Blue Ridge High School will set the standard for all other schools in the Southeast.
We believe that…
• The student is the center of the educational process.
• Every student is a unique individual and that the curriculum should be designed to address a variety of learning styles, assessment techniques, and a broad range of interests.
• Students should expect professionalism and support from all faculty, staff, and support personnel.
• Students should be nurtured and challenged to fully realize their gifts and skills.
• As an essential element of the educational process, each student must accept responsibility to be an active learner and supporter of the learning environment.
• We must offer the students interdisciplinary experiences which will prepare them as cooperative problem solvers and responsible decision-makers in the workplace.
• The academic program should adequately prepare students to meet or exceed established state standards.
• We have an obligation to help each student learn to deal with a technologically advanced 21st century in positive and creative ways.
• We must foster in all students an attitude of understanding and appreciation for cultural, physical, and other differences among people.
• Blue Ridge High School, as a partner with the home and community, should strive to exemplify characteristics of citizenship, self-sufficiency, and strong moral character.
• Blue Ridge High School, as a partner with the home and community, must teach individual responsibility for one’s actions and acceptance of consequences appropriate to one’s behavior.
Page 20 of 71
DATA ANALYSIS AND NEEDS ASSESSMENT
Student Achievement Outcomes and Needs Assessment
Evidence of Strengths • Instruction is aligned with state learning standards, as well as with national, state, and district goals and
expectations of student learning.
• Students are actively involved in the learning.
• Science teachers used hands-on laboratory experiences to emphasize standards.
• Various types of grouping strategies are used in the classroom to help students understand instruction and to encourage active participation.
• Advanced Placement courses are offered in English, Math, Science, Social Studies, Foreign Language and Computer Science.
• Learner expectations are clearly stated in district curriculum guides and South Carolina frameworks.
• Technology is used to enhance the learning process (internet research, Power Point presentations, video streaming, Microsoft Word, Inter-write Pads, etc.).
• Advance Placement (AP), Honors, Advanced, and Applied College Prep levels of courses are offered.
• Career and Technology courses are offered, which include Family and Consumer Sciences, Business Education and Agriculture Education.
• We have built a comprehensive foreign language program, offering four languages: French, German, Latin, and Spanish. In addition, we offer four levels of each language.
• Blue Ridge High has a strong arts program. Our choral students, band members, and visual art students have received numerous honors and awards.
• Special education classes are provided (resource and self-contained).
• Appropriate methods of unbiased assessment are chosen, based on class, district, and state goals.
• Expectations for assignments are conveyed before assessments are taken. Thus, students have a clear understanding of the expectations before beginning an assignment.
Page 21 of 71
Evidence of Need • Additional preparation and assistance is needed for students taking SAT and ACT.
• Even though progress has been made in the use of different types of assessments, more variety would be beneficial.
• Continue using USA Test Prep online software to enhance student preparation for HSAP and EOC.
• Continue using USA Test Prep as a means of creating common assessments to give teachers the opportunity to collaborate with fellow colleagues and identify best practices to help effectively teach content standards.
• Continue working with at-risk students.
Teacher and Administrator Outcomes and Needs Assessment
Evidence of Strengths • The school collaboratively develops a school wide plan for improvement.
• Teachers analyze student achievement on classroom assessments, common unit assessments, benchmark assessments and standardized tests in order to determine how to best help students succeed.
• The use of POWERTEACHER has aided teachers in keeping accurate records of student attendance.
• The use of POWERTEACHER(grade book software) has aided teachers in keeping accurate records of student progress. The use of this program has also increased parent communication by enabling teachers to send electronic progress reports to parents via email.
• POWERTEACHER training is available as needed.
• District committees and school staff are working to better align instruction with those specific goals and objectives.
• Departmental meetings allow opportunities for sharing ideas and support.
• Teachers use the following types of data to make instructional decisions: school report card, classroom assessments, Individual Education Plans (IEP’s), and observations.
• Teachers have access to internet resources, materials in the media center, ETV streamline video, distance learning, content department and instructional leaders and on-site workshops to help improve instruction.
Page 22 of 71
• Teachers work cooperatively on creating common syllabi for courses. Teachers provide syllabi to students and parents. The syllabi are aligned to the state curriculum standards and include classroom expectations, grading policies, and an outline of course content.
• Teachers provide syllabi and outlines of courses on their websites.
• Teachers meet at school, district, and state levels to receive and share knowledge in updating the curriculum.
• Departmental meetings are held bi-monthly to address curriculum related issues and to share ideas.
• Faculty in-services focus on improving student achievement.
• Common unit assessments are used by all teachers teaching a course with other teachers and data analysis meetings are held to review data and instructional strategies.
• Teachers use a variety of assessments: standardized tests, objective tests, essays, daily work, homework, portfolios, projects, rubrics, grading scales, and performance assessments.
Evidence of Need • Opportunities for peer observations are needed.
• Vertical Team meetings are needed to allow opportunities for sharing ideas and support.
• Additional departmental planning opportunities are needed in order to continue our focus on refining curriculum foundations.
School Climate Outcomes and Needs Assessment
Evidence of Strengths • SIC meetings are held monthly to discuss how community and parent representatives can contribute to
the school improvement process.
• Parent meetings for rising 9th students identified as at risk from the feeder middle school.
• Over 80% of teachers and students responded they were satisfied with the learning environment on the latest school report card survey.
• Over 80% of parents and students responded they were satisfied with the social and physical environment on the latest school report card survey.
Page 23 of 71
• Over 80% of teachers and students responded they were satisfied with the school-home relations on the latest school report card survey.
Evidence of Need • Establish a committee to formulate more comprehensive plans to decrease learning gaps in student
achievement.
• Under 80% of parents responded they were satisfied with the learning environment on the latest school report card survey.
• Under 80% of parents responded they were satisfied with the social and physical environment on the latest school report card survey.
• Under 80% of parents responded they were satisfied with the school-home relations on the latest school report card survey.
Page 24 of 71
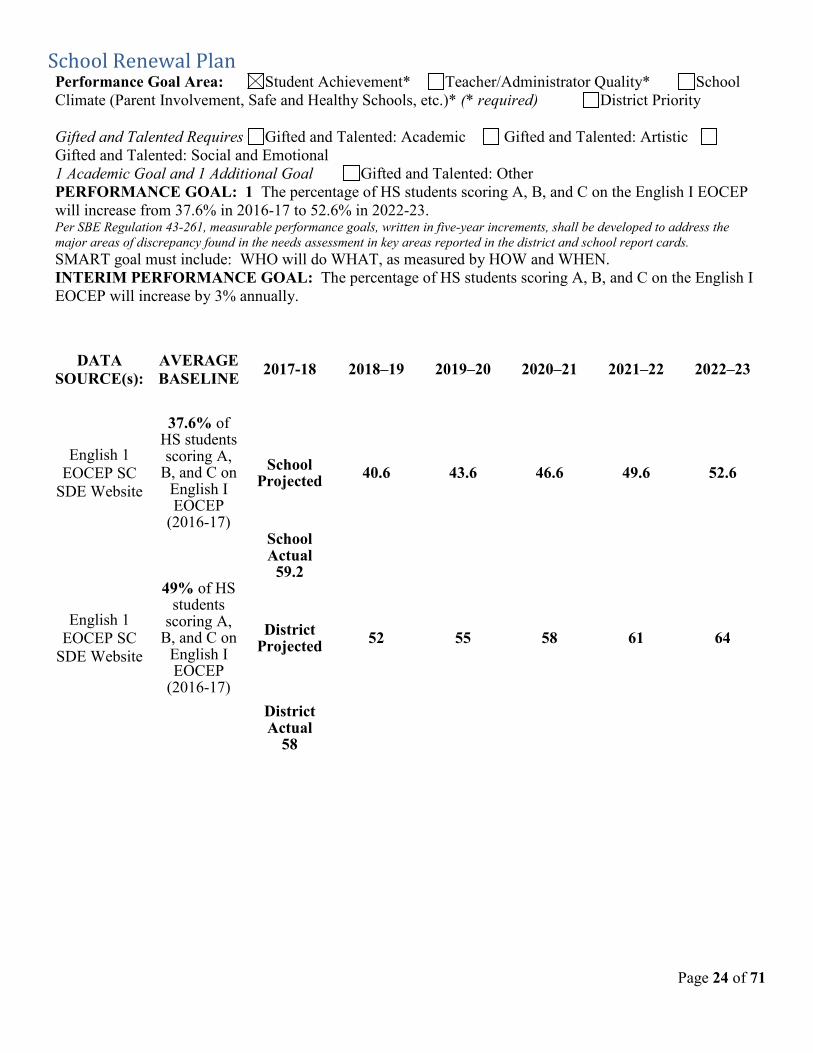
School Renewal Plan Performance Goal Area: Student Achievement* Teacher/Administrator Quality* School Climate (Parent Involvement, Safe and Healthy Schools, etc.)* (* required) District Priority Gifted and Talented Requires Gifted and Talented: Academic Gifted and Talented: Artistic Gifted and Talented: Social and Emotional 1 Academic Goal and 1 Additional Goal Gifted and Talented: Other PERFORMANCE GOAL: 1 The percentage of HS students scoring A, B, and C on the English I EOCEP will increase from 37.6% in 2016-17 to 52.6% in 2022-23. Per SBE Regulation 43-261, measurable performance goals, written in five-year increments, shall be developed to address the major areas of discrepancy found in the needs assessment in key areas reported in the district and school report cards. SMART goal must include: WHO will do WHAT, as measured by HOW and WHEN. INTERIM PERFORMANCE GOAL: The percentage of HS students scoring A, B, and C on the English I EOCEP will increase by 3% annually.
DATA SOURCE(s):
AVERAGE BASELINE 2017-18 2018–19 2019–20 2020–21 2021–22 2022–23
English 1 EOCEP SC
SDE Website
37.6% of HS students scoring A,
B, and C on English I EOCEP
(2016-17)
School Projected 40.6 43.6 46.6 49.6 52.6
School Actual
59.2
English 1 EOCEP SC
SDE Website
49% of HS students
scoring A, B, and C on
English I EOCEP
(2016-17)
District Projected 52 55 58 61 64
District Actual
58
Page 25 of 71
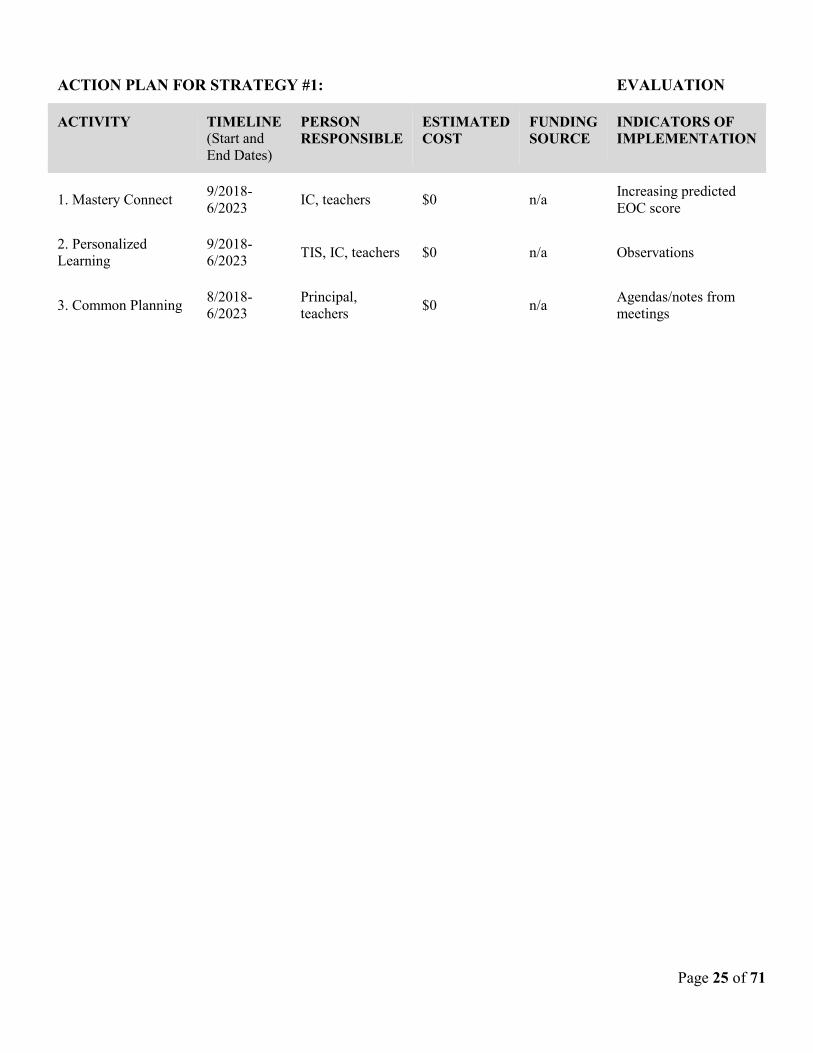
ACTION PLAN FOR STRATEGY #1: EVALUATION
ACTIVITY
TIMELINE (Start and End Dates)
PERSON RESPONSIBLE
ESTIMATED COST
FUNDING SOURCE
INDICATORS OF IMPLEMENTATION
1. Mastery Connect 9/2018-6/2023 IC, teachers $0 n/a Increasing predicted
EOC score
2. Personalized Learning
9/2018-6/2023 TIS, IC, teachers $0 n/a Observations
3. Common Planning 8/2018-6/2023
Principal, teachers $0 n/a Agendas/notes from
meetings
Page 26 of 71
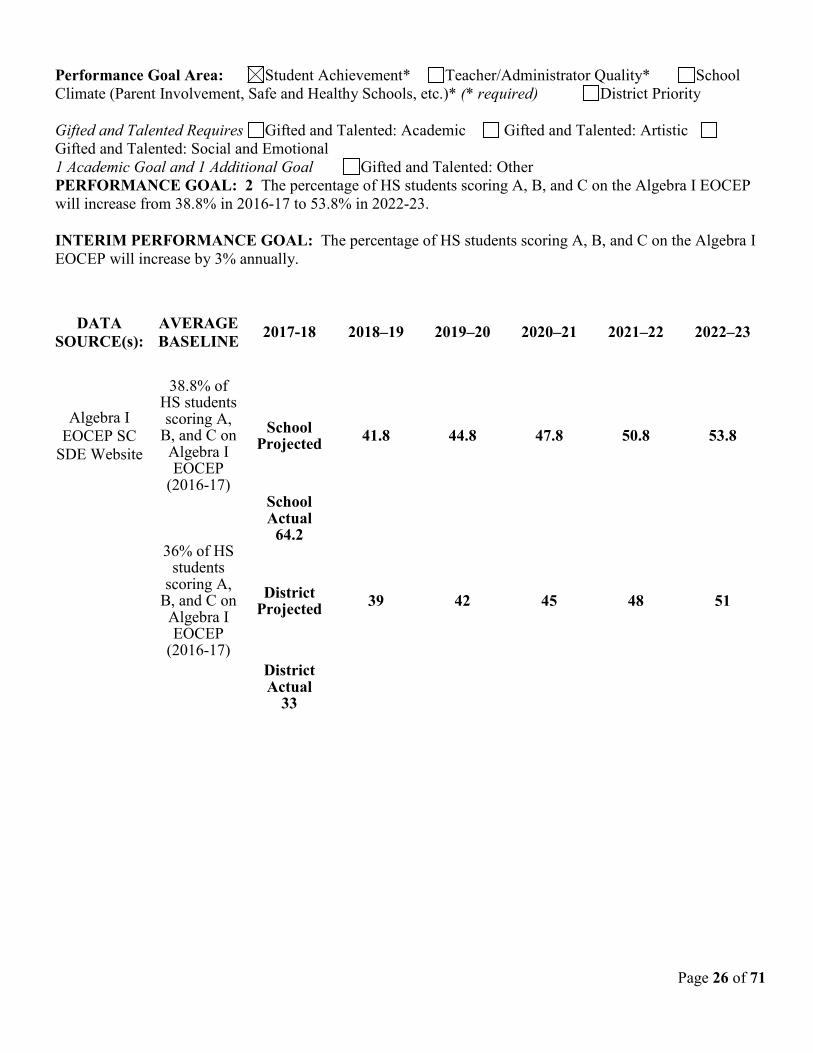
Performance Goal Area: Student Achievement* Teacher/Administrator Quality* School Climate (Parent Involvement, Safe and Healthy Schools, etc.)* (* required) District Priority Gifted and Talented Requires Gifted and Talented: Academic Gifted and Talented: Artistic Gifted and Talented: Social and Emotional 1 Academic Goal and 1 Additional Goal Gifted and Talented: Other PERFORMANCE GOAL: 2 The percentage of HS students scoring A, B, and C on the Algebra I EOCEP will increase from 38.8% in 2016-17 to 53.8% in 2022-23. INTERIM PERFORMANCE GOAL: The percentage of HS students scoring A, B, and C on the Algebra I EOCEP will increase by 3% annually.
DATA SOURCE(s):
AVERAGE BASELINE 2017-18 2018–19 2019–20 2020–21 2021–22 2022–23
Algebra I EOCEP SC
SDE Website
38.8% of HS students scoring A,
B, and C on Algebra I EOCEP
(2016-17)
School Projected 41.8 44.8 47.8 50.8 53.8
School Actual
64.2
36% of HS students
scoring A, B, and C on Algebra I EOCEP
(2016-17)
District Projected 39 42 45 48 51
District Actual
33
Page 27 of 71
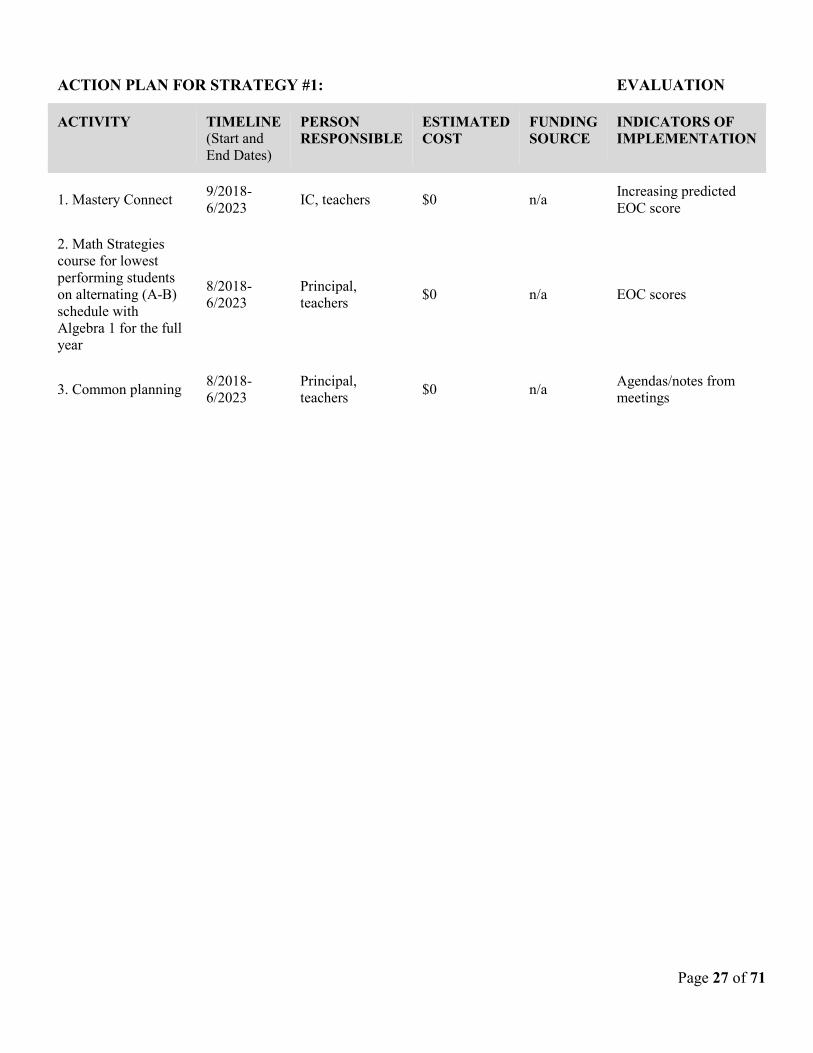
ACTION PLAN FOR STRATEGY #1: EVALUATION
ACTIVITY
TIMELINE (Start and End Dates)
PERSON RESPONSIBLE
ESTIMATED COST
FUNDING SOURCE
INDICATORS OF IMPLEMENTATION
1. Mastery Connect 9/2018-6/2023 IC, teachers $0 n/a Increasing predicted
EOC score
2. Math Strategies course for lowest performing students on alternating (A-B) schedule with Algebra 1 for the full year
8/2018-6/2023
Principal, teachers $0 n/a EOC scores
3. Common planning 8/2018-6/2023
Principal, teachers $0 n/a Agendas/notes from
meetings
Page 28 of 71
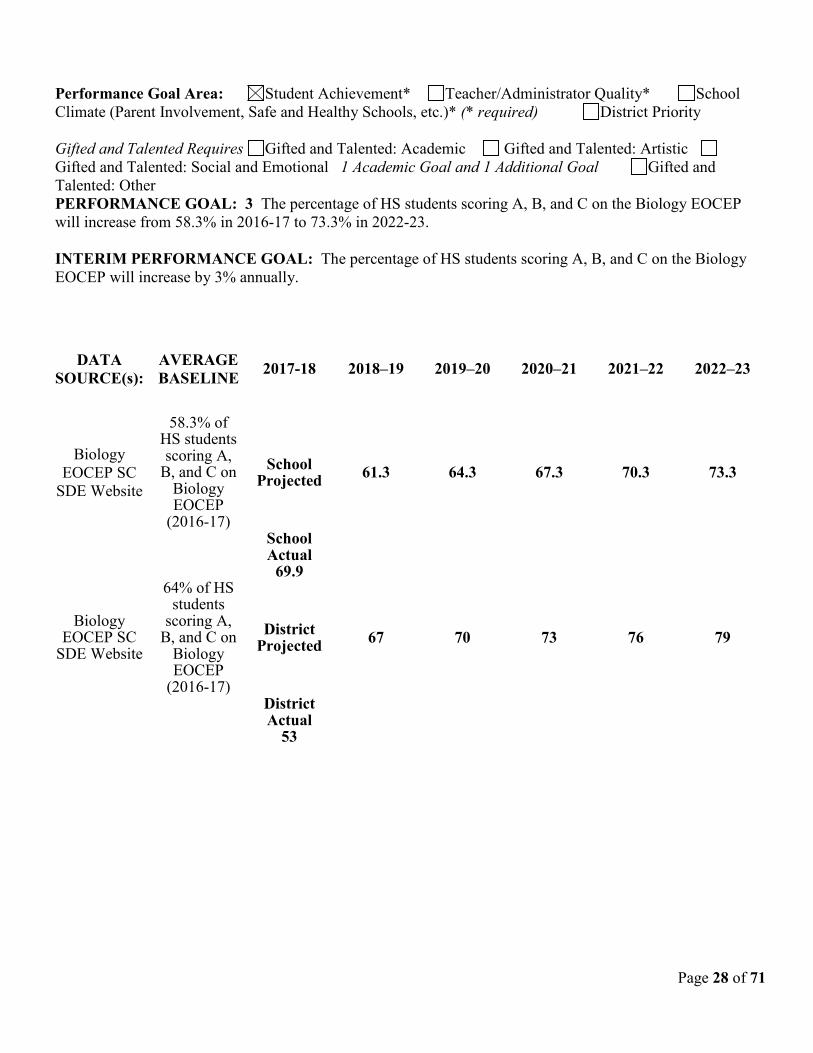
Performance Goal Area: Student Achievement* Teacher/Administrator Quality* School Climate (Parent Involvement, Safe and Healthy Schools, etc.)* (* required) District Priority Gifted and Talented Requires Gifted and Talented: Academic Gifted and Talented: Artistic Gifted and Talented: Social and Emotional 1 Academic Goal and 1 Additional Goal Gifted and Talented: Other PERFORMANCE GOAL: 3 The percentage of HS students scoring A, B, and C on the Biology EOCEP will increase from 58.3% in 2016-17 to 73.3% in 2022-23. INTERIM PERFORMANCE GOAL: The percentage of HS students scoring A, B, and C on the Biology EOCEP will increase by 3% annually.
DATA SOURCE(s):
AVERAGE BASELINE 2017-18 2018–19 2019–20 2020–21 2021–22 2022–23
Biology EOCEP SC
SDE Website
58.3% of HS students scoring A,
B, and C on Biology EOCEP
(2016-17)
School Projected 61.3 64.3 67.3 70.3 73.3
School Actual
69.9
Biology EOCEP SC
SDE Website
64% of HS students
scoring A, B, and C on
Biology EOCEP
(2016-17)
District Projected 67 70 73 76 79
District Actual
53
Page 29 of 71
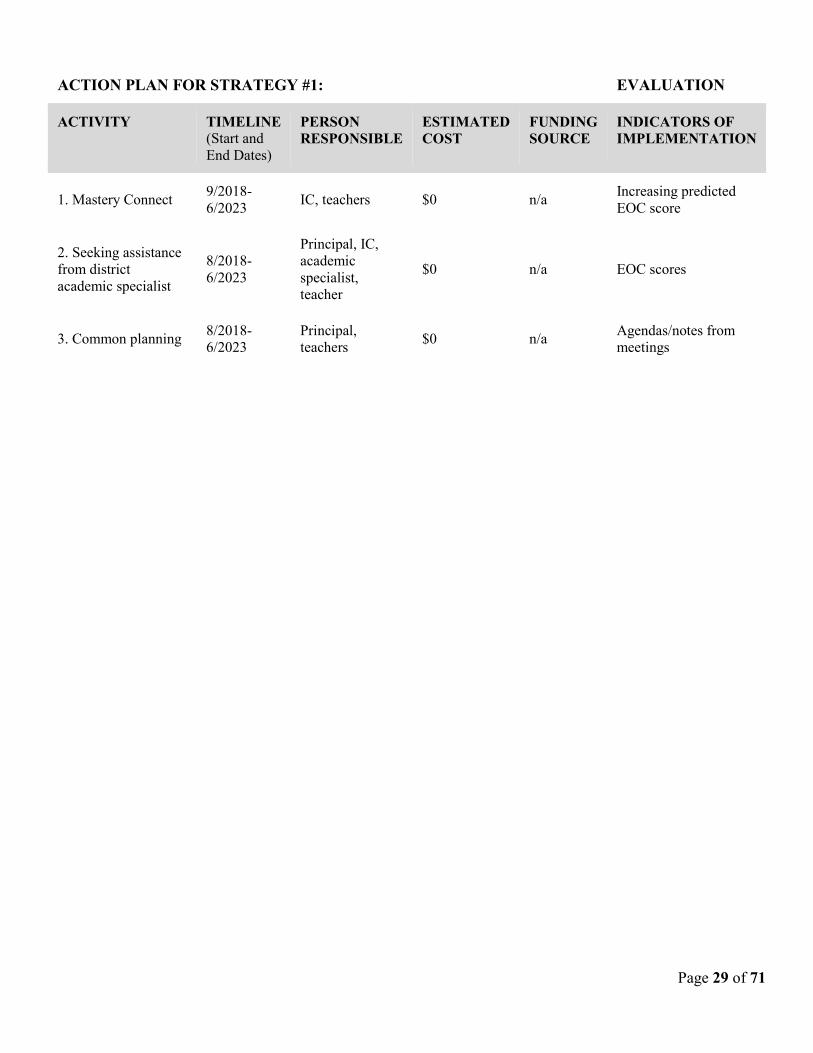
ACTION PLAN FOR STRATEGY #1: EVALUATION
ACTIVITY
TIMELINE (Start and End Dates)
PERSON RESPONSIBLE
ESTIMATED COST
FUNDING SOURCE
INDICATORS OF IMPLEMENTATION
1. Mastery Connect 9/2018-6/2023 IC, teachers $0 n/a Increasing predicted
EOC score
2. Seeking assistance from district academic specialist
8/2018-6/2023
Principal, IC, academic specialist, teacher
$0 n/a EOC scores
3. Common planning 8/2018-6/2023
Principal, teachers $0 n/a Agendas/notes from
meetings
Page 30 of 71
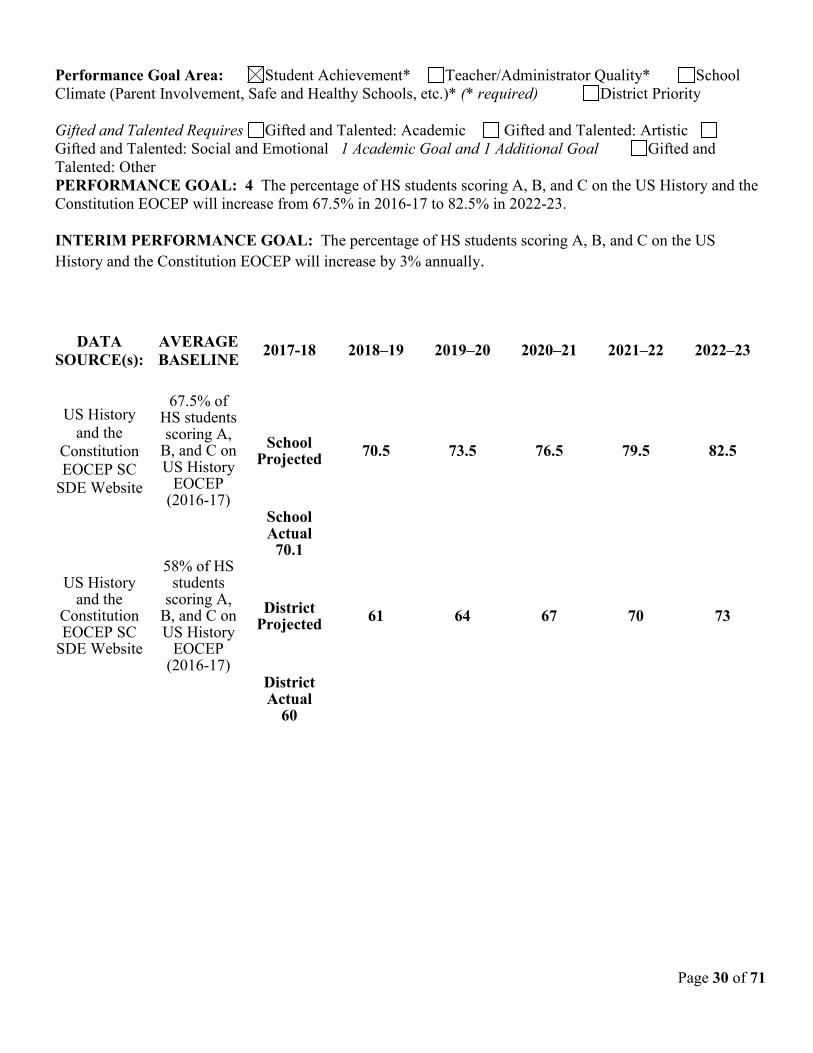
Performance Goal Area: Student Achievement* Teacher/Administrator Quality* School Climate (Parent Involvement, Safe and Healthy Schools, etc.)* (* required) District Priority Gifted and Talented Requires Gifted and Talented: Academic Gifted and Talented: Artistic Gifted and Talented: Social and Emotional 1 Academic Goal and 1 Additional Goal Gifted and Talented: Other PERFORMANCE GOAL: 4 The percentage of HS students scoring A, B, and C on the US History and the Constitution EOCEP will increase from 67.5% in 2016-17 to 82.5% in 2022-23. INTERIM PERFORMANCE GOAL: The percentage of HS students scoring A, B, and C on the US History and the Constitution EOCEP will increase by 3% annually.
DATA SOURCE(s):
AVERAGE BASELINE 2017-18 2018–19 2019–20 2020–21 2021–22 2022–23
US History and the
Constitution EOCEP SC
SDE Website
67.5% of HS students scoring A,
B, and C on US History
EOCEP (2016-17)
School Projected 70.5 73.5 76.5 79.5 82.5
School Actual
70.1
US History and the
Constitution EOCEP SC
SDE Website
58% of HS students
scoring A, B, and C on US History
EOCEP (2016-17)
District Projected 61 64 67 70 73
District Actual
60
Page 31 of 71
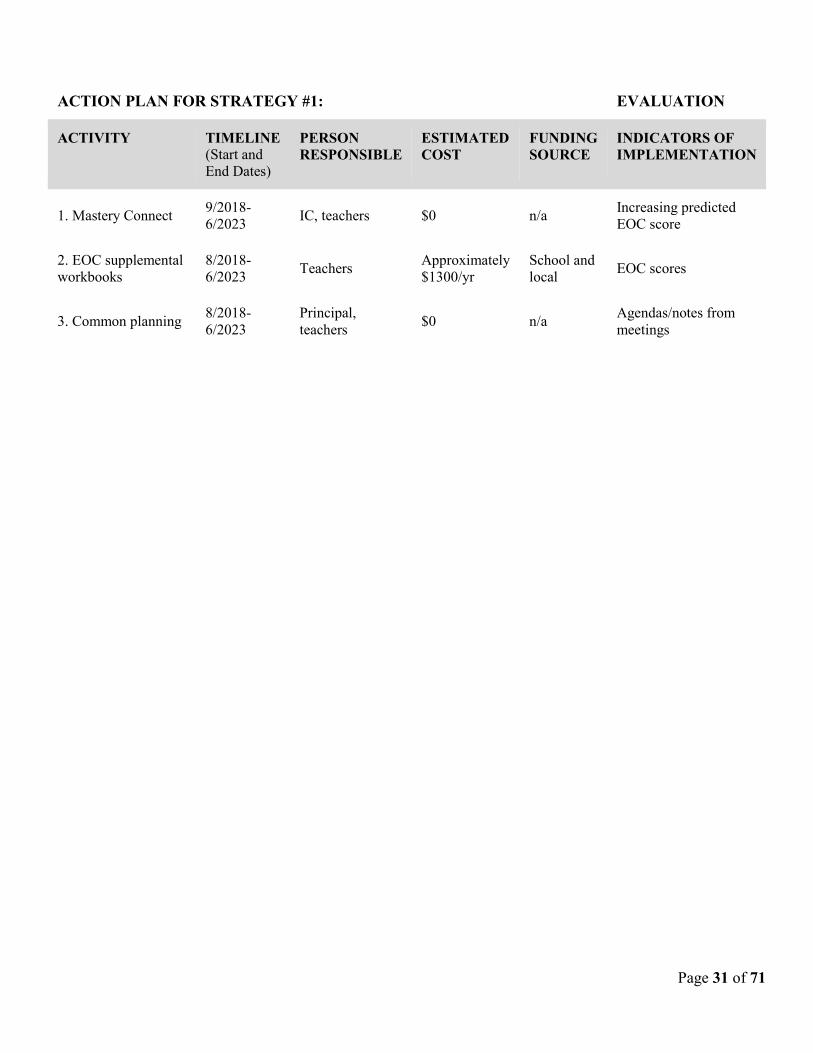
ACTION PLAN FOR STRATEGY #1: EVALUATION
ACTIVITY
TIMELINE (Start and End Dates)
PERSON RESPONSIBLE
ESTIMATED COST
FUNDING SOURCE
INDICATORS OF IMPLEMENTATION
1. Mastery Connect 9/2018-6/2023 IC, teachers $0 n/a Increasing predicted
EOC score
2. EOC supplemental workbooks
8/2018-6/2023 Teachers Approximately
$1300/yr School and local EOC scores
3. Common planning 8/2018-6/2023
Principal, teachers $0 n/a Agendas/notes from
meetings
Page 32 of 71
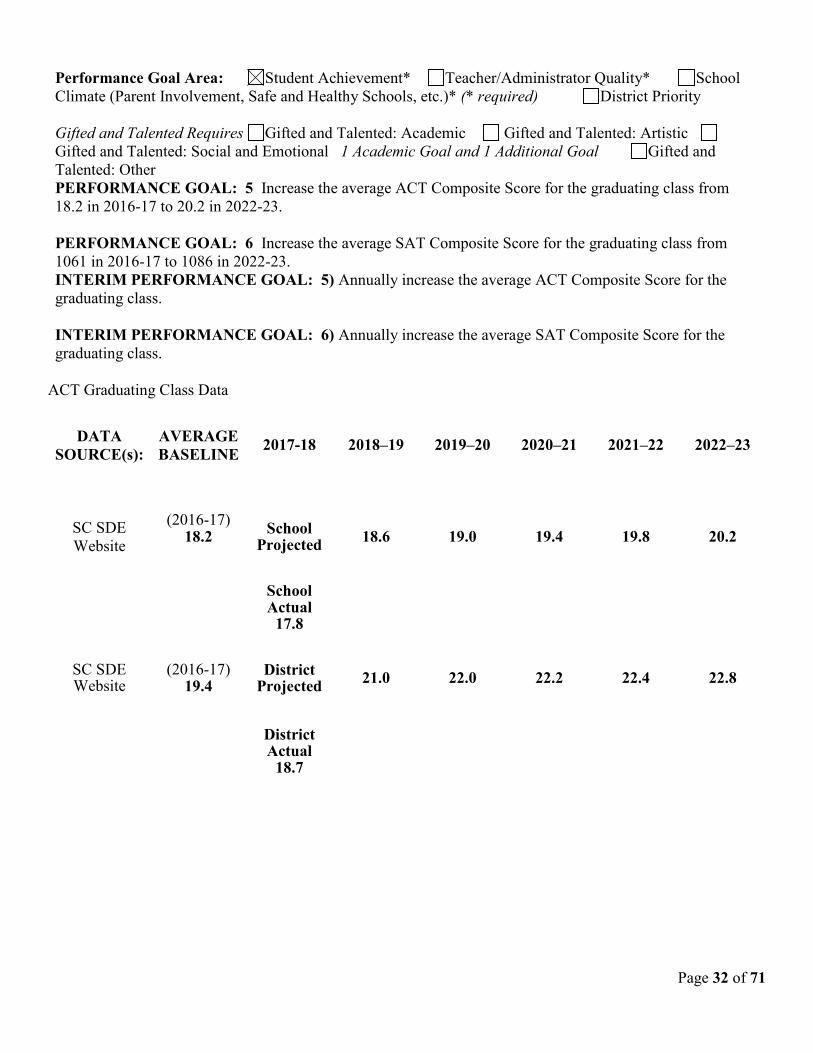
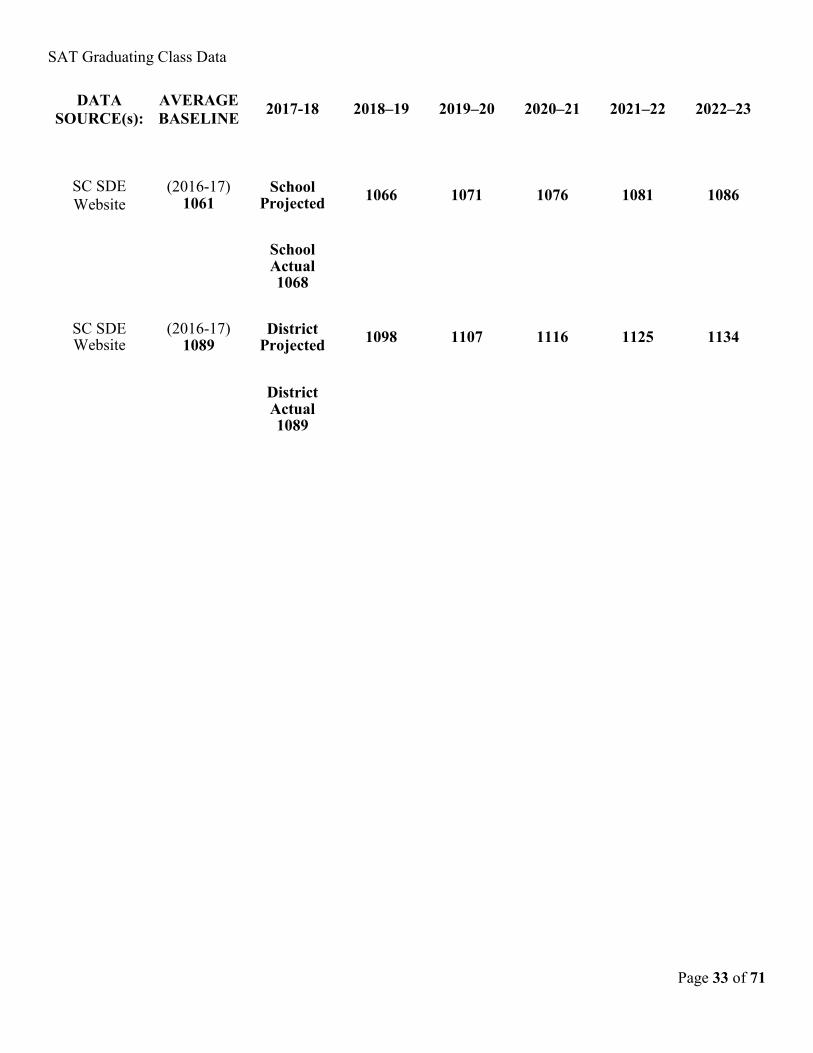
Performance Goal Area: Student Achievement* Teacher/Administrator Quality* School Climate (Parent Involvement, Safe and Healthy Schools, etc.)* (* required) District Priority Gifted and Talented Requires Gifted and Talented: Academic Gifted and Talented: Artistic Gifted and Talented: Social and Emotional 1 Academic Goal and 1 Additional Goal Gifted and Talented: Other PERFORMANCE GOAL: 5 Increase the average ACT Composite Score for the graduating class from 18.2 in 2016-17 to 20.2 in 2022-23. PERFORMANCE GOAL: 6 Increase the average SAT Composite Score for the graduating class from 1061 in 2016-17 to 1086 in 2022-23. INTERIM PERFORMANCE GOAL: 5) Annually increase the average ACT Composite Score for the graduating class. INTERIM PERFORMANCE GOAL: 6) Annually increase the average SAT Composite Score for the graduating class.
ACT Graduating Class Data
DATA SOURCE(s):
AVERAGE BASELINE 2017-18 2018–19 2019–20 2020–21 2021–22 2022–23
SC SDE Website
(2016-17) 18.2
School
Projected 18.6 19.0 19.4 19.8 20.2
School Actual
17.8
SC SDE Website
(2016-17) 19.4
District Projected 21.0 22.0 22.2 22.4 22.8
District Actual
18.7
Page 33 of 71
SAT Graduating Class Data
DATA SOURCE(s):
AVERAGE BASELINE 2017-18 2018–19 2019–20 2020–21 2021–22 2022–23
SC SDE Website
(2016-17) 1061
School Projected 1066 1071 1076 1081 1086
School Actual 1068
SC SDE Website
(2016-17) 1089
District Projected 1098 1107 1116 1125 1134
District Actual 1089
Page 34 of 71
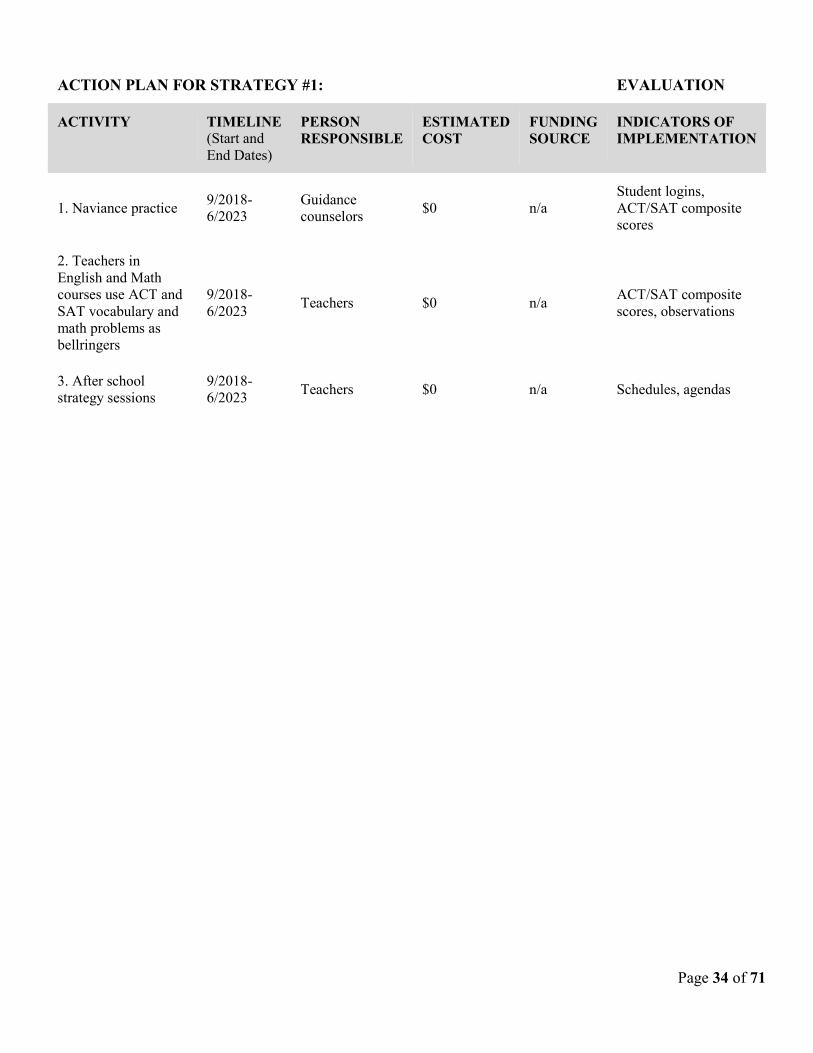
ACTION PLAN FOR STRATEGY #1: EVALUATION
ACTIVITY
TIMELINE (Start and End Dates)
PERSON RESPONSIBLE
ESTIMATED COST
FUNDING SOURCE
INDICATORS OF IMPLEMENTATION
1. Naviance practice 9/2018-6/2023
Guidance counselors $0 n/a
Student logins, ACT/SAT composite scores
2. Teachers in English and Math courses use ACT and SAT vocabulary and math problems as bellringers
9/2018-6/2023 Teachers $0 n/a ACT/SAT composite
scores, observations
3. After school strategy sessions
9/2018-6/2023 Teachers $0 n/a Schedules, agendas

Page 35 of 71
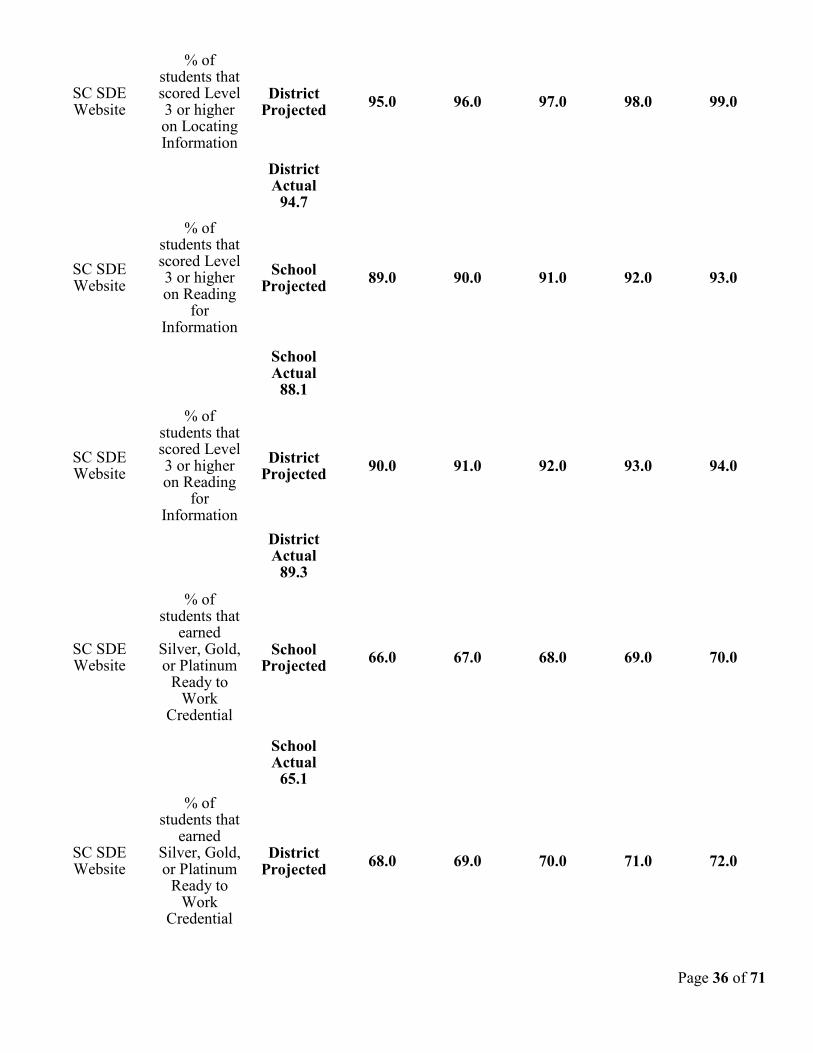
Performance Goal Area: Student Achievement* Teacher/Administrator Quality* School Climate (Parent Involvement, Safe and Healthy Schools, etc.)* (* required) District Priority Gifted and Talented Requires Gifted and Talented: Academic Gifted and Talented: Artistic Gifted and Talented: Social and Emotional 1 Academic Goal and 1 Additional Goal Gifted and Talented: Other PERFORMANCE GOAL: 7 Students will meet or exceed the state and federal accountability standard as measured by the WIN Ready 2 Work Career Readiness Assessment from 2018-19 through 2022-23. INTERIM PERFORMANCE GOAL: Annually meet or exceed the standard as measured by the WIN Ready 2 Work Career Readiness Assessment.
DATA SOURCE(s):
AVERAGE BASELINE 2017-18 2018–19 2019–20 2020–21 2021–22 2022–23
SC SDE Website
% of students that scored Level 3 or higher on Applied
Mathematics
School Projected 93.0 94.0 95.0 96.0 97.0
School Actual
92.2
SC SDE Website
% of students that scored Level 3 or higher on Applied
Mathematics
District Projected 94.0 95.0 96.0 97.0 98.0
District Actual
93.7
SC SDE Website
% of students that scored Level
3 on Locating
Information
School Projected 96.0 97.0 98.0 99.0 99.0
School Actual
95.9
Page 36 of 71
SC SDE Website
% of students that scored Level 3 or higher on Locating Information
District Projected 95.0 96.0 97.0 98.0 99.0
District Actual
94.7
SC SDE Website
% of students that scored Level 3 or higher on Reading
for Information
School Projected 89.0 90.0 91.0 92.0 93.0
School Actual
88.1
SC SDE Website
% of students that scored Level 3 or higher on Reading
for Information
District Projected 90.0 91.0 92.0 93.0 94.0
District Actual
89.3
SC SDE Website
% of students that
earned Silver, Gold, or Platinum
Ready to Work
Credential
School Projected 66.0 67.0 68.0 69.0 70.0
School Actual
65.1
SC SDE Website
% of students that
earned Silver, Gold, or Platinum
Ready to Work
Credential
District Projected 68.0 69.0 70.0 71.0 72.0

Page 37 of 71
District Actual
67.1
Page 38 of 71
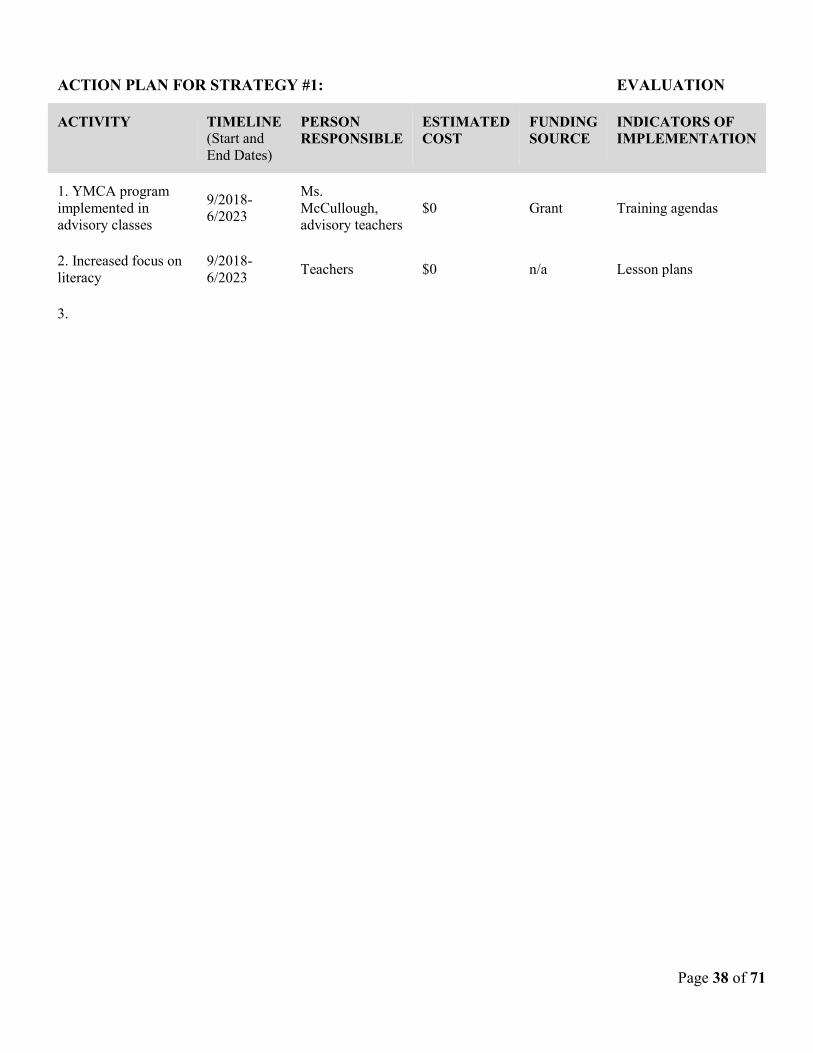
ACTION PLAN FOR STRATEGY #1: EVALUATION
ACTIVITY
TIMELINE (Start and End Dates)
PERSON RESPONSIBLE
ESTIMATED COST
FUNDING SOURCE
INDICATORS OF IMPLEMENTATION
1. YMCA program implemented in advisory classes
9/2018-6/2023
Ms. McCullough, advisory teachers
$0 Grant Training agendas
2. Increased focus on literacy
9/2018-6/2023 Teachers $0 n/a Lesson plans
3.
Page 39 of 71
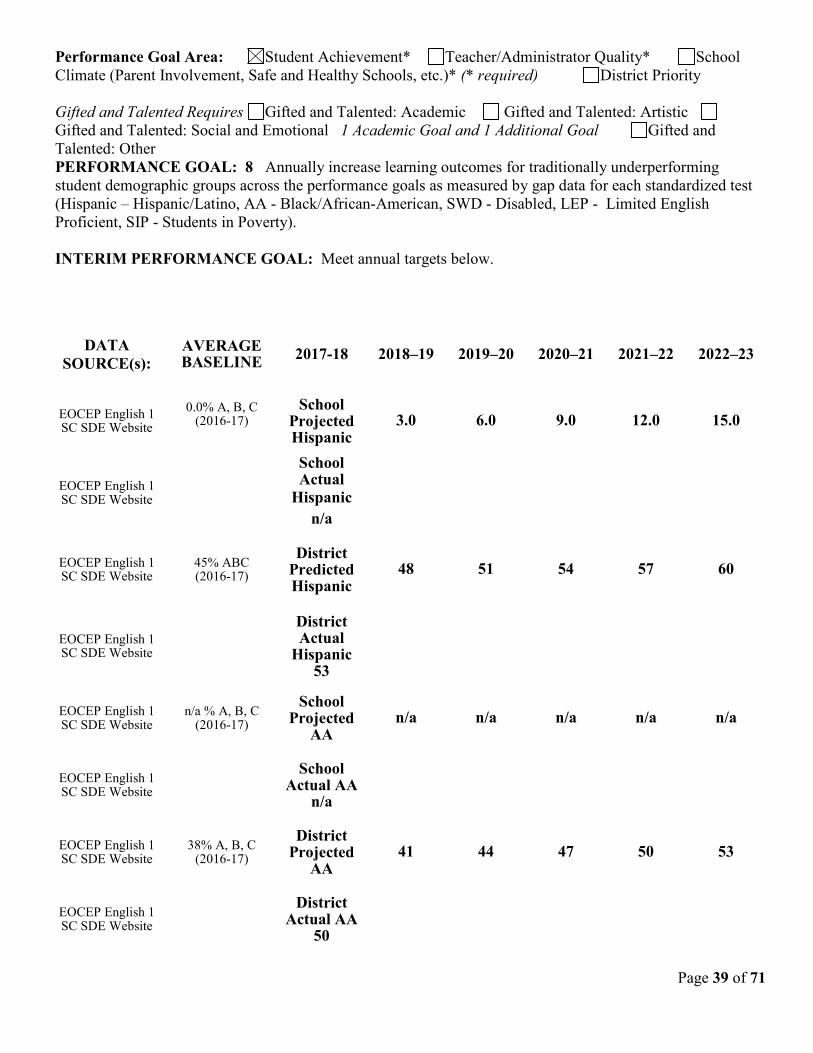
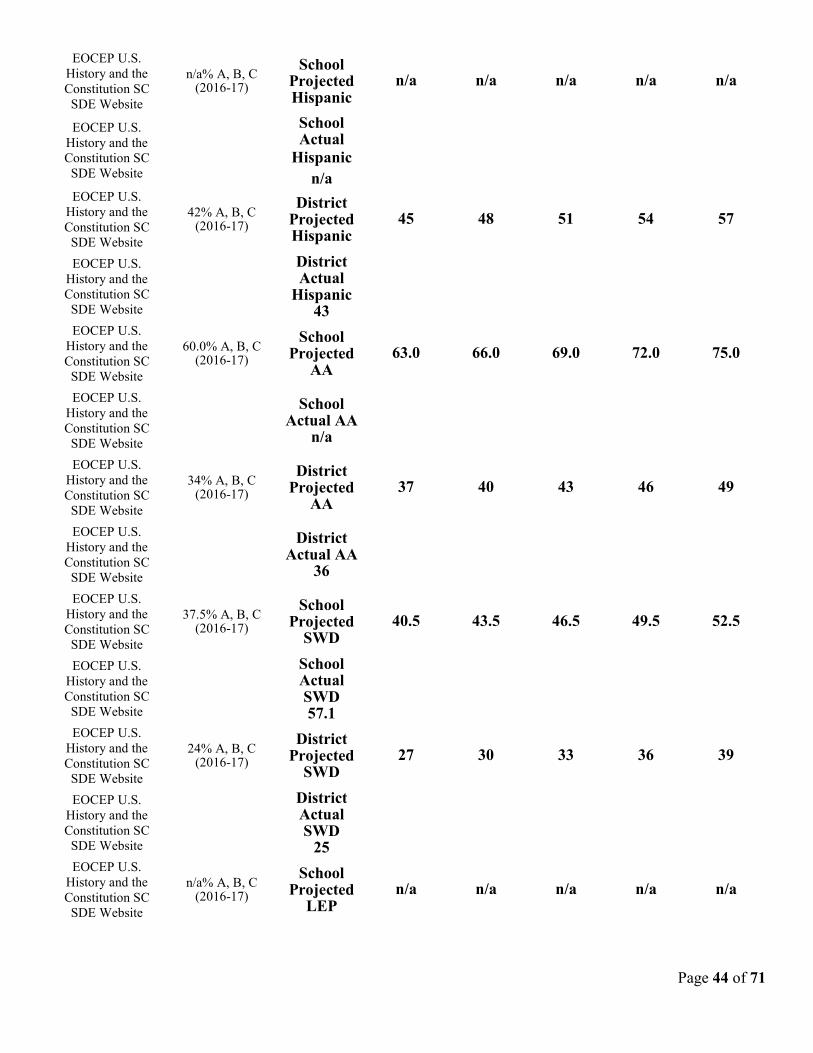
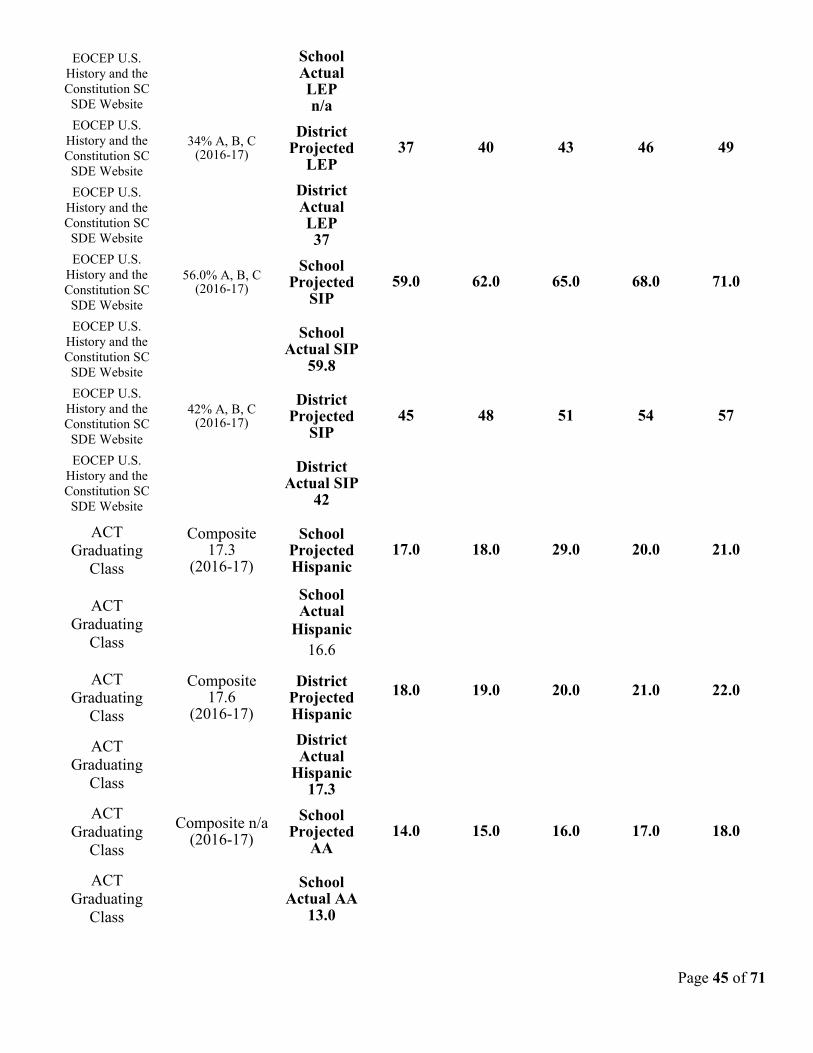
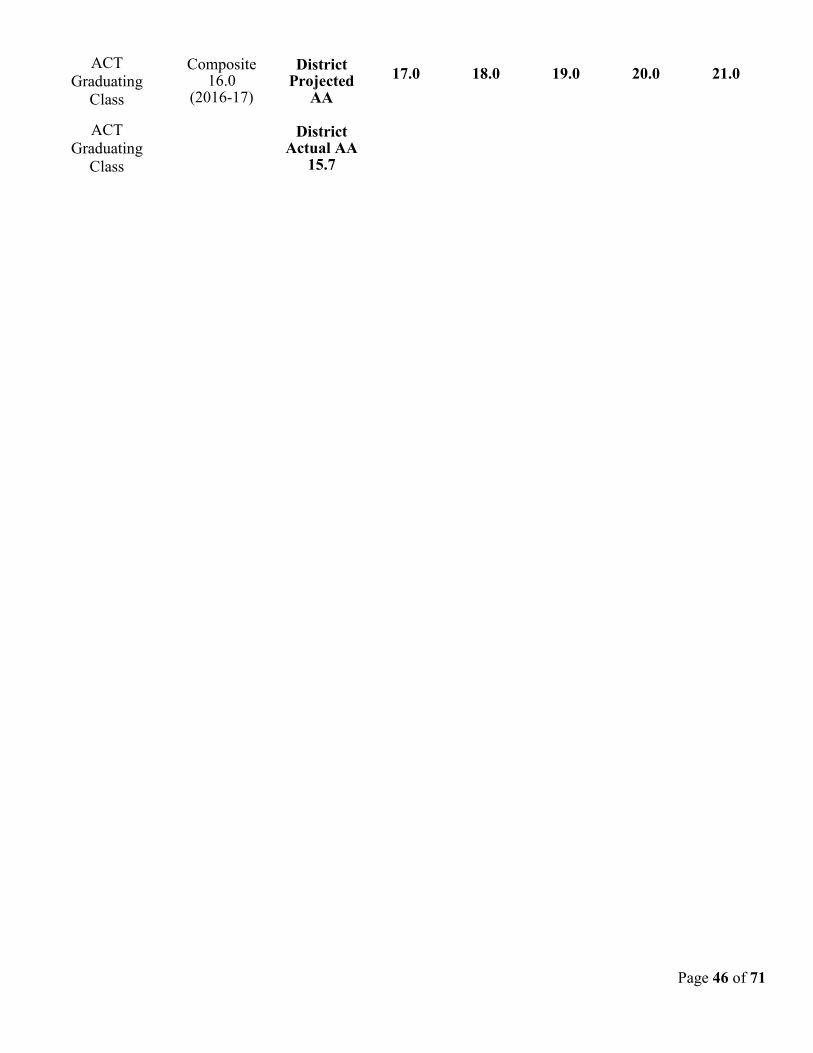
Performance Goal Area: Student Achievement* Teacher/Administrator Quality* School Climate (Parent Involvement, Safe and Healthy Schools, etc.)* (* required) District Priority Gifted and Talented Requires Gifted and Talented: Academic Gifted and Talented: Artistic Gifted and Talented: Social and Emotional 1 Academic Goal and 1 Additional Goal Gifted and Talented: Other PERFORMANCE GOAL: 8 Annually increase learning outcomes for traditionally underperforming student demographic groups across the performance goals as measured by gap data for each standardized test (Hispanic – Hispanic/Latino, AA - Black/African-American, SWD - Disabled, LEP - Limited English Proficient, SIP - Students in Poverty). INTERIM PERFORMANCE GOAL: Meet annual targets below.
DATA SOURCE(s):
AVERAGE BASELINE 2017-18 2018–19 2019–20 2020–21 2021–22 2022–23
EOCEP English 1 SC SDE Website
0.0% A, B, C (2016-17)
School Projected Hispanic
3.0 6.0 9.0 12.0 15.0
EOCEP English 1 SC SDE Website
School Actual
Hispanic n/a
EOCEP English 1 SC SDE Website
45% ABC (2016-17)
District Predicted Hispanic
48 51 54 57 60
EOCEP English 1 SC SDE Website
District Actual
Hispanic 53
EOCEP English 1 SC SDE Website
n/a % A, B, C (2016-17)
School Projected
AA n/a n/a n/a n/a n/a
EOCEP English 1 SC SDE Website
School Actual AA
n/a
EOCEP English 1 SC SDE Website
38% A, B, C (2016-17)
District Projected
AA 41 44 47 50 53
EOCEP English 1 SC SDE Website
District Actual AA
50
Page 40 of 71
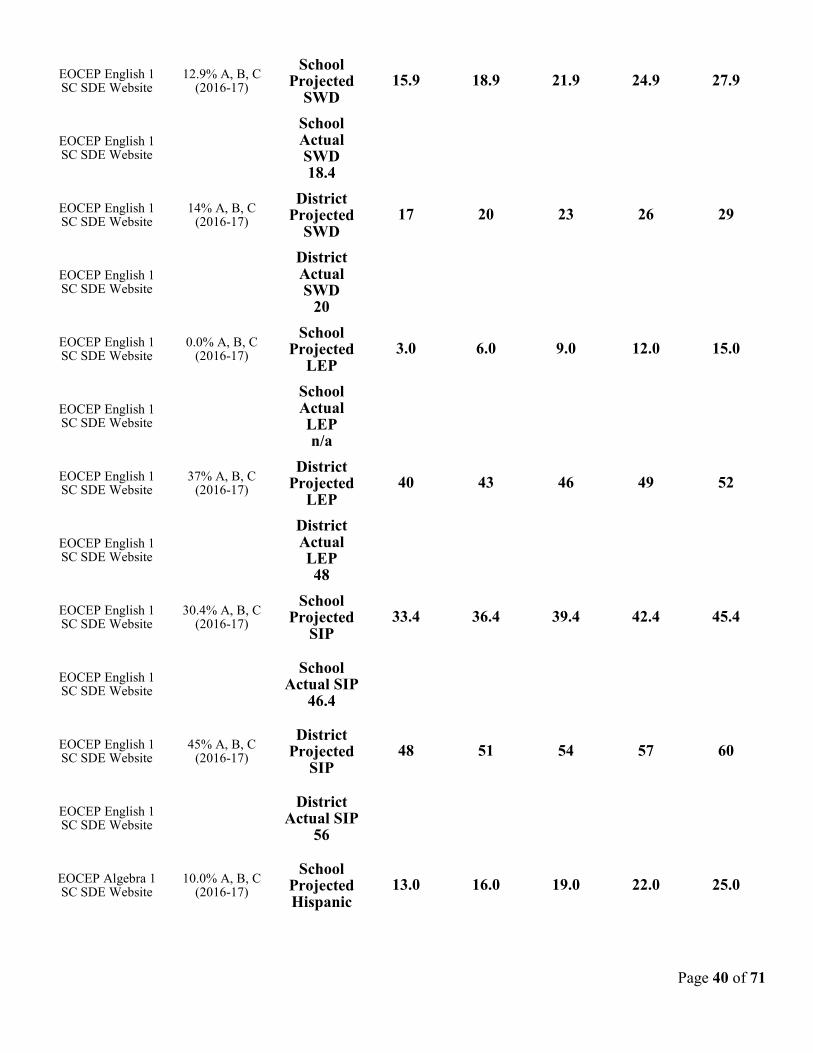
EOCEP English 1 SC SDE Website
12.9% A, B, C (2016-17)
School Projected
SWD 15.9 18.9 21.9 24.9 27.9
EOCEP English 1 SC SDE Website
School Actual SWD 18.4
EOCEP English 1 SC SDE Website
14% A, B, C (2016-17)
District Projected
SWD 17 20 23 26 29
EOCEP English 1 SC SDE Website
District Actual SWD
20
EOCEP English 1 SC SDE Website
0.0% A, B, C (2016-17)
School Projected
LEP 3.0 6.0 9.0 12.0 15.0
EOCEP English 1 SC SDE Website
School Actual LEP n/a
EOCEP English 1 SC SDE Website
37% A, B, C (2016-17)
District Projected
LEP 40 43 46 49 52
EOCEP English 1 SC SDE Website
District Actual LEP 48
EOCEP English 1 SC SDE Website
30.4% A, B, C (2016-17)
School Projected
SIP 33.4 36.4 39.4 42.4 45.4
EOCEP English 1 SC SDE Website
School Actual SIP
46.4
EOCEP English 1 SC SDE Website
45% A, B, C (2016-17)
District Projected
SIP 48 51 54 57 60
EOCEP English 1 SC SDE Website
District Actual SIP
56
EOCEP Algebra 1 SC SDE Website
10.0% A, B, C (2016-17)
School Projected Hispanic
13.0 16.0 19.0 22.0 25.0

Page 41 of 71
EOCEP Algebra 1 SC SDE Website
School Actual
Hispanic 40.9
EOCEP Algebra 1 SC SDE Website
37% A, B, C (2016-17)
District Projected Hispanic
40 43 46 49 52
EOCEP Algebra 1 SC SDE Website
District Actual
Hispanic 33
EOCEP Algebra 1 SC SDE Website
n/a% A, B, C (2016-17)
School Projected
AA n/a n/a n/a n/a n/a
EOCEP Algebra 1 SC SDE Website
School Actual AA
n/a
EOCEP Algebra 1 SC SDE Website
27% A, B, C (2016-17)
District Projected
AA 30 33 36 39 42
EOCEP Algebra 1 SC SDE Website
District Actual AA
24
EOCEP Algebra 1 SC SDE Website
2.8% A, B, C (2016-17)
School Projected
SWD 5.8 8.8 11.8 14.8 17.8
EOCEP Algebra 1 SC SDE Website
School Actual SWD
4.2
EOCEP Algebra 1 SC SDE Website
10% A, B, C (2016-17)
District Projected
SWD 13 16 19 22 25
EOCEP Algebra 1 SC SDE Website
District Actual SWD
6
EOCEP Algebra 1 SC SDE Website
n/a% A, B, C (2016-17)
School Projected
LEP n/a n/a n/a n/a n/a
EOCEP Algebra 1 SC SDE Website
School Actual LEP n/a
Page 42 of 71
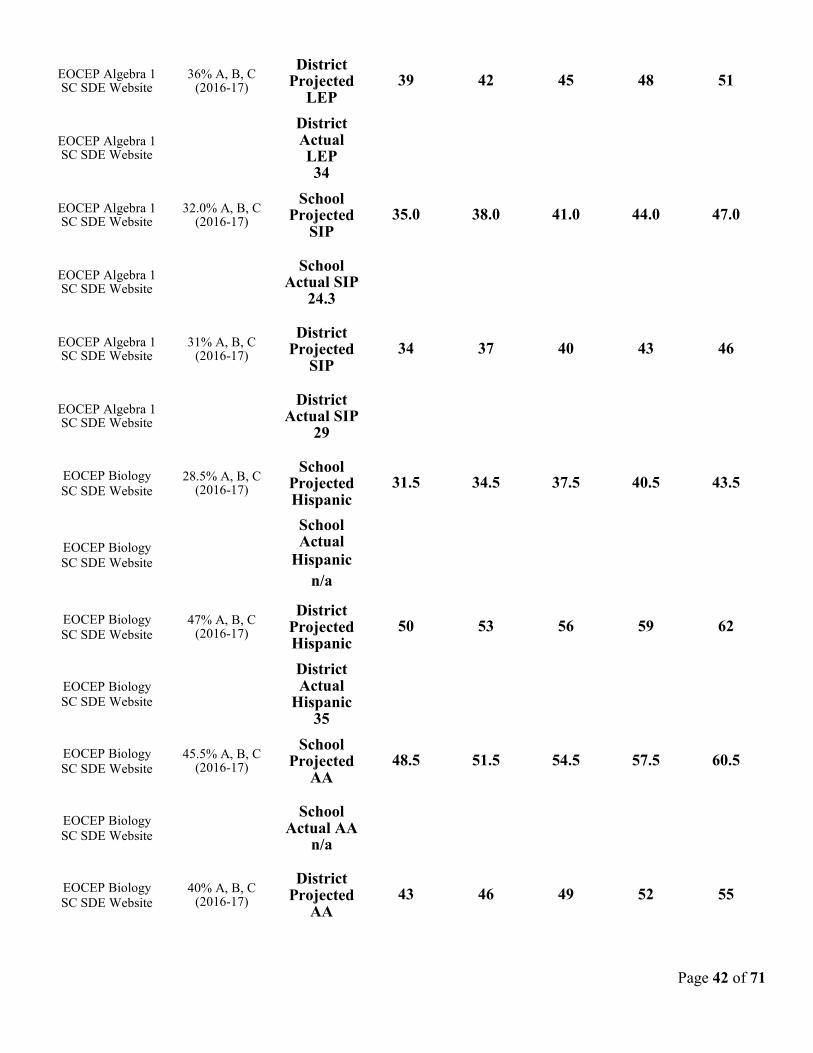
EOCEP Algebra 1 SC SDE Website
36% A, B, C (2016-17)
District Projected
LEP 39 42 45 48 51
EOCEP Algebra 1 SC SDE Website
District Actual LEP 34
EOCEP Algebra 1 SC SDE Website
32.0% A, B, C (2016-17)
School Projected
SIP 35.0 38.0 41.0 44.0 47.0
EOCEP Algebra 1 SC SDE Website
School Actual SIP
24.3
EOCEP Algebra 1 SC SDE Website
31% A, B, C (2016-17)
District Projected
SIP 34 37 40 43 46
EOCEP Algebra 1 SC SDE Website
District Actual SIP
29
EOCEP Biology SC SDE Website
28.5% A, B, C (2016-17)
School Projected Hispanic
31.5 34.5 37.5 40.5 43.5
EOCEP Biology SC SDE Website
School Actual
Hispanic n/a
EOCEP Biology SC SDE Website
47% A, B, C (2016-17)
District Projected Hispanic
50 53 56 59 62
EOCEP Biology SC SDE Website
District Actual
Hispanic 35
EOCEP Biology SC SDE Website
45.5% A, B, C (2016-17)
School Projected
AA 48.5 51.5 54.5 57.5 60.5
EOCEP Biology SC SDE Website
School Actual AA
n/a
EOCEP Biology SC SDE Website
40% A, B, C (2016-17)
District Projected
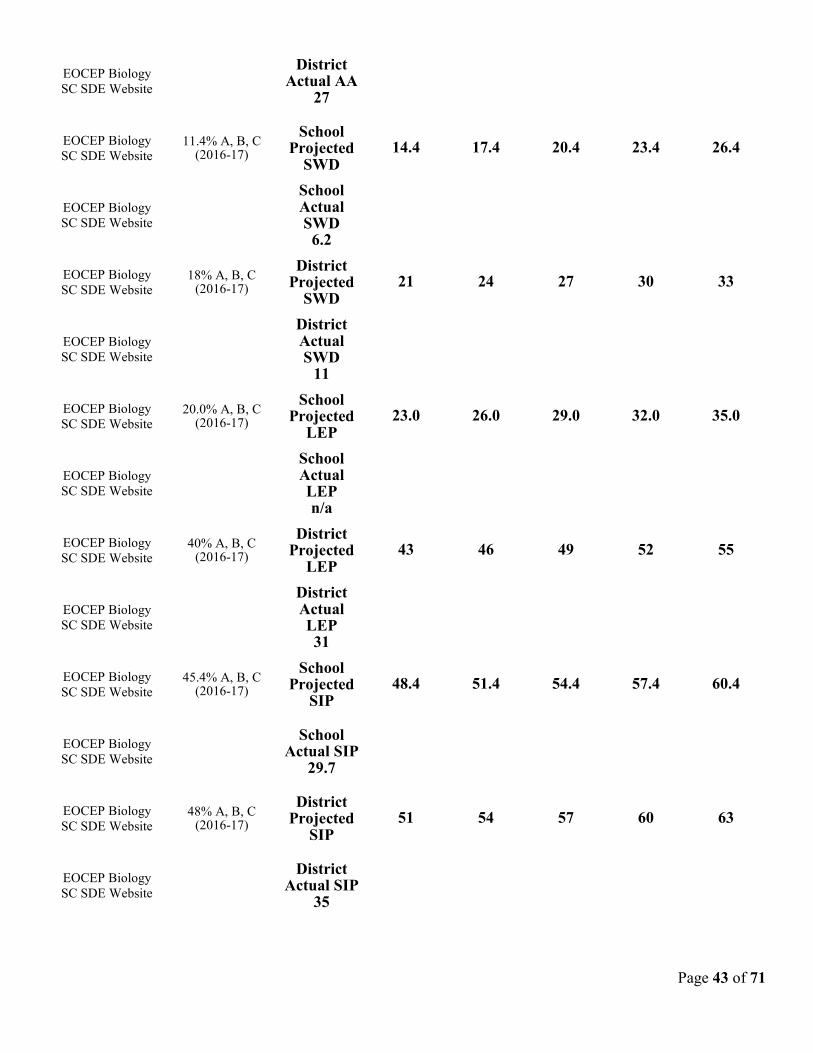
AA 43 46 49 52 55
Page 43 of 71
EOCEP Biology SC SDE Website
District Actual AA
27
EOCEP Biology SC SDE Website
11.4% A, B, C (2016-17)
School Projected
SWD 14.4 17.4 20.4 23.4 26.4
EOCEP Biology SC SDE Website
School Actual SWD
6.2
EOCEP Biology SC SDE Website
18% A, B, C (2016-17)
District Projected
SWD 21 24 27 30 33
EOCEP Biology SC SDE Website
District Actual SWD
11
EOCEP Biology SC SDE Website
20.0% A, B, C (2016-17)
School Projected
LEP 23.0 26.0 29.0 32.0 35.0
EOCEP Biology SC SDE Website
School Actual LEP n/a
EOCEP Biology SC SDE Website
40% A, B, C (2016-17)
District Projected
LEP 43 46 49 52 55
EOCEP Biology SC SDE Website
District Actual LEP 31
EOCEP Biology SC SDE Website
45.4% A, B, C (2016-17)
School Projected
SIP 48.4 51.4 54.4 57.4 60.4
EOCEP Biology SC SDE Website
School Actual SIP
29.7
EOCEP Biology SC SDE Website
48% A, B, C (2016-17)
District Projected
SIP 51 54 57 60 63
EOCEP Biology SC SDE Website
District Actual SIP
35
Page 44 of 71
EOCEP U.S. History and the Constitution SC SDE Website
n/a% A, B, C (2016-17)
School Projected Hispanic
n/a n/a n/a n/a n/a
EOCEP U.S. History and the Constitution SC SDE Website
School Actual
Hispanic n/a
EOCEP U.S. History and the Constitution SC SDE Website
42% A, B, C (2016-17)
District Projected Hispanic
45 48 51 54 57
EOCEP U.S. History and the Constitution SC SDE Website
District Actual
Hispanic 43
EOCEP U.S. History and the Constitution SC SDE Website
60.0% A, B, C (2016-17)
School Projected
AA 63.0 66.0 69.0 72.0 75.0
EOCEP U.S. History and the Constitution SC SDE Website
School
Actual AA n/a
EOCEP U.S. History and the Constitution SC SDE Website
34% A, B, C (2016-17)
District Projected
AA 37 40 43 46 49
EOCEP U.S. History and the Constitution SC SDE Website
District
Actual AA 36
EOCEP U.S. History and the Constitution SC SDE Website
37.5% A, B, C (2016-17)
School Projected
SWD 40.5 43.5 46.5 49.5 52.5
EOCEP U.S. History and the Constitution SC SDE Website
School Actual SWD 57.1
EOCEP U.S. History and the Constitution SC SDE Website
24% A, B, C (2016-17)
District Projected
SWD 27 30 33 36 39
EOCEP U.S. History and the Constitution SC SDE Website
District Actual SWD
25
EOCEP U.S. History and the Constitution SC SDE Website
n/a% A, B, C (2016-17)
School Projected
LEP n/a n/a n/a n/a n/a
Page 45 of 71
EOCEP U.S. History and the Constitution SC SDE Website
School Actual LEP n/a
EOCEP U.S. History and the Constitution SC SDE Website
34% A, B, C (2016-17)
District Projected
LEP 37 40 43 46 49
EOCEP U.S. History and the Constitution SC SDE Website
District Actual LEP 37
EOCEP U.S. History and the Constitution SC SDE Website
56.0% A, B, C (2016-17)
School Projected
SIP 59.0 62.0 65.0 68.0 71.0
EOCEP U.S. History and the Constitution SC SDE Website
School
Actual SIP 59.8
EOCEP U.S. History and the Constitution SC SDE Website
42% A, B, C (2016-17)
District Projected
SIP 45 48 51 54 57
EOCEP U.S. History and the Constitution SC SDE Website
District
Actual SIP 42
ACT Graduating
Class
Composite 17.3
(2016-17)
School Projected Hispanic
17.0 18.0 29.0 20.0 21.0
ACT Graduating
Class
School Actual
Hispanic 16.6
ACT Graduating
Class
Composite 17.6
(2016-17)
District Projected Hispanic
18.0 19.0 20.0 21.0 22.0
ACT Graduating
Class
District Actual
Hispanic 17.3
ACT Graduating
Class
Composite n/a (2016-17)
School Projected
AA 14.0 15.0 16.0 17.0 18.0
ACT Graduating
Class
School Actual AA
13.0
Page 46 of 71
ACT Graduating
Class
Composite 16.0
(2016-17)
District Projected
AA 17.0 18.0 19.0 20.0 21.0
ACT Graduating
Class
District Actual AA
15.7
Page 47 of 71
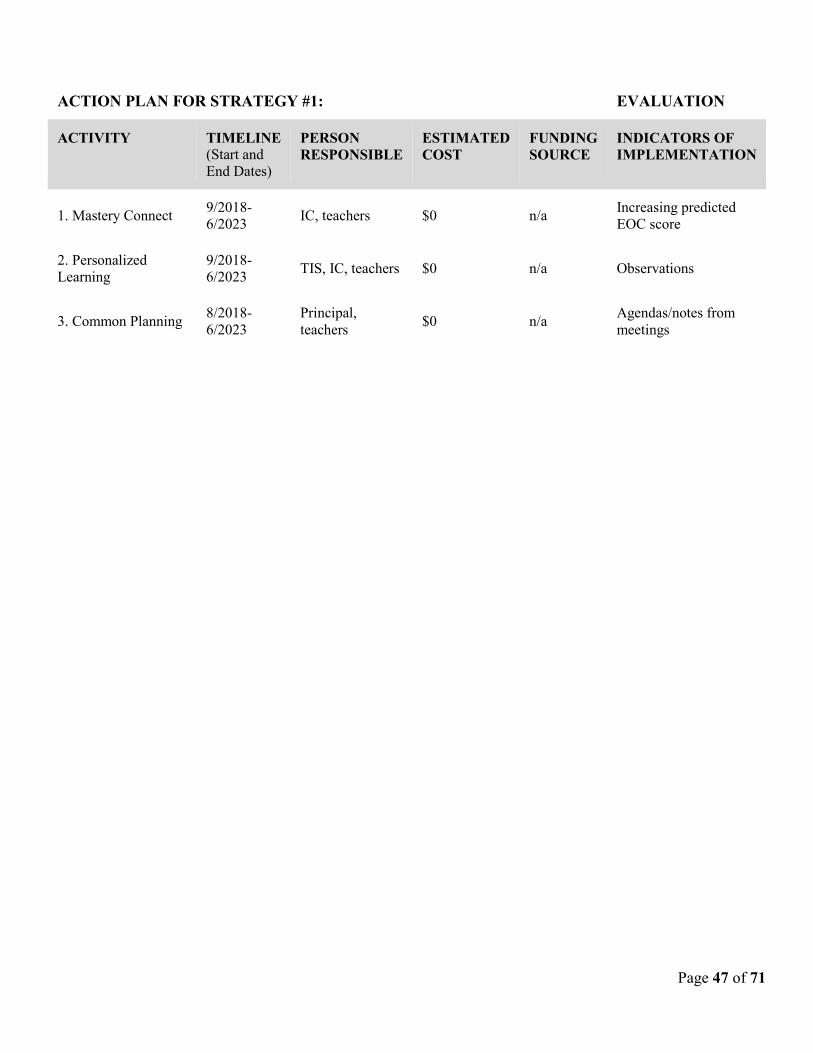
ACTION PLAN FOR STRATEGY #1: EVALUATION
ACTIVITY
TIMELINE (Start and End Dates)
PERSON RESPONSIBLE
ESTIMATED COST
FUNDING SOURCE
INDICATORS OF IMPLEMENTATION
1. Mastery Connect 9/2018-6/2023 IC, teachers $0 n/a Increasing predicted
EOC score
2. Personalized Learning
9/2018-6/2023 TIS, IC, teachers $0 n/a Observations
3. Common Planning 8/2018-6/2023
Principal, teachers $0 n/a Agendas/notes from
meetings
Page 48 of 71
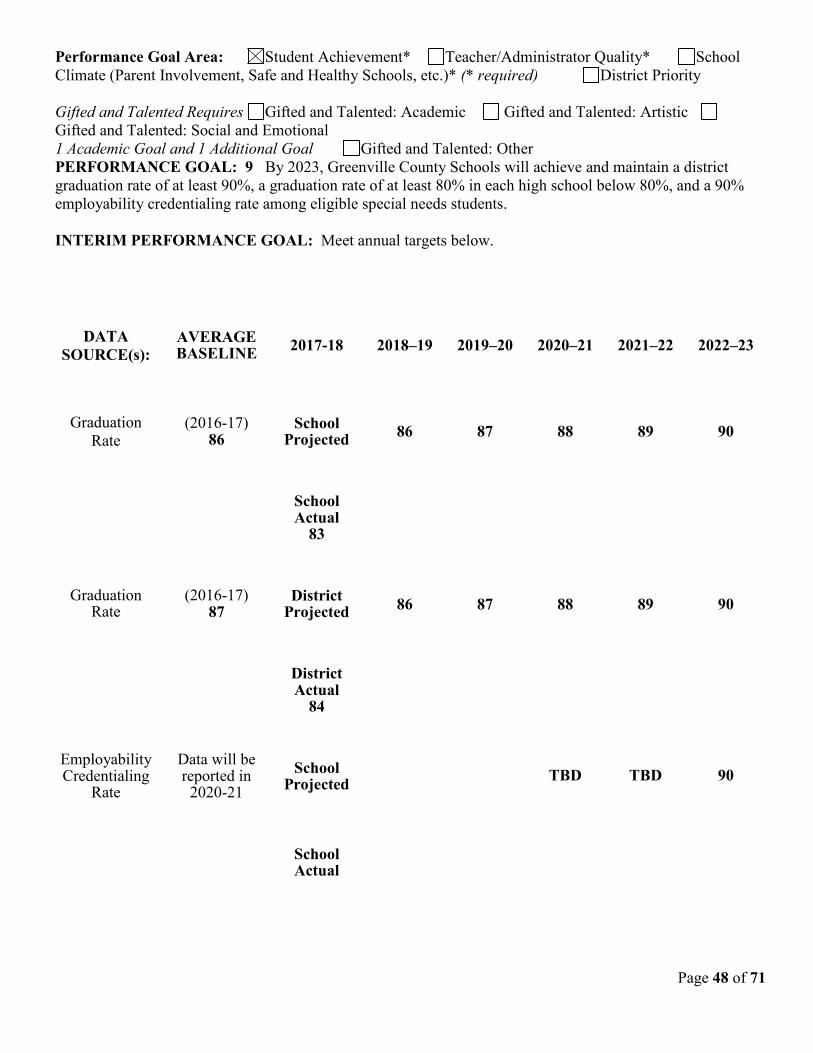
Performance Goal Area: Student Achievement* Teacher/Administrator Quality* School Climate (Parent Involvement, Safe and Healthy Schools, etc.)* (* required) District Priority Gifted and Talented Requires Gifted and Talented: Academic Gifted and Talented: Artistic Gifted and Talented: Social and Emotional 1 Academic Goal and 1 Additional Goal Gifted and Talented: Other PERFORMANCE GOAL: 9 By 2023, Greenville County Schools will achieve and maintain a district graduation rate of at least 90%, a graduation rate of at least 80% in each high school below 80%, and a 90% employability credentialing rate among eligible special needs students. INTERIM PERFORMANCE GOAL: Meet annual targets below.
DATA SOURCE(s):
AVERAGE BASELINE 2017-18 2018–19 2019–20 2020–21 2021–22 2022–23
Graduation Rate
(2016-17) 86
School Projected 86 87 88 89 90
School Actual
83
Graduation Rate
(2016-17) 87
District Projected 86 87 88 89 90
District Actual
84
Employability Credentialing
Rate
Data will be reported in
2020-21 School
Projected TBD TBD 90
School Actual
Page 49 of 71
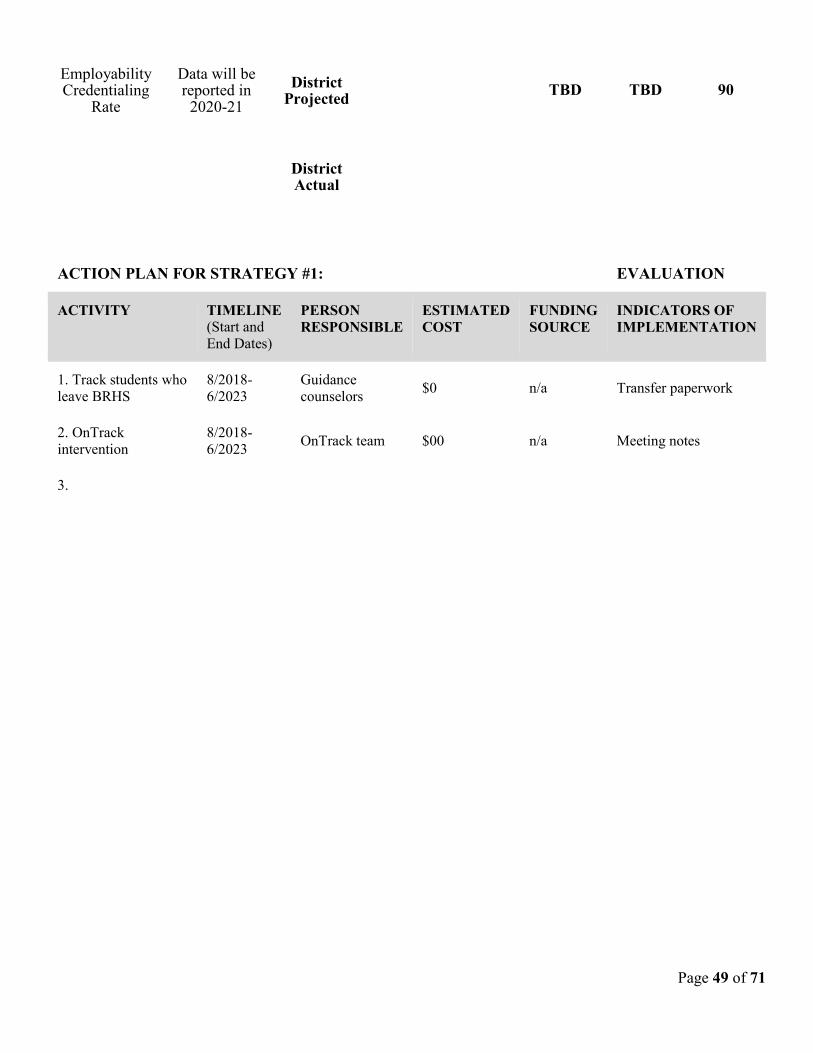
Employability Credentialing
Rate
Data will be reported in
2020-21 District
Projected TBD TBD 90
District Actual
ACTION PLAN FOR STRATEGY #1: EVALUATION
ACTIVITY
TIMELINE (Start and End Dates)
PERSON RESPONSIBLE
ESTIMATED COST
FUNDING SOURCE
INDICATORS OF IMPLEMENTATION
1. Track students who leave BRHS
8/2018-6/2023
Guidance counselors $0 n/a Transfer paperwork
2. OnTrack intervention
8/2018-6/2023 OnTrack team $00 n/a Meeting notes
3.

Page 50 of 71
Performance Goal Area: Student Achievement* Teacher/Administrator Quality* School Climate (Parent Involvement, Safe and Healthy Schools, etc.)* (* required) District Priority Gifted and Talented Requires Gifted and Talented: Academic Gifted and Talented: Artistic Gifted and Talented: Social and Emotional 1 Academic Goal and 1 Additional Goal Gifted and Talented: Other PERFORMANCE GOAL: 10 By 2023, increase the percentage of graduates meeting Graduation Plus (G+) requirements as indicated by: 90% earning at least one college credit course (dual/AP/IB), or earning two career specific units, or earning work-based unit credit(s), or achieving an industry certification INTERIM PERFORMANCE GOAL: Meet annual targets below.
DATA SOURCE(s):
AVERAGE BASELINE 2017-18 2018–19 2019–20 2020–21 2021–22 2022–23
PowerSchool, College Reports
Baseline will be established at the end of the 2018-19 school year
School Projected TBD TBD TBD 90%
School Actual
PowerSchool, College Reports
Baseline will be established at the end of the 2018-19 school year
School Projected TBD TBD TBD 90%
School Actual
Page 51 of 71
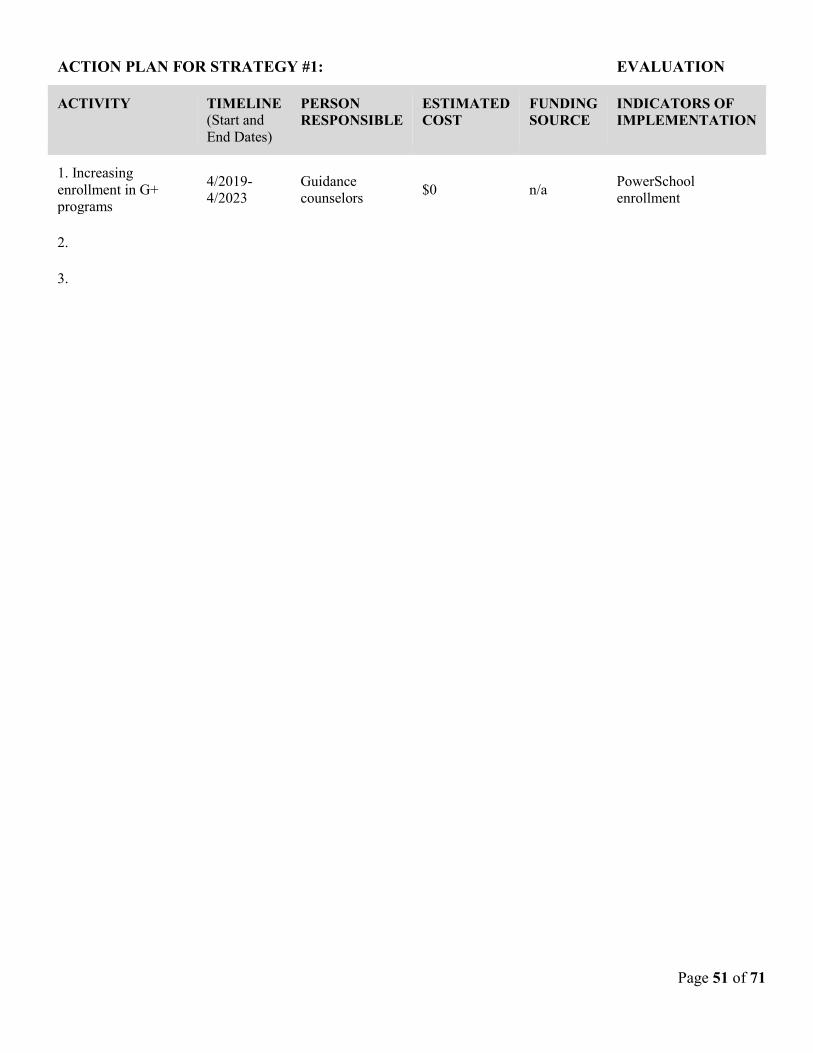
ACTION PLAN FOR STRATEGY #1: EVALUATION
ACTIVITY
TIMELINE (Start and End Dates)
PERSON RESPONSIBLE
ESTIMATED COST
FUNDING SOURCE
INDICATORS OF IMPLEMENTATION
1. Increasing enrollment in G+ programs
4/2019-4/2023
Guidance counselors $0 n/a PowerSchool
enrollment
2.
3.
Page 52 of 71
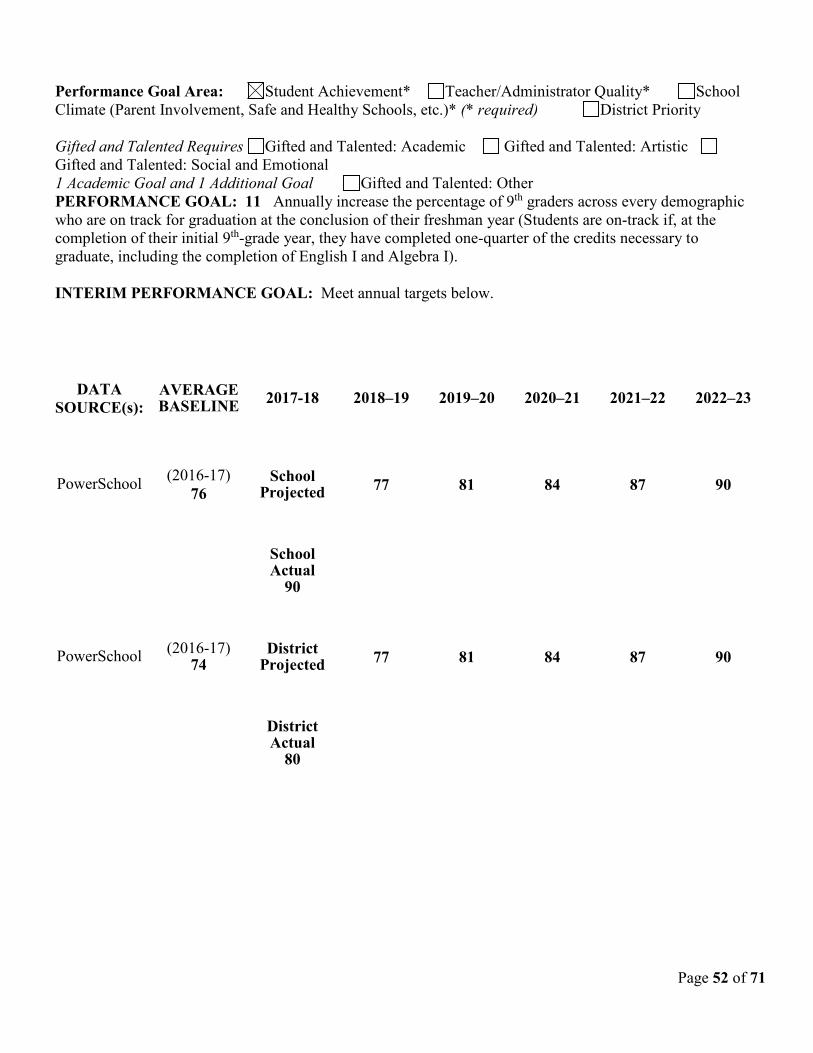
Performance Goal Area: Student Achievement* Teacher/Administrator Quality* School Climate (Parent Involvement, Safe and Healthy Schools, etc.)* (* required) District Priority Gifted and Talented Requires Gifted and Talented: Academic Gifted and Talented: Artistic Gifted and Talented: Social and Emotional 1 Academic Goal and 1 Additional Goal Gifted and Talented: Other PERFORMANCE GOAL: 11 Annually increase the percentage of 9th graders across every demographic who are on track for graduation at the conclusion of their freshman year (Students are on-track if, at the completion of their initial 9th-grade year, they have completed one-quarter of the credits necessary to graduate, including the completion of English I and Algebra I). INTERIM PERFORMANCE GOAL: Meet annual targets below.
DATA SOURCE(s):
AVERAGE BASELINE 2017-18 2018–19 2019–20 2020–21 2021–22 2022–23
PowerSchool (2016-17) 76
School Projected 77 81 84 87 90
School Actual
90
PowerSchool (2016-17) 74
District Projected 77 81 84 87 90
District Actual
80
Page 53 of 71
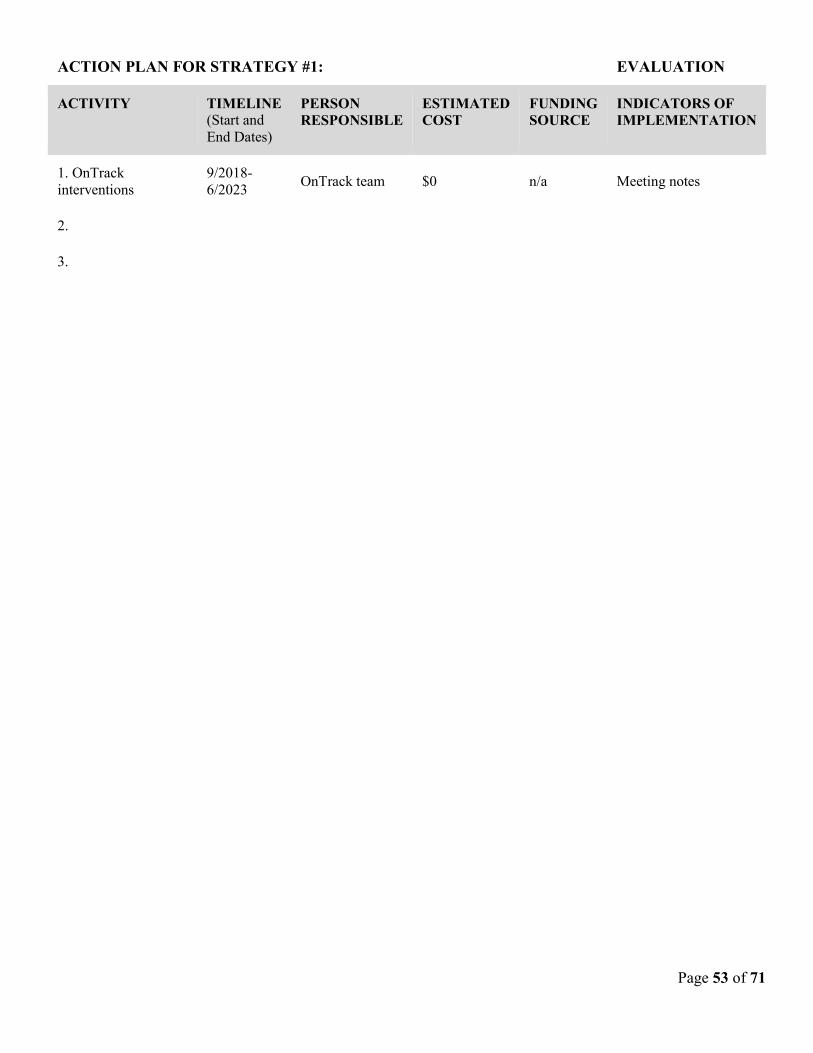
ACTION PLAN FOR STRATEGY #1: EVALUATION
ACTIVITY
TIMELINE (Start and End Dates)
PERSON RESPONSIBLE
ESTIMATED COST
FUNDING SOURCE
INDICATORS OF IMPLEMENTATION
1. OnTrack interventions
9/2018-6/2023 OnTrack team $0 n/a Meeting notes
2.
3.
Page 54 of 71
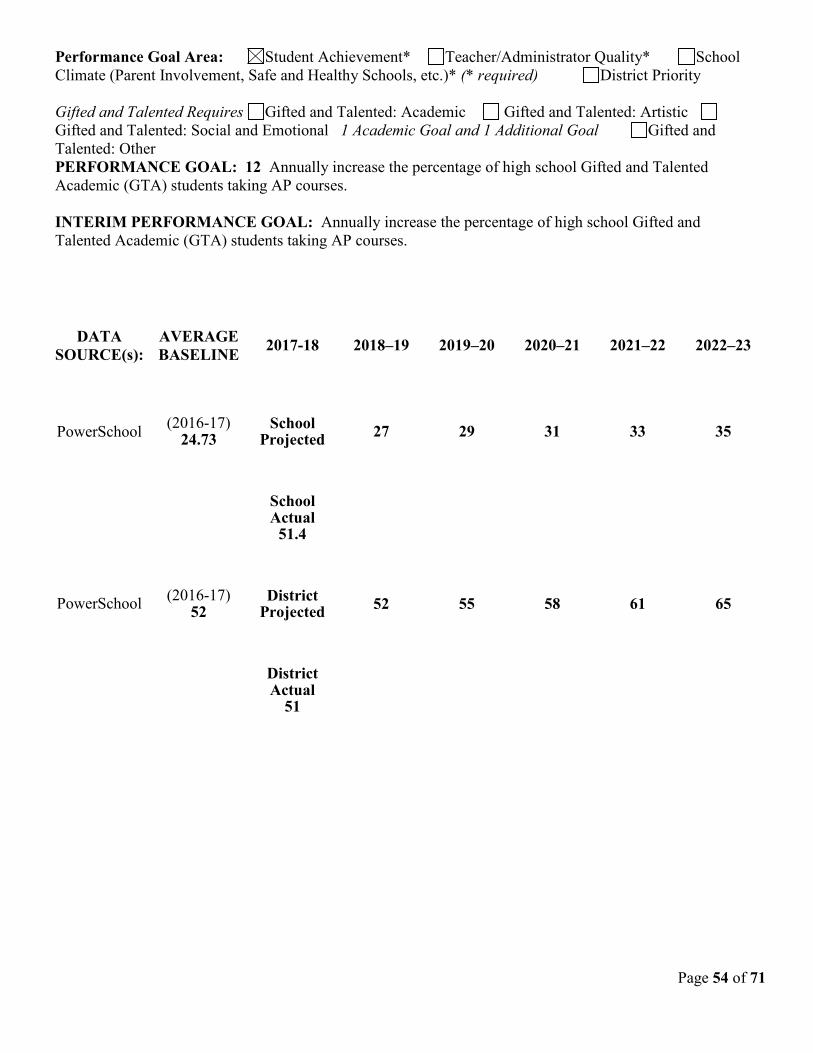
Performance Goal Area: Student Achievement* Teacher/Administrator Quality* School Climate (Parent Involvement, Safe and Healthy Schools, etc.)* (* required) District Priority Gifted and Talented Requires Gifted and Talented: Academic Gifted and Talented: Artistic Gifted and Talented: Social and Emotional 1 Academic Goal and 1 Additional Goal Gifted and Talented: Other PERFORMANCE GOAL: 12 Annually increase the percentage of high school Gifted and Talented Academic (GTA) students taking AP courses. INTERIM PERFORMANCE GOAL: Annually increase the percentage of high school Gifted and Talented Academic (GTA) students taking AP courses.
DATA SOURCE(s):
AVERAGE BASELINE 2017-18 2018–19 2019–20 2020–21 2021–22 2022–23
PowerSchool (2016-17) 24.73
School Projected 27 29 31 33 35
School Actual
51.4
PowerSchool (2016-17) 52
District Projected 52 55 58 61 65
District Actual
51
Page 55 of 71
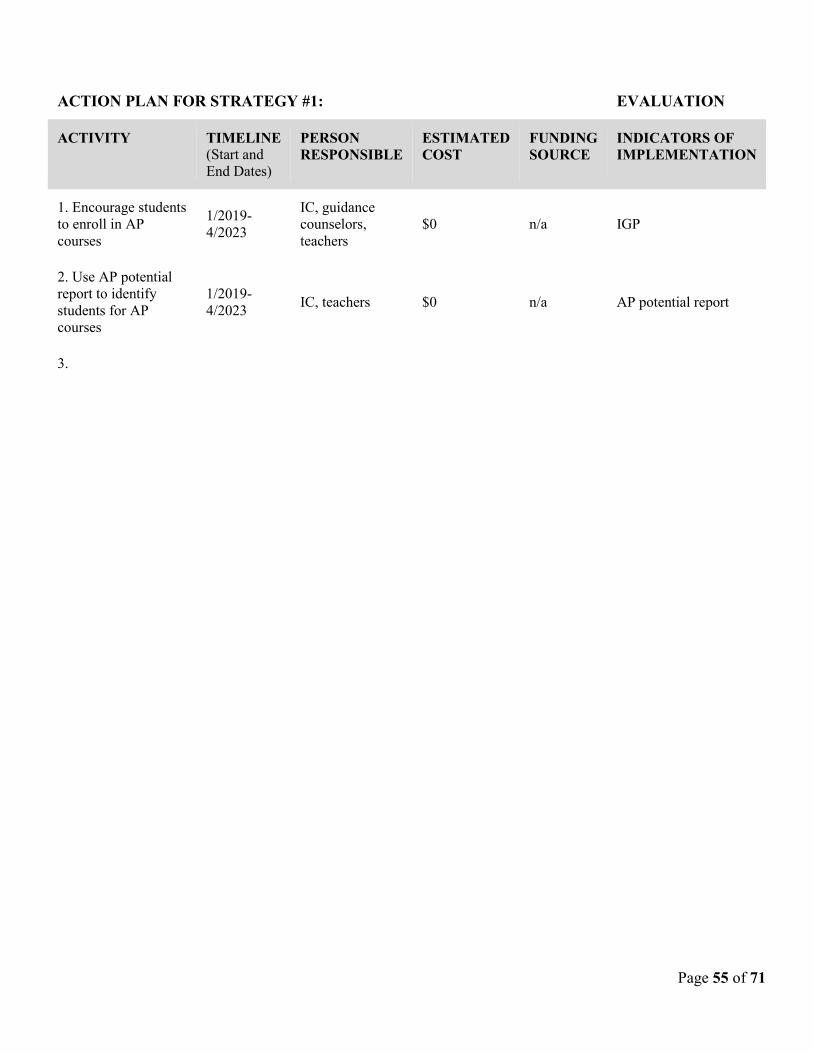
ACTION PLAN FOR STRATEGY #1: EVALUATION
ACTIVITY
TIMELINE (Start and End Dates)
PERSON RESPONSIBLE
ESTIMATED COST
FUNDING SOURCE
INDICATORS OF IMPLEMENTATION
1. Encourage students to enroll in AP courses
1/2019-4/2023
IC, guidance counselors, teachers
$0 n/a IGP
2. Use AP potential report to identify students for AP courses
1/2019-4/2023 IC, teachers $0 n/a AP potential report
3.
Page 56 of 71
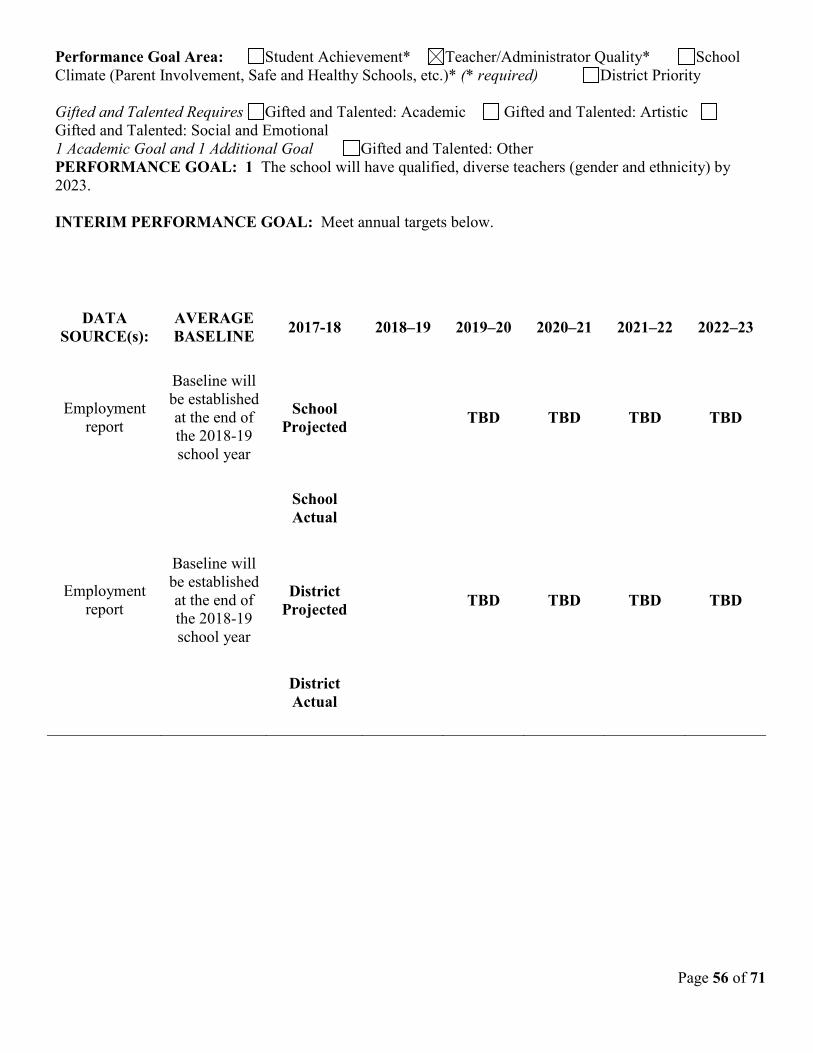
Performance Goal Area: Student Achievement* Teacher/Administrator Quality* School Climate (Parent Involvement, Safe and Healthy Schools, etc.)* (* required) District Priority Gifted and Talented Requires Gifted and Talented: Academic Gifted and Talented: Artistic Gifted and Talented: Social and Emotional 1 Academic Goal and 1 Additional Goal Gifted and Talented: Other PERFORMANCE GOAL: 1 The school will have qualified, diverse teachers (gender and ethnicity) by 2023. INTERIM PERFORMANCE GOAL: Meet annual targets below.
DATA SOURCE(s):
AVERAGE BASELINE 2017-18 2018–19 2019–20 2020–21 2021–22 2022–23
Employment report
Baseline will be established at the end of the 2018-19 school year
School Projected TBD TBD TBD TBD
School Actual
Employment report
Baseline will be established at the end of the 2018-19 school year
District Projected TBD TBD TBD TBD
District Actual
Page 57 of 71
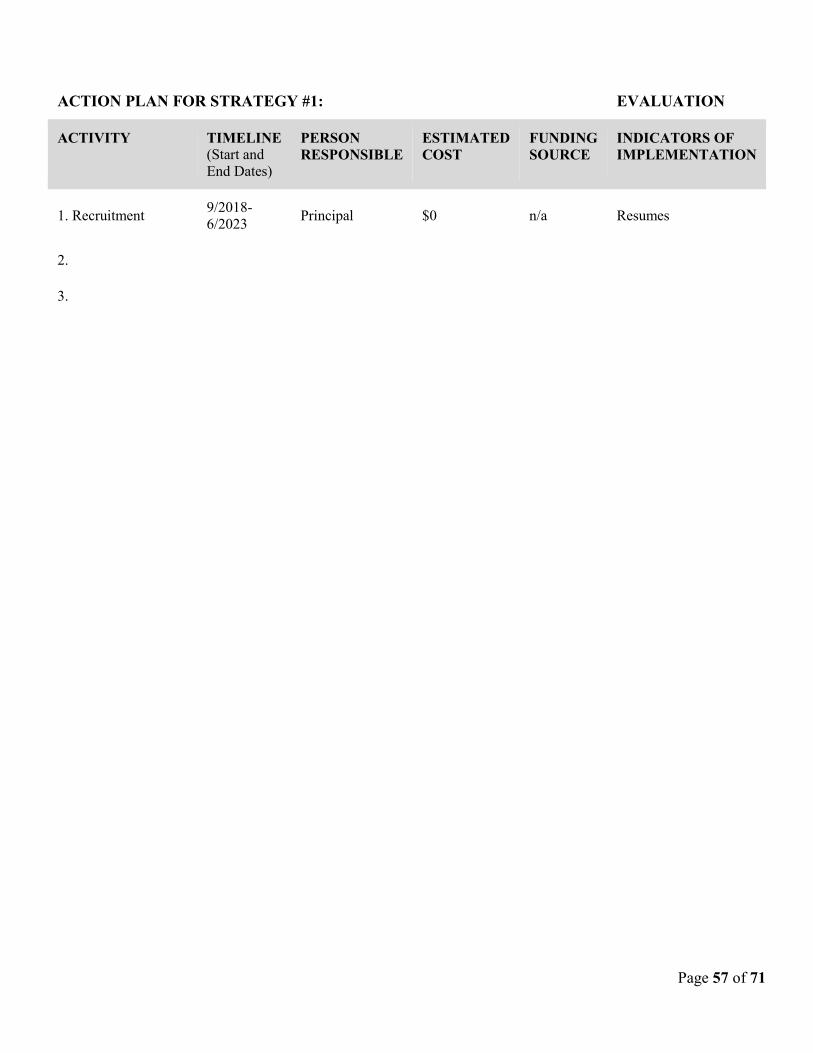
ACTION PLAN FOR STRATEGY #1: EVALUATION
ACTIVITY
TIMELINE (Start and End Dates)
PERSON RESPONSIBLE
ESTIMATED COST
FUNDING SOURCE
INDICATORS OF IMPLEMENTATION
1. Recruitment 9/2018-6/2023 Principal $0 n/a Resumes
2.
3.
Page 58 of 71
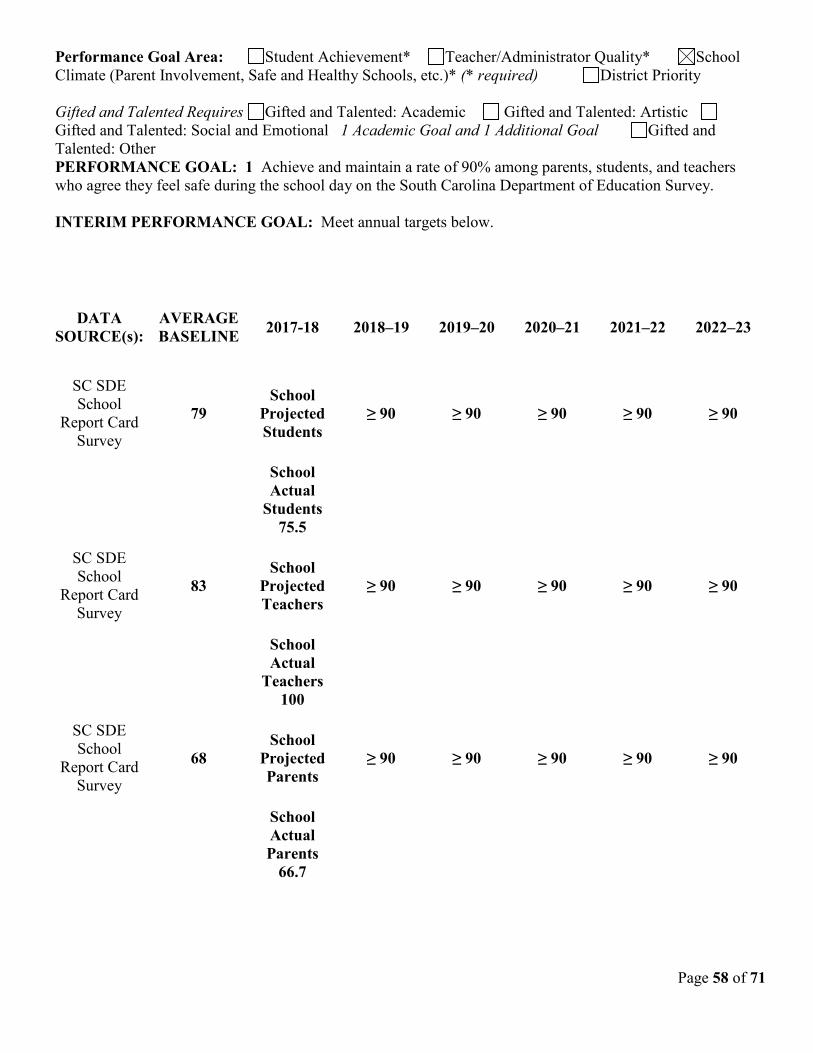
Performance Goal Area: Student Achievement* Teacher/Administrator Quality* School Climate (Parent Involvement, Safe and Healthy Schools, etc.)* (* required) District Priority Gifted and Talented Requires Gifted and Talented: Academic Gifted and Talented: Artistic Gifted and Talented: Social and Emotional 1 Academic Goal and 1 Additional Goal Gifted and Talented: Other PERFORMANCE GOAL: 1 Achieve and maintain a rate of 90% among parents, students, and teachers who agree they feel safe during the school day on the South Carolina Department of Education Survey. INTERIM PERFORMANCE GOAL: Meet annual targets below.
DATA SOURCE(s):
AVERAGE BASELINE 2017-18 2018–19 2019–20 2020–21 2021–22 2022–23
SC SDE School
Report Card Survey
79 School
Projected Students
≥ 90 ≥ 90 ≥ 90 ≥ 90 ≥ 90
School Actual
Students 75.5
SC SDE School
Report Card Survey
83 School
Projected Teachers
≥ 90 ≥ 90 ≥ 90 ≥ 90 ≥ 90
School Actual
Teachers 100
SC SDE School
Report Card Survey
68 School
Projected Parents
≥ 90 ≥ 90 ≥ 90 ≥ 90 ≥ 90
School Actual Parents
66.7
Page 59 of 71
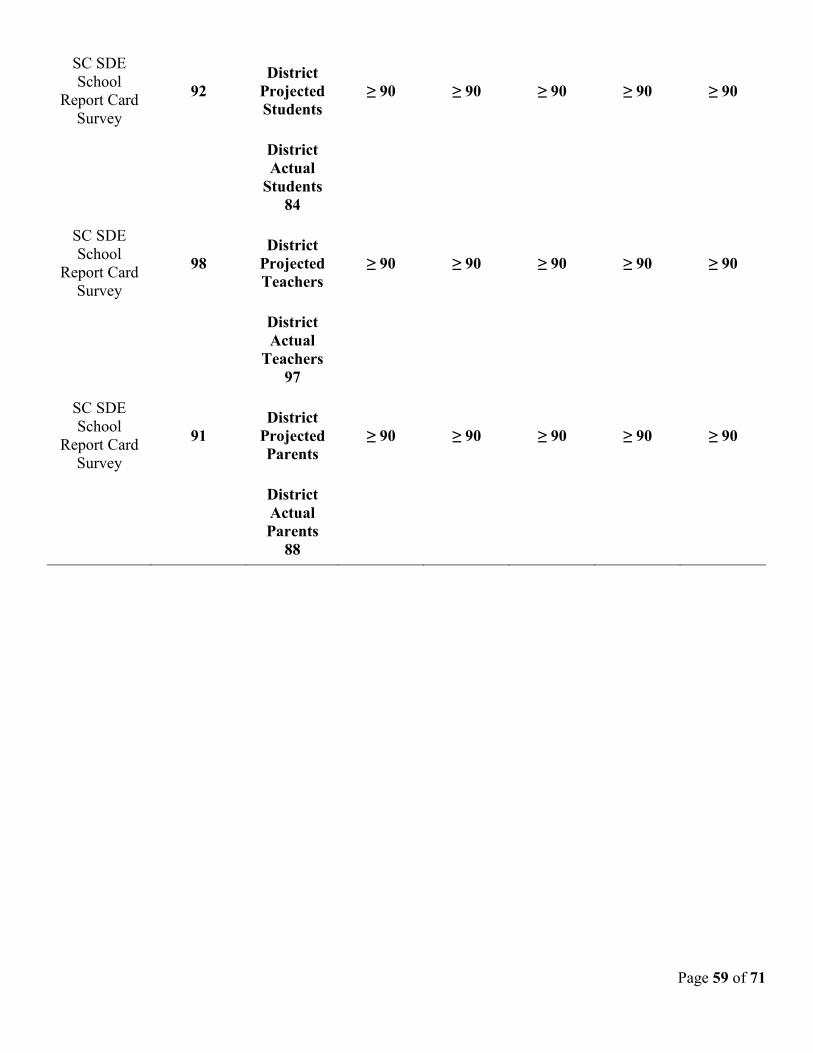
SC SDE School
Report Card Survey
92 District
Projected Students
≥ 90 ≥ 90 ≥ 90 ≥ 90 ≥ 90
District Actual
Students 84
SC SDE School
Report Card Survey
98 District
Projected Teachers
≥ 90 ≥ 90 ≥ 90 ≥ 90 ≥ 90
District Actual
Teachers 97
SC SDE School
Report Card Survey
91 District
Projected Parents
≥ 90 ≥ 90 ≥ 90 ≥ 90 ≥ 90
District Actual Parents
88
Page 60 of 71
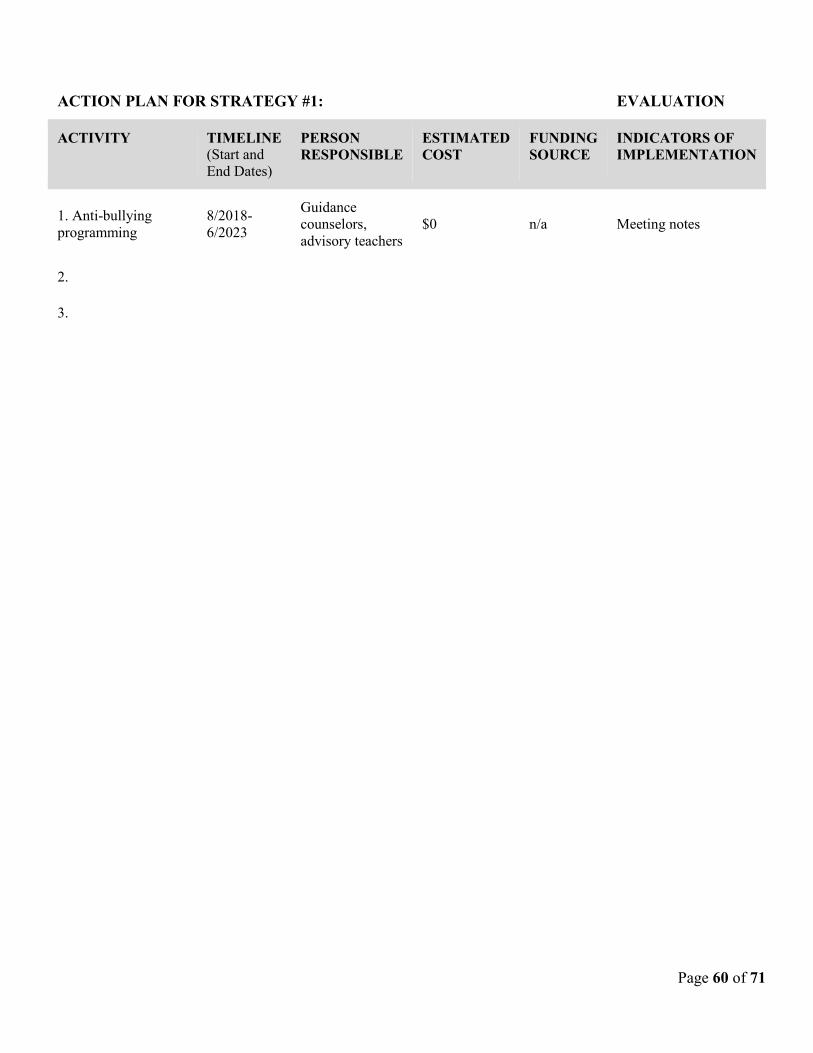
ACTION PLAN FOR STRATEGY #1: EVALUATION
ACTIVITY
TIMELINE (Start and End Dates)
PERSON RESPONSIBLE
ESTIMATED COST
FUNDING SOURCE
INDICATORS OF IMPLEMENTATION
1. Anti-bullying programming
8/2018-6/2023
Guidance counselors, advisory teachers
$0 n/a Meeting notes
2.
3.
Page 61 of 71
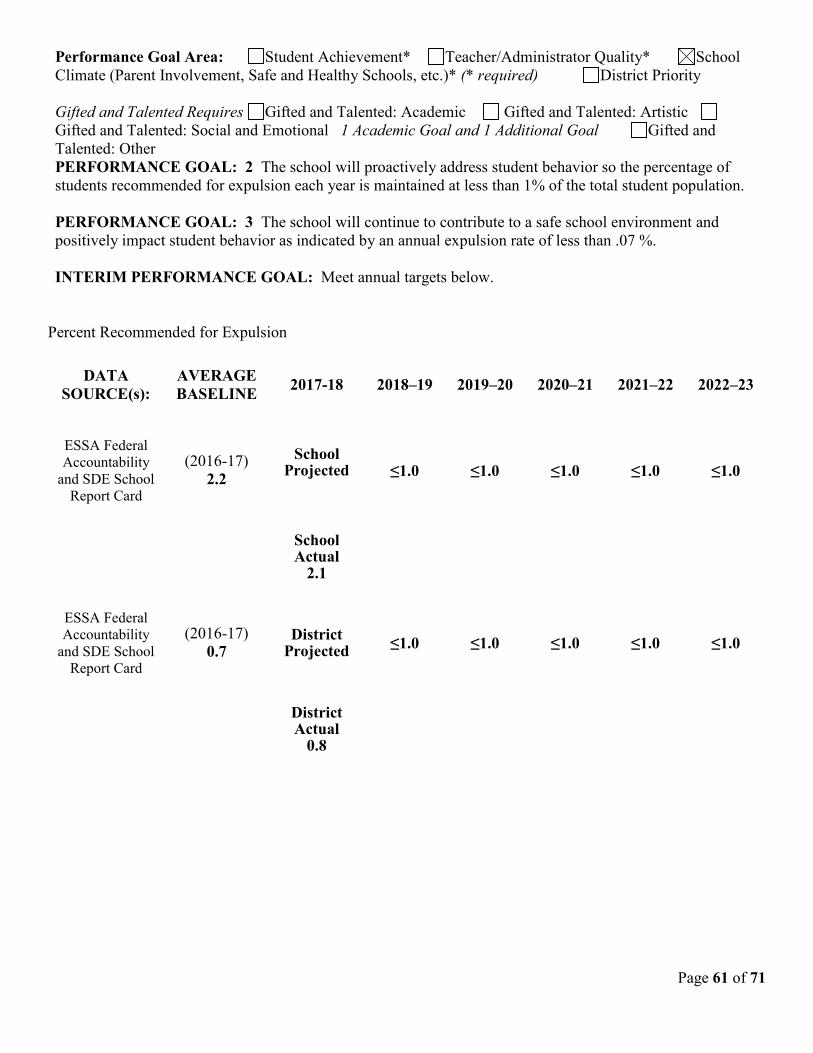
Performance Goal Area: Student Achievement* Teacher/Administrator Quality* School Climate (Parent Involvement, Safe and Healthy Schools, etc.)* (* required) District Priority Gifted and Talented Requires Gifted and Talented: Academic Gifted and Talented: Artistic Gifted and Talented: Social and Emotional 1 Academic Goal and 1 Additional Goal Gifted and Talented: Other PERFORMANCE GOAL: 2 The school will proactively address student behavior so the percentage of students recommended for expulsion each year is maintained at less than 1% of the total student population. PERFORMANCE GOAL: 3 The school will continue to contribute to a safe school environment and positively impact student behavior as indicated by an annual expulsion rate of less than .07 %. INTERIM PERFORMANCE GOAL: Meet annual targets below.
Percent Recommended for Expulsion
DATA SOURCE(s):
AVERAGE BASELINE 2017-18 2018–19 2019–20 2020–21 2021–22 2022–23
ESSA Federal Accountability
and SDE School Report Card
(2016-17) 2.2
School Projected
≤1.0 ≤1.0 ≤1.0 ≤1.0 ≤1.0
School Actual
2.1
ESSA Federal Accountability
and SDE School Report Card
(2016-17) 0.7
District Projected ≤1.0 ≤1.0 ≤1.0 ≤1.0 ≤1.0
District Actual
0.8
Page 62 of 71
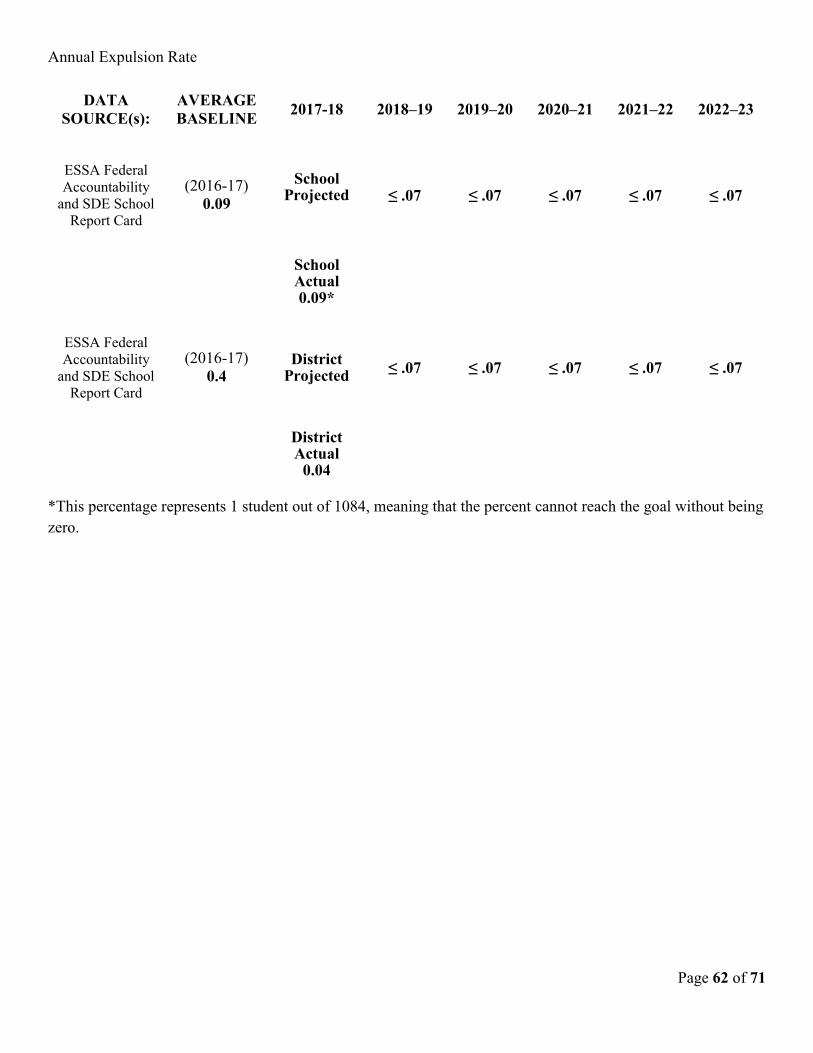
Annual Expulsion Rate
DATA SOURCE(s):
AVERAGE BASELINE 2017-18 2018–19 2019–20 2020–21 2021–22 2022–23
ESSA Federal Accountability
and SDE School Report Card
(2016-17) 0.09
School Projected
≤ .07 ≤ .07 ≤ .07 ≤ .07 ≤ .07
School Actual 0.09*
ESSA Federal Accountability
and SDE School Report Card
(2016-17) 0.4
District Projected ≤ .07 ≤ .07 ≤ .07 ≤ .07 ≤ .07
District Actual
0.04
*This percentage represents 1 student out of 1084, meaning that the percent cannot reach the goal without being zero.

Page 63 of 71
ACTION PLAN FOR STRATEGY #1: EVALUATION
ACTIVITY
TIMELINE (Start and End Dates)
PERSON RESPONSIBLE
ESTIMATED COST
FUNDING SOURCE
INDICATORS OF IMPLEMENTATION
1. OnTrack interventions
9/2018-6/2023 OnTrack team $0 n/a Meeting notes
2.
3.
Page 64 of 71
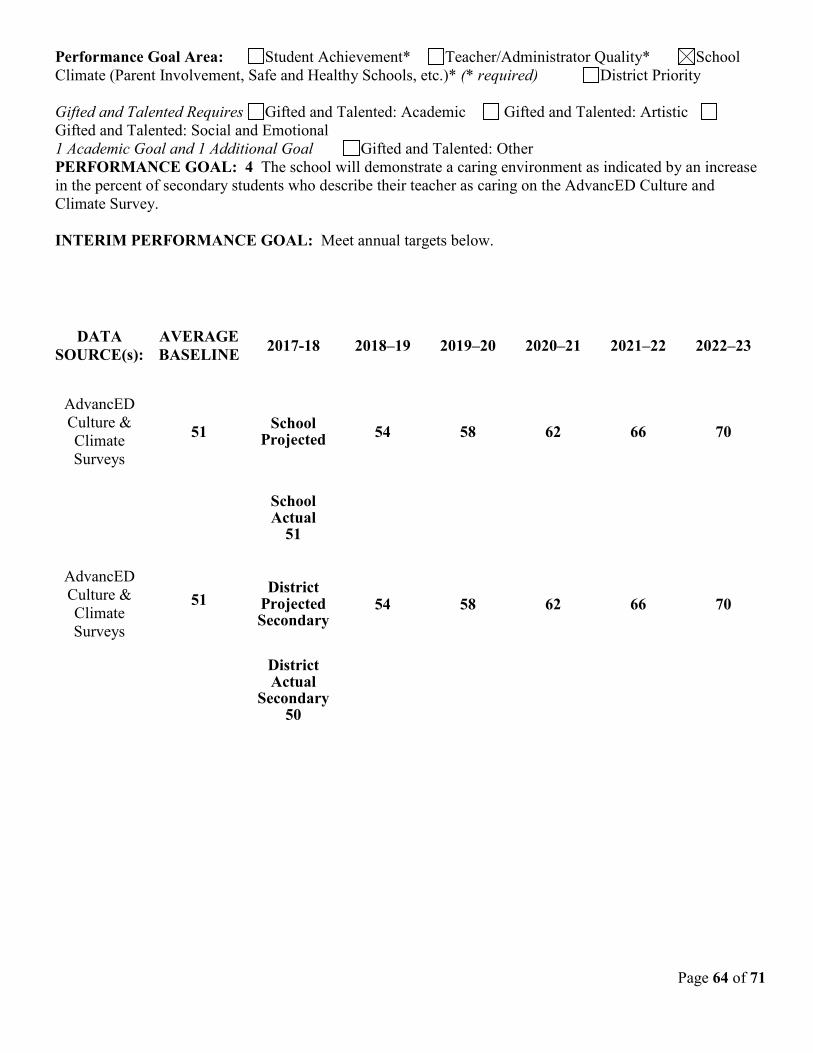
Performance Goal Area: Student Achievement* Teacher/Administrator Quality* School Climate (Parent Involvement, Safe and Healthy Schools, etc.)* (* required) District Priority Gifted and Talented Requires Gifted and Talented: Academic Gifted and Talented: Artistic Gifted and Talented: Social and Emotional 1 Academic Goal and 1 Additional Goal Gifted and Talented: Other PERFORMANCE GOAL: 4 The school will demonstrate a caring environment as indicated by an increase in the percent of secondary students who describe their teacher as caring on the AdvancED Culture and Climate Survey. INTERIM PERFORMANCE GOAL: Meet annual targets below.
DATA SOURCE(s):
AVERAGE BASELINE 2017-18 2018–19 2019–20 2020–21 2021–22 2022–23
AdvancED Culture & Climate Surveys
51 School Projected 54 58 62 66 70
School Actual
51
AdvancED Culture & Climate Surveys
51 District
Projected Secondary
54 58 62 66 70
District Actual
Secondary 50

Page 65 of 71
ACTION PLAN FOR STRATEGY #1: EVALUATION
ACTIVITY
TIMELINE (Start and End Dates)
PERSON RESPONSIBLE
ESTIMATED COST
FUNDING SOURCE
INDICATORS OF IMPLEMENTATION
1. Student conferences in advisory
8/2018-6/2023
Advisory teachers $0 n/a Advisory records
2.
3.
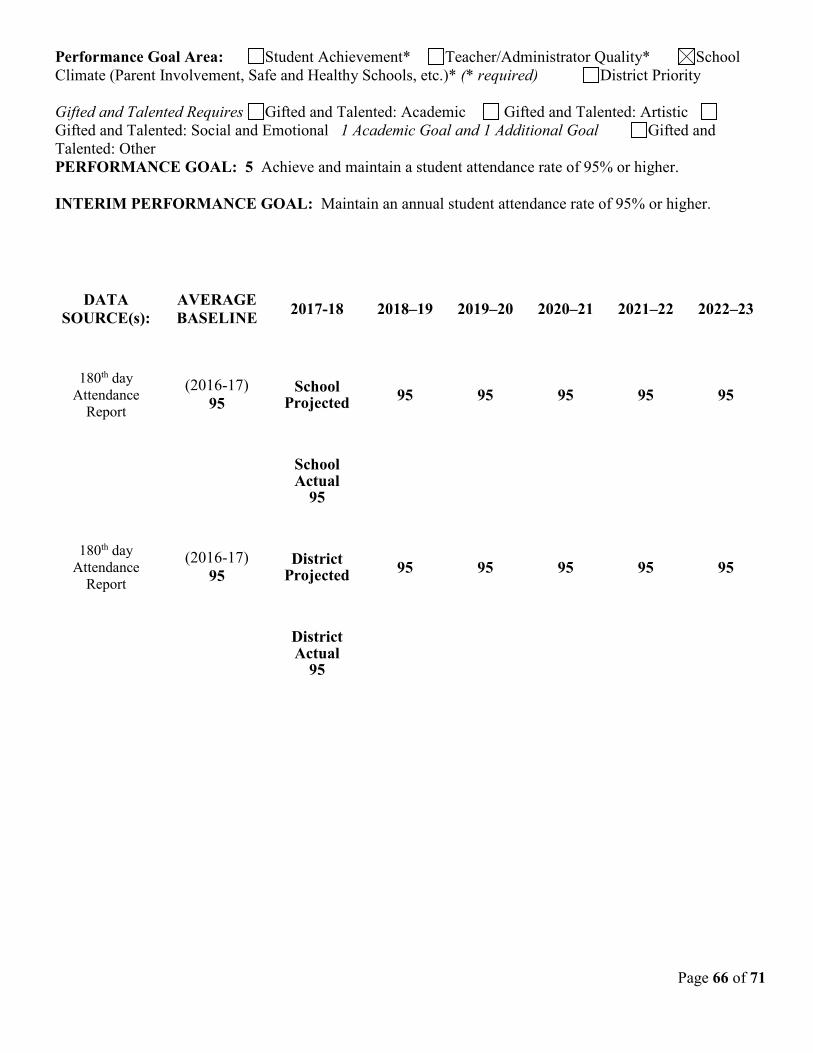
Page 66 of 71
Performance Goal Area: Student Achievement* Teacher/Administrator Quality* School Climate (Parent Involvement, Safe and Healthy Schools, etc.)* (* required) District Priority Gifted and Talented Requires Gifted and Talented: Academic Gifted and Talented: Artistic Gifted and Talented: Social and Emotional 1 Academic Goal and 1 Additional Goal Gifted and Talented: Other PERFORMANCE GOAL: 5 Achieve and maintain a student attendance rate of 95% or higher. INTERIM PERFORMANCE GOAL: Maintain an annual student attendance rate of 95% or higher.
DATA SOURCE(s):
AVERAGE BASELINE 2017-18 2018–19 2019–20 2020–21 2021–22 2022–23
180th day Attendance
Report
(2016-17) 95
School Projected 95 95 95 95 95
School Actual
95
180th day Attendance
Report
(2016-17) 95
District Projected 95 95 95 95 95
District Actual
95
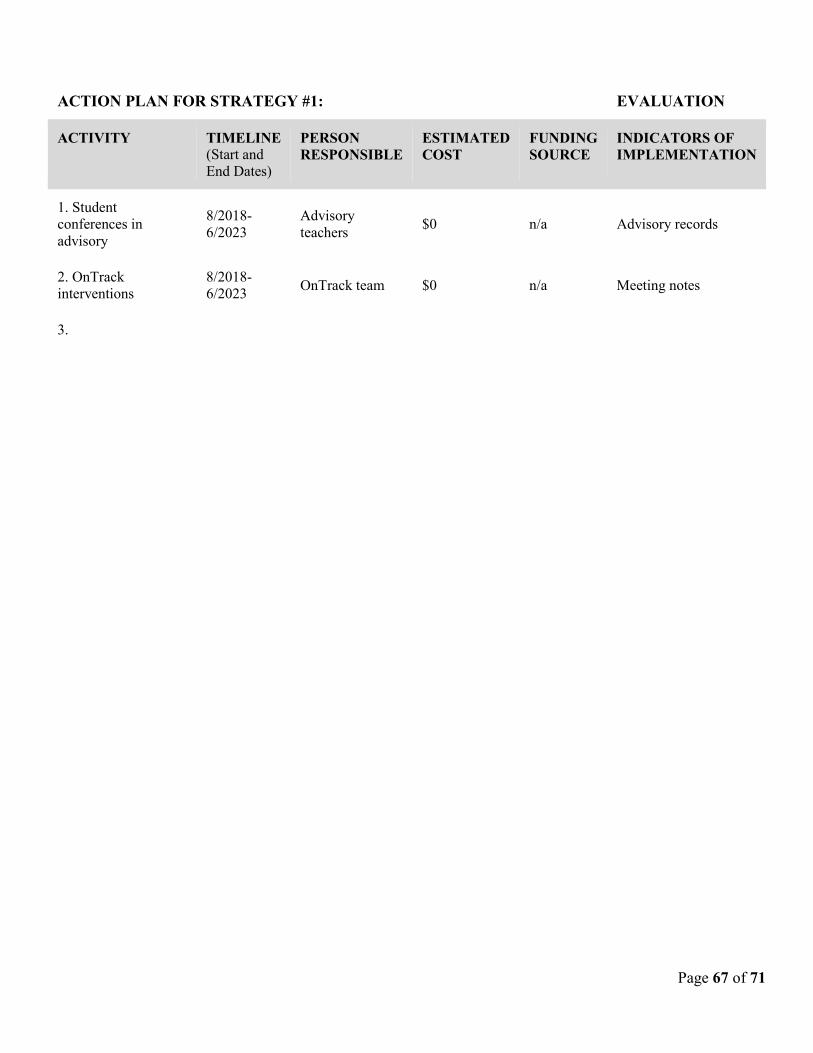
Page 67 of 71
ACTION PLAN FOR STRATEGY #1: EVALUATION
ACTIVITY
TIMELINE (Start and End Dates)
PERSON RESPONSIBLE
ESTIMATED COST
FUNDING SOURCE
INDICATORS OF IMPLEMENTATION
1. Student conferences in advisory
8/2018-6/2023
Advisory teachers $0 n/a Advisory records
2. OnTrack interventions
8/2018-6/2023 OnTrack team $0 n/a Meeting notes
3.
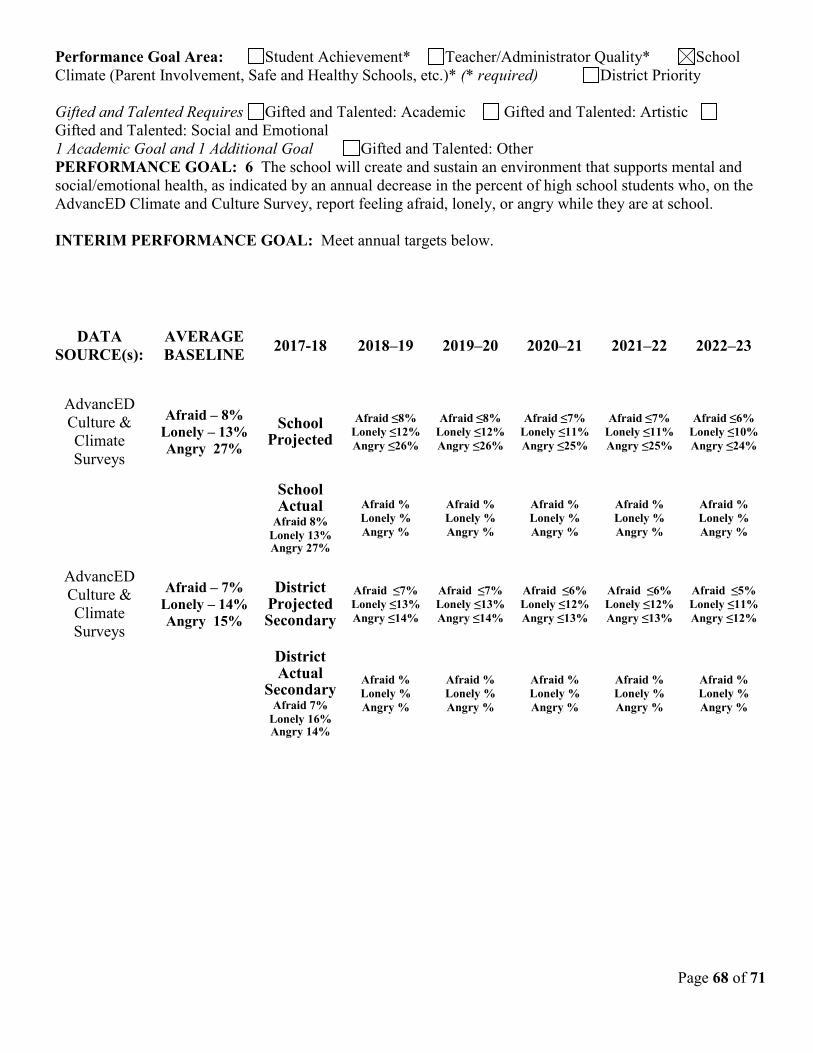
Page 68 of 71
Performance Goal Area: Student Achievement* Teacher/Administrator Quality* School Climate (Parent Involvement, Safe and Healthy Schools, etc.)* (* required) District Priority Gifted and Talented Requires Gifted and Talented: Academic Gifted and Talented: Artistic Gifted and Talented: Social and Emotional 1 Academic Goal and 1 Additional Goal Gifted and Talented: Other PERFORMANCE GOAL: 6 The school will create and sustain an environment that supports mental and social/emotional health, as indicated by an annual decrease in the percent of high school students who, on the AdvancED Climate and Culture Survey, report feeling afraid, lonely, or angry while they are at school. INTERIM PERFORMANCE GOAL: Meet annual targets below.
DATA SOURCE(s):
AVERAGE BASELINE 2017-18 2018–19 2019–20 2020–21 2021–22 2022–23
AdvancED Culture & Climate Surveys
Afraid – 8% Lonely – 13% Angry 27%
School Projected
Afraid ≤8% Lonely ≤12% Angry ≤26%
Afraid ≤8% Lonely ≤12% Angry ≤26%
Afraid ≤7% Lonely ≤11% Angry ≤25%
Afraid ≤7% Lonely ≤11% Angry ≤25%
Afraid ≤6% Lonely ≤10% Angry ≤24%
School Actual
Afraid 8% Lonely 13% Angry 27%
Afraid % Lonely % Angry %
Afraid % Lonely % Angry %
Afraid % Lonely % Angry %
Afraid % Lonely % Angry %
Afraid % Lonely % Angry %
AdvancED Culture & Climate Surveys
Afraid – 7% Lonely – 14% Angry 15%
District Projected Secondary
Afraid ≤7% Lonely ≤13% Angry ≤14%
Afraid ≤7% Lonely ≤13% Angry ≤14%
Afraid ≤6% Lonely ≤12% Angry ≤13%
Afraid ≤6% Lonely ≤12% Angry ≤13%
Afraid ≤5% Lonely ≤11% Angry ≤12%
District Actual
Secondary Afraid 7%
Lonely 16% Angry 14%
Afraid % Lonely % Angry %
Afraid % Lonely % Angry %
Afraid % Lonely % Angry %
Afraid % Lonely % Angry %
Afraid % Lonely % Angry %
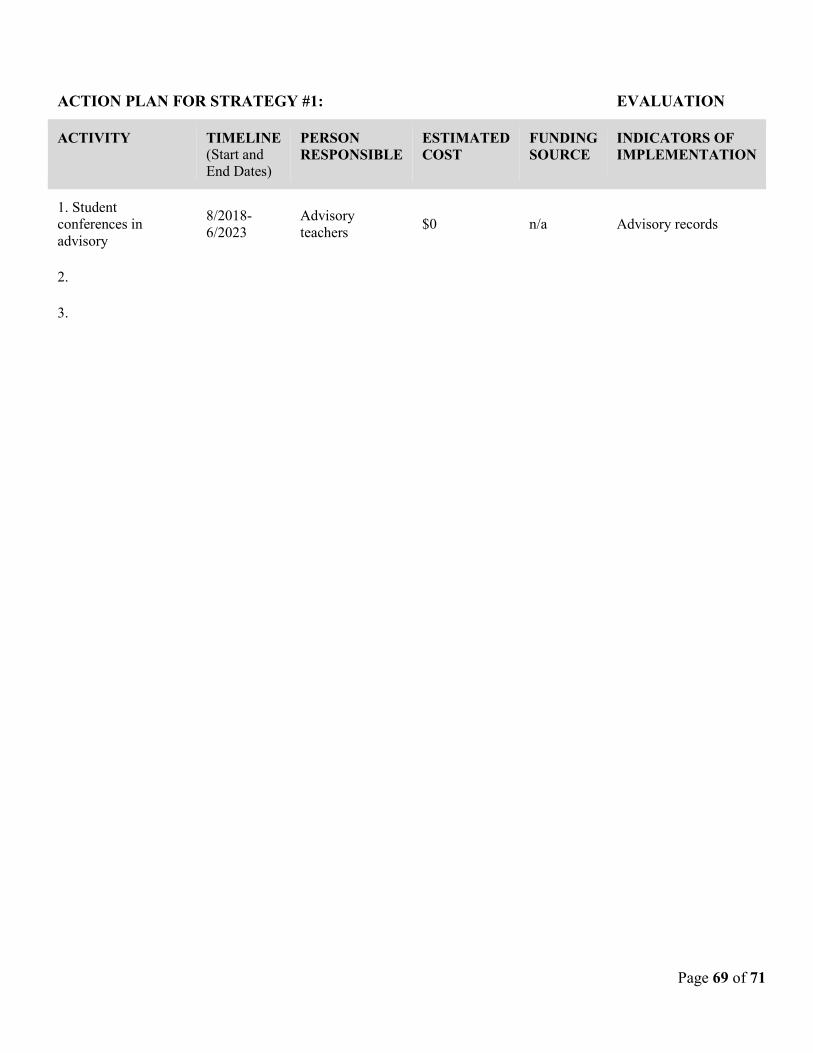
Page 69 of 71
ACTION PLAN FOR STRATEGY #1: EVALUATION
ACTIVITY
TIMELINE (Start and End Dates)
PERSON RESPONSIBLE
ESTIMATED COST
FUNDING SOURCE
INDICATORS OF IMPLEMENTATION
1. Student conferences in advisory
8/2018-6/2023
Advisory teachers $0 n/a Advisory records
2.
3.
Page 70 of 71
2016-2017 School Report Card See Blue Ridge High School Report Card online.
2017-2018 School Report Card See Blue Ridge High School Report Card online.

Page 71 of 71
2016-2018 ESEA Currently not available.