Global Blue
31
INTERNATIONAL SHOPPERS What’s happening in the British & Scottish markets? June 11 th 2019
-
Upload
khangminh22 -
Category
Documents
-
view
0 -
download
0
Transcript of Global Blue
INTERNATIONAL SHOPPERSWhat’s happening in the British & Scottish
markets?
June 11th 2019
Methodology
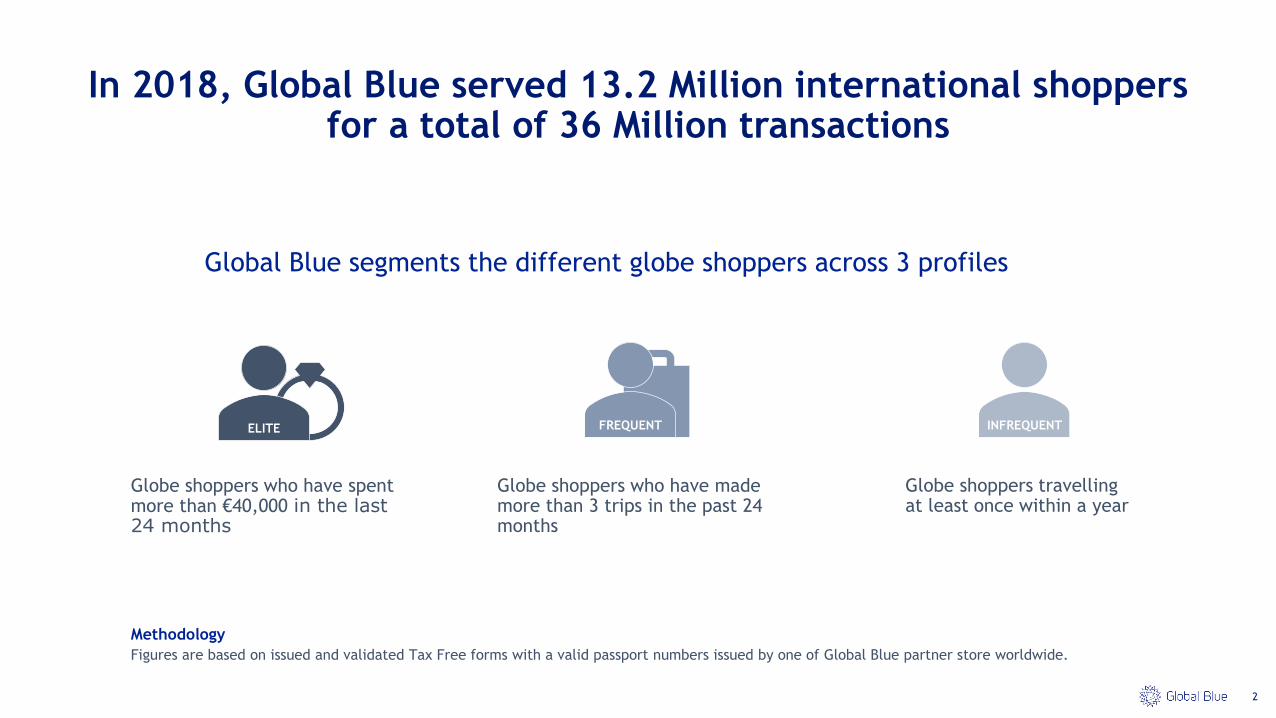
Figures are based on issued and validated Tax Free forms with a valid passport numbers issued by one of Global Blue partner store worldwide.
2
ELITE
Globe shoppers who have spentmore than €40,000 in the last 24 months
FREQUENT
Globe shoppers who have made more than 3 trips in the past 24 months
INFREQUENT
Globe shoppers travelling at least once within a year
In 2018, Global Blue served 13.2 Million international shoppers for a total of 36 Million transactions
Global Blue segments the different globe shoppers across 3 profiles
3
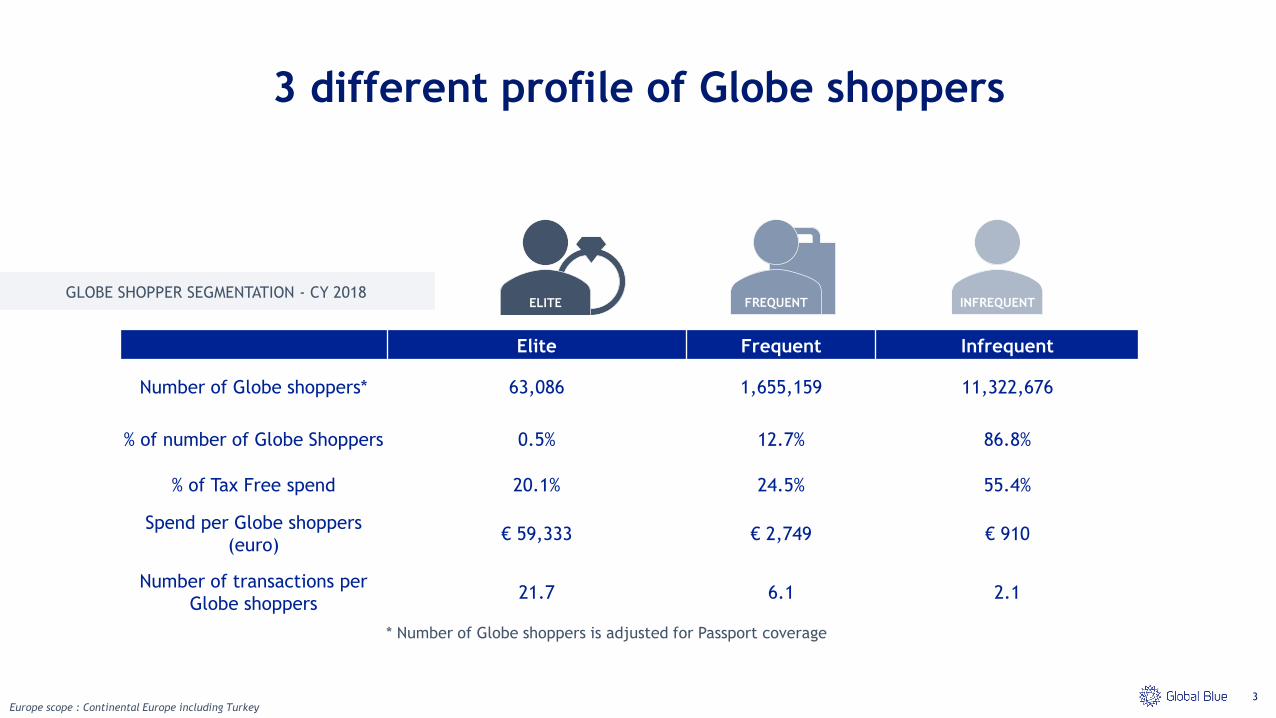
GLOBE SHOPPER SEGMENTATION - CY 2018
Europe scope : Continental Europe including Turkey
3 different profile of Globe shoppers
Elite Frequent Infrequent
Number of Globe shoppers* 63,086 1,655,159 11,322,676
% of number of Globe Shoppers 0.5% 12.7% 86.8%
% of Tax Free spend 20.1% 24.5% 55.4%
Spend per Globe shoppers
(euro)€ 59,333 € 2,749 € 910
Number of transactions per
Globe shoppers21.7 6.1 2.1
ELITE FREQUENT INFREQUENT
* Number of Globe shoppers is adjusted for Passport coverage
4
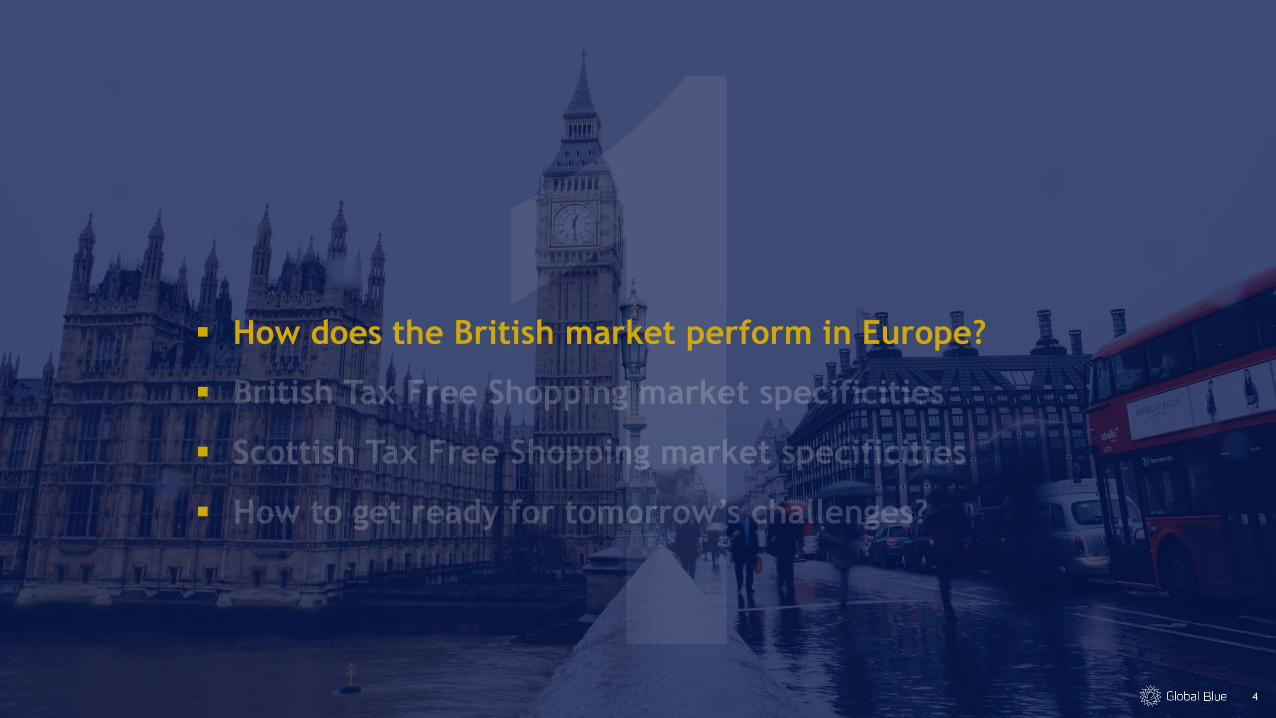
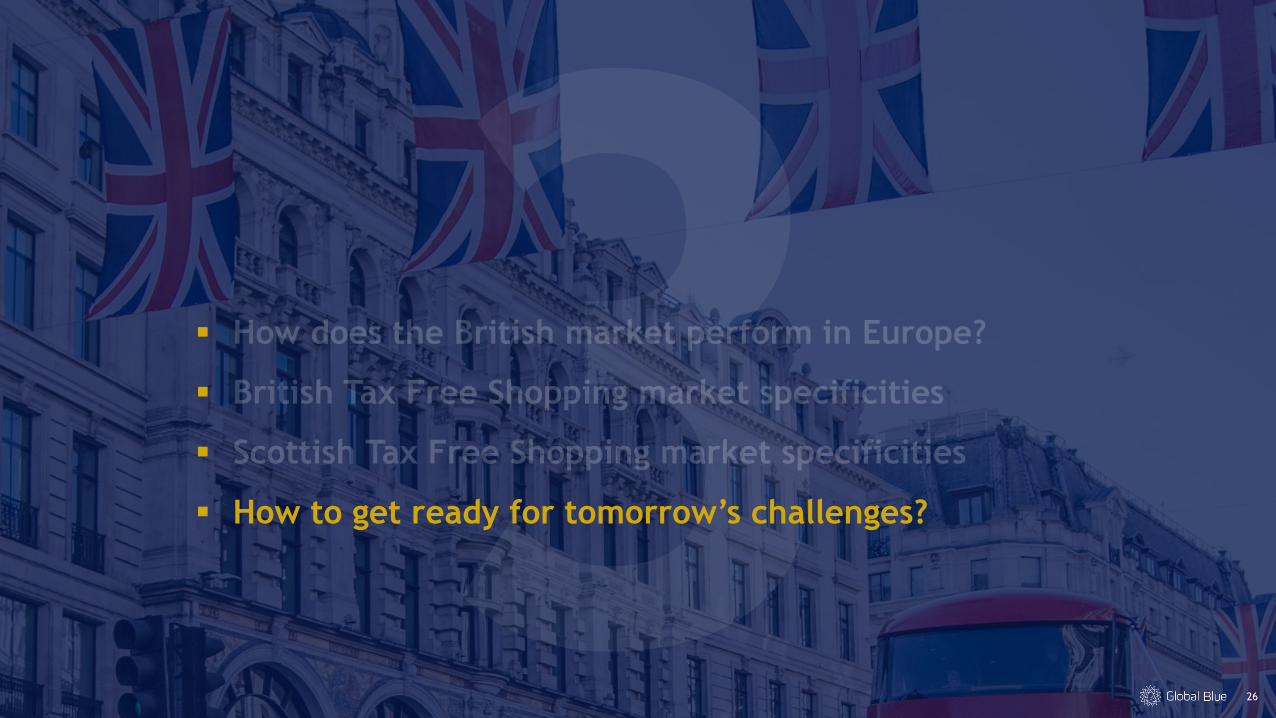
▪ How does the British market perform in Europe?
▪
▪
▪
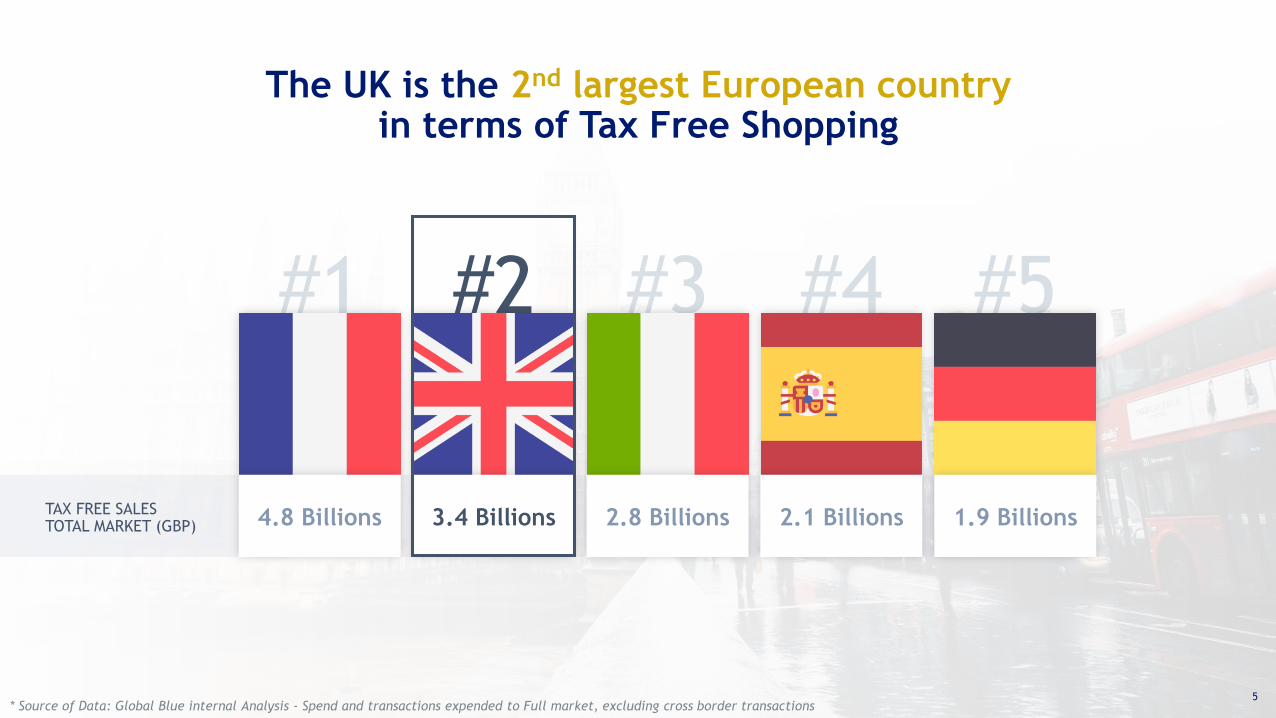
TAX FREE SALESTOTAL MARKET (GBP)
#2
The UK is the 2nd largest European country in terms of Tax Free Shopping
5
4.8 Billions 3.4 Billions 2.8 Billions 2.1 Billions 1.9 Billions
* Source of Data: Global Blue internal Analysis - Spend and transactions expended to Full market, excluding cross border transactions
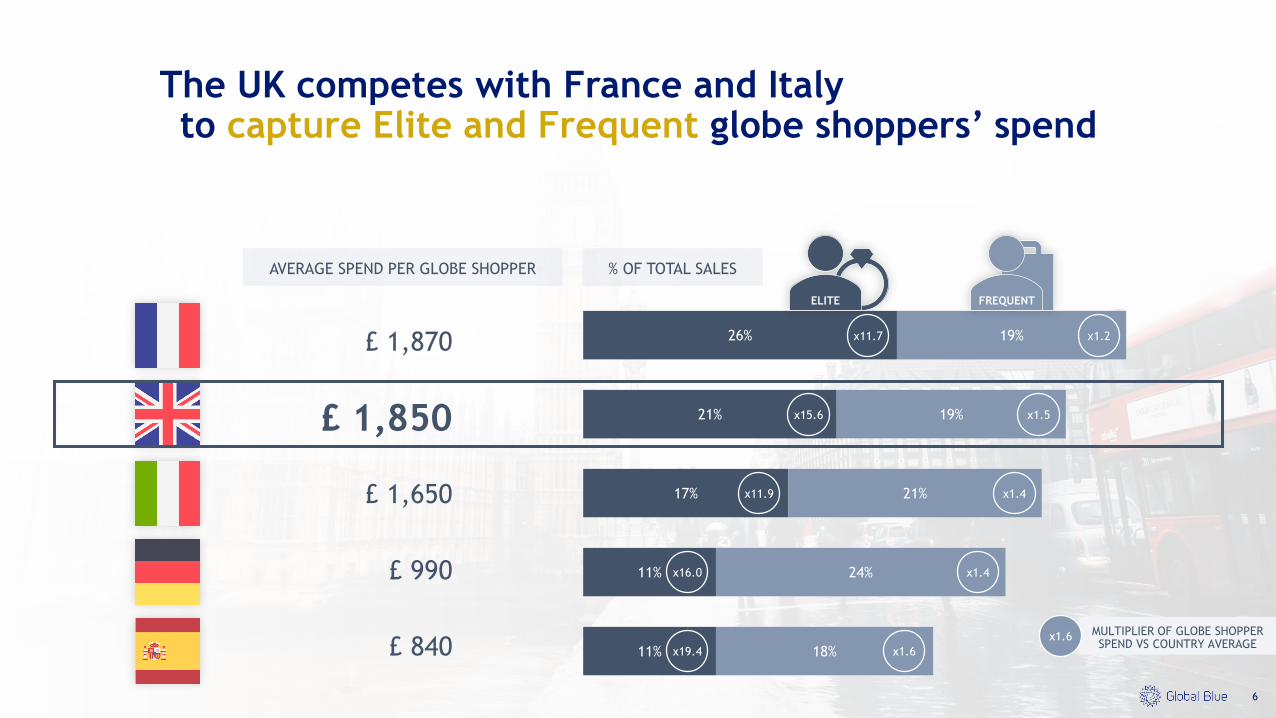
The UK competes with France and Italy to capture Elite and Frequent globe shoppers’ spend
6
AVERAGE SPEND PER GLOBE SHOPPER
£ 1,870
£ 1,850
£ 1,650
£ 990
£ 840 11%
11%
17%
21%
26%
18%
24%
21%
19%
19%
% OF TOTAL SALES
ELITE FREQUENT
x11.7
x15.6
x11.9
x16.0
x19.4
x1.2
x1.5
x1.4
x1.4
x1.6
MULTIPLIER OF GLOBE SHOPPER SPEND VS COUNTRY AVERAGE
x1.6
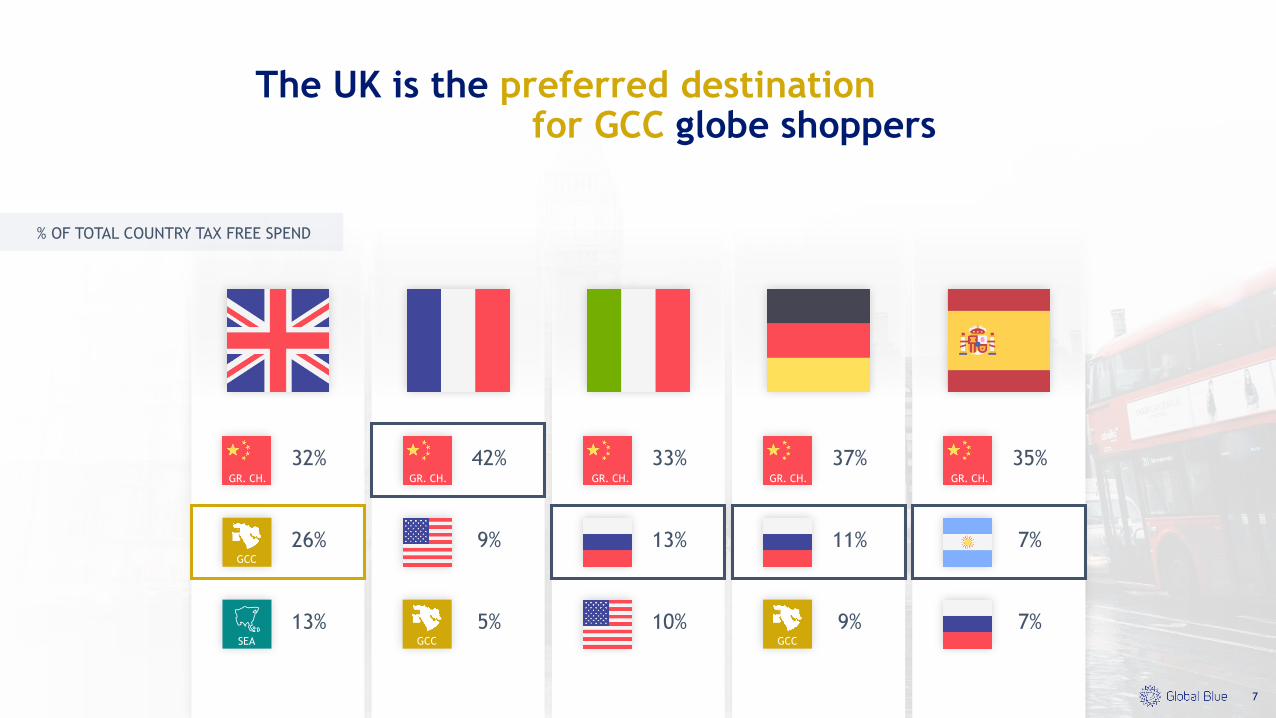
The UK is the preferred destination for GCC globe shoppers
7
% OF TOTAL COUNTRY TAX FREE SPEND
GCC
26% 13% 7%9% 11%
32% 33% 35%42% 37%
SEA
13% 10% 7%GCC
5%GCC
9%
GR. CH. GR. CH. GR. CH. GR. CH. GR. CH.
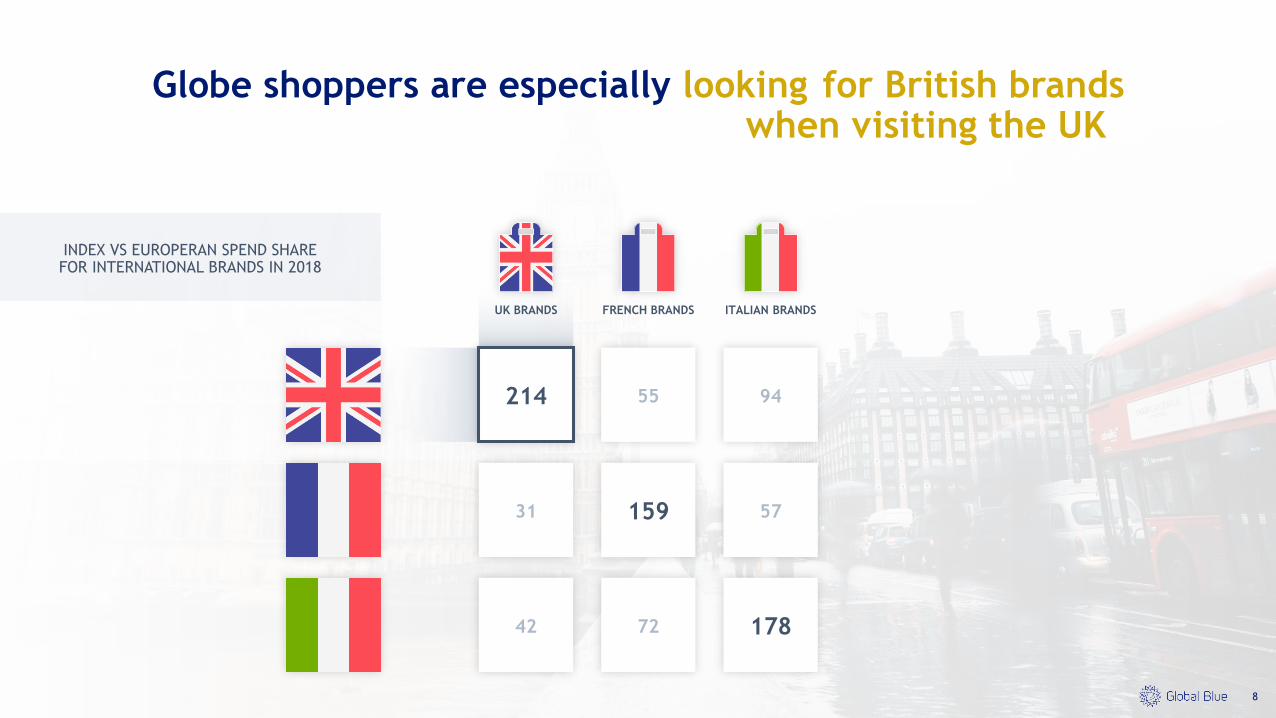
Globe shoppers are especially looking for British brandswhen visiting the UK
8
INDEX VS EUROPERAN SPEND SHARE FOR INTERNATIONAL BRANDS IN 2018
31 159 57
42 72 178
UK BRANDS
214
FRENCH BRANDS ITALIAN BRANDS
55 94
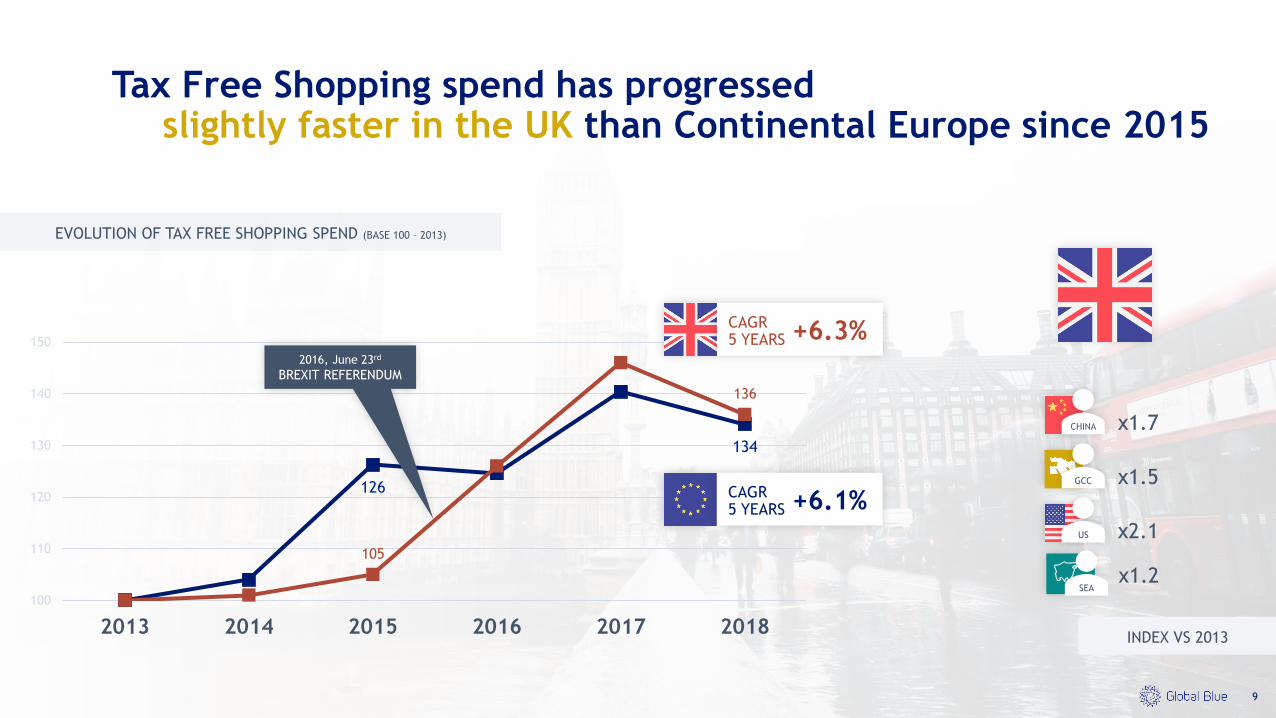
Tax Free Shopping spend has progressed slightly faster in the UK than Continental Europe since 2015
9
EVOLUTION OF TAX FREE SHOPPING SPEND (BASE 100 – 2013)
126
134
105
136
100
110
120
130
140
150
2013 2014 2015 2016 2017 2018
CAGR5 YEARS +6.3%
CAGR5 YEARS +6.1%
CHINA
GCC x1.5
x1.7
x2.1US
2016, June 23rd
BREXIT REFERENDUM
x1.2SEA
INDEX VS 2013
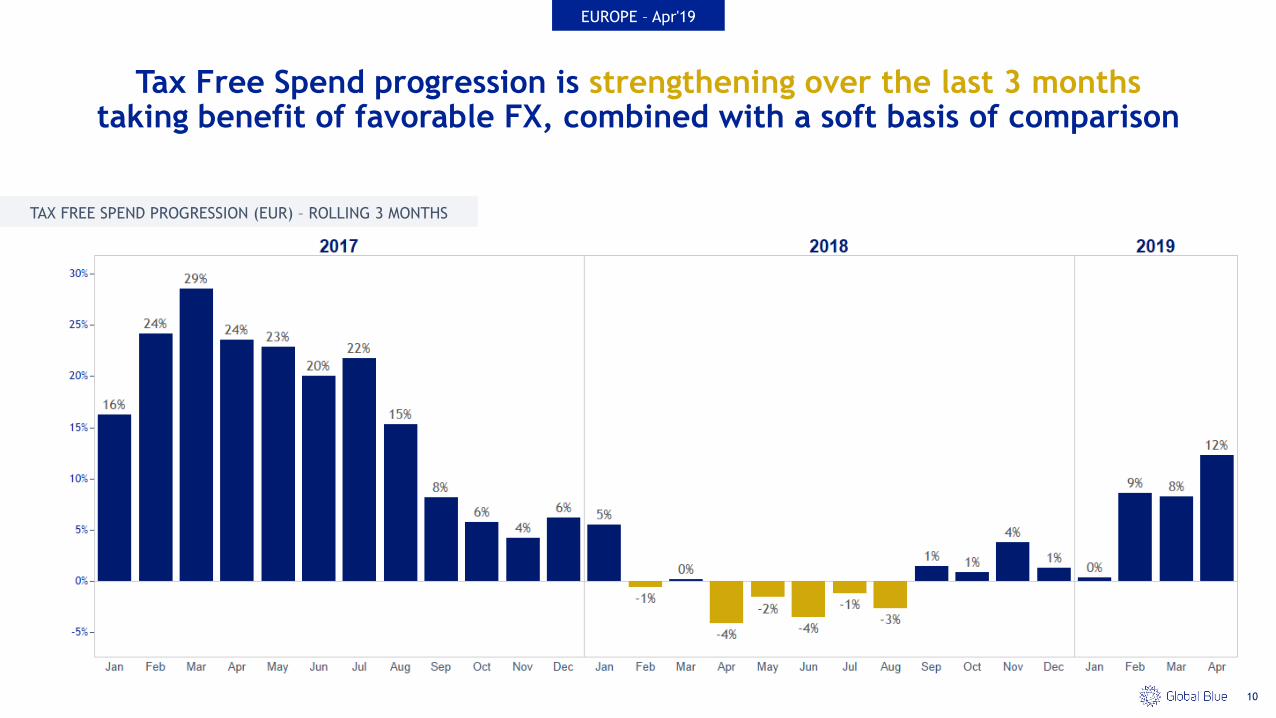
Tax Free Spend progression is strengthening over the last 3 months taking benefit of favorable FX, combined with a soft basis of comparison
10
EUROPE – Apr'19
TAX FREE SPEND PROGRESSION (EUR) – ROLLING 3 MONTHS
11
▪
▪ British Tax Free Shopping market specificities
▪
▪
A MARKET ORIENTED TOWARDS
LUXURY12
13
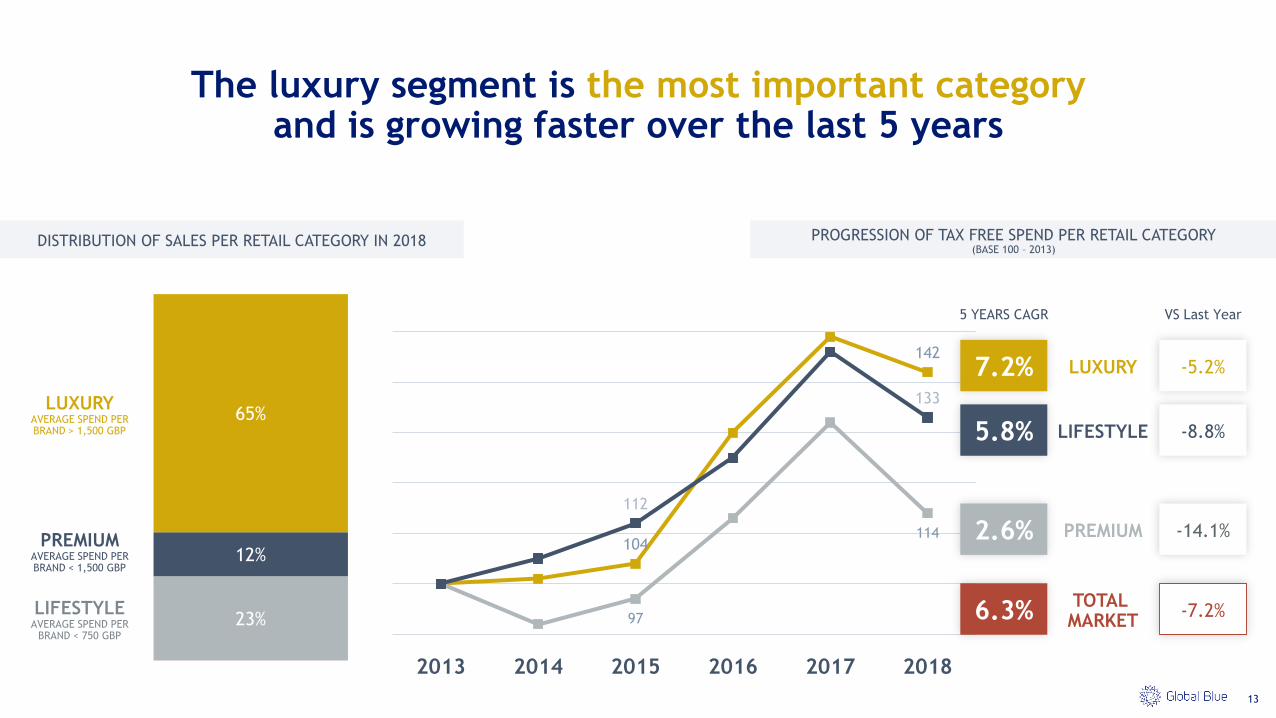
The luxury segment is the most important categoryand is growing faster over the last 5 years
23%
12%
65%
DISTRIBUTION OF SALES PER RETAIL CATEGORY IN 2018
104
142
97
114
112
133
2013 2014 2015 2016 2017 2018
PROGRESSION OF TAX FREE SPEND PER RETAIL CATEGORY (BASE 100 – 2013)
LUXURYAVERAGE SPEND PER BRAND > 1,500 GBP
PREMIUMAVERAGE SPEND PER BRAND < 1,500 GBP
LIFESTYLEAVERAGE SPEND PER
BRAND < 750 GBP
13
LUXURY7.2% -5.2%
LIFESTYLE5.8% -8.8%
PREMIUM2.6% -14.1%
5 YEARS CAGR VS Last Year
TOTAL MARKET6.3% -7.2%
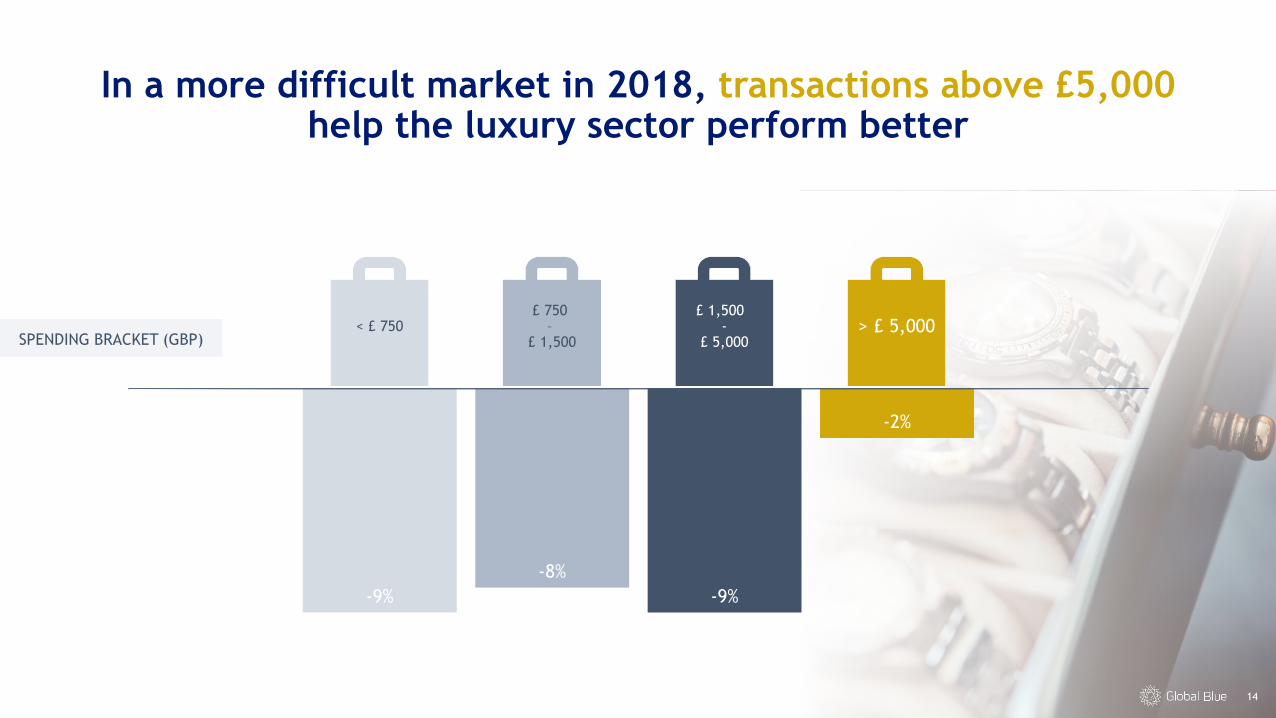
In a more difficult market in 2018, transactions above £5,000 help the luxury sector perform better
14
-9%
-8%
-9%
-2%
< £ 750£ 750
–£ 1,500
£ 1,500 -
£ 5,000> £ 5,000
SPENDING BRACKET (GBP)
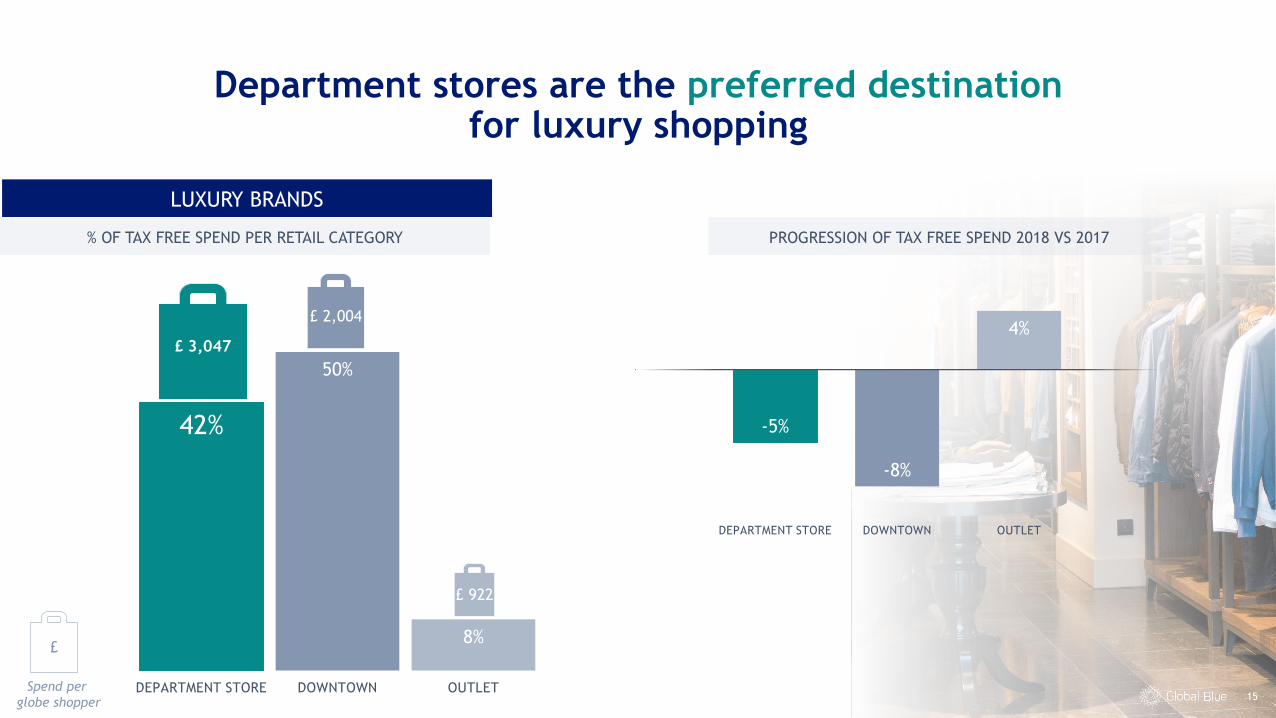
Department stores are the preferred destination for luxury shopping
15
42%
50%
8%
DEPARTMENT STORE DOWNTOWN OUTLET
% OF TAX FREE SPEND PER RETAIL CATEGORY
-5%
-8%
4%
DEPARTMENT STORE DOWNTOWN OUTLET
PROGRESSION OF TAX FREE SPEND 2018 VS 2017
£ 3,047
£ 2,004
£ 922
£
Spend per
globe shopper
LUXURY BRANDS
A MARKET WITH A UNIQUE
NATIONALITY MIX16
17
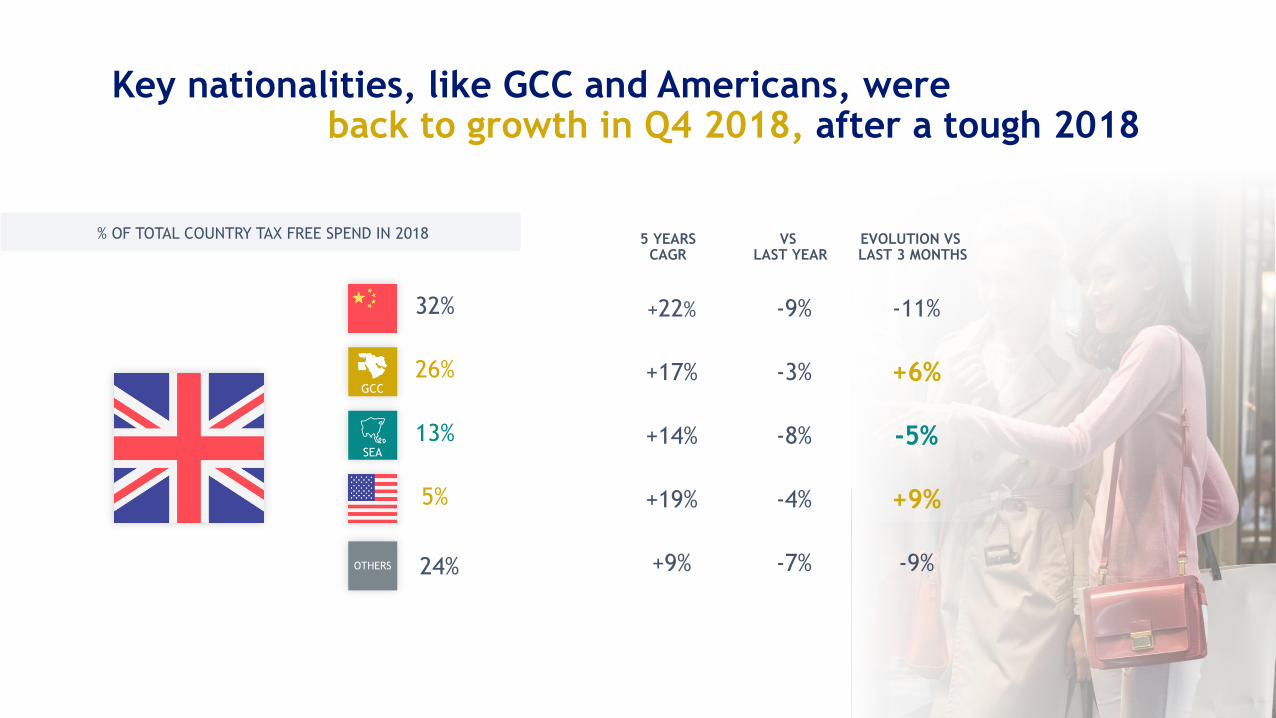
Key nationalities, like GCC and Americans, were back to growth in Q4 2018, after a tough 2018
5 YEARSCAGR
VS LAST YEAR
EVOLUTION VS LAST 3 MONTHS
32%
GCC
26%
SEA
13%
5%
+22% -9% -11%
+17% -3% +6%
+14% -8% -5%
+19% -4% +9%
+9% -7% -9%OTHERS
% OF TOTAL COUNTRY TAX FREE SPEND IN 2018
24%
18
▪
▪
▪ Scottish Tax Free Shopping market specificities
▪
19
A MARKET ORIENTED TOWARDS
LOCAL EXCELLENCE AND PREMIUM QUALITY
20
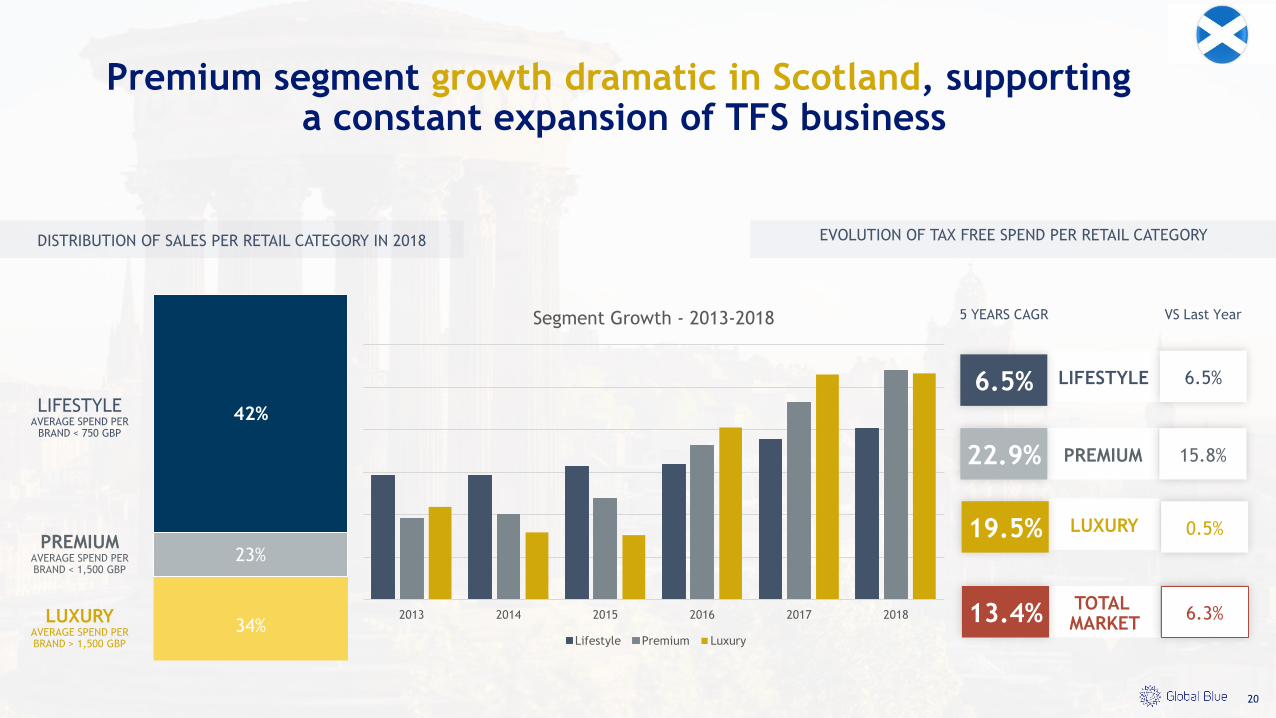
Premium segment growth dramatic in Scotland, supporting a constant expansion of TFS business
34%
23%
42%
DISTRIBUTION OF SALES PER RETAIL CATEGORY IN 2018 EVOLUTION OF TAX FREE SPEND PER RETAIL CATEGORY
LUXURYAVERAGE SPEND PER BRAND > 1,500 GBP
PREMIUMAVERAGE SPEND PER BRAND < 1,500 GBP
LIFESTYLEAVERAGE SPEND PER
BRAND < 750 GBP
20
LUXURY19.5% 0.5%
LIFESTYLE6.5% 6.5%
PREMIUM22.9% 15.8%
5 YEARS CAGR VS Last Year
TOTAL MARKET13.4% 6.3%2013 2014 2015 2016 2017 2018
Segment Growth - 2013-2018
Lifestyle Premium Luxury
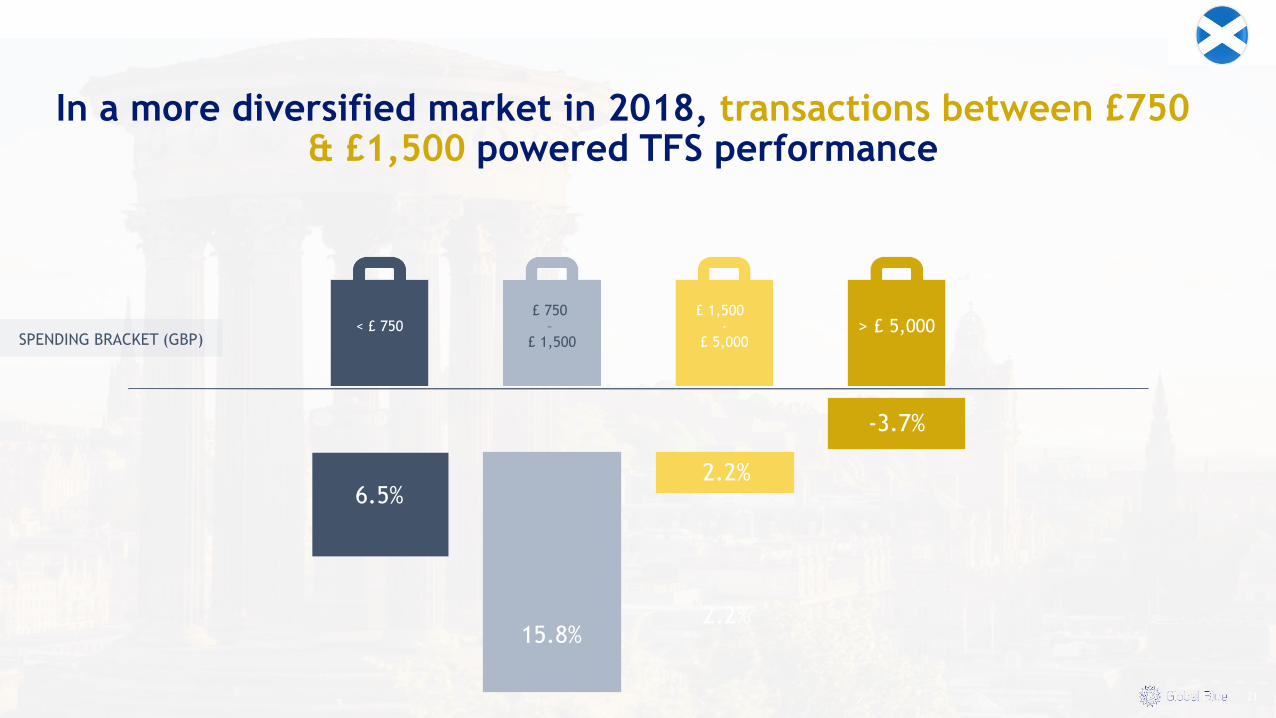
In a more diversified market in 2018, transactions between £750 & £1,500 powered TFS performance
21
< £ 750£ 750
–£ 1,500
£ 1,500 -
£ 5,000> £ 5,000
SPENDING BRACKET (GBP)
6.5%
15.8%
2.2%
2.2%
-3.7%
22
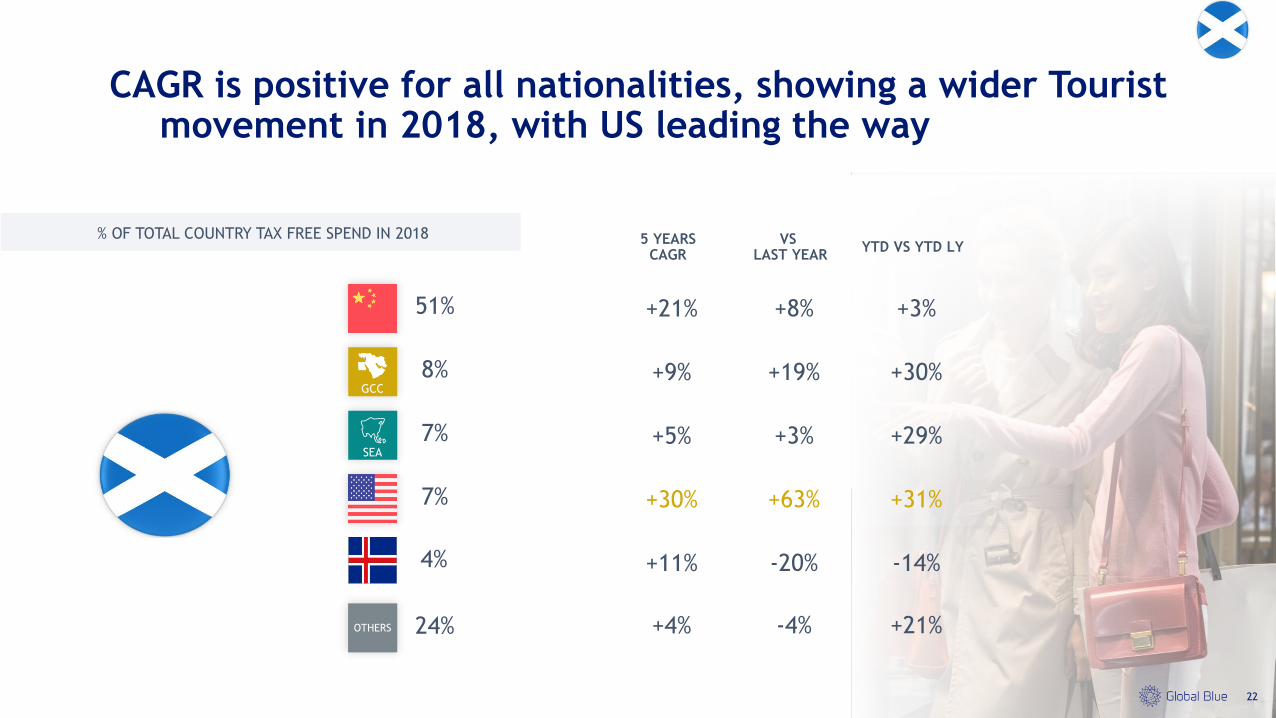
CAGR is positive for all nationalities, showing a wider Tourist movement in 2018, with US leading the way
5 YEARSCAGR
VS LAST YEAR
YTD VS YTD LY
51%
GCC
8%
SEA
7%
7%
+21% +8% +3%
+9% +19% +30%
+5% +3% +29%
+30% +63% +31%
+11% -20% -14%
OTHERS
% OF TOTAL COUNTRY TAX FREE SPEND IN 2018
24%
4%
+4% -4% +21%
2019A year of economic
growth
23
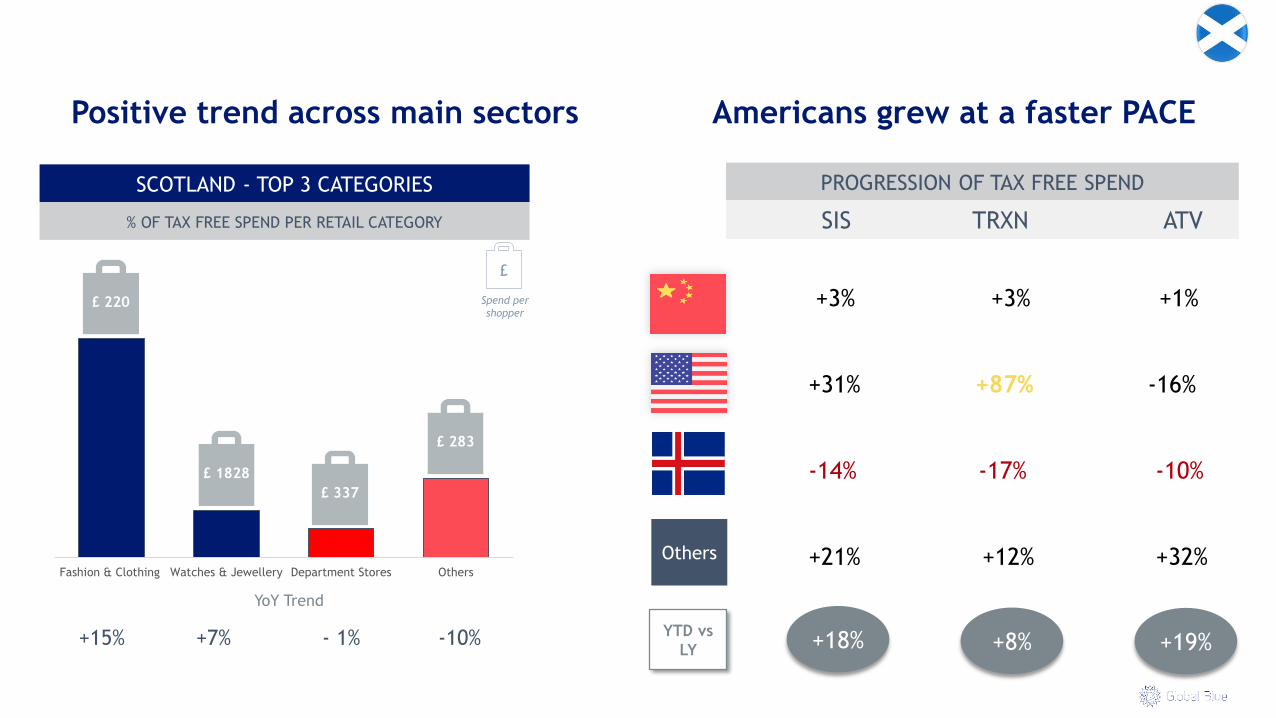
Fashion & Clothing Watches & Jewellery Department Stores Others
£ 220
£ 337
£ 1828
£ 283
Positive trend across main sectors Americans grew at a faster PACE
24
% OF TAX FREE SPEND PER RETAIL CATEGORY
PROGRESSION OF TAX FREE SPENDSCOTLAND - TOP 3 CATEGORIES
+15% +7% - 1% -10%
£
Spend per
shopper
SIS TRXN ATV
+3% +3% +1%
+31% +87% -16%
-14% -17% -10%
+21% +12% +32%
+18% +8%
Others
YoY Trend
+19%YTD vs
LY
OTHER NATIONALITIES
GCCGLOBE SHOPPERS
AMERICANGLOBE SHOPPERS
RUSSIANGLOBE SHOPPERS
CHINESE GLOBE SHOPPERS
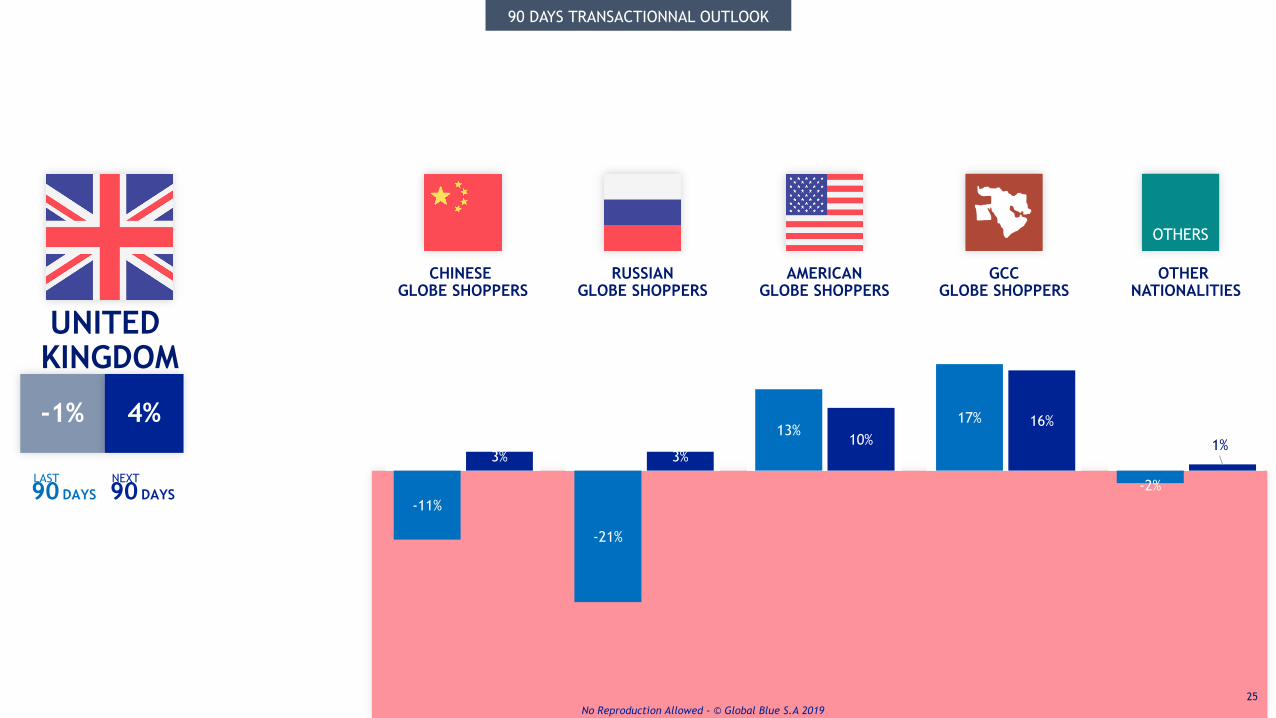
-3%
-11%
-21%
13%17%
-2%-6%
3% 3%10%
16%
1%
25
UNITED KINGDOM
90 DAYS
LAST
90 DAYS
NEXT
90 DAYS TRANSACTIONNAL OUTLOOK
OTHERS
-1% 4%
No Reproduction Allowed - © Global Blue S.A 2019
26
▪
▪
▪
▪ How to get ready for tomorrow’s challenges?
27
ANTICIPATE TAX FREE SHOPPING
DIGITISATION
28
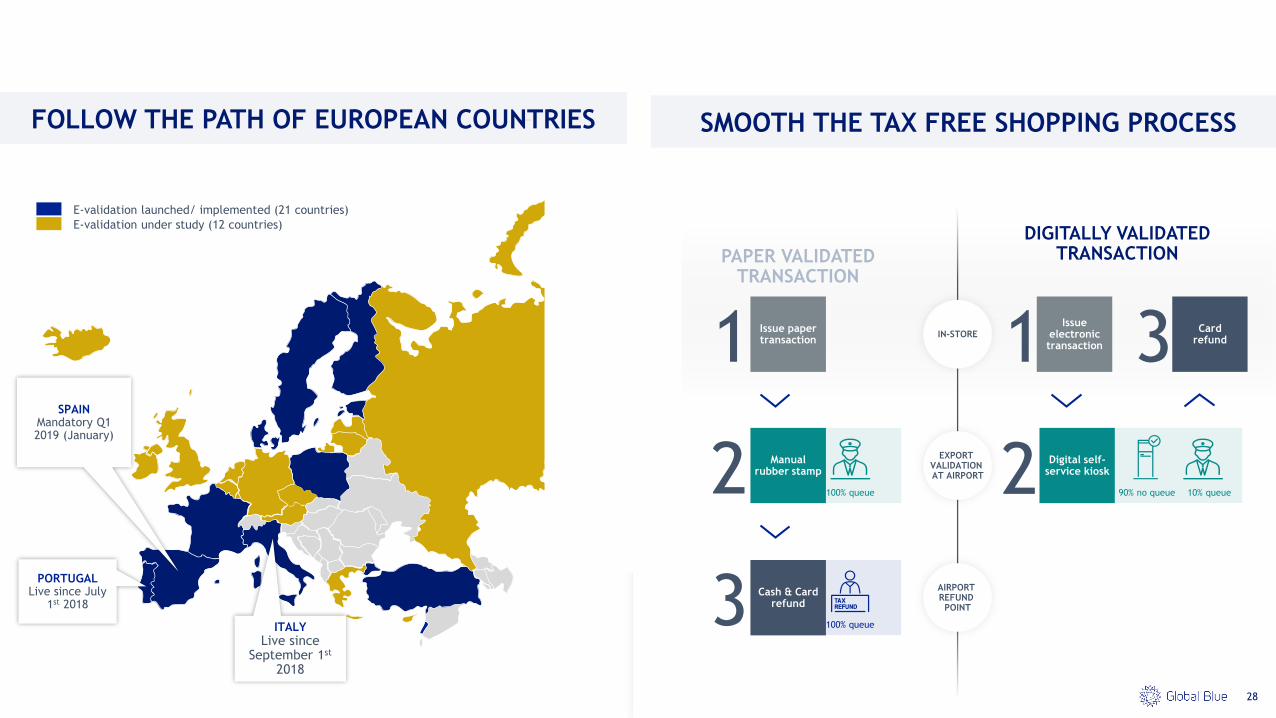
DIGITALLY VALIDATED TRANSACTIONPAPER VALIDATED
TRANSACTION
E-validation launched/ implemented (21 countries)
E-validation under study (12 countries)
ITALYLive since
September 1st
2018
PORTUGALLive since July
1st 2018
SPAINMandatory Q1 2019 (January)
IN-STORE1 Issue paper transaction
EXPORT VALIDATION AT AIRPORT 2 Digital self-
service kiosk
90% no queue 10% queue2 Manual rubber stamp
100% queue
AIRPORT REFUND
POINT3 Cash & Card refund
100% queue
1Issue
electronic transaction 3 Card
refund
FOLLOW THE PATH OF EUROPEAN COUNTRIES SMOOTH THE TAX FREE SHOPPING PROCESS
29
ANTICIPATE
BREXIT’S IMPACTS
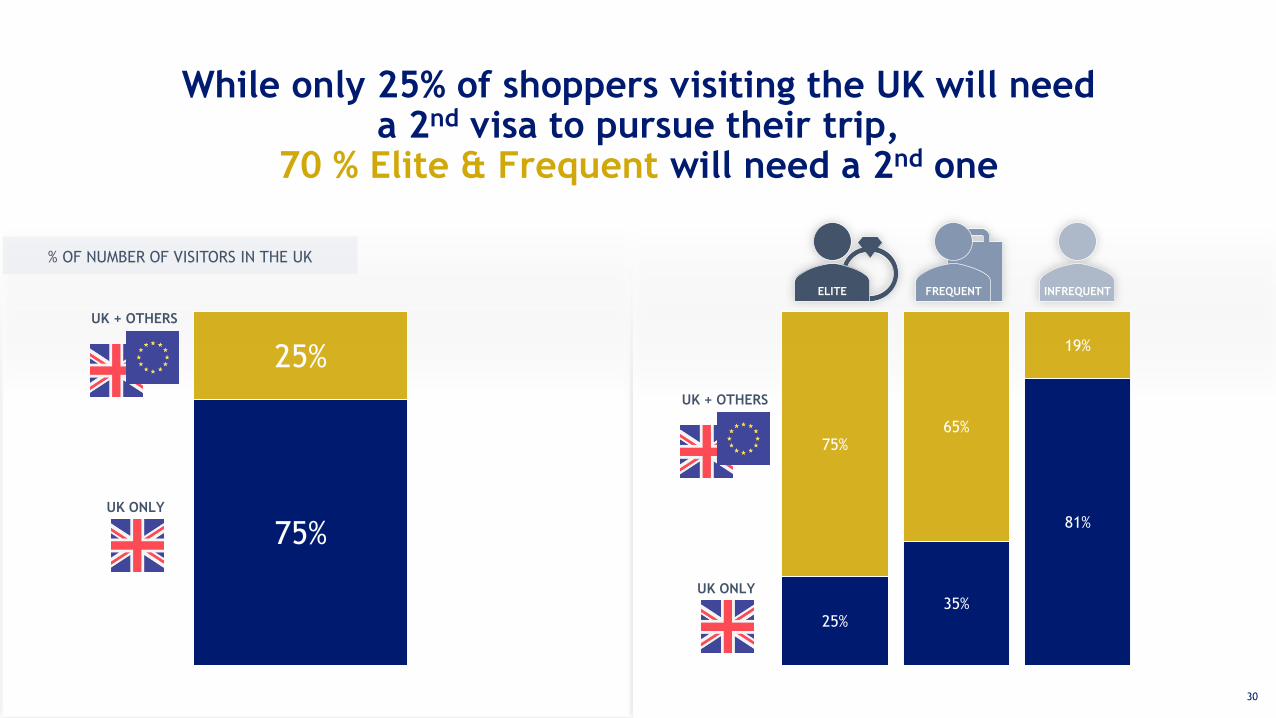
While only 25% of shoppers visiting the UK will needa 2nd visa to pursue their trip,
70 % Elite & Frequent will need a 2nd one
30
25%35%
81%
75%65%
19%
ELITE FREQUENT INFREQUENT
UK ONLY
UK + OTHERS
75%
25%
UK ONLY
UK + OTHERS
% OF NUMBER OF VISITORS IN THE UK
ENHANCING THE GLOBE SHOPPER
EXPERIENCE TOGETHER