Variations in the Temporal and Spatial Distribution of ... - MDPI
13
sustainability Article Variations in the Temporal and Spatial Distribution of Microalgae in Aquatic Environments Associated with an Artificial Weir Suk Min Yun 1, * , Sang Deuk Lee 2 , Pyo Yun Cho 3 , Seung Won Nam 2 , Dae Ryul Kwon 2 , Chung Hyun Choi 4 , Jin-Young Kim 3 and Jong-Suk Lee 3 1 Exhibition & Education Department, Nakdonggang National Institute of Biological Resources, Sangju-si, Gyeongsangbuk-do 37242, Korea 2 Microbial Research Department, Nakdonggang National Institute of Biological Resources, Sangju-si, Gyeongsangbuk-do 37242, Korea; [email protected] (S.D.L.); [email protected] (S.W.N.); [email protected] (D.R.K.) 3 Animal & Plant Research Department, Nakdonggang National Institute of Biological Resources, Sangju-si, Gyeongsangbuk-do 37242, Korea; [email protected] (P.Y.C.); [email protected] (J.-Y.K.); [email protected] (J.-S.L.) 4 Department of Oceanography, Kunsan National University, Gunsan-si, Jeollabuk-do 54150, Korea; [email protected] * Correspondence: [email protected]; Tel.: +82-54-530-0777; Fax: +82-54-530-0779 Received: 31 May 2020; Accepted: 21 July 2020; Published: 10 August 2020 Abstract: The construction of weirs causes changes in the aquatic environment and affects several aquatic organisms. To understand the ecosystem in the Sangju Weir, Gyeongsangbuk-do Province, variations in the spatiotemporal distribution and composition of microalgae communities were analyzed. Microalgae were collected fortnightly from April to November 2018 from six sites in the Nakdonggang River. There was significant variation in environmental factors, microalgal community structure, and flora. Microalgae communities were dominated by diatoms (e.g., Fragilaria crotonensis, Ulnaria acus, and Aulacoseira ambigua), green algae (e.g., genera Eudorina and Desmodesmus), cyanobacteria (e.g., genera Anabaena and Microcystis). Multidimensional scaling indicated that species composition and diversity were generally similar among sites but varied between the bottom and the surface and middle water layers. Vertical migration of microalgae was difficult to investigate because of the thermocline in the study area and high turbidity in the lower layer. The distribution of microalgae was little affected by the construction of the weir, but the formation of thermocline changed microalgae communities in the water layer. Keywords: aquatic ecosystem; species distribution; Sangju Weir; microalgae 1. Introduction The Nakdonggang River is the largest river in the Republic of Korea, with a length of 510 km and a watershed area of 23,384 km 2 [1,2]. The upper stream flows into the western part of the Banbyeoncheon Stream in Andong-si, and several tributaries, such as the Naeseongcheon Stream and the Yeonggang River (the first tributary of the Nakdonggang River) near the Hamchang Stream, gather to flow southward through Sangju, Sunsan, and Daegu [1,2]. The Nakdonggang River is important since it has become a major source of agricultural, public, and industrial water near the metropolis [1,2]. A weir is a barrier across the width of a river, installed to allow the flow of a certain amount of water along the water intake channel to maintain a constant water level upstream by blocking the waterway and to harvest water for agricultural and domestic use. In addition to water abstraction Sustainability 2020, 12, 6442; doi:10.3390/su12166442 www.mdpi.com/journal/sustainability
-
Upload
khangminh22 -
Category
Documents
-
view
0 -
download
0
Transcript of Variations in the Temporal and Spatial Distribution of ... - MDPI

sustainability
Article
Variations in the Temporal and Spatial Distribution ofMicroalgae in Aquatic Environments Associated withan Artificial Weir
Suk Min Yun 1,* , Sang Deuk Lee 2 , Pyo Yun Cho 3, Seung Won Nam 2 , Dae Ryul Kwon 2,Chung Hyun Choi 4, Jin-Young Kim 3 and Jong-Suk Lee 3
1 Exhibition & Education Department, Nakdonggang National Institute of Biological Resources, Sangju-si,Gyeongsangbuk-do 37242, Korea
2 Microbial Research Department, Nakdonggang National Institute of Biological Resources, Sangju-si,Gyeongsangbuk-do 37242, Korea; [email protected] (S.D.L.); [email protected] (S.W.N.);[email protected] (D.R.K.)
3 Animal & Plant Research Department, Nakdonggang National Institute of Biological Resources, Sangju-si,Gyeongsangbuk-do 37242, Korea; [email protected] (P.Y.C.); [email protected] (J.-Y.K.);[email protected] (J.-S.L.)
4 Department of Oceanography, Kunsan National University, Gunsan-si, Jeollabuk-do 54150, Korea;[email protected]
* Correspondence: [email protected]; Tel.: +82-54-530-0777; Fax: +82-54-530-0779
Received: 31 May 2020; Accepted: 21 July 2020; Published: 10 August 2020�����������������
Abstract: The construction of weirs causes changes in the aquatic environment and affects severalaquatic organisms. To understand the ecosystem in the Sangju Weir, Gyeongsangbuk-do Province,variations in the spatiotemporal distribution and composition of microalgae communities wereanalyzed. Microalgae were collected fortnightly from April to November 2018 from six sites inthe Nakdonggang River. There was significant variation in environmental factors, microalgalcommunity structure, and flora. Microalgae communities were dominated by diatoms (e.g., Fragilariacrotonensis, Ulnaria acus, and Aulacoseira ambigua), green algae (e.g., genera Eudorina and Desmodesmus),cyanobacteria (e.g., genera Anabaena and Microcystis). Multidimensional scaling indicated that speciescomposition and diversity were generally similar among sites but varied between the bottom andthe surface and middle water layers. Vertical migration of microalgae was difficult to investigatebecause of the thermocline in the study area and high turbidity in the lower layer. The distributionof microalgae was little affected by the construction of the weir, but the formation of thermoclinechanged microalgae communities in the water layer.
Keywords: aquatic ecosystem; species distribution; Sangju Weir; microalgae
1. Introduction
The Nakdonggang River is the largest river in the Republic of Korea, with a length of 510 km and awatershed area of 23,384 km2 [1,2]. The upper stream flows into the western part of the BanbyeoncheonStream in Andong-si, and several tributaries, such as the Naeseongcheon Stream and the YeonggangRiver (the first tributary of the Nakdonggang River) near the Hamchang Stream, gather to flowsouthward through Sangju, Sunsan, and Daegu [1,2]. The Nakdonggang River is important since it hasbecome a major source of agricultural, public, and industrial water near the metropolis [1,2].
A weir is a barrier across the width of a river, installed to allow the flow of a certain amount ofwater along the water intake channel to maintain a constant water level upstream by blocking thewaterway and to harvest water for agricultural and domestic use. In addition to water abstraction
Sustainability 2020, 12, 6442; doi:10.3390/su12166442 www.mdpi.com/journal/sustainability
Sustainability 2020, 12, 6442 2 of 13
from rivers and pollution, damming is probably one of the greatest stressors affecting water flow [3–5].Through the “The Four Major Rivers Restoration Project” in Korea, 16 weirs have been constructed.Weirs and dams can interfere with or prevent the transport of sediments and nutrients along rivers,reduce fluctuations in natural discharge, stop the inundation of floodplains, and result in the formationof wider and shallower rivers [3]. Such riverine changes can lead to increased algal blooms, increasederosion, and reductions in water quality [3,6]. The Sangju Weir, located in the upper stream of theNakdonggang River, was constructed at the Jungdong-myeon, Sangju-si, Gyeongsangbuk-do Province(81 km downstream of the Andong Dam) as part of the “The Four Major Rivers Restoration Project.”Its watershed area is 7404 km2, which corresponds to about 32% of the area of the Nakdonggang River,its management water level is 47.0 m, and it secures 27.4 million m3 of water.
Microalgae are primary producers in aquatic ecosystems and are used as indicators for underwaterenvironments owing to the responsiveness of communities to changes in water quality [7–11] andphysicochemical factors [1]. In addition, when pollution increases, certain species may cause oxygendepletion and fish death [12].
First studies of microalgal communities in major freshwater aquatic systems in Korea wereconducted by Chung et al. [13]. This was followed by studies on the Nakdonggang River, especially onphytoplankton communities [1,2,14–20]. Currently, many research institutes are conducting researchon the Nakdonggang River from various perspectives.
In this study, we aimed to further understand how artificial weirs affect the spatiotemporaldistribution and community composition of microalgae in the aquatic ecosystem. In addition, througha diurnal vertical migration study of microalgae, we aimed to understand the environmental factorsaffecting the vertical distribution of microalgae.
2. Materials and Methods
2.1. Sampling Sites
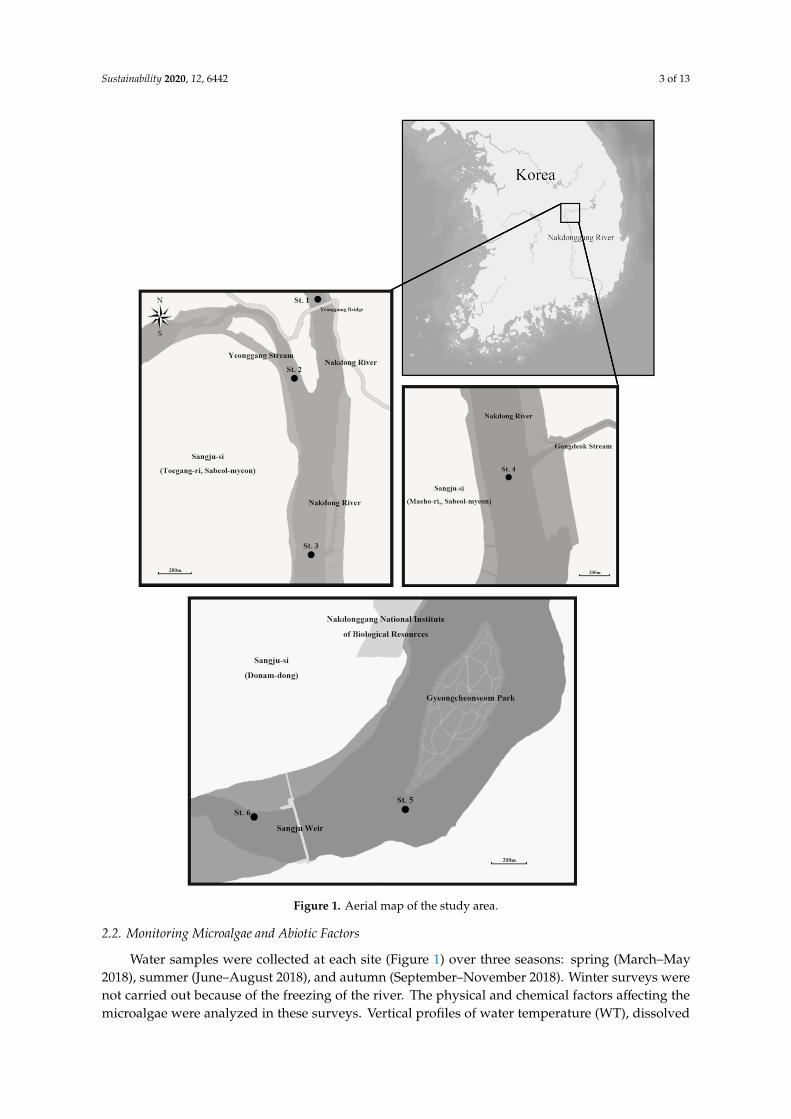
Six sampling sites were established: Site 1 (St. 1) in the upper part of the Sangju Weir, nearthe Yeongpung Bridge; St. 2 in the Yeonggang River (the first tributary of the Nakdonggang River);St. 3 at the junction of the Nakdonggang River and Yeonggang River; St. 4 is the confluence of theNakdonggang River and Gongdeokcheon Stream; St. 5 near the Gyeongcheon Island Park and SangjuWeir; and St. 6 in the lower part of the Sangju Weir. Selected sites were expected to remain unaffected(Sites 1 and 2) or affected either by the tributary (Sites 3 and 4) or the weir (Sites 5 and 6). The distancebetween St. 1 and St. 6 was approximately 20 km (Figure 1). Sampling was undertaken every twoweeks from April to November 2018.
A study was conducted on the vertical migration of microalgae during the first survey (7–8 June2018) and the second survey (18–19 September 2018). Mooring analysis was conducted at St. 5 (nearthe Gyeongcheon Island), where the water depth is constantly maintained at 10 m. The microalgaewere collected from depths of 1 m (surface layer), 5 m (middle layer), and 10 m (bottom layer).
Sustainability 2020, 12, 6442 3 of 13Sustainability 2020, 12, x FOR PEER REVIEW 3 of 14
Figure 1. Aerial map of the study area.
2.2. Monitoring Microalgae and Abiotic Factors
Water samples were collected at each site (Figure 1) over three seasons: spring (March–May 2018), summer (June–August 2018), and autumn (September–November 2018). Winter surveys were
Figure 1. Aerial map of the study area.
2.2. Monitoring Microalgae and Abiotic Factors
Water samples were collected at each site (Figure 1) over three seasons: spring (March–May2018), summer (June–August 2018), and autumn (September–November 2018). Winter surveys werenot carried out because of the freezing of the river. The physical and chemical factors affecting themicroalgae were analyzed in these surveys. Vertical profiles of water temperature (WT), dissolved

Sustainability 2020, 12, 6442 4 of 13
oxygen (DO), conductivity (CON), pH, and turbidity (TUR) were measured using water qualitysampling and monitoring meters (ProDSS, YSI, Yellow Springs, OH, USA). Water samples werecollected from the surface (0.5 m depth), middle (4 m depth), and bottom (1 m above the riverbed)using a 5 L Van Dorn sampler. We also analyzed the total organic carbon (TOC), total phosphorus (TP),and total nitrogen (TN) content (Supplementary Tables S1 and S2). To analyze the concentrations ofnutrients, each 30 mL sample of water was collected in a 50 mL poly-ethylene bottle. The TN, TP, andTOC concentrations were measured using a TOC analyzer (Shimadzu TOC analyzer, Shimadzu, Kyoto,Japan) and UV/Vis spectrophotometer (G1103A, Agilent, Pal Alto, CA, USA) and the concentrationswere determined following modified methods [21]. Counts and identification of at least 500 cells persample were performed using a Counting Chamber Sedgewick Rafter Cell at 400 × magnificationand a light microscope (LM, Eclipse Ni, Nikon, Tokyo, Japan). The fine structure of the diatom(Bacillariophyta) was observed using a field emission scanning electron microscope (FE-SEM, MIRA3, TESCAN, Brno, Czech Republic). The diatom in each water sample were collected on an Isoporemembrane filter (pore size: 0.22 µm, GTTP04700; Burlington, Millipore). The samples were dried in adesiccator. Each dried sample was gold coated and then inspected using the FE-SEM instrument atmagnification of 3,000–20,000 ×magnification.
2.3. Data Analysis
Cluster analysis of microalgae data was performed using the statistical software Primer v6(Primer-E Ltd., Lutton, UK) [22–24]. Non-metric multidimensional scaling (MDS) was applied todetermine the relationships among microalgae and to explain their relationships in a two-dimensionalspace. The procedure for MDS was calculated with 25 restarts to arrive at a minimum stress value (0.01),as suggested by Field et al. [25] and Clarke [22]. We used canonical correspondence analysis (CCA)to relate assemblage structure to environmental factors and to explore their relationships by usingthe statistical software MVSP v3.1 (Kovach Computing Services, Wales, UK) [26]. We also employedforward selection and associated Monte Carlo permutation tests (999 unrestricted permutations, p <
0.01) to identify variables that better explain each gradient. The species–environmental factor biplotsshowed the species distribution with respect to the forward-investigated environmental variables.
3. Results
3.1. Temporal and Spatial Distribution of Microalgae
Overall, 121 microalgal taxa were identified in this study, representing five phyla, five classes,20 orders, 29 families, 45 genera, 116 species, and five formae. The main taxa in the study areawere diatoms, green algae (chlorophyta), unidentified flagellates, dinoflagellates, and cyanobacteria(Figure 2). During the survey period, the average species richness of diatoms, green algae, unidentifiedflagellates, dinoflagellates, and cyanobacteria was 58.20 ± 19.81, 28.59 ± 14.98, 4.12 ± 6.23, 1.11 ± 6.20,and 7.98 ± 13.53, respectively (Figure 3).
In this study, the abundance of microalgae ranged from 1.44 to 44.62 × 10⁵ cells/L at all sites, withan average of 8.38 ± 7.00 × 10⁵ cells/L (Figure 3). The site of highest abundance was St. 6 (average11.07 ± 7.69 × 10⁵ cells/L) and that of lowest abundance was St. 1 (average 5.65 ± 4.31 × 10⁵ cells/L).The month with the highest abundance was August, while November showed the lowest abundance.The average abundance of diatoms was higher in the Sangju Weir. Fragilaria crotonensis, Ulnaria acus,and Aulacoseira ambigua were the most frequent species of diatoms. Among green algae, the generaEudorina and Desmodesmus were the most dominant, while those in cyanobacteria were Anabaena andMicrocystis (Figure 4).

Sustainability 2020, 12, 6442 5 of 13
Sustainability 2020, 12, x FOR PEER REVIEW 5 of 14
highest diversity was observed in April (average 3.27 ± 0.11) and the lowest in August (average 2.56 ± 0.34).
Figure 2. Appearance of microalgae in the study area.
Figure 2. Appearance of microalgae in the study area.
Sustainability 2020, 12, x FOR PEER REVIEW 6 of 14
Figure 3. Species richness, abundance, and diversity of microalgae in the study area.
Figure 4. Frequency of microalgae during the survey period Micrographs of microalgae taken using light microscopy (a–c, f–i) and scanning electron microscopy (d and e). (a) Fragilaria crotonensis; (b, d) Ulnaria acus; (c, e) Aulacoseira ambigua; (f) Eudorina sp.; (g) Desmodesmus sp.; (h) Anabaena sp.; (i) Microcystis sp. Scale bars represent 20 μm (b,d,f), 10 μm (a, c, e, g, i), and 5 μm (h).
3.2. Diurnal Vertical Migration of Microalgae
A total of 78 microalgae taxa were identified in the diurnal migration study, representing five phyla, five classes, 18 orders, 26 families, and 38 genera. The main taxa in this study were diatoms, green algae, unidentified flagellates, dinoflagellates, and cyanobacteria (Figure 5).
During the survey period, the highest average species richness was that of diatoms (78.69 ± 18.03) and the lowest average species richness was that of dinoflagellates (0.28 ± 0.68) (Figure 6). In the surface and middle layers, the highest average species richness was that of diatoms.
The total abundance of microalgae across surveys ranged from 2.19 to 72.36 × 10⁵ cells/L, with an average of 19.81 ± 21.50 × 10⁵ cells/L (Figure 6). The average abundance was similar in the surface and middle layers, and the value of the bottom layer was the lowest. In the first survey, the range
Figure 3. Species richness, abundance, and diversity of microalgae in the study area.

Sustainability 2020, 12, 6442 6 of 13
Sustainability 2020, 12, x FOR PEER REVIEW 6 of 14
Figure 3. Species richness, abundance, and diversity of microalgae in the study area.
Figure 4. Frequency of microalgae during the survey period Micrographs of microalgae taken using light microscopy (a–c, f–i) and scanning electron microscopy (d and e). (a) Fragilaria crotonensis; (b, d) Ulnaria acus; (c, e) Aulacoseira ambigua; (f) Eudorina sp.; (g) Desmodesmus sp.; (h) Anabaena sp.; (i) Microcystis sp. Scale bars represent 20 μm (b,d,f), 10 μm (a, c, e, g, i), and 5 μm (h).
3.2. Diurnal Vertical Migration of Microalgae
A total of 78 microalgae taxa were identified in the diurnal migration study, representing five phyla, five classes, 18 orders, 26 families, and 38 genera. The main taxa in this study were diatoms, green algae, unidentified flagellates, dinoflagellates, and cyanobacteria (Figure 5).
During the survey period, the highest average species richness was that of diatoms (78.69 ± 18.03) and the lowest average species richness was that of dinoflagellates (0.28 ± 0.68) (Figure 6). In the surface and middle layers, the highest average species richness was that of diatoms.
The total abundance of microalgae across surveys ranged from 2.19 to 72.36 × 10⁵ cells/L, with an average of 19.81 ± 21.50 × 10⁵ cells/L (Figure 6). The average abundance was similar in the surface and middle layers, and the value of the bottom layer was the lowest. In the first survey, the range
Figure 4. Frequency of microalgae during the survey period Micrographs of microalgae taken usinglight microscopy (a–c,f–i) and scanning electron microscopy (d,e). (a) Fragilaria crotonensis; (b,d) Ulnariaacus; (c,e) Aulacoseira ambigua; (f) Eudorina sp.; (g) Desmodesmus sp.; (h) Anabaena sp.; (i) Microcystis sp.Scale bars represent 20 µm (b,d,f), 10 µm (a,c,e,g,i), and 5 µm (h).
The species diversity index of microalgae ranged from 1.93 to 3.37 (average 2.85 ± 0.26) across allthe sites (Figure 3). The highest species diversity was found at St. 1 (average 2.95 ± 0.19) (near theYeongpung Bridge) and was lower for St. 4 and 5 (near Gongdeok and Gyuncheon Stream). The highestdiversity was observed in April (average 3.27 ± 0.11) and the lowest in August (average 2.56 ± 0.34).
3.2. Diurnal Vertical Migration of Microalgae
A total of 78 microalgae taxa were identified in the diurnal migration study, representing fivephyla, five classes, 18 orders, 26 families, and 38 genera. The main taxa in this study were diatoms,green algae, unidentified flagellates, dinoflagellates, and cyanobacteria (Figure 5).
Sustainability 2020, 12, x FOR PEER REVIEW 7 of 14
was 7.65~72.36 × 10⁵ cells/L, and the average was 35.45 ± 20.81 × 10⁵ cells/L. There was almost no difference between the surface and middle layers, and the bottom layer was the lowest. In the second survey, the range was 2.19~6.71 × 10⁵ cells/L, and the average was 4.17 ± 1.15 × 10⁵ cells/L. There was little difference between the water layers.
The most dominant species in this study were Fragilaria crotonensis and Aulacoseira ambigua (Figure 4). Among green algae, Eudorina sp. and Desmodesmus sp. were dominant, and among cyanobacteria, Anabaena sp. and Microcystis sp. (Figure 4). The monitoring survey of these species exhibited no significant quantitative difference.
In this study, the species diversity index of microalgae across both surveys ranged from 2.03 to 3.37 at all sites, with an average of 2.64 ± 0.30. There was little difference between the water layers and the first and second surveys (Figure 6).
Figure 5. Vertical distribution of microalgae in the study area. Figure 5. Vertical distribution of microalgae in the study area.
During the survey period, the highest average species richness was that of diatoms (78.69 ± 18.03)and the lowest average species richness was that of dinoflagellates (0.28 ± 0.68) (Figure 6). In thesurface and middle layers, the highest average species richness was that of diatoms.

Sustainability 2020, 12, 6442 7 of 13Sustainability 2020, 12, x FOR PEER REVIEW 8 of 14
Figure 6. Species richness, abundance, and diversity in the vertical distribution of microalgae in the study area.
3.3. Abiotic Analysis
The physical and chemical factors affecting the microalgae were analyzed in the first and second surveys. WT ranged from 19.6 °C (bottom layer in the first survey) to 28.4 °C (surface layer in the first survey), with an average of 22.6 °C. DO was highest in the surface layer in all surveys. The CON was greater than 230 μs/cm3. pH ranged from 7.78 (bottom layer in the first survey) to 11.48 (surface layer in the first survey), with an average of 9.67, indicating that an alkaline environment was predominant in the study area. The TUR was higher in the bottom layer because of the upwelling of sediments and the inflow of organic particles from upstream. TOC, TP, and TN ranged from 0.87 to 6.06 mg/L, 4.46 to 72.1 mg/L, and 0.61 to 4.72 mg/L, respectively, with an average of 3.11 ± 0.93 mg/L, 30.55 ± 12.15 mg/L, and 1.94 ± 0.42 mg/L, respectively.
3.4. Statistical Analysis
The six study areas were divided into groups based on species composition and population (Figure 7). Groups of one stage of microalgae were observed in the divided group, mostly at St. 2. In addition, St. 4 (the site of the confluence of Gongduk Stream and the main river) was found to be different from other peaks at the time of the survey, and the factors affecting the distribution of microalgae in the residential area were influenced by the main stream and other tributaries. The CCA results for the two studies, shown in Figure 8, indicate that seven environmental factors were responsible for a significant proportion of variance in the five selected taxa. The ordination axes 1 and 2 were both statistically significant (p < 0.001) (Supplementary Table S3). Cyanobacteria were most influenced by pH and WT, whereas unidentified flagellates were affected by TN (Figure 8a). The diatoms and green algae, which were relatively higher in abundance than other taxa, were not
Figure 6. Species richness, abundance, and diversity in the vertical distribution of microalgae in thestudy area.
The total abundance of microalgae across surveys ranged from 2.19 to 72.36 × 10⁵ cells/L, with anaverage of 19.81 ± 21.50 × 10⁵ cells/L (Figure 6). The average abundance was similar in the surfaceand middle layers, and the value of the bottom layer was the lowest. In the first survey, the rangewas 7.65~72.36 × 10⁵ cells/L, and the average was 35.45 ± 20.81 × 10⁵ cells/L. There was almost nodifference between the surface and middle layers, and the bottom layer was the lowest. In the secondsurvey, the range was 2.19~6.71 × 10⁵ cells/L, and the average was 4.17 ± 1.15 × 10⁵ cells/L. There waslittle difference between the water layers.
The most dominant species in this study were Fragilaria crotonensis and Aulacoseira ambigua(Figure 4). Among green algae, Eudorina sp. and Desmodesmus sp. were dominant, and amongcyanobacteria, Anabaena sp. and Microcystis sp. (Figure 4). The monitoring survey of these speciesexhibited no significant quantitative difference.
In this study, the species diversity index of microalgae across both surveys ranged from 2.03 to3.37 at all sites, with an average of 2.64 ± 0.30. There was little difference between the water layers andthe first and second surveys (Figure 6).
3.3. Abiotic Analysis
The physical and chemical factors affecting the microalgae were analyzed in the first and secondsurveys. WT ranged from 19.6 ◦C (bottom layer in the first survey) to 28.4 ◦C (surface layer in the firstsurvey), with an average of 22.6 ◦C. DO was highest in the surface layer in all surveys. The CON wasgreater than 230 µs/cm3. pH ranged from 7.78 (bottom layer in the first survey) to 11.48 (surface layerin the first survey), with an average of 9.67, indicating that an alkaline environment was predominantin the study area. The TUR was higher in the bottom layer because of the upwelling of sediments and

Sustainability 2020, 12, 6442 8 of 13
the inflow of organic particles from upstream. TOC, TP, and TN ranged from 0.87 to 6.06 mg/L, 4.46 to72.1 mg/L, and 0.61 to 4.72 mg/L, respectively, with an average of 3.11 ± 0.93 mg/L, 30.55 ± 12.15 mg/L,and 1.94 ± 0.42 mg/L, respectively.
3.4. Statistical Analysis
The six study areas were divided into groups based on species composition and population(Figure 7). Groups of one stage of microalgae were observed in the divided group, mostly at St. 2.In addition, St. 4 (the site of the confluence of Gongduk Stream and the main river) was found tobe different from other peaks at the time of the survey, and the factors affecting the distribution ofmicroalgae in the residential area were influenced by the main stream and other tributaries. TheCCA results for the two studies, shown in Figure 8, indicate that seven environmental factors wereresponsible for a significant proportion of variance in the five selected taxa. The ordination axes 1and 2 were both statistically significant (p < 0.001) (Supplementary Table S3). Cyanobacteria weremost influenced by pH and WT, whereas unidentified flagellates were affected by TN (Figure 8a). Thediatoms and green algae, which were relatively higher in abundance than other taxa, were not affectedby these factors. On the other hand, dinoflagellates were not related to these factors because of theirlow abundance.
Sustainability 2020, 12, x FOR PEER REVIEW 9 of 14
affected by these factors. On the other hand, dinoflagellates were not related to these factors because of their low abundance.
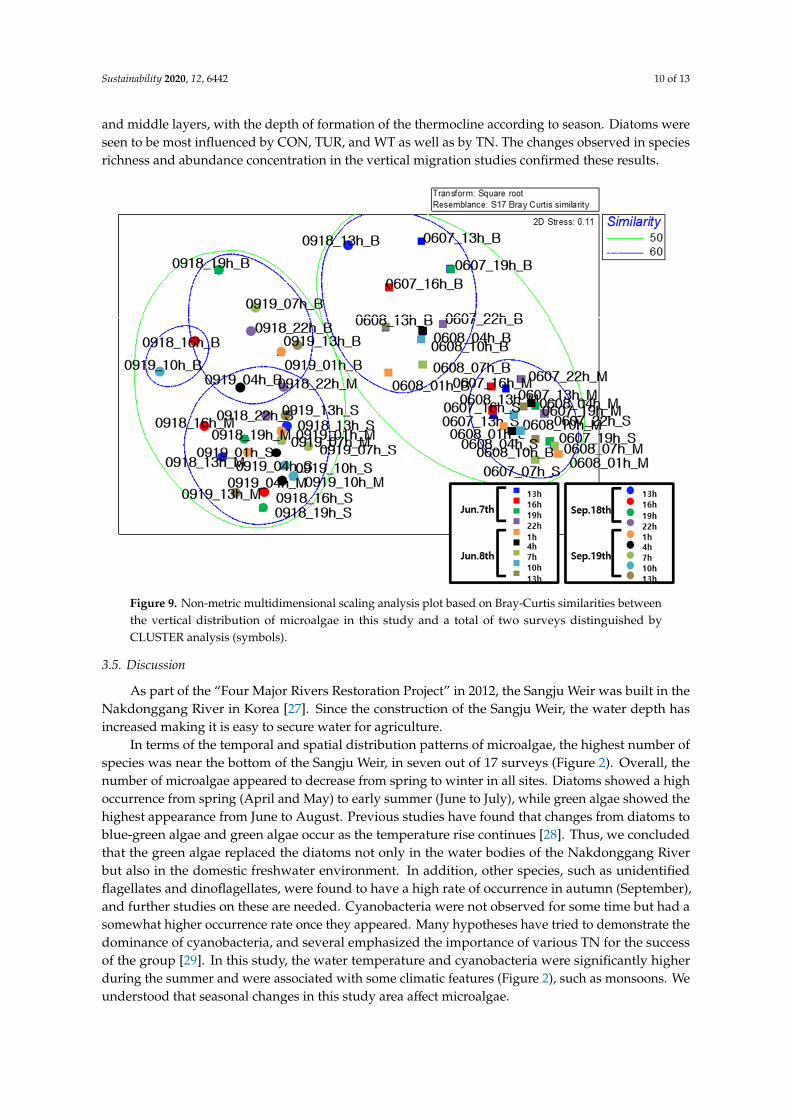
The similarities were divided into three groups at around the 60% level by the Bray–Curtis similarity index (Figure 9). The Bray–Curtis similarity index was calculated using the relative percentage of each class in each sample. There were differences in the species composition and biodiversity between the summer and autumn. In the summer, the surface and middle layers were grouped, while the bottom layer formed another group. Similarly, in the autumn survey, the surface and middle layers were grouped, while the bottom layer formed a different group. However, this tendency was found to be slightly lower in autumn than in summer. Based on these results, we could indirectly confirm the formation of a thermocline that interferes with the vertical movement of microalgae between the lower and middle layers, with the depth of formation of the thermocline according to season. Diatoms were seen to be most influenced by CON, TUR, and WT as well as by TN. The changes observed in species richness and abundance concentration in the vertical migration studies confirmed these results.
Figure 7. Non-metric multidimensional scaling analysis plot based on Bray-Curtis similarities between observed microalgae in this study and a total of 17 surveys distinguished by CLUSTER
Figure 7. Non-metric multidimensional scaling analysis plot based on Bray-Curtis similarities betweenobserved microalgae in this study and a total of 17 surveys distinguished by CLUSTER analysis(symbols).

Sustainability 2020, 12, 6442 9 of 13Sustainability 2020, 12, x FOR PEER REVIEW 10 of 14
analysis (symbols).
Figure 8. Distribution of the microalgae in an ordination diagram using the two first axes of the Canonical Correspondence Analysis for the study are (a) results of the ‘Temporal and spatial distribution patterns of microalgae’ survey; (b) results of the ‘Diurnal vertical migration of microalgae’ survey.
Figure 8. Distribution of the microalgae in an ordination diagram using the two first axes of theCanonical Correspondence Analysis for the study are (a) results of the ‘Temporal and spatial distributionpatterns of microalgae’ survey; (b) results of the ‘Diurnal vertical migration of microalgae’ survey.
The similarities were divided into three groups at around the 60% level by the Bray–Curtis similarityindex (Figure 9). The Bray–Curtis similarity index was calculated using the relative percentage of eachclass in each sample. There were differences in the species composition and biodiversity between thesummer and autumn. In the summer, the surface and middle layers were grouped, while the bottomlayer formed another group. Similarly, in the autumn survey, the surface and middle layers weregrouped, while the bottom layer formed a different group. However, this tendency was found to beslightly lower in autumn than in summer. Based on these results, we could indirectly confirm theformation of a thermocline that interferes with the vertical movement of microalgae between the lower
Sustainability 2020, 12, 6442 10 of 13
and middle layers, with the depth of formation of the thermocline according to season. Diatoms wereseen to be most influenced by CON, TUR, and WT as well as by TN. The changes observed in speciesrichness and abundance concentration in the vertical migration studies confirmed these results.Sustainability 2020, 12, x FOR PEER REVIEW 11 of 14
Figure 9. Non-metric multidimensional scaling analysis plot based on Bray-Curtis similarities between the vertical distribution of microalgae in this study and a total of two surveys distinguished by CLUSTER analysis (symbols).
4. Discussion
As part of the “Four Major Rivers Restoration Project” in 2012, the Sangju Weir was built in the Nakdonggang River in Korea [27]. Since the construction of the Sangju Weir, the water depth has increased making it is easy to secure water for agriculture.
In terms of the temporal and spatial distribution patterns of microalgae, the highest number of species was near the bottom of the Sangju Weir, in seven out of 17 surveys (Figure 2). Overall, the number of microalgae appeared to decrease from spring to winter in all sites. Diatoms showed a high occurrence from spring (April and May) to early summer (June to July), while green algae showed the highest appearance from June to August. Previous studies have found that changes from diatoms to blue-green algae and green algae occur as the temperature rise continues [28]. Thus, we concluded that the green algae replaced the diatoms not only in the water bodies of the Nakdonggang River but also in the domestic freshwater environment. In addition, other species, such as unidentified flagellates and dinoflagellates, were found to have a high rate of occurrence in autumn (September), and further studies on these are needed. Cyanobacteria were not observed for some time but had a somewhat higher occurrence rate once they appeared. Many hypotheses have tried to demonstrate the dominance of cyanobacteria, and several emphasized the importance of various TN for the success of the group [29]. In this study, the water temperature and cyanobacteria were significantly higher during the summer and were associated with some climatic features (Figure 2), such as monsoons. We understood that seasonal changes in this study area affect microalgae.
Among dominant diatom species, Fragilaria crotonensis is known to have a high abundance in rivers, lakes, and estuaries all over Korea [30]. Joh et al. [31] reported that they are more common in lakes than in rivers, and Kobayasi et al. [32] reported their distribution in alkaline, middle aqueous, and eutrophic lakes. In addition, Watanabe et al. [33] classified this species as alkaliphilous and
Figure 9. Non-metric multidimensional scaling analysis plot based on Bray-Curtis similarities betweenthe vertical distribution of microalgae in this study and a total of two surveys distinguished byCLUSTER analysis (symbols).
3.5. Discussion
As part of the “Four Major Rivers Restoration Project” in 2012, the Sangju Weir was built in theNakdonggang River in Korea [27]. Since the construction of the Sangju Weir, the water depth hasincreased making it is easy to secure water for agriculture.
In terms of the temporal and spatial distribution patterns of microalgae, the highest number ofspecies was near the bottom of the Sangju Weir, in seven out of 17 surveys (Figure 2). Overall, thenumber of microalgae appeared to decrease from spring to winter in all sites. Diatoms showed a highoccurrence from spring (April and May) to early summer (June to July), while green algae showed thehighest appearance from June to August. Previous studies have found that changes from diatoms toblue-green algae and green algae occur as the temperature rise continues [28]. Thus, we concludedthat the green algae replaced the diatoms not only in the water bodies of the Nakdonggang Riverbut also in the domestic freshwater environment. In addition, other species, such as unidentifiedflagellates and dinoflagellates, were found to have a high rate of occurrence in autumn (September),and further studies on these are needed. Cyanobacteria were not observed for some time but had asomewhat higher occurrence rate once they appeared. Many hypotheses have tried to demonstrate thedominance of cyanobacteria, and several emphasized the importance of various TN for the successof the group [29]. In this study, the water temperature and cyanobacteria were significantly higherduring the summer and were associated with some climatic features (Figure 2), such as monsoons. Weunderstood that seasonal changes in this study area affect microalgae.

Sustainability 2020, 12, 6442 11 of 13
Among dominant diatom species, Fragilaria crotonensis is known to have a high abundance inrivers, lakes, and estuaries all over Korea [30]. Joh et al. [31] reported that they are more common inlakes than in rivers, and Kobayasi et al. [32] reported their distribution in alkaline, middle aqueous,and eutrophic lakes. In addition, Watanabe et al. [33] classified this species as alkaliphilous andmesosaprobous or mesotraphentic. Aulacoseira ambigua is a floating species, frequently observed inKorea, in freshwater ecosystems [30,34]. In dominant green-algae species, the genera Eudorina andDesmodesmus are frequently observed in various domestic water bodies and in nutrient-rich lakes,reservoirs, paddy fields, and slow-flowing streams [35]. On the other hand, cyanobacteria Anabaenaand Microcystis are commonly found in freshwater ecosystems worldwide and cause major bloomingduring summer [36].
In the diurnal vertical migration of microalgae in the summer, the appearance of diatoms wasoverwhelmingly high, while that of other taxa was relatively negligible (Figure 6). However, theappearance of green and other algae was higher in the autumn when that of diatoms was relativelylower. In some cases, the appearance of cyanobacteria was approximately 10%, which was differentfrom the first survey. Cyanobacteria have a high flotation, high light adaptability, and high CO2
utilization and absorption [37], in this study, it is analyzed that the appearance of cyanobacteria ishigher than that of other microalgae in the diurnal vertical migration. In summer, the species richnessin all the layers decreased between 13:00 hours on one day and 01:00 hours on the following day andincreased again after that. Then, 24 h later, at 13:00 hours on the following day, the species richnesslevel was restored. In autumn, the high species richness of the surface layer decreased rapidly andthen increased again. On the other hand, there was a steady increase in species richness in boththe middle and bottom layers. Species diversity was similar between the surface and middle layersbut different in the lower. Based on these results, we could indirectly confirm the formation of athermocline that interferes with the vertical movement of microalgae (between the lower and middlelayers), and the depth of formation of the thermocline varies according to season. In Figure 8b, diatomsare seen to be most influenced by physical characteristics, such as CON, TUR, and WT as well as by thechemical factor TN. Since water temperature accelerates or delays the growth of microalgae, it affectsthe seasonal changes of the population and is an important factor in the structure of the ecosystem [2],apparently forms a thermocline layer in this area. The changes observed in species richness andabundance concentration in the vertical migration studies confirmed these results. Unidentifiedflagellates, green algae, and dinoflagellates were seen to be slightly affected by DO, TP, and pH. Thechange in pH is related to the change of the carbon source (e.g. H2CO3, HCO3
−, CO3−2), it affects
the amount and community of microalgae [2], and in this study, the pH in aquatic ecosystem wereaffected the microalgae. The concentration of essential nutrients such as TN and TP are not onlyfactors that determine the amount of microalgae, but the N/P ratio also affects abundance and speciescomposition [37,38]. Therefore, the vertical migration of microalgae in the aquatic ecosystem in theSangju Weir is considered to be somewhat difficult. The variation in pH was similar to that of watertemperature in the summer, while in the autumn, there was no clear pattern in the variation. Turbiditywas found to be high in the bottom layer in both seasons.
3.6. Conclusions
In this study, we aimed to understand the environmental factors affecting the temporal and spatialdistribution and composition of microalgae communities in the Sangju Weir. The following conclusionswere drawn:
(1) They are dominated by various microalgae, such as diatoms (e.g., Fragilaria crotonensis, Ulnariaacus, and Aulacoseira ambigua), green algae (e.g., genera Eudorina and Desmodesmus), cyanobacteria(e.g., genera Anabaena and Microcystis). Dinoflagellates and unidentified flagellates occasionallyobserved high abundance.
(2) The distribution of microalgae was hardly affected by the weir but showed variability withtemporal and spatial changes. The microalgal community structures in the main stream of

Sustainability 2020, 12, 6442 12 of 13
the river were different from that in the Nakdonggang River stream. Species composition anddiversity were very similar for all sites, except for the area around the Yeonggang River, wherethere was little impact from weir.
(3) The species composition and diversity in the bottom layer were different from those of the surfaceand middle layer. Vertical migration of the microalgae was somewhat difficult because of theformation of a thermocline and the high turbidity of the lower layer.
Supplementary Materials: The following are available online at http://www.mdpi.com/2071-1050/12/16/6442/s1,Table S1: List of environmental factors for the ‘Temporal and spatial distribution patterns of microalgae’ survey instudy area, Table S2: List of environmental factors for the ‘Diurnal vertical migration of microalgae’ survey instudy area. Table S3. Summary of CCA analysis based on the species environment factors in study area.
Author Contributions: Conceptualization, S.M.Y., S.D.L., and D.R.K.; methodology, S.M.Y., S.D.L., and P.Y.C.;software, S.M.Y. and D.R.K.; validation, S.D.L. and S.W.N.; formal analysis, S.M.Y., S.D.L., and D.R.K.; investigation,S.M.Y., S.W.N., C.H.C., J.-Y.K., and J.-S.L.; resources, S.M.Y., S.W.N., P.Y.C., J.-Y.K., and J.-S.L.; data curation,S.M.Y. and S.D.L.; writing—original draft preparation, S.M.Y., S.D.L., and C.H.C.; visualization, S.M.Y. and D.R.K.;supervision, S.M.Y.; project administration, S.M.Y. and P.Y.C. All authors have read and agreed to the publishedversion of the manuscript.
Funding: This study was supported by a research fund from NNIBR (NNIBR2018000011310, Study on thevariation of time and space distribution of microalgae in resident aquatic ecosystem-Vol. I; NNIBR201901106,Study of protist on the freshwater and brackish habitant-Vol. III and NNIBR202001103, Study of protist diversityfrom the freshwater-Vol. IV).
Acknowledgments: We thank Chung Hyun Choi from Kunsan National University and KOTITI Testing &Research Institute Inc. (Seongnam, Gyeonggi-do, Republic of Korea) for helping with analyses of the watersamples. We gratefully acknowledge the valuable comments from anonymous reviewers who helped improvethis manuscript.
Conflicts of Interest: The authors declare no conflict of interest.
References
1. Chung, J.; Kim, H.S.; Kim, Y.J. Structure of phytoplankton community in the Nakdong River estuary dam.Korean J. Limnol. 1994, 27, 33–46.
2. Shin, J.H.; Lee, K.S.; Park, C. Dynamics of phytoplankton community in the up-stream of Naktong River. J.Nat. Sci. 1998, 15, 409–421.
3. De Leaniz, C.G. Weir removal in salmonid streams: Implications, challenges and practicalities. Hydrobiologia2008, 609, 83–96. [CrossRef]
4. Churchman, C.W. Science and Decision Making. Philos. Sci. 1956, 23, 247–249. [CrossRef]5. Pielou, E.C. Freshwater; The University of Chicago Press: Chicago, IL, USA, 1998.6. Kondolf, G.M. PROFILE: Hungry Water: Effects of Dams and Gravel Mining on River Channels. Environ.
Manag. 1997, 21, 533–551. [CrossRef] [PubMed]7. Harper, D. What is eutrophication? In Eutrophication of Freshwaters; Springer Science and Business Media
LLC: London, UK, 1992; pp. 1–28.8. James, A. The value of biological indicators in relation to other parameters of water quality. In Biological
Indicators of Water Quality; James, A., Evison, L., Eds.; John Wiley and Sons: Chichester, UK, 1979; Chapter 1.9. Watanabe, T.; Tohei, M.; Kakutani, U. Epilithic diatoms which have tolerance of organic population and
adaptability. Res. Rep. Environ. Biol. 1982, B121–R12–10, 34–43.10. Watanabe, T.; Negoro, K.; Fukushima, H.; Kobayasi, H.; Asai, K.; Gotoh, T.; Kobayashi, T.; Mayama, S.;
Nagumo, T.; Holum, A. Studies of the quantitative water quality estimation on freshwater pollution usingdiatom communities as the biological indicators (1). Ann. Rep. Nissan Sci. Found. 1983, 10, 336–341.
11. Watanabe, T.; Negoro, K.; Fukushima, H.; Kobayasi, H.; Asai, K.; Gotoh, T.; Kobayashi, T.; Mayama, S.;Nagumo, T.; Holum, A. Studies of the quantitative water quality estimation on freshwater pollution usingdiatom communities as the biological indicators (2). Ann. Rep. Nissan Sci. Found. 1984, 11, 308–317.
12. Lee, O.M. The annual dynamics of standing crops and distribution of phytoplankton in Juam lake in 1992.Korean J. Limnol. 1994, 27, 327–337.
13. Chung, Y.H.; Shim, J.H.; Lee, M.J. A study on the microflora of the Han River I. The phytoplanktons and theeffect of the marine water in the lower course of the Han River. J. Plant Biol. 1965, 8, 47–65.

Sustainability 2020, 12, 6442 13 of 13
14. Cho, K.J. Spatial and temporal distribution of phytoplanktonic and periphytic diatom assemblages ofNaktong River estuary. Korean J. Phycol. 1991, 6, 47–53.
15. Cho, K.J.; Chung, I.K.; Lee, J.A. Seasonal dynamics of phytoplankton community in the Naktong Riverestuary. Korea. Korean J. Phycol. 1993, 8, 15–28.
16. Chung, Y.H.; Noh, K.H.; Lee, O.M. The flora and dynamics of phytoplankton in estuary of Naktong River.Bull. Korean Assoc. Conserv. Nat. 1987, 9, 5–30.
17. Kim, J.W.; Lee, H.Y. A study on phytoplankton communities in the reservoir of Naktong River estuary.Korean J. Limnol. 1991, 24, 143–151.
18. Kim, Y.J.; Lee, J.H. Comparison of phytoplankton communities of six dam lakes in the Naktong River system.Korean J. Limnol. 1996, 29, 347–362.
19. Moon, S.; Chung, J.; Choi, C. The structure of phytoplankton community in the middle-lower part of theNaktong River. J. Korean Environ. Sci. Soc. 2001, 10, 41–45.
20. Park, H.; Chung, C.M.; Bahk, J.; Hong, Y.K. The relationship between phytoplankton productivity and waterquality changes in downstream of Nakdong River. J. Korean Environ. Sci. Soc. USA 1999, 8, 101–106.
21. American Public Health Association (APHA). Standard Methods for the Examination of Water and Wastewater,19th ed.; American Public Health Association: Washington, DC, USA, 1995; pp. 1–733.
22. Clarke, K.R. Non-parametric multivariate analyses of changes in community structure. Austral Ecol. 1993, 18,117–143. [CrossRef]
23. Clarke, K.; Ainsworth, M. A method of linking multivariate community structure to environmental variables.Mar. Ecol. Prog. Ser. 1993, 92, 205–219. [CrossRef]
24. Clarke, K.R.; Warwick, R.M. Change in Marine Communities: An Approach to Statistical Analysis and Interpretation,2nd ed.; Primer-E Ltd.: Plymouth, UK, 2001.
25. Field, J.G.; Clarke, K.R.; Warwick, R.M. A practical strategy for analyzing multispecies distribution patterns.Mar. Ecol. Prog. Ser. 1982, 8, 37–52. [CrossRef]
26. Ter Braak, C.J.F.; Verdonschot, P.F.M. Canonical correspondence analysis and related multivariate methodsin aquatic ecology. Aquat. Sci. 1995, 57, 255–289. [CrossRef]
27. Kim, J.-H.; Yoon, J.-D.; Baek, S.-H.; Jang, M.-H. Estimation of optimal ecological flowrates for fish habitats ina nature-like fishway of a large river. J. Ecol. Environ. 2016, 39, 43–49. [CrossRef]
28. Patrick, R.; Crum, B.; Coles, J. Temperature and manganese as determining factors in the presence of diatomor blue-green algal floras in streams. Proc. Natl. Acad. Sci. USA 1969, 64, 472–478. [CrossRef]
29. Rückert, G.V.; Giani, A. Effect of nitrate and ammonium on the growth and protein concentration ofMicrocystis viridis Lemmermann (Cyanobacteria). Braz. J. Bot. 2004, 27, 325–331. [CrossRef]
30. Lee, J.H. Checklist of freshwater planktonic diatoms in Korea. J. Basic Sci. Sangmyung Univ. 1997, 10, 59–204.31. Joh, G.; Lee, J.H.; Lee, K.; Yoon, S.-K. Algal flora of Korea. In Chrysophyta: Bacillariophyceae: Pennales:
Araphidineae: Diatomaceae Freshwater Diatoms II; National Institute of Biological Resources Ministry ofEnvironment: Incheon, Korea, 2010; Number 2; Volume 3, pp. 1–53.
32. Kobayasi, H.; Idei, M.; Mayama, S.; Nagumo, T.; Osada, K. Kobayasi’s Atlas of Japanese Diatoms Based onElectron Microscopy; Uchida Rokakuho Publ. Co. Ltd.: Tokyo, Japan, 2006; Volume 1.
33. Watanabe, T.; Ohtsuka, T.; Tuji, A.; Houki, A. Picture Book and Ecology of the Freshwater Diatoms;Uchida-Rokakuho: Tokyo, Japan, 2005.
34. Mizuno, T. Illustrations of Freshwater Plankton of Japan; Hoikusha Publishing Co. Ltd.: Osaka, Japan, 1993.35. John, D.M.; Whitton, B.A.; Brook, A.J. The Freshwater Algal Flora of the British Isles: An Identification Guide to
Freshwater and Terrestrial Algae, 2nd ed.; Cambridge University Press: Cambridge, UK, 2011.36. Lee, J.H.; Kim, H.S.; Jung, S.W. Illustration of Phytoplankton in the Nakdong River; Nakdonggang National
Institute of Biological Resources (NNIBR): Sangju, Korea, 2017; pp. 1–461.37. Cho, K.-J.; Shin, J.-K. Growth and nutrient kinetics of some algal species isolated from the Naktong River.
Algae 1998, 13, 235–240.38. Kilham, P.; Hecky, R.E. Comparative ecology of marine and freshwater phytoplankton. Limnol. Oceanogr.
1988, 33, 776–795. [CrossRef]
© 2020 by the authors. Licensee MDPI, Basel, Switzerland. This article is an open accessarticle distributed under the terms and conditions of the Creative Commons Attribution(CC BY) license (http://creativecommons.org/licenses/by/4.0/).