Probabilistic seismic hazard assessment of Switzerland: best estimates and uncertainties
Upload
khangminh22Category
view
0download
0
Spatial-temporal variability of seismic hazardin peninsular India
Kishor Jaiswal1,∗ and Ravi Sinha1,∗∗
1Department of Civil Engineering, Indian Institute of Technology Bombay, Powai, Mumbai 400 076, India.∗e-mail: [email protected]∗∗e-mail: [email protected]
This paper examines the variability of seismic activity observed in the case of different geologicalzones of peninsular India (10◦N–26◦N; 68◦E–90◦E) based on earthquake catalog between the period1842 and 2002 and estimates earthquake hazard for the region. With compilation of earthquakecatalog in terms of moment magnitude and establishing broad completeness criteria, we derivethe seismicity parameters for each geologic zone of peninsular India using maximum likelihoodprocedure. The estimated parameters provide the basis for understanding the historical seismicityassociated with different geological zones of peninsular India and also provide important inputs forfuture seismic hazard estimation studies in the region. Based on present investigation, it is clearthat earthquake recurrence activity in various geologic zones of peninsular India is distinct andvaries considerably between its cratonic and rifting zones. The study identifies the likely hazardsdue to the possibility of moderate to large earthquakes in peninsular India and also presents theinfluence of spatial rate variation in the seismic activity of this region. This paper presents theinfluence of source zone characterization and recurrence rate variation pattern on the maximumearthquake magnitude estimation. The results presented in the paper provide a useful basis forprobabilistic seismic hazard studies and microzonation studies in peninsular India.
1. Introduction
India has experienced several devastating earth-quakes in the past few centuries that have resultedin severe destruction in terms of loss of lives andproperty. Minimization of the devastating effectsof earthquakes in India certainly requires betterunderstanding of the seismic hazards in differentparts of the country and adopting better earth-quake preparedness measures. Earthquake activityin India is attributed mainly to two distincttectonic environments namely seismically activeHimalayan frontal arc which covers most of north-ern parts of the country and intraplate seismicactivity within the Indian shield which accommo-dates central and southern India. The Himalayanseismicity has caused several damaging earth-quakes in the last few centuries (such as Shillong
1897; Kangra 1905; Nepal 1934; Assam 1950;Uttarkashi 1991; Chamoli 1999 and Kashmir 2005)and intraplate seismicity within the continentalshield mass of India has caused intermittent het-erogeneous seismic activity (Koyna 1967; Latur1993; Jabalpur 1997; Bhuj 2001). The intra-plateseismic activity in peninsular India (10◦N–26◦N;68◦E–90◦E) arises largely out of the sudden releaseof strain energy that has been accumulated overa long time due to the north and northeastwardmovement of the Indian plate. Most of the his-torical earthquakes in peninsular India have beenconcentrated near the weak rifting zones (Rann ofKuchchh, Narmada lineament) or in the passivecontinental margins (both eastern and western)whereas the cratonic zones (northern and eastern)and inactive grabens are generally free from largeearthquake activity and thus form stable shields of
Keywords. Seismicity; seismic hazard; maximum likelihood procedure; seismotectonics; stable continental regions.
J. Earth Syst. Sci. 117, S2, November 2008, pp. 707–718© Printed in India. 707
708 Kishor Jaiswal and Ravi Sinha
the Indian plate. The seismic hazard estimation inpeninsular India for different levels of exceedancehence requires understanding of the variabilityin seismogenic characteristics of different sourcezones.
The seismic hazard has been quantified for mostof the active tectonic environments of the worldwhereas for regions of low to moderate seismicitysuch as the Stable Continental Regions (SCRs),it still remains an important task to accuratelyestimate the likelihood of future seismic acti-vity for predefined exceedance levels. The seismichazard estimation procedure has been broadly cat-egorized into two broad categories namely deduc-tive and historic (McGuire 1993). Cornell (1968)pioneered the theoretical basis of the deductivemethod which is primarily based on deducing thecausative sources (zones), seismicity and earth-quake ground motion characteristics in the region.Historic methods rely completely on past earth-quake catalog data and do not require specificationof seismogenic zones. For each historic earthquakeof certain magnitude, distance and assumed groundmotion prediction equation, the empirical distri-bution of the required seismic hazard parameteris computed (Veneziano et al 1984). By normali-zing the empirical distribution for the duration ofearthquake catalog, an annual rate of exceedanceof ground motion parameter is estimated. How-ever, historic procedures generally work only inactive tectonic regions which are characterized byfrequent earthquakes and where the record of pastseismicity is reasonably complete (Boschi et al1996).
The deductive methods have several advantagesin terms of its applicability in variable seismotec-tonic regions and its ability to account for aleatoryand epistemic uncertainties mainly because theprocedure is parametric in nature. It requires accu-rate identification and characterization of differ-ent earthquake sources that can result in damagingearthquakes. Earthquake sources may be identifiedon the basis of geologic (paleoseismic), tectonic,historical, and instrumental evidence. Better esti-mation of seismic hazards of peninsular India espe-cially due to large damaging earthquakes whichtend to have higher return periods require the useof more accurate assessment of Mmax and its recur-rence for each seismogenic zone. The assumptionof single Mmax and single b-value for the entirepeninsular India as used in previous PSHA stud-ies (Khatri et al 1984; Bhatia et al 1999) providesonly a macroscopic picture of seismic hazard asso-ciated with the entire region without incorporatingspatial variability of earthquake recurrence.
Estimation of maximum magnitude potential foreach seismotectonic zone of peninsular India isuseful for future regional PSHA studies, seismic
microzonation studies and also for application inbuilding codes. Most of the building codes used forearthquake resistant design generally specify Maxi-mum Considered Earthquake (MCE) and DesignBasis Earthquake (DBE) to help to estimate poten-tial design forces. Similarly design of large engi-neering facilities such as dams and nuclear powerplants require accurate estimation of maximummagnitude earthquake potential in a region.
The main focus of this article is to under-stand the spatial variability of seismic activity inpeninsular India and to estimate seismic zone-specific parameters which can be used for futurePSHA studies. It is worth noting that currently,there is no established or generally acceptedmethod available for the estimation of Mmax espe-cially for SCRs such as peninsular India. Themost commonly used deterministic procedure con-sists of using knowledge of various tectonic andfault specific parameters and combining it withhistorical earthquake data associated with eachseismogenic feature to empirically estimate themaximum earthquake potential. Such an approachmay not be always applicable to SCRs due tolimited knowledge regional faults, its activity andaccurate delineation. Secondly, empirical magni-tude fault-length relationships for SCR regionsare not well-established and can contribute signifi-cantly to the uncertainty of PSHA results.
One of the well-known approaches proposed byKijko and Sellevoll (1989) is parametric and itallows application of historical earthquake informa-tion (that can be both extreme and complete partsof the region’s earthquake catalog) to statisticallypredict region specific maximum magnitude andearthquake recurrence characteristics. The presentinvestigation makes use of Kijko’s approach (Kijkoand Sellevoll 1989; Kijko 2004) to incorporate theuncertainties associated with catalog informationdue to its incompleteness while estimating the seis-micity parameters and finally estimate the seismichazard for each identified seismotectonic zones ofpeninsular India. Similar approach has been usedin earlier studies by Sharma et al (2003) for haz-ard estimation for Delhi and surrounding regionand by Shankar and Sharma (1998) for the entireHimalayan belt. Due to the paucity of data andrelatively shorter catalog history, we utilize bothextreme and complete parts of the catalog to esti-mate seismicity parameters of nine source zones ofpeninsular India.
The application of Gutenberg–Richter (GR)relationship derived from earthquake catalog datahelps in determining the earthquake recurrencecharacteristics and this approach is similar toflood and wind hazard analyses in civil engineering(Wang and Ormsbee 2005) and is appropriate forseismic hazard assessment (Wang 2006, 2007). In
Seismic hazard in peninsular India 709
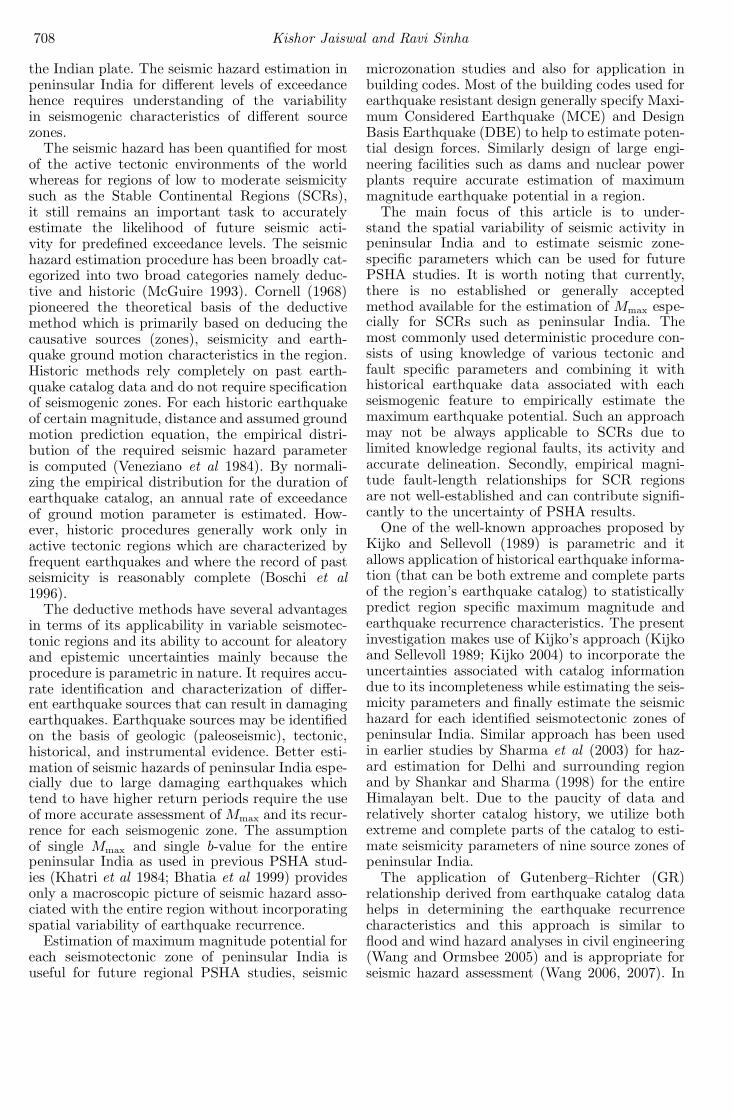
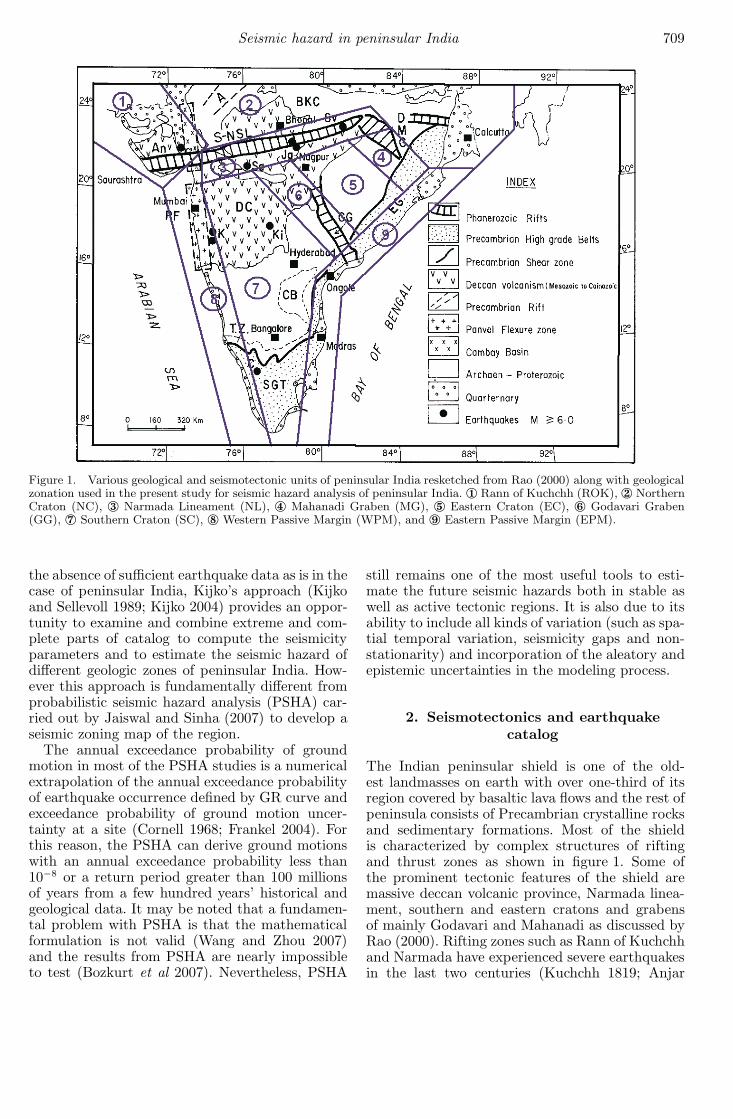
Figure 1. Various geological and seismotectonic units of peninsular India resketched from Rao (2000) along with geologicalzonation used in the present study for seismic hazard analysis of peninsular India. ① Rann of Kuchchh (ROK), ② NorthernCraton (NC), ③ Narmada Lineament (NL), ④ Mahanadi Graben (MG), ⑤ Eastern Craton (EC), ⑥ Godavari Graben(GG), ⑦ Southern Craton (SC), ⑧ Western Passive Margin (WPM), and ⑨ Eastern Passive Margin (EPM).
the absence of sufficient earthquake data as is in thecase of peninsular India, Kijko’s approach (Kijkoand Sellevoll 1989; Kijko 2004) provides an oppor-tunity to examine and combine extreme and com-plete parts of catalog to compute the seismicityparameters and to estimate the seismic hazard ofdifferent geologic zones of peninsular India. How-ever this approach is fundamentally different fromprobabilistic seismic hazard analysis (PSHA) car-ried out by Jaiswal and Sinha (2007) to develop aseismic zoning map of the region.
The annual exceedance probability of groundmotion in most of the PSHA studies is a numericalextrapolation of the annual exceedance probabilityof earthquake occurrence defined by GR curve andexceedance probability of ground motion uncer-tainty at a site (Cornell 1968; Frankel 2004). Forthis reason, the PSHA can derive ground motionswith an annual exceedance probability less than10−8 or a return period greater than 100 millionsof years from a few hundred years’ historical andgeological data. It may be noted that a fundamen-tal problem with PSHA is that the mathematicalformulation is not valid (Wang and Zhou 2007)and the results from PSHA are nearly impossibleto test (Bozkurt et al 2007). Nevertheless, PSHA
still remains one of the most useful tools to esti-mate the future seismic hazards both in stable aswell as active tectonic regions. It is also due to itsability to include all kinds of variation (such as spa-tial temporal variation, seismicity gaps and non-stationarity) and incorporation of the aleatory andepistemic uncertainties in the modeling process.
2. Seismotectonics and earthquakecatalog
The Indian peninsular shield is one of the old-est landmasses on earth with over one-third of itsregion covered by basaltic lava flows and the rest ofpeninsula consists of Precambrian crystalline rocksand sedimentary formations. Most of the shieldis characterized by complex structures of riftingand thrust zones as shown in figure 1. Some ofthe prominent tectonic features of the shield aremassive deccan volcanic province, Narmada linea-ment, southern and eastern cratons and grabensof mainly Godavari and Mahanadi as discussed byRao (2000). Rifting zones such as Rann of Kuchchhand Narmada have experienced severe earthquakesin the last two centuries (Kuchchh 1819; Anjar

710 Kishor Jaiswal and Ravi Sinha
1958; Jabalpur 1997; Bhuj 2001); however most ofsouthern peninsular shield have experienced dif-fused seismic activity except regions of so calledtriggered or induced seismicity on the WesternGhats. Chandra (1977) described the broad tec-tonic regions of Indian shield in detail and Khatriet al (1984) took it forward to propose broad geo-logic zones in the region to be used for probabilis-tic seismic hazard analysis. Bhatia et al (1999) inthe Global Seismic Hazard Assessment Program(GSHAP) study confined the earthquake zona-tion scheme in Indian shield to only small andlimited pockets of the shield delineated based oneither locations of past earthquake epicenters andprominent seismotectonics.
Seeber et al (1999) studied the seismic hazardassessment of Maharashtra for developing prob-abilistic seismic hazard map to be used by theGovernment of Maharashtra. In this unpublishedreport, the authors proposed nine broad seismiczones based on geology, key tectonic features andobserved seismic activity. Seismic zone character-ization proposed by Seeber et al (1999) were pri-marily based on various evolutionary geologic andseismotectonic units identified by researchers inthe past (Valdiya 1973; Naqvi et al 1974; Chandra1977; Rao and Rao 1984) and classifying thembroadly into cratonic and paleorifting zones. Cra-tons are primarily a stable interior of peninsu-lar shield namely northern, eastern and southerncratons and paleorifting zones (a region contain-ing large faults and has experienced extensionaldeformations in their most active phase) whichare Narmada, Cambay and Mahanadi grabens andpassive continental margins as shown in figure 1.More details about classification, zonation bound-ary and spatial extent have been discussed inJaiswal (2006). Table 1 provides a concise summaryof the geologic and seismotectonic characteristicsof Indian shield along with significant earthquakesin each region.
A working catalog has been prepared based onthe available information of the earthquake datafrom various sources. It includes the published cat-alog (Mw ≥ 3.0) after equivalent moment magni-tude conversion up to 1997 from Rao and Rao(1984) and Seeber et al (1999). The PreliminaryDetermination of Epicenters (PDE) bulletin of theUS Geological Survey’s National Earthquake Infor-mation Center (NEIC) has been used to includemost recent events up to May 2003 (NEIC 2003)within the study area. The events are in termsof body wave magnitude and hence converted toequivalent moment magnitude using the relationproposed by Johnston (1996). Details of the earth-quake catalog development process which includesmagnitude conversion criteria, removal of duplicateevents and application of declustering algorithm
for removing foreshock and aftershocks can befound at Jaiswal (2006), and final catalog datacan be easily downloaded from EarthquakeInfo.orgwebsite (Jaiswal and Sinha 2005).
3. Spatial-temporal variabilityin seismicity
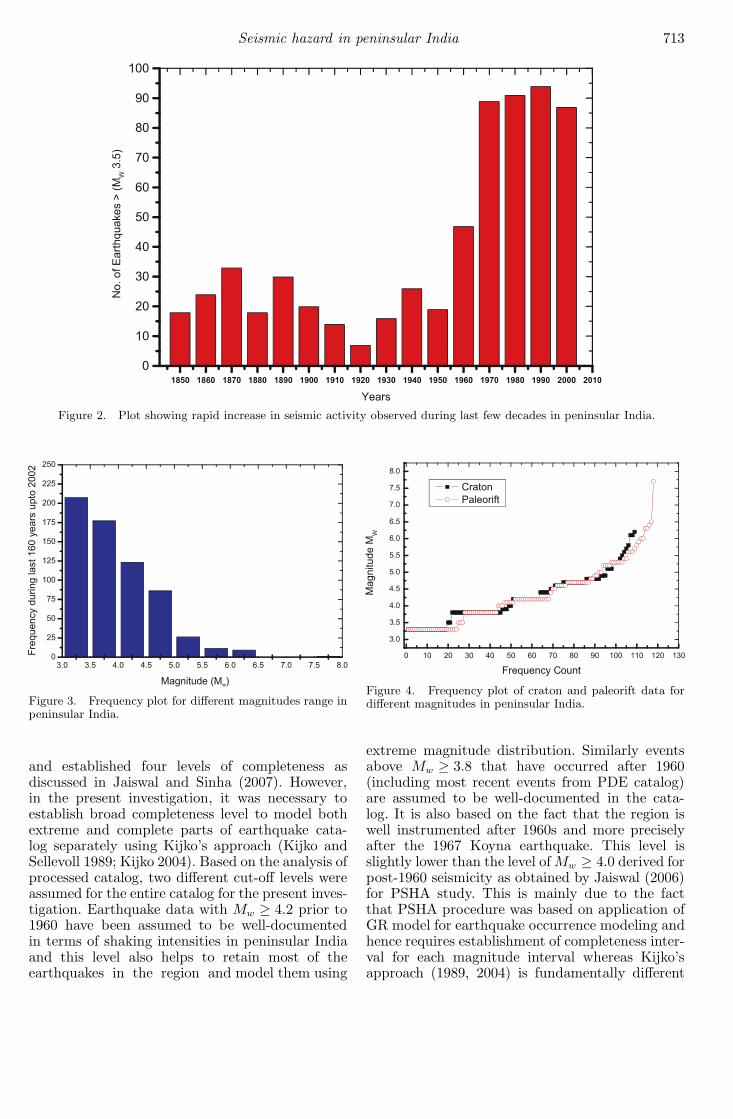
This section focuses on evaluating the spatial-temporal variability of seismic activity observed forpeninsular India based on past earthquake cata-log. Estimation of the seismicity parameters usingthe past earthquake catalog data without model-ing such variability may lead to erroneous results.The recent increase in seismic activity for penin-sular India has been discussed in detail by Seeberet al (1999). It indicates the association of a largenumber of earthquakes in the marginal areas alongwith a few regional conglomeration or hotspotsnear some of the reservoirs. Figure 2 shows a plotof decadal variation of seismic activity in penin-sular India clearly indicating the rapid increasein the activity since 1960s. One of the reasonsof rapid increase is due to remarkable increase inseismic activity of Koyna belt after being con-stant for more than one century. This increase israpid and drastic in the 1960s which is commonlytermed as triggered seismicity and is described indetail in earlier studies (Gupta and Rastogi 1976;Gupta 1992).
It is important to study such increase in terms ofdifferent magnitude ranges to understand the pos-sible rate variation in terms of seismic activity inthe region. For this, earthquakes in different mag-nitude ranges are shown in figure 3 which indicatesthat a large number of earthquakes during recenttimes are in the magnitude range of 3.0 to 4.5.It is obvious due to increase in the capability ofdetecting such low to moderate earthquakes pre-cisely through better instrumentation in the shieldregion. Since a very small portion of data in thismagnitude range is available for period prior to1960s, it is likely that several low to moderateearthquake events may be missing due to sparseinstrumentation in the region.
Figure 4 shows the frequency of earthquakesof different magnitude ranges in different cratonicand rifting zones of peninsular India. Though forlow to moderate magnitude ranges, the observedfrequency of earthquakes in both the zones is simi-lar; the variation is quite high for larger size earth-quakes. The sudden rise in terms of frequencyin high magnitude ranges is a peculiar charac-teristic of these rifting zones which have experi-enced some of the largest earthquakes with shortrecurrence duration. Rajendran (2000) obtainedsimilar results based on the classification of recent

Seismic hazard in peninsular India 711
Table
1.
Sei
smog
enic
zones
ofpe
nin
sula
rIn
dia
and
thei
rass
ocia
ted
chara
cter
istics
.
Nam
eofth
eso
urc
ezo
ne
Geo
gra
phic
allo
cati
on
boundary
Sei
smote
ctonic
sand
geo
logic
al
sett
ings
from
Chandra
(1977);
Khatr
iet
al
(1984)
Pre
vio
us
signifi
cant
eart
hquakes
(Mw)
1.R
ann
ofK
uch
chh
(RO
K)
22.0
,68.0
;26.0
,68.0
;26.0
69.9
;22.4
,73.6
;20.0
,71.0
.W
est-
nort
hw
est
seis
mic
ally
act
ive
strikin
gfa
ult
sand
ass
oci
ate
dblo
ckfa
ult
ing.South
-er
nase
ism
icG
irnar
consi
sts
ofex
tensi
on
of
Narm
ada
fault
.
June
16,1819
(7.7
);July
21,1956
(6.5
);January
26,2001
(7.6
)
2.N
ort
her
nC
rato
n(N
C)
30.0
,68.0
;30.0
,70.0
;30.0
,73.6
;33.0
,75.0
;28.5
,80.0
;27.0
,85.0
;26.0
,89.9
;26.0
,90.0
;22.0
,90.0
;21.0
,88.8
5;
21.0
,86.3
;23.9
5,
82.4
;22.2
,73.8
;22.4
,73.6
;26.0
,70.0
;26.0
,68.0
.
Nort
h-e
ast
tren
din
gzo
ne
of
Sin
ghbhoom
mer
ges
with
Him
aly
an
and
Burm
ese
moun-
tain
ranges
inth
enort
hea
st.
Eart
hquake
act
ivity
inth
eea
ster
nport
ion
isco
rrel
ate
dw
ith
nort
her
nm
arg
inof
Sausa
rse
ries
.In
wes
tern
part
,A
rava
lli
ranges
tren
din
gnort
hea
stdir
ecti
on.
Dec
ember
15,
1882
(6.1
);M
ay20,
1935
(6.0
);June
12,1989
(5.8
)
3.N
ara
mada
linea
men
t(N
L)
20.4
,73.2
;22.0
5,
73.2
;23.9
5,
82.4
;22.7
5,
84.0
5.
The
800
km
stra
ight
cours
eof
Narm
ada
river
may
be
due
toth
efa
ult
whic
hjo
ins
wit
hSon
fault
toth
eea
st.
Itis
apro
mi-
nen
tte
ctonic
featu
reof
the
India
nsh
ield
tren
din
gE
NE
-WSW
dir
ecti
on.
Marc
h31,
1852
(6.0
);N
ovem
ber
18,
1863
(5.2
);June
2,
1927
(6.4
);M
arc
h14,
1938
(6.3
);M
ay22,1997
(6.0
)
4.M
ahanadiG
raben
(MG
)22.1
5,
81.5
;22.7
5,
84.0
5;
21.0
,86.3
;19.8
,84.8
.P
rese
nce
of
seis
mic
ally
act
ive
tect
onic
gra
ben
tren
din
gin
NW
-SE
direc
tion.
May
8,1963
(5.1
);June
12,2001
(4.8
)
5.E
ast
ern
Cra
ton
(EC
)21.5
,78.1
;22.1
5,
81.5
;19.8
,84.8
;17.7
,82.0
.N
osp
ecifi
cknow
nse
ism
ote
ctonic
stru
cture
has
bee
nid
enti
fied
inth
isre
gio
nand
can
be
term
edas
one
of
the
most
stable
cra-
tonic
zone.
No
signifi
cant
eart
hquake
inth
eex
trem
eand
com
ple
tepart
ofca
talo
gabov
ecu
t-off
thre
shold
use
din
the
study.
6.G
odav
ari
Gra
ben
(GG
)21.5
,78.1
;21.0
,76.0
5;
16.5
,80.3
;17.7
,82.0
.Long
and
narr
owgra
ben
tren
din
gin
nort
h-
wes
tdir
ecti
on.
Tre
nd
innort
hea
stdir
ec-
tion
indic
ate
sco
nju
gate
set
offa
ult
str
ans-
ver
seto
the
gra
ben
.
Nov
ember
22,
1872
(4.7
);A
pril
13,
1969
(5.8
)
7.South
ern
Cra
ton
(SC
)21.0
,76.0
5;
20.4
,73.2
;16.0
,74.1
;10.0
,76.8
;10.0
,79.0
;16.0
,79.5
;16.5
,80.3
.T
he
south
ern
port
ion
of
the
zone
consist
sof
blo
ckfa
ult
edm
ounta
ins
such
as
Nilgiri
and
Annam
ala
iand
gra
ben
stru
cture
.N
oknow
nsu
rface
geo
logic
alst
ruct
ure
isass
o-
ciate
dw
ith
the
obse
rved
seis
mic
act
ivity
inth
ere
gio
n.
Feb
ruary
28,1882
(5.6
);Feb
ruary
7,1900
(5.7
);Sep
tem
ber
29,1993
(6.2
);Sep
tem
ber
5,2000
(5.4
)

712 Kishor Jaiswal and Ravi SinhaTable
1.
(Continued
)
Nam
eofth
eso
urc
ezo
ne
Geo
gra
phic
allo
cati
on
boundary
Sei
smote
ctonic
sand
geo
logic
al
sett
ings
from
Chandra
(1977);
Khatr
iet
al
(1984)
Pre
vio
us
signifi
cant
eart
hquakes
(Mw)
8.
Wes
tern
Pass
ive
Marg
in(W
PC
)10.0
,74.0
;20.0
,71.0
;22.0
5,
73.2
;20.4
,73.2
;16.0
,74.1
;10.0
,76.8
.A
larg
ever
tica
lfa
ult
of
nort
h-n
ort
hw
est
stri
ke
expose
din
the
mid
dle
part
of
the
Wes
tern
Ghats
inB
elgaum
,Ven
gurl
are
gio
n.
How
ever
,ea
rthquake
act
ivity
of
Koy
na
sugges
tsact
ivity
of
fault
wit
hnort
h-n
ort
hea
stst
rike.
Pre
sence
of
majo
rte
ctonic
featu
reca
lled
Panvel
flex
ure
par-
allel
toth
ew
estco
ast
and
runsin
nort
her
lydir
ecti
on.
Dec
ember
10,1967
(6.3
);June
4,1965
(5.4
)
9.
East
ern
Pass
ive
Marg
in(E
PC
)21.0
,86.3
;16.0
,79.5
;10.0
,79.0
;10.0
,81.0
;15.0
,81.0
;21.0
,88.8
5.
Nort
hea
sttr
endin
gzo
ne
from
Kakin
ada
toM
idnapore
inth
eea
ster
nco
ast
of
India
.T
he
south
centr
alport
ion
ofO
ngole
tren
ds
inth
enort
hea
stdir
ecti
on.
The
south
ern
east
marg
inco
nsi
sts
of
Tam
ilN
adu
wit
hnort
h-e
ast
erly
alignm
ent
inth
eare
aso
uth
ofM
adra
s.
July
3,
1867
(5.6
);A
pril
17,
1917
(5.3
);O
ctober
12,
1959
(5.2
);January
14,
1980
(5.9
);Sep
tem
ber
25,2001
(5.5
)
damaging earthquakes in terms of tectonic envi-ronment, recurrence period, maximum magnitudeand style of deformation.
The regional earthquake recurrence activity iscommonly expressed in terms of the Gutenberg–Richter magnitude frequency relationship(Gutenberg and Richter 1944) represented bythe following exponential magnitude distributionfunction:
Log10N (≥ M per year) = a − bM, (1)
where N is the number of events per year with mag-nitude greater than or equal to M . The a-value israte per unit area per year of M earthquakes andthe b-value is the slope of log-linear fit that repre-sents the relative likelihood of larger and smallerearthquakes. To evaluate the effect of increase inseismicity, the pre- and post-1960 earthquake cat-alog data are shown in figure 5. It can be seen thatthe increase in seismicity after 1960 is also in termsof increase in recurrence rate of moderate earth-quakes giving higher b-value of 0.90 compared with0.77 as observed for pre-1960 data. According toSeeber et al (1999), this increase is not due to sta-tistical fluctuation or due to catalog incomplete-ness. There is considerable increase in the observedseismic activity especially within certain pocketsof peninsular India namely in passive continentalmargins (mainly in Koyna–Warna region) and inrifting zones (Narmada and Kuchchh region). How-ever, the increase cannot be attributed to reservoir-induced seismicity alone. It should also be notedthat most of the earthquakes (between magnitude4 and 5) near Koyna region have been identifiedonly after relatively better instrumentation in thearea which took place in late 1960s whereas mostsuch earlier earthquakes in the rest of peninsu-lar India may have remained unrecorded in thetime span of catalog data (Mohan et al 1981).In addition, the spatial variation in seismicityneeds to be studied with respect to each geologicalsource zone for accurate estimation of seismicityparameters.
4. Uncertainty modeling using extremeand complete data
4.1 Earthquake database completeness
Rao and Rao (1984) estimated b-value of 0.85using single threshold of magnitude level of 4.5for the entire catalog data of peninsular Indiaduring 1840–1980. Jaiswal (2006) studied theearthquake catalog developed in terms of momentmagnitude using Stepp’s procedures (Stepp 1973)
Seismic hazard in peninsular India 713
Figure 2. Plot showing rapid increase in seismic activity observed during last few decades in peninsular India.
Figure 3. Frequency plot for different magnitudes range inpeninsular India.
and established four levels of completeness asdiscussed in Jaiswal and Sinha (2007). However,in the present investigation, it was necessary toestablish broad completeness level to model bothextreme and complete parts of earthquake cata-log separately using Kijko’s approach (Kijko andSellevoll 1989; Kijko 2004). Based on the analysis ofprocessed catalog, two different cut-off levels wereassumed for the entire catalog for the present inves-tigation. Earthquake data with Mw ≥ 4.2 prior to1960 have been assumed to be well-documentedin terms of shaking intensities in peninsular Indiaand this level also helps to retain most of theearthquakes in the region and model them using
Figure 4. Frequency plot of craton and paleorift data fordifferent magnitudes in peninsular India.
extreme magnitude distribution. Similarly eventsabove Mw ≥ 3.8 that have occurred after 1960(including most recent events from PDE catalog)are assumed to be well-documented in the cata-log. It is also based on the fact that the region iswell instrumented after 1960s and more preciselyafter the 1967 Koyna earthquake. This level isslightly lower than the level of Mw ≥ 4.0 derived forpost-1960 seismicity as obtained by Jaiswal (2006)for PSHA study. This is mainly due to the factthat PSHA procedure was based on application ofGR model for earthquake occurrence modeling andhence requires establishment of completeness inter-val for each magnitude interval whereas Kijko’sapproach (1989, 2004) is fundamentally different

714 Kishor Jaiswal and Ravi Sinha
Figure 5. Completeness plot for different magnitude rangesbased on earthquake catalog for pre-1960 and for post-1960of peninsular India.
and it allows incorporation of significant eventsprior to 1960 using extreme value distributionalong with the standard estimation error in itsestimation.
4.2 Seismicity parameter estimation
To estimate the maximum earthquake magnitudefor different seismogenic zones of peninsular India,the well-known approach proposed by Kijko andSellevoll (1989, 1992) has been used. It is based onmodified Gutenberg–Richter relation after intro-ducing the lower and upper truncation in termsof minimum and maximum bound of earthquakeoccurrence as:
FM (m)
=
⎧⎪⎪⎪⎨
⎪⎪⎪⎩
0, for m < mmin
1−exp[−β(m−mmin)]
1−exp[−β(mobsmax−mmin)]
for mmin≤m≤mmax
1 for m > mmax
,
(2)
where β = b ln(10), and b is the Gutenberg–Richterparameter indicating the seismicity rate. Kijkoet al (2001) and Kijko (2004) have providedtwo separate estimates of Mmax using Cramer’sapproximation and non-parametric Gaussian esti-mation. Page (1968) presented the maximum like-lihood procedure for estimation of parameter β.This approach is very useful for regions withlimited data such as stable shield regions andhas been widely used by researchers in thepast (Shankar and Sharma 1998; Sharma et al
2003; Kijko 2004; Raghukanth and Iyengar 2006).The earthquake magnitudes compiled in earth-quake catalogs are never accurately estimated andthe error in its estimation becomes even largerfrom complete (instrumentally recorded data) toextreme part of earthquake catalog (which arederived from shaking intensities). The standarderror of 0.2 magnitude units has been consideredfor complete parts of catalog and 0.5 units forextreme parts of earthquake catalog. We haveapplied both the estimators to statistically evalu-ate maximum possible magnitude that can occurin each of the nine zones of the peninsular Indiaregion. Table 2 shows estimated values of seismicityparameters for each geological zonation.
4.3 Comparative analysis and significance
It is interesting to note that the b-value and theactivity rate are found to be highest in the South-ern Craton though this region has not experienceda large earthquake during last few hundred years.The seismicity rate from the statistical consider-ation is an indication of the previous observedactivity in terms of magnitude of different sizesof past earthquakes and not just due to observedmaximum magnitude in that region. The values ofcomputed maximum magnitude of different seis-mogenic zones and different observed magnitudebased on the catalog data reflect their differenttectonic behaviour. The observed maximum mag-nitude is located in ROK (Mw = 7.7), which isthe highest observed magnitude in the entire cat-alog. The expected maximum magnitudes in eachzone along with error in the estimation proce-dure are shown in table 2. It is important to notethat no earthquake records of magnitude morethan the cut-off magnitude in the extreme andcomplete parts was available in the Eastern Cra-ton region. Only two earthquake events of East-ern Craton were identified in the catalog periodwhich were less than or equal to magnitude 5.0but higher than 3.2. Since both events occurredoutside the cut-off threshold of extreme and com-plete parts of earthquake catalog, they could notbe included in estimation of earthquake parame-ters. However, it is seen that Eastern Craton issurrounded by different seismogenic zones whichhave experienced moderate earthquakes in the lasthundred years. Even though the observed seismic-ity of the Eastern Craton region is not indica-tive of the severity of future possible earthquakes,it is imperative to consider the seismicity rate ofthis region closely associated with the neighbour-ing active seismogenic zones either due to the prox-imity or due to similar tectonic conditions withrespect to other cratons. The seismicity parame-ters of Eastern Craton has been evaluated (shown

Seismic hazard in peninsular India 715
Table 2. Estimated seismicity parameters for different seismogenic zones of peninsular India.
Seismicity b-value of Estimated Mmax Estimated Mmax Mmax from geologicalSeismogenic zones in parameter Gutenberg–Richter using Cramer’s using Bayesian consideration (frompeninsular India β = b ln 10 equation approximation approximation Seeber et al 1999)
Rann of Kuchchh(ROK)
1.63±0.06 0.71±0.03 8.3±0.57 8.3±0.71 8.0
Northern Craton(NC)
1.34±0.06 0.58±0.03 6.3±0.56 6.3±0.56 6.5
Narmada Lineament(NL)
1.73±0.16 0.75±0.07 6.9±0.57 6.9±0.71 7.5
Mahanadi Graben(MG)
1.14±0.31 0.50±0.13 5.6±0.56 5.6±0.71 7.5
Godavari Graben(GG)
2.04±0.25 0.88±0.11 6.3±0.56 5.6±0.71 7.5
Southern Craton(SC)
2.78±0.12 1.21±0.05 6.7±0.57 6.7±0.71 6.5
Western PassiveMargin (WPM)
1.44±0.06 0.62±0.03 6.8±0.57 6.8±0.71 7.5
Eastern PassiveMargin (EPM)
1.44±0.07 0.62±0.03 6.4±0.56 6.4±0.71 7.5
Eastern Craton(EC)
1.63±0.21 0.704±0.1 6.3±0.56 6.3±0.71 6.5
Figure 6. Annual exceedance probabilities of different mag-nitude ranges estimated for nine source zones of peninsularIndia.
in bold in table 2) using the average of seismicityrates of four zones based on the associated length ofthe boundaries and corresponding seismicity para-meters. Based on this consideration, the maxi-mum magnitude for the Eastern Craton has beenestimated as Mw = 6.3. This indicates the severityof the possible future large earthquakes in this zoneand is in close association with the large northerncratonic zone of the Indian Peninsula. The grabens,mainly Mahanadi, show low past seismic acitivityand thus form the main part of the stable shieldwhereas highly active ROK and northern linea-ments are relatively active and weak zones of theshield.
Figure 7. Recurrence of different magnitudes per annumestimated for nine source zones of peninsular India.
5. Hazard estimates and interpretations
Figure 6 shows the annual exceedance probabili-ties for different magnitude ranges estimated forthe nine seismic zones and figure 7 shows theannual recurrence rate for different magnitudeearthquakes in each zone. It has been found thatthe recurrence rate associated with most of the rift-ing zones is higher as compared to the quiescentcratonic shields of India. For Rann of Kuchchh, theestimated recurrence rate is highest whereas forGodavari Graben, southern and eastern cratons, itremains very low indicating its aseismic nature dur-ing recent history. For Southern Craton, the esti-mated recurrence rate is quite high especially for
716 Kishor Jaiswal and Ravi Sinha
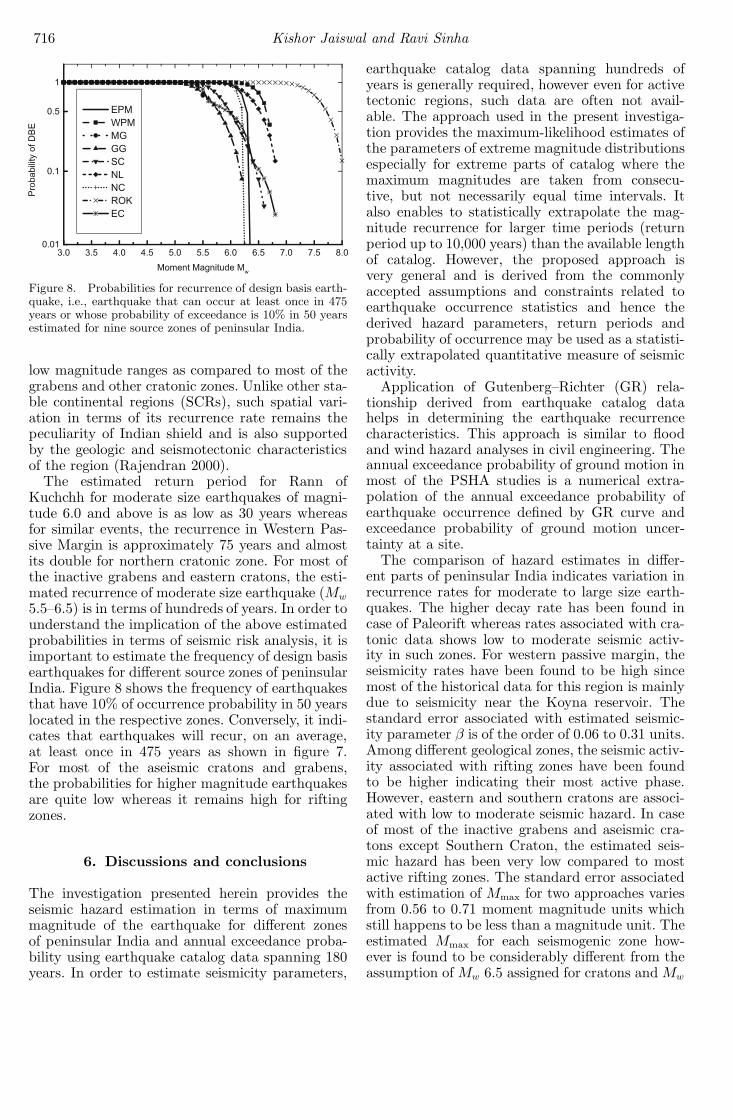
Figure 8. Probabilities for recurrence of design basis earth-quake, i.e., earthquake that can occur at least once in 475years or whose probability of exceedance is 10% in 50 yearsestimated for nine source zones of peninsular India.
low magnitude ranges as compared to most of thegrabens and other cratonic zones. Unlike other sta-ble continental regions (SCRs), such spatial vari-ation in terms of its recurrence rate remains thepeculiarity of Indian shield and is also supportedby the geologic and seismotectonic characteristicsof the region (Rajendran 2000).
The estimated return period for Rann ofKuchchh for moderate size earthquakes of magni-tude 6.0 and above is as low as 30 years whereasfor similar events, the recurrence in Western Pas-sive Margin is approximately 75 years and almostits double for northern cratonic zone. For most ofthe inactive grabens and eastern cratons, the esti-mated recurrence of moderate size earthquake (Mw
5.5–6.5) is in terms of hundreds of years. In order tounderstand the implication of the above estimatedprobabilities in terms of seismic risk analysis, it isimportant to estimate the frequency of design basisearthquakes for different source zones of peninsularIndia. Figure 8 shows the frequency of earthquakesthat have 10% of occurrence probability in 50 yearslocated in the respective zones. Conversely, it indi-cates that earthquakes will recur, on an average,at least once in 475 years as shown in figure 7.For most of the aseismic cratons and grabens,the probabilities for higher magnitude earthquakesare quite low whereas it remains high for riftingzones.
6. Discussions and conclusions
The investigation presented herein provides theseismic hazard estimation in terms of maximummagnitude of the earthquake for different zonesof peninsular India and annual exceedance proba-bility using earthquake catalog data spanning 180years. In order to estimate seismicity parameters,
earthquake catalog data spanning hundreds ofyears is generally required, however even for activetectonic regions, such data are often not avail-able. The approach used in the present investiga-tion provides the maximum-likelihood estimates ofthe parameters of extreme magnitude distributionsespecially for extreme parts of catalog where themaximum magnitudes are taken from consecu-tive, but not necessarily equal time intervals. Italso enables to statistically extrapolate the mag-nitude recurrence for larger time periods (returnperiod up to 10,000 years) than the available lengthof catalog. However, the proposed approach isvery general and is derived from the commonlyaccepted assumptions and constraints related toearthquake occurrence statistics and hence thederived hazard parameters, return periods andprobability of occurrence may be used as a statisti-cally extrapolated quantitative measure of seismicactivity.
Application of Gutenberg–Richter (GR) rela-tionship derived from earthquake catalog datahelps in determining the earthquake recurrencecharacteristics. This approach is similar to floodand wind hazard analyses in civil engineering. Theannual exceedance probability of ground motion inmost of the PSHA studies is a numerical extra-polation of the annual exceedance probability ofearthquake occurrence defined by GR curve andexceedance probability of ground motion uncer-tainty at a site.
The comparison of hazard estimates in differ-ent parts of peninsular India indicates variation inrecurrence rates for moderate to large size earth-quakes. The higher decay rate has been found incase of Paleorift whereas rates associated with cra-tonic data shows low to moderate seismic activ-ity in such zones. For western passive margin, theseismicity rates have been found to be high sincemost of the historical data for this region is mainlydue to seismicity near the Koyna reservoir. Thestandard error associated with estimated seismic-ity parameter β is of the order of 0.06 to 0.31 units.Among different geological zones, the seismic activ-ity associated with rifting zones have been foundto be higher indicating their most active phase.However, eastern and southern cratons are associ-ated with low to moderate seismic hazard. In caseof most of the inactive grabens and aseismic cra-tons except Southern Craton, the estimated seis-mic hazard has been very low compared to mostactive rifting zones. The standard error associatedwith estimation of Mmax for two approaches variesfrom 0.56 to 0.71 moment magnitude units whichstill happens to be less than a magnitude unit. Theestimated Mmax for each seismogenic zone how-ever is found to be considerably different from theassumption of Mw 6.5 assigned for cratons and Mw

Seismic hazard in peninsular India 717
7.5 for rifting zones and a higher value of 8.0 forRann of Kuchchh used by Seeber et al (1999).
Engineers are mainly interested in knowingexceedances of ground motion parameters (peak ofground accelerations, velocities or spectral accele-rations associated with time period of 0.2 or 1 s)at a certain predefined interval at a site to designthe structure. However, the present approach doesnot directly provide such estimates since it requiresadditional analysis in terms of incorporation ofground motion prediction equations in the model.Nevertheless, the investigation provides seismichazard estimated in terms of earthquake mag-nitude and annual exceedance probability andprovides a useful basis for understanding the vari-ation of seismic activity in peninsular India andcan potentially benefit future probabilistic seismichazard analysis. The estimation of zone specificmaximum magnitude potential not only providesan opportunity to potentially identify regions ofhigher hazards from lower hazard but also to per-form further research in terms of the geologicand paleoseismic investigations of regions that hasconsiderably low return periods of moderate earth-quakes. It is important to note that the estimationof maximum magnitude purely based on statisticaldata is often not recommended since the zoneswith limited historical data often lead to erro-neous estimates and hence it is recommended toutilize multiple approaches to incorporate epis-temic uncertainties in the modeling parametersbefore developing seismic hazard map for theregion.
Based on the present investigation, the followingconclusions can be drawn:
• A regional seismic hazard assessment in termsof earthquake magnitude and annual exceedanceprobability has been presented. The seismic haz-ard parameters such as β and Mmax estimatedfor each seismotectonic zone shows considerablevariation and hence future seismic hazard stu-dies must consider spatial variation of seismicityparameters.
• The average recurrence of moderate size earth-quakes in Rann of Kuchchh, Narmada lineamentand other rifting zones is much higher than mostof the inactive cratons and grabens of peninsu-lar India. The mean estimate of Mmax for Rannof Kuchchh is higher than Mw 8.0 used in pre-vious studies. Similarly, for most of the cratoniczones, it is found to be lower than the assump-tion of cratonic maximum magnitude potentialin past studies.
• The seismic hazard assessment should considerthe influence of increase in seismicity rate ofpeninsular India since 1960. The hazard assess-ment based on only the extreme part of the
catalog does not provide accurate assessment ofthe seismic hazard.
• The study of spatial variation of seismic acti-vity illustrates the importance of identifying thecratonic and rifting zones activity pattern forfuture seismic hazard estimation and microzona-tion studies of the region. The estimation ofsource specific seismic hazard not only providessource specific characteristics but also a use-ful basis for future micro-level ground motionestimation.
References
Bhatia S C, Ravi Kumar M and Gupta H K 1999 A proba-bilistic seismic hazard map of India and adjoining regions;Ann. Di. Geofisica 42(6) 1153–1166.
Boschi E, Giardini D, Pantost D, Valensise G,Arrowsmith R, Basham P, Burgmann R, Crone A J,Hull A, Mcguire R K, Schwartz D, Sieh K, Ward S Nand Yeats R S 1996 New trends in active faulting stud-ies for seismic hazard assessment; Ann. Di. Geofisica 391301–1304.
Bozkurt S B, Stein R S and Toda S 2007 Forecastingprobabilistic seismic shaking for greater Tokyo from 400years of intensity observations; Earthquake Spectra 23525–546.
Chandra U 1977 Earthquakes of peninsular India – a seis-motectonic study; Bull. Seismol. Soc. Am. 65 1387–1413.
Cornell C A 1968 Engineering seismic risk analysis; Bull.Seismol. Soc. Am. 58 1583–1606.
Frankel A 2004 How can seismic hazard around the NewMadrid seismic zone be similar to that in California?;Seis. Res. Lett. 75 575–586.
Gupta H K 1992 Reservoir-induced earthquakes (Amster-dam: Elsevier Scientific Publishing) 355 pp.
Gupta H K and Rastogi B K 1976 Dams and earthquakes(Amsterdam: Elsevier Scientific Publishing) 229 pp.
Gutenberg B and Richter C F 1944 Frequency of earth-quakes in California; Bull. Seismol. Soc. Am. 34185–188.
Jaiswal K 2006 Probabilistic seismic hazard estimationmethodology for stable continental regions incorporatingspatial and temporal uncertainties; Ph.D. thesis, IndianInstitute of Technology Bombay, Mumbai, 2006.
Jaiswal K and Sinha R 2005 EarthquakeInfo.org: Web-portal on earthquake disaster awareness in India;http://www.earthquakeinfo.org.
Jaiswal K and Sinha R 2007 Probabilistic seismic-hazardestimation for peninsular India; Bull. Seismol. Soc. Am.97(1B) 318–330.
Johnston A 1996 Seismic moment assessment of earthquakesin stable continental regions: Part-II instrumental seis-micity; Geophys. J. Int. 124 381–414.
Khatri K N, Rogers A M and Algermissen S T 1984 A seis-mic hazard map of India and adjacent areas; Tectonophys.108 93–134.
Kijko A 2004 Estimation of the maximum earthquake mag-nitude mmax; Pure Appl. Geophys. 161 1655–1681.
Kijko A, Lasocki S and Graham G 2001 Nonparametric seis-mic hazard analysis in mines; Pure Appl. Geophys. 1581655–1675.
Kijko A and Sellevoll M A 1989 Estimation of earthquakehazard parameters from incomplete data files. Part I: Uti-lization of extreme and complete catalogs with different
718 Kishor Jaiswal and Ravi Sinha
threshold magnitudes; Bull. Seismol. Soc. Am. 793645–654.
Kijko A and Sellevoll M A 1992 Estimation of earthquakehazard parameters from incomplete data files. Part II:Incorporation of magnitude heterogeneity; Bull. Seismol.Soc. Am. 821 120–134.
Mcguire R M 1993 Computation of seismic hazard; Ann. DiGeofisica 36 181–200.
Mohan I, Sitaram M V D and Gupta H K 1981 Some recentearthquakes in peninsular India; J. Geol. Soc. India 22292–298.
Naqvi S M, Divakara Rao V and Narain H 1974 The proto-continental growth of the Indian shield and the antiquityof its rift valleys; Precramb. Res. 1 345–398.
National Earthquake Information Center 2003 USA PDEreportings http://neic.usgs.gov/neis/epic/
Page R 1968 Aftershocks and microaftershocks; Bull. Seis-mol. Soc. Am. 58 1131–1168.
Raghukanth S T G and Iyengar R N 2006 Seismic haz-ard estimation for Mumbai city; Curr. Sci. 91(11)1486–1494.
Rajendran C P 2000 Using geological data for earthquakestudies: A perspective from peninsular India; Curr. Sci.79(9&10) 1251–1258.
Rao B R 2000 Historical seismicity and deformation ratesin the Indian peninsular shield; J. Seismol. 4 247–258.
Rao B R and Rao P S 1984 Historical seismicity of penin-sular India; Bull. Seismol. Soc. Am. 74 2519–2533.
Seeber L, Armbruster J G and Jacob K H 1999 Probabilisticassessment of earthquake hazard for the state of Maha-rashtra; Report to Government of Maharashtra Earth-quake Rehabilitation Cell Mumbai.
Shankar D and Sharma M L 1998 Estimation of seismichazard parameters for the Himalayas and its vicinity
from complete data files; Pure Appl. Geophys. 152267–279.
Sharma M L, Wason H R and Dimri R 2003 Seismic zonationof the Delhi region for bedrock ground motion; Pure Appl.Geophys. 160 2381–2398.
Stepp J 1973 Analysis of completeness of the earthquakesample in Puget Sound area; In: Seismic zoning (ed.)S T Harding, NOAA Tech. Report ERL 267-ESL30,Boulder, Colorado, U.S.A.
Wang Z and Ormsbee L 2005 Comparison between proba-bilistic seismic hazard analysis and flood frequency analy-sis; EOS, Trans., AGU 86(45) 51–52.
Wang Z 2006 Understanding seismic hazard and risk assess-ments: An example in the New Madrid seismic zone of theCentral United States; Proc. of the 8th National Confer-ence on Earthquake Engineering, April 18–22, San Fran-cisco, CA, Paper no. 416.
Wang Z 2007 Seismic hazard and risk assessment in theintraplate environment: The New Madrid seismic zoneof the central United States; In: Continental IntraplateEarthquakes: Science, Hazard, and Policy Issues (eds)S Stein and S Mazzotti; Geological Society of AmericaSpecial Paper 425 363–373.
Wang Z and M Zhou 2007 Comment on “Why Do Mod-ern Probabilistic Seismic-Hazard Analyses Often Leadto Increased Hazard Estimates?” by Julian J Bommerand Norman A Abrahamson; Bull. Seismol. Soc. Am. 972212–2214.
Valdiya K S 1973 Tectonic framework of India: A review andinterpretation of recent structural and tectonic studies;Geophys. Res. Bull. 11 79–114.
Veneziano D, Cornell C A and O’hara T 1984 Historicmethod for seismic hazard analysis; Elect. Power Res.Inst. Report, NP-3438, Palo Alto.
MS received 4 October 2007; revised 3 February 2008; accepted 6 March 2008
Copyright © 2022 FDOKUMEN