Palaeoseismology of the North Anatolian Fault near the Marmara Sea: implications for fault...
24
Palaeoseismology of the North Anatolian Fault near the Marmara Sea: implications for fault segmentation and seismic hazard THOMAS ROCKWELL 1 *, DANIEL RAGONA 1 , GORDON SEITZ 1 , ROB LANGRIDGE 2 , M. ERSEN AKSOY 3 , GU ¨ LSEN UCARKUS 3 , MATTHIEU FERRY 4,7 , ARON J. MELTZNER 5 , YANN KLINGER 6 , MUSTAPHA MEGHRAOUI 7 , DILEK SATIR 3 , AYKUT BARKA 3† & BURCAK AKBALIK 3 1 Geological Sciences, San Diego State University, San Diego, CA 92182, USA 2 Institute of Geological and Nuclear Sciences, PO Box 30-368, Lower Hutt, New Zealand 3 Eurasia Institute of Earth Sciences, Istanbul Technical University, Maslak, Istanbul, Turkey 4 Universidade de E ´ vora, Centro de Geofisica de E ´ vora, Rua Roma ˜o Ramalho 59, 7002-554 E ´ vora, Portugal 5 Tectonics Observatory, California Institute of Technology, Pasadena, CA 91125, USA 6 Laboratoire de Tectonique, Institut de Physique du Globe, 4 place Jussieu, 75005, Paris, France 7 Institut de Physique de Globe, 5 rue Rene ´ Descartes, F-67084 Strasbourg Cedex, France † Deceased *Corresponding author (e-mail: [email protected]) Abstract: We conducted palaeoseismic studies along the North Anatolian fault both east and west of the Marmara Sea to evaluate its recent surface rupture history in relation to the well-documented historical record of earthquakes in the region, and to assess the hazard of this major fault to the city of Istanbul, one of the largest cities in the Middle East. Across the 1912 rupture of the Ganos strand of the North Anatolian fault west of the Marmara Sea, we excavated 26 trenches to resolve slip and constrain the earthquake history on a channel–fan complex that crosses the fault at a high angle. A distinctive, well-sorted fine sand channel that served as a marker unit was exposed in 21 trenches totaling over 300 m in length. Isopach mapping shows that the sand is channelized north of the fault, and flowed as an overflow fan complex across a broad fault scarp to the south. Realignment of the feeder channel thalweg to the fan apex required about 9 +1 m of reconstruction. Study of the rupture history in several exposures demonstrates that this displacement occurred as two large events. Analysis of radiocarbon dates places the age of the sand channel as post AD 1655, so we attribute the two surface ruptures to the large regional earthquakes of 1766 and 1912. If each was similar in size, then about 4–5 m of slip can be attributed to each event, consistent with that reported for 1912 farther east. We also found evidence for two additional surface ruptures after about AD 900, which probably correspond to the large regional earthquakes of 1063 and 1344 (or 1354). These observations suggest fairly periodic occurrence of large earthquakes (RI ¼ c. 283 +113 years) for the past millennium, and a rate of c. 16 mm/a if all events experi- enced similar slip. We excavated six trenches at two sites along the 1999 Izmit rupture to study the past earthquake history along that segment of the North Anatolian fault. One site, located in the township of Ko ¨seko ¨y east of Izmit, revealed evidence for three surface ruptures (including 1999) during the past 400 years. The other trench was sited in an Ottoman canal that was excavated (but never completed) in 1591. There is evidence for three large surface rupturing events in the upper 2 m of alluvial fill within the canal at that site, located only a few kilometres from the Ko ¨seko ¨y site. One of the past events is almost certainly the large earthquake of 1719, for which historical descrip- tions of damage are nearly identical to that of 1999. Other earthquakes that could plausibly be attributed to the other recognized rupture of the Izmit segment are the 1754, 1878 or 1894 events, all of which produced damage in the region and for which the source faults are poorly known. Our palaeoseismic observations suggest that the Izmit segment of the North Anatolia fault ruptures every one and a half centuries or so, consistent with the historical record for the region, although the time between ruptures may be as short as 35 years if 1754 broke the Izmit segment. Release of about 4 m of seismic slip both west and east of the Marmara Sea this past century (1912, 1999) support the contention that Istanbul is at high risk from a pending large earthquake. From:REICHERTER, K., MICHETTI , A. M. & SILVA, P. G. (eds) Palaeoseismology: Historical and Prehistorical Records of Earthquake Ground Effects for Seismic Hazard Assessment. The Geological Society, London, Special Publications, 316, 31–54. DOI: 10.1144/SP316.3 0305-8719/09/$15.00 # The Geological Society of London 2009.
-
Upload
univ-montp2 -
Category
Documents
-
view
3 -
download
0
Transcript of Palaeoseismology of the North Anatolian Fault near the Marmara Sea: implications for fault...
Palaeoseismology of the North Anatolian Fault near the Marmara
Sea: implications for fault segmentation and seismic hazard
THOMAS ROCKWELL1*, DANIEL RAGONA1, GORDON SEITZ1, ROB LANGRIDGE2,
M. ERSEN AKSOY3, GULSEN UCARKUS3, MATTHIEU FERRY4,7, ARON J. MELTZNER5,
YANN KLINGER6, MUSTAPHA MEGHRAOUI7, DILEK SATIR3, AYKUT BARKA3† &
BURCAK AKBALIK3
1Geological Sciences, San Diego State University, San Diego, CA 92182, USA2Institute of Geological and Nuclear Sciences, PO Box 30-368, Lower Hutt, New Zealand
3Eurasia Institute of Earth Sciences, Istanbul Technical University, Maslak, Istanbul, Turkey4Universidade de Evora, Centro de Geofisica de Evora, Rua Romao Ramalho 59,
7002-554 Evora, Portugal5Tectonics Observatory, California Institute of Technology, Pasadena, CA 91125, USA
6Laboratoire de Tectonique, Institut de Physique du Globe, 4 place Jussieu, 75005, Paris, France7Institut de Physique de Globe, 5 rue Rene Descartes, F-67084 Strasbourg Cedex, France
†Deceased
*Corresponding author (e-mail: [email protected])
Abstract: We conducted palaeoseismic studies along the North Anatolian fault both east and westof the Marmara Sea to evaluate its recent surface rupture history in relation to the well-documentedhistorical record of earthquakes in the region, and to assess the hazard of this major fault to the cityof Istanbul, one of the largest cities in the Middle East. Across the 1912 rupture of the Ganos strandof the North Anatolian fault west of the Marmara Sea, we excavated 26 trenches to resolve slip andconstrain the earthquake history on a channel–fan complex that crosses the fault at a high angle.A distinctive, well-sorted fine sand channel that served as a marker unit was exposed in 21 trenchestotaling over 300 m in length. Isopach mapping shows that the sand is channelized north of thefault, and flowed as an overflow fan complex across a broad fault scarp to the south. Realignmentof the feeder channel thalweg to the fan apex required about 9+1 m of reconstruction. Study of therupture history in several exposures demonstrates that this displacement occurred as two largeevents. Analysis of radiocarbon dates places the age of the sand channel as post AD 1655, so weattribute the two surface ruptures to the large regional earthquakes of 1766 and 1912. If eachwas similar in size, then about 4–5 m of slip can be attributed to each event, consistent withthat reported for 1912 farther east. We also found evidence for two additional surface rupturesafter about AD 900, which probably correspond to the large regional earthquakes of 1063 and1344 (or 1354). These observations suggest fairly periodic occurrence of large earthquakes(RI ¼ c. 283+113 years) for the past millennium, and a rate of c. 16 mm/a if all events experi-enced similar slip.
We excavated six trenches at two sites along the 1999 Izmit rupture to study the past earthquakehistory along that segment of the North Anatolian fault. One site, located in the township ofKosekoy east of Izmit, revealed evidence for three surface ruptures (including 1999) during thepast 400 years. The other trench was sited in an Ottoman canal that was excavated (but nevercompleted) in 1591. There is evidence for three large surface rupturing events in the upper 2 mof alluvial fill within the canal at that site, located only a few kilometres from the Kosekoy site.One of the past events is almost certainly the large earthquake of 1719, for which historical descrip-tions of damage are nearly identical to that of 1999. Other earthquakes that could plausibly beattributed to the other recognized rupture of the Izmit segment are the 1754, 1878 or 1894events, all of which produced damage in the region and for which the source faults are poorlyknown. Our palaeoseismic observations suggest that the Izmit segment of the North Anatoliafault ruptures every one and a half centuries or so, consistent with the historical record for theregion, although the time between ruptures may be as short as 35 years if 1754 broke theIzmit segment.
Release of about 4 m of seismic slip both west and east of the Marmara Sea this past century(1912, 1999) support the contention that Istanbul is at high risk from a pending large earthquake.
From: REICHERTER, K., MICHETTI, A. M. & SILVA, P. G. (eds) Palaeoseismology: Historical and Prehistorical Recordsof Earthquake Ground Effects for Seismic Hazard Assessment. The Geological Society, London, Special Publications,316, 31–54. DOI: 10.1144/SP316.3 0305-8719/09/$15.00 # The Geological Society of London 2009.
In that historical records suggest that the last large central Marmara Sea event occurred in 1766,there may be a similar 4 m of accumulated strain across the Marmara basin segment of theNorth Anatolian fault.
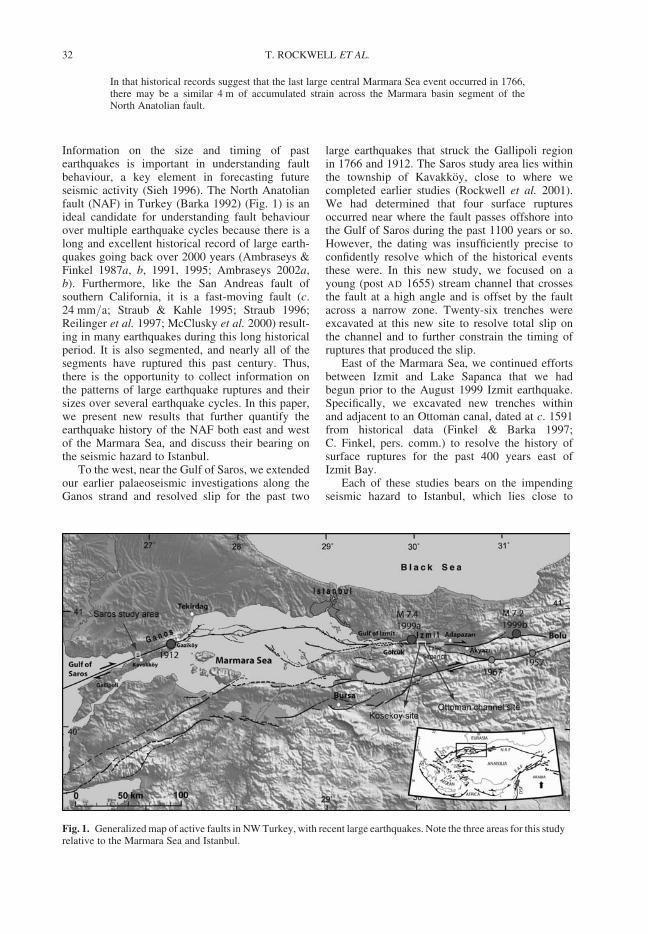
Information on the size and timing of pastearthquakes is important in understanding faultbehaviour, a key element in forecasting futureseismic activity (Sieh 1996). The North Anatolianfault (NAF) in Turkey (Barka 1992) (Fig. 1) is anideal candidate for understanding fault behaviourover multiple earthquake cycles because there is along and excellent historical record of large earth-quakes going back over 2000 years (Ambraseys &Finkel 1987a, b, 1991, 1995; Ambraseys 2002a,b). Furthermore, like the San Andreas fault ofsouthern California, it is a fast-moving fault (c.24 mm/a; Straub & Kahle 1995; Straub 1996;Reilinger et al. 1997; McClusky et al. 2000) result-ing in many earthquakes during this long historicalperiod. It is also segmented, and nearly all of thesegments have ruptured this past century. Thus,there is the opportunity to collect information onthe patterns of large earthquake ruptures and theirsizes over several earthquake cycles. In this paper,we present new results that further quantify theearthquake history of the NAF both east and westof the Marmara Sea, and discuss their bearing onthe seismic hazard to Istanbul.
To the west, near the Gulf of Saros, we extendedour earlier palaeoseismic investigations along theGanos strand and resolved slip for the past two
large earthquakes that struck the Gallipoli regionin 1766 and 1912. The Saros study area lies withinthe township of Kavakkoy, close to where wecompleted earlier studies (Rockwell et al. 2001).We had determined that four surface rupturesoccurred near where the fault passes offshore intothe Gulf of Saros during the past 1100 years or so.However, the dating was insufficiently precise toconfidently resolve which of the historical eventsthese were. In this new study, we focused on ayoung (post AD 1655) stream channel that crossesthe fault at a high angle and is offset by the faultacross a narrow zone. Twenty-six trenches wereexcavated at this new site to resolve total slip onthe channel and to further constrain the timing ofruptures that produced the slip.
East of the Marmara Sea, we continued effortsbetween Izmit and Lake Sapanca that we hadbegun prior to the August 1999 Izmit earthquake.Specifically, we excavated new trenches withinand adjacent to an Ottoman canal, dated at c. 1591from historical data (Finkel & Barka 1997;C. Finkel, pers. comm.) to resolve the history ofsurface ruptures for the past 400 years east ofIzmit Bay.
Each of these studies bears on the impendingseismic hazard to Istanbul, which lies close to
Fig. 1. Generalized map of active faults in NW Turkey, with recent large earthquakes. Note the three areas for this studyrelative to the Marmara Sea and Istanbul.
T. ROCKWELL ET AL.32
the NAF. Our observations support the contentionthat the NAF near Istanbul should be close tofailure based on the distribution and size ofearthquakes during the past 400 years, and that therecent earthquakes to the east (Izmit and Duzceevents in 1999) have further loaded the faultsegments beneath the Marmara Sea (Parsonset al. 2000).
The Saros site
Earlier palaeoseismic results at Kavakkoy in theGallipoli Peninsular region near the Gulf of Sarosindicate that four earthquakes have rupturedthe surface in that area during the past 1000–1200years, and that two of these post-date a sandchannel dated to younger than the fourteenthcentury AD (Rockwell et al. 2001). One of these isalmost certainly the surface rupture of the 1912
M7.3 earthquake (Ambraseys 2002a), which wasphotographed east of our site towards Gazikoy(Ambraseys & Finkel 1987a) and has been studiedin detail by Altunel et al. (2004).
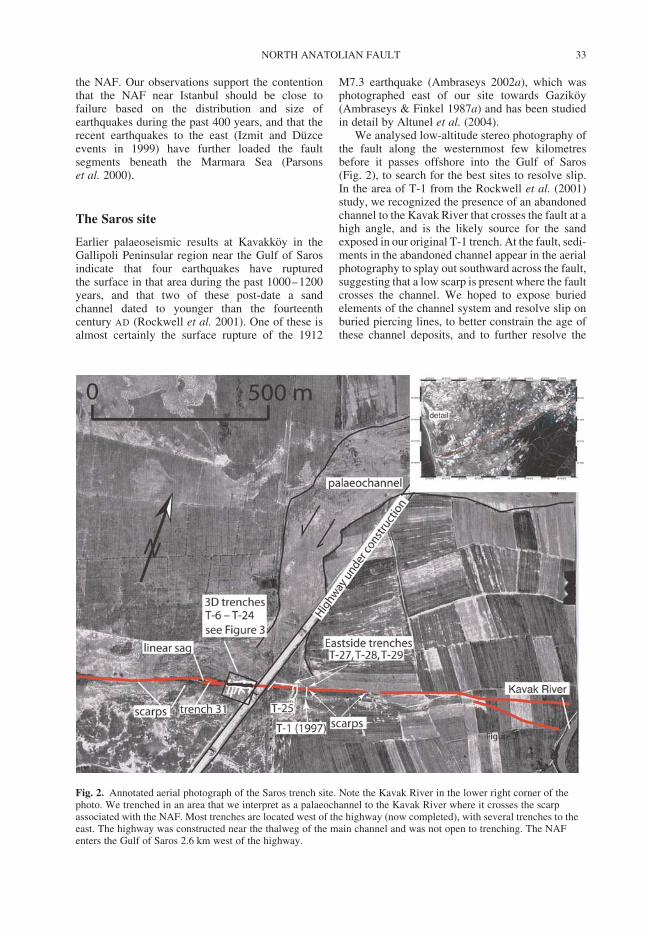
We analysed low-altitude stereo photography ofthe fault along the westernmost few kilometresbefore it passes offshore into the Gulf of Saros(Fig. 2), to search for the best sites to resolve slip.In the area of T-1 from the Rockwell et al. (2001)study, we recognized the presence of an abandonedchannel to the Kavak River that crosses the fault at ahigh angle, and is the likely source for the sandexposed in our original T-1 trench. At the fault, sedi-ments in the abandoned channel appear in the aerialphotography to splay out southward across the fault,suggesting that a low scarp is present where the faultcrosses the channel. We hoped to expose buriedelements of the channel system and resolve slip onburied piercing lines, to better constrain the age ofthese channel deposits, and to further resolve the
Fig. 2. Annotated aerial photograph of the Saros trench site. Note the Kavak River in the lower right corner of thephoto. We trenched in an area that we interpret as a palaeochannel to the Kavak River where it crosses the scarpassociated with the NAF. Most trenches are located west of the highway (now completed), with several trenches to theeast. The highway was constructed near the thalweg of the main channel and was not open to trenching. The NAFenters the Gulf of Saros 2.6 km west of the highway.
NORTH ANATOLIAN FAULT 33
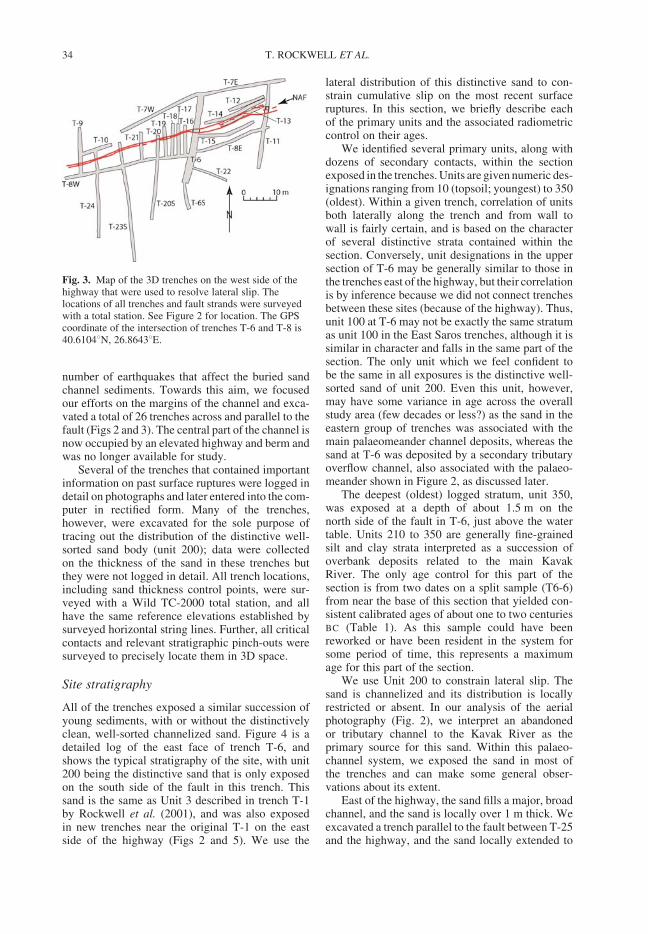
number of earthquakes that affect the buried sandchannel sediments. Towards this aim, we focusedour efforts on the margins of the channel and exca-vated a total of 26 trenches across and parallel to thefault (Figs 2 and 3). The central part of the channel isnow occupied by an elevated highway and berm andwas no longer available for study.
Several of the trenches that contained importantinformation on past surface ruptures were logged indetail on photographs and later entered into the com-puter in rectified form. Many of the trenches,however, were excavated for the sole purpose oftracing out the distribution of the distinctive well-sorted sand body (unit 200); data were collectedon the thickness of the sand in these trenches butthey were not logged in detail. All trench locations,including sand thickness control points, were sur-veyed with a Wild TC-2000 total station, and allhave the same reference elevations established bysurveyed horizontal string lines. Further, all criticalcontacts and relevant stratigraphic pinch-outs weresurveyed to precisely locate them in 3D space.
Site stratigraphy
All of the trenches exposed a similar succession ofyoung sediments, with or without the distinctivelyclean, well-sorted channelized sand. Figure 4 is adetailed log of the east face of trench T-6, andshows the typical stratigraphy of the site, with unit200 being the distinctive sand that is only exposedon the south side of the fault in this trench. Thissand is the same as Unit 3 described in trench T-1by Rockwell et al. (2001), and was also exposedin new trenches near the original T-1 on the eastside of the highway (Figs 2 and 5). We use the
lateral distribution of this distinctive sand to con-strain cumulative slip on the most recent surfaceruptures. In this section, we briefly describe eachof the primary units and the associated radiometriccontrol on their ages.
We identified several primary units, along withdozens of secondary contacts, within the sectionexposed in the trenches. Units are given numeric des-ignations ranging from 10 (topsoil; youngest) to 350(oldest). Within a given trench, correlation of unitsboth laterally along the trench and from wall towall is fairly certain, and is based on the characterof several distinctive strata contained within thesection. Conversely, unit designations in the uppersection of T-6 may be generally similar to those inthe trenches east of the highway, but their correlationis by inference because we did not connect trenchesbetween these sites (because of the highway). Thus,unit 100 at T-6 may not be exactly the same stratumas unit 100 in the East Saros trenches, although it issimilar in character and falls in the same part of thesection. The only unit which we feel confident tobe the same in all exposures is the distinctive well-sorted sand of unit 200. Even this unit, however,may have some variance in age across the overallstudy area (few decades or less?) as the sand in theeastern group of trenches was associated with themain palaeomeander channel deposits, whereas thesand at T-6 was deposited by a secondary tributaryoverflow channel, also associated with the palaeo-meander shown in Figure 2, as discussed later.
The deepest (oldest) logged stratum, unit 350,was exposed at a depth of about 1.5 m on thenorth side of the fault in T-6, just above the watertable. Units 210 to 350 are generally fine-grainedsilt and clay strata interpreted as a succession ofoverbank deposits related to the main KavakRiver. The only age control for this part of thesection is from two dates on a split sample (T6-6)from near the base of this section that yielded con-sistent calibrated ages of about one to two centuriesBC (Table 1). As this sample could have beenreworked or have been resident in the system forsome period of time, this represents a maximumage for this part of the section.
We use Unit 200 to constrain lateral slip. Thesand is channelized and its distribution is locallyrestricted or absent. In our analysis of the aerialphotography (Fig. 2), we interpret an abandonedor tributary channel to the Kavak River as theprimary source for this sand. Within this palaeo-channel system, we exposed the sand in most ofthe trenches and can make some general obser-vations about its extent.
East of the highway, the sand fills a major, broadchannel, and the sand is locally over 1 m thick. Weexcavated a trench parallel to the fault between T-25and the highway, and the sand locally extended to
Fig. 3. Map of the 3D trenches on the west side of thehighway that were used to resolve lateral slip. Thelocations of all trenches and fault strands were surveyedwith a total station. See Figure 2 for location. The GPScoordinate of the intersection of trenches T-6 and T-8 is40.61048N, 26.86438E.
T. ROCKWELL ET AL.34

Fig. 4. Log of the east face of trench T-6. Units are described in the text. The labels 1912 and 1766 correspond to the thicker black contacts and represent the 1912 and1766 event horizons, respectively. The unit 200 sand is the stippled grey unit in the top diagram.
NO
RT
HA
NA
TO
LIA
NF
AU
LT
35
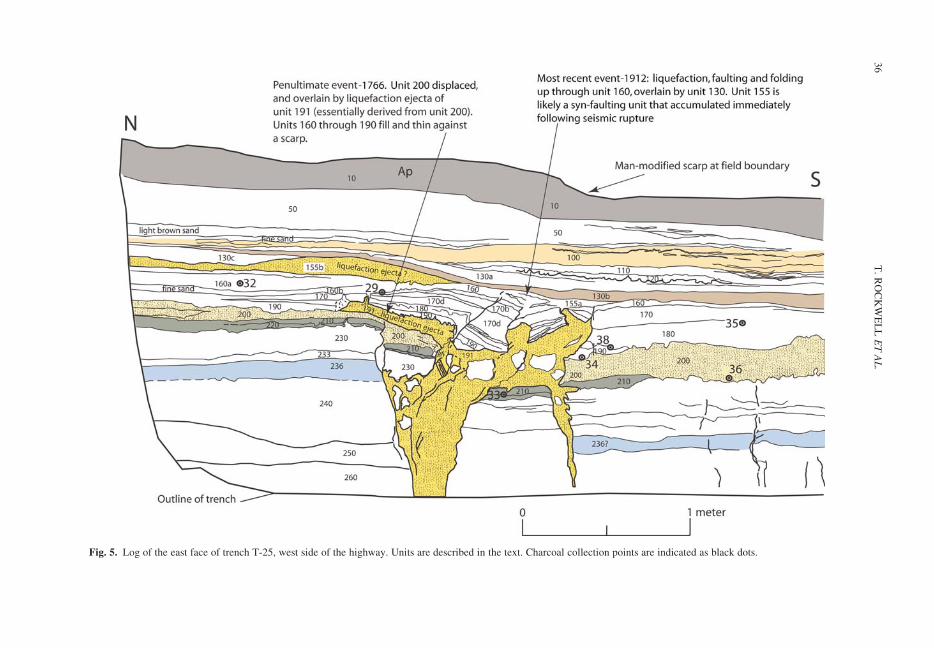
Fig. 5. Log of the east face of trench T-25, west side of the highway. Units are described in the text. Charcoal collection points are indicated as black dots.
T.
RO
CK
WE
LL
ET
AL
.36

Table 1. Radiocarbon dates from trenches at Saros, the Ottoman Canal, and Kosekoy
CAMS # Samplename
Trench exposure Notes Unit d13C Fractionmodern
+ D14C + 14C age + Calibrated agerange (2s)
Kavakkoy and Saros Trenches67291 K-T14-48 Proxy to T6 92 225 0.9556 0.0048 244.4 4.8 360 50 AD 1451–164267290 K-T6-46 T6 0.15 mgC 95 225 0.8972 0.0053 2102.8 5.3 870 50 AD 1041–126767285 K-T6-12 T6E c. 99 225 0.8401 0.0042 2159.9 4.2 1400 40 AD 592–70367289 K-T14-45 Proxy to T6 102 225 0.9675 0.0043 232.5 4.3 270 40 AD 1489–195567288 K-T14-44 Proxy to T6 105 224.3 0.9038 0.0043 296.2 4.3 810 40 AD 1170–128567696 K-T13-32 East Saros, East wall 150 225 0.9698 0.0048 230.2 4.8 250 50 AD 1489–195567694 K-T13-29* East Saros, East wall 0.12 mgC base 160 225 0.9232 0.0065 276.8 6.5 640 60 AD 1282–141467698 K-T13-35 East Saros, East wall top 180 225 0.8855 0.0033 2114.5 3.3 980 40 AD 999–116468212 K-T13-41 East Saros, East wall shell 180 0 0.8711 0.0043 2128.9 4.3 1110 40 AD 874–101667697 K-T13-34 East Saros, East wall 190 225 0.9467 0.0048 253.3 4.8 440 50 AD 1408–163167286 K-T6-43 T6W @ M9 200 225 0.9777 0.0053 222.3 5.3 180 50 AD 1655–195567284 K-T6-3 T6E 200 225 0.9682 0.0042 231.8 4.2 260 40 AD 1513–195567292 K-T6-43 T6W @ M9 0.04 mgC 200 225 0.9931 0.016 26.9 16 60 130 AD 1529–195567695 K-T13-30 East Saros,West wall 210 225 0.9662 0.0048 233.8 4.8 280 40 AD 1488–195567293 K-T6-6 T6E 310 227.6 0.7638 0.0034 2236.2 3.4 2160 40 360–60 BC
67287 K-T6-6 T6E 310 225 0.771 0.0034 2229 3.4 2090 40 190–2 BC
Ottoman Canal Berm (dated at the ArizonaAMS facity)
AA33511 Berm 14C-3 Tepetarla Berm Trench 225.6 0.9193 0.0055 675 50 AD 1274–1402AA33512 Berm 14C-7 Tepetarla Berm Trench 225.2 0.7815 0.0053 1980 55 112 BC –AD 191AA33513 Berm 14C-8 Tepetarla Berm Trench 224.7 0.7976 0.005 1815 50 AD 85–371AA33640 Berm 14C-5 Tepetarla Berm Trench 225.7 0.7985 0.0047 1805 45 AD 120–373
Kosekoy Trench 168683 T1-19 Above E2 3b 225 0.9809 0.0043 219.1 4.3 150 40 AD 1670–195568684 T1-6 Below E2 4 225 0.9526 0.0043 247.4 4.3 390 40 AD 1441–163468686 T1-27 5c 225 0.976 0.0047 224 4.7 200 40 AD 1647–195568685 T1-25 7 225 0.9922 0.0048 27.8 4.8 60 40 AD 1688–192768687 T1-23 10 225 0.8183 0.004 2181.7 4 1610 40 AD 381–55568688 T1-16 11 225 0.8281 0.004 2171.9 4 1520 40 AD 444–630
NO
RT
HA
NA
TO
LIA
NF
AU
LT
37
below the depth of the 2-m-deep trench. This was anexploratory trench to determine the character of thesand and was not logged in detail because of safetyconstraints. Nevertheless, it was clear to us that theprimary fluvial channel lies east of or beneath thehighway, and our trench T-25 was located near themargin of this system. Trench T-1 of Rockwellet al. (2001), which lies within 10 m to the east ofT-25, also exposed this sand unit (unit 3 in theirtrench log).
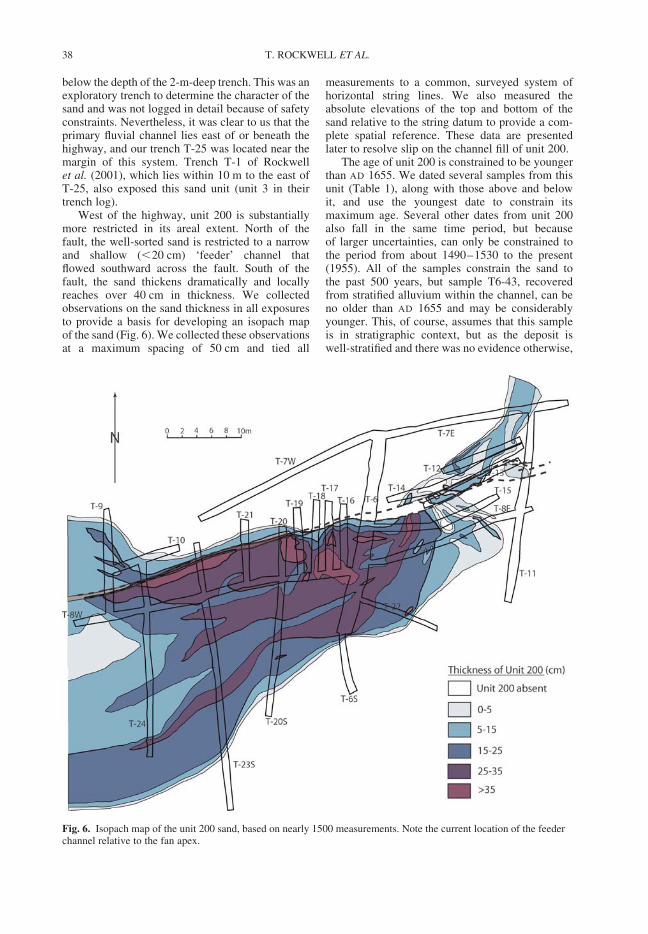
West of the highway, unit 200 is substantiallymore restricted in its areal extent. North of thefault, the well-sorted sand is restricted to a narrowand shallow (,20 cm) ‘feeder’ channel thatflowed southward across the fault. South of thefault, the sand thickens dramatically and locallyreaches over 40 cm in thickness. We collectedobservations on the sand thickness in all exposuresto provide a basis for developing an isopach mapof the sand (Fig. 6). We collected these observationsat a maximum spacing of 50 cm and tied all
measurements to a common, surveyed system ofhorizontal string lines. We also measured theabsolute elevations of the top and bottom of thesand relative to the string datum to provide a com-plete spatial reference. These data are presentedlater to resolve slip on the channel fill of unit 200.
The age of unit 200 is constrained to be youngerthan AD 1655. We dated several samples from thisunit (Table 1), along with those above and belowit, and use the youngest date to constrain itsmaximum age. Several other dates from unit 200also fall in the same time period, but becauseof larger uncertainties, can only be constrained tothe period from about 1490–1530 to the present(1955). All of the samples constrain the sand tothe past 500 years, but sample T6-43, recoveredfrom stratified alluvium within the channel, can beno older than AD 1655 and may be considerablyyounger. This, of course, assumes that this sampleis in stratigraphic context, but as the deposit iswell-stratified and there was no evidence otherwise,
Fig. 6. Isopach map of the unit 200 sand, based on nearly 1500 measurements. Note the current location of the feederchannel relative to the fan apex.
T. ROCKWELL ET AL.38
we take this to be the case. Thus, we interpret allof the radiocarbon samples that lie above this unitand that have older apparent ages to be the resultof either reworking of detrital charcoal or, morelikely, the consequence of the charcoal (and its orig-inal wood) having been resident in the system forsome period of time. The post-1655 date placesstrong constraints on which earthquakes may haveproduced surface rupture at this site and contributedto the observed amount of offset on unit 200, asdiscussed below.
The stratigraphic units above unit 200 can bedesignated as either sedimentation within the faultzone, possibly due to formation of a depressionalong the fault, or the result of overbank sedimen-tation by the Kavak River and its tributary channels.Units 192 to 198, recognized in the east face of T-6(Fig. 4) and in adjacent trenches to the west, areinterpreted to be a sequence of fine-grained depositsthat fill a narrow trough between the unit 200 fanand a low fault scarp. Although this may be inter-preted as the result of deformation along the fault,there is no direct evidence for a surface rupture inthis part of the section. There is a reasonableinterpretation, however, that invokes purely strati-graphic mechanisms to produce this deposit: theisopach map of the sand in Figure 6 clearly showsa fan that splays out and flows west, parallel to thefault, thereby producing a slight low along thefault. Thus, there is no need to require a faultingevent to produce this low, and we prefer thenon-faulting interpretation.
In contrast, units such as 110 to 150 in trench T-6fill a depression that formed immediately after asurface rupture, as indicated by faulting and fissur-ing up to the base of that section. In these cases,the units may be only very locally preserved alongthe fault, although their significance to the interpre-tation of the event stratigraphy may be profound.
Units 10 to 100 are sandy to silty sediments thatbury the fault scarp and are presumably derivedfrom flood events from the Kavak River. Unit 10is the A horizon developed in this uppermostsection and is also the active plough pan in areasthat are farmed, such as to the east of the highway.We dated a number of detrital charcoal samplesfrom units 10 to 190 to provide preliminary con-straints on the age of the overall section. Becauseunit 200 was found to be younger than AD 1655,all higher units must be as well. The radiocarbonresults demonstrate a variety of dates rangingbetween about AD 600 and 1955 (i.e. the present),with no particular order in the section. Weinterpret all of these as having had a small to largecomponent of resident age prior to their incorpor-ation into the sediments exposed in our trenches.From this, we interpret the entire section from unit200 to the surface as being deposited during the
past 350 years or so. As this corresponds to thepart of the C-14 calibration curve that cannot beresolved without very precise ages, we did notpursue further dating of this section.
Evidence for earthquakes
There was evidence observed for two large surfaceruptures in nearly every trench that we excavatedacross the fault. In many of these, there were twodeposits of well-sorted fine sand that appear tohave been ejected out of the fault zone andderived from unit 200. In trench T-25 (Fig. 5), wedesignate the earlier of these ejecta deposits asunit 191. We also observed structural evidence fortwo surface ruptures, with faults and fracturesextending up to a specific stratigraphic level andthen being overlain by unfaulted deposits. We didnot construct detailed trench logs of most exposuresdue to the lack of time and because our focus formany of these trenches was to map out the extentof unit 200. Nevertheless, both T-6 and T-25record both of these events and are discussed herein.
Evidence from trench T-6. The fault in T-6 isnarrow, less than 0.5 m at the base of the trench.Within this fault zone, faulting has produced lique-faction, brittle faulting, tilting, fissures, and anarrow trough into which sediment accumulated.The interpreted event horizons for each of thesephenomena are coincident and correspond to thebase of unit 190 and the base of unit 150.
In T-6E (east wall of trench T-6), fracturesextend to the base of unit 190 and are overlain bywell-bedded stratigraphy of units 160–190. Withinthe fault zone, a massive, well-sorted fine sandthat is clearly affected by liquefaction is likelyderived from unit 200, or possibly another sandbelow the base of the trench. This liquefactionsand is also overlain by unit 190 along bothmargins of the fault zone in this exposure. Finally,along the northern edge of the fault zone, a narrowdepression is filled by finely laminated stratigraphyof units 160–190. We interpret the depression to beformed as a direct result of surface rupture.
The most recent event, 1912, is represented byrupture and liquefaction of units 190 up through160 to the base of unit 150, and tilting of theseunits within the fault zone. Units 110 to 150 accum-mulated within a trough along the fault and aredraped across the scarp. Unit 50 largely fillsagainst the scarp, and units 10–30 were depositedafter the scarp had been completely buried.
Evidence from trench T-25. East of the highway, weconstructed detailed logs of the fault zone in trenchT-25 to further constrain the timing and number ofevents that post-date the unit 200 sand. It should
NORTH ANATOLIAN FAULT 39
be noted that the earlier study by Rockwell et al.(2001) also found evidence for only two surface rup-tures after deposition of their Unit 3, which is iden-tical to unit 200 described herein. Trench T-25 lieswithin 10 m of Rockwell et al.’s (2001) trench T-1.
In the east wall of T-25, the northernmost frac-tures extend up through unit 200 and are overlainby another clean sand (unit 191) that we interpretas ejecta derived from unit 200. Massive cleansand fills the main fault and is also interpreted tobe the result of liquefaction of unit 200. Overlyingunit 191 is a sequence of bedded silt and sandunits (units 160 to 190) that are not faulted by thenorthernmost strand of the zone. These observationsall indicate a surface rupture that occurred when unit200 was at the surface in this area.
Another set of fractures displaces all units upthrough 160, including unit 191 (liquefaction sandfrom the penultimate event). Chunks of bedded stra-tigraphy, composed of units 160 to 190, lie floatingwithin the fault zone in a massive, fine sand matrixthat we interpret as the result of re-liquefaction ofthe unit 200 sand. Unit 155a fills the trough in thefault zone and appears to be derived from unit160, whereas unit 155b is a well-sorted sand thatis identical to the unit 200 sand, has the form of asand-blow, and is likely a second ejecta unit associ-ated with the 1912 earthquake. All of these depositsare overlain by undeformed strata of units 100 to130, which fill against the scarp, and units 10 to50, which bury the scarp. The apparent scarp atthe surface is evidently man-made.
The above observations indicate that there aretwo surface ruptures preserved in the stratigraphy,one at the contact at the base of unit 190 and onebetween deposition of units 130 and 155. Theseare identical to the relationships determined intrench T6 and we interpret these to be the sametwo events. Thus, at these and all other exposuresthat we examined in our field exercise, we noted evi-dence for two ruptures that produced liquefaction,surface faulting, and consequent sedimentationalong the fault. Both of these events must haveoccurred after deposition of the channel sand ofunit 200, or after AD 1655. The only two largeevents that may be ascribed to these surface rupturesare the large regional events of August 1766 andAugust 1912 (Ambraseys & Finkel 1987a, b,1995; Ambraseys 2002a; Rockwell et al. 2001).Thus, we attribute lateral slip on unit 200 to be thecumulative result of these two earthquakes.
Determination of lateral slip
The channelized nature of unit 200 is ideal forresolving cumulative slip for the two events thatpost-date its deposition. From the aerial photo-graphic analysis, it appeared that the palaeochannel
containing unit 200 flowed at a high angle to thefault. We chose the area west of the highway toconduct the detailed 3D portion of this studybecause the area is devoid of agriculture and wewere unrestricted in our ability to excavate longtrenches both across and parallel to the fault zone.
In the preliminary excavations, such as trenchT-6, we were not certain of the areal distributionof the unit 200 sand, so we began fault-parallel exca-vations to determine its extent. In all, we excavated19 trenches and trench extensions to resolve thegeometry of the unit 200 deposit. All exposureswere surveyed with a Wild TC 2000 total stationto provide accuracy. Further, a surveyed string linewas emplaced in all trenches at the same elevationto assure accurate measurement of the sand thick-ness and the relative elevations of its top and base.We took over 1500 detailed measurements on thethickness of the sand, including the exact locationsof the pinch-outs, to construct an isopach map ofits distribution (Fig. 6).
Unit 200 is much thicker on the south side ofthe fault than on the north. We take this to indicatethat a low scarp was present at the time the channelflowed across the fault. North of the fault, the sand isconfined to a narrow channel and never exceeds20 cm in thickness. The channel slopes to thesouth, towards the fault, and then thickens to over40 cm where it crosses the fault. The overall formis that of an alluvial overflow fan, and we interpretthe channel to have splayed at and beyond thefault scarp, resulting in deposition of the main fanon the south side. The fan is deflected downstream,towards the coast to the west, and its true SE sideonly extends south of the fault for 5–10 m. Asseen in trench T-6, the fan has a convex-up profilein cross-section and is multi-lobed. The apex ofthe fan is exposed in trench T-15, and the fanrapidly thins to the east and pinches out in trenchesT-8 and T-15. To the west, the fan is bounded on thenorth by the fault for a distance of about 30–35 m,and then the edge of the fan crosses the fault with10–15 cm of deposition north of the fault. In thevicinity of T-6 and the area of the feeder channel,unit 200 is thickest away from the fault except atthe fan apex.
We reconstruct the fan apex with the deepestportion of the feeder channel to resolve about 9 mof lateral slip (Fig. 7). A secondary smaller channelc. 8 m west of the main channel also reconstructsto a secondary fan apex, and the margins of the fanto the east of the feeder channel all realign. Further-more, the thickest portion of the fan that pondedadjacent to the fault west of T-6 realigns to thethinner section of sand that spilled across the faultto the north, although this latter match is nottightly constrained. The uncertainty in the 9 mestimate is on the order of about 1 m, based on the
T. ROCKWELL ET AL.40

realignments and their mismatches if the reconstruc-tion is less than 8 m or greater than 10 m. We takethis 9 + 1 m value as the cumulative slip producedby both the 1766 and 1912 earthquakes. If eachearthquake produced similar slip at this site, thenthe c. 4–5 m of presumed slip agrees well with theestimated 1912 slip measured by Altunel et al.(2004) and Altınok et al. (2003) along the centraland eastern onshore portions of the Ganos faultbased on deflected roads and field boundaries, withtheir measurements located 15 to 50 km east of ourstudy site. It is also similar to the average valuesfor many of the large earthquakes that have rupturedthe North Anatolia fault this century, and is consist-ent with the amount of slip predicted by Ambraseys& Finkel (1987a) for the 1912 earthquake, based onits inferred magnitude of about M7.4.
Timing of the past four events
The 1912 and 1766 earthquakes almost certainlyproduced the last two recognized surface rupturesin the Saros area. In our earlier study, we recognized
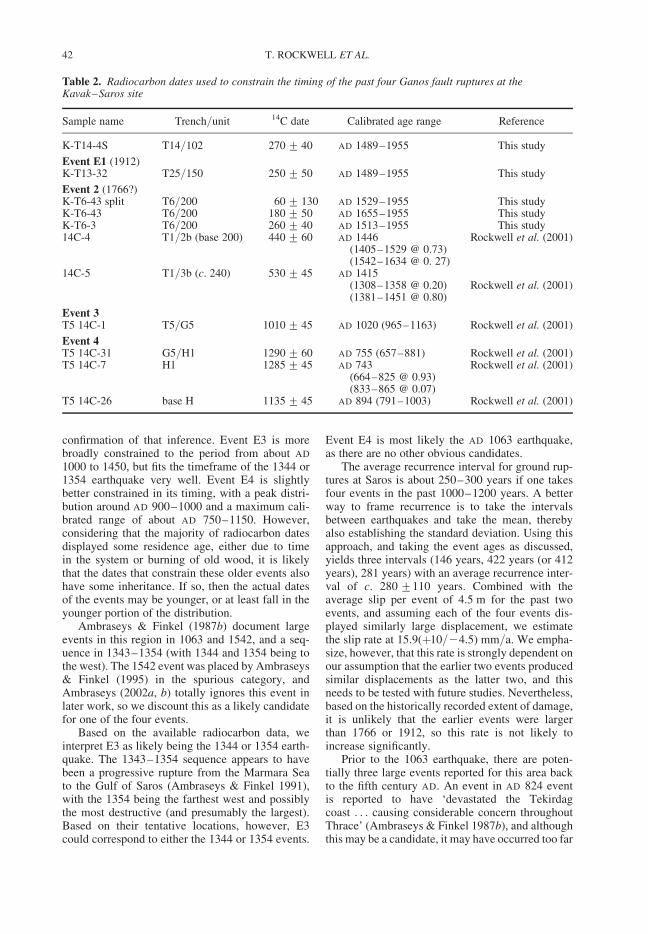
evidence for two additional ruptures, but we did nothave sufficient radiometric data to constrain theirtiming (Rockwell et al. 2001). In this paper, wecombine all of the radiocarbon data and eventevidence from both studies to better constrain thetiming of the rupture history for the past 1000years or so. For this task, we first compiled theradiocarbon dates from each trench that constrainthe timing of the past four recognized events.There are clearly some dates that have substantialresidency or inheritance, likely due to the burningof old wood. We therefore take only the datesfrom each section that did not result in stratigraphi-cally inverted radiocarbon dates (Table 2).
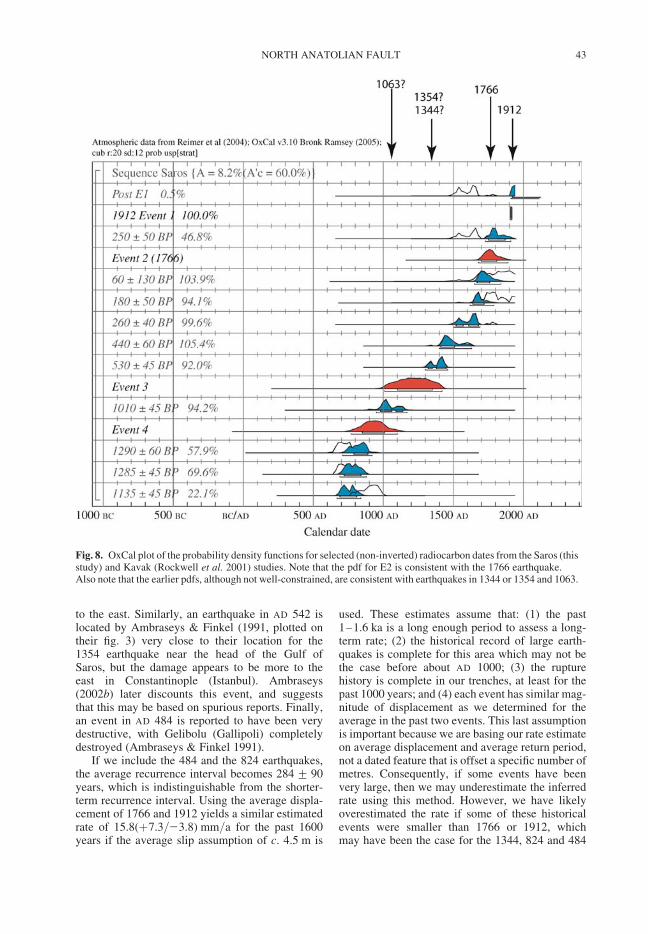
We placed the radiocarbon dates in Table 2 instratigraphic sequence in OxCal (Ramsey 2000)and analysed them for the inferred ages of the fourevents. Using 1912 as the most recent event andentering this as a calendar date in OxCal, the otherthree events are plotted as probability densityfunctions (pdfs) of the likely age range at 2s(Fig. 8). Event E2 plots in the appropriate timeframefor the 1766 earthquake, which we take as a
Fig. 7. Reconstruction of the fan apex with the thalweg of the feeder channel. Slip estimated at about 9 m, with about1 m of uncertainty. Note that the eastern margin of the fan complex, along with a secondary feeder channel in T-14,also all realign with 9 m of reconstruction.
NORTH ANATOLIAN FAULT 41
confirmation of that inference. Event E3 is morebroadly constrained to the period from about AD
1000 to 1450, but fits the timeframe of the 1344 or1354 earthquake very well. Event E4 is slightlybetter constrained in its timing, with a peak distri-bution around AD 900–1000 and a maximum cali-brated range of about AD 750–1150. However,considering that the majority of radiocarbon datesdisplayed some residence age, either due to timein the system or burning of old wood, it is likelythat the dates that constrain these older events alsohave some inheritance. If so, then the actual datesof the events may be younger, or at least fall in theyounger portion of the distribution.
Ambraseys & Finkel (1987b) document largeevents in this region in 1063 and 1542, and a seq-uence in 1343–1354 (with 1344 and 1354 being tothe west). The 1542 event was placed by Ambraseys& Finkel (1995) in the spurious category, andAmbraseys (2002a, b) totally ignores this event inlater work, so we discount this as a likely candidatefor one of the four events.
Based on the available radiocarbon data, weinterpret E3 as likely being the 1344 or 1354 earth-quake. The 1343–1354 sequence appears to havebeen a progressive rupture from the Marmara Seato the Gulf of Saros (Ambraseys & Finkel 1991),with the 1354 being the farthest west and possiblythe most destructive (and presumably the largest).Based on their tentative locations, however, E3could correspond to either the 1344 or 1354 events.
Event E4 is most likely the AD 1063 earthquake,as there are no other obvious candidates.
The average recurrence interval for ground rup-tures at Saros is about 250–300 years if one takesfour events in the past 1000–1200 years. A betterway to frame recurrence is to take the intervalsbetween earthquakes and take the mean, therebyalso establishing the standard deviation. Using thisapproach, and taking the event ages as discussed,yields three intervals (146 years, 422 years (or 412years), 281 years) with an average recurrence inter-val of c. 280 +110 years. Combined with theaverage slip per event of 4.5 m for the past twoevents, and assuming each of the four events dis-played similarly large displacement, we estimatethe slip rate at 15.9(þ10/24.5) mm/a. We empha-size, however, that this rate is strongly dependent onour assumption that the earlier two events producedsimilar displacements as the latter two, and thisneeds to be tested with future studies. Nevertheless,based on the historically recorded extent of damage,it is unlikely that the earlier events were largerthan 1766 or 1912, so this rate is not likely toincrease significantly.
Prior to the 1063 earthquake, there are poten-tially three large events reported for this area backto the fifth century AD. An event in AD 824 eventis reported to have ‘devastated the Tekirdagcoast . . . causing considerable concern throughoutThrace’ (Ambraseys & Finkel 1987b), and althoughthis may be a candidate, it may have occurred too far
Table 2. Radiocarbon dates used to constrain the timing of the past four Ganos fault ruptures at theKavak–Saros site
Sample name Trench/unit 14C date Calibrated age range Reference
K-T14-4S T14/102 270 + 40 AD 1489–1955 This study
Event E1 (1912)K-T13-32 T25/150 250 + 50 AD 1489–1955 This study
Event 2 (1766?)K-T6-43 split T6/200 60 + 130 AD 1529–1955 This studyK-T6-43 T6/200 180 + 50 AD 1655–1955 This studyK-T6-3 T6/200 260 + 40 AD 1513–1955 This study14C-4 T1/2b (base 200) 440 + 60 AD 1446 Rockwell et al. (2001)
(1405–1529 @ 0.73)(1542–1634 @ 0. 27)
14C-5 T1/3b (c. 240) 530 + 45 AD 1415(1308–1358 @ 0.20) Rockwell et al. (2001)(1381–1451 @ 0.80)
Event 3T5 14C-1 T5/G5 1010 + 45 AD 1020 (965–1163) Rockwell et al. (2001)
Event 4T5 14C-31 G5/H1 1290 + 60 AD 755 (657–881) Rockwell et al. (2001)T5 14C-7 H1 1285 + 45 AD 743 Rockwell et al. (2001)
(664–825 @ 0.93)(833–865 @ 0.07)
T5 14C-26 base H 1135 + 45 AD 894 (791–1003) Rockwell et al. (2001)
T. ROCKWELL ET AL.42
to the east. Similarly, an earthquake in AD 542 islocated by Ambraseys & Finkel (1991, plotted ontheir fig. 3) very close to their location for the1354 earthquake near the head of the Gulf ofSaros, but the damage appears to be more to theeast in Constantinople (Istanbul). Ambraseys(2002b) later discounts this event, and suggeststhat this may be based on spurious reports. Finally,an event in AD 484 is reported to have been verydestructive, with Gelibolu (Gallipoli) completelydestroyed (Ambraseys & Finkel 1991).
If we include the 484 and the 824 earthquakes,the average recurrence interval becomes 284 + 90years, which is indistinguishable from the shorter-term recurrence interval. Using the average displa-cement of 1766 and 1912 yields a similar estimatedrate of 15.8(þ7.3/23.8) mm/a for the past 1600years if the average slip assumption of c. 4.5 m is
used. These estimates assume that: (1) the past1–1.6 ka is a long enough period to assess a long-term rate; (2) the historical record of large earth-quakes is complete for this area which may not bethe case before about AD 1000; (3) the rupturehistory is complete in our trenches, at least for thepast 1000 years; and (4) each event has similar mag-nitude of displacement as we determined for theaverage in the past two events. This last assumptionis important because we are basing our rate estimateon average displacement and average return period,not a dated feature that is offset a specific number ofmetres. Consequently, if some events have beenvery large, then we may underestimate the inferredrate using this method. However, we have likelyoverestimated the rate if some of these historicalevents were smaller than 1766 or 1912, whichmay have been the case for the 1344, 824 and 484
Fig. 8. OxCal plot of the probability density functions for selected (non-inverted) radiocarbon dates from the Saros (thisstudy) and Kavak (Rockwell et al. 2001) studies. Note that the pdf for E2 is consistent with the 1766 earthquake.Also note that the earlier pdfs, although not well-constrained, are consistent with earthquakes in 1344 or 1354 and 1063.
NORTH ANATOLIAN FAULT 43
events. It is noteworthy that this rate is below thec. 24 mm/a (and possibly as high as 26–28 mm/a)measured by GPS for the NAF (McClusky et al.2000; Reilinger et al. 2006), although the higherrate is allowed at the uppermost range of our esti-mate from the palaeoseismic data.
Palaeoseismology of the Izmit
to Sapanca segment
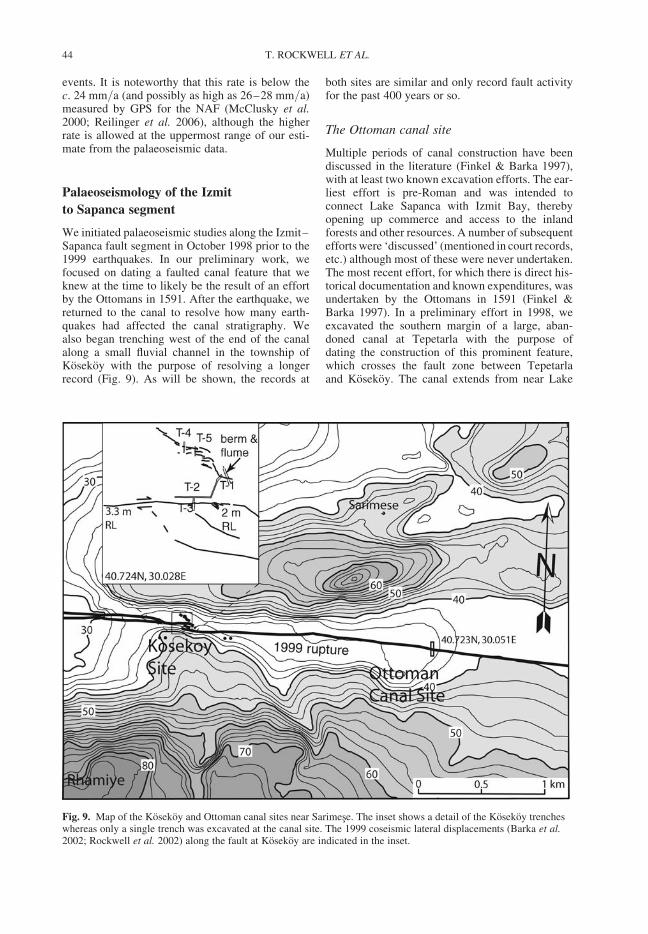
We initiated palaeoseismic studies along the Izmit–Sapanca fault segment in October 1998 prior to the1999 earthquakes. In our preliminary work, wefocused on dating a faulted canal feature that weknew at the time to likely be the result of an effortby the Ottomans in 1591. After the earthquake, wereturned to the canal to resolve how many earth-quakes had affected the canal stratigraphy. Wealso began trenching west of the end of the canalalong a small fluvial channel in the township ofKosekoy with the purpose of resolving a longerrecord (Fig. 9). As will be shown, the records at
both sites are similar and only record fault activityfor the past 400 years or so.
The Ottoman canal site
Multiple periods of canal construction have beendiscussed in the literature (Finkel & Barka 1997),with at least two known excavation efforts. The ear-liest effort is pre-Roman and was intended toconnect Lake Sapanca with Izmit Bay, therebyopening up commerce and access to the inlandforests and other resources. A number of subsequentefforts were ‘discussed’ (mentioned in court records,etc.) although most of these were never undertaken.The most recent effort, for which there is direct his-torical documentation and known expenditures, wasundertaken by the Ottomans in 1591 (Finkel &Barka 1997). In a preliminary effort in 1998, weexcavated the southern margin of a large, aban-doned canal at Tepetarla with the purpose ofdating the construction of this prominent feature,which crosses the fault zone between Tepetarlaand Kosekoy. The canal extends from near Lake
Fig. 9. Map of the Kosekoy and Ottoman canal sites near Sarimese. The inset shows a detail of the Kosekoy trencheswhereas only a single trench was excavated at the canal site. The 1999 coseismic lateral displacements (Barka et al.2002; Rockwell et al. 2002) along the fault at Kosekoy are indicated in the inset.
T. ROCKWELL ET AL.44

Sapanca westward about half of the distance to IzmitBay, consistent with historical accounts for the 1591effort. The purpose of our initial trench was toresolve whether this was the Ottoman effort of1591 or an earlier canal effort.
We found numerous pieces of small to large det-rital charcoal, some that were associated with burnzones, that we interpret to represent cooking firesor fires to boil water for tea (as is a common practicetoday in Turkey). We collected eight large samplesand dated four of the samples to place maximumages on the berm construction, and therefore thecanal excavation project. In that it is likely that theworkers burned dead wood for their fires, and asthere are numerous large trees in the area today,we surmise that all of the samples are likely olderthan the actual age of the berm. As it turns out, theages of the detrital charcoal pieces range from amaximum age of 112 BC to as young as AD 1402(Table 1). We therefore infer the berm and canalconstruction to post-date the youngest fourteenthcentury date, and to be the effort funded by theOttomans in 1591. Thus, all of the alluvial fillwithin the canal must date to younger than 1591
so we did not attempt further C-14 dating in thecanal fill.
In the summer of 2000, we excavated a trenchacross the 1999 rupture west of Lake Sapanca wherethe fault is entirely contained within the canal fill(Figs 1 and 9). The trench site was chosen about2 m west of a small several-metre-long open exten-sional fissure resulting from a c. 2 m-wide releasingstep-over. The trench exposed predominantly fine-grained, bedded clay-rich canal fill, although a dis-tinctive sand was found to fill a fissure zone withinthe fault zone, apparently resulting from a priorrupture (Fig. 10). The fault zone is approximately3 m wide in the trench, although the 1999 rupturezone is narrower.
The stratigraphy was differentiated into nineunits, with the topmost and youngest unit (unit 1)interpreted as a plough pan. Unit 1 is a massive,organic-rich silty clay, similar in texture to severalof the underlying strata. Unit 2, which is beddedand further subdivided into several subunits, is inpart an alluvial fill within the fault zone. Unit 2a isa fine silty sand that is only present north of the1999 rupture trace. Unit 2b is clayey silt that fills a
Fig. 10. Trench log of the Ottoman canal site near Tepetarla. The 1999 rupture produced slip in a narrow zone, withminor cracking over a 2 m width. All deposits exposed in the trench post-date the excavation age of the canal inAD 1591.
NORTH ANATOLIAN FAULT 45
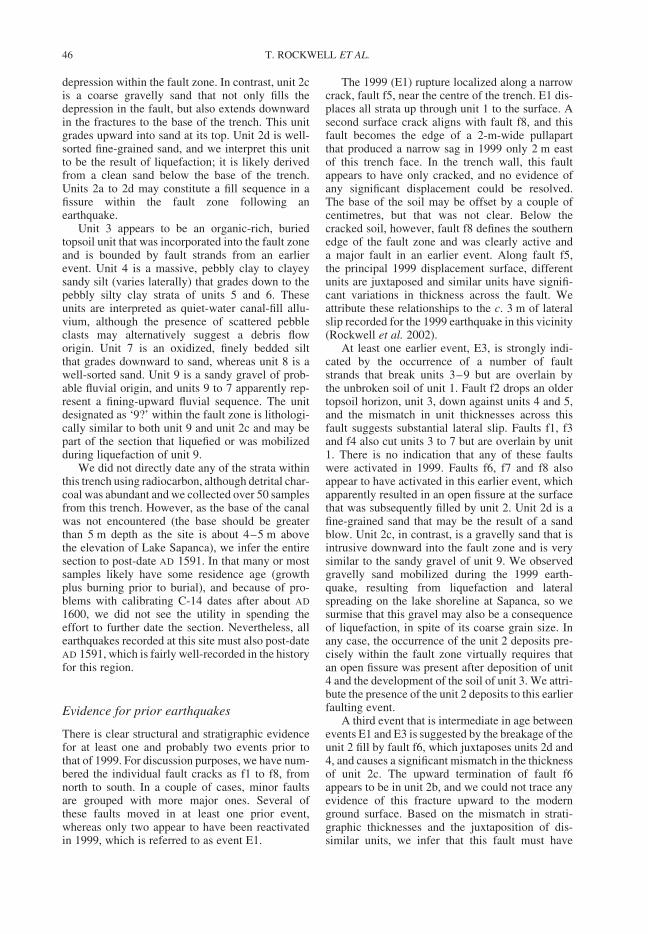
depression within the fault zone. In contrast, unit 2cis a coarse gravelly sand that not only fills thedepression in the fault, but also extends downwardin the fractures to the base of the trench. This unitgrades upward into sand at its top. Unit 2d is well-sorted fine-grained sand, and we interpret this unitto be the result of liquefaction; it is likely derivedfrom a clean sand below the base of the trench.Units 2a to 2d may constitute a fill sequence in afissure within the fault zone following anearthquake.
Unit 3 appears to be an organic-rich, buriedtopsoil unit that was incorporated into the fault zoneand is bounded by fault strands from an earlierevent. Unit 4 is a massive, pebbly clay to clayeysandy silt (varies laterally) that grades down to thepebbly silty clay strata of units 5 and 6. Theseunits are interpreted as quiet-water canal-fill allu-vium, although the presence of scattered pebbleclasts may alternatively suggest a debris floworigin. Unit 7 is an oxidized, finely bedded siltthat grades downward to sand, whereas unit 8 is awell-sorted sand. Unit 9 is a sandy gravel of prob-able fluvial origin, and units 9 to 7 apparently rep-resent a fining-upward fluvial sequence. The unitdesignated as ‘9?’ within the fault zone is lithologi-cally similar to both unit 9 and unit 2c and may bepart of the section that liquefied or was mobilizedduring liquefaction of unit 9.
We did not directly date any of the strata withinthis trench using radiocarbon, although detrital char-coal was abundant and we collected over 50 samplesfrom this trench. However, as the base of the canalwas not encountered (the base should be greaterthan 5 m depth as the site is about 4–5 m abovethe elevation of Lake Sapanca), we infer the entiresection to post-date AD 1591. In that many or mostsamples likely have some residence age (growthplus burning prior to burial), and because of pro-blems with calibrating C-14 dates after about AD
1600, we did not see the utility in spending theeffort to further date the section. Nevertheless, allearthquakes recorded at this site must also post-dateAD 1591, which is fairly well-recorded in the historyfor this region.
Evidence for prior earthquakes
There is clear structural and stratigraphic evidencefor at least one and probably two events prior tothat of 1999. For discussion purposes, we have num-bered the individual fault cracks as f1 to f8, fromnorth to south. In a couple of cases, minor faultsare grouped with more major ones. Several ofthese faults moved in at least one prior event,whereas only two appear to have been reactivatedin 1999, which is referred to as event E1.
The 1999 (E1) rupture localized along a narrowcrack, fault f5, near the centre of the trench. E1 dis-places all strata up through unit 1 to the surface. Asecond surface crack aligns with fault f8, and thisfault becomes the edge of a 2-m-wide pullapartthat produced a narrow sag in 1999 only 2 m eastof this trench face. In the trench wall, this faultappears to have only cracked, and no evidence ofany significant displacement could be resolved.The base of the soil may be offset by a couple ofcentimetres, but that was not clear. Below thecracked soil, however, fault f8 defines the southernedge of the fault zone and was clearly active anda major fault in an earlier event. Along fault f5,the principal 1999 displacement surface, differentunits are juxtaposed and similar units have signifi-cant variations in thickness across the fault. Weattribute these relationships to the c. 3 m of lateralslip recorded for the 1999 earthquake in this vicinity(Rockwell et al. 2002).
At least one earlier event, E3, is strongly indi-cated by the occurrence of a number of faultstrands that break units 3–9 but are overlain bythe unbroken soil of unit 1. Fault f2 drops an oldertopsoil horizon, unit 3, down against units 4 and 5,and the mismatch in unit thicknesses across thisfault suggests substantial lateral slip. Faults f1, f3and f4 also cut units 3 to 7 but are overlain by unit1. There is no indication that any of these faultswere activated in 1999. Faults f6, f7 and f8 alsoappear to have activated in this earlier event, whichapparently resulted in an open fissure at the surfacethat was subsequently filled by unit 2. Unit 2d is afine-grained sand that may be the result of a sandblow. Unit 2c, in contrast, is a gravelly sand that isintrusive downward into the fault zone and is verysimilar to the sandy gravel of unit 9. We observedgravelly sand mobilized during the 1999 earth-quake, resulting from liquefaction and lateralspreading on the lake shoreline at Sapanca, so wesurmise that this gravel may also be a consequenceof liquefaction, in spite of its coarse grain size. Inany case, the occurrence of the unit 2 deposits pre-cisely within the fault zone virtually requires thatan open fissure was present after deposition of unit4 and the development of the soil of unit 3. We attri-bute the presence of the unit 2 deposits to this earlierfaulting event.
A third event that is intermediate in age betweenevents E1 and E3 is suggested by the breakage of theunit 2 fill by fault f6, which juxtaposes units 2d and4, and causes a significant mismatch in the thicknessof unit 2c. The upward termination of fault f6appears to be in unit 2b, and we could not trace anyevidence of this fracture upward to the modernground surface. Based on the mismatch in strati-graphic thicknesses and the juxtaposition of dis-similar units, we infer that this fault must have
T. ROCKWELL ET AL.46
significant lateral slip. The problem with a surfacerupture interpretation at this stratigraphic level isthat unit 2b apparently fills the depression left byevent E3 and it is difficult to believe that thedepression lasted for too long after the surfacerupture. Thus, event E2 must have either occurredsoon after event E3 or the site was closed to signifi-cant deposition for some extended period of timeafter event E3, which is possible considering thesite’s presence within the canal.
An alternative explanation is that fault f6 defor-mation is absorbed in the fine-grained fill of units2b and 1 and that this fault was activated in 1999.Support for this idea is weak, but is based on theinference that unit 2b is only slightly younger inage than unit 2c, which appears to have directlyresulted from the earlier event. However, the evi-dence for lateral slip along fault f6 is strong andwould require a significant amount of strain beingabsorbed in unit 2b.
A third possibility is that unit 2c is a fluvialdeposit that filled/eroded along the fault afterevent E3 and was faulted by both faults f6 and f7during event E2. This possibility might be moreattractive than the first explanation because it wouldpermit more time between events E3 and E2. Thefissuring of unit 2c downward into the fault couldbe explained by this mechanism and thereforewould not require liquefaction of the sandy gravelof unit 2c.
We attribute event E3 to the large event of 1719that had descriptions of damage that closely parallelthose of 1999. It is the first large event after 1591for this area and was apparently as large as 1999(Ambraseys & Finkel 1995), consistent with thetrench observations that indicate event E3 was amajor surface rupture. Considering the case thatevent E2 occurred soon after E3, we attribute thatdeformation to either afterslip or possibly the 1754earthquake, which is known to have produceddamage in this region but for which the source isunknown. Later earthquakes, such as 1878 or1894, appear to have occurred too long after eventE3, and the surface soil of unit 1 would almost cer-tainly have developed by that time.
The Kosekoy site
The Kosekoy site lies along a section of rupture inthe SE corner of the township of Kosekoy (Fig. 9),SE of Izmit and west of the end of the Ottomancanal. Rupture in this area in 1999 included about2 m of slip along the primary fault strand, and sec-ondary rupture along faults that splay off to thenorth from the main strand. The site is also in anarea where the fault makes a small releasing step-over, and a strand to the south of our trenchbecomes the main strand farther east (Fig. 9).
Rockwell et al. (2002) report offsets of surveyedtrees adjacent to this site to be on the order of1.8–2.25 m, consistent with slip values reportedfrom rupture mapping after the earthquake (Barkaet al. 2002). To both the east and west of theKosekoy area, slip along the Izmit–Sapanca rupturesegment generally exceeded 3 m in 1999, and slipvalues as high as 3.8 m based on surveyed datawere reported by Rockwell et al. (2002). We inter-pret this to mean that slip is distributed across mul-tiple strands in the Kosekoy area. We chose this sitein part because the secondary faulting could bedemonstrated to be principally dip-slip, making rec-ognition and reconstructions of past earthquakeseasier. Furthermore, palaeoearthquakes are oftenmore easily recognized where multiple fault splaysare present, as some secondary faults may rupturein only one or two events. Finally, part of ourgroup conducted radar profiles at this site and ident-ified a buried palaeochannel that is apparently right-laterally offset about 6.6 m, roughly three times the1999 slip (Ferry et al. 2004).
We excavated five trenches at this site (Fig. 9),with only trench T-3 crossing the main, northernstrand of the fault. The active drainage generallyruns parallel to the fault zone and lies immediatelysouth of the end of trench 3 by about 2 m. Hence,we could not extend this trench to cross the southernmain strand, which had lost most of its slip in thisarea. Trench T-1 was excavated across a purelydip-slip fault that experienced about 60 cm of slipin 1999. A nearby small berm and associated con-crete flume displayed no evidence of lateral slip(Fig. 9), thereby confirming the normal slip infer-ence for the fault in trench T-1. Thus, no out-of-plane transfer of sediments is expected in thesediments of trench T-1 and past events should berecognized by their dip separations.
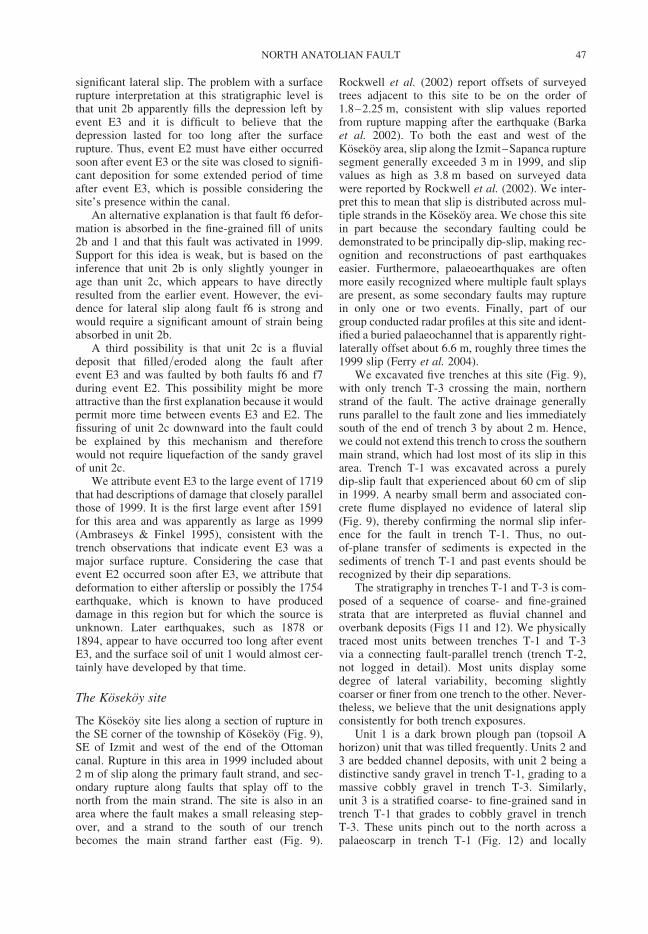
The stratigraphy in trenches T-1 and T-3 is com-posed of a sequence of coarse- and fine-grainedstrata that are interpreted as fluvial channel andoverbank deposits (Figs 11 and 12). We physicallytraced most units between trenches T-1 and T-3via a connecting fault-parallel trench (trench T-2,not logged in detail). Most units display somedegree of lateral variability, becoming slightlycoarser or finer from one trench to the other. Never-theless, we believe that the unit designations applyconsistently for both trench exposures.
Unit 1 is a dark brown plough pan (topsoil Ahorizon) unit that was tilled frequently. Units 2 and3 are bedded channel deposits, with unit 2 being adistinctive sandy gravel in trench T-1, grading to amassive cobbly gravel in trench T-3. Similarly,unit 3 is a stratified coarse- to fine-grained sand intrench T-1 that grades to cobbly gravel in trenchT-3. These units pinch out to the north across apalaeoscarp in trench T-1 (Fig. 12) and locally
NORTH ANATOLIAN FAULT 47
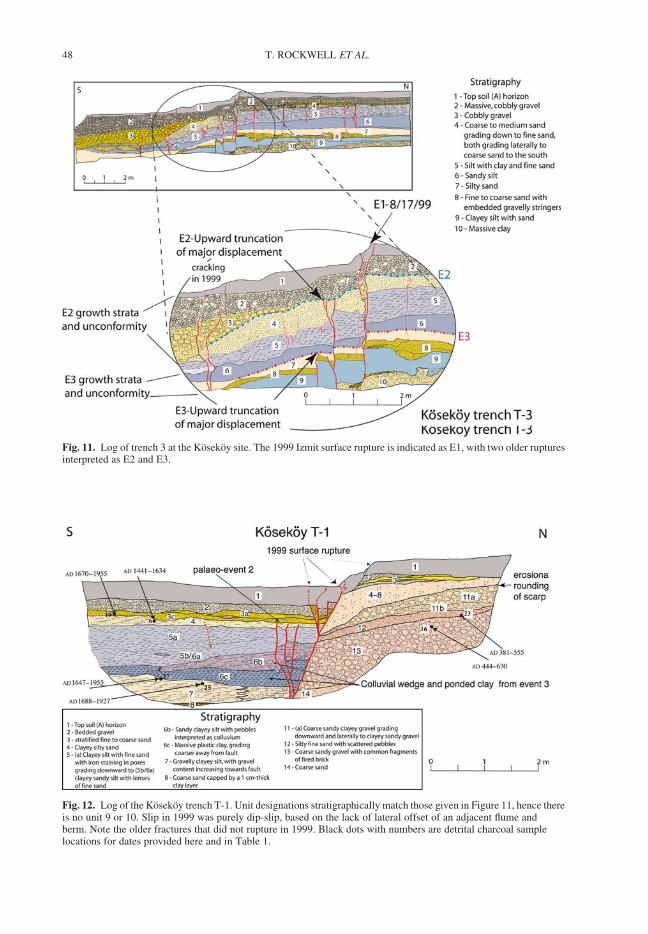
Fig. 11. Log of trench 3 at the Kosekoy site. The 1999 Izmit surface rupture is indicated as E1, with two older rupturesinterpreted as E2 and E3.
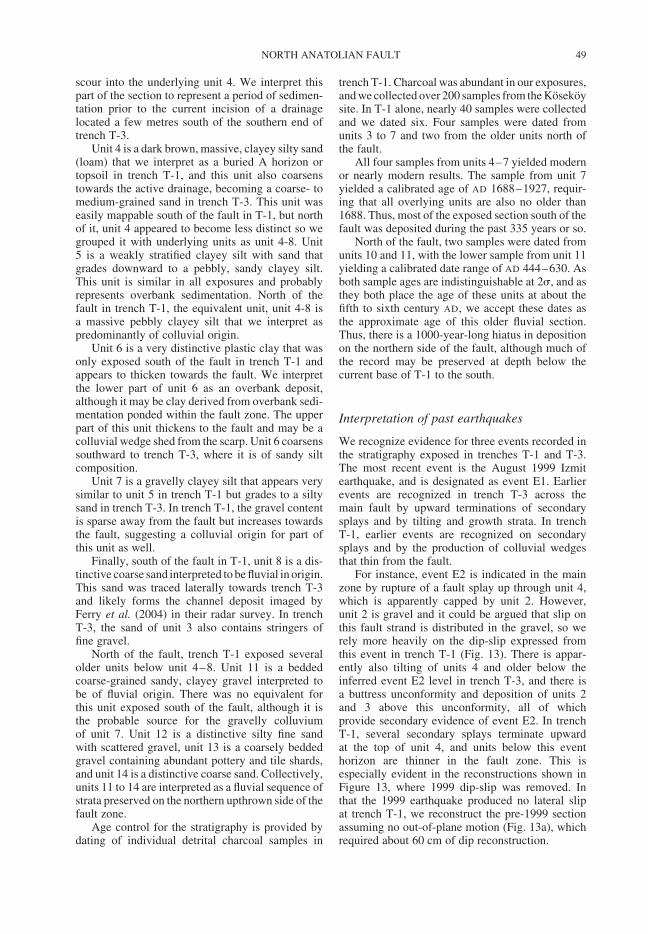
Fig. 12. Log of the Kosekoy trench T-1. Unit designations stratigraphically match those given in Figure 11, hence thereis no unit 9 or 10. Slip in 1999 was purely dip-slip, based on the lack of lateral offset of an adjacent flume andberm. Note the older fractures that did not rupture in 1999. Black dots with numbers are detrital charcoal samplelocations for dates provided here and in Table 1.
T. ROCKWELL ET AL.48
scour into the underlying unit 4. We interpret thispart of the section to represent a period of sedimen-tation prior to the current incision of a drainagelocated a few metres south of the southern end oftrench T-3.
Unit 4 is a dark brown, massive, clayey silty sand(loam) that we interpret as a buried A horizon ortopsoil in trench T-1, and this unit also coarsenstowards the active drainage, becoming a coarse- tomedium-grained sand in trench T-3. This unit waseasily mappable south of the fault in T-1, but northof it, unit 4 appeared to become less distinct so wegrouped it with underlying units as unit 4-8. Unit5 is a weakly stratified clayey silt with sand thatgrades downward to a pebbly, sandy clayey silt.This unit is similar in all exposures and probablyrepresents overbank sedimentation. North of thefault in trench T-1, the equivalent unit, unit 4-8 isa massive pebbly clayey silt that we interpret aspredominantly of colluvial origin.
Unit 6 is a very distinctive plastic clay that wasonly exposed south of the fault in trench T-1 andappears to thicken towards the fault. We interpretthe lower part of unit 6 as an overbank deposit,although it may be clay derived from overbank sedi-mentation ponded within the fault zone. The upperpart of this unit thickens to the fault and may be acolluvial wedge shed from the scarp. Unit 6 coarsenssouthward to trench T-3, where it is of sandy siltcomposition.
Unit 7 is a gravelly clayey silt that appears verysimilar to unit 5 in trench T-1 but grades to a siltysand in trench T-3. In trench T-1, the gravel contentis sparse away from the fault but increases towardsthe fault, suggesting a colluvial origin for part ofthis unit as well.
Finally, south of the fault in T-1, unit 8 is a dis-tinctive coarse sand interpreted to be fluvial in origin.This sand was traced laterally towards trench T-3and likely forms the channel deposit imaged byFerry et al. (2004) in their radar survey. In trenchT-3, the sand of unit 3 also contains stringers offine gravel.
North of the fault, trench T-1 exposed severalolder units below unit 4–8. Unit 11 is a beddedcoarse-grained sandy, clayey gravel interpreted tobe of fluvial origin. There was no equivalent forthis unit exposed south of the fault, although it isthe probable source for the gravelly colluviumof unit 7. Unit 12 is a distinctive silty fine sandwith scattered gravel, unit 13 is a coarsely beddedgravel containing abundant pottery and tile shards,and unit 14 is a distinctive coarse sand. Collectively,units 11 to 14 are interpreted as a fluvial sequence ofstrata preserved on the northern upthrown side of thefault zone.
Age control for the stratigraphy is provided bydating of individual detrital charcoal samples in
trench T-1. Charcoal was abundant in our exposures,and we collected over 200 samples from the Kosekoysite. In T-1 alone, nearly 40 samples were collectedand we dated six. Four samples were dated fromunits 3 to 7 and two from the older units north ofthe fault.
All four samples from units 4–7 yielded modernor nearly modern results. The sample from unit 7yielded a calibrated age of AD 1688–1927, requir-ing that all overlying units are also no older than1688. Thus, most of the exposed section south of thefault was deposited during the past 335 years or so.
North of the fault, two samples were dated fromunits 10 and 11, with the lower sample from unit 11yielding a calibrated date range of AD 444–630. Asboth sample ages are indistinguishable at 2s, and asthey both place the age of these units at about thefifth to sixth century AD, we accept these dates asthe approximate age of this older fluvial section.Thus, there is a 1000-year-long hiatus in depositionon the northern side of the fault, although much ofthe record may be preserved at depth below thecurrent base of T-1 to the south.
Interpretation of past earthquakes
We recognize evidence for three events recorded inthe stratigraphy exposed in trenches T-1 and T-3.The most recent event is the August 1999 Izmitearthquake, and is designated as event E1. Earlierevents are recognized in trench T-3 across themain fault by upward terminations of secondarysplays and by tilting and growth strata. In trenchT-1, earlier events are recognized on secondarysplays and by the production of colluvial wedgesthat thin from the fault.
For instance, event E2 is indicated in the mainzone by rupture of a fault splay up through unit 4,which is apparently capped by unit 2. However,unit 2 is gravel and it could be argued that slip onthis fault strand is distributed in the gravel, so werely more heavily on the dip-slip expressed fromthis event in trench T-1 (Fig. 13). There is appar-ently also tilting of units 4 and older below theinferred event E2 level in trench T-3, and there isa buttress unconformity and deposition of units 2and 3 above this unconformity, all of whichprovide secondary evidence of event E2. In trenchT-1, several secondary splays terminate upwardat the top of unit 4, and units below this eventhorizon are thinner in the fault zone. This isespecially evident in the reconstructions shown inFigure 13, where 1999 dip-slip was removed. Inthat the 1999 earthquake produced no lateral slipat trench T-1, we reconstruct the pre-1999 sectionassuming no out-of-plane motion (Fig. 13a), whichrequired about 60 cm of dip reconstruction.
NORTH ANATOLIAN FAULT 49
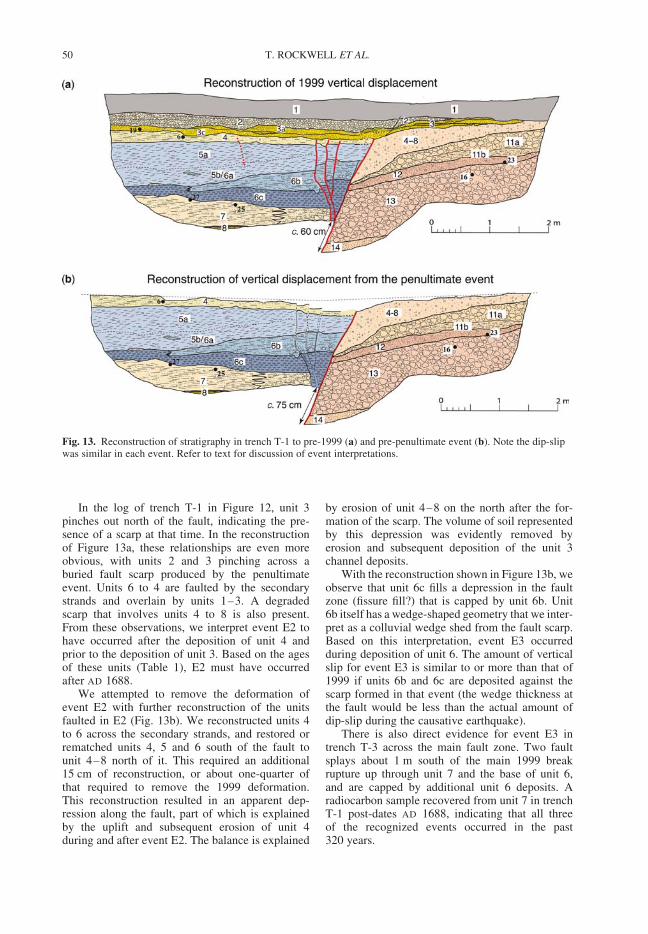
In the log of trench T-1 in Figure 12, unit 3pinches out north of the fault, indicating the pre-sence of a scarp at that time. In the reconstructionof Figure 13a, these relationships are even moreobvious, with units 2 and 3 pinching across aburied fault scarp produced by the penultimateevent. Units 6 to 4 are faulted by the secondarystrands and overlain by units 1–3. A degradedscarp that involves units 4 to 8 is also present.From these observations, we interpret event E2 tohave occurred after the deposition of unit 4 andprior to the deposition of unit 3. Based on the agesof these units (Table 1), E2 must have occurredafter AD 1688.
We attempted to remove the deformation ofevent E2 with further reconstruction of the unitsfaulted in E2 (Fig. 13b). We reconstructed units 4to 6 across the secondary strands, and restored orrematched units 4, 5 and 6 south of the fault tounit 4–8 north of it. This required an additional15 cm of reconstruction, or about one-quarter ofthat required to remove the 1999 deformation.This reconstruction resulted in an apparent dep-ression along the fault, part of which is explainedby the uplift and subsequent erosion of unit 4during and after event E2. The balance is explained
by erosion of unit 4–8 on the north after the for-mation of the scarp. The volume of soil representedby this depression was evidently removed byerosion and subsequent deposition of the unit 3channel deposits.
With the reconstruction shown in Figure 13b, weobserve that unit 6c fills a depression in the faultzone (fissure fill?) that is capped by unit 6b. Unit6b itself has a wedge-shaped geometry that we inter-pret as a colluvial wedge shed from the fault scarp.Based on this interpretation, event E3 occurredduring deposition of unit 6. The amount of verticalslip for event E3 is similar to or more than that of1999 if units 6b and 6c are deposited against thescarp formed in that event (the wedge thickness atthe fault would be less than the actual amount ofdip-slip during the causative earthquake).
There is also direct evidence for event E3 intrench T-3 across the main fault zone. Two faultsplays about 1 m south of the main 1999 breakrupture up through unit 7 and the base of unit 6,and are capped by additional unit 6 deposits. Aradiocarbon sample recovered from unit 7 in trenchT-1 post-dates AD 1688, indicating that all threeof the recognized events occurred in the past320 years.
Fig. 13. Reconstruction of stratigraphy in trench T-1 to pre-1999 (a) and pre-penultimate event (b). Note the dip-slipwas similar in each event. Refer to text for discussion of event interpretations.
T. ROCKWELL ET AL.50
Another observation that is consistent with theoccurrence of three events after deposition of unit8 is based on a radar survey conducted by Ferryet al. (2004). Prior to the trenching, they ran radarsurveys parallel to the 1999 rupture and imaged aburied channel on each side of the fault. North ofthe main rupture, we encountered this channel inour trench 2. South of the fault, the interpreted cor-relative channel is laterally displaced about 6.7–7.4 m westward. We attempted to trench to thedepth of the channel on the south side of the fault.However, saturated conditions and a collapsingtrench wall precluded a direct look at this depositsouth of the fault. If the radar correlation and esti-mate of slip is valid, approximately three times theamount of 1999 slip as occurred on the main rupturewould be required to restore the lateral offset ofthe unit 8 channel. This is consistent with our infer-ence that three events are required to explain all ofthe relationships observed in trench T-1, althoughnot all were necessarily the same size.
Event E1 is the 1999 Izmit rupture. Events E2and E3 must post-date 1688, and one is almost cer-tainly the large 1719 earthquake that had a verysimilar damage distribution to 1999 (Ambraseys &Finkel 1995). Considering that 1719 is only a fewdecades after the bounding radiocarbon control, itis most likely that E3 corresponds to the 1719surface rupture.
Our observations also suggest that vertical slipon the secondary normal fault in event E2 wassmaller than that of 1999, although this may notreflect the amount of lateral displacement on themain fault. It is also possible that this secondaryfault displays variable amounts of slip in each earth-quake, possibly as a consequence of rupture direc-tion. In any case, it is possible that event E2 wassmaller than 1719 or 1999, and is possibly either1754, 1878 or 1894. The 1754 source zone is notwell known but is reported to have produced moredamage in Istanbul (Ambraseys & Finkel 1995)than that which occurred in 1999. Damage from1719 was reported from Istanbul to Bolu, whereasdamage in 1754 was more strongly focused to thewest. From those observations, 1754 was eitherlarger or farther west than 1999. If the main shockof 1754 was in the Gulf of Izmit, as suggested byAmbraseys & Finkel (1991, 1995), then it is alsopossible that some slip propagated onto the Izmit–Sapanca segment that had ruptured only a fewdecades earlier. The 1878 event, in contrast, isbelieved to have occurred farther east than 1754based on damage reports, but there is also muchless known. Ambraseys & Finkel (1991) andAmbraseys (2000) report this as a locally destruc-tive event between Esme, Sapanca and Adapazarı,with damage extending to Akyazı, Izmit andBursa. Taken at face value, the damage zone is
considerably smaller than 1719 or 1754, althoughan east-directed rupture of smaller magnitude maybe consistent with the 1878 damage effects. How-ever, the damage zone for 1878 may be too smallto be consistent with a major surface-rupturingevent. In the final analysis, more historical reportson damage are needed to determine whether 1878is a viable candidate earthquake for event E2.
The M7.3 1894 earthquake is also suggested tohave ruptured from Sapanca to Izmit Bay based onhistorical reports of damage (Ambraseys 2001),and this earthquake would likely have resulted insurface rupture at both the Ottoman Canal andKosekoy sites if it indeed ruptured east of Izmit.(Klinger et al. 2003 did not see evidence for thisevent at their Golcuk trench site, however.)Ambraseys (2001) reports this as a large earthquakethat was only slightly smaller than 1999. If correct,and if event E2 corresponds to this earthquake, thenthe observed smaller vertical displacement associ-ated with E2 on the secondary strand probablyreflects inherent variability in vertical displacementassociated with secondary faults. Thus, there arethree plausible candidates for event E2 betweenIzmit and Sapanca, with the potential size rangingfrom relatively small (1878) to relatively large(1894).
The record is too short to develop a meaningfulslip rate at the Kosekoy site. Nevertheless, the returnperiod for large earthquakes in the past 350 yearsappears to be in the range of 140 years (1719,1754 or 1878 or 1894, and 1999). However, basedon the amount of displacement on the secondaryfault exposed in T-1 at Kosekoy, it is not clear ifall events have similar displacement at the Kosekoytrench site. In 1999, slip across the entire fault zonenear our Kosekoy trench site was measured fromoffset tree lines at c. 3–3.8 m (Rockwell et al.2002), although we only measured about 2 m onthe main strand at trench T-3. If Ferry et al. (2004)have correctly defined lateral displacement for allthree events, then each may have been large in theKosekoy area and a rate as high as c. 24 mm/ais estimated, which is close to the GPS rateof 24 + 1 mm/a (McClusky et al. 2000) to28 + 0.3 mm/a (Reilinger et al. 2006). Alterna-tively, if some events are smaller, such as suggestedby the vertical component of event E2, then thislikely represents a maximum rate for the past severalhundred years.
Discussion of results
There are three primary conclusions from our work.First, it appears that 7–9 m of slip has accrued onthe NAF both east and west of the Marmara Sea inthe past 300 years. During this period, only the
NORTH ANATOLIAN FAULT 51
April 1766 earthquake has released significant storedstrain in the central Marmara itself (Ambraseys &Jackson 2000), leading to the conclusion that theMarmara is ripe for a large earthquake, consistentwith interpretations by Parsons et al. (2000).Armijo et al. (2005) suggest that the 1912 earth-quake may have ruptured well eastward into theMarmara based on the freshness of scarps on thesea floor. However, it is not clear how long suchscarps can be preserved at the bottom of thesedeep basins and some of these may have survivedsince 1766. Further, the isoseisms for 1912 aremuch stronger to the west, with less damage atTekirdag (Fig. 1) than farther west. Damage obser-vations argue that either the 1912 rupture terminatedwell before the central Marmara or that the rupturepropagated westward, resulting in substantialdirectivity of energy and concentration of damageon the Gallipoli peninsula. In either case, thecentral Marmara segment closest to Istanbul hasapparently not failed since 1766 (or possibly 1509;Ambraseys & Jackson 2000), so hazard is highwhen the behaviour of adjacent segments isconsidered.
A second general observation is that the NAFslip rate over the past millennium is apparentlylower than that indicated by GPS west of theMarmara Sea. At Saros, we determined a returnperiod of about 283+113 years, which, whencombined with average displacement for the pasttwo surface ruptures (and assuming that thisaverage displacement is applicable for earlierevents), yields a millennial rate of c. 16 mm/a.Relienger et al. (2006) interpret GPS data to rep-resent 26–28 mm/a of loading in the Gallipolipeninsular region, which is considerably higherthan what has apparently been released in the pastthousand years or so. There are three obvious expla-nations for this apparent discrepancy. First, it islikely that we do not record the full amount ofdisplacement in our trenches. We determined 3Dslip at only one site whereas slip can vary sub-stantially along a rupture, as demonstrated byRockwell et al. (2002) for the 1999 Izmit earth-quake. In their study, they found an average of15% distributed near-field deformation representedby warping into the fault. As this deformationextends out for several metres in areas of deep allu-vium, and such is likely the case for the Saros studysite, we may have determined only the minimumaverage displacement for the 1912 and 1766 earth-quakes. Further, slip varies laterally along a ruptureby 20% or more over relatively short distances, sowe may have trenched in a low slip area. However,to increase displacement to that required to satisfythe GPS rate would require that the average displa-cement per event increase to about 6.7 m. Althoughthis is possible, Altunel et al. (2004) suggest that
the average far-field value for the 1912 surfacerupture is closer to 4–5 m, consistent with ourtrench results.
For a similar length of record, Klinger et al.(2003) studied the rupture history of the NAF atGolcuk, where they determined that the fault hadruptured only three times since the fifteenth century.They attributed the surface ruptures described intheir trenches to the large events of 1509, 1719and 1999, which suggests a return period for largeearthquakes for that segment of the NAF of about250 years. Maximum slip at Golcuk in 1999 wasabout 4.5–5 m (Barka et al. 2002), which whencombined with the return period, suggests a short-term rate of 18–20 mm/a. Farther east, along the1944 rupture, Okumura et al. (2004), Rockwellet al. (2004) and Kondo et al. (2004) have deter-mined about 25 m of slip for the past 1500 years,which also yields a rate of c. 16 mm/a. In summary,the NAF appears to have a surface slip rate for thepast 500–1200 years, and possibly longer, that issignificantly lower than that interpreted from GPSdata, and this observation appears to be true botheast and west of the Marmara Sea. It is possiblethat the past 1000 to 1500 years is too short an inter-val to assess the rate, and that strain release is vari-able over the several-thousand-year timeframe. Inthis scenario, the past thousand years have simplyseen a relative lull in seismic slip. Alternatively,the GPS rate may be too high, at least in terms ofslip on the main NAF. This can be explained byeither a lower long-term GPS rate with the currentobservations affected by the .1000 km sequenceof ruptures this past century, or by more broadlydistributed slip across the NAF zone, with second-ary faults accommodating up to 20% of thedeformation.
A third conclusion from our trench study betweenIzmit and Sapanca is that this segment apparentlyruptures more frequently than the section to thewest (Klinger et al. 2003). Slip in 1999 was lower,averaging about 3–3.5 m near Izmit versus 4–5 mto the east and west (Barka et al. 2002). This c.30-km-long segment is bound by relatively smallstep-overs at Lake Sapanca (1–2 km) and Golcuk(1–2 km) (Lettis et al. 2002), and thus appears tobe weaker than the adjacent sections and can appar-ently fail on its own as indicated by the shorterreturn period and smaller amount of slip inferredfor event E2. If E2 was, in fact, the result of the1754 rupture, then it appears that re-rupture of thissegment can occur after only a few decades. Thisis contrary to the general idea that the Izmit toSapanca area is safe from a near-future rupturebecause it just sustained slip in 1999. In contrast,if E2 was 1878 or 1894, then the Izmit–Sapancasegment appears to have more periodic behaviour.Future work along this segment should concentrate
T. ROCKWELL ET AL.52

on better dating of the penultimate rupture, as thereare clear implications for future hazard andrupture behaviour.
This work was funded by the USGS NEHRP programme,award no. 00HQGR0034, and by Pacific Gas and ElectricCompany (PG & E). We are indebted to the many land-owners who allowed access, the mayors of Kavakkoyand Kosekoy for their support, and to Lloyd Cluff andWoody Savage of PG & E who supported the field effort,allowing the students from SDSU and ITU to be involvedin this work. We sincerely appreciate the reviews byDrs James Dolan and Alessandro Michetti who con-tributed to improvements in the presentation of thispaper. Finally, none of this work would have been possiblewithout Aykut Barka. Although a coauthor, he deservesspecial attention and thanks, and his death in February2002 was a profound loss to the earthquake sciencecommunity in Turkey as well as the world. He will besorely missed.
References
ALTINOK, Y., ALPAR, B. & YALTIRAK, C. 2003.Sarkoy–Murefte 1912 Earthquake’s Tsunami, exten-sion of the associated faulting in the Marmara Sea,Turkey. Journal of Seismology, 7(3), 329–346.
ALTUNEL, E., MEGHRAOUI, M., AKYUZ, S. & DIKBAS,A. 2004. Characteristics of the 1912 co-seismicrupture along the North Anatolian Fault Zone(Turkey): Implications for the expected Marmaraearthquake. Terra Nova, 16(4), 198–204.
AMBRASEYS, N. N. 2000. The seismicity of the MarmaraSea area, 1800–1899. Journal of Earthquake Engin-eering, 4(3), 377–401.
AMBRASEYS, N. 2001. The earthquake of 10 July 1894 inthe Gulf of Izmit (Turkey) and its relation to the earth-quake of 17 August 1999. Journal of Seismology, 5,117–128.
AMBRASEYS, N. N. 2002a. The seismic activity of theMarmara Sea region over the last 2000 years. Bulletinof Seismological Society of America, 92(1), 1–18.
AMBRASEYS, N. N. 2002b. Seismic sea-waves in theMarmara Sea region during the last 20 centuries.Journal of Seismology, 6(4), 571–578.
AMBRASEYS, N. N. & FINKEL, C. F. 1987a. The Saros-Marmara earthquake of 9 August, 1912. EarthquakeEngineering and Structural Dynamics, 15, 189–211.
AMBRASEYS, N. N. & FINKEL, C. F. 1987b. Seismicity ofTurkey and neighboring regions, 1899–1915. AnnalesGeophysicae, 5B, 701–726.
AMBRASEYS, N. N. & FINKEL, C. F. 1991. Long-termseismicity of Istanbul and the Marmara Sea region.Terra Nova, 3, 527–539.
AMBRASEYS, N. N. & FINKEL, C. F. 1995. The Seismicityof Turkey and Adjacent Areas, A Historical Review,1500–1800. Eren Yayıncılık, Istanbul.
AMBRASEYS, N. N. & JACKSON, J. A. 2000. Seismicity ofthe Sea of Marmara (Turkey) since 1500. GeophysicalJournal International, 141, F1–F6.
ARMIJO, R., PONDARD, N. ET AL. 2005. Submarine faultscarps in the Sea of Marmara pull-apart (North Anato-lian Fault): Implications for seismic hazard in Istanbul.Geochemistry, Geophysics, Geosystems, 6, 1–29.
BARKA, A. A. 1992. The North Anatolian fault zone.Annales Tectonicae, 6, 164–195.
BARKA, A., AKYUZ, H. S. ET AL. 2002. The surfacerupture and slip distribution of the 17 August 1999Izmit earthquake (M7.4), North Anatolian fault.Bulletin of the Seismological Society of America(Special Issue on the 1999 Izmit and Duzce, Turkey,Earthquakes, N. Toksoz (ed.)), 92(1), 43–60.
BRONK RAMSEY, C. 2005. OxCal Program v3.10. www.rlaha.ox.ac.uk/oxcal/oxcal.htm.
FERRY, M., MEGHRAOUI, M., GIRAD, J.-F., ROCKWELL,T. K., KOZACI, A., AKYUZ, S. & BARKA, A. 2004.Ground-penetrating radar investigations along theNorth Anatolian fault near Izmit, Turkey: Constraintson the right-lateral movement and slip history.Geology, 32(1), 85–88.
FINKEL, C. & BARKA, A. 1997. The Sakarya River-LakeSapanca-Izmit Bay canal project: A reappraisal of thehistorical record in the light of new morphologicalevidence. Istanbuler Mitteilungen, 47, 429–442.
KLINGER, Y., SIEH, K. ET AL. 2003. Paleoseismic evi-dence of characteristic slip on the western segment ofthe North Anatolian fault, Turkey. Bulletin of the Seis-mological Society of America, 93(6), 2317–2332.
KONDO, H., OZAKSOY, V., YILDRIM, C., AWATA, Y.,EMRE, O. & OKUMURA, K. 2004. 3D trenchingsurvey at Demir Tepe site on the 1944 earthquakerupture, North Anatolian fault system, Turkey.Annual Report on Active Fault and PaleoearthquakeResearch, 4, 231–242.
LETTIS, W., BACHHUBER, J., WITTER, R., BRANKMAN,C., RANDOLPH, C. E., BARKA, A., PAGE, W. D. &KAYA, A. 2002. Influence of releasing step-overs onsurface rupture and fault segmentation: Examplesfrom the 17 August 1999 Izmit earthquake on theNorth Anatolian fault, Turkey. Bulletin of the Seismo-logical Society of America, 92(1), 19–42.
MCCLUSKY, S., BALASSANIAN, S. ET AL. 2000. Globalpositioning system constraints on plate kinematicsand dynamics in the eastern Mediterranean andCaucasus. Journal of Geophysical Research, 105,5695–5719.
OKUMURA, K., KONDO, H. ET AL. 2004. Slip history of the1944 Segment of the North Anatolian Fault to QuantifyIrregularity of the Recurrence. Geological Society ofAmerica Annual Meeting, 04-103.
PARSONS, T., TODA, S., STEIN, R., BARKA, A. &DIETRICH, J. H. 2000. Heightened odds of large earth-quakes near Istanbul: An interaction-based probabilitycalculation. Science, 288, 661–665.
RAMSEY, C. B. 2000. OxCal Program Ver. 3.5. Radio-carbon Accelerator Unit, University of Oxford. Avail-able at: http://units.ox.ac.uk/departments/rlaha/orau/06_01.htm
REILINGER, R. E., MCCKUSKY, S. C. ET AL. 1997. Globalpositioning system measurements of present-daycrustal movements in the Arabian-African-Eurasianplate collision zone. Journal of Geophysical Research,102, 9983–9999.
REILINGER, R., MCCLUSKY, S., VERNANT, P. ET AL.2006. GPS constraints on continental deformation inthe Africa-Arabia-Eurasia continental collision zoneand implications for the dynamics of plate interactions.Journal of Geophysical Research, 111, B05411,doi:10.1029/2005JB004051.
NORTH ANATOLIAN FAULT 53

REIMER, P. J., BAILLIE, M. G. L., BARD, E. ET AL. 2004.IntCal04 Terrestrial Radiocarbon Age Calibration,0–26 cal kyr BP. Radiocarbon, 46, 1029–1058.
ROCKWELL, T., BARKA, A., DAWSON, T., THORUP, K. &AKYUZ, S. 2001. Paleoseismology of theGazikoy-Saros segment of the North Anatoliafault, northwestern Turkey: Comparison of thehistorical and paleoseismic records, implications ofregional seismic hazard, and models of earth-quake recurrence. Journal of Seismology, 5(3),433–448.
ROCKWELL, T. K., LINDVALL, S., DAWSON, T.,LANGRIDGE, R., LETTIS, W. & KLINGER, Y. 2002.Lateral offsets on surveyed cultural features resultingfrom the 1999 Izmit and Duzce earthquakes, Turkey.Bulletin of the Seismological Society of America,92(1), 79–94.
ROCKWELL, T. K., OKUMURA, K. ET AL. 2004. Paleoseis-mology of the 1912, 1944 and 1999 ruptures on theNorth Anatolian Fault: implications for long-term pat-terns of strain release. Geological Society of America,Abstracts with Programs, 36(5), 51.
SIEH, K. 1996. The repetition of large-earthquakeruptures. Proceedings of the National Academy ofSciences, 93, 3764–3771.
STRAUB, C. & KAHLE, H. 1995. Active crustal defor-mation in the Marmara Sea region, NW Anatolia,inferred from GPS measurements. GeophysicalResearch Letters, 22(18), 2533–2536.
STRAUB, C. S. 1996. Recent crustal deformation andstrain accumulation in the Marmara Sea region,N.W. Anatolia, inferred from GPS measurements.PhD dissertation, Swiss Federal Institute of Techno-logy at Zurich.
T. ROCKWELL ET AL.54