Probabilistic seismic hazard assessment of Switzerland: best estimates and uncertainties
30
J Seismol (2009) 13:449–478 DOI 10.1007/s10950-008-9138-7 ORIGINAL ARTICLE Probabilistic seismic hazard assessment of Switzerland: best estimates and uncertainties Stefan Wiemer · Domenico Giardini · Donat Fäh · Nicholas Deichmann · Souad Sellami Received: 8 July 2005 / Accepted: 8 September 2008 / Published online: 15 October 2008 © Springer Science + Business Media B.V. 2008 Abstract We present the results of a new genera- tion of probabilistic seismic hazard assessment for Switzerland. This study replaces the previous intensity-based generation of national hazard maps of 1978. Based on a revised moment- magnitude earthquake catalog for Switzerland and the surrounding regions, covering the period 1300– 2003, sets of recurrence parameters (a and b val- ues, M max ) are estimated. Information on active faulting in Switzerland is too sparse to be used as source model. We develop instead two models of areal sources. The first oriented towards capturing historical and instrumental seismicity, the second guided largely by tectonic principles and express- ing the alterative view that seismicity is less stationary and thus future activity may occur in previously quiet regions. To estimate three alterna- tive a and b value sets and their relative weighting, we introduce a novel approach based on the mod- Electronic supplementary material The online version of this article (doi: 10.1007/s10950-008-9138-7) contains supplementary material, which is available to authorized users. S. Wiemer (B ) · D. Giardini · D. Fäh · N. Deichmann · S. Sellami Swiss Seismological Service, Institute of Geophysics, Sonneggstrasse 5, ETH Zurich, NO, 8092 Zurich, Switzerland e-mail: [email protected] URL: http://www.seismo.ethz.ch ified Akaike information criterion, which allows us to decide when the data in a zone deserves to be fitted with a zone-specific b value. From these input parameters, we simulate synthetic earth- quake catalogs of one-million-year duration down to magnitude 4.0, which also reflect the differ- ence in depth distribution between the Alpine Foreland and the Alps. Using a specific predictive spectral ground motion model for Switzerland, we estimate expected ground motions in units of the 5% damped acceleration response spectrum at frequencies of 0.5–10 Hz for all of Switzerland, referenced to rock sites with an estimated shear wave velocity of 1,500 m/s 2 in the upper 30 m. The highest hazard is found in the Wallis, in the Basel region, in Graubünden and along the Alpine front, with maximum spectral accelerations at 5 Hz frequency reaching 150 cm/s 2 for a return period of 475 years and 720 cm/s 2 for 10,000 years. Keywords Seismic hazard · Seismicity rates · PSHA · Seismotectonics · Switzerland 1 Introduction 1.1 History of seismic hazard assessment in Switzerland Probabilistic seismic hazard assessment (PSHA) is widely considered as seismology’s most valu-
-
Upload
independent -
Category
Documents
-
view
2 -
download
0
Transcript of Probabilistic seismic hazard assessment of Switzerland: best estimates and uncertainties

J Seismol (2009) 13:449–478DOI 10.1007/s10950-008-9138-7
ORIGINAL ARTICLE
Probabilistic seismic hazard assessment of Switzerland:best estimates and uncertainties
Stefan Wiemer · Domenico Giardini ·Donat Fäh · Nicholas Deichmann ·Souad Sellami
Received: 8 July 2005 / Accepted: 8 September 2008 / Published online: 15 October 2008© Springer Science + Business Media B.V. 2008
Abstract We present the results of a new genera-tion of probabilistic seismic hazard assessmentfor Switzerland. This study replaces the previousintensity-based generation of national hazardmaps of 1978. Based on a revised moment-magnitude earthquake catalog for Switzerland andthe surrounding regions, covering the period 1300–2003, sets of recurrence parameters (a and b val-ues, Mmax) are estimated. Information on activefaulting in Switzerland is too sparse to be used assource model. We develop instead two models ofareal sources. The first oriented towards capturinghistorical and instrumental seismicity, the secondguided largely by tectonic principles and express-ing the alterative view that seismicity is lessstationary and thus future activity may occur inpreviously quietregions.Toestimatethreealterna-tive a and b value sets and their relative weighting,we introduce a novel approach based on the mod-
Electronic supplementary material The online versionof this article (doi: 10.1007/s10950-008-9138-7)contains supplementary material, which is availableto authorized users.
S. Wiemer (B) · D. Giardini · D. Fäh ·N. Deichmann · S. SellamiSwiss Seismological Service,Institute of Geophysics, Sonneggstrasse 5,ETH Zurich, NO, 8092 Zurich, Switzerlande-mail: [email protected]: http://www.seismo.ethz.ch
ified Akaike information criterion, which allowsus to decide when the data in a zone deserves tobe fitted with a zone-specific b value. From theseinput parameters, we simulate synthetic earth-quake catalogs of one-million-year duration downto magnitude 4.0, which also reflect the differ-ence in depth distribution between the AlpineForeland and the Alps. Using a specific predictivespectral ground motion model for Switzerland,we estimate expected ground motions in units ofthe 5% damped acceleration response spectrumat frequencies of 0.5–10 Hz for all of Switzerland,referenced to rock sites with an estimated shearwave velocity of 1,500 m/s2 in the upper 30 m.The highest hazard is found in the Wallis, in theBasel region, in Graubünden and along the Alpinefront, with maximum spectral accelerations at5 Hz frequency reaching 150 cm/s2 for a returnperiod of 475 years and 720 cm/s2 for 10,000 years.
Keywords Seismic hazard · Seismicity rates ·PSHA · Seismotectonics · Switzerland
1 Introduction
1.1 History of seismic hazard assessmentin Switzerland
Probabilistic seismic hazard assessment (PSHA)is widely considered as seismology’s most valu-

450 J Seismol (2009) 13:449–478
able contribution to earthquake hazard assess-ment (Abrahamson and Bommer 2005; Frankel1995; Giardini et al. 1999; Reiter 1991; Woo 1996).Estimating the chance of strong ground motionat a given level is the most critical input forseismic zoning and building code design and iscommonly done for all countries worldwide. It isalso common that PSHA is periodically reviewedin order to incorporate novel data and to improvescientific understanding (Frankel 1995; Frankelet al. 1997b). Seismic hazard is assessed by com-bining the history of past earthquakes with theknowledge of the present seismotectonic settingand the local properties of the waves generatedby earthquakes. The assessment of seismic hazardis the first step in the evaluation of seismic risk,obtained by combining the seismic hazard withvulnerability and value factors (type, value andage of buildings, as well as infrastructure, popu-lation density, and land use).
A number of studies related to hazard assess-ment in Switzerland have been performed in thepast three decades:
• In 1978, Sägesser and Mayer-Rosa (1978)published the first PSHA for Switzerland.The hazard was based on the historical cat-alog available at the time, which containedepicentral intensities, Io, as quantification ofsize. To compute hazard, an intensity-basedattenuation function was used. Hazard wascomputed based on the Cornell–McGuire ap-proach (Cornell 1968) with a zoning modelof about 20 zones, which, to a large degree,mirrored the spatial distribution of seismicity.This study produced the input for the Swissbuilding code (SIA code 160) as well as forcritical facilities, such as nuclear power plantsand large dams.
• In 1995, a comprehensive study byRüttener (1995), based on a historical para-metric method, estimated the hazard andassociated uncertainties at 12 sites withinSwitzerland. The computed parameter wasagain macroseismic intensity.
• Grünthal et al. (1998) significantly updatedthe hazard map and provided a harmo-nized assessment between Germany, Austria,and Switzerland (D-A-CH). The D-A-CH
map was used as test region for Global SeismicHazard Assessment Program (GSHAP) re-gion 3 (Grünthal 1999), which represented thefirst unified seismic hazard model for North-ern Europe (north of 46◦ latitude), includingthe majority of Switzerland. To express epis-temic uncertainty in ground motions model-ing, Grünthal (1999) used three attenuationrelationships with equal weight: Ambraseyset al. (1996), Boore et al. (1997), and Sabettaand Pugliese (1996).
• In 2002, the Seismotectonics and Seismic Haz-ard Assessment in the Mediterranean Regionproject (SESAME; IGCP Project 382) pub-lished a first unified seismic hazard model forthe entire European–Mediterranean region(Jiménez et al. 2003). For the SESAME com-putations, Ambraseys et al. (1996) attenuationrelationships in terms of peak ground acceler-ation and spectral acceleration were applied.For Switzerland, the zonation of the GSHPtest region 3 (Grünthal 1999) was adoptedwith minor modification to the southernmostsource zones.
Starting in 1998, the SED initiated a num-ber of complementary studies in view of a newgeneration of PSHA for Switzerland. Several doc-toral theses were targeted towards improving in-dividual elements of a forthcoming PSHA. Aregion-specific attenuation model for Switzerlandwas developed by Bay et al. (2003, 2005). Theseismotectonic framework of Switzerland was as-sessed using focal mechanisms for stress tensorinversion (Kastrup 2002; Kastrup et al. 2004). Theseismicity database was vastly improved througha series of studies devoted to paleoseismologic,historical, and instrumental seismicity (Beckeret al. 2002; Meghraoui et al. 2001; Schwarz-Zanetti et al. 2003). A major result of these stud-ies, a new moment-based earthquake catalog forSwitzerland, was published in 2003 (Fäh et al.2003; Braunmiller et al. 2005). All of these studiesrepresent the essential groundwork for the newnational PSHA of Switzerland. In this paper, wedescribed the generation of the PSHA model,present and interpret the final hazard results, andperform sensitivity analysis.

J Seismol (2009) 13:449–478 451
Starting in 2002, the Swiss Nuclear Industrysupported the PEGASOS project aimed at a re-assessment of the seismic hazard at the sites of thefour nuclear power plants, which are located in theforeland of Switzerland (Abrahamson et al. 2002).This SSHAC level 4 (Budnitz et al. 1997) PSHAstudy involved multiple expert panels on sourcecharacterization, ground motion scaling, and siteeffect characterization. The study was completedin 2005 and has spawned numerous research pa-pers (e.g., Cotton et al. 2006; Scherbaum et al.2004, 2005, 2006; Bommer et al. 2004, 2005) aswell as significant discussion on its interpretation(e.g., Klügel 2005, 2007; Musson et al. 2005). Itis now being followed up by a refinement studyto address open questions and research needsidentified in the initial study. Because the SwissNational Hazard model presented in this paperwas largely completed before the conclusion ofthe PEGASOS study, and because site-specificprojects and regional hazard mapping work
under somewhat different constraints, we will onlybriefly comment on the similarities and differ-ences between the two studies.
1.2 Seismotectonic framework of the study region
Switzerland contains several distinct geologicaland seismotectonic regimes related to the colli-sion of the African and the European plates. Interms of crustal strain rate and seismicity rate,Switzerland is located in the transition zonesbetween areas of high seismic activity (Greece,Italy) and areas of low seismic activity (NorthernEurope). The country can be subdivided intothree main tectonic units (Fig. 1): (1) The Alpinebelt in the south, (2) the Jura in the north, and (3)the Molasse basin in between (e.g., Trümpy 1985;Hsü 1995; Pavoni et al. 1997). Small to moderatebut persistent seismic activity occurs beneath theAlpine belt and north of the Alps, including the
Fig. 1 Seismotectonicmap of Switzerland andsurrounding region.Shown are the majortectonic/geological unitsdifferentiated by color.See legend for detail
Zürich
Bern
Basel
Genève
Lausanne
Luzern
Chur
Lugano
Sion
10˚E
10˚E
9˚E
9˚E
8˚E
8˚E
7˚E
7˚E
6˚E
6˚E
47˚N 47˚N
46˚N 46˚N
0 40 8020 km
Helvetic Nappes (Mesozoic and Tertiary Sediments)
Penninic Zone
Austroalpine Zone
Southalpine Mesozoic Sediments
Southalpine Paleozoic Sediments
Southalpine Crystalline Massifs
Ivrea-Verbano-Zone
Tertiary Intrusives and Volcanites
Lakes
Quarternary (glacial and post-glacial deposits)
Paleozoic Sediments
Foreland Mesozoic Sediments
Mesozoic Sediments of the Folded Jura
Subalpine Molasse
Alpine and Extra alpine Crystalline Massifs
Tertiary of the Molasse Basin, Jura, Rhine Graben and Po-Basin
Jura Molasse
Wallis
Rhinegraben
Graubünden

452 J Seismol (2009) 13:449–478
Molasse basin, the Rhine Graben, and the Jura(e.g., Deichmann et al. 2000).
A systematic analysis of 138 focal mechanismsin Switzerland and its surroundings showed thatthe style of faulting and the orientation of thestress field vary significantly both along strike andacross the Alps (e.g., Kastrup 2002; Kastrup et al.2004). Whereas strike-slip mechanisms with a nor-mal faulting component dominate in the NorthernAlpine Foreland and some shallow thrust mech-anisms are observed along the Northern AlpineFront, the Penninic domains of the Wallis andGraubünden are characterized by normal fault-ing with extensional axes at a high angle to thestrike of the Alps. In the Northern Foreland, thestress tensor reflects the large-scale convergenceof Africa and continental Europe, with a maxi-mum horizontal stress axis that rotates from eastto west so as to remain roughly perpendicular tothe Alpine arc. Thus, the least compressive stressin the northern foreland is roughly parallel tothe Alpine front. Across the Alps, the variationin azimuth of the least compressive stress is de-fined by a progressive counterclockwise rotation
of about 45◦ from the Foreland in the north acrossthe Helvetic domain to the Penninic nappes inthe southern Wallis. This apparent rotation of thestress field can be explained by the superpositionof a local uniaxial deviatoric tension on the large-scale regional stress. The tensile nature and orien-tation of this local stress component is consistentwith the spreading stress expected from lateraldensity changes due to the crustal root beneaththe Alps (Kastrup et al. 2004). These results rep-resent important input for the definition of seismicsource zones.
1.2.1 Historical observations of seismicity
The bulk of our knowledge of past seismicity relieson the historical record of earthquake damage.From these macroseismic observations, we deriveapproximate locations and magnitudes of pastevents. On average, 10–15 earthquakes are felteach year within Switzerland; damaging eventsare expected every 5–10 years. Over the past800 years, a total of 28 events of a moment
Fig. 2 Map ofSwitzerland. Orangecircles mark epicenterswith epicentral intensityIx > VI since the year1300, based onmacroseismicobservations (Fäh et al.2003). Red circles showthe instrumentallyrecorded events withML > 2.5 in the period1975–2007
10˚E
10˚E
9˚E
9˚E
8˚E
8˚E
7˚E
7˚E
6˚E
6˚E
47˚N 47˚N
46˚N 46˚N
0 40 8020 km
2.53
4
5
MagnitudeVIVII
VIII
IX
Intensity

J Seismol (2009) 13:449–478 453
magnitude Mw ≥ 5.5 are known to have occurred.A map of all events known to have caused damageto buildings (macroseismic intensities ≥ VI) isshown in Fig. 2 (top). Twelve of them reach anintensity of VIII or higher, causing severe damage.Destructive earthquakes of intensity IX or largerhave occurred in the past, but their return periodsexceed 1,000 years (Fäh et al. 2003; Meghraouiet al. 2001). The highest seismic activity is ob-served in the region of Basel and in the Wallis.Other regions of enhanced activity are centralSwitzerland, Graubünden, and the Rhine Valleyof St. Gallen.
The earthquake that occurred on October 18,1356 in the region of Basel is the strongesthistorically documented earthquake in centralEurope (Fäh et al. 2003). A repeat of this eventhas been estimated to cause damages on the orderof several tens of billions of Swiss Francs to build-ings alone, as well as hundreds to thousands offatalities.
1.2.2 Instrumental observations of seismicity
Instrumental observations complement themacroseismic observations for larger events andare the basis for a homogeneous record of theseismicity in Switzerland since 1975. With theexception of central Switzerland, which has shownlittle activity since the earthquake sequence ofSarnen in 1964, and of the recent lack of activityin the Oberwallis, the instrumentally recordedseismicity of the last 29 years (Fig. 2, bottom) isconcentrated in the same regions as the seismicityderived from the historical record (Fig. 2, top).
An important factor for the PSHA, which canbe derived only using instrumental recordings, isthe hypocentral depth of earthquakes. However,the routinely determined depth of earthquakesin Switzerland is poorly constrained for manyevents. Therefore, we rely on results from dedi-cated studies such as Deichmann et al. (2000) andHusen et al. (2003). The results of Deichmannet al. (2000) are based on high-quality locations ofselected well-recorded events. Husen et al. (2003)also derived a three-dimensional velocity modeland used a nonlinear location algorithm (Husenet al. 2003; Lomax et al. 2001) to further constraindepth and its uncertainty. Both studies consis-
tently show a major difference in depth distribu-tion between the Alps proper and the NorthernForeland (Jura, Molasse): Deeper earthquakes(mean depth = 13 km, maximum depth > 30 km)occur only in the north beneath the MolasseBasin, whereas in the south under the Alps wherethe crust is up to 55 km thick, earthquakes arerestricted to the upper 10–15 km (mean depth =7 km; e.g., Deichmann et al. 2000). This major dif-ference across the Alpine Front is one of the prin-ciple design criteria used for our seismic sourcezonation.
1.2.3 Paleoseismic investigations in centraland northern Switzerland
Since 1997, a number of investigations have beenundertaken with the aim of identifying paleoseis-mological approaches suitable for application innorthern and central Switzerland and to recon-struct the Late Pleistocene and Holocene recordof strong earthquakes (Becker and Davenport2003; Becker et al. 2002; Schnellmann et al. 2002,2004). These results change our understanding ofthe earthquake record in northern and centralSwitzerland and of how earthquakes affect thegeological record. Most relevant for our study arethe investigations related to the Rheinach faultnear Basel, now believed to have been also thesource of the 1356 Basel event (Meghraoui et al.2001). Paleoseismologic studies (Meghraoui et al.2001; Becker et al. 2002) suggest that similar sizeevents have indeed taken place on the Reinachfault. There is evidence for at least three earth-quakes, which occurred on that branch of the faultwithin the last 8,500 years with vertical displace-ments ranging from 0.5 to 0.8 m.
Analyzing multiple subaqueous landslide de-posits in Lake Zurich and Lake Lucerne throughhigh-resolution seismic surveys and radiocarbon-dated sediment cores, Strasser et al. (2006) iden-tified evidence for three large paleo-earthquakesin central Switzerland with moment magnitudes(M > 6.5–7.0). These magnitudes significantly ex-ceed the historically known values. These earth-quakes occurred during the past 15 ky and werestrong enough to simultaneously affect a largeregion that includes the present-day major citiesof Lucerne and Zurich.

454 J Seismol (2009) 13:449–478
1.2.4 Active faults and deformation in Switzerland
Knowledge of active faults and of deformationrates on such faults is very limited in Switzerland.Whereas numerous faults are identified on geolo-gical maps at all scales, these do not correlate withobserved seismicity. In the literature, there is noconvincing evidence for Quaternary movementsthat has offset topography and post-glacial fea-tures (e.g., Eckardt et al. 1983). However, withinthe generally rather diffuse epicenter distribution,two epicenter lineaments have emerged in recentyears, which seem to be related to active faultsat depth within the crust. The first is an almostrectilinear 20- to 30-km-long north–south strikingepicenter alignment east of the city of Fribourg.Based on the good agreement with the focal mech-anisms, with the subsurface structures identified inreflection seismic experiments and in geomagneticstudies, as well as with morphological featuresof the region, it could be demonstrated that theearthquake lineament of Fribourg corresponds toan active fault zone capable of hosting a possibleM6 event (Kastrup 2002; Kastrup et al. 2007).The second lineament is a narrow earthquakezone that is located along the northern borderof the Rhone Valley in the Wallis and that pos-sibly extends in a southwestern direction all theway into the Haute-Savoie. The northern Wallissegment of this epicenter alignment is probably along-lasting consequence of the 1946 earthquakesequence of Sierre. However, in recent years, anincrease of activity southwest of this region sug-gests the possible existence of an active fault zonewhose dimensions could accommodate an earth-quake considerably larger than what is known tohave occurred previously. Ongoing investigations,such as the precise relative locations of events inindividual sequences within the larger earthquakezone, will contribute towards clarifying this issue.
Due to the low deformation rates, detailed geo-detic measurements for individual faults do notexist in Switzerland to date. However, geodeticdeformation rates help to define broad regionaldifferences in seismic potential. In Switzerlandand in neighboring areas, geologically estimateddeformation rates are homogeneous and are over-all very low, consistent with recent GPS mea-surements. The average total convergence rate
between Africa and Europe for the past 49 Myawas about 0.9 cm/year (Regenauer-Lieb and Petit1997), which is in good agreement with the rateof 0.94 cm/year for the past 3 Mya, as given byNUVEL-1 (DeMets et al. 1990). These numbersare reasonably consistent with long-term geologi-cal strain rates. Vertical movements are too smallto distinguish isostatic signals due to post-glacialrebound from tectonic signals.
2 Input for PSHA in Switzerland
Input parameters needed for performing aPSHA following the Cornell–McGuire approach(Cornell 1968; McGuire 1976; Reiter 1990) are:
1. An earthquake catalog, which is used to de-rive recurrence rates and to estimate the max-imum possible earthquake for each sourcezone.
2. A seismotectonic source model, which definesfault or areal zones of equal seismic potential.
3. A predictive ground motion model (PGMM),which describes the attenuation of amplitudes(acceleration, velocities) as a function of dis-tance and the scaling with magnitude. Indi-vidual models are constructed for differentfrequencies and local site conditions.
Below, we describe how these input parameterswere derived for Switzerland.
2.1 Earthquake catalog of Switzerland
The historical earthquake catalog and macro-seismic database for Switzerland were revisedduring the period 1998–2003 (Fäh et al. 2003).The resulting Earthquake Catalog of Switzerland(ECOS), covering also the border regions, inte-grates information from different sources: (1) theMacroseismic Earthquake Catalog of Switzerland(MECOS 02) with events since 250; (2) the an-nual reports of the Swiss Earthquake Commis-sion since 1879; (3) the epicenter locations of theSwiss Instrumental Network since 1975; and (4)additional information from 12 earthquake cat-alogs of neighboring countries and internationalagencies. The ECOS catalog can be downloadedfrom www.seismo.ethz.ch, along with a detailed

J Seismol (2009) 13:449–478 455
report describing its compilation. Note that someof the events of the twentieth century were in-dependently reappraised by Ambraseys (2003);however, because this reappraisal is not inter-nally consistent with the remainder of the ECOSapproach, we did not use this catalog for ourPSHA.
Moment magnitude, Mw, was chosen as mea-sure of earthquake size for both the historicallyknown and the instrumentally recorded events.This involved a reassessment of instrumental mag-nitudes in order to standardize the various types ofmagnitude scales and the different measurementprocedures of various institutions to a commonbasis (Braunmiller et al. 2005). Then, a set ofcalibration events with values of intensity as wellas magnitude was established. This calibrationset was used to assign a magnitude value to thehistorical earthquakes. In case of larger events,the magnitude assessment is based on an analysisof the entire macroseismic field according to themethod of Bakun (Bakun and Wentworth 1999;Wesson et al. 2003). For smaller events, magni-tudes are computed from epicentral intensitiesusing an empirical relationship (Fäh et al. 2003).After removal of all events identified as explo-sions and of all events judged to be uncertain,ECOS comprises a total of about 20,000 earth-quakes. Figure 3 shows a time–magnitude plot ofthe entire ECOS database since 1300. Note thatmagnitude 2–4 events are binned in 0.3 magnitudeintervals before 1970 as a result of the conversionfrom epicentral intensity to magnitude.
2.2 Definition of seismic source zones
The assessment of seismic hazard requires the in-terpretation of past seismicity and tectonic knowl-edge to forecast likely locations of future shaking.Several methods have been proposed, but there isno ideal and proven way to derive a set of seismicsource zones; zoning remains inherently a matterof expert judgment. It is therefore important tocapture and propagate the uncertainty of any zon-ing model.
Seismotectonic zoning is intrinsically linked tothe question of stationarity in space and time.Will future seismicity follow the pattern of thepast? Will areas which were active in the last cen-turies remain active also in the next 50–100 years(Fig. 2)? Or have areas of past seismicity currentlyexhausted their potential and will remain quietwhile other areas will become more active? Theseissues are critical in areas of spatially dispersedseismicity such as Switzerland because the lackof knowledge of active faulting requires the useof areal sources as the primary zoning tool. Wedecided not to use faults as linear or areal sourcezones because only very limited information isavailable for Switzerland and the known seismicactivity along these faults is, in our opinion, in-sufficient to characterize them as source zones.Doing so would introduce a bias in the hazardassessment because the information density onknown faults is so sparse, and therefore, few se-lected areas would receive a ‘special’ treatment.Areal sources can be either used to closely trace
Fig. 3 Time–magnitudedistribution of the eventsin the ECOS database
1300 1400 1500 1600 1700 1800 1900 20000
1
2
3
4
5
6
7
Time
Mag
nit
ud
e

456 J Seismol (2009) 13:449–478
the historical seismicity, or they can be used toalso reflect seismotectonic knowledge. In the lat-ter case, the activity in an area could spread withthe same probability to a neighboring area of iden-tical seismotectonic character. As an alternative,smoothed seismicity models have been used insome hazard studies (Frankel 1995; Rüttener et al.1996; Woo 1996) to distribute historical seismic-ity over a larger region. These models generallyuse a constant smoothing kernel across the entireregion, thus avoiding potential bias. Their disad-vantage is that they ignore existing boundariesand do not allow for the integration of externalknowledge and that the choice of a smoothingparameter is likewise subjective.
For our hazard computations, we developedtwo models of areal sources. Model 1 (SEIS)is mostly driven by historical seismicity; model2 (TECTO), using generally larger zones, at-tempts to capture the major tectonic features ofthe region. For the peripheral regions aroundSwitzerland, we relied largely on the existingsource models that were developed previouslyfor the international hazard mapping projectsGSHAP and SESAME (Grünthal 1999; Jiménezet al. 2003). The geometry of the two sourcezone models is plotted in Fig. 4. We feel thatthe TECTO model represents well alternative
scenarios that assume that the seismicity of thenext years changes from what has been ob-served as persistent clusters of activity in the past1,000 years (Fig. 2). However, we assume that sucha change is an unlikely scenario, which is why weonly give a 10% weight in the logic tree branch tothe TECTO model.
Below, we describe some of the major tectonicfeatures and resting zoning decisions for the studyregion.
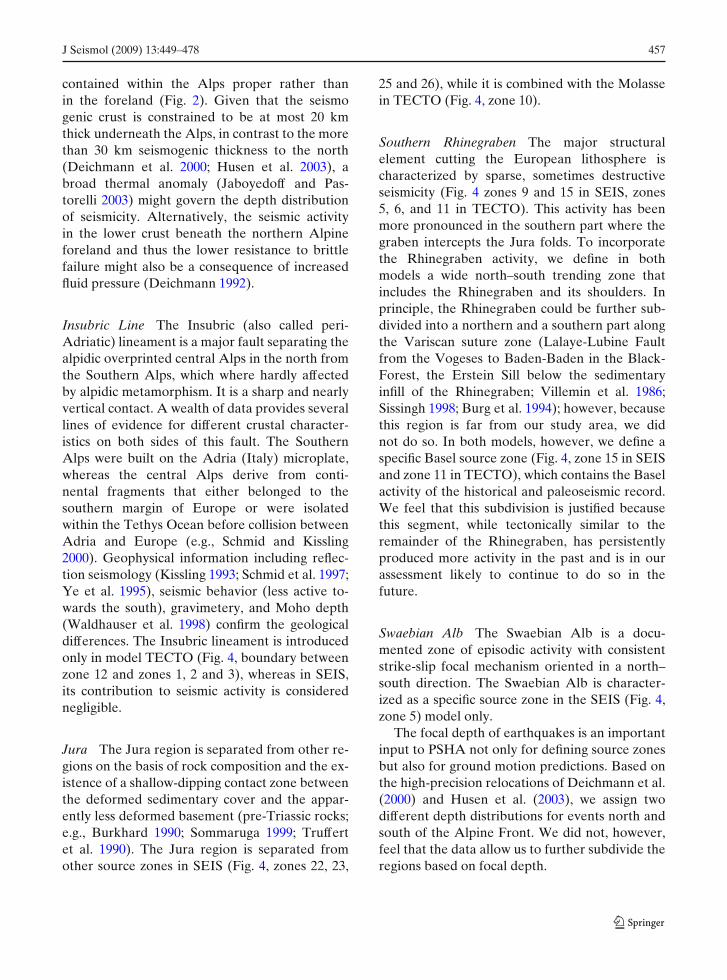
Helvetic Front This is the major tectonic sep-aration between the Alpine Foreland and theAlps proper and introduced as a single archedzone in model TECTO (Fig. 4, zone 4) andsubdivided into an eastern and western arc inmodel SEIS (Fig. 4, zones 4 and 24). Its defini-tion is based on: (1) the depth distribution ofthe hypocenters (Deichmann 1992; Deichmannet al. 2000), (2) geological information, and (3)density of the seismic events. The Helvetic Frontis shown on any geological map (e.g., Trümpy1985). It is characterized by different litholo-gies with different rheological/mechanical prop-erties to the south and north. The tectonic con-tact zone of the Helvetic Front dips towardsthe south at an angle of 30◦ to 45◦. The seismicactivity along the Helvetic Front is apparently
Fig. 4 Maps ofSwitzerland. Left: sourcezones of model 1, SEIS,which is largely based onthe historical seismicity.Right: source zones ofmodel 2, TECTO, whichassumes that theseismicity follows broadtectonic regions. Thecorresponding names,recurrence parameters,completeness estimates,and zone geometries aregiven in the ElectronicAppendix
TECTOSEIS
J Seismol (2009) 13:449–478 457
contained within the Alps proper rather thanin the foreland (Fig. 2). Given that the seismogenic crust is constrained to be at most 20 kmthick underneath the Alps, in contrast to the morethan 30 km seismogenic thickness to the north(Deichmann et al. 2000; Husen et al. 2003), abroad thermal anomaly (Jaboyedoff and Pas-torelli 2003) might govern the depth distributionof seismicity. Alternatively, the seismic activityin the lower crust beneath the northern Alpineforeland and thus the lower resistance to brittlefailure might also be a consequence of increasedfluid pressure (Deichmann 1992).
Insubric Line The Insubric (also called peri-Adriatic) lineament is a major fault separating thealpidic overprinted central Alps in the north fromthe Southern Alps, which where hardly affectedby alpidic metamorphism. It is a sharp and nearlyvertical contact. A wealth of data provides severallines of evidence for different crustal character-istics on both sides of this fault. The SouthernAlps were built on the Adria (Italy) microplate,whereas the central Alps derive from conti-nental fragments that either belonged to thesouthern margin of Europe or were isolatedwithin the Tethys Ocean before collision betweenAdria and Europe (e.g., Schmid and Kissling2000). Geophysical information including reflec-tion seismology (Kissling 1993; Schmid et al. 1997;Ye et al. 1995), seismic behavior (less active to-wards the south), gravimetery, and Moho depth(Waldhauser et al. 1998) confirm the geologicaldifferences. The Insubric lineament is introducedonly in model TECTO (Fig. 4, boundary betweenzone 12 and zones 1, 2 and 3), whereas in SEIS,its contribution to seismic activity is considerednegligible.
Jura The Jura region is separated from other re-gions on the basis of rock composition and the ex-istence of a shallow-dipping contact zone betweenthe deformed sedimentary cover and the appar-ently less deformed basement (pre-Triassic rocks;e.g., Burkhard 1990; Sommaruga 1999; Truffertet al. 1990). The Jura region is separated fromother source zones in SEIS (Fig. 4, zones 22, 23,
25 and 26), while it is combined with the Molassein TECTO (Fig. 4, zone 10).
Southern Rhinegraben The major structuralelement cutting the European lithosphere ischaracterized by sparse, sometimes destructiveseismicity (Fig. 4 zones 9 and 15 in SEIS, zones5, 6, and 11 in TECTO). This activity has beenmore pronounced in the southern part where thegraben intercepts the Jura folds. To incorporatethe Rhinegraben activity, we define in bothmodels a wide north–south trending zone thatincludes the Rhinegraben and its shoulders. Inprinciple, the Rhinegraben could be further sub-divided into a northern and a southern part alongthe Variscan suture zone (Lalaye-Lubine Faultfrom the Vogeses to Baden-Baden in the Black-Forest, the Erstein Sill below the sedimentaryinfill of the Rhinegraben; Villemin et al. 1986;Sissingh 1998; Burg et al. 1994); however, becausethis region is far from our study area, we didnot do so. In both models, however, we define aspecific Basel source zone (Fig. 4, zone 15 in SEISand zone 11 in TECTO), which contains the Baselactivity of the historical and paleoseismic record.We feel that this subdivision is justified becausethis segment, while tectonically similar to theremainder of the Rhinegraben, has persistentlyproduced more activity in the past and is in ourassessment likely to continue to do so in thefuture.
Swaebian Alb The Swaebian Alb is a docu-mented zone of episodic activity with consistentstrike-slip focal mechanism oriented in a north–south direction. The Swaebian Alb is character-ized as a specific source zone in the SEIS (Fig. 4,zone 5) model only.
The focal depth of earthquakes is an importantinput to PSHA not only for defining source zonesbut also for ground motion predictions. Based onthe high-precision relocations of Deichmann et al.(2000) and Husen et al. (2003), we assign twodifferent depth distributions for events north andsouth of the Alpine Front. We did not, however,feel that the data allow us to further subdivide theregions based on focal depth.

458 J Seismol (2009) 13:449–478
2.3 Estimation of recurrence parameters
2.3.1 Data completeness with time
To model the seismicity in each zone, we needknowledge on the magnitude of completeness,Mc, below which only a fraction of all eventsin a magnitude bin are detected by the net-work (Kijko and Graham 1999; Rydelek andSacks 2003; Wiemer and Wyss 2000, 2003).Completeness as a function of space and timein the ECOS catalog varies, first of all, country-by-country because the different countries usedifferent methods to compile the catalogs. Com-pleteness estimates for historical datasets arelargely a matter of expert judgment based onan evaluation of various plots of the seismicity.This iterative process leads to a definition of com-pleteness periods through time for each country.Results are then checked against historical esti-mates of completeness, as given in the ECOS cat-alog. For Switzerland, an independently derivedestimate of completeness based on a historian’sestimate of data source availability can also beconsulted (Fäh et al. 2003). For the instrumen-tal data, completeness is also computed using analgorithm developed for completeness mapping(Wiemer and Wyss 2000).
Because sources cross national borders, and be-cause even within individual countries differencesin Mc for different time periods are apparent,we interactively review the normalized cumulativefrequency–magnitude distribution of events foreach source zone. In some cases, we adjust thecompleteness threshold.
Completeness estimation, especially for histor-ical data, is subject to large uncertainties. To ex-press these uncertainties and to allow for the factthat historical data for low magnitudes are lessreliable, we define an additional alternative model2 with a higher Mc cutoff. This alternative model2 results in relatively higher weights to the recentearthquakes in the instrumental dataset. We thushave two completeness models for each sourceregion. The final determined Mc thresholds foreach source zone of models TECTO and SEISare given in the Electronic Appendix to thispublication.
2.3.2 Explosion contamination
The ECOS catalog contains a number of uniden-tified explosion events. Despite the best effortsof network operators to identify these events, itis common in all regional earthquake catalogs tohave such unidentified events because the sep-aration of explosion events from tectonic onesis difficult (Fäh and Koch 2002; Koch and Fäh2002; Wiemer and Baer 2000; Wüster 1993). Theseevents are mainly limited to the most recent 30-year period of data. Their magnitudes are believedto be mostly smaller than Mw = 2.5; however,these small events have the potential to signif-icantly bias the a and b value computation insome regions, especially because the size distri-bution of explosions is generally much steeper(higher b values) than of tectonic earthquakes(Wiemer and Baer 2000). To estimate the numberof unidentified explosions, we plot a histogram ofthe time of the day of all events not marked asexplosion in the ECOS database. This plot revealsa typical pattern for a quarry-blast-rich region(Wiemer and Baer 2000): Detection is best inthe nighttime hours (Rydelek and Sacks 1989); inother words, Mc is lower. A peak during daytimehours around 12 UTC, however, is not explainedby improved completeness, but caused by arti-facts. Based on the hourly histogram, we esti-mate that the ECOS catalog contains roughly 500explosions.
To further investigate these explosions, wemap the ratio of nighttime-to-daytime number ofearthquakes, R (Wiemer and Baer 2000). Themap in Fig. 5 was computed using sampling vol-umes of 60 events. Ratios of R > 2, plotted inblue to purple colors, show a statistically signifi-cant (as compared to a uniform probability den-sity function) increased seismicity during daytimehours and are indicative for the presence of quarryblasts. On the other hand, statistically significantlow ratios (red colors in Fig. 5) could also beindicative of man-made activity (e.g., nighttimeunderground mining activity). However, their in-terpretation is less reliable because they show thesame trend as the aforementioned daily variationsin Mc due to daytime noise. An example of thehourly distribution of events in an anomalous

J Seismol (2009) 13:449–478 459
Fig. 5 Map ofSwitzerland and itssurrounding regions.Color-coded is thedaytime to nighttime ratioof events (daytime,800–1800 GMT). Highratios (blue to purplecolors) suggest thepresence of explosioncontamination in thedata. The frame aboveshows the histogram ofthe hourly distribution ofevents located near the“Wallis anomaly”
Mc
1
2
3
4
region is shown in the inset in Fig. 5. To re-move the explosion contamination, we follow theiterative approach outlined in Wiemer and Baer(2000). The final “dequarried” catalog containsfewer earthquakes during daytime hours becauseinevitably some daytime tectonic earthquakes arealso removed. However, because the removed realevent set is independent of magnitude scaling, andpresumably follow the true natural size distribu-tion, the effect is only a minor reduction in activityrate for these volumes. It is also limited to the in-strumental data. This unavoidable rate reductionis considerably less biasing than the original biasin rate and b value caused by the explosions. In anadditional step, we also removed manually eventsnear a mining area in France (6.8◦ W, 49.4◦ N).This region shows an anomalously low daytimeto nighttime ratio and a peculiar time distributionand magnitude size distribution of events. Thenumerous events in this region after 1980 corre-
spond almost entirely to mining related activity(J.P. Burg 2002, personal communication).
2.3.3 Declustering the ECOS catalog
Declustering attempts to separate the time-independent part of seismicity (background) fromthe time-dependent or clustered parts (after-shocks, foreshocks, and swarm type activity). Formost hazard-related studies, it is required that theseismicity behaves in a time-independent fashion(Reiter 1990; Giardini 1999; Frankel 1995). Work-ing with the time-independent dataset (from nowon called “declustered”) avoids biasing the aver-age rate assessments with data from, for example,prominent aftershock sequences that may not berepresentative of the average behavior of a crustalvolume. We test whether or not the temporaldistribution of events within the ECOS catalog isPoissonian (Knopoff 1964; Gardner and Knopoff

460 J Seismol (2009) 13:449–478
1974; Reasenberg 1985), which would argue thatdeclustering may not be necessary. We apply aχ2 test (Taubenheim 1969) to a variety of ECOSsubsets (in space, magnitude, and time) testingfor the null hypothesis: Earthquakes in the ECOSdataset are independent and follow a Poissoniandistribution. For all subsets, we find that the nullhypothesis can be rejected at a significance levelof 99.9%. Therefore, declustering the dataset isneeded.
There is no unique way to separate time-dependent earthquakes from background ones.We explored the two main declustering algo-rithms used in seismicity studies. The first ap-proach was introduced by Gardner and Knopoff(1974) and has been used in numerous hazard-related studies (e.g., Frankel 1995). It simplyremoves a space and time window after eachmainshock. We explored first of all the original pa-rameters given in Gardner and Knopoff (1974). Inaddition, we apply window parameters optimizedfor central Europe by Grünthal (personal commu-nication) and alternatives given by Uhrhammer(1986) and Youngs et al. (1987). The diversity ofthe window parameters illustrates again the non-uniqueness of declustering. The second approachwe evaluated is by Reasenberg (1985) who definesinteraction windows in space-time in a somewhatmore sophisticated way that attempts to intro-duce physical properties behind triggering. Thespatial and temporal extent of a cluster is notfixed, as it is in the windowing method, but de-pends on the development of an individual se-quence. Several free parameters in Reasenberg’salgorithm determine the degree of clustering thatis applied. When comparing the results of the twoapproaches in terms of total number of identifieddependent events (38.8% versus 47.7%) and interms of their contribution to the total momentreleased (0.94% versus 1.99%), Reasenberg’sand Gardener and Knophoff’s declustering ap-proaches vary considerably. However, sensitivitytests show that the difference in terms of re-sulting hazard is minor. We selected Gardenerand Knophoff’s approach with Grünthal’s para-meters as our preferred method because its pa-rameters are optimized for central Europe andresults seem to fit selected recent sequences inSwitzerland.
2.3.4 Estimating seismicity rates
Various approaches have been used to estimaterecurrence parameters in the past. The debatedquestions in this respect, despite the aforemen-tioned issues of completeness, are related to themost appropriate way to determine a and b values(least squares, weighted least squares, maximumlikelihood; see Bender 1983) and to the questionto the allowed degree of spatial variability of bvalues. We reviewed the existing literature andfound no fully satisfying approach. In light of therecently well-established spatial variability in bvalues (Schorlemmer et al. 2004a, b; Wiemer andWyss 1997, 2002), we feel that using an overallconstant b value, as done in many parts of theUSA (Frankel et al. 1997a), is not appropriate.However, we are also uncomfortable with thesometimes large variability of b values seen inregional zonations (Giardini et al. 1999; Jiménezet al. 2003), which we believe are often statisticalvariations due to the small sample sizes investi-gated (Wiemer and Wyss 2002). The question ofwhen a regional b value versus local ones shouldbe used has, in our opinion, not been answeredsystematically before, and here, we present a newapproach that integrates model selection theoryfor decision making.
The basic principles of our recurrence rate esti-mation are:
• Objectivity and reproducibility. The ratesshould be computed in an automatic fashionand reflect significant statistical measures;
• Simplicity. We use a simple model with fewparameters unless the data require a differentapproach.
To achieve these goals, we develop a multi-step scheme to assess the earthquake size distri-bution and activity rate. We use the truncatedexponential distribution, which is the earthquakerecurrence relationship most commonly used inPSHA. It is derived from the Gutenberg andRichter (1944) recurrence model by truncatingthe rate density of earthquakes at a maximummagnitude, Mmax. Other recurrence relationshipswere considered but ultimately rejected because:(1) there is little evidence for the validity ofdifferent recurrence laws in the literature and
J Seismol (2009) 13:449–478 461
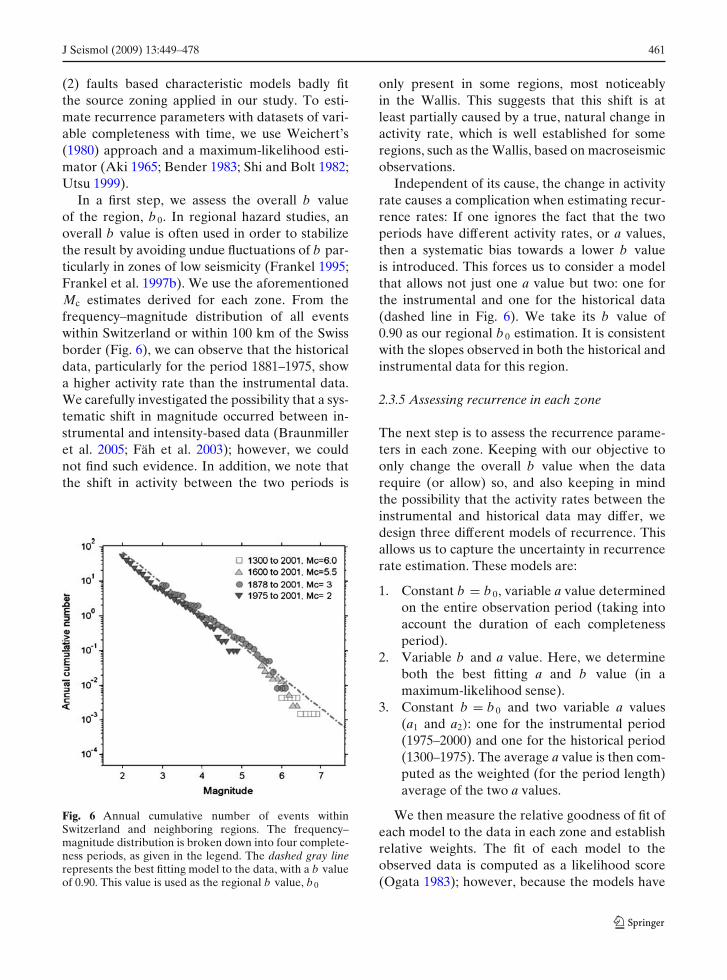
(2) faults based characteristic models badly fitthe source zoning applied in our study. To esti-mate recurrence parameters with datasets of vari-able completeness with time, we use Weichert’s(1980) approach and a maximum-likelihood esti-mator (Aki 1965; Bender 1983; Shi and Bolt 1982;Utsu 1999).
In a first step, we assess the overall b valueof the region, b 0. In regional hazard studies, anoverall b value is often used in order to stabilizethe result by avoiding undue fluctuations of b par-ticularly in zones of low seismicity (Frankel 1995;Frankel et al. 1997b). We use the aforementionedMc estimates derived for each zone. From thefrequency–magnitude distribution of all eventswithin Switzerland or within 100 km of the Swissborder (Fig. 6), we can observe that the historicaldata, particularly for the period 1881–1975, showa higher activity rate than the instrumental data.We carefully investigated the possibility that a sys-tematic shift in magnitude occurred between in-strumental and intensity-based data (Braunmilleret al. 2005; Fäh et al. 2003); however, we couldnot find such evidence. In addition, we note thatthe shift in activity between the two periods is
Fig. 6 Annual cumulative number of events withinSwitzerland and neighboring regions. The frequency–magnitude distribution is broken down into four complete-ness periods, as given in the legend. The dashed gray linerepresents the best fitting model to the data, with a b valueof 0.90. This value is used as the regional b value, b0
only present in some regions, most noticeablyin the Wallis. This suggests that this shift is atleast partially caused by a true, natural change inactivity rate, which is well established for someregions, such as the Wallis, based on macroseismicobservations.
Independent of its cause, the change in activityrate causes a complication when estimating recur-rence rates: If one ignores the fact that the twoperiods have different activity rates, or a values,then a systematic bias towards a lower b valueis introduced. This forces us to consider a modelthat allows not just one a value but two: one forthe instrumental and one for the historical data(dashed line in Fig. 6). We take its b value of0.90 as our regional b 0 estimation. It is consistentwith the slopes observed in both the historical andinstrumental data for this region.
2.3.5 Assessing recurrence in each zone
The next step is to assess the recurrence parame-ters in each zone. Keeping with our objective toonly change the overall b value when the datarequire (or allow) so, and also keeping in mindthe possibility that the activity rates between theinstrumental and historical data may differ, wedesign three different models of recurrence. Thisallows us to capture the uncertainty in recurrencerate estimation. These models are:
1. Constant b = b 0, variable a value determinedon the entire observation period (taking intoaccount the duration of each completenessperiod).
2. Variable b and a value. Here, we determineboth the best fitting a and b value (in amaximum-likelihood sense).
3. Constant b = b 0 and two variable a values(a1 and a2): one for the instrumental period(1975–2000) and one for the historical period(1300–1975). The average a value is then com-puted as the weighted (for the period length)average of the two a values.
We then measure the relative goodness of fit ofeach model to the data in each zone and establishrelative weights. The fit of each model to theobserved data is computed as a likelihood score(Ogata 1983); however, because the models have

462 J Seismol (2009) 13:449–478
different degrees of freedom (i.e., free parame-ters), these likelihood scores cannot be compareddirectly. If two models have the same likelihoodscore, the one with fewer free parameters shouldbe the preferred model because a simpler modeltends to be more robust. To find the best fittingmodel, we use the corrected Akaike informationcriterion, AICc (Kenneth et al. 2002):
AICc = −2 max (ln L) + 2 (P) + 2P (P + 1)
N − P − 1
with log L(a, b) being the log-likelihood function,P the number of free parameters, and N thesample size. In contrast to the original Akaikeinformation criterion (Akaike 1974; Imoto 1991;Ogata 1999), the corrected AICc penalizes for theamount of samples, which becomes critical forsmall sample sizes. The AICc is useful in selectingthe best model in the set; however, even thatmodel may be poor in an absolute sense (Kennethet al. 2002). The model with the lowest AICc isthe preferred model. For most zones in our whole-Switzerland model, model I is preferred. In theBasel zone and in few other zones, a lower bvalue is preferred. The AICc can also be usedto obtain weighted alternative models in orderto express the epistemic uncertainties in a logictree approach. The best model is determined byexamining their relative distance to the “truth”.The first step is to calculate the difference be-tween model i and the model with the overall low-est AICc:�i = AICc(i) - min(AICc). The relativeweight can then be described as:
wi = exp (−0.5 × �i)∑R
r=1 exp (−0.5 × �r)
where wi are known as Akaike weights for modeli and the denominator is simply the sum of therelative likelihoods for all candidate models.
In Fig. 7, we show the fit of the three modelsand their relative weights for eight zones, takenfrom the SEIS and TECTO models, and for ei-ther completeness models 1 or 2. Note that insome cases, all three models give almost identicalresults, while in others, the three models differsignificantly. All recurrence estimates and weightsare given in the Electronic Appendix.
�Fig. 7 Examples of the rate estimation for eight zonesfrom the SEIS and TECTO models. The recurrence para-meters, AICc scores, and estimated weights are given at thebottom of each frame
2.3.6 Maximum possible earthquake
The choice of the maximum possible earthquake,Mmax, might have a considerable influence onthe hazard, especially at longer return periods.Mmax is possibly the most difficult recurrence pa-rameter to assess in the study area because thephysical understanding of Mmax is poor and thedatabase is statistically very limited. We consid-ered several techniques for estimating Mmax usedin past hazard studies: (1) the EPRI approach(Johnston et al. 1994) based on a global data-base of stable continental regions; (2) regionalstrain-based constraints (Regenauer-Lieb andPetit 1997; DeMets et al. 1990); (3) global statis-tical models (Kagan 1999; Kagan and Jackson2000); (4) seismotectonic constraints (maximumavailable feature; Coppersmith 1994, Wells andCoppersmith 1994); (5) Kijko’s numerical ap-proach based on observed seismicity (Kijko andGraham 1998; Kijko et al. 2001); and (6) ‘onestep beyond’ method, which adds a constant in-crement to the observed maximum at each zone(e.g., Slejko et al. 1998). In our assessment,none of these provides a convincing and well-constrained answer. We therefore decided to firstof all derive main guiding principles for our Mmax
determination:
• Mmax should be relatively large because wesee no evidence from worldwide studies orseismotectonic constraints that rule out M6class events in any region of Switzerland. Thiskind of events may have recurrence rates ex-ceeding 10,000 years in most zones and mightnot be traceable in the historical or geologicalrecord. This view is supported by the work ofStrasser et al. (2006) who identified, based onlake sediments, three large (Mw ≥ 6.5) eventsin central Switzerland in the past 15 ka wherethe historical record shows no events of similarsize.
• Our Mmax assessment should reflect the uncer-tainty of this parameter.

J Seismol (2009) 13:449–478 463

464 J Seismol (2009) 13:449–478
Fig. 8 Example of asynthetic catalog. Left:Map of epicenters andsources zones used inmodel SEIS. Right:Cumulative (squares) andnon-cumulative(triangles)frequency–magnitudedistribution of events. Inthis case, Mmax wasassumed 7.2. Note thatfor plotting purposes, thecatalog in this figurecontains only50,000 years, and the maponly displays events withM ≥ 5
• Mmax should not vary between zones; thechoice of Mmax is, in our opinion, a genericone. This reflects the assumption that no fun-damental differences between tectonic regionsexist in the study regions that would justify adifferent behavior when it comes to Mmax.
To incorporate this principles, and to keep asimple model, we use only two different Mmax aslogic tree branches: Mmax = 7.2 and Mmax = 7.5.This model has the advantage of being simple,yet allowing capturing the influence of Mmax forsensitivity analysis. As it will turn out, the hazardsensitivity to Mmax is, as expected, only minor.
2.4 Predictive ground motion models
Ground motion relations, estimating ground mo-tions as a function of earthquake magnitude anddistance, are critical to seismic hazard assessment.A PGMM describes the attenuation of amplitudewith distance due to geometrical spreading andintrinsic attenuation, as well as the scaling of am-plitude with magnitude. The PGMM is generallythe element with the largest influence on the finalhazard results. It also is generally the largest con-tributor to uncertainties in hazard.
Numerous PGMMs have been proposed world-wide and specifically for central Europe in thelast two decades (Douglas 2003). Most studiesadopt a functional form introduced by Joyner andBoore (1981), with a constant geometrical spread-ing for all distances [e.g., Sabetta and Pugliese(1987) (Italy); Ambraseys et al. (1996) (Europe);Smit 1996 (Switzerland); Ambraseys et al. (2005)(Europe and Middle East)]. A different approach,applied by Malagnini et al. (2000a, b) in Italyand Germany, Malagnini and Herrmann (2000) inItaly, Morasca et al. (2006) in the Western Alp,and Malagnini et al. (2007) in the San FranciscoBay area, uses a stochastic simulation method(Boore 1983, 2003; Raoof et al. 1999) to predictground motions.
Recently, a dedicated study of attenuation andscaling for Switzerland was published by Bay(2002) and Bay et al. (2003, 2005). Followingthe approach by Malagnini et al. (2000a, b)and Malagnini and Herrmann (2000), Bay et al.modeled spectral ground motion (1 to 15 Hz) asa function of distance for events spanning themagnitude range 3.0<Mw ≤7.0 in Switzerland.The parameters were inverted from 2,958horizontal and vertical component waveforms ofsmall to moderate size events (2.0 ≤ ML ≤ 5.2) inthe distance range 10–300 km recorded on hardrock sites with an estimated shear-wave velocity

J Seismol (2009) 13:449–478 465
of about 1,500 m/s in the upper 30 m. The unitsare response-spectral displacements, pseudo-spectral velocities, and pseudo-spectral accelera-tions (Boore 2001, 2003). We use this study as thebaseline for our PSHA of Switzerland.
The distinction between aleatory variabilityand epistemic uncertainty is now widely viewed asa useful paradigm for seismic hazard analysis (e.g.,Toro et al. 1997). In PSHA, aleatory variabilitydetermines the shape of the hazard curve, whereasepistemic uncertainties, captured by the branchesof the logic tree, lead to families of hazard curves(e.g., Bommer et al. 2005). Note, however, thatwhile the distinction between aleatory and epis-temic uncertainties is conceptually useful, in prac-tice, the separation of the two is far from beingclear cut.
We distinguish between the two parts of aground motion model. (1) The true attenuationpart, which we consider well described by themodel given by Bay et al. (2003, 2005), because inour assumption, intrinsic attenuation and geomet-rical spreading are scale invariant. (2) The scalingwith magnitude, on the other hand, may be poorlyconstrained based on the small to moderate eventsin Switzerland. Here, we use scaling relationshipsderived for other regions where large events haveoccurred.
Ground motion scaling is a currently muchdebated topic in seismology. It is critical whenextrapolating towards larger magnitude events(Mayeda and Walter 1996; Ide and Beroza 2001;Ide et al. 2003). The critical scaling parameter of-ten referred to is “stress drop”, �σ , or “apparentstress drop” (Brune 1970; Choy and Boatwright1995), which is only somewhat related to the ac-tual physical drop in stress during an earthquake(Atkinson and Beresnev 1997). Even in areas withexcellent monitoring and with datasets containingseveral large events, such as California or Japan,it remains hotly debated if stress drop is con-stant or scales with magnitude. Bay et al. (2005)proposed a set of scaling models that are ableto explain the small stress drop (�σ ≈ 3 bars)observed for M3 class events in Switzerland, butis consistent with observed damages from largerevents and with worldwide scaling relationships.We use three different scaling models as input
for the hazard computations in order to expressepistemic uncertainty:
1. Increasing stress drop to a maximum of �σ ≈30 bars. In this model, which best fits theSwiss data at small magnitudes, stress dropscales proportionally to moment as M0.25
o asproposed by Mayeda and Walter (1996). Theupper bound for this increase is set to a stressdrop of �σ ≈ 30 bars, as it is found froma compilation of worldwide studies (Ide andBeroza 2001).
2. Same as model 1, but increasing to a maximumvalue of �σ ≈ 50 bars. This model assumesthat the largest events may have a higher thanaverage stress drop.
3. Constant stress drop of �σ ≈ 30 bars forall magnitudes. This model does not fit smallmagnitude seismicity in Switzerland well;however, it is a viable alternative for the haz-ard relevant event with M ≥ 5.0 where noSwiss data is available.
We also considered using alternative Europeanattenuation functions, such as the frequently usedAmbraseys et al. (1996). The comparison betweenthese PGMM (Bay et al. 2005) shows that formost distances, Ambraseys PGMM shows sig-nificantly higher ground motions; however, fordistances of less than about 10 km, the Swissmodels exhibit higher ground motions. While weare aware that comparing PGMM derived for dif-ferent magnitude ranges is problematic (Bommeret al. 2007), we feel that it would not be appropri-ate to use Ambraseys PGMM or other Europeanattenuation relationships because of the followingreasons:
1. The site class of Ambraseys is different; hisreference rock has a shear-wave velocity inthe upper 30 m that is about half of the oneestimated for our sites. While a conversion toa reference site is possible, this adds additionalaleatory uncertainty and hence artificially in-creases the hazard (Scherbaum et al. 2005).
2. The magnitude scales are different. WhileAmbraseys MS measurements can be con-verted to Mw, this again adds aleatory uncer-tainty and is difficult for magnitudes below

466 J Seismol (2009) 13:449–478
5.0 where MS is not well defined. Such smallevents contribute significantly to the hazard incountries of moderate seismicity, as illustratedby the Dec. 8, 2006 Mw = 3.2 induced eventunderneath Basel that caused significant non-structural damage in Basel. We also feel thatusing a PGMM model that is derived based onthe same magnitudes and site conditions usedfor recurrence estimation is most appropriatebecause this model is internally consistent.
3. The events considered and the tectonic en-vironments are quite different. The major-ity of Ambraseys earthquakes stem from theMediterranean area. Attenuation is differentin Switzerland (Bay et al. 2003). AmbraseysPGMM does not well fit the Swiss data interms of attenuation or scaling of small events.
The most appropriate choice of the PGMMmodel, however, remains a hotly debated issue inregions of low seismicity where one is forced toeither extrapolate to larger magnitudes from thesmall ones, or “import” data from other regions.The attention experts of the PEGASOS group, forexample, reached quite different conclusions onthis issue (see for example Scherbaum et al. 2006).
2.4.1 Aleatory uncertainty of PGMM
Including aleatory uncertainty is critical(Bommer et al. 2005; Bommer and Abrahamson2006). The aleatory uncertainty of the PGMM ofBay et al. (2005) includes parametric and model-ing uncertainties. Bay et al. (2005) computed anaverage log10 σ lg = 0.35. Note, however, that thisvalue includes scatter from source, path, and siteeffects. We feel that we are not able to divide σ lg
into intra- and inter-event contributions or reducethe site contamination because the availabledatabase is too sparse. When computing site-specific hazard, one has to be careful to considerthat σ lg already contains a sizeable (but unknown)site uncertainty component. We also—somewhatarbitrarily—truncate the uncertainty distributionof the PGMM at 2σ lg. While this truncation caninfluence the final hazard (Strasser et al. 2008),we will find in the subsequent sensitivity analysisshows that this truncation has little impact onthe median or mean hazard results; however, it
would becomes relevant for very low probabilityscenarios.
A final decision regarding the PGMM involvesthe shape of the model for very small distances.The PGMM cannot continue to increase pro-portionally to 1/r because the associated groundmotion would approach infinity. No data are avail-able for Switzerland to constrain this roll overdistance, rmin, and very little data exist withhypocentral distances below 2 km worldwide. Be-cause rmin is uncertain, we considered treating itas such through a logic tree branch, which allowsus to also study the sensitivity of the results tothis parameter. In our final model, we only usermin = 1 km, since sensitivity analyses showed onlya minor influence of rmin on hazard for the returnperiods we considered.
3 Hazard computation and results
3.1 Monte-Carlo simulation approach
Various computer codes to estimate seismic haz-ard based on a Cornell/McGuire-type approachare available, some commercial, some open source(Bender and Perkins 1987; Field et al. 2005).We decided to develop a synthetic catalog-basedimplementation of the Cornell–McGuire methodto compute probabilistic seismic hazard forSwitzerland and its uncertainty. Our method is,in principle, identical to Musson (2000). See alsoBeauval et al. (2006) for a review of the advan-tages of Monte Carlo-based hazard assessmentin regions of distributed seismicity. Our codewas validated against outputs of Frisk88 (RiskEngineering Inc.) for selected input models, whichgave identical hazard curves for the same set ofsimple input models.
The process of hazard computation for a givenfrequency, including the logic tree branchingshown in Figs. 8 and 9, follows these four steps:
1. Create a synthetic catalog of earthquakes forone logic tree branch based on the zoning mo-del as well as on Mc, a and b , and Mmax para-meters in each source zone. The catalog spansone million years and contains events down

J Seismol (2009) 13:449–478 467
Fig. 9 Logic tree setup ofthe hazard model.Weights for each branchare given in gray beneaththe branch. For the a andb value estimation, theweight (w) iszone-dependent
to magnitude 4.0, typically two million events.The depths of events are explicitly given.
2. Alternative source zonations, completeness,a, b , and Mmax models result in alterna-tive catalogs, a total of 24 in our case(2 × 2 × 3 × 2 = 24 branches). The three al-ternative a and b models and their weightingare considered within each catalog by creatingsubcatalogs of a duration that corresponds tothe AICc weighting factor (e.g., weight 0.6 =600,000 years). One example of such a catalogand its frequency–magnitude distribution isshown in Fig. 8.
3. Three alternative predictive ground motionmodels at a given frequency fi result in threebranches.
4. Each earthquake Ei from the catalog cre-ates a ground motion Yi at the receiver siteRi, computed based on the PGMM and arandomly drawn uncertainty in the range of±2σ lg. We rank these ground motions in de-scending order starting with the highest ob-served ground motion in any 1-year period.From these, we can extract the annual proba-bility of exceedance for any given probabilitylevel (Musson 2000).
The total number of alternative branches con-sidered is 72. We compute the median hazardand any desired fractiles, for example the 16and 84 percentiles that represent the one-sigmastandard deviation. We choose the median haz-ard curve following the arguments spelled out byAbrahamson and Bommer (2005). To computehazard maps, this procedure is repeated for all
nodes spaced evenly on a 5 × 5-km grid coveringSwitzerland.
3.2 Hazard results
We present selected results only; the completePSHA results for a range of frequencies andreturn periods, including also uniform hazardspectra, are available on the SED web page,www.seismo.ethz.ch. We compute and show onlyaccelerations in units of 5% damped accelerationresponse spectrum at a given frequency. Veloci-ties or displacements could also be computed us-ing the PGMM of Bay et al. (2005). First of all, weplot seismic hazard curves (annual probability ofexceedance as a function of spectral acceleration)for four selected sites in Switzerland, the locationsof Basel, Sion, Zurich, and Bern (Fig. 10). Asexpected, results show the highest hazard at Sionin the Wallis where historically (Fig. 2), most ofthe damaging events have been located. A seismichazard map, in units of 5% damped accelerationresponse spectrum (in cm/s2 at 5 Hz frequency),is shown in Fig. 11. The maximum accelerationobserved at 5 Hz is 151 cm/s2, respectively, andlocated in the Wallis. Other areas of increasedhazard are located in the Basel region, along theHelvetic Front and in Graubünden. The maps arecalibrated for a rock ground condition (a shearwave velocity of approximately 1,500 m/s in theupper 30 m). For softer soil conditions, site am-plifications must be considered and can be onthe order of a factor of 2–4 with respect to hardrock conditions (Fäh et al. 2003). We also plot thehazard maps for 1-Hz frequency for return periods

468 J Seismol (2009) 13:449–478
Fig. 10 Hazard curves forfour cities in Switzerland.Plotted is the medianannual probability ofexceedance as a functionof ground acceleration inunits of 5% dampedacceleration responsespectrum at 5 Hz
0 100 200 300 400 500 600 700 800 90010
10
10
10
Spectral acceleration (cm/s2)
An
nu
al p
rob
abili
ty o
f ex
ceed
ance
SionBernZurichBasel-1
-2
-3
-4
of 100, 475, 2,500, and 10,000 years in Fig. 12. Theirvalues of course are much lower than the ones forhigher frequencies. In addition, one notices that
the hazard is slightly less concentrated, which isa result of the reduced slope of the attenuationfunction at lower frequencies (Bay et al. 2003).
30 60 90 120 150cm/s2
Fig. 11 Seismic hazard map of Switzerland depicting thelevel of horizontal ground motion in cm/s2 (in units of5% damped acceleration response spectrum at 5-Hz fre-quency) expected to be reached or exceeded in a periodof 475 years (10% exceedance chance in 50 years). The
map is calibrated for a rock ground condition (Vs approxi-mately 1,500 m/s). Overall, the hazard level of Switzerlandranges between 5% and 15% of the acceleration of gravity(50–150 cm/s2)

J Seismol (2009) 13:449–478 469
Fig. 12 Same as Fig. 11,but for return periods of100, 475, 2,500, and10,000 years and a 1-Hzfrequency. Note that thescale (cm/s2) for thelongest return period isclipped in order to usejust one scale
With longer return periods, hazard is more con-centrated in the areas of highest hazard, the Wallisand Basel. In other words, the difference betweenthe lowest hazard areas in Switzerland, the Ticino,and the highest hazard area, the Wallis, increasesfrom about a factor of 2 for return periods of100 years to a factor of 7 for return periods of10,000 years. This is a result of the lower b valuesin the high hazard areas in some models, whichbecome increasingly relevant for longer returnperiods.
3.3 De-aggregation of hazard results
De-aggregation of hazard is required to under-stand what types of events contribute most tothe hazard for a given site. After specifying for agiven frequency a return period, one then deter-mines from which magnitude and distance rangethe hazard to a site stems. The results of the de-aggregation depend on the site of interest. Weshow for example results from one site only (Sion,Fig. 13). The general trend of all de-aggregationresults is that for longer recurrence intervals,the main hazard contribution comes from largerevents and closer-by distances. The overall shapeof the de-aggregation plots is determined by theattenuation relation, while the spread of the val-ues is largely a result of the sigma of the attenua-tion relation.
For Sion, we find that for a recurrence pe-riod of 100 years (spectral acceleration 53 cm/s2),most hazard is contributed from magnitude 4–5events at distances of 5–15 km (black squares inFig. 13). Note, however, that such small earth-quakes produce high peak accelerations at shortdistances, but their potential for widespread dam-age is limited because of their short duration andlow energy content. Larger distances and magni-tudes also contribute (gray squares). For 475 years(spectral acceleration 151 cm/s2), magnitude 5.0–6.0 events dominate. At 2,500 and 10,000 years(spectral accelerations of 368 and 708 cm/s2,respectively), we find that most hazard is stillcontributed from magnitude 5.0–6.5 events at dis-tances of 5–10 km. However, even at these largeground motion levels, events of M5 or smallercontribute significantly to the hazard; these eventswould be very close to the site and thus causeunusually large ground motions.
For other sites, such as Basel and Zurich (notshown), the results are quite comparable. A largercontribution to the hazard comes from deeperevents, which is a result of the greater hypocentraldepths in the Foreland compared to the Alps. Forreturn periods of 2,500 and 10,000 years, for Basel,we find a larger contribution from the highermagnitude range, similar to Sion. It is interestingto note that even for long return periods, therare largest events (M ≥ 7) are not a significantcontributor to design hazard.

470 J Seismol (2009) 13:449–478
Fig. 13 De-aggregationof the hazard results (inunits of 5% dampedacceleration responsespectrum at 5-Hzfrequency) for the site ofSion. The grayscale showsthe fractionalcontribution of eachmagnitude–distance bin.The different framesshows four returnperiods: 100, 475, 2,500,and 10,000 years
3.4 Sensitivity to input parameters
Sensitivity is studied in order to detect whichparameters are the most critical for the hazardcomputation. This can also offer guidance for fu-ture research activities. A number of input de-cisions were made based on sensitivity feedbackcomputed from a preliminary hazard model. Thishelped us to determine that:
• The type of declustering does not play asignificant role in the hazard assessment;Reasenberg (1985) declustering or the(Gardner and Knopoff 1974) approach withdifferent sets of input parameters do notsignificantly change the hazard output. There-fore, we decided to not include a logic treealternative branch for different declusteringalgorithms.
• Similarly, removing explosion events does notplay a significant role; hazard results do notchange significantly if dequarrying is appliedor not. Therefore, no logic tree alternativebranch is included for different dequarring.
• Soft borders in the hazard computation (grad-ually changing rates across zone boundaries)do not play a significant role as long as thesmoothing distance remains small. Therefore,again, no logic tree alternative branch is in-cluded for different border types.
• The choice of the magnitude of completeness(Mc) model has a moderate influence on thefinal hazard, Mc model 2 results show up to10% higher values overall, and, specificallyfor the Wallis region, with a slightly differentspatial distribution of hazard.
In Fig. 14, we show sensitivity analysis for eightparameters, all computed for 5 Hz and a site in the

J Seismol (2009) 13:449–478 471
10
10
10
10
Ann
ual p
roba
bilit
y of
exc
eeda
nce
Minimum Dist = 1 kmMinimum Dist = 3 kmMinimum Dist = 5 km
SEIS Source ModelTECTO Source Model
10
10
10
10
Ann
ual p
roba
bilit
y of
exc
eeda
nce
Sigma = 0.2Sigma = 0.3Sigma = 0.4
Cap at 1 sigmaCap at 2 sigmaCap at 3 sigma
0 100 200 300 400 500 600 700 80010
10
10
10
Spectral acceleration (cm/s2)
Ann
ual p
roba
bilit
y of
exc
eeda
nce
Bay 2005ABS 1996
Mmax = 7,2Mmax = 7.5
0 100 200 300 400 500 600 700 800 900
Spectral acceleration (cm/s2)
A
B
C
D
E
F
Fig. 14 Sensitivity analysis. Plotted are hazard curves (an-nual probability of exceedance as a function of groundacceleration in units of 5% damped acceleration responsespectrum at 5 Hz) for a site in the Wallis (Martigny),each evaluating the sensitivity to a specific input para-
meter of the hazard model: a Minimum distance of thePGMM; b Sigma of the PGMM; c Comparison between theAmbraseys et al. (1996) and Bay et al. (2005) attenuationlaws; d SEIS and TECTO source models; e Cap of thesigma in the attenuation law; f Maximum magnitude

472 J Seismol (2009) 13:449–478
Fig. 15 Top framesHazard maps at5 Hz/475-year returnperiod (spectralacceleration in cm/s2) forthe two different zoningapproaches. Left: ModelTECTO. Right: ModelSEIS. Bottom frames:Hazard maps at5 Hz/475-year returnperiod (spectralacceleration in cm/s2)
compared are thedifferent completenessmodels
cm/s2
cm/s2
Wallis (Martigni). From these figures, we derivethat minimum distance used in the PGMM (Fig.14a) has a minimal effect only on the hazard curve.The sigma of the attenuation (Fig. 14b) influencesthe hazard curve quite strongly, especially at lowannual probabilities of exceedance. This is con-sistent with other hazard studies (e.g., Bommerand Abrahamson 2006) and suggest also that acritical step in improving the hazard assessmentis related to an improved understanding of thescatter of ground motions. In Fig. 14c, we comparethe hazard curves computed based on the Bayet al. (2005) PGGM model employed in this studywith the one computed based on the Ambraseyset al. (1996) attenuation. The difference betweenthe two PGMM is largest for intermediate annualprobability of exceedance, with Bay et al. (2005)being up to one third lower. This is explainedby the fact that the contribution to the hazard atintermediate probabilities is dominated by eventsin the range 4.5–5.5 where the difference betweenthe two PGMM is largest (Bay et al. 2005). Thechoice of the zoning model has a moderate impacton the resulting hazard (Fig. 14d), with the SEISmodel resulting in hazard of up to 20% higherthan TECTO at long return periods. The sensitiv-ity analysis of the truncation level of the PGMM(Fig. 14e) suggests that the difference of a cut at2 or 3 sigma is minimal. Lastly, the choice of the
maximum magnitude Mmax has a minor influenceon the hazard (Fig. 14f).
When comparing the hazard maps at 5 Hz fora return period of 475 years for the SEIS andTECTO models (Fig. 15), we find that the lat-ter reaches peak values about 25% lower thanthe first. The overall appearance of the TECTOmodel is smoother; a result of the larger sourcezones (Fig. 4). Specifically, the hazard at Basel isreduced in absolute terms and relative to otherregions, such as Graubünden.
4 Conclusions
In this study, we present and discuss the new gen-eration of probabilistic seismic hazard assessmentfor Switzerland. This study replaces the previ-ous intensity-based generation of national hazardmaps of 1978.The PSHA builds upon extensiveresearch and database compilation over the last10 years. Progress was made in particular by usinga Swiss specific PGMM, which provides physicalunits of acceleration, velocity, or displacement.In addition, both the historical and instrumentalearthquake database were vastly improved andconverted to a uniform moment magnitude scale.We also developed a new zonation, which takesinto account an improved understanding of the

J Seismol (2009) 13:449–478 473
seismotectonic framework of the region. Finally,we implemented a 72-branch logic tree to charac-terize uncertainty in the seismic hazard. The finalmodel, the new national seismic hazard assess-ment for Switzerland, was released in late 2004.The new national building code of Switzerland(SIA code 261 2003) already reflects the changesseen in the 2004 hazard model both in terms ofthe zoning of Switzerland as well as the designacceleration. While the full PSHA was not readyat the time that the SIA code was designed, apreliminary version was available.
The presented hazard model differs from pre-vious assessments in a few aspects. It is not pos-sible to compare absolute values, since the oldgeneration of hazard assessment was created froman intensity-based attenuation relation. While themain activity centers in the Wallis and Basel re-main dominant in the hazard, the hazard mapspresented here (Fig. 11) are smoother across thecountry. Smoother hazard is found specificallyalong the Alpine Front, in the Graubünden, and inthe Wallis. These changes reflect the realization ofseismologists that the instrumental and historicalrecord is too short to be simply extrapolated intothe future. Events of magnitude 6–7 are now be-lieved to be possible in all regions of Switzerland,but in areas of low seismicity, their recurrenceintervals may be too long (>10,000 years) to beknown from the historical or even the paleoseis-mic record.
The fact that temporal and spatial non-stationarity of the earthquake catalog today isclearly seen but not easily understood. We do notknow why regions such as the Wallis are peri-odically more active for some years to decades,and we have currently no means of forecast-ing the next periods of higher activity. TheWallis, for example, has been relatively quietin the past 30 years when compared to otherperiods of history—but what does that implyfor the next 30 years? Consequently, currentPSHA for Switzerland must assume a time-independent Poissonian recurrence model, whichresults in larger uncertainties. Likewise, the phys-ical processes that determine spatial and temporalchanges in the earthquake size distribution arepoorly understood and hence cannot be integratedwell into a predictive model other than by extrap-
olation of the past. While we have made someprogress in understanding spatial variability in bvalues (e.g., Schorlemmer et al. 2004a, b), thereremains a significant research need.
PSHA inevitably involves a certain level of ex-pert opinion in the decision-making process andalso the logic tree branch weighting needed forthe final model because our knowledge of theunderlying processes is incomplete. The modeland its input parameters were reviewed by ateam of experts from within the SED; however,a different group of experts would make some-what different decisions. The group of PEGASOSexperts, for example, has derived an extensiveset of zoning model for the site-specific hazardassessment of the three sites of nuclear powerplants in Switzerland (Klügel 2005, 2007). We arenot in a position to quantitatively compare thevery complex PEGASOS zoning and recurrencemodels to the much more simple ones derivedhere; however, because both rely on the ECOSearthquake catalog, we speculate that the differ-ence are comparatively small. With respect to thePGMM, however, differences between the PE-GASOS experts and our assessment are signif-icant: The PGMM we use, based on Bay et al.(2005), results in significantly lower hazard whencompared to other PGMM (e.g., Fig. 14c, alsoScherbaum et al. 2006). Because our PGMM isconsistent with the SED Mw magnitude scale andsite conditions in Switzerland, thus reducing theneed for additional conversions because it is con-sistent with the observed ground motions of smallevents and calibrated in its stress drop to globalobservations, we feel that the decision made forthe Swiss National Seismic Hazard model is sensi-ble. The PEGASOS PGMM results are currentlybeing reviewed in a follow-up project, and anupdate of Bay et al. (2005) including more dig-ital broadband waveform data collected in thepast few years is also on the way, hopefullyallowing to resolve the difference between themodels.
Our hazard model, while largely following thewell-established route of PSHA established byCornell (1968) and McGuire (1976), includes sev-eral innovative aspects. Most importantly, we in-troduce a more objective way to assess the bvalues in individual zones. Using the AICc, we

474 J Seismol (2009) 13:449–478
are able to decide, based on an established sta-tistical criterion, if the data in a specific zonewarrants to be fitted with a zone specific b valueor if the overall b value is superior. Using AICweights, we are able to express objectively a rangeof alternative scenarios for the different (a, b)
models. This addresses a long-standing need inhazard assessment, and it stabilizes the resultingmodel by avoiding large fluctuations in b values.We recommend using such procedures in futurehazard assessments as a tool to improve the modelgeneration.
The new PSHA presented here is the cul-mination point of many years of investigationsby a diverse group of researchers. However, theprogress in our understanding of the earthquakeprocess, as well as the collection of new dataand the development of innovative approaches, isnot stopping. The SED is working toward the fu-ture generation of seismic hazard for Switzerland,anticipated for around the year 2011.
Acknowledgements The authors are indebted to all whocontributed in small or large part to the assessment ofthe seismic hazard of Switzerland. Special thanks to theM. Baer, F. Bay, A. Becker, F. Bernardi, J. Braunmiller, M.Ferry, S. Jenny, M. Garcia-Jiménez, M. Gisler, S. Heimers,S. Husen, P. Kästli, U. Kastrup, F. Kind, U. Kradolfer,M. Mai, S. Maraini, K. Monecke, M. Schnellmann, D.Schorlemmer, G. Schwarz-Zanetti, S. Steimen, J. Wössner,S. Wöhlbier and A. Wyss. This work was supportedby ETHZ, the Swiss Nuclear Safety Board (HSK), theSwiss National Foundation (SNF), Swissnuclear and byreinsurance and insurance broker companies (SwissRe,MünichRe, Benfield Greig). We like to thank J Bommer,one anonymous reviewers and the associate editor, G.Grünthal, for their detailed input that greatly helped toimprove the manuscript.
References
Abrahamson NA, Bommer JJ (2005) Probability and un-certainty in seismic hazard analysis. Earthq Spectra21(2):603–607. doi:10.1193/1.1899158
Abrahamson NA, Birkhauser P, Koller M, Mayer-Rosa D,Smit PM, Sprecher C et al (2002) PEGASOS—a com-prehensive probabilistic seismic hazard assessment fornuclear power plants in Switzerland. In: Proceedingsof the 12 ECEE, London, paper no. 633
Akaike H (1974) New look at statistical-model identifica-tion. IEEE Trans Automat Contr AC19(6):716–723.doi:10.1109/TAC.1974.1100705
Aki K (1965) Maximum likelihood estimate of b in theformula log N = a – b M and its confidence limits. BullEarthq Res Inst 43:237–239
Ambraseys N (2003) Reappraisal of magnitude of 20thcentury earthquakes in Switzerland. J Earthq Eng 7:149–191. doi:10.1142/S1363246903001073
Ambraseys NN, Simpson KA, Bommer JJ (1996)Prediction of horizontal response spectra in Europe.Earthq Eng Struct Dyn 25:371–400. doi:10.1002/(SICI)1096-9845(199604)25:4<371: :AID-EQE550>3.0.CO;2-A
Ambraseys NN, Douglas J, Sarma SK, Smit PM (2005)Equations for the estimation of strong groundmotions from shallow crustal earthquakes usingdata from Europe and the Middle East: horizontalpeak ground acceleration and spectral acceleration.Bull Earthq Eng 3:1–53. doi:10.1007/s10518-005-0-0183-0
Atkinson GM, Beresnev I (1997) Don’t call it stress drop.Seismol Res Lett 68:3–4
Bakun WH, Wentworth CM (1999) Estimating earthquakelocation and magnitude from seismic intensity data(vol 87, p 1502, 1997). Bull Seismol Soc Am 89(2):557–557
Bay F (2002) Ground-motion scaling in Switzerland: impli-cations for hazard assessment. PhD thesis no. 14567,Swiss Federal Institute of Technology, Zurich
Bay F, Fäh D, Malagnini D, Giardini D (2003) Spectralshear wave ground-motion scaling in Switzerland. BullSeismol Soc Am 93:414–429. doi:10.1785/0120010232
Bay F, Wiemer S, Fäh D, Giardini D (2005) Predic-tive ground-motions relationships for Switzerland:best estimates and uncertainties. J Seismol 9:223–240.doi:10.1007/s10950-005-5129-0
Beauval C, Hainzl S, Scherbaum F (2006) The impact ofthe spatial uniform distribution of seismicity on prob-abilistic seismic-hazard estimation. Bull Seismol SocAm 96:2465–2471. doi:10.1785/0120060073
Becker A, Davenport CA (2003) Rockfalls triggered bythe a.d. 1356 Basle earthquake. Terra Nova 15(4):258–264. doi:10.1046/j.1365-3121.2003.00496.x
Becker A, Davenport CA, Giardini D (2002) Palaeoseis-micity studies on end-Pleistocene and Holocene lakedeposits around Basle, Switzerland. Geophys J Int149(3):659–678. doi:10.1046/j.1365-246X.2002.01678.x
Bender B (1983) Maximum likelihood estimation of b-values for magnitude grouped data. Bull Seismol SocAm 73:831–851
Bender B, Perkins DM (1987) SEISRISK III: a computerprogram for seismic hazard estimation. US Geol SurvBull 1772:20
Bommer JJ, Abrahamson NA (2006) Why do modemprobabilistic seismic-hazard analyses often lead toincreased hazard estimates? Bull Seismol Soc Am96:1967–1977. doi:10.1785/0120060043
Bommer JJ, Abrahamson NA, Strasser FO et al (2004)The challenge of defining upper bounds on earthquakeground motions. Seismol Res Lett 75(1):82–95
Bommer JJ, Scherbaum F, Bungum H et al (2005) On theuse of logic trees for ground-motion prediction equa-

J Seismol (2009) 13:449–478 475
tions in seismic-hazard analysis. Bull Seismol Soc Am95(2):377–389. doi:10.1785/0120040073
Bommer JJ, Stafford PJ, Alarcón JE, Akkar S (2007)The influence of magnitude range on empirical ground-motion prediction. Bull Seismol Soc Am 97(6):2152–2170. doi:10.1785/0120070081
Boore DM (1983) Stochastic simulation of high-frequencyground-motion based on seismological models ofthe radiated spectra. Bull Seismol Soc Am 73:1865–1894
Boore DM (2001) Fortran programs for simulating ground-motions from earthquakes: version 2.0—a revision ofOpen-File Report 96-80-A. Open-File Report 00-509,US Geological Survey
Boore DM (2003) Prediction of ground-motion using thestochastic method. Pure Appl Geophys 160:635–676.doi:10.1007/PL00012553
Boore DM et al (1997) Equations for estimating horizon-tal response spectra and peak acceleration from west-ern North America earthquakes: a summary of recentwork. Seism Res Lett 68:128–153
Braunmiller J, Deichmann N, Giardini D, Wiemer S(2005) Homogeneous moment magnitude calibrationin Switzerland. Bull Seismol Soc Am 95(1):58–74
Brune JN (1970) Tectonic stress and the spectra of seis-mic shear waves from earthquakes. J Geophys Res75:4997–5009. doi:10.1029/JB075i026p04997
Budnitz RJ, Apostolakis A, Boore DM et al (1997) Recom-mendations for PSHA: guidance on uncertainty anduse of experts (No. NUREG/CR-6372-V1)
Burg JP, Van Den Driessche J, Brun JP (1994) Syn- to post-thickening extension in the Variscan Belt of WesternEurope: mode and structural consequences. Géol Fr3:33–51
Burkhard M (1990) Aspects of the large-scale Miocene de-formation in the most external part of the Swiss Alps(Subalpine Molasse to Jura fold belt). Eclogae GeolHelv 83(3):559–583
Choy GL, Boatwright J (1995) Global patterns of radiatedseismic energy and apparent stress. J Geophys Res100:18205–18226. doi:10.1029/95JB01969
Coppersmith KJ (1994) Conclusions regarding maximumearthquake assessment. The earthquakes of stablecontinental regions, 1: assessment of large earthquakepotential. Electric Power Research Institute, ReportTR-102261-V1, 1: a, 6-1-6-24
Cornell CA (1968) Engineering seismic risk analysis. BullSeismol Soc Am 58:1583–1606
Cotton F, Scherbaum F, Bommer JJ, Bungum H (2006)Criteria for selecting and adjusting ground-motionmodels for specific target regions: application toCentral Europe and rock sites. J Seismol 10(2):137–156. doi:10.1007/s10950-005-9006-7
Deichmann N (1992) Structural and rheological impli-cations of lower-crustal earthquakes below north-ern Switzerland. Phys Earth Planet Inter 69:270–280.doi:10.1016/0031-9201(92)90146-M
Deichmann N, Baer M, Braunmiller J et al (2000) Earth-quakes in Switzerland and surrounding regions during1999. Grunthal 93:23–45
DeMets C, Gordon RG, Argus DF, Stein S (1990)Current plate motions. Geophys J Int 101:425–478.doi:10.1111/j.1365-246X.1990.tb06579.x
Douglas J (2003) Earthquake ground motion estimationusing strong-motion records: a review of equationsfor the estimation of peak ground acceleration andresponse spectral ordinates. Earth Sci Rev 61(1–2):43–104. doi:10.1016/S0012-8252(02)00112-5
Eckardt P, Funk HP, Labhart T (1983) PostglazialeKrustenbewegungen an der Rhein-Rhone-Linie,Vermessung, Photogrammetrie. Kult Tech 2:43–56
Fäh D, Koch K (2002) Discrimination between earth-quakes and, chemical explosions by multivariate sta-tistical analysis: a case study for Switzerland. BullSeismol Soc Am 92(5):1795–1805. doi:10.1785/0120010166
Fäh D, Giardini D, Bay F et al (2003) Earthquake Cata-logue Of Switzerland (ECOS) and the related macro-seismic database. Eclogae Geol Helv 96(2):219–236
Field EH, Gupta N, Gupta V et al (2005) Hazard calcu-lations for the WGCEP-2002 earthquake forecastusing OpenSHA and distributed object technologies.Seismol Res Lett 76(2):161–167
Frankel A (1995) Mapping seismic hazard in the centraland eastern United States. Seismol Res Lett 66:8–21
Frankel A, Harmsen S, Mueller C et al (1997a) U. S. G.S. national seismic hazard maps: uniform hazard spec-tra, de-aggregation, and uncertainty. In: Proceedings,FEMA/NCEER workshop on the national represen-tation of seismic ground motion for new and existingbridges
Frankel A, Mueller C, Barnhard T et al (1997b) Seismichazard maps for California, Nevada and westernArizona/Utah. United States Geological SurveyOpen-File Report, pp 97–130
Gardner JK, Knopoff L (1974) Is the sequence ofearthquakes in Southern California, with aftershocksremoved, Poissonian? Bull Seismol Soc Am 64:1363–1367
Giardini D (1999) The global seismic hazard assess-ment program (GSHAP)—1992/1999. Ann Geofis 42:957–974
Giardini D, Grünthal G, Shedlock KM, Zhang PZ (1999)The GSHAP global seismic hazard map. Ann Geofis42(6):1225–1230
Grünthal G (1999) Seismic hazard assessment for Central,North and Northwest Europe: GSHAP region 3. AnnGeofis 42(6):999–1011
Grünthal G, Mayer-Rosa D, Lenhardt WA (1998)Abschätzung der Erdbebengefährdung für dieD-A-CH-Staaten—Deutschland, Österreich, Schweiz.Bautechnik 10:753–767
Gutenberg R, Richter CF (1944) Frequency of earthquakesin California. Bull Seismol Soc Am 34:185–188
Hsü KJ (1995) The geology of Switzerland. PrincetonUniversity Press, Princeton, New Jersey, USA
Husen S, Kissling E, Deichmann N, Wiemer S, GiardiniD, Baer M (2003) Probabilistic earthquake location incomplex three-dimensional velocity models: applica-tion to Switzerland. J Geophys Res 108(B2):ESE5.1–ESE5.20. doi:10.1029/2002JB001778

476 J Seismol (2009) 13:449–478
Ide S, Beroza G (2001) Does apparent stress vary withearthquake size? Geophys Res Lett 28:3349–3352.doi:10.1029/2001GL013106
Ide S, Beroza GC, Prejean SJ, Ellsworth WL (2003) Appar-ent break in earthquake scaling due to path and siteeffects on deep borehole recordings. J Geophys Res108(B5):2271. doi:10.1029/2001JB001617
Imoto M (1991) Changes in the magnitude frequency b-value prior to large (M-greater-than-or-equal-to-6.0)earthquakes in Japan. Tectonophysics 193(4):311–325.doi:10.1016/0040-1951(91)90340-X
Jaboyedoff M, Pastorelli S (2003) Perturbation of the heatflow by water circulation in a mountainous framework:examples from the Swiss Alps. Eclogae Geol Helv96:37–47
Jiménez MJ, Giardini D, Grünthal G (2003) The ESC-SESAME unified hazard model for the European–Mediterranean region. EMSC/CSEM Newsletter19: 2–4
Johnston AC, Coppersmith KJ, Kanter LR, Cornell CA(1994) The earthquakes of stable continental regions,vol. 1: assessment of large earthquake potential. Elec-tric Power Research Institute (EPRI TR-102261-V1)
Joyner WB, Boore BM (1981) Peak horizontal accelera-tion and velocity from strong motion records includ-ing records from the 1979 Imperial Valley, California,earthquake. Bull Seismol Soc Am 71:2011–2083
Kagan Y (1999) Universality of the seismic moment–frequency relation. Pure Appl Geophys 155:537–574.doi:10.1007/s000240050277
Kagan Y, Jackson DD (2000) Probabilistic forecast-ing of earthquakes. Geophys J Int 143:438–453.doi:10.1046/j.1365-246X.2000.01267.x
Kastrup U (2002) Seismotectonics and stress field vari-ations in Switzerland. PhD thesis no. 14527, ETHZurich, 153 pp
Kastrup U, Zoback ML, Deichmann N, Evans K, MichaelAJ, Giardini D (2004) Stress field variations in theSwiss Alps and the northern Alpine Foreland derivedfrom inversion of fault plane solutions. J Geophys Res109:B01402. doi:10.1029/2003JB002550
Kastrup U, Deichmann N, Frohlich A et al (2007) Evidencefor an active fault below the northwestern Alpine fore-land of Switzerland. Geophys J Int 169(3):1273–1288.doi:10.1111/j.1365-246X.2007.03413.x
Kenneth P, Burnham KP, Anderson DR (2002)Model selection and multimodel inference: a prac-tical information—theoretic approach. Springer,New York
Kijko A, Graham G (1998) Parametric-historic procedurefor probabilistic seismic hazard analysis - Part I: esti-mation of maximum regional magnitude m(max). Pa-geoph 152(3):413–442
Kijko A, Graham G (1999) “Parametric-historic” proce-dure for probabilistic seismic hazard analysis—partII: assessment of seismic hazard at specified site.Pure Appl Geophys 154(1):1–22. doi:10.1007/s000240050218
Kijko A, Lasocki S, Graham G (2001) Non-parametricseismic hazard in mines. Pure Appl Geophys 158(9–10):1655–1675. doi:10.1007/PL00001238
Kissling E (1993) Deep-structure of the Alps—what do wereally know. Phys Earth Planet Inter 79(1–2):87–112.doi:10.1016/0031-9201(93)90144-X
Klügel JU (2005) Problems in the application of theSSHAC probability method for assessing earthquakehazards at Swiss nuclear power plants. Eng Geol 78(3–4):285–307. doi:10.1016/j.enggeo.2005.01.007
Klügel JU (2007) Error inflation in probabilistic seis-mic hazard analysis. Eng Geol 90(3–4):186–192. doi:10.1016/j.enggeo.2007.01.003
Knopoff L (1964) Statistics of earthquakes in California.Bull Seismol Soc Am 54:1871–1873
Koch K, Fäh D (2002) Identification of earthquakesand explosions using amplitude ratios: the Vogtlandarea revisited. Pure Appl Geophys 159(4):735–757.doi:10.1007/s00024-002-8657-3
Lomax A, Zollo A, Capuano P, Virieux J (2001) Precise,absolute earthquake location under Somma-Vesuviusvolcano using a new three-dimensional velocity model.Geophys J Int 146(2):313–331. doi:10.1046/j.0956-540x.2001.01444.x
Malagnini L, Herrmann RB (2000) Ground-motion scal-ing in the region of the 1997 Umbria-Marche earth-quakes (Italy). Bull Seismol Soc Am 90:1041–1051.doi:10.1785/0119990150
Malagnini L, Hermann L, Di Bona L (2000a) Ground-motion scaling in the Apennines (Italy). Bull SeismolSoc Am 90:1062–1081. doi:10.1785/0119990152
Malagnini L, RB Herrmann RB, Koch K (2000b)Regional ground-motion scaling in central Europe.Bull Seismol Soc Am 90:1052–1061. doi:10.1785/0119990151
Malagnini L, Mayeda K, Uhrhammer R, Akinci A,Herrmann RB (2007) A regional ground-motion ex-citation/attenuation model for the San Francisco re-gion. Bull Seismol Soc Am 97:843–862. doi:10.1785/0120060101
Mayeda K, Walter WR (1996) Moment, energy, stressdrop, and source spectra of western United Statesearthquakes from regional coda envelopes. J GeophysRes 101:11195–11208. doi:10.1029/96JB00112
McGuire RK (1976) EQRISK: evaluation of sites for earth-quake risk. US Geological Survey, Open File Report,pp 76–67
Meghraoui M, Delouis B, Ferry M et al (2001) Activenormal faulting in the upper Rhine Graben andpaleoseismic identification of the 1356 Basel earth-quake. Science 293(5537):2070–2073. doi:10.1126/science.1010618
Morasca P, Malagnini L, Akinci A et al (2006) Ground-motion scaling in the Western Alps. J Seismol 10(3):315–333. doi:10.1007/s10950-006-9019-x
Musson RMW (2000) The use of Monte Carlo simulationsfor seismic hazard assessment in the UK. Ann Geofis43:1–9
Musson RMW, Toro GR, Coppersmith KJ et al (2005)Evaluating hazard results for Switzerland and hownot to do it: a discussion of “problems in the ap-plication of the SSHAC probability method for as-sessing earthquake hazards at Swiss nuclear power

J Seismol (2009) 13:449–478 477
plants” by J-U Klügel. Eng Geol 82(1):43–55.doi:10.1016/j.enggeo.2005.09.003
Ogata Y (1983) Estimation of the parameters in themodified Omori formula for aftershock frequenciesby the maximum-likelihood procedure. J Phys Earth31(2):115–124
Ogata Y (1999) Seismicity analysis through point-processmodeling: a review. Pure Appl Geophys 155(2–4):471–507. doi:10.1007/s000240050275
Pavoni N, Maurer HR, Roth P, Deichmann N (1997)Seismicity and seismotectonics of the Swiss Alps,deep structures of the Swiss Alps, results of NRP 20.Birkhäuser, Basel, Switzerland, pp 241–250
Raoof M, Herrmann RB, Malagnini L (1999) Attenuationand excitation of three-component ground-motion inSouthern California. Bull Seismol Soc Am 89:888–902
Reasenberg PA (1985) Second-order moment of CentralCalifornia seismicity. J Geophys Res 90:5479–5495.doi:10.1029/JB090iB07p05479
Regenauer-Lieb K, Petit JP (1997) Cutting of theEuropean continental lithosphere: plasticity theoryapplied to the present Alpine collision. J Geophys Res102(B4):7731–7746. doi:10.1029/96JB03409
Reiter L (1990) Probabilistic seismic hazard analyses—lessons learned—a regulators perspective. Nucl EngDes 123(2–3):123–128. doi:10.1016/0029-5493(90)90232-M
Reiter L (1991) Earthquake hazard analysis. ColumbiaUniversity Press, 254 pp
Rüttener E (1995) Earthquake hazard evaluation forSwitzerland, Matériaux pour la Géologie de laSuisse, Géophysique No 29 publié par la CommissionSuisse de Géophysique. Schweizerischer Erdbebendi-enst, Zürich, p 106
Rüttener E, Egozcue JJ, Mayerrosa D, Mueller S(1996) Bayesian estimation of seismic hazard for twosites in Switzerland. Nat Hazards 14(2–3):165–178.doi:10.1007/BF00128264
Rydelek PA, Sacks IS (1989) Testing the completenessof earthquake catalogs and the hypothesis of self-similarity. Nature 337:251–253. doi:10.1038/337251a0
Rydelek PA, Sacks IS (2003) Comment on “Minimummagnitude of completeness in earthquake catalogs:examples from Alaska, the western United States, andJapan,” by Stefan Wiemer and Max Wyss. Bull Seis-mol Soc Am 93(4):1862–1867
Sabetta F, Pugliese A (1987) Attenuation of peakhorizontal acceleration and velocity from Italianstrong-motion records. Bull Seismol Soc Am 77:1491–1513
Sabetta F, Pugliese A (1996) Estimation of responsespectra and simulation of nonstationary earthquakeground motions. Bull Seismol Soc Am 86(2):337–352
Sägesser R, Mayer-Rosa D (1978) Erdbebengefährdungin der Schweiz. Schweizerische Bauzeitung SIA78:3–18
Scherbaum F, Schmedes J, Cotton F (2004) On the con-version of source-to-site distance measures for ex-
tended earthquake source models. Bull Seismol SocAm 94(3):1053–1069. doi:10.1785/0120030055
Scherbaum F, Bommer JJ, Bungum H, Cotton F,Abrahamson NA (2005) Composite ground-motionmodels and logic trees: methodology, sensitivities, anduncertainties. Bull Seismol Soc Am 95(5):1575–1593.doi:10.1785/0120040229
Scherbaum F, Cotton F, Staedtke H (2006) The estimationof minimum-misfit stochastic models from empiricalground-motion prediction equations. Bull Seismol SocAm 96(2):427–445. doi:10.1785/0120050015
Schmid S, Kissling E (2000) The arc of the western Alps inthe light of geophysical data on deep crustal structure.Tectonics 19(1):62–68. doi:10.1029/1999TC900057
Schmid SM, Froitzheim N, Pfiffner OA, Schonborn G,Kissling E (1997) Geophysical–geological transect andtectonic evolution of the Swiss-Italian Alps. Tectonics16(1):186–188. doi:10.1029/96TC03723
Schnellmann M, Anselmetti FS, Giardini D, MckenzieJA, Ward SN (2002) Prehistoric earthquake historyrevealed by lacustrine slump deposits. Geology30(12):1131–1134. doi:10.1130/0091-7613(2002)030<
1131:PEHRBL>2.0.CO;2Schnellmann M, Anselmetti FS, Giardini D, Mckenzie
JN, Ward SN (2004) Ancient earthquakes at LakeLucerne. Am Sci 92(1):46–53
Schorlemmer D, Wiemer S, Wyss M (2004a) Earthquakestatistics at Parkfield: 1. Stationarity of b values. J Geo-phys Res Solid Earth 109(B12):B12307.1–B12307.17
Schorlemmer D, Wiemer S, Wyss M, Jackson DD (2004b)Earthquake statistics at Parkfield: 2. Probabilisticforecasting and testing. J Geophys Res Solid Earth109(B12):B12308.1–B12308.12
Schwarz-Zanetti G, Deichmann N, Fäh D et al (2003) Theearthquake in Unterwalden on September 18, 1601:a historico-critical macroseismic evaluation. EclogaeGeol Helv 96(3):441–450
Shi Y, Bolt BA (1982) The standard error of themagnitude–frequency b value. Bull Seismol Soc Am72:1677–1687
SIA (2003) Norm SIA261-Einwirkungen auf Tragwerke.Schweizerischer Ingenieur und Architekten Verein
Sissingh W (1998) Comparative tertiary stratigraphy ofthe Rhine Graben, Bresse Graben and MolasseBasin: correlation of Alpine foreland events. Tectono-physics 300(1–4):249–284. doi:10.1016/S0040-1951(98)00243-1
Slejko DL, Peruzza L, Rebez A (1998) Seismic hazardmaps of Italy. Ann Geofis 41(2):183–214
Smit P (1996) Datenerfassung und Bestimmung derAbminderung der Bodenbewegung bei Erdbeben inder Schweiz. PhD thesis, ETH-Zurich
Sommaruga A (1999) Décollement tectonics in the Juraforeland fold-and-thrust belt. Mar Pet Geol 16:111–134. doi:10.1016/S0264-8172(98)00068-3
Strasser M, Anselmetti FS, Fäh D et al (2006) Mag-nitudes and source areas of large prehistoricnorthern Alpine earthquakes revealed by slope fail-ures in lakes. Geology 34:1005–1008. doi:10.1130/G22784A.1

478 J Seismol (2009) 13:449–478
Strasser FO, Bommer JJ, Abrahamson NA (2008) Trunca-tion of the distribution of ground motion residuals.J Seismol 12(1):79–105. doi:10.1007/s10950-007-9073-z
Taubenheim J (1969) Statistische Auswertung geophysi-kalischer und meteorologischer Daten, Geophysikalis-che Monographien, akademische VerlagsgesellschaftGeest & Portig K.-G., Leipzig
Toro GR, Abrahamson NA, Schneider JF (1997) Modelof strong ground-motions from earthquakes in centraland eastern North America: best estimates and uncer-tainties. Seismol Res Lett 6:41–57
Truffert C, Burg JP, Cazes M, Bayer R, Damotte B, Rey D(1990) Structures crustales sous le Jura et la Bresse:contraintes sismiques et gravimétriques le long desprofils ECORS Bresse-Jura et Alpes II. Mem SocGeologique Fr 156:157–164
Trümpy R (1985) Die Plattentektonik und Entstehung derAlpen. Orell Füssli, Zurich, Switzerland
Uhrhammer R (1986) Characteristics of northern andsouthern California seismicity. Earthq Notes 57:21
Utsu T (1999) Representation and analysis of the earth-quake size distribution: a historical review and somenew approaches. Pure Appl Geophys 155(2–4):509–535. doi:10.1007/s000240050276
Villemin TF, Alvarez F, Angelier J (1986) The RhineGraben—extension, subsidence and shoulder uplift.Tectonophysics 128(1–2):47–5. doi:10.1016/0040-1951(86)90307-0
Waldhauser F, Kissling E, Ansorge J, Mueller S (1998)Three-dimensional interface modelling with two-dimensional seismic data: the Alpine crust-mantleboundary. Geophys J Int 135(1):264–278. doi:10.1046/j.1365-246X.1998.00647.x
Weichert DH (1980) Estimation of the earthquake re-currence parameters for unequal observation periodsfor different magnitudes. Bull Seismol Soc Am 70:1337–1346
Wells DL, Coppersmith KJ (1994) New empirical rela-tionships among magnitude, rupture length, rupturewidth, rupture area and surface displacement. BullSeismol Soc Am 84:974–1002
Wesson RL, Bakun WH, Perkins DM (2003) Associationof earthquakes and faults in the San Francisco Bayarea using Bayesian inference. Bull Seismol Soc Am93(3):1306–1332. doi:10.1785/0120020085
Wiemer S, Baer M (2000) Mapping and removing quarryblast events from seismicity catalogs. Bull Seismol SocAm 90:525–530. doi:10.1785/0119990104
Wiemer S, Wyss M (1997) Mapping the frequency-magnitude distribution in asperities: an improvedtechnique to calculate recurrence times? J GeophysRes 102:15115–15128. doi:10.1029/97JB00726
Wiemer S, Wyss M (2000) Minimum magnitude of com-plete reporting in earthquake catalogs: examples fromAlaska, the Western United States, and Japan. BullSeismol Soc Am 90:859–869. doi:10.1785/0119990114
Wiemer S, Wyss M (2002) Mapping spatial variability ofthe frequency–magnitude distribution of earthquakes.Adv Geophys 45:259–302
Wiemer S, Wyss M (2003) Reply to “Comment on ‘Min-imum magnitude of completeness in earthquake cat-alogs: examples from Alaska, the western UnitedStates, and Japan,’ by Stefan Wiemer and Max Wyss,”by Paul A. Rydelek and I.S. Sacks. Bull Seismol SocAm 93(4):1868–1871
Woo G (1996) Kernel estimation methods for seismic hazardarea source modeling. Bull Seismol Soc Am 86:353–362
Wüster J (1993) Discrimination of chemical explosions andearthquakes in central Europe—a case study. BullSeismol Soc Am 83:1184–1212
Ye S, Ansorge J, Kissling E, Mueller S (1995) Crustalstructure beneath the Eastern Swiss Alps derivedfrom seismic-refraction data. Tectonophysics 242(3–4):199–221. doi:10.1016/0040-1951(94)00209-R
Youngs RR, Swan FH, Power MS, Schwartz DP, GreenRK (1987) Probabilistic analysis of earthquake groundshaking hazard along the Wasatch Front, Utah. In:Glori P-L, Hays W-W (eds) Assessment of regionalearthquake hazard and risk along the Wasatch Front,Utah. US Geological Survey Open File Report,pp 1–110