A new evaluation of seismic hazard for the northwestern part of Saudi Arabia of Saudi
23
A new evaluation of seismic hazard for the northwestern part of Saudi Arabia Nassir S. Al-Arifi • R. E. Fat-Helbary • Ahmad R. Khalil • Aref A. Lashin Received: 11 September 2012 / Accepted: 23 May 2013 Ó Springer Science+Business Media Dordrecht 2013 Abstract A new evaluation of seismic hazard in the northwestern part of Saudi Arabia area has been carried out, for the minimization and mitigation of earthquake losses. The study area controlled by a number of major regional tectonic features including the Red Sea, Gulf of Suez, and Gulf of Aqaba—Dead Sea fault system and a larger number of recorded earth- quakes. A probabilistic seismic hazard analysis is performed within a logic-tree framework. The analysis started with an exhaustive revision of the seismic catalogues of the area and vicinity from which a catalogue has been declustered and homogenized at moment magni- tude, M w . According to the tectonic setting and spatial distribution of earthquakes in area and vicinity, twelve seismic zones are defined. The seismic hazard parameters, namely the b- parameter (of the Gutenberg–Richter relation), M max (the upper-bound magnitude), and, k (the annual rate of occurrence of earthquakes with minimum magnitude M min C 3), are calculated for each seismic zone. The ground-motion prediction models have been selected according to the tectonic regime associated with the earthquakes in each source zone. The results are displayed in the form of contour maps of peak ground acceleration and five ground- motion spectral periods for a return period of 475 years. The maximum peak ground accel- eration values are found around the Gulf of Aqaba and it is 325 gal for 475-year return period (equivalent to 90 % probability of non-exceedance in 50 years), while the lowest values in the eastern region is 75 gal. This is the first study developed at the northwestern part of Saudi N. S. Al-Arifi (&) A. A. Lashin Department of Geology and Geophysics, College of Science, King Saud University, Riyadh, Saudi Arabia e-mail: nalarifi@ksu.edu.sa R. E. Fat-Helbary Aswan Earthquake Research Center, NRIAG, Aswan, Egypt A. R. Khalil Prince Sultan Research Center for Environment, Water and Desert, King Saud University, Riyadh, Saudi Arabia A. A. Lashin Geology Department, Faculty of Science, Benha University, P.O. Box 13518, Benha, Egypt 123 Nat Hazards DOI 10.1007/s11069-013-0756-1
Transcript of A new evaluation of seismic hazard for the northwestern part of Saudi Arabia of Saudi

A new evaluation of seismic hazard for the northwesternpart of Saudi Arabia
Nassir S. Al-Arifi • R. E. Fat-Helbary • Ahmad R. Khalil •
Aref A. Lashin
Received: 11 September 2012 / Accepted: 23 May 2013� Springer Science+Business Media Dordrecht 2013
Abstract A new evaluation of seismic hazard in the northwestern part of Saudi Arabia area
has been carried out, for the minimization and mitigation of earthquake losses. The study area
controlled by a number of major regional tectonic features including the Red Sea, Gulf of
Suez, and Gulf of Aqaba—Dead Sea fault system and a larger number of recorded earth-
quakes. A probabilistic seismic hazard analysis is performed within a logic-tree framework.
The analysis started with an exhaustive revision of the seismic catalogues of the area and
vicinity from which a catalogue has been declustered and homogenized at moment magni-
tude, Mw. According to the tectonic setting and spatial distribution of earthquakes in area and
vicinity, twelve seismic zones are defined. The seismic hazard parameters, namely the b-
parameter (of the Gutenberg–Richter relation), Mmax (the upper-bound magnitude), and, k(the annual rate of occurrence of earthquakes with minimum magnitude Mmin C 3), are
calculated for each seismic zone. The ground-motion prediction models have been selected
according to the tectonic regime associated with the earthquakes in each source zone. The
results are displayed in the form of contour maps of peak ground acceleration and five ground-
motion spectral periods for a return period of 475 years. The maximum peak ground accel-
eration values are found around the Gulf of Aqaba and it is 325 gal for 475-year return period
(equivalent to 90 % probability of non-exceedance in 50 years), while the lowest values in
the eastern region is 75 gal. This is the first study developed at the northwestern part of Saudi
N. S. Al-Arifi (&) � A. A. LashinDepartment of Geology and Geophysics, College of Science, King Saud University, Riyadh, SaudiArabiae-mail: [email protected]
R. E. Fat-HelbaryAswan Earthquake Research Center, NRIAG, Aswan, Egypt
A. R. KhalilPrince Sultan Research Center for Environment, Water and Desert, King Saud University, Riyadh,Saudi Arabia
A. A. LashinGeology Department, Faculty of Science, Benha University, P.O. Box 13518, Benha, Egypt
123
Nat HazardsDOI 10.1007/s11069-013-0756-1

Arabia in terms of peak ground acceleration and different spectral acceleration—SA (T). As a
result, the new generation of maps will be useful in the revision of seismic codes of the area.
Keywords Seismic hazard � Saudi Arabia � Spectral acceleration � Ground motion
1 Introduction
The Saudi Arabia has been undergoing accelerated development in recent years and cur-
rently has one of the highest rates of construction in the world. The investigated area is
located between Lat. 26.5�–31.5�N and Long. 34�–38�E northwestern part of Saudi Arabia
(Fig. 1). Due to their proximity of the study area, the seismotectonic of the Dead Sea Rift,
Red Sea and Gulf of Suez, and a larger number of recorded earthquakes, special emphases
were placed on the study of seismic hazard in the selected area. This study is concerned
with obtaining a reliable estimate of the seismic hazard in terms of peak ground accel-
eration (PGA) and different spectral acceleration—SA (T) for the purpose of minimization
and mitigation of earthquake losses, and for the implementation of planning and socio-
economic development.
Different methods of approach and distribution equations have been developed and
applied in the evaluation of seismic hazard, e.g., Kawasumi (1957), Cornell (1968), Al-
germissen and Perkins (1976), Hattori (1979), Schenkova et al. (1981), Boore and Joyner
(1984), Kijko and Sellevoll (1990), and the applications of Poisson distribution and
Gumbel’s theory (1958) of extremes. The methods usually take into account the source-
propagation-site effects using the free or arbitrary zone method to obtain a frequency
relation; the seismic hazard or expected maximum value of ground motion for a given
interval of time is then estimated using probability distribution.
Some of these methods have been applied in some related studies of western Saudi
Arabia and adjacent areas (Ali 1984; Al-Noury and Ali 1986; Yucceman and Qa’dan 1987;
Thenhaus et al. 1989; Al-Haddad et al. 1994; Al-Amri 1995; Al-Amri et al. 2003) based on
arbitrary zonation of the seismic sources. These studies have drawn very different con-
clusions regarding the level of seismic hazard in NW Saudi Arabia area, with estimates of
the 475-year PGA in the study area ranging from \0.1 to 0.325 g.
Authors used different data catalogue that were gathered and cross-checked from dif-
ferent sources and networks and for deferent time spans that make the final product
(catalogue) as complete as possible. We also used different seismogenic zones, test each,
and conclude the best zones that lead the study to new results considered as an addition to
the seismic hazard of the study area. The study area will have an economical and geo-
strategic importance for the near future of the Middle East.
In this study, the probabilistic seismic hazard assessment (PSHA) is conducted because
it is widely considered as seismology’s most valuable contribution to earthquake hazard
assessment (Reiter 1991; Frankel 1995; Fat-Helbary 1995; Woo 1996; Giardini 1999;
Bommer et al. 2004; Deif et al. 2011). This approach is based on the assumption that
seismicity is Poissonian process, with event magnitude exponentially distributed and
equiprobability of occurrence over a seismogenic zone. The theoretical assumption of this
approach was first introduced by Cornell (1968), and it has been computerized by various
authors (Algermissen and Perkins 1976; McGuire 1976) by considering the seismic sources
as wide area or as linear faults. For each seismic source, the geometry, recurrence
Nat Hazards
123

relationship, and attenuation relation are needed. PSHA is performed utilizing CRISIS
2007 software (Ordaz et al. 2007). CRISIS 2007 accommodates uncertainty in the seis-
micity parameters and ground-motion scaling model, and has a user-friendly interface.
The effect of the aleatory uncertainty is taken into consideration in the hazard equation
and handled by CRISIS 2007 by specifying a mean value and bounds for the recurrence
parameters, the maximum magnitude of each seismogenic zone, and the predicted ground
motions. In this study, the epistemic uncertainties are treated by taking alternatives for the
seismotectonic models, and the ground-motion scaling relationship, which in turn impli-
cate several different estimates of the ground motion.
The output of a seismic hazard analysis using PSHA is expressed by the cumulative
probability distribution of a maximum ground-motion intensity parameter for individual
site. If a region with more than a single site is concerned, the seismic hazard analysis can
Fig. 1 Tectonic setting of the Dead Sea transform in the Middle East, compiled after Garfunkel et al.(1981); Salamon et al. (1996). Arrows indicate directions of relative motion at faults
Nat Hazards
123

be systematically applied to a grid of point and constructing a regional seismic probability
maps for acceleration or intensity levels corresponding to a given return period.
A probabilistic seismic hazard assessed to produce 5 % damped spectral acceleration
values on rock for the PGA, in addition to five spectral periods (0.1, 0.2, 0.3, 1.0, and 2.0 s)
for a return period of 475 years to define approximate uniform response spectra at each
0.25 9 0.25 grid nods.
2 Tectonic setting
Saudi Arabia comprises the largest part of the Arabian plate, which is characterized by a
variety of seismotectonic environments. These seismotectonic environments result from the
motion of the Arabian plate relative to other neighboring plates along narrow zones or
tectonic boundaries. Red Sea and Dead Sea fault systems have been identified as significant
boundaries relative to the study area (Fig. 1). The Red Sea is a NNW–SSE-trending
depression about 2,000 km long, separating Arabia and Africa (El-Shazly 1982). Morpho-
logically, the floor of the Red Sea is built of elongated main trough (from 15�N to the Sinai
Peninsula, 28�N), bisected in the south by a deeper and narrower axial trough (between 15�N
and 20�N) where the seafloor spreading process took place (Cochran 1983). North of 20�N,
the axial trough becomes discontinuous forming a series of large deeps spaced at about
50 km. The region to the north of 23�300N is interpreted as representing the late stage of
continental extension and is characterized by the presence of an axial depression.
At the northern end of the Red Sea, the active extensional features produced the strike-slip
motion along the Gulf of Suez in addition to the sinistral shear along the Gulf of Aqaba–Dead
Sea rift system (Ben-Menahem et al. 1976). It is postulated that these depressions were
formed by the anticlockwise rotation of Saudi Arabia away from Africa about a pole of
rotation in the central or south-central Mediterranean Sea (36.5�N, 18.0�E) (Le Pichon and
Gaulier 1988) and the Sinai sub-plate has moved relative to both Africa and Arabia.
The Suez rift is a slightly arcuate, generally NW (30�N–40�W, parallel to the major
normal faults) striking depression, 69–80 km wide, and about 500 km long (Steckler et al.
1988). Its structure is dominated by faults. The birth of the Gulf of Suez graben dates back
to the late Oligocene (Said 1969).
The Aqaba rift is 30–40 km wide and 110 km long; it forms the southern part of the
1,100 km long Dead Sea Rift that separates the Arabian Plate from the Sinai sub-plate.
Hosney (1985) suggested a late Miocene–Pliocene age of the Aqaba Gulf. The main faults of
Aqaba Gulf trend are N–S to NNE–SSW. The Aqaba Gulf–Dead Sea fault system is a left-
lateral transform fault linking the Zagros–Taurus area of plate convergence, with the Red
Sea opening (Lyberis 1988). Tectonically, the Gulf of Aqaba faulting structure is dominated
by a N–S strike-slip system that resulted in the creation of three en-echelon rhomb-shaped
grabens, similar to that at the Dead Sea (pull-apart basin), where changes in the trend to
NNW and back to N–S occur. These grabens are filled with a few kilometers of sediments.
The Red Sea and its northern extension, the Gulf of Suez, and the Gulf of Aqaba are
considered to be the result of divergence of the lithospheric plates.
3 Seismicity
Historical seismicity is reported to have been felt in the study area (northwestern Saudi
Arabia during the period from 95 BC to 1910 AD at different localities with intensities in
Nat Hazards
123
the range VI–IX). Some of these earthquakes have a macro-seismic magnitude determined
from the felt data and ranges from 5.4 to 6.7, while others have no defined magnitude. The
assigned intensity values are based on the reported damage that may be not homogeneous
either in time or space. From these historical activity, a conclusions can be made as
follows: (a) The only historical earthquake that has been reported in Gulf of Aqaba is the
March 18, 1068 earthquake (28.5 N and 36.7 E) that occurred in northern Hejaz and
caused destruction over hundreds of kilometers in northwestern Arabia and killed 20,000
people. While there are destructive earthquakes have been reported in the Gulf of Suez,
Jordan-Dead Sea transform, and Eastern Mediterranean regions (Ambraseys et al. 1994). In
addition, two earthquakes reported to have been felt in January 6, 1910 at 29.9 N and
33.8 E while the second one was felt in February 12, 1091 at 28.5 N and 34.0�E with an
intensity of VI–VII. This earthquake distribution may be due to the past population density
in the area. (b) The epicentral distribution of these historical earthquakes seems to correlate
with the general tectonics of the region. In the Gulf of Suez, four historical earthquakes
were reported in the southern part while in the northern part, there are six and there are no
reported earthquakes in the central part of the Gulf of Suez. Destructive earthquakes are
concentrated around Jordan-Dead Sea transform (El-Isa 1985; El-Isa and Hasweh 1988).
(c) At least nine historical earthquakes have occurred in the Jordan-Dead Sea transform
within the period 112–1546 AD (Ambraseys et al. 1994). Six of those are reported with
intensities in the range of VII–IX, i.e., with an overall average recurrence period of about
235 years. According to Ben-Menahem et al. (1976), twenty-six historical earthquakes
with magnitude ranging from 6.1 to 7.7 occurred in the south Jordan-Dead Sea transform in
the period 2150 BC to 1973 AD with an average recurrence period of 153 years.
Instrumental information of earthquakes in the study area during the period from 1900
to July 2012 was collected from a number of seismological catalogues and bulletins
including those of the International Seismological Centre (ISC), the National Earthquake
Information Service (NEIS). According to the analysis of instrumental earthquake distri-
bution (Fig. 2a), it is noticed that Sinai Peninsula is affected by number of earthquakes that
have been occurred within the period of 1900–2012 with wide range of magnitudes in the
range 2 \ M C 7.3. Strong earthquakes, as well as most of events with Ml B5, are con-
centrated into belts and extend along the geologically defined borders and margins of the
Sinai sub-plate. Low-moderate activity is noticed within the Sinai itself. The seismicity of
the region indicates that the Gulf of Aqaba has been the more active segment of the plate
boundary between Arabian plate and Sinai sub-plate. Since 1983, the Gulf region was
affected by four major earthquake sequences (Al-Arifi 1996; Al-Arifi et al. 2012): (a) the
first swarm was on January 21, 1983, which lasted within a few months. There were 181
earthquakes listed in the IPRG bulletin and 60 shocks from the swarm were recorded by the
Jordan University Seismological station. More than 500 shocks (Ml [ 3.5) were recorded
by Saudi local mobile network of 6 stations within a period of 72 days operation. The
largest shock had a magnitude of 5 and about 10 events had a magnitude greater than or
equal to 4.4 (El-Isa 1984). (b) The second swarm occurred in the southern part of Aqaba on
April 20–27, 1990 having a peak magnitude of Ml = 4.2. (c) The third swarm was on July
31, 1993 and continued until the end of August 1993. More than 600 events with 420 of
magnitude equal to or greater than 3. The main event (Ml = 5.8, Mw = 6.1) occurred on
August 3 and was felt on both side of the DST (Al-Arifi 1996; Al-Arifi et al. 2012). and
(d) the fourth swarm was on November 1995, which has been already described. On the
other hand, Wadi Araba segment of the Dead Sea transform has a lower activity level
during instrumental monitoring and this might be due to the lack of seismograph stations in
the vicinity of the fault. During this period, many earthquakes have occurred in the Gulf of
Nat Hazards
123

Suez region between latitudes 27�N and 30�N. The largest earthquake (M = 6.9) occurred
on March 31, 1969 with an epicenter at the entrance of the Gulf (lat. 27.61�N, long.
33.91�E) at Shadwan island.
3.1 Earthquake catalogue
Preparing a reliable, long and homogenous earthquake catalogue represents the starting
point for any seismic hazard assessment study regardless of the approach adopted. The
initial catalogue was compiled for a spatial region spanning 30� to 40� E and Latitude 24�to 34� N in spans periods from 1900 up to 2012. Any duplication in the resultant catalogue
is removed, and events with magnitude 3.0 and above are included (Fig. 2a). The earth-
quake data comprise instrumental data from the ISC online bulletin for the period from
1900–2012 (http://www.isc.ac.uk/). ISC relies on contributions from seismological agen-
cies around the world. To date, a total of 488 agencies have contributed to the ISC Bulletin,
throughout its history. Several seismological agencies have been contributed to the cata-
logue of the study area in addition to IASOEI and NEIC such as:
• HLW, National research Institute of Astronomy and Geophysics (Egypt)
• RYD, King Saud University (Saudi Arabia)
• JSO, Jordan Seismological observatory (Jordan)
• SNSN, Saudi National Seismic Network (Saudi Arabia)
• NSSC, National Syrian Seismological Center (Syrian)
• DUSS, Damascus University (Syrian)
• IPRG, Institute for Petroleum Research and Geophysics (Israel)
• LAO, Large Aperture Seismic Array (USA)
3.1.1 Catalogue processing
To satisfy the spatial and temporal principles of independence of the earthquakes, dependent
events in the catalogue (i.e., foreshocks and aftershocks) were removed (catalogue declus-
tering) and then the relative completeness of each magnitude level was identified.
There is no unique way to decluster the seismicity catalogues. Two main declustering
algorithms are usually in use. The first approach was introduced by Gardner and Knopoff
(1974) and has been used in numerous hazard-related studies (e.g., Frankel 1995; Deif et al.
2009). It simply removes a space and time window after each main shock. The second one is
provided by Reasenberg (1985) who defines interaction windows in space-time in a some-
what more sophisticated way attempting to introduce physical properties behind triggering.
The spatial and temporal extent of a cluster is not fixed, as it is in the windowing method, but
depends on the development of an individual sequence. Several free parameters in Reasen-
berg’s algorithm determine the degree of clustering that should be applied.
Gardner and Knopoff (1974) technique was applied because of its simplicity using their
original parameters. The process consisted of the definition of a temporal and spatial
window adapted to each range of magnitude (the larger the main shock, the larger the
temporal and spatial window). All earthquakes situated inside the window defined fol-
lowing a main shock were considered as aftershocks and removed from the catalogue
(Fig. 2b).
The compiled catalogue comprises a total of about 6,658 earthquakes. After applying
the declustering method, a total of 4,755 (71.42 %) events out of 6,658 were removed. The
map in Fig. 2b displays the declustered catalogue containing 1,903 events.
Nat Hazards
123

40° E30° E 39° E38° E37° E36° E35° E34° E33° E32° E31° E
34° N
33° N
32° N
31° N
30° N
29° N
28° N
27° N
26° N
25° N 250 0 250125
Kilometers
RED
SEA
MEDITERRANEAN SEA
Egypt
Saudi Arabia
Mw
2.8 to 3.73.7 to 4.64.6 to 5.45.4 to 6.3
40° E30° E 39° E38° E37° E36° E35° E34° E33° E32° E31° E
34° N
33° N
32° N
31° N
30° N
29° N
28° N
27° N
26° N
25° N 250 0 250125
Kilometers
RED SEA
MEDITERRANEAN SEA
Egypt
Saudi Arabia
3 to 3.83.8 to 4.64.6 to 5.55.5 to 6.36.3 to 7.1
(a)
(b)
6.3 to 7.1
Fig. 2 a The initial compiled catalogue in spans periods from 1900 up to 2012 for events with magnitude3.0 and above, b Declustered seismicity catalogue in spans periods from 1900 to 2012 and seismic sourcemodels employed for the PSHA presented in this study. The numbers relate to the seismic zones listed inTable 1
Nat Hazards
123

3.1.2 Magnitude scale
Surface wave magnitude in the catalogue is the most common scale upon which magni-
tudes have been reported in the early instrumental period (before 1964). Body wave
magnitude scale becomes more common in the instrumental period. In addition, moment
and local magnitudes are also available for some recent events. Most magnitude scales
saturate with increasing earthquake size. This occurs because magnitudes scale, aside from
moment magnitude (Mw), is determined using a seismic wave of particular period and
wavelength. Seismic waves, whose wavelength is much smaller than the earthquake
source, do not increase in amplitude as the earthquake source size increases.
To ensure the catalogue magnitude homogeneity, all events for which MW were not
reported were converted into this scale. Conversion of multiple magnitude measures to a
single, representative magnitude is performed using empirical relationships developed
directly from the various magnitude measures in the compiled catalogue. Events for which
a surface wave magnitude (Ms) and body wave magnitude (mb) are reported, the following
conversion equations proposed by Scordilis (2006) have been used:
Mw ¼ 0:85 mb þ 1:03; 3:5�mb� 6:2 ðr ¼ 0:29Þ
Mw ¼ 0:67 Ms þ 2:07; 3:0�Ms� 6:1 ðr ¼ 0:17Þ
Mw ¼ 0:99 Ms þ 0:08; 6:2�Ms� 8:2 ðr ¼ 0:20ÞWhile for events for which local magnitude (Ml) and duration magnitude (Md) are
reported, the following conversion equations by Al Kathery (2010) have been adopted:
Mw ¼ 0:742 Ml þ 0:754; ðr ¼ 0:042Þ
Mw ¼ 0:843 Md þ 0:281; ðr ¼ 0:092Þ
4 Seismic hazard analysis
4.1 Probabilistic seismic hazard assessment (PSHA)
The PSHA was first introduced by Cornell (1968) and has since then been widely adopted
and modified (McGuire 1978; Bender and Perkins 1987). This technique uses the widest
possible amount of data, combining seismological, geological, and geophysical data to
build up a model of the earthquake-producing processes. The following is a very brief
theoretical background of the PSHA. The seismic sources are defined according to geo-
tectonic considerations; it is assumed that, within a seismic source, an independent
earthquake-occurrence process is taking place.
For each seismic source, magnitude exceedance rates are the number of earthquakes, per
unit time, in which the magnitude M is exceeded, and they characterize the seismicity of the
source. Seismic sources are usually lines, areas, or volumes, so a spatial integration process is
carried out to account for all possible focal locations. The acceleration exceedance rates due
to a single source, the ith source, are computed using the following expression:
viðaÞ ¼X
j
wij
ZMu
M0
�dkðMÞdM
� �PrðA [ a M;Rij
�� ÞdM;
Nat Hazards
123
where M0 and Mu are, respectively, the minimum and maximum magnitudes considered in
the analysis, and Pr(A [ a M;Rij
�� Þ denotes the conditional probability that the chosen
ground-motion level a is exceeded for a given distance Rij and magnitude M. Rij are the
distances between the site and the sub-elements into which the source has been divided.�dkðMÞ
dM
h iis the probability density function of earthquake magnitude. A weight wij has been
assigned to each sub-element, and the expression above assumes that Swij = 1. Finally, the
contributions of all the sources—N- to earthquake hazard at the site are added:
vðaÞ ¼XN
i¼1
viðaÞ
Input parameters needed for performing a PSHA following the Cornell–McGuire
approach (Cornell 1968; McGuire 1976; Reiter 1991) are as follows.
1. An earthquake catalogue, which is used to derive recurrence rates and to estimate the
maximum possible earthquake for each seismic zone with potential hazard on the site
of interest.
2. A seismotectonic source model: this model identifies all the seismic sources that can
generate strong ground shaking at the site of interest. These seismic sources are shown
as map representations of lines (fault sources), and areal source zones that are defined
on the basis of a number of different types of geological, geophysical, and
seismological data. Within each seismic source, a single tectonic regime is assumed
to be responsible for the generation of earthquakes and all the points have the same
probability of being the focus of the future earthquake.
3. The seismicity recurrence characteristics for the seismic sources, where each source is
described by an earthquake recurrence relationship. A recurrence relationship indicates
the chance of an earthquake of a given size to occur anywhere inside the source zone
during a specified period of time. A maximum or upper-bound earthquake is chosen
for each source, which represents the largest event to be considered.
4. A predictive ground-motion model, which describes the attenuation of amplitudes of
ground motion as a function of distance and magnitude. Different models are
constructed for different frequencies and local site conditions. Below, we describe how
these input parameters were derived for the studied area.
Considering the short period for which earthquake data are available, there is insuffi-
cient information to calculate some of the parameters required precisely for PSHA. There
is therefore an element of uncertainty in what is known about the properties of any
seismogenic zone. Modern PSHA studies follow ideas proposed by Coppersmith and
Youngs (1986) to be able to deal with the uncertainty problem by incorporating into the
model what is known as a ‘logic tree,’ in which certain parameters are given a range of
possible values with weights as to the probability of each.
4.2 Earthquake source zones
Seismogenic zones are defined according to the present-day tectonic setting, recent and
historical seismicity, and the location of known faults in the area under study. The local
and regional seismicities of northwestern Saudi Arabia are divided into 12 seismogenic
zones (Fig. 3). These zones are related to the tectonic activity of the seismic trends that are
acting in the study area, Red Sea, Gulf of Suez also Gulf of Aqaba–Dead Sea rift trend.
Nat Hazards
123

Fig. 3 Alternative seismotectonics models used in seismic hazard calculations, seismogenic zones areshown
Nat Hazards
123

4.2.1 Northern Red Sea zones
The Red Sea and its two Gulfs Suez and Aqaba have experienced large damaging earth-
quakes; Archaeological evidences specify considerable earthquake activity and shear along
the Red Sea rift in the past times. Both of them has been examined by several authors;
Sieberg (1932), Maamoun (1976), Maamoun and Ibrahim (1978), El-Isa and Hasweh
(1989), Ambraseys et al. (1994), Abu El Enien (1997). These earthquakes frequently occur
in relation to the known active tectonic trends of the Red Sea–Gulf of Suez and of the East
Mediterranean Basin. The seismic activity in the northern Red Sea tends to follow the two
different structural trends and the shear zones of the Aqaba-Levant trend and the Gulf of
Suez zone (Maamoun et al. 1984).
The historical earthquakes that have been felt in the northern Red Sea (2200 BC to 1899
AD) were compiled by Badawy and Horvath (1999) from the Arabic documents and earlier
catalogue. Nine earthquakes believed to be occurred along the two Gulfs and Sinai during
that period. The most famous historical events are that of March 18 , 1068 (Levant Fault
area), May 20 , 1202 (Dead Sea), and July 11 , 1879 (Gulf of Suez) (Mahmoud 2003).
The recent seismicity of the Red Sea Rift clarifies the activity of the two Gulfs, the northern
and the southern Red Sea as well. They produce earthquakes of different magnitude levels
with moderate to high seismic activity. The seismicity of Red Sea axial trough clustered on or
near the transform faults of the deep axial trough in consistent with Alamri (1994) and
supports the interpretation of the magnetic anomalies in terms of seafloor spreading.
4.2.1.1 Gulf of Suez seismic zone It extends along the Gulf of Suez and represents the
broken arm of the northern Red Sea rift. Faulting of younger age was recognized in the
Gulf of Suez (Garfunkel and Bartov 1977), so the seismic expression of the current
information has to be expected. In the first half of the last century, it was believed that the
Gulf of Suez is aseismic and its activity may be related to the Red Sea rift transferred into a
shear on the Dead Sea transform (Le Pichon and Gaulier 1988). Recent seismic activity has
been proved along the gulf of Suez Ben-Menahem (1979) and Salamon et al. (1996). The
epicentral distribution of the micro-earthquakes shows clustering beneath Gobal Island,
southern Gulf of Suez, while the scattering events existed beneath the southern borders of
the gulf Daggett et al. (1986). The focal mechanism solutions of March 31, 1969 earth-
quake revealed the continuous activity.
High rate of seismicity at the southern end of the Gulf of Suez is attributed to the crustal
movements among the Arabian plate, African plate, and the Sinai sub-plate. The activity along
the Suez Gulf is supported by the recent seismic activity observed by the National Research
Institute of Astronomy and Geophysics (NRIAG-Bulletins 1994–2012, Helwan Egypt).
Based on the regional dip of the fault block, Meshref 1990 classified the Gulf of Suez
structurally into three zones: southern Gulf of Suez (SGS), middle Gulf of Suez (MGS),
and northern Gulf of Suez (NGS). SGS zone is characterized by intensive structural
deformation and as a result moderate to high earthquake activity and earthquake swarms as
well. The largest instrumental event recorded in SGS is Mw 6.9 on March 31, 1969 and 5.5
in 1972. The prevailing mechanism of this zone is extensional on the clysmic trend with
normal faulting. MGS is located in the middle of the Gulf, it is of low seismicity compared
to SGS. Focal mechanism solution showed strike-slip faulting with normal component;
therefore, it can be considered as a separate seismogenic zone. The largest event occurred
in this zone is Shukir 1983 mb = 5.3, it shows strike-slip faulting with minor normal
component (Maamoun 1985).NGS is located in the northern tip of the Gulf, it is of low
Nat Hazards
123

seismic activity but according to NRIAG 1994–2012, it is still active. Historically, it
suffered a unique large earthquake in 742 AD with intensity VII. The focal mechanism
solution revealed normal faulting (El-Hefnawy et al. 2006).
4.2.1.2 The Aqaba–Dead Sea levant trend The Aqaba Gulf is documented as an active
seismic trend where many destructive earthquakes have been occurred. The historical
records of large and catastrophic earthquakes revealed that the Aqaba–Dead Sea Fault
System is of significant seismic hazard. The earthquakes of this trend are of shallow foci
and tend to occur along NE-trending faults. An earthquake with magnitude larger than
(Mw = 7.6) for the fault between the Dead Sea and the Aqaba Gulf (Wells and Copper-
smith 1994). The b value = 1.2 was determined by El-Sayed and Walhstrom (1996).
(a) The Dead Sea Zone This zone extends from Lebanon Mountains in the north (lat.
30.9–33.5N) to Arava Valley (Wadi Araba) in the south, including the Dead Sea and
Jordan River basins. Basically, the Dead Sea Rift is a pull-apart basin that formed as a
result of the shear movements along the Levant Faults System (Hatzor and Reches 1990).
The Dead Sea margins are asymmetrical with steeper bounding faults on the eastern
margins (Barazangi 1983). Several historical and instrumental earthquakes were docu-
mented. The largest historical earthquake occurred in January 1546 (Mw = 7.0). The
largest recent two events are those of March 1903 (Mw = 5.7) and July 1927 (Mw = 6.3)
where 500 were killed and 700 were injured (Al-Tarazi 1999).
(b) The Gulf of Aqaba zone This zone encompasses the Gulf of Aqaba and Arava Valley
to the north gulf, it extends between 28 and 30.9N. The earthquakes sequences of this zone
mainly characterized by left-lateral strike-slip mechanism along the main axis of the gulf
and normal slip along transverse faults. May 1212 (Mw = 6.7) is the largest historical
earthquake and the largest instrumental one is the November 22 , 1995 (Mw = 7.2).
Earthquake larger than 6 is predictable with an average return period 1,000–3,000 years
according to the paleoseismicity, Shapira and Jarradat (1995).
4.2.2 Eastern Mediterranean seismic zone
The seismic activity of this zone is relative to the movement of the surrounding plates. This
zone has experienced significant damage earthquakes. The eastern Mediterranean region is
known to be seismically active over a period of more than 2,000 years based on historical
and instrumental records. The tectonic and seismotectonic studies reflect highly compli-
cated tectonic setting. The area could be divided into seven major tectonic zones; in this
study, we consider only two of them, which can affect the area under study.
4.2.3 Volcanic zone
Harrat Lunayyir Volcanic area is located in the Arabian shield of northwestern Saudi
Arabia, immediately east of the Red Sea port of Umm Lajj. It is an area of extensive
basaltic lava flows and about fifty small volcanic cones. The center of the volcanic field is
about thirty miles inland from the Red Sea. Individual lava flows radiate out in all
directions from the center of the field. They follow stream valleys through the desert. Two
of the flows have reached the Red Sea, but they are now covered by sand along the coast.
The youngest lava flows at Harrat Lunayyir were produced by eruptions that occurred
about 1,000 years ago. Until 2009, the field was considered to be inactive because no
evidence of recent activity had been identified. Then, between April and June 2009, a
Nat Hazards
123
swarm of over 30,000 earthquakes occurred beneath the volcanic field and a fissure about
five miles long opened to a width of about three feet. The enormous number of earthquakes
was a cause for concern. About 20 earthquakes were over magnitude 4 and a magnitude 5.4
earthquake on May 19, 2010 damaged buildings in the town of Al Ays.
4.2.4 Tabuk zone
This zone follows NW-trending faults that represent the northern extension of the Najd
Fault System. The seismicity of the zone is attributed to the reactivation movement of the
preexisting faults. It is characterized by low seismic activity concentrated along tabuk
Graben. It is located to the north of N–S Hail volcanic arc line of Cenozoic age. Histor-
ically, it is suffered from to large geological events, one is the volcanic eruptions of Harrat
Kishb, Khayber, Almadinah, and Rahat (Adams and Barazangi 1984) and the other one is
large earthquake with Magnitude 7.0 on March 1068, with intensity VII–IX, It caused
major damage and killed 20,000 people (Ambraseys et al. 1994). Another damaging
earthquake was documented on January 1, 1588 with intensity VII–IX, it is located at the
extension of structural trend starts from Tabuk parallel to the Red Sea up to Jordan.
4.3 Seismotectonic source models
The seismotectonic source model is always defined on the basis of available tectonic
setting, geophysical, and seismological data. The process of defining the seismotectonic
model is a matter of expert judgment; thus, it is clouded by some uncertainty. According to
the tectonic setting in the previous section and the spatial distribution of earthquakes in the
study area and the surrounding area, twelve seismic zones are identified in order to analyze
the seismic hazard according to area source model as in Fig. 3. Within each seismic source,
a single tectonic regime is assumed to be responsible for the generation of earthquakes and
all the points have the same probability of being the focus of the future earthquake. The
seismotectonic model shown on the map in Fig. 3 for two models tested in this study. Each
model comprises zones that show seismic activity and geological activity.
Because of the uncertainties in the seismological, geophysical, and geological data, i.e.,
because of existence of modeling uncertainties, we had to define several alternative seis-
motectonic models. The seismotectonic models tested in this study area are shown in
Fig. 3. For treating the epistemic uncertainties, model A is selected for the final solution.
Based on the spatial distribution of epicenters and reported active faults and focal
mechanism solutions, the seismogenic zones for model (a) are mapped into 12 seismogenic
zones as shown in Fig. 3 and Table 1. Mediterranean Sea zones part 1 and part 2; Dead Sea
zone; Jordan zone and East Jordan zone; Gulf of Suez zone; Sinai peninsula zone; Red Sea
1; Tabuk region zone; Zone 10 named as Red Sea 2 zone; Zone 11 named as Volcanic
Zone; and finally Zone 12 is the Gulf of Aqaba.
Alternative seismotectonic model B is defined based on the geological and structural
characteristic; therefore, zone 6 (Gulf of Suez) seismogenic zone is divided into three
subzones structurally and geologically; according to El-Hefnawy et al. 2006, he classified
the gulf of Suez into three zones such as northern Gulf of Suez (NGS), Middle Gulf of Suez
(MGS), and the southern Gulf of Suez (SGS). The Gulf of Aqaba Zone (12) also is divided
into three zones according to Garfunkel et al. (1981); Gulf of Aqaba is underlined by three
grabens filled with sediments, three basins are also found to be seismically active char-
acterized with earthquake swarms, Eilat deep, aragonese deep and Daka deep (Klinger
et al. 1999).
Nat Hazards
123

4.4 Estimation of seismic hazard parameters
4.4.1 Recurrence parameters
The seismicity of a seismogenic zone is quantified in terms of the recurrence relationship:
Log NðMÞ ¼ a� bM
where N is the number of earthquakes of magnitude M or greater per unit time. The a value
is the activity and defines the intercept of the above recurrence relationship (Gutenberg and
Richter 1944) at M equals zero. The number of occurrences per year of a hazardous event
(e.g., the annual frequency that the ground-motion parameter, X, at a site exceeds a
specified value x) is defined as the annual frequency and usually denoted as k (X C x). The
parameter b is the slope, which defines the relative proportion of small and large earth-
quakes (Fig. 4).
Figure (4a) cumulative number of the earthquakes as a function of time of the catalogue
used in this study, figure (4b) an example of a typical frequency magnitude distributions in
this study. The slope of the red line corresponds to the b-value.
All seismic sources were assumed to generate earthquakes according to a doubly
bounded exponential distribution (Cornell and Vanmarcke 1969). This is because the
Gutenberg and Richter (1944) relationship imposes the unrealistic assumption that the
maximum potential earthquake for any seismotectonic setting. The following truncated
exponential recurrence relationship is therefore commonly used in practice:
Nð�MÞ ¼ aexp½�bðM �MminÞ� � exp½ðMmax �MminÞ�
1� exp½�bðMmax �MminÞ�
where a = N(Mmin), Mmin is an arbitrary reference magnitude, Mmax is an upper-bound
magnitude where N (m) = 0 for M [ Mmax, and b = b 9 lin10. In this form, earthquake
frequency approaches zero for some chosen maximum earthquake of a region.
The compiled catalogue has varying levels of completeness and these must be
accounted for when deriving activity parameters for the seismic sources. The parameters of
Table 1 Seismicity parameters for all seismic sources
Zone No. Zone name Mmax k r (k) b r (b) b r (b)
Z-1 Mediterranean Sea 1 6.3 16.98 2.4 2.12 0.09 0.92 0.04
Z-2 Mediterranean Sea 2 5.4 23.21 3.36 2.58 0.12 1.12 0.05
Z-3 Dead Sea 6.7 29.58 2.75 2.73 0.09 1.19 0.04
Z-4 Jordan 4.8 114.05 14.11 3.40 0.14 1.48 0.06
Z-5 East Jordan 4.8 9.46 1.79 2.42 0.13 1.05 0.06
Z-6 Gulf of Suez 6.7 27.82 3.21 2.00 0.11 0.87 0.05
Z-7 Sinai triangle 5.4 17.40 2.56 2.42 0.12 1.05 0.05
Z-8 Red Sea 1 5.6 14.83 2.40 1.94 0.14 0.84 0.05
Z-9 Tabuk region 5.4 16.93 2.93 2.30 0.15 1.00 0.06
Z-10 Red Sea 2 6.0 10.40 1.73 2.03 0.11 0.88 0.05
Z-11 Volcanic zone 6.1 7.78 2.78 2.10 0.16 0.91 0.07
Z-12 Aqaba Gulf 6.8 54.27 6.02 2.20 0.11 0.96 0.05
Mmax is an upper-bound magnitude, Mmin = 3, k is the annual frequency and b = b 9 ln10
Nat Hazards
123

the doubly bounded exponential distribution were obtained in this study using the maxi-
mum likelihood estimation procedure of Weichert (1980).
In many regional hazard studies, an overall b value is often used in order to stabilize the
results by avoiding undue fluctuations of b particularly in zones of low seismicity (Frankel
1995; Frankel et al. 1997; Deif et al. 2009).
4.4.2 Maximum earthquake estimation
Maximum magnitude mmax was calculated within the seismic sources using statistical
procedure of Kijko (2004), using the following equations:
Fig. 4 a Cumulative number of the earthquakes as a function of time of the catalogue used in this study,b an example of a typical frequency magnitude distributions in this study. The slope of the red linecorresponds to the b-value
Nat Hazards
123

mmax ¼ mobsmax þ
Zmmax
mmin
½FmðmÞ�ndm;
where Fm(m) is the cumulative density function (CDF) of magnitude.
From this equation, an estimated value of mmax can be obtained only by iteration. This
equation states that mmax is equal to the largest observed magnitude mobsmax plus an amount
D ¼Rmmax
mminFmðmÞ½ �ndm: This equation is valid for any CDF, Fm(m) and does not require the
fulfillment of any additional conditions. It may also be used when the exact number of
earthquakes, n, is not known. In this case, the number of earthquakes can be replaced by
kT. Such a replacement is equivalent to the assumption that the number of earthquakes
occurring in unit time conforms to a Poisson distribution with a parameter k, with T the
span of the seismic catalogue. It is also important to note that, since the value of the
integral D is never negative, the equation provides a value of mmax, which is never less than
the largest magnitude already observed. The integration D for the Gutenberg–Richter
relationship that bounded from above is given by:
D ¼Zmmax
mmin
1� exp½�bðm� mminÞ1� exp½�bðmobj
maxÞ � mmin�
" #n
dm
This integral is not simple to evaluate; therefore, Kijko (2004) replaced [FM (m)]n by Cramer’s
(1961) approximation exp{-n[1 - [FM(m)]}. The integral is then solved to give mmax.
In any remaining cases, the maximum magnitude was obtained by adding 0.5 units to the
maximum observed magnitude. The paucity of data related to these sources necessitates
applying this approach, although it is not an ideal one. The maximum magnitude values for
each seismic zone are given in Table 1, while the minimum magnitude for each seismic zone
is equal 3. The seismicity parameters of all seismogenic zones are listed in (Table 1).
4.5 Ground-motion prediction models
The ground-motion prediction models have been selected according to the tectonic regime
associated with the earthquakes in each source zone. The models of Youngs et al. (1997)
are used to model the ground motions from subduction zone earthquakes occurring within
the Mediterranean sources, while the model of Boore et al. (1997) has been used for Gulf
of Aqaba–Dead Sea rift system and active shallow crustal zones. These models were
incorporated within a logic-tree framework. Therefore, they must be transformed into
common metrics (Bommer et al. 2005).
Fortunately, the software used to perform the hazard calculations, CRISIS 2007 (Ordaz
et al. 2007), uses tabulated ground-motion values to define the level of ground motion
corresponding to a particular magnitude distance scenario. This framework enables the
distance conversion to be implemented very easily. In the current study, distance metrics
are handled in a straight forward manner using the software package CRISIS 2007.
5 Hazard calculations
The hazard calculations were performed using the CRISIS 2007 software (Ordaz et al.
2007). The software is essentially an implementation of the Cornell (1968) PSHA
Nat Hazards
123

framework, with the aleatory variability in the ground motion explicitly included (Bommer
and Abrahamson 2006). All sources were assumed to behave in a Poissonian manner and
only earthquakes of Mw C 3.0 were deemed to be of engineering significance. The alter-
nated seismic source zonations, activity rates, and ground-motion models that have pre-
viously been discussed are all incorporated into the hazard calculations through the use of
logic-tree formulation. Uncertainties, due to errors associated with the delineation of the
source boundary and attenuation model, were mindfully treated using the logic-tree for-
mulation. The numerical calculations were done in points of a grid covering all selected
region, equi-spaced 0.25� in latitude and longitude, in terms of PGA and period spectral
accelerations SA (T) for T = 0.1, 0.2, 0.3, 1.0, and 2.0 s and for 475-year return period.
6 Results
In this study, the probabilistic assessment using the logic-tree framework are treated to
obtain at each point the mean value of the acceleration. The obtained PGA and 5 % damped
horizontal spectral acceleration values at 0.1, 0.2, 0.3, 1.0, and 2.0 s spectral periods were
mapped so that it can be used to generate an approximate uniform hazard spectrum (UHS)
for each point on the hazard maps for the range of periods important for common engineering
structures. The contour hazard maps display the regional distribution of the mean ground
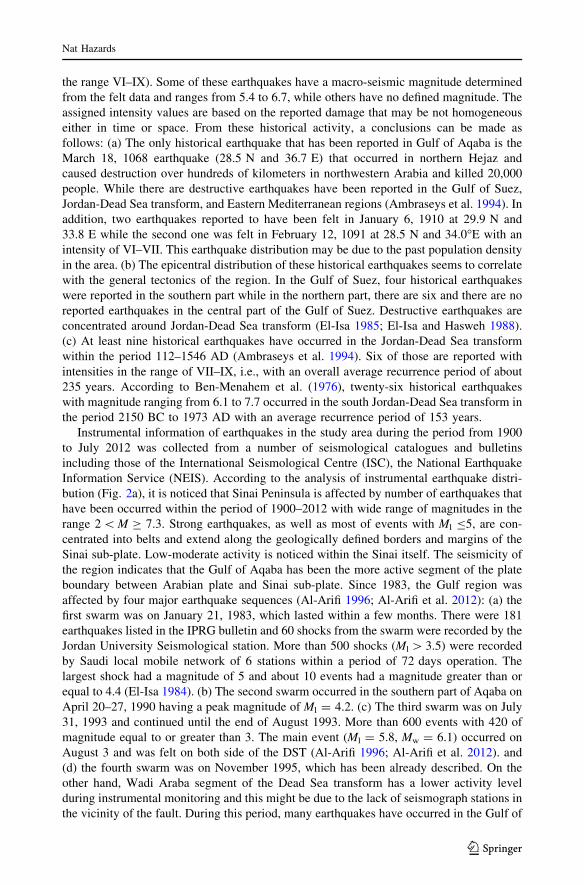
motion in cm/s2 for a rock condition, with 10 % probability of exceedance in 50 years,
which correspond to return periods 475 years (Figs. 5, 6, 7, 8, 9, 10).
38° E 34° E 37° E 36° E 35° E
31° N
30° N
29° N
28° N
27° N
Gul
f of
Aqa
ba
Saudi Arabia
EGYPT
Jordan
RED SEA0 50 100 150
Km
(a)
Fig. 5 Maximum PGA (cm/s2) with a probability of 90 % of not being exceeded in 50 years in the studyarea
Nat Hazards
123

Km
38° E 34° E 37° E 36° E 35° E
31° N
30° N
29° N
28° N
27° N
Gul
f of
Aqa
ba
Saudi Arabia
EGYPT
Jordan
100 150
(b)
RED SEA0 50
Fig. 6 Seismic hazards on rock for spectral acceleration of 0.1 s and 5 % damping for a 475-year returnperiod
38° E 34° E 37° E 36° E 35° E
31° N
30° N
29° N
28° N
27° N
Saudi Arabia
JordanEGYPT
50 100 150
Km Red Sea
Gul
f of
Aqa
ba
0
Fig. 7 Seismic hazards on rockfor spectral acceleration of 0.2 sand 5 % damping for a 475-yearreturn period
Nat Hazards
123

38° E 34° E 37° E 36° E 35° E
31° N
30° N
29° N
28° N
27° N
Saudi Arabia
Jordan
200
200
350
200
500
500
50 100 150
Km
350
650
650
650
500
EGYPT
RED SEA
Gul
f of
Aqa
ba35
0
0
Fig. 8 Seismic hazards on rockfor spectral acceleration of 0.3 sand 5 % damping for a 475-yearreturn period
38° E 34° E 37° E 36° E 35° E
31° N
30° N
29° N
28° N
27° N
Saudi Arabia
Jordan
RED SEA0 50 100 150
Km
200
200
EGYPT
Gul
f of A
qaba
Fig. 9 Seismic hazards on rockfor spectral acceleration of 1.0 sand 5 % damping for a 475-yearreturn period
Nat Hazards
123

7 Discussion and conclusions
The results of the present study are compared with those of the Global Seismic Hazard
Assessment Program (GSHAP) and Al-Amri 1995. The GSHAP map is based on more
generalized seismotectonic model which lack for specific and detailed seismic zonation.
The (GSHAP) map is calculated for a 10 % probability of being exceeded in 50 years on
rock (475-year return period). Our results are similar as the generalized (GSHAP) map
showing a relatively high hazard values around the Gulf of Aqaba area. It compares well
with the hazard values in this study, taking into consideration the uncertainty in reading
values of the more generalized GSHAP map. Also, this study is similar as the results of Al-
Amri 1995, with estimates of the 475-year PGA around Gulf of Aqaba ranging from 100 to
325 gal.
As main results derived from the analysis of the different maps, its worthy to note that,
for return period, maximum PGA values are predicted around the Gulf of Aqaba–Dead Sea
rift system. Isolines are quite parallel around the coast and decreases toward the continent.
All seismic hazard maps presented in this study show the highest values of peak ground
acceleration along the Gulf of Aqaba-Arava Valley and decrease eastward and westward.
For instant, the peak ground acceleration value in the Gulf of Aqaba-Arava Valley fault for
50 years lifetime is 325 gals, while the lowest values in the eastern region and it is about
75 gals. In this study, we represent a new evaluation in terms of PGA and SA (T) for the
first time in this area. The results should be considered in the revision of the respective
seismic codes, land-use planning, and earthquake-resistant structure design.
Acknowledgments The authors extend their appreciation to the Deanship of Scientific Research at KingSaud University for funding the work through the research group project No RGPVPP-122.
38° E 34° E 37° E 36° E 35° E
31° N
30° N
29° N
28° N
27° N
Gul
f of
Aqa
ba
Saudi Arabia
Jordan
EGYPT
RED SEA0 50 100 150
Km
Fig. 10 Seismic hazards on rockfor spectral acceleration of 2.0 sand 5 % damping for a 475-yearreturn period
Nat Hazards
123

References
Abu El Enien K (1997) A study on the seismotectonics of Egypt in relation to the Mediterranean and RedSeas tectonics, Ph.D Thesis. Ain Shams University
Adams RD, Barazangi M (1984) Sesimotectonics and seismology in the arab region: a brief summary andfuture plans. Bull Seismol Soc Am 74:1011–1030
Al-Amri AM (1994) Seismicity of the south-western region of the Arabian Shield and southern Red Sea.J Afr Earth Sci 19:17–25
Al-Amri AM (1995) Preliminary seismic hazard assessment of southern Red Sea region. J Eur Earthq Eng3:33–38
Al-Amri AM, Punsalan BT, Khalil AR, Uy EA (2003) Seismic hazard assessment of western Saudi Arabiaand the Red Sea region. Bull Inter Inst Seismol Earth Eng (IISEE) Jpn Spec Ed:95–112
Al-Arifi NS (1996) Micro-seismicity and lineament study of the Eastern side of the Gulf of Aqaba NWSaudi Arabia (1986–1994). Unpublished Ph D Thesis, University of Manchester, UK, p 460
Al-Arifi NS, Lashin AA, Al-Humidan SM (2012) Migration of local earthquakes in the Gulf of Aqaba,North Red Sea. Earth Sci Res J 16(1):35–40
Algermissen ST, Perkins D (1976) A probabilistics estimate of maximum acceleration in rock in contiguousUnited States. USGS Open File Rep 76:416–435
Al-Haddad M, Siddiqi G, Al-Zaid R, Arafah A, Necioglu A, Turkelli N (1994) A basis for evaluation ofseismic hazard and design criteria for the Kingdom of Saudi Arabia. Earthq Spectra 10:231–258
Ali SA (1984) Seismic risk study of Jeddah region in Saudi Arabia. In: Proceedings of the 18th worldconference on earthquake engineering, San Francisco, USA, pp 13–60
AlKathery AM (2010) Short-term and long-term seismic hazard assessment, NW Arabian Peninsula. MScthesis, Geology Department, College of science, King Saud University, p 179
Al-Noury SI, Ali SA (1986) Seismic risk analysis of western Saudi Arabia. Eng Geol 23:95–108Al-Tarazi E (1999) Regional seismic hazard study for the eastern Mediterranean (Trans-Jordan, Levant and
Antakia) and Sinai region. J Afr Earth Sci 28(3):743–750Ambraseys NN, Melville CP, Adams RD (1994) The seismicity of Egypt, Arabia and Red Sea. Cambridge
University Press, CambridgeBadawy A, Horvath F (1999) The Sinai subplate and tectonic evolution of the northern Red Sea region.
Geodynamics 27:433–450Barazangi M (1983) A summary of the seismotectonics of the Arab region. In: Cidlinsky K, Rouhban B
(eds) Assessment and mitigation of earthquake risk in the Arab Region. UNESCO, France, pp 43–58Bender BK, Perkins DM (1987) SEISRISK III: a computer program for seismic hazard estimation. USGS
Open File Rep:82–293Ben-Menahem A (1979) Earthquake catalogue for the Middle East (92 B.C.–1980 A.D.). Boll Geofis Teor
Appl 21:245–310Ben-Menahem A, Nur A, Vered M (1976) Tectonics, seismicity and structure of the Afro-Eurasian junction
and the breaking of an incoherent plate. Phys Earth Planet Inter 12:1–50Bommer JJ, Abrahamson NA (2006) Why do modern probabilistic seismic-hazard analyses often lead to
increased hazard estimates? Bull Seismol Soc Am 96(6):1967–1977Bommer JJ, Abrahamson NA, Strasser FO, Pecker A, Bard P-YH, Cotton F, Fah D, Sabetta F, Scherbaum F,
Studer J (2004) The challenge of defining upper bounds on earthquake ground motions. Seismol ResLett 75:82–95
Bommer JJ, Bungun H, Cotton F, Sabetta F, Abrahamson N (2005) On the use of logic trees for ground-motion prediction equations in seismic hazard analysis. Bull Seismol Soc Am 95:377–389
Boore MD, Joyner WB (1984) A note on the use of random vibration theory to predict peak amplitudes oftransient signals. Bull Seismol Soc Am 74:2035–2039
Boore DM, Joyner WB, Fumal TE (1997) Equations for estimating horizontal response spectra and peakacceleration from western North American earthquakes. A summary of recent work. Seismol Res Lett68:128–153
Cochran JR (1983) A model for the development of the Red Sea. Am As Pet Geol Bull 67:40–69Coppersmith KJ, Youngs RR (1986) Capturing uncertainty in probabilistic seismic hazard assessments
within intraplate tectonic environments. In: Proceedings of the 3rd US national conference on earth-quake engineering, vol 1, pp 301–312
Cornell CA (1968) Engineering seismic risk analysis of Boston. J Struct Div Proc ASCE 101:2027–2043Cornell CA, Vanmarcke EH (1969) The major influences on seismic risk. In: Proceedings of the 4th world
conference on earthquake engineering, vol 1. Santiago, Chile, pp 69–83Cramer H (1961) Mathematical methods of statistics, 2nd edn. Princeton University Press, Princeton
Nat Hazards
123

Daggett PH, Morgan P, Boulos FK, Hennin SF, El-Sherif AA, El-Sayed AA, Basta NZ, Melek YS (1986)Seismicity and active tectonics of the Egyptian Red Sea margin and the northern Red Sea. Tectono-physics 125:313–324
Deif A, Abou Elenean K, El Hadidy M, Tealeb A, Mohamed A (2009) Probabilistic seismic hazard maps forSinai Peninsula, Egypt. J Geophys Eng 6:288–297
Deif A, Hamed H, Ibrahim HA, Abou Elenean K, El-Amin E (2011) Seismic hazard assessment in Aswan,Egypt. J Geophys Eng 8:531–548
Egyptian National Research Institute of Astronomy and Geophysics (NRIAG) (1994–2012) SeismologicalBulletins
El-Hefnawy M, Deif A, El-Hemamy ST, Gomaa NM (2006) Probabilistic assessment of earthquake hazardin Sinai in relation to the seismicity in the eastern Mediterranean region. Bull Eng Geol Environ65:309–319
El-Isa ZH (1984) The Gulf of Aqaba earthquake swarm of 1983 January–April. Geophys J R Astron Soc78:711–722
El-Isa ZH (1985) Earthquake studies of some archaeological sites in Jordan. Oxf Conf Archaeol Jordan2:229–236
El-Isa ZH, Hasweh NK (1988) Seismicity of the southern Jordan-Dead Sea transform. In: Proceedings of the3rd Arab seismological workshop, March 1986, pp 47–58
El-Isa ZH, Hasweh NK (1989) Seismicity and tectonics of the Red Sea and western Arabia. Geophys J97:449–457
El-Sayed A, Walhstrom R (1996) Distribution of the energy release, b-values and seismic hazard in Egypt.Nat Hazards 13:133–150
El-Shazly EM (1982) The Red Sea region. In: Nairn AEM, Stehli FG (eds) The Ocean Basins and Margins,vol 6. The Indian Ocean. Plenum Press, New York, pp 205–252
Fat-Helbary RE (1995). Assessment of seismic hazard and risk in Aswan Area, Egypt. Ph. D. Thesis, TokyoUniversity, Japan
Frankel A (1995) Mapping seismic hazard in the Central and Eastern United States. Bull Seismol Soc Am66:8–21
Frankel A, Mueller C, Barnhard T (1997) Seismic hazard maps for California, Nevada and western Arizona/Utah. US Geol Surv Open-File Rep:97–130
Gardner JK, Knopoff L (1974) Is the sequence of earthquake in Southern California with after shocksremoved, Poissonian. Bull Seismol Soc Am 64:1363–1367
Garfunkel Z, Bartov Y (1977) The tectonics of the Suez rift. Geol Surv Isr Bull 71:44Garfunkel Z, Zak Y, Freund R (1981) Active faulting in the Dead Sea rift. Tectonophysics 80:1–26Giardini D (1999) The global seismic hazard assessment program (GSHAP) 1992–1999. Ann Geofis
42:957–1230Gumbel ES (1958) Statistics of extremes. Colombia Univ Press, New YorkGutenberg B, Richter CF (1944) Seismicity of the earth and associated phenomena. Princeton University
Press, Princeton, p 310Hattori S (1979) Seismic risk maps in the world (maximum acceleration and maximum particle velocity).
Bull Inter Inst Seism Earthq Eng 17:33–96Hatzor Y, Reches Z (1990) Structure and paleostresses in the Gilboa region, western margins of the central
Dead Sea Rift. Tectonophysics 180:87–100Hosney HM (1985) Geophysical investigations in the Gulf of Suez. Consequences for the tectonics evo-
lution of the Northern Red Sea. Ph. D. Thesis, Kiel UniversityKawasumi H (1957) Measures of earthquake danger and expectancy of maximum intensity throughout
Japan as inferred from the seismic activity in historical times. Bull Earthq Res Inst 29:469Kijko A (2004) Estimation of the maximum earthquake magnitude, Mmax. Pure Appl Geophys
161:1655–1681Kijko A, Sellevoll MA (1990) Estimation of the earthquake hazard parameters from incomplete data. Nat
Hazards 3:1–13Klinger Y, Rivra L, Hassler H, Martin JC (1999) Active faulting in the Gulf of Aqaba: new knowledge from
the Mw 7.3 earthquake of November 22, 1995. Bull Seismol Soc Am 89:1025–1036Le Pichon X, Gaulier JM (1988) The rotation of Arabia and the Levant fault system. Tectonophysics
153:271–294Lyberis N (1988) Tectonic evolution of the Gulf of Suez and the Gulf of Aqaba. Tectonophysics
153:209–220Maamoun M (1976) La seismicite du moyen et du prochorient dans le cadre de la seismotectonique
mondiale. These Doc. Es Sc., Un. Louis Pasteur, Strasbourg, France
Nat Hazards
123

Maamoun M (1985) Shukeir earthquake June, 12th, 1983, Gulf of Suez, Egypt: radiation pattern of firstmotion and its tectonic implication. HIAG Bull, 5, Ser B
Maamoun M, Ibrahim E (1978) Tectonic activity in Egypt as indicated by earthquakes. Bull HIAG No. 170Maamoun M, Allam A, Megahed A (1984) Seismicity of Egypt. Bull HIAG, Vol. IV, Ser B:109–160Mahmoud M (2003) Seismicity and GPS-derived crustal deformation in Egypt. J Geodyn 35:333–352McGuire RK (1976) FORTRAN computer program for seismic risk analysis. U.S. Dept of Interior. Geol
Surv Open-File Rep. 76–67, p 90. Denver, ColoradoMcGuire RK (1978) FRISK: computer program for seismic risk analysis using faults as earthquake sources.
US Geol Surv Open-File Rep:78–107Ordaz A, Aguilar M, Arboleda J (2007) CRISIS 2007: program for computing seismic hazard written by
Derechos Reservados � Instituto de Ingenier0ıa, UNAMReasenberg PA (1985) Second-order moment of Central California seismicity. J Geophys Res 90:
5479–5495Reiter L (1991) Earthquake hazard analysis. Columbia University Press, New YorkSaid R (1969) General stratigraphy of the adjacent land areas of the Red Sea. In: Degens ET, Ross DA (eds)
Hot brines and recent heavy metal deposits of the Red Sea. Springer, New York, pp 71–81Salamon A, Hofstetter A, Garfunkel Z, Ron H (1996) Seismicity of the eastern Mediterranean region:
perspective from the Sinai subplate. Tectonophysics 263:293–305Schenkova Z, Schenk V, Karnik V (1981) Seismic hazard estimate for a low seismicity region-example of
Bohemia. PAGEOPH 119:1077–1092Scordilis EM (2006) Empirical global relations converting Ms and mb to moment magnitude. J Seismol
10:225–236Shapira A, Jarradat M (1995) Earthquake risk and loss assessment in Aqaba and Eilat regions. Submitted to
the US Aid-Merc ProgramSieberg A (1932) Erdbebengeographie. In: Gutenberg B (ed) Handbuch der geophysik, vol IV. Gebruder
Borntraeger, BerlinSteckler MS, Berthelot F, Lyberis N, Le Pichon X (1988) Subsidence in the Gulf of Suez: implications for
rifting and plate kinematics. Tectonophysics 153:249–270Thenhaus PC, Algermissen ST, Perkins DM, Hanson SL, Diment WH (1989) Probabilistic estimates of the
seismic ground-motion hazard in western Saudi Arabia. USGS Geol BullWeichert DH (1980) Estimation of the earthquake recurrence parameters for unequal observation periods for
different magnitude. Seismol Soc Am Bull 70:1337–1346Wells D, Coppersmith K (1994) New empirical relationships among magnitude, rupture length, rupture
width, rupture area, and surface displacement. Bull Seismol Soc Am 84:974–1002Woo G (1996) Kernel estimation methods for seismic hazard area source modeling. Bull Seismol Soc Am
86:353–362Youngs RR, Chiou SJ, Silva W, Humphrey JR (1997) Strong ground motion attenuation relationships for
subduction zone earthquakes. Seismol Res Lett 68:58–73Yucceman S, Qa’dan H (1987) Seismic hazard analysis for Jordan. In: Proceedings of the 2nd Arab
conference on structural engineering, Jordan Univ., 19–22 April
Nat Hazards
123