
The Saguenay Fjord, Quebec, Canada: integrating marine geotechnical and geophysical data for spatial...
22
The Saguenay Fjord, Quebec, Canada: integrating marine geotechnical and geophysical data for spatial seismic slope stability and hazard assessment Roger Urgeles a;b; , Jacques Locat a , Homa J. Lee c , Francis Martin a a De ¤partement de ge ¤ologie et de ge ¤nie ge ¤ologique, Universite ¤ Laval, Pavillon Pouliot, Ste. Foy, QC, Canada G1K 7P4 b GRC Geocie 'ncies Marines, Departament d’Estratigra¢a i Paleontologia, Universitat de Barcelona, Campus de Pedralbes, 08028 Barcelona (Catalonia), Spain c United States Geological Survey, Mail Stop 999, 345 Middle¢eld Road, Menlo Park, CA 94025, USA Received 13 February 2001; accepted 15 January 2002 Abstract In 1996 a major flood occurred in the Saguenay region, Quebec, Canada, delivering several km 3 of sediment to the Saguenay Fjord. Such sediments covered large areas of the, until then, largely contaminated fjord bottom, thus providing a natural capping layer. Recent swath bathymetry data have also shown that sediment landslides are widely present in the upper section of the Saguenay Fjord, and therefore, should a new event occur, it would probably expose the old contaminated sediments. Landslides in the Upper Saguenay Fjord are most probably due to earthquakes given its proximity to the Charlevoix seismic region and to that of the 1988 Saguenay earthquake. In consequence, this study tries to characterize the permanent ground deformations induced by different earthquake scenarios from which shallow sediment landslides could be triggered. The study follows a Newmark analysis in which, firstly, the seismic slope performance is assessed, secondly, the seismic hazard analyzed, and finally an evaluation of the seismic landslide hazard is made. The study is based on slope gradients obtained from EM1000 multibeam bathymetry data as well as water content and undrained shear strength measurements made in box and gravity cores. Ground motions integrating local site conditions were simulated using synthetic time histories. The study assumes the region of the 1988 Saguenay earthquake as the most likely source area for earthquakes capable of inducing large ground motions in the Upper Saguenay region. Accordingly, we have analyzed several shaking intensities to deduce that generalized sediment displacements will begin to occur when moment magnitudes exceed 6. Major displacements, failure, and subsequent landslides could occur only from earthquake moment magnitudes exceeding 6.75. ȣ 2002 Elsevier Science B.V. All rights reserved. Keywords: slope stability; seismic loading; Newmark analysis; contaminated sediments; Saguenay Fjord 1. Introduction Fjords have been designated one of the major submarine landslide areas (Hampton et al., 1996) because of the rapid sediment deposition taking 0025-3227 / 02 / $ ^ see front matter ȣ 2002 Elsevier Science B.V. All rights reserved. PII:S0025-3227(02)00185-8 * Corresponding author. E-mail address: [email protected] (R. Urgeles). Marine Geology 185 (2002) 319^340 www.elsevier.com/locate/margeo
-
Upload
independent -
Category
Documents
-
view
1 -
download
0
Transcript of The Saguenay Fjord, Quebec, Canada: integrating marine geotechnical and geophysical data for spatial...
The Saguenay Fjord, Quebec, Canada:integrating marine geotechnical and geophysical data forspatial seismic slope stability and hazard assessment
Roger Urgeles a;b;�, Jacques Locat a, Homa J. Lee c, Francis Martin a
a De¤partement de ge¤ologie et de ge¤nie ge¤ologique, Universite¤ Laval, Pavillon Pouliot, Ste. Foy, QC, Canada G1K 7P4b GRC Geocie'ncies Marines, Departament d’Estratigra¢a i Paleontologia, Universitat de Barcelona, Campus de Pedralbes,
08028 Barcelona (Catalonia), Spainc United States Geological Survey, Mail Stop 999, 345 Middle¢eld Road, Menlo Park, CA 94025, USA
Received 13 February 2001; accepted 15 January 2002
Abstract
In 1996 a major flood occurred in the Saguenay region, Quebec, Canada, delivering several km3 of sediment tothe Saguenay Fjord. Such sediments covered large areas of the, until then, largely contaminated fjord bottom, thusproviding a natural capping layer. Recent swath bathymetry data have also shown that sediment landslides are widelypresent in the upper section of the Saguenay Fjord, and therefore, should a new event occur, it would probably exposethe old contaminated sediments. Landslides in the Upper Saguenay Fjord are most probably due to earthquakes givenits proximity to the Charlevoix seismic region and to that of the 1988 Saguenay earthquake. In consequence, thisstudy tries to characterize the permanent ground deformations induced by different earthquake scenarios from whichshallow sediment landslides could be triggered. The study follows a Newmark analysis in which, firstly, the seismicslope performance is assessed, secondly, the seismic hazard analyzed, and finally an evaluation of the seismic landslidehazard is made. The study is based on slope gradients obtained from EM1000 multibeam bathymetry data as well aswater content and undrained shear strength measurements made in box and gravity cores. Ground motionsintegrating local site conditions were simulated using synthetic time histories. The study assumes the region of the1988 Saguenay earthquake as the most likely source area for earthquakes capable of inducing large ground motions inthe Upper Saguenay region. Accordingly, we have analyzed several shaking intensities to deduce that generalizedsediment displacements will begin to occur when moment magnitudes exceed 6. Major displacements, failure, andsubsequent landslides could occur only from earthquake moment magnitudes exceeding 6.75. 8 2002 ElsevierScience B.V. All rights reserved.
Keywords: slope stability; seismic loading; Newmark analysis; contaminated sediments; Saguenay Fjord
1. Introduction
Fjords have been designated one of the majorsubmarine landslide areas (Hampton et al., 1996)because of the rapid sediment deposition taking
0025-3227 / 02 / $ ^ see front matter 8 2002 Elsevier Science B.V. All rights reserved.PII: S 0 0 2 5 - 3 2 2 7 ( 0 2 ) 0 0 1 8 5 - 8
* Corresponding author.E-mail address: [email protected] (R. Urgeles).
MARGO 3080 7-6-02 Cyaan Magenta Geel Zwart
Marine Geology 185 (2002) 319^340
www.elsevier.com/locate/margeo

Fig. 1. (A) Location of the study area. (B) Earthquake epicenters from 1663 to present (Natural Resources Canada, 1999). Sizeof circle is proportional to earthquake magnitude (Mn) and gray scale is proportional to earthquake depth except for old earth-quakes for which source depth is not known and which are represented in white. Moment tensor is plotted for the 1988 Sague-nay earthquake (Department of Earth and Planetary Sciences, 2000). (C) Estimated earthquake acceleration for the Saguenayearthquake of 1988 (normal lines) as well as for the 1663 Charlevoix seismic event (dashed lines). Calculations of the peakground acceleration (PGA) are presented as a fraction of g and made according to attenuation equations as described in Atkin-son and Boore (1995). Isolines appear as ovals because of the equidistant cylindrical projection. (D) PGA with 10% probabilityof exceedence in 50 years (Frankel et al., 1996). Background is topographic data from the GTOPO30 database (Earth ResourcesInformation Systems Data Center, 1996).
MARGO 3080 7-6-02 Cyaan Magenta Geel Zwart
R. Urgeles et al. /Marine Geology 185 (2002) 319^340320

place at their head deltas and their steep sidewalls. On the other hand, they provide protectedports and staging areas in rugged terrain whichmake them especially appealing for human activ-ities. The combination of these two attributesmakes them potential high landslide risk areasand emphasizes the need for geotechnical studiesof such areas.Earthquakes are also recognized as one of the
major destabilizing factors in the marine environ-ment (Hampton et al., 1996; Roberts and Cramp,1996; Duperret et al., 1995; Piper et al., 1999).Earthquakes induce horizontal and vertical accel-erations, which produce a direct load of the sedi-ment. In addition, they induce a buildup of £uid
pore pressure in the sediments, which leads to astrength reduction.The Saguenay Fjord is thus an area where po-
tential destabilization by earthquakes is signi¢-cant, ¢rstly because of the high sedimentationrates that take place at the fjord head, about7 cm/yr (Schafer et al., 1980), and secondly be-cause of the moderate seismic activity that thisarea and the neighboring region of Charlevoixexperience (Fig. 1).There was and there is still important industrial
activity at the head of the Saguenay Fjord. Theseindustries were a source of mercury and othermetals (Loring and Bewers, 1978; Barbeau etal., 1981a,b), as well as aromatic hydrocarbons
Fig. 2. Extent of the deposits of the 1996 £ood. Isocontours are shown for areas where layer thickness is higher than 0.5 m, de-rived by coupling swath bathymetry data acquired in 1993 (previous to the £ood) with data from 1999. For thicknesses lowerthan 0.5 m the thickness is shown as proportional circles indicating the thickness measured in the box cores.
MARGO 3080 7-6-02 Cyaan Magenta Geel Zwart
R. Urgeles et al. /Marine Geology 185 (2002) 319^340 321

(Martel et al., 1987), which were responsible forsigni¢cant contamination of the fjord sediments.In 1996 a major rainstorm and general £ooding
of the upper Saguenay region occurred, depositinga £ood layer of 10^20 cm on average (Fig. 2), butreaching several meters near the river mouthswhere rivers directly discharged their material tothe fjord (Fig. 2). The magnitude of the £oodinspired a research project focused on evaluatingthe concealing of old contaminated fjord sedimentand the stability of the new ‘£ood layer’. In con-trast to the great damage the £ood caused(Brooks and Lawrence, 1999), it was believedthat the huge amount of ‘clean’ newly deposited£ood sediments would bury the old contaminatedones, thus providing a natural capping layer. Amajor goal of these investigations was to evaluatethe stability of the newly deposited layer since therecurrence of new landslide events could lead tothe exposure of the old contaminated materials.In this study we tackle the issue of shallow land-slide hazard which would most likely expose the‘old’ contaminated sediments. In this paper weconsider a seismic gravity loading approach fol-lowing a Newmark (1965) analysis. On land, sev-eral examples of earthquake triggered landslidesoccurred during the 1988 seismic event (Tuttle etal., 1990; Lefebvre et al., 1992) and several olderlandslides and liquefaction structures are also at-tributed to seismic activity (LaSalle and Chagnon,1968; Schafer and Smith, 1987; Chagnon and Lo-cat, 1988; Locat and Bergeron, 1988; Locat et al.,1997, 2000). An additional factor, not consideredin this study, that could induce slope failure in theSaguenay Fjord, especially at the river mouths, isthe rapid deposition of large amounts of new sedi-ment, as might occur during a new £ooding event.Wave loading is not expected to produce land-slides given the small area (the fjord has a max-imum width of 3 km in this area) for wave gen-eration and the great fjord depths (up to 200 m).
2. Geological framework
The Saguenay Fjord lies within the CanadianShield, which is mostly composed in this area ofmetamorphic Precambrian rocks. The region was
tectonically active between 175 and 190 Ma ago,which allowed the formation of the Saguenay gra-ben (Du Berger et al., 1991). During the Pleisto-cene, the area was covered several times by icesheets (LaSalle and Tremblay, 1978). The Sague-nay graben, oriented more or less parallel to theglacial £ow, became a preferred path for ice £owand resulted in deep excavation of the bedrock.The ¢nal retreat of the Wisconsinian ice sheet,which took place about 10 000 years ago (LaSalleand Tremblay, 1978), was followed by signi¢cantisostatic rebound, varying from 140 m on thenorth side of the graben to 120 m on the southside (Bouchard et al., 1983). The rebound wasalso accompanied by rapid in¢ll of the grabenwith as much as 1000 m of sediment (Syvitskiand Praeg, 1989; Locat and Syvitski, 1991).The Upper Saguenay Fjord is characterized by
a Y-shape, with one arm of the Y being the BrasNord and the other one being the Baie des Ha!Ha! (Fig. 3). The fjord, in that area, has waterdepths ranging from 0 to 275 m and a width be-tween 3 and 5 km. The Saguenay River £ows intothe Bras Nord while the Mars, Ha! Ha! and duMoulin rivers £ow into the Baie des Ha! Ha! Theregular tide in the area is about 4^5 m. The mostactive segment of the upper Saguenay Fjord is theBras Nord where the accumulation rate is mea-sured in centimeters per year at the delta (Locatand Leroueil, 1988; Perret et al., 1995) so that theBras Nord is being ¢lled more rapidly that theBaie des Ha! Ha!, where sedimentation rates areof the order of 0.2 cm/yr (Barbeau et al., 1981a).The water depth in the Bras Nord ranges from
about 10 m at the mouth of the Saguenay Riverto 200 m at the con£uence with the Baie des Ha!Ha! The Baie des Ha! Ha! itself has a water depthwhich rapidly increases to about 100 m near thehead (at La Baie city) and to 200 m downstream.The £oor of the Baie des Ha! Ha! has a uniquefeature located near the center, in the form of asharp and more or less straight escarpment (ar-rows in Fig. 3). Above it, the slope is 0.6‡, andbelow, 0.2‡. The slopes on either side of the fjordare quite di¡erent, in particular in the Baie desHa! Ha!, the northern sidewall is steep withslopes exceeding 40‡ while the south shore slopeis gentler and gullied (Fig. 3). The slope on the
MARGO 3080 7-6-02 Cyaan Magenta Geel Zwart
R. Urgeles et al. /Marine Geology 185 (2002) 319^340322
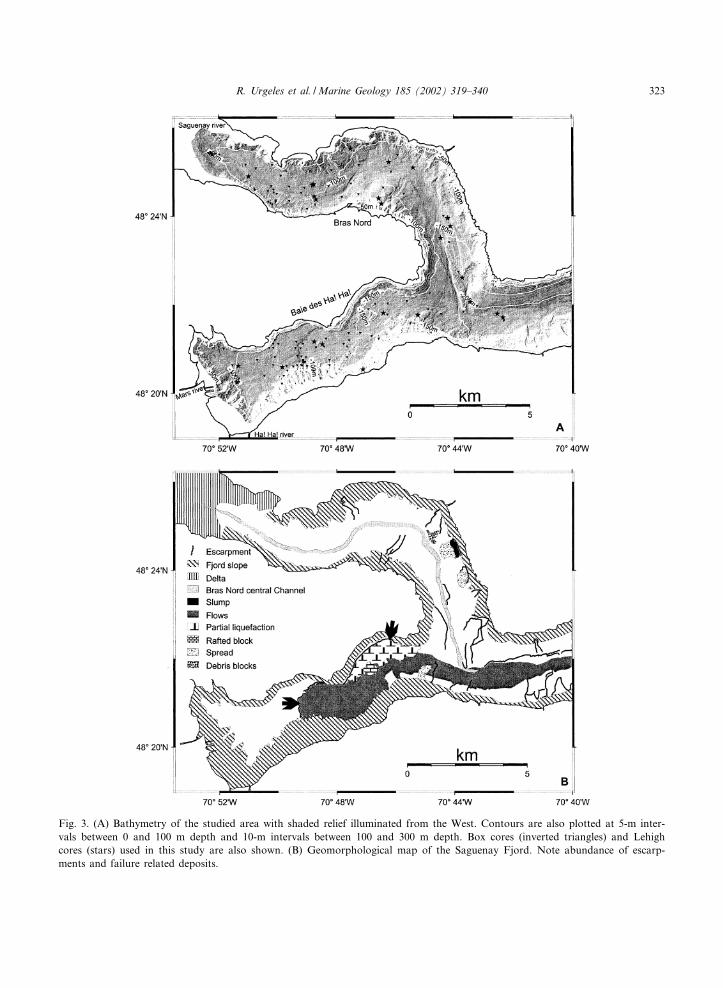
Fig. 3. (A) Bathymetry of the studied area with shaded relief illuminated from the West. Contours are also plotted at 5-m inter-vals between 0 and 100 m depth and 10-m intervals between 100 and 300 m depth. Box cores (inverted triangles) and Lehighcores (stars) used in this study are also shown. (B) Geomorphological map of the Saguenay Fjord. Note abundance of escarp-ments and failure related deposits.
MARGO 3080 7-6-02 Cyaan Magenta Geel Zwart
R. Urgeles et al. /Marine Geology 185 (2002) 319^340 323
north side is controlled by the bedrock, while thesouthern side is dominated by Quaternary sedi-ments. The Bras Nord is bisected by a shallowchannel, which follows more or less the centerof the fjord, potentially acting as a conduit formud £ows or debris £ows originating from theupper reaches of the fjord (Fig. 3).
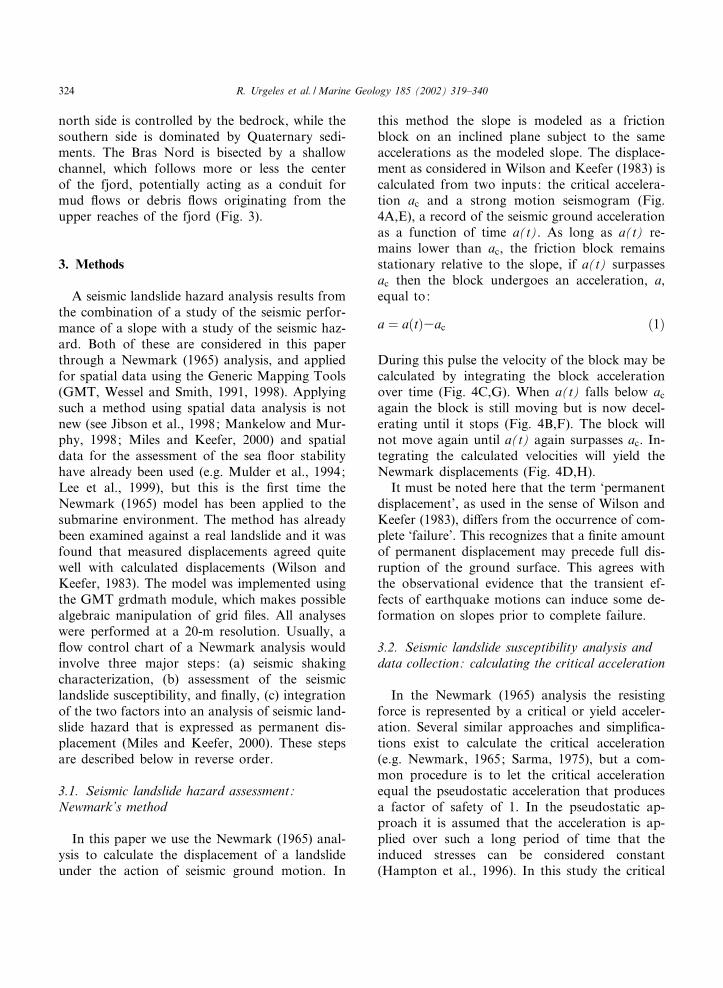
3. Methods
A seismic landslide hazard analysis results fromthe combination of a study of the seismic perfor-mance of a slope with a study of the seismic haz-ard. Both of these are considered in this paperthrough a Newmark (1965) analysis, and appliedfor spatial data using the Generic Mapping Tools(GMT, Wessel and Smith, 1991, 1998). Applyingsuch a method using spatial data analysis is notnew (see Jibson et al., 1998; Mankelow and Mur-phy, 1998; Miles and Keefer, 2000) and spatialdata for the assessment of the sea £oor stabilityhave already been used (e.g. Mulder et al., 1994;Lee et al., 1999), but this is the ¢rst time theNewmark (1965) model has been applied to thesubmarine environment. The method has alreadybeen examined against a real landslide and it wasfound that measured displacements agreed quitewell with calculated displacements (Wilson andKeefer, 1983). The model was implemented usingthe GMT grdmath module, which makes possiblealgebraic manipulation of grid ¢les. All analyseswere performed at a 20-m resolution. Usually, a£ow control chart of a Newmark analysis wouldinvolve three major steps: (a) seismic shakingcharacterization, (b) assessment of the seismiclandslide susceptibility, and ¢nally, (c) integrationof the two factors into an analysis of seismic land-slide hazard that is expressed as permanent dis-placement (Miles and Keefer, 2000). These stepsare described below in reverse order.
3.1. Seismic landslide hazard assessment:Newmark’s method
In this paper we use the Newmark (1965) anal-ysis to calculate the displacement of a landslideunder the action of seismic ground motion. In
this method the slope is modeled as a frictionblock on an inclined plane subject to the sameaccelerations as the modeled slope. The displace-ment as considered in Wilson and Keefer (1983) iscalculated from two inputs: the critical accelera-tion ac and a strong motion seismogram (Fig.4A,E), a record of the seismic ground accelerationas a function of time a(t). As long as a(t) re-mains lower than ac, the friction block remainsstationary relative to the slope, if a(t) surpassesac then the block undergoes an acceleration, a,equal to:
a ¼ aðtÞ3ac ð1Þ
During this pulse the velocity of the block may becalculated by integrating the block accelerationover time (Fig. 4C,G). When a(t) falls below acagain the block is still moving but is now decel-erating until it stops (Fig. 4B,F). The block willnot move again until a(t) again surpasses ac. In-tegrating the calculated velocities will yield theNewmark displacements (Fig. 4D,H).It must be noted here that the term ‘permanent
displacement’, as used in the sense of Wilson andKeefer (1983), di¡ers from the occurrence of com-plete ‘failure’. This recognizes that a ¢nite amountof permanent displacement may precede full dis-ruption of the ground surface. This agrees withthe observational evidence that the transient ef-fects of earthquake motions can induce some de-formation on slopes prior to complete failure.
3.2. Seismic landslide susceptibility analysis anddata collection: calculating the critical acceleration
In the Newmark (1965) analysis the resistingforce is represented by a critical or yield acceler-ation. Several similar approaches and simpli¢ca-tions exist to calculate the critical acceleration(e.g. Newmark, 1965; Sarma, 1975), but a com-mon procedure is to let the critical accelerationequal the pseudostatic acceleration that producesa factor of safety of 1. In the pseudostatic ap-proach it is assumed that the acceleration is ap-plied over such a long period of time that theinduced stresses can be considered constant(Hampton et al., 1996). In this study the critical
MARGO 3080 7-6-02 Cyaan Magenta Geel Zwart
R. Urgeles et al. /Marine Geology 185 (2002) 319^340324

acceleration is determined using the methodologyof Lee and Edwards (1986) and Lee et al. (1999),which is appropriate for the marine environmentand the di⁄culties associated with underwatersampling. The method considers three factors in-£uencing slope stability (Lee et al., 1999): (1) li-thology (as represented by mineralogy and grainsize or engineering classi¢cation); (2) consolida-tion stress history due to erosion events (presenceof sustained static shear stress, and existence ofexcess pore water or gas pressures) ; and (3) the
nature of loading (static gravitational or cyclic).In the present study, the data available for calcu-lating the critical acceleration on a spatial basisconsists of EM1000 multibeam bathymetry and adatabase of sediment samples on which severalphysical properties were measured. The latter in-cluded 110 box cores and 28 gravity cores ob-tained using a 3-m-long Lehigh corer. In mostbox cores measurements were done at intervalsof 1 cm and include corrected water content andundrained intact and remolded shear strength,
Fig. 4. (A) Example of synthetic seismogram for a 6.5-Mw earthquake at an epicentral distance of 40 km with local site condi-tions as illustrated in Table 2. The example illustrates: (B) The accelerations applied to the block resulting from the interactionbetween moving forces (ground motion) and resisting forces simulated here as the critical acceleration. Note that in this example,we model a critical acceleration of 40 cm/s2. (C) Calculated velocities. (D) Newmark displacement. (E^H) Zoom of the intervalcontained within a box in A.
MARGO 3080 7-6-02 Cyaan Magenta Geel Zwart
R. Urgeles et al. /Marine Geology 185 (2002) 319^340 325

while on gravity cores, measurements were madeat intervals ranging between 10 and 20 cm.
3.2.1. LithologyThe sur¢cial sediments of the Saguenay Fjord
appear to be quite homogeneous with an averagegrain size distribution of 26% clay, 71% silt and
3% sand. This distribution does not vary in asigni¢cant manner longitudinally (i.e. from prox-imal to distal areas), although a few of the moreproximal samples show large sand contents andthere is a slight decrease in silt content accompa-nied by a slight increase in clay content eastwards(Fig. 5).
Fig. 5. Grain size distribution as measured in grab samples for the entire studied area (top), variability with longitude, i.e. fromproximal to distal areas of the grain size (middle), and water content (bottom) (based on data from Urgeles et al., 2002).
MARGO 3080 7-6-02 Cyaan Magenta Geel Zwart
R. Urgeles et al. /Marine Geology 185 (2002) 319^340326

The box cores show that the 1996 event layerhas similar physicochemical characteristics to therest of the Saguenay Fjord sediments (Maurice etal., 2000). The Lehigh cores show an overall trendwith the water content decreasing with depth insediment, while the shear strength increases (Fig.6).For the purpose of spatial analysis, Lee et al.
(1999) and Lee and Baraza (1999) showed thatsediment density from the near surface is a goodindicator of engineering classi¢cation (see alsoLee and Baraza, 1999). Therefore a map of nearsurface water content (Fig. 7), which is directlyrelated to sediment density in ¢ne marine sedi-ments, is considered a good representation ofthe sediment’s engineering classi¢cation. To thispurpose the values of water content observed at10 cm were gridded to produce such a map. Thevalue of 10 cm was chosen following Lee et al.(1999) because it is considered to be below thezone of most active bioturbation but is still rep-resentative of the sediment lithology depositedmost recently.
3.2.2. Consolidation stress historyThe soil consolidation state is usually de¢ned
using the overconsolidation ratio (OCR), whichis de¢ned as the ratio of the vertical e¡ective over-burden stress (cPv), to the e¡ective preconsolida-tion stress (cPp), the latter being a measure of themaximum stress applied to the sediment since de-position. Perret et al. (1995) showed that, in theSaguenay Fjord, when the sediment shearstrength is normalized against the preconsolida-tion pressure, a value of 0.3 or 0.5 was obtaineddepending on whether the sediment contained lessthan 3% organic matter or more. The results ofPerret et al. (1995) showed that, typically, thefjord sediments are overconsolidated in the upperhalf meter of the sediment column and are nor-mally consolidated at greater depths. Such asuper¢cial, apparent overconsolidation is verytypical of marine sediments (Lee and Edwards,1986; Cochonat et al., 1992), and its e¡ects tendto disappear within the ¢rst meter of sedimentcolumn (Perret et al., 1995). Thus, in this studywe consider that the Saguenay Fjord sedimentsare normally consolidated (OCR=1), althoughnear surface sediment samples show elevated lev-els of overconsolidation (OCRs 1).Such sur¢cial overconsolidation is clearly
shown in Fig. 6B. The shear strength versus ver-
Fig. 6. (A) Undrained shear strength measured using the fall cone test versus depth. (B) The ratio of undrained shear strength/vertical e¡ective stress versus depth for all Lehigh cores in the study area.
MARGO 3080 7-6-02 Cyaan Magenta Geel Zwart
R. Urgeles et al. /Marine Geology 185 (2002) 319^340 327

tical e¡ective stress ratio in the Lehigh coresshows very high values in the ¢rst half meter ofthe sediment column, and then the values from allcore samples become concurrently asymptotic to avalue of V0.3. Note that for normally consoli-dated sediments, the preconsolidation pressureequals the vertical e¡ective stress.
3.2.3. Loading characteristicsThe ¢nal two parameters needed to perform a
seismic landslide susceptibility analysis are slopeangle and the depth to failure for each potentiallandslide. Slope estimates were made from 20-m-resolution swath bathymetry grids (Fig. 8).Considering all of the above factors, the shear
stress induced by seismic and gravitational load-
ing (dc) on an in¢nite slope is (Lee and Edwards,1986; Lee et al., 1999):
d c
Q0h
¼ sinK þ agQ
Q0 ð2Þ
where Q and QP are respectively the total unitweight and the submerged unit weight of sedi-ment, K is the slope angle, h is depth in sediment,g is the acceleration of gravity, and a the horizon-tal pseudostatic earthquake acceleration. Verticalacceleration is neglected since, although earth-quakes generate both horizontal and vertical ac-celerations that induce the corresponding shearand normal stresses in the sediment, it is mostlythe shear stress that can drive the sediment tofailure and responds most strongly to horizontal
Fig. 7. Water content (%) at 10 cm depth using the adjustable tension continuous curvature surface gridding algorithm of Smithand Wessel (1990). Box cores (inverted triangles) used for gridding are also shown.
MARGO 3080 7-6-02 Cyaan Magenta Geel Zwart
R. Urgeles et al. /Marine Geology 185 (2002) 319^340328

acceleration (Mulder et al., 1994; Hampton et al.,1996). It must be noted also that Eq. 2 is onlyused for slopes 6 10‡ (Lee and Edwards, 1986).This is not a major obstacle in this scenario, be-cause the fjord slopes exceeding this value gener-ally consist of rock outcrops.Note that because of the sur¢cial, apparent
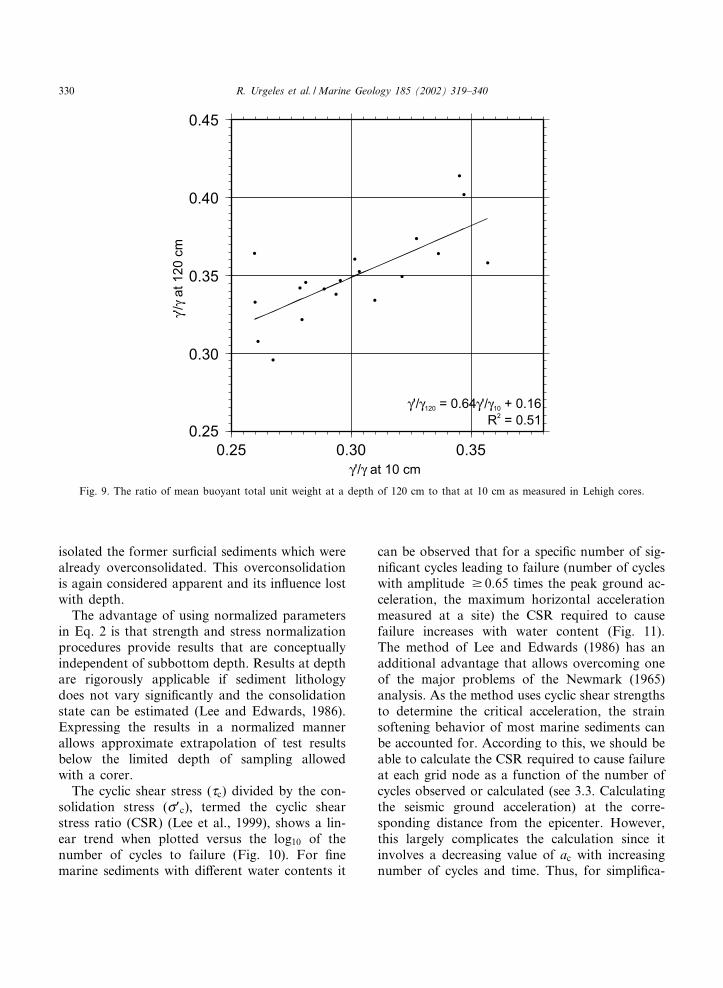
overconsolidation the relation QP/Q cannot be di-rectly estimated from the water content measure-ments made on the uppermost box core sedi-ments. Most of the cores show an overallincrease of the QP/Q ratio with depth following anexponential trend. The cores with a higher QP/Qratio on the seabed are those with higher QP/Q atdepth (Fig. 9) and this relation is used to over-come the e¡ect of the sur¢cial, apparent overcon-solidation. According to oedometer tests (Perretet al., 1995), normal consolidation occurs from
1 m onwards, although, from Fig. 6B we choosea depth of 1.2 m. Fig. 9 shows the relation be-tween QP/Q at 10 cm and QP/Q at 1.2 m.The correlation between surface measurements
of QP/Q and those at depth is obviously compli-cated by the fact that we are considering a homo-geneous non-layered system, while actually thesystem is a layered one. The cores north of40.4‡N, i.e. the most proximal areas of the BrasNord, show the presence of a coarse turbiditelayer related to the 1971 St. Jean de Vianney land-slide (Schafer and Smith, 1988). This layer con-trasts with that of the 1996 event, which looksmuch more similar to the background sedimenta-tion. Such cores show an anomalous water con-tent pro¢le (see ¢g. 14 of Perret et al., 1995), andare therefore not used for the correlation. Thispro¢le seems to indicate that the 1971 material
Fig. 8. Slope map of the Saguenay Fjord.
MARGO 3080 7-6-02 Cyaan Magenta Geel Zwart
R. Urgeles et al. /Marine Geology 185 (2002) 319^340 329
isolated the former sur¢cial sediments which werealready overconsolidated. This overconsolidationis again considered apparent and its in£uence lostwith depth.The advantage of using normalized parameters
in Eq. 2 is that strength and stress normalizationprocedures provide results that are conceptuallyindependent of subbottom depth. Results at depthare rigorously applicable if sediment lithologydoes not vary signi¢cantly and the consolidationstate can be estimated (Lee and Edwards, 1986).Expressing the results in a normalized mannerallows approximate extrapolation of test resultsbelow the limited depth of sampling allowedwith a corer.The cyclic shear stress (dc) divided by the con-
solidation stress (cPc), termed the cyclic shearstress ratio (CSR) (Lee et al., 1999), shows a lin-ear trend when plotted versus the log10 of thenumber of cycles to failure (Fig. 10). For ¢nemarine sediments with di¡erent water contents it
can be observed that for a speci¢c number of sig-ni¢cant cycles leading to failure (number of cycleswith amplitude v 0.65 times the peak ground ac-celeration, the maximum horizontal accelerationmeasured at a site) the CSR required to causefailure increases with water content (Fig. 11).The method of Lee and Edwards (1986) has anadditional advantage that allows overcoming oneof the major problems of the Newmark (1965)analysis. As the method uses cyclic shear strengthsto determine the critical acceleration, the strainsoftening behavior of most marine sediments canbe accounted for. According to this, we should beable to calculate the CSR required to cause failureat each grid node as a function of the number ofcycles observed or calculated (see 3.3. Calculatingthe seismic ground acceleration) at the corre-sponding distance from the epicenter. However,this largely complicates the calculation since itinvolves a decreasing value of ac with increasingnumber of cycles and time. Thus, for simpli¢ca-
Fig. 9. The ratio of mean buoyant total unit weight at a depth of 120 cm to that at 10 cm as measured in Lehigh cores.
MARGO 3080 7-6-02 Cyaan Magenta Geel Zwart
R. Urgeles et al. /Marine Geology 185 (2002) 319^340330
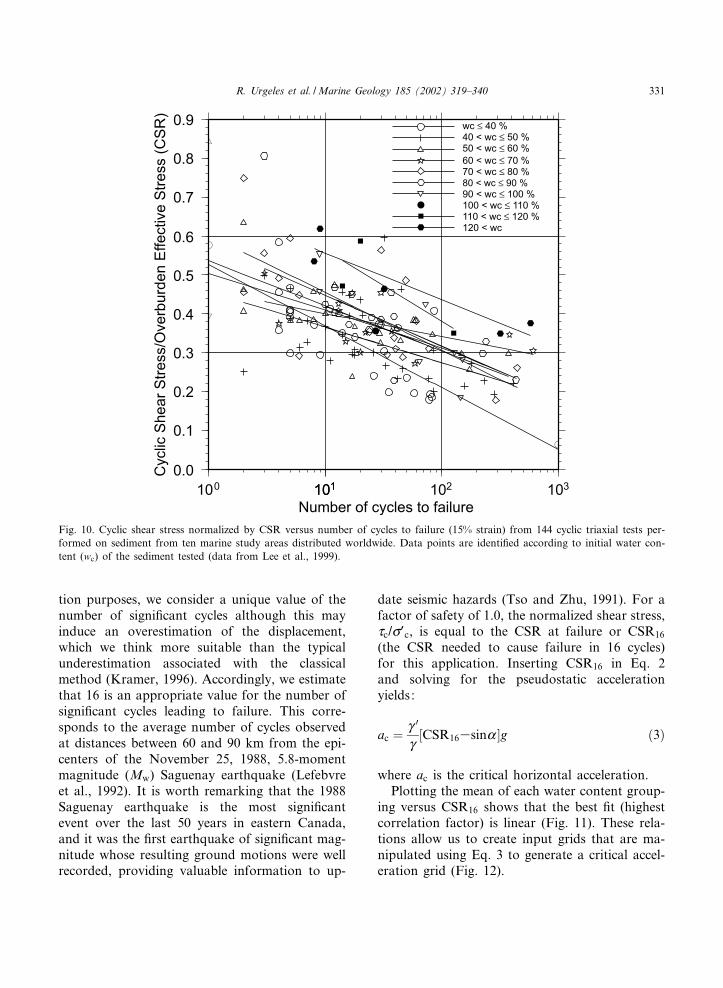
tion purposes, we consider a unique value of thenumber of signi¢cant cycles although this mayinduce an overestimation of the displacement,which we think more suitable than the typicalunderestimation associated with the classicalmethod (Kramer, 1996). Accordingly, we estimatethat 16 is an appropriate value for the number ofsigni¢cant cycles leading to failure. This corre-sponds to the average number of cycles observedat distances between 60 and 90 km from the epi-centers of the November 25, 1988, 5.8-momentmagnitude (Mw) Saguenay earthquake (Lefebvreet al., 1992). It is worth remarking that the 1988Saguenay earthquake is the most signi¢cantevent over the last 50 years in eastern Canada,and it was the ¢rst earthquake of signi¢cant mag-nitude whose resulting ground motions were wellrecorded, providing valuable information to up-
date seismic hazards (Tso and Zhu, 1991). For afactor of safety of 1.0, the normalized shear stress,dc/cPc, is equal to the CSR at failure or CSR16
(the CSR needed to cause failure in 16 cycles)for this application. Inserting CSR16 in Eq. 2and solving for the pseudostatic accelerationyields:
ac ¼Q0
Q
½CSR163sinK �g ð3Þ
where ac is the critical horizontal acceleration.Plotting the mean of each water content group-
ing versus CSR16 shows that the best ¢t (highestcorrelation factor) is linear (Fig. 11). These rela-tions allow us to create input grids that are ma-nipulated using Eq. 3 to generate a critical accel-eration grid (Fig. 12).
Fig. 10. Cyclic shear stress normalized by CSR versus number of cycles to failure (15% strain) from 144 cyclic triaxial tests per-formed on sediment from ten marine study areas distributed worldwide. Data points are identi¢ed according to initial water con-tent (wc) of the sediment tested (data from Lee et al., 1999).
MARGO 3080 7-6-02 Cyaan Magenta Geel Zwart
R. Urgeles et al. /Marine Geology 185 (2002) 319^340 331

3.3. Calculating the seismic ground acceleration
Selection of a time history for predictive hazardanalysis can pose a major obstacle in using thedouble integration approach (Miles and Keefer,2000). Ideally, records of an earthquake that oc-curred on the fault zone of interest having ad-equate magnitude to predict are used. Unfortu-nately, in many, if not most cases, such recordsdo not exist. The alternatives consist of modifyingactual records from the fault zone of interest (oranother fault system) or generating arti¢cial timehistories. This issue is treated in more detail byMiles and Ho (1999) and Kramer (1996).In addition, one must select a representative
earthquake epicenter and magnitude. In our casewe assumed that the source of major earthquakesin the Saguenay region is the epicenter of the well-known 1988 Saguenay earthquake (see Sommer-ville et al., 1990; Du Berger et al., 1991). This isconsistent with the observation of a deep clusterof seismic events around the area of the 1988Saguenay earthquake (Fig. 1B), and the lack ofmajor faults along which earthquakes have oc-curred (see also Du Berger et al., 1991). Some
authors also believe that the large amount of evi-dence for major slope instabilities in the Saguenayregion associated with the local magnitude (Mn)V7 seismic event of 1663 (e.g. LaSalle and Chag-non, 1968; Syvitski and Schafer, 1996; Locat etal., 1997), the largest seismic event recorded inhistorical times in Quebec, is reason enough tobelieve that the actual epicenter of this eventwas not located in the Charlevoix region, butnear the epicenter of the 1988 Saguenay earth-quake (Locat et al., 2000). Thus, we decided totest the model against di¡erent earthquake mag-nitudes.In this study, displacements were computed
from synthetic time histories, which were itera-tively created for each grid node. The seismicground acceleration time histories were generatedusing a slightly modi¢ed version of the td_drvrSMSIM program (Boore, 1996), using the groundmotion model of Atkinson and Boore (1995). Thesimulations were run using the parameters listedin Table 1. An aspect that we were careful tointegrate in our computations was the local sitecondition, which has been demonstrated to havean important in£uence on ground motion charac-teristics (Wilson and Keefer, 1983; Idriss, 1990;Sugito et al., 1991).The principal factors controlling local site con-
ditions are topography (Wilson and Keefer, 1983;Benites and Aki, 1994) and the presence of softsoils (Idriss, 1990; Sugito et al., 1991). Unfortu-nately, we were not able to account for site e¡ectsdue to the topography, which are probably quiteimportant at the fjord margins. On the other handwe modeled local soil conditions using ampli¢ca-tion factors computed by Herrmann and Akinci’s(1999) dorvt180 program. The input soil stratig-
Fig. 11. The CSR producing failure in 10 and 16 cycles ver-sus initial sediment water content. Data points are obtainedfrom the intercept of these values of the number of cycleswith the regressions for di¡erent water contents in Fig. 10.
Table 1Parameters used to conduct Boore (1996) simulation
Stress drop 100 barCuto¡ frequency 50 HzFree surface factor 2Radiation pattern 0.55Energy partition factor 0.707
Based on Atkinson and Boore (1995) for eastern NorthAmerican earthquakes.
MARGO 3080 7-6-02 Cyaan Magenta Geel Zwart
R. Urgeles et al. /Marine Geology 185 (2002) 319^340332

raphy, obtained from Locat and Syvitski (1991),consisted of a Precambrian basement overlain ¢rstby a 150-m-thick contact glacial till unit, secondby a 100-m-thick proglacial till unit (see Table 2for physical properties used in this study), andultimately by an upper layer consisting of the La-£amme sea clays and Recent sediments. Accord-ing to seismic re£ection data (Locat and Syvitski,1991), for this later unit we assume a variable
thickness (T) controlled by the following func-tion:
T ¼ 1:85e3:28cosK ð4Þ
where K is the slope angle. Such a function yieldsvalues between 50 m thickness (maximum esti-mated thickness of La£amme sea clays and Re-cent sediments in the Saguenay Fjord) for £atsurfaces (bottom fjord) and almost no sediment
Fig. 12. Calculated critical horizontal earthquake acceleration (as a fraction of g) to cause shallow seated landslides in the Sague-nay Fjord.
Table 2Input soil stratigraphy based on Locat and Syvitski (1991) and soil parameters based on Carr et al. (1998)
Layer T Vp Vs Qs Qp b
(m) (m/s) (m/s) (g/cm3)
Recent and La£amme sea clays 1.85 e3:28cosK 1800 250 z0:18 6 z0:24 6 z0:24 0.8 log10(vs)30.1Proglacial till 100 1500 420 500 500 2.0Contact till 150 1600 450 500 500 2.1Precambrian basement ^ 6000 3500 500 500 2.7
MARGO 3080 7-6-02 Cyaan Magenta Geel Zwart
R. Urgeles et al. /Marine Geology 185 (2002) 319^340 333

MARGO 3080 7-6-02 Cyaan Magenta Geel Zwart
R. Urgeles et al. /Marine Geology 185 (2002) 319^340334

cover for the fjord walls where gradients ap-proach vertical.
4. Results
4.1. Slope gradients
The slope gradient strongly in£uences slopestability. The data derived from the multibeamechosounder show that the slopes within the fjord£oor vary from almost 0‡ to more than 40‡. Thesteepest slope gradients are associated with thefjord margins, but not all slopes can be treatedin the same manner for the analysis of slopestability since, generally, the slopes exceeding10‡ are rocky in nature.There are also important changes in slope gra-
dient within the deepest part of the fjord, wherethe bottom is covered mostly by sediment butslopes do not generally surpass 10‡. The highestslope gradients within the deeper parts of thefjord are associated with linear features corre-sponding to escarpments related to landslide pro-cesses or channel erosion. There are also relativelystrong gradients at the foot of the fjord wallswhere there is an input of sediment associatedwith the fjord margins.
4.2. Water content
The map of water content, wc (Fig. 7), will di-rectly in£uence the estimated CSR needed tocause failure. The values range from about 50%to 150% of the dry weight. A general increase inwater content is seen from the more proximalareas to distal areas in the Bras Nord, while inthe Baie des Ha! Ha! such a trend is not so clear,although low values are also present in the mostproximal area. This distribution is roughly consis-tent with grain size distribution, i.e. the lowerwater contents correspond to more sandy sedi-ments, even though the predominant fraction all
along the fjord is silt (Fig. 5). The areas withhigher water content (Fig. 7) will be those show-ing the higher CSR required for failure and, ac-cordingly, the areas where most sandy materialexists will be those most prone to failure.
4.3. Critical acceleration
The estimated values of ac range between asmuch as 0.2 g and as little as 0.08 g (Fig. 12).As explained above, the critical acceleration can-not be directly compared with estimates of peakground acceleration, and the later is usually largerthan ac (Seed, 1979). Having taken this into ac-count, it can be seen that the calculated ac valuesclearly fall within the range of accelerations thatwould be reached during an earthquake of thesame characteristics as the well documented1988 Saguenay earthquake (Fig. 1C). It wouldtherefore ‘trigger’ some amount of permanent dis-placement. These accelerations also clearly fallwithin the range of accelerations that will be ex-ceeded in 50 years with a 10% probability (Frank-el et al., 1996) (Fig. 1D).The distribution of calculated ac in Fig. 12 al-
lows us to infer which geological processes in£u-ence slope stability in the Saguenay Fjord. Thecritical acceleration map (Fig. 12) shows threetypes of regions with low values of ac. The ¢rstone is associated with the steep slope margins ofthe fjord.The second type region is associated with the
deltaic sediment accumulations at the head of themajor rivers entering the Fjord, i.e. the Saguenay,Ha! Ha! and Mars rivers. This occurs as a resultof the relatively high slope angle associated withprogradation of the delta front in the case of theSaguenay River, but also because of the lowerwater contents the sediments hold in this area.The third type zone is related to a major lique-
faction event associated with a fault and escarp-ment that bisect the Baie des Ha! Ha! into twoparts (see also Locat et al., 2000). The map in
Fig. 13. A series of calculated Newmark displacements for increasing earthquake magnitudes. Simulations were run with an epi-center corresponding to that of the 1988 Saguenay earthquake.
MARGO 3080 7-6-02 Cyaan Magenta Geel Zwart
R. Urgeles et al. /Marine Geology 185 (2002) 319^340 335

Fig. 12 shows moderate low values of ac just be-low the main scarp as well as further down, wherethe fjord £oor shows a blocky morphology (ar-rows in Fig. 3B), probably resulting from a partialliquefaction of a section of a landslide.
4.4. Newmark displacements
Fig. 13 depicts Newmark displacements for dif-ferent intensities of ground shaking. According tothese data, earthquakes of Mw9 5.75 do notcause any signi¢cant displacement of the fjordsediments. On the other hand, displacements ap-pear widespread for accelerations induced byearthquakes of Mws 6.5. Major displacementsoccur mostly at the head of the Baie des Ha!Ha! and St. Fulgence delta, when the slopes aresubjected to accelerations induced by earthquakesin excess of Mw 6.75. Fig. 13 shows no majordisplacements for earthquakes with Mw = 5.9,which is consistent with the lack of major land-slides in the fjord bottom associated with the Sa-guenay seismic event of 1988.As explained above, a ¢nite amount of perma-
nent displacement may precede major disruptionof the ground surface. Many works (see for exam-ple Wilson and Keefer, 1983) describe a criticaldisplacement beyond which major failure will oc-cur. Miles et al. (2000) note that such a criticaldisplacement has not been rigorously studied andthere is little consensus regarding what is a repre-sentative value. Mankelow and Murphy (1998)review several cases to show that values of criticaldisplacement depend on the materials involvedand the type of landslides. Critical displacementshave ranged from 2 cm for rock falls through5 cm for translational slides, block slides andslumps to 10 cm for deep-seated rotational slides(see Mankelow and Murphy, 1998). It is clearfrom the maps shown in Fig. 13 that the lattervalue is unable to explain the landslides in theSaguenay Fjord. Considering the type of failuresobserved in the Saguenay Fjord (Fig. 4), mostlyshallow translational and rotational slides, wewould expect values not exceeding 5 cm, howeverthe displacements observed at ‘reasonable’ earth-quake magnitudes (known to have occurred in thearea) would indicate a slightly lower value, which
probably represents the particularities of the sub-marine environment. There are several large land-slides in the Saguenay Fjord, but their limitednumber does not allow us to recommend a valueof critical displacement.
5. Discussion
5.1. Stability of the 1996 £ood event layer
As mentioned above major displacements areonly expected in certain regions of the fjord formoment magnitudes larger than 6.75. The areasthat appear most likely to fail under such earth-quakes are the head regions of the Baie des Ha!Ha! and the delta of St. Fulgence in the BrasNord. As noted previously, some authors (e.g.Locat et al., 2000) believe that the Mn V7 earth-quake of 1663 might have had its epicenter some-where near the epicenter of the 1988 Saguenayearthquake. If such an earthquake was to takeplace now, it would pose a major hazard to thestability of the £ood layer. However, earthquakesof such magnitudes do not appear to be frequentin the Saguenay Fjord region. Lake sedimentcores representing some 3000 years of sedimentaccumulation of the area near the Saguenay Fjordhave shown the occurrence of ‘abnormal’ siltlayers attributed to seismic shaking events priorto the 1988 earthquake (Doig, 1998). The siltlayers, much thicker and more widely distributedthan the one associated with the 1988 event, werebelieved to be generated by earthquakes of localorigin of magnitudes ranging between 6 and 7.From these data Doig (1998) estimated a recur-rence interval for magnitude v 6 earthquakes of350^1000 years. Thus, it would appear from thisrecurrence interval range that failure of the £oodlayer in the near future is highly unlikely.
5.2. Contrasting the model results with geologicaland geomorphological evidence
The critical acceleration and Newmark dis-placement charts show results that are consistentwith geological and geomorphological observa-tions. First of all, the areas that seem most prone
MARGO 3080 7-6-02 Cyaan Magenta Geel Zwart
R. Urgeles et al. /Marine Geology 185 (2002) 319^340336
to failure are those more proximal to river mouthswhere slopes are steep, cohesionless materials arepresent, and sedimentation rates are high. Theagreement is striking between relatively low valuesof the critical acceleration and the location thelargest failure in the fjord (Fig. 3A,B, arrows),roughly in the center of the Baie des Ha! Ha!(Fig. 12). This might indicate that failure tookplace in an area where sediments already hadlow cyclic shear strengths.
5.3. In£uence of local site conditions
One of the major in£uences on ground motionis local site condition. This is a factor that, if notproperly taken into account, may strongly a¡ectestimates of Newmark displacement. For exam-ple, ground motions generated by moderate earth-quakes at distances of 40^100 km may be ampli-¢ed by a factor of two by site characteristics(Idriss, 1990). When we initially carried out ourstudy, we evaluated ground motions as theywould occur on ¢rm rock, and deceivingly theresults could not explain how landslides couldbe formed on the fjord bottom without seismicevents of an extraordinary magnitude. However,if ampli¢cation is considered, inferred ground mo-tions and displacements may be explained fromthe range of earthquakes that the area is knownto be subject to from historical records.
5.4. Method limitations
Several simpli¢cations are implicit in the anal-ysis we have carried out. Among them, the sim-pli¢cation that may most in£uence results relatesto the input parameters used to calculate the crit-ical acceleration (ac). In our analysis we assumedthat Recent Saguenay sediments behave the sameas most present marine sediments. While this is areasonable approximation it is also true that sed-imentation in fjord areas has a speci¢c characterthat probably a¡ects their geotechnical properties.Some authors (see Yegian et al., 1991a,b; Man-kelow and Murphy, 1998) include a probabilisticapproach to account for the variability and un-certainty associated with the input parameters.Although such an analysis is desirable, it is be-
yond the scope of this paper. There is an addi-tional uncertainty derived from the model of Leeand Edwards (1986). The model assumes that thesediment is vertically homogeneous while, ac-tually, we should probably best consider a layeredsystem as shown by down core variations of thegrain size, water content and shear strength.A complete discussion of the limitations of spa-
tial analysis for determining earthquake inducedlandslide hazard is given in Miles et al. (2000).The major limitation we are dealing with in spa-tial data analysis when combining data sets suchas bathymetry derived from multibeam sonar sys-tems and physical properties measured on samplesis the fact that the data sets have resolutions thatdi¡er by orders of magnitude. Transforming thedata measured on sediment samples to a higherresolution data set involves deaggregation, whichwill cause an added uncertainty (Heuvelink andPebesma, 1999). Miles et al. (2000) note thatthat this consideration implies that we shouldrun the analysis at the resolution of the coarsestdata. However, we proceeded, as did Miles et al.(2000), with the most common choice of using theresolution of the bathymetry data.A problem of the Newmark’s analysis is that
the e¡ects of the vertical component of shakingare not accounted for (Jibson, 1993).Although, as noted by Miles and Keefer (2000),
synthetic ground motion may not accurately pre-dict actual ground motions in all instances, thismethod is considered the most reliable since itdoes not rely on extrapolations based on datafrom other areas.
5.5. Future work
To assess the stability of the 1996 £ood layerwith more con¢dence, further samples need to beacquired to overcome, at least to a larger extent,the problems associated with deaggregation.We assume that the cyclic response of the sedi-
ments in Fig. 10, which are derived from studyareas worldwide, is approximately the same asthe response of Saguenay Fjord sediments. Testsunder cyclic load conditions also need to be car-ried out on Saguenay Fjord sediments to deter-mine the consistency of such an assumption.
MARGO 3080 7-6-02 Cyaan Magenta Geel Zwart
R. Urgeles et al. /Marine Geology 185 (2002) 319^340 337

6. Conclusions
In this article we apply spatial data and extendthe pseudostatic approach of Lee and Edwards(1986), to perform a Newmark permanent dis-placement analysis using synthetic ground mo-tions. The analysis produces a consistent agree-ment between calculated Newmark displacements,critical acceleration and present or most likelyareas of slope instability.Ampli¢cation due to speci¢c soil conditions ap-
pears to be an important parameter to take intoaccount if reliable earthquake magnitudes are tobe linked with landslides in the study area. Suchampli¢cation will e⁄ciently control the groundmotion characteristics and, thus, the onset oflandslide triggering.According to this study, major displacements
that might induce failure are only expected fromearthquake moment magnitudes of 6.5 or larger.Therefore, the 1996 £ood layer appears to be seis-mically stable.
Acknowledgements
The authors would like to thank the severalcaptains and crews of the vessels involved inacquiring the data here presented, including thoseof F.G. Creed, D. Riverain and A.C. Horth. Wealso owe thanks to P. Cochonat, M. Makelow andT. Mulder for critically reviewing the manuscript.We acknowledge the financial support of theQuebec Ministry of Education for postdoctoralfellowship provided to R.U. This study wassupported by the Natural Sciences and Engineer-ing Research Council and Alcan of Canada Ltdwith funds provided to the strategic project‘Saguenay post-de¤luge’ (STP201981) andCOSTA-Canada (CRO-234277-00). Support fromthe EU through project COSTA (EVK3-CT-1999-00006) is also acknowledged.
References
Atkinson, G.M., Boore, D.M., 1995. Ground-motion relationsfor eastern North America. Bull. Seismol. Soc. Am. 85, 17^30.
Barbeau, C., Bougie, R., Co“te¤, J.-E., 1981a. Varations spa-tiales et temporelles du ce¤sium-137 et du carbone dans desse¤diments du fjord du Saguenay. Can. J. Earth Sci. 18,1004^1011.
Barbeau, C., Bougie, R., Co“te¤, J.-E., 1981b. Temporal andspatial variations of mercury, lead, zinc, and copper in sedi-ments of the Saguenay fjord. Can. J. Earth Sci. 18, 1065^1074.
Benites, R., Aki, K., 1994. Ground motion at mountains andsedimentary basins with vertical seismic velocity gradient.Geophys. J. Int. 116, 95^118.
Boore, D.B., 1996. SMSIM ^ Fortran program for simulatingground motions from earthquakes: Version 1.0. USGSOpen File Report 96-80-A. US Geological Survey, Denver,CO, 73 pp.
Bouchard, R., Dion, D.J., Tavenas, F., 1983. Origine de lapre¤consolidation des argiles du Saguenay, Que¤bec. Can.Geotech. J. 20, 315^328.
Brooks, G.R., Lawrence, D.E., 1999. The drainage of the LakeHa! Ha! reservoir and downstream impacts along Ha! Ha!River, Saguenay area, Quebec, Canada. Geomorphology 28,141^168.
Carr, B.J., Hajnal, Z., Prugger, A., 1998. Shear-wave studies inglacial till. Geophysics 63, 1273^1284.
Chagnon, J.Y., Locat, J., 1988. The e¡ects of seismic activityon the soils of the Charlevoix area ^ Quebec, Canada. In:El-Sabh, M.I., Murty, T.S. (Eds.), Natural and Man-madeHazards. Reidel, Dordrecht, pp. 125^136.
Cochonat, P., Le Suave¤, R., Charles, C., Greger, B., Ho¡ert,M., Lenoble, J.P., Meunier, J., Pautot, G., 1992. First in situstudies of nodule distribution and geotechnical measure-ments of associated deep-sea clay (Northeastern Paci¢cOcean). Mar. Geol. 103, 373^380.
Department of Earth and Planetary Sciences, 2000. HarvardCentroid Moment Tensor Database, Harvard University,Cambridge, MA, http://www.seismology.harvard.edu/CMTsearch.html.
Doig, R., 1998. 3000-year paleoseismological record from theregion of the 1988 Saguenay, Quebec, earthquake. Bull. Seis-mol. Soc. Am. 88, 1198^1203.
Du Berger, R., Roy, D.W., Lamontagne, M., Woussen, G.,North, R.G., Wetmiller, R.J., 1991. The Saguenay (Quebec)earthquake of November 25, 1988: seismologic data andgeologic setting. Tectonophysics 186, 59^74.
Duperret, A., Bourgois, J., Lagabrielle, Y., Suess, E., 1995.Slope instabilities at an active continental margin: large-scale polyphase submarine slides along the northern Peru-vian margin, between 5‡S and 6‡S. Mar. Geol. 122, 303^328.
Earth Resources Information Systems Data Center, 1996.Global 30 arc second elevation data set: Sioux Falls, SD.US Geological Survey, Denver, CO, http://edcwww.cr.usgs.-gov/landdaac/gtopo30/gtopo30.html.
Frankel, A., Mueller, C., Barnhand, T., Perkins, D., Leyen-decker, E.V., Dickman, N., Hanson, S., Hopper, M., 1996.National seismic-hazard maps: documentation June 1996.US Geological Survey Open-File Report, 96-532. US Geo-logical Survey, Denver, CO, 71 pp.
MARGO 3080 7-6-02 Cyaan Magenta Geel Zwart
R. Urgeles et al. /Marine Geology 185 (2002) 319^340338
Hampton, M.A., Lee, H.J., Locat, J., 1996. Submarine land-slides. Rev. Geophys. 34, 33^59.
Herrmann, R.B., Akinci, A., 1999. Mid-America ground mo-tion models, http://www.eas.slu.edu/People/RBHerrmann/MAEC/maecgnd.html.
Heuvelink, G.B.M., Pebesma, E.J., 1999. Spatial aggregationand soil process modelling. Geoderma 89, 47^65.
Idriss, I.M., 1990. In£uence of local site conditions on earth-quake ground motions. Proceedings of the Fourth US Na-tional Conference on Earthquake Engineering, PalmSprings, CA, 1, pp. 55^57.
Jibson, R.W., 1993. Predicting earthquake-induced landslidedisplacements using Newmark’s sliding block analysis.Transp. Res. Rec. 1411, 9^17.
Jibson, R.W., Harp, E.P., Michael, J.A., 1998. A method forproducing digital probabilistic seismic landslide hazardmaps: An example of the Los Angeles, California, area.US Geological Survey Open-File Report 98-113. US Geo-logical Survey, Denver, CO, 17 pp.
Kramer, S.L., 1996. Geotechnical Earthquake Engineering.Prentice-Hall, Englewood Cli¡s, NJ, 653 pp.
LaSalle, P., Chagnon, J.-Y., 1968. An ancient landslide alongthe Saguenay River, Quebec. Can. J. Earth Sci. 5, 548^549.
LaSalle, P., Tremblay, G., 1978. De¤po“ts meubles SaguenayLac Saint-Jean. Rapport Ge¤ologique 191. Ministe're desRichesses naturelles du Que¤bec, Que¤bec, 61 pp.
Lee, H.J., Baraza, J., 1999. Geotechnical characteristics andslope stability in the Gulf of Cadiz. Mar. Geol. 155, 173^190.
Lee, H.J., Edwards, B.D., 1986. Regional method to assesso¡shore slope stability. J. Geotech. Eng. 112, 489^509.
Lee, H.J., Locat, J., Dartnell, P., Israel, K., Wong, F., 1999.Regional variability of slope stability: application to the Eelmargin, California. Mar. Geol. 154, 305^321.
Lefebvre, G., Leboeuf, D., Hornych, P., Tanguay, L., 1992.Slope failures associated with the 1988 Saguenay earth-quake, Quebec, Canada. Can. Geotech. J. 29, 117^130.
Locat, J., Bergeron, M., 1988. EŁ tude a' rebours de glissementssous-marins, fjord du Saguenay, Que¤bec. Proceedings of the41st Canadian Geotechnical Conference, Waterloo, ON,pp. 338^346.
Locat, L., Leroueil, S., 1988. Physicochemical and geotechnicalcharacteristics of recent Saguenay Fjord sediments. Can.Geotech. J. 25, 382^388.
Locat, J., Syvitski, J.P., 1991. Le fjord du Saguenay et le golfedu St-Laurent: EŁ talons pour l’e¤valuation des changementsglobaux au Que¤bec. In: Bouchard, M.A., Be¤rard, J., Delisle,C.E. (Eds.), Collection Environnement et Ge¤ologie, Vol. 12.Association Professionelle des Ge¤ologues et des Ge¤ophysi-ciens du Que¤bec, Que¤bec, QC, pp. 309^318.
Locat, J., Dube¤, S., Couture, R., 1997. Analyse de l’e¤croupe-ment rocheux du Mont EŁ boule¤, Que¤bec. Proceedings of the50th Canadian Geotechnical Conference, Ottawa, ON, pp.118^126.
Locat, J., Urgeles, R., Schmitt, T., Hoareau, L., Martin, F.,Hill, P., Long, B., Simpkin, P., Kammerer, E., SanfacZon, R.,2000. The morphological signature of natural disasters in the
Upper Saguenay Fjord area, Que¤bec, Canada. Proceedingsof the 53rd Canadian Geotechnical Conference, Montreal,QC, pp. 109^116.
Loring, D.H., Bewers, J.M., 1978. Geochemical mass balanceof mercury in Canadian fjord. J. Chem. Geol. 22, 309^330.
Mankelow, J.M., Murphy, W., 1998. Using GIS in the prob-abilistic assessment of earthquake triggered landslide haz-ards. J. Earthq. Eng. 2, 593^623.
Martel, L., Gagnon, M., Masse¤, R., Leclerc, A., 1987. Thespatio-temporal variations and £uxes of polycyclic aromatichydrocarbons in the sediments of the Saguenay fjord. WaterRes. 21, 699^707.
Maurice, F., Locat, J. and Leroueil, S., 2000. Caracte¤ristiquesge¤otechniques et e¤volution de la couche de se¤diments de¤po-se¤e lors du de¤luge de 1996 dans la Baie des Ha! Ha! (Fjorddu Saguenay, Que¤bec). Proceedings of the 53rd CanadianGeotechnical Conference, Montreal, Que¤bec, pp. 125^132.
Miles, S.B., Ho, C.L., 1999. Rigorous landslide hazard zona-tion using Newmark’s method and stochastic ground motionsimulation. Soil Dyn. Earthq. Eng. 18, 305^323.
Miles, S.B., Keefer, D.K., 2000. Evaluation of seismic slope-performance models using a regional case study. Environ.Eng. Geosci. 6, 25^39.
Miles, S.B., Keefer, D.K., Nyerges, T.L., 2000. A case study inGIS-based environmental model validation using earth-quake-induced landslide hazard, Proceedings of the 4th In-ternational Symposium on Spatial Accuracy Assessment inNatural Resources and Environmental Science, Amsterdam,pp. 481^492.
Mulder, T., Tisot, J.-P., Cochonat, P., Bourillet, J.-F., 1994.Regional assessment of mass failure events in the Baie desAnges, Mediterranean Sea. Mar. Geol. 122, 29^45.
Natural Resources Canada, 1999. Canadian national earth-quake database, Ottawa, Canada. Geological Survey ofCanada. http://www.seismo.nrcan.gc.cadatabase/eq_d-b_e.html.
Newmark, N.M., 1965. E¡ects of earthquakes on dams andembankments. Ge¤otechnique 15, 139^160.
Perret, D., Locat, J., Leroueil, S., 1995. Strength developmentwith burial in ¢ne-grained sediments from the SaguenayFjord, Quebec. Can. Geotech. J. 32, 247^262.
Piper, D.J.W., Cochonat, P., Morrison, M.L., 1999. The se-quence of events around the epicentre of the 1929 GrandBanks earthquake: initiation of debris £ows and turbiditycurrents inferred from sidescan sonar. Sedimentology 46,79^97.
Roberts, J.A., Cramp, A., 1996. Sediment stability on the west-ern £anks of the Canary Islands. Mar. Geol. 134, 13^30.
Sarma, S.K., 1975. Seismic stability of earth dams and em-bankments. Ge¤otechnique 25, 743^761.
Schafer, C.T., Smith, J.N., 1987. Hypothesis for a submarinelandslide and cohesionless sediment £ows resulting from a17th century earthquake-triggered landslide in Quebec, Can-ada. Geo-Mar. Lett. 7, 31^37.
Schafer, C.T., Smith, J.N., 1988. Evidence of the occurrenceand magnitude of terrestrial landslides in recent SaguenayFjord sediments. In: El-Sabh, M.I., Murty, T.S. (Eds.), Nat-
MARGO 3080 7-6-02 Cyaan Magenta Geel Zwart
R. Urgeles et al. /Marine Geology 185 (2002) 319^340 339

ural and Man-made Hazards. Kluwer Academic, New York,pp. 137^145.
Schafer, C.T., Smith, J.M., Loring, D.H., 1980. Recent sedi-mentation events at the head of the Saguenay Fjord, Cana-da. Environ. Geol. 3, 139^150.
Seed, H.B., 1979. Considerations in earthquake-resistant de-sign of earth and rock-¢ll dams. Ge¤otechnique 29, 215^263.
Smith, W.H.F., Wessel, P., 1990. Gridding with continuouscurvature splines in tension. Geophysics 55, 293^305.
Sommerville, P.G., McLaren, J.P., Saikia, C.K., Helemberger,D.V., 1990. The 25 November 1988 Saguenay earthquakeand the attenuation of strong ground motion. Bull. Seismol.Soc. Am. 80, 1118^1143.
Sugito, M., Kiremidjian, A.S., Shah, H.C., 1991. Nonlinearground motion ampli¢cation factors based on local soil pa-rameters. Proceedings of the International Conference onSeismic Zonation 2, Stanford, CA, pp. 221^228.
Syvitski, J.P.M., Praeg, D.B., 1989. Quaternary sedimentationin the St. Lawrence estuary and adjoining areas, EasternCanada: an overview based on high-resolution seismo-strat-igraphy. Ge¤ogr. Phys. Quat. 43, 291^310.
Syvitski, J.P.M., Schafer, C.T., 1996. Evidence for an earth-quake-triggered basin collapse in Saguenay Fjord, Canada.Sediment. Geol. 104, 127^153.
Tso, W.K., Zhu, T.J., 1991. Implications of the 1988 Saguenayearthquake on Canadian seismic strength speci¢cation. Can.J. Civ. Eng. 18, 130^139.
Tuttle, M., Law, K.T., Seeber, L., Jacob, K., 1990. Liquefac-tion and ground failure induced by the 1988 Saguenay, Que-bec earthquake. Can. Geotech. J. 27, 580^589.
Urgeles, R., Locat, J., Schmitt, T., Hughes Clarke, J.E., 2002.The July 1996 £ood deposit in the Saguenay Fjord, Quebec,Canada: Implications for sources of spatial and temporalbackscatter variations. Mar. Geol. 184, 41^60.
Wessel, P., Smith, W.H.F., 1991. Free software helps map anddisplay data. EOS Trans. Am. Geophys. Union 72, 441.
Wessel, P., Smith, W.H.F., 1998. New, improved version ofthe Generic Mapping Tools released. EOS Trans. Am. Geo-phys. Union 79, 579.
Wilson, R.C., Keefer, D.K., 1983. Dynamic analysis of a slopefailure from the 6 August 1979 Coyote Lake, California,earthquake. Bull. Seismol. Soc. Am. 73, 863^877.
Yegian, M.K., Marciano, E.A., Ghahraman, V.G., 1991a.Seismic risk analysis for earth dams. J. Geotech. Eng. 117,18^34.
Yegian, M.K., Marciano, E.A., Ghahraman, V.G., 1991b.Earthquake-induced permanent deformations: Probabilisticapproach. J. Geotech. Eng. 117, 35^50.
MARGO 3080 7-6-02 Cyaan Magenta Geel Zwart
R. Urgeles et al. /Marine Geology 185 (2002) 319^340340