A Spatial-Temporal Approach to Differentiate Epidemic Risk Patterns
14
A Spatial-Temporal Approach to Differentiate Epidemic Risk Patterns T.H. Wen, et al. Tzai-hung Wen a , Neal H Lin b , Katherine Chun-min Lin c , I-chun Fan a , Ming-daw Su d and Chwan-chuen King b a Centre for Geographical Information Science, Research Centre for Hu- manities and Social Sciences, Academia Sinica, Taipei, Taiwan b Institute of Epidemiology, College of Public Health, National Taiwan University, Taipei, Taiwan c Department of Public Health, College of Public Health, National Taiwan University, Taipei, Taiwan d Department of Bioenvironmental Systems Engineering, National Taiwan University, Taipei, Taiwan A Spatial-Temporal Approach to Differentiate Epidemic Risk Patterns Abstract: The purpose of disease mapping is to find spatial clustering and identify risk areas and potential epidemic initiators. Rather than relying on plotting either the case number or incidence rate, this chapter proposes three temporal risk indices: the probability of case occurrence (how often did uneven cases occur), the duration of an epidemic (how long did cases persist), and the intensity of a transmission (were the case of chronological significance). By integrating the three indicators using the local indicator of spatial autocorrelation (LISA) statistic, this chapter intends to develop a novel approach for evaluating spatial-temporal relationships with different risk patterns in the 2002 dengue epidemic, the worst outbreak in the past sixty years. With this approach, not only are hypotheses generated through the mapping processes in furthering investigation, but also procedures pro- vided to identify spatial health risk levels with temporal characteristics. Keywords: risk identification, spatial autocorrelation, spatial-temporal analysis, epidemic 1 Introduction In 1854, John Snow curbed the spread of cholera by identifying through mapping the infected water pump located in the Golden Square of London (Snow 1936). Ever since, mapping of infected cases has become an impor-
Transcript of A Spatial-Temporal Approach to Differentiate Epidemic Risk Patterns
A Spatial-Temporal Approach to Differentiate
Epidemic Risk Patterns
T.H. Wen, et al.
Tzai-hung Wena, Neal H Linb, Katherine Chun-min Linc, I-chun Fana,
Ming-daw Sud and Chwan-chuen Kingb
a Centre for Geographical Information Science, Research Centre for Hu-
manities and Social Sciences, Academia Sinica, Taipei, Taiwan b Institute of Epidemiology, College of Public Health, National Taiwan
University, Taipei, Taiwan c Department of Public Health, College of Public Health, National Taiwan
University, Taipei, Taiwan d Department of Bioenvironmental Systems Engineering, National Taiwan
University, Taipei, Taiwan
A Spatial-Temporal Approach to Differentiate Epidemic Risk Patterns
Abstract: The purpose of disease mapping is to find spatial clustering and
identify risk areas and potential epidemic initiators. Rather than relying on
plotting either the case number or incidence rate, this chapter proposes
three temporal risk indices: the probability of case occurrence (how often
did uneven cases occur), the duration of an epidemic (how long did cases
persist), and the intensity of a transmission (were the case of chronological
significance). By integrating the three indicators using the local indicator
of spatial autocorrelation (LISA) statistic, this chapter intends to develop a
novel approach for evaluating spatial-temporal relationships with different
risk patterns in the 2002 dengue epidemic, the worst outbreak in the past
sixty years. With this approach, not only are hypotheses generated through
the mapping processes in furthering investigation, but also procedures pro-
vided to identify spatial health risk levels with temporal characteristics.
Keywords: risk identification, spatial autocorrelation, spatial-temporal
analysis, epidemic
1 Introduction
In 1854, John Snow curbed the spread of cholera by identifying through
mapping the infected water pump located in the Golden Square of London
(Snow 1936). Ever since, mapping of infected cases has become an impor-

A Spatial-Temporal Approach to Differentiate Epidemic Risk Patterns 215
tant means to generating hypotheses, guiding intervening measures, and
controlling infectious outbreak. Mapping can help epidemiologists to find
the origins of an outbreak, but more importantly, to target high-risk areas
and places of strategic importance in disease prevention (Ali et al. 2003).
A Geographical Information Systems (GIS) is often constructed under
these circumstances: a computer-based system is set up to integrate spatial
statistics into maps, which can detect disease clustering and determine re-
lationships between disease rates and relevant geographic locations (Lai et
al. 2004, Cockings et al. 2004, Dunn et al. 2001). Recent studies have
united temporal factors with spatial analysis and found dynamic epidemic
changes in certain time course and in specific locations (Tran et al. 2004,
Harrington et al. 2005, Morrison et al. 1998, João et al. 2004, Getis et al.
2003). Unlike the traditional approach, this chapter enhances spatial analy-
sis by using not only the incidence rate. We propose a spatial model that
integrates temporally-defined epidemiological characteristics and verify it
using data from the 2002 dengue epidemic in Taiwan.
Dengue virus, a member of flaviviruses with four known antigenic dis-
tinct serotypes, is transmitted in Taiwan mainly by mosquitoes of species
Aedes aegypti and Aedes albopictus. Few studies have focused on the in-
terplay between the spatial clustering of dengue cases and entomological
factors (Ali et al. 2003, Tran et al. 2004, Morrison et al. 1998) or environ-
mental conditions (Alpana and Haja 2001) by using a GIS with spatial sta-
tistics. However, spatial analysis is the key to identifying the incidence of
dengue fever (DF), dengue hemorrhagic fever (DHF) and dengue shock
syndrome (DSS). On the contrary, several studies have the treated tempo-
ral issues on dengue transmission (Tran et al. 2004, Harrington et al. 2005,
Morrison et al. 1998, Derek et al. 2004). Innovative models of temporal-
spatial analysis in disease transmission have proffered, and tested by data
of the 2002 dengue epidemic in Taiwan, which was the worst outbreak in
both magnitude and severity in the past sixty years. Hopefully this novel
approach of disease surveillance can be applied to detect other infectious
diseases.
2 Materials and Methods
2.1 Data of Dengue Confirmed Cases
Kaohsiung City and its satellite city of Fengshan, confronted in 2002 the
biggest dengue epidemic in Taiwan since 1940s. A total of 4,790 cases
were confirmed (representing 85% of total cases found in 2002), including
4,574 dengue fever (DF) cases and 286 dengue hemorrhagic fever (DHF)

216 T.H. Wen, et al.
cases according to WHO’s definition (Chao et al. 2004). This study fo-
cuses on these 4,790 confirmed cases cohered with positive results in one
of the three following laboratory tests: (1) molecular diagnosis (Lanciotti
et al. 1992), or (2) serological diagnosis (Shu et al. 2001), or (3) virus iso-
lation (Kuno et al. 1985). Figure 1 illustrates the temporal progression of
DF versus DHF cases.
This chapter chooses Li - the smallest administrative unit in Taiwan - as
the spatial mapping unit, and a 7-day week as the temporal indicator. Most
Li in urban areas occupies 0.26-0.58 square kilometers and comprises
2,100-5,300 residents or 850-1,600 households. 423 Li covered roughly
94.4% of total confirmed dengue cases in 2002. These case data were pro-
vided by the Taiwan-CDC and without personal identifiers to protect the
privacy of the patients. All cases (including DHF cases) collected in this
chapter were summarized at the Li scale, instead of by exact addresses.
Fig. 1. The epidemic curve of week-based total confirmed dengue (DEN) and
dengue hemorrhagic fever (DHF) cases in Kaoshiung City and Fengshan City,
2002
2.2 Temporally-defined Indices as Epidemiological Measures
A risk model developed by Wen et al. (2006) depicts the dynamic process
of a dengue epidemic by emphasizing temporal characteristics on map dis-
plays. To evaluate a dengue epidemic in both magnitude and severity, this
chapter modifies and further introduces indices with temporally-defined
epidemiological characteristics (also referred to as temporal indices), in-
cluding (1) probability of occurrence or how often do cases occur in cer-
tain week(s) of a calendar year (e.g. 2002 in this study), (2) duration of

A Spatial-Temporal Approach to Differentiate Epidemic Risk Patterns 217
epidemic or how long does an epidemic persist, and (3) intensity of
transmission or how significant do cases among people at risk happen
and cumulate in consecutive weeks during an epidemic wave. A higher
value of , , will indicate that a case studied is more likely to occur
within a specific time interval with a longer duration and more intense
transmission.
2.2.1 Probability of Occurrence Index ( )
, the probability of a disease occurrence in certain week(s), is the propor-
tion of one or more laboratory confirmed dengue cases occurred in an epi-
demic period (i.e.. numerator, EW) to the total number of weeks in that
year (i.e.. denominator, TW = 52). The mathematical definition of of a
specific disease is expressed in Equation 1 below:
TW
EW Eqn. 1
2.2.2 Duration of Epidemic Index ( )
To monitor the persistence of disease cases in a geographical area of inter-
est, the duration of an epidemic ( ) is described as the average number of
weeks per epidemic wave as in Equation 2:
EV
CWEV
i
i
1
Eqn. 2
where CWi represents the summation of persistent numbers of weeks for
the ith epidemic wave, and EV is the total number of epidemic waves in the
studying period. The duration index, reflecting the effectiveness of preven-
tive and control strategies used during the early period of an epidemic, is
very valuable for public health practitioners and administrators. A larger
value means fewer disease cases are eliminated.
2.2.3 Intensity of Transmission Index ( )
To measure population-adjusted mean magnitude of dengue cases per
wave, intensity of transmission equals to the mean number of case(s) oc-
curred in successive weeks divided by number of people at risk in an epi-
demic wave. Therefore, the intensity of transmission index ( ) is formu-
lated as in Equation.3:

218 T.H. Wen, et al.
= (CaseNum/POP)/EV Eqn. 3
where CaseNum and POP represent respectively the cumulative total of
confirmed dengue cases and population-at-risk, and EV as described
above. The index is comparable to a measure of the intensity of cases in
different areas considering both the duration and size of the population. A
higher index implies that the occurrence of cases is temporally concen-
trated; whereas a lower value equates to a smaller epidemic wave, indicat-
ing that most cases are sporadic and temporally dispersed throughout the
epidemic. The use of different temporal indices offers clues to key ele-
ments of an epidemic that are worth investigating.
2.3 Spatial risk index: Local Indicator of Spatial Autocorrelation
Other than temporally-defined epidemiological characteristics, the degree
of spatial clustering among cases (i.e. spatial risk) (Odland 1988) is also
needed to measure the degree of association between an interested tempo-
ral index and its specified location. Spatial autocorrelation, including
global and local autocorrelation indices, are then introduced. A Positive
spatial autocorrelation and negative spatial autocorrelation in the Global
indices (Griffith 1987) respectively represent “clustering” of points based
on tested variables (Anselin 1995) and inverse correlation, shown as “spa-
tial outliers”, between neighboring areas. A zero spatial autocorrelation is
considered a random distribution rather than clustering or dispersal. Local
autocorrelation indices, however, evaluate trends of clustering by compar-
ing similarities and dissimilarities among neighboring locations. Therefore,
further information about clustered loci is gained. In brief, the Local Indi-
cator of Spatial Autocorrelation (LISA) can be regarded a spatial risk in-
dex to identify both significant spatial clusters and outliers (Anselin 1995).
The definition of LISA index is given below:
n
j
j
iji
XXW
XXiI
1
)()()(
Eqn. 4
where I(i) = the LISA index for region i; Wij = the proximity of region i to
region j; Xi = the value of the tested temporal index of region i; Xj = the
value of the tested temporal index of region j; X = the average value of
the tested temporal index; = the standard deviation of Xi; and n = the to-
tal number of regions to be evaluated.

A Spatial-Temporal Approach to Differentiate Epidemic Risk Patterns 219
The term Wij describes the proximity between region i and j, where a
value of 1 means that region i is next to region j. The term
)()( XXXX jidescribes the degree of similarity in a tested index within
a designated area and its neighbors; from which each of temporal indices
for the 2002 dengue epidemic in Kaohsiung and Fengshan was evaluated.
A positive I(i) value of the tested LISA means that a certain region and its
neighboring areas exhibit a clustering of homogenous areas and have a
higher tendency of local spatial dependency. In contrast, a negative I(i)
value, which shows the opposite trend between Xi and Xj (i.e. Xi = high,
Xj = low or vice versa), implying a negative spatial dependency (i.e. the
region is a spatial outlier in relation to its neighborhoods). The Monte
Carlo significance test can be used to evaluate the statistical significance of
spatial clusters and outliers (Anselin 1995). Risk areas can be classified by
LISA index values into five distinct levels of epidemiological significance
(Table 1).
Fig. 2. Definitions of five spatial risk levels. Areas with a high value of the tested
index are shown in grey and areas with a low index value are shaded in white.
Among the five spatial risk distributions, (a) shows a spatial cluster of high values
of the tested temporal index; (b) and (c) represent the spatial outliers; (d) shows
random spatial distribution of the tested temporal index; and (e) displays a spatial
cluster of low values of the tested temporal index.
Risk Levels: (a) Extreme (b) High (c) Moderate (d) Mild (e) Lowest
Cell with high index value is shaded in grey Cell with low index value is shaded in white

220 T.H. Wen, et al.
Table 1. Five spatial risk levels with epidemiological significance
Spatial
Risk Level Epidemiological Significance
Level 1
(Extremely
high)
Areas surrounded by neighboring areas having a statistically
significant positive LISA index and a high tested temporal index
value, shown in Figure 2(a), represent a spatial clustering of
such an designated temporal index. This implies the presence of
a severe epidemic spreading in that locality with extreme risk.
Level 2
(High)
Areas surrounded by neighboring areas with statistically signifi-
cant negative LISA index, where the central area has lower
tested temporal index value (as a spatial outlier) compared with
it’s neighbors, shown in Figure 2(b). This implies that a disease
outbreak would soon occur in these high-risk areas, if effective
control measures are not taken.
Level 3
(Moderate)
Areas surrounded by neighboring areas with statistically signifi-
cant negative LISA index, where the central area has higher
tested temporal index value (as a spatial outlier), opposite to
Level 2, compared with it’s neighbors, shown in Figure 2(c),
and implies that the focused area with moderate risk could be a
potential source of infection if cases begin appearing in the sur-
rounding areas.
Level 4
(Mild)
Areas surrounded by neighbors having neither a significantly
positive nor negative LISA index, shown in Figure 2(d). This re-
fers to cases occurred sporadically in those areas but there is no
significant spatial cluster or outlier.
Level 5
(Lowest)
Areas surrounded by neighbors having a statistically significant
positive LISA index, but low for the tested all the three temporal
index values, shown in Figure 2(e); this situation implies no
outbreak occurs in those areas.
3 Results
3.1 Correlation among three temporally-defined epidemiological Indices
All three temporal indices (including probability of case occurrence , du-
ration of epidemic , and intensity of transmission ) show significant
positive correlation with the “incidence rate” (p < 0.001) (Table 2). Among
the temporally-defined characteristics, intensity is strongly correlated with
duration ( and : 0.841), indicating that dengue cases in areas with a
higher intensity are most likely to persist (i.e. last a longer duration). Yet,

A Spatial-Temporal Approach to Differentiate Epidemic Risk Patterns 221
the correlation coefficient between and at 0.425 is not significant
enough, denoting that a higher occurrence of dengue cases does not always
imply a higher intensity of transmission, which suggests difficulty in curb-
ing the spread of the disease.
Table 2. Correlation matrix among incidence rate and the three temporally-
defined characteristics in the 2002 Dengue Epidemic in Kaoshiung and Fengshan
Cities in Southern Taiwan
Probability of
occurrence ( )
Duration of
Epidemic ( )
Intensity of
Transmission ( )
Incidence Rate
(IR)
Probability of
occurrence ( )1 0.625** 0.425 * 0.681**
Duration of Epi-
demic ( )0.625** 1 0.841 * 0.636**
Intensity of
Transmission ( )0.425 * 0.841 * 1 0.801**
Incidence Rate
(IR)0.681** 0.636** 0.801** 1
(*) means the value is high with a 95% statistical significance.
(**) means the value is high with a 99% statistical significance.
Nevertheless, sporadic cases likely to initiate an epidemic in certain
geographic areas should be identified. Table 2 shows the importance of
specifying spatial risk areas with different temporally-defined characteris-
tics. Such information is valuable for public health officials to determine
where dengue cases with a longer duration or a higher transmissible inten-
sity but a lower incidence rate are located.
3.2 Spatial patterns analysis with temporally-defined epidemiological indices
This chapter illustrates a means to search for possible risk areas and point
out likely areas with a longer duration of epidemic or more severe intensity
of transmission. The procedures to examine each temporal index include
the following: spatial mapping, spotting spatial risk areas, comparing their
risk patterns, and finally, evaluating and filtering factors having the great-
est influence on DHF epidemics in areas of different risk types.

222 T.H. Wen, et al.
3.2.1 Identifying epidemic risk areas
Fig. 3. Mapping the values of incidence and other three temporal indices (prob-
ability of occurrence, duration of epidemic and transmission of intensive) with ob-
served clusters. The darker areas reflect a higher value of that indicated index. The
locations of dengue clusters are shown as circled areas.

A Spatial-Temporal Approach to Differentiate Epidemic Risk Patterns 223
Figure 3 shows plots of the three temporal indices along with that of the
incidence rate (IR). The spatial patterns on these plots are compared to
identify possible risk areas (Mermel 2005). In these cases, darker areas in
the figure reflect a higher value of the index. Risk areas with higher values
in all three temporal indices (labeled as (a2)-(b2), (a3)-(b3), and (a4)-(b4)
respectively in Figures 3B, 3C, 3D) are also recognized by IR (labeled as
(a1)-(b1) in Figure 3A). However, areas with higher IR values (Figure 3A)
are not detectable as areas with a longer duration of epidemic (e.g. c3 in
Figure 3C) or those of a higher intensity of transmission (e.g. c4 and d4 in
Figure 3D).
3.2.2 Identifying spatially significant clusters and outliers
“Spatial outlier” is another important spatial pattern for risk identification
besides “spatial clusters,” particularly at the beginning of an epidemic. To
evaluate spatial association (including spatial clusters and outliers) with
the three Li-based temporal indices, this study transforms LISA statistics
into five different spatial risk levels with a 95% statistical significance
(Table 1 and Figure 2) and displays their spatial distributions in Figure 4.
The LISA map for IR shows two statistically significant clusters (i.e.
circles (a) and (b) in Figure 4A). Comparing this map of IR with that of the
probability of occurrence ( ), we can observe similarity in the clustering
of cases in two locations (marked by circles (a) and (b) in Figure 4B).
Similar clusters can also be found on LISA maps of the duration of epi-
demic ( ) (i.e. circles (a) and (b) in Figure 4C) and the intensity of trans-
mission ( ) (i.e. circles (a) and (b) in Figure 4D). Further comparison
among the temporal characteristics in all areas marked (a) and (b) in Fig-
ures 4B, 4C, 4D suggests that areas with a higher are larger in size and
cover more Li than those with a higher or (e.g. : 14.35 km2 vs. : 8.74
km2 and : 4.24 km2 at circle (a); : 4.25 km2 vs. : 0.47 km2 and : 0.26
km2 at circle (b)). Fewer Li with a higher or are found in circle (b)
(Figures 4C and 4D), which implies somewhat effective control strategies.
These areas in circle (b) characterized by having a shorter duration (0.7-1.5
weeks/wave) and a lower intensity of transmission (0.2-1.2 dengue
cases/10,000 population-at-risk/wave) have had mosquito breeding sites
reduced throughout.
Areas with 159 dengue cases can be identified using the IR map (9 Li
covering about 1.05 square meters) although their values on duration and
intensity are not particularly high ( = 1.92~2.01 weeks, = 1.18~1.26).
Moreover, areas with moderate risks marked by circles (c) in Figures 4C
and 4D have higher temporal index values than their surroundings (Central

224 T.H. Wen, et al.
Fig. 4. Dengue significant risk maps of incidence and other three temporal indices
to show spatial clusters and outliers. The Local Indicator of Spatial Autocorrela-
tion (LISA) was adopted as the spatial risk index to identify both significant spa-
tial clusters and outliers of the tested temporal in-dices. Monte Carlo significance
test with p<0.05 was used to evaluate the statistical significance of spatial clusters
and outliers.
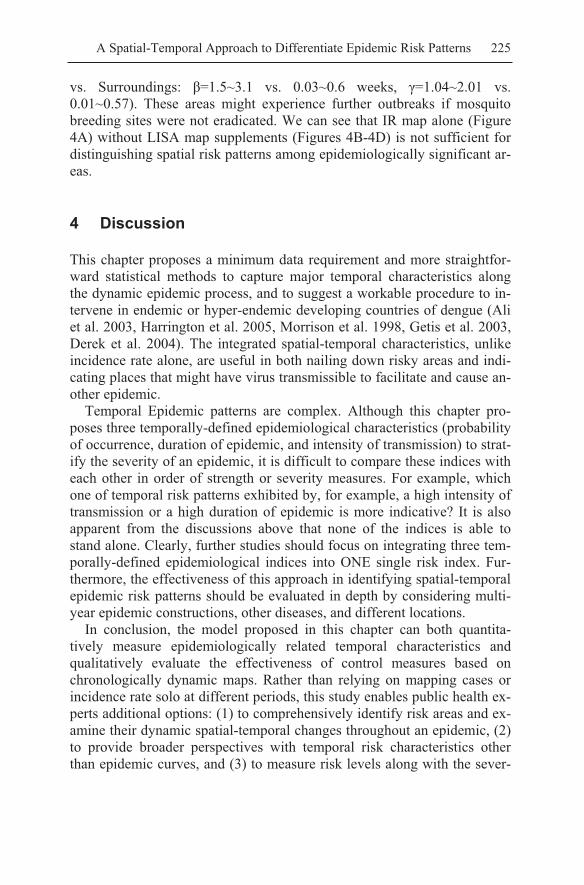
A Spatial-Temporal Approach to Differentiate Epidemic Risk Patterns 225
vs. Surroundings: =1.5~3.1 vs. 0.03~0.6 weeks, =1.04~2.01 vs.
0.01~0.57). These areas might experience further outbreaks if mosquito
breeding sites were not eradicated. We can see that IR map alone (Figure
4A) without LISA map supplements (Figures 4B-4D) is not sufficient for
distinguishing spatial risk patterns among epidemiologically significant ar-
eas.
4 Discussion
This chapter proposes a minimum data requirement and more straightfor-
ward statistical methods to capture major temporal characteristics along
the dynamic epidemic process, and to suggest a workable procedure to in-
tervene in endemic or hyper-endemic developing countries of dengue (Ali
et al. 2003, Harrington et al. 2005, Morrison et al. 1998, Getis et al. 2003,
Derek et al. 2004). The integrated spatial-temporal characteristics, unlike
incidence rate alone, are useful in both nailing down risky areas and indi-
cating places that might have virus transmissible to facilitate and cause an-
other epidemic.
Temporal Epidemic patterns are complex. Although this chapter pro-
poses three temporally-defined epidemiological characteristics (probability
of occurrence, duration of epidemic, and intensity of transmission) to strat-
ify the severity of an epidemic, it is difficult to compare these indices with
each other in order of strength or severity measures. For example, which
one of temporal risk patterns exhibited by, for example, a high intensity of
transmission or a high duration of epidemic is more indicative? It is also
apparent from the discussions above that none of the indices is able to
stand alone. Clearly, further studies should focus on integrating three tem-
porally-defined epidemiological indices into ONE single risk index. Fur-
thermore, the effectiveness of this approach in identifying spatial-temporal
epidemic risk patterns should be evaluated in depth by considering multi-
year epidemic constructions, other diseases, and different locations.
In conclusion, the model proposed in this chapter can both quantita-
tively measure epidemiologically related temporal characteristics and
qualitatively evaluate the effectiveness of control measures based on
chronologically dynamic maps. Rather than relying on mapping cases or
incidence rate solo at different periods, this study enables public health ex-
perts additional options: (1) to comprehensively identify risk areas and ex-
amine their dynamic spatial-temporal changes throughout an epidemic, (2)
to provide broader perspectives with temporal risk characteristics other
than epidemic curves, and (3) to measure risk levels along with the sever-

226 T.H. Wen, et al.
ity of epidemics after integrating spatial-temporal characteristics. Further-
more, monitoring spatial risk patterns over time described in this chapter
can as well be applied to other infectious diseases, such as the West Nile
encephalitis or Ebola hemorrhagic fever. Last but not least, the approach is
potentially useful for controlling the fast spreading and highly pathogenic
avian influenza virus (HPAI) by shortening the duration of the virus activ-
ity, and by minimizing its intensive transmission in epidemic sites; thus
avoiding a possible pandemic (Mermel 2005).
References
[1] Ali M, Wagatsuma Y, Emch M, Breiman RF (2003) Use of geographic in-
formation system for defining spatial risk for dengue transmission in Bangla-
desh: Role for Aedes Albopictus in an urban outbreak. Am J Trop Med Hyg
69(6): 634 – 640
[2] Alpana B and Haja A (2001) Application of GIS in Modeling of Dengue Risk
Based on Sociocultural Data: Case of Jalore, Rajasthan, India. Dengue Bulle-
tin 25:92-102
[3] Anselin L (1995) Local indicators of spatial association – LISA. Geogr Anal
27 (2): 93–115
[4] Chao DY, Lin TH, Hwang KP, Huang JH, Liu CC, King CC (2004) 1998
Dengue hemorrhagic fever epidemic in Taiwan. Emerg Infect Dis 10(3):552-4
[5] Cockings S, Dunn CE, Bhopal RS, Walker DR (2004) Users' perspectives on
epidemiological, GIS and point pattern approaches to analyzing environment
and health data. Health Place 10(2):169-82
[6] Derek C, Rafael I, Norden H, Timothy E, Ananda N, Kumnuan U, Donald B
(2004) Travelling waves in the occurrence of dengue hemorrhagic fever in
Thailand. Nature 427(22): 344-347
[7] Dunn CE, Kingham SP, Rowlingson B, Bhopal RS, Cockings S, Foy CJ, et al.
(2001) Analyzing spatially referenced public health data: a comparison of
three methodological approaches. Health Place 7:1 -12
[8] Getis A, Morrison AC, Gray K, Scott TW (2003) Characteristics of the spatial
pattern of the dengue vector, Aedes Aegypti, in Inquitos, Peru. Am J Trop
Med Hyg 69(5): 495 – 505
[9] Griffith DA (1987) Spatial Autocorrelation: A Primer. Resource Publications
in Geography (Washington: Association of American Geographers).
[10] Harrington LC, Scott TW, Lerdthusnee K, Coleman RC, Costero A, Clark
GC, et al. (2005) Dispersal of the dengue vector Aedes Aegypti within and
between rural communities. Am J Trop Med Hyg 72(2): 209 – 220
[11] Siqueira JB, Martelli CM, Maciel IJ, Oliveira RM, Ribeiro MG, Amorim FP,
Moreira BC, Cardoso DD, Souza WV, Andrade AL. (2004) Household Sur-
vey Of Dengue Infection In Central Brazil: Spatial Point Pattern Analysis
And Risk Factors Assessment, Am J Trop Med Hyg 71(5): 646–651

A Spatial-Temporal Approach to Differentiate Epidemic Risk Patterns 227
[12] Kuno G, Gubler DJ, Velez M, Oliver A (1985) Comparative sensitivity of
three mosquito cell lines for isolation of dengue viruses. Bull World Health
Organ 63(2):279-86
[13] Lai PC, Wong CM, Hedley AJ, Lo SV, Leung PY, Kong J et al. (2004) Un-
derstanding the spatial clustering of severe acute respiratory syndrome
(SARS) in Hong Kong. Env Hlth Persp 112(15): 1560 – 6
[14] Lanciotti RS, Calisher CH, Gubler DJ, Chang GJ, Vorndam AV (1992) Rapid
detection and typing of dengue viruses from clinical samples by using reverse
transcriptase-polymerase chain reaction. J Clin Microbiol 30(3):545-51
[15] Mermel LA (2005) Pandemic avian influenza. Lancet Infect Dis 5(11):666-7
[16] Morrison AC, Getis A, Santiago M, Rigau-Perez J, Reiter P (1998) Explora-
tory space-time analysis of reported dengue cases during an outbreak in Flor-
ida, Puerto Rico, 1991-1992. Am J Trop Med Hyg 58: 287 – 298
[17] Odland J (1988) Spatial autocorrelation. Newbury Park, CA: Sage
[18] Shu PY, Chen LK, Chang SF, Yueh YY, Chow L, Chien LJ, et al. (2001) An-
tibody to the nonstructural protein NS1 of Japanese encephalitis virus: poten-
tial application of mAb-based indirect ELISA to differentiate infection from
vaccination. Vaccine 19(13-14):1753-63
[19] Snow J (1936) On the mode of communication of cholera. The Common-
wealth Fund. Oxford University Press, London
[20] Tran A, Deparis X, Dussart P, Morvan J, Rabarison P, Remy F, et al. (2004)
Dengue spatial and temporal patterns, French Guiana, 2001. Emerg Infect Dis
10(4): 615 – 621