Am I too fat? Bulimia as an epidemic
12
Journal of Mathematical Psychology 47 (2003) 515–526 Am I too fat? Bulimia as an epidemic Beverly Gonza´lez, a Emilia Huerta-Sa´nchez, b Angela Ortiz-Nieves, c Terannie Va´zquez-Alvarez, d and Christopher Kribs-Zaleta e, a University of Illinois at Urbana-Champaign, USA b Cornell University, USA c University of New Mexico, USA d Colorado State University, USA e Department of Mathematics, University of Texas at Arlington, P.O. Box 19408, Arlington, TX, USA Received 19 February 2002; revised 6 August 2003 Abstract For at least the past 10 yr; eating disorders have had a major impact on the physical and mental health of women, particularly young women. Anorexia and bulimia nervosa are closely linked eating disorders. Anorexia often precedes bulimia. However, there are about 2 million women in college that have been exclusively bulimic. In this article, we focus on the role of college-peer pressure on the dynamics of anorexia-free bulimia. The model looks at bulimia as a progressive disease and explores the impact of intervention (treatment) at two stages of disease progression. The impact of relapse (a common occurrence among bulimics) is taken into account. Analysis indicates that the disorder cannot be wiped out in this population without a shift in cultural pressures; control strategies should include early detection and treatment, as well as preventative education campaigns. r 2003 Elsevier Inc. All rights reserved. Keywords: Bulimia nervosa; Eating disorders; Dynamical systems; Peer pressure; Reproductive number 1. Introduction Like AIDS, eating disorders suddenly became widely known to the North American public in the mid 1980s. The catalyst was the death of popular singer Karen Carpenter from cardiac arrest, associated with the abuse of a drug used to induce vomiting in case of poisoning (Gordon, 1990). Public attention focused for the first time on the self-destructive aspects of anorexia nervosa, and the related illness bulimia nervosa. Both of these disorders revolve around a fear of obesity, obsession with being thin, and a struggle between societal pressures to remain thin and the biological necessity of consuming food. An increase in incidence of these and related disorders has been observed, primarily in young women, over the roughly 20 yr since concerted efforts to keep data on them began. In the segment of the population most deeply impacted, there is a rising epidemic of both anorexia (which causes emaciation from excessive dieting) and bulimia (which changes body chemistry through repeated purging), driven by pressures to conform to cultural ideals. This paper uses techniques developed for the modeling of infectious diseases to study the spread of bulimia as a peer- pressure-driven phenomenon. Because of the psychological aspects of these dis- orders, prevalence data are based in large part on estimates gleaned from self-reporting on questionnaires and records of those individuals actually clinically diagnosed. It is estimated that 8 million people in the US have been diagnosed with anorexia or bulimia, 7 million of whom are females (ANRED, 2001), and that 0.5–3.7% of females suffer from anorexia nervosa in their lifetime, and 1.1–4.2% of females from bulimia nervosa (APA, 2000). The National Center for Health Statistics estimated that about 9000 people admitted to hospitals were diagnosed with bulimia in 1994, and about 8000 were diagnosed with anorexia (NCHS, n.d.). These disorders can be fatal: according to the American Anorexia and Bulimia Association, an estimated 1000 women die of anorexia each year (AABA, n.d.). Both of these eating disorders seem to have the most impact on young women between the ages of 15–25 in the US ARTICLE IN PRESS Corresponding author. Fax: +1-817-272-5802. E-mail address: [email protected] (C. Kribs-Zaleta). 0022-2496/$ - see front matter r 2003 Elsevier Inc. All rights reserved. doi:10.1016/j.jmp.2003.08.002
-
Upload
independent -
Category
Documents
-
view
1 -
download
0
Transcript of Am I too fat? Bulimia as an epidemic

Journal of Mathematical Psychology 47 (2003) 515–526
ARTICLE IN PRESS
�Correspond
E-mail addr
0022-2496/$ - se
doi:10.1016/j.jm
Am I too fat? Bulimia as an epidemic
Beverly Gonzalez,a Emilia Huerta-Sanchez,b Angela Ortiz-Nieves,c
Terannie Vazquez-Alvarez,d and Christopher Kribs-Zaletae,�
aUniversity of Illinois at Urbana-Champaign, USAbCornell University, USA
cUniversity of New Mexico, USAdColorado State University, USA
eDepartment of Mathematics, University of Texas at Arlington, P.O. Box 19408, Arlington, TX, USA
Received 19 February 2002; revised 6 August 2003
Abstract
For at least the past 10 yr; eating disorders have had a major impact on the physical and mental health of women, particularly
young women. Anorexia and bulimia nervosa are closely linked eating disorders. Anorexia often precedes bulimia. However, there
are about 2 million women in college that have been exclusively bulimic. In this article, we focus on the role of college-peer pressure
on the dynamics of anorexia-free bulimia. The model looks at bulimia as a progressive disease and explores the impact of
intervention (treatment) at two stages of disease progression. The impact of relapse (a common occurrence among bulimics) is taken
into account. Analysis indicates that the disorder cannot be wiped out in this population without a shift in cultural pressures; control
strategies should include early detection and treatment, as well as preventative education campaigns.
r 2003 Elsevier Inc. All rights reserved.
Keywords: Bulimia nervosa; Eating disorders; Dynamical systems; Peer pressure; Reproductive number
1. Introduction
Like AIDS, eating disorders suddenly became widelyknown to the North American public in the mid 1980s.The catalyst was the death of popular singer KarenCarpenter from cardiac arrest, associated with the abuseof a drug used to induce vomiting in case of poisoning(Gordon, 1990). Public attention focused for the firsttime on the self-destructive aspects of anorexia nervosa,and the related illness bulimia nervosa. Both of thesedisorders revolve around a fear of obesity, obsessionwith being thin, and a struggle between societalpressures to remain thin and the biological necessity ofconsuming food. An increase in incidence of these andrelated disorders has been observed, primarily in youngwomen, over the roughly 20 yr since concerted efforts tokeep data on them began. In the segment of thepopulation most deeply impacted, there is a risingepidemic of both anorexia (which causes emaciationfrom excessive dieting) and bulimia (which changes
ing author. Fax: +1-817-272-5802.
ess: [email protected] (C. Kribs-Zaleta).
e front matter r 2003 Elsevier Inc. All rights reserved.
p.2003.08.002
body chemistry through repeated purging), driven bypressures to conform to cultural ideals. This paper usestechniques developed for the modeling of infectiousdiseases to study the spread of bulimia as a peer-pressure-driven phenomenon.
Because of the psychological aspects of these dis-orders, prevalence data are based in large part onestimates gleaned from self-reporting on questionnairesand records of those individuals actually clinicallydiagnosed. It is estimated that 8 million people in theUS have been diagnosed with anorexia or bulimia, 7million of whom are females (ANRED, 2001), and that0.5–3.7% of females suffer from anorexia nervosa intheir lifetime, and 1.1–4.2% of females from bulimianervosa (APA, 2000). The National Center for HealthStatistics estimated that about 9000 people admitted tohospitals were diagnosed with bulimia in 1994, andabout 8000 were diagnosed with anorexia (NCHS, n.d.).These disorders can be fatal: according to the AmericanAnorexia and Bulimia Association, an estimated 1000women die of anorexia each year (AABA, n.d.). Both ofthese eating disorders seem to have the most impact onyoung women between the ages of 15–25 in the US
ARTICLE IN PRESSB. Gonzalez et al. / Journal of Mathematical Psychology 47 (2003) 515–526516
(Steiner & Lock, 1998). Because the media portraythinner models as how women should look—the averageNorth American model weighs 23% less than theaverage North American woman (Wooley, 1991)—young women, struggling to develop their identities,are especially vulnerable to developing these illnesses inresponse to such pressures (Murray, Touyz, & Beumont,1995; Steiner & Lock, 1998). The McKnight Investiga-tors wrote (2003) that ‘‘thin body preoccupation andsocial pressure is the strongest proximal indicator of theonset of eating disorders.’’ Early studies found youngwomen in their early teens with anorexia, and a historyof bulimic behavior by their first year of college. Onceanorexic there is a 50% chance that an individual willbecome bulimic (Drewnowski, Yee, & Krahn, 1988).Bulimia nervosa has increased in epidemic proportionsamong the college female population (Gordon, 1990),currently approximately 8 million, since it was firstclinically identified in the late 1970s (Halmi, Falk, &Schwartz, 1981). The incidence of bulimia in college-agefemales has been estimated to be anywhere from 4 to20% (Halmi et al., 1981; Drewnowski et al., 1988).
The distinction between anorexia and bulimia lies inthe type of behavior which arises in response to thecompulsion to be thin. Most anorexics, perceiving theirbodies to be fatter than they really are, thereby developa desire to maintain an unhealthily low body weightwhich manifests itself through excessive dieting (to thepoint of food avoidance) and exercise (Brumberg, 1988;Schlundt & Johnson, 1990). In contrast, bulimics are notalways able to maintain severe dietary restraint. Theseindividuals turn to purging to try to reduce caloricintake, primarily self-induced vomiting and/or abuse oflaxatives or other medication. Despite these extrememeasures, bulimics often remain near their normal bodyweight (because of limited dietary restraint), making thedisorder easier to conceal. Although there is someoverlap between sufferers of the two disorders, thedifferences in behavior keep the diagnoses distinct.Anorexics, in fact, may even be proud of the thinnessthey achieve, while bulimics, feeling shameful, becomeadept at hiding the disorder (Gordon, 1990). While theclinical symptoms of anorexia nervosa therefore arisefrom an excessively low body mass, bulimia presentshazards that follow from purging and resulting changesin body chemistry. Repeated vomiting causes acid fromthe stomach to damage dental enamel, salivary glands,and other parts of the digestive tract, and can even breakblood vessels in the eyes. Disturbances of these acidsdisrupts body chemistry, as does abuse of laxatives(Mitchell, 1986, 1990), to the point that in extreme casesdeath can occur (Keel & Mitchell, 1997). Morecommonly, the menstrual cycle becomes irregular orstops altogether. It is also common for young women todevelop relatively mild initial symptoms (e.g., infrequentor without purging episodes) triggered by a period of
marked unhappiness or restrictive dieting (Mitchell,1990): for a time the bulimic episodes may occurperiodically rather than continuously, and remain easyto conceal (‘‘closet bulimia’’). As the severity of thedisorder increases, the individuals’ lives become morechaotic, provoking them in some multi-impulsive casesto scavenge leftovers from a dustbin or steal in order tofeed the compulsion (Mitchell, 1990). One review found(Bilich, 1989) that the onset of purging behavior lagsbehind the onset of bingeing by an average of a year orso. There is then a corresponding feeling of shame anddesire for secrecy on the part of the bulimic. It isgenerally only at this point that symptoms becomesevere enough to force the sufferer into treatment.
Despite the difficulties with gathering accurate pre-valence data for these disorders, one statistic which hasremained relatively consistent across studies is the meanage at onset of bulimia: 18 yr (Bilich, 1989; Mitchell,1990). The coincidence of this age with the point inmany young women’s lives when they leave a familyenvironment for the first time to enter a largely peer-defined university culture motivates the present study.Furthermore, Gordon (1989, 1990) observed that thereis a significant social component to bulimic behavior oncollege campuses: its incidence has often been observedin clusters—for example, among women living in thesame dormitory or sorority house—even to the extent inextreme cases of purging in groups. Studies of thefactors which contribute to the development of eatingdisorders consistently cite peer sociocultural pressure asa leading risk factor. Lieberman (2001) found, ‘‘At thelevel of the individual, involvement in a close friendship,high opposite-sex relational esteem, severe weight andbody-shape teasing, peer pressure about weight andappearance, externalized self-perceptions, and peerattributions about the importance of weight andappearance for popularity and dating were importantpredictors of problematic eating behaviors.’’ A recentstudy of risk factors for eating disorders identified sevenseparate factors, of which the strongest (and in somecases the only factor significantly related to outcome)was thin body preoccupation and social pressure(McKnight Investigators, 2003). It is clear, therefore,that in addition to the environment produced bycultural norms, peer pressure plays a significant role inthe rising prevalence of bulimia in this population.
As the prevalence of eating disorders rises, theirtreatment has become an important research topic in itsown right. Without treatment, up to 20% of people withserious eating disorders die. With treatment, thatnumber falls to 2–3% (ANRED, 2001). However,treatment is not always successful, and, as with otherbehavior disorders, there is a significant relapse rate. Asurvey (Keel & Mitchell, 1997) found that 5–10 yr afterpresentation, about 50% of bulimics had made completerecoveries, 20% still met all clinical criteria for bulimia

ARTICLE IN PRESS
Fig. 2. Two-stage bulimia model.
Fig. 1. Anorexia and bulimia model.
B. Gonzalez et al. / Journal of Mathematical Psychology 47 (2003) 515–526 517
despite treatment, and about 30% experienced relapse.However, there are indications that many bulimics whorelapse do so within 6 months of entering treatment(Mitchell, 1990).
Variability in success rates stems in part from the needfor individualized treatment plans. Because each in-dividual’s situation involves a different combination ofthe many contributing factors, treatment must becustomized for each individual. A typical treatmentplan used might include hospitalization, medication torelieve depression and anxiety, nutrition counseling,individual, group and family counseling, and supportgroups to break down isolation and alienation (Mitchell,1990). Treatment is often along behavioral lines at firstand gradually focuses more on emotional problems.Estimates of the time required for full recovery are onthe order of years, so this phase is a significant one in thecourse of the disorder.
Treatment rates are limited by two significant factors:the secretive nature of the disorder, discussed above, andcost. The cost of treatment may vary from US $3800 upto US $24,000 per month or more for intensivetreatment (e.g., Mirasol, n.d.; Westwind, 1999). Thehealthcare industry has no standardized measures of‘‘need for treatment’’ for eating disorders, and conse-quently many people cannot seek treatment even if theyhave medical insurance.
This article examines the influence of peer pressure onthe prevalence of bulimia in a population of collegefemales, by considering a theoretical model in whichboth the incidence rate and the treatment rate areinfluenced by peer-pressure terms akin to the massaction terms used in models for the spread of infectiousdiseases. Sociologists have observed (Crane, 1991;Gladwell, 2000) that some social phenomena, such asjuvenile crime, are ‘‘contagious’’ in the sense that therate at which they occur depends on the number ofindividuals involved, as well as on the number ofindividuals who might become involved, and where‘‘tipping points’’ determine whether or not the phenom-enon dies out or persists in a population. Our modelmakes this epidemiological analogy quantitative, andtries to account for the population dynamics behindobserved data. Our approach borrows from the analysisof dynamical systems in mathematical epidemiology, inorder to address the following questions: What implica-tions does a peer-pressure-driven progression have forthe control of bulimia nervosa in a university popula-tion? and what are the relative effects of treatment andeducation at different (early or advanced) stages of thedisorder? An education campaign might serve to reducethe rate of ‘‘infection’’ (e.g., Winzelberg et al., 2000), aswell as to encourage bulimics to seek treatment early.The following section describes our theoretical modeland its underlying assumptions; later sections present itsanalysis and draw some conclusions.
2. The model
A general model for anorexia and bulimia in thepopulation consisting of young women ages 12–22might look as follows (Fig. 1). The at-risk populationðSÞ can develop either anorexia ðAÞ or bulimia ðBÞ:Once anorexic, an individual may become bulimic.There is treatment available specifically for anorexicsðTAÞ or for bulimics ðTBÞ: Some individuals in treatmentsuffer relapses; others eventually recover ðRÞ: There isalso a given rate at which new individuals age into the½S� population and others age out (downward diagonalarrows).
If we now restrict our attention to bulimia in college-age females, we can simplify the above model whiledifferentiating between the early and advanced stages ofthe disorder, since treatment is typically only soughtonce an individual is in the advanced stage. In order tokeep the model as simple as possible, we shall considerthe effect of public education campaigns by reducing therate at which susceptible individuals develop bulimia,rather than adding an educated class. This new model,illustrated in Fig. 2, eliminates a number of the classes ofthe first model, and identifies individuals only by stageof bulimia nervosa. Members of the at-risk (susceptible)population S may develop the first stage of bulimianervosa ðB1Þ either directly or by progression fromanorexia. The individuals in state B1 are closet bulimics,who are not receiving treatment (commonly out ofembarrassment or shame) nor are their symptoms severeenough to make discovery likely. When episodes ofbingeing and purging occur with greater frequency andseverity, they move to the advanced state, B2; where thesymptoms are harder to hide. At this state, bulimicindividuals may enter treatment, either because ofpressure from peers already in treatment or becausethey are so sick that they need medical help. Someindividuals in treatment ðTÞ relapse to the B2 class, but

ARTICLE IN PRESSB. Gonzalez et al. / Journal of Mathematical Psychology 47 (2003) 515–526518
many will progress to a full recovery in time. Forsimplicity, and because recovery usually requires someyears spent in treatment—and we here assume theaverage time a female stays in college to be approxi-mately 3 yr (lower than the nominal 4 yr due to effectsof transfers, dropouts, and other family and personalsituations)—this more focused model does not includethe recovered stage R of the previous model. We useP ¼ S þ B1 þ B2 þ T to represent the total constantpopulation. (Note all transition rates in Fig. 2 are givenas per capita except the recruitment rate, which is givenas an absolute, cf. the equation below for dS=dt:)
To specify the rates at which individuals move fromone class to another, we consider the factors underlyingeach transition. In our model, susceptibles becomebulimics due to peer pressure. Therefore, the rate atwhich susceptible women develop bulimia depends onhow much interaction a woman has with her bulimicfriends. We assume that the rate depends upon twofactors: cultural pressure to conform to unrealisticideals, measured by a parameter a; and the environ-mental peer pressure which acts as a catalyst, measuredin direct relation to the proportion of bulimics alreadypresent among the peer set, ðB1 þ B2Þ=P: This gives aper capita rate of aðB1 þ B2Þ=P: It is important to notethat peer pressure is considered here as a collective force,rather than simply as a sum of individual pressures, andwe use the bulimia incidence within the populationunder study as an estimate of the strength of this force inpressing upon its members the unrealistic ideal sug-gested by the larger culture. At this stage it is very rarethat women will look for treatment, but we can modelthe effects of an education campaign s by considering aas a function of s; aðsÞ: In contrast, the progression tothe more severe stage of bulimia depends more on thedisorder itself than on peer pressure, and is modeledhere by a constant per capita rate g:
With regard to treatment rate, we make the assump-tion that friends and family play different roles inpressuring bulimics to get treatment. One factor is thatof parents, or occasionally healthcare professionals,discovering an individual’s symptoms and obliging herto enter treatment; we model this with a constant percapita rate r: The other factor is peer pressure,measured in terms of the proportion of peers currentlyreceiving treatment, T=P; multiplied by a constant ofproportionality d; so that the overall per capitatreatment rate is rþ dT=P: Finally, we assume thatthe relapse rate depends on the individual more thanpeer pressure, so we model this with a constant percapita rate f: Since the model considers only the collegefemale population, we do not model the slowertransition to full recovery, but instead incorporate theturnover in the population with a demographic para-meter m; the per capita rate at which individuals enterand leave the population.
A note about mixing and population size is in orderhere. In each case above where the strength of peerpressure has been estimated by proportions of the at-risk population in various stages of bulimia, an under-lying assumption is that proportional, homogeneousmixing occurs among students—that is, students mixreasonably uniformly with each other regardless ofbulimic status (the peer group is the entire population).This simplifying assumption is valid for a small tomoderate-sized college population, but not for largeuniversities where individuals are likely to mix prefer-entially in partially isolated subgroups. To incorporatethe latter case we shall restrict our attention to a singlesuch subgroup within which mixing is uniform. If,instead, mixing were heterogeneous, it would be moreappropriate to measure peer pressure using proportionsof the preferred subgroup (in this case, bulimics).
We can now write a set of four differential equationsfor this model:
dS
dt¼ mP � aðsÞS B1 þ B2
P� mS;
dB1
dt¼ aðsÞS B1 þ B2
P� gB1 � mB1;
dB2
dt¼ gB1 � mB2 � rB2 � dB2
T
Pþ fT ;
dT
dt¼ rB2 þ dB2
T
P� fT � mT :
The model can be reduced to three equations since wehave a constant total population, P ¼ S þ B1 þ B2 þ T :For the moment, however, we will merely rescale it withthe dimensionless variables x ¼ S=P; y1 ¼ B1=P; y2 ¼B2=P; and z ¼ T=P; to eliminate dependence on thepopulation size P and obtain the model
dx
dt¼ m� aðsÞxðy1 þ y2Þ � mx; ð1Þ
dy1
dt¼ aðsÞxðy1 þ y2Þ � gy1 � my1; ð2Þ
dy2
dt¼ gy1 � my2 � ry2 � dy2z þ fz; ð3Þ
dz
dt¼ ry2 þ dy2z � fz � mz; ð4Þ
where 1 ¼ x þ y1 þ y2 þ z: ð5Þ
The model parameters are summarized in Table 1.Recall that we are considering the ‘‘infective’’ force a asa decreasing function of the effort s expended in publiceducation about eating disorders.
ARTICLE IN PRESS
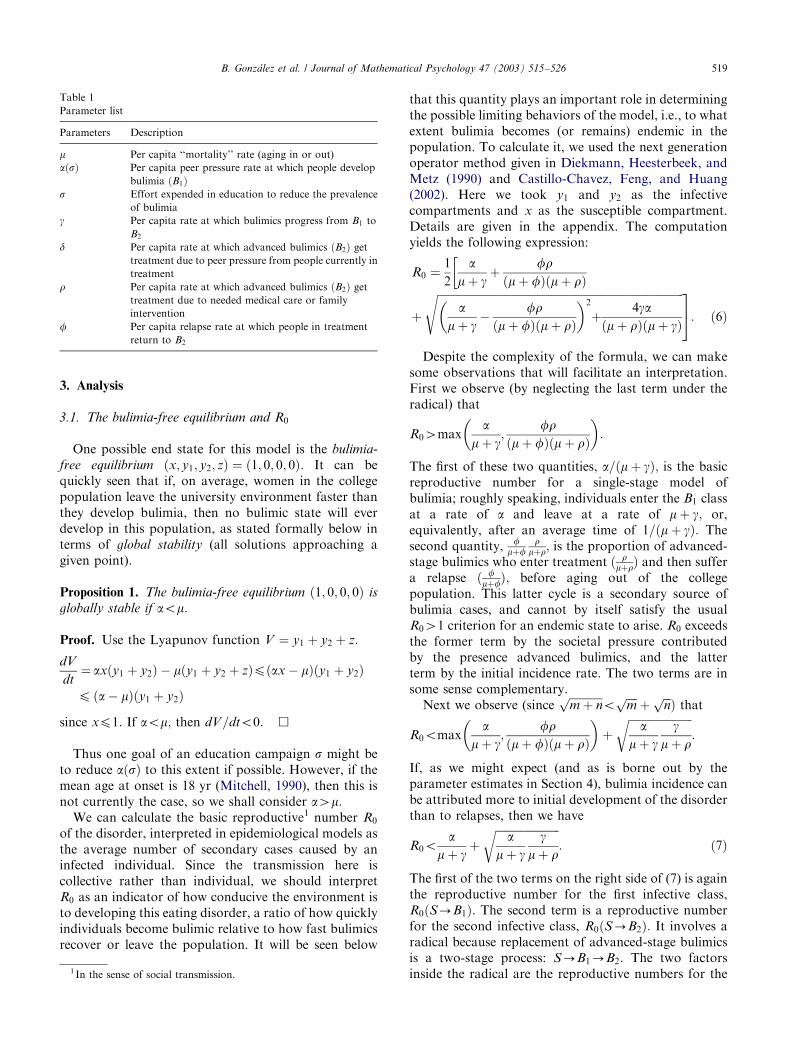
Table 1
Parameter list
Parameters Description
m Per capita ‘‘mortality’’ rate (aging in or out)
aðsÞ Per capita peer pressure rate at which people develop
bulimia ðB1Þs Effort expended in education to reduce the prevalence
of bulimia
g Per capita rate at which bulimics progress from B1 to
B2
d Per capita rate at which advanced bulimics ðB2Þ get
treatment due to peer pressure from people currently in
treatment
r Per capita rate at which advanced bulimics ðB2Þ get
treatment due to needed medical care or family
intervention
f Per capita relapse rate at which people in treatment
return to B2
B. Gonzalez et al. / Journal of Mathematical Psychology 47 (2003) 515–526 519
3. Analysis
3.1. The bulimia-free equilibrium and R0
One possible end state for this model is the bulimia-
free equilibrium ðx; y1; y2; zÞ ¼ ð1; 0; 0; 0Þ: It can bequickly seen that if, on average, women in the collegepopulation leave the university environment faster thanthey develop bulimia, then no bulimic state will everdevelop in this population, as stated formally below interms of global stability (all solutions approaching agiven point).
Proposition 1. The bulimia-free equilibrium ð1; 0; 0; 0Þ is
globally stable if aom:
Proof. Use the Lyapunov function V ¼ y1 þ y2 þ z:
dV
dt¼ axðy1 þ y2Þ � mðy1 þ y2 þ zÞpðax � mÞðy1 þ y2Þ
p ða� mÞðy1 þ y2Þ
since xp1: If aom; then dV=dto0: &
Thus one goal of an education campaign s might beto reduce aðsÞ to this extent if possible. However, if themean age at onset is 18 yr (Mitchell, 1990), then this isnot currently the case, so we shall consider a4m:
We can calculate the basic reproductive1 number R0
of the disorder, interpreted in epidemiological models asthe average number of secondary cases caused by aninfected individual. Since the transmission here iscollective rather than individual, we should interpretR0 as an indicator of how conducive the environment isto developing this eating disorder, a ratio of how quicklyindividuals become bulimic relative to how fast bulimicsrecover or leave the population. It will be seen below
1 In the sense of social transmission.
that this quantity plays an important role in determiningthe possible limiting behaviors of the model, i.e., to whatextent bulimia becomes (or remains) endemic in thepopulation. To calculate it, we used the next generationoperator method given in Diekmann, Heesterbeek, andMetz (1990) and Castillo-Chavez, Feng, and Huang(2002). Here we took y1 and y2 as the infectivecompartments and x as the susceptible compartment.Details are given in the appendix. The computationyields the following expression:
R0 ¼1
2
amþ g
þ frðmþ fÞðmþ rÞ
�
þ
ffiffiffiffiffiffiffiffiffiffiffiffiffiffiffiffiffiffiffiffiffiffiffiffiffiffiffiffiffiffiffiffiffiffiffiffiffiffiffiffiffiffiffiffiffiffiffiffiffiffiffiffiffiffiffiffiffiffiffiffiffiffiffiffiffiffiffiffiffiffiffiffiffiffiffiffiffiffiffiffiffiffiffiffiffiffiffiffiffia
mþ g� frðmþ fÞðmþ rÞ
� �2
þ 4gaðmþ rÞðmþ gÞ
s 35: ð6Þ
Despite the complexity of the formula, we can makesome observations that will facilitate an interpretation.First we observe (by neglecting the last term under theradical) that
R04maxa
mþ g;
frðmþ fÞðmþ rÞ
� �:
The first of these two quantities, a=ðmþ gÞ; is the basicreproductive number for a single-stage model ofbulimia; roughly speaking, individuals enter the B1 classat a rate of a and leave at a rate of mþ g; or,equivalently, after an average time of 1=ðmþ gÞ: Thesecond quantity, f
mþfr
mþr; is the proportion of advanced-stage bulimics who enter treatment ð r
mþrÞ and then suffera relapse ð f
mþfÞ; before aging out of the collegepopulation. This latter cycle is a secondary source ofbulimia cases, and cannot by itself satisfy the usualR041 criterion for an endemic state to arise. R0 exceedsthe former term by the societal pressure contributedby the presence advanced bulimics, and the latterterm by the initial incidence rate. The two terms are insome sense complementary.
Next we observe (sinceffiffiffiffiffiffiffiffiffiffiffiffim þ n
po
ffiffiffiffim
pþ
ffiffiffin
pÞ that
R0omaxa
mþ g;
frðmþ fÞðmþ rÞ
� �þ
ffiffiffiffiffiffiffiffiffiffiffiffiffiffiffiffiffiffiffiffiffiffiffia
mþ gg
mþ r
r:
If, as we might expect (and as is borne out by theparameter estimates in Section 4), bulimia incidence canbe attributed more to initial development of the disorderthan to relapses, then we have
R0oa
mþ gþ
ffiffiffiffiffiffiffiffiffiffiffiffiffiffiffiffiffiffiffiffiffiffiffia
mþ gg
mþ r
r: ð7Þ
The first of the two terms on the right side of (7) is againthe reproductive number for the first infective class,R0ðS-B1Þ: The second term is a reproductive numberfor the second infective class, R0ðS-B2Þ: It involves aradical because replacement of advanced-stage bulimicsis a two-stage process: S-B1-B2: The two factorsinside the radical are the reproductive numbers for the

ARTICLE IN PRESSB. Gonzalez et al. / Journal of Mathematical Psychology 47 (2003) 515–526520
two stages involved, R0ðS-B1Þ and R0ðB1-B2Þ: Thistype of expression for two-stage cycles has been seenbefore in models for infectious diseases, e.g., Diekmannet al. (1990), May and Anderson (1988, Eq. (5.7)). Theactual value of R0 is less than R0ðS-B1Þ þ R0ðS-B2Þbecause of the S-B1 overlap in the two cycles.Expressions for R0 of the form seen in (6) havepreviously been observed in models for multi-stagediseases, including a three-stage model in Diekmann,Dietz, and Heesterbeek (1991) and a four-stage HIVmodel in Dietz, Heesterbeek, and Tudor (1993).
Finally, the fact that R0 is independent of d; the peer-pressure treatment rate parameter, might lead us toconclude that peer-based encouragement to seek treat-ment does not affect society’s conduciveness to supportan ‘‘epidemic’’ of bulimia. However, we recall that R0
measures response to the first appearances of bulimia inthe population, while d corresponds to a term whosestrength also depends on the presence of peers currentlyin recovery. As we shall see in the following section, thisparameter does have an important role to play indetermining the size of the bulimic population insituations where bulimia does arise.
3.2. Endemic equilibria
Another possible end state for model (1–5) is one inwhich bulimia exists in an endemic state within thecollege female population. If R041; then such a statecertainly exists, although the number of endemicequilibria is difficult to establish analytically, as thefollowing analysis shows.
Proposition 2. If R041; we have either one or three
endemic equilibria.If R0o1; we have zero or two endemic equilibrium
points.
Proof. We obtain the equilibrium conditions fromEqs. (1)–(5), and reduce the system to just one equationby expressing the equilibrium values for x; y1; and z interms of y2:
z ¼ y2r
mþ f� dy2from ð4Þ; ð8Þ
y1 ¼ y2mg
1 þ rmþ f� dy2
� �from ð3Þ and ð8Þ; ð9Þ
x ¼ mmþ ay2½1 þ m
gð1 þ rmþf�dy2
Þ� from ð1Þ and ð9Þ; ð10Þ
and then substituting into (5):
1 ¼ mmþ ay2½1 þ m
gð1 þ rmþf�dy2
Þ�
þ y2mg
1 þ rmþ f� dy2
� �þ 1 þ r
mþ f� dy2
� :
After multiplying by the various denominators anddividing by y2; we will have a cubic equation in y2; of theform
f ðy2Þ ¼ Ay32 þ By2
2 þ Cy2 þ D ¼ 0; ð11Þwhere A40; B; C and D are functions of modelparameters (see appendix for details).
Now, for an endemic equilibrium we need for x�; y�1;
y�2; and z� to be nonnegative and sum to 1. The use of (5)
to get (11) guarantees the latter; we can see from (8) thatin order to have zX0; we need mþ f� dy�
240: There-fore, we require that
y�2o
mþ fd
:
With this condition, we can see from (9) and (10) that y1
and x are then also nonnegative. Hence, endemicequilibria are solutions to f ðy2Þ ¼ 0; y�
2Að0; mþfd Þ: It is
not necessary to worry about whether mþfd 41 or mþf
d o1since Eq. (5) already guarantees solutions less than 1.
We now consider f ð0Þ and f ðmþfd Þ: Calculations show
that
f ð0Þ ¼ Do03a4mmþ fþ r
mþ fþ r mmþg
3R041 ð12Þ
and
fmþ fd
� �¼ mþ f
d
� �mþ gg
� �mgar240:
By continuity of f at least one solution y�2 exists when
R041 (since then f ð0Þo0of ðmþfd ÞÞ: More specifically,
since f is cubic, if R041; we have either one or threeendemic equilibria. If R0o1; we have zero or twoendemic equilibrium points. &
At this point there remains the possibility of havingmultiple endemic equilibria; numerical investigations,such as the one considered in Section 4, indicate thatmultiple endemic equilibria do not occur, but thecomplexity of the model makes it difficult to show ingeneral. We can, however, make some observations thatmake multiple endemic equilibria unlikely. First, wenote that the bifurcation at R0 ¼ 1 is ‘‘forward’’—thatis, the small (in y2) endemic equilibrium which arises forR0 close to 1 exists only for R041:
Proposition 3. The bifurcation at R0 ¼ 1 is forward in R0;and endemic equilibria with y2 close to zero arise only for
R041:
Proof. In terms of equation (11), R0 ¼ 13f ð0Þ ¼ 0:That is, there is a solution y�
2 of (11) which crosses zeroas R0 crosses 1. Therefore, as a graphical analysis willshow, if f 0ð0Þ40 for R0 in some neighborhood of 1, thenthat solution y�
2 will be positive for R041; and negativefor R0o1 (again in some neighborhood of 1). Thiscorresponds to a ‘‘forward’’ bifurcation in R0; in that a
ARTICLE IN PRESSB. Gonzalez et al. / Journal of Mathematical Psychology 47 (2003) 515–526 521
meaningful (nonnegative) solution will exist only forR041: If instead f 0ð0Þo0 in a neighborhood of R0 ¼ 1;then the solution which is zero for R0 ¼ 1 will bepositive for R0o1 and negative for R041; correspond-ing to a ‘‘backward’’ bifurcation. Thus we need onlyshow that f 0ð0Þ40 for R0 sufficiently close to 1.
Calculations show that
f 0ð0Þ403a4
m2ðmþ fÞ þ r
2 þ mþgg
�mþfþr
d
h iðmþ fÞ þ 1 þ mþg
g
�mþfþr
d
h im
mþg r:
ð13Þ
If we define the quantities
a1 ¼ mmþ fþ r
mþ fþ r mmþg
and
a2 ¼ m2ðmþ fÞ þ r
2þ mþgg
�mþfþr
d
h iðmþ fÞ þ 1 þ mþg
g
�mþfþr
d
h im
mþgr;
then (12) becomes R0413a4a1; and (13) becomesf 0ð0Þ403a4a2: Now we can observe that
a2om 2ðmþfÞþr
2ðmþfÞþ mmþgr
oa1; so that indeed for a close enough
to a1—or, correspondingly, R0 close enough to 1—wemust have a4a2; and thus f 0ð0Þ40: &
We next observe that when R0 ¼ 1 ða ¼ a1Þ we knowone solution (zero) to the equilibrium condition (11), sofactoring it out we are left with the quadratic Ay2
2 þBy2 þ Cja¼a1
¼ 0; which we can easily solve for y�2:
y7 ¼fðmþg
g Þðmþ fþ rÞð2ðmþ fÞ þ ð1þ mmþgÞrÞ þ
gmþg dr7r
ffiffiffiffiK
pg
2ðmþgg Þdðmþ fþ rÞ
;
ð14Þ
where
K ¼ðmþ fþ rÞ2 þ 22mþ g
gðmþ fþ rÞ g
mþ gd
þ gmþ g
� �2
d2:
It follows from (14) that yþ4y�4mþfd (by completing
the square inside the radical), so both nonzero solutionsto (11) are outside the state space. Since we have seenthat f ðmþf
d Þ40; the only way to have multiple endemicequilibria inside the state space (i.e., meaningful) is firstto have a bifurcation where these two solutions yþ; y�outside the state space vanish, and then to have a secondbifurcation in which another pair arises inside the statespace. Numerical analysis indicates that the number ofsolutions to (11) is always three, in which case nomeaningful multiple endemic equilibria can occur.
Finally, since d is a bifurcation parameter indepen-dent of R0; we consider in the subsection below twospecial cases: the extremes of d:
3.3. Special cases in d
Since we are interested in the effects of peer pressure,we now consider two special cases in d; which we recallis independent of R0: If we consider the case d ¼ 0; wefind that A ¼ B ¼ 0 in (11). This makes the endemicequilibrium condition linear. Therefore if d ¼ 0; there isnever more than one endemic equilibrium. Our otherspecial case is the opposite extreme, when everybody inB2 gets treated: when d-N:
Can we have multiple endemic equilibria for arbi-trarily large d? Consider the part of f ðy2Þ which has d2;
f ðy2Þ ¼ d2 mþ gg
� �mþ gg
� �ay3
2 � ða� mÞy22
� þ?
If d is very big then this part must be zero at an endemicequilibrium y�
2: This means either
ðy�2Þ
2 ¼ O1
d
� �
or
mþ gg
� �ay�
2 � ða� mÞ ¼ O1
d
� �;
i.e.,
y�2 ¼
a� ma
gmþ g
þ O1
d
� �E
a� ma
gmþ g
:
Suppose that a4m: Then y�240: In fact, for sufficiently
large d; y�24
mþfd : Thus, we have three points where we
know f : 0; mþfd ; and y�
2: Furthermore, we can show
f 0ðy�2Þ40: Now, since we also know that f ðy2Þ-�N
as y2-�N and f ðy2Þ-N as y2-N; we can establishwhere the zeroes of f must lie. If R0o1; we have
f ð0Þ40; f ðmþfd Þ40; f ðy�
2Þ ¼ 0; f 0ðy�2Þ40; so there must
be a zero crossing to the left of 0; another one betweenmþfd and y�
2 (since f 0ðy�2Þ40Þ; and the third at y�
2; neara�ma
gmþg: If R041; we have f ð0Þo0; f ðmþf
d Þ40; f ðy�2Þ ¼ 0;
f 0ðy�2Þ40; and the only change is that the first zero
crossing must be in ð0; mþfd Þ; as promised by Proposition
1: In both cases the first two zeroes are the two Oð1dÞsolutions promised above. In neither case is there anextra pair of endemic equilibria. Thus, if any ever exist,they must do so for intermediate values of d:
4. Parameter values and control strategies
We now estimate values for model parameters inorder to determine model predictions. As some of theparameters can be estimated only very roughly (see

ARTICLE IN PRESSB. Gonzalez et al. / Journal of Mathematical Psychology 47 (2003) 515–526522
below), our principal objective shall be to see howclosely model behavior corresponds to empirical ob-servations, and to suggest directions for controlmeasures and further data-gathering.
In calculating the removal rate, m; we take intoconsideration the average time an individual remains ina given college population. This statistic is not readilyavailable but should take into account departures due toother reasons than graduation, including transfers anddropping out. Bradburn (2002) notes that 32% of thestudents who began their postsecondary education inthe 1995–96 school year had left without a credential,and without returning, by the end of the spring 1998term. THECB (2003) reports that over 40% of studentsleft their Texas postsecondary institutions withoutgraduating (this includes transferring). We will thereforeuse an estimate of three years, 1
m ¼ 3; making m ¼ 13yr�1:
This gives us a reference by which to measure other ratesthrough proportions of bulimics undergoing treatment,relapse, etc. below.
In the absence of accurate data on progression ofsymptoms, we estimated that it takes between half ayear and 1 yr to pass to the more advanced stageof bulimia ðB2Þ: For the rate g of going from B1 to B2;this gives a value in the range of 1–2 yr�1; we took1:5 yr�1:
The average per capita treatment rate is rþ dz; wherez is the proportion of the population in treatment, as in(1–5). One non-interventive study ðn ¼ 102Þ found that34% of the subjects had the disorder for at least 15months, 15% had it for 5 yr or more, and only 28% everentered treatment (Fairburn, Cooper, Doll, Norman, &O’Connor, 2000). We therefore take for the proportionof bulimics who enter treatment before leaving thepopulation rþdz
mþrþdzE0:28; which, with the above value for
m; gives rþ dzE0:13 yr�1: Mitchell (1990) gives themean time till seeking treatment as 6–7 yr; inverting thisgives an estimate for rþ dz of 0.14 to 0:17 yr�1; which isclose to the above value of 0:13 yr�1:
If we take the above treatment proportion togetherwith the conservative 4% prevalence estimate reportedby Halmi et al. (1981), Drewnowski et al. (1988) andothers, we obtain an estimate for z of z ¼ð0:28Þð0:04ÞE0:01: This means that if r and d are ofthe same order, then rþ dzEr; and we can taker
mþrE0:28 and rE0:13 yr�1: Since d measures thepressure exerted by peers, while r measures family orhealthcare professionals discovering symptoms andobliging the bulimic to enter treatment, it is difficult tocompare their orders: there is no available datameasuring peer pressure to seek treatment, and wefound no studies which estimated the relative impor-tance of the two factors in leading bulimics to seektreatment. However, we will proceed under the aboveassumption that the two parameters are of the sameorder, which will give us a value for r:
The proportion of bulimics in treatment who relapsebefore leaving the population is f=ðmþ fÞ: Keel andMitchell (1997) found relapse rates ranging from 26% to43%, and centered around 30%. Olmsted, Kaplan, andRockert (1994) observed a 31.25% relapse rate, so we
take f=ðmþ fÞ ¼ 0:3125; which gives f ¼ 0:15 yr�1:The average per capita rate at which women in the
population develop bulimia is aðy1 þ y2Þ; with yi as in(1–5). Although a is a peer-pressure parameter, we canestimate it using prevalence data (ideally longitudinal, aswe will discuss below, but in the absence of such data forour population we will use the single figure givenearlier). If we define Y ¼ y1 þ y2 and suppose that thesusceptible proportion is changing very slowly(dx=dtE0; though not necessarily at equilibrium), wecan rewrite Eq. (1) as a ¼ mð1 � xÞ=xY : Using theconservative estimate of 4% (Drewnowski et al., 1988)given earlier for Y and the above estimate zE0:01; this
gives xE0:95 and a ¼ 0:439 yr�1:These estimates give us a=ðmþ gÞ ¼ 0:239; which is
indeed greater than the corresponding estimate forf
mþfr
mþr ¼ 0:28ð0:3125Þ ¼ 0:0875; thereby justifying (7)
and the associated discussion in the previous section.These estimates also yield values of R0E1:05; consistentwith our initial observation that bulimia is present in anendemic state in the college population.
This leaves us with the role of d; and the potentialeffects of s; to consider. If we again consider d withrespect to r; we can see that the effect of increasing thispeer-pressure treatment rate is to reduce the size of thebulimic population by as much as 80%. If d is no bigger
than r ¼ 0:13 yr�1; we find the bulimic population y1 þy2E0:065; or 6.5% of the total. If instead d is two ordersof magnitude greater than r; that is, dzEr; then the
resulting d ¼ 13 yr�1 yields y1 þ y2E0:014: (If we set
d ¼ 13 yr�1 and adjust r to zero to keep rþdzE0:13 yr�1; then R0 rises to 1.16, but y1 þ y2 reducesonly to 0.045.) An intermediate value of d will yield theestimate used earlier of 0.04; this suggests that the forceof peer pressure to seek treatment for bulimia is greaterthan that of caregivers obliging the bulimic to seektreatment, but its effectiveness is limited by the smallsize of the support group providing the pressure ðzÞ:
We see that d affects the size of the bulimic populationbut apparently not whether it persists; as noted earlier,R0 is independent of d: However, this is not entirelysurprising, as d measures an avenue of control whichreduces only the number of advanced-stage bulimics,and does not address the onset of the disorder. Wetherefore turn to the notion of a public educationcampaign s which could deter some potential bulimicsfrom developing the disorder. If we consider a as adecreasing function of s; then it might be possible toreduce a below the threshold value a1 where R0 ¼ 1: Forthe parameter values above, this corresponds to a

ARTICLE IN PRESSB. Gonzalez et al. / Journal of Mathematical Psychology 47 (2003) 515–526 523
decrease of only 8% in a; such a modest drop seems wellwithin reach—but it is not at all clear what the costwould be for the campaign to achieve such a reduction.Even a small drop in a may require enormous effort, asit involves targeting not only potential bulimics but theentire peer group and its cultural standards, which drivethe peer-pressure term.
We might also wish to consider the effects of aneducation campaign on the rate g at which symptomsadvance, but in this model the only way to recovery isthrough the advanced bulimia stage, so slowing theprocess down only appears to make the situation worse,by keeping individuals bulimic longer. (An exception tothis conclusion is the case where B2 individualscontribute more to the peer pressure than B1 indivi-duals, which would necessitate weighting terms for y1
and y2 in Eqs. (1) and (2).) A more productive approachwould be to encourage bulimic individuals to seek helpbefore symptoms become more severe. Incorporatingsuch a change into our model would necessitate an extraterm in the equations for y1 and z; this term woulddecrease R0 only if it reflected broad-based culturalpressure (a constant per capita rate) rather than a peerpressure term dependent only on individuals currently intreatment. Otherwise its role would be similar in natureto that of d:
At this point some discussion is in order regarding themeasuring of peer pressure, which has typically beendone by means of survey instruments. Early validatedmeasures designed to assess various indices related tothe perception of peer pressure tended to be rather long(40–50 items or more), and consequently difficult toadminister reliably to some of the adolescent populationat whom they are targeted. More recently, shorter testshave been developed (and validated) to measure peerpressure (e.g., Santor, Messervey, & Kusumakar, 2000;McKnight Investigators, 2003). These measures tend tobe more narrowly focused, e.g., on peer pressure toexhibit antisocial behavior, or to change eating beha-viors. Survey questions may ask about perceivedpressure to exhibit a particular behavior, or about thesubject actually having done it as a result of suchpressure. To measure the force of peer pressure inspreading bulimia within a given population, as in ourmodel, it is necessary to target instruments toward theeffective peer pressure to conform to cultural body-shape norms via eating behaviors, that is, the averageextent to which peer pressure actually influences thedecision-making process.
However, in estimating peer-pressure-based para-meters for a dynamical system, there is anotherimportant distinction. Studies such as the McKnightstudy examine the relative importance of differentfactors in the spread of a given behavior. The modeldescribed in this paper assumes (based on conclusions ofstudies such as those cited above) that collective, peer-
pressure-based forces are the driving force for initialdevelopment of bulimic symptoms (unlike the pressureto seek treatment, which we have modeled as havingboth a collective component and an environmentalcomponent). The dimensionless measures of peerpressure (and other factors) described in the previousparagraph therefore serve primarily to guide theassumptions that shape a model; parameter estimatesfor a dynamical system involving time must be based onlongitudinal incidence data. The parameter a in ourmodel is a rate with per-time units, rather than adimensionless incidence rate or correlation, and sorequires a comparison of the overall per capita rate atwhich a given population becomes bulimic, to theprevalence rate of bulimia within the population (thequotient of which should determine a). For example,using the aggregate data of the McKnight study, 32 newcases of eating disorders developed in a population of1103 middle-school girls over 3 yr; at the beginning ofwhich time there was a 2.5% prevalence of eatingdisorders in the baseline population. This gives a per-capita rate of growth in incidence of 32
1103=3 yrE0:01 yr�1
and an estimate aE0:01=0:025 ¼ 0:4 yr�1; not far fromthe rough estimate of 0:439 yr�1 obtained above for acollege-age population. (The conversion of Likert-scalepeer pressure data directly into per capita transitionrates will remain an open problem until such timeas multiple data sets with measures of both peerpressure and prevalence are available for regressionpurposes.)
The test of the model comes in the extent to which itcan account for observed data and make new predic-tions, relative to an alternative. In this case, analternative might be that instead bulimia develops basedprimarily on factors independent of the current in-cidence of bulimia in the population. Removal of they1 þ y2 term in equation (1) makes the model linear(except for d) and eliminates the bulimia-free equili-brium, predicting instead an asymptotic prevalence y1 þy2 þ z ¼ a
mþa: In this case our original estimate for a in acollege population would be mð1 � xÞ=xE0:0175 yr�1;while the value estimated from the McKnight studybecomes a significantly lower 0:0097 yr�1:
A further test of the model might compare therespective levels of peer pressure and bulimia in diff-erent populations. Some studies have identifiedsubgroups of the same population with significantlydifferent levels of peer pressure (e.g., different socialcliques (Lieberman, 2001)) and/or prevalences ofeating disorders (e.g., Hispanic vs. white or African-American girls (Striegel-Moore, Wilfley, Pike, Dohm,& Fairburn, 2000; McKnight Investigators, 2003)).Comparing peer pressure and prevalence data fromsuch paired populations can lead to a better under-standing of the quantitative relationship between thetwo measures.

ARTICLE IN PRESSB. Gonzalez et al. / Journal of Mathematical Psychology 47 (2003) 515–526524
5. Conclusion
The model for bulimia considered in this paper isjust the barest sketch of a complex social phenomenon,an initial model for a disorder which has historicallypresented difficulties in standardizing clinical diagnosis.Nevertheless, its analysis accounts for some of thepopulation dynamics underlying the spread of thedisorder and the recommendations to focus controlstrategies on multilevel interventions and decreasingpeer pressure (e.g., Lieberman, 2001). It also provides aquantitative basis for distinguishing the relativecontributions of different factors involved. Ourconclusions have come to focus through the lens ofthe disorder’s basic reproductive number, R0—anenvironment’s conduciveness to collective transmissionof the disorder via pressure to conform to unhealthycultural norms—which appears to determine whetherbulimia will persist in the population at risk. Theform of R0 reflects the structure of the disorder (forexample, the two stages of early and advancedsymptoms modeled here), and highlights the drivingforces behind it. In particular, we have seen thatthe terms based on peer pressure drive only thosetransitions which do not involve more environmental orsocietal forces: the peer-pressure-based ‘‘infective’’ forceproves the gateway to control, but it is society’s ability(through family and caregivers) to get bulimics intotreatment that appears in R0; rather than the peer-pressure-based treatment rate. Instead, pressure frompeers for bulimics to seek treatment plays a role inreducing the endemic levels at which the disorder exists.Efforts to prevent or eradicate such endemic levels musttherefore address the societal pressures which influenceindividuals’ entry into the binge-purge cycle (cf. Ho-telling, 1989).
Our analysis also found the treatment currentlyoffered to advanced-stage bulimics to be inefficient ineradicating the disorder because it is not well-placed. Inthe scenario modeled, bulimic individuals need to getworse before any treatment begins. Treatment ofindividuals at an earlier stage offers a higher potentialfor population-level control of the disorder by reducingthe amount of time that bulimics contribute tounhealthy peer pressure (treatment in early stages mayalso cost less than treatment of more advanced bulimia).Since females in the early stages of bulimia rarely seektreatment, any efforts to encourage earlier treatment willrequire an education campaign to make these studentsrealize that they have a problem that needs to be treated.We have seen that peer-based encouragement to seekhelp could significantly reduce the number of bulimics.It is also important to consider any campaign ofeducation and treatment based on self-referral in thelight of expected utility, using diagnostic-efficiencystatistics to minimize the cost generated by false
positives (e.g., Neufeld, 1977). Education and treatmentprograms should therefore be targeted carefully toensure a high base rate of genuine need for treatment.One simple four-question screen for potential eatingdisorders developed by the McKnight Investigators(2003), for example, had a sensitivity of 0.72, aspecificity of 0.80, and an efficiency of 0.79.
Even though statistics show that the prevalence ofbulimia has risen dramatically in recent years, theamount of public concern does not seem tohave undergone a similar increase. However, theanalysis in preceding sections suggests that publiceducation campaigns must be systemic in orderto succeed: The per capita transmission rate is modeledby the product of the current bulimia incidence (interms of the state variables) and the strength ofcultural norms in influencing at-risk women tobecome bulimic (given by the parameter a), and tothe extent that R0 drives the disorder, a drives R0:Efforts at public education, which commonly aim toclarify why eating disorders are dangerous, must there-fore also make the connection to the cultural norms andpressures that lead many women to develop distortedself-images. Counseling, for example, made not onlyavailable but encouraged for all students, could helpeliminate the identification of thinness with self-esteem(cf. Stice, 1999) while supporting healthy weightmanagement.
Future work, then, should consider more specificallythe effects of a public education campaign on allsegments of the population, especially as preventionfor those vulnerable but not yet bulimic, and encour-agement to seek treatment early for those bulimicswhose symptoms have not yet become advanced.Measuring the effects of collective societal forces suchas public education and peer pressure remains difficult,but is crucial in order to understand the dynamics ofdisorders such as bulimia and anorexia which are drivenby those forces. Further clinical studies can lead tobetter estimates of these forces, as well as the rate atwhich symptoms become severe and the relativeimportance of the factors which presently lead indivi-duals to seek treatment.
Acknowledgments
This research, carried out at the Mathematical andTheoretical Biology Institute (MTBI) of Cornell Uni-versity, was sponsored by NSF grant DMS-9977919 andNSA grant MDA 904-00-1-0006. The authors wish tothank MTBI’s sponsors, the Cornell University Office ofthe Provost, the Alfred P. Sloan Foundation (Cornell-Sloan National Pipeline Program in the MathematicalSciences) and SACNAS, and to express their apprecia-tion to the MTBI staff and fellow researchers, especially

ARTICLE IN PRESSB. Gonzalez et al. / Journal of Mathematical Psychology 47 (2003) 515–526 525
Carlos Castillo-Chavez, Sophonie Nshinyabakobeje,Fabio Sanchez and Fred Brauer, whose suggestionsimproved the current manuscript. The authors alsothank Jessica Benninghoff and Dr. Peter Rowan forinformation on anorexia and bulimia.
Appendix A
A.1. Calculation of R0
R0 for model (1–5) can be computed as follows via thenext generation operator approach (Diekmann et al.,1990; Castillo-Chavez et al., 2002). Take y1 and y2 as theinfective compartments and x as the susceptiblecompartment. Solve for the equilibrium value z� inEq. (4) and substitute it in Eq. (3) to put dy2=dt in termsof y1 and y2: The Jacobian of y1; y2 evaluated at thebulimia-free equilibrium is then
J ¼�g� mþ a a
gfr
mþ f� r� m
24
35:
We then write J in the form J ¼ M � D; with MX0elementwise and D40 diagonal, and compute MD�1:
MD�1 ¼
amþ g
amþ r
ggþ m
frðmþ fÞðrþ mÞ
2664
3775:
R0 is the dominant eigenvalue of MD�1; namely
R0 ¼1
2
amþ g
þ frðmþ fÞðmþ rÞ
�
þ
ffiffiffiffiffiffiffiffiffiffiffiffiffiffiffiffiffiffiffiffiffiffiffiffiffiffiffiffiffiffiffiffiffiffiffiffiffiffiffiffiffiffiffiffiffiffiffiffiffiffiffiffiffiffiffiffiffiffiffiffiffiffiffiffiffiffiffiffiffiffiffiffiffiffiffiffiffiffiffiffiffiffiffiffiffiffiffiffiffia
mþ g� frðmþ fÞðmþ rÞ
� �2
þ 4gaðmþ rÞðmþ gÞ
s 35:
A.2. Coefficients of Eq. (11)
A ¼ amþ gg
� �2
d2;
B ¼ mþ gg
� �d ar� 2
mþ gg
� �aðmþ fþ rÞ � dða� mÞ
� ;
C ¼ mþ gg
� �d 2ðmþ fÞ þ r½ �ða� mÞ � dar;
þ mþ gg
� �2
ðmþ fþ rÞ2a� mþ gg
� �ðmþ fþ rÞra
D ¼ðmþ fÞ ar� mþ gg
� �ðmþ fþ rÞða� mÞ
� :
References
American Anorexia and Bulimia Association (AABA) (n.d.),
Retrieved August 2001 from http://www.aabainc.org.
American Psychiatric Association Work Group on Eating Disorders
(APA) (2000). Practice guideline for the treatment of patients
with eating disorders (revision). American Journal of Psychiatry,
157(1 Suppl.) 1–39.
Anorexia Nervosa and Related Eating Disorders Inc. ANRED (2001).
Statistics. Retrieved August 2001 from http://www.anred.com/
stats.html.
Bilich, M. A. (1989). Demographic factors associated with bulimia in
college students: Clinical and research implications. In L. C.
Whitaker & W. N. Davis (Eds.), The bulimic college student
(pp. 13–25). Binghamton, NY: Haworth Press.
Bradburn, E. M. (2002). Short-term enrollment in postsecondary
education: Student background and institutional differences in
reasons for early departure, 1996–98 (NCES 2003-153). Washing-
ton, DC: US Dept. of Education.
Brumberg, J. J. (1988). Fasting girls: The emergence of anorexia nervosa
as a modern disease. Cambridge, MA: Harvard University Press.
Castillo-Chavez, C., Feng, Z., & Huang, W. (2002). On the
computation of R0 and its role on global stability. In C. Castillo-
Chavez et al. (Eds.), Mathematical approaches for emerging and re-
emerging infectious diseases, Part I, IMA Vol. 125 (pp. 224–250).
New York: Springer-Verlag.
Crane, J. (1991). The epidemic theory of ghettoes and neighborhood
effects on dropping out and teenage childbearing. American Journal
of Sociology, 96, 1226–1259.
Diekmann, O., Dietz, K., & Heesterbeek, J. A. P. (1991). The basic
reproduction ratio for sexually transmitted diseases, Part 1:
Theoretical considerations. Mathematical Biosciences, 107,
325–339.
Diekmann, O., Heesterbeek, J. A. P., & Metz, J. A. J. (1990). On the
definition and the computation of the basic reproduction ratio R0
in models for infectious diseases in heterogeneous population.
Journal of Mathematical Biology, 28, 365–382.
Dietz, K., Heesterbeek, J. A. P., & Tudor, D. W. (1993). The basic
reproduction ratio for sexually transmitted diseases, Part 2: Effects
of variable HIV-infectivity. Mathematical Biosciences, 117, 35–47.
Drewnowski, A., Yee, D. K., & Krahn, D. D. (1988). Bulimia in
college women: Incidence and recovery rates. American Journal of
Psychiatry, 145, 753–755.
Fairburn, C., Cooper, Z., Doll, H., Norman, P., & O’Connor, M.
(2000). The natural course of bulimia nervosa and binge-eating
disorder in young women. Archives of General Psychiatry, 57,
659–665.
Gladwell, M. (2000). The tipping point. Boston: Little, Brown & Co.
Gordon, R. A. (1989). Bulimia: A sociocultural interpretation. In L. C.
Whitaker & W. N. Davis (Eds.), The bulimic college student (pp.
41–55). Binghamton, NY: Haworth Press.
Gordon, R. A. (1990). Anorexia and bulimia: Anatomy of a social
epidemic. Cambridge, MA: Basil Blackwell, Inc.
Halmi, K. A., Falk, J. R., & Schwartz, E. (1981). Binge-eating and
vomiting: A survey of a college population. Psychology of
Medicine, 11, 697–706.
Hotelling, K. (1989). A model for addressing the problem of bulimia
on college campuses. In L. C. Whitaker & W. N. Davis (Eds.), The
Bulimic College Student (pp. 241–255). Binghamton, NY: Haworth
Press.
Keel, P. K., & Mitchell, J. E. (1997). Outcome in bulimia nervosa.
American Journal of Psychiatry, 154, 313–321.
Lieberman, M. F. (2001). The association between peer relations,
eating behaviors, and body esteem in adolescent girls. Doctoral
dissertation, Concordia University. (Abstracted in Dissertation
Abstracts International B, 61, 6711).
ARTICLE IN PRESSB. Gonzalez et al. / Journal of Mathematical Psychology 47 (2003) 515–526526
May, R. M., & Anderson, R. M. (1988). The transmission dynamics of
human immunodeficiency virus (HIV). Philosophical Transactions
of the Royal Society of London B, 321, 565–607.
McKnight Investigators (2003). Risk factors for the onset of eating
disorders in adolescent girls: results of the McKnight Longitu-
dinal Risk Factor Study. American Journal of Psychiatry, 160,
248–254.
Mirasol, the Arizona Center for Eating Disorders Recovery (n.d.),
Retrieved July 2001 from http://www.mirasol.net/enrollment.html.
Mitchell, J. E. (1986). Bulimia: Medical and physiological aspects. In
K. D. Brownell & J. P. Foreyt (Eds.), Handbook of eating disorders
(pp. 379–388). New York: Basic Books.
Mitchell, J. E. (1990). Bulimia nervosa. Minneapolis: University of
Minnesota Press.
Murray, S. H., Touyz, S. W., & Beumont, P. J. V. (1995). The influence
of personal relationships on women’s eating behavior and body
satisfaction. Eating Disorders: The Journal of Treatment &
Prevention, 4, 115–127.
National Center for Health Statistics (NCHS) (n.d.), Retrieved August
2001 from http://www.cdc.gov/nchs.
Neufeld, R. W. J. (1977). Clinical quantitative methods. New York:
Grune & Stratton.
Olmsted, M. P., Kaplan, A. S., & Rockert, W. (1994). Rate and
prediction of relapse in bulimia nervosa. American Journal of
Psychiatry, 151, 738–743.
Santor, D. A., Messervey, D., & Kusumakar, V. (2000). Measuring
peer pressure, popularity, and conformity in adolescent boys and
girls: Predicting school performance, sexual attitudes, and sub-
stance abuse. Journal of Youth and Adolescence, 29, 163–182.
Schlundt, D. G., & Johnson, W. G. (1990). Eating Disorders:
Assessment and Treatment. Needham Heights, MA: Allyn and
Bacon.
Steiner, H., & Lock, J. (1998). Anorexia nervosa and bulimia nervosa
in children and adolescents: A review of the past 10 years. Journal
of the American Academy of Child and Adolescent Psychiatry, 37,
352–359.
Stice, E. (1999). Clinical implications of psychosocial research on
bulimia nervosa and binge-eating disorder. Journal of Clinical
Psychology, 55, 675–683.
Striegel-Moore, R., Wilfley, D., Pike, K., Dohm, F., & Fairburn, C.
(2000). Recurrent binge eating in black American women. Archives
of Family Medicine, 9, 83–87.
Texas Higher Education Coordinating Board (THECB) (2003). Report
of the Task Force on Retention and Graduation. Austin, TX:
Author.
Westwind Eating Disorder Recovery Center (1999). Retrieved August
2001 from http://www.westwind.mb.ca/westwind.
Winzelberg, A. J., Eppstein, D., Eldredge, K. L., Wilfley, D.,
Dasmahapatra, R., Dev, P., & Taylor, C. B. (2000). Effectiveness
of an Internet-based program for reducing risk factors for eating
disorders. Journal of Consulting and Clinical Psychology, 68, 346–
350.
Wooley, S. (1991). Obesity: Winners and losers in marketing of false
hope. National Eating Disorders Organization Newsletter, 14(2).