Epidemic processes with immunization
12
arXiv:cond-mat/0304113v2 [cond-mat.stat-mech] 15 Sep 2003 Epidemic processes with immunization Andrea Jim´ enez-Dalmaroni 1, ∗ and Haye Hinrichsen 2 1 University of Oxford, Department of Physics – Theoretical Physics, 1 Keble Road, Oxford OX1 3NP, U.K. 2 Theoretische Physik, Fachbereich 8, Bergische Universit¨ at Wuppertal, D-42097 Wuppertal, Germany We study a model of directed percolation (DP) with immunization, i.e. with different probabilities for the first infection and subsequent infections. The immunization effect leads to an additional non- Markovian term in the corresponding field theoretical action. We consider immunization as a small perturbation around the DP fixed point in d< 6, where the non-Markovian term is relevant. The immunization causes the system to be driven away from the neighbourhood of the DP critical point. In order to investigate the dynamical critical behaviour of the model, we consider the limits of low and high first infection rate, while the second infection rate remains constant at the DP critical value. Scaling arguments are applied to obtain an expression for the survival probability in both limits. The corresponding exponents are written in terms of the critical exponents for ordinary DP and DP with a wall. We find that the survival probability does not obey a power law behaviour, decaying instead as a stretched exponential in the low first infection probability limit and to a constant in the high first infection probability limit. The theoretical predictions are confirmed by optimized numerical simulations in 1 + 1 dimensions. PACS numbers: 05.70.Ln, 64.60.Ak, 64.60.Ht I. INTRODUCTION Epidemic processes can be described as the spread and decay of a non-conserved agent, an example of which is an infectious disease [1]. The agent is not allowed to appear sponstaneously but it can multiply itself by in- fecting neighbouring individuals, or decay at a constant rate. Depending on the balance between these two pro- cesses, the infection may either die out or spread over the entire population. The two regimes of survival and extinction of the epidemic are typically separated by a continuous non-equilibrium phase transition. When the decay process dominates, the epidemic dies out at large times and the system gets trapped in an absorbing state from which it cannot escape. Continuous phase transitions into absorbing states are associated with certain universality classes [2, 3]. For epidemic processes, a well studied case is the univer- sality class of directed percolation (DP). It is believed that two-state spreading processes with short-range in- teractions generically belong to the DP class, provided that quenched randomness, unconventional symmetries and large scales due to memory effects are absent [4, 5]. Examples of physical systems whose critical behaviour is described by DP include heterogeneous catalysis [6], chemical reactions [7, 8], interface depinning [9, 10], the onset of spatio-temporal chaos [11], flowing sand [12] and self-organized criticality [13]. The epidemic process in which the susceptibility to in- fection is independent of previous infections is described by DP. However, for a more realistic description, we ∗ Electronic address: [email protected] should consider an immunization effect [14]. Immuniza- tion can be added to the DP model by changing the sus- ceptibility after the first infection [15, 16, 17]. A min- imalistic model that captures this feature is one that is controlled by two independent parameters: a probability of first infection and another probability for all subse- quent reinfections. The fact that the local susceptibility depends on whether a site has been infected in the past or not leads to a non-Markovian epidemic process, in which the time evolution depends on the entire history. This non-Markovian feature changes the universality class of the epidemic spreading. The phase diagram of an epidemic process with im- munization (Fig. 1) was studied in Ref. [18, 19]. If the probabilities for first infections and reinfections are equal, the model corresponds to ordinary directed percolation. However if the susceptibility changes to zero after the first infection there is perfect immunization, and the model re- duces to the General Epidemic Process (GEP) [1]. GEP belongs to the ordinary percolation universality class [20]. The critical points of the GEP and DP are connected by a curved phase transition line separating a phase in which the spreading process always dies out, from an- other phase of annular growth, where an active front may propagate into regions of non-immune sites, leav- ing a bulk of immune sites behind. As shown in Ref. [18] the critical behavior along this line (except for the upper terminal point) belongs to the same universality class as GEP. Using field theoretic renormalization group tech- niques, the critical exponents were calculated along this line [16, 17]. The main result in Ref. [18] is that the compact growth/no growth phase transition line is at the critical value of the reinfection rate and independent of the first infection rate. Above this horizontal transition line in Fig. 1, the model exhibits compact growth and approaches the stationary state of supercritical DP. This is because, in the active phase of an epidemic process
Transcript of Epidemic processes with immunization

arX
iv:c
ond-
mat
/030
4113
v2 [
cond
-mat
.sta
t-m
ech]
15
Sep
2003
Epidemic processes with immunization
Andrea Jimenez-Dalmaroni1, ∗ and Haye Hinrichsen2
1University of Oxford, Department of Physics – Theoretical Physics, 1 Keble Road, Oxford OX1 3NP, U.K.2Theoretische Physik, Fachbereich 8, Bergische Universitat Wuppertal, D-42097 Wuppertal, Germany
We study a model of directed percolation (DP) with immunization, i.e. with different probabilitiesfor the first infection and subsequent infections. The immunization effect leads to an additional non-Markovian term in the corresponding field theoretical action. We consider immunization as a smallperturbation around the DP fixed point in d < 6, where the non-Markovian term is relevant. Theimmunization causes the system to be driven away from the neighbourhood of the DP critical point.In order to investigate the dynamical critical behaviour of the model, we consider the limits of lowand high first infection rate, while the second infection rate remains constant at the DP criticalvalue. Scaling arguments are applied to obtain an expression for the survival probability in bothlimits. The corresponding exponents are written in terms of the critical exponents for ordinary DPand DP with a wall. We find that the survival probability does not obey a power law behaviour,decaying instead as a stretched exponential in the low first infection probability limit and to aconstant in the high first infection probability limit. The theoretical predictions are confirmed byoptimized numerical simulations in 1 + 1 dimensions.
PACS numbers: 05.70.Ln, 64.60.Ak, 64.60.Ht
I. INTRODUCTION
Epidemic processes can be described as the spread anddecay of a non-conserved agent, an example of which isan infectious disease [1]. The agent is not allowed toappear sponstaneously but it can multiply itself by in-fecting neighbouring individuals, or decay at a constantrate. Depending on the balance between these two pro-cesses, the infection may either die out or spread overthe entire population. The two regimes of survival andextinction of the epidemic are typically separated by acontinuous non-equilibrium phase transition. When thedecay process dominates, the epidemic dies out at largetimes and the system gets trapped in an absorbing state
from which it cannot escape.
Continuous phase transitions into absorbing states areassociated with certain universality classes [2, 3]. Forepidemic processes, a well studied case is the univer-sality class of directed percolation (DP). It is believedthat two-state spreading processes with short-range in-teractions generically belong to the DP class, providedthat quenched randomness, unconventional symmetriesand large scales due to memory effects are absent [4, 5].Examples of physical systems whose critical behaviouris described by DP include heterogeneous catalysis [6],chemical reactions [7, 8], interface depinning [9, 10], theonset of spatio-temporal chaos [11], flowing sand [12] andself-organized criticality [13].
The epidemic process in which the susceptibility to in-fection is independent of previous infections is describedby DP. However, for a more realistic description, we
∗Electronic address: [email protected]
should consider an immunization effect [14]. Immuniza-tion can be added to the DP model by changing the sus-ceptibility after the first infection [15, 16, 17]. A min-imalistic model that captures this feature is one that iscontrolled by two independent parameters: a probabilityof first infection and another probability for all subse-quent reinfections. The fact that the local susceptibilitydepends on whether a site has been infected in the past ornot leads to a non-Markovian epidemic process, in whichthe time evolution depends on the entire history. Thisnon-Markovian feature changes the universality class ofthe epidemic spreading.
The phase diagram of an epidemic process with im-munization (Fig. 1) was studied in Ref. [18, 19]. If theprobabilities for first infections and reinfections are equal,the model corresponds to ordinary directed percolation.However if the susceptibility changes to zero after the firstinfection there is perfect immunization, and the model re-duces to the General Epidemic Process (GEP) [1]. GEPbelongs to the ordinary percolation universality class [20].The critical points of the GEP and DP are connectedby a curved phase transition line separating a phase inwhich the spreading process always dies out, from an-other phase of annular growth, where an active frontmay propagate into regions of non-immune sites, leav-ing a bulk of immune sites behind. As shown in Ref. [18]the critical behavior along this line (except for the upperterminal point) belongs to the same universality class asGEP. Using field theoretic renormalization group tech-niques, the critical exponents were calculated along thisline [16, 17]. The main result in Ref. [18] is that thecompact growth/no growth phase transition line is at thecritical value of the reinfection rate and independent ofthe first infection rate. Above this horizontal transitionline in Fig. 1, the model exhibits compact growth andapproaches the stationary state of supercritical DP. Thisis because, in the active phase of an epidemic process

2
0 0.2 0.4 0.6 0.8 1
first infection probability p0
0
0.2
0.4
0.6
0.8
1re
infe
ctio
n pr
obab
ility
p
compact growth (supercritical DP)
no growth
multicritical point
GEP
annular growth
A B
FIG. 1: Phase diagram of directed bond percolation with im-munization in 2+1 dimensions. Along the curve phase tran-sition line the universality class corresponds to the GEP. Thehorizontal line separates the no growth-annular growth regionfrom the compact growth behaviour. The point where bothphase transitions lines meet correspond to the universalityclass of DP.
with immunization, each site will be visited at least onceafter a sufficiently long time so that the dynamics in thestationary active state involves only reinfections. On thehorizontal phase transition line itself all reinfection pro-cesses are critical DP while the probability of first infec-tions may be sub- or supercritical. By varying the firstinfection rate, we can impede or facilitate the spreadinginto non-immune regions. In Ref. [18] a numerical analy-sis of the scaling behaviour along this horizontal line givesno hint of power law behaviour, and it is also suggestedthat this result could be applied to models with multipleabsorbing states [19, 21, 22, 23, 24, 25, 26, 27, 28].
The aim of the present work is to investigate in furtherdetail the dynamical critical behavior along the horizon-tal phase transition line and in the vicinity of the DPcritical point, and to give a theoretical explanation ofthe absence of power law scaling along this line.
In order to describe the effect of immunization in anepidemic process, in Sec. II we study a field theoretic for-mulation of directed percolation with immunization andwe show that the non-Markovian term which contains theimmunization effects, is relevant under renormalizationgroup analysis. As a consequence of this result we arguethat the asymptotic spreading properties along the hor-izontal transition line should be determined by the lim-its of very low and very high first infection probability.Therefore, in Sec. III we present a study of the very smallinfection probability limit and we develop a quasi-staticapproximation to obtain the scaling behaviour of the sur-vival probability of the epidemic. It turns out that thisdoes not follow a power law, but instead decays asymp-totically as a stretched exponential. This theoretical pre-
diction is confirmed by optimized numerical simulationsin 1+1 dimensions. The high first infection probabilitylimit is studied in Sec. IV giving similar results. We com-plete the section with a theoretical approximation for thespreading behaviour, and with numerical calculations tocorroborate the theoretical claims. Finally, a discussionof these results together with a possible connection withmultiple absorbing state models is the subject of the con-clusions in Sec. V.
II. FIELD THEORETICAL ANALYSIS
A. The model
In this section we develop an alternative derivation ofthe action for the DP model with immunization that wasproposed in [15, 16, 17]. The microscopic rules for DP ind + 1 dimensions are rather simple. An infected site attime t can infect its nearest neighbours at time t+1 witha probability p0. There is a critical threshold pc suchthat for p0 < pc the epidemic process always dies out,that is, it reaches the absorbing state. For p0 > pc thereis a finite probability that the epidemics survives. At thecritical point p0 = pc the system scales anisotropically intime and space. The upper critical dimension is dc = 4,below which the fluctuation effects become important.The field theoretic action of DP [29, 30] reads as follows:
SDP =
∫
dt ddx[
φ(∂t−D∇2+r)φ+u1φφ2−u2φ
2φ]
. (1)
Here, φ is the local activity, φ is the response field andr ∝ pc − p0 is the mass parameter which measures thedistance from criticality. This action can also be writtenas a Langevin-type equation for the local activity,
(∂t −D∇2 + r)φ +1
2uφ2 + ξ(x, t) = 0 , (2)
where u is the symmetrized coupling constant afterrescaling the fields according to the DP time reversalsymmetry. The noise ξ(x, t) is Gaussian, and satisfies〈ξ(x, t)〉 = 0 and 〈ξ(x, t)ξ(x′, t′)〉 = uδd(x − x
′)δ(t − t′).For a systematic analysis of the immunization around theDP fixed point it is often more convenient to make useof the description in terms of the action.
To add immunization to the model, the susceptibilityafter the first infection is decreased by an amount λ >0. The probability of infection, p, depends locally onposition and time, p = p(x, t). The microscopic rules aremodified as follows: a healthy site can first be infectedwith infection probability p0. A site which is infectedat time t will become immune at the next time step t +1. Meanwhile any immune site can be re-infected at thelower re-infection probability p0 − λ. Thus, the state of

3
the system at time t depends not just on the configurationof infected sites at time t− 1, but on the entire previoushistory.
In order to take into account the effects of immuniza-tion, we will modify the DP action. Let us consider a dis-crete d+ 1 dimensional lattice and assume that the fieldφ(x, t) is almost constant between times t and t + ∆t,where ∆t = 1 is the time step unit on the lattice. Wethen subdivide it into N intervals, ∆t/N . First of all, wewant to find an expression for the probability that thereis an active site in the temporal sub-interval ∆t/N . Todo so in terms of the field φ(x, t), we need to take into ac-count the fact that φ has units of length−d/2. Then thisprobability can be written as wφ(x, t)∆t/N , where weintroduce a parameter w to ensure that this expressionis dimensionless.
In this way, 1 − wφ(x, t)∆tN is the probability that the
site is not active in the interval ∆t/N . The probabilityof not finding activity between times t and t + ∆t, canthen be expressed as:
N∏
i=0
(1 − wφ(x, t + i/N)∆t
N) ∼ (1 − wφ(x, t)
∆t
N)N
N→∞−→ e−wφ(x,t)∆t. (3)
However, between times t = 0 and t > 1, we can nolonger assume that the field φ is constant. Therefore, theprobability of a site x has never been infected by time tturns out to be,
t∏
t′<t
e−wφ(x,t′)∆t = e−w∑ t
t′=0φ(x,t′)∆t. (4)
When the continuous limit is taken on the discrete lat-tice, the probability of having been infected at least once
in the past becomes 1 − exp(−w∫ t
0 φ(x, t′)dt′). This ex-pression is the probability for a site to be immune at timet. Since λ is the parameter related to the immunizationin the system, we can use the above result to write anexpression for p(x, t),
p(x, t) = p0 − λ
[
1 − e−w∫ t
0φ(x, t′)dt′
]
. (5)
We assume that the mass parameter r can be written asr ∝ pc−p(x, t). Thus, using Eq. 5, the addition of immu-nization can be reflected in the action as a modificationin the original DP mass parameter by the following sub-stitution:
r → r + λ
[
1 − e−w∫ t
0 φ(x, t′)dt′]
. (6)
Finally the action for DP with immunization can bewritten as a modification of the directed percolation ac-tion as follows:
S = SDP +
λ
∫
dtddxφ(x, t)φ(x, t)[
1 − e−w∫ t0
dt′φ(x,t′)]
. (7)
According to the field theory, w is a finite couplingconstant. Then in the numerical calculations on a dis-crete d+ 1 dimensional lattice, w can be considered as aparameter such that the subsequent infection rate is,
p0 + (p− p0) [1 − exp(−wn(x, t))] . (8)
Here, the function n counts all the past activity at a sitex until time t. Since the exponential function vanishes atsufficient large times, the effective subsequent infectionrate is equal to p.
In the numerical calculations carried out in the presentwork, we assume that the susceptibility for spreadingonly changes at the first infection process and remainsconstant thereafter. This assumption is equivalent totake an infinite value of w, but does not make any rel-evant change in the final results of the theory as it isargued in Ref. [18].
B. Renormalization group analysis
Expanding in Eq. 7 the exponential function as a powerseries, the action reads
S = SDP +
∫
dtddxφ(x, t)φ(x, t) ×
[
−∞∑
n=1
λ(n)
n!
(
−
∫ t
0
dt′φ(x, t′)
)n]
, (9)
where we abbreviate λ(n) = λwn. Let us now study thestability of the DP fixed point with respect to a smallperturbation in λ(n) by dimensional analysis. Introduc-ing a length scale k−1, the mean-field fixed point of DP ischaracterized by the dimensions [φφ] = kd, [D] = ωk−2,and [u/D] = k4−d/2 so that the upper critical dimensionis dc = 4. When immunization is considered as a pertur-bation, the effective expansion parameter in the expres-sion of the two point vertex function is un
2λ(n). Thus, by
dimensional analysis we find
[un
2λ(n)
D2n+10
] = k2+n(4−d) . (10)
Consequently the upper critical dimension for each cou-pling constant λ(n) is dc = 2
n + 4, where n = 1, . . . ,∞.
This means that for dimensions d > 6, λ(n) is irrelevant

4
. . .= + +Γφφφ∼ ’ −λ(1)
FIG. 2: One-loop diagrams for the three point vertex function Γ′
φφφ. The dashed lines in the external dashed-continue-leg
represent the shift in time indicated by the Θ(t− t′) function in the action after the expansion of the exponential. The ’externallegs’ are cut off, and this fact is indicated with the two parallel lines.
. . .= + +Γ∼φφ
1
FIG. 3: One-loop diagrams for the two point vertex function Γφφ . The ’external legs’ are cut off, and this fact is indicated
with the two parallel lines. The X indicates the insertion of the composite operator φφ.
for all n. The parameter u2 will also be irrelevant, andonly the mass parameter r renormalizes.
Consider now the renormalization group (RG) param-eter space spanned by r, u2, and the λ(n). The DP fixedpoint occurs at a point on the u2 axis, and the GEP fixedpoint is somewhere in the hyper-dimensional space. Sinceall the coupling constants are irrelevant in the case d > 6,the RG flows bring the system from the neighborhood ofthe DP fixed point towards the Gaussian DP fixed point,which corresponds to the DP free-field theory. Thereforeif close to the DP fixed point we turn on a small perturba-tion of immunization in a system, the qualitative natureof the system will not change, and the epidemic process isexpected to spread according to a mean-field DP processcontrolled by the probability of first infections.
For 4 < d ≤ 6, the coupling constant λ(1) is the mostrelevant. Consequently the higher order terms in the ex-pansion of the exponential in Eq. (9) can be neglected.In this case the RG flows bring the system away fromthe neighbourhood of the DP fixed point to the GEPfixed point which is stable. Thus, we expect the sys-tem to undergo an ordinary crossover from DP to thedynamic percolation universality class at a certain typi-cal time scale. However, recently it has been suggestedthat dangerous irrelevant operators may possibly lead toa non-trivial critical behavior different from dynamicalpercolation [28].
To take the fluctuation effects into account, we de-
fine the renormalized λ(1) as λ(1)R and we apply standard
methods of the perturbative renormalization group [31].In particular we make use of an ǫ = 4 − d expansionaround the DP critical point. The non-Markovian mod-ification in the DP action can be written then as an ad-
ditional term of the form,
λ(1)
∫
dt ddx Θ(t− t′)φ(x, t)φ(x, t)φ(x, t′). (11)
The non-locality in time, expressed by the Θ function inEq. 11, is represented by a dashed line propagator in theFeynman diagrams. The renormalized coupling constant
λ(1)R can be determined in terms of the vertex function
Γ′φφφ
(see Fig. 2), evaluated at some specified normaliza-
tion point, NP, setting a momentum scale µ. The ′ in thevertex function’s notation in Eq. 11 is used to indicatethat this function is calculated in the DP with immuniza-tion theory and is different from the one calculated in theordinary DP. Near the upper critical dimension the ul-traviolet divergences are absorbed in the renormalization
constant Zφ, where φR ≡ Z−1/2φ φ and Zφ = Zφ.
λ(1)R = −Γ′
Rφφφ
∣
∣
∣
∣
NP
= −Z3/2φ Γ′
φφφ
∣
∣
∣
∣
NP
. (12)
The structure of the corrections to the vertex functionΓ′
φφφsuggests a correspondence with the RG theory of
DP away from the critical point, where is considered therenormalization of a nonzero mass term r which coupleswith the composite operator φ(x, t)φ(x, t). One loop cor-rections to the corresponding two point bare vertex func-tion Γφφ in this theory, are depicted in Fig. 3. The nor-malization condition implies that the renormalized twopoint vertex function ΓRφφ evaluated at the normaliza-tion point NP, is equal to 1.
ΓRφφ
∣
∣
∣
∣
NP
= Z−1
φφZφΓφφ
∣
∣
∣
∣
NP
= 1. (13)
5
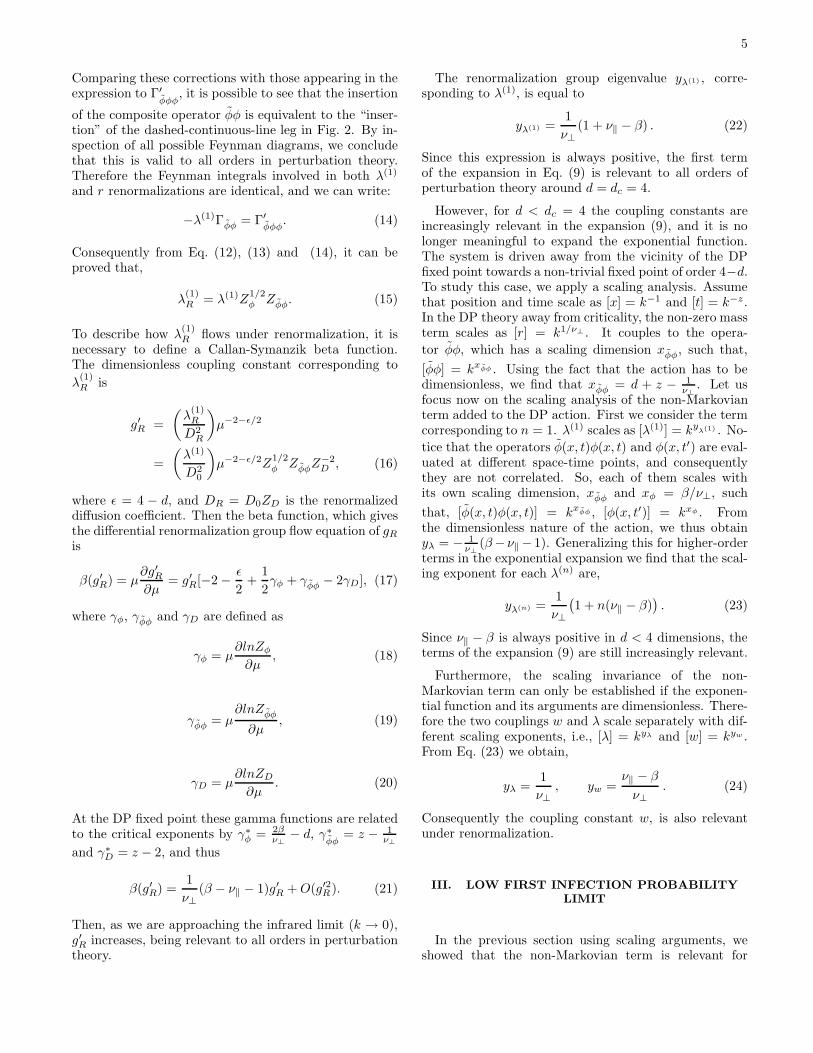
Comparing these corrections with those appearing in theexpression to Γ′
φφφ, it is possible to see that the insertion
of the composite operator φφ is equivalent to the “inser-tion” of the dashed-continuous-line leg in Fig. 2. By in-spection of all possible Feynman diagrams, we concludethat this is valid to all orders in perturbation theory.Therefore the Feynman integrals involved in both λ(1)
and r renormalizations are identical, and we can write:
−λ(1)Γφφ = Γ′φφφ
. (14)
Consequently from Eq. (12), (13) and (14), it can beproved that,
λ(1)R = λ(1)Z
1/2φ Zφφ. (15)
To describe how λ(1)R flows under renormalization, it is
necessary to define a Callan-Symanzik beta function.The dimensionless coupling constant corresponding to
λ(1)R is
g′R =
(
λ(1)R
D2R
)
µ−2−ǫ/2
=
(
λ(1)
D20
)
µ−2−ǫ/2Z1/2φ ZφφZ
−2D , (16)
where ǫ = 4 − d, and DR = D0ZD is the renormalizeddiffusion coefficient. Then the beta function, which givesthe differential renormalization group flow equation of gR
is
β(g′R) = µ∂g′R∂µ
= g′R[−2 −ǫ
2+
1
2γφ + γφφ − 2γD], (17)
where γφ, γφφ and γD are defined as
γφ = µ∂lnZφ
∂µ, (18)
γφφ = µ∂lnZφφ
∂µ, (19)
γD = µ∂lnZD
∂µ. (20)
At the DP fixed point these gamma functions are relatedto the critical exponents by γ∗φ = 2β
ν⊥− d, γ∗
φφ= z − 1
ν⊥
and γ∗D = z − 2, and thus
β(g′R) =1
ν⊥(β − ν‖ − 1)g′R +O(g′2R ). (21)
Then, as we are approaching the infrared limit (k → 0),g′R increases, being relevant to all orders in perturbationtheory.
The renormalization group eigenvalue yλ(1) , corre-sponding to λ(1), is equal to
yλ(1) =1
ν⊥(1 + ν‖ − β) . (22)
Since this expression is always positive, the first termof the expansion in Eq. (9) is relevant to all orders ofperturbation theory around d = dc = 4.
However, for d < dc = 4 the coupling constants areincreasingly relevant in the expansion (9), and it is nolonger meaningful to expand the exponential function.The system is driven away from the vicinity of the DPfixed point towards a non-trivial fixed point of order 4−d.To study this case, we apply a scaling analysis. Assumethat position and time scale as [x] = k−1 and [t] = k−z.In the DP theory away from criticality, the non-zero massterm scales as [r] = k1/ν⊥ . It couples to the opera-
tor φφ, which has a scaling dimension xφφ, such that,
[φφ] = kxφφ . Using the fact that the action has to bedimensionless, we find that xφφ = d + z − 1
ν⊥. Let us
focus now on the scaling analysis of the non-Markovianterm added to the DP action. First we consider the termcorresponding to n = 1. λ(1) scales as [λ(1)] = ky
λ(1) . No-
tice that the operators φ(x, t)φ(x, t) and φ(x, t′) are eval-uated at different space-time points, and consequentlythey are not correlated. So, each of them scales withits own scaling dimension, xφφ and xφ = β/ν⊥, such
that, [φ(x, t)φ(x, t)] = kxφφ , [φ(x, t′)] = kxφ . Fromthe dimensionless nature of the action, we thus obtainyλ = − 1
ν⊥(β− ν‖− 1). Generalizing this for higher-order
terms in the exponential expansion we find that the scal-ing exponent for each λ(n) are,
yλ(n) =1
ν⊥
(
1 + n(ν‖ − β))
. (23)
Since ν‖ − β is always positive in d < 4 dimensions, theterms of the expansion (9) are still increasingly relevant.
Furthermore, the scaling invariance of the non-Markovian term can only be established if the exponen-tial function and its arguments are dimensionless. There-fore the two couplings w and λ scale separately with dif-ferent scaling exponents, i.e., [λ] = kyλ and [w] = kyw .From Eq. (23) we obtain,
yλ =1
ν⊥, yw =
ν‖ − β
ν⊥. (24)
Consequently the coupling constant w, is also relevantunder renormalization.
III. LOW FIRST INFECTION PROBABILITYLIMIT
In the previous section using scaling arguments, weshowed that the non-Markovian term is relevant for

6
spac
e
time
L(t)
FIG. 4: Spreading in the limit of a very small first infection probability p0. The figure shows a surviving cluster in 1+1dimensions. In this case the domain of infected/immune is hole-less and grows very slowly with time. Its boundaries can beconsidered as stationary absorbing walls.
d < dc = 4. We can now argue that a critical spreadingprocess on the horizontal line in Fig. 1, is therefore drivenaway from the vicinities of the DP critical point to thepoints A or B, where the probability of first infections iseither very low or very high. In order to understand thedynamic behavior in these limits we study the asymp-totic spreading properties keeping the second infectionprobabilities at the critical value of DP. We consider aninitial state with a single infected site at the origin in anon-infected environment. For simplicity we will focuson the 1 + 1-dimensional lattice. In this case there arenot empty sites inside the epidemic clusters, which arecomposed of infected and immune sites only.
A. Quasi-static approximation
Let us consider the limit of a very small first infec-tion probability. In this regime, although first infectionshardly ever happen, there still exists a surviving criti-cal epidemic process as is shown in Fig. 4. The activedomain is composed by re-infected sites among immuneones, and can be considered as bounded by almost rigid“walls” of empty sites. Let us define L(t) to be the dis-tance at time t between these two walls, such that thereis at least one site active. If we keep the second infec-tion rate critical, the dynamic epidemic process can bethought as an effective critical DP process evolving in afinite system of size L(t).
A quasi-static approximation is based on the assump-tion that the time scale on which L(t) grows is muchlarger than the correlation time of the DP process.Therefore, L(t) can be assumed constant. It is knownthat in a finite-size system with a constant width L, thesurvival probability of a DP process decays exponentiallyas P (t) ∼ exp(−t/Lz), where z =
ν‖
ν⊥. Then, in a quasi-
static finite system the survival probability can be ap-proximated as Ps(t) ∼ exp(−t/ξ‖), i.e.
dPs(t)
dt≃ −
1
ξ‖Ps(t) ≃ −aPs(t)L(t)−z , (25)
where a is a non-universal amplitude factor. We neednow to know how L(t) grows. Since the two boundariesare absorbing, we can apply the theory of DP with ab-sorbing walls [32]. According to these results, the density
of active sites next to the walls generated by the survivingclusters scales as
ρs(t) = b L(t)−βs/ν⊥ , (26)
where b is a non-universal amplitude factor which de-pends on the value of p0. βs ≃ 0.73371(2) is the sur-
face critical exponent of DP in 1+1 dimensions. Clearly,dL/dt is proportional to the frequency by which the sys-tem attempts to infect sites at the boundary and thusalso to the density of active sites next to the boundary:
dL(t)
dt= p0 ρs(t) = p0 b L(t)−βs/ν⊥ . (27)
Therefore, the size of the domain grows as
L(t) = (p0 b (1 + βs/ν⊥) t)1/(1+βs/ν⊥). (28)
Inserting this result into Eq. (25) and solving the differ-ential equation we obtain
lnPs(t) ∼ −
∫ t
0
L(z)−zdt ∼ −p−α0 t1−α , (29)
where α =ν‖
ν⊥+βs≃ 0.947167. Hence the survival decays
asymptotically as a stretched exponential of the form
Ps(t) = Ps(0) exp(
−Ap−α0 t1−α
)
. (30)
with A = a1−α ( α
bz )α. The above result implies that theaverage survival time T is finite and scales as
T ∼ pα/(1−α)0 . (31)
It is interesting to compare these results with recentfindings for random walkers between movable reflectors,where the survival probability was shown to decay asa power law with continuously varying exponents [33].We note that this result is not in contradiction withthe present work since it would correspond to the limitα→ 1.
B. Numerical simulations
The lattice model considered is a 1+1 dimensional tri-angular lattice. We simulate a directed bond percolation

7
100
102
104
10610
0
101
102
103
104
p0=0.01p0=0.05p0=0.1quasi−static approximation
t
L
(
t
)
FIG. 5: The logarithm of the domain size L(t) in the problemof directed percolation with immunization for small values ofp0 as function of time t. The numerical results are comparedwith the quasic-static approximation predictions.
process with a first infection rate p0 different from a ratefor subsequent infections or second infection rate p.
Let us first consider the limit of a very small first in-fection probability, where it is difficult for the processto infect sites at the boundary that have never beeninfected before (see Fig. 4). Bonds inside the infectedregion are open with the critical probability p = pc =0.6447001(1) [34], while bonds leading to healthy sitesat the boundary are open with a different probability offirst infection p0. However, as p0 is very small, conven-tional seed simulations are not suitable since most of theruns terminate after a very short time. For example, forp = 0.1 most of the runs survive for less than 100 timesteps. Consequently we apply enrichment methods in or-der to circumvent this limitation. First of all, we applya very simple enrichment method, in which we considerone lattice system. We keep the activity artificially aliveat any time t. This is achieved by ignoring the updateswhich lead to the inactive state. Averaging over manyrealizations we measured the domain size L(t) and thesurface density of active sites. We find that the expo-nents predicted by the quasi-static approximation are ingood agreement with the values obtained with the nu-merical simulations as shown in Fig. 5 and Fig. 6. Thenonuniversal factor b in Eq. (28) depends on the value ofp0. For, p0 = 0.01 it takes the value b = 1.65.
To determine the survival probability Ps(t), we applyanother enrichment method [35], which leads to a con-siderable improvement. The simulation starts with anensemble of N = 65 536 independent systems. Wheneverthe number of active runs becomes smaller than N/2 theensemble is duplicated by creating identical copies of allthe remaining active states. The new systems are labelledaccording to their ancestors. The survival probability Ps
100
102
104
10610
−3
10−2
10−1
100
p0=0.01p0=0.05p0=0.1quasi−static approximation
t
�
s
(
t
)
FIG. 6: The logarithm of the surface density of active sitesof directed percolation with immunization for small values ofp0 as function of time t. The numerical results are comparedwith the quasic-static approximation predictions.
then is reduced by a factor of nf/ni, where ni is thenumber of initial active systems and nf is the numberof remaining active systems before the duplication. Thisprocess may be repeated as long as the ensemble has asufficiently large number m of independent ancestors att = 0. Using this method we were able to extend thetemporal range of the simulation by four orders of mag-nitude up to t = 106. Our results are shown in Fig. 7 forvarious values of p0. As can be seen, the survival prob-ability plotted in a double logarithmic representation isnot a straight line, proving that it does not follow a powerlaw. For the case p0 = 0.01, the parameter a in Eq. (25)takes the value a = 1.00(2).
C. Lattice effects
The scaling arguments in Section III A are developedassuming the existence of a well defined mean value forthe domain size L(t). To justify this assumption, we de-fine P (L, t) to be the probability of having a domainof size L at time t. Then the survival probability isPs(t) =
∫
P (L, t)dL. In this subsection we show thatL(t) is peaked around the mean value L(t).
We begin by writing down a heuristic discrete masterequation for the temporal evolution of P (L, t):
P (L, t+ 1) = e−aL−z
P (L, t) + bp0(L − 1)−βs/ν⊥ ×
P (L− 1, t) − bp0L−βs/ν⊥P (L, t). (32)
The first term in the right hand side of Eq. (32) describesthe change in P (L, t) due to terminating runs accordingto Eq. (25) integrated over the time interval [t, t+1]. Thesecond term corresponds to the probability of creating

8
100
101
102
103
104
105
106
-250
-200
-150
-100
-50
0
p0=0.01
p0=0.05
p0=0.1
100
101
102
103
104
105
106
t
100
101
102
103
104
105
m
t
l
n
P
s
(
t
)
FIG. 7: The logarithm of the survival probability Ps(t) ofdirected percolation with immunization for small values ofp0. The inset shows the corresponding number of independentancestors as a function of time (see text). For p0 = 0.01 theduplication method reaches its limit since only 11 independentancestors are left.
a domain of size L from a domain of length (L − 1).The third term describes a loss term corresponding toL → L + 1. We neglect the second order contributions+b2p2
0(L−1)−2βs/ν⊥P (L−2, t) and −b2p20(L−1)−2βs/ν⊥
which only affect the behaviour at small time and smallL regime.
It is straightforward to show that this master equationis consistent with Eq. (25), by summing over all L andreplacing L by its average value L(t). On doing thiswe obtain dPs(t)/dt = −aL(t)−zPs(t), that is the sameequation as Eq. (25).
Consider Eq. (32) with p0, a and b fixed at certainvalues. Then the differential equation which correspondsto the master equation, Eq. (32), can be written as
∂P (L, t)
∂t= −
a
LzP (L, t) −
p0b∂
∂L
[
L−βs/ν⊥P (L, t)]
, L≫ 1. (33)
The solution for Eq. (33) is
P (L, t) = e− a
p0b(1−z+βs/ν⊥)L1−z+βs/ν⊥
Lβs/ν⊥
ψ[
Lβs/ν⊥+1 − p0b(βs/ν⊥ + 1)t]
, (34)
where L≫ 1. Consider the integrated distribution prob-ability G(L, t) =
∫ ∞
LP (L, t)dL. Then G(L, t) has the
functional form
G(L, t) = e−c[p0b(βs/ν⊥+1)t]κ ×
φ
[
Lβsν⊥
+1− p0b(
βs
ν⊥+ 1)t
](
1 +O(1
t1−κ)
)
,
(35)
0 100 200 300 400 5000
0.001
0.002
0.003
t=8000t=16000t=32000t=64000t=128000t=256000t=512000t=1000000
−4000 −3000 −2000 −1000 0 1000 2000 3000 40000
10
20
30
L
G
(
L
;
t
)
L
�
s
=�
?
+1
� p
0
b(�
s
=�
?
+ 1)t
e
c
[
p
0
b
(
�
s
=
�
?
)
t
]
�
G
(
L
;
t
)
FIG. 8: Probability G(L, t) =∫
∞
LP (L, t)dL computed by
numerical integration of the master equation Eq. (32). Theplots correspond to a = 0.01 and p0 = 0.01. The inset showsthe scaling plot when G(L, t) scales according to Eq. (35).
with c = a/(p0b(1 − z + βs/ν⊥)) and κ = (1 − z +βs/ν⊥)/(1 + βs/ν⊥).
To observe the qualitative behaviour of P (L, t) andG(L, t), we carry out numerical integrations of Eq. (32).As initial conditions we choose the state in which thereis only one site infected at time t = 0. In Fig. 8, G(L, t)is shown for several values of time t. It behaves like apropagating front with an overall exponential factor oftime t. The fact that all the G(L, t) curves intersect atthe same point (see inset in Fig. 8), implies that thereis a well defined peak and a mean value L(t) for P (L, t).The qualitative behaviour ofG(L, t) is independent of theparticular values of a and p0. Consequently, to performthese calculations, we use values of a and p0 such thatthe effect of the exponential decay in Eq. (35) is not sopronounced.
We now compare the predictions of the master equa-tion proposed in this subsection, with the results ob-tained from a simulation of the model. In Eq. (32), wefixed the value of p0 = 0.01 and vary a. The survivalprobability calculated from direct numerical integrationof Eq. (32), describes well the corresponding simulationresult for p = 0.01, in the case a = 1 (see Fig. 9).
IV. HIGH FIRST INFECTION PROBABILITYLIMIT
Let us finally consider the limit of a very high firstinfection probability p0 → 1. Again we restrict to the1+1-dimensional case, where the region of immune sitesdoes not contain healthy sites inside. Because of the en-hanced spreading probability at the boundaries, the do-

9
100
102
104
106
-300
-250
-200
-150
-100
-50
0
simulationsa=1
t
l
n
P
s
(
t
)
FIG. 9: Survival probability calculated using the masterequation Eq. (32). We set p0 = 0.01, a = 1 and b = 1.65.The result is in good agreement with the Monte Carlo simu-lations for p0 = 0.01.
main grows rapidly by sudden avalanches of successivefirst infections (see Fig. 10). Since the avalanches at theleft and the right boundary are expected to be uncorre-lated, it suffices to study the propagation of one of theboundaries. As in the previous section, we propose sim-ple scaling arguments in order to describe the growth ofthe infected/immune domain and the survival probabil-ity.
A. Independent avalanche approximation
In 1+1-dimensional directed bond percolation with p =pc and p0 → 1 an avalanche is caused by a sequence ofopen bonds at the boundary. Therefore, the avalanchesize ξ is distributed exponentially as
P (ξ) = (1 − p0) pξ0 ∼ e−ξ/ξ , (36)
The quantity
ξ = −1
ln p0≈
1
1 − p0p0 → 1. (37)
is the average distance by which the avalanche advancesthe boundary in space. After each avalanche the pro-cess continues to evolve as an ordinary critical DP pro-cess inside the immune domain until it terminates or re-turns to the boundary where it releases a new avalanche.Thus the spreading behavior is mainly determined by thedistribution of waiting times τ between the avalanches.We argue that the distribution of waiting times betweenavalanches is related to the problem of local persistence
in DP [36, 37] (for a recent review on persistence seee.g. [38]). The local persistence probability R(t) is de-fined as the probability that a randomly selected site in
space
time
L(t)
FIG. 10: Spreading in the limit of a very high first infectionrate.
an ordinary critical DP process starting from a homo-geneous initial state has not been reactivated until timet. It was shown that this quantity decays algebraicallyas R(t) ∼ t−Θ, where Θ = 1.50(1) is the so-called lo-cal persistence exponent [36]. In the present problemthe situation is similar: Each avalanche creates locally aquasi-homogeneous state. The process then evolves as anordinary critical DP process inside the infected/immuneregion until the boundary is revisited for the first time inorder to release a new avalanche. However, unlike persis-tence studies in 1+1 dimensions, where a persistent sitecan be activated independently from the left and fromthe right, the boundary sites in the present problem canbe infected only from one side. Hence the probabilitythat the next avalanche has not yet been released decaysas τ−Θ/2. Thus we conjecture that the waiting timesbetween avalanches are distributed algebraically as
P (τ) ∼ τ−1−Θ/2 . (38)
Next, we argue that these waiting times may be inter-preted as directed Levy flights in time [39]. After eachflight the domain size L(t) grows on average by the meanavalanche size ξ. This type of growth may be describedby the equation
DΘ/2t L(t) ∼ ξ , (39)
where DΘ/2t is a fractional derivative defined through its
action in Fourier space DΘ/2t eiωt = (iω)Θ/2eiωt. Simple
dimensional analysis leads to the result
L(t) ∼ ξ tΘ/2 . (40)
In order to compute the survival probability, we note thatduring the waiting time the outermost active site departsfrom the boundary with an average distance ℓ(τ) ∼ τ1/z .Obviously, the process can only terminate if this distanceis of the same order as the size of the infected/immunedomain L(t). Therefore, we expect the distribution ofwaiting times between avalanches to be cut off by a max-imal waiting time
τmax ∼ Lz(t) ∼ ξz tzΘ/2. (41)
Consequently, the probability that the process terminatesbetween two avalanches is given by
P0 =
∫ ∞
τmaxdτ P (τ)
∫ ∞
1 dτ P (τ)∼ τ−Θ/2
max (42)

10
On the other hand, the cutoff due to terminating runsimplies that the average waiting time is finite and scalesas
τ =
∫ τmax
1 dτ τ P (τ)∫ τmax
1 dτ P (τ)= τ1−Θ/2
max (43)
Therefore, the average loss of the survival probability perunit time is given by P0/τ ∼ 1/τmax, i.e.
dPs(t)
dt∼ −Ps(t)/τmax ∼ −Ps(t) ξ
−z t−zΘ/2 . (44)
Solving this equation, the asymptotic behavior of thesurvival probability is not a stretched exponential and isgiven by a
Ps(t) =1
Nexp
(
+Aξ−z t1−zΘ/2)
, (45)
where N and A are unknown constants. In contrast tothe previous case in Eq. (30) the exponent 1 − zΘ/2 ≃−0.185 is negative. Consequently the survival probabilitytends to a constant Ps(∞) > 0, meaning that a finitefraction of runs survives for infinitely long time. For verylarge p0 this constant is expected to scale as
1 − Ps(∞) ∝ (1 − p0)zΘ/2 . (46)
B. Numerical results
In order to verify these results numerically, we devel-oped an especially optimized Monte Carlo algorithm forlarge values of p0. In order to compute the survivaltime for a run and to see how the boundaries advancefor a given realization of open and closed bonds, it is inmost cases not necessary to construct the entire cluster.Rather it suffices to construct its branches next to theboundaries. For example, in Fig. 10 large parts of thecluster are irrelevant for the advancement of the bound-aries and the survival time. For this reason our algo-rithm first constructs the branches of the cluster nextto the boundaries. If these branches terminate beforethe simulation time is reached, we recursively constructsthe omitted branches in the interior of the clusters. Ifhowever they do not terminate, then the recursive con-struction is not performed. Using this technique we couldextend the simulation time by two decades to 104 timesteps, two decades less than in the previous case of lowp0.
Our numerical results are shown in Fig. 11. The leftpanel shows the survival probability as a function oftime in a directed bond percolation process with p0 =0.85, 0.90, 0.95, and 0.98. The positive curvature of thelines indicates that there is no power-law scaling. Al-though the upward curvature is in agreement with theexpected result (45), the simulation time is not large
enough to confirm the behaviour of Eq. (45) quantita-
tively, mainly because the constant A is not known. Inorder to substantiate the assumptions made in the pre-vious subsection, we first measured the growing domainsize L(t). As shown in Fig. 11b, the measured slope seemsto tend to the predicted slope Θ/2 = 0.75(1). Moreover,we estimated the logarithmic derivative of the survivalprobability, in which the unknown prefactor A drops out(see right panel of Fig. 11). Although this data set isquite noisy, we observe a rather clean power law. The es-timated slope 1.12(10) is consistent with the theoreticalprediction t−zΘ/2 = t−1.185, supporting the assumptionswhich led to the result (45).
V. CONCLUSIONS
We analyzed the effects of immunization as a small per-turbation on the DP model and studied in detail the scal-ing behaviour of the theory around the DP critical point.We derived by an alternative method the field theoreticaction for the model. A non-Markovian term is addedto the DP action because of the presence of immuniza-tion. In the field theory, the probability for subsequentinfections, which is different from the first infection prob-ability, is a function of position and time. Nevertheless,we assumed in the lattice model that the susceptibilityfor spreading changes only after the first infection, re-maining constant thereafter. This assumption does notchanges the final results.
The phase diagram (cf. Fig. 1) comprises two phasetransition lines, namely, a horizontal line, where the pro-cess in reinfected regions shows the critical behavior ofDP, and (in more than one spatial dimension) a curvedtransition line, where the critical behavior corresponds tothe general epidemic process studied in [18]. Both linesmeet at the DP critical point p = p0 = pc.
The non-Markovian term turns out to be relevant ford < 6. We considered the RG flows and argued thatany point in the neighbourhood of the DP critical pointwill be driven away from it. In particular, we focusedour study on the horizontal phase transition line with acritical reinfection probability p = pc. The system alongthis line, is driven away from the DP critical point assoon as the immunization effects are turned on as a smallperturbation. The asymptotic behavior is determined bythe limits of very low and high first infection probability(close to points A and B in Fig. 1).
We proposed simple scaling arguments for the be-haviour of the survival probability in both limits. We re-lated the corresponding exponents with those exponentsof the critical ordinary DP theory and DP near a wall.The survival probability is found to obey a stretched ex-ponential behaviour in the low first infection probabilitylimit, and it decays to a constant in the high first infec-

11
100
101
102
103
104
0.8
0.9
1
100
101
102
103
10410
0
101
102
103
100
101
102
103
104
10
10
−8
−2
(a) (b) (c)
P
s
(
t
)
L
(
t
)
t t t
�
d
d
t
l
n
P
s
(
t
)
FIG. 11: Avalanche approximation in comparison with numerical results. (a) Numerically determined survival probabilityfor p0 = 0.85, 0.9, 0.95, and 0.98 from bottom to top. (b) Numerically determined domain size L(t) for p0 = 0.9 (solid line)compared to the theoretical prediction (40) (dotted line). (c) Logarithmic derivative of the survival probability for p0 = 0.9.
tion probability limit, taking the form
Ps(t) ∝
{
exp(−at+0.0528) for p0 → 0
exp(+bt−0.185) for p0 → 1(47)
The numerical simulations in 1 + 1 dimensions supportthese theoretical predictions, ruling out the possibility ofasymptotic power-law scaling in both limits. The ques-tion as to whether the stretched exponential decay of thesurvival probability persists in higher dimensions is stillopen.
Finally, we comment on a possible connection of theseresults with the problem of infinitely many absorbingstates. A typical example of such systems is the pair con-tact process 2A → 3A, 2A → ∅, in which solitary parti-cles are not allowed to diffuse [40]. In Ref. [19, 24, 25, 26]this model was studied with an effective Langevin equa-tion and it was inferred that the survival probability de-cays as a power law at the transition point, with contin-uously varying exponents. However, the field theoreticalaction studied in [19, 24, 26] is identical to the one stud-ied in this paper. Hence, we conclude that, accordingto the analysis presented in this paper, seed simulations
of the pair contact process, at least in 1 + 1 dimensions,should show an stretched exponential behaviour and nota power low decay at the transition point.
Acknowledgments
We want to thank Peter Grassberger for communi-cation of unpublished numerical calculations. A.J.D. isgreatly indebted to John Cardy for enlightening discus-sions and suggestions, and for his most careful readingof the manuscript. A.J.D. would also like to thank to R.Rajesh for useful comments.
Part of the present computations have been carried outon the 128-node Alpha Linux Cluster Engine ALiCE atWuppertal University. We thank N. Eicker, Th. Lippertand B. Orth for their assistance.
A.J.D. was supported by CONICET (Argentina), theBritish Council-Fundacion Antorchas (Argentina), andthe ORS Award Scheme (UK).
[1] D. Mollison, J. R. Stat. Soc. B 39, 283 (1977).[2] J. Marro and R. Dickman, Nonequilibrium phase tran-
sitions in lattice models, Cambridge University Press,Cambridge, 1999.
[3] H. Hinrichsen, Adv. Phys. 49, 815 (2000).[4] H. K. Janssen, Z. Phys. B 42, 151 (1981).[5] P. Grassberger, Z. Phys. B 47, 365 (1982).[6] R. M. Ziff, E. Gulari and Y. Barshad, Phys. Rev. Lett
56, 2553 (1986).
[7] P. Grassberger and A. De la Torre, Ann. Phys. 122, 373(1979).
[8] F. Schlogl, Z. Phys. 253, 147 (1972).[9] L. H. Tang and H. Leschhorn, Phys. Rev. A 45, R8309
(1992).[10] S. V. Buldyrev, A.-L. Barabasi, F. Caserta, S. Havlin, H.
E. Stanley and T. Vicsek, Phys. Rev. A 45, R8313(1992).[11] P. Rupp, R. Richter, and I. Rehberg, Phys. Rev. E 67,
036209 (2003).

12
[12] H. Hinrichsen, A. Jimenez-Dalmaroni, Y. Rozov, and E.Domany, Phys. Rev. Lett. 83, 4999 (1999);J. Stat. Phys. 98, 1149 (2000).
[13] P. K. Mohanty and Deepak Dhar, Phys. Rev. Lett. 89,104303 (2002).
[14] A. S. Perelson and G. Weisbuch, Rev. Mod. Phys. 69,1219 (1997).
[15] J. L. Cardy, J. Phys. A: Math. Gen. 16, L709 (1983).[16] J. L. Cardy and P. Grassberger, J. Phys. A 18, L267
(1985).[17] H. K. Janssen, Z. Phys. B 58, 311 (1985).[18] P. Grassberger, H. Chate and G. Rousseau, Phys. Rev.
E 55, 2488 (1997).[19] M. A. Munoz, G. Grinstein and R. Dickman, J. Stat.
Phys. 91, 541 (1998).[20] Z. Alexandrowicz, Phys.Lett. 80A,284 (1980).[21] I. Jensen and R. Dickman, Phys. Rev. E 48, 1710 (1993).[22] J. F. F. Mendes, R. Dickman, M. Henkel, and M. C.
Marques, J. Phys. A 27, 3019 (1994).[23] R. Dickman, Phys. Rev. E 53, 2223 (1996).[24] M. A. Munoz, G. Grinstein, R. Dickman, and R. Livi,
Phys. Rev. Lett. 76, 451 (1996).[25] C. Lopez and M. Munoz, Phys. Rev. E 56, 4864 (1997).[26] M. A. Munoz, G. Grinstein, R. Dickman, and R. Livi,
Physica D 103, 485 (1997).
[27] W. Hwang and H. Park, Phys. Rev. E 59, 4683 (1999).[28] F. van Wijland, Phys. Rev. Lett. 89,190602 (2002).[29] P. Grassberger and K. Sundermeyer, Phys. Lett. B 77,
220 (1978).[30] J. L. Cardy and R. L. Sugar, J. Phys. A 13, L432 (1980).[31] D. Amit, “Field Theory, the Renormalization Group, and
Critical Phenomena”, World Scientific (1984).[32] P. Frojdh, M. Howard, and K. B. Lauritsen, Int. J. Mod.
Phys. 15, 1761 (2001), and references therein.[33] R. Dickman and D. ben-Avraham, Phys. Rev. E 64,
020102R; R. Dickman and D. ben-Avraham, eprintcond-mat/0304292.
[34] I. Jensen, Phys. Rev. Lett. 77, 4988 (1996).[35] P. Grassberger, Comput. Phys. Commun 147 (1-2), 64
(2002).[36] H. Hinrichsen and H. M. Koduvely, Eur. Phys. J. B 5,
257 (1998).[37] K. Oerding and F. van Wijland, J. Phys. A 31, 7011
(1998).[38] For a review see S. N. Majumdar, Current Science 77,
370 (1999).[39] J.-P. Bouchaud and A. Georges, Phys. Rep. 195, 127
(1990).[40] I. Jensen, Phys. Rev. Lett. 70, 1465 (1993).