A modern epidemic: Expert perspectives on obesity and ...
557
-
Upload
khangminh22 -
Category
Documents
-
view
2 -
download
0
Transcript of A modern epidemic: Expert perspectives on obesity and ...


A modern epidemicExpert perspectives on obesity and diabetes
Edited by Louise A Baur, Stephen M Twiggand Roger S Magnusson

Copyright
Published 2012 by Sydney University Press
SYDNEY UNIVERSITY PRESSUniversity of Sydney Librarysydney.edu.au/sup
© Louise A Baur, Stephen M Twigg and Roger S Magnusson 2012© Individual contributors 2012© Sydney University Press 2012
Reproduction and Communication for other purposes
Except as permitted under the Act, no part of this edition may be reproduced, stored in a retrievalsystem, or communicated in any form or by any means without prior written permission. Allrequests for reproduction or communication should be made to Sydney University Press at theaddress below:
Sydney University PressFisher Library F03University of Sydney NSW 2006 AUSTRALIAEmail: [email protected]
National Library of Australia Cataloguing-in-Publication entry
Title: A modern epidemic: expert perspectives on obesity and diabetes / editedby Louise A. Baur, Stephen M. Twigg and Roger S. Magnusson.
ISBN: 9781920899851 (pbk.)Notes: Includes bibliographical references and index.
Subjects: Obesity--Social aspects.Diabetes--Social aspects.Health--Social aspects--21st Century.
iv

Other Authors/Contributors:Baur, Louise.Twigg, Stephen M.Magnusson, Roger S.
Dewey Number: 362.196398
Book Project Manager Kerrie Legge Cover design by Miguel Yamin, University Publishing Service,the University of Sydney
Copyright
v

Contents
Copyright ivPreface viiiAbout the contributors xIntroduction xxi
The physiological level 11 The biology of weight control 3Amanda Sainsbury 32 The geometry of human nutrition 24Stephen J Simpson and David Raubenheimer 243 Insulin resistance pathogenesis in visceral fat and gut organisms 56Yan Lam, Connie Ha and Andrew Holmes 564 Pancreatic beta-cell failure in the pathogenesis of type 1 diabetes 85Alexandra Sharland 855 Pancreatic beta-cell failure in the pathogenesis of type 2 diabetes 107Jenny Gunton and Christian M Girgis 107
Specific risk groups and settings 1296 Gender and obesity 131Murray Fisher and Natalie Chilko 1317 Preventing chronic disease to close the gap in life expectancy for
Indigenous Australians 147Alan Cass, Paul Snelling and Alex Brown 1478 The case for and against the regulation of food marketing directed
towards children 159Bridget Kelly, Rohan Miller and Lesley King 1599 Benefits of developing a whole-school approach to health promotion 180Jenny O’Dea 18010 Health implications of overweight and obesity in children and
adolescents 196
vi

Shirley Alexander 19611 Child and adolescent obesity in Asia 209Mu Li and Michael J Dibley 209
Ethics, policy and regulation 23112 The ethical implications of intervening in bodyweight 233Stacy M Carter, Ian Kerridge, Lucie Rychetnik and Lesley King 23313 How law and regulation can add value to prevention strategies for
obesity and diabetes 253 253Roger S Magnusson 25314 Whole of society approaches to preventing obesity and diabetes 300 300Philayrath Phongsavan, Chris Rissel, Lesley King and Adrian Bauman 300
Treatment 31915 How self-perception, emotion and beliefs influence eating and
weight-related behaviour 321 321Brooke Adam and Elizabeth Rieger 32116 The role of physical activity in the prevention and treatment of
diabetes 335Klaus Gebel, Hidde P van der Ploeg, Maria Fiatarone Singh and Adrian
Bauman 33517 Nutrition therapy in the treatment of diabetes 366 366Jennie Brand-Mille and Geoffrey Ambler 36618 Current therapies and pharmacy programs for obesity and diabetes 385
385Carol Armour, Betty Chaar, Michael Murray, Geoffrey Ambler and Ines
Krass 38519 Diabetes healthcare strategies to cope with the growing epidemic 415
415Marg McGill and Jane Overland 41520 Managing diabetes complications in the clinical arena 431 431Stephen M Twigg, and Susan V McLennan 43121 Obesity treatment for adults, adolescents and children 455 455Ian Caterson, Nick Finer, Louise A Baur, and Kate Steinbeck 45522 A ‘cure’ for diabetes and its complications 489 489Kim Donaghue, Tony Keech, Maria Craig and Philip O’Connell 489
Index 513
Contents
vii

Preface
The start of 2012 is marked by the establishment of the Charles Perkins Centreat the University of Sydney, with Professor Stephen J Simpson as Academic Di-rector, to support research and education programs that will lead to real-worldsolutions for obesity, diabetes and cardiovascular disease. The centre is the resultof a remarkable conversation where groups of diverse researchers and educatorshave come together to consider how they might combine forces and contributereal-world solutions to mitigate the growing impacts of these chronic diseasesthat are of increasing global concern.
The conversation was stimulated in part by the commitment of the Uni-versity, with a A$95m grant from the Australian Government, to a A$395minfrastructure investment that will provide state-of-the-art education and researchfacilities that will serve the centre. The year 2011 was marked by some memo-rable milestones in support of this compelling vision. We broke ground on thenew 45,000 square metre building that will become the hub for the academicprogram, which is now under construction in a strategic position next to theRoyal Prince Alfred Hospital and Centenary Institute. We celebrated the saleof Picasso’s portrait of Marie-Thérèse Walter at Christie’s auction house. Thefunds (A$20.3m) generated through the generous act of an anonymous donorwill support chair appointments in disciplines supporting the academic program’sstrategic goals.
A series of workshops including ‘The mind-body interface’, ‘E-health andsocial media’, and ‘Corporate social responsibility and obesity, diabetes and car-diovascular disease’ have brought focus to the conversation in high priority areas.More than 300 academics worked together during the genesis of our centre, ledby Professor David Ian Cook with support from many, but especially from Pro-fessor Warwick Britton and Dr Mark Ainsworth. These researchers created thefirst draft strategic plan for what has become a truly Universitywide academicprogram – bringing together the excellence and breadth needed to realise an am-bitious and timely vision.
This volume is the product of the passion and commitment of the contribut-
viii

ing researchers to push forward the frontier of knowledge, and ensure the newknowledge impacts on the health and quality of life for individuals and our com-munities in the future.
Jill TrewhellaDeputy Vice-Chancellor (Research)
Preface
ix

About the contributors
Brooke Adam is clinical psychologist at the Boden Institute of Obesity, Nutri-tion, Exercise and Eating Disorders, the University of Sydney, where she is cur-rently working on an National Health and Medical Research Council (NHMRC)trial examining the efficacy of psychological treatment for obese patients. In ad-dition, Brooke is clinical psychologist at the Eating Disorders Day Program atRoyal Prince Alfred Hospital, Sydney. Brooke has a strong research interest inobesity, as well as the psychological correlates between obese individuals and pa-tients with ‘traditional’ eating disorders.
Shirley Alexander is clinical lecturer with the Discipline of Paediatrics andChild Health, Sydney Medical School, the University of Sydney and a generalpaediatrician, currently working as a staff specialist in the Weight ManagementServices (WMS) at the Children’s Hospital at Westmead. The WMS is a mul-tidisciplinary service working with families of children and young people withoverweight and obesity. Shirley has published broadly on the topic of child andadolescent obesity and is a sub-editor for the Journal of Paediatrics and ChildHealth.
Geoffrey Ambler is paediatric endocrinologist and diabetologist at the Chil-dren’s Hospital at Westmead, where he is co-head of the Institute of Endocrinol-ogy and Diabetes. He is also a clinical professor at the University of Sydney. Hehas a longstanding clinical and research interest in insulin resistance and obesityas well as clinical management of type 1 and type 2 diabetes, particularly the useof insulin pump therapy and other new technologies.
Carol Armour is professor of pharmacology at the Woolcock Institute ofMedical Research, the University of Sydney. She is internationally recognised forher work in asthma research in terms of basic mechanisms of the disease and hashad continuous funding from the NHMRC since 1982. More recently she has de-veloped the evidence base for community pharmacy services in both asthma anddiabetes, and has been successful in receiving tenders to test the implementationof these services in primary care.
Adrian Bauman is Sesquicentenary Professor of public health (behavioral
x

epidemiology and health promotion) at the Sydney School of Public Health, theUniversity of Sydney. He is also director of the Prevention Research Collabora-tion and of the Physical Activity, Nutrition and Obesity Research Group, both atthe University of Sydney. Adrian is a world-renowned expert in physical activityand public health.
Louise A Baur is professor in the Discipline of Paediatrics and Child Health,Sydney Medical School, the University of Sydney, and also holds a conjointappointment as professor in the Sydney School of Public Health, where she isco-director of the Prevention Research Collaboration. She is a consultant paedia-trician and director of Weight Management Services at the Children’s Hospital atWestmead and Obesity team leader for the Charles Perkins Centre, the Universityof Sydney. Louise researches in the areas of the prevention of childhood obesity,the antecedents of obesity and the metabolic syndrome in childhood and adoles-cence, the complications of paediatric overweight and obesity, and the effectivemanagement of obesity and related disorders in a variety of clinical settings.
Jennie Brand-Miller AM is professor of human nutrition at the School ofMolecular Bioscience and the Boden Institute of Obesity, Nutrition, Exercise andEating Disorders, the University of Sydney. Jennie is currently a co-investigatoron several nationally competitive grants, including an NHMRC project grant toreduce the risk of adverse pregnancy outcomes in women with gestational dia-betes. She is a past president of the Nutrition Society of Australia and immediatepast chair of the National Committee on Nutrition of the Australian Academy ofScience.
Alex Brown is an Indigenous doctor and head of the Baker IDI Heart and Di-abetes Institute in Central Australia. He has developed a leading national profilein Indigenous cardiovascular and metabolic disease research and policy devel-opment. He is a chief investigator in the Kanyini Vascular Collaboration andrepresents Aboriginal issues on key national committees and forums includingthe National Aboriginal and Torres Strait Islander Health Equality Council.
Stacy M Carter is senior lecturer in qualitative research in health at theSydney School of Public Health, the University of Sydney and the Centre forValues, Ethics and the Law in Medicine, the University of Sydney. Stacy’s ex-pertise is in qualitative methodology and the ethics of public health, especiallyhealth promotion. Together with Lucie Rychetnik and Ian Kerridge, she is cur-rently researching how health promotion professionals across NSW intervene inpopulation weight. Stacy was the inaugural academic coordinator and directorof the Master of Qualitative Health Research program at the University of Syd-ney, the first of its kind in Australia. She held a University of Sydney ThompsonFellowship in 2011, and holds an NHMRC Career Development Fellowship(2012–2015).
Alan Cass is senior director of the Renal and Metabolic Division at theGeorge Institute for Global Health and a professor at the Sydney Medical School,
About the contributors
xi

the University of Sydney. He is a chief investigator in the Kanyini Vascular Col-laboration and holds a National Health and Medical Research Council PrincipalResearch Fellowship. He undertakes clinical research, intervention research inAboriginal health, studies of the economic burden of chronic disease and imple-mentation research focusing on translating research evidence into practice. Heregularly works with governments and NGOs to develop strategies for chronicdisease prevention and management.
Ian Caterson is currently Boden Professor of Human Nutrition and foun-dation director of the Boden Institute of Obesity, Nutrition, Exercise and EatingDisorders, the University of Sydney. He has had a long interest and involvementin the causes, prevention and management of obesity. He has been involvedin many prevention initiatives, including government committees and groupsdealing with obesity. He has received funding from the NHMRC and other gov-ernment agencies for many clinical trials.
Betty Chaar is lecturer in pharmacy practice and professional ethics at theFaculty of Pharmacy, the University of Sydney. Her publications and ongoingresearch are in the areas of pharmacy practice, moral reasoning, ethical decision-making, professional ethics in practice, misconduct, and ethics in the context ofthe practice in pharmacy, as well as the pharmaceutical industry. Her interestin obesity and weight management is from a community pharmacy perspective.She has investigated the types of services offered in pharmacy, what pharmacistswould like to offer and what evidence there is for effectiveness. She is currentlyworking with the Boden Institute of Obesity, Nutrition, Exercise and Eating Dis-orders, the University of Sydney in this area.
Natalie Chilko is research assistant at the Sydney Nursing School, theUniversity of Sydney, and at the Dementia Collaborative Research Centre, theUniversity of New South Wales. Natalie’s research interests include obesity,healthy ageing, and the behavioural and psychological symptoms of dementia.
Maria Craig is paediatric endocrinologist at the Children’s Hospital atWestmead and St George Hospital, associate professor at the School of Women’sand Children’s Health, University of New South Wales and associate professor inthe Discipline of Paediatrics and Child Health, Sydney Medical School, the Uni-versity of Sydney. Her main research focus is childhood diabetes, including epi-demiology, evidence-based medicine, the association between enteroviruses anddiabetes, and microvascular complications. She holds an NHMRC career devel-opment award. She was co-chair of the NHMRC-approved Australian NationalEvidence Based Clinical Practice Guidelines for Type 1 Diabetes in Children,Adolescents and Adults (2011).
Michael J Dibley is a nutritional epidemiologist and associate professor ininternational public health at the Sydney School of Public Health, the Universityof Sydney. Over the last 20 years, Michael has explored the ‘double burden ofunder and over nutrition’ found in many countries in the Asia-Pacific region. In
About the contributors
xii
Vietnam and China he has collaborated on research assessing the magnitude ofchildhood and adolescent obesity, and investigated a wide range of environmen-tal, social and behavioural risks factors associated with excess weight gain. He iscurrently participating in a cohort study of 800 adolescents in Ho Chi Minh City,Vietnam, which is examining the role of diet, physical activity and environmentalchange on the risk for adolescent overweight and obesity.
Kim Donaghue holds a conjoint appointment as professor in the Disciplineof Paediatrics and Child Health, Sydney Medical School, the University of Syd-ney, and senior staff endocrinologist at the Children’s Hospital at Westmead.She is co-head of Institute of Endocrinology and Diabetes and Head of DiabetesServices which also coordinates paediatric diabetes outreach services in ruralNSW. Her major research interest is evidence-based medicine, and preventionof diabetes and its complications. She is editor of the 2012 Global IDF/ISPADGuideline for Diabetes in Childhood and Adolescence. She served as FoundationChair of Education and Training for Australasian Paediatric Endocrine Group in2006–10.
Maria Fiatarone Singh holds the John Sutton Chair of Exercise and SportsScience at the Discipline of Exercise and Sports Science, Faculty of Health Sci-ences, the University of Sydney, and is professor of medicine at the SydneyMedical School, the University of Sydney. She is convenor of Exercise, Healthand Rehabilitation Faculty Research Group and also director of the Exercise Di-vision at the Boden Institute of Obesity, Nutrition, Exercise and Eating Disorders,the University of Sydney.
Nick Finer is consultant in obesity medicine at University College Hospital,London and a member of the Vascular Physiology Unit at Great Ormond StreetHospital for Sick Children. He is honorary professor in the Department of Med-icine, University College London, visiting professor at the University of Sydneyand Robert Gordon University, Aberdeen. Nick chairs the International Associ-ation for the Study of Obesity Education and Management Task Force, is pastchair of the UK Association for the Study of Obesity and editor-in-chief of Clin-ical Obesity. His research focuses on clinical aspects of obesity and associatedendocrine disease.
Murray Fisher is associate professor and director of Preregistration Pro-grams in the Sydney Nursing School, the University of Sydney. Murray is cur-rently the chief investigator on a number of research projects investigating therelationship of masculinity to men’s health. Murray has an extensive publicationsrecord and has contributed to committees of professional organisations anddiscipline-specific regulatory bodies.
Klaus Gebel is research associate at the Sydney School of Public Health,the University of Sydney. He has master degrees in exercise science from theGerman Sport University Cologne and Victoria University, Melbourne, where hespecialised first on exercise for rehabilitation and then on physical activity and
About the contributors
xiii

public health. From 2005 to 2009 he did his PhD at the Sydney School of PublicHealth, the University of Sydney. Klaus has studied and worked at six univer-sities in three countries and has received multiple scholarships and awards. Hismain research interests are in environmental determinants of physical activity andobesity and in the health benefits of physical activity.
Christian M Girgis received his graduate medical qualifications in 2004from the University of New South Wales. He is currently in his final year ofadvanced physician training in the field of endocrinology and has recently com-menced postgraduate studies in insulin resistance and vitamin D at the GarvanInstitute of Medical Research, Sydney. He is a PhD student in the Sydney Med-ical School, the University of Sydney.
Jenny Gunton is the head of the Diabetes and Transcription Factors Groupat the Garvan Institute of Medical Research, Sydney. The main interest of her labis beta-cell function. She is also an endocrinologist at Westmead Hospital. She isthe current vice-president of the Australian Diabetes Society. Jenny is a conjointsenior lecturer in the Sydney Medical School, the University of Sydney.
Connie Ha is a PhD candidate in the School of Molecular Bioscience, theUniversity of Sydney. She has been investigating the diversity of gut microbialcommunity under the supervision of Associate Professor Andrew Holmes. Con-nie is currently researching the dietary factors that promote changes in the gutmicrobiota and the role of diet responsive microbes in host health.
Andrew Holmes is associate professor in microbiology in the School ofMolecular Bioscience, the University of Sydney. His research interests revolvearound applied microbial ecology with particular emphasis on the developmentof tools to enable management of the gut microbial ecosystem for health. He wasthe recipient of the 2006 Fenner Prize from the Australian Society for Microbi-ology. He is currently an editor of Microbiology, and a member of the editorialboards of Applied and Environmental Microbiology and The ISME Journal.
Tony Keech is professor of medicine, cardiology and epidemiology in theSydney Medical School, the University of Sydney. He is consultant cardiologistat Royal Prince Alfred Hospital, Sydney, Principal Research Fellow of theNHMRC, and deputy director of the NHMRC Clinical Trials Centre. He is an ex-pert in clinical trials research and has been involved in many large randomisedtrials undertaken in cardiovascular disease treatment and prevention. Impacts onclinical practice of his trials have been particularly important in treatments foracute myocardial infarction and lipid management to reduce morbidity and com-plications in type 2 diabetes mellitus.
Bridget Kelly is research dietitian in the Prevention Research Collaboration,the Sydney School of Public Health, the University of Sydney with both researchand teaching responsibilities in public health nutrition. Her research focuses onthe development of public policy to support healthy eating, in particular on foodmarketing and its effect on childhood weight and obesity.
About the contributors
xiv

Ian Kerridge is director and associate professor in bioethics at the Centrefor Values, Ethics and the Law in Medicine, the University of Sydney and staffhaematologist/bone marrow transplant physician at Royal North Shore Hospital,Sydney. He has published widely in ethics and medicine/haematology and is theauthor of over 150 papers in peer-reviewed journals and five textbooks of ethics,most recently Ethics and law for the health professions (Federation Press, 2009).He is chair of the Australian Bone Marrow Donor Registry Ethics Committeeand a member of the NSW Health Department’s Clinical Ethics Advisory Panel.His current research interests include the philosophy of medicine, public healthethics, evidence-based medicine, stem cells, end-of-life care, synthetic genomics,identity formation in illness, research ethics, organ donation and transplantation,and the pharmaceutical industry.
Lesley King is adjunct senior lecturer in the Prevention Research Collab-oration, the Sydney School of Public Health, the University of Sydney, andthe executive officer of the NSW Physical Activity Nutrition Obesity ResearchGroup (PANORG) funded by NSW government to undertake policy-relevantresearch. Lesley has expertise in health promotion, chronic disease preventionand public health policy, with a focus on the design and implementation ofcommunity-based programs, and the dissemination of research into policy andpractice. Lesley has had prior experience as a senior manager of health promotionin government and non-government organisations. She has published academicpapers on topics related to obesity prevention.
Ines Krass is professor in pharmacy practice at the Faculty of Pharmacy,the University of Sydney. Her research has focused on disease state management,screening and health promotion, and quality use of medicines in diabetes, asthmaand cardiovascular disease. She has built a worldwide reputation in health ser-vices research in community pharmacy evidenced through significant compet-itive funding success, an extensive publication record, visiting professorships,invitations to speak at national and international conferences and contribute tosubject reviews.
Yan Lam is Postdoctoral Research Fellow in the Boden Institute of Obesity,Nutrition, Exercise and Eating Disorders, the University of Sydney. Yan iscurrently undertaking an NHMRC-funded project which investigates the relation-ships between gut health, visceral fat inflammation and metabolic dysfunction.Yan has a unique background having trained in both clinical nutrition, and basiccell and molecular biology, which underpins both basic research into mechanismsof disease and translational work into the clinical setting.
Mu Li is associate professor in the Sydney School of Public Health, theUniversity of Sydney. Mu’s research interests include micronutrient deficienciesdisorders, international program evaluation and childhood obesity. Mu is cur-rently a co-chief investigator of a study in China to investigate the feasibility andacceptability of using mobile phone short messages to promote breastfeeding and
About the contributors
xv

healthy infant feeding in new mothers, in order to prevent early childhood obe-sity.
Roger S Magnusson is professor of health law and governance at the Syd-ney Law School, the University of Sydney. His research interests are in publichealth law and governance, health law and bioethics, global health and health de-velopment. His publications include Angels of death: exploring the euthanasiaunderground (Melbourne University Press, 2002) which reported on the practiceof illicit, physician-assisted suicide and euthanasia among health professionalsworking in HIV/AIDS healthcare. His current research focuses on the opportuni-ties for law and regulation in responding to chronic, non-communicable diseases,including those caused by tobacco use, obesity and poor diet.
Marg McGill is adjunct associate professor at the Sydney Medical School(Central Clinical School) and the Sydney Nursing School, the University of Syd-ney. She was appointed Australia’s first paediatric diabetes educator in 1978.She has been manager of the Diabetes Centre at Royal Prince Alfred Hospital,Sydney for more than two decades. Marg was elected vice-president of the Inter-national Diabetes Federation (IDF) in 2003 and was senior vice-president from2006 to 2009. She was chair of the IDF Consultative Section on Diabetes Educa-tion (DECS) for nine years. During this time she made significant contributionsto improving the status of diabetes education as a profession as well as develop-ing initiatives to assist in building the skills of physicians and health professionalsworking in diabetes care globally. Her clinical and research interests and publica-tions are focused on the assessment and management of diabetic complications.She was named in the 2011 Australia Day Honours List with the award of Mem-ber of the Order of Australia (AM) for her contribution to diabetes nationally andoverseas.
Susan V McLennan is principal hospital scientist at Royal Prince AlfredHospital, Sydney and associate professor in medicine at the Sydney MedicalSchool, the University of Sydney. Her principal area of expertise is the role of theMMP/TIMP system in extracellular matrix turnover, with a focus in diabetes onmicrovascular complications, liver disease, cardiomyopathy and wound healing.She has been investigating the role of the MMP/TIMP system in regulation of fi-brosis, including the effects of high glucose and advanced glycation regulation ofextracellular matrix turnover in diabetic kidney disease, and the development ofmethods for the collection of fluids from human diabetic wounds to study bacte-rial growth and wound fluid MMP concentrations. Susan is a basic scientist whois committed to linking clinical and laboratory based research in order to rapidlyprogress from bench to bedside.
Rohan Miller is senior lecturer in marketing and marketing communicationsin the University of Sydney Business School. He was formerly an an advertisingpractitioner and now consults to industry, government and peak industry groups.Rohan’s research investigates negative effects of consumption, advertising to
About the contributors
xvi

children, and public policy.Michael Murray is professor of pharmacogenomics at the Faculty of Phar-
macy, the University of Sydney. After a postdoctoral period at Cornell Uni-versity, US he returned to Westmead Hospital, was appointed as an NHMRCResearch Fellow in 1987, and was promoted in 1989 and 1994 to Senior andPrincipal Research Fellow, respectively. In 1995 he received a DSc from the Uni-versity of Sydney. Michael is the author of 168 publications and has presented 70symposia and seminars. In 2002 he was the ASCEPT visitor to the British Toxi-cology Society.
Philip O’Connell is clinical professor of medicine, the University of Sydneyat Westmead Hospital. He is director of transplantation and medical director ofthe National Pancreas Transplant Unit. Philip is co-chief investigator on a numberof national and internationally competitive reseach grants, including grants fromthe NHMRC and the NIH. He is a chief investigator on an NHMRC programgrant for the prevention and cure of type 1 diabetes. His major research interest isin islet transplantation and he is director of the Australian Islet Transplant Con-sortium which has introduced clinical islet transplantation for selected patients inAustralia with type 1 diabetes.
Jenny O’Dea is a dietitian, health and nutrition education researcher andprofessor in nutrition and health education in the Faculty of Education andSocial Work, the University of Sydney. Jenny is currently working on two largeAustralian Research Council studies investigating body image, weight issues,self-concept, self-esteem, and eating issues. Jenny is well known for her contri-butions to the international media and public debate about food, nutrition, bodyimage, obesity and has authored many scientific research publications as wellas five books including Everybody’s different: a positive approach to teachingabout health, puberty, body image, nutrition, self-esteem and obesity prevention(ACER Press, 2007) and Childhood obesity prevention: international research,controversies and interventions (Oxford University Press, 2010).
Jane Overland is clinical associate professor at the Sydney Nursing School,the University of Sydney. She has worked in chronic disease management forover 20 years and she speaks widely in the area of diabetes and healthcare de-livery to a range of healthcare professionals, both nationally and internationally.She is an active researcher, attracting over $500,000 in research grants during hercareer and successfully publishing in a range of peer-reviewed journals. She hasacted as a consultant to both government and non-government health related bod-ies. She has also successfully supervised postgraduate students from a variety ofhealth-related faculties.
Philayrath Phongsavan is senior lecturer with the Prevention ResearchCollaboration, the Sydney School of Public Health, the University of Sydney.Philayrath’s research specialises in social epidemiology, behavioural science,and disease prevention and health promotion program evaluation. Her other re-
About the contributors
xvii
search interest is evaluating the impact of redesign of urban public open spaces insocially disadvantaged areas and the effect on residents’ physical activity behav-iour, obesity, and sense of community and safety.
David Raubenheimer is professor of nutritional ecology at the Institute ofNatural Sciences, Massey University, Auckland, New Zealand. Born in SouthAfrica, David was based at Oxford University for 16 years, where he obtained hisDPhil, before moving to New Zealand in 2004. In a long-term collaboration withStephen J Simpson, David has developed the geometric framework for nutrition,and used it to address a wide range of problems in biology. His current researchfocus is on developing nutritional geometry for use in field studies, an extensionthat is being applied to a range of study systems spanning marine fish, birds, dol-phins, large predators (tigers and snow leopards) and primates including humans.David has been Visiting Fellow at the Smithsonian Institute, a Fellow of the Insti-tute for Advanced Study (Wissenschaftskolleg) in Berlin, distinguished lecturerin behavioural and brain sciences at Cornell University, Fellow at the Institute forAdvanced Study in Oslo, and Visiting Research Fellow at the University of Syd-ney. He heads the Nutritional Ecology Research Group at Massey University, andis senior associate member of the New Zealand Institute for Advanced Study.
Elizabeth Rieger is associate professor and clinical psychologist in the De-partment of Psychology, Australian National University. Elizabeth has publishedwidely in the area of eating and weight disorders, and is currently chief investi-gator on a randomised controlled trial funded by the NHMRC to investigate theeffectiveness of motivational enhancement therapy for obese patients and theirsupport network.
Chris Rissel is professor of public health at the Prevention Research Collab-oration, the Sydney School of Public Health, the University of Sydney. His mainresearch interests focus on obesity prevention and active travel, particularly cy-cling advocacy. He is one of the authors of the national report ‘Cycling: gettingAustralia moving. Barriers, facilitators and interventions to get more Australiansphysically active through cycling.’ He has just completed a three-year grant topromote increased use of cyclepaths in south-west Sydney – ‘Cycling connectingcommunities’, and is currently involved in an ARC grant looking at safer cycling.
Lucie Rychetnik is Senior Research Fellow at the Sydney School of PublicHealth, the University of Sydney. Her main areas of interest and expertise arethe appraisal, translation and application of evidence for public health and healthpromotion policy and practice. From 2000 to 2009 Lucie was senior associateat the Sydney Health Projects Group (SHPG), an academic consulting group inthe Sydney School of Public Health, the University of Sydney whose primaryrole was to translate research evidence for a wide range of public health policyand practice settings. She joined the School of Public Health, Screening and TestEvaluation Program (STEP) in September 2009, where she primarily conductsqualitative research to complement and enhance the established program of quan-
About the contributors
xviii
titative research. In March 2010 she joined the Centre for Values, Ethics and theLaw in Medicine (VELIM), the University of Sydney as chief investigator on anNHMRC project – ‘Reconceptualising health promotion: the role of values, ethicsand evidence in obesity intervention’. Prior to completing her MPH (1996) andPhD (2001) she worked in the health sector as a clinical dietitian and commu-nity nutritionist in Oxford, London and Sydney, and as a health promotion officerwith the (then) Southern Sydney Area Health Service.
Amanda Sainsbury is conjoint associate professor in the Sydney MedicalSchool, the University of Sydney. She leads a research team at the Garvan Insti-tute of Medical Research, Sydney investigating how the brain and diet interactto control body weight and body composition. Her research is funded by a Ca-reer Development Award and competitive grants from the NHMRC, and spansstudies with transgenic mice to randomised controlled clinical weight-loss trialsin humans. Amanda disseminates her research findings to the wider communityby lecturing to students in science, medicine, nursing and human movement, andshe has authored two books and given seminars on weight management for healthprofessionals and the public.
Alexandra Sharland is senior lecturer in transplantation immunobiologyin the Collaborative Transplantation Research Group, the University of Sydney.Her research encompasses innate immunity and inflammation in brain death andischaemia-reperfusion injury, autoimmunity, and the mechanisms by which thesefactors promote transplant rejection and interfere with the development of trans-plantation tolerance. She is a former councillor of the Transplantation Society ofAustralia and New Zealand, and chair of the TSANZ Scientific Advisory Com-mittee.
Stephen J Simpson is the Academic Director of the Charles Perkins Centreand an Australian Research Council Laureate Fellow in the School of BiologicalSciences, the University of Sydney, having returned to Australia in 2005 as anARC Federation Fellow after 22 years at Oxford where he was professor of en-tomology and curator of the University Museum of Natural History. Stephen haspioneered developments at the interface of nutritional physiology, ecology, andbehaviour. Together with David Raubenheimer, he developed state-space mod-els for nutrition (the geometric framework), which were devised and tested usinginsects but have since been applied to a wide range of animals and problems,from aquaculture and conservation biology to the dietary causes of human obe-sity. His research on locusts has led to an understanding of locust swarming thatlinks chemical events in the brains of individual insects to landscape-scale massmigration. Stephen has been visiting professor at Oxford, a Fellow of the Institutefor Advanced Study (Wissenschaftskolleg) in Berlin, Distinguished Visiting Fel-low at the University of Arizona, and guest professor at the University of Basel.In 2007 he was elected a Fellow of the Australian Academy of Science, in 2008he was awarded the Eureka Prize for Scientific Research, in 2009 he was named
About the contributors
xix

NSW Scientist of the Year, and in 2010 he was named as the WigglesworthMedallist by the Royal Entomological Society of London.
Paul Snelling is senior staff specialist in nephrology at Royal Prince AlfredHospital, Sydney. He has extensive experience in renal service delivery to Indige-nous Australians and was previously director of Renal Services in the NorthernTerritory. He provides crucial clinical input and understanding to a broad rangeof Aboriginal health and kidney health research programs and has worked closelywith government in the development of strategies for renal service provision.
Kate Steinbeck is the Medical Foundation Chair of Adolescent Medicine,the University of Sydney and is an adolescent endocrinologist and physician. Shehas significant experience in the management of secondary obesity, includingpost-craniopharyngioma obesity and the Prader-Willi syndrome. Her researchinterests include the longitudinal effects of puberty hormones on weight andbody composition, and obesity management in the transition from adolescence toyoung adulthood.
Stephen M Twigg is professor in medicine at the Sydney Medical School,the University of Sydney, Diabetes theme leader for the Charles Perkins Centre,the University of Sydney, and deputy head of Department of Endocrinology andmedical head of the Endocrinology Research Laboratories at Royal Prince AlfredHospital, Sydney. His research focuses on the prevention and management of di-abetes complications including pathogenic growth factors and tissue fibrosis, aswell as optimisation of quality and length of life in people with diabetes. As aphysician-scientist, he is dedicated to optimising healthcare delivery in diabetes,finding scientific solutions to the medical problems related to diabetes and itscomplications, and mentoring and training advanced clinical trainees in clinicalskills, and laboratory students and fellows in the scientific method. He is the im-mediate past president of the Australian Diabetes Society, and a past honoraryboard member of Diabetes Australia.
Hidde P van der Ploeg is Senior Research Fellow in the Sydney Schoolof Public Health, the University of Sydney. He has a masters degree in humanmovement science, a postgraduate degree in epidemiology and a PhD in physicalactivity and public health, all from the Vrije Universiteit Amsterdam in theNetherlands. His main research interest is in the development and evaluation ofphysical activity programs for people with chronic disease.
About the contributors
xx

Introduction
In 2006, Sydney University Press and Sydney University Research Portfolio be-gan a collaboration to produce a series of books containing multidisciplinaryperspectives on issues of global importance. Because diabetes, obesity and theirrelated diseases place a high burden on individuals, the community and thehealthcare system, this topic was an obvious choice for the second book in thisseries. In this book, researchers and clinicians from the University of Sydney andbeyond have joined forces to tackle this major health challenge.
Type 2 diabetes and obesity share common risk factors, including insuffi-cient physical activity, and the over-consumption of energy-dense, nutrient poorfoods. Obese individuals are at an increased risk of developing chronic healthproblems including cardiovascular disease and type 2 diabetes. These diseases arenot just problems for the individual, but create psychological and relational prob-lems within families, reflect environmental problems within communities, andultimately carry economic consequences for entire nations. The solutions, there-fore, need to be equally wide-ranging, and accessible to all.
As well as affecting the adult population, obesity and diabetes are increas-ingly seen in childhood and adolescence. Obesity is associated with a range ofpsychosocial problems such as depression and low self-esteem, and discrimina-tion. Often an individual does not perceive their weight accurately and tends toeither over- or underestimate it. However the solutions to the diabetes and obesityepidemic require more than just changes in the perceptions and behaviours of in-dividuals. Obesity and diabetes are environmental health problems and effectivesolutions will require policies that target the entire population, regardless of theircurrent health status. Cultural differences, food production and supply, urban de-sign and transportation are important factors to consider. In addition, new kindsof interventions will be needed in key settings including schools, workplaces, pri-mary healthcare, pharmacies and hospitals.
Acknowledging this, the authors write about risks, causes and consequences,as well as prevention and treatment: how to identify and mitigate the risk factors,deliver targeted and effective healthcare, and formulate national and global strate-
xxi

gies to ultimately turn the tide on some of the 21st-century’s most devastatingdiseases. Contributors to this book are necessarily diverse and include endocri-nologists, pharmacists, haematologists, biologists, paediatricians, psychologists,health policy experts, lawyers, nutritional scientists, nurses, health promotion ex-perts, exercise and sports scientists, and dietitians. By drawing from a range ofspecialties these authors present new insights and hope to present a more holisticunderstanding of the challenges faced by individuals and societies.
This book brings together new research in obesity and diabetes from a rangeof perspectives. Drawing from the fields of medicine, the biological sciences,health science, business, law, social sciences, pharmacy, education and nursing,the authors first define the nature and scale of the obesity and diabetes crisis, andthen explore possible solutions. In the first section, researchers explore the prob-lems of obesity and diabetes at the cellular or physiological level. The issues thatthese conditions raise are not the same for everyone. Hence, in the second section,the authors turn to specific risk groups and settings. The third section considersoptions for regulatory approaches as well as the ethics of policy interventions. Fi-nally, in section four, researchers discuss treatment, prevention and managementstrategies for both diseases.
Some important findings presented in the book include the following:
• Healthy behaviours established in young people tend to translate into healthyhabits in adulthood, which are subsequently modelled and passed on to the fol-lowing generations.
• Eating according to hunger results in loss of excess weight.• An individual genetically predisposed to obesity requires an obesogenic diet in
order to manifest the genetic blueprint via gene-environment interactions. Epi-genetics suggests that obesogenic diets not only render individuals incapableof losing excess weight, but may also have adverse impacts on the health offuture generations.
• Discrimination against obese individuals is evident in all areas of life includ-ing social life, parenting practices, education, employment and healthcare. Thestress which obese individuals are exposed to as a result of negative societalattitudes and behaviours can lead to further weight gain, and worse health out-comes.
• Regular physical activity and exercise, independent of weight loss, are ef-fective in both prevention and treatment of diabetes. Prolonged sitting timemight be associated with the risk of developing type 2 diabetes, independentof leisure-time physical activity.
• Obesity is linked to changes in the nutritional balance of our diet, with a pri-mary role for protein appetite driving excess energy intake. Small changes inthe percentage of protein in the diet can potentially yield big effects on intake,with consequences – both good and bad – for weight management.
• In considering approaches to the prevention of obesity, there are distinct and
Introduction
xxii

overlapping ethical concerns at both individual and population levels; at bothlevels moral compromise is necessary.
• School-based health promotion programs can have a positive and lastingimpact on body image, eating behaviours, attitudes, and the self-image ofadolescents. So promoting a healthy body image, establishing positive foodhabits and encouraging involvement in sport and physical activity at schoolcan be catalysts for behavioural changes to improve health globally and reducehealthcare costs.
• Diabetes complications occur to some degree in practically every person whodevelops diabetes, although severe complications occur in only a minority.Because it has a high prevalence in Australia however, diabetes is the sin-gle commonest cause of endstage kidney disease and the commonest cause ofworking-age blindness. Evidence from clinical trials indicates that by usingcurrent healthcare and therapy standards, much can be done to prevent the on-set and progression of diabetes complications. Prospective therapies to preventand treat complications in diabetes include the agent fenofibrate and stem cellsto treat diabetes and the organ affected by complications.
• A considerable body of evidence highlights the significant adverse health-related impact of childhood and adolescent obesity. Moreover, childhoodobesity may track into adulthood, with further increased obesity-related mor-bidity and mortality.
• Organised high-quality diabetes care needs to be accessible and affordable toan increasing number of people with diabetes. Community pharmacists are avaluable resource of trained healthcare professionals that can be utilised toprovide prevention and care services as part of an integrated primary care sec-tor approach.
• Childhood obesity has become a major public concern in developing countrieswhere the absolute number of children who are overweight or obese is nowmuch higher than in developed countries.
• A holistic approach that considers how an individual configures their mas-culinity or femininity may assist in promoting and maintaining weight loss inobese individuals as it addresses the struggle in society experienced by manyobese people. Weight-loss approaches that recognise the individual strugglewith gender and the influence of other social structures may be an alternativeto current, largely unsuccessful treatments of obesity.
• While weight loss can be achieved, the major issue in the treatment of obesityremains weight maintenance. Those individuals who lose weight and suc-cessfully keep it off undertake lifestyle changes that includes high levels ofphysical activity, eating breakfast and regular meals, and a diet that is low infat. Self-monitoring is an important way of catching ‘slips’ early and correct-ing them.
• Promising societal and environmental responses to overweight and obesity in-
Introduction
xxiii

clude redesigning the built environment, providing active transport options,promoting the availability and accessibility of healthy food choices, restrictingpromotion of unhealthy foods, and implementing ongoing social marketingstrategies to influence sustained healthy eating and physical activity behav-iours. Achieving these things is a massive challenge. Government leadership,social planning and urban renewal that engages communities, businesses andother relevant stakeholders are fundamental to the process.
Editors: Louise A Baur, Stephen M Twigg and Roger S MagnussonBook Project Manager: Kerrie Legge
Introduction
xxiv

The physiological level


1The biology of weight control
Amanda Sainsbury1,2,3
Many clinical and commercial weight-loss programs use external controlssuch as kilojoule allowances to reduce energy intake. While this results inweight loss, it is not necessarily suitable for people prone to disorderedeating, nor is it feasible for public health initiatives opposing obesity. Inthis chapter I cover the endogenous biological systems that enable humansto attain and maintain a healthy body weight – without kilojoule count-ing – and how genetic variations and our obesogenic environment cancompromise them. These endogenous weight-control mechanisms allow in-dividuals who don’t respond well to external controls about how much toeat, to lose excess weight and keep it off, provided that the endogenous sig-nals are heard and heeded, and the environment is conducive to doing so.These mechanisms are also suitable for community interventions.
When it comes to losing excess weight, many people utilise methods such as‘kilojoule counting’ and weighing or measuring portion sizes in order to reducetheir energy intake. For people not inclined to count or measure their food, struc-tured programs are available that provide ‘pre-counted’ reduced energy intakes,such as specific diet menus, meal replacement programs and home-deliveredmeals. These are all examples of weight reducing diets in which energy intakeis externally prescribed. For many people, the clear directives about what andhow much to eat provided by such regimes impart knowledge about healthyfoods choices and reasonable portion sizes. This is particularly important in thecurrent obesogenic environment, where default food choices, portion sizes andthe physical environment have led many adults to become overweight or obese.Weight-loss programs with externally prescribed energy intakes have helped
1 Neuroscience Research Program, Garvan Institute of Medical Research, Sydney.2 Sydney Medical School, University of Sydney.
3 School of Medical Sciences, University of New South Wales.
3

many people to lose excess weight efficiently and – in a proportion of cases – sus-tainably. In fact, a recent study showed that a commercial weight-loss programinvolving food counting outperformed individualised attention from general prac-titioners in terms of helping overweight and obese adults to reduce body weightover a one-year period [1].
Despite their effectiveness for a proportion of people, weight-reducing dietswith externally prescribed energy intakes are not suitable for everyone. Examplesinclude people with higher or lower energy requirements than those stipulated bythe diet, or those prone to disordered eating. For these reasons, in addition to thehigh level of support required for adherence to such diets, they are not suitablefor community initiatives against obesity. In this chapter I explore an alternatesolution for weight management in these people, drawing on the function of bi-ological weight-control systems. Because these endogenous weight managementsystems appear to be intact in a significant proportion of people, they are poten-tially amenable to community-level interventions against obesity.
ONE SIZE NEVER FITS ALLMost clinical and commercial weight-loss programs use standardised energy in-takes, with some programs offering two or three options for people with loweror higher energy requirements (eg diets providing 1200, 1500 or 1800 kilocalo-ries per day). However, many people have energy requirements for weight lossthat are different from these standardised levels, at least at times, due to intra-and inter-individual variations in factors such as body size and composition, age,sex, physical activity levels, phase of the menstrual cycle, as well as prevailingclimatic conditions. This means that, for a proportion of people, weightreducingdiets with defined levels of energy intake are either ineffective or unsustainable,as outlined below.
When dietary energy intake is too highI found that in order to eat all of the allocated food on that diet’s menuplan, I was often eating when I wasn’t hungry, and I actually gained weight.(Maria, 49 years of age and 1.52 metres tall)
Losing body fat is a question of consuming less energy than the amount of energyused for basal metabolic processes, digestion, adaptive thermogenesis and physi-cal activity. Some people’s energy requirements are so low that even adherence toa 1200 kilocalorie per day diet will not result in weight loss. It is not uncommonto hear of people who started and apparently followed a weight-loss diet with adefined energy intake, only to achieve either very slow or no weight loss. While it
A modern epidemic
4

is often assumed that the person ‘must be doing something wrong’, the standard-ised energy intakes of many weight-loss diets can be too high to produce negativeenergy balance in people with low energy requirements, as in older women withlow muscle mass and a low level of physical activity, for example.
When dietary energy intake is too lowWith uni study, social life and trying to exercise regularly, it was not possi-ble for me to ‘diet’ and ‘live’ at the same time. (Sabrina, 21 years of age)
A more common limitation of weight-loss diets with standardised kilojoule al-lowances is that people with higher energy requirements – such as younger, largeror more active individuals – can be left with inadequate energy with which tolive full and active lives. A woman once told me that she often stopped going tothe gym when following a commercial weight-loss program because she felt shedidn’t have enough energy for the vigorous workouts she otherwise enjoyed. Thismay be due to physical and psychological effects.
Physical effects of energy deficitEnergy deficit is known to cause adaptive responses that inhibit ongoing weightloss and which promote fat regain [2]. Emerging evidence suggests that thegreater the deficit between energy requirements and intake, the greater the mag-nitude of these adaptive responses [3, 4, 5]. Such adaptations have been observedin overweight and obese humans and animals in response to even moderate en-ergy restriction, and include increased appetite, reduced energy expenditure [2],a possible reduction in spontaneous physical activity [2, 5, 6, 7, 8], and an increasein skeletal muscle work efficiency [9]. Additional adaptations include changesin endocrine status that would tend to promote the accretion of fat (particularlyvisceral fat) at the expense of muscle and bone, as recently reviewed [10]. Forinstance, energy deficit has been shown to decrease circulating levels of thyroidhormones, sex hormones, insulin like growth factor-1 and gut-derived satiety hor-mones such as peptide YY, in addition to increased circulating cortisol levels[10].
As larger energy deficits appear to induce stronger adaptive responses [3,4, 5], and as the magnitude of the deficit-induced increase in appetite [11, 12]or decrease in energy expenditure [11, 12, 13, 14] predicts subsequent weight re-gain, the widespread use of standardised energy intakes in weight-reducing dietscould be inadvertently promoting a situation where the large get larger. For in-stance, a 1500 kilocalorie per day diet would produce a greater energy deficit ina woman weighing 100 kgs than in a woman weighing 80 kgs, all other thingsbeing equal. As such, the more overweight woman could be expected to exhibit a
1 The biology of weight control
5

greater adaptive response to weight loss in response to the standardised diet, po-tentially putting her at greater risk of rebound weight gain.
Psychological effects of energy deficitAs well as having effects on physical predictors of weight regain, notably appetiteand energy expenditure, energy deficit affects psychological determinants offeeding behaviour. For instance, energy restriction in rodents up-regulates hypo-thalamic brain expression of dynorphins [
15,,
16], which are endogenous opioids
that induce dysphoria (an emotional state characterised by anxiety, depression,or unease). Moreover, blocking endogenous opioids with non-specific opioid an-tagonists such as naloxone or naltrexone has been shown to reduce binge-eatingbehaviour and food intake in bulimia nervosa [17] and in obese women [18]. Thesefindings suggest that energy deficit may be contributing to changes in the brainthat promote binge eating. In keeping with this, restricting energy intake to levelsdictated by external factors rather than physiological needs (as in dieting) con-tributes to binge eating and other eating disorders in some people. Indeed, 100%of patients with bulimia and anorexia nervosa have followed restrictive diets inthe past, and abstaining from such practices is part of the established treatmentfor eating disorders.
In light of the limitations of weight-reducing diets with standardised energyintakes, as well as the impracticality of determining energy requirements tailoredto the individual needs of millions of people who need to lose excess weight, whatare the alternatives?
TAPPING INTO BIOLOGICAL WEIGHT-CONTROLSYSTEMS FOR INDIVIDUAL AND COMMUNITY
SOLUTIONSMany members of the public and health practitioners alike do not realise thatmammals such as humans are equipped with physiological systems that enableindividuals to attain and maintain an optimum weight – without the need to fol-low externally prescribed kilojoule allowances – provided that the types of foodseaten are generally healthy, and provided that the endogenous hunger and satietysignals about when and how much to eat are heeded. In this and the next sec-tion I will outline how these physiological weight-management systems work,as well as the evidence that they function even in modern society, where thecurrent obesity epidemic might suggest otherwise. An advantage of tapping intothese endogenous weight-management systems is that they offer the potentialfor personalised solutions, where energy intake can be automatically matched tothe optimal level for weight loss in each individual every day, without the need
A modern epidemic
6

to measure actual energy requirements. These biological weight-control systemsare also amenable to community interventions against obesity because – whencombined with population-wide strategies facilitating healthy food and activitychoices – the associated public health message could be reduced to a single in-struction: eat according to your physical needs.
Pathways that prevent excessive weight gainWhen an individual consistently consumes a greater number of kilojoules thanthat which is used by the body, the result is storage of excess energy, predom-inantly in the form of triglycerides (fat) in white adipose tissue. When totalbody energy stores exceed the level that the body defends (often referred to asthe ‘set point’), physiological changes that promote restoration of the set pointensue. These changes include decreased appetite, increased physical activity, en-hanced energy expenditure and hormonal alterations, as evidenced below. Whilethe appetite-inhibiting effects of energy excess are easy to override, as describedlater in this chapter, research suggests that these adaptive responses to energy ex-cess occur nonetheless in up to 84% of individuals [19], making them potentialtargets for community-based interventions against obesity.
Positive energy balance reduces appetiteThe most obvious sign of the adaptive responses opposing excessive weight gainis a reduction in appetite. Anecdotally, many people notice this after a spate ofparticularly heavy eating or inactivity or both (eg after holiday overindulgences),when they may not feel as drawn to as abundant or as rich foods as usual. Thisphenomenon has been measured in clinical trials. When healthy young male vol-unteers were instructed to overeat by 4200 kilojoules (1000 kilocalories) a dayfor three weeks and were then asked to eat ad libitum, they voluntarily consumed2000 kilojoules (480 kilocalories) fewer per day than they were consuming beforethe experiment began [20]. Moreover, they voluntarily chose to eat foods thatwere lower in fat than those they normally ate [20]. Similar results have beenobserved in lean rodents, which exhibit spontaneous reductions in food intake inresponse to exposure to a high-fat diet [21], probably driven by changes in thehypothalamus of the brain as described below. Further research is required to de-termine whether the effect of short-term energy excess to inhibit appetite is alsoapparent in all people, particularly those who are overweight or obese, as a recentstudy has suggested that this response may be impaired in some [22].
Positive energy balance increases physical activityIn addition to reducing appetite, energy excess increases physical activity, the
1 The biology of weight control
7

amount of energy used to perform physical activity, or both [8, 9, 23], therebyhelping to allay fat accumulation. Lean volunteers were asked to overeat by4200 kilojoules (1000 kilocalories) each day for eight weeks [23]. They werespecifically instructed not to increase the amount of exercise they did during theexperiment, and they stringently maintained a low level of voluntary physical ac-tivity throughout the eight-week overfeeding period. Remarkably, the volunteersdisplayed a massive increase in non-exercise activities such as spontaneous mus-cle contractions, posture maintenance and fidgeting. In fact, the average increasein energy spent on these types of non-volitional physical activities – termed non-exercise activity thermogenesis, or NEAT – added up to 1425 kilojoules (340calories) a day. One volunteer even burnt up 2900 additional kilojoules (700 calo-ries) a day, which he achieved without meaning to by pacing for about 15 minutesof every waking hour. This spontaneous increase in the amount of energy ex-pended on physical activity in response to energy excess has been confirmed inother studies in humans [9]. It is a change that has been suggested to opposeweight gain, because spontaneous physical activity in mice and rhesus monkeysnegatively correlates with weight gain, consistent with human epidemiologicaldata [24]. Not only does energy excess increase the volume of physical activ-ity performed, it also appears to decrease muscle work efficiency in humans [9],thereby further increasing the amount of energy expended on physical activityand decreasing that available for storage.
Positive energy balance may increase energy expenditureIn addition to decreasing appetite and stimulating the amount of energy expendedon physical activity, some studies have shown that energy excess leads to an in-crease in total daily energy expenditure or basal metabolic rate in humans [22, 25,26, 27], albeit this has not been observed in all studies, as recently reviewed [28].Such a change would be expected to further increase energy dissipation and helpto prevent weight gain.
Neuroendocrine responses to positive energy balanceThe changes in food intake, physical activity and possibly also total energy ex-penditure that occur in response to energy excess are likely to be mediated byassociated effects on neuroendocrine status. For instance, feeding rodents a high-fat diet for eight weeks reduces expression of orexigenic peptides that promotefood intake, notably neuropeptide Y (NPY) [21]. As NPY has been shown tostimulate feeding, reduce physical activity and decrease metabolic rate [2], sucha change in its hypothalamic expression could contribute to effects of energy ex-cess on appetite, physical activity and energy expenditure.
While it is not possible to measure dynamic changes in hypothalamic peptide
A modern epidemic
8

expression in response to energy excess in humans, investigation of human bodyfluids or peripheral tissues provides indirect evidence of similar brain changes tothose that have been measured in rodents. For instance, overfeeding increases ac-tivity of both the hypothalamopituitary thyroid axis and the sympathetic nervoussystem in humans, as evidenced by measurements of serum thyroid hormone andcatecholamine levels [29] or muscle sympathetic nerve activity [30]. Both of thesechanges would be expected to result from decreases in orexigenic peptide ex-pression in the hypothalamus of the brain [10, 31], and could in turn contributeto the adaptive changes opposing weight gain in response to energy excess. Forinstance, induction of hyperthyroidism in rats leads to an increase in physical ac-tivity and NEAT [8, 32]. Additionally, thyroid hormones are classically knownfor their effect to stimulate energy expenditure by acting on peripheral tissues todirectly influence cellular metabolism [33], and they have recently been shownto act in the hypothalamus of the brain to stimulate sympathetic nervous activity[34], which in turn is known to stimulate energy expenditure [35].
Changes in gut hormone secretion could also contribute to the effects of en-ergy excess on energy intake and expenditure. Short-term energy excess in lean,overweight and obese males increases circulating concentrations of the gut-de-rived satiety hormone peptide YY (PYY) [36]. As PYY has been shown to reduceappetite and food intake in lean and obese humans and rodents [37, 38, 39], thischange could contribute to the associated reduction in appetite seen after energyexcess. Increased PYY levels could also contribute to observed increases in en-ergy expenditure during energy excess, since PYY has been shown to increaseenergy expenditure in lean and obese men [40], and to decrease energy efficiencyand increase core body temperature in rodents [41].
EVIDENCE THAT BIOLOGICALWEIGHT-CONTROL SYSTEMS CAN LEAD TO
LOSS OF EXCESS WEIGHTIn light of adaptive responses to energy excess such as those described above, itwould be expected that eating according to individual physical hunger and sati-ety signals would result in reversal of past overindulgences. Energy intake wouldbe reduced on account of the associated reduction in appetite, and increases inphysical activity levels or the energy cost of physical activity, combined with apossible increase in total energy expenditure, would further facilitate loss of ex-cess weight and restoration of the defended ‘set point’. But what is the evidencethat eating according to individual hunger and satiety cues – without external pre-scriptions on energy intake – does indeed result in loss of excess weight in lean,overweight and obese people?
1 The biology of weight control
9

Effectiveness of biological weight-control systems in leanpeople
In a classic overfeeding study [42], 12 pairs of lean young identical male twinswere instructed to stop exercising and to overeat by 4200 kilojoules (1000 kilo-calories) a day, six days a week, for 12 weeks. Every single man gained weightduring the study, with a mean weight gain of 8.1 kg. As might be expected basedon anecdotal observations that some people can ‘gain weight just by looking atfood’ and others ‘can eat anything they want and never gain weight’, the range ofweight gain was wide (4.3 to 13.3 kg), and there was a markedly greater similaritywithin each twin pair than among pairs with respect to weight gain. This findingshows that genetics play a significant role in determining the ability of endoge-nous weight-control systems to cope with energy excess. Intriguingly, despite thiswide range of weight gain among twin pairs, when the volunteers resumed theirregular lives at the end of the study, all of them spontaneously returned to withinone kilogram of their original weight within four months [42, 43]. This findingprovides indirect evidence that even those individuals with a genetic propensity togain the most weight during periods of energy excess can reverse those excessesby eating according to appetite, without the need for diets with an externally pre-scribed energy intake.
Similar spontaneous returns to initial body weight have been seen in menfrom Cameroun after four to six months of fattening by massive carbohydrateoverconsumption for the traditional Guru Walla session [44]. However, a recentstudy of 12 lean men and six lean women showed that a four-week period ofhyper-alimentation and limited physical activity resulted in increases in bodyweight and adiposity that were almost – albeit not completely – reversed within12 months of return to ad libitum food intake and usual activity patterns [22]. Itis thus likely that the homeostatic control mechanisms that contribute to reversalof energy excesses are not impervious, at least in some individuals.
Effectiveness of biological weight-control systems inoverweight and obese people
It might be expected that lean young men and women would reverse energyexcesses reasonably efficiently without the need for fixed energy intake prescrip-tions. However, evidence that homeostatic regulatory systems can also contributeto reversal of excess weight in overweight, obese or severely obese people comesfrom weight-loss studies involving ad libitum intake of a modified diet. Whenobese [45] or severely obese [46] men and women limited carbohydrate intakewithout restricting consumption of fat and protein, they lost at least as muchweight after six to 12 months (~4% to 7% of body weight) as people in a con-trol arm who consciously restricted total daily energy intake via calorie counting.Additionally, overweight or obese young men and women lost an average of
A modern epidemic
10

~5% of their body weight in a 12-week intervention involving the instruction to‘eat to appetite’, choosing from lists of appropriate meals and snacks that wouldresult in modification of glycaemic load and/or protein intake [47]. Similar ef-fects on body weight are seen when the fat intake of the diet is modified withoutprescribing energy intake [48]. Indeed, the Clinical Practice Guidelines for theManagement of Overweight and Obesity in Adults from the National Health andMedical Research Council (NHMRC) of Australia provides evidence that low-fatdiets consumed ad libitum can lead to weight and waist circumference losses of2– 6 kg and 2–5 cm after one year, and that these diets – if intensively monitored– may be more effective for maintaining weight loss than more prescriptive low-energy diets [48].
Potential significance for the treatment of overweight andobesity
It has been estimated that these endogenous weight regulatory mechanisms areeffective in up to 84% of people [19]. This number is derived from observationsthat up to 84% of people tested in several independent overfeeding studies gainedless weight than expected, indicating adaptive metabolic processes that dissipatedpart of the energy excess [19]. This means that for situations where rigid prescrip-tions of energy intake are impractical or contraindicated, it can still be possiblefor people to lose excess weight and keep it off, provided that endogenous sig-nals of hunger and satiety are heard and heeded, and provided that healthy foodsare easily accessible and chosen. Such situations include people who eat outsidethe home frequently or who have a propensity for disordered eating, as well asfor community interventions where it is unfeasible to mass-prescribe kilojouleallowances. There are, however, circumstances that appear to render these bio-logical weight-control systems ineffective, at least in some people, and these arediscussed below.
FACTORS THAT INTERFERE WITH BIOLOGICALWEIGHT-CONTROL SYSTEMS
There are multiple factors that interfere with the body’s innate ability to defenda healthy set point weight. These include congenital disorders associated with in-creased appetite, such as Prader Willi syndrome, or mutations of critical genesinvolved in the regulation of body weight, such as leptin, the leptin receptor orthe melanocortin 4 receptor. Additionally, certain medications such as cortisoland insulin can interfere with the function of endogenous weight-control systems,leading to increased hunger and weight gain unless energy intake is deliberatelyrestrained. In this section however, I will deal with two situations that threaten the
1 The biology of weight control
11

functionality of endogenous weight-control systems in the majority of – if not all– people living in obesogenic environments such as Australia. The first of theseinvolves situations that encourage people to eat when they are not hungry, andthe second involves the types of foods that are available to most people.
Environmental triggers for non-hungry eating
Availability of food in excessIn modern society, eating often occurs independently of biological hunger andsatiety signals. With so many delicious, varied and affordable foods and bev-erages readily available, how many people stop to question whether they arephysically hungry before hoeing in? We often eat irresistible foods at the momentthey are offered to us. I for one find it exceedingly difficult to save a biscuit, bunor chocolate for later if a colleague brings one to my office when I am not hungry.We often eat meals simply because it is mealtime, regardless of whether or notwe have an appetite. And people commonly eat out of pure boredom, joy or otheremotional triggers, even in the complete absence of physical hunger. These areall examples of non-hungry eating, an everyday occurrence for most people. Assuch, the ability of biological weight-control systems to work effectively is com-promised, even in people in whom the appetite-reducing effects of these systemsare perfectly functional.
In addition to increasing the number of eating and drinking episodes per day,our environment readily offers excessively large portions at each sitting, and thisappears to compromise the satiety signals that tell us when to stop eating. Re-search volunteers were invited to eat from a bowl of soup until they felt satisfied[49]. Unbeknown to any of the volunteers, some of them were eating soup frombowls that were slowly and imperceptibly refilling as their contents were con-sumed. Uncannily, these people ate a massive 73% more than volunteers who hadeaten from normal soup bowls. What is even more fascinating is that the volun-teers who had eaten from the surreptitiously rigged bowls didn’t feel any moresatisfied or oversatisfied than those who had eaten from normal bowls, demon-strating that we use visual as well as physical cues to determine when we havehad enough to eat. This effect of larger portion sizes appears to be prolonged.When normal-weight and overweight adults were served 50% larger portionsfor 11 days, they ate an average of 423 additional kilocalories per day over the11-day test period compared to an 11-day control period two weeks earlier orlater in which they ate standard-sized portions [50]. This consistently increasedenergy intake occurred despite the fact that the volunteers reported feeling signif-icantly less hungry and significantly more satiated during the overfeeding periodthan during the control period [50]. These results collectively imply that unlessdeliberate attempts are made to control portion sizes and heed endogenous hunger
A modern epidemic
12

and satiety signals, then even if an individual is in energy excess with a subse-quently reduced appetite, they will eat more than their physical needs dictate, andtheir biological weight-control systems will not have the opportunity to functionoptimally in the defence against excessive weight gain.
Health messages that inadvertently discourage eating accordingto physical hunger
It may seem obvious that our obesogenic environment pushes people to overeatwhen not hungry. However, even amongst people who are trying to lose weight,there is a disconnect between eating and biological hunger.
The diet specified that you have to eat at least six times a day, as this issupposed to keep the metabolism of premenopausal women high. (Maria,49 years of age and 1.52 metres tall)
People wishing to lose excess weight frequently seek knowledge about how todo so from the media, from books and from gyms. Unfortunately, these avenuesoften provide weight-loss directives that can inadvertently encourage non-hun-gry eating. Examples of such directives include ‘eat little and often to keep yourmetabolism high’ and ‘you must eat within 30 minutes after a workout to buildmuscle’ or ‘never skip a meal’. While the importance of regular consumption ofnutritious foods is acknowledged, it must be balanced with the likelihood thatmany people seeking to lose excess weight will have a reduced appetite due toeffects of their biological weight-control systems. Encouraging eating without re-gard to hunger signals prevents these people from listening to the innate systemsthat could actually help them to lose excess weight, if heeded.
Diets high in sugar and/or fatIt is well accepted in the scientific literature that feeding rodents a diet high insugar and fat (or high in fat) for several months results in approximately 30% ofanimals becoming apparently permanently obese [12, 51, 52, 53]. When switchedto an ad libitum low-fat diet, these diet-induced obese rodents maintain the sameelevated body weight. When placed on an energy-restricted low-fat diet, they loseweight, but once ad libitum access is reinstated, body weight rebounds to the el-evated level. Whereas these animals would never have become obese if they hadnot been fed the obesogenic diet – as indicated by the fact that littermate controlsmaintained on the low-fat diet remain lean throughout life – the high-fat diet in-duces a shift in ‘set point’ such that a higher body weight is defended.
Genes load the gun, the environment pulls the trigger. (Quote attributed to
1 The biology of weight control
13

George Bray)
Genetic blueprint is a major determinant of whether or not an individual animalwill be susceptible or resistant to diet-induced obesity. However, having thegenes for obesity is not enough; an individual genetically predisposed to obesityrequires an obesogenic diet in order to manifest this genetic blueprint viagene–environment interactions. So what are the effects of obesogenic diets on bi-ological weight-control systems? This question has been addressed in studies inwhich diets that are either high in fat, or high in fat and sugar, have been fed toanimals.
Obesogenic diets induce leptin resistanceOne clear effect of long-term exposure to an environment rich in dietary fat is thedevelopment of leptin resistance [21, 54, 55, 56]. The hormone leptin is a key reg-ulator of biological weight-control systems. It is secreted in large part from whiteadipose tissue (body fat). Under normal circumstances, a gain in body fat leads toan increase in circulating concentrations of leptin, which in turn acts on the hypo-thalamus of the brain to contribute to effects of energy excess as discussed above,namely inhibition of appetite, stimulation of physical activity and enhancementof energy expenditure. However, after several months on a high-fat diet, there isa decrease in the ability of leptin to induce its effects, possibly via changes suchas a decrease in the number of leptin receptors in the brain. This change in turnleads to ineffectiveness of the endogenous weight-control mechanisms, with sub-sequently accelerated weight gain.
Obesogenic diets induce changes resembling ‘food addiction’Constant exposure to, and overconsumption of, a high fat–high sugar diet triggerssimilar changes in the brain to those seen in drug addiction. These changescan override the biological weight-control systems, driving the development ofcompulsive overeating and excessive weight gain. When adult rats were givenunlimited access to bacon, sausages, cheesecake, pound cake, frosting and choco-late (as well as normal low-fat chow) for about 20 hours a day for 40 days, theyrapidly developed a preference for the high-fat foods [57]. Moreover, the rats ex-hibited compulsive-like feeding behaviour, demonstrated by the fact that theykept eating even in adverse conditions that normally cause rats to cease eating. Atthe end of 40 days, the animals had gained significant amounts of excess weight.Genetic techniques revealed that this drive to eat ‘compulsively’ was likely dueto a decrease in the amount of dopamine D2 receptors in the striatum, a part ofthe brain involved in the development of addictive behaviours [57]. Dopamine isa neurotransmitter that is released in the brain in response to pleasurable stimuli
A modern epidemic
14
such as eating, sex, or use of addictive drugs like cocaine. By acting on dopamineD2 receptors, dopamine induces changes in mood. Intriguingly, this reductionin dopamine D2 receptors in the brain is also seen in the brains of people whoare addicted to drugs, as well as in people who have a body mass index in theobese range [57]. These findings may help to explain the observation that despitethe presence of endogenous weight-control systems, many people overeat in ourcurrent obesogenic environment, where foods such as sausages, pound cake andfrosting are easier – and cheaper per kilojoule – to procure than fruits and vegeta-bles.
Reversibility – or not – of diet-induced brain changes thatpredispose to obesity
A plethora of studies such as the ones cited above unanimously show that over-consumption of a diet high in sugar and/or fat leads to changes in the brain thatcompromise the functionality of biological weight-control systems, at least in an-imals. What is not known from this research is whether such changes occur inpeople who have been exposed to similarly obesogenic diets for a long time, andwhether any such changes are reversible in humans or animals, particularly inthose with a genetic propensity for diet-induced obesity.
New evidence points to the possibility that at least some of the effects of ahigh-fat diet on the brain may be reversible. In one study, the severe leptin resis-tance seen in the hypothalamus of mice on a high-fat diet was reversed after twoweeks on a low-fat diet [56]. Exercise has also been shown to alleviate the effectsof a high-fat diet on the defended set point. As mentioned above, diet-inducedobese rats with a strong genetic propensity for weight gain lose weight when puton a low-fat/low-energy diet, but they regain their pre-diet weight within eightweeks of ad libitum access to low-fat food [52]. In contrast, diet-induced obeserats that ran on a treadmill for half-an-hour a day, six days a week, regained sig-nificantly less weight than the sedentary control rats, weighing approximately10% less, and having approximately 13% less body fat, than non-exercising con-trols [52]. In fact, the total body fat of the exercising rats was no different fromthat of lean rats that had never been obese in their lives. This beneficial effect ofexercise was due to inhibition of the drive to eat rather than an increase in energyexpenditure. Circumstantial evidence also suggests that effects of obesogenic di-ets on addiction-like changes in the brain may be reversible. Just as the low levelsof the dopamine D2 receptor in the brain of people who are addicted to drugs ap-pear to be increased upon abstinence from the drug to which they are addicted,the low levels of D2 receptor seen in postmortem brains of obese people are notapparent in brains from formerly obese people who had lost weight followinggastric surgery [57]. Collectively, these findings raise the hopeful possibility thatenvironmental and behavioural changes leading to a better diet, increased phys-
1 The biology of weight control
15

ical activity and weight loss can reverse the brain changes that compromise theeffectiveness of biological weight-control systems.
More research into the potential reversibility – or not – of diet-induced brainchanges is urgently needed. Of particular concern is the observation that a high-fat diet has been shown to cause epigenetic changes in the gene for leptin [58].Epigenetic changes are changes to the DNA structure that are not encoded by theDNA sequence itself but which are nonetheless transmitted to subsequent gener-ations. Examples include the addition of methyl groups to regions of the DNA,resulting in alterations to the expression of nearby genes. Feeding lean rats ahigh-fat diet resulted in methylation of DNA in the promotor region controllingthe expression of leptin [58]. The link between epigenetic changes and obesityis an expanding area of research. It raises the troubling possibility that obeso-genic diets not only render individuals incapable of losing excess weight, but theycan also lumber ensuing generations with residual environmentally induced prob-lems. Circumstantial evidence for this comes from the finding that the sons andgrandsons of men who had been exposed to overabundant food at around the timeof puberty in Overkalix, an isolated region in Sweden, lived significantly shorterlives than the progeny of men who had not been exposed to a rare period of foodoverabundance in their pre-pubertal development [59].
Implications for human obesityWith these rodent diet-induced obesities in mind, it is deeply concerning to seepeople consuming high-fat or high-fat and high-sugar diets – with little fruits andvegetables – from an early age onwards. Is our environment robbing their bod-ies of the natural ability to guard against excess weight, thereby setting them andtheir progeny up for permanent obesity? Outstanding research questions are listedbelow. Sadly, we will probably have the answers to these questions when the firstgeneration of children who have grown up almost exclusively on junk food comeof age.
• Does overconsumption of an obesogenic diet induce brain changes in humansthat predispose to overeating and obesity, as has been observed in rodents?
• If so, how many months or years on an obesogenic diet are required to inducesuch brain changes in humans?
• Are such effects of an obesogenic diet on the brain permanent, or can switch-ing to a healthy diet, exercising and losing weight reverse them?
• What are the genotypes or epigenotypes that increase the susceptibility to diet-induced obesity in humans?
• Can we identify diagnostic biomarkers to identify children with such geno-types or epigenotypes, so that they can be protected from obesogenic diets,just as children with nut allergies are vehemently protected from nuts in theenvironment?
A modern epidemic
16

CONCLUSIONIn modern society, the process of eating is becoming increasingly disconnectedfrom the physical need to replenish fuel supplies. We consume highly palatablefoods and beverages because they are readily available in large quantities, andlack of physical hunger is all too rarely an impediment to eating. When weightgain ensues, many people and their health practitioners resort to external direc-tives about what, when and how much to eat. While this approach – where energyintake is determined externally – helps a proportion of people to lose excessweight and keep it off, it also results in a proportion of people eating too littleor too much for effective weight loss, potentially exacerbating their overweightor obese conditions. Moreover, such methods are not suitable for everyone, es-pecially people whose lifestyles do not afford the rigidity required to count ormeasure foods or eat separate meals to their family and friends, and those prone toeating disorders. Additionally, such weight-loss strategies are not suited to publichealth campaigns to promote healthy weight.
The body is equipped with endogenous systems to control excess weight.There is evidence that these biological weight-control systems are active in themajority of people and can enable loss of excess weight and/or maintenance of ahealthy weight if the signals are heard and heeded. These biological control sys-tems allow for individualised solutions to weight management, because energyintake is tailored to each person’s individual needs at any particular time. How-ever, unless public health measures are implemented to improve food supply andportion sizes, and thus allow these systems to work as effectively as they are able,it will be difficult for many people to listen to the signals. This is particularlytrue of people with a genetic propensity for obesity. Moreover, continuation ofthe current obesogenic environment may lead to irreparable brain changes thatmake it impossible for certain people to lose excess weight, with changes po-tentially being transmitted to subsequent generations. While intense lobbying tochange our environment via public health measures continues, benefits could beobtained now by helping people to learn to eat according to internal hunger andsatiety signals. This could be achieved via commercial weight-loss programs,health practitioners, or potentially also via public health campaigns, thus enablingmore people to benefit from the biological systems that naturally control bodyweight.
ACKNOWLEGEMENTAmanda Sainsbury is supported by a Career Development Award from the Na-tional Health and Medical Research Council (NHMRC) of Australia.
1 The biology of weight control
17
DISCLOSUREAmanda Sainsbury is the author of two books: The don’t go hungry diet (Bantam,2007) and Don’t go hungry for life (Bantam, 2011).
References1. Jebb SA, Ahern AL, Olson AD, Aston LA, Holzapfel C, Stoll J, et al.
(2011). Primary care referral to a commercial provider for weight loss treat-ment, relative to standard care: an international randomised controlled trial.The Lancet, DOI:10.1016/50140-6736(11)61344-5.
2. Sainsbury A & Zhang L (2010). Role of the arcuate nucleus of the hypo-thalamus in regulation of body weight during energy deficit. Molecular andCellular Endocrinology, 316(2): 109–19.
3. Wing RR & Jeffery RW (2003). Prescribed ‘breaks’ as a means to disruptweight control efforts. Obesity Research, 11(2): 287–91.
4. Sweeney ME, Hill JO, Heller PA, Baney R & DiGirolamo M (1993). Severevs moderate energy restriction with and without exercise in the treatment ofobesity: efficiency of weight loss. American Journal of Clinical Nutrition,57(2): 127–34.
5. Sullivan EL & Cameron JL (2010). A rapidly occurring compensatory de-crease in physical activity counteracts diet-induced weight loss in femalemonkeys. American Journal of Physiology: Regulatory, Integrative andComparative Physiology, 298(4): R1068–R74.
6. Martin CK, Das SK, Lindblad L, Racette SB, McCrory MA, Weiss EP, et al.(2011). Effect of calorie restriction on the free-living physical activity levelsof nonobese humans: results of three randomized trials. Journal of AppliedPhysiology, 110(4): 956–63.
7. Martin CK, Heilbronn LK, de Jonge L, DeLany JP, Volaufova J, Anton SD,et al. (2007). Effect of calorie restriction on resting metabolic rate and spon-taneous physical activity. Obesity, 15(12): 2964–73.
8. Novak CM & Levine JA (2007). Central neural and endocrine mechanismsof non-exercise activity thermogenesis and their potential impact on obesity.Journal of Neuroendocrinology, 19(12): 923–40.
9. Rosenbaum M, Vandenborne K, Goldsmith R, Simoneau JA, Heymsfield
A modern epidemic
18

S, Joanisse DR, et al. (2003). Effects of experimental weight perturbationon skeletal muscle work efficiency in human subjects. American Journalof Physiology Regulatory Integractive Comparitive Physiology, 285(1):R183–R92.
10. Sainsbury A & Zhang L (2011). Role of the hypothalamus in the neuroen-docrine regulation of body weight and composition during energy deficit.Obesity Reviews, DOI:10.1111/j.1467-789X.2011.00948.x.
11. Pasman WJ, Saris WH & Westerterp-Plantenga MS (1999). Predictors ofweight maintenance. Obesity Research, 7(1): 43–50.
12. MacLean PS, Higgins JA, Johnson GC, Fleming-Elder BK, Peters JC & HillJO (2004). Metabolic adjustments with the development, treatment, and re-currence of obesity in obesity-prone rats. American Journal of Physiology:Regulatory, Integrative and Comparative Physiology, 287(2): R288–R97.
13. Goran MI (2000). Energy metabolism and obesity. Medical Clinics of NorthAmerica, 84(2): 347–62.
14. Dulloo AG & Girardier L (1990). Adaptive changes in energy expenditureduring refeeding following low-calorie intake: evidence for a specific meta-bolic component favoring fat storage. The American Journal of ClinicalNutrition, 52(3): 415–20.
15. Berman Y, Devi L, Spangler R, Kreek MJ & Carr KD (1997). Chronic foodrestriction and streptozotocin-induced diabetes differentially alter prodynor-phin mRNA levels in rat brain regions. Molecular Brain Research, 46(1–2):25–30.
16. Herve C & Fellmann D (1997). Changes in rat melanin-concentrating hor-mone and dynorphin messenger ribonucleic acids induced by food depriva-tion. Neuropeptides, 31(3): 237–42.
17. Jonas JM & Gold MS (1988). The use of opiate antagonists in treating bu-limia: a study of low-dose versus high-dose naltrexone. Psychiatry Research,24(2): 195–99.
18. Atkinson RL (1982). Naloxone decreases food intake in obese humans.Journal of Clinical Endocrinology and Metabolism, 55(1): 196–98.
19. Stock MJ (1999). Gluttony and thermogenesis revisited. International Jour-nal of Obesity and Related Metabolic Disorders, 23(11): 1105–17.
20. Roberts SB, Young VR, Fuss P, Fiatarone MA, Richard B, Rasmussen H,
1 The biology of weight control
19

et al. (1990). Energy expenditure and subsequent nutrient intakes in overfedyoung men. American Journal of Physiology, 259(3 Pt 2): R461–R9.
21. Lin S, Storlien LH & Huang X (2000). Leptin receptor, NPY, POMC mRNAexpression in the diet-induced obese mouse brain. Brain Research, 875(1–2):89–95.
22. Ernersson A, Nystrom FH & Lindstrom T (2010). Long-term increase of fatmass after a four week intervention with fast food based hyper-alimentationand limitation of physical activity. Nutrition and Metabolism (London), 7:68.
23. Levine JA, Eberhardt NL & Jensen MD (1999). Role of nonexercise activitythermogenesis in resistance to fat gain in humans. Science, 283(5399):212–14.
24. Sullivan EL, Koegler FH & Cameron JL (2006). Individual differences inphysical activity are closely associated with changes in body weight in adultfemale rhesus monkeys (Macaca mulatta). American Journal of Physiology:Regulatory, Integrative and Comparative Physiology, 291(3): R633–R42.
25. Leibel RL, Rosenbaum M & Hirsch J (1995). Changes in energy expendi-ture resulting from altered body weight. New England Journal of Medicine,332(10): 621–28.
26. Wijers SL, Saris WH & van Marken Lichtenbelt WD (2009). Recent ad-vances in adaptive thermogenesis: potential implications for the treatment ofobesity. Obesity Reviews, 10(2): 218–26.
27. Rising R, Alger S, Boyce V, Seagle H, Ferraro R, Fontvieille AM, et al.(1992). Food intake measured by an automated food-selection system: re-lationship to energy expenditure. American Journal of Clinical Nutrition,55(2): 343–49.
28. Joosen AM & Westerterp KR (2006). Energy expenditure during overfeed-ing. Nutrition and Metabolism (London), 3: 25.
29. Rosenbaum M, Hirsch J, Murphy E & Leibel RL (2000). Effects of changesin body weight on carbohydrate metabolism, catecholamine excretion, andthyroid function. American Journal of Clinical Nutrition, 71(6): 1421–32.
30. Gentile CL, Orr JS, Davy BM & Davy KP (2007). Modest weight gain is as-sociated with sympathetic neural activation in nonobese humans. AmericanJournal of Physiology: Regulatory, Integrative and Compatative Physiology,
A modern epidemic
20

292(5): R1834–R8.31. Sainsbury A, Cooney GJ & Herzog H (2002). Hypothalamic regulation of
energy homeostasis. Best Practice & Research Clinical Endocrinology andMetabolism, 16(4): 623–37.
32. Levine JA, Nygren J, Short KR & Nair KS (2003). Effect of hyperthy-roidism on spontaneous physical activity and energy expenditure in rats.Journal of Applied Physiology, 94(1): 165–70.
33. Silva JE (2003). The thermogenic effect of thyroid hormone and its clinicalimplications. Annals of Internal Medicine, 139(3): 205–13.
34. Lopez M, Varela L, Vazquez MJ, Rodriguez-Cuenca S, Gonzalez CR,Velagapudi VR, et al. (2010). Hypothalamic AMPK and fatty acid metabo-lism mediate thyroid regulation of energy balance. Nature Medicine, 16(9):1001–08.
35. Wijers SL, Schrauwen P, van Baak MA, Saris WH & van Marken Licht-enbelt WD (2011). Beta-adrenergic receptor blockade does not inhibit cold-induced thermogenesis in humans: possible involvement of brown adiposetissue.The Journal of Clinical Endocrinology and Metabolism, 96(4):E598–E605.
36. Cahill F, Shea JL, Randell E, Vasdev S & Sun G (2011). Serum peptide YYin response to short-term overfeeding in young men. The American Journalof Clinical Nutrition, 93(4): 741–47.
37. Batterham RL, Cohen MA, Ellis SM, Le Roux CW, Withers DJ, Frost GS,et al. (2003). Inhibition of food intake in obese subjects by peptide YY3–36.New England Journal of Medicine, 349(10): 941–48.
38. Pittner R, Moore C, Bhavsar S, Gedulin B, Smith P, Jodka C, et al. (2004).Effects of PYY[3–36] in rodent models of diabetes and obesity. Interna-tional Journal of Obesity, 28: 963–71.
39. Chelikani PK, Haver AC, Reeve JR Jr, Keire DA & Reidelberger RD(2006). Daily, intermittent intravenous infusion of peptide YY(3–36) re-duces daily food intake and adiposity in rats. American Journal of Phys-iology: Regulatory, Integrative and Comparative Physiology, 290(2):R298–R305.
40. Sloth B, Holst JJ, Flint A, Gregersen NT & Astrup A (2007). Effects ofPYY1–36 and PYY3–36 on appetite, energy intake, energy expenditure, glu-
1 The biology of weight control
21

cose and fat metabolism in obese and lean subjects. American Journal ofPhysiology: Endocrinology and Metabolism, 292(4): E1062–E68.
41. Boey D, Lin S, Enriquez RF, Lee NJ, Slack K, Couzens M, et al. (2008).PYY transgenic mice are protected against diet-induced and genetic obesity.Neuropeptides, 42(1): 19–30.
42. Bouchard C, Tremblay A, Despres JP, Nadeau A, Lupien PJ, Theriault G,et al. (1990). The response to long-term overfeeding in identical twins. TheNew England Journal of Medicine, 322(21): 1477–82.
43. Ukkola O, Tremblay A, Sun G, Chagnon YC & Bouchard C (2001). Geneticvariation at the uncoupling protein 1, 2 and 3 loci and the response to long-term overfeeding. European Journal of Clinical Nutrition, 55(11): 1008–15.
44. Pasquet P & Apfelbaum M (1994). Recovery of initial body weight andcomposition after long-term massive overfeeding in men. The AmericanJournal of Clinical Nutrition, 60(6): 861–63.
45. Foster GD, Wyatt HR, Hill JO, McGuckin BG, Brill C, Mohammed BS, etal. (2003). A randomized trial of a low-carbohydrate diet for obesity. TheNew England Journal of Medicine, 348(21): 2082–90.
46. Samaha FF, Iqbal N, Seshadri P, Chicano KL, Daily DA, McGrory J, et al.(2003). A low-carbohydrate as compared with a low-fat diet in severe obe-sity. The New England Journal of Medicine, 348(21): 2074–81.
47. McMillan-Price J, Petocz P, Atkinson F, O’Neill K, Samman S, SteinbeckK, et al. (2006). Comparison of 4 diets of varying glycemic load on weightloss and cardiovascular risk reduction in overweight and obese young adults:a randomized controlled trial. Archives of Internal Medicine, 166(14):1466–75.
48. National Health and Medical Research Council. Clinical Practice Guidelinesfor the Management of Overweight and Obesity in Adults. Canberra: Com-monwealth of Australia, 2003.
49. Wansink B, Painter JE & North J (2005). Bottomless bowls: why visual cuesof portion size may influence intake. Obesity Research, 13(1): 93–100.
50. Rolls BJ, Roe LS & Meengs JS (2007). The effect of large portion sizeson energy intake is sustained for 11 days. Obesity (Silver Spring), 15(6):1535–43.
51. Levin BE (2007). Why some of us get fat and what we can do about it. Jour-
A modern epidemic
22

nal of Physiology, 583(Pt 2): 425–30.52. MacLean PS, Higgins JA, Wyatt HR, Melanson EL, Johnson GC, Jackman
MR, et al. (2009). Regular exercise attenuates the metabolic drive to regainweight after long-term weight loss. American Journal of Physiology - Regu-latory, Integrative and Comparative Physiology, 297(3): R793–R802.
53. Hariri N & Thibault L (2010). High-fat diet-induced obesity in animal mod-els. Nutrition Research Reviews, 23(2): 270–99.
54. Lin S, Thomas TC, Storlien LH & Huang XF (2000). Development of highfat diet-induced obesity and leptin resistance in C57Bl/6J mice. InternationalJournal of Obesity and Related Metabolic Disorders, 24(5): 639–46.
55. El-Haschimi K, Pierroz DD, Hileman SM, Bjorbaek C & Flier JS (2000).Two defects contribute to hypothalamic leptin resistance in mice with diet-induced obesity. Journal of Clinical Investigation, 105(12): 1827–32.
56. Enriori PJ, Evans AE, Sinnayah P, Jobst EE, Tonelli-Lemos L, Billes SK, etal. (2007). Diet-induced obesity causes severe but reversible leptin resistancein arcuate melanocortin neurons. Cell Metabolism, 5(3): 181–94.
57. Johnson PM & Kenny PJ (2010). Dopamine D2 receptors in addiction-likereward dysfunction and compulsive eating in obese rats. Nature Neurosci-ence, 13(5): 635–41.
58. Milagro FI, Campion J, Garcia-Diaz DF, Goyenechea E, Paternain L &Martinez JA (2009). High fat diet-induced obesity modifies the methylationpattern of leptin promoter in rats. Journal of Physiology and Biochemistry,65(1): 1–9.
59. Bygren LO, Kaati G & Edvinsson S (2001). Longevity determined by pater-nal ancestors’ nutrition during their slow growth period. Acta Biotheoretical,49(1): 53–59.
1 The biology of weight control
23

2The geometry of human nutrition1
Stephen J Simpson2 and David Raubenheimer3
This chapter is an excerpt from a forthcoming book, titled ‘The natureof nutrition: a unifying framework from animal adaptation to human obe-sity’ by Stephen J Simpson and David Raubenheimer (Princeton UniversityPress, 2012). In the book we present a graphical approach, the ‘geometricframework’, which we believe can help to integrate nutrition into thebroader biological sciences and introduce generality into the applied nutri-tional sciences. In the present chapter we use this approach to show that theepidemic of human obesity and metabolic disease is linked to changes inthe nutritional balance of our diet, with a primary role for protein appetitedriving excess energy intake on a modern Western diet.
THE MODERN HUMAN NUTRITIONAL DILEMMAIt is conservatively estimated that more than one billion people worldwide areoverweight or obese. Rates of obesity are increasing, notably among the young,and the associated disease burden is immense [1, 2, 3]. Figure 1A plots the relativerisk of dying prematurely as an adult against body mass index (BMI), which ap-proximates to body fatness and is calculated as body mass in kilograms dividedby the square of height in metres. Clinicians categorise adults as underweight ifthey have a BMI of less than 18.5, as overweight if they have BMI values be-tween 25 and 30, and as obese if they exceed 30. The curve is U-shaped, with therisk of dying prematurely increasing at both low and high values of BMI, and thetarget zone for health and longevity lying in between.
The relationship between body fat content and risk of premature death in hu-mans is very similar to what we have observed in the locust, Figure 1B. This is
2 School of Biological Sciences and Charles Perkins Centre, University of Sydney.3 Institute of National Sciences, Massey University, Auckland, New Zeland.
24

a species that defends a target intake of macronutrients [4], and Figure 1B sug-gests a reason why that target is defended: because doing so minimises the risk ofdying early. We have encountered similar ‘nutritional wisdom’ in caterpillars, aswell as fruit flies and field crickets [4].
Regrettably, the same cannot be said for our own species. Take as an exam-ple the US, where approximately 65% of adults are overweight or obese, while30% are clinically obese. And the US is not atypical – the same trend is seen inall developed countries and increasingly in developing countries, too. Why havewe gone so badly wrong? The answer lies in the interplay between the nutritionalenvironment and regulatory physiology.
1 We are grateful to Princeton University Press for permission to include this chapterfrom the author’s forthcoming book: Simpson SJ and Raubenheimer D (2012). Thenature of nutrition: a unifying framework from animal adaptation to human obesity,Princeton: Princeton University Press.
2 The geometry of human nutrition1
25

Figure 1A. The relative risk of dying prematurely as an adultagainst body mass index (BMI) in US adults (based on Calleet al. [72]); and B. an equivalent plot for locusts [73].
As summarised in Figure 2, the human nutritional environment has changedconsiderably over the past 35,000 years since the Upper Palaeolithic. Anthro-pologists and archaeologists have reconstructed the nutritional ecology of ourforebears during this period [5]. The main conclusion is that people then wereprobably energy-limited, because sources of simple sugar, fat and starch wererare. In contrast, protein was relatively abundant in the form of lean game ani-mals. Skeletal analyses indicate that people were large, lean and healthy undersuch an environment [5].
A modern epidemic
26

Figure 2. A summary timeline for the changing human nutritional environmentsince the Paleolithic.
A major transition in human nutrition occurred with the shift from hunter-gath-erer lifestyle to agriculture. This took place at different times in different partsof the world, but the results were similar: there was an increase in the amount ofreadily available carbohydrate, particularly starch from grains, in the diet. Thismay have been associated with protein limitation and also micronutrient imbalan-ces, and probably led to increased problems of famine as well as a greater diseaseburden as populations became more concentrated and sedentary [6, 7, 8]. As a re-sult, people were, on average, smaller than in the Upper Palaeolithic, lean andless healthy.
The incorporation of carbohydrate into the diet increased further during theIndustrial Revolution, due to the bulk refining and efficient transport of grainsand sugar. Around that time, most people were small and lean, with corpulencebeing largely restricted to the wealthy few.
Since the Industrial Revolution, there has been a further major nutritionaltransition, between and following the two world wars. Today in the developedworld, we have an unprecedented general access to all manner of foods and nutri-ents. We in the Western world are large and live long, but are also suffering theobesity epidemic and an upsurge in a new set of chronic diseases associated withour modern lifestyle.
In contrast to the changing nutritional environment, our physiology seems tohave remained much more constant over the same timescale. There is evidence ofgenetic adaptation in human populations to changed patterns of food availabilitysince the Upper Palaeolithic [8] – for example, the evolution of lactose tolerance
2 The geometry of human nutrition1
27

among human populations with the advent of dairy herding and, possibly alsothe selection of genes that confer resistance to diabetes [9]. However, the paceat which our nutritional environment has changed is considerably faster than therate at which our metabolism can evolve: we are caught in a time lag, in whichour physiology is poorly adapted to our lifestyle.
If we are to understand how our ‘outdated’ physiology interacts with ourchanged nutritional environment, we must answer three fundamental questions:
1. Do humans regulate intake of multiple nutrients to an intake target (sensuSimpson and Raubenheimer [4])?
2. How do humans balance eating too much of some nutrients against too littleof others when faced with an imbalanced diet – ie what is the rule of com-promise for humans (sensu Simpson and Raubenheimer [4])?
3. How do humans deal with nutrient excesses?
We will deal with these questions in turn, restricting our discussion to the threemacronutrients – protein, carbohydrate and fat. Of these nutrients, we argue thatprotein has played a pivotal role in the development of the obesity epidemic.
DO HUMANS REGULATE TO AN INTAKETARGET?
As yet, no properly controlled geometric experiment, along the lines described in[4] for numerous other animals, has been published for humans. Partly for thisreason, it remains contentious whether humans are able to regulate their intake ofdifferent macronutrients [10, 11, 12]. There are, nonetheless, three sources of infor-mation that suggest that we can regulate the intake of specific nutrients.
1. Comparative data from rodents and other omnivoresRodents are widely used as models for human nutritional physiology. From a nu-tritional perspective, there is some rationale to this because, like humans, rodentsare broad-scale food generalists. Reinterpreting published data on rats showedconvincingly that these mammals have the capacity to regulate their intake ofprotein and carbohydrate [13]. An example is shown in Figure 3A, in which wereplotted data collected by Theall et al. [14]. Rats were provided with one of eightdifferent complementary food pairings, and in every case converged on the sameintake of protein and carbohydrate, indicating that these animals regulated theirintake of both macronutrients. Subsequently, Sørensen and colleagues [15] con-ducted a full geometric analysis of protein and carbohydrate regulation in anothermodel rodent, the mouse, and showed unequivocally that mice, too, regulate pro-tein and carbohydrate to an intake target (Figure 3B).
A modern epidemic
28

2. Studies on human macronutrient appetiteThere are data which indicate that we have some capacity to regulate our intakeof macronutrients, notably protein, despite the extreme complexity of our socialand nutritional environments [12, see 16]. It appears that macronutrient-specificfeedbacks operate over a period of one to two days, and that, at least for protein,we subliminally learn to associate foods with the nutritional consequences of eat-ing them [17, 18].
Figure 3. Rats and mice possess separate appetites for protein and carbohydrate. A. Datafor rats provided with one of eight different complementary food pairings (food rails notmarked except for the two most extreme ratios). Rats converged on a point of pro-tein–carbohydrate intake, indicating tight regulation of both macronutrients to an intaketarget. (Data from Theall et al. [14], reanalysed in Simpson and Raubenheimer [13]). B.Cumulative protein– carbohydrate intake trajectories for mice offered one of five foodpairings. Mice converged significantly relative to a common (target) intake trajectory.Had they fed indiscriminately between foods in each pairing, trajectories would have di-verged markedly, as shown in the lower insert. (From Sørensen et al. [15], withpermission).
3. Population-level dataA striking feature of the human diet is that the proportion of protein in the diet ishighly consistent across populations and across time, comprising around 15% oftotal energy, whereas fat and carbohydrate vary [19] (Figure 4). And not only theproportion of protein, but also the amount is consistent, at least in some popula-tions. Figure 5 plots estimates for per capita intake for the UK population from
2 The geometry of human nutrition1
29

1961 until 2000, taken from the Food and Agriculture Organization of the UnitedNations (FAOSTAT) database [20]. According to these data (which are based onnutrient supply rather than measures of actual intake), intake of protein and alsofat and carbohydrate have remained remarkably stable since 1961. Not only that,they appear to have been ‘defended’. If we first take the case of dietary fat sup-ply and break down the total into fats derived from animal and vegetable sources,it is apparent that during the mid 1980s intake of animal fats fell precipitously,presumably in response to the public health campaign urging people to eat less ofthese fats. Thus, at this time there was a perturbation in the nutritional environ-ment – was there a compensatory change to counterbalance this? Yes – as can beseen in Figure 5, the intake of vegetable fats rose in direct proportion to fallingintake of animal fats, leading to maintenance of total fat intake at a constant level.Similar substitutions between food groups were also seen over the same periodfor protein and carbohydrate. Sugar intake fell and was compensated for by in-creasing consumption of complex carbohydrates (starches, fruit and vegetables).Declining consumption of beef, pork and lamb was compensated by increasedpoultry consumption, reflecting increasing availability and cheapness of the latterwith increased industrialisation of poultry production.
Figure 4. Ratios of average macronutrient intake (scaled in units of energy) in varioushuman societies during the late 1950s and early 1960s. (Based on data from Westerterp-Plantenga [19] and the FAOSTAT database [20]).
But regulation of macronutrient intake is not always perfect, as strikingly illus-
A modern epidemic
30

trated by the US, where carbohydrate and fat intake (as again estimated fromFAOSTAT data) have risen substantially over the period 1961 to 2000 (Figure 6).However, protein intake has risen to a lesser degree over the same period. As aresult, in the US there has been a shift in diet composition towards a lower ratioof protein to carbohydrate and fat, with protein comprising 12.5% as comparedwith 14% of total energy intake. Almost certainly this shift has been away fromthe intake target ratio. Data from the National Health and Nutrition ExaminationSurvey (NHANES) in America indicate a similar pattern: a small decline in per-cent dietary protein, caused largely by increasing fat and especially, carbohydrateintake [21, see also 22, 23]. Understanding the effect of such a change requiresknowledge of the rule of compromise.
Figure 5. Changing patterns of macronutrient supply (from which in-take can be approximated) in the UK from 1961 to 2000, based onFAOSTAT data. Macronutrient intake remained stable and seeminglyregulated. See text for interpretation.
2 The geometry of human nutrition1
31

Figure 6. Data as in Figure 5, for the US. Intake ofcarbohydrate and fat rose faster than that for proteinand as a result the percentage of protein in the dailydiet fell.
WHAT IS THE HUMAN RULE OF COMPROMISE?To address this question, we used the geometric framework to explore the humanrule of compromise [16]. Our initial study was a short-term experiment, involvingten subjects incarcerated in a chalet in the Swiss Alps, focusing on intake of pro-tein vs carbohydrate and fat combined. We decided to treat fat and carbohydrateas a single dimension (carbohydrate and fat) scaled in energy units since the ex-isting evidence from humans, rodents and other omnivorous animals suggestedthat the key interaction was between protein and non-protein energy in the diet.
Subjects were housed together for six days. For the first two days, they wereprovided with the opportunity to select their breakfast, lunch, afternoon snackand dinner from a buffet of items comprising a wide range of macronutrient com-positions. Everything they ate was weighed and their macronutrient intake wasestimated from food composition tables. For the next two days, one group of sub-jects (treatment 1) was restricted to foods that were high in protein and low incarbohydrate and fat, while the remaining subjects in treatment group two wereprovided with only low-protein, high-fat + carbohydrate items. For the final twodays of the experiment (days five and six), all subjects were given the same freechoice of foods as on days one and two. The results are summarised in Figure7. The overriding message of the experiment was that when subjects were re-stricted to a diet that contained either a higher (treatment 1) or lower (treatment2) ratio of protein to carbohydrate and fat than they had self-selected during daysone and two, they maintained their intake of protein at the expense of the reg-ulation of carbohydrate and fat intake. Thus, treatment group one underingested
A modern epidemic
32

carbohydrate and fat rather than overate protein, while treatment group 2 overatecarbohydrate and fat to gain limiting protein.
Figure 7. Results from our Swiss study [16]. See text for details. (After Simpson et al.[16], with permission).
From these data, we derived an indication of the form of the human rule of com-promise for protein vs carbohydrate and fat, which is that, when forced to tradeoff intake of protein vs carbohydrate and fat, humans prioritise protein intake. Wetermed this the ‘protein leverage hypothesis’ [24].
2 The geometry of human nutrition1
33

Figure 8A. Protein intake is more tightly regulated than non-protein intake in humans.Protein versus non-protein intakes from a meta-analysis of 23 studies measuring ad libi-tum daily intake on diets of different macronutrient compositions for time periodsranging from less than two months (circle), two to four months (upwards triangle), six toeight months (downwards triangle) and 12 months (square). The rails represent 10%,15% and 25% protein diets. The inset shows that as the percentage of protein in the dietincreases, non-protein (carbohydrate and fat) intake decreases but protein intake re-mains relatively constant. The dashed line is the mean protein intake for all studies (1.52MJ). The solid line is calculated as the non-protein (carbohydrate and fat) intake giventhe percent protein intake in each study but assuming protein intake was equal to themean (1.52 MJ); in other words, the case where protein leverage is complete and regula-tion of absolute protein intake dominates total energy consumption. B. Three publishedweight-loss studies, each showing changes in weight between baseline (circle), twomonths (square), six months (diamond) and 12 months (triangle). In each study partici-pants were prescribed one of the following weight-loss regimes: the Atkins (black); Zone(grey); and Ornish (white) diets. Percent of dietary protein vs weight (kg) was plotted foreach time point in each study. As percent of protein of the diet increases as a result of theAtkins and Zone regimes during the first two months (1) body weight decreases (2). Be-tween six and 12 months the weight loss that occurred on the Atkins and Zone diets ismaintained but no further weight loss occurs (3). The inset shows percent dietary proteinvs (i) protein intake (dashed line: mean of protein intakes) or (ii) carbohydrate and fat(non-protein; solid line calculated as above) intake information for the three studies.From Gosby et al., unpublished.
To examine whether other experimental data supported this result, we plottedthe data from our experiment along with data recast from several earlier exper-iments. The signature pattern of protein leverage emerged [24]. A more recent
A modern epidemic
34

update including 23 separate studies measuring ad libitum intake on diets of dif-ferent macronutrient compositions for time periods ranging from several days to12 months, shows the pattern very strongly indeed (Figure 8). As predicted bythe protein leverage hypothesis, in cases where subjects were restricted to a dietcomprising a fixed ratio of protein to carbohydrate and fat, either in the short orlong term, they maintained daily protein intake at a more constant level than thatof the other two macronutrients.
Two other notable features appeared from the compilation of data in Figure8. First, stable patterns of energy intake in response to altered dietary protein de-velop within one to two days and persist over at least 70 days thereafter (eg thestudy by Weigle et al. [18]). Second, there is evidence of an asymmetry in proteinleveraging in humans. Hence, humans appear to be more willing to overeat low-protein diets to gain limiting protein than to limit intake to avoid ingesting excessprotein [25]. This asymmetry may reflect the fact that the evolutionary costs ofeating too little protein exceed those of eating too much. Hence, underconsump-tion is costly because protein is the only macronutrient to contain nitrogen, whichis essential for growth and reproduction. On the other hand, excess protein con-sumption has been shown to have associated performance costs in some animals[eg 26, 27] – and perhaps also in humans, and suggested risks include increasedinsulin resistance, kidney damage, bone decalcification, ketoacidosis, cardiovas-cular disease and some cancers [28, 29, 30, 31].
Also consistent with the protein leverage hypothesis are comparative datafrom rodents and other omnivores such as chickens and pigs [13, 15, 32, 33,34] – and even from herbivorous and omnivorous insects such as locusts andcockroaches. Hence, rats and mice confined to a diet containing a lower pro-tein–to–carbohydrate ratio than at the intake target, maintained protein intakenear constant and in so doing overeat carbohydrate. In contrast, rodents providedwith a high-protein diet did not substantially overeat protein to gain their intaketarget level of carbohydrate (although the asymmetry in protein leverage, alludedto above for humans, is apparent) (Figure 9). More strikingly still, data for an-other primate, the spider monkey, show the signature of extreme protein leveragein which protein intake is maintained near constant and non-protein energy intakeallowed to vary freely to attain the protein target [35].
AN ACID TEST OF PROTEIN LEVERAGE:DISGUISING THE MACRONUTRIENT
COMPOSITION OF THE DIETAll of the studies summarised in Figure 8 involved offering subjects diets com-posed of varying numbers of types of familiar foods. There was therefore thepossibility that changes in the proportion of protein in the diets were confounded
2 The geometry of human nutrition1
35

by other factors, such as differences in the palatability of the treatment foods, thevariety of options available within each treatment, and prior experience. An acidtest of the protein leverage hypothesis requires that these potentially confoundingeffects are controlled for. Recently, Gosby and colleagues [36, 37] set out to dojust that.
A modern epidemic
36

Figure 9. The rule of compromise in rats, mice and chicken. These om-nivores prioritise protein intake when confined to diets (dashed rails)requiring them to tradeoff protein versus non-protein energy intake. ITindicates the position of the intake target ratio, as derived from experi-ments in which animals were offered one of eight (A), five (B) or four(C) complementary food pairings and demonstrated tight convergenceto a nutrient intake point. The dotted line indicates isocaloric intakes,to emphasise the point that as percent of dietary protein fell, total dailyenergy intake rose (ie the intake arrays have slopes steeper than –1). A.After Simpson and Raubenheimer [13], derived from data by Theall etal. [14], with extra data (grey points) added from a study by Tews et al.[74]. The grey dashed curve is an interpolation between the two experi-ments. B. From Sørensen et al. [15]. C. From Raubenheimer andSimpson [34], based on data from Shariatmadari and Forbes [75].
2 The geometry of human nutrition1
37

Figure 10. The Sydney protein leverage trial in which subjects wereconfined to four-day menus in which protein content of all foods wasthe same but disguised. Each participant spent three four-day periodsin the trial. In one, all foods for the period contained 10% protein, inanother all foods were 15% protein and in the third they were all 25%protein. Foods were matched for pleasantness and variety. A. An exam-ple of a lunch from the 10% protein week and its equivalent in the 25%protein week. Participants were provided with a selection of sweet (ap-ple crumble muffins) and savory (Teriyaki sushi rolls and Mexicanwraps) foods to choose from as well as a serving of salad leaves anddressing. Participants were asked to eat until they felt comfortably full.B. Cumulative daily bi-coordinate means for protein and non-protein(carbohydrate and fat) intake (MJ) for participants during the four-day10% (light-grey circles), 15% (grey triangles) and 25% (black squares)protein study periods. The dashed lines represent the nutrient rails par-
A modern epidemic
38

ticipants were restricted to during the 10%, 15% and 25% study peri-ods. The dotted lines represent intakes that may occur on the 10%, 15%and 25% foods if intake was regulated to energy requirements. The in-set shows total energy intake (MJ) for participants over the four-day10% (white), 15% (grey) and 25% (black) periods. Bi-coordinatemeans for ‘anytime’ and ‘meal time’ savory (C) and sweet (D) foods asa percent of total intake for participants over the four-day 10% (whitecircles), 15% (grey triangles) and 25% (black squares) ad-libitumstudy periods. As the percent of protein in the diet fell, not only did to-tal energy intake rise, also the proportion of intake from savory snackfoods rose, indicating protein-seeking behaviour (From Gosby et al.[37], with permission).
We began by designing a series of experimental foods that were disguised in theirmacronutrient composition. The recipes were manipulated to produce three ver-sions of each food, containing 10%, 15% or 25% protein. Dietary fat was keptconstant at 30%, and carbohydrate was adjusted to be 60%, 55% or 45% of to-tal energy. Some of these foods were designed to be sweet, others savoury; somewere to be presented as part of a main meal (breakfast, lunch or dinner) and oth-ers available between meals. Volunteers were recruited to taste-test the foods tomake sure that the 10%, 15% and 25% protein versions of each food were equallypalatable. As a result, we ended up with three versions of a four-day menu com-prising 28 foods. For one version, all foods contained 10% protein, another 15%protein and the third 25% protein. An example of a 10% and the equivalent 25%protein lunch is shown in Figure 10A.
Lean adult subjects were next recruited who spent three four-day periodsconfined in an apartment at the Woolcock Institute Sleep Study Centre at the Uni-versity of Sydney. Subjects were given breakfast, lunch and dinner each day andalso offered free access to snack foods throughout the day. For one of the four-day periods every food eaten contained 10% protein; during another all foodscontained 15% protein; and for the third period all foods were 25% protein. Sub-jects could eat as much as they liked and their food intake was measured. Becausemacronutrient composition was disguised and palatability, availability, varietyand sensory aspects of foods were matched between treatment periods, the exper-iment provided a strong test of the effect of protein leverage on energy intake.
As predicted by the protein leverage hypothesis, reducing the protein contentof the diet from 15% to 10% resulted in subjects increasing total energy intake.The extent of the increase was 12% over the four-day trial (Figure 10B); whichif continued, would be expected to promote an increase in body fat of one kilo-gram per month. The increased energy intake was already evident within the firstday and was mainly due to eating more of foods available between meals (Figure10 C, D), with a predilection for savoury over sweet-tasting foods (although re-
2 The geometry of human nutrition1
39

member that all foods were actually the same in their macronutrient compositionwithin the four-day trial). This preference for savoury-flavoured foods is stronglysuggestive of protein-seeking behaviour.
In contrast to previous studies using undisguised foods (Figure 8), increasingthe percent protein from 15% to 25% did not result in a lowering of energy intake(Figure 10B). This result suggested that continual access to a variety of energy-dense foods may counteract the inhibition of energy intake due to elevated dietaryprotein [37]. We return to this important point below.
WHAT ARE THE IMPLICATIONS OF PROTEINLEVERAGE?
The implications of such a rule of compromise are considerable when consideringthe modern nutritional dilemma. To illustrate this, we will consider four scenariosfor the case of a 45-year-old, moderately active adult male 1.8 ms tall and stablyweighing 76 kg (BMI 23.5). His total daily energy requirements to remain in en-ergy balance are 10 700 kJ. Achieving a diet comprising 14% protein requireshim to eat 1500 kJ per day of protein and 9200 kJ of carbohydrate and fatcombined. This represents a daily intake of 88 g protein and a total mass of car-bohydrate and fat eaten that will depend on the relative proportions between thetwo in the diet, given that fat has twice the energy density of carbohydrate. Asbefore, we will combine fat and carbohydrate into a single value for energy, sincetheir relative contributions are not germane to the logic of our argument.
The four scenarios are:
1. There is a shift to a diet containing a higher percentageof carbohydrate and fat
This could occur where fat- and/or carbohydrate-rich foods are more accessible,more affordable, in greater variety, or more palatable than alternatives [3, 38],leading to people being effectively trapped on a suboptimal diet. Under such cir-cumstances, maintaining the amount of protein eaten requires overconsumptionof carbohydrate and fat.
Since protein is a minor component of the total diet, only a small decreasein the percentage of protein results in a substantial excess of carbohydrate and fateaten: the protein leverage effect. Let us return to the above example of the US(Figure 6), where the FAOSTAT data suggest that, since 1961, the average dietcomposition has changed from 14% protein: 86% carbohydrate and fat to 12.5%protein: 87.5% carbohydrate and fat [20]. Maintaining protein intake under thesecircumstances required a 14% increase in the carbohydrate and fat eaten (Figure11A). The implications for body weight regulation are clear: unless the excess
A modern epidemic
40

carbohydrate and fat ingested to maintain protein intake is removed through in-creased physical or metabolic activity, body weight will rise, predisposing toobesity.
One important caveat that must be considered here is that the opportunity toovereat carbohydrate and fat to an extent sufficient to reach the protein intake tar-get will depend on the energy density of the foods available. Where the ratio ofprotein to carbohydrate and fat is lower than the intake target ratio, but nutrientdensity is low (eg in the diets of macrobiotic vegetarians), physical bulk may in-hibit reaching the protein intake target [see 39], thus leading to cessation of intakebefore the protein target is reached. In contrast, the fact that modern packagedand convenience foods are often energy-dense makes it easy to achieve the pro-tein target on a diet with a lower than optimal ratio of protein to carbohydrate andfat.
Figure 11. The consequences of four nutritional scenarios, given a ruleof compromise that is to maintain protein intake. See text for details.
Additionally, having 24-hour access to food in the modern world, rather than re-
2 The geometry of human nutrition1
41

stricting food to meal times, allows people the opportunity to ‘snack’ and ‘graze’,ie to increase the number of eating episodes in a day [40]. Hence, in the studyby Alison Gosby et al. [37], subjects achieved greater consumption of the 10%protein diet not by eating more during main meals, but by increasing intake be-tween meals (Figures 10C, D). In free-living individuals in the US the numberof eating episodes per day is on the increase [41]. To make matters worse, in-creased food variety may also play a role in helping reach the protein target bystimulating increased intake on low-protein diets [37]. Variety can increase totalenergy intake independently of macronutrient composition [42], which may be anevolved response to ensure that we eat enough different foods to achieve our re-quirements for various micronutrients [43] and to overcome boredom effects and‘sensory specific satiety’ [44, 45, 46].
2. There is a shift to a diet containing a higher percentageof protein
If humans are restricted to a diet that contains a higher percentage of protein, yetthe absolute amount of protein eaten were regulated to the intake target, the resultwill be that carbohydrate and fat intake would fall, bringing the body into en-ergy deficit and promoting weight loss. For example, a 1.5% increase in dietaryprotein from 14% to 15.5% would result in an 11% decrease in the carbohydrateand fat eaten (Figure 11B). As seen in Figure 8, available data suggest that someoverconsumption of protein is tolerated, but not sufficient to maintain carbohy-drate and fat intake. This explains why high-protein diet regimes promote weightloss and improve weight-loss maintenance [29, 30, 47, 48, 49]. It also explains whythe most successful fad diets in terms of proponents and product sales over recentyears have been those containing an elevated percentage of protein. Irrespectiveof the supposedly scientific claims made, and whether these diets promote omit-ting carbohydrates, reducing fat intake, or both, the primary reason why theyencourage weight loss is simply because people eat less.
Perhaps then, augmenting the proportion of protein in the daily diet offersa means of ameliorating obesity by taking advantage of the inhibition of intakeonce the protein target is reached? Three things take some of the gloss from thisoptimistic suggestion. First, as we mentioned above, Gosby et al. [37] (Figure 10)did not find a decrease in intake when the diet contained 25% rather than 15%protein and concluded that
it appears that the benefits of protein leverage – reduced intake on highpercent protein diets – may be circumvented in [W]esternised countriesin which the variety and availability of foods, especially snack foods, isgreater than it has ever been in our evolutionary history [37]
A modern epidemic
42

Consistent with this conclusion, it is commonly reported that when subjects beginon a high-protein dietary regime they initially lose weight as a result of eatingless, but over time the temptations of the modern nutritional environment lead toa gradual reduction in the percentage of protein in the diet, with associated cessa-tion of weight loss (Figure 8B).
A second difficulty with increasing dietary protein is that, as well as the ben-efits in terms of weight loss, eating too much protein (even though this is resistedby protein regulatory feedbacks) may come at a cost to health (see above). A thirdproblem is that increasing the proportion of protein in the diet has economic andpotentially also environmental costs.
Brooks et al. [38] conducted an analysis of the economic costs of macronu-trients in relation to the biology of protein leverage. We partitioned the energycontent of supermarket foods and demonstrated that increasing overall energycontent only modestly raises the cost of foods, largely because carbohydrate andfat are cheap. In fact, lower food prices were associated with higher carbohy-drate content; whereas higher food prices were associated with increased proteincontent. It follows that the different costs of protein and carbohydrates may biasconsumers – especially those on limited incomes [2, 50] – towards diets higher incarbohydrate and lower in protein energy content, which will then cause them toeat excessive energy to meet their dietary protein needs via the protein leverageeffect. It also follows that there is economic pressure on processed food manufac-turers to substitute protein in their products with cheaper energy sources, therebydriving increased energy intake in consumers via protein leverage. Such an eco-nomic pressure acts not only upon the manufacturers of human foods, but alsoupon those producing feeds for domestic animals [4]. In the case of food animalproduction, the result is to further increase the lipid content of the human dietthrough production of fatty meat.
Brooks et al. [38] used estimates of the strength of protein leverage from acompilation of published studies (an earlier version of Figure 8, from Simpsonand Raubenheimer [24] and analysed further by Cheng et al. [25]) to estimatethe extent to which dietary protein would need to be augmented to achieve a re-duction in levels of obesity in a population, and the cost of this to the economy.Under the assumptions used (which in light of the results of Gosby et al. [37] mayhave overstated the inhibitory effect of protein on long-term intake), the cost ofproviding the extra protein needed to reduce intake was substantially less than thehealth costs of obesity.
There are, of course, important environmental implications for raising pro-tein supply, especially when that comes from animal sources. However, anincrease in dietary percentage of protein may be more effectively achieved by re-ducing consumption, and therefore production, of non-protein energy, rather thanby increasing intake and production of protein. For example, taxation of foodsrich in sugar (or starch or fat) but poor in protein could simultaneously reduce the
2 The geometry of human nutrition1
43

need for large increases in protein production and reduce the land used for sugar(or starch or oil) crops, therefore helping to offset the environmental costs of in-creasing protein supply [38].
3. There is an increase in the requirement for proteinIf diet composition remains unchanged, yet protein requirements increase, thenoverconsumption of carbohydrate and fat will result (Fig 11C). For example,shifting the intake target ratio from 14% to 15.5% protein in the diet leads to a13% increase in the carbohydrate and fat eaten – with attendant risks of weightgain. But under what circumstances might this occur?
One source of protein loss is hepatic gluconeogenesis, whereby amino acidsare used in the liver to produce glucose. This is inhibited by insulin, as is thebreakdown of muscle proteins to release amino acids, and therefore usually oc-curs mainly during periods of fasting. However, inhibition of gluconeogenesisand protein catabolism is impaired when insulin release is abnormal, insulin re-sistance occurs, or free fatty acids circulate in the blood at high levels. These areinterdependent conditions that are associated with overweight and obesity andare especially pronounced in type 2 diabetes [51, 52]. The result is an increasedrequirement for ingested protein. Unless either more high-protein, low-carbo-hydrate and fat items are included in the diet (ie scenario 2 above) or rates ofremoving excess co-ingested carbohydrate and fat are increased, weight gain willoccur. And the system becomes unstable – the increased fat deposits (especiallyabdominal fat [51]) will further increase protein needs, which will in turn driveeven greater weight gain [24, 27] (Figure 12). Data from rodents also supportsuch a scenario – a vicious cycle to morbid obesity [53, 54]. Further evidence insupport of our ‘vicious cycle’ come from Newgard et al. [55], who discovered thatobese humans are distinguished from lean subjects by a metabolic signature indi-cating elevated protein catabolism.
A modern epidemic
44

Figure 12. The vicious cycle by which protein appetite may drive obesity.
Another reason why protein needs may increase is during periods of lean musclegrowth, for example during adolescence, accompanying weight training, or aftera period of starvation. The effect of an increased protein requirement will dependon the extent to which requirements for non-protein energy change as well, butif the net movement of the target is to the right on a carbohydrate + fat vs pro-tein intake plot (as in Figure 11 C), placing such a person onto a low-protein dietwould predispose to excessive energy consumption and weight gain. This mighthelp explain the ‘yo-yo’ diet effect, whereby subjects regain weight rapidly fol-lowing a period on a crash diet [56]; and perhaps also why some athletes are proneto weight gain once they cease training.
A corollary is that we might predict that individuals and populations with anelevated intake target for protein should be more prone to developing obesity ona low-protein diet than those with a lower protein target [24]. Organisms evolvesuch that their intake target reflects the composition of their natural diet [4]. Hu-mans too adapt to their current diet, genetically, developmentally and culturally[7, 57, 58, 59]. Perhaps populations that have traditionally eaten a high-protein diethave an elevated protein target, and therefore suffer increased susceptibility toobesity and metabolic disease when making the transition to a modern Westerndiet in which carbohydrate-rich foods are cheap and abundant [24]? The preva-lence of obesity and type 2 diabetes among Oceanic populations is particularly
2 The geometry of human nutrition1
45

telling, since such populations have until recently remained on a protein-richmarine-based diet, rather than having shifted like many others to terrestrial agri-culture in the Neolithic with a consequent increase in dietary carbohydrate [60, 61,62].
A particularly striking example is the Kosrae district of Micronesia, wherenearly 90% of adults are overweight and 53% are obese. Here, the recent develop-ment of a wage-based economy has led to altered eating habits from a traditionaldiet high in fish, fruit and vegetables to a diet based on imported packaged food[39, 62].
4. Diet remains unchanged but energy expenditure declinesWe must take account of changes to the demand side of the energy budget whenconsidering the implication of protein leverage. Because much of our metabolicfuel comes from carbohydrate and fat, the result of lowered levels of exercise andother forms of energy expenditure is, in effect, to lower the position of the intaketarget on the carbohydrate and fat axis (Figure 11D). Unless the diet changes to-wards a higher percentage of protein, the result will be weight gain.
As we discussed above, unlike the US where intake has risen (Figure 6), inthe UK macronutrient and energy intake appear to have remained relatively stableover the period from 1960 to 2000 (Figure 5); yet obesity rose rapidly, in directcorrelation with causes of declining activity levels, such as the use of cars andtelevision viewing [50]). As well as spending more time inactive, many of us nowlive (and drive around) within temperature controlled environments – cooled dur-ing summer and warmed during winter – with consequent metabolic savings forthermoregulation, especially in higher latitudes [8].
To make matters worse, as well as lowering the demand for fuel, decreasingthe level of exercise has a direct influence on metabolic physiology, associatedwith increased resistance to insulin and thus enhanced gluconeogenesis [63]. Aswe saw above (scenario 3), insulin resistance and its consequences will cause anincreased need for protein, shifting the intake target towards an even higher per-centage of protein that results from the lowered need for carbohydrate and fat tofuel metabolism under a low-exercise regime.
And to compound matters, while humans respond by increasing intake fol-lowing high levels of energetic expenditure, we tend not to compensate fully byeating less when our energy needs fall [63]. Possibly our intake target has evolvedto ‘assume’ a certain level of energy expenditure based on our ancestral lifestyle,and we may therefore be ‘hard wired’ to eat that amount, even if we do not use it[24].
A modern epidemic
46

INTERACTING CONSEQUENCESThe scenarios introduced above interact with one another. Either shifting the dietcomposition to a lower percentage of protein (scenario one), or effectively do-ing the same by having low levels of energy expenditure (scenario four), willresult in overconsumption of energy to maintain protein intake. This in turn willpredispose towards weight gain and insulin resistance, leading to disinhibitionof protein breakdown and gluconeogenesis, which will increase protein demand(scenario three). Unless this increased demand is met by shifting to a higher per-centage protein diet, protein appetite will drive increased energy intake, resultingin further weight gain, and so on in a vicious cycle leading to obesity, metabolicdisease and associated pathologies (Figure 12).
One nagging question remains. If humans do regulate protein intake, why dowe not simply select protein-rich foods to rebalance our diet, as a locust would?It seems that we are led astray by our sweet tooth. For most of our evolutionaryhistory the human diet consisted of a high proportion of animal foods [64, 65, 66].Simple sugars were rare, and wild animals typically have much lower fat contentthan modern commercial meat (4 g compared with 20 g fat per 100 g meat) [67,68]. Hence, hunter-gatherer peoples around the world go to considerable risks tocollect honey from tall trees and cliff faces, and fat is highly prized. A historyof short supply of simple sugars and fat has been proposed as an explanation fortheir high palatability, which may predispose towards the overconsumption of fatand carbohydrate-rich foods even when these are not required [69]. Similar ar-guments have been put to explain aspects of human metabolic physiology, mostnotably the ease with which we store rather than eliminate excess ingested energy[70] (see below). Because it appears that we have limited evolutionary experienceof excess carbohydrates (especially simple sugars) or fats, it seems reasonable toinfer that natural selection against their overconsumption would not have beenstrong.
These evolutionary predispositions interact with the modern nutritional en-vironment to misdirect our regulatory physiology. As we have seen, highlyenergy-dense, fat- and carbohydrate-rich foods are constantly available and af-fordable, and levels of energy expenditure are lower than it is anticipated by ourancestral physiology. It is also telling that taste stimuli naturally associated withprotein-rich foods, such as sodium and umami stimulants, are extensively used inlow-protein processed foods, and may as a result subvert protein regulatory sys-tems and lead to overconsumption of fat and carbohydrates [24]. For example,Americans increased intake of salty snack foods between 1977 and 1996 [71] –perhaps as part of a subliminal effort to gain protein, but in fact exacerbating theproblem.
2 The geometry of human nutrition1
47

HOW DO HUMANS DEAL WITH NUTRIENTEXCESSES?
We return finally, and briefly, to the third of our initial questions: having eatenexcess energy, what happens to it? The extent to which weight gain occurs fol-lowing ingestion of excess nutrients depends on what happens to such excessesonce they enter the body. There is a clear relationship between the priority withwhich surplus nutrients are voided from the body through being metabolised andexcreted, and the extent to which they are stored [10]. Excess carbohydrates arereadily metabolised and excreted, and stores are minimal (in the form of glycogenin the liver and muscles). Surplus protein is also metabolised and excreted withhigh efficiency and little if any is stored. In marked contrast, ingested fat is thelast fuel to be burned, and excesses are mostly stored in adipose tissue – a storewith virtually unlimited capacity. These metabolic patterns are consistent withour having evolved in an environment where energy was limited and periods offood scarcity were not uncommon, especially since the post-agricultural era [7].
CONCLUSIONSAn analysis of the modern human nutritional dilemma using the geometric frame-work leads to the following conclusions.
1. The intake targetThe available evidence suggests that humans can regulate macronutrient intake,but that the intake target contains a built-in component for fat storage. This hasprobably evolved to ‘anticipate’ energetic demands for activity and thermoregu-lation, and also periods of food shortage. Failure to use this stored fat promotesobesity.
2. Rule of compromiseWhen faced with imbalanced diets, protein intake is prioritised. Therefore, onlow-protein/high-carbohydrate and fat diets, carbohydrate and/or fat areovereaten; and on high-protein/low-carbohydrate and fat diets, carbohydrate and/or fat are undereaten. When the ratio of protein to carbohydrate in the diet islower than optimal, it is easier to gain the required amount of protein – andhence overconsume fat and carbohydrate – when foods are high in energy den-sity, present in great variety, and easily available throughout the day. These aredefining features of the modern Western nutritional environment. Regarding di-etary causes of obesity, most emphasis in research over the past 40 years or more
A modern epidemic
48

has been on changing patterns of fat and carbohydrate consumption. In contrast,the role of protein has largely been ignored because it typically comprises only15% of dietary energy and protein intake has remained near constant within andacross populations throughout the development of the obesity epidemic. We haveshown that, paradoxically, these are precisely the two conditions that provide pro-tein with the leverage both to drive the obesity epidemic through its effects onfood intake and potentially (with caveats) to assuage it.
3. Post-ingestive regulationRegulation of nutrient intake has evolved ‘assuming’ a higher level of energeticexpenditure than is usual today. Energy limitation in our ancestral nutritional en-vironment may well explain our predisposition to store fat and poor ability to voidexcesses. The combined consequences of the interactions between our regulatoryphysiology and our changing nutritional environment can be seen in Figure 1.
Whereas it is not our intention here to give detailed dietary recommen-dations, our hope is that we have provided an awareness of the unconsciousappetites that shape our feeding behaviour. Managing diet and health, whetherat the level of individuals, societies or nations, requires such an understanding ifwe are to work with, rather than against, biology; otherwise, biology will alwayswin. The evidence indicates that efforts to fight our powerful protein appetite willbe bound to fail. As can be seen in Figure 11, small changes in the percentage ofprotein in the diet can potentially yield big effects on intake, with consequences –both good and bad – for weight management. Diluting protein with fat and sugarwill drive excess energy intake and promote weight gain, because more must beeaten to reach the protein target. In the extreme, sugary beverages (carbonateddrinks or fruit juice) and many high-fat and carbohydrate snack foods take theconsumer up the Y-axis in Figure 11 to infinity and no closer to the protein intaketarget, leaving the protein appetite unsatisfied. In contrast, a modest reduction infat, sugar and other readily digested carbohydrates in the diet will make it far eas-ier to limit energy intake and lose weight, by effectively concentrating protein inthe diet and allowing the protein target to be achieved at lower total energy in-take.
References1. Must A, Spadano J, Coakley EH, Field AE, Colditz G & Dietz WH (1999).
The disease burden associated with overweight and obesity. Journal of theAmerican Medical Association, 282(16): 1523–29.
2. Björntorp P (Ed) (2001). International textbook of obesity. Chichester: JohnWiley and Sons.
2 The geometry of human nutrition1
49

3. Hill JO, Wyatt HR, Reed GW & Peters JC (2003). Obesity and the environ-ment: where do we go from here? Science, 299(5608): 853–55.
4. Simpson SJ & Raubenheimer D (2012). The nature of nutrition: a unifyingframework from animal adaptation to human obesity. Princeton: PrincetonUniversity Press (in press).
5. Eaton SB, Eaton III SB, Konner MJ & Shostak M (1996). An evolutionaryperspective enhances understanding of human nutritional requirements.Journal of Nutrition, 126(6): 1732–40.
6. Prentice AM (2001). Fires of life: the struggles of an ancient metabolismin a modern world. British Nutrition Foundation Nutrition Bulletin, 26(1):13–27.
7. Prentice AM, Hennig BJ & Fulford AJ (2008). Evolutionary origins of theobesity epidemic: natural selection of thrifty genes or genetic drift followingpredation release? International Journal of Obesity, 32: 1607–10.
8. Wells JCK (2010). The evolutionary biology of human body fatness. Cam-bridge: Cambridge University Press.
9. Gibson G (2007). Human evolution: thrifty genes and the dairy queen. Cur-rent Biology, 17(8): R295–96.
10. Stubbs RJ (1998). Appetite, feeding behaviour and energy balance in humansubjects. Proceedings of the Nutrition Society, 57: 141–56.
11. Friedman MI (2000). Too many choices? A critical essay on macronutrientselection. In H-R Berthoud & RJ Seeley (Eds). Neural and metabolic controlof macronutrient intake (pp11–18). Boca Raton: CRC Press.
12. Berthoud H-R & Seeley RJ (Eds) (2000). Neural and metabolic control ofmacronutrient intake. Boca Raton: CRC Press.
13. Simpson SJ & Raubenheimer D (1997). The geometric analysis of feedingand nutrition in the rat. Appetite, 28(3): 201–13.
14. Theall CL, Wurtman JJ & Wurtman RJ (1984). Self-selection and regulationof protein:carbohydrate ratios in foods adult rats eat. Journal of Nutrition,114: 711–18.
15. Sørensen A, Mayntz D, Raubenheimer D & Simpson SJ (2008). Protein-leverage in mice: the geometry of macronutrient balancing and consequencesfor fat deposition. Obesity, 16(3): 566–71.
16. Simpson SJ, Batley R & Raubenheimer D (2003). Geometric analysis
A modern epidemic
50

of macronutrient intake in humans: the power of protein? Appetite, 41(2):123–40.
17. de Castro JM (1999). What are the major correlates of macronutrient se-lection in western populations? Proceedings of the Nutrition Society, 58(4):755–63.
18. Weigle DS, Breen PA, Matthys CC, Callahan HS, Meeuws KE, Burden VR,et al. (2005). A high-protein diet induces sustained reductions in appetite, adlibitum caloric intake, and body weight despite compensatory changes in di-urnal plasma leptin and ghrelin concentrations. American Journal of ClinicalNutrition, 82(1): 41–48.
19. Westerterp-Plantenga MS (1994). Nutrient utilization and energy balance.In MS Westerterp-Plantenga, EWHM Fredrix, AB Steffens & HR Kissileff(Eds). Food intake and energy expenditure (pp311–19). Boca Raton: CRCPress.
20. FAOSTAT database (2002). Food Balance Sheets [Online]. Available: fao-stat.fao.org/site/368/default.aspx#ancor [Accessed 31 August 2011].
21. Austin GL, Ogden LG & Hill JO (2011). Trends in carbohydrate, fat, andprotein intakes and association with energy intakes in normal-weight, over-weight, and obese individuals: 1971–2006. American Journal of ClinicalNutrition, 93(4): 836–43.
22. Fulgoni III VL (2008). Current protein intake in America: analysis of theNational Health and Nutrition Examination Survey, 2003–2004. AmericanJournal of Clinical Nutrition, 87(5): 1554S–1557S.
23. Swinburn BA, Sacks G, Lo SK, Westerterp KR, Rush EC, Rosenbaum M, etal. (2009). Estimating the changes in energy flux that characterize the rise inobesity prevalence. American Journal of Clinical Nutrition, 89(6): 1723–28.
24. Simpson SJ & Raubenheimer D (2005). Obesity: the protein leverage hy-pothesis. Obesity Reviews, 6(2): 133–42.
25. Cheng K, Simpson SJ & Raubenheimer D (2008). A geometry of regulatoryscaling. American Naturalist, 172(5): 681–93.
26. Lee KP, Simpson SJ, Clissold FJ, Brooks R, Ballard JWO, Taylor PW, etal. (2008). Lifespan and reproduction in Drosophila: new insights from nu-tritional geometry. Proceedings of the National Academy of Sciences of theUnited States of America, 105(7): 2498–2503.
2 The geometry of human nutrition1
51

27. Simpson SJ & Raubenheimer D (2009). Macronutrient balance and lifespan.Aging, 1(10): 875–80.
28. Metges CC & Barth CA (2000). Metabolic consequences of a high dietary-protein intake in adulthood: assessment of the available evidence. Journal ofNutrition, 130(4): 886–89.
29. Freedman MR, King J & Kennedy E (2001). Popular diets: a scientific re-view. Obesity Research, 9(11): 1S–40S.
30. Elsenstein J, Roberts SB, Dallal G & Salzman E (2002). High-proteinweight-loss diets: are they safe and how do they work? A review of the ex-perimental and epidemiologic data. Nutrition Reviews, 60(7 Pt 1): 189–200.
31. Weickert MO, Roden M, Isken F, Hoffmann D, Nowotny P, Osterhoff M, etal. (2011). Effects of supplemented isoenergetic diets differing in cereal fiberand protein content on insulin sensitivity in overweight humans. AmericanJournal of Clinical Nutrition, 94(2): 459–71.
32. Kyriazakis I & Emmans GC (1991). Diet selection in pigs: dietary choicesmade by growing pigs following a period of underfeeding with protein. Ani-mal Production, 52: 337–46.
33. Webster AJF (1993). Energy partitioning, tissue growth and appetite con-trol. Proceedings of the National Academy of Sciences of the United Statesof America, 52(1): 69–76.
34. Raubenheimer D & Simpson SJ (1997). Integrative models of nutrient bal-ancing: application to insects and vertebrates. Nutrition Research Reviews,10(1): 151–79.
35. Felton AM, Felton A, Raubenheimer D, Simpson SJ, Foley WJ, Wood JT,et al. (2009). Protein content of diets dictates the daily energy intake of afree–ranging primate. Behavioral Ecology, 20(4): 685–90.
36. Gosby AK, Campbell C, Badaloo A, Soares-Wynter S, Antonelli M, Hall R,et al. (2010). Design and testing of foods differing in protein to energy ratios.Appetite, 55(2): 367–70.
37. Gosby AK, Conigrave AD, Lau N, Hall R, Jebb SA, Brand-Miller J, et al.(2011). Testing the protein leverage hypothesis in lean humans. PLoS ONE,6(10): e25929.
38. Brooks RC, Simpson SJ & Raubenheimer D (2010). The price of protein:combining evolutionary and economic analysis to understand excessive en-
A modern epidemic
52

ergy consumption. Obesity Reviews, 11(12): 887–94.39. Rolls BJ (2000). The role of energy density in overcomsumption of fat.
Journal of Nutrition, 130(2): 268S–271S.40. Levitsky DA, Halbmaier CA & Mrdjenovic G (2004). The freshman weight
gain: a model for the study of the epidemic of obesity. International Journalof Obesity and Related Metabolic Disorders, 28: 1435–42.
41. Popkin BM & Duffey KJ (2010). Does hunger and satiety drive eatinganymore? Increasing eating occasions and decreasing time between eatingoccasions in the United States. American Journal of Clinical Nutrition,91(5): 1342–47.
42. Stubbs RJ, Johnstone AM, Mazlan N, Mbaiwa SE & Ferris, S. (2001). Effectof altering the variety of sensorially distinct foods, of the same macronutrientcontent, on food intake and body weight in men. European Journal of Clini-cal Nutrition, 55(1): 19–28.
43. Maillot M, Vieux F, Ferguson EF, Volatier J-L, Amiot MJ & Darmon N(2009). To meet nutrient recommendations, most French adults need to ex-pand their habitual food repertoire. Journal of Nutrition, 139(9): 1721–27.
44. Norton GN, Anderson AS & Hetherington MM (2006). Volume and variety:relative effects on food intake. Physiology & Behavior, 87(4): 714–22.
45. Brondel L, Romer M, Van Wymelbeke V, Pineau N, Jiang T, Hanus C, etal. (2009). Variety enhances food intake in humans: role of sensory-specificsatiety. Physiology & Behavior, 97(1): 44–51.
46. Nolan LJ & Hetherington MM (2009). The effects of sham feeding-inducedsensory specific satiation and food variety on subsequent food intake in hu-mans. Appetite, 52(3): 720–25.
47. Astrup A (2005). The satiating power of protein: a key to obesity preven-tion? American Journal of Clinical Nutrition, 82(1): 1–2.
48. Larsen TM, Dalskov S-M, van Baak M, Jebb SA, Papadaki A, Pfeiffer AFH,et al. (2010). Diets with high or low protein content and Glycemic Indexfor weight-loss maintenance. New England Journal of Medicine, 363(22):2102–13.
49. Ludwig DS & Ebbeling CB (2010). Weight-loss maintenance – mind overmatter? New England Journal of Medicine, 363(22): 2159–61.
50. Prentice AM & Jebb SA (1995). Obesity in Britain: gluttony or sloth. British
2 The geometry of human nutrition1
53

Medical Journal, 311: 437–39.51. Saltiel AR & Kahn CR (2001). Insulin signaling and the regulation of glu-
cose and lipid metabolism. Nature, 414: 799–806.52. Boden G (2003). Effects of free fatty acids on gluconeogenesis and
glycogenolysis. Life Sciences, 72(9): 977–88.53. Zhou Q, Du J, Hu Z, Walsh K & Wang XH (2007). Evidence for adipose-
muscle crosstalk: opposing regulation of muscle proteolysis by adiponectinand fatty acids. Endocrinology, 148(12): 5696–5705.
54. Quinn LS (2008). Interleukin-15: A muscle-derived cytokine regulatingfat-to-lean body composition. Journal of Animal Science, 86(Suppl. 14):E75–E83.
55. Newgard CB, An J, Bain JR, Muehlbauer MJ, Stevens RD, Lien LF, et al.(2009). A branched-chain amino acid-related metabolic signature that dif-ferentiates obese and lean humans and contributes to insulin resistance. CellMetabolism, 9(4): 311–26.
56. Westerterp-Plantenga MS, Lejeune MPGM, Nijs I, van Ooijen M & KovacsEMR (2004). High protein intake sustains weight maintenance after bodyweight loss in humans. International Journal of Obesity and Related Meta-bolic Disorders, 28(1): 57–64.
57. Harris M & Ross EB (Eds) (1987). Food and evolution. Philadelphia: Tem-ple University Press.
58. Barker DJP (1998). Mothers, babies and health in later life. 2nd edn. Lon-don: Churchill Livingstone.
59. Diamond J (2003). The double puzzle of diabetes. Nature, 423: 599–602.60. Richards MP, Schulting RJ & Hedges REM (2003). Sharp shift in diet at
onset of Neolithic. Nature, 425: 366.61. Ulijaszek SJ (2003). Trends in body size, diet and food availability in the
Cook Islands in the second half of the 20th century. Economics & HumanBiology, 1(1): 123–37.
62. Cassels S (2006). Overweight in the Pacific: links between foreign depen-dence, global food trade, and obesity in the Federated States of Micronesia.Global Health, 2: 10.
63. International Agency for Research on Cancer (IARC) (2002). Weight con-trol and physical activity. IARC handbook of cancer prevention, vol. 6.
A modern epidemic
54

Lyon: World Health Organization Press.64. Brand-Miller JC & Colagiuri S (1999). Evolutionary aspects of diet and in-
sulin resistance. World Review of Nutrition and Dietetics, 84: 74–105.65. Cordain L, Miller JB, Eaton SB & Mann N (2000). Macronutrient estima-
tions in hunter-gatherer diets. American Journal of Clinical Nutrition, 72(6):1589–90.
66. Milton K (2003). The critical role played by animal source foods in human(Homo) evolution. Journal of Nutrition, 133(11 Suppl. 2): 3886S–3892S.
67. Speth JD (1991). Protein selection and avoidance strategies of contemporaryand ancestral foragers: unresolved issues. Philosophical Transactions of theRoyal Society B: Biological Sciences, 334(1270): 265–70.
68. Eaton SB, Eaton III SB & Konner MJ (1997). Paleolithic nutrition revisited:a twelve-year retrospective on its nature and implications. European Journalof Clinical Nutrition, 51(4): 207–16.
69. Galef BG (1996). Food selection: problems in understanding how we choosefoods to eat. Neuroscience & Biobehavioral Reviews, 20(1): 67–73.
70. Lev-Ran A (2001). Human obesity: an evolutionary approach to under-standing our bulging waistline. Diabetes/Metabolism Research and Reviews,17(5): 347–62.
71. Nielsen SJ, Siega-Riz AM & Popkin BM (2002). Trends in energy intake inUS between 1977 and 1996: similar shifts seen across age groups. ObesityResearch, 10(5): 370–78.
72. Calle EE, Thun MJ, Petrelli JM, Rodriguez C & Heath Jr. CW (1999). Body-mass index and mortality in a prospective cohort of US adults. New EnglandJournal of Medicine, 341(15): 1097–1105.
73. Raubenheimer D & Simpson SJ (1993). The geometry of compensatoryfeeding in the locust. Animal Behaviour, 45(50): 953–64.
74. Tews JK, Repa JJ & Harper AE (1992). Protein selection by rats adaptedto high or moderately low levels of dietary protein. Physiology & Behavior,51(4): 699–712.
75. Shariatmadari F & Forbes JM (1993). Growth and food intake responses todiets of different protein contents and a choice between diets containing twoconcentrations of protein in broiler and layer strains of chicken. British Poul-try Science, 34(5): 959–70.
2 The geometry of human nutrition1
55

3Insulin resistance pathogenesis in
visceral fat and gut organismsYan Lam,1 Connie Ha2 and Andrew Holmes
Epidemiological work has shown that visceral adiposity is strongly relatedto metabolic disorders including insulin resistance. What regulates visceralfat deposition and why it is so metabolically deleterious remains largely un-clear. Recent data suggest that the gastrointestinal tract may be a centralplayer in the development of visceral fat accumulation and metabolic syn-drome. An impaired gut barrier function, as a consequence of inflammationand/or altered microbiota composition, increases the leak of microbial mol-ecules and their metabolites to the adjacent mesenteric fat resulting inhypertrophy and inflammation of the fat depot. Subsequently, the increasedefflux of fatty acids and pro-inflammatory factors in the portal vein leads toliver dysfunction and systemic insulin resistance.
Obesity is a condition in which fat accumulation in adipose tissue is in excess toan extent that health may be impaired. Obese individuals are at an increased riskof developing chronic health problems including cardiovascular disease, type 2diabetes, hypertension, non-alcoholic fatty liver disease and certain cancers [1].A subset of obese individuals, classified as ‘metabolically healthy obese’ (MHO)account for ~20% of the obese population, remain insulin-sensitive and appearto be less susceptible to obesity-related metabolic complications [2]. It has beenestimated that type 2 diabetes and cardiovascular disease is six- and twofold re-spectively more common in ‘at-risk’ obese as compared to MHO individuals [3].An important feature of MHO individuals is they have proportionally less vis-ceral fat (the abdominal fat within the visceral cavity). This is consistent withrecent data suggesting that regional fat distribution is an important determinantof insulin sensitivity and metabolic risk [4]. What regulates visceral fat deposi-tion and why it is so metabolically dangerous remains largely unclear. This article
1 Boden Institute of Obesity, Nutrition, Exercise and Eating Disorders, University ofSydney.
2 School of Molecular Bioscience, University of Sydney.
56

summarises literature on underlying mechanisms of visceral adipose dysfunctionand the emerging role of the gut, and its resident microbes, as a central player inmetabolic disorders (Figure 1).
Figure 1. Overview of interconnections between lifestyle factors, host factors and gut mi-crobiota in metabolic health. Refer to the text for a more detailed explanation anddescription of terms used.
REGIONAL FAT DISTRIBUTIONThe distribution of adipose tissue varies considerably among individuals evenwith similar total body fat. What regulates regional fat deposition is not entirelyclear but is at least known to be affected by gender, age and ethnicity. Men tendto have more visceral fat and have at least twice the proportion of fat localised inthe intra-abdominal depot as compared to women [5, 6]. The gender-specific dif-ference in fat distribution, however, appears to diminish in older age as femalestend to develop central adiposity after menopause [7]. Ethnicity also affects re-gional adiposity. Aboriginal men and women in Australia have been shown tohave greater waist-to-hip ratio as compared to their European Australian coun-terparts and the difference is observed across all BMI levels up to 30 kg/m2 [
8].
Central obesity is also more common in Hispanic as compared to white womenin early adulthood [9].
Epidemiological data suggest a relationship between central adiposity andmetabolic risk factors including elevated blood pressure, fasting plasma glucose
3 Insulin resistance pathogenesis in visceral fat and gut organisms
57

and triglycerides [10]. Visceral fat accounts for ~50% of the variance in insulinsensitivity [11, 12] and has been shown to be a predictor for future insulin re-sistance [13]. The accumulation of visceral fat is strongly related to reducedinsulin responsiveness irrespective of adiposity [6, 14]. Conversely, the associ-ation between visceral fat reduction and improved insulin sensitivity has beenconsistently demonstrated in obese [15], glucose intolerance-impaired [16] andtype 2 diabetic [17] individuals.
In contrast to visceral fat, the relationship between subcutaneous fat andmetabolic risk is less clear-cut. Wagenknechi and co-workers [18] reported thatboth visceral and subcutaneous adiposity were inversely associated with insulinsensitivity; Cnop et al. [19] estimated that subcutaneous fat only accounted for 5%of the variance in insulin sensitivity; in patients with type 2 diabetes, Miyazakiand colleagues [20] reported that insulin-stimulated glucose disposal was in-versely correlated with visceral but not subcutaneous fat area; data from theFramingham Heart Study even suggested a protective effect of subcutaneousfat against metabolic and cardiovascular risk in individuals in the highest tertileof visceral adiposity [21]. Some attributed the inconsistent relationship betweensubcutaneous fat and insulin sensitivity to different metabolic effects of the subdi-visions of the fat depot [22], with the deep subcutaneous adipose tissue exhibitinga secretory profile similar to that of visceral fat [22]. It has also been proposedthat once the accumulation of visceral adipose tissue exceeds a certain threshold,the contribution of the depot to insulin resistance would overwhelm that of ab-dominal subcutaneous fat regardless of subdivisions [23].
It is logical to hypothesise that the intrinsic difference(s) between visceraland subcutaneous adipocytes (fat cells) may contribute to the region-specificmetabolic effects of fat depots. Indeed, visceral adipocytes are shown to be bothstructurally and functionally distinct. For example, they are larger in size, lessinsulin-sensitive and have a greater lipolytic activity as compared to subcuta-neous adipocytes (for details please refer to a comprehensive review by Ibrahim[24]). These characteristics, however, do not appear to completely account for thedeleterious nature of visceral fat.
OBESITY, INFLAMMATION AND INSULINRESISTANCE
Over the past decade it has been increasingly recognised that adipose tissue is acomplex endocrine organ secreting, inter alia, a range of cytokines [25]. Togetherwith the well-characterised state of low-grade chronic inflammation in obesity[26], this points to an entirely novel angle to investigate regional metabolic effectsof fat depots. Adipose tissue produces a range of protein factors including cy-tokines, chemokines and growth factors. Leptin and adiponectin increase insulin
A modern epidemic
58

sensitivity; tumor necrosis factor (TNF)-alpha, interleukin (IL)-1beta, IL-6, IL-8and monocyte chemoattractant protein (MCP)-1 are pro-inflammatory, either bydirect activation of the inflammatory signalling pathway or by promoting themigration of immune cells; IL-10, which inhibits the production of pro-inflam-matory cytokines, is one of the main adipose-derived anti-inflammatory factors.
Epidemiological data indicate an association between chronic inflammationand decreased insulin sensitivity. Circulating levels of inflammatory markers areincreased in individuals with type 2 diabetes, insulin resistance or the metabolicsyndrome [27]. In a prospective case-control study, elevated plasma levels of IL-6and C-reactive protein were shown to be associated with an increased risk of de-veloping type 2 diabetes independent of BMI, physical activity and other lifestylefactors [28]. The role of inflammation in the pathogenesis of insulin resistance isfurther supported by the effect of high-dose aspirin, an anti-inflammatory drugcommonly used to treat rheumatoid arthritis, in reducing fasting blood glucoseand improving insulin-stimulated peripheral glucose uptake in type 2 diabetic pa-tients [29].
More importantly, there is evidence supporting inflammation as the majordeterminant of the deleterious metabolic effects of visceral fat. Compared topeople with normal fat distribution, the plasma concentrations of inflammatorymediators are up to ~50% higher in centrally obese individuals [30]. Direct com-parison of cytokine production using adipose tissue explants in vitro revealed thatvisceral fat released higher concentrations of pro-inflammatory cytokines includ-ing IL-6, IL-8 and TNF-alpha as compared to subcutaneous fat [31, 32]. Usingadipose tissue-conditioned media, we provided direct evidence for visceral fatinduction of insulin resistance in skeletal muscle in vitro [33]. Individual pro-in-flammatory cytokines, specifically IL-6 [33] IL-1beta [34] and TNF-alpha [35],have been shown to inhibit insulin signalling. Further, our data suggest that thesequential activation of nuclear factor kappa B (NFκB) and mammalian target ofrapamycin complex 1 (mTORC1) may be the common pathway which mediatesvisceral fat-induced insulin resistance [33]. Briefly, pro-inflammatory cytokinesphosphorylates inhibitor of kappa B kinase (IKK) and activates mTORC1. Ribo-somal S6 kinase 1, a downstream effector of mTORC1, phosphorylates insulinreceptor substrate-1 and inhibits its interaction with the insulin receptor and/orp85 subunit of phsophatidylinositol 3-kinase. Also, activated IKK degrades in-hibitor protein inhibitor kappa B. The subsequent nuclear translocation of NFκBinduces the transcription of pro-inflammatory cytokines and therefore provides apositive feedback to the inflammation cascade.
3 Insulin resistance pathogenesis in visceral fat and gut organisms
59

MACROPHAGE INFILTRATION IN ADIPOSETISSUE
Ameliorating fat inflammation has thus become a major focus in both preventionand treatment of type 2 diabetes. It is now recognised that in adipose the majorityof cytokines originate from ‘non-fat’ cells [36]. Obesity is characterised by anincreased accumulation of adipose tissue macrophages (ATMs) [37] which havebeen identified as the major contributor of both pro- and anti-inflammatory cy-tokines. Further, Harman-Boehm et al. [38] reported that the number of ATMwas approximately two- to fourfold higher in omental (a major visceral fat depotin human) as compared to subcutaneous fat irrespective of levels of adiposity.A causal relationship between ATM infiltration and insulin resistance has beendemonstrated in animal studies. Attenuating ATM infiltration, by genetic mod-ification or pharmacological treatment, partially improved glucose homeostasisand insulin sensitivity in diet-induced obese mice, an effect associated withreduced expression of pro-inflammatory cytokines [39]. Conversely, over-expres-sion of MCP-1, a major chemokine which promotes macrophage infiltration, inadipocytes increased ATM abundance and induced insulin resistance without af-fecting adipose tissue weight [40].
Mechanisms of macrophage infiltrationThe mechanisms by which ATM infiltration occurs, however, are not entirelyclear. It has long been proposed that macrophage infiltration is part of an immuneresponse to adipose dysfunction in obesity. A credible hypothesis is that chronicenergy excess and increased lipid accumulation leads to adipocyte hypertrophy.Limited lipid storage capacity then induces oxidative stress, which results innecrotic-like cell death and subsequently triggers an inflammatory response [41].
The increased susceptibility of visceral adipocytes to cell death may leadto differential ATM infiltration. The majority of ATMs aggregate around deadadipocytes and form the characteristic ‘crown-like structures’ (CLS). In geneti-cally (ob/ob and db/db) and diet-induced obese mice, both dead adipocytes andCLS are more abundant in visceral as compared to subcutaneous fat [42, 43]. Alinear correlation between adipocyte size and CLS density has been demonstratedin all fat depots, suggesting that visceral adipocytes may have a smaller criticalsize triggering death and therefore promotes the migration of macrophages intothis fat depot [43].
Adipocyte hypertrophy: the role of extracellular matrixIt is tempting to hypothesise that ATM infiltration, and therefore the associateddeleterious metabolic consequences, may be preventable if the fat depots could
A modern epidemic
60

expand indefinitely. The ability of adipocytes to expand is partly restricted by theextracellular matrix (ECM) and the abundance of ECM proteins determines thephysical limit to cell growth. An increased area of fibrosis has been shown in adi-pose tissue from obese individuals as compared to lean controls [44]. More impor-tantly, the mRNA (Messenger RNA) expression of collagen VI alpha3-subunit,the predominant ECM component in adipose tissue, is positively correlated withvisceral fat content but no such relationship exists with the subcutaneous depot[45]. Khan and colleagues [46] used a genetic model of collagen VI disruption anddemonstrated that the weakening of ECM structure allowed ‘stress-free’ expan-sion of adipocytes during high-fat feeding, an effect associated with a reductionin ATM infiltration and an improvement in glucose tolerance. In support, correla-tion between collagen VI and macrophage expression in adipose tissue and theirinverse relationship with insulin sensitivity has also been recently demonstratedin humans [46].
The fact that obesity is characterised by both an increase in adipocyte sizeand ECM protein abundance in the adipose tissue, however, is intriguing and ap-pears to work against the above-mentioned hypothesis. It is possible that, in thecase of obesity, the increase in ECM component is a secondary effect from thealready hypertrophic adipocytes in an attempt to restrict further lipid accumula-tion in the tissue. Mere adipocyte expansion is not physiologically viable in thelong term due to excessive demands on the endoplasmic reticulum (ER) for pro-tein folding, lipid esterification and nutrient-sensing results in ER stress [47]. Thistriggers an inflammatory response including the activation of the mitogen-acti-vated protein kinase (MAPK) signalling pathway which has been linked to insulinresistance [48]. Further, unresolved ER stress and elevated intracellular levels offree fatty acids generate oxidative stress in the mitochondria which further im-pairs cellular function of adipocytes and may eventually induce apoptotic and/ornecrotic cell death [49].
ECM regulates adipocyte size, and there is some evidence that ‘healthy’ hy-pertrophy may ameliorate adipose inflammation and obesity-associated insulinresistance. Thus, modulating ECM may provide some benefits during early obe-sity – when intervention precedes the stage at which adipocyte expansion be-comes dangerous. However, such an approach would only achieve maximallong-term benefits when treatments to prevent further energy surplus and adiposeexpansion are in place.
Phenotypic switching of macrophagesThe metabolic effects of ATMs are specific to their phenotypes. Macrophagesare broadly classified as M1 (classically activated) or M2 (alternatively activated)based on the expression of cell surface markers. M1 macrophages produce pri-marily pro-inflammatory cytokines, eg IL-1beta, IL-6 and TNF-alpha, whereas
3 Insulin resistance pathogenesis in visceral fat and gut organisms
61

M2 macrophages (which may be further subdivided into M2a, M2b and M2c)are generally responsible for tissue remodelling and down-regulation of an in-flammatory response [50]. Obese mice exhibited an increased M1:M2 ATM ratioin visceral as compared to subcutaneous fat [51] and similar findings have alsobeen reported in humans [52], suggesting the predominant effect of M1 ATMs inthe pro-inflammatory nature of visceral fat. Recent data, however, challenge thesimple M1/M2 classification system. For instance, CD11c has long been recog-nised as a typical M1 marker. In a study by Li and colleagues [50] in which micewere switched from a high-fat to a normal chow diet, the abundance of CD11c+
ATMs remained unchanged despite a reduction in the release of pro-inflamma-tory cytokines. Similar alterations in gene expression profile of CD11c+ ATMshave also been observed during the course of high-fat feeding [53], suggesting thatsuch macrophages may exhibit a spectrum of functionality. Accordingly, the in-creased ATM infiltration in visceral fat does not necessarily, by itself, result in a‘pro-inflammatory’ fat depot.
What further complicates our understanding of ATMs is their plasticity.The secretory function of macrophages is dependent on the specific microen-vironment. It has been shown that macrophages activation, as defined by theexpression of both cell surface markers and chemokines, is plastic and fully re-versible depending on the presence and withdrawal of specific stimuli [54]. Asin the case of chronic systemic inflammation in viscerally obese individuals, thiswould implicate the presence of factors that activate and maintain the ATMs inthe pro-inflammatory phenotype. The nature and range of these factors is cur-rently only poorly understood.
THE ROLE OF GUT IN METABOLICDYSFUNCTION
From leaky gut to visceral adipose expansionThe role of the gut in adipose physiology has long been recognised in patientswith Crohn’s disease (a condition characterised by severe gut inflammation).These patients have an increased ratio of intra-abdominal to total abdominal fatas compared to healthy individuals [55]. The excess accumulation of mesentericfat around the inflamed gut, known as ‘fat wrapping’, is associated with theprognosis of the disease [56] and is characterised by the increased infiltration ofimmune cells (eg macrophages and T-cells) and production of pro-inflammatoryfactors (eg IL-6 and MCP-1) [57]. Data from experimental models suggest causal-ity between gut inflammation and mesenteric fat dysfunction – rats with inducedcolitis have 35% more mesenteric fat as compared to controls [58]. Using a similar
A modern epidemic
62

model, Thomaz and colleagues [59] showed that mesenteric fat in the colitis ani-mals had increased expression of F4/80 (a macrophage marker) and TNF-alpha.Importantly, it has been shown that the effect of gut inflammation on adipose tis-sue is localised [58] and therefore implicates anatomical proximity as importantfor gut-visceral fat interactions.
Indeed, there is some evidence suggesting that gut-induced adipose dys-function may be a consequence of the direct ‘leakage’ of luminal antigens,microbiota and their metabolites through the gut wall into the adjacent mesentericfat. Gut barrier integrity is normally maintained by multiple mechanisms. First,tight-junction proteins (eg zona occludens [ZO]-1, occludins and claudins) formmulti-protein complexes to seal the space between neighbouring epithelial cellsand therefore act as a physical barrier [60]. Second, intestinal epithelial cellsproduce a wide range of anti-microbial peptides, including defensins and cathe-licidins, which serve as an immunological barrier to protect the mucosal surfacefrom microbial pathogens [61]. Inflammation impairs gut barrier function, as ev-ident by the increased gut permeability in patients with Crohn’s disease [62] andanimal models of induced inflammation [63]. In vitro, activation of the inflam-matory NFκB pathway (eg by TNF-alpha [64] and IL-1beta [65]) has been shownto disrupt tight-junction integrity by increasing the expression and activity ofmyosin light chain kinase, leading to the contraction of peri-junctional actin-myosin filaments and opening of the tight-junctions. This may result in a ‘leak’ ofbacteria and their products, as demonstrated by the translocation of bacteria intothe mesenteric fat in mice with induced-gut inflammation [63].
Mesenteric fat, therefore, is left to cope with an increased microbial loadfrom the ‘leaky’ gut. Lipopolysaccharides (LPS), a major bacterial cell com-ponent derived from the cell wall of Gram-negative bacteria, induce insulinresistance in adipocytes [66]. Further, LPS induces the release of MCP-1 andpro-inflammatory cytokines in adipocytes [67, 68] and promotes the ‘pro-inflam-matory’ polarisation of macrophages (ie increase production of IL-1, IL-6 andTNF-alpha and reduce that of the anti-inflammatory IL-10 [69]) and, thereforeresults in an inflamed fat depot. The chronic stimulation from the bacterial anti-gens also leads to activation and the subsequent enlargement of lymph nodes[70, 71], which together with the direct effect of bacterial stimuli on activatingperoxisome proliferator-activated receptor-γ and then on to adipogenesis [71], re-sults in mesenteric hypertrophy and/or hyperplasia. Mesenteric fat expansion asa consequence of the microbial leak from the inflamed gut however, may be animportant defensive mechanism to prevent further translocation of bacteria and/or their products into the visceral cavity, which in extreme cases, can be fatal.
From leaky gut to systemic dysfunctionUnfortunately the metabolic consequences of a leaky gut do not stop at visceral
3 Insulin resistance pathogenesis in visceral fat and gut organisms
63

adipose dysfunction. Following on from the inflamed and hypertrophic mesen-teric fat, more pro-inflammatory factors and free fatty acids (as a result ofincreased lipolysis of insulin-resistant adipocytes) enter the portal circulation andsubsequently lead to an inflamed, steatotic and insulin-resistant liver [72]. Thedeleterious effects of a diseased liver on carbohydrate and lipid homeostasis areobvious – reduced glucose uptake, impaired suppression of postprandial glucoserelease and over-production of fatty acids [73].
There is also the effect of bacterial components and metabolites on systemichost metabolism when they enter the circulation. Under normal circumstances,only a very small amount of endotoxins (primarily LPS) pass through the gutbarrier and reach the liver in which they are detoxified [74]. An impaired gut bar-rier function, however, will see an increased delivery of LPS into the liver. Thismay saturate the hepatic detoxification capacity and result in an ‘overflow’ ofLPS into the systemic circulation [75]. A study by Pastor Rojo et al. [76] showedthat 48% of patients with Crohn’s disease had an increased serum concentrationof endotoxins. Recently, there is also some evidence for an elevated circulatinglevel of endotoxins in overweight/obese individuals [77] and patients with type 2diabetes [78]. This phenomenon, often referred to as ‘metabolic endotoxemia’, isassociated with insulin resistance, chronic systemic inflammation and increasedcardiovascular risk [79]. The metabolic consequence of endotoxemia is directlydemonstrated in a study by Mehta and co-workers [80], in which intravenous LPSadministration in healthy humans resulted in elevated plasma concentrations ofinflammatory markers and a 35% reduction in insulin sensitivity. The molecularpathways by which LPS induces inflammation are detailed in a comprehensivereview by Lu and colleagues [81]. Briefly, LPS is first recognised in the circula-tion by the LPS-binding protein and is then transported to the target cells, whereLPS binds to CD14 and the toll-like receptor (TLR)-4/MD-2 receptor complex.After interacting with a series of adaptor proteins including myeloid differenti-ation primary response gene (MyD)-88, the net response to LPS is activation ofboth the NFκB and the MAPK signalling pathways and subsequently inductionof the expression of pro-inflammatory cytokines. It should be noted that TLR4 isubiquitously expressed in insulin-targeting tissues, eg adipose tissue, liver, skele-tal muscle and pancreatic beta-cells, and there is evidence for TLR4-inducedinflammation to inhibit insulin signal transduction (for details please refer to a re-view by Kim and Sears [82]).
In summary, the initially ‘localised’ inflammation of the gut may havedeleterious consequence on whole-body metabolism. Inflammation and the asso-ciated insulin resistance, eg in liver, adipose tissue and skeletal muscle, will thenstimulate insulin secretion from the beta-cells and subsequently results in periph-eral insulin resistance and a vicious cycle of systemic metabolic dysfunction. Thisinflammatory response involves interaction with the gut microbiota.
A modern epidemic
64

GUT MICROBIOTAAvailable evidence indicates that gut microbiota influence metabolic health ina variety of ways. The gastrointestinal tract (GIT) harbours a large microbialcommunity (total of ca 1014 cells) with very high microbial cell densities in theileum and large intestine [83, 84]. Many of the processes that occur in the GITare either encoded by microbial genomes, or strongly influenced by microbialactivity, and our physiology is a convergent of human and microbial traits [85,86]. Accordingly, we need to consider the role of gut microbial community in thepathogenesis of metabolic disorders. Each individual’s gut microbiota is unique.While 80%–90% of the gut bacteria belong to the phyla Firmicutes and Bac-teroidetes, the species involved and their relative abundances vary from person toperson [87]. This variation in microbiota composition is widely accepted to be acontributing factor to differences in host physiological outcomes.
Gut microbiota and barrier functionFunctional disruptions to the epithelial lining of GIT is characterised by an alteredmicrobial community. In fact, epithelial cells and resident bacteria are thought tobe synergistic partners in modulating gut barrier function. Gut microbiota con-tributes to barrier function through three different mechanisms. Firstly, normalmucosal resident bacteria competitively exclude other, potentially pathogenicbacteria, from attachment to the epithelial mucosa. Secondly, some gut bacteriahave been shown to promote tight-junction integrity by inducing the expressionlevels of tight-junction-related genes [88] and/or by promoting the localisation ofproteins (eg ZO-1 and occludin) in the tight-junctions [89]. Thirdly, gut bacteriaproduce substrates for the maintenance of enterocytes. Butyrate, for example, isthe primary energy source for colonic epithelial cells. In germ-free mouse mod-els, the absence of microbial butyrate resulted in the depletion of ATP level andinduced autophagy, an effect reversed by introducing exogenous butyrate or bycolonising germ-free mice with butyrate-producing bacteria [90]. These data sup-port the notion that gut microbes are directly involved in the normal functioningof epithelial cells and maintenance of gut barrier integrity.
It has long been postulated that the beneficial effect of gut bacteria is notuniversal but is confined to specific species with other species being detrimental.To date only very few species are thoroughly investigated. Initial studies fo-cused on organisms commonly isolated from the gut epithelium, eg Lactobacillusand Bifidobacterium. In gnotobiotic studies, Lactobacillus acidophilus has beenshown to inhibit cell association and the invasion of flagellated bacteria, there-fore ameliorating inflammation and improving gut barrier function [91]. Similarly,Bifidobacterium infantis increased epithelial integrity and was protective againstinflammation-induced impaired gut barrier function both in vitro and in an exper-
3 Insulin resistance pathogenesis in visceral fat and gut organisms
65

imental model of spontaneous colitis [92]. The effect of the described species (andstrains) on maintaining epithelial barrier integrity in simple models (eg monoas-sociated gnotobionts), however, does not necessarily translate to physiologicalbenefits in the natural gut system with its complex community. Lactobacillus andBifidobacterium only account for a small proportion of the gut microbial commu-nity and therefore their metabolic effects may be relatively minor as compared tothat of the more abundant genera such as Clostridium.
Recent studies have focused on investigating the function of gut microbiotaat a systems level. Using real-time quantitative polymerase chain reaction (PCR),Cani and colleagues [93] measured gut bacterial populations in ob/ob mice whichalso exhibited impaired gut permeability. They demonstrated an association be-tween systemic metabolic dysfunction (including endotoxemia and inflamma-tion) and alternations in the abundances of Bifidobacterium, Lactobacillus andClostridium coccoides-Eubacterium rectale cluster. Importantly, this study iden-tified the relationship between Clostridia and metabolic dysregulation, which hasnot been previously noted in monocolonisation studies. The role of Clostridia ingut inflammation and barrier function is further substantiated by metagenomicanalysis which examines the genomic profile of the entire gut microbial commu-nity. Metagenomic studies of gut microbiota showed that patients with inflamma-tory bowel disease had a lower relative abundance of Clostridial cluster IV andXIVa as compared to healthy controls [94]. This suggests that the absence of theseClostridial clusters may enhance gut permeability and subsequently increase hostsusceptibility to chronic inflammation. There is also some evidence suggestingthat bacteria in Clostridial cluster IV and XIVa are potent inducers of gut regu-latory CD4 T cells, which are important modulators in the initiation of immuneresponses [95].
In summary, numerous studies revealed the role of certain gut microbes inmodulating intestinal permeability. The effect of bacteria on gut health appears tobe highly species- and even strain-specific. Identifying beneficial strains will beimportant for developing nutraceutical, and even pharmaceutical, interventions toimprove gut health.
Gut microbiota and energy homeostasisGut microbiota influence host energy metabolism by modulating nutrient absorp-tion and energy storage. There is some evidence suggesting that gut bacteriastimulate angiogenesis in the small intestine epithelium and therefore increase theefficiency of nutrient absorption [96]. It is also well documented that gut micro-biota ferments dietary compounds, which are otherwise indigestible by the host,and therefore increases energy harvest.
The effect of gut microbiota on host energy homeostasis is primarily a con-sequence of short-chain fatty acids (SCFAs) production. Bacterial enzymes, eg
A modern epidemic
66

glycoside hydrolases, break down dietary polysaccharides to SCFAs such as bu-tyrate, acetate and propionate [97]. While butyrate is the primary energy substratefor colonocytes and is important for fortification of the GIT epithelial barrier, ac-etate and propionate are delivered to the liver for de novo lipogenesis throughacetyl-CoA carboxylase and fatty acid synthase. The direct effect of gut micro-biota on hepatic lipid metabolism is demonstrated in conventionalisation studies,in which the colonisation of germ-free mice with cecal content of conventionallyraised animals increased fatty acid and triglyceride synthesis in the liver and pro-moted peripheral fat storage [98]. Bacterial SCFAs may also directly modulate thesignalling pathways involved in host fat storage. SCFAs are specific ligands forat least two G protein coupled receptors, GPR 41 and GPR 43, which when defi-cient ameliorate microbe-associated energy harvest [99] and diet-induced obesity[100].
It is important to note that the interactions between gut microbiota, GIT andliver are part of the normal physiological processes in the host. Disturbances oralterations to the microbial community (collectively known as microbial dysbio-sis) however, are likely to shift the energy balance in favour of nutrient recoveryand storage. This notion is best illustrated in a series of studies by Turnbaugh,Gordon and colleagues. Germ-free mice receiving an obesity-associated micro-biota (OAM, from diet-induced obese mice) had increased fat deposition ascompared to those transplanted with a lean-associated microbiota (LAM) [101].Further, it has also been shown that OAM is enriched for genes that encodeenzymes involved in starch, sucrose, and galactose metabolism to breakdownotherwise indigestible polysaccharides [102]. These data suggest that OAM has ahigher energy harvesting potential. The increased influx of SCFAs into the sys-temic and, more importantly, the portal circulation may increases lipid load in theliver and predispose hepatic insulin resistance.
The research of gut microbiota currently focuses on unravelling microbialpopulations affected in microbial dysbiosis and the associated metabolic seque-lae. A feature of many human [103] and experimental models of obesity [104], isthat an OAM is characterised by a lower Bacteroidetes:Firmicutes ratio as com-pared to an LAM. Whether this is a generic trend across the obesity-associatedmetabolic disorders is not entirely clear. For example, patients with type 2 dia-betes have been shown to have similar Bacteroidetes:Firmicutes ratio as healthycontrols but the proportion of bacteria represented within Bacteroidetes differedin the two cohorts [105]. To date there is limited evidence suggesting the predom-inant role of a particular microbe or a specific group of bacterial species in theevents leading up to metabolic disorders. Experimental data however, stronglyindicate that the composition of gut microbiota is an important aspect of hostmetabolic phenotype. Microbial dysbiosis, therefore, should be considered as anadditional risk factor in the pathogenesis of insulin resistance and systemic meta-bolic dysregulations.
3 Insulin resistance pathogenesis in visceral fat and gut organisms
67

FUTURE DIRECTIONS: FOCUS ON IMMUNE ANDGUT SYSTEMS
The discovery of the involvement of the immune and gut systems in obesity-re-lated metabolic dysfunctions identify a subset of at-risk individuals who wouldbenefit from novel immune- and gut-targeted therapies to improve metabolichealth. Here we highlight some recent data to identify potential therapeutic tar-gets.
ImmunomodulatorsA logical approach to prevent inflammation-associated metabolic sequelae is toblock the initiation of an immune response. The chronic use of agents which non-selectively antagonise the key pro-inflammatory pathways (eg glucocorticoids),however, are often associated with immunosuppression-related side effects [106].Attempts to develop interventions to reduce localised inflammation have alsoproven to be impractical. In the gut system, inhibiting the signalling of spe-cific TLRs interferes with mucosal repair [107] and has even been shown toinduce ‘hallmark features of metabolic syndrome’ including insulin resistance,hyperlipidemia and increased adiposity [108, 109]. It then becomes apparent thata specific TLR functional deficiency is compensated by the activation of otherTLRs [108]. Further, this feedback loop appears to modulate gut microbiotaprofile [109] and therefore may subsequently lead to metabolically deleteriousphenotypes.
Promoting resolution has recently been appreciated as an alternative way tominimise the deleterious effects of inflammation. Rather than directly interferingwith the inflammatory signalling pathways, pro-resolving mediators reduce theinfiltration and, at the same time, enhance the clearance of immune cells at thesite of inflammation [106]. Accordingly, these mediators promote tissue recov-ery and therefore prevent unnecessarily prolonged inflammation. Resolvins are afamily of endogenous pro-resolution molecules which have received much of theattention. N-3 polyunsaturated fatty acids have long been recognised as anti-in-flammatory due to the preferential production of less inflammatory eicosanoids[110]. The recent discovery of the D- and E-series of resolvins, derived from do-cosahexaenoic acid (DHA; 22:6n-3) and eicosapentaenoic acid (EPA; 20:5n-3)respectively, suggests that the pro-resolving nature is another important aspectof n-3 polyunsaturated fatty acids to modulate inflammation. Human clinical tri-als of resolvins to treat inflammatory diseases including rheumatoid arthritis andinflammatory bowel disease are already underway. Consistent with the furtherrole of inflammation in obesity/diabetes, resolvin D1 administration has recentlybeen shown to reduce CLS-localised ATMs in visceral adipose tissue and im-prove insulin sensitivity in db/db mice [111]. Taken with the protective effect of
A modern epidemic
68
fish oil feeding against LPS-induced inflammation and insulin resistance [112],these results also point to the potential of resolvins as a pharmacological targetfor obesity and diabetes.
Probiotics, prebiotics and resistant starchesThe compelling evidence of the role of gut microbiota in gut functions and energymetabolism clearly indicates manipulating the microbial community as an im-portant avenue to improve metabolic health. Probiotic supplementation, whichinvolves the ingestion of live micro-organisms, is the most direct way to intro-duce specific beneficial bacteria into the gut system. Strains of several species ofLactobacillus and Bifidobacteria, eg L. plantarum [113] and B. bifidum [114] areprobiotics with consistently demonstrated health benefits. There is an emergingliterature supporting the use of probiotics supplementary to standard treatmentfor inflammatory bowel disease [115] and irritable bowel syndrome [116]. Dietaryprobiotic supplements and food fortified with probiotics (eg dairy products andinfant formulas) are also widely available for general consumption. There havebeen concerns however, about the efficacy of probiotic supplementation as theeffective dose of beneficial bacteria reaching the GIT may be highly variable andit is likely to account for only a relatively small proportion of the entire micro-bial population. Also little is known about the duration of effect so dosage maybe critical for long-term health benefits.
Supplementation of prebiotics in combination with resistant starch is analternative way to manipulate gut microbiota profile. Prebiotics are oligosaccha-rides which serve as substrates for specific gut microbes. For example inulin isa fructan preferentially used by Lactobacillus and Bifidobacteria [117]. Resistantstarch is defined as starch and/or products of starch degradation, which are notabsorbed in the small intestine, and therefore enters the colon with butyrate asa predominant product from microbial fermentation [118]. While each bacterialgenus or species has its own preferential substrates, prebiotics and resistant starchpromote the growth of specific beneficial bacterial populations and subsequentlyshifts the balance of microbial communities in a way that favours gut and meta-bolic health.
The use of food ingredients to manipulate gut microbiota composition isadvantageous to probiotics supplementation. Bioavailability becomes less of anissue, but perhaps what makes prebiotics and resistant starch a really appealingoption is their ability to modify, long term, autochthonous microbial communitiesand therefore increase the likelihood of having persisting health benefits. Thereis also the possibility of engineering dietary components to facilitate colonisationof specific microbial populations and/or to produce specific species of SCFAsto serve particular therapeutic purposes. Rats fed with diet containing 10% bu-tyrylated high-amylose maize starch, for example, had increased total SCFAs
3 Insulin resistance pathogenesis in visceral fat and gut organisms
69

and in particular butyrate content in the colon as compared to those which con-sumed non-butyrylated carbohydrates [119]. Finally, the notion of synbiotics (acombination of probiotics and prebiotics), which potentially introduce and, at thesame time, maintain beneficial microbes in the gut system, may well be the mostpromising intervention to modify gut microbiota profile and achieve maximalhealth benefits.
Gut mucosal defenceStrengthening the innate defence mechanisms against pathogens is critical tomaintain gut health. The gastrointestinal tract is coated with a mucus layer, asthe first line of defence, to protect the epithelium from both physical and chem-ical damage. Mucins, the major component of the overlaying mucus layer, areglycoproteins produced primarily by goblet cells. The highly complex oligosac-charide side-chains of mucins form a viscous lining which interacts with andtrap microbes and subsequently prevent direct contact of epithelial surface withpathogens [120]. The interaction between mucins and bacteria has also beenshown to facilitate specific patterns of bacterial colonisation [134]. A study byAn et al. [121] provided direct evidence for the role of mucins in gut function, inwhich mice deficient in the biosynthesis of core 3 O-glycans (the predominantcomponent of mucins) had increased gut permeability and were more susceptibleto experimental colitis and colorectal adenocarcinoma. Similarly, mice deficientin Muc2 (the most abundant mucin) exhibited signs of spontaneous colitis andgrowth retardation [122].
Dietary supplementations to induce mucins expression may be important toameliorate metabolic sequelae associated with gut inflammation. Probiotics (egspecific strains of Lactobacillus) have been shown to increase mRNA levels ofmucins in colonic cells in vitro [123, 124]. There is also some evidence for theability of probiotic administration to induce gene expression of mucins in animalmodels of colitis [125]. Similarly, dietary supplementation of amino acids specificto mucins production restores the colonic protein level of mucins to that in thecontrols and promotes epithelial repair in rats with experimental colitis [126].
Trefoil factors (TFF) are another group of important proteins involved in themaintenance of the mucosal barrier. Among this family of small peptides, TFF3is one of the most abundant secretory products from goblet cells. TFF3 workssynergistically with mucins to strengthen the structural integrity of the intestinalmucosal barrier [120]. TFF3 is also critical in aiding epithelial repair followinginjury by promoting epithelial restitution via the TGF-beta-dependent pathway[127]. When subjected to experimental colitis, mice deficient in TFF3 are moresusceptible to mortality and exhibit delayed mucosal healing as a consequence ofinhibited anti-apoptosis during acute inflammation [128].
TFF3 serves as a critical molecular link between microbiota and intestinal in-
A modern epidemic
70

tegrity. Commensal bacteria activate many members of the TLR family (eg TLR2and TLR4), which subsequently induce the expression of TFF3 via the Ras/MEK/MAPK and PI3K/Akt pathways [120]. Accordingly, TFF3 is the downstream ef-fector of the microbiota-initiated innate immune response. Manipulating TLRs,as we have argued earlier, might be a dangerous impairment of the innate immunesystem. However, modulating TFF3 may offer an alternate opportunity to de-velop interventions to improve gut health while bypassing the upstream effects ofmicrobiota and inflammatory and/or stress-activated pathways on epithelial func-tion. This notion is best-illustrated in a study by Podolsky and colleagues [128],in which administration of a TLR2 agonist in TFF3-/- mice and oral supplementa-tion of recombinant TFF3 in TLR2-/- mice both confer protection of the intestinalmucosa during experimental colitis.
Figure 2. The role of gut in the development of systematic in-flammation and metabolic dysfunctions.
3 Insulin resistance pathogenesis in visceral fat and gut organisms
71

CONCLUSIONInsulin resistance is central to obesity-associated metabolic dysfunctions. The lit-tle success we have in reversing the insulin-resistant state clearly suggest the needto focus on preventative measures to achieve maximal metabolic health. Recentadvances in understanding the metabolic sequelae of visceral fat deposition andgut dysfunction, summarised in Figure 2, provide unprecedented opportunitiesto both prevent and treat metabolic disorders. What is critical now is to developbiomarkers for large-scale population screening to identify individuals with highmetabolic risk and offer early preventative interventions. Dietary modificationsvia the development of fortified and functional foods, perhaps in combinationwith novel pharmaceuticals, are also promising avenues to improve metabolichealth at the population level.
References1. Reaven G (2005). All obese individuals are not created equal: insulin resis-
tance is the major determinant of cardiovascular disease in overweight/obeseindividuals. Diabetes and Vascular Disease Research, 2(3): 105–12.
2. Rasouli N, Molavi B, Elbein SC & Kern PA (2007). Ectopic fat accumula-tion and metabolic syndrome. Diabetes, Obesity and Metabolism, 9(1): 1–10.
3. Meigs JB, Wilson PW, Fox CS, Vasan RS, Nathan DM, Sullivan LM, et al.(2006). Body mass index, metabolic syndrome, and risk of type 2 diabetes orcardiovascular disease. The Journal of Clinical Endocrinology and Metabo-lism, 91(8): 2906–12.
4. Weiss R (2007). Fat distribution and storage: how much, where, and how?European Journal of Endocrinology, 157(Suppl. 1): S39–45.
5. Bjorntorp P (1990). ‘Portal’ adipose tissue as a generator of risk factors forcardiovascular disease and diabetes. Arteriosclerosis, 10(4): 493–96.
6. Wajchenberg BL (2000). Subcutaneous and visceral adipose tissue: their re-lation to the metabolic syndrome. Endocrine Reviews, 21(6): 697–738.
7. Ito H, Ohshima A, Ohto N, Ogasawara M, Tsuzuki M, Takao K, et al.(2001). Relation between body composition and age in healthy Japanese sub-jects. European Journal of Clinical Nutrition, 55(6): 462–70.
8. Piers LS, Rowley KG, Soares MJ & O’Dea K (2003). Relation of adiposityand body fat distribution to body mass index in Australians of Aboriginal andEuropean ancestry. European Journal of Clinical Nutrition, 57(8): 956–63.
A modern epidemic
72
9. Casas YG, Schiller BC, DeSouza CA & Seals DR (2001). Total and regionalbody composition across age in healthy Hispanic and white women of simi-lar socioeconomic status. The American Journal of Clinical Nutrition, 73(1):13–18.
10. Fox CS, Massaro JM, Hoffmann U, Pou KM, Maurovich-Horvat P, LiuCY, et al. (2007). Abdominal visceral and subcutaneous adipose tissue com-partments: association with metabolic risk factors in the Framingham HeartStudy. Circulation, 116(1): 39–48.
11. Kelley DE, Thaete FL, Troost F, Huwe T & Goodpaster BH (2000). Sub-divisions of subcutaneous abdominal adipose tissue and insulin resistance.American Journal of Physiology – Endocrinology and Metabolism, 278(5):E941–48.
12. Cnop M, Landchild MJ, Vidal J, Havel PJ, Knowles NG, Carr DR, et al.(2002). The concurrent accumulation of intra-abdominal and subcutaneousfat explains the association between insulin resistance and plasma leptin con-centrations: distinct metabolic effects of two fat compartments. Diabetes,51(4): 1005–15.
13. Hayashi T, Boyko EJ, McNeely MJ, Leonetti DL, Kahn SE & FujimotoWY (2008). Visceral adiposity, not abdominal subcutaneous fat area, is as-sociated with an increase in future insulin resistance in Japanese Americans.Diabetes, 57(5): 1269–75.
14. Karelis AD, St-Pierre DH, Conus F, Rabasa-Lhoret R & Poehlman ET(2004). Metabolic and body composition factors in subgroups of obesity:what do we know? The Journal of Clinical Endocrinology and Metabolism,89(6): 2569–75.
15. Lien LF, Haqq AM, Arlotto M, Slentz CA, Muehlbauer MJ, McMahon RL,et al. (2009). The STEDMAN project: biophysical, biochemical and meta-bolic effects of a behavioral weight loss intervention during weight loss,maintenance, and regain. OMICS, 13(1): 21–35.
16. Carr DB, Utzschneider KM, Hull RL, Kodama K, Retzlaff BM, BrunzellJD, et al. (2004). Intra-abdominal fat is a major determinant of the NationalCholesterol Education Program Adult Treatment Panel III criteria for themetabolic syndrome. Diabetes, 53(8): 2087–94.
17. Ibanez J, Izquierdo M, Arguelles I, Forga L, Larrion JL, Garcia-Unciti M, et
3 Insulin resistance pathogenesis in visceral fat and gut organisms
73

al. (2005). Twice-weekly progressive resistance training decreases abdomi-nal fat and improves insulin sensitivity in older men with type 2 diabetes.Diabetes Care, 28(3): 662–67.
18. Wagenknecht LE, Langefeld CD, Scherzinger AL, Norris JM, Haffner SM,Saad MF, et al. (2003). Insulin sensitivity, insulin secretion, and abdominalfat: the Insulin Resistance Atherosclerosis Study (IRAS) Family Study. Dia-betes, 52(10): 2490–96.
19. Cnop M, Landchild MJ, Vidal J, Havel PJ, Knowles NG, Carr DR, et al.(2002). The concurrent accumulation of intra-abdominal and subcutaneousfat explains the association between insulin resistance and plasma leptin con-centrations: distinct metabolic effects of two fat compartments. Diabetes,51(4): 1005–15.
20. Miyazaki Y, Glass L, Triplitt C, Wajcberg E, Mandarino LJ & DeFronzoRA (2002). Abdominal fat distribution and peripheral and hepatic insulinresistance in type 2 diabetes mellitus. American Journal of Physiology – En-docrinology and Metabolism, 283(6): E1135–43.
21. Porter SA, Massaro JM, Hoffmann U, Vasan RS, O’Donnel CJ & Fox CS(2009). Abdominal subcutaneous adipose tissue: a protective fat depot? Dia-betes Care, 32(6): 1068–75.
22. Walker GE, Verti B, Marzullo P, Savia G, Mencarelli M, Zurleni F, et al.(2007). Deep subcutaneous adipose tissue: a distinct abdominal adipose de-pot. Obesity, 15(8): 1933–43.
23. Ross R, Freeman J, Hudson R & Janssen I (2002). Abdominal obesity,muscle composition, and insulin resistance in premenopausal women. TheJournal of Clinical Endocrinology and Metabolism, 87(11): 5044–51.
24. Ibrahim MM (2010). Subcutaneous and visceral adipose tissue: structuraland functional differences. Obesity Reviews, 11(1): 11–18.
25. Rabe K, Lehrke M, Parhofer KG & Broedl UC (2008). Adipokines and in-sulin resistance. Molecular Medicine, 14(11–12): 741–51.
26. Gregor MF & Hotamisligil GS (2011). Inflammatory mechanisms in obe-sity. Annual Review of Immunology, 23(29): 415–45.
27. Crook M (2004). Type 2 diabetes mellitus: a disease of the innate immunesystem? An update. Diabetic Medicine, 21(3): 203–07.
28. Hu FB, Meigs JB, Li TY, Rifai N & Manson JE (2004). Inflammatory
A modern epidemic
74

markers and risk of developing type 2 diabetes in women. Diabetes, 53(3):693–700.
29. Hundal RS, Petersen KF, Mayerson AB, Randhawa PS, Inzucchi S, Shoel-son SE, et al. (2002). Mechanism by which high-dose aspirin improvesglucose metabolism in type 2 diabetes. The Journal of Clinical Investigation,109(10): 1321–26.
30. Panagiotakos DB, Pitsavos C, Yannakoulia M, Chrysohoou C & StefanadisC (2005). The implication of obesity and central fat on markers of chronicinflammation: The ATTICA study. Atherosclerosis, 183(2): 308–15.
31. Krysiak R, Labuzek K & Okopien B (2009). Effect of atorvastatin andfenofibric acid on adipokine release from visceral and subcutaneous adiposetissue of patients with mixed dyslipidemia and normolipidemic subjects.Pharmacological Reports, 61(6): 1134–45.
32. Bruun JM, Lihn AS, Madan AK, Pedersen SB, Schiott KM, Fain JN, et al.(2004). Higher production of IL-8 in visceral vs subcutaneous adipose tissue.Implication of nonadipose cells in adipose tissue. American Journal of Phys-iology – Endocrinology and Metabolism, 286(1): E8–13.
33. Lam YY, Janovska A, McAinch AJ, Belobrajdic DP, Hatzinikolas G, GameP, et al. (2011). The use of adipose tissue-conditioned media to demonstratethe differential effects of fat depots on insulin-stimulated glucose uptakein a skeletal muscle cell line. Obesity Research and Clinical Practice, 5:e43–e54.
34. Arkan MC, Hevener AL, Greten FR, Maeda S, Li ZW, Long JM, et al.(2005). IKK-beta links inflammation to obesity-induced insulin resistance.Nature Medicine,11(2): 191–98.
35. Austin RL, Rune A, Bouzakri K, Zierath JR & Krook A (2008). siRNA-me-diated reduction of inhibitor of nuclear factor-kappaB kinase prevents tumornecrosis factor-alpha-induced insulin resistance in human skeletal muscle.Diabetes, 57(8): 2066–73.
36. Fain JN (2006). Release of interleukins and other inflammatory cytokinesby human adipose tissue is enhanced in obesity and primarily due to the non-fat cells. Vitamins and Hormones, 74: 443–77.
37. Weisberg SP, McCann D, Desai M, Rosenbaum M, Leibel RL & FerranteAW Jr (2003). Obesity is associated with macrophage accumulation in adi-
3 Insulin resistance pathogenesis in visceral fat and gut organisms
75

pose tissue. The Journal of Clinical Investigation, 112(12): 1796–808.38. Harman-Boehm I, Bluher M, Redel H, Sion-Vardy N, Ovadia S, Avinoach
E, et al. (2007). Macrophage infiltration into omental versus subcutaneousfat across different populations: effect of regional adiposity and the comor-bidities of obesity. The Journal of Clinical Endocrinology and Metabolism,92(6): 2240–47.
39. Weisberg SP, Hunter D, Huber R, Lemieux J, Slaymaker S, Vaddi K, etal. (2006). CCR2 modulates inflammatory and metabolic effects of high-fatfeeding. The Journal of Clinical Investigation, 116(1): 115–24.
40. Kanda H, Tateya S, Tamori Y, Kotani K, Hiasa K, Kitazawa R, et al. (2006).MCP-1 contributes to macrophage infiltration into adipose tissue, insulinresistance, and hepatic steatosis in obesity. The Journal of Clinical Investi-gation, 116(6):1494–1505.
41. Cinti S, Mitchell G, Barbatelli G, Murano I, Ceresi E, Faloia E, et al. (2005).Adipocyte death defines macrophage localization and function in adiposetissue of obese mice and humans. The Journal of Lipid Research, 46(11):2347–55.
42. Strissel KJ, Stancheva Z, Miyoshi H, Perfield JW, 2nd, DeFuria J, Jick Z, etal. (2007). Adipocyte death, adipose tissue remodeling, and obesity compli-cations. Diabetes, 56(12): 2910–18.
43. Murano I, Barbatelli G, Parisani V, Latini C, Muzzonigro G, Castellucci M,et al. (2008). Dead adipocytes, detected as crown-like structures, are preva-lent in visceral fat depots of genetically obese mice. The Journal of LipidResearch, 49(7): 1562–68.
44. Spencer M, Yao-Borengasser A, Unal R, Rasouli N, Gurley CM, Zhu B, etal. (2010). Adipose tissue macrophages in insulin-resistant subjects are asso-ciated with collagen VI and fibrosis and demonstrate alternative activation.American Journal of Physiology – Endocrinology and Metabolism, 99(6):E1016–27.
45. Pasarica M, Gowronska-Kozak B, Burk D, Remedios I, Hymel D, Gimble J,et al. (2009). Adipose tissue collagen VI in obesity. The Journal of ClinicalEndocrinology and Metabolism, 94(12): 5155–62.
46. Khan T, Muise ES, Iyengar P, Wang ZV, Chandalia M, Abate N, et al.(2009). Metabolic dysregulation and adipose tissue fibrosis: role of collagen
A modern epidemic
76

VI. Molecular and Cellular Biology, 29(6): 1575–91.47. Gregor MF & Hotamisligil GS (2007). Thematic review series: Adipocyte
Biology. Adipocyte stress: the endoplasmic reticulum and metabolic disease.The Journal of Lipid Research, 48(9): 1905–14.
48. Zhang K & Kaufman RJ (2008). From endoplasmic-reticulum stress to theinflammatory response. Nature, 454(7203): 455–62.
49. de Ferranti S & Mozaffarian D (2008). The perfect storm: obesity, adipocytedysfunction, and metabolic consequences. Clinical Chemistry, 54(6):945–55.
50. Martinez FO, Sica A, Mantovani A & Locati M (2008). Macrophage activa-tion and polarization. Frontiers in Bioscience, 13: 453–61.
51. Lumeng CN, DelProposto JB, Westcott DJ & Saltiel AR (2008). Phenotypicswitching of adipose tissue macrophages with obesity is generated by spa-tiotemporal differences in macrophage subtypes. Diabetes, 57(12): 3239–46.
52. Aron-Wisnewsky J, Tordjman J, Poitou C, Darakhshan F, Hugol D, Basde-vant A, et al. (2009). Human adipose tissue macrophages: m1 and m2 cellsurface markers in subcutaneous and omental depots and after weight loss.The Journal of Clinical Endocrinology and Metabolism, 94(11): 4619–23.
53. Shaul ME, Bennett G, Strissel KJ, Greenberg AS & Obin MS (2010).Dynamic, M2-like remodeling phenotypes of CD11c+ adipose tissuemacrophages during high-fat diet-induced obesity in mice. Diabetes, 59(5):1171–81.
54. Porcheray F, Viaud S, Rimaniol AC, Leone C, Samah B, Dereuddre-Bosquet N, et al. (2005). Macrophage activation switching: an asset for theresolution of inflammation. Clinical and Experimental Immunology, 142(3):481–89.
55. Desreumaux P, Ernst O, Geboes K, Gambiez L, Berrebi D, Muller-AloufH, et al. (1999). Inflammatory alterations in mesenteric adipose tissue inCrohn’s disease. Gastroenterology, 117(1): 73–81.
56. Maconi G, Greco S, Duca P, Ardizzone S, Massari A, Cassinotti A, etal. (2008). Prevalence and clinical significance of sonographic evidence ofmesenteric fat alterations in Crohn’s disease. Inflammatory Bowel Diseases,14(11): 1555–61.
57. Bertin B, Desreumaux P & Dubuquoy L (2010). Obesity, visceral fat and
3 Insulin resistance pathogenesis in visceral fat and gut organisms
77

Crohn’s disease. Current Opinion in Clinical Nutrition and Metabolic Care,13(5): 574–80.
58. Gambero A, Marostica M, Abdalla Saad MJ & Pedrazzoli J Jr (2007).Mesenteric adipose tissue alterations resulting from experimental reactivatedcolitis. Inflammatory Bowel Diseases, 13(11): 1357–64.
59. Thomaz MA, Acedo SC, de Oliveira CC, Pereira JA, Priolli DG, SaadMJ, et al. (2009). Methotrexate is effective in reactivated colitis and reducesinflammatory alterations in mesenteric adipose tissue during intestinal in-flammation. Pharmacological Research, 60(4): 341–46.
60. Cereijido M, Contreras RG, Flores-Benitez D, Flores-Maldonado C, Larre I,Ruiz A, et al. (2007). New diseases derived or associated with the tight junc-tion. Archives of Medical Research, 38(5): 465–78.
61. Muller CA, Autenrieth IB & Peschel A (2005). Innate defenses of theintestinal epithelial barrier. Cellular and Molecular Life Sciences, 62(12):1297–307.
62. D’Inca R, Annese V, di Leo V, Latiano A, Quaino V, Abazia C, et al.(2006). Increased intestinal permeability and NOD2 variants in familialand sporadic Crohn’s disease. Alimentary Pharmacology and Therapeutics,23(10): 1455–61.
63. Cenac N, Coelho AM, Nguyen C, Compton S, Andrade-Gordon P, Mac-Naughton WK, et al. (2002). Induction of intestinal inflammation in mouseby activation of proteinase-activated receptor-2. American Journal ofPathology, 161(5): 1903–15.
64. Ye D, Ma I & Ma TY (2006). Molecular mechanism of tumor necrosisfactor-alpha modulation of intestinal epithelial tight junction barrier. Amer-ican Journal of Physiology Gastrointestinal and Liver Physiology, 290(3):G496–504.
65. Al-Sadi R, Ye D, Dokladny K & Ma TY (2008). Mechanism of IL-1beta-in-duced increase in intestinal epithelial tight junction permeability. The Jour-nal of Immunology, 180(8): 5653–61.
66. Bumrungpert A, Kalpravidh RW, Chitchumroonchokchai C, Chuang CC,West T, Kennedy A, et al. (2009). Xanthones from mangosteen preventlipopolysaccharide-mediated inflammation and insulin resistance in primarycultures of human adipocytes. Journal of Nutrition, 139(6): 1185–91.
A modern epidemic
78

67. Grisouard J, Bouillet E, Timper K, Radimerski T, Dembinski K, Frey DM, etal. (2010). Both inflammatory and classical lipolytic pathways are involvedin lipopolysaccharides-induced lipolysis in human adipocytes. Innate Immu-nity, 18 November, DOI: 10.1177/1753425910386632 [Online]. Available:ini.sagepub.com/content/early/2010/10/14/1753425910386632.full.pdf [Ac-cessed 12 January 2012].
68. Kopp A, Bala M, Buechler C, Falk W, Gross P, Neumeier M, et al. (2010).C1q/TNF-related protein-3 represents a novel and endogenous lipopolysac-charide antagonist of the adipose tissue. Endocrinology, 151(11): 5267–78.
69. Mantovani A, Sica A, Sozzani S, Allavena P, Vecchi A & Locati M (2004).The chemokine system in diverse forms of macrophage activation and polar-ization. Trends in Immunology, 25(12): 677–86.
70. Pond CM (2005). Adipose tissue and the immune system. Prostaglandins,Leukotrienes, and Essential Fatty Acids, 73(1): 17–30.
71. Peyrin-Biroulet L, Chamaillard M, Gonzalez F, Beclin E, Decourcelle C,Antunes L, et al. (2007). Mesenteric fat in Crohn’s disease: a pathogenetichallmark or an innocent bystander? Gut, 56(4): 577–83.
72. Tarantino G, Savastano S & Colao A (2010). Hepatic steatosis, low-gradechronic inflammation and hormone/growth factor/adipokine imbalance.World Journal of Gastroenterology, 16(38): 4773–83.
73. Postic C, Dentin R & Girard J (2004). Role of the liver in the control of car-bohydrate and lipid homeostasis. Diabetes and Metabolism, 30(5): 398–408.
74. Szabo G & Bala S (2010). Alcoholic liver disease and the gut-liver axis.World Journal of Gastroenterology, 16(11): 1321–29.
75. Rao R (2009). Endotoxemia and gut barrier dysfunction in alcoholic liverdisease. Hepatology, 50(2): 638–44.
76. Pastor Rojo O, Lopez San Roman A, Albeniz Arbizu E, de la Hera MartinezA, Ripoll Sevillano E & Albillos Martinez A (2007). Serumlipopolysaccharide-binding protein in endotoxemic patients with inflamma-tory bowel disease. Inflammatory Bowel Diseases, 13(3): 269–77.
77. Sun L, Yu Z, Ye X, Zou S, Li H, Yu D, et al. (2010). A marker ofendotoxemia is associated with obesity and related metabolic disorders inapparently healthy Chinese. Diabetes Care, 8 June, 33(9):1925-32. DOI:10.2337/dc10-0340 [Online]. Available: care.diabetesjournals.org/content/
3 Insulin resistance pathogenesis in visceral fat and gut organisms
79

early/2010/06/03/dc10-0340.full.pdf+html [Accessed 12 January 2012].78. Creely SJ, McTernan PG, Kusminski CM, Fisher M, Da Silva NF,
Khanolkar M, et al. (2007). Lipopolysaccharide activates an innate immunesystem response in human adipose tissue in obesity and type 2 diabetes.American Journal of Physiology – Endocrinology and Metabolism, 292(3):E740–47.
79. Manco M, Putignani L & Bottazzo GF (2010). Gut microbiota, lipopolysac-charides, and innate immunity in the pathogenesis of obesity and cardiovas-cular risk. Endocrine Reviews, 31(6): 817–44.
80. Mehta NN, McGillicuddy FC, Anderson PD, Hinkle CC, Shah R, PruscinoL, et al. (2010). Experimental endotoxemia induces adipose inflammationand insulin resistance in humans. Diabetes, 59(1): 172–81.
81. Lu YC, Yeh WC & Ohashi PS (2008). LPS/TLR4 signal transduction path-way. Cytokine, 42(2): 145–51.
82. Kim JJ & Sears DD (2010). TLR4 and insulin resistance. GastroenterologyResearch and Practice, 2010.
83. Savage DC (1977). Microbial ecology of the gastrointestinal tract. AnnualReview of Microbiology, 31: 107–33.
84. Xu J & Gordon JI. (2003). Honor thy symbionts. Proceedings of the Na-tional Academy of Sciences of the United States of America, 100(18):10452–59.
85. Camp JG, Kanther M, Semova I & Rawls JF (1989). Patterns and scales ingastrointestinal microbial ecology. Gastroenterology, 136(6): 1989–2002.
86. Bocci V (1992). The neglected organ: bacterial flora has a crucial immunos-timulatory role. Perspectives in Biology and Medicine, 35(2): 251–60.
87. Macfarlane S, Woodmansey EJ & Macfarlane GT (2005). Colonization ofmucin by human intestinal bacteria and establishment of biofilm communi-ties in a two-stage continuous culture system. Applied and EnvironmentalMicrobiology, 71(11): 7483–92.
88. Anderson RC, Cookson AL, McNabb WC, Park Z, McCann MJ, Kelly WJ,et al. (2010). Lactobacillus plantarum MB452 enhances the function of theintestinal barrier by increasing the expression levels of genes involved intight junction formation. BMC Microbiology, 10: 316.
89. Karczewski J, Troost FJ, Konings I, Dekker J, Kleerebezem M, Brummer
A modern epidemic
80

RJ, et al. (2010). Regulation of human epithelial tight junction proteins byLactobacillus plantarum in vivo and protective effects on the epithelial bar-rier. American Journal of Physiology Gastrointestinal and Liver Physiology,298(6): G851–59.
90. Donohoe DR, Garge N, Zhang X, Sun W, O’Connell TM, Bunger MK, etal. (2011). The microbiome and butyrate regulate energy metabolism and au-tophagy in the mammalian colon. Cell Metabolism, 13(5): 517–26.
91. Bernet-Camard MF, Lievin V, Brassart D, Neeser JR, Servin AL & HudaultS (1997). The human Lactobacillus acidophilus strain LA1 secretes a non-bacteriocin antibacterial substance(s) active in vitro and in vivo. Applied andEnvironmental Microbiology, 63(7): 2747–53.
92. Ewaschuk JB, Diaz H, Meddings L, Diederichs B, Dmytrash A, Backer J, etal. (2008). Secreted bioactive factors from Bifidobacterium infantis enhanceepithelial cell barrier function. American Journal of Physiology Gastroin-testinal and Liver Physiology, 295(5): G1025–34.
93. Cani PD, Possemiers S, Van de Wiele T, Guiot Y, Everard A, Rottier O,et al. (2009). Changes in gut microbiota control inflammation in obese micethrough a mechanism involving GLP-2-driven improvement of gut perme-ability. Gut, 58(8): 1091–103.
94. Frank DN, St Amand AL, Feldman RA, Boedeker EC, Harpaz N & PaceNR (2007). Molecular-phylogenetic characterization of microbial commu-nity imbalances in human inflammatory bowel diseases. Proceedings of theNational Academy of Sciences of the United States of America, 104(34):13780–85.
95. Smith PM & Garrett WS (2011). The gut microbiota and mucosal T cells.Frontiers in Microbiology, 2: 111.
96. Stappenbeck TS, Hooper LV & Gordon JI (2002). Developmental regulationof intestinal angiogenesis by indigenous microbes via Paneth cells. Proceed-ings of the National Academy of Sciences of the United States of America,99(24): 15451–55.
97. Flint HJ, Duncan SH, Scott KP & Louis P (2007). Interactions and competi-tion within the microbial community of the human colon: links between dietand health. Environmental Microbiology, 9(5): 1101–11.
98. Backhed F, Ding H, Wang T, Hooper LV, Koh GY, Nagy A, et al. (2004).
3 Insulin resistance pathogenesis in visceral fat and gut organisms
81

The gut microbiota as an environmental factor that regulates fat storage.Proceedings of the National Academy of Sciences of the United States ofAmerica, 101(44): 15718–23.
99. Samuel BS, Shaito A, Motoike T, Rey FE, Backhed F, Manchester JK, et al.(2008). Effects of the gut microbiota on host adiposity are modulated by theshort-chain fatty-acid binding G protein-coupled receptor, Gpr41. Proceed-ings of the National Academy of Sciences of the United States of America,105(43): 16767–72.
100. Bjursell M, Admyre T, Goransson M, Marley AE, Smith DM, Oscarsson J,et al. (2011). Improved glucose control and reduced body fat mass in freefatty acid receptor 2-deficient mice fed a high-fat diet. American Journal ofPhysiology – Endocrinology and Metabolism, 300(1): E211–20.
101. Turnbaugh PJ, Backhed F, Fulton L & Gordon JI (2008). Diet-induced obe-sity is linked to marked but reversible alterations in the mouse distal gutmicrobiome. Cell Host and Microbe, 3(4): 213–23.
102. Turnbaugh PJ, Ley RE, Mahowald MA, Magrini V, Mardis ER & GordonJI (2006). An obesityassociated gut microbiome with increased capacity forenergy harvest. Nature, 444(7122): 1027–31.
103. Ley RE, Turnbaugh PJ, Klein S & Gordon JI. (2006). Microbial ecology:human gut microbes associated with obesity. Nature, 444(7122): 1022–23.
104. Ley RE, Backhed F, Turnbaugh P, Lozupone CA, Knight RD & GordonJI (2005). Obesity alters gut microbial ecology. Proceedings of the NationalAcademy of Sciences of the United States of America, 102(31): 11070–75.
105. Wu X, Ma C, Han L, Nawaz M, Gao F, Zhang X, et al. (2010). Molecularcharacterisation of the faecal microbiota in patients with type II diabetes.Current Microbiology, 61(1): 69–78.
106. Uddin M & Levy BD (2011). Resolvins: natural agonists for resolution ofpulmonary inflammation. Progress in Lipid Research, 50(1): 75–88.
107. Ungaro R, Fukata M, Hsu D, Hernandez Y, Breglio K, Chen A, et al. (2009).A novel toll-like receptor 4 antagonist antibody ameliorates inflammationbut impairs mucosal healing in murine colitis. American Journal of Physiol-ogy Gastrointestinal and Liver Physiology, 296(6): G1167–79.
108. Vijay-Kumar M, Sanders CJ, Taylor RT, Kumar A, Aitken JD, SitaramanSV, et al. (2007). Deletion of TLR5 results in spontaneous colitis in mice.
A modern epidemic
82

The Journal of Clinical Investigation, 117(12): 3909–21.109. Vijay-Kumar M, Aitken JD, Carvalho FA, Cullender TC, Mwangi S, Srini-
vasan S, et al. (2010). Metabolic syndrome and altered gut microbiota inmice lacking toll-like receptor 5. Science, 328(5975): 228–31.
110. Adkins Y & Kelley DS (2010). Mechanisms underlying the cardioprotectiveeffects of omega-3 polyunsaturated fatty acids. The Journal of NutritionalBiochemistry, 21(9): 781–92.
111. Hellmann J, Tang Y, Kosuri M, Bhatnagar A & Spite M (2011). ResolvinD1 decreases adipose tissue macrophage accumulation and improves insulinsensitivity in obese-diabetic mice. The FASEB Journal, 25: 2399–407.
112. Vijay-Kumar M, Vanegas SM, Patel N, Aitken JD, Ziegler TR, Ganji V.(2011). Fish oil rich diet in comparison to saturated fat rich diet offeredprotection against lipopolysaccharide-induced inflammation and insulin re-sistance in mice. Nutrition and Metabolism, 8(1): 16.
113. Molin G (2001). Probiotics in foods not containing milk or milk con-stituents, with special reference to Lactobacillus plantarum 299v. The Amer-ican Journal of Clinical Nutrition, 73(2): 380S–5S.
114. Trebichavsky I, Rada V, Splichalova A & Splichal I (2009). Cross-talk ofhuman gut with bifidobacteria. Nutrition Reviews, 67(2): 77–82.
115. Cary VA & Boullata J (2010). What is the evidence for the use of probioticsin the treatment of inflammatory bowel disease? Journal of Clinical Nursing,19(7–8): 904–16.
116. Lee BJ & Bak YT (2011). Irritable bowel syndrome, gut microbiota and pro-biotics. Journal of Neurogastroenterology and Motility, 17(3): 252–66.
117. Gourbeyre P, Denery S & Bodinier M (2011). Probiotics, prebiotics, andsynbiotics: impact on the gut immune system and allergic reactions. Journalof Leukocyte Biology, 89(5): 685–95.
118. Topping DL, Fukushima M & Bird AR (2003). Resistant starch as a prebi-otic and synbiotic: state of the art. The Proceedings of the Nutrition Society,62(1): 171–76.
119. Clarke JM, Topping DL, Bird AR, Young GP & Cobiac L (2008). Effectsof high-amylose maize starch and butyrylated high-amylose maize starchon azoxymethane-induced intestinal cancer in rats. Carcinogenesis, 29(11):2190–94.
3 Insulin resistance pathogenesis in visceral fat and gut organisms
83

120. Kim YS & Ho SB (2010). Intestinal goblet cells and mucins in healthand disease: recent insights and progress. Current Gastroenterology Reports,12(5): 319–30.
121. An G, Wei B, Xia B, McDaniel JM, Ju T, Cummings RD, et al. (2007).Increased susceptibility to colitis and colorectal tumors in mice lackingcore 3-derived O-glycans. The Journal of Experimental Medicine, 204(6):1417–29.
122. Van der Sluis M, De Koning BA, De Bruijn AC, Velcich A, MeijerinkJP, Van Goudoever JB, et al. (2006). Muc2-deficient mice spontaneouslydevelop colitis, indicating that MUC2 is critical for colonic protection. Gas-troenterology, 131(1): 117–29.
123. Mack DR, Michail S, Wei S, McDougall L & Hollingsworth MA (1999).Probiotics inhibit enteropathogenic E. coli adherence in vitro by inducing in-testinal mucin gene expression. American Journal of Physiology, 276(4 Pt1): G941–50.
124. Mattar AF, Teitelbaum DH, Drongowski RA, Yongyi F, Harmon CM &Coran AG (2002). Probiotics up-regulate MUC-2 mucin gene expression ina Caco-2 cell-culture model. Pediatric Surgery International, 18(7): 586–90.
125. Amit-Romach E, Uni Z & Reifen R (2010). Multistep mechanism of probi-otic bacterium, the effect on innate immune system. Molecular Nutrition andFood Research, 54(2): 277–84.
126. Faure M, Mettraux C, Moennoz D, Godin JP, Vuichoud J, Rochat F, etal. (2006). Specific amino acids increase mucin synthesis and microbiota indextran sulfate sodium-treated rats. Journal of Nutrition, 136(6): 1558–64.
127. Sturm A & Dignass AU (2008). Epithelial restitution and wound healingin inflammatory bowel disease. World Journal of Gastroenterology, 14(3):348–53.
128. Podolsky DK, Gerken G, Eyking A & Cario E (2009). Colitis-associatedvariant of TLR2 causes impaired mucosal repair because of TFF3 deficiency.Gastroenterology, 137(1): 209–20.
A modern epidemic
84
4Pancreatic beta-cell failure in thepathogenesis of type 1 diabetes
Alexandra Sharland1
In essence, it is the failure of the cell known as the pancreatic beta cellto make and secrete adequate insulin, that leads to the development of allforms of diabetes mellitus. Type 1 diabetes is caused by immune destruc-tion of pancreatic beta cells. While multiple pancreatic beta-cell autoanti-body positivity is strongly associated with the progression to diabetes, itis not clear whether autoantibodies can cause initial beta-cell destruction,or whether antibody production is only triggered after episodes of beta-celldeath have already occurred leading to clinical onset of type 1 diabetes. In-deed even though many of the major T cell autoantigens are derived fromthe same proteins recognised by the immune cells known as B cells, it iscurrently thought that type 1 diabetes is mainly mediated by subsets ofeffector T cells. Documented epidemiological data suggest environmentalfactors act upon a background of genetic susceptibility to establish pan-creatic islet inflammation known as ‘insulitis’ and subsequent beta-celldysfunction and loss. Understanding the nature of the environmental fac-tors contributing to insulitis, beta-cell loss and the development of type1 diabetes may provide the key to developing interventions to preventor delay onset in at-risk individuals. To date, no clinical trials includingimmune-based approaches aimed at preventing type 1 diabetes onset inhigh-risk individuals have proven effective. This chapter will focus uponthe evidence for genetic susceptibility, and some of the putative environ-mental triggers in type 1 diabetes which may ultimately lead to methods toprotect beta cells, and to stimulate residual beta-cell function or regenera-tion without ongoing immune destruction.
Type 1 diabetes mellitus is an autoimmune disease with very well-defined geneticsusceptibility. Individuals with a strong genetic predisposition to type 1 diabetes
1 Collaborative Transplantation Research Group, University of Sydney.
85

typically develop one or more autoantibodies against islet antigens, and grum-bling islet inflammation or insulitis ensues, with slow destruction of the islets andattrition of the islet cell mass over a number of years. In most cases, clinical di-abetes develops before the complete destruction of islet beta cells has occurred,whereas absence of functioning beta cells is the rule in longstanding type 1 dia-betes.
Although this pathway represents the characteristic pattern of disease pro-gression, many aspects of the pathogenesis of type 1 diabetes are incompletelyunderstood. Not all individuals with a genetic predisposition develop diabetes.Disease incidence can be influenced by additional genes inherited concurrentlywith the known high-susceptibility alleles, and by environmental factors. Insulitiscan be difficult to detect, and when present, is often patchy. Whilst most patientswith type 1 diabetes have one or more pancreatic islet autoantibodies detectableat the time of diagnosis, and the risk of developing diabetes increases with thenumber of autoantibodies an individual is producing, a small number of patientsnever have detectable islet autoantibodies. The progression from susceptibility toautoantibody production and beta cell loss is usually steady and inexorable, yetsome elements of this process may be reversible. Animal studies have demon-strated the potential for islet beta cells to regenerate after the onset of clinicaldiabetes – such regeneration may be possible in humans as well, and offers a po-tential target for therapeutic intervention. These and other areas of current interestand controversy will be discussed further in the following sections.
GENETIC SUSCEPTIBILITY TO TYPE 1 DIABETESOver 40 gene loci have now been identified as being linked to the risk of de-veloping type 1 diabetes [1]. Consistent with the notion of type 1 diabetes as anautoimmune disease, essentially all these genes influence the immune system atsome level, thus affecting its ability to mount a response against islet autoanti-gens. The strongest predisposition to diabetes development is conferred by genesfound in the Human Leucocyte Antigen complex on the short arm of chromosome6, particularly the HLA class II loci, DR and DQ [2]. The highest-risk genotypeincludes some combination of HLA DR3 or DR4 with HLA DQ2 or DQ8. Thisgenotype is present in around 2.4% of newborns, but its representation is muchgreater amongst individuals with diabetes [3]. Infants with this gene combinationhave a greater than 50% chance of developing type 1 diabetes by age 12, and thisrisk is increased further if an HLA-identical sibling is already affected by diabetes[3]. Conversely, other class II alleles such as DQ 0602, are associated with dom-inant protection from diabetes, even amongst autoantibody-positive first-degreerelatives of patients with type 1 diabetes [4]. The function of HLA DR and DQmolecules is to present antigens to CD4-positive helper T cells, thus initiating a
A modern epidemic
86

cognate immune response. Structural and computational studies of susceptibilityand protective alleles have revealed a number of shared features which modifythe ability of these class II molecules to present peptides derived from islet au-toantigens to responding T cells [5]. Charged residues at critical positions withinthe peptide binding groove allow diabetogenic peptide epitopes to bind stronglywith slow dissociation kinetics, promoting the priming of a range of autoreac-tive CD4+ T cells [5]. Consistent with these observations, possession of particularHLA DQ alleles is linked to antibody specificity, such that DQ8 is associatedwith the presence of insulin autoantibodies, and DQ2 is found in subjects withantibodies against glutamic acid decarboxylase (GAD65) [6]
HLA class I genes are also associated with diabetes susceptibility, and thepresence of the common HLA A2 allele further increases the likelihood of de-veloping diabetes in individuals with high-risk class II alleles [7, 8] Possession ofHLA B39 increases overall risk, and is linked with earlier onset of disease [9].HLA class I molecules present antigens to CD8+ T cells, the cell subset directlyimplicated in the final phase of islet destruction. A growing body of evidencesupports a functional role for HLA-A2 in the display of antigenic peptides de-rived from insulin precursors and GAD on the beta-cell surface, thus triggeringbeta-cell killing by CD8+ T cells which recognise these antigens [10, 11, 12].
Autoimmunity arises from a failure of development or maintenance of self-tolerance, where either the deletion of potentially autoreactive T cells in thethymus, or the generation of regulatory T cells which can suppress autoreactivityin the periphery, is inadequate. Two rare single gene (or monogenic) disorderswhich affect these processes result in severe generalised autoimmunity, withdiabetes as one manifestation. These conditions are known as IPEX (immunedysregulation, polyendocrinopathy, enteropathy, X-linked) in which regulatory Tcells fail to develop appropriately due to a mutation in the FoxP3 transcriptionfactor [13, 14], and APECED (autoimmune polyendocrinopathy – candidiasis – ec-todermal dystrophy) where a defect in the protein AIRE prevents expression ofotherwise tissuespecific genes (such as insulin) in the thymus, and blocks gener-ation of self-tolerance to the proteins encoded by those genes [15]. Reminiscentof the mechanism underlying APECED, polymorphisms in the promoter of theinsulin gene confer susceptibility to type 1 diabetes if they bind poorly to AIRE,and reduce insulin expression in the thymus [16, 17].
Recent advances in high-throughput sequencing technology have enabledgenome-wide association studies (GWAS) to be performed in type 1 diabetes andother common disorders. These studies have confirmed that a number of otherloci involved in the regulation of T cell function influence the likelihood of de-veloping diabetes [18]. Such genes include PTPN 22, which encodes a tyrosinephosphatise which regulates T cell receptor signalling, and the genes encodinginterleukin 2 receptor alpha chain and the co-inhibitory molecule CTLA4 [19].
4 Pancreatic beta-cell failure in the pathogenesis of type 1 diabetes
87

Genes involved in innate immune responses to microorganisms have also beenlinked with diabetes susceptibility in recent studies, and intriguingly, these find-ings suggest one mechanism whereby genetic susceptibility can interact withenvironmental exposures to result in disease. IFIH1 is a gene which encodes theintracellular pathogen receptor MDA5 [19, 20]. MDA5 triggers immune responsesto viral RNA derived from the enterovirus family, of which Coxsackie viruses area member, and there is considerable circumstantial evidence linking Coxsackieinfection with diabetes onset. Other intracellular nucleic acid receptors recentlymapped in type 1 diabetes include the toll-like receptors TLR7 and TLR8 [21].
ENVIRONMENTAL FACTORS AND TYPE 1DIABETES
Whilst the growing epidemic of type 2 diabetes is common knowledge, it is lesswell appreciated that worldwide incidence of type 1 diabetes has been rising overthe past few decades as well [22, 23]. Moreover, there has been a shift towardsonset of clinical diabetes at an earlier age, such that the prevalence rate in indi-viduals aged younger than 15 years is projected to increase by 70% between 2005and 2020 [24]. These rapid changes in incidence and in age of onset, along withthe lower than expected concordance between monozygotic twins, are character-istic of the operation of environmental factors upon a background susceptibility[25]. Consistent with the idea that the highest-risk genotypes require the least en-vironmental pressure to result in overt diabetes, the changes in incidence havebeen most pronounced amongst those with moderate, rather than extreme ge-netic susceptibility [26]. In Australia, the incidence of type 1 diabetes in childrenwith the highest risk alleles has remained stable over time, as has age at diag-nosis. Conversely, a greater proportion of children with moderate-risk alleles isdeveloping diabetes, and is doing so at a younger age [27]. Other hallmarks of en-vironmental influence, such as seasonal variations in onset of clinical diabetes,are also largely confined to those at moderate genetic risk [28]. Understanding thenature of the environmental factors contributing to the development of overt dia-betes may provide the key to developing interventions to prevent or delay onset inat-risk individuals, and there is considerable research concentration in this area.In this section, we will discuss the evidence for some of the putative environmen-tal triggers of diabetes.
Viral infectionsInfections with several viruses have been plausibly associated with the devel-opment of type 1 diabetes. 22% of children infected with rubella in utero laterdeveloped type 1 diabetes [29], and cross-reactivity between T cells recognising
A modern epidemic
88

both rubella and GAD-derived peptides was demonstrated [30]. However, it nowappears that impairment of islet development following pancreatic infection withrubella, rather than islet autoimmunity, may be the mechanism of rubella-associ-ated type 1 diabetes [31].
Data linking infection with enterovirus or rotavirus to diabetes onset are tan-talising, and evidence to support a potential pathogenetic role for these infectionsexists. Nevertheless, these findings have not been consistent across all groupsstudied, perhaps reflecting the complexity of the interactions between individualsusceptibility and environmental factors as well as differences in study method-ology.
In the longitudinal Diabetes Prediction and Prevention (DIPP) study fromFinland, enterovirus infections were reported in the majority of subjects devel-oping islet autoantibodies in the six months preceding initial antibody detection,whereas significantly fewer children without autoantibodies had been infected[32]. Other large longitudinal studies of genetically at-risk cohorts did not confirmthese findings [33, 34]. Seemingly conflicting results may arise because differentsubstrains of the same virus may not be differentiated by routinely available sero-logical testing, and yet may have different diabetogenic potential. In addition,identical viruses could have different effects upon progression if encountered atdifferent stages in the natural history of the disease [35].
Fulminant type 1 diabetes is an entity described in Japan, where direct in-fection of the islets and exocrine pancreas with enterovirus leads to upregulationof chemokine and cytokine secretion by islets, triggering infiltration with aggres-sive T cells and macrophages, and islet destruction within a matter of days [36].However, pancreatic infection with enterovirus family members is also reportedin diabetes cases with a less dramatic onset. Coxsackie virus is tropic for humanbeta cells, and virus-positive beta cells have been demonstrated in pancreas spec-imens from studies in children succumbing to severe metabolic complications ofdiabetes close to diagnosis, but not from control pancreata [37]. At symptom on-set, multiple enterovirus nucleic acid sequences were identified in the peripheralblood cells of 50% of subjects, compared with 0% of age and sex-matched con-trols [38]. Moreover, T cells from a majority of recent-onset subjects proliferatedin response to Coxsackie viral lysates [39]. One criticism of these data was that thecontrols were not matched with respect to diabetes risk, but recent reports fromboth the Diabetes Autoimmunity Study in the Young (DAISY) and DIPP stud-ies have addressed these concerns. Amongst high-risk children with multiple isletautoantibodies, progression to clinical diabetes was significantly more frequentin those with evidence of a recent enterovirus infection than in those without [40,41]. In addition to direct infection of the pancreas with enteroviruses such as Cox-sackie, molecular mimicry between viral antigens and islet autoantigens has beenpostulated to trigger T cell reactivity against islets (discussed in [42]). The P2Cnon-structural protein of a diabetogenic strain of Coxsackie virus B4 shares ex-
4 Pancreatic beta-cell failure in the pathogenesis of type 1 diabetes
89
tensive sequence similarity with GAD65, and virtually identical highly antigenicpeptides can be derived from the two proteins [43].
Rotaviruses are double-stranded RNA viruses belonging to the Reovirusfamily. They are ubiquitous in the environment, and are the most frequent causeof gastroenteritis in young children [44]. The first indication that these agents maycontribute to the development of type 1 diabetes came from studies demonstratingstrong sequence homology between the rotavirus VP7 antigen and two epitopesrecognised by islet-reactive T cells, one in GAD and one in IA-2 [45]. Longitudi-nal studies attempting to determine whether rotavirus exposure is associated withdiabetes development have yielded varying results. The Australian BabyDiabstudy of at-risk children reported strong concordance between the appearance ofislet autoantibodies and the detection of rotavirus-specific antibodies. Repeatedrotavirus infection appeared to boost levels of anti-islet antibodies and coincidedwith epitope spreading and an increase in the number of autoantibody specifici-ties present [46]. A later Finnish study failed to confirm these observations [47].However, differences in the methodology used for determining rotavirus expo-sure may have contributed to this negative finding.
Lifestyle factorsVarious other aspects of the modern lifestyle could be influencing the rise inincidence of type 1 diabetes (reviewed in [48]). Many of these (increased con-sumption of high-energy foods and foods containing trans-fatty acids, fructose oradvanced glycation end-products, reduced energy expenditure due to declininglevels of physical activity and maintenance of ambient temperatures within thethermoneutral zone for most of the time, reduced sleep duration) act throughthe mechanism of increasing insulin resistance, which will be discussed furtherbelow. In a seeming paradox, although exposure to some pathogenic viruses islinked to the development of type 1 diabetes, widespread adoption of clean liv-ing conditions with prevention or delay of exposure to environmental pathogenshas also been implicated in the rise of autoimmune and allergic conditions, a the-ory termed the ‘hygiene hypothesis’ [49]. Changes in commensal gut bacteria, byincreasing energy extraction from the diet, may also predispose to obesity and in-sulin resistance [50]. Finally, exposure to sunlight and consequent generation ofvitamin D has progressively declined in many developed and developing coun-tries over the past few decades. Several epidemiological studies have shown aninverse correlation between vitamin D intake and the incidence of type 1 diabetes[51, 52], and this link has been strengthened by the demonstration of protectionagainst type 1 diabetes development by vitamin D administration in primary pre-vention studies in at-risk populations [53, 54].
A modern epidemic
90

Insulin resistance and type 1 diabetesInsulin resistance in children and adults in the developed and developing worldhas been increasing in parallel with the rise in overweight and obesity, and couldbe making a significant contribution to the rising incidence of type 1 diabetes, inaddition to its acknowledged role in type 2 diabetes. Analyses of a number of in-dependent cohorts from Europe, the US and Australia have demonstrated that ageat onset of type 1 diabetes was inversely proportional to body mass index (BMI)[55]. Not surprisingly, BMI was higher in subjects with moderate genetic risk,compared to those with high risk, and direct measurements of insulin sensitiv-ity during metabolic testing confirmed that insulin resistance was an independentrisk factor for progression to clinical type 1 diabetes in individuals with isletautoimmunity [56]. There are several ways in which insulin resistance could ac-celerate the development of type 1 diabetes in those with an underlying geneticpredisposition. Insulin resistance means that the beta cells are obliged to increaseinsulin production in order to maintain blood glucose within the physiologicalrange. Metabolic upregulation results in increased production of insulin precur-sor proteins as well as the cellular enzymes GAD and IA-2. Increased productionresults in increased presentation of peptides derived from these molecules on thesurface of the beta cell, thereby increasing the chances of the beta cell being de-stroyed by a cytotoxic T cell which recognises these peptides. Insulin resistanceper se ‘accelerates the rate of beta-cell apoptosis through glucotoxicity and lipo-toxicity’ [57]. Furthermore, patients would be expected to cross the threshold atwhich remaining beta-cell function is no longer able to maintain glucose home-ostasis at an earlier stage of beta-cell loss, in the presence of insulin resistance.
PATHOGENESIS AND DISEASE PROGRESSION
Beta cells and autoantibodies in type 1 diabetesThe principal autoantibodies in type 1 diabetes recognise four islet autoantigens:insulinoma-associated antigen-2 (I–A2), insulin (micro IAA or mIAA), the 65kD isoform of the enzyme glutamic acid decarboxylase (GAD65) and zinc trans-porter 8 (ZnT8) [58]. Whilst autoantibody positivity is strongly associated withthe progression to diabetes, especially when antibodies against multiple isletdeterminants are present [59], it is not clear whether autoantibodies can causebeta-cell destruction, or whether antibody production is only triggered afterepisodes of beta-cell death have already occurred [60]. Antibody-producing Bcells may also play a role in the pathogenesis of type 1 diabetes as professionalantigen-presenting cells for T cells. In this regard, B cells can use their surfaceantibody to capture islet autoantigens before processing and presenting them toCD4+ T cells. B cells in turn receive help from the T cells which culminates in in-
4 Pancreatic beta-cell failure in the pathogenesis of type 1 diabetes
91

creased antibody secretion. This role of B cells is consistent with the observationthat many of the major T cell autoantigens are derived from the same proteinsrecognised by B cells [61, 62, 63].
InsulitisInfiltration of the pancreatic islets with lymphocytes (‘insulitis’) in patients whosuccumbed to diabetic complications close to the time of presentation was firstnoted in the 1960s [64] and has since been considered a hallmark of type 1 di-abetes. Cross-sectional studies of tissues obtained close to diagnosis can yieldimportant information about the final pre-clinical stages of the disease. Advancesin the management of metabolic complications of diabetes mean that patients nowrarely die with ketoacidosis, and most data are derived from historical collectionsof tissue [65]. Painstaking re-analysis of one such large cohort affirmed earlierobservations that the degree of insulitis varied not only between patients but be-tween regions of the pancreas and between individual islets [63, 65, 66, 67]. Theinvestigators subdivided islets according to the percentage of remaining insulin-positive cells. The numbers of infiltrating cells increased as insulin-positive cellnumbers declined, reaching a peak when less than 10% of insulin-containing cellsremained. The density of infiltrate was then dramatically reduced in islets lack-ing insulin positivity. Although this was a cross-sectional study, the differentcategories of islets were interpreted as representing stages in the progression tobeta-cell destruction, which was proceeding asynchronously [68]. At all stages,CD8+ T cells predominated in the infiltrate. B cells were preferentially found inmore inflamed islets, whilst macrophages were a constant presence, albeit lessfrequent than CD8+ T cells. In this study, at least some degree of insulitis wasfound in all pancreas specimens, and overall, insulitis was detected in 12% ofislets examined [68]. The observation that the density of the infiltrate increasessubstantially once beta-cell loss has reached a critical threshold is consistent withthe idea that the drive to maintain glucose homeostasis upregulates the metabolicactivity of the remaining beta cells, causing antigenic peptides to be producedand displayed on the cell surface in increasing amounts. This increases beta-cellsusceptibility to CD8+ T cell-mediated killing and hastens the decline of the re-maining beta-cell mass.
Much could be learned from the systematic histological study of the pancreasin at-risk and pre-diabetic individuals, as well as those with clinical diabetes ofvarying durations. However, obtaining tissue samples from these groups has pre-viously been all but impossible. Recent initiatives have aimed to fill this void inour knowledge by screening organ donors for the presence of islet autoantibod-ies, and examining specimens of the pancreata of antibody-positive subjects. Onesuch study of 62 antibody-positive donors found evidence of insulitis in only two
A modern epidemic
92
individuals, a surprising result which led researchers to question the central roleof islet inflammation in progression to diabetes [69]. Closer examination of thestudy cohort reveals that the two donors with insulitis were the only subjects with≥3 autoantibodies, and also possessed high-risk HLA-DQ alleles. The increasedage of this donor population compared with the usual age of onset of type 1 DM,single and low-titre antibody positive status of most of the subjects and relativelysmall number of islets examined per pancreas may all have contributed to thepaucity of insulitis noted, and may mean that these findings do not reflect the gen-eral situation in prediabetes.
Efforts to gather pancreatic tissue from deceased organ donors of all ageshave continued, largely under the auspices of the network for pancreatic organdonors with diabetes (nPOD), a program established by the Juvenile DiabetesResearch Foundation. One of the first studies to be reported as a result of thisinitiative revealed that 30% of pancreata from donors with longstanding type 1diabetes still contained numerous insulin positive cells in at least some islets [70].Two distinct histological patterns were detected – one with patchy distributionof insulin-positive cells in a fraction of islets, co-incident with the upregulationof pro-survival signals in these islets. The second pattern was characterised bythe presence of residual insulin-positive cells in 100% of islets. Subjects withthis pattern were typically islet autoantibody-negative, and lacked high-risk HLAclass II alleles, yet their disease displayed metabolic hallmarks of type 1 diabetes,including episodes of ketoacidisis [70]. These studies suggest that the pathogen-esis of type 1 diabetes may be more heterogeneous than previously appreciated,and, at least a subset of patients have the potential to benefit from treatment ap-proaches which stimulate residual beta-cell function or regeneration. More than60 projects are currently underway using tissues collected through nPOD, andhopes are high that further new insights into diabetes pathogenesis will soonemerge from these.
Non-invasive imaging and monitoring of T cell functionImaging of pancreatic islets and cells in vivo has to date proven very difficultin humans. The capacity to non-invasively screen for and sequentially monitorislet inflammation in at-risk, pre-diabetic, or type 1 diabetes patients would allowmuch greater refinement of risk stratification as well as enabling direct and timelyassessment of the effect of interventions. In animal models of type 1 diabetes,the onset of insulitis is accompanied by increased ‘leakiness’ of the small bloodvessels supplying the islets [71]. Magnetic Resonance Imaging (MRI) can be usedto capture signals from injected magnetic nanoparticles, which exit the circula-tion through the leaky vessels and are engulfed by infiltrating macrophages in thepancreas. A recent report demonstrates that this imaging method can be adaptedfor use in humans, and is able to differentiate between subjects with recent-onset
4 Pancreatic beta-cell failure in the pathogenesis of type 1 diabetes
93

diabetes and controls [71]. Further development and more widespread adoptionof this and other non-invasive imaging techniques, such as positron-emission to-mography [72], have the potential to greatly increase our understanding of type 1diabetes pathogenesis.
Efforts are being made to develop and validate assays of cell-mediated anti-islet reactivity which might be used to monitor changes in T cell function inthose at risk for type 1 diabetes development, and subjects in prevention and earlyintervention trials of immunomodulation. A recent workshop sponsored by theImmune Tolerance Network evaluated two such assays for CD4+ T cells, a cel-lular immunoblot and a T cell proliferation assay [73]. Overall, these assays per-formed reasonably well in distinguishing patients with new-onset diabetes fromnormal controls with sensitivities of 94% and 58%, and specificities of 83% and91%, respectively. Combination of the assays improved sensitivity, whilst main-taining specificity [73]. For CD8+ T cells, an islet-specific ELISPOT assay hasbeen developed (ISL8SPOT, [74]). This assay measures interferon gamma-pro-ducing T cells in response to stimulation with a mixture of HLA-A2-restricted,beta cell-derived peptide epitopes. Beta cell-specific CD8+ T cells can thus bequantitated directly from unfractionated peripheral blood mononuclear cells. IS-L8SPOT responses were clearly detectable in newly diagnosed patients with type1 diabetes, but waned rapidly over the following six to 12 months as the rate ofbeta-cell destruction declined. Autoantibody levels remained constant over thisperiod, suggesting that the T cell functional assays were more likely to reflectthe patients’ current immunological status than autoantibody titres [75]. HLA-A2tetramers loaded with beta cell antigenic peptides are another tool which can beused to detect and quantitate islet-reactive CD8+ T cells [
76]. These various as-
says are currently being evaluated for their suitability in monitoring responses toimmunomodulatory treatments, and further information about these applicationsshould soon become available.
On the opposite side of the T cell balance from the destructive effector cellsare regulatory T cells, and attempts have also been made to assess regulatory Tcell activity in type 1 diabetes. No consistent difference in the numbers of periph-eral blood regulatory T cells have been identified between subjects with type 1diabetes and normal individuals. Nonetheless, natural T regs isolated from type 1diabetes patients are less potent suppressors than those isolated from control sub-jects, suggesting that function, rather than absolute number of these cells makesthe paramount contribution to the disease state [77].
Interventions in at-risk individualsThe idea of being able to intervene in at risk or pre-diabetic individuals toprevent the onset of clinical diabetes is enormously appealing. Even with the
A modern epidemic
94

most accurate predictive identification of high-risk groups, it should be remem-bered that not all members will develop diabetes. As a corollary, such trials mustinvolve large numbers of subjects, and are very costly to conduct. Any inter-ventions tested must be inherently very safe to maintain a balance between therisks and potential benefits to the participants. Interventions can be categorisedas either non antigen-specific, or specific to various islet autoantigens. Dietarymodifications are non antigen-specific interventions, and dietary substitutes andsupplements studied in this way include hydrolysed cows’ milk formula (Trialto Reduce IDDM in Genetically at Risk (TRIGR) study, [78]), vitamin D3 [79],Omega-3 fatty acids [80] and nicotinamide [81]. Another subgroup of preventiontrials has aimed to induce specific tolerance to islet autoantigens by administer-ing them via a route that is generally non-immunogenic. Accordingly, insulin hasbeen given orally or intranasally to at-risk subjects. Whereas nicotinamide hasbeen ineffective, early studies of vitamin D supplementation and of hydrolysedcow’s milk formula have shown some benefit [82] and these interventions are nowundergoing further evaluation. Results of insulin administration have been equiv-ocal thus far [83].
The honeymoon phase and beta-cell regenerationUp to 60% of patients newly diagnosed with type 1 diabetes achieve some im-provement in functional beta-cell mass as measured by secretion of c-peptide andreduction in exogenous insulin requirement, after the initiation of insulin replace-ment therapy [84]. This period is often referred to as the ‘honeymoon phase’. Themechanisms governing this short-lived improvement in function are incompletelyunderstood, but probably involve restoration of function to insulin-depleted betacells, perhaps accompanied by some true expansion of beta-cell mass [85].
A subset of patients with type 1 diabetes maintains small populations offunctioning beta cells for many years after the onset of clinical type 1 diabetes[85], and these patients may be particularly amenable to therapies which aim torestore or improven glucose homeostasis via regeneration of existing beta-cellmass. In mouse models, three different mechanisms have been shown by differentgroups to result in the generation of new beta cells [87]. Replication of existingbeta cells was responsible for beta-cell regeneration after subtotal ablation of betacells in a transgenic mouse model [88], while recent reports have demonstratedthat both beta-cell neogenesis from ductal precursors [89] and transdifferentiationfrom glucagon-secreting islet alpha cells [90, 91] can also occur under some cir-cumstances. In the human pancreas, staining for the nuclear proliferation markerKi-67 suggests that mature, differentiated beta cells can replicate, though thebasal rate of replication is low (reviewed in [92]). Data supporting the existenceof the other two mechanisms in humans are scant.
Arresting autoimmune islet destruction may allow beta-cell regeneration to
4 Pancreatic beta-cell failure in the pathogenesis of type 1 diabetes
95

emerge, but in adult humans, it is not clear whether this alone could be sufficientto reconstitute beta-cell mass and restore glucose homeostasis. In order to harnessthe potential of beta-cell regeneration, it is essential to understand how beta-cellturnover is controlled, and whether this could be manipulated in such a way as toproduce a net accumulation of functional beta-cell mass. Murine studies indicatethat a critical driver of beta-cell replication is glycolytic flux in the beta cell it-self, reflected in the activity of the enzyme glucokinase [93]. Under physiologicalconditions, this is proportional to blood glucose levels, but glucokinase activitycan be modified by a novel class of small-molecule drugs, the glucokinase ac-tivators, and thus represents a potential target for intervention [94]. Glucokinaseactivators are currently under development for the treatment of type 2 diabetes.They act by increasing the glucose affinity and maximum velocity of glucoki-nase [94]. Administration of glucokinase activators could eventually be used toenhance the low basal rate of beta-cell replication in vivo, thus permitting grad-ual regeneration of sufficient beta-cell mass from the remaining viable beta cellsafter the onset of clinical type 1 diabetes.
Gastrointestinal hormones (incretins) also play a role in regulation of beta-cell mass [95]. Glucagon-like peptide 1 (GLP-1) and glucose-dependent in-sulinotropic peptide (GIP) are produced and secreted by intestinal cells in re-sponse to dietary fat and carbohydrate. They increase insulin secretion by thebeta cell via binding to G protein-coupled receptors (discussed in [96]). GLP-1reduces beta-cell apoptosis [97], and may also stimulate beta-cell proliferationvia the mitogen-activated protein (MAP) kinase [98] and Wnt [99] pathways, thusshifting the balance of beta-cell turnover towards accumulation. Treatment withcurrently available GLP-1 agonists such as exendin-4, or with inhibitors of theenzyme dipeptidyl peptidase 4 (DPP-IV), which degrades GLP-1 and GIP, in-crease beta-cell mass in diabetic rodents [100, 101]. These agents may have similarbeneficial effects in humans if used in conjunction with treatments which targetautoimmunity.
CONCLUSIONSThis is an exciting time for research in type 1 diabetes. Recent technologicaladvances such as the ability to conduct genome-wide association studies or toundertake non-invasive imaging of the pancreas, coupled with initiatives such asnPOD, are greatly increasing our understanding of the aetiology and pathogenesisof type 1 diabetes. These insights will continue to suggest ways in which it mightbe possible to intervene in the course of the disease, both prior to and followingthe onset of clinical diabetes. Growing appreciation of the heterogeneity of type1 diabetes will allow tailoring of treatment modalities to the particular subgroupsof patients most likely to benefit from each type of intervention, while improved
A modern epidemic
96

assays for monitoring anti-islet immune reactivity and response to treatment willinform clinical decisions and permit fine adjustment of immunomodulatory ther-apies.
References1. Barrett JC, Clayton DG, Concannon P, Akolkar B, Cooper JD, Erlich HA, et
al. (2009). Genome-wide association study and meta-analysis find that over40 loci affect risk of type 1 diabetes. Nature Genetics, 41(6): 703–07.
2. Todd JA (1995). Genetic analysis of type 1 diabetes using whole genomeapproaches. Proceedings of the National Academy of Sciences of the UnitedStates of America, 92(19): 8560–65.
3. Aly TA, Ide A, Jahromi MM, Barker JM, Fernando MS, Babu SR, etal. (2006). Extreme genetic risk for type 1A diabetes. Proceedings of theNational Academy of Sciences of the United States of America, 103(38):14074–79.
4. Erlich H, Valdes AM, Noble J, Carlson JA, Varney M, Concannon P, etal. (2008). HLA DR–DQ haplotypes and genotypes and type 1 diabetes risk:analysis of the type 1 diabetes genetics consortium families. Diabetes, 57(4):1084–92.
5. Parry CS & Brooks BR (2008). A new model defines the minimal set ofpolymorphism in HLA–DQ and –DR that determines susceptibility and re-sistance to autoimmune diabetes. Biology Direct, 3: 42.
6. Noorchashm H, Kwok W, Rabinovitch A & Harrison LC (1997). Immunol-ogy of IDDM. Diabetologia, 40 (Suppl. 3): B50–57.
7. Fennessy M, Metcalfe K, Hitman GA, Niven M, Biro PA, Tuomilehto J,et al. (1994). A gene in the HLA class I region contributes to susceptibilityto IDDM in the Finnish population. Childhood Diabetes in Finland (DiMe)Study Group. Diabetologia, 37(9): 937–44.
8. Robles DT, Eisenbarth GS, Wang T, Erlich HA, Bugawan TL, Babu SR,et al. (2002). Millennium award recipient contribution. Identification of chil-dren with early onset and high incidence of anti-islet autoantibodies. ClinicalImmunology, 102(3): 217–24.
9. Nejentsev S, Howson JM, Walker NM, Szeszko J, Field SF, Stevens HE, etal. (2007). Localization of type 1 diabetes susceptibility to the MHC class I
4 Pancreatic beta-cell failure in the pathogenesis of type 1 diabetes
97

genes HLA–B and HLA–A. Nature, 450(7171): 887–92.10. Panagiotopoulos C, Qin H, Tan R & Verchere CB (2003). Identification of a
beta-cell-specific HLA class I restricted epitope in type 1 diabetes. Diabetes,52(11): 2647–51.
11. Panina-Bordignon P, Lang R, van Endert PM, Benazzi E, Felix AM, PastoreRM, et al. (1995). Cytotoxic T cells specific for glutamic acid decarboxylasein autoimmune diabetes. Journal of Experimental Medicine, 181(5):1923–27.
12. Pinkse GG, Tysma OH, Bergen CA, Kester MG, Ossendorp F, van VeelenPA, et al. (2005). Autoreactive CD8 T cells associated with beta cell destruc-tion in type 1 diabetes. Proceedings of the National Academy of Sciences ofthe United States of America, 102(51): 18425–30.
13. Bacchetta R, Passerini L, Gambineri E, Dai M, Allan SE, Perroni L, et al.(2006). Defective regulatory and effector T cell functions in patients withFOXP3 mutations. The Journal of Clinical Investigation, 116(6): 1713–22.
14. Wildin RS, Ramsdell F, Peake J, Faravelli F, Casanova JL, Buist N, et al.(2001). X-linked neonatal diabetes mellitus, enteropathy and endocrinopathysyndrome is the human equivalent of mouse scurfy. Nature Genetics, 27(1):18–20.
15. Villasenor J, Benoist C & Mathis D (2005). AIRE and APECED: molecularinsights into an autoimmune disease. Immunology Reviews, 204: 156–64.
16. Vafiadis P, Bennett ST, Todd JA, Nadeau J, Grabs R, Goodyer CG, et al.(1997). Insulin expression in human thymus is modulated by INS VNTR al-leles at the IDDM2 locus. Nature Genetics, 15(3): 289–92.
17. Anderson MS, Venanzi ES, Klein L, Chen Z, Berzins SP, Turley SJ, et al.(2002). Projection of an immunological self shadow within the thymus bythe aire protein. Science, 298(5597): 1395–401.
18. Todd JA, Walker NM, Cooper JD, Smyth DJ, Downes K, Plagnol V, et al.(2007). Robust associations of four new chromosome regions from genome-wide analyses of type 1 diabetes. Nature Genetics, 39(7): 857–64.
19. Todd JA (2010). Etiology of type 1 diabetes. Immunity, 32(4): 457–67.20. Nejentsev S, Walker N, Riches D, Egholm M & Todd JA (2009). Rare vari-
ants of IFIH1, a gene implicated in antiviral responses, protect against type 1diabetes. Science, 324(5925): 387–89.
A modern epidemic
98
21. Todd JA (2010). Etiology of type 1 diabetes. Immunity, 32(4): 457–67.22. Diamond Study Group (2006). Incidence and trends of childhood type 1 di-
abetes worldwide 1990–1999. Diabetic Medicine, 23(8): 857–66.23. Green A & Patterson CC (2001). Trends in the incidence of childhood-onset
diabetes in Europe 1989–1998. Diabetologia, 44(Suppl. 3): B3–8.24. Patterson CC, Dahlquist GG, Gyurus E, Green A & Soltesz G (2009). Inci-
dence trends for childhood type 1 diabetes in Europe during 1989–2003 andpredicted new cases 2005–20: a multicentre prospective registration study.The Lancet, 373(9680): 2027–33.
25. Ehehalt S, Dietz K, Willasch AM & Neu A (2009). Epidemiological per-spectives on type 1 diabetes in childhood and adolescence in Germany: 20years of the Baden–Wurttemberg Diabetes Incidence Registry (DIARY). Di-abetes Care, 33(2): 338–40.
26. Fourlanos S, Varney MD, Tait BD, Morahan G, Honeyman MC, ColmanPG, et al. (2008). The rising incidence of type 1 diabetes is accounted forby cases with lower-risk human leukocyte antigen genotypes. Diabetes Care,31(8): 1546–49.
27. Wentworth JM, Fourlanos S & Harrison LC (2009). Reappraising the stereo-types of diabetes in the modern diabetogenic environment. Nature ReviewsEndocrinology, 5(9): 483–89.
28. Weets I, Kaufman L, Van der Auwera B, Crenier L, Rooman RP, De BlockC, et al. (2004). Seasonality in clinical onset of type 1 diabetes in belgianpatients above the age of 10 is restricted to HLA-DQ2/DQ8-negative males,which explains the male to female excess in incidence. Diabetologia, 47(4):614–21.
29. Forrest JM, Turnbull FM, Sholler GF, Hawker RE, Martin FJ, Doran TT,et al. (2002). Gregg’s congenital rubella patients 60 years later. The MedicalJournal of Australia, 177(11–12): 664–67.
30. Ou D, Mitchell LA, Metzger DL, Gillam S & Tingle AJ (2000). Cross-reactive rubella virus and glutamic acid decarboxylase (65 and 67) proteindeterminants recognised by T cells of patients with type I diabetes mellitus.Diabetologia, 43(6): 750–62.
31. Bodansky HJ, Dean BM, Grant PJ, McNally J, Schweiger MS, HamblingMH, et al. (1990). Does exposure to rubella virus generate endocrine autoim-
4 Pancreatic beta-cell failure in the pathogenesis of type 1 diabetes
99

munity? Diabetic Medicine, 7(7): 611–14.32. Salminen K, Sadeharju K, Lonnrot M, Vahasalo P, Kupila A, Korhonen S,
et al. (2003). Enterovirus infections are associated with the induction of beta-cell autoimmunity in a prospective birth cohort study. Journal of MedicalVirology, 69(1): 91–98.
33. Fuchtenbusch M, Irnstetter A, Jager G & Ziegler AG (2001). No evidencefor an association of coxsackie virus infections during pregnancy and earlychildhood with development of islet autoantibodies in offspring of mothersor fathers with type 1 diabetes. Journal of Autoimmunology, 17(4): 333–40.
34. Graves PM, Rotbart HA, Nix WA, Pallansch MA, Erlich HA, Norris JM,et al. (2003). Prospective study of enteroviral infections and developmentof beta-cell autoimmunity: the Diabetes Autoimmunity Study in the Young(DAISY). Diabetes Research and Clinical Practice, 59(1): 51–61.
35. Honeyman M (2005). How robust is the evidence for viruses in the inductionof type 1 diabetes? Current Opinion in Immunology, 17(6): 616–23.
36. Tanaka S, Nishida Y, Aida K, Maruyama T, Shimada A, Suzuki M, et al.(2009). Enterovirus infection, CXC chemokine ligand 10 (CXCL10), andCXCR3 circuit: a mechanism of accelerated beta-cell failure in fulminanttype 1 diabetes. Diabetes, 58(10): 2285–91.
37. Ylipaasto P, Klingel K, Lindberg AM, Otonkoski T, Kandolf R, Hovi T, etal. (2004). Enterovirus infection in human pancreatic islet cells, islet tropismin vivo and receptor involvement in cultured islet beta cells. Diabetologia,47(2): 225–39.
38. Yin H, Berg AK, Tuvemo T & Frisk G (2002). Enterovirus RNA is found inperipheral blood mononuclear cells in a majority of type 1 diabetic childrenat onset. Diabetes, 51(6): 1964–71.
39. Jones DB & Crosby I (1996). Proliferative lymphocyte responses to virusantigens homologous to GAD65 in IDDM. Diabetologia, 39(11): 1318–24.
40. Stene LC, Oikarinen S, Hyoty H, Barriga KJ, Norris JM, Klingensmith G,et al. (2010). Enterovirus infection and progression from islet autoimmu-nity to type 1 diabetes: the Diabetes and Autoimmunity Study in the Young(DAISY). Diabetes, 59(12): 3174–80.
41. Oikarinen S, Martiskainen M, Tauriainen S, Huhtala H, Ilonen J, Veijola R,et al. (2011). Enterovirus RNA in blood is linked to the development of type
A modern epidemic
100
1 diabetes. Diabetes, 60(1): 276–79.42. Varela-Calvino R, Sgarbi G, Arif S & Peakman M (2000). T-Cell reactivity
to the P2C nonstructural protein of a diabetogenic strain of coxsackievirusB4. Virology, 274(1): 56–64.
43. Kaufman DL, Erlander MG, Clare-Salzler M, Atkinson MA, Maclaren NK& Tobin AJ (1992). Autoimmunity to two forms of glutamate decarboxylasein insulin-dependent diabetes mellitus. The Journal of Clinical Investigation,89(1): 283–92.
44. Honeyman M (2005). How robust is the evidence for viruses in the inductionof type 1 diabetes? Current Opinion in Immunology, 17(6): 616–23.
45. Honeyman MC, Brusic V, Stone NL & Harrison LC (1998). Neuralnetwork-based prediction of candidate T-cell epitopes. Nature Biotechnol-ogy, 16(10): 966–69.
46. Honeyman MC, Coulson BS, Stone NL, Gellert SA, Goldwater PN, SteeleCE, et al. (2000). Association between rotavirus infection and pancreaticislet autoimmunity in children at risk of developing type 1 diabetes. Dia-betes, 49(8): 1319–24.
47. Blomqvist M, Juhela S, Erkkila S, Korhonen S, Simell T, Kupila A, et al.(2002). Rotavirus infections and development of diabetes-associated autoan-tibodies during the first 2 years of life. Clinical & Experimental Immunology,128(3): 511–15.
48. Wentworth JM, Fourlanos S & Harrison LC (2009). Reappraising the stereo-types of diabetes in the modern diabetogenic environment. Nature ReviewsEndocrinology, 5(9): 483–89.
49. Bach JF (2002). The effect of infections on susceptibility to autoimmune andallergic diseases. The New England Journal of Medicine, 347(12): 911–20.
50. Wentworth JM, Fourlanos S & Harrison LC (2009). Reappraising the stereo-types of diabetes in the modern diabetogenic environment. Nature ReviewsEndocrinology, 5(9): 483–89.
51. Hypponen E, Laara E, Reunanen A, Jarvelin MR & Virtanen SM (2001).Intake of vitamin D and risk of type 1 diabetes: a birth-cohort study. TheLancet, 358(9292): 1500–03.
52. Scragg R, Sowers M & Bell C (2004). Serum 25-hydroxyvitamin D, dia-betes, and ethnicity in the Third National Health and Nutrition Examination
4 Pancreatic beta-cell failure in the pathogenesis of type 1 diabetes
101

Survey. Diabetes Care, 27(12): 2813–18.53. Stene LC & Joner G (2003). Use of cod liver oil during the first year of
life is associated with lower risk of childhood-onset type 1 diabetes: a large,population-based, case-control study. The American Journal of Clinical Nu-trition, 78(6): 1128–34.
54. Eurodiab Substudy 2 Study Group (1999). Vitamin D supplement in earlychildhood and risk for type I (insulin-dependent) diabetes mellitus: The EU-RODIAB Substudy 2 Study Group. Diabetologia, 42(1): 51–54.
55. Wilkin TJ (2009). The accelerator hypothesis: a review of the evidence forinsulin resistance as the basis for type 1 as well as type 2 diabetes. Interna-tional Journal of Obesity (Lond), 33(7): 716–26.
56. Fourlanos S, Narendran P, Byrnes GB, Colman PG & Harrison LC (2004).Insulin resistance is a risk factor for progression to type 1 diabetes. Dia-betologia, 47(10): 1661–67.
57. Wilkin TJ (2006). The accelerator hypothesis: a unifying explanation fortype-1 and type-2 diabetes. Nestle Nutrition Workshop Series: Clinical andPerformance Programme, 11: 139–50; discussion 150–53.
58. van Belle TL, Coppieters KT & von Herrath MG (2011). Type 1 diabetes:etiology, immunology, and therapeutic strategies. Physiological Reviews,91(1): 79–118.
59. Eisenbarth GS & Jeffrey J (2008). The natural history of type 1A diabetes.Arquivos Brasileiros de Endocrinologia Metabologia, 52(2): 146–55.
60. van Belle TL, Coppieters KT & von Herrath MG (2011). Type 1 diabetes:etiology, immunology, and therapeutic strategies. Physiological Reviews,91(1): 79–118.
61. Panagiotopoulos C, Qin H, Tan R & Verchere CB (2003). Identification of abeta-cell-specific HLA class I restricted epitope in type 1 diabetes. Diabetes,52(11): 2647–51.
62. Panina-Bordignon P, Lang R, van Endert PM, Benazzi E, Felix AM, PastoreRM, et al. (1995). Cytotoxic T cells specific for glutamic acid decarboxylasein autoimmune diabetes. The Journal of Experimental Medicine, 181(5):1923–27.
63. Skowera A, Ellis RJ, Varela-Calvino R, Arif S, Huang GC, Van-Krinks C,et al. (2008). CTLs are targeted to kill beta cells in patients with type 1 dia-
A modern epidemic
102

betes through recognition of a glucose-regulated preproinsulin epitope. TheJournal of Clinical Investigation, 118(10): 3390–402.
64. Gepts W (1965). Pathologic anatomy of the pancreas in juvenile diabetesmellitus. Diabetes, 14(10): 619–33.
65. Coppieters KT & von Herrath MG (2009). Histopathology of type 1 dia-betes: old paradigms and new insights. The Review of Diabetic Studies, 6(2):85–96.
66. Gepts W (1976). Islet changes suggesting a possible immune aetiology ofhuman diabetes mellitus. Acta Endocrinologica Supplementum (Copenha-gen), 205: 95–106.
67. Willcox A, Richardson SJ, Bone AJ, Foulis AK & Morgan NG (2009).Analysis of islet inflammation in human type 1 diabetes. Clinical & Experi-mental Immunology, 155(2): 173–81.
68. Foulis AK & Stewart JA (1984). The pancreas in recent-onset type 1(insulin-dependent) diabetes mellitus: insulin content of islets, insulitis andassociated changes in the exocrine acinar tissue. Diabetologia, 26(6):456–61.
69. Willcox A, Richardson SJ, Bone AJ, Foulis AK & Morgan NG (2009).Analysis of islet inflammation in human type 1 diabetes. Clinical & Experi-mental Immunology, 155(2): 173–81.
70. In’t Veld P, Lievens D, De Grijse J, Ling Z, Van der Auwera B, Pipeleers-Marichal M, et al. (2007). Screening for insulitis in adult autoantibody-posi-tive organ donors. Diabetes, 56(9): 2400–04.
71. Gianani R, Campbell-Thompson M, Sarkar SA, Wasserfall C, PuglieseA, Solis JM, et al. (2010). Dimorphic histopathology of long-standingchildhood-onset diabetes. Diabetologia, 53(4): 690–98.
72. Gaglia JL, Guimaraes AR, Harisinghani M, Turvey SE, Jackson R, BenoistC, et al. (2011). Noninvasive imaging of pancreatic islet inflammation intype 1A diabetes patients. The Journal of Clinical Investigation, 121(1):442–45.
73. Martinic MM & von Herrath MG (2006). Control of graft-versus-host dis-ease by regulatory T cells: which level of antigen specificity? The EuropeanJournal of Immunology, 36(9): 2299–303.
74. Seyfert-Margolis V, Gisler TD, Asare AL, Wang RS, Dosch HM, Brooks-
4 Pancreatic beta-cell failure in the pathogenesis of type 1 diabetes
103

Worrell B, et al. (2006). Analysis of T-cell assays to measure autoimmuneresponses in subjects with type 1 diabetes: results of a blinded controlledstudy. Diabetes, 55(9): 2588–94.
75. Mallone R, Martinuzzi E, Blancou P, Novelli G, Afonso G, Dolz M, etal. (2007). CD8+ T-cell responses identify beta-cell autoimmunity in humantype 1 diabetes. Diabetes, 56(3): 613–21.
76. Martinuzzi E, Novelli G, Scotto M, Blancou P, Bach JM, Chaillous L, et al.(2008). The frequency and immunodominance of islet-specific CD8+ T-cellresponses change after type 1 diabetes diagnosis and treatment. Diabetes,57(5): 1312–20.
77. Cernea S & Herold KC (2010). Monitoring of antigen-specific CD8 T cellsin patients with type 1 diabetes treated with antiCD3 monoclonal antibodies.Clinical Immunology, 134(2): 121–29.
78. Coppieters KT, Roep BO & von Herrath MG (2011). Beta cells under attack:toward a better understanding of type 1 diabetes immunopathology. Semi-nars in Immunopathology, 33(1): 1–7.
79. Akerblom HK, Krischer J, Virtanen SM, Berseth C, Becker D, Dupre J, etal. (2011). The Trial to Reduce IDDM in the Genetically at Risk (TRIGR)study: recruitment, intervention and follow-up. Diabetologia, 54(3): 627–33.
80. Eurodiab Sybstudy 2 Study Group (1999). Vitamin D supplement in earlychildhood and risk for type 1 (insulin-dependent0 diabetes mellitus. The EU-RODIAB Substudy 2 Study Group. Diabetologia, 42(1): 51–54.
81. Stene LC & Joner G (2003). Use of cod liver oil during the first year oflife is associated with lower risk of childhood-onset type 1 diabetes: a large,population-based, case-control study. The American Journal of Clinical Nu-trition, 78(6): 1128–34.
82. Gale EA, Bingley PJ, Emmett CL & Collier T (2004). European Nicoti-namide Diabetes Intervention Trial (ENDIT): a randomised controlled trialof intervention before the onset of type 1 diabetes. The Lancet, 363(9413):925–31.
83. Knip M, Virtanen SM, Becker D, Dupre J, Krischer JP & Akerblom HK(2010). Early feeding and risk of type 1 diabetes: experiences from the Trialto Reduce Insulin-dependent diabetes mellitus in the Genetically at Risk(TRIGR). The American Journal of Clinical Nutrition, in press.
A modern epidemic
104
84. van Belle TL, Coppieters KT & von Herrath MG (2011). Type 1 diabetes:etiology, immunology, and therapeutic strategies. Physiological Reviews,91(1): 79–118.
85. Baker L, Kaye R & Root AW (1967). The early partial remission of juvenilediabetes mellitus: the roles of insulin and growth hormone. Journal of Pedi-atrics, 71(6): 825–31.
86. Weir GC & Bonner-Weir S (2010). Dreams for type 1 diabetes: shuttingoff autoimmunity and stimulating beta-cell regeneration. Endocrinology,151(7): 2971–73.
87. Gianani R, Campbell-Thompson M, Sarkar SA, Wasserfall C, PuglieseA, Solis JM, et al. (2010). Dimorphic histopathology of long-standingchildhood-onset diabetes. Diabetologia, 53(4): 690–98.
88. Gianani R (2011). Beta cell regeneration in human pancreas. Seminars inImmunopathology, 33(1): 23–27.
89. Nir T, Melton DA & Dor Y (2007). Recovery from diabetes in mice by betacell regeneration. The Journal of Clinical Investigation, 117(9): 2553–61.
90. Bonner-Weir S, Li WC, Ouziel-Yahalom L, Guo L, Weir GC & SharmaA (2010). Beta-cell growth and regeneration: replication is only part of thestory. Diabetes, 59(10): 2340–48.
91. Thorel F, Nepote V, Avril I, Kohno K, Desgraz R, Chera S, et al. (2010).Conversion of adult pancreatic alpha-cells to beta-cells after extreme beta-cell loss. Nature, 464(7292): 1149–54.
92. Chung CH, Hao E, Piran R, Keinan E & Levine F (2010). Pancreatic beta-cell neogenesis by direct conversion from mature alpha-cells. Stem Cells,28(9): 1630–38.
93. Gianani R (2011). Beta cell regeneration in human pancreas. Seminars inImmunopathology, 33(1): 23–27.
94. Porat S, Weinberg-Corem N, Tornovsky-Babaey S, Schyr-Ben-Haroush R,Hija A, Stolovich-Rain M, et al. (2011). Control of pancreatic beta cell re-generation by glucose metabolism. Cell Metabolism, 13(4): 440–49.
95. Matschinsky FM (2009). Assessing the potential of glucokinase activatorsin diabetes therapy. Nature Reviews Drug Discovery, 8(5): 399–416.
96. Lavine JA & Attie AD (2010). Gastrointestinal hormones and the regulationof beta-cell mass. Annals of the New York Academy of Sciences, 1212:
4 Pancreatic beta-cell failure in the pathogenesis of type 1 diabetes
105

41–58.97. Baggio LL & Drucker DJ (2007). Biology of incretins: GLP-1 and GIP.
Gastroenterology, 132(6): 2131–57.98. Li Y, Cao X, Li LX, Brubaker PL, Edlund H & Drucker DJ (2005). Beta-
Cell Pdx1 expression is essential for the glucoregulatory, proliferative, andcytoprotective actions of glucagon-like peptide-1. Diabetes, 54(2): 482–91.
99. Lavine JA & Attie AD (2010). Gastrointestinal hormones and the regulationof beta-cell mass. Annals of the New York Academy of Sciences, 1212:41–58.
100. Liu Z & Habener JF (2008). Glucagon-like peptide-1 activation ofTCF7L2-dependent Wnt signaling enhances pancreatic beta cell prolifera-tion. The Journal of Biological Chemistry, 283(13): 8723–35.
101. Song WJ, Schreiber WE, Zhong E, Liu FF, Kornfeld BD, Wondisford FE,et al. (2008). Exendin-4 stimulation of cyclin A2 in beta-cell proliferation.Diabetes, 57(9): 2371–81.
102. Tian L, Gao J, Hao J, Zhang Y, Yi H, O’Brien TD, et al. (2010). Reversalof new-onset diabetes through modulating inflammation and stimulatingbeta-cell replication in nonobese diabetic mice by a dipeptidyl peptidase IVinhibitor. Endocrinology, 151(7): 3049–60.
A modern epidemic
106

5Pancreatic beta-cell failure in thepathogenesis of type 2 diabetes
Jenny Gunton1, 2 and Christian M Girgis1, 2
As the worldwide prevalence of type 2 diabetes continues to rise, there ismounting evidence that failure of the cells which make insulin – termedpancreatic beta (or β) cells, play a fundamental role at all stages in thepathogenesis. Beta-cell defects such as loss of the initial (first) phase of in-sulin secretion and inefficient insulin synthesis are seen years prior to theonset of type 2 diabetes. Later, it is the failure of beta cells to adequatelyrespond to the demand for high insulin requirements that determines the on-set of hyperglycaemia leading to the clinical diagnosis of type 2 diabetes.In this chapter, we will discuss the various proposed mechanisms of beta-cell failure in type 2 diabetes and address recent controversies in this fieldof research.
The prevalence of type 2 diabetes is rising at an alarming rate. In Australia alone,those affected by type 2 diabetes doubled from 3.4% in 1981 to 7.4% in a nationalsample of 11 247 adults in 1999 to 2002. An additional 16.4% of participantsshowed symptoms of prediabetes in this study, a sign of imminent trouble.
On a global scale, the International Diabetes Foundation projected that by2030, up to 438 million people may be affected by this disease, accounting formore than 4.5% of the world’s projected population [3]. China, the world’s mostpopulous nation, has not been spared as a recent survey reported a remarkablyhigh diabetes prevalence of 9.7% (92.4 million adults) [4].
The burden of diabetes spans beyond the threat it poses to the individualsufferer and includes the greater effect on communities, the health economy andworkforce. The estimated financial cost of type 2 diabetes in Australia is A$10.3billion per annum which includes costs for carers (>A$4 billion), productivitylosses (A$4.1 billion), direct costs to the healthcare system and the estimated di-
1 Diabetes and Transcription Factors Group, Garvan Institute of Medical Research,Sydney.
2 Sydney Medical School, University of Sydney.
107

rect costs of obesity (A$2.2 billion) [5].Modern life is largely to blame for this surge in diabetes prevalence with the
abundance of calorie-rich foods, the gross reduction in energy expenditure result-ing from the use of cars and other labour-saving devices, the hours spent sittingin front of television or computer screens and the avoidance of outdoor activities.As described in earlier chapters, it is the collusion of such environmental factorswith an individual’s genetic predisposition that lead to pancreatic beta-cell failurethat is characteristic of type 2 diabetes. However, the precise pathologic processesby which beta cells fail in their essential role in glucose homeostasis are incom-pletely understood and contentious.
This chapter will outline some of the proposed mechanisms of beta-cell fail-ure in type 2 diabetes and touch on a couple of controversial issues that havecharacterised this field of research. However, it will first lay the groundwork withsome basic principles in beta-cell physiology.
THE BETA CELLSince the initial description of the pancreatic islet by Paul Langerhans in 1869 as‘a network of small cells, almost perfect in homogeneity and structure, arrangedin groups, scattered amongst the acinar cells of the pancreas’ [6], understandingof this highly complex miniorgan has increased greatly. Five different endocrinecell types are found within the pancreatic islet, namely alpha cells that makeglucagon, beta cells that make insulin, delta cells that make somatostatin, PP cellsthat make pancreatic polypeptide and epsilon cells that make ghrelin [7].
Although islets cells account for only 1%–2% of the pancreatic mass [8, 9],they receive 10% of the total pancreatic blood flow and are surrounded by ahighly specialised system of fenestrated endothelial cells which provide criticalsignals for cell differentiation, development and function [10]. Other extracellu-lar components, including extracellular matrix and neurons also play critical rolesin influencing the behaviour of islet cells [11]. Beta cells are the dominant celltype of the human islet, accounting for 50% to 70% of islet cells [12]. Their mainfunction, namely regulated insulin secretion, involves the integration of severalstimuli which activate secretion when challenged and others that switch it offwhen the stimuli are no longer present. Whilst there is general agreement thatthe entry of glucose into the beta cell via specialised glucose transporters leadsto a cascade of events including glucose phosphorylation by glucokinase and theclosure of potassium-ion channels leading to membrane depolarisation and in-sulin secretion [13], the process is more complex. Following glucose entry intobeta cells, insulin is secreted in two distinct phases and in an oscillatory, ratherthan a linear, pattern [14]. Further complexity can be found in the presence ofsecondary pathways of insulin secretion independent of ion channels [11], in-
A modern epidemic
108

teractions between beta cells which influence behaviour [15] and the effect ofgut-derived hormones, known as incretins, on beta-cell function [16]. The majorsteps in glucose-stimulated insulin secretion have been summarised in Figure 1.
However our understanding of beta-cell physiology is incomplete, with lackof understanding of the roles of a broad system of G-protein coupled receptorson the beta-cell surface [17], the effect of other nutrients such as amino acids andfatty acids on beta-cell function [18] and the role of vitamin D activating enzymesand receptors within the beta cell [19]. In seeking answers to these and many otherquestions, researchers in this field face a number of challenges. Significant inter-species differences in islet architecture [20] and responses to hyperglycaemia [21]pose a challenge that has made direct extrapolation of disease-related pathophysi-ology from rodents to humans tricky. Furthermore, the study of human pancreaticspecimens, whilst insightful, does not always reflect in vivo beta-cell behaviour.
Figure 1. Steps involved in glucose-stimulated insulin secretion by the pancreatic betacell. Following entry of glucose via GLUT transporters, phosphorylation by glucokinaseoccurs and pyruvate is formed via the process of glycolysis. This leads to increased activ-ity of the TCA cycle within the mitochondria by which adenosine diphosphate (ADP) isconverted to adenosine triphosphate (ATP). This causes closure of ATP-sensitive potas-sium channels, a wave of membrane depolarisation and the subsequent activation ofvoltage gated calcium channels. The entry of calcium into the cell is followed by vesicledocking and insulin granules are released into the circulation. Other factors play a rolesuch as glucagon-like peptide 1 which has unique receptors in the beta-cell membrane.
5 Pancreatic beta-cell failure in the pathogenesis of type 2 diabetes
109

There is no doubt that beta cells play an important role in the pathogenesis of type2 diabetes but the complex nature of these cells and the difficulties encountered in‘unlocking’ some of these complexities have inevitably led to some controversyin our understanding of the precise nature of this role.
INSULIN RESISTANCE OR DEFECTIVE BETACELLS?
A controversial issue for many years has been whether insulin resistance or im-paired beta-cell function is the primary cause of type 2 diabetes. This controversyseems to have resulted from the complex interaction between both defects presentearly in the disease and the relative ease in measuring in vivo insulin resistance ascompared to beta-cell function [22].
A 1992 study examining non-diabetic subjects at high risk of developingtype 2 diabetes (ie women with prior gestational diabetes, high risk ethnic groups,people whose parents were both affected by type 2 diabetes) reported that insulinresistance was the predominant feature [23]. This was based on a glucose tol-erance test which demonstrated supraphysiological insulin levels required tomaintain normal glucose at two hours following a 75 gm oral glucose load. How-ever, by only obtaining two-hour measurements, the high insulin levels weremisinterpreted as representing normal beta-cell function compensating for a stateof insulin resistance. As discussed above, insulin secretion is normally biphasicand the first phase of insulin secretion, maximal at 30 minutes following a meal,appears to be the first casualty of the beta cell in type 2 diabetes [12] Therefore, ifvalues were measured at 30 minutes following the glucose load, different levelsmay have been found which would match the early rise in glucose, then followedby compensatory insulin hypersecretion at two hours.
A prospective study of 200 non-diabetic Pima Indians, which is a group witha very high risk of type 2 diabetes, also reported that insulin resistance was theearliest feature in the 38 patients who went on to develop diabetes [24]. Lifestylefactors, such as obesity, sedentary lifestyle and high-fat diets correlated closelywith this state of insulin resistance which was detected by the gold-standardtechnique, the hyperinsulinaemic-euglycaemic clamp. However, as the diseasedeveloped, the degree of insulin resistance did not change significantly but rather,a dynamic pattern of beta-cell activity emerged with early hyperinsulinaemia tomaintain normoglycaemia being followed by a significant drop in insulin levelsresulting in hyperglycaemia. It was therefore proposed that beta-cell failure wasthe final determinant in the development of hyperglycaemia in these patients.
For some time, ‘beta-cell exhaustion’ was the sole explanation for the failurein insulin secretion [20]. This is the concept that after a prolonged period of pro-ducing high amounts of insulin in order to overcome an insulin resistant state,
A modern epidemic
110

otherwise normal beta cells eventually ‘burn out’ and permanently fail. Propo-nents of this hypothesis also describe distinct stages in the evolution of beta cellsfrom a state of compensation to severe decompensation [25]. But the exhaus-tion concept has some limitations. Most patients with conditions characterised byinsulin resistance – such as pregnancy, morbid obesity, Cushing’s disease andacromegally – do not develop diabetes. Furthermore, studies in humans and rhe-sus monkeys suggest that the early hyperinsulinaemia may occur independentlyof insulin resistance and rather reflect ‘beta-cell hyper-responsiveness’ [26]. In ad-dition, patients with mutations in the insulin receptor, who have severe insulinresistance from birth do not develop diabetes until their beta cells fail, usually intheir teens or 20s [27]. Therefore, intrinsic defects in susceptible beta cells appearto be important both early in the development of diabetes and later when the cellsundergo critical failure in their compensatory capacity.
Another five-year prospective study involving non-diabetic Pima Indiansconfirmed dual pathology involving both the beta cell and peripheral insulin sen-sitivity in the development of diabetes [28]. Amongst 48 non-diabetic subjectswho were roughly equal for parameters of obesity and insulin resistance, the 17who progressed to diabetes failed to increase their insulin secretion in responseto progression of insulin resistance. Furthermore, they showed signs of defectivebeta-cell function even before the onset of impaired glucose tolerance. The 31subjects who did not progress to diabetes demonstrated appropriate increasesin insulin secretion as they gained weight and became more insulin resistant.Therefore, it was beta-cell function that determined the progression from insulinresistance to frank diabetes in this high-risk group.
A useful way to understand the interaction between insulin sensitivity andbeta-cell function can be found in the disposition index [29]. In normal subjects,beta-cell function varies according to the degree of insulin sensitivity so thatwhen non-diabetic individuals enter a phase of greater insulin resistance, suchas in puberty, pregnancy or aging, beta cells ‘rise to the occasion’ and producegreater insulin as required. The relationship follows a hyperbolic pattern as seenin Figure 2, indicating a continuum of beta-cell responsiveness to variations ininsulin sensitivity. The dotted, downward line in this figure represents the pro-gression to diabetes as was displayed in the previous study [25] – while stillglucose tolerant, susceptible individuals began to ‘fall below the curve’ with theinability of beta cells to respond appropriately to the degree of insulin resistance.The downward, rather than horizontal, trajectory of this dotted line indicates thatdeterioration in beta-cell function was of greater importance than the reductionin insulin sensitivity in the development of hyperglycaemia [20]. Therefore, inessence, type 2 diabetes may be considered a failure of beta-cell compensation.
Beta-cell failure and insulin resistance however need not be considered asseparate entities. Pathways are emerging by which these otherwise disparate con-ditions may be linked. Striking examples exist in the insulin signalling pathway.
5 Pancreatic beta-cell failure in the pathogenesis of type 2 diabetes
111

For example, insulin receptor substrate-2 (IRS-2) promotes both cell growth, in-sulin secretion and plays a well-recognised role in insulin sensitivity [30]. Micewith IRS-2 mutations in their beta-cells develop diabetes. In addition, people withAkt2 mutations develop diabetes due to the combination of severe insulin re-sistance and impaired beta-cell dysfunction [31]. Insulin receptor mutations alsoassociate with diabetes, both in people, and in mice. The transcription factorNF-kappaB plays an important role in both insulin resistance [32] and beta-cellbehaviour [33]. Furthermore, complex processes which alter the behaviour of themitochondria, the cell’s own ‘energy plant’, are similar in insulin-resistant tissuesand defective beta cells. Therefore, insulin resistance and beta-cell dysfunctionmay be aetiologically related and rather than predominating over the other, ap-pear to conspire together in the development of diabetes.
REDUCED BETA-CELL MASS OR FUNCTION?Currently, there is a debate concerning the relative roles of decreased beta-cellmass compared with decreased beta-cell function in diabetes pathogenesis [34].
Proponents of the reduced beta-cell mass argument refer to postmortem stud-ies which demonstrate up to 40% reduction in the number of beta cells in subjectswith prediabetes versus weight-matched non-diabetic individuals [35]. In addi-tion, mutations of genes known to control beta-cell mass such as the pancreaticand duodenal homeobox 1 (Pdx-1) result in monogenic forms of diabetes, such asMaturity Onset Diabetes of the Young [36].
A modern epidemic
112

Figure 2. The ‘disposition index’ is a useful way to consider the rela-tionship between insulin secretion and insulin sensitivity in bothphysiologic (ie curved line) and pathologic states (ie dotted line). Thisis based on data from a number of studies and has been adapted fromKahn et al. [26]. Individuals who develop type 2 diabetes head in adownward trajectory below the curve indicating that deterioration inbeta-cell function (and thus less insulin secretion) is the main factor inthe development of hyperglycaemia.
However, there are some limitations to this argument. Firstly, not all autopsystudies in diabetic subjects demonstrate relative reductions in beta-cell mass [37].Secondly, beta-cell mass is highly variable even in normal individuals and mayundergo substantial changes throughout a person’s life [7]. Thirdly, it is difficultto see how a reduction of less than 50% of otherwise healthy beta cells couldcause diabetes in the light of a recent in vivo islet donation from 50% of a healthyhuman pancreas which resulted in diabetes cure in the recipient and the absenceof diabetes in the donor [38]. Furthermore, normal rats that underwent a 60%pancreatectomy remained normoglycaemic due to partial beta-cell regenerationand hyperfunction of remaining beta cells [39]. However, when these rats werechallenged by the addition of 10% sugar to their water supply, impairment ofthe residual beta-cell mass and subsequent hyperglycaemia ensued. Therefore, inisolation, reduced beta-cell mass was insufficient to cause diabetes but rather re-quired the presence of environmental factors to unmask the effect.
There are well-described functional defects in the beta cells of subjects withdiabetes. As mentioned earlier, the loss of first phase insulin secretion is a partic-ularly early defect [12]. Another is the loss of oscillations in insulin secretion, the
5 Pancreatic beta-cell failure in the pathogenesis of type 2 diabetes
113

importance of which relates to the regulation of hepatic glucose production underphysiological conditions [40]. This may occur early in the disease, being foundin non-diabetic relatives of people with type 2 diabetes [41]. Thirdly, inefficientconversion of the precursor peptide, pro-insulin, into insulin results in a four tofivefold increase in pro-insulin levels in the beta cells of patients with type 2 dia-betes [42].
Defects within the incretin system may also result in early beta-cell dys-function [14]. The incretins are a pair of gut hormones, namely glucagon-likepeptide 1 and glucose-dependent insulinotropic polypeptide, which are releasedinto the bloodstream after meal ingestion and stimulate insulin secretion in aglucose-dependent manner. The incretins increase the expression of genes im-portant for insulin secretion, such as the GLUT2 and glucokinase genes, andbeta-cell proliferation, such as PDX-1. Subjects with type 2 diabetes may displaydown-regulation of incretin receptors on the surface of beta cells [43], impairedincretin-induced insulin secretion [44] and increased degradation of incretin hor-mones [45]. Non-diabetic relatives of those with diabetes [46] and people withimpaired glucose tolerance [47] may also display defects in the incretin system.
A whole range of gene expression defects are also associated with beta-celldysfunction. My research group have previously demonstrated that proteins vi-tal to beta-cell function and insulin secretion, known as the transcription factorsHIF-1a [48] and ARNT [49], have significantly less expression in the pancreaticislets of diabetic versus non-diabetic subjects. Knockout mice lacking the genesfor these proteins in insulin expressing cells develop glucose intolerance and im-paired insulin secretion [44, 45]. In fact, the advent of genome-wide associationstudies (GWAS) in 2007 has led to an explosion of data on the possible geneticbackground of type 2 diabetes [20]. GWAS uses thousands of small nucleotidesequences throughout the genome to search for patterns linked to disease, us-ing the human genome sequencing project as reference. The transcription factor7-like 2 (TCF7L2) is to be most strongly linked to type 2 diabetes with impor-tant effects on beta-cell proliferation and function [50], incretin-related insulinsecretion [39] and insulin secretion [51]. Polymorphisms in TCF7L2 are thoughtto account for ~20% of the population attributable risk of diabetes [52]. The im-portant point here is that the genetic determinants of beta-cell function and massappear closely linked.
Some investigators now refer to ‘reduced functional beta-cell mass’ ratherthan debating the predominance of reduced mass or defective function in diabetescausation [53]. The ‘plasticity’ of the functional beta-cell mass, that is, the conceptthat beta cells can undergo adaptive changes in both mass and function whenchallenged by insulin resistance has also received some attention.
A modern epidemic
114

MECHANISMS OF BETA-CELL FAILUREIf defects in the functional beta-cell mass play such a critical role in diabetespathogenesis, what are some of the mechanisms responsible for these defects?These have been summarised in Figure 3.
Figure 3. Proposed mechanisms of pancreatic beta (beta) cell dysfunction and death intype 2 diabetes. This flow-chart depicts the complex and multifactorial nature of cell dys-function in this condition. For a description of the concepts and terms see the text.
PANCREATIC ISLET INFLAMMATIONThere is mounting evidence that chronic low-grade inflammation of the pan-creatic islet can cause insulin secretory dysfunction and beta-cell apoptosis [54].Most striking is the macrophage infiltration seen in the islets of mice and humanswith type 2 diabetes prior to the onset of beta-cell death [55]. It is also known thatislets and ductal cells respond to metabolic stress, such as hyperglycaemia [56]and exposure to fatty acids, by expressing cytokines particularly IL-1beta. Whilethis may initially be protective, chronic expression of this cytokine may result inthe production of reactive oxygen species, inflammation and eventual beta-celldeath [49]. Furthermore, the use of anti-inflammatory therapies, such as an IL-1receptor antagonists [57] or non-steroidal anti-inflammatory drugs [58] results insmall improvements in beta-cell function independent of an effect on insulin re-sistance. Inflammatory markers, such as the serum leukocyte count and c-reactiveprotein, are also elevated in patients with type 2 diabetes and in those at risk of
5 Pancreatic beta-cell failure in the pathogenesis of type 2 diabetes
115

diabetes [59].There is emerging evidence linking obesity and beta-cell failure via an in-
flammatory pathway. Leptin, a hormone secreted by fat cells to control appetite,is often found in high levels in type 2 diabetes [60] and at such levels, has negativeeffects on insulin secretion [61] and may induce beta-cell apoptosis [62]. Con-versely, adiponectin which has anti-inflammatory and insulin sensitising effects,appears to be down-regulated in diabetes [63]. In addition, fat-derived cytokines,fatty acids and lipoproteins may all have adverse effects on beta-cell function,suggesting a common inflammatory link between the various components of themetabolic syndrome.
Figure 4. Islet amyloid deposition in a human with type 2 diabetes In the islet of this pa-tient with diabetes, amyloid infiltration is seen as bright plaques in this grey scale image,thioflavin S stain.
ISLET AMYLOIDAlthough islet amyloidosis has long been associated with beta-cell loss in type 2diabetes [64], its precise role is uncertain. At postmortem, more than 90% of type2 diabetic subjects have amyloid deposits in at least one islet compared to 12% of
A modern epidemic
116

age-matched non-diabetic patients [65]. However, the number of islets affected ishighly variable [66] and there is no relationship between duration of diabetes andthe presence or severity of islet amyloid [67].
Islet amyloid fibrils are composed of amylin, a normally occurring peptideof the beta cell co-stored with insulin, which has folded abnormally and is ini-tially deposited around islet capillaries but later within the islet space [30]. Theincreased production of pro-amylin accompanies the higher pro-insulin levelscharacteristic of type 2 diabetes and may be the first step to developing islet amy-loid [68].
Although synthetic amyloid fibrils induce early beta-cell death in vitro [69],it is unclear whether amyloidosis is the direct cause of beta-cell failure in vivoor rather, the end-result of several distinct processes including inflammation, ox-idative stress and mitochondrial damage. It is also currently debated whether theamyloid plaques per se are cytotoxic or rather small intracellular molecules thatare precursors in the development of such plaques [70].
ENDOPLASMIC RETICULUM STRESSThe endoplasmic reticulum (ER), a highly developed organelle that resides withinthe cell, is responsible for protein handling and packaging. Due to the high secre-tory demand placed on beta cells in type 2 diabetes, the endoplasmic reticulummay become overwhelmed by the production of high level of proteins [71]. Aprocess called ER stress ensues whereby intracellular signals intending to protectthe beta cells from the effects of inflammation [72] may eventually lead to the im-pairment of beta-cell function, the morphological appearance of ER swelling asproteins accumulate and subsequent beta-cell death.
ER stress may be mediated via genetic and environmental factors. Mice withmutations in proinsulin develop diabetes with morphological evidence of ERstress [20]. Exposure of islets to high glucose levels, cytokines and fatty acidsmay also lead to signs of ER stress [73].
GLUCOSE TOXICITYGlucose is the key physiological regulator of insulin secretion. Chronic hy-perglycaemia is associated with impaired insulin secretion [74] and restoringnormoglycaemia in subjects with diabetes has a clearly positive effect on beta-cell function [75].
There are several ways by which the exposure of beta cells to high glucoselevels has toxic effects (glucotoxicity). The term ‘beta-cell dedifferentiation’refers to an altered pattern of gene expression that results in substantial functional
5 Pancreatic beta-cell failure in the pathogenesis of type 2 diabetes
117

defects related to chronic hyperglycaemia [76]. Changes in beta-cell signallingand architecture are also possible effects of high glucose exposure [77]. The over-production of reactive oxygen species, known as oxidative stress, is related tomitochondrial metabolism of high glucose levels and may result in beta-cell dys-function or death [20].
Support for the oxidative stress hypothesis has come from a number of ani-mal and human studies. The beta-cell over-expression of glutathione peroxidase,the enzyme that protects cells from oxidative damage, improved beta-cell massand function in diabetic mice [78]. Higher concentrations of oxidative stress mark-ers were found in islets from human subjects with type 2 diabetes and markedimprovement in insulin secretion followed 24 hours of exposure to glutathione[79].
The failure of the beta cell’s adaptive response to high glucose levels mayprecede dysfunction. The Fas-FLIP pathway involves a series of factors whichare upregulated in response to high glucose levels and which result in greaterbeta-cell differentiation, proliferation and function [80]. However, in chronic hy-perglycaemia, this adaptive pathway may eventually fail resulting in deteriorationin beta-cell function and reduced survival [49].
LIPOTOXICITYWhilst effective insulin secretion requires the presence of fatty acids [81], long-term exposure to excessive levels of this nutrient may also result in beta-celltoxicity [30]. The precise mechanism of so-called lipotoxicity is unclear but itmay be due to genetic alterations in the expression of insulin and enzymes con-trolling insulin secretion [82], metabolic disturbances and ultimately, beta-celldeath.
Studies in the Zucker diabetic fatty rat, considered a good model for obesity-related type 2 diabetes, have shown that the development of hyperlipidaemiaparallels inadequate insulin secretion and the onset of diabetes [83]. However thelipid levels in this animal model are often extreme, so whether this reflects thehuman condition is debatable. Furthermore, fewer than 12% of obese hyperlipi-daemic human subjects become diabetic [84], suggesting that lipotoxicity may bejust one component in the development of beta-cell failure in type 2 diabetes.
BETA-CELL EXHAUSTIONIt is speculated that after a prolonged period of insulin hypersecretion, depletionof readily available insulin granules may occur, thereby reducing the insulinsecretory response [20]. Although we previously discussed the limitations of
A modern epidemic
118

beta-cell exhaustion as the sole pathogenic mechanism, it may play a role in thewider, multifactorial setting of diabetes pathogenesis.
The strongest support for the exhaustion concept comes from studies ex-amining the benefits of ‘beta-cell rest’ strategies. When inhibitors of insulinsecretion, such as diazoxide or somatostatin, are given to animals or humanswith diabetes, paradoxical increases in beta-cell function are observed followinga period of ‘rest’ [85, 86]. Furthermore, human subjects with poorly controlled dia-betes demonstrate a dramatic improvement in beta-cell function following a briefperiod of intensive glycaemic control [67]. A multicentre, randomised study ofover 350 newly diagnosed patients confirmed that early intensive insulin therapymay facilitate recovery and maintenance of beta-cell function and protracted gly-caemic remission better than oral hypoglycaemic agents for at least one year afterdiagnosis [87].
This leads to the discussion of the therapeutic implications of beta-cell fail-ure and the possibility of reversing this complex process. Although a highlycontroversial and evolving area of research, the use of certain sulfonylureas suchas glibenclamide has been linked to beta-cell death [88], while there is mountingevidence that incretin-based therapy and insulin replacement increase beta-cellmass in mice and have a positive effect on function [89]. However, a discussionon the nuances of beta-cell preservation in type 2 diabetes is beyond the scope ofthis chapter. For such a discussion, we refer the reader to a recent review on thistopic [81].
CONCLUSIONPancreatic beta-cell dysfunction plays a vital and complex role in the pathogen-esis of type 2 diabetes. Ultimately, it is the failure of beta cells to respond to theinsulin requirements posed by the prevailing level of insulin resistance that leadsto the development of type 2 diabetes. We have discussed the evidence in supportof various genetic and environmental factors that conspire together in this stateof beta-cell susceptibility and ‘decompensation’. The precise role of each and thesearch for a hypothesis which may unify these disparate concepts into a singleparadigm is highly contentious and under active investigation. However, thereis no doubt that beta-cell demise occurs in stages with early defects in beta-celldysfunction, such as loss of first phase insulin secretion resulting in post-pran-dial hyperglycaemia following which progressive rises in glucose levels, fattyacids and insulin resistance place further stress on the beta cell, leading to even-tual decline in its secretory capacity. Subtle components of the beta-cell stressmechanism, initially adaptive, such as changes to the endoplasmic reticulum andmitochondrium also eventually exacerbate the situation. Recent evidence sug-gests that early intervention to improve glycaemic control may improve beta-cell
5 Pancreatic beta-cell failure in the pathogenesis of type 2 diabetes
119

function and for at least a limited time period, may retard progression to beta-cellfailure. Further research into the complex mechanisms of beta-cell failure maytherefore offer hope in our collective fight against the global epidemic of type 2diabetes.
References1. Glatthaar C, Welborn TA, Stenhouse NS & Garcia-Webb P (1985). Diabetes
and impaired glucose tolerance: a prevalence estimate based on the Bussel-ton 1981 survey. The Medical Journal of Australia, 143(10): 436–40.
2. Dunstan DW, Zimmet PZ, Welborn TA, DeCourten MP, Cameron AJ &Sicree RA, et al. (2002). The rising prevalence of diabetes and impairedglucose tolerance: the Australian diabetes, obesity and lifestyle study (Aus-Diab). Diabetes Care, 25(5): 829–34.
3. Wild S, Roglic G, Green A, Sicree R & King H (2004). Global prevalenceof diabetes: estimates for the year 2000 and projections for 2030. DiabetesCare, 27(5): 1047–53.
4. Yang W, Lu J, Weng J, Jia W, Ji L, Xiao J & Shan Z, et al. (2010). Preva-lence of diabetes among men and women in China. New English Journal ofMedicine, 362: 1090–101.
5. Diabetes Australia (2010). Diabetes in Australia. [Online]. Available:www.diabetesaustralia.com.au/Understanding-Diabetes/Diabetes-in-Aus-tralia [Accessed 26 September 2011].
6. Sakula A (1988). Paul Langerhans: a centenary tribute. Journal of the RoyalSociety of Medicine, 81(7): 414–15.
7. Bonner-Weir S (1991). Anatomy of islet of Langerhans. In Samols E (Ed).The endocrine pancreas (pp15–27). New York: Raven.
8. Rahier J, Guiot Y, Goebbels RM, Sempoux C & Henquin JC (2008). Pan-creatic beta-cell mass in European subjects with type 2 diabetes. Diabetes,Obesity and Metabolism, 10(Suppl. 4): 32–42.
9. Klöppel G, Löhr M, Habich K, Oberholzer M & Heitz PU (1985). Isletpathology and the pathogenesis of type 1 and type 2 diabetes mellitus revis-ited. Survey and Synthesis of Pathology Research, 4(2): 110–25.
10. Lifson N, Lassa CV & Dixit PK (1985). Relation between blood flow andmorphology in islet organ of rat pancreas. American Journal of Physiology,
A modern epidemic
120

249(1 Pt 1): E43–48.11. Kaido T, Yebra M, Cirulli V, Rhodes C, Diaferia G & Montgomery AM
(2006). Impact of defined matrix interactions on insulin production by cul-tured human beta-cells: effect on insulin content, secretion and gene tran-scription. Diabetes, 55(10): 2723–29.
12. Brissova M, Fowler MJ, Nicholson WE, Chu A, Hirshberg B & Harlan DM,et al. (2005). Assessment of human pancreatic islet architecture and compo-sition by laser scanning confocal microscopy. Journal of Histochemistry andCytochemistry, 53(2): 1087–97
13. Straub SG, James RF, Dunne MJ & Sharp GW (1998). Glucose activatesboth K(ATP) channel-dependent and K(ATP) channel-independent signalingpathways in human islets. Diabetes, 47(5): 758–63.
14. Perley MJ & Kipnis DM (1967). Plasma insulin responses to oral and intra-venous glucose: studies in normal and diabetic subjects. Journal of ClinicalInvestigation, 46(12): 1954–62.
15. Klee P, Bavamian S, Charollais A, Caille D, Cancela J, Peyrou M, et al.(2008). Gap junctions and insulin secretion. In Seino S & Bell GI (Eds). Pan-creatic beta cell in health and disease (pp111–32). Japan: Springer.
16. Ahren B (2006). Incretins and islet function. Current Opinion in En-docrinology & Diabetes, 13(2): 154–61.
17. Ahren B (2009). Islet G protein-coupled receptors as potential targets fortreatment of type 2 diabetes. Nature Reviews Drug Discovery, 8: 369–85.
18. Nolan CJ & Prentki M (2008). The islet beta-cell: fuel responsive and vul-nerable. Trends in Endocrinology and Metabolism, 19(8): 285–91.
19. Lau SL, Clifton-Bligh R, Eismann J & Gunton JE (2008). A functionaland regulated vitamin D system exists within Min-6 cells, an immortalizedmouse-derived beta-cell line. Australian Diabetes Society Annual ScientificMeeting.
20. Baetens D, Malaisse-Lagae F, Perrelet A & Orci L (1979). Endocrine pan-creas: three-dimensional reconstruction shows two types of islets of Langer-hans. Science, 206(4424): 1323–25.
21. Haataja L, Gurlo T, Huang CJ & Butler PC (2008). Islet amyloid in type2 diabetes and the toxic oligomer hypothesis. Endocrinology Review, 29(3):303–16.
5 Pancreatic beta-cell failure in the pathogenesis of type 2 diabetes
121

22. Leahy JL & Pratley RE (2011). What is type 2 diabetes mellitus? Crucialrole of maladaptive changes in beta cell and adipocyte biology In RobertsonRP & Powers AC (Eds). Translational endocrinology and metabolism: Type2 Diabetes (pp9–43). Maryland: The Endocrine Society.
23. Martin BC, Warram JH, Krolewski AS, Bergman RN, Soeldner JS & KahnCR (1992). Role of glucose and insulin resistance in the development oftype 2 diabetes mellitus: results of a 25-year follow-up study. The Lancet,340(8825): 925–29.
24. Lillioja S, Mott DM, Howard BV, Bennett PH, Yki-Jarvinen H, FreymondD, et al. (1988). Impaired glucose tolerance as a disorder of insulin action.Longitudinal and cross-sectional studies in Pima Indians. The New EnglishJournal of Medicine, 318(19): 1217–25.
25. Weir GC & Bonner-Weir S (2004). Five stages of evolving beta cell dys-function during progression to diabetes. Diabetes, 53(S3): 16–21.
26. Hansen BC & Bodkin NL (1990). Beta-cell hyperresponsiveness: earliestevent in the development of diabetes in monkeys. The American Journal ofPhysiology, 259(3): R612–17.
27. Krook, A & O’Rahilly S (1996). Mutant insulin receptors in syndromes ofinsulin resistance. Baillieres Clinical Endocrinology and Metabolism, 10(1):97–122.
28. Weyer C, Bogardus C, Mott DM & Pratley RE (1999). The natural historyof insulin secretory dysfunction and insulin resistance in the pathogenesis oftype 2 diabetes mellitus. Journal of Clinical Investigation, 104(6): 787–94.
29. Kahn SE, Prigeon RL, McCulloch DK, Boyko EJ, Bergman RN, SchwartzMW, et al. (1993). Quantification of the relationship between insulin sen-sitivity and beta-cell function in human subjects: evidence for a hyperbolicfunction. Diabetes, 42(11): 1663–72.
30. Hennige AM, Burks DJ, Ozcan U, Kulkarni RN, Ye J, Park S, SchubertM, Fisher TL, et al. (2003). Upregulation of insulin receptor substrate-2 inpancreatic beta cells prevents diabetes. Journal of Clinical Investigation,112(10): 1521–32.
31. George S, Rochford JJ, Wolfrum C, Gray SL, Schinner S & Wilson JC(2004). A family with severe insulin resistance and diabetes due to a muta-tion in AKT2. Science, 304(5675): 1325–28.
A modern epidemic
122

32. Shoelson SE, Lee J & Yuan M (2003). Inflammation and the IKK beta/Ikappa B/NF kappa B axis in obesity- and diet-induced insulin resistance. In-ternational Journal of Obesity and Related Metabolic Disorders, 27(Suppl.3): S49–52.
33. Donath MY, Storling J, Maedler K & Mandrup-Poulsen T (2003). Inflam-matory mediators and islet beta cell failure: a link between type 1 and type 2diabetes. Journal of Molecular Medicine, 81(8): 455–70.
34. Clark A (2008). Pancreatic islet pathology in type 2 diabetes. In Seino S &Bell GI (Eds). Pancreatic beta cell in health and disease (pp381–98). Japan:Springer.
35. Butler AE, Janson J, Bonner-Weir S, Ritzel R, Rizza RA & Butler PC(2003). Beta cell deficit and increased beta cell apoptosis in humans withtype 2 diabetes. Diabetes, 52(1): 102–10.
36. Powers AC, Stein RW (2011). In Robertson RP & Powers AC (Eds).Translational endocrinology and metabolism: type 2 diabetes (pp95–116).Maryland: The Endocrine Society.
37. MacLean N & Ogilvie RF (1955). Quantitative estimation of pancreatic islettissue in diabetic subjects. Diabetes, 4(5): 367–76.
38. Matsumoto S, Okitsu T, Iwanaga Y, Noguchi H, Nagata H, Yonekawa Y, etal. (2005). Insulin independence of unstable diabetic patient after single liv-ing donor islet transplantation. Transplant Proceeding, 37(8): 3427–29.
39. Leahy JL, Bonner-Weir S & Weir GC (1988). Minimal chronic hypergly-caemia is a critical determinant of impaired insulin secretion after an incom-plete pancreatectomy. Journal of Clinical Investigation, 81(5): 1407–14.
40. Porkson N (2002). The in vivo regulation of pulsatile insulin secretion. Dia-betologia, 45(1): 3–20.
41. O’Rahilly S, Turner RC & Matthews DR (1988). Impaired pulsatile secre-tion of insulin in relatives of patients with non-insulin-dependent diabetes.The New England Journal of Medicine, 318(19): 1225–30.
42. Kahn SE & Halban PA (1997). Release of incompletely processed pro-in-sulin is the cause of the disproportionate proinsulinemia of NIDDM. Dia-betes, 46(1): 1725–32.
43. Shu L, Matveyenko AV, Kerr-Conte J, Cho JH, McIntosh CH & MaedlerK (2009). Decreased TCF7L2 protein levels in type 2 diabetes mellitus
5 Pancreatic beta-cell failure in the pathogenesis of type 2 diabetes
123
correlate with downregulation of GIP- and GLP-1 receptors and impairedbeta-cell function. Human Molecular Genetics, 18(13): 2388–99.
44. Meier JJ, Gallwitz B, Kask B, Deacon CF, Holst JJ, Schmidt WE, et al.(2004). Stimulation of insulin secretion by intravenous bolus injection andcontinuous infusion of gastric inhibitory polypeptide in patients with type 2diabetes and healthy control subjects. Diabetes, 53(Suppl. 3): S220–24.
45. Mannucci E, Pala L, Ciani S, Bardini G, Pezzatini A, Sposato I, et al. (2005).Hyperglycaemia increases dipeptidyl peptidase IV activity in diabetes melli-tus. Diabetologia, 48(6): 1168–72.
46. Meier JJ, Hucking K, Holst JJ, Deacon CF, Schmiegel WH & NauckMA (2001). Reduced insulinotropic effect of gastric inhibitory polypeptidein first-degree relatives of patients with type 2 diabetes. Diabetes, 50(11):2497–04.
47. Faerch K, Vaag A, Holst JJ, Glumer C, Pederson O & Borch-Johnsen K(2008). Impaired fasting glycaemia vs impaired glucose tolerance: similarimpairment of pancreatic alpha and beta-cell function but differential rolesof incretin hormones and insulin action. Diabetologia, 51(5): 853–61.
48. Cheng K, Ho K, Stokes R, Scott C, Lau SM, Hawthorne WJ et al. (2010).Hypoxia-inducible factor-1alpha regulates beta-cell function in mouse andhuman islets. Journal of Clinical Investigation, 120(6): 2171–83.
49. Gunton JE, Kulkarni RN, Yim S, Okada T, Hawthorne WJ, Tseng Y,et al. (2005). Loss of ARNT/HIF1β mediates altered gene expression andpancreatic-islet dysfunction in human type 2 diabetes cell. Cell Metabolism,122: 337–49.
50. Liu Z & Habener JF (2010). Wnt signaling in pancreatic islets. Advances inExperimental Medicine and Biology, 654: 391–419.
51. da Silva Xavier G, Loder MK, McDonald A, Tarasov AI, Carzaniga R, Kro-nenberger K, et al. (2009). TCF7L2 regulates late events in insulin secretionfrom pancreatic islet beta cells. Diabetes, 58(4): 894–905.
52. Grant SFA, Thorleifsson G, Reynisdottir I, Benediktsson R, Manolescu A,Sainz J, et al. (2006). Variant of transcription factor 7-like 2 (TCF7L2) geneconfers risk of type 2 diabetes. Nature Genetics, 38: 320–23.
53. Karaca M, Magnan C & Kargar C (2009). Functional pancreatic beta-cellmass: involvement in type 2 diabetes and therapeutic intervention. Diabetes
A modern epidemic
124

and Metabolism, 35: 77–84.54. Donath MY & Ehses JA (2008). Mechanisms of beta cell death in diabetes.
In Seino S & Bell GI (Eds). Pancreatic beta cell in health and disease(pp75–89). Japan: Springer.
55. Ehses JA, Perren A, Eppler E, Ribaux P, Pospisilik JA, Maor-Cahn R, et al.(2007). Increased number of islet associated macrophages in type 2 diabetes.Diabetes, 56: 2356–70.
56. Maedler K, Sergeev P, Ris F, Oberholzer J, Joller-Jemelka HI, SpinasGA, et al. (2002). Glucose-induced beta-cell production of interleukin-1betacontributes to glucotoxicity in human pancreatic islets. Journal of ClinicalInvestigation, 110: 851–60.
57. Larsen CM, Faulenbach M, Vaag A, Volund A, Ehses JA, Seifert B, etal. (2007). Interleukin-1-receptor antagonist in type 2 diabetes mellitus. TheNew England Journal of Medicine, 356: 1517–26.
58. Zeender E, Maedler K, Bosco D, Berney T, Donath MY & Halban PA(2004). Pioglitazone and sodium salicylate protect human beta cells againstapoptosis and impaired function induced by glucose and interleukin-1beta.Journal of Clinical Endocrinology and Metabolism, 89: 5059–66.
59. Pham MN, Hawa MI, Pfleger C, Roden M, Schernthaner G, Pozzilli P, et al.(2011). Pro- and anti-inflammatory cytokines in latent autoimmune diabetesin adults, type 1 and type 2 diabetes patients: action LADA 4. Diabetologia,54(7): 1630–38.
60. Weyer C, Funahashi T, Tanaka S, Hotta K, Matsuzawa Y, Pratley RE, etal. (2001). Hypoadiponectinaemia in obesity and type 2 diabetes: close as-sociation with insulin resistance and hyperinsulinaemia. Journal of ClinicalEndocrinology and Metabolism, 86: 1930–35.
61. Kieffer TJ & Habener JF (2000). The adipoinsular axis: effects of leptin onpancreatic beta cells. American Journal of Physiology: Endocrinology andMetabolism, 278: E1–14.
62. Maedler K, Sergeev P, Ehses JA, Mathe Z, Bosco D, Berney T, et al. (2004).Leptin modulates beta cell expression of IL-1 receptor antagonist and releaseof IL-1beta in human islets. Proceedings of the National Academy of Sci-ences USA, 101: 8138–43.
63. Weyer C, Funahashi T, Tanaka S, Hotta K, Matsuzawa Y, Pratley RE et
5 Pancreatic beta-cell failure in the pathogenesis of type 2 diabetes
125

al. (2001). Hypoadiponectinaemia in obesity and type 2 diabetes: a close as-sociation with insulin resistance and hyperinsulinaemia. Journal of ClinicalEndocrinology and Metabolism, 86: 1930–35.
64. Wright A (1927). Hyaline degeneration of the islets of Langerhans in non-diabetics. American Journal of Pathology, 3(5): 461–82.
65. Rocken C, Linke RP & Saeger W (1992). Immunohistology of islet amyloidpolypeptide in diabetes mellitus: semi-quantitative studies in a post-mortemseries. Virchows Archive A: Pathological Anatomy and Histopathology, 421:339–44.
66. Clark A, Holman R, Matthews D, Hockaday T & Turner R (1984). Non-uni-form distribution of islet amyloid in the pancreas of ‘maturity-onset’ diabeticpatients. Diabetologia, 27: 527–28.
67. Westermark P (1984). Amyloid and polypeptide hormones: what is theirinterrelationship? Amyloid: International Journal of Experimental and Clin-ical Investigation, 1: 47–57.
68. Paulsson JF & Westermark GT (2005). Aberrant processing of humanproislet amyloid polypeptide results in increased amyloid formation. Dia-betes, 54: 2117–25.
69. Marzban L, Rhodes CJ, Steiner DF, Haataja L, Halban PA & VerchereCB (2006). Impaired NH2-terminal processing of human proislet amyloidpolypeptide by the prohormone convertase PC2 leads to amyloid formationand cell death. Diabetes, 55: 2192–201.
70. Zraika S, Hull RL, Verchere CB, Clark A, Potter KJ, Fraser PE, et al. (2010).Toxic oligomers and islet beta cell death: guilty by association or convictedby circumstantial evidence? Diabetologia, 53: 1046–56.
71. Laybutt DR, Preston AM, Akerfeldt MC, Kench JG, Busch AK, BiankinAV, et al. (2007). Endoplasmic reticulum stress contributes to beta cell apop-tosis in type 2 diabetes. Diabetologia, 50: 752–63.
72. Weber SM, Chambers KT, Bensch KG, Scarim AL & Corbett JA (2004).PPARgamma ligands induce ER stress in pancreatic beta cells: ER stressactivation results in attenuation of cytokine signaling. American Journal ofPhysiology: Endocrinology and Metabolism, 287: E1171–77.
73. Marchetti P, Bugliani M Lupi R, Marselli l, Masini M, Boggi U, et al.(2007). The endoplasmic reticulum in pancreatic beta cell of type 2 diabetes
A modern epidemic
126

patients. Diabetologia, 50: 2486–94.74. Unger RH & Grundy S (1985). Hyperglycaemia as an inducer as well as a
consequence of impaired islet cell function and insulin resistance: implica-tions for the management of diabetes. Diabetologia, 28: 119–21.
75. Turner RC, McCarthy ST, Holman RR & Harris E (1976). Beta-cell functionimproved by supplementing basal insulin secretion in mild diabetes. BritishMedical Journal, 1: 1252–54.
76. Leahy JL, Cooper HE, Deal DA & Weir GC (1986). Chronic hypergly-caemia is associated with impaired glucose influence on insulin secretion: astudy in normal rats using chronic in vivo glucose infusion. Journal of Clin-ical Investigation, 77: 908–15.
77. Leahy JL (2004). Detrimental effects of chronic hyperglycemia on thepancreatic β-cell. In LeRoith D, Olefsky JM & Taylor S (Eds). Diabetes mel-litus: a fundamental and clinical text (pp115–27). Philadelphia: Lippincott.
78. Harmon JS, Bogdani M, Parazzoli SD, Mark SS, Oseid EA, Berghmans M,et al. (2009). Beta-cell specific overexpression of glutathione peroxidase pre-serves intranuclear MafA and reverses diabetes in db/db mice. Endocrinol-ogy, 150: 4855–62.
79. Del Guerra S, Lupi R, Marselli L, Masini M, Bugliani M, Sbrana S, et al.(2005). Functional and molecular defects of pancreatic islets in human type2 diabetes. Diabetes, 54: 727–35.
80. Donath MY, Ehses JA, Maedler K, Schumann DM, Ellingsgaard H, EpplerE, et al. (2005). Mechanisms of beta cell death in type 2 diabetes. Diabetes,54(Suppl. 2): S108–13.
81. Dobbins RL, Chester MW, Stevenson BE, Daniels MB, Stein DT & Mc-Garry JDI (1998). A fatty acid – dependent step is critically important forboth glucose- and non-glucose-stimulated insulin secretion. Journal of Clin-ical Investigation, 101: 2370–76.
82. Kebede M, Favaloro J, Gunton JE, Laybutt DR, Shaw M, Wong N, et al.(2008). Fructose-1,6-bisphosphatase overexpression in pancreatic beta-cellsresults in reduced insulin secretion: a new mechanism for fat-induced im-pairment of beta-cell function. Diabetes, 57: 1887–95.
83. Unger RH & Zhou YT (2001). Lipotoxicity of beta-cells in obesity and inother causes of fatty acid spillover. Diabetes, 50(Suppl. 1): S118–21.
5 Pancreatic beta-cell failure in the pathogenesis of type 2 diabetes
127

84. Agren G, Narbro K, Naslund, Sjostrom L & Peltonen M (2002). Long-termeffects of weight loss on pharmaceutical costs in obese subjects: a reportfrom the SOS intervention study. International Journal of Obesity RelatedMetabolism Disorders, 26: 184–92.
85. Leahy JL, Bumbalo LM & Chen C (1994). Diazoxide causes recovery ofbeta-cell glucose responsiveness in 90% pancreatectomised diabetic rats. Di-abetes, 44: 173–79.
86. Greenwood RH, Mahler RF & Hales CN (1976). Improvement in insulin se-cretion in diabetes after diazoxide. The Lancet, 1: 444–47.
87. Weng J, Li Y, Xu W, Shi L, Zhang Q, Zhu D, et al. (2008). Effect of inten-sive insulin therapy on beta-cell function and glycaemic control in patientswith newly diagnosed type 2 diabetes: a multicentre randomised parallel-group trial. The Lancet, 371: 1753–60.
88. Efanova IB, Zaitsev SV, Zhivotovsky B, Kohler M, Efendic S, Orrenius S,et al. (1998). Glucose and tolbutamide induce apoptosis in pancreatic betacells: a process dependent on intracellular xcalcium concentration. The Jour-nal of Biological Chemistry, 273: 33501–07.
89. Leahy JL, Hirsch IB, Peterson KA & Schneider D (2010). Targeting beta-cell function early in the course of therapy for type 2 diabetes mellitus.Journal of Clinical Endocrinology and Metabolism, 95: 4206–16.
A modern epidemic
128

Specific risk groups and settings


6Gender and obesity
Murray Fisher1 and Natalie Chilko
Multiple factors contribute to the development, maintenance and treatmentof obesity. Viewing obesity through a gender relations approach helps tounderstand how an individual’s interactions with others and society con-tributes to health opportunities and constraints, resulting in excess bodyweight. In gender relations theory, the body is viewed as both an agentand a product of social practice, whereby lifestyle behaviours influencedby an individual’s context may impact on the physical body. This chapterpresents life histories of two men in their 20s who have experience withobesity. Analysis of the production and power relations, relationships andsymbolism reveal the marginalising effect of their obesity, and how genderinteracts with other social structures including ethnicity and class. A holis-tic approach that considers how an individual configures their masculinityor femininity may assist in promoting and maintaining weight loss in obeseindividuals as it addresses the struggle in society experienced by manyobese people.
Despite significant advances in nutrition, health and weight-loss treatments, thereis a global epidemic of overweight and obesity [1]. Obesity is the result of sig-nificantly greater energy consumption than expenditure, and it is associated withlong-term health problems including diabetes, cardiovascular disease, high-bloodpressure, high cholesterol and some cancers [2]. Excess body weight has alsobeen associated with depression, anxiety and low self-esteem [3]. Colagiuri andcolleagues [4] estimate that the total direct cost of overweight and obesity inAustralia was a substantial A$21 billion in 2005. Obesity is a serious issue andcurrent treatment strategies are modest at best with limited long-term success [5],making it critical to investigate new approaches to the prevention and treatmentof obesity.
1 Sydney Nursing School, University of Sydney.
131

Gender research provides a new approach to understanding obesity. It isgenerally recognised that multiple factors contribute to excess weight, and med-ical, nursing and psychological literature have all considered this issue. The rapidincrease in obesity rates worldwide suggests genetic causes alone are not suffi-cient to account for the epidemic and the importance of technology and sedentarylifestyles is well recognised [6]. Gender research has the potential to investigatethe heterogeneity between and amongst men and women that may explain or giveinsight into why lifestyle behaviours are generally not altered by obese people.Consideration of an individual’s experience of obesity will enable the develop-ment of tailored weight-loss programs, rather than treatments that treat all menand all women as a collective group.
THE GENDER RELATIONS APPROACHThe contemporary theory of gender is gender relations, where gender is definedas ‘a structure of social relations that centres on the reproductive arena, and theset of practices (governed by this structure) that bring reproductive distinctionsbetween bodies into social processes’ [7, p10]. Gender is an internally com-plex social structure that is actively constructed and comes into being as people(inter)act. An individual’s gender is dynamic and constantly configured as itinteracts with other social structures including ethnicity, sexuality and class. Mul-tiple femininities and masculinities exist, and these are viewed as gender projectsthat can be challenged, reconstructed and contested [8, 9]. An individual’s gen-der is considered relational to other’s constructions of gender and thus peopleare positioned within a gender order. Hegemony, for example, is an idealisedand dominant form of masculinity that is powerful, influential and strong. Othertypes of masculinity include complicit, marginalised and subordinated masculin-ities [6].
The body is a reproductive arena through which social practice occurs andgender is constructed. The body is both a recipient of social practice as well as anagent in social practice. As embodied beings we are recipients of emotions fromothers’ actions, while simultaneously able to act in ways that create emotions inothers. Social embodiment refers to the way bodies, as agencies, participate insociety, and how in turn society affects bodies [10]. Some bodies for example en-counter violence, accidents and sickness as a result of social practices, and thiscontributes to their configuration of gender [10]. To this end, obese bodies areconstituted in social processes that are created in history and subject to change,and therefore could be explored as patterns of gendered social embodiment.
A modern epidemic
132

Gender, health and obesityFrom the perspective of a gender relations approach, research on obesity demon-strates the validity of gender as a concept that manifests in social practice. Forexample, differences and inequalities between genders may help to explain gen-eral health differences among men and women. For example men are less likelyto receive health screens, report symptoms and attend medical services thanwomen [11, 12], and are more likely to engage in risky behaviour [13]. Howevernot all men engage in risky behaviour and not all women have regular medicalcheck-ups. Societal norms can influence the health of different genders beyondany biological sex differences, although there are differences in how people areaffected. A gender relations approach focuses on how an individual’s interactionswith others and society significantly contribute both to opportunities for and con-straints on health [14]. These, in turn, can give insight into the cause, maintenanceand treatment of obesity.
The focus in the empirical literature on sex differences in obesity is a startingpoint for understanding the impact of gender on health behaviours. There arecomplex sex differences in the prevalence, effects and treatment of obesity. Agrowing number of studies for example suggest sex differences in rates of obesityexist in a dynamic relationship with ethnicity, age, geography and socioeco-nomic status worldwide [15, 16, 17]. Wang and Beydon’s [15] systematic reviewand meta-regression analysis of obesity prevalence studies in the US reportedlarge ethnic differences in obesity prevalence, especially among women. Minor-ity groups, including non-Hispanic blacks and Mexican Americans, had a highercombined prevalence than non-Hispanic whites. Non-Hispanic blacks overall hadthe highest prevalence of obesity which, in women, was 20 percentage pointshigher than obesity prevalence among white women [15]. Prevalence was alsoaffected by socioeconomic status (SES) and the effect differed by ethnic group.Less educated persons were more likely to be obese than their more educatedcounterparts, except amongst black women where higher education was associ-ated with a higher rate of obesity [15].
The complex dynamic between sex, SES, ethnicity and obesity prevalencealso exists in Australia. Obesity prevalence is higher among men and womenfrom lower socioeconomic status, less educated people, Aboriginal and TorresStrait Islander peoples, and among migrants [18]. Data from the 2004 to 2005National Health Survey indicate that people born overseas are more likely thanpeople born in Australia to be overweight or obese, and within this group, menare more likely to be overweight or obese than women (58% compared to 43%).Indigenous Australians have nearly double the likelihood of non-Indigenous Aus-tralians to be obese, and are almost three times more likely to be morbidly obese[18].
The differences between males and females and the effects of obesity alsoappear to be complex. A recent meta-analysis of cross-sectional studies of de-
6 Gender and obesity
133

pression and obesity (defined by BMI) in the community found a significantpositive association for women but not men [19]. However another systematic re-view and meta-analysis of longitudinal studies revealed a reciprocal link betweendepression and obesity (n = 58 745) in both men and women [20]. This study alsofound a potential cultural influence as the risk of developing depression whenobese was more pronounced in the American subjects compared to their Euro-pean counterparts [20]. This complexity also exists in research on sex differencesin obesity and anxiety, body image, quality of life [21, 22, 23, 24], and weight loss.Considerable individual differences exist in the efficacy of weight-loss interven-tions, however this is often concealed by reporting mean differences [5]. Rates ofdropout in weight-loss studies are also high (30%–60%) [5]. A range of behav-ioural, physiological and inherited factors have been put forward to explain therelative success of different individuals in losing weight through exercise [25].
Gender theory can help untangle the inconsistencies in the literature as it re-frains from categorising men and women into groups, as gender is dependent onan individual’s social and historical context. The failure to account for within-group and within-person variability has been suggested to be partially responsiblefor inconsistencies within the literature on sexual differences in other areasincluding healthcare utilisation [26]. Categorising by sex does not adequately ex-plain why only some men and some women become obese, nor does it explainwhy only some obese men and some obese women lose a significant amount ofweight. Biological and inherited characteristics are known to contribute to adi-pose profile [6] and the propensity to lose weight [25]; however social factors ofobesity are also strongly acknowledged. Gender relations theory focuses on howthe body navigates through and how it is affected by society.
THE STUDY AND ITS METHODWhile there is growing research investigating sex differences in obesity, there isa paucity of studies investigating the role of gender. Gender as configurations ofsocial practice may influence the lifestyle behaviours people engage in. It couldbe hypothesised that a person’s positioning within the gender order will influencetheir ability to alter lifestyle behaviours (eating habits, smoking, diet and exer-cise), thus influencing their weight.
We conducted a study to examine, using a gender relations approach, thelived experience of men who are or have been obese. We investigated the impactobesity has on identity, social practice and gender relations in order to discoverwhy individuals are successful (or not) in changing their lifestyles and behav-iours. Life history methodology was used to collect personal narratives fromobese men, two of which are presented here. The life history method is used toexplain an individual’s understanding of social events, movements and political
A modern epidemic
134

causes, and how individual members of groups or institutions see, experience andinterpret those events [27]. It is thus a useful way to gain a perspective on and un-derstanding of the gendered experiences of obese men.
Data analysis consisted of the identification of patterns of social response totrace a historical dynamic of gender. A progressive-regressive method of analy-sis was employed where the life story provides the personal link to wider issuesof history and culture [27]. In the first phase of analysis, a four-dimensionalstructural model of gender relations (production, power, emotion and symbolism)described by Connell [9, 10] was used to ascertain the informant’s experience ofgender and their position in the gender order. Each transcript was then analysedto map the informant’s gender project – the construction and reconstruction ofmasculinity. Gender starting points and the trajectories of the gender projectsare highlighted. These case studies were re-analysed to explore similarities anddifferences in the trajectories. These methods are consistent with those used incritical studies of men and masculinities [8, 28].
Group and contextBoth men whose life stories are the subject of this study, have been significantlyaffected by their obesity throughout the course of their life and both are currentlytrying to lose weight. Lukman (24 years old) and Justin (25 years old) havesimilar starting points for their construction of masculinity and a strikingly sim-ilar gender project. They have a similar family history, both growing up in themiddle class with relatively conservative parents. Both families were quite reli-gious; Lukman’s family was Coptic Christian and Justin’s was Catholic. Lukmanwas born in Jordan and moved with his family when he was in Year 11 atschool. Justin’s background is Spanish (his mother) and Italian (his father). Bothparticipants grew up in families with a conventional division of labour and a con-ventional power structure. They shared a closer relationship with their mothersthan fathers. The mother was often quite involved in the participants’ life whilecommunication with the father was generally avoided and the relationship wastense. Lukman’s father was obese and died two and a half years ago due to com-plications after surgery. Lukman has a family history of diabetes, cardiovasculardisease, high-blood pressure and cancer. Both Justin’s parents are alive and hismother struggles to lose weight. Both participants live at home and have beenoverweight since childhood.
Lukman and Justin appear to be at different points on the weight-loss trajec-tory. Although they currently weigh similar amounts, Justin, the heavier of thepair, became committed to weight loss at an earlier age. Lukman is 183 cm talland weighs approximately 147 kg. Justin is 189 cm tall and weighs 136 kg. Theirrespective BMIs are 43.9 and 38.1. Lukman underwent gastric-sleeve bandingtwo weeks prior to the interview and has so far lost 20 kg. His weight-loss ef-
6 Gender and obesity
135

forts prior to surgery were minor, with his only significant attempt at the age of13, when his family forced him to lose weight to make him more presentable forhis sister’s wedding. His father’s health complications associated with the obesityhave prompted Lukman’s recent commitment to weight loss.
Justin has a longer weight-loss history, undergoing lap-band surgery aftergraduating high school at age 18. He weighed 250 kg at this point, and lost 40 kgin the following year. He comments that although he initially reduced his portionsize and fat intake, no lifestyle changes were made and the weight-loss even-tually plateaued at approximately 180 kg. Justin tried other methods of weightloss while at university, however these were largely unsuccessful. A significantchange occurred when a friend introduced him to a weight-loss retreat, whichhe visited several times. This experience and access to information on nutrition,health and exercise inspired Justin to focus on his eating habits and caloric intake.He has been exercising regularly and closely monitoring his diet since then. Hegraduated from university in 2009 and spent the following year exercising andfocusing on weight loss. He has a personal trainer, visits the gym regularly andhas so far lost 114 kg. Although his BMI is still classified as obese, much of hisweight is due to muscle mass and his latest visit to a physician reported that hewas in good health.
GENDER SUBSTRUCTURES ANALYSISThe construction of masculinity of Lukman and Justin was analysed using Con-nell’s [10] substructures of gender relations: a) Gender production relations: thegender division, allocation and organisation of labour; b) Gender power rela-tions: the organisation of power, the way power is contested and the way groupsmobilise to counteract power inequalities; c) Cathexis or gender emotional re-lations: a person’s emotional attachment with another (or an object), includingdesire, sexuality and sexual relations; and d) Symbolism: the communication ofgender ideologies.
ProductionLukman and Justin are situated in a similar subordinated position in productionrelations. They have an unimpressive work history, are currently unemployed,rely on other family members for financial support, and have limited qualifica-tions and skills. They both experienced times at university that were difficult andresulted in failed subjects, and Justin partially attributes this to a low mood be-cause of his weight. Both participants have a transient work history and no skillsavailable to sell, resulting in a limited position in the labour market. Lukman hasworked primarily in temporary jobs in the fast food industry, for the local council,
A modern epidemic
136

in administrative roles, and for an IT company assembling computers for privateuse. Justin has worked at a call centre and recently in an IT sales job. They bothlack any affection for these positions, and being relatively unskilled, they remainreplaceable employees in the workplace.
Both Lukman and Justin have acknowledged a role of their weight in limitingtheir employment options. Lukman comments that for many jobs you ‘need tolook good in a shirt’ and he believes he is not ‘employable-looking’. Justin alsoindicates how his weight has affected his work: he resigned from his call centreposition after believing staff perceived him as ‘a grumpy person who couldn’ttalk to other people and couldn’t relate and didn’t have time for anybody’, as hewas struggling with severe back pain. His relationship with staff prior to the on-set of back pain had been friendly and warm. Justin further indicates that workingreduces time spent on weight loss,
I found that the only way to lose weight is if you fully dedicate yourself toit, which means you can’t have a job. (Justin)
He left his last job of three months because he was unhappy in the position andfound this affected his eating habits and potential to gain weight.
Although Lukman and Justin have worked in abstract labour positions, theyboth express dissatisfaction with these roles and have a positive attitude to theirfuture role in the labour market. They appear eager to support themselves. Justinis committed to ‘find something I love doing and do it’. Lukman expresses feel-ing ‘terrible’ about having to rely on the financial support of his sister and herhusband, and indicates his goals are to find work, finish uni, complete any post-graduate qualifications in psychology that may be necessary, and to eventuallysupport himself and his mother. Justin intends to complete a personal trainingqualification and to pursue work in the fitness industry. Although these men arecurrently dispensable in the workplace, they express motivation to becoming avaluable contributor to the labour market.
PowerThere have been significant issues of power in the lives of Lukman and Justin.They both cite an estranged relationship with their fathers from an early age. Bothfathers were perceived as aggressive, with rare occasions of violence, and themothers were the more approachable parent. They both believe however that theirmothers also perceived them as powerless. Lukman labels his mother as the ‘dot-ing’ mother, always involved and always enquiring about his wants and needs,
I go to sleep and I wake up and all the clothes that are on my floor are goneand washed and waiting outside the room. (Lukman)
6 Gender and obesity
137

Justin acknowledges a more general perceived powerlessness because of hisweight,
I think that people saw that [the weight] and empathised and it just turnedinto a ‘everyone has to take care of Justin’ kind of thing … I was so over-weight at one point that, you know, if I can’t help myself, how can I helpother people? (Justin)
They both believe their weight has significantly contributed to a powerlessnessand marginalisation in society.
They also acknowledge their own role in power relations by recognising theirchosen submissiveness in relationships. Justin comments that he was ‘friendly toeveryone so they would be friendly to me’. He used humour to be likeable and toavoid being the victim of bullying,
Humour was a really big part of how I came to relate to people all throughhigh school and further on. (Justin)
Lukman comments that he transformed from being ‘a very social animal … avery involved person to more of an introvert.’ He is unsure why this changeoccurred, but believes his obesity played a role in the transformation. He did ex-perience some bullying during high school but nothing he couldn’t really ‘shrugoff’. He believes his weight may have some role in it as ‘first appearances meana lot’, but he says that the bullying disappeared when he was one-on-one with theperpetrators.
Importantly, both participants express a desire to increase their power. Luk-man says that he wishes to ‘survive without’ the help of his doting mother andthat he wishes to ‘become more of an extrovert’ so that he can advance in his ca-reer and in relationships. Justin is dedicated to training and eating nutritiously sothat he can ‘inspire people and eventually raise some money for some charities.’A key weight-loss trigger for both these men has been a desire to increase theirpower, and thus to improve their position in the gender order.
Cathexis: emotion and relationshipsRelationships have been significantly affected by the obesity of these two men.Within the family unit, tension often arose because of weight,
I felt like a lot of their fights started from arguments about me and myweight and how hard Dad was on me and how my Mum [was] giving meeverything I want[ed]. (Justin)
A modern epidemic
138

Justin believes his dad may have felt ‘helpless’ and was unsure how to handle hisincreasing weight, resulting in their tense relationship. Obesity similarly affectedJustin’s ability to communicate with his father.
Obesity has also affected the friendships of the two men, however in a lessovert way to relationships with their parents. Both men report having few soundfriendships. Lukman believes he is more of ‘a deep friendship kind of person’ ashe prefers close, intimate relationships over a ‘legion of friends.’ Obesity thoughhas affected the activities that the men can participate in with friends. Justin com-ments that he ‘wasn’t really doing the same kind of things that other kids were’because he ‘wasn’t able to’,
I seemed to always be in a bit of a state of anxiousness or anxiety about …just about everyday things like if someone invited me out, would they bedriving a sedan or a hatchback? Would I be able to fit in the passenger seator the backseat? Would I be able to do the seatbelt up? (Justin)
He ‘felt it was easier just to stay home than to be bothered with it because of allthe things that I would have to encounter throughout the day.’ Lukman also limitshis social activities, avoiding going to the beach and places where he would haveto take his shirt off. He feels more comfortable around people who are aware heis trying to lose weight; otherwise he becomes very self-conscious.
Obesity has also had a major role in the sexual relations of the two partici-pants. Both participants reported having had a few, short-term relationships witha female partner that broke up primarily because of their low self-esteem.
I don’t feel confident enough to approach many people that I do find attrac-tive and I do find that I’d like to get to know. And then, if I do get overthat, if I do ask someone out, and then we do the relationship for a coupleof months – I don’t see myself as good enough, a lot of the time. (Lukman)
Justin also comments that he did not want to be seen with a girl because he wasconcerned about his appearance and he did not want to be an embarrassment.Despite losing a significant amount of weight, he still feels this way. His first girl-friend since the weight loss had also experienced a significant drop in weight andhe comments that this made it easier to have a sexual relationship, as they felt lessjudgemental about the other’s body. Justin however realises that he was insecurein the relationship,
I was still really insecure about having a girlfriend. I had kind of come tothe point in my life at one stage where I would be single for the rest of mylife and I was fine with it. So I had thought. (Justin)
6 Gender and obesity
139

Lukman struggles with his sexuality and he believes his obesity has limited hissexual opportunities and ability to explore this. Although he believes he is a het-erosexual, his first sexual encounter was with a gay man who he met through afriend. He is unsure if this was due to a ‘lack of long-term success with females’or homosexual tendencies of his own:
I figured what the hell, this might be the case. But I don’t know if it’s dueto the lack of success, lack of long-term success, or is it just an individualthing? (Lukman)
He indicates that because of his obesity he has been prevented in investigatinghis sexuality further, noting this as one of the reasons for undergoing weight-losssurgery. He believes his attraction to men may be just sexual, and he thinks hemay be ‘bi-sexual with a heterosexual skew’.
SymbolismThe symbol of obesity in society has affected both participants and has had arole in triggering their weight loss. Lukman acknowledges that his decision to un-dergo gastric-sleeve surgery was partially due to a desire to ‘fit in’. He commentsthat he wants to ‘look normal’. Justin uses the train as an example,
Getting on a train would always be difficult. Especially if it was busy orhot. I couldn’t stand for too long so I’d need to find a seat but there’s thatwhole thing where people don’t really want you to sit next to them or don’twant to sit next to you. There’s that, there’s the people watching you all thetime, looking at what you do and making judgements. (Justin)
These men are aware of their marginalisation by others because of their weight.Justin believes many people judge obese people as selfish and lazy,
I think people see overweight people like they only think about themselves.That they haven’t got time for other people … It’s like you think aboutfeeding yourself before doing anything else. (Justin)
Both participants are aware of the symbolic meanings that subjugate the bodyand place stress on the construction of gender. The body is inextricably linked togender, and as Parker [29] notes, a healthy looking physique is associated with asense of respect for oneself and a commitment to health and fitness – the converseof the perception of obesity, as experienced by these men. The stigma associatedwith obesity is considerable [30].
A modern epidemic
140

DiscussionThe two life histories presented here are valuable to the study of gender andhealth as they highlight the significant effect of the body on one’s constructionof masculinity. The weight of the participants has affected their position in thelabour market, their power relations and their emotional and sexual relationships.This has resulted in their marginalisation and thus the construction of a margin-alised masculinity.
The life-history methodology allows the dynamic of gender to be tracedacross the life course and the study of obesity serves as an interesting exampleof embodied masculinity developing over time. Both participants believed theywould improve their position in the gender order by losing weight. Both menbelieve their weight loss will allow them to ‘advance’ in society, which is syn-onymous to being closer to achieving the hegemonic dividend, that is, beingcomplicit with patriarchy and receiving its rewards. There is a sense that thingswill improve when they weigh less,
I guess I keep thinking that if I lose weight or if I get to a certain point I’mgoing to be happy and everything is going to be fine. (Justin)
Weight loss is an embodied transformative process in these cases, essential forthe reconfiguration of one’s masculinity. Physicality is closely tied with genderand the desire to achieve a more powerful, athletic body is a trigger for weightloss.
One’s position in the gender order, however, is not solely determined bythe physical body. Social practices have a role in shaping an individual’s bodywhich exists in a reciprocal relationship with the individual’s production, power,cathexis and symbolism. Justin, who is further along the weight-loss journey thanLukman, appears to be realising that his change in physical size is not matchedwith a change in positioning in the gender order,
I still feel like a child. I don’t feel like a man. I’m still living at home andmy parents still see me the same way, as they always have. So they stilltreat me the same way with everything … I feel like I haven’t grown up, Ihaven’t been given responsibilities and I haven’t learnt to do things for my-self … I find myself 15 years old. If you were to look at me, you would seea man. But I don’t feel that way … I don’t feel like I’ve lived in the world.Until this point. (Justin)
Justin is struggling to reconfigure his masculinity despite weight loss. The mar-ginalisation of obese people in terms of power, production and emotional andsexual relations has been well researched. A large study (n = 12 364) using tele-phone interviews found sexual behaviour differed for obese people compared to
6 Gender and obesity
141
normal weight [31]. Obese women were less likely than women of normal weightto report having a sexual partner in the previous 12 months, and obese men weremore likely to suffer from erectile dysfunction than normal weight men, and hadfewer sexual partners [31]. Obesity has also been found to affect employment op-portunities. A high BMI is associated with an increased likelihood of receiving adisability pension [32]. The evidence that obesity impacts negatively on job eval-uations and hiring has also been rated as strong [30]. The stigma associated withobesity is considerable [30], comparable to racial discrimination [33], and this hasa marginalising effect for many individuals.
Consideration of embodied masculinities and femininities in weight loss hasthe potential to contribute to individualising weight-loss plans. Justin commentedthat although surgery was necessary to lose the initial weight, he did not learnsustainable healthy behaviours from this process. His education in nutrition andlifestyle came from his time spent at a weight-loss retreat that focused on thepersonal experience in the weight-loss journey. Lukman, who has recently under-gone gastric-sleeve surgery, recognises that his eating habits preceding surgerywere unhealthy, but he did not indicate a desire to increase his exercise or en-gage in a healthy lifestyle now that he has had the surgery. Shah and colleagues’[34] review found weight-loss surgeries were associated with significant initialweight reduction, but that this was not maintained long term [34]. Douketis andcolleagues’ [5] systematic review of weight loss in obesity found weight loss of25 kg to 75 kg in the two to four years following surgery, which was higher thanthe other interventions (eg diet therapy, pharmacologic therapy). Current weight-loss treatments overall for obese persons are modestly successful [35], however afocus on mean values may conceal individuals who do lose a significant amountof weight [5]. Justin comments:
What I’ve started to realise is that there is no point that you can get to wherethings just change. It’s what you do right now and what you do in your lifeas this weight loss is taking place that shapes how people react to you andhow you react to others. So then it becomes your life. Rather than wait till Iweigh 100 kilos and then my life will be like this. As you go, your life startsto build and it incorporates all of this and it’s not like you can put your lifeon hold, lose weight and then come back to it. (Justin)
It is an empirical question if an intervention involving a discussion about gender,personality and weight loss earlier in the weight-loss journey would facilitatequicker and sustained weight loss.
A modern epidemic
142

CONCLUSIONThe life histories presented demonstrate the value of gender relations theory inanalysing the obesity issue. Life-history methodology has the potential to shedlight on the inconsistencies in data on the prevalence and effects of obesity by fo-cusing on the individual experience. The cases presented highlight how the bodyis integral to constructing gender, but also how social aspects of ethnicity andclass, as well as aspects of production, relationships and power, shape the bodyand contribute to the gender project. These preliminary results suggest that theconstruction of masculinity of an individual who is attempting to lose weight isclosely tied with the body and that a trigger for weight loss may be a desire toimprove one’s position in the gender order. Challenges to maintaining this weightloss may however include the realisation that physical changes to the body arenot the only obstacle to achieving a dominant form of masculinity or femininity.Weight-loss approaches that recognise the individual struggle with gender andthe influence of other social structures may be an alternative to current, largelyunsuccessful treatments of obesity.
References1. International Obesity Task Force. Obesity prevalence worldwide [Online].
Accessed at: www.iaso.org/iotf/obesity/ [Accessed 16 June 2011].2. Stein CJ & Colditz GA (2004). The epidemic of obesity. The Journal of
Clinical Endocrinology & Metabolism, 89(6): 2522–25.3. Atlantis E & Ball K (2007). Association between weight perception and psy-
chological distress. International Journal of Obesity, 32: 715–21.4. Colagiuri S, Lee CMY, Colagiuri R, Magliano D, Shaw JE, Zimmet PZ, et
al. (2010). The cost of overweight and obesity in Australia. Medical Journalof Australia, 192(5): 260–264.
5. Douketis JD, Macie C, Thabane L & Williamson DF (2005). Systematic re-view of long-term weight loss studies in obese adults: clinical significanceand applicability to clinical practice. International Journal of Obesity, 29:1153–67.
6. Power ML & Schulkin J (2008). Sex differences in fat storage, fat metabo-lism, and the health risks from obesity: possible evolutionary origins. BritishJournal of Nutrition, 99(5): 931–40.
7. Connell RW (2001). The social organization of masculinity. In SM Whit-head & FJ Barrett (Eds). The masculinities reader (pp 30–50). Cambridge:
6 Gender and obesity
143

Polity Press.8. Connell RW (1995). Masculinities. Sydney: Allen & Unwin.9. Connell RW (2000). Men and the boys. Sydney: Allen and Unwin.
10. Connell RW (2002). Gender. Cambridge: Polity Press.11. Stoverinck MJ, Lagro-Janssen AL & Weel CV (1996). Sex differences in
health problems, diagnostic testing, and referral in primary care. Journal ofFamily Practice, 43(6): 567–76.
12. Ladwig K-H, Mittag BM, Formanek B & Dammann G (2000). Genderdifferences of symptom reporting and medical healthcare utilization in theGerman population. European Journal of Epidemiology, 16(6): 511–18.
13. Lienard P (2011). Life stages and risk-avoidance: status- and context-sensi-tivity in precaution systems. Neuroscience and Behavioural Reviews, 35(4):1067–74.
14. Schofield T, Connell RW, Walker L, Wood JF & Butland DL (2000). Un-derstanding men’s health and illness: a gender-relations approach to policy,research, and practice. Journal of American College Health, 48(6): 247–56.
15. Wang Y & Beydoun MA (2007). The obesity epidemic in the United States– gender, age, socioeconomic, racial/ethnic, and geographic characteristics:a systematic review and meta-regression analysis. Epidemiologic Reviews,29(1): 6–28.
16. Paeratakul S, Lovejoy JC, Ryan DH & Bray GA (2002). The relation of gen-der, race and socioeconomic status to obesity and obesity comorbidities in asample of US adults. International Journal of Obesity, 26(9): 1205–10.
17. Zhang Q & Wang Y (2004). Socioeconomic inequality of obesity in theUnited States: do gender, age, and ethnicity matter? Social Science & Medi-cine, 58(6): 1171–80.
18. National Preventative Health Taskforce (2009). Australia: the healthiestcountry by 2020. The report of the National Preventative Health Strategy:the roadmap for action. Including addendum for October 2008 to 2009. Can-berra: National Preventative Health Taskforce.
19. de Wit L, Luppino F, van Straten A, Penninx B, Zitman F & Cuijpers P(2010). Depression and obesity: a meta-analysis of community-based stud-ies. Psychiatry Research, 178(2): 230–35.
20. Luppino FS, de Wit LM, Bouvy PF, Stijnen T, Cuijpers P, Penninx BWJH
A modern epidemic
144

et al. (2010). Overweight, obesity, and depression: a systematic review andmeta-analysis of longitudinal studies. Archives of General Psychiatry, 67(3):220–29.
21. Gariepy G, Nitka D & Schmitz N (2010). The association between obesityand anxiety disorders in the population: a systematic review and meta-analy-sis. International Journal of Obesity, 34(3): 407–19.
22. Barry D, Pietrzak RH & Petry NM (2008). Gender differences in associa-tions between body mass index and DSM-IV Mood and Anxiety Disorders:results from the National Epidemiologic Survey on Alcohol and RelatedConditions. Annals of Epidemiology, 18(6): 458–66.
23. Sorbara M & Geliebter A (2002). Body image disturbance in obese outpa-tients before and after weight loss in relation to race, gender, binge eating,and age of onset of obesity. International Journal of Eating Disorders, 31(4):416–23.
24. White MA, O’Neil PM, Kolotkin RL & Byrne TK (2004). Gender, race, andobesity-related quality of life at extreme levels of obesity. Obesity Research,12(6): 949–55.
25. Boutcher SH & Dunn SL (2009). Factors that may impede the weight lossresponse to exercise-based interventions. Obesity Reviews, 10(6): 671–80.
26. Addis ME & Mahalik JR (2003). Men, masculinity, and the contexts of helpseeking. American Psychologist, 58(1): 5–14.
27. Plummer K (2001). Documents of life: an invitation to a critical humanism.London: Sage.
28. Messner MA (1992). Power at play: sports and the problem of masculinity.Boston: Beacon Press.
29. Parker A. (1996). Sporting masculinities: gender relations and the body. InM Mac an Ghaill (Ed). Understanding masculinities: social relations andcultural arenas (pp126–38). Buckingham: Open University Press
30. Puhl RM & Heuer CA (2009). The stigma of obesity: a review and update.Obesity, 17(5): 941–64.
31. Bajos N, Wellings K, Laborde C & Moreau C (2010). Sexuality and obesity,a gender perspective: results from French national random probability surveyof sexual behaviours. British Medical Journal, 340: c2573.
32. Neovius K, Johansson K, Rössner S & Neovius M (2008). Disability pen-
6 Gender and obesity
145

sion, employment and obesity status: a systematic review. Obesity Reviews,9(6): 572–81.
33. Puhl RM, Andreyeva T & Brownell KD (2008). Perceptions of weight dis-crimination: prevalence and comparison to race and gender discrimination inAmerica. International Journal of Obesity, 32(6): 992–1000.
34. Shah M, Simha V & Garg A (2006). Long-term impact of bariatric surgeryon body weight, comorbidities, and nutritional status. The Journal of ClinicalEndocrinology & Metabolism, 91(11): 4223–31.
35. Franz MJ, VanWormer JJ, Crain L, Boucher JL, Histon T, Caplan W, etal. (2007). Weight-loss outcomes: a systematic review and meta-analysis ofweight-loss clinical trials with a minimum 1-year follow-up. Journal of theAmerican Dietetic Association, 107(10): 1755–67.
A modern epidemic
146

7Preventing chronic disease to closethe gap in life expectancy for In-
digenous AustraliansAlan Cass,1, 2 Paul Snelling3 and Alex Brown4
Prevention of disease is a major aim of the Australian health system.Chronic diseases are responsible for approximately 80% of the burden ofdisease and injury in Australia, account for around 70% of total health ex-penditure, form part of 50% of GP consultations, and are associated withmore than 500 000 person/years of lost full-time employment each year [1].A small number of modifiable risk factors are responsible for the majorshare of the burden of preventable chronic disease. This chapter focuses onchronic kidney disease as an example of a preventable chronic disease thatimpacts heavily on the indigenous community, causing major morbidityand mortality. Key modifiable risk factors for chronic kidney disease in-clude tobacco smoking, physical inactivity, poor nutrition, obesity and highblood pressure. Amongst Indigenous Australians, poor access to necessarypreventative care, combined with the broader social determinants of health,acting across the life-course, contribute to the excess burden of chronicdisease, including diabetes and chronic kidney disease. Improvements inmaternal and early childhood health and development, educational attain-ment outcomes and access to safe and secure housing are critical ‘buildingblocks’ in national efforts to reduce the burden of chronic disease and toclose the gap between the health status of Indigenous and non-indigenousAustralians.
1 Sydney Medical School, University of Sydney.2 George Institute for Global Health, Sydney.
3 Royal Prince Alfred Hospital, Sydney.4 Baker IDI Heart and Diabetes Institute, Central Australia.
147

BURDEN OF DISEASEThe most recent estimates of the gap in life expectancy between Indigenous andnon-Indigenous men and women are 12 and ten years respectively [2]. However,the true life expectancy of Indigenous Australians remains a matter of dispute.Research has shown a lower life expectancy in states or territories with morecomplete reporting of Indigenous deaths [3]. Amongst people aged 35 to 74 years,80% of the mortality gap is attributable to chronic diseases. The inextricably re-lated chronic diseases of blood vessels and metabolism – heart disease, diabetes,stroke and kidney disease – constitute half of this gap [2].
There are almost 20 000 Australians with severe or end-stage kidney disease(ESKD), who require ongoing dialysis or have received a kidney transplant. Theincidence rate of ESKD among Indigenous Australians contrasts dramaticallywith that for non-Indigenous Australians. There is a steep gradient in the burdenof kidney disease from urban areas, where rates are three to five times the na-tional average, to rural areas where rates are ten to 15 times higher, to remoteareas where rates are up to 30 times the national average [4, 5]. Between 2007 and2008, there were almost 115 000 hospitalisations for regular dialysis for Indige-nous Australians. This constitutes more than 40% of all hospital admissions forIndigenous Australians and dialysis hospitalisations occur at a rate 11 times thatof non-Indigenous Australians [6]. While the burden of earlier stages of chronickidney disease (CKD) amongst Indigenous Australians is less well documented,it is known to occur commonly. People with earlier stages of CKD are at highrisk of death due to heart disease and at high risk of progression to ESKD.
Based on data from the AusDiab study, which surveyed the health of a largeand representative sample of the adult population, about one in nine Australiansaged 25 years and over have early CKD [7]. However, comprehensive population-based data for the national burden of CKD among Indigenous Australians are notavailable. Between 2004 and 2006 in Queensland, South Australia, Western Aus-tralia and the Northern Territory, CKD was recorded as the underlying cause ofdeath in nearly 4% of all Indigenous deaths, a rate seven to 11 times higher thanfor non-Indigenous males and females respectively [8]. CKD was an associatedcause in a further 12% of deaths [8]. Surveys in individual remote Aboriginalcommunities have documented high rates of early stages of CKD and its cardinalmarkers – reduced kidney function measured with a simple blood test and pro-tein leakage into the urine from damaged kidneys. An audit of the screening andmanagement of chronic disease in Aboriginal primary care, undertaken throughthe Kanyini Vascular Collaboration, has confirmed that more than 40% of regularadult attendees at Aboriginal primary care services who receive recommendedscreening tests have reduced kidney function or proteinuria [9]. This health ser-vice, rather than population-based data, underscores the burden of CKD whichneeds to be addressed.
A modern epidemic
148

RISK FACTORSRisk factors for CKD can be categorised as fixed and modifiable. Fixed-riskfactors include a family history, genetic predisposition and increasing age [8].Modifiable risk factors include low birthweight, socioeconomic disadvantage, di-abetes, high-blood pressure, overweight and obesity, tobacco smoking, physicalinactivity and poor nutrition [8, 10, 11]. Amongst Indigenous Australians, factorsthat arise early in the lifecourse, including poor maternal health and low birth-weight and the burden of childhood infection and chronic inflammation, havebeen associated with increased risk of developing CKD [12, 13]. The associationsbetween markers of socioeconomic disadvantage, including leaving school early,unemployment, low household income and house crowding, and ESKD rates, areparticularly strong for Indigenous Australians [14].
INTERVENTION ACROSS THE LIFE-COURSEReducing the burden of CKD will require targeted interventions across the life-course, from before birth through childhood to adulthood (Figure 1). Whole ofgovernment interventions are required to address social disadvantage, and pri-ority areas around housing, food supply and tobacco control can be directlyrelated to CKD. Within the health sector, targeted screening, early interventionand evidence-based management to prevent the progression of kidney disease arerequired [15]. Although this chapter will focus on prevention, equitable access tonecessary kidney disease treatment services must also be provided. Key servicedelivery issues that must be addressed by health providers and systems in order tobetter respond to the health, social and cultural needs of Indigenous Australianswith kidney disease include:
1. Poor access to home- and community-based dialysis forcing the majority ofpatients from remote areas to relocate permanently to urban areas for treat-ment
2. Low kidney transplant rates3. Making health services easier for Indigenous patients to navigate: key factors
here include proximity to health services, availability of transport, minimalout-of-pocket costs for attendance and treatments, after-hours access, out-reach services and mobile clinics, welcoming physical spaces and Indige-nous staff as a critical point of contact
4. Inadequate provision of trained interpreters in Aboriginal languages5. Pervasive miscommunication between Indigenous kidney patients and their
healthcare providers (Figure 1) [16, 17, 18, 19].
7 Preventing chronic disease to close the gap in life expectancy for IndigenousAustralians
149
PRIMARY PREVENTION OF KIDNEY DISEASEPrimary prevention initiatives are required from the antenatal period with theaim of preventing the development of CKD. High-quality evidence from con-trolled trials conducted within the Indigenous population, on the effectiveness ofinterventions to prevent the development of CKD is not currently available. Nev-ertheless, evidence indicates that the following initiatives would have a positivehealth impact generally and would affect intermediate outcomes known to be as-sociated with the development of CKD:
1. Increased access to antenatal services to improve fetal and maternal health,and reduce the rates of low birthweight
2. Screening and intensive management of diabetes in pregnancy [20] and en-couragement of breastfeeding [21] to help prevent the development of obesityand early onset of type 2 diabetes
3. Prevention of obesity in early childhood, particularly due to ‘catch upgrowth’ in those with low birthweight, as these people are at greatest risk ofdeveloping diabetes [22] and CKD [23]
4. Early childhood development initiatives to improve educational achievementand lifeskills
5. Training community members to improve housing infrastructure and tomaintain improvements [24]
6. Installing swimming pools in remote communities to reduce the prevalenceof skin, middle ear and respiratory tract infections [25]
7. Community-based scabies control programs8. Food supply initiatives to improve access to affordable healthy food [26]9. Culturally appropriate healthy nutrition, physical activity and quit smoking
programs and legislative initiatives to regulate tobacco advertising.
A modern epidemic
150

Figure 1. A life-course approach to CKD prevention and management (Refer to the textfor specific approaches as they relate to Indigenous Australians).
PRIMARY CARE-BASED SCREENING AND EARLYINTERVENTION TO PREVENT DISEASE
PROGRESSIONScreening tests for CKD in primary care should include:
1. A urine test for protein – specifically indicated is a first morning urine spec-imen tested for albumin. Albumin is an abundant protein in the blood. Ifdetected in the urine, it indicates kidney damage. (If a first morning urinespecimine cannot be obtained, a urine specimen obtained when a patient isattending primary care is acceptable.)
2. A blood test to measure serum creatinine – a breakdown product of muscle,usually produced in the body at a constant rate and filtered out of the bodythrough the kidneys. Where kidney function is reduced, the filtration ratefalls and blood levels rise. The blood test result is used to estimate kidneyfunction – commonly termed as estimated glomerular filtration rate or eGFR.
The Kanyini Vascular Collaboration (KVC), established in 2006, brings togetherIndigenous and non-Indigenous researchers, health providers and policy-makersin a research program aiming to improve the health outcomes of Indigenous Aus-
7 Preventing chronic disease to close the gap in life expectancy for IndigenousAustralians
151

tralians with heart disease, diabetes and kidney disease (www.kvc.org.au). TheKVC Audit Study showed that approximately 40% of those people attendingAboriginal primary-care services, who are indicated for CKD screening, have theresults of these tests entered into their medical record [9]. Primary care-basedscreening to facilitate early detection and evidence-based management of CKDhas been shown to be cost-effective in the general population [27]. Evidence sup-ports targeted screening of people at high risk of CKD – including IndigenousAustralians aged 35 years and over; people with diabetes, high blood pressure orheart disease; smokers; people with a family history of CKD; and people who areoverweight or obese. A comprehensive CKD screening program, if implementedas part of a coordinated chronic disease strategy, should have benefits both interms of prevention of heart attacks, stroke and cardiac deaths as well as preven-tion of ESKD [27].
Modelled analyses utilising best Australian evidence regarding the popula-tion burden of diabetes and high-blood pressure, current practice patterns andrandomised controlled trial-based evidence regarding the effectiveness of inter-ventions, have demonstrated that primary care–based screening for CKD and itsmajor risk factors, followed by evidence-based management of high blood pres-sure, diabetes and proteinuria, is likely to be highly cost-effective [27]. The KVCAudit Study has revealed evidence–practice gaps in the management of bloodpressure and cholesterol in Aboriginal primary care, similar to gaps in main-stream primary care, which, if closed, would improve heart and kidney healthoutcomes for Indigenous Australians [9].
Substantial evidence underlines that lowering blood pressure is effective inreducing heart attacks, stroke and cardiac death [28] and favours the use of treat-ment regimens which include a particular class of drugs, ACE inhibitors, inslowing the progression of CKD [29]. Such evidence is most compelling for pa-tients with kidney disease due to diabetes [30]. Diabetes is the leading cause ofESKD in many countries and is the primary cause or an associated conditionfor the vast majority of Indigenous Australians commencing dialysis for ESKD.As described in other sections of this book that address diabetes organ compli-cations, large trials in people with diabetes have provided strong evidence thatintensive control of blood glucose delays the onset or progression of diabetic kid-ney disease, particularly in its early stages [31]. Despite a lack of controlled trialsindicating benefit within the Australian Indigenous population, chronic diseasemanagement programs in remote Aboriginal communities, which compared pro-gram results with disease rates for the population prior to the program, indicatethe heart and kidney benefits from intensive management regimens [32].
A modern epidemic
152

THE NEED FOR MONITORINGRecent research has confirmed the lack of reliable, population-representative datafor Indigenous Australians regarding the burden of CKD and related chronic con-ditions, risk factors for the development and progression of chronic disease, andutilisation of relevant preventative and treatment services. As concluded in theAIHW report on prevention of cardiovascular disease, diabetes and CKD [33]:
There is clearly a need for ongoing monitoring in the area of prevention.However, better data are needed, in particular those based on measurementrather than self-reported data, as well as systematic data on population-levelinitiatives.
The Australian Health Survey (AHS), which commenced in 2011 and aims toinvolve around 50 000 Australians, will include an Aboriginal and Torres StraitIslander wave in 2012 [34]. This is a key step towards filling this data gap.Amongst its objectives, the AHS aims to estimate the prevalence of certainchronic conditions and selected biomedical and behavioural risk factors. In-formed and consenting participants in the AHS, from a representative household-based sample of the population, will answer questions about their health; havetheir height, weight, waist circumference and blood pressure measured; and willbe asked for separate consent to give blood and urine samples to measure markersof chronic disease including heart disease, diabetes and CKD. Such monitoringwill form one necessary part of a coordinated prevention strategy aiming to re-duce the burden of complex chronic disease amongst Indigenous Australians.
CONCLUSIONThe National Indigenous Health Equality Summit, held in Canberra in March2008, proposed a set of key targets to achieve the COAG commitment of closingthe Aboriginal and Torres Strait Islander life expectancy gap within a generation.With the major contribution of premature death due to chronic diseases, wemust comprehensively address chronic disease prevention and management usingappropriate, sustainable and cost-effective strategies. The summit promulgateda prevention target relevant to CKD: ‘Stabilize all-cause incidence of ESKDwithin five to ten years’ [35]. Although ESKD directly affects fewer than 1500Indigenous Australians [36], the impact of this chronic disease on families andcommunities is profound. Key findings of the recent Department of Health andAgeing Central Australia Renal Study [17] regarding the social and cultural im-pacts of ESKD include:
• For Aboriginal patients [in remote regions], uptake of treatment for ESKD has
7 Preventing chronic disease to close the gap in life expectancy for IndigenousAustralians
153

generally necessitated permanently moving away from kin and community.Consequences have included loss of social and cultural connectedness, loss ofautonomy and control, and loss of status and authority.
• Key family and cultural leaders having to move away has profoundly affectedcommunities.
• Patients moving to town for treatment are generally accompanied by immedi-ate family carers and dependents. Research has estimated that as many as fivepeople may follow a person going for dialysis. This has implications for ac-commodation, social support services, employment and education.
These findings are relevant to the experiences of Indigenous Australians acrossremote Australia [37]. The devastating impact of ESKD was confirmed by manypeople interviewed for the Central Australia Renal Study. Their experiece under-scores the imperative to prevent and optimise the management of CKD [17]:
When my husband went onto dialysis, he got really angry and depressed …It was really hard. We had to move into town. There was no support to helpus cope. He lost everything … he felt useless. (Wife of a dialysis patient,October 2010)
I was born and bred on these lands. How on earth could I go all theway to the city, away from my family and country, knowing there was nopossibility for them to come down and stay with me, no accommodation,no facilities … There’s no way I could think about being so far away … I’djust be in total despair all the time. (Senior community member, September2010)
References1. National Preventative Health Strategy (2010). Australia: the healthiest
country by 2020. The report of the National Preventative Health Strategy:the roadmap for action. Canberra: National Preventative Health Strategy.
2. Australian Institute of Health and Welfare (2011). Contribution of chronicdisease to the gap in adult mortality between Aboriginal and Torres StraitIslander and other Australians. Canberrra: Australian Institute of Health andWelfare.
3. Australian Institute of Health and Welfare (2011). Comparing life ex-pectancy of indigenous people in Australia, New Zealand, Canada andthe United States: conceptual, methodological and data issues. Canberra:AIHW.
4. Cass A, Cunningham J, Wang Z & Hoy W (2001). Regional variation in
A modern epidemic
154

the incidence of end-stage renal disease in Indigenous Australians. MedicalJournal of Australia, 175(1): 24–27.
5. Preston-Thomas A, Cass A & O’Rourke P (2007). Trends in the incidence oftreated end-stage kidney disease among Indigenous Australians and access totreatment. The Australian and New Zealand Journal of Public Health, 31(5):419–21.
6. Australian Institute of Health and Welfare (2010). Chronic kidney diseasehospitalisations in Australia 2000–01 to 2007–08. Canberra: Australian In-stitute of Health and Welfare.
7. White SL, Polkinghorne KR, Atkins RC & Chadban SJ (2010). Comparisonof the prevalence and mortality risk of CKD in Australia using the CKDEpidemiology Collaboration (CKD-EPI) and Modification of Diet in RenalDisease (MDRD) Study GFR estimating equations: the AusDiab (AustralianDiabetes, Obesity and Lifestyle) Study. American Journal of Kidney Dis-ease, 55(4): 660–70.
8. Australian Institute of Health and Welfare (2009). An overview of chronickidney disease in Australia 2009. Canberra: Australian Institute of Healthand Welfare.
9. Peiris DP, Patel AA, Cass A, Howard MP, Tchan ML, Brady JP, et al.(2009). Cardiovascular disease risk management for Aboriginal and TorresStrait Islander peoples in primary healthcare settings: findings from theKanyini Audit. Medical Journal of Australia, 191(6): 304–09.
10. Cass A, Cunningham J, Wang Z & Hoy W (2001). Social disadvantageand variation in the incidence of end-stage renal disease in Australian capitalcities. The Australian and New Zealand Journal of Public Health, 25(4):322–26.
11. White SL, Perkovic V, Cass A, Chang CL, Poulter NR, Spector T, et al.(2009). Is low birth weight an antecedent of CKD in later life? A systematicreview of observational studies. American Journal of Kidney Disease, 54(2):248–61.
12. Hoy WE, Hughson MD, Singh GR, Douglas-Denton R & Bertram JF(2006). Reduced nephron number and glomerulomegaly in Australian Abo-rigines: a group at high risk for renal disease and hypertension. KidneyInternational, 70(1): 104–10.
7 Preventing chronic disease to close the gap in life expectancy for IndigenousAustralians
155

13. White AV, Hoy WE & McCredie DA (2001). Childhood post-streptococcalglomerulonephritis as a risk factor for chronic renal disease in later life. Med-ical Journal of Australia, 174(10): 492–96.
14. Cass A, Cunningham J, Snelling P, Wang Z & Hoy W (2002). End-stagerenal disease in Indigenous Australians: a disease of disadvantage. Ethnicityand Disease, 12(3): 373–78.
15. Cass A, Cunningham J, Snelling P, Wang Z & Hoy W (2004). Exploring thepathways leading from disadvantage to end-stage renal disease for Indige-nous Australians. Social Science & Medicine, 58(4): 767–85.
16. Cass A, Lowell A, Christie M, Snelling PL, Flack M, Marrnganyin B, et al.(2002). Sharing the true stories: improving communication between Aborig-inal patients and healthcare workers. Medical Journal of Australia, 176(10):466–70.
17. Department of Health and Ageing (2011). Central Australia renal studyJune 2011. Part 3: Technical Report. Canberra: Department of Health andAgeing.
18. Yeates KE, Cass A, Sequist TD, McDonald SP, Jardine MJ, Trpeski L, et al.(2009). Indigenous people in Australia, Canada, New Zealand and the UnitedStates are less likely to receive renal transplantation. Kidney International,76(6): 659–64.
19. Australian Institute of Health and Welfare (2011). Chronic kidney diseasein Aboriginal and Torres Strait Islander people 2011. Canberra: AustralianInstitute of Health and Welfare.
20. Dabelea D & Pettitt DJ (2001). Intrauterine diabetic environment confersrisks for type 2 diabetes mellitus and obesity in the offspring, in additionto genetic susceptibility. Journal of Pediatric Endocrinology & Metabolism,14(8): 1085–91.
21. Pettitt DJ, Forman MR, Hanson RL, Knowler WC & Bennett PH (1997).Breastfeeding and incidence of non-insulin-dependent diabetes mellitus inPima Indians. The Lancet, 350(9072): 166–68.
22. Yajnik CS (2002). The lifecycle effects of nutrition and body size onadult adiposity, diabetes and cardiovascular disease. Obesity Review, 3(3):217–24.
23. Hoy WE, Rees M, Kile E, Mathews JD & Wang Z (1999). A new dimension
A modern epidemic
156

to the Barker hypothesis: low birthweight and susceptibility to renal disease.Kidney International, 56(3): 1072–77.
24. Pholeros P, Rainow S & Torzillo PJ (1994). Housing for health: towards ahealthier living environment for Aborigines. Sydney: HealthHabitat.
25. Silva DT, Lehmann D, Tennant MT, Jacoby P, Wright H & Stanley FJ(2008). Effect of swimming pools on antibiotic use and clinic attendancefor infections in two Aboriginal communities in Western Australia. MedicalJournal of Australia, 188(10): 594–98.
26. Rowley KG, Daniel M, Skinner K, Skinner M, White GA & O’Dea K(2000). Effectiveness of a community-directed ‘healthy lifestyle’ programin a remote Australian Aboriginal community. The Australian and NewZealand Journal of Public Health, 24(2): 136–44.
27. Howard K, White S, Salkeld G, McDonald S, Craig JC, Chadban S, et al.(2010). Cost-effectiveness of screening and optimal management for dia-betes, hypertension, and chronic kidney disease: a modeled analysis. Valuein Health, 13: 196–208.
28. Turnbull F (2003). Effects of different blood-pressure-lowering regimens onmajor cardiovascular events: results of prospectively designed overviews ofrandomised trials. The Lancet, 362(9395): 1527–35.
29. Jafar TH, Schmid CH, Landa M, Giatras I, Toto R, Remuzzi G, et al. (2001).Angiotensin-converting enzyme inhibitors and progression of nondiabeticrenal disease. A meta-analysis of patient-level data. Annals of Internal Med-icine, 135(2): 73–87.
30. Jafar TH, Stark PC, Schmid CH, Landa M, Maschio G, de Jong PE, etal. (2003). Progression of chronic kidney disease: the role of blood pres-sure control, proteinuria, and angiotensin-converting enzyme inhibition: apatient-level meta-analysis. Annals of Internal Medicine, 139(4): 244–52.
31. Jun M, Perkovic V & Cass A (2011). Intensive glycemic control andrenal outcome. In Lai KN & Tang SCW (Eds). Diabetes and the kidney(pp196–208). Basel: Karger.
32. Hoy W, Baker PR, Kelly AM & Wang Z (2000). Reducing premature deathand renal failure in Australian Aboriginals: a community-based cardiovas-cular and renal protective program. Medical Journal of Australia, 172(10):473–78.
7 Preventing chronic disease to close the gap in life expectancy for IndigenousAustralians
157

33. Australian Institute of Health and Welfare (2009). Prevention of cardiovas-cular disease, diabetes and chronic kidney disease: targeting risk factors.Canberra: Australian Institute of Health and Welfare.
34. Australian Bureau of Statistics (2011). Australian Health Survey [Online].Available: http://www.abs.gov.au/websitedbs/D3310114.nsf/home/aus-tralian+health+survey [Accessed: 21 September 2011]
35. Aboriginal and Torres Strait Islander Social Justice Commissioner and theSteering Committee for Indigenous Health Equality (2008). Close the Gap– National Indigenous health equality targets: outcomes from the NationalIndigenous Health Equalty Summit Canberra, 18–20 March 2008. Sydney:Human Rights and Equal Opportunity Commission.
36. Australia and New Zealand Dialysis and Transplant Registry (2011). ANZ-DATA Registry 2010 report. Adelaide: Australia and New Zealand Dialysisand Transplant Registry.
37. Anderson K, Devitt J, Cunningham J, Preece C & Cass A (2008). ‘Allthey said was my kidneys were dead’: Indigenous Australian patients’ un-derstanding of their chronic kidney disease. Medical Journal of Australia,189(9): 499–503.
A modern epidemic
158

8The case for and against the regula-
tion of food marketing directedtowards children
Bridget Kelly,1 Rohan Miller2 and Lesley KingAuthoritative and comprehensive reviews of studies on the nature and ex-tent of food marketing to children indicate that children are exposed tohigh levels of food marketing and that the ‘marketed diet’ typically com-prises energy-dense, micronutrient-poor foods. However, the implicationof causality between marketing, product exposures and childhood obesityis not universally accepted. A vigorous discussion rages about appropriatepolicy responses to children’s exposure to food marketing. The advocacyby many health and consumer groups for tighter government restrictions onfood marketing is juxtaposed to the views held by many in the food and ad-vertising industries. Pivotal in this debate is the role of evidence in policydecisions and the appropriateness of industry self-regulation versus govern-ment intervention in food marketing. This chapter will explore the dietaryand health implications of children’s exposure to unhealthy food marketingand present arguments for and against regulations to restrict this marketing.
Unhealthy food marketing to children has become a highly politicised debate inAustralia and internationally. Health and consumer groups cite substantial bodiesof research that children’s exposure to unhealthy food marketing is a contribut-ing factor in the development of children’s food preferences and purchases, andhence plays a role in rising rates of childhood obesity. As such, these groups havecalled on government to restrict marketing as an obesity prevention initiative. Atthe same time, the food and advertising industries rebut these claims, and pro-mulgate the relative benefits of industry self-regulatory mechanisms. This chapterpresents both public health and marketing perspectives, in the form of a ‘head tohead’ debate presenting arguments for and against regulation of food marketing.
A key driver in this debate comes from psychological research that children
1 Prevention Research Collaboration, Sydney School of Public Health, University ofSydney.
2 University of Sydney Business School.
159

are highly vulnerable to advertising promotions and consequently require protec-tion from this form of marketing. One reason for this is because young children,especially those less than five years of age, are unable to distinguish commercialcontent from non-commercial content [1]. For example, when viewing television,very young children are unable to differentiate between a program and an ad-vertisement break. For older children, despite being able to identify advertising,these children still have an impaired ability to interpret marketing messages crit-ically as they lack the necessary cognitive skills and experience. Up until theage of eight years, most children are unable to recognise the persuasive natureof advertising effectively, and tend to accept advertising as truthful, accurate andunbiased [1].
While children’s vulnerability to some forms of marketing has been recog-nised, the effect of marketing and the most appropriate approach to limit chil-dren’s marketing exposure is contested by health and industry groups. The keypoints of debate covered in this chapter concern the quality and sufficiency of ev-idence which underpins any regulatory initiative, the range of media that wouldneed to be covered by any regulation, and the quality and type of foods that areadvertised and potentially subject to regulation.
THE CASE FOR REGULATING FOOD MARKETINGDIRECTED TOWARDS CHILDREN
The effect of marketing on children’s food choices andhabits
There is a large and accumulating body of research to support the associationbetween the marketing of energy-dense nutrient-poor (‘unhealthy’) foods andbeverages, and childhood obesity. This includes at least seven major systematicreviews synthesising the scientific evidence on the impact of food marketing tochildren [2, 3, 4, 5, 6, 7, 8]. Most of these systematic reviews have been commis-sioned by key health organisations, such as the Institute of Medicine in the USand the World Health Organization, and have been updated regularly to includenew evidence. Such reviews take into account the quality of evidence, by consid-ering methodological limitations and consistency between studies.
The most recent systematic review, commissioned by the World Health Or-ganization in 2008, found that food advertising has a modest impact on children’snutrition knowledge, their food preferences and their consumption patterns, withsubsequent implications for weight gain and obesity [8]. In particular, researchindicated that children are able to recall a high number of food advertisementsand that these advertisements were enjoyed and discussed amongst their peers [9,10, 11]. Further, advertisements created a desire in children to purchase food prod-
A modern epidemic
160

ucts, and the majority of children either purchased these products themselves orasked their parents to buy these products for them [12, 13, 14].
Importantly, food marketing is thought to operate at both the brand and thefood category level [8], thereby influencing not only the particular product brandsthat children choose but also their broader consumption patterns. For example,advertisements for a particular brand of confectionery will not only generate a de-sire for that brand but also for confectionery in general [8].
Contribution of food marketing to childhood obesityThe causes of obesity are many and complex, comprising an array of sociological,environmental and genetic influences. Unhealthy food marketing is only onesuch environmental factor that contributes to the obesity-promoting environment.Other factors, such as family and peer networks, engagement in physical activity,and socioeconomic status also influence children’s food choices and risk ofweight gain and obesity [5].
In the context of the full range of contributing factors, the specific contribu-tion that television food advertising makes to childhood obesity is estimated to besmall to moderate in size, with some studies estimating that 2% of the variationin food choice and obesity is attributed to this advertising [15]. However, evensmall effects in statistical terms can have an appreciable effect when they influ-ence a large population and are ongoing. These estimated effects are based onthe contribution of television food advertising alone, and may be increased whenmarketing from other forms of media are included [5]. Given that the majority ofadvertised foods are energy dense and nutrient poor, this advertising encouragesadditional consumption of these food types that are already consumed in excessby Australian children [16]. Data from the 1995 National Nutrition Survey iden-tified that energy-dense, nutrient-poor foods contribute 41% of children’s dailyenergy intake, while dietary recommendations allow for between 5%–20% of en-ergy from these discretionary foods [16]. In addition, the act of television viewingitself contributes to sedentary lifestyles and obesity, independent of the effects offood advertising [17].
Researchers have predicted that the magnitude of the specific effect of foodadvertising on food behaviours and weight is at least the same as that of manyother determinants of obesity, including family and parents, peers and socioeco-nomic status [8]. Therefore, food marketing has as much impact on obesity asthese other factors and is amenable to intervention, making it one of a number ofpotential levers for change.
Nature and scope of food marketing to childrenEvidence on the effect of food marketing on children’s food preferences and con-
8 The case for and against the regulation of food marketing directed towards children
161

sumption is concerning as the majority of advertised foods are high in fat, sugarand/or salt. Indeed, the top products that are advertised to children internationallyon television are sugar-sweetened breakfast cereals, soft drinks, confectioneryand high-fat savoury snacks, while the promotion of healthy food choices, in-cluding fruit, vegetables, whole grains and milk is virtually non-existent [8]. Thefrequency of advertisements for fast food restaurants is also increasing [8]. Onestudy from Australia identified that even during a A$5 million government cam-paign promoting fruit and vegetable consumption, television advertisements forhealthy foods only contributed to 5% of all food advertisements across the wholestudy period, while 82% were for high-fat/high-sugar foods [18]. The heavy andubiquitous marketing of these unhealthy food and beverage products assists inpromoting these products as normal and desirable.
Most of the research and attention on children’s exposure to food marketinghas been directed to television food advertising. However, it is widely acknowl-edged that food marketing encompasses a range of different media platforms andfood marketing campaigns are increasingly integrating these different marketingchannels to more widely promote their messages [19].
These marketing channels include: broadcast media (eg television, cinemaand radio); new technology (eg the internet and SMS/text messaging); printmedia (eg magazines and newspapers); promotions (eg premium offers, celebrityendorsements, cartoon characters, health and nutrient claims and product place-ments); places (eg school canteens and vending machines, sporting events and su-permarkets); price where products are sold at cheaper prices to make them moreavailable and appealing to children; packaging that is appealing to children; prod-uct expansion by selling multiple variations of a product; and public relations bysponsoring television programs, sporting events, fundraising and establishing ordonating money to charity.
Data on industry marketing expenditure can be used to assess the spread ofmedia used by food marketers. While available Australian information is limited,data from the UK indicate that between 2003 and 2007 there was a 19% increasein industry expenditure on food and beverage advertising, from £704m to £838m[20]. Over the same time period, expenditure on print advertising increased themost, with an increase of 159% or £107m. By comparison, expenditure on televi-sion food advertising increased by only 6% or £34m [20]. From this expenditureinformation, it appears that food marketers are shifting away from traditionallyused advertising modes, such as television. Of concern is that these other formsof media are often used by children without parental supervision, making themmore difficult for parents to monitor and control.
Some examples of integrated marketing campaigns by food companies pro-moting products high in fat, sugar, and/or salt have included the Nestle Smarties8 Colours of Fun campaign (www.smarties-australia.com.au, accessed 20 June2011). This campaign involved the creation of multi-media clips featuring eight
A modern epidemic
162

young children teamed up with musicians, sculptors, dancers, photographers andinstallation artists to create an artwork inspired by each of the eight differentSmarties colours. These clips were then broadcast through the Smarties websiteand online social networking sites, including YouTube and Facebook, as wellas through television, press and in-store promotions. The Streets Paddle PopElemagika Lick-a-Prize campaign is a further example of integrated marketing(www.paddlepop.com.au, accessed 20 June 2011). This campaign incorporateda short film starring the Paddle Pop Lion, a website featuring branded games,a Facebook page, and a competition requiring the purchase of Paddle Pop ice-creams to uncover prize codes listed on ice-cream sticks. Additional codes forprizes could be found in television and magazine advertisements.
The power of pesteringThe raison d’être of marketing is to create a desire for advertised products. Inthe case of children, marketing can influence their own food purchases, as wellas the purchase behaviour of parents [21]. Children’s purchase requests, often re-ferred to as ‘pester power’ or ‘purchase influence attempts’, can create tensionin child–parent relationships and result in the purchase of these products de-spite parents’ awareness of their poor nutritional quality [22]. As such, advertisingcommentators have claimed that ‘by advertising to children, companies are en-couraging the child to nag their parents into buying something that is not goodfor them, they don’t need or the parent cannot afford’ [23]. This phenomenon ofchildren ‘nagging’ for advertised products has been repeatedly reported by par-ents [8].
In the supermarket setting, children employ various techniques to encourageparents to purchase food items. For example, in a qualitative study from the UK,children reported that they kept on requesting products until their parents con-ceded. This is typified in the response from one child, who was reported as saying‘you just keep saying please mum, please mum, please mum, and then she gets it’[24].
Research also indicates that children’s purchase requests often result in ac-tual product purchases. In a review of studies on the effect of children’s purchaserequests on parents’ purchasing responses, children were found to request prod-ucts an average of 15 times per supermarket visit (around one request for everytwo minutes spent in the supermarket), and around half of all children’s requestswere successful [22]. Further, children’s exposure to food marketing increasedtheir purchase requests for advertised foods [22].
Parents’ responses to children’s purchase requests are also likely to be in-fluenced by their socioeconomic status. In interviews conducted with over 1000parents and their children in the UK, the most socially disadvantaged parentswere more open to persuasion by children and were more likely to agree to the
8 The case for and against the regulation of food marketing directed towards children
163

statement ‘I buy what the children want’, compared to less disadvantaged parents[25].
As such, the marketing of unhealthy food to children impedes the ability ofparents to promote and support healthy eating. This appears to be particularlythe case for socially disadvantaged families, who are also the most vulnerable toexcessive weight gain and obesity [26]. In the face of exceedingly sophisticatedand integrated food marketing campaigns, spanning multiple media platforms,parents’ ability to subjugate children’s purchase requests are likely to be furtherdiminished.
The role of industry self-regulation in minimising harm tochildren from unhealthy food marketing
In recent times, there has been vigorous discussion regarding appropriate policyresponses to the issue of children’s high and diversifying exposure to the mar-keting of unhealthy food and beverages. In particular, there has been significantadvocacy from health and consumer groups calling for government restrictionsto protect children from these promotional messages. Meanwhile, the food andadvertising industries have been actively involved in promoting self-regulatoryapproaches to limit this marketing. These may be seen as good corporate re-sponsibility, or more likely, as a means of diverting criticism and impedinggovernment regulations.
In an analysis of available regulations to restrict unhealthy food marketingto children across 73 countries between 2004 and 2006, most new regulationscame from the food and advertising industries [27]. The number of countries withindustry self-regulations increased from 11 in 2004 to 23 by the end of 2006, in-cluding the revision and extension of industry codes in Australia, Canada and theUS [27]. These regulatory codes are typically overseen by an industry body andparticipation by individual food companies is voluntary.
In Australia, the Australian Food and Grocery Council, the national bodyrepresenting food and grocery manufacturers, introduced the Responsible Chil-dren’s Marketing Initiative in 2009, which aims to ‘provide a framework for foodand beverage companies to promote healthy dietary choices and lifestyles to Aus-tralian children’ [28]. As well, the Australian Association of National Advertisersintroduced a similar initiative in 2009 relating to the quick service (fast food) in-dustry [29].
Independently conducted evaluations of the Australian Food and GroceryCouncil code have compared the amount of television advertising from compa-nies participating in this self-regulatory initiative before and after its introduction[30]. These evaluations show that overall unhealthy food advertising did not de-crease following the introduction of the codes, despite a reduction in televisionadvertisements for unhealthy food items by participating companies. The main
A modern epidemic
164

reason for the ineffectiveness of this self-regulation was the limited participationin these codes by food companies [30]. As at May 2011, only 17 food companieshad signed up to this initiative.
As well, in an analysis of the nutrition criteria used to define foods as ap-propriate to be marketed to children, industry-developed nutrition criteria varybetween companies and tended to be more permissive than independently devel-oped standards [31]. Of the 52 food products that were assessed, only 38% wereconsidered healthy by independent criteria, although 83% were deemed appro-priate using industry standards including items such as chocolate, confectionery,sugary drinks and ice-cream [31].
The findings of these evaluations indicate that self-regulatory initiatives, intheir current form, are insufficient to curb the amount of unhealthy food market-ing that children are exposed to and the effect of this marketing. By comparingsuccessful and less successful self-regulatory initiatives across a range of indus-tries, including tobacco, alcohol, fisheries and forestry industries, Sharma andcolleagues proposed eight standards that should be met if self-regulation is to beeffective [32]. These included input from all stakeholders, transparency, mean-ingful objectives, objective evaluation and public reporting, and oversight [32].In the case of food and beverage marketing, self-regulatory initiatives would re-quire: the input of health and consumer groups as well as government and thefood and advertising industries; transparency in developing standards on howbreaches can be reported; be targeted towards reducing children’s exposure tounhealthy food marketing and the persuasiveness of this marketing; be regularlyevaluated for their effectiveness; involve public reporting on industry’s adher-ence to regulations; and be overseen by an appropriate regulatory or health body.
The role of government in creating real and sustainablechange in children’s exposure to unhealthy food marketing
Governments have a clear leadership role, particularly in relation to the protectionof children, protecting public health, overseeing broadcast and non-broadcastinformation environments and balancing the operation of free markets in the pub-lic interest. In the case of food marketing to children, government can provideleadership through statutory regulation or through co-regulation with industry.Statutory regulation has been most commonly called for by health and consumeradvocates, as this has the benefit of being independent, having greater account-ability, ensuring unilateral compliance across all industry groups and of operatingwithin the public interest.
In 2010, the World Health Organization released a set of recommendationsfor limiting the marketing of foods and non-alcoholic beverages to children [33].One recommendation was that government should play a lead role in developing,monitoring and evaluating regulations to limit children’s exposure to unhealthy
8 The case for and against the regulation of food marketing directed towards children
165

food marketing.
Evidence of the effectiveness of statutory regulations toreduce children’s exposure to unhealthy food marketing
Government restriction on television advertising to children has been a long-standing policy in Sweden (since 1991), Norway (since 1992), and across allmedia in Quebec, Canada (since 1980). While no systematic evaluations of theeffectiveness of these regulations have been conducted, there is a small amountof research to indicate that these regulations have been effective in reducing chil-dren’s exposure to unhealthy food advertising and the effect of this marketing.
One study from Quebec examined household purchases of breakfast cerealsbetween English-speaking children, exposed to American television, and French-speaking children who tended to watch more French-language television. Atthe time of this research, French-language television channels banned adver-tisements targeting children whereas television broadcast from the US was notsubject to these restrictions. Findings from this study indicate that English-speak-ing children, who had a higher exposure to advertisements for children’s cereals,had significantly higher household purchases of advertised cereals compared toFrench-speaking children [34]. Research also indicates that children in Quebechave the lowest prevalence of obesity across all Canadian provinces, and the sec-ond lowest prevalence of overweight [35].
Additionally, in 2008 the Office of Communications in the UK introducedrestrictions on the scheduling of television advertising of food and drink productsto children. Under these regulations, advertisements for unhealthy food andbeverage products were precluded from being shown in or around programsspecifically designed for children or of appeal to children less than 16 years ofage, and on dedicated children’s channels. An evaluation of the impact of theseregulations on children’s exposure to unhealthy food advertising found that, com-pared to 2005, children saw around 34% fewer unhealthy food advertisements inthe year following the introduction of regulations [36]. As such, these governmentregulations have been effective in reducing children’s exposure to unhealthy foodand beverage advertising and reducing the effect of this marketing on food pur-chases.
THE CASE AGAINST REGULATING FOODMARKETING DIRECTED TOWARDS CHILDREN
A complex array of rules and regulations already exists governing food marketingacross multiple tiers of government. Social contract theory has long acknowl-edged the need for common rules in order for people to protect themselves and
A modern epidemic
166
one another from harm. That food marketing should be regulated is not an issue;however, questions need to be asked about the veracity and standard of evidencethat justify changes to the existing legislation and self-regulation frameworks,how the outcomes of the new laws will be measured, what will happen if the newlaws don’t have the desired effect, and what other implications will additionalregulations present to our market economy. Any proposed change to the regula-tion of food marketing should be realistic and likely to be effective in behaviouralchange. Considerable doubt exists that even the most extreme restrictions to theexisting level of Australia’s commercial speech will render the desired behav-ioural change.
What is marketing: now and in the immediate future?The overwhelming body of academic literature discussing food marketing isembedded in the era of television dominated mass marketing characterised bythe Mad Men television series (see www.amctv.com/shows/mad-men). However,television advertising is no longer omnipotent; marketing professionals, regu-lators and consumers face increasingly fragmented media. Experience is king.Companies seek to engage with consumers by offering elements of emotions,logic and general thought processes to connect with the consumer. Pushing amessage is passé: consumers are the recipients of thousands of commercial mar-keting messages, each day. There is no way that consumers can react to all of theadvertising or marketing communications they receive and they have become ex-pert at filtering out unwanted messages.
In the Mad Men era of mass media primacy it was commonly assumed therewas a linear relationship called a purchase funnel that was also encapsulatedin hierarchical advertising models. These simple advertising models generalisedthat brand awareness led to familiarity with the brand, then to consideration forpurchase, the act of purchase, and thereafter, repeated purchase. However, ascategories and brands matured, new empirically based behavioural models ofconsumer behaviour were proposed suggesting habits were a major considerationin stable markets [37].
Consistent with the behavioural models, streetwise marketers sought to influ-ence purchase decisions at or immediately before the point of purchase; in effect,to encourage brand switching. This shift largely explains the ascent of marketingtechniques such as sampling, premiums, coupons, discounts, in-store radio, signs,and shelf space (slotting) in the marketing mix in order to influence short-termpurchase behaviour, and ideally leading to repeat purchase or habit. It also pro-vides historical context to the contemporary view that consumers undertake anincreasingly sophisticated and technologically driven journey along many brandtouch-points rather than being causally influenced by single or multiple forms ofmedia. These marketing tactics, however, are not always successful, nor do they
8 The case for and against the regulation of food marketing directed towards children
167

typically deliver long-term behavioural change [38].
Causality: silver or rusting bullet?The case for regulating food marketing to children is based on assumptions thatfood advertising has a causal influence on children’s food choices and that thiscontributes to rising rates of childhood obesity. It is also assumed that regulatoryrestrictions or bans on food advertising will reduce rates of obesity and associatedhealth problems. These assumptions appear to be unwarranted due to a lack ofevidence and the continued evolution of communications practice. Holland et al.comment that the perceived threat of obesity is deemed to be so great that effortsto contain it may be subjected to less scrutiny than they warrant [39]. Suggestedremedies based on incorrect assumptions are likely to be ineffective [40].
There are a number of possible causal relationships between television view-ing and obesity. Critics of food advertising assume that more television viewingleads to more exposure to food advertising which in turn leads to purchaserequests and hence increased consumption of unhealthy advertised foods. Tele-vision viewing might also lead to increased snacking and reduced family mealtimes. Increased television viewing may also be associated with a more sedentarylifestyle and hence reduced physical activity. Research linking television viewingwith obesity and health outcomes generally do not attempt to distinguish betweenthese three possible explanations of the relationship [5].
Correlational studies do not show causationIt is a fallacy of logic that correlational studies can show a causal relationshipbetween marketing or advertising and obesity. Most of the reviews alleging thatfood advertising causes obesity have been largely based on correlational studiesexamining television viewing. For example, the US Institute of Medicine Com-mittee on Food Marketing and the Diets of Children and Youth published a reportcited by Livingstone [5] concluding, on the basis of 123 studies, that televisionadvertising influences the food and drink preferences, purchase requests, andshort-term consumption of children aged two to 11 years.
Livingstone [5] noted that the typical research designs linking marketing tobehaviour/diet and to health outcomes were mostly surveys with low quality mea-sures and low causal inference validity. Ecological validity was mostly high asthese surveys considered real world behaviour. Most of these studies assessedexposure to advertisements through assessing general television viewing. Liv-ingstone noted that only five findings from four published studies combinedhigh causal inference validity and high ecological validity. None of these fourstudies demonstrated that exposure to advertising causes obesity. One studyusing a quasi-experimental design found that advertising exposure produced
A modern epidemic
168

more favourable evaluations of products compared to non-exposure, but this didnot affect purchasing decisions [41].
Much recent research on the link between advertising and obesity has largelybeen correlational in design because researchers have assumed that there is suf-ficient evidence of a causal link between the two [5]. However, this assumptionseems inappropriate as research has not been able to disentangle confounding fac-tors, such as lack of physical activity, or parental factors, that could plausiblyhave much larger effects on obesity. For example, there is research suggestingthat higher levels of television watching are associated with permissive parent-ing styles that may be associated with less parental control over children’s dietarybehaviours [42]. The relevance of this causal assumption must also be questionedwith the decline in television viewing and the proliferation of other ‘screens’ in-creasingly used by children, adolescents and adults.
Mass media impact: going downTechnology evolves constantly, and rapidly. Moore’s law predicts technologicalchanges will occur at an exponential rate (approximately). Marketing commu-nications are at the cutting edge of the technological development, often under-pinning the commercial business model for change. Moreover, internet-basedcommunications are increasingly integrated with other media, other forms ofpromotion, and even product offerings. From a research perspective, the rapidevolution of technologically based innovations in marketing makes their impacthard to assess, especially in a timely way, and also suggests evidence-based reg-ulations will lag considerably behind marketing practice.
If advertising causes obesity through its influence on consumption of un-healthy foods then it would be reasonable to assume that rising rates of obesitywould be accompanied by a rise in children’s exposure to advertising and anincrease in consumption of advertised foods [42]. Conclusions that advertisingleads to obesity have been based largely on studies of television advertising [1,2, 3, 4, 5, 6, 7, 8]. However, children’s television viewing has declined ratherthan increased over the last two decades [42]. Furthermore, due to the widespreaddiffusion of cable television, an increasing number of children spend more timewatching channels with little or no outside product advertising than watchingbroadcast television programs.
Expenditure on television advertising for food is only one indicator of pos-sible advertising influence and should not be assumed a measure of behaviouralchange. Moreover, advertising expenditure needs to be considered againstchanges in the cost for advertising, real dollar changes and declining audiencelevels (implying higher costs for a consistent level of reach and frequency). Thismeans it costs considerably more in real dollars to have the same reach and fre-quency in 2012 than in 1992. Data from the UK suggest that food advertising on
8 The case for and against the regulation of food marketing directed towards children
169

television declined from 34% of advertising in 1982 to 18% in 2002 [43].Technological innovations have also reduced how much attention children
pay to advertising. For example, the use of remote controls encourage channelsurfing, and the introduction of video recorders, themselves largely rendered ob-solete by the digital innovations TiVo and Foxtel, mean that viewers can recordthen zip (fast forward) or zap (switch to another channel) with minimal ad-vertising exposure. In fairness, however, television ratings in Australia suggestonly a very small percentage of viewers presently do this. As digital televisionbroadcasting increases, the percentage of viewers who pre-record shows for laterwatching will likely increase, further leading to declining levels of advertisingimpact.
Technology is shifting traditional free-to-air television from omnipotence toa background media (similar to the audience shift from radio following the in-troduction of television). Accompanying the decline in television viewing led byyounger demographics, there appears to be an increase in non-television ‘screentime’, such as computer use, videos, DVDS and video games [42]. Time play-ing video games is positively associated with risk of obesity [42] as is computerusage time [44], and yet video games are largely advertisement free and what ad-vertising they have is not usually food related. There has also been an increasein media multi-tasking (such as computer, iPad, SMS or Facebook use) duringtelevision viewing times, meaning that children pay less attention to commercials[42]. Additionally, studies of television suggest viewing might also conflate timespent watching videos and DVDs with time watching commercial television [7].These factors together suggest that children’s exposure and susceptibility to foodadvertising, and particularly televised advertising, has significantly decreasedwhile obesity rates are claimed to be increasing. None of these moderating devel-opments have been factored into research based in the Mad Men era.
It is also largely unexplained why television is claimed to lead to a causalrelationship when other media do not. For example, a study on magazine adver-tisements for healthy and less-healthy foods found no effects on hunger or foodpreferences in pre-adolescent children [45]. Clearly more research on non-televi-sion food marketing is required in order to make informed decisions as to whyregulation should occur primarily in one form of media rather than all media,and why advertisements on television are assumed to be problematic yet those inother media are ignored.
The advertising–obesity causality argument also ignores culturally basedconsumption habits. For example, in New Zealand, demand for fish and chips,an unadvertised product, is substantially larger than demand for heavily adver-tised fast foods such as hamburgers [40]. It is also argued that demand for aproduct can be primarily influenced by price and consumer wealth [40]. Re-ductions in advertising may lead to cost-based competition that could be passedon to consumers through price reductions and can have the effect of increasing
A modern epidemic
170
consumption. Therefore, restricting food advertising could actually increase con-sumption of unhealthy foods, unless measures to increase the price, such as a ‘sintax’ were introduced.
OBESITY: EVOLVING, BUT NOT NECESSARILYGROWING
Research from the UK suggests that dietary energy intake has declined between1983 and 1999 [43]. Similarly, US data show that Americans decreased their con-sumption of fat between 1965 and 1995 [40]. If advertising caused obesity dueto increased consumption of unhealthy foods there would logically only be ev-idence of increased energy consumption. The findings that energy consumptionhas decreased while obesity has risen suggest the cause of obesity is not necessar-ily increased energy input. Rather, there may be an under-addressed issue relatedto decreasing energy output, that is, decreased physical activity and lifestyle.
The importance of decreased physical activity needs to be considered wheninterpreting findings that exposure to television advertising is modestly correlatedwith obesity. Cross-sectional studies have found that children’s television view-ing is positively associated with increased consumption of fat, sweet and saltysnacks and carbonated beverages. Researchers assume that television exposureaffects food consumption via advertising and consequent purchase requests toparents [46]. Studies finding a correlation between television watching and obe-sity/health outcomes often understate other potential explanatory variables, in-cluding the nature of any assumed causal relationship [5]. Excess televisionwatching might be a symptom, rather than a cause, of a sedentary lifestyle leadingto obesity [45]. Obesity might cause a sedentary lifestyle in a reciprocal manner.Most studies do not distinguish between whether it is hours of watching televi-sion, or amount of advertising seen, that leads to unhealthy eating behaviour [5],although the 1983 study by Bolton [15] is a notable exception. Bolton found thatexposure to food advertising had a significant although small effect on snacking(explaining 2% of the variance) but did not have a significant direct effect on en-ergy intake. Bolton found that the influence of parental snacking frequency wasstronger than that of food advertising. Food advertising did not have a significanteffect on nutrient balance (deviation from percentage of Recommended Daily In-take) for specific nutrients. Parent nutrient balance explained 9% of the variancein nutrient balance.
Interestingly, an intervention to reduce time spent viewing television andplaying video games was successful in reducing these behaviours and participantsdid have a reduction in body mass index (BMI) compared to a control group [47].However, there was no reduction in high-fat foods or daily servings of highlyadvertised foods in the diet of the experimental group. Therefore, reducing ex-
8 The case for and against the regulation of food marketing directed towards children
171

posure to television advertising did not appear to have an impact on diet. Theauthors suggested that decreases in BMI associated with reduced television view-ing were due to increases in low-intensity physical activity. One of these studiesdid find that advertising affected consumption of orange juice (but not of un-healthy foods), but another of these studies found no effect of advertising onpurchasing behaviour. Furthermore, reducing television viewing, and presumablyexposure to food advertising, did not produce dietary changes but may have in-creased physical activity. Therefore, the apparent link between food advertisingand obesity might be due largely to the associated sedentary lifestyle, a findingsupported by Wong et al. [48]. Additionally, the correlation between televisionviewing and obesity might also be due to unobserved confounding factors [40].For example, parents who restrict children’s hours of television viewing mightalso encourage healthier diets and lifestyles.
Additional support for the role of lifestyle factors relating to lack of physicalactivity on obesity is drawn from findings from New Zealand that televisionviewing was inversely correlated with parental socioeconomic status (SES) [40].The authors suggested that higher SES families could afford more after-schoolactivities, such as sports electives to keep children occupied. Low SES familiesoften left children unsupervised during after-school hours as it was common forboth parents to be working. Children might therefore have tended to occupytheir time watching television rather than engaging in outdoor activities. Fearof ‘stranger danger’ for children playing with little or no supervision, and otherpossible physical harm through participation in sports, reinforces the view that asedentary lifestyle may be safer than a more physical lifestyle.
Critics of food advertising have argued that even though the amount of vari-ance in BMI explained by exposure to food advertising appears to be small, thecumulative effects are sufficiently important to warrant restricting or banningfood advertising aimed at children. Implementing such restrictive policies mightbe misguided. Sweden introduced a comprehensive ban on all television ad-vertising aimed at children in 1991 and childhood obesity rates in that countrycontinued to rise [49].
IS THE PROBLEM TOO MUCH FOOD, OR ONLYTHE WRONG FOOD?
It has been argued that imposing restrictions on advertising of unhealthy foodswould be unfair because unhealthy foods have not been clearly defined [50].Critics of food advertising complain that advertised foods do not match ‘recom-mended diets’ [7], yet there is a lack of expert consensus about what constitutesa healthy diet [49]. Proponents of the traditional ‘food pyramid’ recommend thatpeople derive most of their energy from carbohydrates, yet an increasingly popu-
A modern epidemic
172

lar alternative view is that energy should be obtained mostly from protein and fat[49].
Developing guidelines for ‘acceptable’ foods to be advertised would appearto be highly complicated. It is clear that research is continually evolving: perfectknowledge about the perfect diet does not yet exist. Therefore a simpler alter-native would be to ban all food advertising altogether. However, banning allfood advertising would make it impossible to use television and other media topromote healthy food choices. An experimental study comparing the effects ofadvertisements for either healthy or junk foods found that, contrary to expecta-tions, advertisements for junk foods did not enhance attitudes or intentions tothese foods. On the other hand, advertisements for healthy foods actually did en-hance attitudes and intentions to these foods in children who had seen these adscompared to children not exposed to them. This experiment suggests that ad-vertising of healthy foods could actually have a beneficial impact on children’sdietary habits [51].
Evidence that advertising of healthy foods can have a beneficial impact ondiet was shown by research into the advertising of high-fibre cereals. Advertis-ing containing information that high-fibre foods can reduce the risk of cancer wasfollowed by an increase in market share for these products [42]. Regulations mayprohibit certain truthful claims about foods that might be useful to consumers, egcalorie reductions can only be advertised if they are greater than 25% comparedto a reference food. Producers might therefore lack incentives to reduce caloriecontent if they cannot meet this threshold.
CONCLUSIONThe debate about the appropriateness and efficacy of any additional regulation ofadvertising of unhealthy foods to children centres around key themes: the defi-nition of ‘unhealthy’ foods, the range of media that would be encompassed byany regulation, and importantly, the interpretation of available evidence. Publichealth, and food and marketing industries draw from overlapping bodies of ev-idence regarding the impact of food marketing on children’s food consumptionand obesity patterns, but draw different conclusions. The complexities of defin-ing both the unhealthy foods and range of media (including new social media) tobe covered by any regulation are widely recognised.
The potential of regulatory initiatives to reduce children’s exposure to foodmarketing to some extent is also widely recognised, with debate focused on whoshould control such regulations. The further impact of this on children’s diets andobesity levels is more uncertain, given the broader obesity-promoting environ-ment in which we live. There is scope for the debate to broaden, for example,to introduce regulation to encourage the marketing of healthier foods and im-
8 The case for and against the regulation of food marketing directed towards children
173
prove food product formulation. Or to foster a new approach to self-regulationwhich has full industry participation and consistent standards for defining un-healthy foods. Future work in this area should focus on estimating the actualimpact of food marketing on children’s food consumption patterns and obesity,and the development of transparent and meaningful regulations (either statutoryor self-regulatory) which truly seek to improve the healthiness of the marketingenvironment for children.
References1. American Psychological Association (2004). Report of the APA taskforce
on advertising and children. [Online]. Available: www.apa.org/pi/families/resources/advertising-children.pdf [Accessed 16 January 2012].
2. Dalmeny K, Hanna E & Lobstein T (2003). Broadcasting Bad Health: Whyfood advertising needs to be controlled: International Association of Con-sumer Food Organisations.
3. Escelante de Cruz A. The junk food generation. A multi-country survey ofthe influence of television advertisements on children. Consumers Interna-tional 2004 [22 July 2011]. [Online]. Available: epsl.asu.edu/ceru/Articles/CERU-0407-227-OWI.pdf [Accessed 16 January 2012].
4. Hastings G, McDermott L, Angus K, Stead M & Thomson S (2006). Theextent, nature and effects of food promotion to children: a review of theevidence. Technical Paper Prepared for The World Health Organization;Geneva.
5. Livingstone S (2006). New research on advertising foods to children: anupdated review of the literature. Published as Annex 9 to Ofcom TelevisionAdvertising of Food and Drink Products to Children consultation. London:Office of Communications (Ofcom).
6. McGinnis MJ, Gootman JA & Kraak VI (2006). Food Marketing to Chil-dren and Youth: threat or Opportunity? Food and Nutrition Board, Board onChildren, Youth and Families, Institute of Medicine of the National Acad-emies. [Online]. Available: books.nap.edu/catalog/11514.html [Accessed 16January 2012].
7. Hastings G, Stead M, McDermott L, Forsyth A, MacKintosh AM, RaynerM, et al. (2003). Review of research on the effects of food promotion to chil-dren. Prepared for the Food Standard Agency. Glasgow: Centre for Social
A modern epidemic
174

Marketing.8. Cairns G, Angus K & Hastings G (2009). The extent nature and effects of
food promotion to children: a review of the evidence to December 2008.Prepared for the World Health Organization. United Kingdom: Institute forSocial Marketing, University of Stirling.
9. Hitchings E, Moynihan P & Moynihan P (1998). The relationship betweentelevision food advertisements recalled and actual foods consumed by chil-dren. Journal of Human Nutrition and Dietetics, 11(6): 511–17.
10. Barry TE & Hansen RW (1973). How race affects children’s TV commer-cials. Journal of Advertising Research, 13(5):63–67.
11. Batada A & Borzekowsk D (2008). Snap! Crackle! What? Recognition ofcereal advertisements and understanding of commercials’ persuasive intentamong urban, minority children in the US. Journal of Children and Media,2(1): 19–36.
12. Carruth BR, Goldberg DL & Skinner JD (1991). Do parents and peers medi-ate the influence of television advertising on food-related purchases? Journalof Adolescent Research, 6(2): 253–71.
13. Marshall D, O’Donohoe S & Kline S (2007). Families, food, and pesterpower: beyond the blame game? Journal of Consumer Behaviour, 6(4):164–81.
14. Maryam A, Mehdi MR, Masood K, Mosoomeh G, Nasrin O & Yadollah M(2005). Food advertising on Iranian children’s television: A content analysisand an experimental study with junior high school students. Ecology of Foodand Nutrition, 44(2): 123–33.
15. Bolton RN (1983). Modeling the impact of television food advertising onchildren’s diets. In JH Leigh & JCR Martin (Eds). Current issues and re-search in advertising (pp173–99). Ann Arbor: University of Michigan
16. Rangan AM, Randall D, Hector DJ, Gill TP & Webb KL (2008). Consump-tion of ‘extra’ foods by Australian children: types, quantities and contribu-tion to energy and nutrient intakes. European Journal of Clinical Nutrition,62(3): 356–64.
17. Landhuis CE, Poulton R, Welch D & Hancox RJ (2008). Programming obe-sity and poor fitness: the long-term impact of childhood television. Obesity,16(6): 1457–59.
8 The case for and against the regulation of food marketing directed towards children
175

18. Chapman K, Kelly B, King L & Flood V (2007). Fat chance for Mr VegieTV ads. Australian and New Zealand Journal of Public Health, 31(2): 190.
19. Dalmeny K, Hanna E & Lobstein T (2003). Broadcasting bad health: whyfood advertising needs to be controlled. London: The International Associa-tion of Consumer Food Organizations.
20. United Kingdom Department of Health (2008). Changes in food and drinkadvertising and promotion to children: a report outlining the changes in thenature and balance of food and drink advertising and promotion to children,from January 2003 to December 2007. [Online]. Available: www.dh.gov.uk/prod_consum_dh/groups/dh_digitalassets/@dh/@en/documents/digitalasset/dh_089123.pdf [Accessed 16 January 2012].
21. Story M & French S (2004). Food advertising and Marketing Directed atChildren and Adolescents in the US. International Journal of Behavioral Nu-trition and Physical Activity, 1(3).
22. McDermott L, O’Sullivan T, Stead M & Hastings G (2006). Internationalfood advertising, pester power and its effects. International Journal of Ad-vertising, 25(4): 513–39.
23. Spungin P (2004). Parent power, not pester power. International Journal ofAdvertising and Marketing to Children, 5(3): 37–40.
24. Wilson G & Wood K (2004). The influence of children on parental pur-chases during supermarket shopping. International Journal of ConsumerStudies, 28(4): 329–36.
25. Ofcom (2004). Childhood Obesity – Food Advertising in Context. Chil-dren’s Food Choices, Parents’ Understanding and Influence, and the Roleof Food Promotion. Office of Communication. [Online]. Available:www.ofcom.org.uk/research/tv/reports/food_ads/report.pdf [Accessed 16January 2012].
26. King T, Kavanagh AM, Jolley D, Turrell G & Crawford D (2006). Weightand place: a multilevel cross-sectional survey of area-level social disadvan-tage and overweight/obesity in Australia. International Journal of Obesity,30(2): 281–87.
27. Hawkes C (2007). Regulating and litigating in the public interest: regulatingfood marketing to young people worldwide: trends and policy drivers. Amer-
A modern epidemic
176

ican Journal of Public Health, 97(11): 1962–73.28. Australian Food and Grocery Council (2010). The Responsible Children’s
Marketing Initiative. [Online]. Available: www.afgc.org.au/industry-codes/advertising-kids.html [Accessed 25 August 2010].
29. Australian Association of National Advertisers. Australian Quick ServiceRestaurant Industry Initiative for Responsible Advertising and Marketing toChildren (2009). [19 January 2010]; Available from: www.aana.com.au/doc-uments/QSRAInitiativeforResponsibleAdvertisingandMarketingtoChildrenJune2009.pdf.
30. King L, Hebden L, Grunseit A, Kelly B, Chapman K & Venugopal K(2010). Industry self regulation of television food advertising: responsibleor responsive? International Journal of Pediatric Obesity. DOI: 10.3109/17477166.2010.51731.
31. Hebden L, King L, Kelly B, Chapman K, Innes-Hughes C & Gunatillaka N(2010). Regulating the types of foods and beverages marketed to children:how useful are food industry commitments. Nutrition & Dietetics67(4):258–66.
32. Sharma LL, Teret SP & Brownell KD (2010). The food industry and self-regulation: standards to promote success and to avoid public health failures.American Journal of Public Health, 100(2):240–46.
33. World Health Organization. Set of recommendations on the marketing offoods and non-alcoholic beverages to children. Geneva 2010.
34. Goldberg M (1990). A quasi-experiment assessing the effectiveness of TVadvertising directed to children. Journal of Marketing Research, 27:445–54.
35. GPI Atlantic. Cost of obesity in Quebec. 2000 [23 March 2011]; Availablefrom: www.gpiatlantic.org/pdf/health/obesity/que-obesity.pdf.
36. Ofcom. Changes in the nature and balance of television food advertising tochildren. 2008 [23 March 2011]; Available from: stakeholders.ofcom.org.uk/market-data-research/tv-research/hfssdec08/.
37. Ehrenberg ASC & Ehrenberg A (1988). Repeat-buying: facts, theory andapplications. London: Oxford University Press.
38. Lawson M, McGuinness D & Esslemont D (1990). The effect of in-storesampling on the sale of food products. Marketing Bulletin, 1: 1–6.
39. Holland KE, Blood RW, Thomas I, Lewis S, Komesaroff PA & Castle DJ
8 The case for and against the regulation of food marketing directed towards children
177

(2011). Our girth is plain to see: an analysis of newspaper coverage of Aus-tralia’s Future ‘Fat Bomb’. Health, Risk & Society, 13(1): 31–46.
40. Eagle L, Bulmer S, De Bruin A & Kitchen KJ (2004). Exploring the linkbetween obesity and advertising in New Zealand. Journal of MarketingCommunications, 10: 49–67.
41. Greenberg BS & Brand JE (1993). Television news and advertising inschools: the Channel One controversy. Journal of Communication, 43(1):143–51.
42. Zywicki TJ, Holt D & Ohlhausen, MK (n.d.). Obesity and advertising pol-icy. George Mason School of Law Working Paper Series. Working Paper3 [Online]. Available: law.bepress.com/gmulwps/gmule/art3/ [Accessed 17April 2011].
43. Ambler T (2004). Does the UK promotion of food and drink to childrencontribute to their obesity? Centre for marketing working paper, No. 4–901.London Business School, Centre for Marketing.
44. Russ SA, Larson K, Franke TM & Halfon N (2009). Associations betweenmedia use and health in US children. Academic Paediatrics, 9(5): 300–06.
45. King L & Hill AJ (2008). Magazine adverts for healthy and less healthyfoods: effects on recall but not hunger or food choice by pre-adolescent chil-dren. Appetite, 51(1): 194–97.
46. Carter OBJ (2006). The weighty issue. Health Promotion Journal of Aus-tralia, 17: 5–11.
47. Robinson TN (1999). Reducing children’s television viewing to preventobesity: a randomised controlled trial. Journal of the American Medical As-sociation, 282(16): 1561–67.
48. Wong ND, Hei TK, Qaqundah PY, Davidson DM, Bassin SL & Gold KV(1992). Television viewing and pediatric hypercholesterolemia. Pediatrics,90: 75–79.
49. Harker D, Harker M & Svensen S (2007). Attributing blame. Journal ofFood Products Marketing, 13: 33–46.
50. Australian Association of National Advertisers (2009). Letter to NicolaRoxon, Minister for Health and Aging. 23 October 2009.
51. Dixon HG, Scully ML, Wakefield MA, White VM & Crawford DA (2007).The effects of television advertisements for junk food versus nutritious food
A modern epidemic
178

on children’s food attitudes and preferences. Social Science and Medicine,65: 1311–23.
8 The case for and against the regulation of food marketing directed towards children
179

9Benefits of developing a whole-
school approach to health promotionJenny O’Dea1
This chapter examines the school experience as a determinant of futurehealth, including discussion of how broad dimensions such as physicalhealth, emotional wellbeing, cultural identity and psychosocial develop-ment, may be developed and enhanced within a whole-school health-pro-moting context. Healthy behaviours can be established in young people,and these behaviours tend to translate into healthy habits in adulthood,which are subsequently modelled and passed on to the following gen-erations. In this chapter, the salience of health promotion in schools ispresented in terms of preventing obesity and type 2 diabetes by promotinga healthy body image, establishing positive food habits and encouraging in-volvement in sport and physical activity. The potential ‘ripple effect’ thatschool health promotion can have via families and communities is also ad-dressed as an additional avenue which can be utilised and embraced byteachers, health professionals and communities.
LINKS BETWEEN HEALTH AND EDUCATIONOUTCOMES
One way to promote health in schools is to highlight the important links betweena child’s health status and their academic achievement. As recently as 2010, theUnited Nations’ 2010 Human Development Report clearly reiterated the predic-tive nature of health and education variables by stating that ‘education, health,nutrition and sanitation complement each other, with investments in any onecontributing to better outcomes in the others’ [39]. Other researchers agree anddemonstrate how literacy and numeracy are inextricably interwoven with educa-tion, and education is concurrently a key predictor of life opportunities, including
1 Faculty of Education and Social Work, University of Sydney.
180

economic development, psychological wellbeing, health status and social spheres[4, 33]. It is recognised that healthy students are more able and ready to learn [25],and that improving the health of students and the school environment has positiveoutcomes for learning and academic results.
An example of this important association is given in some recent studieswhich clearly demonstrate the predictive relationships between physical activityand educational performance and achievement, and show that physical activity ispositively related to brain function and cognitive performance [14, 37]. Positive re-lationships have also been documented between academic achievement and bothphysical activity [5, 20] and sports participation [10, 11]. Field and colleagues [11]found that students who reported having high physical activity and exercise par-ticipation also reported having higher grade point averages (GPAs), better familyrelationships, lower levels of drug use and better mental health, than those whoreported participating in physical activity and exercise less often. Vigorous levelsof physical activity are also positively associated with overall grade score [6, 7, 12,16, 35].
Similarly, recent studies of nutrition and cognitive function also reinforceearlier reports that dietary components favourably influence cognitive functionand academic achievement in children and adolescents. For example, compar-isons of studies among school-aged children indicate that breakfast consumptionis more beneficial to cognitive function and academic performance than skippingbreakfast, particularly in those whose nutritional status is already compromisedby social disadvantage and poverty [3, 15, 23]. Recent reviews and experimentalstudies present a working hypothesis that a breakfast of low-glycaemic index isbeneficial to the blood glucose supply to the brain, and that this effect is likelyto explain the positive relationship between breakfast consumption and the cog-nitive and academic performance of schoolchildren [24, 36].
Other studies provide ongoing evidence for the link between the academicachievement and health status of children, with a recent report also proposingclear pathways between socioeconomic position, physical activity, mental healthand educational performance in adolescents [19].
A WHOLE-SCHOOL, HEALTH-PROMOTINGSCHOOLS FRAMEWORK
Whilst the links between child health and academic achievement become morecemented in the recent international research literature, governments, schools andlocal communities have become increasingly perceived as having the major re-sponsibility for child health promotion, childhood obesity and type 2 diabetesprevention. Much of the resultant pressure placed on governments has been in thearea of providing procedures and resources for health promotion.
9 Benefits of developing a whole-school approach to health promotion
181

One way of ensuring a collaborative and developmental process on whichto base health promotion is the World Health Organization (WHO) health-pro-moting schools framework [43]. This framework outlines a holistic approach tofoster health within a school and its local community by engaging health and ed-ucation officials, teachers, students, parents, health professionals and communityleaders in making common, coordinated and sustained efforts to promote health.A ‘whole-school’ or health-promoting school approach is one which has an or-ganised set of policies, procedures, activities, and structures designed to protectand promote the overall health and wellbeing of students, staff, and wider schooland community members.
The health-promoting schools concept is based on the previously outlinedpremise that education and health are inseparable and that health supports suc-cessful learning, and successful learning supports health [39, 43]. The ideologyof the health-promoting schools framework states that the whole school and itssurrounding community must implement policies, practices, and other measuresthat respect individual self-esteem, are culturally appropriate, provide multipleopportunities for success, and acknowledge group efforts and intentions as wellas personal achievements. A health-promoting school also strives to improve thehealth of school personnel, families, and community members as well as students,and it works with community leaders to help them understand how the commu-nity and environment is influential in affecting health and education.
The WHO guiding principles for developing health-promoting schools in-clude the holistic nature of health, gender equity, involvement and ownership ofthe whole-school community, participatory decision-making, sustainability, cul-tural appropriateness, and inclusion of measures to increase health literacy. WHOdefines health literacy as the cognitive and social skills that determine the motiva-tion and ability of individuals to gain access to, understand, and use informationin ways that promote and maintain health [43]. Thus, the health-promoting schoolpromotes empowerment of students, teachers, parents, school staff, and commu-nity members because they learn to obtain and use health information.
The framework focuses on three areas of intervention within the school andits local community: 1) School curriculum, teaching, and learning; 2) Schoolethos, environment, and organisation; 3) School–community partnerships andservices.
The overall guiding principles for the development of health-promotingschools include the following:
• Good health supports lifelong learning, living and wellbeing.• Students grow and learn in a safe, caring, responsive and empowering envi-
ronment.• Health-promoting schools view health holistically, addressing the physical,
social, cultural, mental, intellectual and spiritual dimensions of health compre-hensive programs.
A modern epidemic
182

• Equal access by male and female students from all population groups to edu-cational opportunities is essential for promoting quality of life.
• Health-promoting schools ensure a coordinated, comprehensive approach tohealth and learning by linking curriculum with the school ethos/environmentand the community.
• Health-promoting schools are inclusive – the whole community of students,parents, staff and local agencies are engaged in school activities.
• Active participation is based on respecting skills, values and experiences ofparents, students and staff.
• Collaborative, participatory decision-making and personal action provide theconditions for the empowerment of individuals and the school community.
• Staff and parent wellbeing is an integral part of health-promoting school activ-ity.
• Partnerships result in action which is more effective, efficient and sustainable.• Addressing health literacy is an important component of a health-promoting
school.• The contribution of diverse cultures and groups is supported and valued.
In a recent report of a health-promoting schools project in Africa, MacNab andcolleagues [21] demonstrate how these basic principles can have wide relevanceand application in multiple international settings. In this oral health and nutritionproject, the researchers demonstrate how health-promoting schools provide in-formation and support systems that can be catalysts for behavioural changes toimprove health globally and reduce healthcare costs [21].
Unfortunately, school-based health education programs face many chal-lenges such as inconsistent health messages in the child’s home or communityenvironment, coupled with communication barriers between the health and edu-cation communities [25]. Health-promoting schools practitioners can overcomethese issues by collaborating with community representatives, opening the linesof communication, distributing clear messages to the community and engagingstudents, parents, teachers, and health and education professionals. Health-pro-moting schools can empower students to make positive decisions about theirhealth and allow them to take such knowledge home to their families.
Inchley and colleagues [17] expressed concern that a common approach to-ward health promotion and education in a school setting had been a focus onspecific, short-term interventions that produce observable change in students’health related behaviours. Such short-term initiatives neglect to fully embracethe philosophy behind health-promoting schools, which states that long-termgains will only follow if initiatives are integrated into a more diverse, multifac-eted health-promotion strategy that supports sustained change [17]. This is inaccordance with the concept of a whole-school and community approach that en-compasses a combined and collaborative effort.
A successful whole-school approach to health promotion must also provide
9 Benefits of developing a whole-school approach to health promotion
183

opportunities to utilise broader social, economic and environmental factors as cat-alysts for positive behavioural change [34]. Further successes can be attributedto drawing connections between curriculum and learning imperatives within theschool environment as well as placing value on the partnerships between theschool and community [34].
FACTORS THAT AFFECT HEALTH PROMOTION INA POSITIVE AND NEGATIVE WAY
The delivery of health education and promotion is a very important factor to beconsidered, as there are many components that can impact the way health educa-tion is received by its target recipients.
Potential resistance to the messages presented in health interventions is oftenreported among adolescents [40]. School students often do not respond well tothe paternalistic nature of health-education interventions and can have an op-positional response if they see the intervention as a threat to, or removal of,their freedom to determine their own health status [41]. Whitehead [40], however,explains a continuum to counter this, whereby the less educating a health inter-vention is, and the more health promoting it becomes, the less likely the strategyis to be rejected by its target group.
Alternatively, a program that is properly planned, implemented and deliveredcan have a profoundly positive impact, as recently demonstrated in the BrighterSmiles Africa oral health program which generated more positive attitudes to-wards health-related practices for the wider community [21].
A recent study conducted by Xin-Wei and colleagues [44] discusses the de-velopment of an overall health-promoting school program in a province of China.It was reported that with community collaboration, it was feasible to imple-ment the health-promoting schools concept in rural and urban schools in bothresource-poor and adequately resourced schools. This study subsequently re-ported enhanced student educational outcomes as well as improvement in theemotional and social wellbeing of students and the broader school community[44].
DEVELOPMENT OF HEALTH-PROMOTINGSCHOOLS
The long-term planning and partnerships required to produce health-promotingschools do not develop overnight and it is unrealistic to assume that such ini-tiatives will lead to immediate change. Inchley and colleagues [17] suggest thatthere are four themes that should be given the major focus in planning and de-
A modern epidemic
184

velopment of school health promotion programs. These include: 1) recognition –ownership and empowerment, 2) leadership and management, 3) collaboration,and 4) integration [17]. Deliberately utilising these major themes in health-pro-motion activities reduces barriers to implementation, promotes ease of accessbeyond narrow individual behavioural outcomes, and aims instead to improve theschool as a whole organisation, whilst supporting teachers and facilitating sus-tainable long-term health improvement.
Rowe and colleagues [34] also recognise the importance of school leadershipand management naturally forming from within the school environment, ratherthan being imposed from outside of the school or the local community. The roleof such leadership is critical in engaging others in the program implementation.
There are many factors that influence whether a school will be able to adoptand implement a health-promoting schools approach. A recent Canadian studyfound that there were four predictors relating to school organisational character-istics that carried great weight in determining the adoption of a health-promotingschools approach: 1) the presence of leaders within schools, 2) perceived schoolcontextual barriers, 3) school investment in healthy lifestyles, and 4) belief incollective efficacy [8]. These findings imply that emphasis should not be placedsolely on strategies designed to ‘sell’ the health-promoting schools concept toschools, but also on strategies that support the organisational change required toincorporate it within schools [8].
The health-promoting schools framework involves shifting from practicesthat rely predominantly on classroom-based health education to a more integratedconstruct of health promotion that encompasses both children’s attitudes and be-haviours as well as their environment [8]. The framework outlines requirementsfor a planned and sequential health-education curriculum across all age groupsand the need for inter-sectoral and cross-curricular approaches.
An example of this concept in regard to obesity prevention, would be a co-ordinated, cross-curricular approach using a deliberate focus on promotion ofhealthy eating habits and prevention of fad dieting and subsequent weight-gaincycles in health-education classes (skill development to reduce the influenceof peer-group pressure), English classes (the impact of persuasive advertising),and science (normal composition and nutritional needs of the human body). Thecross-curricular approach ensures health messages remain balanced and consis-tent across subject areas. In addition, the utilisation of a health-promoting schoolsframework emphasises teacher training in specific areas and the opportunity forteachers to reflect on their own values, beliefs, prejudices and life experiencesin order to be effective role models. In regard to the long-term prevention ofbody image problems, promotion of lifelong physical activity, healthy eating, andobesity and diabetes prevention, teachers and other school and community per-sonnel are likely to require training to better understand these problems, trainingin effective and safe preventive strategies, and access to counselling and referral
9 Benefits of developing a whole-school approach to health promotion
185

services.
FIRST, DO NO HARMBefore governments and other agencies leap into actions that they assume to bebeneficial in the promotion of child and adolescent health and the prevention ofchildhood obesity and type 2 diabetes, we must remember to employ one of themost important principles of modern medicine and prevention science, ‘First, dono harm’.
Programs aimed at healthy eating or increased physical activity that are notadequately planned, pre-tested or inappropriately delivered, have the potentialto do more harm than good [28]. Those who work with young people in anyhealth-promoting capacity need to recognise the vulnerability of children andadolescents of both genders to body image and eating concerns and that weight-focused programs are already known to result in further feelings of shame, guiltand hopelessness and a subsequent low participation in physical activity [31].
The ‘First, do no harm’ approach is not just salient for obesity, diabetes andother disease prevention, but rather an imperative that should be actively consid-ered for all health-education and promotion campaigns. The potential to causeinadvertent and undesirable outcomes when delivering obesity or type 2 diabetesprevention activities should be a serious consideration for all health profession-als, teachers and educators. Such risk can be summarised in the following fourmajor points:
• Implementation of ‘treatment’ rather than ‘prevention’: for example, measur-ing and diagnosing student overweight or obesity based only on a one-off BMImeasure that does not take into account many factors such as pubertal stage,ethnicity, muscularity or adiposity; or providing weight-loss advice.
• Inadvertent suggestion of fad dieting and other weight-loss techniques thatare likely to be unsupervised and thereby fail: for example, discussing weightloss and inadvertent promotion of dieting rather than promoting weight main-tenance or a healthy lifestyle; inadvertently encouraging disordered eating orsuggestion that dieting behaviour is normal and/or desirable.
• Creation of stigmatisation, prejudice and discrimination: for example, suggest-ing that health is exclusively associated with slimness, weighing students andhaving them plot their BMI on a chart, inadvertently encouraging weight andBMI comparisons, focusing on weight rather than growth as evidenced byheight, fitness and overall health markers, labelling and shaming overweightand obese students. This can also stigmatise overweight or obese students ashaving a ‘problem’, being a ‘failure’ and promote the idea that in order to be‘healthy’, students must lose weight.
• Undesirable outcomes of unplanned approaches. Inadvertently creating weight
A modern epidemic
186

concerns can lead to weight-loss attempts that are particularly unhealthy andharmful such as smoking for weight control, vomiting, laxatives, excessiveexercise or avoidance of exercise, shame of body, social isolation and depres-sion. In some recent literature, researchers have identified the link betweeneating disorders and obesity, particularly in young women seeking bariatricsurgery [13]. In these research reports the obesity is the likely result of a binge-eating disorder which ought to be treated by psychiatric and psychologicalinterventions, rather than by simplistic surgical intervention or health pro-motion. The obvious link between eating disorders and weight gain requirefurther recognition and research.
NUTRITION PROMOTION IN SCHOOLSIt has long been recognised that schools have the potential to make significantand long-lasting contributions to promoting healthy eating habits in children andadolescents [34]. Sound child nutrition offers many varied benefits, includinggrowth, brain function, intelligence, immunity to infections, energy regulation,better concentration and behaviour, dental health, prevention of lifestyle diseasesand the development of good eating habits, many of which are likely to continueinto late adolescence and adulthood. School students who are properly nourishedtend to demonstrate better classroom learning behaviours, fewer disciplinaryproblems, better attention and increased attendance [26].
Normal growth and weight control are other benefits of a nutritious diet, butthese factors are often not considered most important to parents. Hence, the fo-cus on other important positive benefits as outlined above which are crucial inthe engagement of families in health promotion. An interesting point related tochild and adolescent nutrition is that the food habits learned at theses stages oflife are often carried on and taught to future generations of children. This can en-sure healthy food habits for the next generation of children or, conversely, thecontinuation of poor eating habits and the risk of adult ill-health.
Food and nutrition are very interesting and relevant topics for children andadolescents of all ages, but all too often this material is taught in a very nega-tive way. Teachers and other health educators often focus on telling students whatNOT to eat rather than encouraging them to enjoy healthy options. This approachis negative and unnecessarily narrow because the key components of human nu-trition are balance, variety, enjoyment and moderation. In this regard, there is noone food that cannot be included in a balanced diet. School personnel and healthprofessionals need to approach the topic of nutrition education using the ‘balance,variety, moderation’ messages in a consistent manner.
While nutrition has long been included in health-education curricula in West-ernised nations, there has been a recent increase in the recognition of the social
9 Benefits of developing a whole-school approach to health promotion
187

and environmental factors that influence food choice, which has extended the fo-cus to include the whole-school community, rather than narrowly approachingnutrition education from just one avenue [34].
As an example of a health-promoting schools approach, a primary school inthe UK developed an approach called Kids Café which empowered the studentsto prepare, sell and serve nutritious food to staff and students. This initiative is anexample of how the health-promoting schools approach can be utilised to insti-gate changes in the school environment that support and encourage healthy eatinghabits among children [34]. Further, the Kids Café initiative provides an exam-ple of how to promote the availability, affordability and accessibility of nutritiousfoods in the school environment.
Other examples of positive, health-promoting schools nutrition activities in-clude the following:
• School gardens – students grow fresh vegetables; examine environmental fac-tors in food production; demonstrate the affordability of and accessibility tonutritious foods; learn about nature, nutrition and health; create recipes forvegetables; develop a sense of ownership of the health promotion initiative;become empowered to make choices regarding their project; raise funds. Thiskind of mutual support where the students are contributing to the public com-munity and the local shops are supporting their schools is a good example ofa whole-school approach having a positive impact beyond the school environ-ment.
• Cookery sessions – students learn about an array of foods from multiculturalorigins; develop recipe-modification skills; enjoy healthy eating in a social sit-uation; develop budgeting and consumerism skills; master cooking skills.
• Healthy school canteen – students learn to choose healthy options; teachersmodel healthy eating; pricing policies demonstrate influences on food choices.
• Shopping/supermarket tours – students learn consumerism skills, value formoney, budgeting, how to interpret food packaging and labels, food law, foodsafety, how to decipher advertising messages, the food supply and the fooddistribution chain.
• Classroom food tasting activities – students have a set class break for fruit andvegetable snack; school programs provide milk, breakfast, fruit, water bottlesor water fountains/dispensers; local vendors provide food products.
• Environmental initiatives – soft-drink machines removed, water fountains in-stalled and regularly maintained; marketing initiatives scrutinised; canteensimplement healthy food and drink policy, canteens provide healthy choices,sponsorship by food companies should be scrutinised, local food producersand media are utilised to reinforce program aims.
For further reading on this topic please see the book by Worsley [47].
A modern epidemic
188

PROMOTION OF A HEALTHY BODY IMAGEThe promotion of a healthy body image is desirable because it impacts on manyaspects of adolescent health including self-image, psychological health [31], par-ticipation in physical activity [9], avoidance of dangerous dieting and it is part ofthe array of self-concept factors that promote and protect general child health sta-tus [22].
The evidence presented by Canadian researcher Niva Piran and her col-leagues [32] recognises that teachers are on the ‘frontline’ with students and in aposition of power to convey critical information, values, norms and other cultur-ally encumbered material. This position of intensive interaction allows teachersgreat potential to become involved in the prevention and treatment of eating dis-orders and childhood obesity, and should be geared towards health education andpromotion [32]. School-based health-promotion programs can have a positive andlasting impact on body image, eating behaviours, attitudes, and the self-image ofadolescents [30]. There is also great potential to address the surrounding issues ofbody dissatisfaction, self-esteem and self-efficacy in a safe and health-promotingenvironment.
The environment in which issues such as obesity, eating disorders and un-healthy weight-loss practices, are didactically taught via classroom ‘lessons’,is considered to be a ‘toxic’ environment which has the potential to cultivatethese problems [18]. Such programs, like the information-giving approach, canglamourise and normalise eating disorders and disturbances, as well as introduceyoung people to methods of fad dieting and weight control that are dangerousand health harming, such as laxative abuse and starvation. Unintentional harmfuleffects have been reported when teachers and school staff inadvertently transfertheir own poor body image, lack of interest in sport or physical activity orweight prejudices to the impressionable young people in their care. Piran [32,p4] discussed teachers being role models and the importance of examining theirown past body-anchored experiences and attitudes, including ‘weightism’. Thiscritical consciousness could reduce the potential for inadvertent transference ofmisinformation, prejudices and inappropriate advice from teacher to student.
Suggestions for body image improvement initiatives in schools include thefollowing:
• Design of school uniforms and sports uniforms in which students feel comfort-able, fashionable, culturally appropriate and less concerned about their bodyimage. An example of this is a sport/swim uniform that is designed for use byMuslim girls.
• Implementation of a ‘free’ physical education uniform so that students can beactive in their own choice of clothing or swimwear. For example, students areallowed to wear board shorts and rash vests to swimming.
• Implementation of a policy that allows students to wear their sports uniform to
9 Benefits of developing a whole-school approach to health promotion
189

school on the day of sport or physical education to avoid having to change inschool changing rooms.
• Addressing privacy/modesty issues such as placing doors on school changecubicles and covering school showers with curtains.
• Implementing body image promotion activities for both girls and boys.
PROMOTING PHYSICAL ACTIVITYThe health benefits of regular physical activity in children and adolescents havebeen well established in the research literature for many decades [26, 47] as havethe health risks of physical inactivity or a sedentary lifestyle [1, 2, 27]. Promotingphysical activity is a clear public health policy objective [42] and one which lendsitself to school-based promotion.
Physical activity among children and adolescents can be basically dividedinto organised and non-organised activities and the promotion of both is impor-tant for children’s health and wellbeing.
The promotion of physical activity within a health-promoting schools frame-work would incorporate some of the following strategies:
• Promoting opportunities for children and adolescents to be physically activeas part of daily life eg walking or riding bikes to school, providing play timeat school, providing play time before and after school, planning specificallytargeted physical activity programs that are supervised before and after school
• Assisting school teachers in the delivery and resourcing of school sport andphysical activity
• Promoting non-competitive, cooperative games and physical activity environ-ments
• Offering non-structured options such as walking, martial arts, free play or gar-dening in school physical activity programs
• Providing structural enablers at school such as safe bike routes, secure bikeracks or lock-up areas for bicycles
• Restructure playgrounds by using colorful markings and providing differenttypes of game equipment
• Avoid or reduce the time required for uniform changing and showering atschool sport or physical education classes. Allow sports uniforms to be wornto school on the day of sport or physical education
• Avoid activities in which students wait for their turn in a queue – find an ac-tivity to keep all students active during the whole class
• Produce innovative activity areas including climbing equipment, rock walls,skate areas and free play materials
• Designing modest and/or self-selected sports uniforms and swimwear to en-courage participation and reduce body consciousness
A modern epidemic
190

• Providing same gender physical activities as an option in order to reduce com-petitive behaviours and self/body consciousness
• Implementing environmental changes to enable more physical activity and toaddress barriers to physical activity eg providing safe public spaces for phys-ical activity, providing seasonally appropriate activities in the community,such as indoor heated swimming pools, providing play areas and equipment inhigh-rise housing areas
• Involve parents in monitoring sedentary time and promoting adequate sleepand daily physical activity of their children
• Provide teacher training to update skills, knowledge and resources.
CONCLUSIONSResearch reinforces the suggestion that educators need preventive strategies thatencompass objectives of holistic health promotion including healthy eating, im-proved body image, increased physical activity as well as prevention of obesityand type 2 diabetes. School-based programs may provide an efficient and ef-fective way to approach these problems utilising a health-promoting schoolsframework which encompasses a range of influences internal and external to theschool environment. The holistic focus of the framework targets numerous as-pects of promoting a healthy lifestyle including school curricula, policies andattitudes as well as the local environment and community activities, services andresources. Collaboration among school, home and community, which is centralto implementing the framework, enables a shared language and a shared way ofworking and understanding each other [43].
The school environment is crucial in determining future health as it com-plements the classroom learning and provides a basis for knowledge, beliefs,attitudes and behaviours that will almost certainly be carried into the young per-sons’ future life.
References1. Aires L, Andersen LB, Mendonça D, Martins C, Silva G & Mota J (2010).
A 3-year longitudinal analysis of changes in fitness, physical activity, fatnessand screen time. Acta Paediatrica, 99(1): 140–44.
2. Andersen LB, Harro M, Sardinha LB, Froberg K, Ekelund U, Brage S &Anderssen SA (2006). Physical activity and clustered cardiovascular risk inchildren: a cross-sectional study (The European Youth Heart Study). TheLancet, 368(9532): 299–304.
9 Benefits of developing a whole-school approach to health promotion
191
3. Benton D (2008). The influence of children’s diets on their cognition andbehaviour. European Journal Nutrition, 47(Suppl. 3): 25–37.
4. Buchmann C, DiPrete T & McDaniel A (2008). Gender inequalities in edu-cation. Annual Review of Sociology, 34(1): 319–37.
5. Caterino M & Polak E (1999). Effects of two types of activity on theperformance of second-, third-, and fourth-grade students on a test of con-centration. Perceptual and motor skills, 89: 245–48.
6. Coe D, Pivarnik J, Wormack C, Reeves M & Malina R (2006). Effect ofphysical education and activity levels on academic achievment in children.Medicine & Science in Sports & Exercise, 39(8): 1515–19.
7. Daley A & Ryan J (2000). Academic performance and participation in phys-ical activity by secondary school adolescents. Perceptual and motor skills,91(2): 531–34.
8. Deschesnes M, Trudeau F & Kebe M (2010). Factors influencing the adop-tion of a health promoting school approach in the province of Quebec,Canada. Health Education Research, 25(3): 438–50.
9. Dounchis JZ, Hayden HA & Wilfley DE (2001). Obesity, body image, andeating disorders in ethnically diverse children and adolescents. In ThomsponJK & Smolak L (Ed). Body image, eating disorders, and obesity in youth: as-sessment, prevention and treatment (pp67–98). Washington DC: AmericanPsychological Association.
10. Dwyer T, Sallis J, Blizzard L, Lazarys R & Dean K (2001). Relationship ofacademic performance to physcial activity and fitness in children. PediatricExercise Science, 13: 225–37.
11. Field T, Diego M & Sanders CE (2001). Exercise is postively related to ado-lescents’ relationships and academics. Adolescence, 36(141): 105.
12. Fisher M, Juszczak L & Friedman S (1996). Sports participation in an urbanhigh school: academic and psychologic correlates. Journal of AdolescentHealth, 18(5): 329–34.
13. Grilo C, Masheb R, Brody M, Burke-Martindale C & Rothschild B (2005).Binge eating and self-esteem predict body image dissatisfaction amongobese men and women seeking bariatric surgery. International Journal ofEating Disorders, 37(4): 347–51.
14. Hillman C, Erickson K & Kramer A (2008). Be smart, exercise your heart:
A modern epidemic
192

exercise effects on brain and cognition. Nature Reviews Neuroscience, 9(1):58–65.
15. Hoyland A, Dye L & Lawton C (2009). A systematic review of the effectof breakfast on the cognitive performance of children and adolescents. Nu-trition Research Reviews, 22: 220–43.
16. Huang T, Goran M & Spruijt-Metz D (2006). Associations of adiposity withmeasured and selfreported academic performance in early adolescence. Obe-sity, 14(10): 1839–45.
17. Inchley J, Muldoon J & Currie C (2006). Becoming a health promotingschool: evaluating the process of effective implementation in Scotland.Health Promotion International, 22(1): 65–71.
18. Irving LM & Neumark-Sztainer D (2002). Integrating the prevention ofeating disorders and obesity: feasible or futile? Preventative Medicine, 34:299–309.
19. Kantomaa M, Tammelin T, Demakakos P, Ebeling H & Taanila A (2010).Physical activity, emotional and behavioural problems, maternal educationand self-reported educational performance of adolescents. Health EducationResearch, 25(2): 368–79.
20. Keays J & Allison K (1995). The effects of regular moderate to vigorousphyscial activity on student outcomes: a review. Canadian Journal of PublicHealth, 86(1): 62–65.
21. MacNab AJ, Radziminiski N, Budden H, Kasangaki A, Zavuga R, GagnonFA & Mbabali M (2010). Brighter Smiles Africa: translation of a Canadiancommunity-based health-promoting school program to Uganda. Educationfor Health, 23(2): 1–8.
22. Mann M, Hosman CMH, Schaalma HPS & DeVries NK (2004). Self-esteemin a broad spectrum approach for mental health promotion. Health EducationResearch, 19(4): 357–72.
23. McBean L & Miller G (1999). Enhancing the nutrition of America’s youth.Journal of the American College of Nutrition, 18(6): 563–71.
24. Micha R, Rogers P & Nelson M (2010). The glycaemic potency of breakfastand cognitive function in school children. European Journal of Clinical Nu-trition, 64(9): 948–57.
25. Moag-Stahlberg A (2004). Action for healthy kids: focus on state
9 Benefits of developing a whole-school approach to health promotion
193

teams–current initiatives for sound nutrition and physical activity programsin schools. Topics in Clinical Nutrition, 19(1): 41–44.
26. Mota J, Ribeiro JC, Carvalho J, Santos MP & Martins J (2010). Televisionviewing and changes in body mass index and cardiorespiratory fitness overa two-year period in schoolchildren. Pediatric Exercise Science, 22(2):245–53.
27. Must A & Strauss RS (1999). Risks and consequences of childhood andadolescent obesity. International Journal of Obesity and Related MetabolicDisorders, 23(Suppl. 2): S2–11.
28. O’Dea J (2002). Can body image education programs be harmful to adoles-cent females? Eating Disorders, 10: 1–13.
29. O’Dea J (2005). School-based health education strategies for the improve-ment of body image and prevention of eating problems: an overview of safeand successful interventions. Health Education, 105(1):11–33.
30. O’Dea J & Maloney D (2000). Preventing eating and body image problemsin children and adolescents using the health promoting schools framework.Journal of School Health, 70(1): 18–21.
31. O’Dea J (2006). Self-concept, self-esteem and body weight in adolescent fe-males: a three-year longitudinal study. Journal of Health Psychology, 11(4):599–611.
32. Piran N (2004). Teachers: on ‘being’ (rather than ‘doing’) prevention. Eat-ing Disorders, 12: 1–9.
33. Ross C & Willigen M (1997). Education and the subjective quality of life.Journal of Health and Social Behavior, 38(3): 275–97.
34. Rowe F, Stewart D & Somerset S (2010). Nutrition education: towards awhole-school approach. Health Education, 110(3): 197–208.
35. Sanders C, Field T, Diego M & Kaplan M (2000). Moderate involvementin sports is related to depression levels among adolescents. Adolescence,35(140): 793–97.
36. Taki Y, Hashizume H, Sassa Y, Takeuchi H, Asano M, Asano K &Kawashima R (2010). Breakfast staple types affect brain gray matter volumeand cognitive function in healthy children. PLoS ONE, 5(11): e15213.
37. Tomporowski P, Davis C, Miller P & Naglieri J (2008). Exercise andchildren’s intelligence, cognition, and academic achievement. Educational
A modern epidemic
194

Psychology Review, 20(2): 111–31.38. United Nations. Human Development Report (2003). Millennium develop-
ment goals: a compact among nations to end human poverty. Oxford: UnitedNations Development Programme.
39. United Nations. Human development report (2010). The real wealth ofnations: pathways of human development. New York: United Nations Devel-opment Programme.
40. Whitehead D (2006). The health-promoting school: what role for nursing?Clinical Nursing Roles, 15: 264–71.
41. Whitehead D & Russell G (2004). How effective are health education pro-grammes: resistance, reactance, rationality and risk? Recommendations foreffective practice. International Journal of Nursing Studies, 41: 163–72.
42. World Health Organization (2002). The world health report 2002: reducingrisks, promoting healthy life. Geneva: World Health Organization.
43. World Health Organization (1998). Health promoting schools: a healthystart for living, learning and working. Geneva: World Health Organization.
44. Zhang XW, Liu LQ, Zhang XH, Guo JX, Pan XD, Aldinger C, Yu SH &Jones J (2008). Health-promoting school development in Zhejiang Province,China. Health Promotion International, 23(3): 220–30.
45. Yager Z & O’Dea JA (2005). The role of teachers and other educators in theprevention of eating disorders and child obesity: what are the issues? EatingDisorders, 13:261–78.
46. Yang X, Telama R, Hirvensalo M, Viikari JS & Raitakari OT (2009). Sus-tained participation in youth sport decreases metabolic syndrome in adult-hood. International Journal of Obesity, 33(11): 1219–26.
47. Worsley T (2008). Nutrition promotion: theories and methods, systems andsettings. Crows Nest: Allen & Unwin.
9 Benefits of developing a whole-school approach to health promotion
195

10Health implications of overweightand obesity in children and adoles-
centsShirley Alexander1,2
Overweight and obesity has been associated with a wide range of healthand psychosocial problems that impact negatively on quality and length oflife. The exact relationship between obesity and premature mortality is con-trovertible but there are strong and clear associations between increasingweight and risk of most major chronic diseases. Obesity is now the mostcommon chronic disorder of childhood, and may adversely affect a child’shealth with immediate medical and psychosocial consequences. Howeverthe more significant risk in children and adolescents who are obese is thetendency for obesity to persist in adulthood leading to greater potential forthe early development of chronic disease and reduced life expectancy.
The validity of adverse health implications in relation to excessive body fat inchildhood and adolescence has come into question in recent years, with warn-ings that exaggeration of risk may lead to potential increases in eating disordersor body image problems [1, 2]. However, a substantial body of research existsdemonstrating that both overweight and obesity can have profound effects on thehealth of a child or adolescent [3, 4].
Childhood obesity is a multisystem disease with significant immediate andlong-term medical and psychosocial complications, which were previously as-sociated with onset in adulthood. Ethnic origin, cultural background, geneticsusceptibility, environmental factors and socioeconomic status contribute to therisk of developing obesity-related complications. Furthermore, childhood over-weight and obesity tracks into adolescence and adulthood. A recent systematicreview found that persistence of overweight and obesity was greater with increas-ing weight status and age [5]. For overweight children (under 12 years of age),the risk of becoming an overweight adult ranged from two- to tenfold compared
1 Discipline of Paediatrics and Child Health, Sydney Medical School, University ofSydney.
2 Weight Management Services, Children’s Hospital, Westmead.
196

with normal weight children. For obese children the relative risk for becomingan obese adult was in the higher range. Similarly, for overweight/obese adoles-cents (aged 12 to 18 years), the risks of becoming overweight/obese as an adultwas higher than in younger children, with between 24%–90% of overweight ado-lescents becoming overweight/obese adults. Risk of persistence of obesity is alsogreater if at least one parent of the child or adolescent is obese [6]. Obesity earlyon in life is a predictor of later morbidity and mortality [6]. Given that obesityduring adolescence increases the risk for chronic disease and premature death inadulthood, independently of adult obesity, forecasts of potential decline in lifeexpectancy of current and future generations are perturbing and plausible [7, 8].
The following gives an overview of clinically important medical and psy-chosocial complications associated with childhood and adolescent overweightand obesity. Table 1 provides a summary of these complications.
Table 1. Potential obesity-associated complications among children and adolescents
System Health problems
Psychosocial Social isolation and discrimination, decreased self-esteem, learningdifficulties, body image disorder, bulimia
Medium and long term: poorer social and economic ‘success’, bulimia
Respiratory Obstructive sleep apnoea, asthma, poor exercise tolerance
Orthopaedic Back pain, slipped femoral capital epiphyses, tibia vara, ankle sprains,flat feet
Hepatobiliary Non-alcoholic fatty liver disease, gallstones, gastro-oesophageal reflux
Reproductive Polycystic ovary syndrome, menstrual abnormalities
Cardiovascular Hypertension, adverse lipid profile (low HDL cholesterol, high triglyc-erides, high LDL cholesterol), raised inflammatory markers
Medium and long term: increased risk of hypertension and adverselipid profile in adulthood, increased risk of coronary artery disease inadulthood, left ventricular hypertrophy
Endocrine Hyperinsulinaemia, insulin resistance, impaired glucose tolerance, im-
10 Health implications of overweight and obesity in children and adolescents
197

paired fasting glucose, type 2 diabetes mellitus
Medium and long term: increased risk of type 2 diabetes mellitus andmetabolic syndrome in adulthood
Neurological Benign intracranial hypertension
Skin Acanthosis nigricans, striae, intertrigo
PSYCHOSOCIAL IMPACTThe most prevalent of obesity-related complications are related to psychosocialconsequences, with risk being greater in girls compared to boys, and increasingwith age [6]. Childhood obesity is highly stigmatised, with affected childrenbeing seen by other children as young as four years, as lazy, unhygienic andsocially incompetent [9]. Peer-relationship problems are more prevalent in over-weight and obese children, adolescents and even preschool-aged children [10].Low self-esteem, anxiety and depression, and social isolation are more commonin overweight and obese children and adolescents who may also suffer high levelsof teasing and bullying [9]. Weight-based teasing may further contribute to nega-tive psychosocial behaviour, including disordered eating, depression and suicidalideation [11]. Overweight school-aged children are more likely to be bullied thannormal-weight peers with obese children even more so [12, 13]. Bullying may takethe form of physical aggression (overt bully) or what is termed relational bul-lying (eg withdrawing friendship or spreading lies). Bullying reportedly reducesthroughout adolescence but whether this also occurs in relation to overweight/obesity is undetermined, though Janssen and colleagues report an association be-tween weight status and peer victimisation in 11 to 14 year olds but not in 15 to16 year olds [13]. Differentiation in relation to bullying, gender and weight is alsounclear. There is a suggestion however that overweight/obese boys tend to sufferovert bullying whereas overweight/obese girls are victims of relational bullying[14]. Furthermore, presumably because of increased size in relation to peers thusenabling physical dominance, obese boys are more likely to be overt bullies [12].
Overweight and obese children tend to have reduced athletic ability, poten-tially leading to exclusion from physical activities and contributing to a viciouscycle of reduced opportunity to improve gross motor skills, further exclusion andinactivity [15]. Similarly, weight status may have a negative influence on aca-demic achievement. Poorer school performance may result from a combinationof factors. An increase in absenteeism has been noted in overweight and obese
A modern epidemic
198

children compared with normal-weight peers, and reduced school attendance isassociated with negative academic outcomes [16]. Absenteeism may be as a resultof obesity-related ill-health or from school avoidance, which may be secondary tovictimisation. Furthermore, difficulties with concentration secondary to sleep de-privation from obstructive sleep apnoea (see below) may also contribute to pooracademic performance.
Many obese children have good self-esteem with few or no psychologicalissues. However, a systematic review of cross-sectional, longitudinal and inter-vention studies found strong evidence of a negative impact on global self-esteemand quality of life in obese children and adolescents compared with healthy-weight peers, with no clear differences in age groups [17]. Moreover, in theseverely obese treatment-seeking child, the psychosocial impact of obesity can beprofound, with studies indicating a significant reduction in health-related qualityof life, with impairment equating to that of a child diagnosed with cancer [15,17]. In addition, the psychosocial problems may persist into adulthood, particu-larly for obese adolescent girls. Longitudinal data indicate young obese womenare less likely to marry, have fewer years of higher education, and have higherrates of poverty with lower levels of income compared with normal weight peers[18].
OBSTRUCTIVE SLEEP APONEA (OSA)Obesity is a major risk factor for sleep-disordered breathing, particularly ob-structive sleep apnoea (OSA), a condition characterised by recurrent prolongedepisodes of partial and/or complete upper-airway obstruction resulting in disrup-tion of normal breathing and sleep patterns. The prevalence of OSA in the normalpaediatric population is around 2%; however in children and adolescents withobesity the prevalence is significantly higher, ranging from 13% to 59%, depend-ing on diagnostic criteria, age, ethnicity and pubertal status [19, 20]. For every 1kg/m2 increment in body mass index beyond the mean for age and sex, the riskof OSA appears to increase by 12% [21]. The underlying mechanisms for this in-creased risk are unknown. It is not simply related to enlargement (hypertrophy)of the tonsils, as, even after adeno-tonsillectomy (first line treatment in OSA inchildren and adolescents), residual OSA persists in around 50% of obese childrencompared with only 10%–20% of non-obese children [22].
Untreated OSA is associated with attention and behavioural problems (foundin up to 58% of obese children, compared with 10% of the general paediatricpopulation [23]), cognitive impairment and poor school performance, in part as aresult of disturbed sleep and even recurrent low level hypoxia. Furthermore, OSAhas been associated with cardio-metabolic complications, such as hypertension,ventricular hypertrophy, insulin resistance and abnormal blood lipid profile. The
10 Health implications of overweight and obesity in children and adolescents
199

common pathway appears to be induction of chronic inflammation, the processbeginning in childhood and persisting into adulthood, particularly if the OSA isleft untreated [24].
INSULIN RESISTANCE AND TYPE 2 DIABETESMELLITUS
Childhood obesity is associated with a number of metabolic complications, in-cluding insulin resistance (IR), a pre-diabetic state. The presence of insulinresistance increases the risk of developing type 2 diabetes mellitus and cardio-vascular disease, and also appears to predict future cardiovascular risk [25]. Theprevalence of insulin resistance is difficult to ascertain as there is no single sim-ple reliable marker to determine a universal cut-point. Furthermore ethnicity andage (in particular pubertal status) influence insulin levels. However, studies us-ing a simple blood marker of insulin resistance (homeostasis model of insulinresistance) have found a prevalence of IR ranging from 45%–80% in obese chil-dren, 10%–60% in overweight children and 2%–20% in normal-weight children[26]. Similarly, in the 2004 New South Wales Schools Physical Activity and Nu-trition Study, in which fasting blood from randomly sampled 15-year-old schoolstudents was analysed, raised levels of fasting insulin (another marker of insulinresistance) were found in 68%, 30% and 7%, of obese, overweight and healthy-weight boys respectively, and in 44%, 42% and 11% of obese, overweight andhealthy-weight girls respectively [27]. Increasing body mass index and deep ab-dominal fat are associated with increasing insulin resistance and there is a degreeof heritability with an increased risk of developing insulin resistance in those witha strong family history of type 2 diabetes.
The number of cases of type 2 diabetes has been increasing in the paediatricpopulation over the past couple of decades in parallel with the rise in paediatricobesity. The overall prevalence of children and adolescents with type 2 diabetesis 1%–4%, with rates being much higher in certain racial and ethnic groups,including Native American, African American, Hispanic, Indian sub-continentand Indigenous Australian populations, and lower in northern European countries[28]. Type 2 diabetes in childhood can present with life-threatening ketoacidosis(around 10% of cases) or hyperglycaemic hyperosmolar non-ketotic syndrome(3.7% of cases) [29, 30]. The consequences of type 2 diabetes in young peoplemay be more marked than in adults. Disease progression is normally related todecline in beta-cell function and altered insulin sensitivity. The decline in gly-caemic control following initial diagnosis of type 2 diabetes tends to occur over aperiod of ten to 12 years in adults, but appears to evolve more rapidly in children,within two to four years of diagnosis, with those presenting in diabetic ketoaci-dosis manifesting greater and more rapid decline [31]. In addition, cardiovascular
A modern epidemic
200

fitness is significantly impaired in comparison with obese youth who do not havetype 2 diabetes.
HYPERTENSION, CARDIOVASCULAR DISEASEAND THE METABOLIC SYNDROME
Obesity in childhood, and especially adolescence, is associated with the devel-opment of cardiovascular abnormalities, including atherosclerotic changes in theaorta and cardiac vasculature, and decreased arterial distensibility. Furthermore,obese children are more likely to develop such changes at an earlier age thannormal-weight children [32, 33]. Both left ventricular hypertrophy and arterial hy-pertension are significantly more prevalent in obese children and adolescents,with the prevalence of hypertension increasing progressively with body mass in-dex. Adolescents with obesity are three times more likely to be hypertensive thanthose in lower weight ranges [34, 35]. Arterial hypertension is a highly preva-lent cardiovascular risk factor in young obese individuals and is predictive ofsustained hypertension and end-organ damage in early adulthood [36]. In the pre-viously mentioned 2004 NSW Schools Physical Activity and Nutrition Survey,high blood pressure was found in 37%, 36% and 14% of obese, overweight andhealthy-weight boys, respectively, and in 22%, 7% and 5% of obese, overweightand healthly-weight girls, respectively [27].
The clustering of cardiovascular risk factors (insulin resistance, hyperten-sion, abdominal obesity and dyslipidaemia – also termed the metabolic syn-drome) are predictors of adult cardiovascular disease. Clustering of two or morecardiovascular risk factors is more prevalent in obese children and adolescents,and, depending on the definition used, 1.2%– 22.6% of children and adolescentshave the metabolic syndrome, with rates ranging from 30% up to 60% observedin those who are overweight or obese [36, 37, 38]. Moreover, mid-childhood obe-sity is associated with a sevenfold increased chance of developing cardiovasculardisease risk factors in adolescence [39].
DYSLIPIDAEMIADyslipidaemia, most commonly raised serum concentrations of low-densitylipoprotein (LDL) cholesterol and triglycerides and reduced concentrations ofhigh-density lipoprotein (HDL) cholesterol, occurs in overweight and obese chil-dren and adolescents, particularly those who have abdominal obesity. Up to 50 %of obese adolescents may have some degree of dyslipidaemia [40, 41].
10 Health implications of overweight and obesity in children and adolescents
201

FATTY LIVER DISEASEPaediatric obesity is associated with a spectrum of liver abnormalities known asnon-alcoholic fatty liver disease (NAFLD).The disease ranges from simple fattyinfiltration of the liver (hepatic steatosis), to fatty liver with inflammation andfibrosis (non-alcoholic steatohepatitis). NAFLD is the most common paediatricliver abnormality, related to the increasing childhood obesity epidemic and isassociated with the metabolic syndrome (central obesity, hypertension, dyslipi-demia and insulin resistance). The true prevalence and severity of NAFLD isunknown because of problems with standardisation of disease definition, diag-nostic modalities and variations by ethnicity. However, prevalence ranges from3%–77% in obese children and adolescents have been quoted [42]. Additionally,the natural history of paediatric NAFLD is not established as long-term stud-ies are lacking. Current evidence suggests that a minority of adolescents withNAFLD develop progressive liver disease, leading to liver failure or transplanta-tion, and this is most likely in patients with advanced fibrosis at baseline [43].
MUSCULOSKELETAL COMPLICATIONSThere is increased awareness that child and adolescent obesity may not only leadto major orthopaedic complications, such as slipped capital femoral epiphyses(where the developing head of the femur shifts backwards resulting in a weak-ened hip joint) and tibia vara (Blount disease, progressive bowing of the legs),but also a number of other issues involving the whole of the musculoskeletal sys-tem. Compared with normal-weight peers, obese children and adolescents havea higher incidence of musculoskeletal pain (eg back pain, lower limb pain es-pecially knees and feet), and genu valgum (knocked knees), greater hinderanceto lower limb functioning and gait, and increased risk of fractures (as obesechildren generally have reduced bone mass after adjusting for size and often vit-amin D deficiency as well) [44]. Slipped capital femoral epiphyses, a debilitatingcondition of the hip joint requiring surgical intervention, is significantly associ-ated with obesity: up to 80% of cases of slipped capital femoral epiphyses areassociated with obesity. Unfortunately, weight loss does not resolve the condi-tion, although it helps alleviate the severity and potential for developing bilateraldisease. Likewise Blounts disease is strongly associated with increased weightwhereby weight loss alleviates but does not resolve the condition [44].
POLYCYSTIC OVARY SYNDROMEObese adolescent girls are at risk of polycystic ovary syndrome (PCOS), a syn-
A modern epidemic
202

drome of elevated androgen levels and ovulatory dysfunction. The prevalenceappears to be increasing. It is associated with obesity, insulin resistance, andother elements of the metabolic syndrome. It should be suspected in girls, withhirsutism or severe acne and/or menstrual irregularity, especially if they haveobesity and insulin resistance [45]. There is mounting evidence that females withPCOS are at increased long-term risk of endometrial cancer (if PCOS is un-treated), cardiovascular and metabolic complications later in adulthood. PCOS isalso the most common cause for infertility.
IDIOPATHIC INTRACRANIAL HYPERTENSIONIdiopathic intracranial hypertension (also known as pseudotumour cerebri), ismore prevalent in obese children and adolescents, although more so in obese ado-lescents rather than younger children [46]. It is a rare condition which can causesevere visual impairment or blindness and presents with headaches and a rangeof potential symptoms.
SKIN PROBLEMSObesity is associated with a number of skin manifestations, including acanthosisnigricans, in association with insulin resistance. Acanthosis nigricans appears ashyperpigmented, velvety-thickened skin most often seen on the neck, in the ax-illae, groin, knuckles or knees. It may be mistaken for a dirty neck and maybe a cause of embarrassment in more marked cases. Treatment of the insulinresistance, either by weight loss or pharmacologically, results in reduction or res-olution of the manifestation. Other skin complications associated with obesityinclude striae (stretch marks) and a tendency for fungal infections (intertrigo) inareas where moisture is trapped, such as in skin folds.
OTHER MEDICAL COMPLICATIONSThe above list of obesity-associated complications is not exhaustive. Additionalcomplications such as gastro-oesophageal reflux disease, constipation, daytimewetting and nocturnal enuresis (bedwetting), nutritional deficiencies, gallstoneformation and bulimia are all problems that are either exacerbated by the associa-tion of obesity or have an increased prevalence in overweight and obese childrenand adolescents. Moreover, seemingly less major difficulties, such as an inabilityto attend to personal hygiene or reach to tie one’s shoelaces, can result from be-ing obese and have a major impact on quality of life.
10 Health implications of overweight and obesity in children and adolescents
203

CONCLUSIONChildhood and adolescent obesity is a multifactorial, multisystem disease, theprevalence of which has been rising exponentially in recent decades. A consid-erable body of evidence exists highlighting the significant adverse health-relatedimpacts of childhood and adolescent obesity. Recognised obesity-related com-plications range from psychosocial issues, these being the most prevalent, tomedical ailments such as insulin resistance, hypertension and non-alcoholic fattyliver disease. Importantly, the adverse effects may not only have immediate im-plications but also can affect health in the longer term, independent of adultobesity. As childhood obesity tends to persist into adulthood, the risk of obesity-related morbidity and mortality is further increased. However, a reduction in totalbody fat has the potential to alleviate or resolve the adverse health outcomes, thusappropriate assessment and management of such children and adolescents is war-ranted.
References1. O’Dea JA (2008). Gender, ethnicity, culture and social class influences on
childhood obesity among Australian schoolchildren: implications for treat-ment, prevention and community education. Health and Social Care in theCommunity, 16(3): 282–90.
2. The Telegraph (April 2008). ‘Obesity crusade’ drives children to anorexia[Online]. Available: www.telegraph.co.uk/news/uknews/1896136/Obesity-crusade-drives-children-to-anorexia.html [Accessed September 2011].
3. Bell LM, Byrne S, Thompson A, Ratnam N, Blair E, Bulsara M, Jones TW& Davis EA (2007). Increasing body mass index z-score is continuously as-sociated with complications of overweight in children, even in the healthyweight range. The Journal of Clinical Endocrinology and Metabolism, 92(2):517–22.
4. Denney-Wilson E, Hardy LL, Dobbins T, Okely AD & Baur LA (2008).Body mass index, waist circumference, and chronic disease risk factorsin Australian adolescents. Archives of Pediatrics & Adolescent Medicine,162(6): 566–73.
5. Singh SA, Mulder C, Twisk JWR, van Mechelen W & Chinapaw MJM(2008). Tracking of childhood overweight into adulthood: a systematic re-view of the literature. Obesity Reviews, 9(5): 474–88.
A modern epidemic
204

6. Reilly JJ, Methven E, McDowell ZC, Hacking B, Alexander D, Stewart L &Kelnar CJH (2003). Health consequences of obesity. Archives of Disease inChildhood, 88: 748–52.
7. Bjorge T, Engeland A, Tverdal A & Smith GD (2008). Body mass indexin adolescence in relation to cause-specific mortality: a follow-up of 23,000Norwegian adolescents. American Journal of Epidemiology, 168: 30–37.
8. Olshansky SJ, Passaro DJ, Hershow RC, Layden J, Carnes BA, Brody J,Hayflick L, Butler RN, Allison DB & Ludwig DS (2005). A potential declinein life expectancy in the United States in the 21st century. The New EnglandJournal of Medicine, 352(11): 1138–45.
9. Rees R, Oliver K, Woodman J & Thomas J (2011). The views of youngchildren in the UK about obesity, body size, shape and weight: a systematicreview. BMC Public Health, 11: 188.
10. Boneberger A, von Kries R, Milde-Busch A, Bolte G, Rochat MK &Ruckinger S for the GME study group (2009). Association between peerrelationship problems and childhood overweight/obesity. Acta Paediatrica,98(12): 1950–55.
11. Eisenberg ME, Neumark-Stanzer D & Story M (2003). Associations ofweight-based teasing and emotional wellbeing among adolescents. Archivesof Pediatrics & Adolescent Medicine, 157(8): 733–38.
12. Griffiths LJ, Wolke D, Page AS & Horwood JP, for the ALSPAC Study(2006). Obesity and bullying: different effects for boys and girls. Archives ofDisease in Childhood, 91(2): 121–25.
13. Janssen I, Craig WM, Boyce WF & Pickett W (2004). Associations betweenoverweight and obesity with bullying in school-aged children. Pediatrics,113(5): 1187–94.
14. Pearce MJ, Boergers J & Prinstein MJ (2002). Adolescent obesity, overt andrelational peer victimization, and romantic relationships. Obesity Research,10: 386–93.
15. Schwimmer JB, Burwinkle TM & Varni JW (2003). Health-related qualityof life of severely obese children and adolescents. Journal of the AmericanMedical Association, 289(14): 1813–19.
16. Geier AB, Foster GD, Womble LG, McLauglin J, Borradaile KE, NachmaniJ, Sherman S, Kumanyika S & Shults J (2007). The relationship between
10 Health implications of overweight and obesity in children and adolescents
205

relative weight and school attendance among elementary schoolchildren.Obesity, 15: 2157–61.
17. Griffiths LJ, Parsons TJ & Hill AJ (2010). Self-esteem and quality of life inobese children and adolescents: a systematice review. International Journalof Pediatric Obesity, 5(4): 282–304.
18. Viner RM & Cole TJ (2005). Adult socioeconomic, educational, social andpsychological outcomes of childhood obesity: a national birth cohort study.British Medical Journal, 330(7504): 1354–57.
19. Arens R, Muzumdar H (2010). Childhood obesity and obstructive sleep ap-nea syndrome. Journal of Applied Physiology, 108(2): 436–44.
20. Verhulst SL, Van Gaal L, De Backer W & Desager K (2008).The preva-lence, anatomical correlates and treatment of sleep-disordered breathing inobese children and adolescents. Sleep Medicine Reviews, 12(5): 339–46.
21. Redline S, Tishler PV, Schluchter M, Aylor J, Clark K & Graham G (1999).Risk factors for sleep-disordered breathing in children: associations withobesity, race, and respiratory problems. American Journal of Respiratoryand Critical Care Medicine, 159(5): 1527–32.
22. Bhattacharjee R, Kheirandish-Gozal L, Spruyt K, Mitchell RB, PromchiarakJ, Simakajornboon N, Kaditis AG, Splaingard D, Splaingard M, Brooks LJ,Marcus CL, Sin S, Arens R, Verhulst SL & Gozal D (2010). Adenotonsillec-tomy outcomes in treatment of OSA in children: a multicenter retrospectivestudy. American Journal of Respiratory and Critical Care Medicine, 182(5):676–83.
23. Agranat-Meged AN, Deitcher C, Goldzweig G, Leibson L, Stein M &Galili-Weisstub E (2005). Childhood obesity and attention deficit/hyperac-tivity disorder: a newly described comorbidity in obese hospitalized children.International Journal of Eating Disorders, 37(4): 357–59.
24. Bhattacharjee R, Kim J, Kheirandish-Gozal L & Gozal D (2011). Obesityand obstructive sleep apnea syndrome in children: a tale of inflammatorycascades. Pediatric Pulmonology, 46(4): 313–23.
25. Sinaiko AR, Steinberger J, Moran A, Hong CP, Pineas RJ & Jacobs DR(2006). Influence of insulin resistance and body mass index at age 13 on sys-tolic blood pressure, triglycerides, and high-density lipoprotein cholesterol atage 19. Hypertension, 48(4): 730–36.
A modern epidemic
206

26. Nelson RA & Bremer AA (2010). Insulin resistance and metabolic syn-drome in the pediatric population. Metabolic Syndrome and Related Disor-ders, 8: 1–14.
27. Booth M, Okely AD, Denney-Wilson E, Hardy L, Yang B & Dobbins T(2006). NSW Schools Physical Activity and Nutrition Survey (SPANS) 2004.Full report. Sydney: NSW Department of Health.
28. L’Allemand-Jander D (2010). Clinical diagnosis of metabolic and cardio-vascular risks in overweight children: early development of chronic diseasesin the obese child. International Journal of Obesity, 34: S32–36.
29. Rewers A, Klingensmith G, Davis C, Petitti DB, Pihoker C, Rodriguez B,Schwartz ID, Imperatore G, Williams D, Dolan LM & Dabelea D (2008).Presence of diabetic ketoacidosis at diagnosis of diabetes mellitus in youth:the Search for Diabetes in Youth Study. Pediatrics, 121(5): e1258–66.
30. Fourtner SH, Weinzimer SA & Levitt Katz LE (2005). Hyperglycemic hy-perosmolar non-ketotic syndrome in children with type 2 diabetes. PediatricDiabetes, 6(3): 129–35.
31. Levitt Katz LE, Magge SN, Hernandez ML, Murphy KM, McKnight HM &Lipman T (2011). Glycemic control in youth with type 2 diabetes declines asearly as two years after diagnosis. The Journal of Pediatrics, 158(1): 106–11.
32. Whincup PH, Gilg JA, Donald AE, Katterhorn M, Oliver C, Cook DG& Deanfield JE (2005). Arterial distensibility in adolescents: the influenceof adiposity, the metabolic syndrome, and classic risk factors. Circulation,112(12): 178–97.
33. Mittelman SD, Gilsanz P, Mo AO, Wood J, Dorey F & Gilsanz V (2010).Adiposity predicts carotid intima-media thickness in healthy children andadolescents. The Journal of Pediatrics, 156(4): 592–97.
34. Maggio AB, Aggoun Y, Marchand LM, Martin XE, Hermann F, Beghetti M& Farpour-Lambert NJ (2008). Associations among obesity, blood pressure,and left ventricular mass. The Journal of Pediatrics, 152(4): 489–93.
35. Movahed M, Bates S, Strootman D & Sattur S (2011). Obesity in ado-lescence is associated with left ventricular hypertrophy and hypertension.Echocardiography, 28(2): 150–53.
36. L’Allemand D, Wiegand S, Reinehr T, Müller J, Wabitsch M, Widhalm K& Holl R on behalf of the APV-Study Group (2008). Cardiovascular risk in
10 Health implications of overweight and obesity in children and adolescents
207

26,008 European overweight children as established by a multicenter data-base. Obesity, 16(7): 1672–79.
37. de Ferranti SD, Gauvreau K, Ludwig DS, Neufeld EJ, Newburger JW &Rafai N (2004). Prevalence of the metabolic syndrome in American adoles-cents: findings from the Third National Health and Nutrition ExaminationSurvey. Circulation, 110: 2494–97.
38. Tailor AM, Peeters PHM, Norat T, Paolo Vineis & Romaguera D (2010).An update on the prevalence of the metabolic syndrome in children and ado-lescents. International Journal of Pediatric Obesityity, 5(3): 202–13.
39. Garnett SP, Baur LA, Srinivasan S, Lee JW & Cowell CT (2007). Bodymass index and waist circumference in midchildhood and adverse cardio-vascular disease risk clustering in adolescence. The American Journal ofClinical Nutrition, 86(3): 549–55.
40. Harel Z, Riggs S, Vaz R, Flanagan P & Harel D (2010). Isolated low HDLcholesterol emerges as the most common lipid abnormality among obeseadolescents. Clinical Pediatrics (Phila), 49(1): 29–34.
41. NSW Centre for Overweight and Obesity. NSW Schools Physical Activityand Nutrition Survey (SPANS) (2004). [Online]. Available:www.health.nsw.gov.au/pubs/2006/pdf/spans_full.pdf [Accessed 19 Octo-ber 2011].
42. Widhalm K & Ghods E (2010). Nonalcoholic fatty liver disease: a challengefor paediatricians. International Journal of Obesity, 34: 1451–67.
43. Feldstein AE, Charatcharoenwitthaya P, Treeprasertsuk S, Benson JT, En-ders FB & Angulo P (2009). The natural history of non-alcoholic fattyliver disease in children: a follow-up study for up to 20 years. Gut, 58(11):1538–44.
44. Chan G & Chen CT (2009). Musculoskeletal effects of obesity. CurrentOpinion in Pediatrics, 21(1): 65–70.
45. Hassan A & Gordon CM (2007). Polycystic ovary syndrome update in ado-lescence. Current Opinion in Pediatrics, 19(4): 389–97.
46. Genizi J, Lahat E, Zelnik N Mahajnah M, Ravid S & Shahar E (2007).Childhood-onset idiopathic intracranial hypertension: relation of sex andobesity. Pediatric Neurology, 36(4): 247–49.
A modern epidemic
208

11Child and adolescent obesity in Asia
Mu Li1 and Michael J Dibley
Childhood obesity is a rapidly growing public health problem in developingcountries. World Health Organization estimated that in 2010, of 43 millionoverweight/obese children worldwide, about 35 million of them were livingin developing countries. In this chapter we will present case studies onwhat is happening in Vietnam, Indonesia, Thailand and China, the devel-oping countries in the Southeast and East Asia that are undergoing rapidsocioeconomic development and urbanisation. We will also explore thepossibilities of what the governments and communities can do to addressthe emerging childhood obesity epidemic in these countries.
Although high rates of childhood obesity have been evident for some time acrossNorth America, Europe, and parts of the Western Pacific, including Australia [1],in recent years lower- and middle-income countries have joined the trend. As aresult, the absolute number of children who are overweight or obese is now muchhigher in developing than developed countries [2]. At the end of 2010, 43 millionpreschool-aged children were overweight or obese – a prevalence of 6.7%, upfrom 4.2% in 1990 globally [3]. The World Health Organization (WHO) has de-clared childhood obesity ‘one of the most serious public health challenges of the21st century’ [4]. Overweight and obesity in childhood are not simply ‘shruggedoff’ in adulthood. Longitudinal studies show that when acquired early, over-weight and obesity can have serious adverse effects in later life, such as metabolicand cardiovascular risks [5, 6, 7]. Importantly, obese children have a 25%–50%risk of progressing to obesity in adulthood, and this risk may be as high as 78%in obese adolescents [5].
This chapter reports on the background of a Regional Collaboration forChildhood Obesity Prevention Research program, funded by AusAID (the Aus-tralian Government’s Overseas Aid Program), with participants from China,
1 Sydney School of Public Health, University of Sydney.
209

Vietnam, Indonesia and Thailand. These countries have enjoyed rapid economicgrowth in recent decades (Table 1), with increased gross national income andfamily disposable income which are accompanied by a shift from under- to over-nutrition [8, 9, 10, 11, 12]. Childhood obesity has become a major public concernin these countries. In this chapter we will review prevalence and trend data fromthese four countries, discuss the similarities and differences, and highlight so-cial, behavioural and environmental factors associated with the rapid growth ofchildhood obesity. We will also explore intervention strategies for the East andSoutheast Asia region.
Table 1. Income (GNI per capita) and level of urbanisation by country*
Thailand China Indonesia Vietnam
Income level Upper Mid-dle
Upper Mid-dle
Lower Mid-dle
Lower Mid-dle
GNI per capita 4210 U$ 4260 U$ 2580 U$ 1100 U$
2009 Urban population(%)
34 44 53 28
* Based on World Bank 2010 data
DEFINITIONS OF CHILD AND ADOLESCENTOVERWEIGHT AND OBESITY
Unlike the situation in adulthood, body mass index (BMI; weight/height2) dif-fers, physiologically, by age, sex and development stage in children and adoles-cents. Thus, BMI rises in the first year, falls during preschool years, reaching itslowest point between four to seven years, before rising once more into adoles-cence and adulthood. Because of this, the standard definition of overweight andobesity in adulthood cannot be used when describing the paediatric population.Several different ways of defining child and adolescent overweight and obesityare commonly used (Table 2), with no one universal consensus definition hav-ing been agreed upon. Some of the currently used international definitions aredescribed below. They are mainly based upon BMI, but have used somewhat dif-ferent approaches for defining the cut-off points for healthy weight, overweightand obesity.
Table 2 Different definitions of child and adolescent overweight and obesity
International Obe-sity Task Force
WorldHealth Or-
World HealthOrganization
World Health Orga-nization
A modern epidemic
210
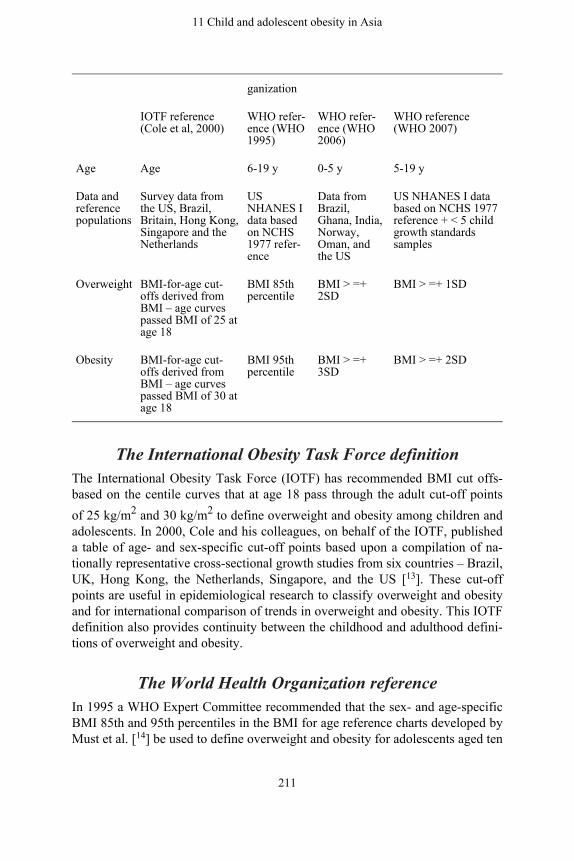
ganization
IOTF reference(Cole et al, 2000)
WHO refer-ence (WHO1995)
WHO refer-ence (WHO2006)
WHO reference(WHO 2007)
Age Age 6-19 y 0-5 y 5-19 y
Data andreferencepopulations
Survey data fromthe US, Brazil,Britain, Hong Kong,Singapore and theNetherlands
USNHANES Idata basedon NCHS1977 refer-ence
Data fromBrazil,Ghana, India,Norway,Oman, andthe US
US NHANES I databased on NCHS 1977reference + < 5 childgrowth standardssamples
Overweight BMI-for-age cut-offs derived fromBMI – age curvespassed BMI of 25 atage 18
BMI 85thpercentile
BMI > =+2SD
BMI > =+ 1SD
Obesity BMI-for-age cut-offs derived fromBMI – age curvespassed BMI of 30 atage 18
BMI 95thpercentile
BMI > =+3SD
BMI > =+ 2SD
The International Obesity Task Force definitionThe International Obesity Task Force (IOTF) has recommended BMI cut offs-based on the centile curves that at age 18 pass through the adult cut-off pointsof 25 kg/m2 and 30 kg/m2 to define overweight and obesity among children andadolescents. In 2000, Cole and his colleagues, on behalf of the IOTF, publisheda table of age- and sex-specific cut-off points based upon a compilation of na-tionally representative cross-sectional growth studies from six countries – Brazil,UK, Hong Kong, the Netherlands, Singapore, and the US [13]. These cut-offpoints are useful in epidemiological research to classify overweight and obesityand for international comparison of trends in overweight and obesity. This IOTFdefinition also provides continuity between the childhood and adulthood defini-tions of overweight and obesity.
The World Health Organization referenceIn 1995 a WHO Expert Committee recommended that the sex- and age-specificBMI 85th and 95th percentiles in the BMI for age reference charts developed byMust et al. [14] be used to define overweight and obesity for adolescents aged ten
11 Child and adolescent obesity in Asia
211

to 19 years, and that obesity in children aged less than ten years be defined asweight-for-height z-score >2 [15]. This definition has now been superseded, al-though published papers may refer to it.
The WHO Child Growth Standard and the WHO growthreference for school-aged children and adolescents
The WHO has subsequently recommended two other approaches to definingoverweight and obesity in the paediatric population, depending upon the age ofthe child. For children aged from birth to 59 months, the new WHO Child GrowthStandard for children [16] is based on the WHO Multicentre Growth ReferenceStudy which looked at the growth of healthy children from Brazil, Ghana, India,Norway, Oman, and the US. Overweight and obesity are defined as the pro-portion of children with BMI-for-age values >2 standard deviations (SDs) andgreater than 3 SDs, respectively, from the WHO Child Growth Standard median[17].
For five- to 19-year-olds, the WHO growth reference (2007) is a reconstruc-tion of the 1977 National Center for Health Statistics/WHO reference [18, 19].Overweight, obesity and severe obesity are defined as the proportion of childrenwith BMI-for-age values >1 SDs, >2 SDs and >3 SDs respectively, from theWorld Health Organization Growth Reference median [19].
Thus, there remains considerable variation in the approaches to definingoverweight and obesity in the paediatric age group. And, as you will see below,other definitions are also being used in individual countries. This highlights theimportance of knowing what definition is being used, especially if comparisonsare made between different countries or different studies. Importantly, whenlooking at trends over time, then it is important to use the same definition at thedifferent time points.
WHAT’S HAPPENING? CHILDHOOD OBESITYSITUATION BY COUNTRY
THAILAND: CHILDHOOD OBESITY PREVALENCEAND TRENDS
There have been two nationally representative surveys for obesity in childrenaged two to 12 years in Thailand, the Second National Health Examination Sur-vey in 1997 and the National Child Health Survey in 2001 [20]. Over these fouryears, there was a substantial rise in obesity prevalence, as defined using the Thaigrowth reference (developed in 1995 and based on weight-for-height percentile)
A modern epidemic
212

[21]. Obesity prevalence in preschool-aged children (two to five years) increasedfrom 5.8% in 1997 to 7.9% in 2001. It increased to a lesser degree in childrenaged six to 12 years: from 5.8% to 6.7% [20]. Obesity was much more prevalentin children living in urban areas.
A recent nationwide survey involving 47 389 grade six primary school chil-dren in urban settings found that 16.7% children were overweight or obese [21].The results were echoed by a study of preschool-aged children (four to six years)in central Thailand. Using the Thai growth reference, the prevalence of over-weight (defined as BMI between the 90th and 97th percentile) was 16.1% in theurban group and 8.7% in rural group, and the prevalence of obesity (BMI greaterthan the 97th percentile) was 22.7% in the urban group compared with 7.4% inthe rural group [22].
The prevalence of childhood obesity appears to be relative to the level of de-velopment of the region. For example, the prevalence of childhood overweight(defined this time as weight-for-height z-score greater than 2 SDs) in seven-to nine-year-old school children in Knon Kaen Municipality, in northeast Thai-land, was 10.8% [23], compared with 15.6% in children (six to 12 years old; thistime defined as BMI >85th percentile for age and sex) from Hat Yai, in south-ern Thailand, an economically advanced metropolitan region [24]. It is noticeable,however, that different references were applied in these studies, and hence directcomparisons cannot be made.
In a five-year follow-up study tracking overweight from childhood to adoles-cence in Hat Yai, Mo-Suwan et al. [25] found that children who were overweightin childhood were more likely to be overweight as adolescents. Overall 11.8%children remained overweight, with a higher proportion of boys (13.9%) thangirls (10.1%).
Social, behavioural and environmental factors associatedwith childhood obesity
Several studies have examined the social determinants of childhood obesity inThailand. Socioeconomic status (SES), as measured by parents’ education levelsand monthly household income levels, are positively associated with increasedrisk [22, 25, 26]. Thus, children of parents with high education levels or highhousehold incomes are more likely to have a high BMI. Other factors such as ahigh BMI for father or mother, a family history of obesity and physically inactiv-ity are also associated with increased child BMI [25].
11 Child and adolescent obesity in Asia
213

CHINA: CHILDHOOD OBESITY PREVALENCEAND TRENDS
School-aged children and adolescentsIn China, there are two nationally representative data collection systems. TheChina National Survey on Students’ Constitution and Health (CNSSCH) is a na-tional initiative by the Ministries of Education, Health, Science and Technology,State National Affairs and State Sports Administration. It started in 1985 and isrepeated every five years for school-aged children and adolescents (aged seven to18 years). The available data from the 1985, 1995, 2000 and 2005 surveys showthat the prevalence of overweight and obesity (using the Group of China ObesityTask Force definition, BMI 85th to 95th and BMI greater than 95th percentile)[27] has steadily increased from 1985. The changes were particularly remarkablein seven- to 12-year-old boys from urban settings, with the prevalence of over-weight increasing dramatically from 1.7% to 25%, and that of obesity from 0.1%to 11.7%, between 1985 and 2005 [28]. A geographic gradient has also emergedfrom the CNSSCH data. The prevalence of overweight and obesity is highest inchildren from the most advanced metropolitan centres such as Beijing and Shang-hai and other coastal large cities, followed by the medium/small coastal cities,then the inland big cities, and finally the medium/small inland cities [29]. Thissuggests that the childhood obesity epidemic in China is largely driven by eco-nomic and social development, and it is still at its early stage. The China NationalNutrition and Health Surveys (CNNHS) have been carried out every ten yearssince 1982. The 1982, 1992 and 2002 data (analysed using the IOTF definitionfor obesity) for school-aged children (aged seven to 17 years) revealed very simi-lar results to the CNSSCH. The prevalence of childhood obesity was low in early1980, but there was a threefold increase over the subsequent 20 years [30].
The China Health and Nutrition Survey (CHNS) is a longitudinal subnationalstudy carried out in nine provinces in the eastern part of China since 1991 withthe most recent data being from 2006. The trend data show that the mean BMIof seven- to 17-year-old Chinese children and adolescents has increased steadilyfrom 17.4 kg/m2 (95% CI: 17.3, 17.5) in 1991 to 18.3 kg/m2 (95% CI: 18.1, 18.5)in 2006, after adjusting for age, sex and urban/rural residence. There was a corre-sponding increase in overweight and obesity prevalence (IOTF definition) duringthe same period, from 5.2% to 13.2% [31]. The results from this dataset werehigher than those obtained from the CNNHS, despite the same reference cut-offpoints being used. One of the explanations is that this is not a nationally represen-tative sample, and that the economic development in the provinces in the easternpart of China sampled is relatively advanced.
A number of provincial and municipal levels studies have also shown similarpatterns. Based on analysis of the CNSSCH data, the overall prevalence of over-
A modern epidemic
214

weight and obesity in seven- to 18-year-olds from Shandong Province, in easternChina, increased from 2.2% in 1985 to 31.2% in 2010 for boys and from 2.3%to 19.1% for girls, using the Chinese weight-for-height criteria [32]. In a cross-sectional survey conducted in 2004 [33] among 1800 junior high school students(aged 11 to 17 years) in Xi’an Metropolitan area, in northwest China, the overalloverweight and obesity prevalence (using the IOTF definition) was 16.3%, witha significant sex difference: 19.4% for boys and 13.2% for girls. The prevalencewas higher in children living in urban area and from rich families.
Preschool-aged children (under seven years)Although there are no national representative data for assessing childhood obesityin younger children, the nine cities epidemiological surveys, carried out by theCoordinating Group of Nine Cities Study on the Physical Growth and Develop-ment of Children in 1986, 1996 and 2006, provide trend data on children underseven years of age [34].The nine cities are Beijing, Harbin and Xi’an in the north,Shanghai, Nanjing and Wuhan in the central region and Guangzhou, Fuzhou andKunming in the south. The 2006 survey included 112 945 children. Using the Na-tional Centre for Health Statistics/WHO reference (weight-for-height >10% and>20%), the overall prevalence of overweight and obesity was 6.3% (6.6% forboys and 5.9% for girls) and 3.2% (3.8% for boys and 2.5% for girls) respectively[34]. Compared with the 1986 results, the prevalence of overweight nearly tripledin 20 years, with an average annual increase of 6.9% [34].
Another subnational survey began in 1986 in children aged zero to six yearscovering 11 cities in the east, central and southern regions. There have been twosubsequent surveys with a ten-year interval. The most recent survey was in 2006,with total sample size of 84 766 [35]. The prevalence of overweight and obesity(WHO Child Growth Standard; BMI greater than 1 SD and greater than 2 SD)was 19.8% (22.2% for boys and 17% for girls) and 7.2% (9.9% for boys and 5.3%for girls), respectively. Due to the different definitions used, the data for similarage groups in the two 2006 surveys are not comparable. In fact, there was a three-fold difference for the overweight prevalence and more than twofold differencefor obesity prevalence. Nevertheless, both surveys have consistently shown thatoverweight and obesity prevalence is higher in boys than in girls.
A similar sex difference was found in Shanghai; the obesity rate (NationalCentre for Health Statistics /WHO reference, with weight-for-height greater than20%) in 5188 kindergarten children (aged from three to six years) was 8.3%, with10.3% for boys and 7.1% for girls [36].
In a large sample study involving 262 738 preschool children (aged from 3.5to 6.4 years) in three provinces (Hebei in the north, Zhejiang and Jiangsu in thesouth), the overall prevalence of overweight and obesity (IOTF definition) was7.4% [37]. However, unlike the findings in the two large scale subnational surveys
11 Child and adolescent obesity in Asia
215

described above, the prevalence of overweight/obesity was higher for girls (7.8%,95% CI: 7.1, 8.0) than for boys (6.9%, 95% CI: 6.8, 7.1). An interesting findingfrom this survey is that the children residing in rural areas, both north and south,had a relatively higher risk of being overweight/obese compared with childrenfrom urban settings in the south (adjusted relative risk = 2.58, 95% CI: 2.43, 2.73;and relative risk = 1.15, 95% CI: 1.09, 1.21; respectively). The possible explana-tions of the difference of the prevalence of overweight/obesity between childrenfrom rural areas of north and south include differences in genetic factors and di-etary habits. Furthermore, Zhejiang and Jiangsu are two of the most developedcoastal provinces. The small difference in overweight/obese prevalence betweenrural and urban children from the south may be attributed to the narrowing gapof living standards and lifestyle between rural and urban population in the moreeconomically advanced areas in China.
Social, behavioural and environmental factors associatedwith childhood obesity
In general, due to the disparities in economic and social development, childhoodobesity prevalence is higher in urban than rural settings [28, 29, 38]. A studyfrom Xi’an reported that adolescents from wealthier families, or whose parentswere overweight or obese, or those who had permission to purchase snacks withpocket money, were 1.7, 1.8 and 1.5 times more likely to be overweight/obese,respectively, than their counterparts [38]. Risk factors identified in boys includedconsuming sweetened soft drink four or more times/week (odds ratio [OR] = 1.6)or more than 1100 ml/day (OR = 1.9) and higher levels of energy consumption(medium to high-energy intake OR = 1.5 and 1.9, respectively) [38, 39]. Inter-estingly, having a mother with tertiary education was associated with a higherprevalence of overweight/obesity in boys (OR = 2.2) but not in girls [38]. Havingbreakfast outside the family home was a stronger dietary risk factor in girls only(OR = 1.7, 95% CI 1.1–2.3) [39].
In the 2004 study on obesity and metabolic syndrome among 21 198 children(two to 18-year-old) in Beijing [40], obesity (after adjustment for age, sex, pubertyand residential area) was significantly associated with a range of factors. Theseinclude: being physically inactive (less than one hour/day physical activity, in-cluding physical education class, physical activities after school, walking or bikeriding to and from school), spending two or more hours per day watching TV, onthe computer or playing video games, snacking frequently (three or more times/week), consuming Western fast foods or having reduced hours of sleep (<10hours for six- to 12-year-olds and <8.5 hours for 13- to 18-year-olds). However,there was no significant association between obesity and consumption of sweet-ened beverage [40].
The reported risk factors from the nine cities epidemiological survey and
A modern epidemic
216

other studies for obesity in preschool-aged children (birth to seven years) in-cluded having a good appetite and fast eating [34], high parental BMI or parentaloverweight [34, 41], maternal overweight [41], watching more than two hours aday of TV [34, 41], lower maternal education level [41, 42] and a lower paternaleducation level [42]. In infants and young children (aged one to 35 months), ahigher total energy intake, formula feeding in the first four months and introduc-tion to semi-solids before four months of age were significantly associated withoverweight [42]. Other factors such as caesarean section birth [34], birth weightmore than 3000 grams [43], sleeping less than 11 hours/night [44] were associatedwith overweight or obesity in children in this age group.
INDONESIA: CHILDHOOD OBESITY PREVALENCEAND TRENDS
Data from the National Basic Health Research in 2007 showed that overnutritionexisted among all age groups in Indonesia [12]. In children under five years, 12%were overweight (WHO Child Growth Standard BMI >2 SD), which was veryclose to the prevalence of undernutrition in the same age group (14 %, WHOweight-for-height less than –2 SD). In six to 14-year-olds, the prevalence of obe-sity (WHO Growth Reference BMI greater than 2 SD) was 10% and 6% for boysand girls, respectively. In the 15 years and above age group, the combined over-weight and obesity (defined as BMI between 25 to 27 kg/m2 and >27 kg/m2
respectively) was 19%. As found in other countries, in the six- to 14-year-old agegroup, the prevalence of overweight was higher in children living in urban areasthan in their rural counterparts: 11% for urban boys vs 9% for rural boys, and 7%for urban girls vs 6% for rural girls [12].
Although these nationally representative data were only collected recently,overweight and obesity among primary school-aged children have been docu-mented earlier [12, 45]. In a cross-sectional study involving 3000 pre-pubertalschool-aged children from Central Java, the overall prevalence of overweightwas 2.7% (IOTF definition). The prevalence of overweight in the non-poor urbangroup was 4.9%, which was five times higher than the rural group [46]. Obesityprevalence was higher for boys than for girls, but no sex difference for over-weight prevalence was found. The Yogyakarta five-year (1999 to 2004) trackingstudy from pre-pubertal children to adolescents found that the prevalence of over-weight (US Centers for Disease Prevention and Control reference BMI 85th to95th percentile) and obesity (BMI ≥95th percentile) increased from 4.2% and1.9%, to 8.8% and 3.2% respectively, over this time [47]. Moreover, all obesechildren stayed obese over the five-year period, and 85% of the overweight chil-dren remained overweight [47].
11 Child and adolescent obesity in Asia
217

Social, behavioural and environmental factors associatedwith childhood obesity
The reported factors associated with overweight and obesity from Indonesia in-clude urban (versus rural) residence and higher family income levels, as seen inThailand and China. Children from non-poor urban families had a higher risk ofbecoming overweight or obese [46].
VIETNAM: CHILDHOOD OBESITY PREVALENCEAND TRENDS
AdolescentsSystematic national data on the prevalence of child and adolescent obesity are notavailable in Vietnam. The reported studies are from Ho Chi Min City (HCMC), inadolescents as well as preschool-aged children. Two recent epidemiological sur-veys conducted in 2002 and 2004, in junior high school students (aged from 11to 16 years) that revealed a rapid decline in the prevalence of underweight (USCenters for Disease Prevention and Control growth reference BMI Z-score lessthan −2 SD) halved in just these two years. At the same time, the overall preva-lence of overweight and obesity (IOTF definition) more than doubled, from 5.9%to 11.7% and from 0.7% to 2.1%, respectively [48]. The increase in prevalence ofoverweight and obesity was particularly marked in boys, from 7.8% (95 CI: 3.2,17.9) and 1.2 (95% CI: 0.3, 4.0) in 2002 to 16.2% (95% CI: 13.3, 19.5) and 3.1(95% CI: 2.2, 4.4) in 2006, especially in the younger age groups. Furthermore,the largest increase was seen in boys from wealthiest families. These findings aresimilar to results from the study in Xi’an, China [33].
Preschool-aged childrenThe 2005 cross-sectional survey of a representative sample of 670 preschool-aged children (aged from 48 to 65 months) in urban areas of HCMC [11] founda remarkably high prevalence (IOTF definition) of overweight (20.5%, 95% CI:17.5, 24.3) and obesity (16.3%, 95% CI: 13.2, 20.4). The prevalence trend be-tween 2002 and 2005 in preschool-aged children in HCMC are consistent withthe findings for adolescents [48]. The total prevalence of overweight/obesity inpreschoolers almost doubled from 2002 to 2005 (21.4%, 95% CI: 17.5, 25.8 and36.8% 95% CI: 32.0, 41.8 respectively). The increase was greater for boys (from22.6% to 40.8%) than for girls (from 20.4% to 32.8%) and of particular interestwas the increase in the less wealthy districts: from 16.9% (95% CI: 13.3, 21.2)to 35.9% (95% CI: 29.4, 42.9) in three years [49]. However, unlike the findingsreported by Hong et al. [48] for adolescents, there was no significant difference
A modern epidemic
218

in the level of overweight/obesity for children from poor and rich families.
Social, behavioural and environmental factors associatedwith childhood obesity
Significant associations have been demonstrated between childhood overweight/obesity and family social status (fathers having secondary school or above ed-ucation, fathers working as professionals, and mothers having government em-ployment), both parents having a BMI ≥23 kg/m2 [
50], one or both parents being
overweight [49], children being from wealthy families and having a birth weight≥4000 grams [11]. Prolonged breastfeeding and longer duration of sleeping atnight have a protective effect [11]. Many of these factors have also been identi-fied in studies from Thailand and China.
COMMON CHARACTERISTICS OF CHILDHOODOBESITY AMONG THE FOUR ASIAN COUNTRIES
AND DIFFERENCES FROM THE WESTThe common characteristics of childhood overweight and obesity in Thailand,China, Indonesia and Vietnam include the:
• rapid increase in prevalence, especially in younger age groups• sex difference in prevalence, highest in younger boys• rural/urban residence differences in prevalence of overweight/obesity• higher prevalence of overweight and obesity amongst children from house-
holds with higher economic status.
However, since the definitions used to define overweight and obesity vary fromcountry to country, and from study to study, direct comparison of epidemiologicaldata across countries is extremely difficult.
In contrast to what has been shown in these four Asian countries, the preva-lence of childhood obesity appears to be plateauing in a number of developedcountries, including Australia [51, 52, 53]. No sex differences in the prevalence ofoverweight/obesity in children and adolescents have been found in the UK [54],US [52] and Sweden [55]. It has been suggested that the higher prevalence in boysin Asia is at least partially related to a societal view that favours boys over girls[48] and the traditional cultural belief that a fat child symbolise the prosperity ofthe family [31]. The socioeconomic gradient in relation to prevalence, includingthe urban/rural disparity, suggests that the childhood obesity epidemic in coun-tries undergoing economic transition is driven by the environment and lifestyleto which the children are exposed. For instance, in urban areas of Asian coun-tries it is common for both parents to work fulltime, having little time to prepare
11 Child and adolescent obesity in Asia
219

nutritious foods. In particular, children from higher income families tend to eatout more, including Western-style fast food, and often have pocket money to buysnacks [38]. This is a different pattern from developed countries where childhoodobesity is more prevalent in lower socioeconomic status families [54, 56].
DISEASE CONSEQUENCES OF CHILDHOODOBESITY
In adults, the cut-off values defining overweight or obesity are based on therelated disease risk. There are no risk-based BMI values for children and ado-lescents, largely due to the time span between childhood obesity and when theadverse outcomes may occur [57]. Nevertheless, a body of evidence has showna strong association between childhood obesity and major cardiovascular dis-ease risk factors, such as diabetes, hypertension and metabolic syndrome (MetS)in children and adolescents. The tracking studies from Thailand and Indonesiaclearly demonstrate that there is a strong tendency for overweight and obese chil-dren to remain overweight or obese into adolescence. This tendency, of course, isnot confined to Asian countries [58, 59].
In a study that reviewed medical records of diabetic patients in the Divisionof Paediatric Endocrinology, Faculty of Medicine, Siriraj Hospital in Hat Yai,south Thailand, children and adolescents diagnosed with type 2 diabetes in-creased from 5% in the mid 1980 to mid 1990s to 17.9% in the late 1990s [60].This coincided with the increase of obesity prevalence from 5.8% to 13.3% [60].The mean age of diabetic children was 11.6 years with a mean BMI of 27.8 kg/m2
[60]. In the 2006 nine cities epidemiological survey conducted in China, both thesystolic (SBP) and diastolic (DBP) blood pressure of children aged three to sixyears were higher in obese children than in children of normal bodyweight [35].Based on data analysis from the 2002 Chinese National Health Survey, over-weight and obese adolescents (aged 15 to 17.9 years, the Group of China ObesityTask Force definition) were 3.3 and 3.9 times more likely, respectively, to havehigh blood pressure than their normal-weight peers, with systolic and diastolicblood pressure being about ten and five mmHg higher than in those of normalweight [61, 62]. Type 2 diabetes was found in 0.2% of seven-to 12-year-olds and0.4% of 12-to 18-year-olds. As many as 62% of children and adolescents had dys-lipidaemia or other lipid profile abnormalities [62]. Overweight was a risk factorfor hyperglycaemia (OR = 2.3, 95% CI: 1.0, 5.4). More alarmingly, overweightand obesity were associated with high dyslipidaemia (OR = 1.5, 95% CI: 1.2, 1.9and OR = 1.8, 95% CI: 1.3, 2.5 respectively), high triglyceride (OR = 1.9, 95%CI: 1.5, 2.4 and OR = 3.3, 95% CI: 2.4, 4.5 respectively), high SBP (OR = 3.4,95% CI: 1.5. 7.5 and OR = 5.0, 95% CI: 1.5, 16.4 respectively), high DBP (OR =2.7, 95% CI: 1.5. 4.8 and OR = 3.1, 95% CI: 1.2, 8.1 respectively) and MetS (OR
A modern epidemic
220

= 15.4, 95% CI: 6.8. 34.8 and OR = 47.9, 95% CI: 16.0, 143.1 respectively) [62].Two recent publications reported on survey results of MetS, using the In-
ternational Diabetes Foundation definition [63], in children and adolescents fromGuangzhou, China [64] and HCMC, Vietnam [65]. The overall prevalence of themetabolic syndrome in seven- to 14-year-olds from Guangzhou was 6.6%, andmuch higher in overweight (20.5%) and obese (33.1%) children [64]. Similarly,the metabolic syndrome was more prevalent in overweight/obese children fromHCMC. Being physically active was associated with a lower odds of develop-ing the metabolic syndrome [65]. These findings illustrate that childhood obesityposes immediate consequences to child and adolescent health.
THE POSSIBILITY FOR INTERVENTION: WHERETO START?
Childhood obesity is a complex problem with no easy solution. The results ofmany intervention studies aimed at preventing obesity in school-aged childrenremain inconclusive due to lack of long-term follow-up [66]. Indeed, Li et al.[67] conducted a systematic review of school-based intervention studies for theprevention or reduction of excess weight gain among Chinese children and ado-lescents and found that most of the published studies (lasting between ten weeksto three years) were uni-dimensional, mostly focusing on improving knowledge,physical activity levels and/or diet. None of the trials demonstrated convincingefficacy. In 2009 WHO published a systematic review, ‘Interventions on diet andphysical activity: what works?’ [68], which examined close to 400 publicationsbetween 1995 and 2005. The authors showed that multi-component interventionsinvolving the family, school, community and government, and interventions thatare adapted to the local context were the most successful [68, 69, 70]. Unfortu-nately, the representation of studies from low-middle income countries in theWHO review was extremely low (less than 13%). This highlights the urgent needfor well-designed intervention programs to be implemented in low and middle-income countries. In the meantime, the extent to which examples of successfulprograms for reducing childhood obesity in developed countries could be adaptedto the context of low- and middle-income countries, should be explored.
At the national level, Singapore’s experience can provide some insight intonational intervention programs within an Asian country that shares a similar so-cial and cultural background and dietary patterns. Although the prevalence ofchildhood obesity in Singapore was not as high as in the countries described inthis chapter, concerns about obesity-related morbidities had prompted the gov-ernment to introduce national health promotion and disease prevention policiesand programs from the early 1990s [71]. Specific policies and programs were de-veloped for populations in different settings, including schools, communities and
11 Child and adolescent obesity in Asia
221

workplaces. Several programs were targeted at school-aged children. The Trimand Fit program was one of the longest running programs (1992 to 2006), andaimed to reduce obesity prevalence and to increase children’s fitness level. Al-though the program achieved its overall goals, it also raised concerns about theextra pressure that overweight and obese students were subjected to, as well asstigmatisation towards them, as a result of the way in which that particular pro-gram was implemented. The program was terminated in 2006 and replaced bythe Holistic Health Framework program [72]. The important point here is that na-tionwide programs in Singapore were implemented by government in order toprevent and control overweight and obesity in the population, in a similar man-ner to national strategies for controlling communicable diseases [71]. The Thaigovernment has recently endorsed its national obesity prevention plan. This na-tionwide approach to the problem is a step in the right direction.
At the community level, one successful Australian example of an obesityprevention program is the Romp & Chomp project. This four-year obesitydemonstration program was targeted towards preschool children aged less thanfive years, and their families, in two communities in Victoria [69]. It was de-signed, planned and implemented as a partnership by a range of government andnon-government organisations [73].The intervention led to a significantly lowerintake, by children, of packed snacks and sweet drinks, as well as a significantlyhigher frequency of vegetable intake. An evaluation of early childhood environ-ments undertaken as part of this study found that no sweet drinks were beingoffered in any of the early childhood settings. Healthy eating policies and healthyfood guidelines were implemented, and there was an increase in the availabil-ity of nutrition and physical activity resources [73]. This project demonstratedthat a whole-community and settings-based approach can create environments foryoung children that are less obesogenic and that promote healthy weight fromearly age. More importantly, it shows that actions can be taken to prevent child-hood obesity.
CHALLENGES AND OPPORTUNITIESThere are a number of challenges and opportunities in addressing the risingprevalence of overweight and obesity among children and adolescents in Asia.
1. There is an important need to gather quality nationally representative epi-demiological data in all countries in order to monitor trends over time and toinform decision-making in policy development and intervention programs.Currently, China has national data collection systems in place; while Thai-land and Indonesia have collected nationally representative data through theThai National Child Health Survey (2001) and the Indonesian Basic HealthResearch (2007); Vietnam has the national child nutrition surveillance pro-
A modern epidemic
222

gram, which is still orientated towards the surveillance of under-nutrition inchildren aged <5 years. The challenge is to achieve a robust national datacollection system that can monitor the trends regularly and consistently.
2. It is important to determine the applicability of the international definitionsof overweight and obesity for Asian children and adolescents. Work is underway to collate and analyse childhood obesity epidemiological data from thefour countries. The data and the national growth references (Thailand andChina) will be evaluated against the WHO Child Growth Standards and theWHO Growth Reference for five to 19-year-olds, as well as the IOTF defin-ition.
3. One of the biggest challenges is to determine the value of the current defin-itions of childhood overweight and obesity in predicting disease risks. Thiswill need a monitoring system to track the development of non-communica-ble diseases from childhood right into adolescence and adulthood.
4. Because countries in the region are facing similar issues, a regional approachto prevention may be warranted. One of the opportunities for reseach collab-oration is to gain a better understanding of the causative factors of childhoodobesity in Asian countries. We have already identified the role of food andbeverage marketing targeted at children as a research priority.
5. Evidence of effective intervention strategies and programs in countries un-dergoing economic and nutrition transition is urgently needed. Further re-search is needed to evaluate obesity prevention interventions in different agegroups and settings in transition countries. These interventions will need toaddress the risk factors found in these countries.
CONCLUSIONAs illustrated by data from Thailand, China, Indonesia and Vietnam, the child-hood obesity epidemic in transition nations shows no signs of slowing down.Although undergoing rapid economic growth these countries share with more de-veloped countries some common social, behavioural and environmental factorsthat are associated with a higher prevalence of childhood overweight and obesity.There are also characteristics that are unique to the region, such as higher ratesof obesity in boys from wealthier families. It is important, therefore, to developpolicies and intervention programs that are culturally appropriate to prevent andreduce rates of childhood obesity for the region.
References1. Wang Y & Lobstein T (2006). Worldwide trends in childhood overweight
and obesity. International Journal of Pediatric Obesity, 1: 11–25.
11 Child and adolescent obesity in Asia
223

2. World Health Organization (2009). Population-based prevention strategiesfor childhood obesity: report of a WHO forum and technical meeting.Geneva: World Health Organization.
3. de Onis M, Blossner M & Borghi E (2010). Global prevalence and trends ofoverweight and obesity among preschool children. The American Journal ofClinical Nutrition, 92(5): 1257–64.
4. World Health Organization (2011). Childhood overweight and obesity [On-line]. Available: www.who.int/dietphysicalactivity/childhood/en/ [Accessed8 February 2011].
5. Deitz W (1994). Critical periods in childhood for the development of obe-sity. The American Journal of Clinical Nutrition, 59: 955–59.
6. Leunissen R, Kerkhof G, Stijnen T & Hokken-Koelega A (2009). Timingand tempo of first-year rapid growth in relation to cardiovascular and meta-bolic risk profile in early adulthood. Journal of the American Medical Asso-ciation, 301(21): 2234–42.
7. Monteiro P & Victora C (2005). Rapid growth in infancy and childhood andobesity in later life: a systematic review. Obesity Review, 6(2): 143–54.
8. Kosulwat V (2002). The nutrition and health transition in Thailand. PublicHealth Nutrition, 5(1A): 183–89.
9. National Bureau of Statistics of China (2010). China Statistical Yearbook2010 [Online]. Available: www.stats.gov.cn/tjsj/ndsj/2010/indexch.htm.[Accessed 9 September 2011].
10. Zhai F, Wang H, Du S, He Y, Wang Z, Ge K, et al. (2009). Prospective studyon nutrition transition in China. Nutrition Reviews, 67(Suppl. 1): S56–61.
11. Dieu H, Dibley M, Sibbritt D & Hanh T (2007). Prevalence of overweightand obesity in preschool children and associated socio-demographic factorsin Ho Chi Minh City, Vietnam. International Journal of Pediatric Obesity,2(1): 40–50.
12. Usfar A, Lebenthal E, Atmarita, Achadi E, Soekirman & Hadi H (2010).Obesity as a poverty-related emerging nutrition problems: the case of In-donesia. Obesity Review, 11(12): 924–28.
13. Cole T, Bellizzi M, Flegal K & Dietz W. (2000). Establishing a standarddefinition for child overweight and obesity worldwide: international survey.British Medical Journal, 320(7244): 1240–43.
A modern epidemic
224

14. Must A, Dallal G & Dietz W. (1991). Reference data for obesity: 85th and95th percentiles of body mass index (wt/ht2) and triceps skinfold thickness.The American Journal of Clinical Nutrition, 53(4): 839–46.
15. World Health Organization (1995). Physical status: the use and interpre-tation of anthropometry. Report of a WHO Expert Committee. TechnicalReport Series No. 854. Geneva: World Health Organization.
16. World Health Organization (2006). WHO child growth standards: methodsand development: length/height-for-age, weight-for-age, weight-for-length,weight-for-height and body mass index-for-age. Geneva: World Health Or-ganization.
17. World Health Organization (2008). Training course on child growth assess-ment. Geneva: World Health Organization.
18. de Onis M, Onyango A, Borghi E, Siyam A, Nishida C & Siekmann J(2007). Development of a WHO growth reference for school-aged childrenand adolescents. Bulletin of the World Health Organization, 85: 660–67.
19. de Onis M, Onyango A, Borghi E, Siyam A, Nishida C & Siekmann J(2007). Development of a WHO growth reference for school-aged childrenand adolescents. Bulletin of the World Health Organization, 85: 649–732.
20. Aekplakorn W & Mo-suwan L (2009). Prevalence of obesity in Thailand.Obesity Reviews, 10(6): 589–92.
21. Mo-suwan L (2008). Childhood obesity: an overview. Siriraj Medical Jour-nal, 60(1): 37–40.
22. Sakamoto N, Wansorn S, Tontisirin K & Marui E (2001). A social epidemi-ologic study of obesity among preschool children in Thailand. InternationalJournal of Obesity Related Metabolic Disorders, 25(3): 389–94.
23. Langendijk G, Wellings S, van Wyk M, Thompson S, McComb J & ChusilpK (2003). The prevalence of childhood obesity in primary school children inurban Khon Kaen, northeast Thailand. Asia Pacific Journal of Clinical Nu-trition, 12(1): 66–72.
24. Mo-suwan L, Junjana C & Puetpaiboon A (1993). Increasing obesity inschool children in a transitional society and the effect of the weight controlprogram. Southeast Asian Journal of Tropical Medicine and Public Health,24(3): 590–94.
25. Mo-suwan L, Tongkumchum P & Puetpaiboon A (2000). Determinants of
11 Child and adolescent obesity in Asia
225

overweight tracking from childhood to adolescence: a 5 y follow-up study ofHat Yai schoolchildren. International Journal of Obesity Related MetabolicDisorders, 24(12): 1642–47.
26. Mo-suwan L & Geater A (1996). Risk factors for childhood obesity in atransitional society in Thailand. International Journal of Obesity RelatedMetabolic Disorders, 20(8): 697–703.
27. Group of China Obesity Task Force (2004). Body mass index referencenorm for screening overweight and obesity in Chinese children and adoles-cents. Zhonghua Liu Xing Bing Xue Za Zhi, 25(2): 97–102.
28. Cui Z & Dibley M. (2010). Secular treand in childhood obesity and associ-ated risk factors in China from 1982 to 2006. In J O’Dea & M Eriksen (Eds).Childhood obesity prevention: international research, controversies, and in-terventions (pp104–16). New York: Oxford University Press.
29. Ji C & Cooperative Study on Childhood Obesity: Working Group on Obe-sity in China (WGOC) (2008). The prevalence of childhood overweight/obesity and the epidemic changes in 1985–2000 for Chinese school-age chil-dren and adolescents. Obesity Review, 9(Suppl. 1): 78–81.
30. Li Y, Schouten E, Hu X, Cui Z, Luan D & Ma G (2008). Obesity prevalenceand time trend among youngsters in China, 1982–2002. Asia Pacific Journalof Clinical Nutrition, 17(1): 131–37.
31. Cui Z, Dibley MJ, Huxley R & Wu Y (2010). Temporal trends in overweightand obesity of children and adolescents from nine provinces in China from1991–2006. International Journal of Pediatric Obesity, 5(5): 365–74.
32. Zang Y & Wang S (2011). Secular trends in body mass index and theprevalence of overweight and obesity among children and adolescents inShandong, China, from 1985 to 2010. Journal of Public Health (Oxf), 1–7.
33. Li M, Dibley M, Sibbritt D & Yan H (2006). An assessment of adolescentoverweight and obesity in Xi’an City, China. International Journal of Pedi-atric Obesity, 1(1): 50–58.
34. Li H & Collaboration Group of Nine Cities Study on the Physical Growthand Development of Children (2008). A national epidemiological surveyon obesity of children under 7 years of age in nine cities of China, 2006.Zhonghua Er Ke Za Zhi, 46(3): 174–78.
35. Ding Z & Collaboration Group of Nine Cities Study on the Physical Growth
A modern epidemic
226

and Development of Children (2008). A national epidemiological surveyon obesity of children under 7 years of age in nine cities of China, 2006.Zhonghua Er Ke Za Zhi, 46(3): 174–78.
36. Zhang J, Yuan L & Wei M (2002). The current status of obesity epidemi-ology and prevention in preschooler. Maternal and Child Health Care ofChina, 17: 376–78.
37. Liu J, Ye R, Li S, Ren A, Li Z, Liu Y, et al. (2007). Prevalence of over-weight/obesity in Chinese children. Archives of Medical Research, 38(3):882–86.
38. Li M, Dibley M, Sibbritt D & Yan H (2008). Factors associated with ado-lescents’ overweight and obesity at community, school and household levelsin Xi’an City, China: results of hierarchical analysis. European Journal ofClinical Nutrition, 62(5): 635–43.
39. Li M, Dibley M, Sibbritt D & Yan H (2010). Dietary habits and overweight/obesity in adolescents in Xi’an City, China. Asia Pacific Journal of ClinicalNutrition, 19(1): 76–82.
40. Shan X, Xi B, Cheng H, Hou D, Wang Y & Mi J (2010). Prevalence andbehavioral risk factors of overweight and obesity among children aged 2–18in Beijing, China. International Journal of Pediatric Obesity, 5(5): 383–89.
41. Jiang J, Rosenqvist U, Wang H, Greiner T, Ma Y & Toschke A (2006). Riskfactors for overweight in 2- to 6-year-old children in Beijing, China. Inter-national Journal of Pediatric Obesity, 1(2): 103–08.
42. Jiang J, Rosenqvist U & Wang H (2009). Relationship of parental charac-teristics and feeding practices to overweight in infants and young children inBeijing, China. Public Health Nutrition, 12(7): 973–78.
43. Zhang X, Liu E, Tian Z, Wang W, Ye T, Liu G, et al. (2009). High birthweight and overweight or obesity among Chinese children 3–6 years old.Preventative Medicine, 49(2–3): 172–78.
44. Jiang F, Zhu S, Yan C, X J, Bandla H & Shen X. (2009). Sleep and obesityin preschool children. The Journal of Pediatrics, 154(6): 814–18.
45. Soekirman, Hardinsyah, Jus’at I & Jahari A (2002). Regional study of nu-tritional status of urban primary schoolchildren. 2. West Jakarta and Bogor,Indonesia. Food and Nutrition Bulletin, 23(1): 31–40.
46. Julia M, van Weissenbruch M, de Waal H & Surjono A (2004). Influence of
11 Child and adolescent obesity in Asia
227

socioeconomic status on the prevalence of stunted growth and obesity in pre-pubertal Indonesian children. Food and Nutrition Bulletin, 25(4): 354–60.
47. Julia M, van Weissenbruch M, Prawirohartono E, Surjono A & Dele-marre–van de Waal H (2008). Tracking for underweight, overweight andobesity from childhood to adolescence: a 5-year follow-up study in urban In-donesian children. Horm Res, 69(5): 301–06.
48. Hong T, Dibley M, Sibbritt D, Binh P, Trang N & Hanh T (2007). Over-weight and obesity are rapidly emerging among adolescents in Ho Chi MinhCity, Vietnam, 2002–2004. International Journal of Pediatric Obesity, 2(4):194–201.
49. Dieu H, Dibley M, Sibbritt D & Hanh T. (2009). Trends in overweight andobesity in pre-school children in urban areas of Ho Chi Minh City, Vietnam,from 2002 to 2005. Public Health Nutrition, 12(5): 702–09.
50. WHO Expert Consultation (2004). Appropriate body-mass index for Asianpopulations and its implications for policy and intervention strategies. TheLancet, 363(9403): 157–63.
51. Popkin B (2010). Recent dynamics suggest selected countries catching up toUS obesity. The American Journal of Clinical Nutrition, 91(1): 284S–8S.
52. C, Carroll M, Curtin L, Lamb M & Flegal K (2010). Prevalence of highbody mass index in US children and adolescents, 2007–2008. Journal of theAmerican Medical Association, 303(3): 242–49.
53. Olds T, Tomkinson G, Ferrar K & Maher C (2010). Trends in the prevalenceof childhood overweight and obesity in Australia between 1985 and 2008.International Journal of Obesity, 34(1): 57–66.
54. Jebb S, Rennie K & Cole T (2004). Prevalence of overweight and obesityamong young people in Great Britain. Public Health Nutrition, 7(3): 461–65.
55. Sundblom E, Sjoberg A, Blank J & Lissner L (2010). Childhood obesity: re-cent trends in Sweden including socioeconomic differences. In J O’Dea & MEriksen (Eds). Childhood obesity prevention: international research, contro-versies, and interventions (pp164–73). New York: Oxford University Press.
56. O’Dea J (2003). Differences in overweight and obesity among Australianschoolchildren of low and middle/high socioeconomic status. Medical Jour-nal of Australia, 179(1): 63.
57. Lloyd L, Langley-Evans S & McMullen S (2010). Childhood obesity and
A modern epidemic
228

adult cardiovascular disease risk: a systematic review. International Journalof Obesity, 34(1): 18–28.
58. Singh A, Mulder C, Twisk J, van Mechelen W & Chinapaw M (2008).Tracking of childhood overweight into adulthood: a systematic review of theliterature. Obesity Review, 9: 474–88.
59. Suchiindran C, North K, Popkin B & Gordon-Larsen P (2010). Associationof adolescent obesity with risk of severe obesity in adulthood. Journal of theAmerican Medical Association, 304: 2042–47.
60. Likitmaskul S, Kiattisathavee P, Chaichanwatanakul K, Punnakanta L,Angsusingha K & Tuchinda C (2003). Increasing prevalence of type 2 di-abetes mellitus in Thai children and adolescents associated with increasingprevalence of obesity. Journal of Pediatric Endocrinology & Metabolism16(1): 71–77.
61. Chen C (2008). Overview of obesity in mainland China. Obesity Review,9(Suppl. 1): 14–21.
62. Li Y, Yang X, Zhai F, Piao J, Zhao W, Zhang J, et al. (2008). Childhoodobesity and its health consequence in China. Obesity Review, 9(Suppl. 1):82–86.
63. Zimmet P, Alberti K, Kaufman F, Tajima N, Silink M, Arslanian S, et al.(2007). The metabolic syndrome in children and adolescents: an IDF consen-sus report. Pediatric Diabetes, 8(5): 299–306.
64. Liu W, Lin R, Liu A, Du L & Chen Q (2010). Prevalence and associationbetween obesity and metabolic syndrome among Chinese elementary schoolchildren: a school-based survey. BMC Public Health, 10: 780.
65. Nguyen T, Tang H, Kelly P, van der Ploeg H & Dibley M (2010). Asso-ciation between physical activity and metabolic syndrome: a cross-sectionalsurvey in adolescents in Ho Chi Minh City, Vietnam. BMC Public Health,17(10): 141.
66. Summerbell C, Waters E, Edmunds L, Kelly S, Brown T & Campbell K(2005). Interventions for preventing obesity in children. Cochrane Databaseof Systematic Reviews, 3: CD001871.
67. Li M, Li S, Baur L & Huxley R (2008). A systematic review of school-basedintervention studies for the prevention or reduction of excess weight amongChinese children and adolescents. Obesity Review, 9(6): 548–59.
11 Child and adolescent obesity in Asia
229

68. World Health Organization (2009). Interventions on diet and physical ac-tivity: what works [Online]. Available: www.who.int/dietphysicalactivity/whatworks/en/ [Accessed 9 July 2011].
69. de Silva-Sanigorski A, Bell A, Kremer P, Nichols M, Crellin M, Smith M,et al. (2010). Reducing obesity in early childhood: results from Romp &Chomp, an Australian community-wide intervention program. The AmericanJournal of Clinical Nutrition, 91(4): 831–40.
70. Bautista-Castano I & Doreste J (2004). Effectiveness of interventions inthe prevention of childhood obesity. European Journal of Epidemiology, 19:617–22.
71. Ho T (2010). Prevention and management of obesity in children andadolescents-the Singapore experience. In J O’Dea & M Eriksen (Eds). Child-hood obesity prevention: international research, controversies, and inter-ventions (pp240–49). New York: Oxford University Press.
72. Soon G, Koh Y, Wong M & Lam P (2008). Obesity prevention and controlefforts in Singapore: 2008 case study. The National Bureau of Asian Re-search, USA.
73. WHO Collaboration Centre for Obesity Prevention & Deakin University(2009). Outcome and impact evaluation of Romp & Chomp: preliminary re-port. Deakin University.
A modern epidemic
230

Ethics, policy and regulation


12The ethical implications of interven-
ing in bodyweightStacy M Carter,1,2 Ian Kerridge, Lucie Rychetnik and Lesley King3
This chapter is about the ethical implications of health sector actions in-tended to change individuals’ or communities’ weight. We consider theseimplications using two hypothetical cases. The first is Megan, a 15-year-old girl whose BMI is in the range defined as obese. She has been unable tolose weight and her parents are considering seeking clinical help. The sec-ond case is the population of the state where Megan lives, in which 35% ofadults and 15% of children are reportedly overweight, and 17% of adultsand 5% of children obese. The minister for health, prompted by these sta-tistics, is determined to take action. What ethical issues are relevant forMegan, her parents, and the health professionals they may consult? Whatethical issues are relevant for the citizens of the state, their minister forhealth and their bureaucrats? How does a focus on the care of individu-als impact on public health, and how might community-level interventionsaffect people like Megan? Interventions designed to treat and prevent obe-sity in individuals and in communities raise important ethical issues. Theseissues are both distinct and overlapping; because the interventions have dif-ferent goals, risks and benefits, moral compromise is always necessary. Thecentral task is to think through the ethical and philosophical issues beforeaction is taken: whether in clinical medicine or in public health. We presentethical approaches that can assist in such reasoning.
In this chapter we examine the ethical implications of intervening in weight, andthe ethical difference between intervening in the weight of individuals and theweight of populations. We discuss these issues via two cases: Megan, a hypothet-ical 15-year-old girl, and Australia, the country where Megan lives. We conclude
1 Centre for Values, Ethics and the Law in Medicine, University of Sydney.2 Sydney School of Public Health, University of Sydney.
3 Prevention Research Collaboration, Sydney School of Public Health, University ofSydney.
233

that there are distinct and overlapping ethical concerns at individual and popula-tion levels, and that at both levels moral compromise is necessary. Both cliniciansand public health professionals need to consider the ethical issues and implica-tions before action is taken. Using our two cases, this chapter provides examplesof such reasoning.
MEGANMegan is 15 and a high-school student. She is technically ‘overweight’: 165 cmtall and 76 kg, with a body mass index of 27.9 kg/m2. Megan has always beenlarger than many of her peers. As a young child Megan wasn’t aware of herweight, but began to be self-conscious in primary school after being teased by afellow student for being fat. Since then she has become increasingly fearful ofbullying. Megan has two close friends, but other students often tease her duringbreaks at school. In physical education classes she is often overlooked in teamselections and teased by fellow pupils.
Megan’s parents became worried about her weight when she was six. Theyenrolled Megan in several team sports over the years, but she begged to be al-lowed to discontinue each one: she felt uncoordinated and awkward and wasresented by teammates, who saw her as a liability. When she was ten, her parentsbegan putting her on diets. In the last four years she has tried a meal replace-ment product, Weight Watchers, a grapefruit diet and the Atkins diet: each timeMegan lost weight but regained it. Friends, family members, teachers, or evencomplete strangers frequently comment about Megan’s weight. When this hap-pens, she thinks: ‘Don’t they realise? I already know I’m fat and I’m trying tofix it!’ Megan’s parents worry about her future; they hear constant media reportsabout health risks, depression and other problems associated with higher weights.
Someone suggests Dr Jim Spright – a general practitioner experienced inmanaging overweight in adolescence – as a good starting point to ‘do something’about Megan’s weight, and Megan’s parents decide to seek his professional ad-vice.
The population in which Megan livesMegan lives in a metropolitan city in Australia, where approximately 21% ofadults are considered obese and 35% overweight, and 25% of children agedfive to 17 overweight or obese [1]. The hypothetical health minister, promptedby these statistics, public health officials and academics, decides that she wantsa formal overweight and obesity strategy. An Obesity Summit is convened todiscuss policy options. Academics, public servants, public health officials, com-mercial weight-loss service providers, exercise industry representatives, food
A modern epidemic
234

industry manufacturing and retail representatives, surgeons, endocrinologists andgeneral practitioners – including Dr Spright – are all invited.
Over the course of the summit, participants discuss many options. Howshould food be labelled and marketed? Should marketing for some foods bebanned? Should healthy behaviours be mandated? Should health departmentmoney be spent on projects with departments of public transport and urban plan-ning? Should spending be focused on kids or on adults? What should be done inschools? Should bariatric surgery be publicly funded, how and for whom? Howshould social marketing be used, and what can it achieve? Their goal is to producefeasible, acceptable recommendations for actions that will reduce the populationprevalence of overweight and obesity significantly by 2020.
INDIVIDUALS AND POPULATIONS AS A FOCUSFOR ACTION
A distinction between intervening in the lives of individuals – like Megan – andintervening in populations – like Australia – is fundamental to public health prac-tice. An iconic statement of this was made by Geoffrey Rose in his 1985 paper‘Sick individuals and sick populations’ [2]. Rose noted that within our population,we tend to treat average states as ‘normal’, and deviation from such states as ‘ab-normal’ [2]. We present to doctors as patients because we perceive ourselves tobe ‘abnormal.’ The goal of clinicians is to determine whether we are ‘abnormal’,and if so, explain why. Rose argued that this is an investigation of why variationoccurs within a population [2]; in the case of weight, for example, a doctor triesto determine why a patient is fatter than the rest of the population. This is donethrough direct clinical interaction – a relatively intimate and proximal exchange.The clinician’s problem-solving is based on examination of the patient and listen-ing to the patient’s story, and can take into account many aspects of their lives.The clinician attempts to determine causes for that individual, and achieve thebest outcome for them. This might require advocacy for that person against sys-tems designed to ration services.
Rose argued that this important clinical process provides only partial under-standing of health problems. If a causal factor is distributed evenly throughout apopulation, everyone in that population is equally exposed to it. Thus a clinicianis unlikely to ‘see’ it as a causal factor for a patient like Megan, because, withinthe doctor’s population of patients, it does not explain why some patients are thinand others fat. The only way we can ‘see’ the effect of such an omnipresent fac-tor is to compare a whole population that is heavier on average – say Australia– with one that is leaner on average – say Japan [3]. To make such a compari-son changes the key question from ‘Why do some Australian individuals weighmore than their peers?’ to ‘Why is overweight more common in Australia and less
12 The ethical implications of intervening in bodyweight
235

common in Japan?’ These two explanations, Rose argued, may rest on differentcausal factors [2]. This led Rose to distinguish between two kinds of interven-tion: the ‘high-risk’ strategy, in which individual cases in the high-risk ‘tail’ ofa distribution were identified and treated, and the ‘population strategy’ whereroot causes were identified and altered to potentially shift the entire distributionslightly towards lower risk [2]. Although Rose noted strengths and weaknessesof each, he proposed that the ‘population strategy’ could lead to a greater averageimprovement in health because of its radical intervention in root causes for wholepopulations.
Clinicians must act in the best interests of a patient, within a health systeminevitably constrained by resource limitations. In contrast, population health in-terventions focus on whole populations, and public health policy-makers onallocating resources to maximise efficiency; this means such policy-makers mayneed to be less sensitive to the complexities of individuals’ lives, and more con-scious of equity and opportunity cost across whole populations. In the clinicalcase, the patient presents to the clinician and asks for treatment. In the case ofpublic health, the population is unlikely to have asked to have its ‘incidence’ re-duced, making the rights and responsibilities of all involved less clear.
CLINICAL ETHICS AND PUBLIC HEALTH ETHICSEthics is the study of what should be done: a prescriptive, systematic analysis ofwhat is required for human wellbeing [4]. The descriptions above reveal the po-tential for incompatibility between the ethics of clinical medicine and the ethicsof public health. They occur in a different milieu, take different objects, seek dif-ferent objectives, and work from different information. It is perhaps unsurprisingthen that the development of clinical ethics has been reasonably distinct from thedevelopment of public health ethics.
Ethics has been a concern of the medical profession for over two millennia:in this sense, medical ethics is not new. However the focus on ethical analysis andreform of clinical medicine and biotechnology has intensified since the develop-ment of bioethics in the 1960s [5]. Clinical ethics grew and developed during thesecond half of the 20th century but during this period public health ethics wasrelatively neglected [6, 7, 8]. Systematic attempts to establish an ethic for publichealth began in earnest in the 21st century producing, for example, a specialistjournal [9], full-length books [10] and technical reports [11, 12].
APPROACHES TO CLINICAL ETHICSA number of moral frameworks have been proposed to guide clinical decision-
A modern epidemic
236

making, including casuistry (case-based reasoning), narrative ethics and theethics of care [4]. The most dominant framework, however, has been principle-based ethics (sometimes referred to as ‘principlism’ [12]. Much-criticised, much-revised and extremely influential, it focuses on four central and two derivedprinciples for ethical conduct (hence the name): respect for the autonomy of thepatient, beneficence (doing good for the patient), non-maleficence (not doingharm to the patient), ensuring justice, veracity (practicing honestly) and respectfor the patient’s privacy and confidentiality. While each of these principles is im-portant, they are, in themselves, not action-guiding and must always be specifiedand balanced and supported by rules that describe their scope, authority and rele-vant processes. Respect for autonomy, therefore, requires that a patient’s consentis sought before commencing treatment, but does not demand that a patient’s de-cisions always be respected, irrespective of the cost. Likewise, rules for consentmust be clearly articulated to outline who can consent, what capacities are re-quired before one can consent, and what should be done where a person is unable,because of illness, to consent. While this approach is deceptively simple, and mayobscure considered ethical critique, the fact that it provides a moral frameworkthat appears consistent with clinical practice has led to its widespread adoptionby the health professions.
APPROACHES TO PUBLIC HEALTH ETHICSIn contrast to clinical ethics, there is little consensus on the best approach toethics in public health, except for a general agreement that public health ethicsrequires its own framework [7, 13]. To date the literature has suggested five keyissues in evaluating public health actions: benefits and harms of intervention (ornon-intervention), problem definition and telos (ultimate purpose), fairness anddistributive justice, process and procedural justice, and rights [5, 11, 14, 15, 16, 17,18, 19, 20].
Maximising benefit, minimising harmThe framework most commonly associated with public health is utilitarianism,a consequentialist and welfarist philosophical position that emphasises achievingthe greatest good for the greatest number of people. Utilitarians are firstly con-cerned with the effectiveness or benefit of an intervention [5, 14, 17, 19, 21] andthe balance of any benefits to the attendant burdens [5, 14]. Possible concernshere include coercion, infringement, intrusion or undermining of human rights(see below) [11, 14, 16, 17] whether the response is proportional to the problem[14], whether the action is necessary [14, 19], and the cost of the intervention,including the opportunity cost [17, 19]. It is also important here to consider the
12 The ethical implications of intervening in bodyweight
237

quality of evidence on matters of ethical concern [15, 19, 20].
Problem definition and telosSome writers emphasise the severity of the problem or risk addressed [17] and thegoals of intervention as key issues for ethical evaluation. More ethical interven-tions are thought to relate to severe problems, fundamental causes, conditions andenvironments, and/or to address the ill-health that people impose on each otherrather than the ill-health people impose upon themselves, because this is more re-spectful of the autonomy of individuals [5, 15].
Increasing fairness or distributive justiceOther writers have argued that social justice, community, common good and/orrecognition of mutual vulnerability are the best basis for public health ethics [6,22, 23]. These writers suggest that it is most important to evaluate the fairness ofgoals and interventions, and the distribution of benefits and burdens, especiallywith regard to vulnerable groups and health inequalities [5, 11, 14, 15, 17, 19,21]. For these writers, goods in public health may be more valuable if they can beobtained only, or more efficiently, through collective action or if benefits pertainto whole communities [5, 14, 17, 19, 21], such as through provision of supportiveenvironments or assisting communities to act [11, 16].
Process and procedural justiceAnother approach is less concerned with principles, values or justifications, andmore with processes and procedural justice. This approach values collaborationand participation [14, 15], transparency and accountability (including informingor disclosing, speaking truthfully, and providing public justification) [14, 15, 16,19, 20] acknowledging and accommodating diversity, applying fair process whenconsensus cannot be reached [14, 15], obtaining consent, determining communityacceptance or ensuring adequate mandate for intervention [11, 15, 19], and build-ing and maintaining trust [14, 15].
Rights as a basis for public healthThe final domain argues – broadly – that human rights provide the most coherent,egalitarian, universalisable and critical framework for public health [7, 17]. Theserights generally include protection of privacy and confidentiality [15] and re-specting the ‘right to health’ enshrined in some international agreements, whichentails a ‘positive right’ to health improvement [7, 17, 24]. Limiting an individ-ual’s freedoms is justified only to prevent harm to others, that is, respecting their
A modern epidemic
238
‘negative right’ to non-interference – sometimes called the Millian harm princi-ple, after John Stuart Mill [7, 16, 21, 24].
A central problem for all approaches to public health ethicsConsideration of each of these domains is necessary for a comprehensive accountof any public health intervention. All approaches, arguably, can inform decisionsregarding a key problem in public health ethics: the degree to which coercion –forcing someone to act against their own will – or paternalism – interfering withsomeone’s liberty or autonomy without their consent to make them better off –are ethically permissible in public health [25, 26]. This is a central issue becausedegrees of coercion and paternalism have been key to the successes of publichealth [7, 11, 21] – think of seatbelt laws, gun control, fluoridation, sanitation andfood hygiene regulations. A central challenge for public health is thus to defineexactly when paternalism and/or coercion are permissible, and under what condi-tions, and what responsibilities this may entail for governments and individuals[18].
Some public health actions are justified by qualifying the paternalism in-volved. Three justificatory qualifications are made. The first is that the paternal-ism is ‘soft’ – that is, that it restricts only ill-informed and involuntarily actions.The second is that the paternalism is ‘weak’ – that is, that it interferes only whena person’s actions are inconsistent with their own goals. The final justification isthat the paternalism is ‘welfare oriented’ – that is, that those intervening are con-cerned only for a person’s physical and psychological condition, as opposed topreventing them from being ‘morally corrupted’ [11, 18, 21]. These distinctionsare a matter of degree and need to be argued on a case-by-case basis.
Some, particularly those concerned with rights and with procedural justice,argue that a simplistic opposition – paternalism or coercion versus freedom – ob-scures the complex relationship between these concepts, and de-emphasises thepositive freedoms that public health interventions can promote [21]. Althoughvoluntarism is not always effective [6], freedoms can decrease the need for coer-cion. If states engage communities, earning trust that negative freedoms will berespected, individuals may be more likely to seek help; conversely coercive in-terventions may be less effective or drive epidemics underground [7, 14, 17]. Inaddition, even strongly paternalistic actions could be moderated by democraticoversight or a community-level mandate [27]. These scholars would argue that byengaging communities paternalism can be lessened and better justified.
We have now considered both clinical and public health ethics. In clinicalethics, a clinician engages directly with a patient and the problem she presents.The clinician attempts to act in the patient’s best interests and to advocate onher behalf. The clinician seeks to determine what has made that individual pa-tient atypical – ‘high risk’ – in the distribution of her peers. More ethical clinical
12 The ethical implications of intervening in bodyweight
239

conduct, broadly speaking, will be that which respects the patients’ autonomy,does her good, does not harm her, treats her justly and honestly, and respects herprivacy and confidentiality. In public health, the situation is different. A decision-maker engages with ‘problems’ that are most likely to be defined statistically bythe state, and may not be priorities for the community. The public health profes-sional – if applying a ‘population’ strategy – will seek to determine what makesthis population different from other populations in regard to that problem, andto intervene in these ‘root causes’, ideally in a way that maximises benefit, min-imises harm, seeks justice, is procedurally transparent, minimises violation of therights of individuals, and can justify any coercion or paternalism entailed.
WHAT ETHICAL ISSUES ARE RELEVANT FORMEGAN, HER PARENTS AND DR SPRIGHT?
Megan and her parents attend Dr Spright’s office for a long appointment.Spright’s training, as Rose would say [2], is to find the ‘causes of Megan’s case’,that is to find a causal explanation for why Megan, as an individual, deviates fromthe average or desired weight for her age. During the appointment he asks manyquestions about Megan – about her development, diet, exercise, other illnesses,symptoms, schooling, friends and family. He takes measurements and samples.He discusses the evidence for, and his experience with, a variety of approachesand services – dietary regimes, weight-loss clubs, specialist physicians and cen-tres and exercise programs.
Dr Spright – Jim – has done continuing education courses in clinical ethics.He is keenly aware that his interactions with Megan and her mother are ethicallycharged, and that bioethical principles are expressed daily through the actions ofdoctors like him. Jim tries to conduct himself ethically, as he would with anyother patient. In the interests of non-maleficence, he recommends actively againstsome programs and services that he thinks are non-evidence based and exploitive.His beneficence is expressed through offering evidence-based options that hethinks will help. He tries to respect the autonomy of both Megan and her parentsin their conversation. Jim knows that Megan has her own opinions and goals andtries to draw her out whenever he can. He tries to inform but not over-inform,pulling back when they seem to be overwhelmed. He offers his own opinion –with clear reasons – when Megan and her mother ask for it. He is careful not toact in ways that could undermine Megan’s self-esteem, and he gently asks ques-tions about the role of her family in her daily habits, not assuming that she iscompletely independent in her choices [28]. Apart from being sensitive to whetheror not Megan’s family can afford private services, and whether they are insured,Jim doesn’t consider the cost of different treatments when making his recommen-dations – he considers only whether or not he thinks they are best for Megan.
A modern epidemic
240

In this sense, Megan is like any one of Jim’s patients. However Megan isalso unlike many of Jim’s patients. Megan is apparently well. If she suffers fromany current condition, it is the psychological effects of the stigma commonlyexperienced by fat people [29]. Jim is not being asked to treat a current, urgentmedical condition like a broken finger or an acute infection. Instead he is beingasked to ‘treat’ two problems: a future risk (that Megan will experience futureweight-related health problems), and a socially produced psychological condition(the product of her stigmatisation). Jim does not think about Megan in this way,however. Because of his expertise and training, because he has read many re-ports showing that obesity is potentially damaging for health, and because Meganand her mother are asking him for assistance he defines Megan’s weight as ‘aproblem’. He sets about explaining why she is fatter than other 15-year-olds, andseeks to provide an individually tailored solution in the most ethical way possi-ble. This individualism is a natural product of case analysis, attention to ethicalprinciples and clinical problem-solving. It is, however, very different from whathappens at the Obesity Summit.
WHAT ETHICAL ISSUES ARE RELEVANT FORAUSTRALIAN CITIZENS, THEIR MINISTER FOR
HEALTH AND THEIR BUREAUCRATS?The week after Jim sees Megan, he attends the Obesity Summit. Before he goeshe reads some of the preparatory material, but it doesn’t seem clear to him whichstrategies are evidence based and which are not. A lot of evidence is presented forthe prevalence of overweight and obesity, but not much about the effectiveness orimplementation of programs. Megan is on his mind as he travels to the meeting inCanberra. What good will this do her, he wonders? In fact, what difference willthis make for anyone?
There are several hundred people at the summit. Jim notices that not manyof the participants seem to be obese themselves. After the Welcome to Countryceremony the health minister is introduced. She stands amid the applause, walksto the microphone and begins her opening speech.
We face a crisis in this country. Two-thirds of Australian men are over-weight. Half of Australian women are overweight. A quarter of our childrenare overweight. Many of us are dying of the diseases that are complicationsof obesity, such as diabetes and cardiovascular disease.
The question is what we do about it. Answering that question is whatwe are here for.
Australians are simply eating more kilojoules than they are burning.Everyday foods that have become part of our daily diet are laden with kilo-
12 The ethical implications of intervening in bodyweight
241

joules. Most ordinary snacks – ice-creams, chocolate bars, soft drinks –would require an hour of fast walking to burn off. We are adding thesesnacks to our diets and simultaneously doing less and less exercise.
Somehow, we have to find a way to eat less and move around more.We need to lose some weight. I don’t think the answer is banning things.We don’t want to shut down industries, or gag their right to advertise. Wedon’t want to tell people that they can’t have treats, that they can’t celebratewith their families. We need to find ways to make people feel responsiblefor their own actions. We need to encourage industries to self-regulate. Weneed to encourage people to make better choices. We need to give peoplebetter information.
Your job is to work out how best we can do that. It’s the most im-portant health challenge facing this country today. I will look forward toreceiving the recommendations from the meeting. Thank you for agreeingto be a part of it.
Over the next few days, health bureaucrats, consumer advocates, representativesof industry, and experts from public health, epidemiology, nutrition, health eco-nomics, exercise physiology, health education and law rise to the minister’schallenge – presenting sometimes conflicting data regarding the costs to the com-munity, and to individuals, of the ‘obesity epidemic’ and calling for support for arange of interventions to meet it.
The summit concludes with a resolution calling upon the federal and stategovernments to prioritise two strategies: 1) a large, persuasive social marketingcampaign aimed at raising awareness of the problem and motivating individualsto do something about their diet and sedentary behaviours; and 2) greater fundingfor obesity-related medical consultations and for bariatric surgery, including foradolescents. These recommendations are broadly acceptable to most political in-terests at the summit. They give something to both public health professionalsand clinicians. They locate the problem and its solution with individual citizens;they permit egalitarian rhetoric via statistics showing equal ‘reach’ and ‘access’;they appear to be minimally restrictive on people’s freedoms; and they providenew income streams for some interests while not limiting the income streams ofcommercial interests. And, perhaps most persuasively, they are framed as being‘evidence based’ – although in reality they are no more or less evidence basedthan other possibilities considered at the summit.
In many ways the Obesity Summit is a success. It stimulates passing mediainterest in obesity, it brings together a range of disciplinary and sectional interestsinto open dialogue about obesity, and it generates clear recommendations for ac-tion. But closer examination of the summit reveals many of the assumptions thatunderpin policy-making around obesity, the limitations of this model of analysisand decision-making, and the potential value of a framework for explicit consid-
A modern epidemic
242

eration of issues of ethics and evidence in public health.The minister’s opening speech is familiar to anyone who has been audience
to such occasions. It begins – as such speeches often do – by conflating over-weight and obesity, associating overweight or obesity with death, and suggestinga need for weight loss, or at least behaviour change. Although the rhetoricalpower of this is clear, the evidence suggests that it is somewhat misleading. Manysystematic reviews distinguish between the health effects of obesity versus over-weight (showing overweight to be significantly less risky or even, at some ages,and in some situations, protective) and there are contradictory findings about thebenefits of weight loss [eg 30, 31, 32, 33, 34]. The speech also frames individualactions as the key problem to be solved, and implicitly advocates a purpose forintervention: encouraging individuals to change their actions. Indeed, the min-ister explicitly guards the audience against restriction of trade and commerce,makes no mention of environmental contributors to obesity and (implicitly) re-stricts the critique of government. It is easy to argue that this fails to address thefundamental root causes, conditions and environments that might stimulate suchbehaviours, ignores the ill-health that people impose on each other, and in factfocuses on preventing people from harming themselves.
The speech also emphasises that obesity is harmful and suggests that publichealth action will be beneficial. Throughout the summit, experts present com-peting accounts of the benefits and harms of various interventions, and many ofthe small group discussions focus on these evaluations. Such evaluative practicesare fundamental in both public health planning and utilitarianism. Inasmuch asthere is a positive right to health improvement, or responsibility for public healthpractitioners to improve health, then advocacy for action – including advocacyof its benefits – is reasonable and required. Yet while there is much optimistictalk of benefits, there is often very little focus on potential harms. Jim might wellthink about Megan – an overweight but not obese adolescent coping with teas-ing, anxiety and reduced self-esteem – and wonder how some of the interventionsproposed at the summit might affect her. Interventions such as the withdrawn Sin-gaporean school-based program Trim and Fit have been empirically associatedwith negative outcomes such as bullying and eating disorders for young people[35], often while producing the desired reductions in weight. This demonstratesthe importance of going beyond ‘effectiveness’ – for example, measures of de-sired behaviour change – by employing ethical reasoning. It also suggests theneed for better measurement of potential harms, including stigmatisation [20].
Public health decisions should rely on evaluations of harm and benefit [5,11, 14, 16, 17, 19]. But the utilitarian ideal of balancing all relevant benefitsand harms based on evidence is unlikely to be achieved [36]. Evidence is con-sumed in the context of political, social, media and lobbying pressures. Ourhypothetical Obesity Summit is a conglomeration of interest groups jostling forprime position, and threatening harms such as job losses, restrictions on commer-
12 The ethical implications of intervening in bodyweight
243

cial freedom of speech, or damage to economic productivity. Little wonder thenthat public health professionals, with the best intentions, feel a responsibility toprovide the most compelling evidence they can about the health benefits of in-terventions! Even the purest utilitarian decision-making requires weighing up ofnon-equivalent, and perhaps non-comparable, benefits and harms. Simple utili-tarianism can also be limited by inattention to egalitarian ideals. Fairness is rarelymeasured [23] or addressed in mainstream public health strategies [eg 37], de-spite its rhetorical prominence in public health documents [38]. Although recentcommentaries have asserted Rose’s deep concern for egalitarianism [39], the ideaof shifting an entire population towards slightly lower risk is sometimes used tojustify prioritising utilitarian average benefit over greater fairness in distributionof benefit. This is a values-based rather than an empirically based commitment[6, 22, 23]. Regarding weight, empirical evidence suggests that – for example– higher weight is associated with lower educational achievement [40], that thepoorest Australian neighbourhoods have 2.5 times as many fast-food outlets asthe richest neighbourhoods [41], and that the objective weight and subjective per-ception of the acceptability of weight in adolescents varies according to theirsocioeconomic status [42]. Thus, fair distribution may be at least as ethically im-portant as average benefit.
And what of rights, freedoms, coercion and paternalism? Although manyscholars interested in these areas have focused on pandemic contagious disease[16, 43], the issues are also critical in chronic states such as overweight, for whichthe threat of harm is less immediate and less certain. Tobacco and alcohol provideexamples of risk factors for which an argument can perhaps be made that behav-iour constitutes a threat to others (environmental tobacco smoke and violence,respectively). At the Obesity Summit, economists attempt to provide argumentsabout such other-regarding harms, including costs to the taxpayer, caring burdenson families and work absenteeism. But while each of these issues seem relevant,for the most part they fail to gain traction in discussions regarding how the gov-ernment should intervene in response to obesity, in part, because these are; a)non-health costs; b) based on highly abstracted models; and c) vulnerable to theway in which overweight versus obese individuals are classified. Any empiri-cal uncertainties regarding differential risks between these groups become highlyethically relevant to these debates, raising questions about the basis for justifica-tion of intervention.
One group of scholars has answered this question with procedural justice.If, they argue, decision-makers make themselves accountable to communities, orcan demonstrate a community mandate for action, they are justified in acting.Models for such mandates can range from the most broad (eg democratic electionof a government) to the most specific (eg deliberative processes that activelyinform and engage a representative sample of citizens and seek consensus ona course of action for a specific problem such as overweight). Summits – like
A modern epidemic
244

our hypothetical one – can help to meet the more limited requirements of trans-parency in decision-making. However, they also raise questions about the cir-cumstances under which mandate can be said to have been achieved. If summitsare populated entirely by ‘experts’ – even if that includes ‘expert’ consumer ad-vocates – can they be said to provide a real mandate? Who should legitimatelymake decisions about public health priorities? [44] Is it realistic to expect ordinarycitizens to engage in public health decision-making? Could such engagement beachieved under the right conditions? These questions are yet to be answered; theybring us to the relationship between individual and community-level intervention.
INDIVIDUAL AND COMMUNITY-LEVELINTERVENTION: THINKING ACROSS
BOUNDARIESJim Spright feels strangely unsatisfied with the whole process. It felt to him likea ‘political exercise’, and he is not convinced by the outcome. He thinks aboutwhat these strategies might do for Megan, and for Australia. The campaign mayincrease the stigma that Megan experiences at school. Greater funding for surgeryand consultations may increase healthcare costs, expectations of services and dis-tribution of services across the population. Spright is conservative with referralsfor surgery, as he’s concerned about potential, as yet unknown, future harms ofthe procedure. He’s also concerned that the increased healthcare costs may haveonly a marginal impact on the weight or health of the population. In fact, hemuses, the campaign might inspire Megan to assent to more radical interventions,like surgery, whether or not that is in her best interests. He also thinks about hispoorer patients, because he knows that they are less likely to respond to this cam-paign, and have less access to surgery. And he wonders whether these strategiesmight prove to be of most benefit to those who are already receptive to healthmessages, who already think about their health, and who already have reasonableaccess to healthcare.
Jim then thinks about how health fits into the lives of his patients. Hehas been reading lately about ‘healthism’ [45], the accusation that public healthprioritises health outcomes over other outcomes regardless of the goals of theindividuals and populations they serve. People clearly value their ‘health’, hethinks, but what does this mean? ‘Health’ and ‘public health’ can be defined verynarrowly or very broadly [44, 46, 47]. Jim can see that these strategies serve narrowdefinitions of health as physical health, but he wonders whether they are goodfor people’s health more broadly: for their wellbeing. In his consultations with apatient like Megan, he can carefully explore life goals, values, what her weightmeans and how this relates to her emotional wellbeing, fulfilment and happiness.This is difficult, and time consuming, but it can be done. However Jim knows
12 The ethical implications of intervening in bodyweight
245

that weight is not simply an individual matter [48]. If we’re going to intervene inweight in communities, how can we think about the relationship between com-munity and individual goals and freedoms?
We suggest that the best way of thinking about the ethics of intervening inindividuals’ weight and communities’ or populations’ weight is to think aboutboth at once, and to consider the relationship between them. This is surprisinglyrare, perhaps because few individuals work across the clinical–population healthboundary. However, as is clear from the summit recommendations to supportboth an extensive social marketing campaign and the medical and surgical man-agement of obesity, it is readily apparent that individuals and communities mutu-ally interact.
This suggests that it is a mistake to understand issues like obesity, and thepublic health responses to them, as simply a contest between respect for indi-vidual liberty (or autonomy) and our responsibilities as citizens, and that thereis merit in exploring some of the various ‘third way’ positions between individ-ualism and collectivism that have been suggested in public health ethics [6, 7,14, 17, 21, 27, 36, 49, 50, 51, 52]. This work suggests several answers for Jim’sconcerns that might help public health strategies to be more ethically justifiable.Respect for individual autonomy is, largely, a concern with freedom – with thefreedom to be and to do as one wishes. However, as relational approaches toautonomy have shown us, these freedoms are not a purely individual matter:they are constituted in relationships. The communities that we belong to producegoods: things that we value. It been proposed that these goods are of two kinds:aggregative and corporate [52]. Aggregative goods are simply the aggregation ofindividual goods. Corporate goods, however, are an ‘emergent social property’of communities: they can only be obtained through community collaboration orcooperation [52]. Corporate goods of public health interventions might include,for example, the creation of conditions that support sustainable future improve-ments in health, the development of new shared and valued cultural practices,or community attributes like solidarity or diversity. Corporate goods have a fu-ture orientation – rather than simply providing a present benefit, they provide abenefit available to future communities. This distinction resonates with Munthe’scall for public health interventions that both 1) promote population health, and2) promote ‘equal (and real) opportunities for everyone to be more healthy’ [50].For Munthe, this required providing the freedom to be healthy or unhealthy (in-cluding by preventing others from constraining our health opportunities), but themeans only to be healthy [50].
To take such a ‘third way’ position on intervention in weight would assistdecision-making for both individual and population-level interventions. It pro-vides an ethical rationale that resonates with Rose’s concern for intervention in‘root causes’. Changing the price structure and composition of the food soldin supermarkets, providing usable public transport, or designing a local com-
A modern epidemic
246

munity to provide healthier food outlets and better opportunities for walkingwould be recognisable interventions in root causes – of health, not just of weight.Critically, they are also corporate goods – the kind that can only be achievedthrough collective effort and which provide sustainable future benefit. They pro-vide opportunities for health and prevent others – like food producers – fromconstraining our health opportunities; however they do not constrain individu-als’ freedoms to live unhealthily if that is what they desire. Mulvaney-Day hasshown, on the basis of social network analyses, that the people one cares about –that is, one’s affective network – may be a more important influence on weightthan the people who live nearby [53]. They suggest that ethical interventions en-gage at a meso-level – the level of community – leveraging existing relationshipnetworks to change the opportunities available to people. This may, at least inpart, explain the popularity of programs such as School Kitchen Gardens [54]which provide opportunities for existing affective networks to make changes to-gether. Such programs also potentially provide both opportunities and corporategoods by changing the norms and practices in a social group, allowing those tobe handed down through generations.
The solutions chosen by the summit provide none of these collectivecommunity-level goods. Instead, the summit used a collective process to supportindividualistic solutions, with little evidence of engagement with the importantethical issues raised for clinical or public health practice. This does not, of course,suggest that participants were ignorant of, or insensitive to, many of the ethicalissues that underpin medicine and public health, but rather, that these issues werenot explicitly addressed, that the limitations of ‘evidence’ were not made clear,that the complex relationships between individuals and the communities in whichthey live were not fully exposed and that the socio-moral goals of healthcare werenot made explicit. These are important failings, because the values, focus, scopeand goals of clinical medicine and public health are both distinct and overlapping;because interventions to address problems affecting individuals and communitiesmay have different goals, risks and benefits, and because moral compromise inthe design and delivery of healthcare is always necessary. For both clinicians andpublic health decision-makers, the central task is to think through the ethical andphilosophical basis for actions before they are taken.
References1. Australian Institute of Health and Welfare (2010). Australia’s health 2010.
Australia’s health series no. 12. Cat. no. AUS 122. Canberra: Australian In-stitute of Health and Welfare.
2. Rose G (1985). Sick individuals and sick populations. International Journalof Epidemiology, 14(1): 32–38.
12 The ethical implications of intervening in bodyweight
247

3. World Health Organization (2006). Global database on body mass index.Geneva: World Health Organization.
4. Kerridge I, Lowe M & Stewart C (2009). Ethics and law for the health pro-fessions. 3rd edn. Annandale, NSW: The Federation Press.
5. Kass NE (2001). An ethics framework for public health. American Journalof Public Health, 91(11): 1776–82.
6. Kass NE (2004). Public health ethics: from foundations and frameworks tojustice and global public health. Journal of Law Medicine & Ethics, 32(2):232–42.
7. Bayer R & Fairchild AL (2004). The genesis of public health ethics.Bioethics, 18(6): 473–92.
8. Callahan D & Jennings B (2002). Ethics and public health: forging a strongrelationship. American Journal of Public Health, 92(2): 169–76.
9. Dawson A & Verweij M (2009). Public health ethics. Oxford, UK: OxfordUniversity Press.
10. Holland S (2007). Public health ethics. Cambridge: Polity.11. Nuffield Council on Bioethics (2007). Public health: ethical issues. London:
Nuffield Council on Bioethics.12. Beauchamp TL & Childress JF (2001). Principles of biomedical ethics. 5th
edn. New York: Oxford University Press.13. Beauchamp DE (1976). Exploring new ethics for public health: developing a
fair alcohol policy. Journal of Health Politics Policy and Law, 1(3): 338–54.14. Childress JF, Faden RR, Gaare RD, Gostin LO, Kahn J, Bonnie RJ, et al.
(2002). Public health ethics: mapping the terrain. Journal of Law Medicineand Ethics, 30(2): 170–78.
15. Center for Health Leadership and Practice, Public Health Institute, PublicHealth Leadership Society Ethics Work Group and Public Health LeadershipSociety Standing Committee on Public Health Ethics (2002). Principles ofthe ethical practice of public health. New Orleans, LA: Public Health Lead-ership Society.
16. Upshur RE (2002). Principles for the justification of public health inter-vention. Canadian Journal of Public Health–Revue Canadienne De SantePublique, 93(2): 101–03.
17. Gostin KG (2003). Public health ethics: tradition, profession, and values.
A modern epidemic
248

Acta Bioethica, 9(2): 177–88.18. Jennings B, Kahn J, Mastroianni A & Parker LS (2003). Ethics and public
health: model curriculum. Washington: Health Resources and Services Ad-ministration, Association of Schools of Public Health and Hastings Centre.
19. Baum NM, Gollust SE, Goold SD & Jacobson PD (2007). Looking ahead:addressing ethical challenges in public health practice. Journal of Law Med-icine & Ethics, 35(4): 657–67.
20. Carter SM, L, Lloyd B, Kerridge IH, Baur L, Bauman A, Hooker C & ZaskA (2011). Evidence, ethics, and values: a framework for health promotion.American Journal of Public Health, 101(3): 465–72.
21. Faden R & Shebaya S (2010). Public health ethics. In EN Zalta (Ed). TheStanford encyclopedia of philosophy [Online]. Available: plato.stanford.edu/entries/publichealth-ethics/ [Accessed 5 September 2011].
22. Baylis F, Kenny NP & Sherwin S (2008). A relational account of publichealth ethics. Public Health Ethics, 1(3): 196–209.
23. Daniels N (2008). Just health. Cambridge: Cambridge University Press.24. Thomas JC, Sage M, Dillenberg J & Guillory VJ (2002). A code of ethics
for public health. American Journal of Public Health, 92(7): 1057–59.25. Anderson S (2008). Coercion. In EN Zalta (Ed). The Stanford encyclopedia
of philosophy [Online]. Available: plato.stanford.edu/archives/fall2008/en-tries/coercion/ [Accessed 2 September 2011].
26. Dworkin G (2010). Paternalism. In EN Zalta (Ed). The Stanford encyclope-dia of philosophy [Online]. Available: plato.stanford.edu/archives/sum2010/entries/paternalism/ [Accessed 2 September 2011].
27. Dawson A & Verweij M (2008). The steward of the Millian state. PublicHealth Ethics, 1(3): 193–95.
28. Entwistle VA, Carter SM, Cribb A & McCaffery K (2010). Supporting pa-tient autonomy: the importance of clinician–patient relationships. Journal ofGeneral Internal Medicine, 25(7): 741–45.
29. Puhl RM & Heuer CA (2009). The stigma of obesity: a review and update.Obesity, 17(5): 941–64.
30. Janssen I & Mark AE (2007). Elevated body mass index and mortality riskin the elderly. Obesity Reviews, 8(1): 41–59.
31. Lenz M, Richter T, Muhlhauser I, Lenz M, Richter T & Muhlhauser I
12 The ethical implications of intervening in bodyweight
249

(2009). The morbidity and mortality associated with overweight and obesityin adulthood: a systematic review. Deutsches Arzteblatt International,106(40): 641–48.
32. McGee DL & Diverse Populations Collaboration (2005). Body mass indexand mortality: a meta-analysis based on person-level data from twenty-sixobservational studies. Annals of Epidemiology, 15(2): 87–97.
33. Oreopoulos A, Padwal R, Kalantar-Zadeh K, Fonarow GC, Norris CM &McAlister FA (2008). Body mass index and mortality in heart failure: ameta-analysis. American Heart Journal, 156(1): 13–22.
34. Romero-Corral A, Montori VM, Somers VK, Korinek J, Thomas RJ, AllisonTG, Mookadam F & Lopez-Jimenez F (2006). Association of bodyweightwith total mortality and with cardiovascular events in coronary artery dis-ease: a systematic review of cohort studies. The Lancet, 368(9536): 666–78.
35. Lee HY, Lee EL, Pathy P & Chan YH (2005). Anorexia nervosa in Singa-pore: an eight-year retrospective study. Singapore Medical Journal, 46(6):275–81.
36. Wyniaa MK (2005). Oversimplifications I: physicians don’t do publichealth. The American Journal of Bioethics, 5(4): 4–5.
37. Carter SM, Hooker LC & Davey HM (2009). Writing social determinantsinto and out of cancer control: an assessment of policy practice. Social Sci-ence & Medicine, 68(8): 1448–55.
38. First International Conference on Health Promotion (1986). Ottawa Charterfor Health Promotion, WHO/HPR/HEP/95.1. Ottawa: World Health Organi-zation, 21 November.
39. Rose G, Khaw K-T & Marmot M (2008). Rose’s strategy of preventive med-icine: updated edition. Oxford: Oxford University Press.
40. Cameron AJ, Welborn TA, Zimmet PZ, Dunstan DW, Owen N, Salmon J,Dalton M, Jolley D & Shaw JE (2003). Overweight and obesity in Australia:the 1999–2000 Australian diabetes, obesity and lifestyle study (AusDiab).Medical Journal of Australia, 178(9): 427–32.
41. Reidpath DD, Burns C, Garrard J, Mahoney M & Townsend M (2002). Anecological study of the relationship between social and environmental deter-minants of obesity. Health & Place, 8(2): 141–45.
42. O’Dea JA & Caputi P (2001). Association between socioeconomic status,
A modern epidemic
250

weight, age and gender, and the body image and weight control practicesof 6- to 19-year-old children and adolescents. Health Education Research,16(5): 521–32.
43. Bayer R (1988). AIDS and the ethics of public-health: challenges posed bya maturing epidemic. Aids, 2: S217–S221.
44. Ruger JP (2010). Health and social justice. New York: Oxford UniversityPress.
45. Skrabanek P (1994). The death of humane medicine and the rise of coercivehealthism. Suffolk: The Social Affairs Unit.
46. Rothstein MA (2002). Rethinking the meaning of public health. Journal ofLaw Medicine & Ethics, 30(2): 144–49.
47. Buchanan DR (2000). An ethic for health promotion: rethinking the sourcesof human wellbeing. New York: Oxford University Press.
48. Holm S (2008). Parental responsibility and obesity in children. PublicHealth Ethics, 1(1): 21–29.
49. EuroPHEN (European Public Health Ethics Network) (2006). Public poli-cies, law and bioethics: a framework for producing public health policyacross the European Union. European Union Member States: Funded bythe European Commission, DG Research, under FP5, Quality of Life Pro-gramme QLG6–CT–2002–02320, Accessed at: www.europhen.net
50. Munthe C (2008). The goals of public health: an integrated, multidimen-sional model. Public Health Ethics, 1(1): 39–52.
51. Jennings B (2009). Public health and liberty: beyond the Millian paradigm.Public Health Ethics, 2(2): 123–34.
52. Widdows H & Cordell S (2011). Why communities and their goods matter:illustrated with the example of biobanks. Public Health Ethics, 4(1): 14–25.
53. Mulvaney-Day N & Womack CA (2009). Obesity, identity and community:leveraging social networks for behavior change in public health. PublicHealth Ethics, 2(3): 250–60.
54. Gibbs L, Staiger P, Townsend M, Macfarlane S, Block K, Gold L, JohnsonB, Long C, Kulas J, Ukoumunne OC & Waters E (2009). Evaluation of theStephanie Alexander Kitchen Garden Program. Melbourne: The StephanieAlexander Kitchen Garden Foundation [Online]. Accessed at:www.kitchengardenfoundation.org.au/about–the–program/prov-
12 The ethical implications of intervening in bodyweight
251

ing–it–works [Accessed 2 September 2011].
A modern epidemic
252
13How law and regulation can addvalue to prevention strategies for
obesity and diabetesRoger S Magnusson1
Steadily rising rates of overweight and obesity among adults and childrenin Australia and elsewhere are fuelling debate about the most effective andappropriate strategies for obesity prevention. This chapter defends a rolefor law in policy efforts to prevent obesity and to improve nutrition at thepopulation level. Rather than targeting individuals and seeking to directlyinfluence their dietary choices and patterns of physical activity, I argue thatthe best opportunities for law lie in improving the environment in orderto support healthier choices and to reduce exposure to the wide range offactors that have made weight gain increasingly common. Secondly, thischapter presents four Australian case studies, with comparisons from theUS and the UK, to illustrate the variety of priority interventions that couldtake legal form.
On my first day of law school, I was introduced to the law of contracts and thelaw of torts. In five years of lectures, however, never once did I come across the‘law of obesity prevention’. Hitherto, preventing obesity has never been consid-ered part of the role of law or lawyers. Lawyers have never been called on todefend the role of law in obesity prevention, or to identify the content of a pack-age of legal interventions having that goal. The same might be said about the lawof cardiovascular disease, or diabetes prevention.
Historically, public health law in Australia, Britain and the United States hasbeen the law of unsanitary premises, abatement, and quarantine. Later, it evolvedto include notifiable diseases, HIV/AIDS, tobacco control, and more recently –certainly in the United States – the law of public health emergencies and ‘pan-demic preparedness’. In other respects, public health laws in all three countrieshave developed in a reactive and haphazard manner, reflecting successive healthcrises, fears and political priorities that vary between jurisdictions. Writing about
1 Sydney Law School, University of Sydney.
253

English public health legislation, Robyn Martin argues that it neither has the pro-motion of health as its primary focus, ‘nor does it particularly address the causesof ill-health’. Instead, its focus is on inadequate premises, ‘on an understandingthat ill-health results from identifiable bodies escaping from a physical source’[1]. Only more recently, as Australian public health acts have undergone a processof renewal, has legislation become more proactive, and less issue-specific. SouthAustralia’s new Public Health Act is the first such act in Australia to include spe-cific provisions for the prevention of non-communicable conditions [2].
Quite apart from this, rising rates of overweight and obesity among adultsand children have been fuelling debate about the most effective and appropriatestrategies for prevention. Legal scholarship on obesity prevention, although rel-atively recent, is increasing in popularity, although with substantial differencesthat reflect the constitutional structure and political traditions of each country [3,4, 5, 6, 7, 8, 9]. Suggested legal strategies are wide-ranging and extend far beyondthe boundaries of the health sector and the traditional ‘turf’ of public health Acts.
This chapter defends a role for law in policy efforts to prevent obesity andto improve nutrition at the population level. Rather than targeting individuals di-rectly and seeking to coerce dietary changes, or greater levels of physical activity,I argue firstly that the best opportunities for law lie in improving the environmentin order to support healthier choices and to reduce exposure to the wide range offactors that have made weight gain increasingly common. This emphasis is sig-nificant: by focusing on policy, systems and environmental changes, rather thanbehavioural change directly, law can address the factors that shape patterns ofbehaviour at a population level, while avoiding the coercive and discriminatorylaws to which an excessive emphasis on ‘personal responsibility’ could lead [10,11, 12, 13].
Secondly, having set out a philosophy or framework for how law can contrib-ute to obesity prevention, this chapter presents four case studies to illustrate thevariety of legal interventions in this area. Each case study will be argued throughin sufficient detail to illustrate the contested nature of legal interventions, withcomparisons between regulatory developments in Australia, the US and the UK.
THE TREND TOWARDS POPULATION WEIGHTGAIN: WHY DOES IT MATTER?
The prevalence of overweight and obesity is based on measurements of bodymass index (BMI), which divides weight in kilograms by height squared (m2).In Australia, results from the 2007–2008 National Health Survey showed that68% of men, and 55% of women were either overweight (BMI 25.0–29.9 kg/m2)or obese (BMI ≥30 kg/m2), based on measured BMI [
14]. Among children aged
A modern epidemic
254

seven to 15, almost 25% were overweight or obese, rising from 20.7% in 1995,and 11.5% in 1985 [15]. According to a Victorian government study, if currenttrends continue, 83% of males and 67% of females will be overweight or obeseby 2025, as well as over one-third of children [16].
In Australia in 2003, cardiovascular disease (CVD) and cancer accounted forsome 37% of the total burden of disease [17].2 Table 1 illustrates the extraordi-nary impact of modifiable risk factors on disability-adjusted life years (DALYs)from all causes in Australia, and on the leading causes of disease burden, includ-ing CVD and cancer. In 2003, overweight and obesity accounted for 7.5% of theburden of disease: almost as much as smoking (7.8%).
Table 1. The contribution of behavioural risk factors to the burden of disease in Aus-tralia, 2003*
Determinant % of DALYS (allcauses)#
% of DALYS (specificcauses)^
Tobacco 7.8% 20.1% of cancer
High blood pressure 7.6% 42.1% of CVD
Overweight & obesity 7.5% 19.5% of CVD
Physical inactivity 6.6% 23.7% of CVD
High blood cholesterol 6.2% 34.5% of CVD
Alcohol harm 3.3% 3.1% of cancer
Alcohol benefit –1.0% –4.7% net benefit on CVD
Lack of adequate fruit, vegetableintake
2.1% 9.6% of CVD
* Begg S, Vos T, Barker B, Stevenson C, Stanley L & Lopez A (2007). The bur-den of disease and injury in Australia, 2003. Canberra: AIHW. PHE 82 (p74).
# Disability-adjusted life years
^ Contribution of each risk factor is independent of other risk factors (analysis isnot additive)
2 The term ‘burden of disease’ refers to a combination of years of life lost throughpremature mortality, combined with the years of healthy life lost, due to disease.Typically, the burden of disease is measured in disability-adjusted life years, orDALYs.
13 How law and regulation can add value to prevention strategies for obesity and diabetes
255

Overweight and obesity are risk factors for high blood pressure, raised cho-lesterol, impaired glucose tolerance, a range of chronic conditions includingCVD (coronary heart disease and stroke), type 2 diabetes, a variety of cancers(including colon, breast and ovarian cancer), as well as gallbladder disease, os-teoarthritis, gout, and sleep apnoea [18]. Many of these conditions are exacerbatedby high blood pressure (for which excess salt consumption is a risk factor), highblood cholesterol (for which excess consumption of saturated fat is a risk factor),and inadequate intake of fresh fruit and vegetables. According to one estimate,in 2007, around 24% of type 2 diabetes, 21% of cardiovascular disease, 25% ofosteoarthritis, and 21% of colorectal, breast, uterine and kidney cancer were at-tributable to obesity [19].
In the US, the prevalence of obesity (defined as BMI >30 kg/m2) remainedrelatively stable from 1960 to 1980 but climbed sharply thereafter, from 15% in1976 to 1980, to 34% in 2007–2008 [20, 21]. Over the same period, obesity in chil-dren and adolescents (aged two to 19 years) tripled from over 5% to 17% [22].Overall calorie intake, mean intake from carbohydrates, and absolute fat intakealso increased over this period [23, 24]. Some epidemiologists warn that increasesin BMI in the US, and its impact on diabetes, CVD and other conditions, will in-creasingly outweigh the positive impact on life expectancy of declining smokingrates, and could cause a decline in life expectancy at birth and at older ages duringthe first half of this century [25, 26, 27]. In Australia, D’Arcy, Holman and Smithhave warned that, based on recent trends in population weight gain, by the timethey are 20, the life expectancy of Australian children will fall two years, pullingthem back to 2001 and 1997 levels for males and females, respectively [28].
In 2010, Colagiuri and colleagues estimated the total direct costs of over-weight and obesity in Australia in 2005 at A$21 billion, with an additionalA$35.6 billion spent by government on pensions and subsidies [29]. Between2003 and 2033, treatment costs for type 2 diabetes are estimated to increase by520%, from A$1.3 billion to A$8 billion, largely driven by the impact of risingobesity rates on diabetes prevalence [30]. In the US, by 2008, annual medical costsattributable to obesity are estimated to have reached US$147 billion [31]. In 2007,RAND Corporation estimated that if current trends continue, by 2020 up to one-fifth of all healthcare expenditures could be obesity related [32].
DEBATES ABOUT THE RIGHT POLICY APPROACHTO POPULATION WEIGHT GAIN
The susceptibility of individuals to weight gain is influenced both by non-modifi-able factors such as age, sex and genetics, and by modifiable dietary and physicalactivity patterns. Modifiable factors contributing to energy oversupply includethe frequency and energy value of the food eaten (fat and alcohol contain more
A modern epidemic
256

calories per gram than protein and carbohydrates), and the duration and inten-sity of physical activity. On the other hand, obesity is also a population issue: theweight distribution of the population as a whole has drifted steadily to the rightover the past two decades.
The rapid changes in national obesity rates over the past few decades suggestthat it is environmental influences upon average eating and physical activity pat-terns within the population that explain the epidemic, rather than individual orgenetic factors [33, p118]. Previous generations shared our genes and physiology,but rates of obesity were lower. Explaining the trend towards weight gain solelyin terms of people eating too much and exercising too little is self-evident, butignores the impact of environmental and policy factors on changes in average be-haviour, and hence the causes of the trend itself. The temptation to explain anemerging epidemic, such as obesity, purely in terms of the private choices of in-dividuals also obscures the contribution of corporate behaviour (such as the foodindustry) to population health trends, as well as the responsibility of governmentsto create the conditions for a healthy lifestyle. Understanding this is critical if weare to develop an effective response.
If Australians, as a population, were to adopt a healthier lifestyle, there islittle doubt that life expectancy, and healthy life expectancy, could dramaticallyincrease. For example, the INTERHEART study found that over 90% of the riskof heart attack in men and women, young and old, across all geographical regionsand ethnic groups, could be predicted by eight risk factors, several of which arecertainly modifiable [34]. These are: smoking, physical inactivity, obesity, highblood pressure, high blood cholesterol, diabetes, inadequate fruit and vegetableintake, and psychosocial stressors.
Knowing this, however, is not enough. As the trend towards weight gain il-lustrates, people find it difficult to eat healthily and to maintain energy balance.In a survey of over 150 000 Americans, 76% were non-smokers, 40% had ahealthy weight, 23% had the appropriate intake of fruit and vegetables, and 22%exercised regularly. But only 3% of the sample were following all four of thesehealthy lifestyle factors [35]. One of the authors of the study said: ‘The effect offollowing these [lifestyle guidelines] is greater than anything else medicine has tooffer. I don’t know anything a doctor’s office can do that would reduce your riskof diabetes or cardiovascular disease by 80% or 90%’ [36]. In Australia, Atlantisand colleagues found that while 55% of Australians are eating enough fruit, lessthan one in four were meeting national guidelines for physical activity (a min-imum of 2.5 hours per week of moderate-intensity physical activity, includingwalking, spread across five or more days per week). Less than 15% were meetingeating enough vegetables, and less than 5% were doing all three [37].
Faced with policy challenges as complex and contested as obesity, there isa temptation for governments in liberal, market-oriented societies – facing coor-dinated pressure from food and beverage manufacturers and retailers – to frame
13 How law and regulation can add value to prevention strategies for obesity and diabetes
257

the problem as one that individuals face. The answer seems blindingly obvious:every individual should exercise more ‘personal responsibility’. In well-quotedcomment, Australia’s former health minister, the Hon. Tony Abbott MHR said:
It is estimated that obesity adds about a billion dollars a year currently tothe nation’s health bill. Obviously I would rather that we didn’t have tospend that money … but in the end if people are obese it’s because they’reeating too much or they’re exercising too little, and the answer is in thehands of those individuals [38].
This is wise counsel – for individuals. However, as a conceptual framework forreducing national healthcare costs and the burden of disease caused by obesityand diabetes, it will continue to fail.
Unless motivational strategies and health promotion can magically unlocknew personal resources for healthy living that are not already being tapped bythe weight-loss industry, or neutralised by the variety of influences in modern so-cieties that make healthy living difficult (such as time poverty, long commutes,loss of cooking skills, food marketing and the ubiquity of cheap, unhealthy food),then this is a counsel of despair. Governments are often attracted to health promo-tion campaigns using mass media, which were an effective tool in tobacco controlstrategies. As Wakefield and colleagues point out, however, media campaignsare likely to be more successful when the behaviour that needs to be changed is‘one-off or episodic’. This is not the case with healthy eating and physical activ-ity, which requires sustained discipline and daily effort, well after the campaignshave ended (39]. Furthermore, the norms about ‘normal weight’ are changing.Surveys indicate that males and females in the US [40] and the UK [41], andAustralian males [42] do not perceive their (over)weight accurately. Unless indi-viduals recognise when they are overweight, they may have little reason to altertheir lifestyles.
To summarise so far: taking responsibility for health is an excellent idea forindividuals. However, populations cannot necessarily be expected to ‘take re-sponsibility’ or to ‘shape up’ in the way that individuals (sometimes) can. Massmedia campaigns are part of a comprehensive policy response, but governmentsneed to be realistic about what they can achieve. To arrest the population-widetrend towards weight gain, we need to address factors to which the population asa whole is exposed: the social forces that shape the way people live [43].
WHERE DOES LAW AND REGULATION FIT WITHOBESITY PREVENTION STRATEGIES?
Most models for understanding the causes of health and disease recognise that
A modern epidemic
258

health outcomes are the result of a complex interplay of environmental, socioe-conomic, biological and individual behavioural factors, partially modified byinteractions with the healthcare system (Figure 1) [44]. Strategies for obesity pre-vention tend to reflect different assumptions about the relative importance of thepolicy, systems and environmental factors that lie outside of the individual, thebehavioural factors that are the individual, and the biological and genetic influ-ences that lie within the individual. The discussion above has already pointed outthe limitations of strategies that focus narrowly on the behavioural domain, re-lying on mass marketing to encourage personal responsibility and motivationallyled, self-directed changes in behaviour. As discussed below, each of the strategicdomains set out in Figure 1 – the environment (from global to local level), indi-vidual behaviours, and the health system – provide opportunities for regulatoryinterventions that could contribute to healthier eating and improvements in phys-ical activity at a population level. The challenge for public health lawyers is toidentify law reform priorities and to make the case for those interventions whichare best implemented through legal and regulatory processes.
(i) Regulating the healthcare systemPopulation growth and the ageing of the population mean that Australia’s health-care system will face a higher burden of chronic disease in future. In 2008, forexample, over one million Australians had type 2 diabetes, and over 242 000of them had it as a result of being obese (an increase of 137% over 2005 fig-ures) [19]. Law plays a crucial role in improving the effectiveness of clinicalcare; for example, by creating stable rules for the sharing of patient data withinan electronic health records system that enjoys public trust, yet permits optimalaccess to a patient’s data at all points of care. In Australia, important elementstowards achieving this include the development of a personally controlled elec-tronic health records service [45], which builds on the Healthcare IdentifiersService that uniquely identifies individuals and healthcare providers [46, 47].
In a bold experiment, New York City extended notifiable disease reportingto chronic disease risk factors, through the mandatory reporting of haemoglobinA1c (glycated haemoglobin, a measure of blood glucose control). By making di-abetes a notifiable disease, the New York City Department of Health and MentalHygiene is creating a registry that will map the epidemiology of hyperglycaemiaand help to facilitate care for the estimated one-third of diabetics who are un-aware of their condition [48, 49, 50].3 Although controversial [51], this initiative
3 Following a pilot project in the Bronx, patients in New York City with blood glucoselevels above a certain level receive information (on an opt-out basis) about thelifestyle changes required to reduce health risks. Treating physicians are given a re-port which enables them to identify patients whose diabetes is not well controlled,
13 How law and regulation can add value to prevention strategies for obesity and diabetes
259

deserves careful study elsewhere. Due to the frequent co-location or clusteringof chronic disease risk factors in the same individual [52, 53, 54], the New YorkCity law could assist in identifying other risk factors for chronic disease in indi-viduals who – not coincidentally – tend to be of lower socioeconomic status [55,56, 57]. Ironically, it is this capacity for chronic disease risk surveillance to poten-tially contribute to reducing health inequalities that also enables this strategy tobe framed as discrimination against poor people of colour.
Figure 1. A simplified, hierarchical model of the determinants of health and disease
In addition to improving diagnosis and treatment, regulation can enhance theprocess of integrating secondary prevention within primary healthcare systems.The Australian Government has taken several initiatives in this direction, includ-ing the introduction of new Medicare item numbers providing reimbursement forgeneral practitioners to carry out medical check-ups on patients aged from 45to 49 who present with identifiable risk factors for chronic disease, and patientsaged from 40 to 49 whose risk factors (including excess weight) put them at riskof developing type 2 diabetes [58].4 In its comprehensive review of strategies for
and a summary of glycaemic control among patients in the practice which can becompared with a NYC benchmark.
4 For patients with diagnosed chronic or complex health conditions, Medicare rebatesare payable for a limited number of consultations with allied health professionalservices, as part of an Enhanced Primary Care plan coordinated by a general
A modern epidemic
260

chronic disease prevention, the National Preventative Health Taskforce recom-mended that the Medical Benefits Schedule should support prevention throughpractice-level incentive payments or payments to individual medical practition-ers to support brief interventions and a followup consultation directed to tobacco,alcohol, obesity, or other risk factors for chronic disease [59, p260]. In the UK,pay-for-performance contracts have been a feature of general practice reform;a substantial proportion of GP income depends upon ‘quality points’ that areearned when practice targets are met, including those for the assessment and man-agement of risk factors for heart disease, asthma and diabetes [60, 61]. UnlikeAustralia, patient registration with local NHS practices facilitates continuity ofcare and a stable patient group for measuring performance.
In Australia, the Practice Incentive Program currently supports performance-based incentive payments to general practices for the successful management ofdiabetes patients, amongst other areas [62, 63]. The Australian Primary Care Col-laboratives program also supports primary practices to improve their capacity tomanage and reduce risk factors in the patient group, and to improve managementof chronic and complex conditions [64, 65].
From July 2011, the Australian Government began to roll out a network ofindependent, primary healthcare organisations, known as Medicare Locals [66].Building on the existing Divisions of General Practice, Medicare Locals iden-tify service gaps and develop formal and informal linkages to integrate the careprovided by different service providers. Their role also includes the delivery ofhealth promotion and risk prevention programs targeted to the risk profiles of lo-cal communities [67, pp8, 48].
(ii) Targeting the behaviours of individualsMany people would intuitively understand legal strategies for obesity preventionas crude attempts at behaviour modification, whether through education, financialincentives and disincentives, or more direct forms of control. More benign in-terventions include evaluative food labelling initiatives which, quite apart fromencouraging reformulation by food manufacturers, aim to alter purchasing pat-terns by educating consumers about the nutrient qualities of foods. Less benigninterventions that might be seen as ‘targeting’ the behaviour or weight status ofindividuals include restrictions on taxpayer-funded medical procedures for obesepatients and smokers [68, 69, 70], or the elimination of community rating result-ing in differential premiums for private health insurance, and other restrictions incoverage, based on one’s obesity or health status.
In April 2008, Japan introduced a legal requirement on companies and local
practitioner: Australian Government Department of Health and Ageing. EnhancedPrimary Care Program, at: www.health.gov.au/epc.
13 How law and regulation can add value to prevention strategies for obesity and diabetes
261

governments to measure the waistlines of Japanese people aged from 40 to 74 aspart of their annual check-up. Japan has adopted official limits for waistlines –33.5 inches for men, and 35.4 inches for women, based on International DiabetesFederation estimates for identifying health risks. Companies and local govern-ments that fail to meet targets for measuring waistlines will be fined [71]. Thesepolicies raise the question of who should bear responsibility for the rising preva-lence of lifestyle risk factors, including obesity, not to mention the ethics ofintruding into the lives of individuals and discriminating against them based onweight [10, 11, 12].
Imposing an additional tax on high-fat or high-salt foods, or eliminating taxconcessions for novated vehicle leases, illustrate policies that aim to ‘nudge’ be-haviour in a healthier direction by increasing the costs of unhealthy choices andregulating in order to make the healthy choice the ‘default option’ [12, 72]. Thesepolicies are defended on the basis that people find it difficult to make choicesthat are consistent with their longer-term preferences and welfare, for reasonsthat include limited willpower, inadequate information and cognitive constraints,and social and cultural influences, including advertising [12, 73]. People are alsooveroptimistic, preferring current consumption while discounting its future, ad-verse impacts on them personally [74].5 On the other hand, policies can subtlyshape patterns of choice within populations in ways that are not necessarily medi-ated through the conscious deliberations of individuals. Interventions of this kindare best understood as being directed at the broader environment, rather than atindividuals.
(iii) Improving the quality of the economic, social, physicaland policy environment
Although debate persists about the underlying drivers of energy imbalance andweight gain, economic factors are crucial [75, 76]. Relevant factors include the re-duced cost of food (particularly energy-dense carbohydrates), and the growth of acommercial food sector marketing processed snack foods (leading to an increasein snacking). Pre-prepared and pre-packaged foods are ubiquitous and heavilymarketed, and manufacturers compete for market share by satisfying human pref-erences for energy-dense, fatty, salty, and sweet foods. Boyd Swinburn points outthat the trend towards population weight gain is evidence of commercial success[77], although weight gain brings longer-term costs that the industry externalises.
5 As Marteau, Oliver and Ashcroft [74] point out, ‘Unfortunately, the health costsof many behaviours occur in the future, whereas their benefits are enjoyed in thepresent. The so-called obesogenic environment reflects the operation of these twoprinciples – that is, an environment that contains a plethora of readily realized op-tions that offer immediate gratification but that cause and sustain obesity’.
A modern epidemic
262

In addition to the changing food culture, technological change has resulted inhigh levels of car use, and less need for both incidental physical activity andarduous work. Entertainment is frequently passive; not surprisingly, there is acorrelation between overweight and hours spent watching television [78].
Scholars point out that population weight gain is, in fact, a normal responseto these environmental influences upon diet and physical activity patterns [76].Two factors follow. Firstly, if the causes of population weight gain lie in the en-vironmental domain, then mitigation ‘require[s] socioeconomic, not health sectorreforms’ [76, p12]. A feature of so-called population health approaches to obe-sity prevention is the emphasis on interventions that address these ‘upstream’environmental and socioeconomic determinants. As Geoffrey Rose stated, a pop-ulation health approach ‘attempts to remove the underlying causes that make thedisease common’ [79]. To the extent that this can be done successfully, a popu-lation health approach has the capacity to shift ‘entire risk factor distributions atthe population level, not simply the causes of cases at the individual level’ [80].
On the other hand, this does not mean that obesity prevention is the processof identifying and seeking to reverse the factors that plausibly explain the popula-tion trend. Not only would it be impossible to reverse the processes of economicdevelopment and globalisation that have given us higher incomes, labour-savingdevices, television, pre-prepared food, and a higher proportion of women in thepaid workforce, it would also be highly undesirable. Rather than return societyto the Stone Age, the policy priority is to identify feasible, evidence-informedand culturally acceptable ways of counteracting the impacts of an ‘obesogenic’environment. Necessarily, this involves finding ways of effectively achievingpopulation nutrient intake goals: reducing salt, fat and free sugars, improvingintake of fibre and fresh fruit and vegetables, and increasing levels of physicalactivity [81].
I would argue that the best opportunities for law lie in addressing the so-cioeconomic and environmental factors that are driving the increase in averageweight gain. ‘Privatising’ the obesity epidemic – confining it to the healthcaresetting, or emphasising personal responsibility to the exclusion of everything else– is unlikely to reverse the trend. Until policy-makers focus on the influences towhich populations are exposed, there will be nothing to prevent the occurrenceof new cases [33, p178]. On the other hand, to the extent that societies are suc-cessful in creating supportive environments that encourage healthier lifestyles, itwill be ‘less necessary to keep on persuading individuals’ [79]. By using legaland policy levers to alter the obesogenic environment, the goal is to ‘outweigh’those environmental contributors to energy imbalance that it is not feasible tochange. An environment that better supports healthier choices and lifestyles willalso be a more fertile ground for education strategies and health promotion, andfor targeted strategies pursuing behaviour change and significant weight reduc-tion among high-risk groups [82, 83, 84, 85].
13 How law and regulation can add value to prevention strategies for obesity and diabetes
263

A final point to make is that where the absolute risk of the population is toohigh – because, for example, average weight, salt or saturated fat intake is toohigh – it is not the case that the only ones to benefit from prevention policies arethose who have the highest relative risk by virtue of being on the far right handtail of the distribution. The risk of diabetes, for example, rises modestly with BMIwithin the normal range, and exponentially at higher levels [86]. Although inter-ventions may benefit the smaller number of people at highest risk, the greatestbenefit may be among the much larger number of people in the middle part of thedisease distribution who are exposed to a relatively low risk [33, pp176–78, 87].
THE IMPORTANCE OF A ‘PLAUSIBLE POLICYBASKET’
Before suggesting some law reform priorities for obesity prevention, a dose ofrealism is needed. No society has yet succeeded in reversing the future reservoirof disease and healthcare expenditure that population weight gain will produce[88]. Given the tenacity of many of the conditions that currently contribute topoor diet and sedentary lifestyle – from long working hours and lack of time, togeographically dispersed suburbs – multiple policy changes will be needed. Im-plementing a sufficiently broad basket of policies through the political processwill be extremely challenging, and incremental progress is the most likely sce-nario. Nevertheless, serious action on obesity prevention is needed now, beforethings get worse, relying on the best available evidence, monitoring the entirebasket of policies, and adding promising new ones as they become feasible. In-sisting on cast-iron evidence of effectiveness for each new policy is an invitationto policy paralysis. Sensibly, the National Preventative Health Taskforce calledfor a ‘trialling of a package of interventions’ accompanied by monitoring andevaluation: a ‘learning by doing’ approach [67, p92].
Scholars including Anjali Jain have pointed out that since there are multipledeterminants of population weight gain, ‘solutions are also likely to be multifac-torial, with no single intervention providing widespread success. Thus it is lessimportant to isolate why an approach is successful, than it is to find interven-tions that work’ [89, p1388]. It is the combined impact of a basket of ‘plausibleinterventions’ that is likely to make a difference: no single policy is likely to de-liver a ‘king hit’. At the same time, it is the complex and multi-factorial natureof population weight gain that makes law reform a constant struggle. In so far aspolicy-makers seek to regulate individual behaviours in ways that move beyondeducation and advice-giving, they run the risk of offending civil libertarians. Inso far as they adopt a population health perspective and move upstream, seekingto influence the social and economic determinants of obesity and chronic disease,they risk offending the free marketeers. Since a population-wide approach nec-
A modern epidemic
264

essarily seeks to achieve changes in the behaviours of large number of people,policies will inevitably have an impact on those who do not perceive themselvesto be at risk and who may resent the ‘interference’. Selling temperance is difficultat the best of times, and becomes even harder when the food industry unites inopposition to a proposed policy initiative, decrying the lack of evidence, in cir-cumstances when the scale of the benefit to public health is unknown, despite itslikely value as part of a package of interventions. Critics fume that public healthshould stick to what it knows best: communicable diseases control, and keepingbugs out of the food supply. They resent public health becoming a smokescreenfor interference in the market economy, or for policies to redress health inequali-ties by re-shaping the political economy [90, 91, 92, 93].
OBESITY PREVENTION AND THE STRUGGLE FORREGULATORY CONTROL
Ultimately, law’s role in chronic disease and obesity prevention boils down to theexercise of raw political power. As Stephen Leeder points out, ‘It’s war’ [94]. Un-derlying reasons for opposing the use of law and regulation as tools for obesityprevention are not difficult to uncover. Firstly, obesity is neither contagious, norreadily transmitted to others (notwithstanding evidence that obesity – probablythrough its behavioural antecedents – spreads through social ties over significantperiods of time) [95]. It follows that the justification for interfering with individ-ual preferences in order to protect the population from health risks to which it hasnot consented, is absent.
Secondly, the goal that underlies at least some interventions for obesity pre-vention involves reducing consumption, whether it be total calories, the amountof saturated fat in the diet, or the habit of snacking. The interests of the food andbeverage industry, on the other hand, lie in avoiding policies that could de-sta-bilise revenue flows based on consumer preferences and markets – as shaped byindustry.
Thirdly, obesity prevention strategies are often vulnerable to attack by eco-nomic conservatives and libertarians who frame the prospect of any regulation– even controls on advertising and clearer nutrition labelling – as evidence of‘nanny state’ interference with the personal autonomy of consumers and parents[90, 91, 92, 93, 96, 97].6 The Hon. Tony Abbott MHR stated in 2006:
6 As Joseph Sullum (90) writes, ‘The war on fat … reflects an anti-capitalist perspec-tive that views people as helpless automatons manipulated into consuming whateverbig corporations choose to produce. The anti-fat crusaders want to manipulate ustoo, but for our own good’ (p23).
13 How law and regulation can add value to prevention strategies for obesity and diabetes
265

I don’t think we can put people in cotton wool. I don’t think we can coverour population in cling-wrap. I think people need to retain substantial au-thority over how they live their lives … I think the role of the Government,in this instance at least, is not so much to regulate, let alone to ban. I thinkits role is to encourage, to inform and to give good example [98].
An alternative view would acknowledge that governments are stewards of thehealth of the population, and have a responsibility to invest in policies that sup-port healthier lifestyles in ways that do not unduly burden individual freedom.To the extent that governments acknowledge this responsibility, a populationhealth approach offers important advantages. By targeting the influences upon –and influencers of – behaviour, rather than the behaviour itself, regulatory inter-ventions can contribute to health improvement without stigmatising individuals,or micro-managing their lifestyles [99]. Success in tobacco control, for example,came about while substantially preserving the liberty of adults to smoke wherethis does not jeopardise the health of others [100].
The obstacles to effective obesity prevention law reform are not only ide-ological. Effective structures for facilitating a comprehensive, inter-sectoral ap-proach do not even exist. Government agencies have their own entrenched cul-tures: it can be difficult to collaborate with them, difficult to usurp their turf, anddifficult to route around them. Political leadership is required from the top, andfederalism complicates everything [101, 102]. With this in mind, the remainder ofthis chapter reviews four case studies for legal and regulatory interventions tosupport obesity prevention.
PRIORITIES FOR LAW AND REGULATION IN THEPREVENTION OF POPULATION WEIGHT GAIN
So far, I have argued that a sustainable approach to reversing the trend towardspopulation weight gain calls for a ‘plausible policy basket’ that focuses sig-nificantly – not necessarily exclusively – on creating environments that bettersupport physical activity and healthy eating. Piecemeal, ad hoc responses are un-likely to have a major impact, due to the combined force of the many factors thatsubtly encourage excess energy intake and a sedentary lifestyle.
The strategies that law can deploy as a tool to prevent obesity and to encour-age an active lifestyle can be described in different ways [5, 6, 7, 8]. Gostin’swell-known model [103] includes:
• laws that shape the informational environment, for example, mandatory front-of-pack nutrition labelling [104], restaurant calorie labelling of ‘standard fooditems’ [105, 106, 107], and laws restricting the advertising of energy-poor,nutrient-poor foods to children;
A modern epidemic
266

• economic policies that alter the costs of behaviour, such as taxes on sugary,fizzy drinks [108, 109];
• laws that shape the physical environment, for example, through infrastructureinvestment, planning controls on the density of fast food outlets [110], or NewYork City’s ‘green cart’ permit scheme to increase the availability of freshfruit and vegetables [111, 112];
• social policies to address social disparities, for example, subsidising the freightcosts of fresh fruit and vegetables to remote indigenous locations [67,pp134–35]; and
• prescriptive controls on business; for example, bans on the use of trans fats[113].
Each of these examples illustrates ways in which regulation can change the ‘ex-ternal’ environment. In addition, however, regulation has an ‘internal aspect’,which refers to governance initiatives whose focus is institutional reform, andstructures for improving the strategic and organisational capacity of governmentto respond to health challenges. This is the focus of the first of four case studies,below.
(1) Improving governance structures for cross-sectoralcollaboration and policy leadership
Goal: To deliver an inter-sectoral, whole-of-government approach to policydevelopment for obesity prevention
In 2008 to 2009, Australia’s federal government spent A$112.8 billion on health,but only 2% of this (A$2.3 billion) was spent on public health [114]. At present,public health functions compete for funding within health departments that arefocused on treating the sick. In addition to the difficulty of achieving more ad-equate investment, however, lies the challenge of achieving a voice in policydevelopment in sectors beyond health. In the context of obesity prevention, thismeans a voice in policies relating to transport and urban development, local gov-ernment, agriculture and food (production, manufacture, retail, catering, advertis-ing), education, and taxation [115]. Achieving an inter-sectoral, all-of-governmentapproach to strategy, policy and program development is perhaps the most im-portant priority for taking innovative and incremental steps that could reduce theburden of disease, and healthcare expenditures, in Australia’s ageing population.
Developing architecture to support an inter-sectoral approach to policy de-velopment requires strategic choices, including between an essentiallygovernment-focused, and a community-focused structure. One model is a ‘polit-ically owned’ governance structure with a mandate – secured through high-level(preferably cabinet-level) leadership and support – to forge cross-departmentallinks and to develop an integrated response that is consistent with the govern-
13 How law and regulation can add value to prevention strategies for obesity and diabetes
267

ment’s commitment to act. This model might include inter-departmental task-forces or standing committees that provide the opportunity for relevant ministriesto consider the negative impact of their policies and programs on shared healthgoals, as well as opportunities for a more coherent, all-of-government approach.
The National Obesity Prevention Act of 2008, a federal bill introduced intothe 110th US Congress, illustrates the first kind of structure [116]. This bill wouldhave established an inter-Departmental Task Force, supported by an AdvisoryCommittee on Obesity, with a mandate to develop a government-wide strategyfor obesity prevention, supported by goals for each agency, with a requirementfor each agency to review its budgets and programs and to determine their impacton physical activity, nutrition and obesity rates. The bill would also have requiredeach agency to report annually on its implementation of the national strategy andits impact on obesity rates.
Although this bill was never passed, its essential structure is reflected inPresident Obama’s more recent National Prevention, Health Promotion and Pub-lic Health Council [117], which recently published the National Prevention Strat-egy [118] and is tasked with monitoring the policies of a dozen federal agencies,reporting annually on progress towards the goals in the strategy, and suggestingcorrective actions to agencies to assist them to achieve the goals. In the UK, theBlair government adopted a multi-sectoral approach to health inequalities, settingout the commitments, key actions and spending required for each department aspart of the all-of-government strategy. Importantly, the strategy was overseen bya Cabinet sub-committee chaired by the deputy prime minister [119].
An alternative model for supporting an inter-sectoral approach is anindependent-of-government structure that is less constrained by party politics, butnevertheless has a clear mandate to advise on policy options. On the one hand,the benefits of this second model include its independence from the entrenchedcultures and agendas of existing departments, its likely capacity to engage moreeffectively with consumers, business, and the NGO sector, and its ability to per-form functions governments might wish to avoid, such as evaluating industrypractices. On the other hand, this remoteness and lack of political power couldlimit the effectiveness of such a body in genuinely influencing the policy agendaof departments and in raising the profile of possible solutions.
A third model of particular relevance to Australia is a ‘portfolio agency’ witha statutory mandate that lies outside the health department, but within the healthportfolio, with executive leadership reporting directly to the minister.7 With ad-equate resources and a statutory mandate, such an agency may be able to movemore effectively between departments and to assume the role of ‘honest broker’,
7 Examples of portfolio agencies, each with their establishing acts, include the Na-tional Health and Medical Research Council (NHMRC), Cancer Australia, and theNational Blood Authority (NBA).
A modern epidemic
268

while engaging effectively with business and community groups. The functionsof the CEO of the recently established Australian National Preventive HealthAgency include encouraging partnerships with industry, non-government organ-isations, and the community sector; developing standards and codes of practicerelating to preventive health matters; advising the minister, and publishing a bian-nual report on the state of preventive health in Australia. If requested to do so,the CEO can also make recommendations about preventive health to the fed-eral health minister, to the Australian Health Ministers’ Conference, to state andterritory governments and the Australian Local Government Association [120]. Itseems clear, however, that the functions of the new agency have been designedto prevent it from interfering in departmental policies or in the political sphere, asdistinct from engaging in health promotion and on non-legislative and voluntaryactions by business and within the community sector.
In 2009, the National Preventative Health Taskforce proposed a Prime Min-ister’s Council for Active Living driving the development and implementation ofa National Framework for Active Living encompassing transport, the built en-vironment, and social engagement [67, pp99–100]. The aim was that the PrimeMinister’s Council would develop a business case for consideration by the Coun-cil of Australian Governments for a new funding partnership that would linkfuture infrastructure funding in these areas to the agreed outcomes for activeliving. This recommendation was rejected on the grounds that the NationalPreventive Health Agency, and other existing mechanisms including MedicareLocals and the national Partnership Agreement on Preventive Health, could de-liver appropriate outcomes [59, pp34–35].
Chronic disease prevention competes with many other issues for the attentionand resources of cabinet, ministers and departments. The easier option, as re-flected in the National Preventive Health Agency, is to create agencies to leadefforts to encourage behavioural change by individuals through mass media cam-paigns and voluntary actions. Important as they are, these investments need tobe matched by governance structures that facilitate serious consideration of howall ministries and sectors can shape their policies in order to encourage and evenprivilege healthier food choices and a more physically active lifestyle.
(2) Reducing or eliminating advertising of high-sugar,high-salt, high-saturated-fat (HSSF) foods to children
Goal: To reduce or eliminate diet-distorting commercial influences on chil-dren’s diets due to the relentless marketing of energy-dense, nutrient-poorfoods; to reduce ‘pester power’ and to support parents in exercising per-sonal responsibility to provide a healthy diet for children
The exposure of children to television advertising of energy-dense, nutrient-poor
13 How law and regulation can add value to prevention strategies for obesity and diabetes
269

foods has become a litmus test for the willingness of governments to use regula-tion to create a healthier food environment for children [121]. Evidence suggeststhat Australian parents are concerned about food advertising to children andsupport stronger regulation [122]. On the other hand, due to assumptions aboutpersonal responsibility and commercial freedom, reducing food advertising toadults is not seriously on anyone’s agenda, even where constitutional constraintsdo not preclude it. Overweight and obese children are more likely to remain soin adulthood [123], and to the extent that unhealthy food advertising could bereduced, it would not only assist parents to exercise parental responsibility to pro-vide a healthier diet for children, but would create incentives for the food industryto improve the nutrition of leading products, or to re-direct advertising dollars to-wards healthier foods.
In Australia, evidence continues to demonstrate that energy-dense, non-corefoods are heavily advertised during children’s peak television viewing times [124,125, 126]. In the US, in 2006, 44 food companies spent over US$1.6 billion promot-ing food and beverages to children and adolescents, predominantly carbonatedbeverages, quick-serve restaurant food and breakfast cereals [127].
Although there is a positive association between the amount of televisionwatched and increased consumption of commonly advertised foods, and betweenexposure to television and obesity, both for adults [128, 129] and children [78,130, 131, 132], the argument that this link is mediated by the impact of food ad-vertising depends upon a distinct chain of reasoning. For children, this includesthe assertion that food advertising alters preferences and purchase requests [133],which attach to higher-energy, advertised foods that crowd out and replace themore energy-dilute foods the child would have eaten if not exposed to advertis-ing. While it is logical to assume that ‘fast-food restaurants would not chooseto advertise if advertising did not increase the demand for their products’ [134],proving a causative link – as distinct from demonstrating correlations between acluster of behaviours – has not been straightforward. In a recent paper, Boylandand colleagues reported that children preferred to select high-fat and high-car-bohydrate foods after viewing food commercials, and that this effect was morepronounced among children who were habitual television viewers [135]. The au-thors point out that their findings support the argument that food advertising notonly alters brand choice but alters generic food preferences in favour of energy-dense, nutrient-poor foods.
A consistent theme in food advertising is the presence of voluntary, industry-designed schemes that are promoted as accommodating community concernsabout childhood obesity and obviating the need for direct government involve-ment. In the US, evidence suggests that as a result of pledges made under theCouncil of Better Business Bureau’s Children’s Food and Beverage AdvertisingInitiative [136], television food advertisements viewed by children aged two to 11declined by 12% between 2004 and 2008. However, by 2010, exposure to food
A modern epidemic
270

advertising increased by 9% over 2008, and in 2010 children viewed 39% moreads for fast food and other restaurants than in 2002 [137]. Adolescent exposure tofood advertising increased by 23% during 2004 to 2010; adult exposure increasedat an even higher rate [138]. Another study found that in 2009, over two-thirds ofall food advertising by signatories to the Children’s Food and Beverage Adver-tising Initiative was for non-core (‘once-in-a-while’) foods, and that healthy foodadvertising was invisible [139].
In 2009, the US Congress authorised an appropriation to establish the Intera-gency Working Group on Food Marketed to Children comprising representativesof the Federal Trade Commission (FTC), Food and Drug Administration, theCenters for Disease Control and Prevention, and the Department of Agriculture.The working group was tasked with developing a set of food marketing princi-ples to guide industry self-regulation that would improve the nutritional profileof food marketed to children aged two to 17 years [140]. From 2016, the work-ing group’s proposed principles would require all food products falling withinthe ten most heavily marketed product categories to comply with two nutritionprinciples. These set maximum values for ‘negative’ nutrients including satu-rated fat, added sugars and sodium, and secondly, require all marketed foods to‘provide a meaningful contribution to a healthful diet’ by containing minimumamounts of either fruit, vegetables, whole grains, low-fat milk or a number ofother food categories [140]. Although the final principles are voluntary, they willrepresent a credible consensus of relevant federal agencies on permissible formsof food advertising to children, which these agencies will expect the food indus-try to implement by 2016. If the food marketing principles are widely ignored,this could encourage the FTC to explore the full reach of its powers to regulatefood marketing to children (subject to First Amendment, tailoring and eviden-tial challenges) and theoretically, could provide support for the restoration of theFTC’s rule-making powers under the unfairness doctrine [141]. By setting norma-tive standards, engaging with the food industry, and monitoring and reporting onits compliance, the FTC could encourage both improvements in food marketingpractices, and the reformulation of heavily advertised foods.
In its submission to the Interagency Working Group in July 2011, the Chil-dren’s Food and Beverage Advertising Initiative (CFBAI) announced new uni-form nutrition criteria, to be implemented by 31 December 2013, which definethe nutritional characteristics for foods advertised to children under 12 across tenproduct categories [142]. Arguing that the Interagency Working Group’s proposedprinciples are ‘not realistic and thus … not aspirational’ [143], the CFBAI arguedthat the application of the Interagency Working Group’s principles to childrenand adolescents aged two to 17 is ‘overly broad and inappropriate’, whereas theCFBAI ‘properly focuses on advertising primarily directed to children under 12’[143, p23].
Australia’s co-regulatory approach to children’s food advertising begins with
13 How law and regulation can add value to prevention strategies for obesity and diabetes
271

the Children’s Television Standards 2009 (CTS) prescribed by the AustralianCommunications and Media Authority (ACMA) [144, 145]. The CTS apply to thedesignated children’s (C) and preschool (P) programming that broadcasters arerequired to broadcast under their licences (CTS 6–19). Compliance with the CTSis a license condition for commercial television broadcasters [146]. The CTS pro-vide that where advertisements contain premium offers, such as toys offered forsale with advertised foods, the advertisement must not make reference to thepremium ‘in a way that is more than merely incidental’ to the advertised prod-uct (CTS 33(2)). The CTS prevent the repetition of advertisements within any30-minute period (CTS 29), and prohibit the promotion of commercial productsby popular characters, including animated, cartoon and movie characters (CTS35). Food advertisements may not contain misleading or incorrect informationabout the nutritional value of the product (CTS 32(7)).
Evidence suggests that food advertisers have regularly ignored the CTS inthe past [147, 148]. In a review of the 2005 version of the CTS, completed in 2009,ACMA decided against imposing any additional restrictions on food advertisingduring children’s designated programming, concluding that ‘the relative contri-bution of advertising to childhood obesity is difficult to quantify and the causalrelationship between these may not be possible to determine’ [149, p9]. ACMAalso carried out economic modelling which showed that banning the advertisingof foods high in fat, salt or sugar (HSSF foods) could significantly affect the rev-enues and profitability of broadcasters [149, p6]. As Ingleby and colleagues pointout, the revenue consequences of restricting unhealthy food advertising ‘becomesless attractive as a proposition when it is translated into an argument that childrenshould be exposed to harm as the price of having television programs made forthem’ [150].
The Children’s Television Standards are supplemented by the co-regulatoryCommercial Television Industry Code of Practice [151] which is registered as acode of practice under the Broadcasting Services Act 1992 [152]. This code pro-vides that food advertisements directed to children shall not promote an unhealthylifestyle, or the excessive or compulsive consumption of foods or beverages [151,para 6.23]; it also requires compliance with the Code for Advertising & Mar-keting Communications to Children adopted by the Australian Association ofNational Advertisers (AANA Code) [153]. Neither code is designed to restrictthe frequency, timing or placement of advertisements for energy-dense, nutrient-poor foods directed to children [154]. Leaving aside the fact that both codes relywholly on consumer complaints, and lack independent monitoring, both codesalso consist of generally expressed principles which recent practice suggestsare exceedingly difficult to break. Neither code restricts the cumulative impactof unhealthy food advertising on children’s preferences and expectations [154,pp134–38].
As evidence and community concern about food marketing to children have
A modern epidemic
272

continued to grow, the food industry has sought to manage the political risk ofregulation by developing additional self-regulatory schemes. Recent initiativesinclude the Responsible Children’s Marketing Initiative developed by the Aus-tralian Food and Grocery Council (AFGC) [155], which came into operationduring the period when ACMA was reviewing the Children’s Television Stan-dard (2005). The AFGC Initiative applies to designated children’s and preschoolprogramming, and G-rated programs where >50% of the audience are childrenunder 12 years, but not other programming where children are nevertheless a sig-nificant share of the audience. In 2009, when the National Preventative HealthTaskforce recommended phasing out the marketing of energy-dense, nutrient-poor (ENDP) food on free-to-air and pay TV before 9pm, together with premiumoffers and the use of competitions, cartoons and promotional characters, the Aus-tralian Government responded that it would continue to monitor the effectivenessof voluntary codes including the AANA Code, the AFGC Initiative, and a similarinitiative by the Quick Service Restaurant Industry [59, pp46–47].
King and colleagues evaluated non-core food advertising before and after theintroduction of the AFGC’s Responsible Children’s Marketing Initiative. Theyfound that while signatories to the AFGC initiative reduced their rate of non-corefood advertising, there was no reduction in the rate of non-core advertisementsoverall (which continue to dominate peak viewing times), since non-signato-ries to the initiative increased their rate of non-core food advertising [124]. Norshould it be assumed that exposure would be dramatically reduced if more adver-tisers implemented the AFGC principles, given their focus on programs directedto children, rather than children’s peak viewing periods. Hebden and colleaguesfound that the introduction, in August 2009, of the children’s marketing initiativeof the Quick Service Restaurant Industry made no difference to the frequency ofnon-core fast food advertisements broadcast during peak children’s viewing peri-ods [156].
Handsley and colleagues have argued that if the goal is to actually reducechildren’s exposure to non-core food advertising, restrictions based on time ofday will be required, not merely restrictions on advertising within designatedchildren’s programming [157]. In the UK, broadcast advertising is regulated bythe UK Code of Broadcast Advertising (BCAP Code), which was written and isreviewed by an industry body, the Broadcast Committee of Advertising Practice(BCAP) under delegation from OfCom, the telecommunications regulator [158,159]. In 2006, the Food Standards Agency (FSA) advocated a complete ban onall advertising of foods high in salt, sugar and fat on television before 9pm [160].After a lengthy inquiry, OfCom did implement a ban on HSSF food advertising[158, section 32.5], based on the nutrient profiling model developed by the FSA[161]. The ban applies specifically to advertising of foods high in salt, sugar andfat in ‘programmes commissioned for, principally directed at or likely to appealto’ audiences below the age of 16. OfCom has contracted out the enforcement of
13 How law and regulation can add value to prevention strategies for obesity and diabetes
273

the BCAP Code to the Advertising Standards Authority [162].The significant difference between ‘children’s programs’ or ‘programs tar-
geted at children’, and ‘peak children’s viewing periods’ illustrates the politicaland philosophical difficulty of implementing an effective ban, which would re-quire the value of commercial speech to adults to be balanced with the benefitsof encouraging healthier diets for children and adolescents. Other important vari-ables include whether advertising restrictions apply to children and adolescents,or only to children; the nutritional parameters of foods that attract any ban; andwhether or not the administering authority is a government agency, industry or in-dependent body. While there is substantial evidence in Australia showing that thefood advertising children are exposed to does not support a healthy diet, govern-ments are reluctant to take on the food industry, and regulation will only improvethings to the extent that it addresses the criteria above.
(3) Economic incentives to encourage investment inworkplace-based risk prevention and health promotion
programsGoal: To exploit the workplace, in both the private and public sectors, as asetting for disease prevention and health promotion programs encompass-ing smoking cessation, obesity prevention and healthy eating
Although calls for a ‘fat tax’ are regularly made and are the best-known exampleof an economic strategy for obesity prevention [163], there is a wide range of op-tions for altering the policy environment in ways that could indirectly influencefood consumption patterns at the population level. These include imposing a levyon television advertising of energy-dense, non-core foods that do not meet mini-mum nutritional criteria [164], eliminating the tax deductibility of food advertisingcosts for non-core foods [134], as well as financing initiatives to make fresh fruitand vegetables more accessible and affordable to lowincome and remote popula-tions [165]. In 2010, the Australian Government rejected the recommendation ofthe National Preventative Health Taskforce to commission a review of economicpolicies, including the use of taxation, grants, pricing, incentives and subsidies topromote access and consumption of healthier foods and greater levels of physi-cal activity [59, p37]. The wide-ranging Henry review of Australia’s future taxsystem also rejected the notion of a fat tax, because of the difficulty of accu-rately estimating the health and productivity costs attributable to particular (lesshealthy) food or product constituents, and because of the multiple influences –besides food choices – on obesity, including genetic, social and economic factors[166]. The population health effects of the dietary changes that could result froma tax on certain classes of food or food ingredients are also not well understood[167].
A modern epidemic
274

Like schools, and healthcare encounters, the workplace is an important set-ting for disease prevention. A growing body of research evaluates the businesscase for workplace-based disease prevention and health promotion programs, andseeks to identify the optimal design elements, spending and managerial require-ments of successful programs [168, 169]. Since risk reduction and better employeehealth offers the promise of reductions in future healthcare costs and sick leave,and improved productivity and morale, workplace-based risk prevention pro-grams provide the opportunity for alignment between the economic goals ofbusiness, the public health goals of government, and the interests of individualemployees. At the global level, the World Economic Forum hosts the WorkplaceWellness Alliance and promotes corporate wellness initiatives as an opportunityfor multinational companies to contribute to the prevention of chronic disease[170, 171].
In the US, employers have a direct financial incentive to invest in evidence-based wellness programs, not only because absenteeism and low productivity af-fect the bottom line, but also because employees’ health insurance premiums aretypically paid for or are heavily subsidised by employers. In 2010, 69% of non-federal private and public employers offered health benefits to employees. Ofthese, nearly three-quarters of employers offered ‘wellness programs’. Servicestypically included in these programs include: weight-loss and smoking cessationprograms, personal health coaching, gym membership discounts, nutrition andhealthy living classes, and online resources [172, p170]. Increases in healthcarepremiums, including employee contributions [172, pp20–21], combined with theeconomic downturn and the imperatives of deficit reduction, are driving a longer-term trend towards government policies to encourage workplace-based healthpromotion programs, with sharper financial incentives for employees to partic-ipate in them. For employees, this typically means submitting to a health riskassessment, followed by the development of an individualised risk reduction pro-gram, with annual review.
President Obama’s Patient Protection and Affordable Care Act (PPACA),signed in 2010, authorises grants to small businesses (<100 employees) to estab-lish comprehensive wellness programs [173], and provides for the development ofreporting requirements for group health plans to report on wellness and healthpromotion initiatives, including smoking cessation, weight management, diabetesmanagement and nutrition [174]. It also requires the Centers for Disease Controland Prevention to conduct a periodic national survey of workplace-based healthprograms and to provide technical assistance to employers in evaluating such pro-grams [175].
Federal law currently restricts employers from varying health insurance pre-mium contributions according to the health status of the particular employee [176].However, an important exception permits premium discounts or rewards of upto 20% of the cost of the employee’s premium contribution where the employee
13 How law and regulation can add value to prevention strategies for obesity and diabetes
275

has complied with the requirements of a wellness program that is ‘reasonablydesigned to promote health or prevent disease’ [177, 178]. From 2014, this incen-tive is increased to 30%, and up to 50% if the Secretaries of Health and HumanServices, Labor and the Treasury so determine [179, 180]. The point at which fi-nancial incentives for participation in wellness programs (in both private andstate-funded health insurance schemes) become intrusive and coercive, remains amatter of debate [181]. From 2014, the PPACA guarantees the availability and re-newability of health insurance cover for employers and individuals, prescribes thegrounds on which premiums may vary, and further restricts discrimination basedon an individual’s health status [182]. PPACA requires all plans to include an ‘es-sential benefits package’ (including specified preventive and wellness servicesand chronic disease management) [183], and sets up a number of risk adjustmentprocesses to allocate payments to plans with high-risk enrolees. In this envi-ronment, the central role of health promotion and risk prevention programs inreducing healthcare costs, with financial incentives to encourage participation,seems set to continue.
One bill not passed by Congress in 2009 would have offered tax credits tobusinesses setting up comprehensive wellness programs, for a period of ten years[184]. One of the primary goals of the US-based Workplace Wellness Alliance isto ‘develop and advocate for tax-credit and other legislation that promotes work-site health promotion programs and other health management initiatives’ [185].
The twin factors that are helping to drive investment in wellness programsin the US – that is, the direct financial burden on employers who either self-insure or pay the larger share of employees’ health insurance premiums, coupledwith financial incentives for employees – are absent in Australia. Australiansenjoy taxpayer-funded, rather than employer-funded, national healthcare cover-age through Medicare, and private health insurance is community rated [186].Any reversal of community rating would likely undermine the market for privatehealth insurance and increase demand for Medicare-funded services, somethingthe Australian Government would be keen to avoid.
In 2009, the National Preventative Health Taskforce argued that public sectororganisations at all levels of government should lead by example by introducing,identifying and replicating successful workplace-based health promotion pro-grams that could serve as ‘models of good practice to the employment sector as awhole’ [67, p53]. To encourage uptake within the private sector, they suggestedthat health promotion programs should be exempt from fringe benefits tax, freeof goods and services tax (GST), and tax deductible. The Australian Governmentdid not respond directly to these recommendations, although it has indicated itdoes not support exempting employer-funded smoking cessation programs fromfringe benefits tax [59, p73].
From 1 July 2011, under the National Partnership Agreement on PreventiveHealth [187], the Commonwealth is providing up to A$289 million in funding to
A modern epidemic
276
the states to develop healthy living initiatives in the workplace [188]. The NSWHealthy Workers Initiatives, for example, will comprise advice, support and re-sources for businesses (including a website, phone service and onsite assistance),as well as a coaching service for individuals [189]. For its part, the Commonwealthis developing a National Healthy Workplace Charter with peak business groups,national standards, and an awards scheme for best practice in workplace healthprograms.
Despite the differences in health insurance arrangements, the US experiencehas clear implications for Australia. The workplace offers a rare opportunity for awin–win partnership between government, business and public health stakehold-ers, yet what is absent are economic drivers. Australian employers are largelyprotected from the direct healthcare costs of employee ill-health, and unless thereis compelling evidence to demonstrate that a healthy workers initiative dramati-cally improves productivity in the short to medium term, uptake is unlikely to beon the scale required to substantially contribute to disease prevention goals. Whatthe current voluntary model overlooks is that workplace-based initiatives are notmerely a vehicle for improving business productivity by enlightened businesses;rather, the workplace is an important setting for reaching a large proportion of theworking population.
This suggests two priorities. Firstly, the Australian Government should acton the recommendation of the National Preventative Health Taskforce by recon-sidering how the taxation system could best support the uptake of healthy workerprograms, encompassing smoking cessation, obesity prevention and improvednutrition. Secondly, governments, as employers, should lead by example, imple-menting comprehensive programs for the benefit of government employees, andusing their purchasing and contracting powers to impose accreditation standardsto drive improvements in the nutritional quality of foods sold in governmentbuildings, hospitals and other public sector settings.
(4) A co-regulatory approach to food reformulationGoal: To moderate overconsumption of saturated fat, sugar and salt at thepopulation level by providing a statutory underpinning to food reformula-tion negotiations encompassing food manufacturers, retailers, government,and public health stakeholders
The availability of ‘cheap, palatable, energy-dense foods’ that are skilfully mar-keted and high in fat, sugar or salt, is an important change in the environmentthat has driven the upward trend in population weight gain over the past fewdecades [190]. Reformulation of food products is a population-level ‘superpolicy’that could improve nutrition by reducing the amount of overconsumed nutrients.Some major food manufacturers and retailers, such as Pepsico [191] and Wal-Mart
13 How law and regulation can add value to prevention strategies for obesity and diabetes
277

[192], are already taking steps to improve the nutritional profile of their portfolioof products.
Prevailing beliefs about the importance of free markets, limited governmentregulation, consumer choice and personal responsibility support the view that itwould be inappropriate for a government agency to prescribe mandatory stan-dards for nutrients (salt, sugar, saturated fat) for the food sector. A competingview might hold that regulation has a legitimate role to play in setting the groundrules for a multi-stakeholder process to drive nutritional improvements within thefood supply. There are several factors that, in combination, suggest a growingrole for government in public health nutrition.
Firstly, although the status of good nutrition, as a value within Australianfood regulation, remains ambiguous, anyone familiar with the Food StandardsCode cannot fail to acknowledge that nutrients in food are already regulated pre-scriptively and in almost forensic detail, in order to reduce health risks, to setparameters for health and nutrient claims, and to avoid confusion, misunderstand-ing and deceptive advertising [193].
Secondly, consumers cannot make healthy choices in circumstances whereonly a minority of products (for example, snacks and beverages) meet ‘healthy’nutritional criteria [194] and where there is no evaluative food labelling scheme toassist consumers to rapidly distinguish between products based on their nutrition[104]. Thirdly, in the light of evidence of its role in cardiovascular disease, NewYork City, followed by a range of US states and cities, has banned trans fats inrestaurant cooking [195, 196].
Over time, salt reduction also has the potential to significantly re-shape as-sumptions about the legitimate limits of food regulation. Around three quartersof salt intake in most high-income countries comes from added salt in processedfoods and pre-cooked meals [197]. This eliminates choice and, since most individ-uals are unaware of their high-salt intake, hampers personal efforts to moderateconsumption. The benefits of salt reduction in controlling hypertension and re-ducing cardiovascular disease at the population level is strongly supported byevidence, but requires gradual – and more than trivial – reductions in salt lev-els across those product categories that most contribute to excess levels [198, 199].Many countries have adopted voluntary targets for reductions in population saltintake, managed by government [200] or, as in Australia, through a Food andHealth Dialogue that includes government, the food industry and public healthgroups [201]. A measure of resistance (passive or active) to substantial reductionsin salt targets, by at least some sections of the food industry, is predictable. Forexample, evidence suggests that salt reduction will reduce sales of sugar-sweet-ened soft drinks (which could assist in obesity prevention) [202]. Habituation tohighly salty foods encourages demand for cheaply produced, profitable snacks,while water-binding chemicals in combination with salt can increase the watercontent, and thus the weight, of meat [199, pp377–78].
A modern epidemic
278

In 2009, the UK government set voluntary targets for salt reduction for thefood industry to meet by 2012 [203], while New York City is coordinating a Na-tional Salt Reduction Initiative that includes 44 cities and states [204]. In Australia,the National Preventative Health Taskforce recommended that the AustralianGovernment establish a Healthy Food Compact to drive changes in the food sup-ply, with voluntary targets for reductions in salt, saturated and trans fats, andsugar [67, pp106–09, 144]. In a muted response, the Australian Government hascommitted A$900 000 over three years to ‘develop the evidence base and ratio-nale for future food reformulation activities’ under the existing, voluntary, Foodand Health Dialogue [59, pp38–40].
There is growing academic interest in regulatory strategies for reducing saltintake at the population level [205, 206]. In 2010, the Institute of Medicine recom-mended that the Food and Drug Administration revoke the ‘generally recognisedas safe’ status of salt and set mandatory national standards for added salt to foods.These would be implemented in a step-wise manner, allowing consumer tastepreferences to adapt and industry to resolve technical challenges [207].
One way of ensuring that food reformulation negotiations achieve an ad-equate level of momentum is through a co-regulatory approach that adds astatutory underpinning to what is currently a purely voluntary process. Consistentwith the prevailing model of ‘responsive regulation’ – which favours ‘soft’,voluntary measures and only escalates to more direct forms of regulation andenforcement when voluntary strategies fail [67, pp57–58] – participation in thefood reformulation dialogue could remain voluntary. In the absence of significantlevels of participation from major food manufacturers and retailers, however, avoluntary process would stall. In that event, there should be a credible expecta-tion that government will intervene more directly.
While the key components of a co-regulatory framework require furtherelaboration, they might begin by enshrining a Healthy Food Compact as a publicprocess with a formal existence recognised in legislation or, at a minimum, ina code of practice developed by an appropriate host agency, such as the Aus-tralian National Preventive Health Agency [208] or Food Standards Australia NewZealand [209]. The code of practice could set out the goals of the dialogue fora defined five-year period, together with the roles, and respective obligations ofgovernment, manufacturers, retailers and industry associations, and community-based organisations, as participants in the dialogue. Major food manufacturersand retailers whose market share exceeds a prescribed minimum would be ex-pected to become signatories to this process.
Signatories might also be offered choices; for example, between makingprospective, binding commitments to reduce average levels of salt, saturated fat,and energy across priority food categories, and to increase levels of fibre andfruits, vegetables, nuts and legumes – versus participation in the dialogue for therelevant five-year term. Prospective commitments might be preferable for sig-
13 How law and regulation can add value to prevention strategies for obesity and diabetes
279

natories that wish to maximise flexibility as well as reduced scrutiny of theirproduct portfolio and manufacturing processes. Under the negotiated process,signatories would need to negotiate towards feasible targets for improvements inthe nutrition of products within priority product lines against a credible expecta-tion that if target levels were not achieved, default levels in some areas might beset through a government-appointed process. Progress would be monitored withpublic reporting.
While the focus of negotiations across the various priority categories withinthe food reformulation dialogue would be improved nutrition, the focus of nego-tiations involving retailers could involve commitments relating to the advertisingand marketing of healthy foods, and increased visibility and shelf space forhealthier products. Both streams would rely on the goodwill of those involvedto work effectively: government, manufacturers, industry associations, consumergroups, and experts in public health and nutrition. The ground rules for the di-alogue would need to balance public health goals with technical feasibility andconsumer acceptability, pursuing significant change across the food supply, whileminimising damage to existing brands.
CONCLUSIONI have argued in this chapter that governments have a critical role to play in theprevention of obesity and diabetes through the development of a ‘plausible policybasket’ that includes both regulatory and non-regulatory interventions. Signif-icant improvements in health and wellbeing, not to mention productivity, areunlikely unless governments acknowledge this leadership role. Effective policiesfor obesity prevention require governments, in collaboration with other stake-holders, to recognise that improving the public’s health is a legitimate goal forpublic policy, rather than delegating responsibility for health to individuals andprivate markets. At the same time, there is plenty of scope for reasonable peopleto disagree about the legitimate boundaries of law reform initiatives, since publichealth policies are difficult to keep separate from political philosophies.
Although a multi-level response is needed that addresses environments,lifestyles and healthcare services, the case studies presented in this chapter –governance reform, food advertising controls, incentives for disease preventionwithin the workplace, and a clearer structure for commercial food reformulation –are all directed at the environment, rather than at individuals and their behavioursper se. While this will not satisfy the critics, there is an important distinction here.Personal autonomy remains an important value in free, market-oriented societies.On any fair assessment, the case studies presented here do not involve dictatinglifestyles or diets to individuals.
On the other hand, policies that create a more supportive environment for
A modern epidemic
280

healthy living may very well conflict with the economic interests of those busi-nesses that derive substantial revenues from current patterns of overeating, poornutrition and physical inactivity. In tobacco control, public health advocates havelearned that there are few, if any, opportunities for collaboration with tobaccocompanies [210, 211]. From a perspective of two or three decades, however, leg-islatures have literally driven over the top of the tobacco industry, dramaticallyreducing the scale of tobacco use (if not the profitability of tobacco companiesthemselves) in the process. Reducing the ‘food economy’ is not the goal of obe-sity prevention. On the other hand, it would be naive of the food industry, lookingtowards the next decade or so, to assume that governments will not seek to offsetrising healthcare costs and stagnating productivity by experimenting with regu-latory measures to reduce the preventable component of chronic disease. Whiledebate continues about whether the food and beverage industries can be genuinepartners in strategies to improve diet and reduce energy intake [191, 212, 213, 214,215], the point is that the law of obesity prevention has already arrived and is likelyto stay for some time. Its future remains to be written, debated, implemented andevaluated. That said, regulatory interventions, like those presented in the casestudies above, may come sooner than many expect.
References1. Martin R (2001). Domestic regulation of public health: England and Wales.
In R Martin & L Johnson (Eds). Law and the public dimension of health(pp75–112). London: Cavendish (p79).
2. South Australian Public Health Act 2011 ss. 61–62.3. Reynolds C (2004). Law and public health: addressing obesity. Alternative
Law Journal, 29: 62–167.4. Mello M, Studdert D & Brennan T (2006). Obesity: the new frontier in pub-
lic health law. New England Journal of Public Health, 354: 2601–10.5. Monroe J, Collins J, Hon. P.Maier, Merrill T, Benjamin G & Moulton A
(2009). Legal preparedness for obesity prevention and control: a frameworkfor action. Journal of Law, Medicine & Ethics, 37(Suppl. 1): 15–23.
6. Pomeranz J & Gostin L (2009). Improving laws and legal authorities forobesity prevention and control. Journal of Law, Medicine & Ethics, 37:62–75.
7. Sacks G, Swinburn B & Lawrence M (2009). Obesity policy action frame-work and analysis grids for a comprehensive policy approach to reducingobesity. Obesity Reviews, 10: 76–86.
13 How law and regulation can add value to prevention strategies for obesity and diabetes
281
8. Magnusson R (2008). What’s law got to do with it? Part 1: a framework forobesity prevention. Australia and New Zealand Health Policy 2008 [Online].Available: www.anzhealthpolicy.com/content/5/1/10 [Accessed 20 October2011].
9. Magnusson R (2008). What’s law got to do with it? Part 2: legal strategiesfor healthier nutrition and obesity prevention. Australia and New ZealandHealth Policy 2008 [Online]. Available: www.anzhealthpolicy.com/content/5/1/11 [Accessed 20 October 2011].
10. Wikler D (2002). Personal and social responsibility for health. Ethics & In-ternational Affairs, 16(2): 47–55.
11. Leichter H (2003). ‘Evil habits’ and ‘personal choices’: assigning responsi-bility for health in the 20th century. The Milbank Quarterly, 81: 603–26.
12. Le Grand J (2008). The giants of excess: a challenge to the nation’s health.Journal of the Royal Statistical Society Series A, 171: 834–56.
13. Jesson J (2008). Weighing the wellness programs: the legal implications ofimposing personal responsibility obligations. Virginia Journal of Social Pol-icy and the Law, 15: 217–98.
14. Australian Institute of Health & Welfare (AIHW) (2010). Australia’s Health2010. Canberra: AIHW (p114).
15. Roberts L, Letcher T, Gason A & Lobstein T (2009). Childhood obesity inAustralia remains a widespread health concern that warrants population-wideprevention programs. Medical Journal of Australia, 191: 46–47.
16. Victorian Department of Human Services (2008). Future prevalence ofoverweight and obesity in Australian children and adolescents, 2005–2025,Melbourne: Department of Human Services.
17. Begg S, Vos T, Barker B, Stevenson C, Stanley L & Lopez A (2007). Theburden of disease and injury in Australia, 2003. Canberra: AIHW, (p39).
18. Kim S & Popkin B (2006). Commentary: understanding the epidemiologyof overweight and obesity – a real global public health concern. InternationalJournal of Epidemiology, 35: 60–67.
19. Access Economics Pty Ltd (2008). The growing cost of obesity in 2008:three years on. Report by Access Economics Pty Ltd to Diabetes Australia.
20. Flegal K, Carroll M, Ogden C & Johnson C (2002). Prevalence and trends inobesity among US adults, 1999–2000. The Journal of the American Medical
A modern epidemic
282

Association, 288: 1723–27.21. Flegal K, Carroll M, Ogden C & Curtin L (2010). Prevalence and trends in
obesity among US adults, 1999–2008. The Journal of the American MedicalAssociation, 303: 235–41.
22. Ogden C & Carroll M (2010. Prevalence of obesity among children and ado-lescents: United States, trends 1964–1965 through 2007–2008. Centers forDiseases Control and Prevention. National Center for Health Statistics [On-line]. Available: www.cdc.gov/nchs/data/hestat/obesity_child_07_08/obesity_child_07_08.htm [Accessed 20 October2011].
23. Wright J, Kennedy–Stephenson J, Wang C, McDowell M & Johnson C(2004). Trends in intake of energy and macronutrients – United States,1971–2000. The Journal of the American Medical Association, 291:1193–94.
24. Wright J & Wang C (2010). Trends in intake of energy and macronutrientsin adults from 1999–2000 through 2007–2008. US Department of Healthand Human Services. Centers for Disease Control and Pevention. NCHSData Brief No. 49 [Online]. Available: www.cdc.gov/nchs/data/databriefs/db49.htm [Accessed 20 October 2011].
25. Stewart S, Cutler D & Rosen A (2009). Forecasting the effects of obesityand smoking on US life expectancy. New England Journal of Medicine, 361:2252–60.
26. Peters A, Barendregt J, Willekens F, Mackenbach J, Al Mamun A &Bonneux L (2003). Obesity in adulthood and its consequences for life ex-pectancy: a life-table analysis. Annals of Internal Medicine, 238: 24–32.
27. Olshansky S, Passaro D, Hershow R, Layden J, Carnes B, Brody J, et al.(2005). A potential decline in life expectancy in the United States in the 21stcentury. New England Journal of Medicine, 352: 1138–45.
28. D’Arcy J. Holman C & Smith F (2008). Implications of the obesity epidemicfor the life expectancy of Australians. Report to the Public Health AdvocacyInstitute of Western Australia [Online]. Available: www.phaiwa.org.au/in-dex.php/publications-mainmenu-125/reports-mainmenu-127/61-obesity-and-life-expectancy [Accessed 20 October 2011].
29. Colagiuri S, Lee C, Colagiuri R, Magliano D, Shaw J, Zimmet P & Caterson
13 How law and regulation can add value to prevention strategies for obesity and diabetes
283

I. (2010). The cost of overweight and obesity in Australia. Medical Journalof Australia, 192: 260–264.
30. Goss J (2008). Projection of Australian healthcare expenditure by disease,2003 to 2033. Cat. No. HWE 43. Canberra: AIHW, (p21).
31. Finkelstein E, Trogdon J, Cohen J & Dietz W (2009). Annual medicalspending attributable to obesity: payer- and service-specific estimates.Health Affairs – Web Exclusive, 28(5): w822–w831.
32. RAND Corporation (2007). Obesity and disability: the shape of thingsto come (RAND Health, Research Highlights), 2007 [Online]. Available:www.rand.org/pubs/research_briefs/2007/RAND_RB9043-1.pdf [Accessed20 October 2011].
33. World Health Organization (2000). Obesity: preventing and managing theglobal epidemic. WHO Technical Report Series 894, Geneva: World HealthOrganisation.
34. Yusuf S, Hawken S, Ôunpuu S, Dans T, Avenzum A, Lanas F, et al. (2004).Effect of potentially modifiable risk factors associated with myocardial in-farction in 52 countries (the INTERHEART Study): case-control study. TheLancet, 364: 937–52.
35. Reeves M & Rafferty A (2005). Healthy lifestyle characteristics amongadults in the United States, 2000. Archives of Internal Medicine, 165:854–57.
36. Hopkins J (2005). Only 3% of US citizens follow good health advice. BritishMedical Journal, 330: 1044.
37. Atlantis E, Barnes E & Ball K (2007). Weight status and perception barriersto healthy physical activity and diet behavior. International Journal of Obe-sity, 32: 343–52.
38. Australian Broadcasting Corporation (2005). Transcript of Interview withthe Hon. Tony Abbott MP. Four Corners. 17 October [Online]. Available:www.abc.net.au/4corners/content/2005/s1480656.htm [Accessed 20 Octo-ber 2011].
39. Wakefield M, Loken B & Hornik R (2010). Use of mass media campaignsto change health behaviour. The Lancet, 376: 1261–71.
40. Johnson-Taylor W, Fisher R, Hubbard V, Starke-Reed P & Eggers P (2008).The change in weight perception of weight status among the overweight:
A modern epidemic
284

comparison of NHANES III (1988–1994) and 1999–2004 NHANES. Inter-national Journal of Behavioral Nutrition and Physical Activity, 5: 9 [Online].Available: www.ijbnpa.org/content/5/1/9 [Accessed 20 October 2011].
41. Johnson F, Cooke L, Croker H & Wardle J (2008). Changing perceptions ofweight in Great Britain: comparison of two population surveys. British Med-ical Journal, 337: a494.
42. Giskes K & Siu J (2008). Do Australians perceive their weight status dif-ferentially and accurately? Implications for health promotion. Australian andNew Zealand Journal of Public Health, 32: 183–84.
43. Bleich S (2008). Public perception of overweight. British Medical Journal,337: 243–44 (p243).
44. Australian Institute of Health & Welfare (AIHW) (2004). Australia’s health2004. Canberra: AIHW. Cat. No. AUS 44 (p122).
45. Australian Government (2011). Personally controlled electronic healthrecord system: legislation issues paper [Online]. Accessed at:www.yourhealth.gov.au/internet/yourhealth/publishing.nsf/Content/pcehr-legals [Accessed 21 October 2011].
46. Healthcare Identifiers Act 2010 (Cth).47. Commonwealth of Australia (2009). Building the foundations for an e-
health future: update on proposals for healthcare identifiers. Issued by theAustralian Health Ministers’ Conference.
48. New York City, N.Y., Title24, Health Code §13.04.49. New York City of Health and Mental Hygiene. The New YorkCity A1C
Registry [Online]. Available: www.nyc.gov/html/doh/html/diabetes/diabetes-nycar.shtml [Accessed 21 October 2011].
50. Steinbrook R (2006). Facing the diabetes epidemic: mandatory reporting ofglycosylated hemoglobin values in New York City. New England Journal ofMedicine, 354: 545–48.
51. Mariner W (2007). Medicine and public health: crossing legal boundaries.Journal of Health Care Law & Policy, 10: 121–51.
52. Australian Institute of Health and Welfare (2006). Chronic diseases and as-sociated risk factors in Australia, 2006. Canberra: AIHW. AIHW Cat. No.PHE 81.
53. Tong B & Stevenson C (2007). Comorbidity of cardiovascular disease, dia-
13 How law and regulation can add value to prevention strategies for obesity and diabetes
285

betes and chronic kidney disease in Australia. Cardiovascular Disease Seriesno. 28. Cat. no. CVD 37. Canberra: AIHW.
54. Weiss C, Boyd C, Yu Q, Wolff J & Leff B (2007). Patterns of prevalent ma-jor chronic disease among older adults in the United States. Journal of theAmerican Medical Association, 298: 1160–62.
55. Turrell G, Stanley L, de Looper M & Oldenburg B (2006). Health in-equalities in Australia: morbidity, health behaviours, risk factors and healthservice use. Health Inequalities Monitoring Series No. 2. AIHW Cat. No.PHE 72. Canberra: Queensland University of Technology & AIHW.
56. King T, Kavanagh A, Jolley D, Turrell G & Drawford D (2006). Weightand place: a multilevel cross-sectional survey of area-level social disadvan-tage and overweight/obesity in Australia. International Journal of Obesity,30: 281–87.
57. Kiim M, Berger D & Matte T (2006). Diabetes in New York City: publichealth burden and disparities. New York: New York City Department ofHealth and Mental Hygiene.
58. Medicare Benefits Schedule items 701, 703, 705, 707 [Online]. Available:www9.health.gov.au/mbs/search.cfm [Accessed 21 October 2011].
59. Australian Government (2010). Taking preventative action: a response toAustralia: the healthiest country by 2020: the report of the National Preven-tative Health Taskforce [Online]. Available: www.preventativehealth.org.au/[Accessed 21 October 2011].
60. Ashworth M & Jones R (2008). Pay for performance systems in generalpractice: experience in the United Kingdom. Medical Journal of Australia,189: 60–61.
61. Scott A, Sivey P, Ait Ouakrim D, Willenberg L, Naccarella L, Furler J &Young D (2011). The effect of financial incentives on the quality of health-care provided by primary care physicians. Cochrane Database of SystematicReviews. Issue 9, Art. No.: CD008451.
62. Australian Government. Department of Health and Ageing. Practice Incen-tives Program [Online]. Available: www.medicareaustralia.gov.au/provider/incentives/pip/index.jsp [Accessed 21 October 2011].
63. Young D, Scott A & Best J (2010). For love or money? Changing the wayGPs are paid to provide diabetes care. Medical Journal of Australia, 193:
A modern epidemic
286
67–68.64. Australian Government. Department of Health and Ageing. Australian Pri-
mary Care Collaboratives Program (APCCP). [Online]. Available:www.health.gov.au/internet/main/publishing.nsf/Content/health-pcd-programs-apccp-index.htm [Accessed 21 October 2011].
65. Australian Primary Care Collaboratives (APCC). [Online]. Available:www.apcc.org.au/ [Accessed 21 October 2011].
66. Australian Government. Department of Health and Ageing (2010). MedicareLocals: discussion paper on governance and functions [Online]. Accessedat: www.yourhealth.gov.au/internet/yourhealth/publishing.nsf/content/MedicareLocalsDiscussionPaper [Accessed 21 October 2011].
67. National Preventative Health Taskforce. Australia: the healthiest country by2020. The report of the National Preventative Health Strategy: the roadmapfor action. 30 June 2009 [Online]. Accessed at: www.yourhealth.gov.au/in-ternet/yourhealth/publishing.nsf/Content/nphs-report-roadmap [Accessed 21October 2011].
68. Balen A, Dresner M, Scott E & Drife J (2006). Should obese women withpolycistic ovary syndrome receive treatment for infertility? British MedicalJournal, 332: 434–35.
69. Peters M & Glantz L (2007). Should smokers be refused surgery? BritishMedical Journal, 334: 20–21.
70. Buyx A (2008). Personal responsibility for health as a rationing criterion:why we don’t like it and why maybe we should. Journal of Medical Ethics,34: 871–74.
71. Onishi N (2008). Japan, seeking trim waists, measures millions. New YorkTimes, 13 June 2008.
72. Thaler R & Sunstein C (2008). Nudge: improving decisions about health,wealth, and happiness. New Haven: Yale University Press.
73. Gostin L (2007). General justifications for public health regulation. PublicHealth, 121: 829–34.
74. Marteau T, Oliver A & Ashcroft R (2008). Changing behaviour throughstate intervention. British Medical Journal, 337: a2543.
75. Finkelstein E, Ruhm C & Kosa K (2005). Economic causes and conse-quences of obesity. Annual Review of Public Health, 26: 239–57.
13 How law and regulation can add value to prevention strategies for obesity and diabetes
287
76. James W (2007). The fundamental drivers of the obesity epidemic. ObesityReviews, 9(Suppl. 1): 6–13.
77. Moodie R, Swinburn B, Richardson J & Somaini B (2006). Childhoodobesity: a sign of commercial success, but a market failure. InternationalJournal of Pediatric Obesity, 1(3): 133–38.
78. Jordan A & Robinson T (2008). Children, television viewing, and weightstatus: summary and recommendations from an expert panel meeting. Annalsof the American Academy of Political and Social Science, 615: 119–32.
79. Rose G (1985). Sick individuals and sick populations. International Journalof Epidemiology, 14: 32–38 (p37).
80. Frank J, Lomax G, Baird P & Lock M (2006). Interactive role of genes andthe environment. In J Heymann, C Hertzman, M Barer & R Evans (Eds).Healthier societies: from analysis to action (pp11–34). New York: OxfordUniversity Press (p19).
81. World Health Organisation (2003). Diet, nutrition and the prevention ofchronic diseases. World Health Organization Technical Report Series 916.Geneva, World Health Organization (pp54–71).
82. Kumanyika S (2007). Obesity prevention concepts and frameworks. InS Kumanyika & R Brownson (Eds). Handbook of obesity prevention(pp85–114). New York: Springer (p102).
83. Egger G & Swinburn B (1997). An ‘ecological’ approach to the obesity pan-demic. British Medical Journal, 315: 477–80.
84. McKinlay J & Marceau L (2000). To boldly go … American Journal of Pub-lic Health, 90: 25–33 (pp28–29).
85. Sallis J, Cervero R, Ascher W, Henderson K, Kraft M & Kerr J (2006). Anecological approach to creating active living communities. Annual Review ofPublic Health, 27: 297–322.
86. Campbell I (2003). The obesity epidemic: can we turn the tide? Heart,89(Suppl. II): ii22–ii24.
87. Rose G (1981). Strategy of prevention: lessons from cardiovascular disease.British Medical Journal, 282: 1847–51.
88. Lang T & Rayner G (2007). Overcoming policy cacophony on obesity:an ecological public health framework for policymakers. Obesity Reviews,8(Suppl. 1): 165–81.
A modern epidemic
288

89. Jain A (2005). Treating obesity in individuals and populations. British Med-ical Journal, 331: 1387–90.
90. Epstein R (2005). What (not) to do about obesity: a moderate Aristoteliananswer. Georgetown Law Journal, 93: 1361–86.
91. Epstein R (2003). Let the shoemaker stick to his last: a defense of the ‘old’public health. Perspectives in Biology and Medicine, 46(3): S138–59.
92. Sullum J (2004). The war on fat: is the size of your butt the government’sbusiness? Reason, 8: 20–31.
93. Hall M (2003). The scope and limits of public health law. Perspectives inBiology and Medicine, 46(3): S199–S209.
94. Leeder S (2004). Ethics and public health. Internal Medicine Journal, 34:435–39 (pp436–37).
95. Christakis N & Fowler J (2007). The spread of obesity in a large social net-work over 32 years. New England Journal of Medicine, 357: 370–79.
96. Jochelson K (2006). Nanny or steward? The role of government in publichealth. Public Health, 120: 1149–55.
97. Daube M, Stafford J & Bond L (2008). No need for nanny. Tobacco Control,17: 426–26.
98. Hon. Tony Abbott MHR. Former Minister for Health and Ageing (Aus-tralia). Address to the Queensland Obesity Summit. 3 May 2006 [Online].Accessed at: www.health.gov.au/internet/ministers/publishing.nsf/Content/health-mediarel-yr2006-ta-abb-sp030506.htm?OpenDocument&yr=2006&mth=5 [Accessed 21 October2011].
99. Dorfman L & Wallack L (2007). Moving nutrition upstream: the casefor reframing obesity. Journal of Nutrition Education and Behaviour, 39:S45–S50.
100. Warner K (2006). Tobacco policy research: insights and contributions topublic health policy. In Warner K (Ed). Tobacco control policy (pp3–86).San Francisco: Jossey-Bass (p18).
101. Oliver T (2006). The politics of public health policy. Annual Review of Pub-lic Health, 27: 195–33.
102. Kersh R & Morone J (2002). The politics of obesity: seven steps to govern-ment action. Health Affairs, 21: 142–53.
13 How law and regulation can add value to prevention strategies for obesity and diabetes
289

103. Gostin L (2007). Law as a tool to facilitate healthier lifestyles and preventobesity. Journal of the American Medical Association, 197: 87–90.
104. Magnusson R (2010). Obesity prevention and personal responsibility: thecase of front-of-pack food labelling in Australia. BMC Public Health, 10:662 [Online]. Available: www.biomedcentral.com/1471-2458/10/662 [Ac-cessed 21 October 2011].
105. Roberto C, Schwartz M & Brownell K (2009). Rationale and evidencefor menu-labeling legislation. American Journal of Preventive Medicine, 37:546–51.
106. Patient Protection and Affordable Care Act (US). H.R. 3590, §4205 (Nutri-tion Labeling of Standard Menu Items at Chain Restaurants and of Articlesof Food Sold From Vending Machines).
107. Food Act 2003 (NSW). ss. 106K–106R.108. McCarthy M (2004). The economics of obesity. The Lancet, 364: 2169–70.109. Brownell K & Frieden T (2009). Ounces of prevention: the public policy
case for taxes on sugared beverages. New England Journal of Medicine, 360:1805–08.
110. Institute of Medicine (2009). Local government actions to prevent childhoodobesity. Washington DC: The National Academies Press (pp4–11).
111. New York City Department of Health and Mental Hygiene. NYC GreenCart.[Online]. Available: www.nyc.gov/html/doh/html/cdp/cdp_pan_green_carts.shtml [Accessed 21 October 2011].
112. Tester J, Stevens S, Yen I & Laraia B (2010). An analysis of public healthpolicy and legal issues relevant to mobile food vending. American Journalof Public Health, 100: 2038–46.
113. Coombes R (2011). Trans fats: chasing a global ban. British Medical Jour-nal, 343: d5567.
114. Australian Institute of Health and Welfare (AIHW) (2010). Health expen-diture Australia 2008–09. Health and Welfare Expenditure Series No. 425;Canberra: AIHW (pp8, 77).
115. World Health Organization (2004). Global strategy on diet, physical activityand health. WHA57.17.
116. National Obesity Prevention Act of 2008, H.R. 7179, 110th Congress, 2ndsession, introduced into the House of Representatives, 27 September 2008
A modern epidemic
290

[Online]. Available: www.govtrack.us/congress/bill.xpd?bill=h110-7179[Accessed 21 October 2011].
117. Patient Protection and Affordable Care Act (US). (P.L. 111–148), Title IV(§4001).
118. National Prevention Council (2011). National prevention strategy: Amer-ica’s plan for better health and wellness. Rockville, Maryland: Office of theSurgeon General [Online]. Accessed at: www.healthcare.gov/centre/coun-cils/nphpphc [Accessed 21 October 2011].
119. Department of Health (UK) (2003). Tackling health inequalities: a programfor action (p37). [Online]. Available: www.dh.gov.uk/en/publicationsandsta-tistics/publications/publicationspolicyandguidance/dh_4008268 [Accessed 21 Oc-tober 2011].
120. Australian National Preventive Health Agency Act 2010 (Cth). s 11.121. MacKay S, Antonopoulos N, Martin J & Swinburn B (2011). A compre-
hensive approach to protecting children from unhealthy food advertisingand promotion. Obesity Policy Coalition; Melbourne [Online]. Available:www.opc.org.au/ [Accessed 21 October 2011].
122. Morley B, Chapman K, Mehta K, King L, Swinburn B & Wakefield M(2008). Parental awareness and attitudes about food advertising to childrenon Australian television. Australian and New Zealand Journal of PublicHealth, 32: 341–47.
123. Singh A, Mulder C, Twisk J, van Mechelen W & Chinapaw M (2008).Tracking of childhood overweight into adulthood: a systematic review of theliterature. Obesity Reviews, 9: 474–88.
124. King L, Hebden L, Grunseit A, Kelly B, Chapman K & Venugopal K(2011). Industry self regulation of television food advertising: responsible orresponsive? International Journal of Pediatric Obesity, 6: e390–98.
125. Kelly B, Chapman K, King L & Hebden L (2011). Trends in food adver-tising to children on free-to-air television in Australia. Australian and NewZealand Journal of Public Health, 35: 131–34.
126. Hebden L, King L, Chau J & Kelly B (2011). Food advertising on children’spopular subscription television channels in Australia. Australian and NewZealand Journal of Public Health, 35: 127–30.
13 How law and regulation can add value to prevention strategies for obesity and diabetes
291

127. Federal Trade Commission (2008). Marketing food to children and ado-lescents: a review of industry expenditures, activities, and self-regulation: areport to Congress. Federal Trade Commission.
128. Banks E, Jorm L, Rogers K, Clements M & Bauman A (2010). Screen-time,obesity, ageing and disability: findings from 91 266 participants in the 45and up study. Public Health Nutrition, 14: 34–43.
129. Scully M, Dixon H & Wakefield M (2008). Association between commer-cial television exposure and fast-food consumption among adults. PublicHealth Nutrition, 12: 105–10.
130. Utter J, Scragg R & Schaaf D (2006). Associations between television view-ing and consumption of commonly advertised foods among New Zealandchildren and young adolescents. Public Health Nutrition, 9: 606–12.
131. Wiecha J, Peterson K, Ludwig D, Kim J, Sobol A & Gortmaker S (2006).When children eat what they watch. Archives of Pediatric Adolescent Medi-cine, 160: 436–42.
132. Hesketh K, Wake M, Graham M & Waters E (2007). Stability of televisionviewing and electronic game/computer use in a prospective cohort study ofAustralian children: relationship with body mass index. International Jour-nal of Behavioral Nutrition and Physical Activity, 4: 60 [Online]. Available:www.ijbnpa.org/content/4/1/60 [Accessed 21 October 2011].
133. Institute of Medicine (2006). Food marketing to children and youth: threator opportunity. Washington DC: The National Academies Press.
134. Chou S, Rashad I & Grossman M (2008). Fast-food restaurant advertisingon television and its influence on childhood obesity. Journal of Law andEconomics, 51: 599–618 (p602).
135. Boyland E, Harrold J, Kirkham T, Corke C, Cuddy J, Evans D, et al. (2011).Food commercials increase preference for energy-dense foods, particularlyin children who watch more television. Pediatrics, 128: e93–e100.
136. The Council of Better Business Bureaus. The Children’s Food and BeverageInitiative [Online]. Accessed at: www.bbb.org/us/about-children-food-beverage-advertising-initiative/ [Accessed 21 October 2011].
137. Harris J, Weinberg M, Schwartz M, Ross C, Ostroff J & Brownell K (2010).Trends in television food advertising: progress in reducing unhealthy mar-keting to young people? Yale University: Rudd Center for Food Policy &
A modern epidemic
292

Obesity.138. Harris J & Sarda V (2011). Trends in television food advertising to young
people. 2010 Update. Yale University: Rudd Center for Food Policy & Obe-sity [Online]. Accessed at: www.yaleruddcenter.org/briefs.aspx [Accessed21 October 2011].
139. Kunkel D, McKinley C & Wright P (2009). The impact of industry self-regulation on the nutritional quality of foods advertised on television tochildren. Commissioned by Children Now [Online]. Available:www.childrennow.org/index.php/learn/reports_and_research/article/576 [Accessed 21 October 2011].
140. Interagency Working Group on Food Marketed to Children (2011). Prelim-inary proposed nutrition principles to guide industry self-regulatory efforts:request for comments [Online]. Available: www.ftc.gov/opa/2011/04/food-market.shtm [Accessed 21 October 2011].
141. Mello M (2010). Federal Trade Commission regulation of food advertisingto children: possibilities for a reinvigorated role. Journal of Health Politics,Policy and Law, 35: 227–76.
142. Kolish E (2011). The children’s food and beverage advertising initiativewhite paper on CFBAI’s Uniform Nutrition Criteria [Online]. Accessedat: www.bbb.org/us/children-food-beverage-advertising-initiative/info/ [Ac-cessed 21 October 2011].
143. The Council of Better Business Bureaus (2011). Comments to the Inter-agency Working Group on food marketing to children [Online]. Accessedat: www.bbb.org/us/children-food-beverage-advertising-initiative/info/com-ments/ [Accessed 21 October 2011].
144. Australian Media and Communications Authority (2009). Children’s tele-vision standards 2009 [Online]. Available: www.acma.gov.au/WEB/STAN-DARD/pc=PC_310262 [Accessed 21 October 2011].
145. Jolly R (2011). Marketing obesity? Junk food, advertising and kids. Parlia-mentary Library Research Paper no. 9, 2010–11.
146. Broadcasting Services Act 1992 (Cth). s.122.147. Kelly B & Chau J (2007). Children’s television sub-standards: a call for sig-
nificant amendments. Medical Journal of Australia, 186: 18 (letter).148. Chapman K, Nicholas P & Supramaniam R (2006). How much food adver-
13 How law and regulation can add value to prevention strategies for obesity and diabetes
293

tising is there on Australian television? Health Promotion International, 21:172–80.
149. Australian Communications and Media Authority (2009). Review of thechildren’s television standards, 2005: final report of the review. Canberra:ACMA [Online]. Accessed at: www.acma.gov.au/WEB/STANDARD/pc=PC_90095 [Accessed 21 October 2011].
150. Richard Ingleby, Lauren Prosser & Elizabeth Waters (2008). UNCROC andthe prevention of childhood obesity: the right not to have food advertise-ments on television. Journal of Law and Medicine, 16: 49–56 (pp55–56).
151. Free TV Australia (2010). 2010 commercial television industry code ofpractice [Online]. Available: www.freetv.com.au/content_common/pg-code-of-practice.seo [Accessed 21 October 2011].
152. Broadcasting Services Act 1992 (Cth). s.123.153. Australian Association of National Advertisers (2009). Code for advertising
& marketing communications to children; August 2009 [Online]. Available:www.aana.com.au/codes.html [Accessed 21 October 2011].
154. MacKay S (2009). Food advertising and obesity in Australia: to what extentcan self-regulation protect the interests of children? Monash University LawReview, 35: 118–46 (p134).
155. Australian Food and Grocery Council (2009). The responsible children’smarketing initiative [Online]. Available: www.afgc.org.au/industry-codes/advertising-kids.html [Accessed 21 October 2011].
156. Hebden L, King L, Grunseit A, Kelly B & Chapman K (2011). Advertisingof fast food to children on Australian television: the impact of industry self-regulation. Medical Journal of Australia, 195: 20–24.
157. Handsley E, Mehta K, Coveney J & Nehmy C (2009). Regulatory axes onfood advertising to children on television. Australia and New Zealand HealthPolicy, 6: 1.
158. The UK Code of Broadcast Advertising (BCAP Code) (2010). [Online].Accessed at: www.cap.org.uk/The-Codes/BCAP-Code.aspx [Accessed 21October 2011].
159. The Contracting Out (Functions Relating to Broadcast Advertising) andSpecification of Relevant Functions Order 2004 (UK). [Online]. Available:www.legislation.gov.uk/uksi/2004/
A modern epidemic
294

1975/pdfs/uksi_20041975_en.pdf [Accessed 13 December 2011].160. Derbyshire D (2006). Ban all junk food ads before 9pm, says watchdog. The
Telegraph (UK). 15 June [Online]. Available: www.telegraph.co.uk/news/uknews/1521313/Ban-all-junk-food-ads-before-9pm-says-watchdog.html[Accessed 21 October 2011].
161. Food Standards Agency (UK) (2009). Guide to using the nutrient profilingmodel [Online]. Available: food.gov.uk/healthiereating/advertisingtochil-dren/nutlab/nutprofmod [Accessed 21 October 2011].
162. Advertising Standards Authority (ASA). [Online]. Available: asa.org.uk/[Accessed 21 October 2011].
163. Bond M, Williams M, Crammond B & Loff B (2010). Taxing junk food:applying the logic of the Henry Tax Review. Medical Journal of Australia,193: 472–73.
164. Harper T & Mooney G (2010). Prevention before profits: a levy on food andalcohol advertising. Medical Journal of Australia, 192: 400–02.
165. Giang T, Karpyn A, Laurison H, Hillier A & Perry R (2008). Closingthe grocery gap in underserved communities: the creation of the Pennsylva-nia Fresh Food Financing Initiative. Journal of Public Health ManagementPractice, 14: 272–79.
166. Commonwealth of Australia (2009). Australia’s future tax system – reportto the Treasurer: part two, detailed analysis, volume 1 (The Henry Review)(pp320–22).
167. Mytton O, Gray A, Rayner M & Rutter H (2007). Could targeted foodtaxes improve health? Journal of Epidemiology and Community Health, 61:689–94.
168. Goetzel R & Ozminkowski R (2008). The health and cost benefits ofwork site health-promotion programs. Annual Review of Public Health, 29:303–23.
169. Baicker K, Cutler D & Song Z (2009). Workplace wellness programs cangenerate savings. Health Affairs, 29: 304–11.
170. World Economic Forum. Workplace Wellness and Chronic Disease Pre-vention [Online]. Available: members.weforum.org/en/initiatives/Wellness/index.htm. [Accessed 21 October 2011].
171. World Economic Forum. Workplace Wellness Alliance [Online]. Available:
13 How law and regulation can add value to prevention strategies for obesity and diabetes
295

www.weforum.org/issues/workplace-wellness-alliance. [Accessed 21 Octo-ber 2011].
172. The Kaiser Family Foundation and Health Research & Educational Trust(2010). Employer health benefits 2010 annual survey [Online]. Available:ehbs.kff.org/ [Accessed 21 October 2011].
173. Patient Protection and Affordable Care Act (US). P.L. No. 111–148 (2009).s.10408.
174. Patient Protection and Affordable Care Act (US). P.L. No. 111–148 (2009).s.1001, inserting s. 2717 into the Public Health Service Act.
175. Patient Protection and Affordable Care Act (US). P.L. No. 111–148 (2009).s. 303.
176. 45 C.F.R. §146.121(b).177. 45 C.F.R. §146.121(f).178. Rothstein M & Harrell H (2009). Health risk reduction programs in
employer-sponsored health plans: part II – law and ethics. Journal of Occu-pational and Environmental Medicine, 51: 951–57.
179. Patient Protection and Affordable Care Act (US). P.L. No. 111–148 (2009).s.1201, inserting s. 2705 into the Public Health Service Act.
180. Volpp K, Asch D, Galvin R & Loewenstein G (2011). Redesigning em-ployee health incentives: lessons from behavioral economics. New EnglandJournal of Medicine, 365: 388–90.
181. Jesson J (2008). Weighing the wellness programs: the legal implications ofimposing personal responsibility obligations. Virginia Journal of Social Pol-icy and the Law, 15: 217–98.
182. Patient Protection and Affordable Care Act (US). P.L. No. 111–148 (2009).s.1201, inserting ss.2702–03 into the Public Health Service Act.
183. Patient Protection and Affordable Care Act (US). P.L. No. 111–148 (2009).ss.1301–02.
184. The Healthy Workforce Act of 2009. S. 803/H.R. 1897 [Online]. Available:www.govtrack.us/congress/bill.xpd?bill=h111-1897 [Accessed 21 October2011].
185. US Workplace Wellness Alliance [Online]. Available: www.uswwa.org/[Accessed 21 October 2011].
186. Private Health Insurance Act 2007 (Cth). s. 55.5.
A modern epidemic
296
187. Council of Australian Governments (COAG) (2008). National partnershipagreement on preventive health. Signed by Australian Governments. Decem-ber [Online]. Available: www.anpha.gov.au/internet/anpha/publishing.nsf/Content/publications [Accessed 21 October 2011].
188. National Partnership Agreement on Preventive Health: National implemen-tation plan 2009–15, (pp38–48). [Online]. Available: www.anpha.gov.au/internet/anpha/publishing.nsf/Content/publications [Accessed 21 October 2011].
189. NSW Health. Centre for Health Advancement (2010). NSW Healthy Work-ers Initiative: discussion paper. Centre for Health Advancement [Online].Available: www.health.nsw.gov.au/Initiatives/healthyworkers/index.asp[Accessed 21 October 2011].
190. Swinburn B, Sacks G, Hall K, McPherson K, Finegood D, Moodie M, et al.(2011). The global obesity pandemic: shaped by global drivers and local en-vironments. The Lancet, 378: 804–14 (p807).
191. Yach D, Khan M, Bradley D, Hargrove R, Kehoe S & Mensah G (2010).The role and challenges of the food industry in addressing chronic disease.Globalization and Health, 6: 10 [Online]. Available:www.globalizationandhealth.com/content/6/1/10 [Accessed 21 October2011].
192. Stolberg S (2011). Wal-Mart shifts strategy to promote healthy foods. NewYork Times, 20 January 2011.
193. Food Standards Australia New Zealand (FSANZ). Food standards code [On-line]. Available: http://www.foodstandards.gov.au/code/Pages/default.aspx[Accessed 21 October 2011].
194. Walker K, Woods J, Rickard C & Wong C (2007). Product variety in Aus-tralian snacks and drinks: how can the consumer make a healthy choice?Public Health Nutrition, 11: 1046–53.
195. New York City, Department of Health and Mental Hygiene. Board of healthapproves regulation to phase out artificial trans fat [Online]. Available:www.nyc.gov/html/doh/html/cardio/cardio-transfat-healthcode.shtml [Ac-cessed 21 October 2011].
196. Mello M (2009). New York City’s war on fat. New England Journal of Med-icine, 360: 2015–20.
13 How law and regulation can add value to prevention strategies for obesity and diabetes
297

197. Brown I, Tzoulaki I, Candeias V & Elliott P (2009). Salt intakes around theworld: implications for public health. International Journal of Epidemiology,38: 791–813 (p807).
198. He F & MacGregor G (2009). A comprehensive review of salt and healthand current experience of worldwide salt reduction programmes. Journal ofHuman Hypertension, 23: 363–84.
199. He F & MacGregor G (2010). Reducing population salt intake worldwide:from evidence to implementation. Progress in Cardiovascular Diseases, 52:363–82.
200. Cappuccio F, Capewell S, Lincoln P & McPherson K (2011). Policy optionsto reduce population salt intake. British Medical Journal, 343: d4995.
201. Australian Government. Department of Health and Ageing. Food and healthdialogue [Online]. Available: www.foodhealthdialogue.gov.au/internet/foodandhealth/publishing.nsf/Content/Home [Accessed 24 October 2011].
202. He F, Marrero N & MacGregor G (2008). Salt intake is related to soft drinkconsumption in children and adolescents: a link to obesity? Hypertension,51: 629–34.
203. Food Standards Agency (UK) (2009). Salt reduction targets. 18 May [On-line]. Accessed at: www.food.gov.uk/scotland/scotnut/salt/saltreduction[Accessed 24 October 2011].
204. New York City. Department of Health and Mental Hygiene. Cutting salt,improving health [Online]. Available: www.nyc.gov/html/doh/html/cardio/cardio-salt-initiative.shtml [Accessed 24 October 2011].
205. Forshee R (2008). Innovative regulatory approaches to reduce sodium con-sumption: could a cap-and-trade system work? Nutrition Reviews, 66:280–85.
206. Sugarman S (2009). Salt, high blood pressure, and performance-based regu-lation. Regulation & Governance, 3: 84–102.
207. Institute of Medicine (IOM) (2010). Strategies to reduce sodium intakein the United States. Washington, DC: The National Academies Press(pp8–15ff).
208. Australian National Preventive Health Agency Act 2010 (Cth). s. 11.209. Food Standards Australia New Zealand Act 1991 (Cth). s. 17.210. Malone R (2010). The tobacco industry. In W Wiist (Ed). The bottom line or
A modern epidemic
298

public health: tactics corporations use to influence health and health policy,and what we can do to counter them (pp155–91). New York: Oxford Univer-sity Press.
211. World Health Organization (2008). Guidelines for implementation of Arti-cle 5.3 of the WHO Framework Convention on Tobacco Control – on theprotection of public health policies with respect to tobacco control from com-mercial and other vested interests of the tobacco industry. Decision FCTC/COP3(7). November.
212. Roberts I (2008). Corporate capture and Coca-Cola. The Lancet, 372:1934–35.
213. Chopra M & Darnton-Hill I (2004). Tobacco and obesity epidemics: so dif-ferent after all? British Medical Journal, 328: 1558–60
214. Ludwig D & Nestle M (2008). Can the food industry play a constructive rolein the obesity epidemic? Journal of the American Medical Association, 300:1808–11.
215. Yach D (2008). Food companies and nutrition for better health. PublicHealth Nutrition, 11: 109–11.
13 How law and regulation can add value to prevention strategies for obesity and diabetes
299

14Whole of society approaches to pre-
venting obesity and diabetesPhilayrath Phongsavan,1 Chris Rissel, Lesley King and Adrian Bauman
The current diabetes and obesity epidemic is largely a societally and envi-ronmentally constructed health problem. Physical inactivity and excessiveintake of nutrient-poor and energy-dense foods are the two most impor-tant proximal behavioural contributors to the unprecedented diabetes andobesity levels currently facing many nations. Traditionally, individual be-haviour change approaches and counselling, often combined with judicioususe of evidence-based pharmacological agents, have been the mainstay ofefforts to reduce these health risks. A newer socio-ecological approachrefocuses solutions on tackling broader environmental causes of obesityand type 2 diabetes. This chapter examines promising societal and envi-ronmental responses that enable and support regular physical activity andhealthy eating across populations. These approaches include redesigningthe built environment, providing active transport options, promoting theavailability and accessibility of healthy food choices, restricting promotionof unhealthy foods, and implementing ongoing social marketing strategiesto influence sustained healthy eating and physical activity behaviours. Im-plications for policy development and how public health can work withvarious sectors of society to halt the rise in obesity and diabetes are dis-cussed.
If it takes a village to raise a child, it takes the organised efforts of a society toensure that all of its children grow up to be healthy. A public health approach, bydefinition, involves ‘the science and art of preventing disease, prolonging life andpromoting health through the organized efforts and informed choices of society,organizations, public and private, communities and individuals’ [1].
Diabetes mellitus, in its commonest form known as type 2 diabetes, and obe-sity, share some of the same modifiable risk factors, such as low physical activity,
1 Prevention Research Collaboration, Sydney School of Public Health, University ofSydney.
300

prolonged sitting, and too much energy-dense, nutrient-poor foods. As a society,we have created a social and physical environment that facilitates being seden-tary and encourages excessive food consumption. High-kilojoule conveniencefoods are readily available and more affordable than fresh food, and heavily mar-keted to all ages. We have designed transport systems to minimise physical effort,and prioritised private motor vehicles over public transport by building motor-ways instead of railways or rapid bus transit corridors. Unchecked developmenton urban fringes creates a vast suburban sprawl, making distances too great forwalking and cycling. These structural problems facilitate and reinforce individualbehaviours, with inactive options logistically easier, and unhealthy food choicescheaper and more accessible. This chapter examines the way this has occurred,and suggests ways to reorganise the efforts of society to create a healthier physi-cal and social environment.
A SOCIO-ECOLOGICAL PERSPECTIVE AS ASOCIETAL SOLUTION TO PREVENTING OBESITY
AND DIABETESUntil recently, most obesity and diabetes prevention strategies have involvedbehaviour change programs that focus on the biology and psychology of the indi-vidual. This approach has some limitations. First, even optimal interventions thatpersuade individuals to eat better and be more physically active tend to have ei-ther weak or short-lived effects [2, 3]. This, together with the rapid rise in obesityand diabetes globally over the past three decades [4], suggests that the causes ofobesity and diabetes are beyond individual biology and psychology. Second, in-dividual and education-based programs tend to have low population reach, andusually enrol motivated individuals or those with already high levels of risk.While this strategy yields great effects for high-risk individuals, it has minimaleffects on population levels of obesity and diabetes because it does not reach thelargest numbers of people, those who are at average risk. As the causes of obesityand diabetes are likely to be linked to broader environmental and societal changes[5, 6, 7] that can impact populations, there is a need for a shift in thinking and so-lutions to these problems.
To achieve large and sustained public health gains through the prevention ofdiabetes and obesity, the whole population needs to be targeted regardless of theircurrent health status. Even small shifts in the average level of a risk factor withina population would result in large population effects overall [8]. Optimal publichealth strategies then would encourage everyone in the community to make smallshifts in lifestyle habits every day [9].
Socio-ecological perspectives describe the multilevel influences on individ-ual health behaviour [10, 11]. Figure 1 shows these influences, conceptually drawn
14 Whole of society approaches to preventing obesity and diabetes
301

as concentric circles of influences from proximal to distal. Individual character-istics, beliefs and attitudes comprise the inner circle, surrounded by immediateinfluences of friends and family. Institutional environmental influences thencome into play, such as the food environment and physical environment at work-places, schools and places where people spend most of their time. Broader outercircles reflect the urban community environment, and the economic and culturalenvironments in which people live; these can influence social norms, food pro-duction and availability, public open space provision, and the existence of activetransport options in communities and cities.
The socio-ecological perspective posits that prevention programs and poli-cies that change people’s knowledge, attitudes and skills without changing thesocietal and physical environments in which people work, live and play, areunlikely to be effective. Prevention strategies must operate on multiple levels, in-cluding individually targeted and tailored behaviour change components, as wellas environment and social support strategies to make it easier for individuals toadopt healthy practices. Becoming more physically active is easier where thereare safe walking/cycling paths in the neighbourhood, exercise stations or qualityplaygrounds in local parks. Healthy food choices are facilitated by neighbour-hood shops that stock affordable and nutritious food. Interventions that cultivatesocial norms about the benefits of physical activity and healthy eating, policiesthat ensure physical activity programs are available in parks, or initiatives thatemphasise the provision of comprehensible nutrition information at point of pur-chase all have potential important benefits. The following sections examine somepromising societal and environmental responses that facilitate regular physicalactivity and healthy eating across populations.
A modern epidemic
302

Figure 1. Socio-ecological perspective for obesity and diabetes prevention across soci-etal levels [10, 11]
PHYSICAL ACTIVITY ENVIRONMENTS
Redesigning the built environment for walking and cyclingOver half the Australian population is not reaching minimal recommendations ofaround 150 minutes per week (2.5 hours) of moderate–vigorous physical activityfor health benefits [12]. This equates to approximately half an hour of activity ac-cumulated over at least five separate sessions on most days each week. The targetamount of 150 minutes per week can also be accrued in short bouts of ten minutesor more. Recommendations for weight maintenance or weight loss are substan-tially greater, typically around 60 to 90 minutes daily [13].
A key contributor to decreased daily physical is increased reliance on motorvehicles. Over 75% of Australians live in an urban setting [14], with a third of allcar trips under three kilometres and a half under five kilometres, distances thatcould easily be walked or cycled. Short trips by bicycle can in fact be faster in an
14 Whole of society approaches to preventing obesity and diabetes
303

inner city context than driving [15]. If available, public transport as an alternativeto driving can also provide some physical activity. Catching a bus or train gen-erally involves a walk at either end of the trip. Walking, cycling or using publictransport is often called ‘active travel’.
Cycling is an important form of active travel. However, while about 10%of Australians will cycle in any given year, only 1%–2% cycle daily [16]. Theopportunity to cycle depends on good cycling infrastructure, with a network ofwell-connected bicycle lanes and routes. This is particularly needed to over-come the perception of the dangers of cycling, ideally by separating cyclists frommainstream car traffic [17]. Recent cycling infrastructure development in centralSydney that applied these guidelines has resulted in an increase in the observednumbers of daily bicycle trips [18].
It is also important to encourage walking as a form of active travel. Walkingaccounts for two-thirds of women’s and one-half of men’s health enhancing phys-ical activity [19], yet, the built environment in urban areas discourages walking.More sustained walking and cycling behaviours can be encouraged by urban de-sign that creates a physical environment more conducive to cycling and walking.For example, occasional or non-regular riders do not ride long distances for utili-tarian purposes. One way to reduce trip distances is to develop cities with higherdensity and greater mixed land use (having residential zoning near commercialareas). Urban planners and transport engineers could create more walkable physi-cal environments through medium-density housing, connection of street networksand having mixed-use destinations (having local shops, businesses and residen-tial dwellings in the same neighbourhood) [20]. This means more people can livenear where they work, removing the need to commute long distances. Most peo-ple will choose the easiest, cheapest and most convenient way to get to work. Ifpedestrian and cycling footpaths were available, active transport is more likely.
While there is some truth in the idea of ‘build it and they will come’, theoptimal approach is for good cycling and walking infrastructure to be built andpromoted to the public and prospective users. A community-based project inWestern Sydney to encourage cycling and the use of existing bicycle paths founda significant increase as a result of social marketing and behavioural programs[21, 22]. Similarly, there is a need to create and then promote walkable environ-ments to the community, and change community perceptions around walking asa mode of transport.
Redesigning public spaces for active living and recreationalactivities
Active living refers to opportunities for people to incorporate active travel andrecreational activities into their everyday lives. Town and city residents rely onpublic spaces such as natural reserves and public parks as venues for outdoor
A modern epidemic
304

recreational activities [23]. Theoretically, public spaces are more likely to be usedby the general population than indoor sport and exercise facilities such as the gym[24]. Epidemiological evidence shows that people living in activity-friendly envi-ronments with green spaces, playgrounds and walking/jogging paths tend to bemore physically active [25, 26, 27, 28], and both adults and children have reducedobesity risk [29, 30]. A recent systematic review found open space preservationto be associated with increased physical activity levels, primarily walking [31].Yet, public spaces such as neighbourhood parks are an underutilised environ-mental setting for promoting physical activity. This reflects a research area inevolution, with much research describing associations between park characteris-tics and physical activity [27]. Limited evidence notwithstanding, the evidence todate supports the notion of neighbourhood parks as a promising environmentalsetting for promoting recreational activities. Since public spaces are amenable tochange, improving their conduciveness to physical activity has good potential toimprove the quality of community life [32].
Two ‘naturalistic’ studies in Sydney evaluated the impact of park improve-ments on physical activity levels. One study in Western Sydney did not reachconclusive findings about the impact of improving the environment in three parkson physical activity participation [33]. Another study in an inner Sydney sub-urb found improving children’s playgrounds increased usage [34]. Despite theirpotential policy implications, intervention evidence from these naturalistic stud-ies, so called because they aimed to evaluate the effectiveness of environmentalchanges opportunistically, remains limited [35, 36].
Even though improving facilities and amenities is an important step, thesocio-ecological perspective would propose that an integrated approach wouldcomprise promotion to increase awareness, and organised activity programs inrenovated public spaces are also needed to motivate community use [35, 37]. Lo-cal councils and governments are in the position to define public space (re)designfor supporting community-wide physical activity participation, and ensure thatappropriate recreational programs are provided and promoted to the community.
Narrowing the health inequality gap through environmentalstrategies
Health inequalities between neighbourhoods have been well documented in Aus-tralia [38]. People living in socioeconomically disadvantaged areas have higherrates of chronic diseases and lower leisure-time physical activity than those inmore affluent neighbourhoods [39]. One benefit of a socio-ecological perspectivein a comprehensive multilevel prevention obesity/diabetes program is that theinterventions can impact whole populations, not just motivated individuals whoattend clinics or specific programs. Based on this perspective, the development ofpublic infrastructure could contribute to reducing the differences in health behav-
14 Whole of society approaches to preventing obesity and diabetes
305

iours between poor and wealthy areas [40, 41, 42, 43].Positive relationships between access to quality public spaces and increased
physical activity and reduced obesity risk are most apparent among residents liv-ing in socioeconomically disadvantaged areas, the elderly and homemakers [27,30]. This suggests that improving the quality of public spaces (eg access, aes-thetics, functionality, proximity, perceived safety), may counter the effects ofneighbourhood socioeconomic disadvantage, and contribute to narrowing the di-abetes and obesity inequality gap between areas [44].
Summary of physical activity environmentsLiving in activity-friendly communities can facilitate active transport and recre-ation for every person regardless of their socioeconomic status. Although moreevidence is needed to demonstrate direct links between specific environmentalinfrastructure and physical activity, public health experts consider the evidencesufficient to recommend policy interventions to reshape approaches to urbanplanning and built environment designs for supporting active living [45]. Increas-ing incidental and everyday physical activities through environmental approachesmay contribute sufficiently to increase total energy expenditure, and to have arole in obesity and diabetes prevention.
FOOD ENVIRONMENTSDespite living in a society that has a plentiful supply of nutritious foods, themajority of Australian adults and children do not eat in accordance with dietaryguidelines, and in particular consume excessive amounts of energy-dense,nutrient-poor (EDNP) foods. Energy-dense, nutrient-poor foods refer to foodshigh in total energy, fat and/or sugar and with little positive nutritional value.Examples include many fast foods, fried foods, fatty meats, cakes, confectioneryand sweetened drinks.
Population increases in the prevalence in overweight and obesity indicatethat a significant proportion of adults and children consume more energy thanthey require on a regular basis. In 2007, EDNP foods contributed to 35% of thedaily energy intake of children aged two to 16 years, which is twice the recom-mended limit of 5%–20% [46]. For adults, EDNP comprised 36% of energy intakein 1995 [47].
As with physical activity, the science of nutrition education started withprograms and clinicians providing advice to individuals. The approach has broad-ened to encompass the food environment, social norms and broader environ-mental influences, as highlighted by the socio-ecological framework. Food con-sumption patterns reflect the interactions between individual factors, such as
A modern epidemic
306

food preferences and disposable income, and environmental factors, such as foodavailability, price and marketing. Despite the positive aspects of our food supply,our food environment in fact promotes excessive food consumption, particularlyof EDNP foods. Energy-dense, nutrient-poor foods are widely available and ex-tensively marketed, through multiple media as well as at point of sale [48]. Theseenvironmental influences are particularly strong, as nutrition information aboutspecific food products is not highly accessible at point of sale. As such, there aremany barriers to ‘making healthy choices easier choices’.
Redesigning environments to improve the availability ofhealthy foods
People’s access to healthy foods is influenced by the availability of healthy foodsin their neighbourhood, or their access to transport to travel to more distant foodretail outlets. A landmark study of 221 census areas with over 10 000 residentsin the US found that residents increased their fruit and vegetable consumption by32% for each additional supermarket in their census area [49]. Further studies inboth Australia and other developed countries have consistently found that super-markets offer a predictably large range of healthier food items and at lowest costs[50, 51].
Much of the work exploring food environments has focused on access differ-entials between more and less socioeconomically advantaged areas as a possibleexplanation of social gradients in the prevalence of obesity. This correspondsto the concept of ‘deprivation amplification’, where disadvantages arising frompoorer quality environments amplify individual disadvantages in ways that aredetrimental to health [52].
Some international studies have described reduced food availability andquality, and increased price of healthier foods in more disadvantaged neighbour-hoods and rural areas [53, 54]. However, this has not been a consistent finding, andhealthy food availability probably also depends on other factors such as popula-tion density and urban planning.
Two studies from the UK prospectively examined the impact of introducinga supermarket into an area which did not previously have one. Whilst one studyfound a substantial increase in nearby residents’ consumption of fruit and veg-etables [55], the other only found a change in those residents who switched to doall their shopping at the new supermarket [56]. A US study which followed 5115people in several cities for 15 years, found that easy access to fresh food storesdid not improve food choices [57]. The study also found that living near fast-foodoutlets was associated with increased consumption of fast food. Thus, limiting theavailability and access to fast foods may be as important as increasing the avail-ability and access of healthy food.
Altogether, the body of research on community food availability reinforces
14 Whole of society approaches to preventing obesity and diabetes
307

the public health value of mixed land use, with convenient location of supermar-kets, and public transport routes, active transport infrastructure and communitytransport options to ensure people have good access to supermarket destinations[58].
Redesigning the nutrition information environment: foodand menu labelling
People’s access to healthy foods is also influenced by their ability to identifyhealthier food products. Thus, nutrition information systems are considered bypublic health professionals as important communication tools to inform and po-tentially influence consumers. They are also of interest to the food industry aspromotional and marketing tools which offer opportunities for communicatingboth factually and persuasively.
Recently, front-of-pack (FOP) signposting schemes have been proposed as aconsumer-friendly tool to assist consumers in making at-a-glance decisions abouta product’s nutritional composition [59]. The value of a FOP system has beenclearly identified, and research indicates that shoppers achieve higher accuracyin determining product healthiness with simpler nutritional formats, particularlytraffic light systems [60]. However, the public health and food industry interestsin nutritional labelling have led to a plethora of FOP labelling systems over re-cent years, and there is now evidence that the simultaneous operation of multiplesystems creates confusion and lack of trust in such information [61]. The need tohave a single, consistent system in operation provides a strong argument for amandatory labelling system. Researchers have also shown that the use of uniformFOP labelling may have indirect impacts on food supply, and may influence re-formulation or development of healthier products [62].
As Australians are increasingly purchasing and relying on foods preparedoutside the home, there has also been increased research and policy emphasison the provision of nutrition information at point of purchase in food serviceoutlets, despite inconclusive evidence regarding the effects of such labelling onpurchasing and consumption [63]. In the interests of consumer information, theNew South Wales (NSW) government has introduced legislation requiring allchain restaurants with 20 or more locations in NSW or 50 or more locations na-tionally to include kilojoule labelling on their menu boards for all ‘standard menuitems’ from 2012. This follows the introduction of state menu nutrition labellingpolicies across the US since 2003, and a national bill in March 2010.
Redesigning the nutrition information environment:limiting food marketing
Whilst public health seeks to provide consumers with nutrition information, food
A modern epidemic
308

marketing is designed to persuade consumers to buy specific food products, andtends to undermine public health nutrition efforts. The specific concern arisesas food marketing is highly pervasive and the majority of foods advertised areEDNP [46].
Australian and international studies indicate that reductions in advertisingof unhealthy foods and beverages are likely to be a cost-effective (and probablycost-saving) strategy for obesity prevention and chronic disease prevention [64,65].
Many governments and international agencies have concerns about the mar-keting of foods and non-alcoholic drinks to children. In May 2010 the WorldHealth Organization stipulated that governments should develop appropriate poli-cies and set clear definitions for key components of restrictions on marketing offoods and drinks to children [66]. On the basis of the evidence, the AustralianGovernment’s National Preventative Health Task Force (2009) recommendedgovernment restrictions to reduce children’s exposure to advertising of unhealthyfoods [67]. In response, the Australian Government decided it would monitorthe impact of self-regulation on ‘reducing children’s exposure to advertising ofenergy-dense, nutrient-poor foods and beverages’, before any further governmentaction [68].
Since then, studies indicate that industry self-regulation remains inadequatein reducing Australian children’s exposure to junk food advertising on television,and children still see the same amount of television advertising for unhealthyfoods as they did before industry self-regulation was introduced in 2009 [69,70]. The lack of impact partially reflects the voluntary participation and lenientspecifications of the industry self-regulatory standards [71]. For example, foodcompanies were found to consistently stipulate higher thresholds for negativenutrients (saturated fats, added sodium and sugars) compared with existing pro-fessional criteria [72].
The rationale for government action to limit food marketing to children isgaining momentum. Only government is in the position to set a framework of ad-vertising standards defining the types of foods and drinks deemed appropriate foradvertising to children based on a food or drink’s nutrient profile, and assessedusing a standardised, independent nutrient-profiling tool; and ensure that thesestandards apply to all food companies.
Summary of food environmentsRedesigning food environments to make them more conducive to healthy eatingis fundamental to promoting nutrition at a population level. Individuals needto be informed about healthy food options, but the broader environment thatpromotes, advertises and creates accessible food purchasing also need to be influ-enced, if population dietary patterns are to be changed. Policies can ensure that
14 Whole of society approaches to preventing obesity and diabetes
309

healthy foods are widely available and accessible, that people have easy accessto accurate nutritional information in order to identify healthier foods, and thatthis information is not undermined by persuasive marketing. These actions cancontribute to a comprehensive approach to public health nutrition and obesity pre-vention.
CREATING SOCIETAL NORMS FOR ACTIVELIVING AND HEALTHY EATING
Even environmental and policy changes may not be sufficient to motivate peopleto become physically active or eat healthily. Cultural values and social normsalso play a key role in the types and quantities of food and drinks consumed; andhow much and where physical activity is incorporated into daily living. Whenindividuals engage in active modes of travel, some may do so because they seeothers doing it, and consider such behaviour the norm in their society. Accordin-gly, striving for healthy eating habits and regular physical activity can be moredifficult if such practices are not valued or perceived to be desirable within a so-ciety.
In this context, social marketing is well placed to augment the benefits ofenvironmental and policy changes in ways that are consistent with a socio-eco-logical framework [67, 73]. Geoffrey Rose reminded us that ‘It makes little senseto expect individuals to behave differently from their peers; it is more appro-priate to seek a general change in behavioural norms and in the circumstanceswhich facilitate their adoption’ [74]. Diverse and complementary chronic dis-ease prevention initiatives therefore must be supported by consistent messages toreshape cultural values and social norms. This includes promoting practical, sim-ple everyday changes in lifestyles [75], as well as cultivating political and socialmovements for active communities and a healthy food supply. In this situation,social marketing to change social norms has an advocacy component, includingtargeting key decision-makers about a policy development or resource allocationdecision [76]. This strategy has been widely used in tobacco control, where thereis already strong community support for tobacco control legislation. In obesityand diabetes prevention, the goal is to replace the ‘obesogenic’ features of envi-ronment with environments that make it easier for individuals to be active andmake healthy nutrition choices.
PREVENTING OBESITY AND TYPE 2 DIABETES ISA SHARED RESPONSIBILITY
The socio-ecological approach provides a framework to implement a broad range
A modern epidemic
310

of environmental and policy initiatives across multiple levels of society. Thisinvolves directing physical activity and nutrition initiatives at infrastructure (egactive living communities), institutions (eg retail settings, workplaces), policiesand regulations (eg food marketing to children), media (eg coverage of healthissues), and social norms (eg relationships, behaviours). Building footpaths andregulating availability of fast food outlets are more permanent strategies, and canimpact larger numbers of people than individual-based health education programsthat target smaller numbers of motivated individuals with high risks. Makingthese changes at the whole population level is a necessary antecedent to diabetesprevention and to weight maintenance and obesity prevention.
The reality of widespread societal and environmental initiatives will requirecommitted and sustained advocacy and resources, with positive population-widechanges in obesity and diabetes taking several years to manifest. Acknowledgingthis complexity, solving the obesity and diabetes ‘epidemics’ will require build-ing multidisciplinary collaborations between scientists and policy-makers.Strengthening the research translation pathways, from findings to practice andpolicy enactment will be an important component of such collaborations. It is im-portant to recognise that all tiers of government and various sectors of societyshape beliefs and practices about physical activity and eating. As such, all areresponsible for society’s health. Organised public health efforts involve collab-orations across government sectors and with different groups in society, such asindustry, consumer groups, civil society and the media. As the City of Sydney hasshown, urban renewal for active living across the life span and for all sub-popula-tion groups is possible in Australia. Government leadership, social planning andurban renewal that engages communities, businesses and relevant stakeholders isfundamental to the process. Only then will a society be able to hardwire regu-lar physical activity and healthy eating into its everyday fabric and ensure moresustainable healthy behaviours to prevent obesity, diabetes and other chronic dis-eases.
References1. Winslow CE (1920). The untilled fields of public health. Science, 51(1306):
23–33.2. Centers for Disease Control and Prevention (CDC) (2010). Guide to com-
munity preventive services: promoting good nutrition [Online]. Available:www.thecommunityguide.org/nutrition/index.html [Accessed 23 July 2011].
3. Foster C, Hillsdon M & Thorogood M (2005). Interventions for promotingphysical activity. Chichester, UK: John Wiley & Sons, Ltd.
4. World Health Organization (2005). Preventing chronic disease: a vital in-
14 Whole of society approaches to preventing obesity and diabetes
311

vestment. WHO global report. Geneva: World Health Organization.5. Bauman A, Ma G, Cuevas F, Omar Z, Waqanivalu T, Phongsavan P, Keke
K & Bhushan A (2011). Cross-national comparisons of socioeconomic dif-ferences in the prevalence of leisure-time and occupational physical activity,and active commuting in six Asia-Pacific countries. Journal of Epidemiologyand Community Health, 65(1): 35–43.
6. Suhrcke M, Nugent RA, Stuckler D & Rocco L (2006). Chronic disease: aneconomic perspective. London: Oxford Health Alliance.
7. Trinh OTH, Nguyen ND, Phongsavan P, Dibley MJ & Bauman AE (2009).Prevalence and risk factors with overweight and obesity among Vietnameseadults: Caucasian and Asian cut-offs. Asia Pacific Journal of Clinical Nutri-tion, 18(2): 226–33.
8. Rose G (2001). Sick individuals and sick populations. International Journalof Epidemiology, 30(3): 427–32.
9. World Health Organization (2004). Global strategy on diet, physical activityand health. Geneva: World Health Organization.
10. McLeroy KR, Bibeau D, Steckler A & Glanz K (1988). An ecological per-spective on health promotion programs. Health Education Quarterly, 15(4):351–77.
11. Stokols D (1992). Establishing and maintaining healthy environments: to-ward a social ecology of health promotion. American Psychologist, 47(1):6–22.
12. Australian Institute of Health and Welfare (2010). Australia’s health 2010.Australia’s health series no. 12. Sydney: AIHW.
13. Haskell WL, Lee IM, Pate RR, Powell KE, Blair SN, Franklin BA, MaceraCA, Heath GW, Thompson PD & Bauman A (2007). Physical activity andpublic health: updated recommendations for adults from the American Col-lege of Sports Medicine and the American Heart Association. Medicine &Science in Sports Exercise, 39(8): 1423–34.
14. Australian Government (2010). Our cities: building a productive, sustain-able and liveable future. Discussion paper. Sydney: Infrastructure Australia.
15. Australian Bicycle Council (2010). The Australian national cycling strategy2011–2016. Sydney: Austroads.
16. Merom D, van der Ploeg HP, Corpuz G & Bauman AE (2010). Public health
A modern epidemic
312

perspectives on household travel surveys active travel between 1997 and2007. American Journal of Preventive Medicine, 39(2): 113–21.
17. Daley M, Rissel C & Lloyd B (2007). All dressed up and no-where to go?A qualitative research study of the barriers and enablers to cycling in innerSydney. Road and Transport Research, 16: 42–52.
18. City of Sydney (2011). Bike riding booms around Sydney’s new cycleways.Sydney: City of Sydney.
19. Merom D, Bauman A & Ford I (2004). The public health usefulness of theexercise recreation and sport survey (ERASS) surveillance system. Journalof Science and Medicine in Sport, 7(1): 32–37.
20. Bauman AE & Bull FC (2007). Environmental correlates of physical ac-tivity and walking in adults and children: a review of reviews. London:National Institute of Health and Clinical Excellence [Online]. Available:www.nice.org.uk [Accessed 14 June 2011].
21. Bauman A, Rissel C, Garrard J, Kerr I, Speidel R & Fishman E (2008).Cycling: getting Australia moving. Barriers, facilitators and interventions toget more Australians physically active through cycling. Melbourne: CyclingPromotion Fund.
22. Rissel C, New C, Wen LM, Merom D, Bauman AE & Garrard J (2010). Theeffectiveness of community-based cycling promotion: findings from the Cy-cling Connecting Communities project in Sydney, Australia. InternationalJournal of Behavioral Nutrition and Physical Activity, 7(1): 8.
23. Sydney Urban Parks Education and Research Group (2002). Research re-port: Sydneysiders’ use of parks and gardens, 2001. Sydney: Centre forVisitor Studies.
24. Bendimo-Rung AL, Mowen AJ & Cohen DA (2005). The significance ofparks to physical activity and public health: a conceptual model. AmericanJournal of Preventive Medicine, 28: 159–68.
25. Brownson RC, Baker EA, Housemann RA, Brennan LK & Bacak SJ (2001).Environmental and policy determinants of physical activity in the UnitedStates. American Journal of Public Health, 91(12): 1995–2003.
26. Davidson KK & Lawson C (2006). Do attributes of the physical environ-ment influence children’s level of physical activity? International Journal ofBehavioral Nutrition and Physical Activity, 3(19): 1–17.
14 Whole of society approaches to preventing obesity and diabetes
313

27. Kaczynski AT & Henderson KA (2007). Environmental correlates of phys-ical activity: a review of evidence about parks and recreation. Leisure Sci-ences, 29: 315–54.
28. Owen N, Humpel N, Leslie E, Bauman A & Sallis JF (2004). Understandingenvironmental influences on walking: review and research agenda. AmericanJournal of Preventive Medicine, 27(1): 67–76.
29. Bell JF, Wilson JS & Liu GC (2008). Neighborhood greenness and 2-yearchanges in body mass index of children and youth. American Journal of Pre-ventive Medicine, 35(6): 547–53.
30. Nielson TS & Hansen KB (2007). Do green areas affect health? Resultsfrom a Danish survey on the use of green areas and health indicators. Health& Place, 13: 839–50.
31. Durand CP, Andalib M, Dunton GF, Wolch J & Pentz MA (2011). A sys-tematic review of built environment factors related to physical activity andobesity risk: implications for smart growth urban planning. Obesity Reviews,12(5): e173–82.
32. Maller C, Townsend M, Brown P & St Leger L (2002). Healthy parkshealthy people: the health benefits of contact with nature in a part context. Areview of current literature. Melbourne: Deakin University.
33. NSW Department of Health (2002). Walk it: active local parks. The effect ofpark modification on physical activity participation. Summary report. Syd-ney: NSW Health Department.
34. Bohn-Goldbaum EE, Phongsavan P, Merom D & Bauman AE (under re-view). Does playground improvement result in increased physical activityamong children?
35. Cohen DA, Golinelli D, Williamson S, Sehgal A, Marsh T & McKenzieTL (2009). Effects of park improvements on park use and physical activity:policy and programming implications. American Journal of Preventive Med-icine, 37(6): 475–80.
36. Tester J & Baker R (2009). Making the playfields even: evaluating theimpact of an environmental intervention on park use and physical activity.Preventive Medicine, 48: 316–20.
37. Cohen DA, Marsh T, Williamson S, Pitkin Derose K, Martinez H, SetodjiC & McKenzie TL (2010). Parks and physical activity: why are some parks
A modern epidemic
314

used more than others? Preventive Medicine, 50: S9–S12.38. Turrell G, Kavanagh AM, Draper G & Subramanian SV (2007). Do places
affect the probability of death in Australia? A multilevel study of area-leveldisadvantage, individual-level socioeconomic position and all-cause mor-tality, 1998–2000. Journal of Epidemiology and Community Health, 61(1):13–19.
39. Kavanagh AM, Goller JL, King T, Jolley D, Crawford D & Turrell G(2005). Urban area disadvantage and physical activity: a multilevel studyin Melbourne, Australia. Journal of Epidemiology and Community Health,59(11): 934–40.
40. Coen SE & Ross NA (2006). Exploring the material basis for health:characteristics of parks in Montreal neighborhoods with contrasting healthoutcomes. Health & Place, 12(4): 361–71.
41. Giles-Corti B & Donovan RJ (2002). Socioeconomic status differences inrecreational physical activity levels and real and perceived access to a sup-portive physical environment. Preventive Medicine, 35(6): 601–11.
42. Moore LV, Diez Roux AV, Evenson KR, McGinn AP & Brines SJ (2008).Availability of recreational resources in minority and low socioeconomic sta-tus areas. American Journal of Preventive Medicine, 34(1): 16–22.
43. Timperio A, Ball K, Salmon J & Crawford RD (2007). Is availability of pub-lic open space equitable across areas? Health & Place, 13: 335–40.
44. McLaren L, McIntyre L & Kirkpatrick S (2010). Rose’s population strategyof prevention need not increase social inequalities in health. InternationalJournal of Epidemiology, 39(2): 372–77.
45. Centers for Disease Control and Prevention (CDC) (2010). Guide to com-munity preventive services: promoting physical activity: Environmental andpolicy approaches [Online]. Available: www.thecommunityguide.org/pa/environmental-policy/index.html [Accessed 23 July 2011].
46. Rangan A, Kwan J, Flood V, Louie J & Gill T (2011). Changes in ‘extra’food intake among Australian children between 1995 and 2007. Obesity Re-search & Clinical Practice, 5: e55–e63
47. Rangan AM, Randall D, Hector DJ, Gill TP & Webb KL (2009). Consump-tion of ‘extra’ foods by Australian children: types, quantities and contribu-tion to energy and nutrient intakes. European Journal of Clinical Nutrition,
14 Whole of society approaches to preventing obesity and diabetes
315

62(3): 356–64.48. Story M, Kaphingst KM, Robinson-O’Brien R & Glanz K (2008). Creating
healthy food and eating environments: policy and environmental approaches.Annual Review of Public Health, 29: 253–72.
49. Morland K, Wing S & Diez Roux A (2002). The contextual effect of thelocal food environment on residents’ diets: the atherosclerosis risk in com-munities study. American Journal of Public Health, 92(11): 1761–67.
50. Burns CM, Gibbon P, Boak R., Baudinette S & Dunbar JA (2004). Food costand availability in a rural setting in Australia. Rural Remote Health, 4(4):311.
51. Cummins S & Macintyre S (2002). A systematic study of an urban food-scape: the price and availability of food in greater Glasgow. Urban Studies,39(11): 2115–30.
52. Macintyre S (2007). Deprivation amplification revisited; or, is it alwaystrue that poorer places have poorer access to resources for healthy diets andphysical activity? International Journal of Behavioral Nutrition and Physi-cal Activity, 4(32).
53. Cummins S, Smith DM, Taylor M, Dawson J, Marshall D, Sparks L & An-derson AS (2009). Variations in fresh fruit and vegetable quality by storetype, urban-rural setting and neighbourhood deprivation in Scotland. PublicHealth Nutrition, 12(11): 2044–50.
54. Giskes K, Turrell G, van Lenthe FJ, Brug J & Mackenbach J P (2006). Amultilevel study of socioeconomic inequalities in food choice behaviour anddietary intake among the Dutch population: the GLOBE study. Public HealthNutrition, 9(1): 75–83.
55. Wrigely N, Warm D & Margetts B (2003). Deprivation, diet and foodretail access: findings from the Leeds ‘Food Deserts’ study. Environmentand Planning, 35: 151–88.
56. Cummins S, Petticrew M, Higgins C, Sparks L & Findlay A (2004). Reduc-ing inequalities in health and diet: the impact of a food retail development.A pilot study. London: MRC Social and Public Health Sciences Unit.
57. Boone-Heinonen J, Gordon-Larsen P, Kiefe CI, Shikany JM, Lewis CE &Popkin BM (2011). Fast food restaurants and food stores longitudinal as-sociations with diet in young to middle-aged adults: the CARDIA Study.
A modern epidemic
316

Archives of Internal Medicine, 171(13): 1162–70.58. Burns C & Inglis A (2007). Measuring food access in Melbourne: access to
healthy and fast food by car, bus and foot in Melbourne. Health & Place, 13:877–85.
59. Blewett N, Goddard N, Pettigrew S, Reynolds C & Yeatman H (2011). La-belling logic: review of food labelling law and policy [Online]. Available:www.foodlabellingreview.gov.au/internet/foodlabelling/publishing.nsf/content/labelling-logic. [Accessed 4 May2011].
60. Gorton D (2007). Nutrition labelling: update of scientific evidence on con-sumer use and understanding of nutrition labels and claims [Online]. Avail-able: www.foodsafety.govt.nz/elibrary/industry/signposting-nutrition-study-research-projects/signs-literature-review-report_final-2.pdf [Accessed 5May 2011].
61. Malam S, Cleg S, Kirwan S & McGinigal S (2009). Comprehension anduse of UK nutrition signpost labelling schemes. London UK: Food StandardsAgency.
62. Vyth EL, Steenhuis IH, Roodenburg AJ, Brug J & Seidell JC (2010). Front-of-pack nutrition label stimulates healthier product development: a quanti-tative analysis. International Journal of Behavioral Nutrition and PhysicalActivity, 7: 65.
63. National Heart Foundation of Australia (2010). Rapid review of the evi-dence: the need for nutritional labelling on menus. National Heart Founda-tion of Australia.
64. Cecchini M, Sassi F, Lauer JA, Lee YY, Guajardo-Barron V & ChisholmD (2010). Tackling unhealthy diets, physical inactivity, and obesity: healtheffects and cost-effectiveness. The Lancet, 376(9754): 1775–84.
65. Vos T, Carter R, Barendregt J, Mihalopoulos C, Veerman JL, MagnusA, Cobiac L, Bertram MY, Wallace AL & ACE-Prevention Team (2010).Assessing cost-effectiveness in prevention (ACE-Prevention): final report.Melbourne: Deakin University and Brisbane: University of Queensland.
66. World Health Organization (2010). Set of recommendations on the market-ing of foods and non-alcoholic beverages to children. Geneva: World HealthOrganization.
14 Whole of society approaches to preventing obesity and diabetes
317

67. National Preventive Health Taskforce (2009). Australia: the healthiestcountry by 2020. The report of the National Preventative Health Strategy:the roadmap for action. Canberra: Commonwealth of Australia.
68. National Preventative Health Taskforce (2010). Taking preventative action.A response to Australia: the healthiest country by 2020. The report of theNational Preventative Health Strategy: the roadmap for action. Canberra:Commonwealth of Australia.
69. Hebden LA, King L, Grunseit A, Kelly B & Chapman K (2011). Advertisingof fast food to children on Australian television: the impact of industry self-regulation. Medical Journal of Australia, 195(1): 20–24.
70. King L, Hebden L, Grunseit A, Kelly B, Chapman K & Venugopal K(2011). Industry self-regulation of television food advertising: Responsibleor responsive? International Journal of Pediatric Obesity, 6(2–2): e390–e98.
71. Hebden L, King L, Kelly B, Chapman K & Innes-Hughes C (2010). Industryself-regulation of food marketing to children: reading the fine print. HealthPromotion Journal of Australia, 21(3): 229–35.
72. Hebden L, King L, Kelly B, Chapman K & Innes-Hughes C (2010). Regu-lating the types of foods and beverages marketed to children: how useful arefood industry commitments. Nutrition & Dietetics, 67(4): 258–66.
73. Maibach EW, Abroms LC & Marosits M (2007). Communication and mar-keting as tools to cultivate the public’s health: a proposed ‘people and places’framework. BMC Public Health, 7: 88.
74. Rose G (1992). The strategy of preventive medicine. Oxford: Oxford Uni-versity Press.
75. Australian Government. Swap it, don’t stop it [Online]. Available:www.swapit.gov.au [Accessed 23 July 2011].
76. Wallack W, Dorfman L, Jernigan D & Themba M (1993). Media advocacyand public health: power for prevention. Newbury Park: Sage.
A modern epidemic
318

Treatment


15How self-perception, emotion and
beliefs influence eating and weight-related behaviour
Brooke Adam and Elizabeth RiegerThis chapter examines the psychological and environmental factors con-tributing to the self-perception of obese individuals and its impact onweight-related behaviour. Emotional functioning, environmental factors,physical health, eating and weight-related attitudes, beliefs and behaviourare explored. The impact of these factors on meaningful short- and long-term treatment outcomes is discussed.
A wealth of knowledge and research exists which attests to the pervasive and of-ten serious physical consequences of obesity. Examining the health problem ofobesity at a surface level, one might feel puzzled as to why some obese patientsexperience marked difficulty, often over an extended period of time, to make rel-atively modest behaviour change in exchange for significant improvements inphysical and psychological health and associated quality of life. Clinically, obe-sity is associated with a range of psychosocial problems such as depression, lowself-esteem, guilt, shame, body dissatisfaction, social withdrawal and isolation,stigmatisation and discrimination [1, 2, 3]. However, not all obese persons willexperience psychological problems. The obese population is heterogeneous interms of aetiology, maintaining factors, and psychological and physiological con-comitants [4, 5]. As such, over recent years the question of whether those whoare obese have psychological difficulties has shifted to who will experience psy-chological problems and in what ways [1]? This chapter will examine the mainpsychological difficulties experienced by obese individuals, some of the factorsknown to contribute to these difficulties, and how these difficulties in turn impacton weight-related behaviours and, as such, should be included as a key compo-nent of treatment.
321

THE RANGE OF PSYCHOLOGICAL PROBLEMSASSOCIATED WITH OBESITY
Psychological difficulties are already evident in obese children and adolescents,a finding which emphasises the importance of preventing and treating paediatricobesity [6]. Given that obesity is increasing in childhood and adolescence, itspsychological and social consequences (such as teasing, peer exclusion, body dis-satisfaction and poor self-esteem) are also of rising importance [7].
Clear evidence is emerging of the concerning association between obesityand the self-perception of children and adolescents. In a 2006 study [8], 2813children with a mean age of 11.3 years completed self-report measures of self-perception and body shape perception, and their body mass index (BMI) wascalculated. Results clearly indicated that obesity has a negative association withself-esteem. Specifically, obese girls and boys possessed lower perceived athleticcompetence, physical appearance and global self-worth than their normal-weightcounterparts. The association between obesity and negative self-perception wasparticularly evident in girls, with obese girls reporting significantly decreased so-cial acceptance and satisfaction with physical appearance than healthy weightpeers. Overall, it was found that obese children were two to four times morelikely than normal weight children to have low self-worth.
Given the cross-sectional nature of these data, it is unclear whether negativeself-esteem is a cause and/or consequence of obesity. However, a longitudinalstudy by Strauss (2000) [9] was able to provide stronger support for the causalrole of obesity in negatively impacting self-esteem. This study similarly foundthat female childhood obesity at nine years of age was associated with impairedself-esteem. At the four-year follow-up, obese girls experienced significant, de-creasing self-esteem, which was associated with sadness, loneliness, anxiety andrisk-taking behaviour (eg smoking and alcohol consumption).
In addition to poor self-esteem, adult obese individuals are more likely tohave a psychological disorder, with a higher prevalence of mood, anxiety, alcoholuse, personality and eating disorders among the obese [10, 11]. Of the various psy-chological disorders, binge-eating disorder (BED) has the strongest connectionwith obesity. BED is characterised by frequent episodes of binge eating in whichthe person consumes a large amount of food in a discrete period of time, coupledwith a sense of a loss of control. It is very different from an episode of overeating,in terms of the amount of food consumed and the driven, compulsive nature ofthe behaviour [1]. In BED, there is no immediate compensatory behaviour (suchas purging or excessive exercise) as seen in bulimia nervosa. BED is common inindividuals with obesity; estimates are that approximately one-third of the obesepopulation undergoing treatment for weight-loss experience binge eating sympto-matology [12]. Similarly, the prevalence of obesity among individuals with BEDmay be as high as 65% [13] which is much higher than the prevalence in the gen-
A modern epidemic
322

eral adult population [14].Yet the most consistent finding in terms of the psychological problems as-
sociated with obesity is that obese individuals experience higher levels of bodyimage disturbance than their normal-weight counterparts [15]. This may take theform of experiencing high levels of dissatisfaction with their appearance, beingexcessively preoccupied with their appearance, believing that their appearanceproves something negative about their worth as a person, avoiding many socialsituations because of their weight, and being overly concerned about hiding ordisguising their body. One of the largest studies to date that has investigated bodysatisfaction at various BMI categories was conducted by Frederick, Peplau andLever (2006) [16]. This study involved 52 677 men and women who were asked torate their level of body satisfaction on a scale ranging from ‘I have a great body’to ‘I find my body unattractive’. The results indicated that rating one’s bodyas unattractive was higher among obese male and female participants comparedwith the other BMI categories: 69% of women and 54% of men with a BMI ≥35felt unattractive compared to 5% of women and 6% of men with a BMI between18.5 and 21.7. Across most BMI categories, women reported greater body dissat-isfaction than men except in the underweight categories (due to men’s desire tobe larger). Particularly for women, a desire to lose weight is strongly associatedwith a desire to change appearance and physical shape, and in turn feel more at-tractive or experience greater body satisfaction. Women and men report that onefactor they find motivating to lose weight is to be able to have more choice in therange of clothing available to wear that they regard as more flattering and fash-ionable [17].
While not all obese individuals experience elevated body dissatisfaction, twosubgroups of obese individuals who are particularly vulnerable in this regard arepeople with BED and those seeking gastric banding [15, 16, 17]. In addition, itis important to note that factors other than seeking to improve body satisfactionmay drive the desire to achieve a thinner physique (such as the belief that weightloss will improve the individual’s relationships) and that treatment should assistindividuals to improve these other factors in addition to interventions aimed atachieving weight loss [18].
FACTORS CONTRIBUTING TO THE NEGATIVEIMPACT OF OBESITY ON SELF-PERCEPTIONS:THIN IDEAL INTERNALISATION AND STIGMA
The negative impact of obesity on self- and body-esteem has been attributed inpart to internalisation of Western society’s ‘thin ideal’ [19, 20]. The psychologi-cal and behavioural consequences of societal pressure to be thin are considerable.An increasing number of children and adolescents in Western societies report that
15 How self-perception, emotion and beliefs influence eating and weight-relatedbehaviour
323

they engage in dieting behaviour to lose or maintain weight [21]. However, diet-ing in pre-adulthood leaves individuals at greater risk of subsequent weight gaincompared to non-dieters [22]. One explanation is that dieting often precedes theonset of binge eating, and an increased risk of other eating disorder pathology,weight gain and obesity in later adulthood [23, 24].
In addition to internalisation of the thin ideal, obese individuals are known toexperience considerable stigma and discrimination which in turn is likely to havea negative influence on self-perceptions. There is a wealth of data demonstratingthe existence of a pervasive stigma towards obese individuals, with discrimina-tion documented in all domains of life including social life, parenting practices,education, employment and healthcare. Indeed, as Puhl and Brownell (2002) [25,p108] state, negative attitudes and behaviours towards obese people ‘constituteone of the last socially acceptable forms of discrimination’.
In the social domain, strongly negative attitudes regarding obese individualsare already evident in pre-school and primary school-aged children. In one study,Latner and Stunkard (2003) [26] presented ten- and 11-year-old boys and girlswith drawings of six children: a healthy child, a child using crutches, a child in awheelchair, a child with no left hand, a child with a slight facial deformity, andan obese child. The children were asked to rank the drawings in terms of the childthey liked best to worst. It was found that children ranked the healthy child as themost preferred and the obese child as the least preferred. Compared to when thesame study was conducted in 1961, the obese child was ranked as even less desir-able by the children in the 2003 study, indicating that negative attitudes towardsobese children have become stronger over time. This study highlights that obesechildren and adults are implicitly perceived as a devalued social group.
Parenting practices are another domain in which negative attitudes towardsobese individuals have been documented. For instance, in one study, parents weregiven three pictures of children (an average-weight child, an obese child and ahandicapped child) and were asked to tell a story about each picture to their ownchild [27]. There were striking differences in the rate of successful outcomes at theend of each story: the outcome was happy for the average-weight child on 45%of occasions, 80% for the handicapped child and on zero occasions for the obesechild.
In addition, research has found evidence of negative attitudes and behaviourstowards obese students in their education. For example, obese students are lesslikely to be accepted into college than average-weight students despite havingequivalent academic records and making the same number of college applications[25]. In a prospective study, women who were overweight in adolescence hadcompleted fewer years of school, were less likely to be married, had lowerhousehold incomes and had higher rates of poverty than women who had notbeen overweight in adolescence [28]. Moreover, negative attitudes and practiceshave been documented for obese people at virtually every stage of the employ-
A modern epidemic
324
ment process [29]. Overweight applicants are evaluated more negatively thanaverage-weight applicants and are less likely to be hired. Once employed, neg-ative attitudes continue, with overweight employees being perceived as lazy,sloppy, less competent, lacking in self-discipline and disagreeable. They are alsoseen as poor role models. At the termination stage, there is evidence from le-gal case documentation that obese employees have been fired due to their weighteven if they hold positions for which weight is irrelevant (eg computer analysts)and despite formal recognition for fine job performance.
In the domain of healthcare, negative attitudes towards obese patients havebeen found among doctors, nurses and medical students. In one particularly con-cerning study, 12% of nurses reported that they were reluctant to touch obesepatients while 24% stated that they found obese patients to be ‘repulsive’ [30].Being aware of negative attitudes towards them may result in obese individualsdelaying seeking medical care (eg obese women delaying getting a breast exami-nation), which obese patients have attributed to embarrassment about their weightand previous negative experiences with healthcare professionals.
THE IMPACT OF PSYCHOLOGICAL DIFFICULTIESON WEIGHT-RELATED BEHAVIOURS AND
OBESITYWhile obesity can result in negative self-perceptions, psychological problems canin turn influence weight-related behaviours and obesity. One psychological fac-tor that may result in weight gain and ultimately obesity is if the individual has alow level of motivation for weight control. A highly influential model in currentunderstandings of health-related behaviours is the stages of change model [31].According to this model, there are two main factors that contribute to an individ-ual’s level of motivation to engage in a healthy behaviour: decisional balance andself-efficacy. Decisional balance is defined as the relative balance between thepotential gains (pros) and losses (cons) of engaging in a health-related behavioursuch as reducing fat consumption and doing more physical activity. According tothe model, people are motivated to engage in these health behaviours when thepros of reducing dietary fat or increasing exercise outweigh the cons. This is pre-cisely what the research shows: for individuals with lower levels of motivationto engage in these health behaviours, the cons of reducing dietary fat (eg ‘Eat-ing less fat would mean not eating my favourite foods’) or increasing exercise(‘Trying to do more exercise would add to my timepressure’) outweigh the pros(‘Eating less fat and exercising more would help me to feel more energetic andattractive’) [32]. However, by the time people are highly motivated and are ac-tively working to reduce their fat consumption and increase their exercise levels,the pros of these behaviours outweigh the cons [32].
15 How self-perception, emotion and beliefs influence eating and weight-relatedbehaviour
325
Self-efficacy is the other main factor contributing to an individual’s motiva-tion to engage in health-related behaviours. Self-efficacy refers to the individual’slevel of confidence that she/he can successfully engage in a health behaviour,even in challenging situations where there is a high level of temptation to en-gage in an unhealthy behaviour. If the individual lacks confidence that she/he canperform the healthy behaviour, then little or no attempt will be made to do so.Self-efficacy is a strong predictor of the degree to which people engage in weight-control behaviours, such as their amount of fruit and vegetable consumption [33]as well as their success at weight management [34].
In addition to low levels of motivation to engage in weight-control behav-iours, another psychological problem that may contribute to obesity is negativeaffect. According to the affect-regulation model, individuals who are prone to ex-periencing negative emotions such as depression, anxiety, anger or stress may eatin an attempt to provide comfort or distraction from these distressing emotions. Insupport of the affect-regulation model, Stice and colleagues (2005) [35] conducteda study in which 496 adolescent girls (aged from 11 to 15 years) were followedup over four years. Girls who reported higher levels of depression and body im-age disturbance at baseline were significantly more likely to be obese four yearslater.
This finding has been replicated in adults. For example, in a study by Blocket al. [4], 1355 American men and women between the ages of 25 and 64 yearshad their BMI and stress levels across various life domains (job-related demands,relationship strains and financial stress) assessed at baseline and then followed upover nine years. Stress in certain domains (eg job-related demands and difficultypaying bills for men and women; strains in family relationships for women) pre-dicted more weight gain over the next nine years, mainly among individuals whowere already obese at baseline. In contrast, individuals who had a normal BMIat baseline lost weight or gained less weight as stress increased. This study high-lights that individuals differ in their appetitive and eating behaviour in responseto life stress. This individual variation may contribute to the inconsistent findingsin the research, with some studies finding that negative emotions predict obesity[35] while others do not [36].
Given this connection between life stress and weight gain, it is perhaps notsurprising that the stress to which obese individuals are exposed to as a result ofnegative societal attitudes and behaviours can worsen their obesity. Adams andBukowski [37] found that the victimisation (ie bullying) experienced by obese 12-to 13-year-old girls predicted a deterioration in their body image by the age of14 to 15 years which in turn predicted an increase in depression and BMI by theage of 16 to 17 years. In another longitudinal study examining mood and weightchanges over a 12-month period after controlling for baseline BMI, depressionat baseline was found to be predictive of adolescent obesity one year later [38].These results are in keeping with the association between negative affect and
A modern epidemic
326

overeating mentioned previously.Another psychological factor that may result in people becoming obese is
the presence of BED. A five-year prospective study conducted by Fairburn andcolleagues (2003) [39] compared individuals with BED and bulimia nervosa. Inthis study, 48 individuals with BED and 102 individuals with bulimia nervosawho were not in treatment for their disorder were assessed at 15-month intervalsregarding their eating disorder symptoms and general psychiatric symptoms. Atthe five-year time-point, a higher proportion of the BED group (39%) was obesecompared to the bulimic group (20%). Indeed the rates of obesity had nearly dou-bled in the BED group during the five years of the study.
IMPLICATIONS FOR TREATMENTThe effectiveness of interventions for obesity must be assessed based on a com-prehensive range of outcomes that look beyond weight loss, such as increasedmotivation, improved mood and self-esteem, and decreased social isolation. Notonly will attention to these factors improve the individual’s quality of life, butwill directly impact on weight control if these psychological issues are involvedin maintaining the individual’s obesity.
Most patients present for treatment of obesity wanting to lose 20%–30% oftheir pre-treatment body weight, which is unrealistic in the context of the modestweight loss (ie 5%–10% of pre-treatment body weight) that a significant subsetof obese patients have difficulty achieving using behavioural treatments [41]. AsCooper and Fairburn (2001) [40] point out, obese patients’ weight goals seem en-tirely reasonable in our Western society which promotes the idea that weight ishighly controllable. In the media we are bombarded with stories and images ofsignificant weight losses achieved in very short periods of time, from the televi-sion program The biggest loser through to the increasing obsession with celebritypost-baby bodies. Further, as mentioned above, the thin-ideal internalisation andsocial pressure to be slim also contributes to an expectation of achieving an unre-alistically low weight in treatment.
Behavioural weight-loss treatment (BWT) addresses eating habits and levelsof physical activity, with an emphasis on making sustainable lifestyle changeswith the aim of resulting in sustained weight loss. The results of group-basedBWL treatment are well established; this form of treatment generally resultsin weight loss between 7%–10% of initial body weight over the typical 16- to24-week treatment period [42]. However, the pattern of weight loss and mainte-nance in patients who engage in this form of treatment is remarkably consistent:the point of maximum weight loss is usually reached six months after commence-ment of treatment, then weight regain begins gradually and consistently untilweight stabilises at around baseline levels by five years for most patients [43, 44].
15 How self-perception, emotion and beliefs influence eating and weight-relatedbehaviour
327

To augment successful maintenance of weight losses, motivational enhance-ment therapy (MET) strategies may prove beneficial as there is a strong theo-retical and empirical rationale for the role of motivation in successful long-termweight control. As previously stated, individuals are motivated to change theirbehaviour when they experience alterations in decisional balance (ie when theadvantages of change are perceived to outweigh the disadvantages) and self-ef-ficacy (ie when they are confident that they can successfully change). Comparedto the weight-loss phase, the weight-maintenance phase may have particularlyadverse effects on both decisional balance and self-efficacy and hence moti-vation for weight control. Firstly, the amount of weight loss achieved duringtreatment and its impact on other domains of life (such as improved health,body satisfaction, and relationships with others) may be less than hoped for,thereby diminishing the perceived advantages of continuing to engage in stren-uous weight-control behaviours [41]. Secondly, given the consistent pattern ofweight regain, most patients will have a history of weightcontrol failures, thus un-dermining a sense of confidence or self-efficacy regarding their ability to achievelong-term success [5]. Unfortunately, the negative alterations in decisional bal-ance and self-efficacy associated with weight maintenance occur at a time whenthe patient’s self-motivation for weight control is paramount, given the reductionor cessation in external support from treating clinicians that occurs at this time.Indeed, research indicates that problems in sustaining motivation are associatedwith poorer long-term weight control for obese patients [45]. In addition, over-weight and obese patients’ levels of motivation to increase their physical activity,increase their consumption of fruit and vegetables, and decrease their dietary fatintake are predictors of their level of engagement in these weight-control behav-iours one year later [46]. Thus, both theoretical and empirical work suggests thatenhancing the motivation of obese patients to control their weight may have ben-efits for their long-term weight management.
While clinical guidelines highlight the key importance for treatment successof enhancing patients’ motivation to control their weight [47], the research basefrom clinical trials to support such recommendations is sparse. This stands inmarked contrast to the considerable research undertaken on MET in the treatmentof other health behaviours, particularly alcohol problems. In the largest of thesestudies, a four-session MET intervention resulted in substantial and sustained(over three years) reductions in drinking behaviour among patients with severedrinking problems and achieved comparable effects to interventions of longer du-ration [48]. One of the few studies to have employed MET in the treatment ofobesity found that the addition of three MET sessions to a standard BWL pro-gram resulted in significantly better treatment adherence and glucose control atpost-treatment relative to standard treatment in obese women with type 2 diabetes[49]. In another study, obese patients who received up to 15 MET sessions afterfailing to lose a significant amount of weight in a BWL program, subsequently
A modern epidemic
328

lost significantly more weight and engaged in significantly more weekly exercisethan those who did not receive the MET intervention [50]. Yet since neither ofthese studies included a follow-up assessment, the effectiveness of MET for themaintenance of weight loss remains unknown.
In a pilot study assessing the efficacy of MET for weight maintenance in obe-sity, 22 obese adults (68% of whom were classified in the extreme/severe obesityrange) participated in a 20-session behavioural weight-loss program, which in-cluded three MET sessions [51]. The patients experienced a significant reductionin weight from pre- to post-treatment (a mean weight loss of 5% of initial bodyweight) with no significant increase in weight from post-treatment to the one-year follow-up. Patients also reported significant improvements in obesity-relatedquality of life, impulsive eating tendencies, body dissatisfaction, and maladap-tive cognitions at post-treatment that were maintained at the one-year follow-up.Importantly, reported utilisation of MET strategies by patients was significantlycorrelated with the degree of weight-loss maintenance. These results suggestMET can assist obese patients in maintaining their weight losses and make sus-tained improvements in terms of quality of life, impulsive eating tendencies, bodydissatisfaction and maladaptive cognitions.
The evidence we have at hand demonstrating the significant association be-tween obesity and negative self/body-esteem already at a very young age, pointsto the need to address this in treatment explicitly. Cooper and Fairburn (2001)[41] outline promising cognitive behavioural strategies to treat obese patientswho avoid body exposure, engage in frequent body checking, or have ongoing,frequent critical thoughts about their appearance, with the overarching goal tofoster greater self-acceptance.
CONCLUSIONSIt is clear that there are a range of psychological problems associated with obe-sity, such as low self-esteem, body dissatisfaction, depression and eating disorderpathology. Although we are currently unable to identify clear and causal relation-ships between obesity and the known comorbid psychological problems outlinedin this chapter, we can be certain that the impact of these problems is broad-reaching. Longitudinal data, in addition to research examining the trajectory ofobesity and psychological comorbidities in older adults given the relatively recentonset of the obesity epidemic, will be important in uncovering more preciselythe causal relationships and longer-term impacts that exist between these prob-lems. A growing body of research points to the need to integrate motivationalenhancement therapy and self-acceptance modules into obesity treatment, in or-der to achieve maintained improvements in the physical and psychological healthof obese patients in the months and years following treatment.
15 How self-perception, emotion and beliefs influence eating and weight-relatedbehaviour
329

ACKNOWLEDGEMENTSThe authors wish to thank Sarah Horsfield for her comments on this chapter.
References1. Friedman MA & Brownell KD (2002). Psychological consequences of obe-
sity. In CG Fairburn & KD Brownell (Eds). Eating disorders and obesity:a comprehensive handbook (pp393–98). 2nd edn. New York: The GuildfordPress.
2. Friedman KE, Reichmann SK, Costanzo PR, Zelli A, Ashmore JA & Mu-sante G J (2005). Weight stigmatization and ideological beliefs: Relation topsychological functioning in obese adults. Obesity Research, 13(5): 907–16.
3. Puhl RM & Brownell KD (2003). Psychosocial origins of obesity stigma:toward changing a powerful and pervasive bias. Obesity Reviews, 4(4):213–27.
4. Block JP, He Y, Zaslavsky AM Ding L & Ayanian JZ (2009). Psychosocialstress and weight change among US adults. American Journal of Epidemiol-ogy, 170(2): 181–92.
5. DiLillo V, Siegfried NJ & Smith West D (2003). Incorporating motivationalinterviewing into behavioral obesity treatment. Cognitive and BehavioralPractice, 10: 120–30.
6. Goldfield GS & Epstein LH (2002). Management of obesity in children. InCG Fairburn & KD Brownell (Eds.). Eating disorders and obesity: a com-prehensive handbook (pp573–77). 2nd edn. New York: The Guildford Press.
7. Magarey AM, Daniels LA & Boulton JC (2001). Prevalence of overweightand obesity in Australian children and adolescents: reassessment of the 1985and 1995 data against new standard international definitions. The MedicalJournal of Australia, 174: 561–64.
8. Franklin J, Denyer G, Steinbeck KS, Caterson ID & Hill AJ (2006). Obesityand risk of low self-esteem: a statewide survey of Australian children. Pedi-atrics, 118(6): 2481–87.
9. Strauss RS (2000). Childhood obesity and self-esteem. Pediatrics,105(1):1–5.
10. Marcus MD & Wildes JE (2009). Obesity: is it a mental disorder? Interna-
A modern epidemic
330

tional Journal of Eating Disorders, 42(8): 739–53.11. Petry NM, Barry D, Pietrzak RH & Wagner JA (2008). Overweight and
obesity are associated with psychiatric disorders: results from the nationalepidemiologic study on alcohol and related conditions. Psychosomatic Med-icine, 70(3): 288–97.
12. Yanovski SZ (2002). Binge eating in obese persons. In CG Fairburn & KDBrownell (Eds). Eating disorders and obesity: a comprehensive handbook(pp403–10). 2nd edn. New York: The Guildford Press.
13. Striegel-Moore RH, Cachelin FM, Dohm F, Pike KM, Wilfley DE & Fair-burn CG (2001). Comparison of binge eating disorder and bulimia nervosain a community sample. International Journal of Eating Disorders, 29(2):157–65.
14. Cameron AJ, Welborn TA, Zimmet PZ, Dunstan DW, Owen N, Salmon J,Dalton M, Jolley D & Shaw JE (2003). Overweight and obesity in Australia:the 1999–2000 Australian diabetes, obesity and lifestyle study (AusDiab).Medical Journal of Australia, 178(9): 427–32.
15. Rosen JC (2002). Obesity and body image. In CG Fairburn & KD Brownell(Eds). Eating disorders and obesity: a comprehensive handbook(pp309–402). 2nd edn. New York: The Guildford Press.
16. Frederick DA, Peplau LA & Lever J (2006). The swimsuit issue: correlatesof body image in a sample of 52 677 heterosexual adults. Body Image, 3(4):413–19.
17. Hrabosy JI, Masheb RM, White MA, Rothschild BS, Burke-Martindale CH& Grilo CM (2006). Prospective study of body dissatisfaction and concernsin extremely obese gastric bypass patients: 6- and 12- month postoperativeoutcomes. Obesity Surgery, 16(12): 1615–621.
18. Cooper Z & Fairburn CG (2001). A new cognitive behavioral approach tothe treatment of obesity. Behaviour Research and Therapy, 39(5): 499–511.
19. Stice E & Shaw HE (1994). Adverse effects of the media portrayed thin-ideal on women and linkages to bulimic symptomatology. Journal of Socialand Clinical Psychology, 13(3): 288–308.
20. Klaczynski PA, Goold KW & Mudry JJ (2004). Culture, obesity stereotypes,self-esteem and the ‘thin ideal’: a social identity perspective. Journal ofYouth and Adolescence, 33(4): 307–17.
15 How self-perception, emotion and beliefs influence eating and weight-relatedbehaviour
331

21. Neumark-Sztainer D, Story M, Hannan PJ, Perry CL & Irving LM (2002).Weight-related concerns and behaviours among overweight and non-over-weight adolescents: implications for preventing weight-related disorders.Archives of Pediatric and Adolescent Medicine, 156(2): 171–78.
22. Field AE, Austin SB, Taylor CB, Malspeis S, Rosner B, Rockett HR, Gill-man MW & Colditz GA (2003). Relation between dieting and weight changeamong preadolescents and adolescents. Pediatrics, 112(4): 900–6.
23. Grilo, CM (2002). Binge eating disorder. In CG Fairburn & KD Brownell(Eds). Eating disorders and obesity: a comprehensive handbook (SecondEdition) (pp178–82). New York: The Guildford Press.
24. Neumark-Sztainer D, Wall M, Haines J, Story M & Eisenberg MA (2007).Why does dieting predict weight gain in adolescents? Findings from ProjectEAT-II: a 5-year longitudinal study. Journal of the American Dietetic Asso-ciation, 107(3): 448–55.
25. Puhl R & Brownell KD (2002). Stigma, discrimination and obesity. In CGFairburn & KD Brownell (Eds). Eating disorders and obesity: a comprehen-sive handbook (pp108–12). 2nd edn. New York: The Guildford Press.
26. Latner JD & Stunkard AJ (2003). Getting worse: the stigmatization of obesechildren. Obesity Research, 11(3): 452–56.
27. Adams GR, Hicken M & Salehi M (1988). Socialization of the physicalattractiveness stereotype: parental expectations and verbal behaviours. Inter-national Journal of Psychology, 23(1, 6): 137–49.
28. Gortmaker SL, Must A, Perrin JM, Sobol AM & Dietz WH (1993). Socialand economic consequences of overweight in adolescence and young adult-hood. New England Journal of Medicine, 329(14): 1008–12.
29. Roehling MV (1999). Weight-based discrimination in employment: psycho-logical and legal aspects. Personnel Psychology, 52(4): 969–1016.
30. Brown I (2006). Nurses’ attitudes towards adult patients who are obese: lit-erature review. Journal of Advanced Nursing, 53(2): 221-32.
31. DiClimente, CC & Prochaska, JO (1998). Towards a comprehensive, trans-theoretical model of change: stages of change and addictive behaviours. InWR Miller & N Heather (Eds). Treating addictive behaviours (pp3–24).New York: Plenum Press.
32. Prochaska JO, Velicer WF, Rossi JS, Goldstein MG, Marcus BH, Rakowski
A modern epidemic
332

W, Fiore C, Harlow LL, Redding CA, Rosenbloom D & Rossi SR (1994).Stages of change and decisional balance for 12 problem behaviours. HealthPsychology, 13(1): 39–46.
33. Shaikh AR, Yaroch AL, Nebeling L, Yeh MC & Resnicow K (2008). Psy-chosocial predictors of fruit and vegetable consumption in adults: a reviewof the literature. American Journal of Preventative Medicine, 34(6): 535–43.
34. Elfhag K & Rossner S (2005). Who succeeds in maintaining weight loss?A conceptual review of factors associated with weight loss maintenance andweight regain. Obesity Reviews, 6(1): 67–85.
35. Stice E, Presnell K, Shaw H & Rohde P (2005). Psychological and behav-ioural risk factors for obesity onset in adolescent girls: a prospective study.Journal of Consulting and Clinical Psychology, 73(2): 195–202.
36. Roberts RE, Seleger S, Strawbridge WJ & Kaplan GA (2003). Prospectiveassociation between obesity and depression: evidence from the AlamedaCounty Study. International Journal of Obesity, 27(4): 514–21.
37. Adams RE & Bukowski WM (2008). Peer victimization as a predictor ofdepression and body mass index in obese and non-obese adolescents. TheJournal of Child Psychology and Psychiatry, 49(8): 858–66.
38. Goodman E & Whitaker RC (2002). A prospective study of the role ofdepression in the development and persistence of adolescent obesity. Pedi-atrics, 110(3): 497–504.
39. Fairburn CG, Stice E, Cooper Z, Doll HA, Norman PA & O’Connor ME(2003). Understanding persistence in bulimia nervosa: a 5-year naturalisticstudy. Journal of Consulting and Clinical Psychology, 71(1): 103–9.
40. Jeffrey RW, Wing RR & Mayer RR (1998). Are smaller weight losses ormore achievable weight loss goals better in the long-term for obese patients?Journal of Consulting and Clinical Psychology, 66(4): 641–45.
41. Cooper Z & Fairburn CG (2001). A new cognitive behavioural approach tothe treatment of obesity. Behavior Research and Therapy, 39(5): 499–511.
42. Wilson GT & Brownell KD (2002). Behavioral treatment for obesity. In CGFairburn & KD Brownell (Eds). Eating disorders and obesity: a comprehen-sive handbook (pp524–28). 2nd edn. New York: The Guildford Press.
43. Fabricatore AN & Wadden TA. (2006). Obesity. Annual Review of ClinicalPsychology, 2(1): 357–77.
15 How self-perception, emotion and beliefs influence eating and weight-relatedbehaviour
333

44. Jeffrey RW, Drewnowski A, Epstein LH, Stunkard AJ, Wilson GT, WingRR & Hill DR (2000). Long-term maintenance of weight loss: current status.Health Psychology, 19(1): 5–16.
45. Williams GC, Grow VM, Freedman ZR, Ryan RM & Deci EL (1996).Motivational predictors of weight loss and weight maintenance. Journal ofPersonality and Social Psychology, 70(1): 115–26.
46. Robinson AH, Norman GJ, Sallis JF, Calfas KJ, Rock CL & Patrick K(2008). Validating stage of change measures for physical activity and dietarybehaviours for overweight women. International Journal of Obesity,32(7):1137–44.
47. National Health and Medical Research Council (2003). Clinical practiceguidelines for the management of overweight and obesity in adults. Can-berra: National Health and Medical Research Centre, Australia.
48. Carroll KM, Connors GJ, Cooney NL, DiClemente CC, Donovan DM, Kad-den RR, Longabaugh RL, Rounsaville BJ, Wirtz PW & Zweben A (1998).Internal validity of project MATCH treatments: discriminability and in-tegrity. Journal of Clinical and Consulting Psychology, 66(2): 290–303.
49. Smith DE, Heckemeyer CM, Kratt PP & Mason DA (1997). Motivationalinterviewing to improve adherence to a behavioural weight-control programfor older obese women with NIDDM: a pilot study. Diabetes Care, 20(1):52–4.
50. Carels R, Darby L, Cacciapaglia HM, Konrad K, Coit C, Harper J, KaplarME, Young K, Baylen CA & Versland A (2007). Using motivational in-terviewing as a supplement to obesity treatment: a stepped-care approach.Health Psychology, 26(3): 369–74.
51. Rieger E, Dean HY, Steinbeck KS, Caterson ID & Manson E (2009). Theuse of motivational enhancement studies for the maintenance of weight lossamong obese individuals: a preliminary investigation. Diabetes, Obesity andMetabolism, 11(6): 637–40.
A modern epidemic
334

16The role of physical activity in the
prevention and treatment of diabetesKlaus Gebel, Hidde P van der Ploeg, Maria Fiatarone Singh and Adrian
Bauman
This chapter is concerned with the role of physical activity and exerciseprescription as components in the prevention and treatment of diabetes.First, the evidence for the diabetes-specific health benefits of physical ac-tivity is summarised and the physiological mechanisms are pointed out.Studies of medical comorbidities of diabetes are discussed. Recommenda-tions for physical activity and exercise in the prevention and control oftype 2 diabetes are provided, and challenges in the implementation of suchstrategies are discussed.
The health benefits of regular moderate-intensity physical activity are wellknown. In particular, epidemiological evidence has shown that an active lifestyleis beneficial in the prevention and treatment of more than 20 health conditionsincluding coronary heart disease, stroke, type 2 diabetes and some cancers [1, 2,3].
Physical activity is defined as body movement produced by skeletal musclethat results in energy expenditure above resting level [2], and can be accumulatedat any time, for example during work, housework, transportation or during leisuretime. Exercise is a subset of ‘leisure time physical activity’ that is usually struc-tured, planned, repetitive, and has the purpose of providing recreation, improvingor maintaining physical fitness, or enhancing other components of health or well-being (see Figure 1). Physical fitness includes cardio-respiratory fitness, musclestrength, body composition and flexibility [4, 5]. Metabolic fitness is also increas-ingly recognised as an important component of fitness which is closely related tophysical activity levels, as well as cardiovascular and musculoskeletal fitness [6].
For the general adult population the American College of Sports Medicinerecommends to accumulate at least 30 minutes of at least moderate-intensityphysical activity on five, preferably all, days of the week, or vigorous-intensityaerobic physical activity for at least 20 minutes on three days per week [1, 3, 7].However, even though physical activity confers numerous health benefits, largeparts of the adult population are not sufficiently active [8, 9, 10, 11, 12, 13].
335

Type 2 diabetes is related to genetic, environmental and behavioural factors.Particularly, lack of physical activity and visceral obesity are considered to bemajor contributors to the global diabetes epidemic.
Figure 1. Energy expenditure in humans subdivided into sedentary be-haviour, physical activity and the various forms of exercise.
This chapter is concerned with the role of physical activity and exercise prescrip-tion as components in the prevention and treatment of diabetes [14, 15]. First, theevidence for the diabetes-specific health benefits of physical activity will be sum-marised. Recommendations for physical activity and exercise in the preventionand control of type 2 diabetes will be provided, and challenges in the implemen-tation of such strategies will be discussed.
PREVENTION OF TYPE 2 DIABETESPhysical inactivity and overweight/obesity are both risk factors for the develop-ment of type 2 diabetes. Regular physical activity improves insulin sensitivity,and reduces glucose levels [16]. The role of obesity in the development of diabetestype 2 is likely to work through adipocytes releasing adipocytokines into the cir-culation, including leptin, adipsin, resistin and interleukin-6 (IL-6) [17], some ofwhich are associated with insulin resistance [18, 19]. There are indications thatobesity plays a larger role than physical activity in the development of diabetes[20, 21, 22]. However, physical activity has been shown to be beneficial in the pre-
A modern epidemic
336

vention of type 2 diabetes independent of weight loss [16]. Besides the beneficialeffects of physical activity on the development of type 2 diabetes, it can also beeffective in prevention of the metabolic syndrome [16, 23], and during pregnancyin the prevention of gestational diabetes [24, 25], and has independent benefits inreducing cardiovascular risk [1]. The following sections summarise the evidencefrom observational and intervention studies on the role of physical activity in theprimary and secondary prevention of type 2 diabetes.
Diabetes prevention evidence: observational studiesThe evidence for primary prevention comes from observational epidemiology;these are usually from large population-based cohort studies that examinedwhether exposure to occupational, commuting and leisure-time physical activitywas related to the subsequent risk of developing type 2 diabetes.
A meta-analysis synthesised the findings from ten prospective cohort studiesfrom the US, the UK, Finland and Japan regarding the exposure to moderate-in-tensity physical activity and the risk of developing type 2 diabetes [26]. Thesestudies included 301 221 participants and 9367 incident cases of diabetes. Thepooled relative risk for diabetes in those who regularly engaged in moderatephysical activity was 0.69 (95% CI 0.58–0.83) compared with inactive par-ticipants. Similarly, the relative risk of those who walked regularly was 0.70(0.58–0.84) compared with almost no walking. The associations remained signif-icant when adjusted for BMI [26].
Likewise, a recent report summarised the results from 25 prospective cohortstudies and found a similar inverse relationship between physical activity anddiabetes incidence. This relationship applied to men and women, different agegroups and ethnicities. The reduction in relative risk for type 2 diabetes rangedfrom 15%–60% for those that were physically active compared with their moreinactive peers [16]. It also appears that several domains of physical activity (oc-cupational, commuting and leisure-time physical activity) are all inversely relatedto the risk of developing type 2 diabetes. Based on these studies, at least 30minutes per day (210 minutes per week) of at least moderate-intensity physicalactivity is sufficient to achieve a significant reduction in diabetes incidence [16].
A new area of research has developed around total ‘sitting’ time. These stud-ies have indicated that prolonged sitting time, including measures of televisionwatching, might be associated with the risk of developing type 2 diabetes, in-dependent of leisure-time physical activity [27, 28, 29]. Furthermore, breaks insitting time have been associated with improvements in waist circumference,triglycerides, and two-hour plasma glucose levels [30]. Two large cohort studieshave observed that each two-hour increment per day in watching TV, as a proxymeasure of sitting time, was associated with a 14%–20% increase in diabetes in-cidence, even after adjustment for physical activity participation [31, 32].
16 The role of physical activity in the prevention and treatment of diabetes
337

Diabetes prevention: the evidence from intervention studiesThe strongest evidence for the benefits of physical activity and exercise in theprevention of type 2 diabetes comes from community-based lifestyle interven-tion trials. To date, at least six randomised trials have examined whether lifestyleinterventions, including physical activity, reduce the risk of developing type 2 di-abetes among adults with impaired glucose tolerance. These trials are:
• Diabetes Prevention Program (DPP), US• Diabetes Prevention Study (DPS), Finland• Da Qing IGT and Diabetes Study (DQS), China• Diabetes Prevention Program (IDPP), India• Diabetes Prevention Program (JDPP), Japan• Västerbotten Intervention Program (VIP), Sweden.
All these trials demonstrated that structured lifestyle modification programs re-duced the incidence of type 2 diabetes compared to controls or usual care. Forthese programs, exercise was usually an independent predictor of improved meta-bolic control or reduced diabetes incidence, and varied modes of exercise wereusually included (see Table 1).
In the Da Qing study in China, 577 middle-aged men and women with im-paired glucose tolerance were randomised to a diet only, exercise only, diet andexercise, or control group. The unsupervised exercise prescription ranged from140 minutes per week for those over 50 years to 280 minutes per week foryounger participants. After six years, the diet, exercise, and combined diet andexercise interventions achieved 31%, 46%, and 42% reductions in the risk of de-veloping diabetes compared with the control group [33]. At 20-year follow-up, asustained preventive benefit was still observed, with the likelihood of diabetes43% lower among those allocated to the lifestyle interventions [34].
In the US Diabetes Prevention Program (DPP) 3324 overweight and obeseparticipants with impaired glucose tolerance were randomised into three groups(placebo, metformin therapy, and lifestyle). The lifestyle modification inter-vention aimed to increase physical activity to at least 150 minutes per week(primarily unsupervised brisk walking, but with availability of two sessions of su-pervised exercise per week) and reduce weight by at least 7%. After a follow-upof three years the lifestyle intervention showed a 58% reduction in the risk of de-veloping diabetes compared to the placebo group, while the metformin group hada risk reduction of only 31% [35]. At ten-year follow-up, compared to controls,the lifestyle intervention maintained a 34% lowered risk of diabetes, and the met-formin group maintained an 18% reduction [36].
The Finnish Diabetes Prevention Study (n = 522) showed similar results tothe US DPP. This lifestyle intervention comprised 210 minutes per week of ex-ercise (including three sessions per week of supervised aerobic and resistance/power training) and diet-induced weight loss of 5%–7%, resulting in a four-
A modern epidemic
338

year diabetes risk reduction of 58% (p <.001). In this study, those who failed tomeet the weight-loss goal, but accumulated four hours of weekly moderate exer-cise, had a significantly lower risk of diabetes than the control group [37]. Threeyears after the program, intervention group participants maintained many lifestylechanges and their risk for diabetes was still 36% lower than among controls [38].
Table 1. Lifestyle change goals in the intervention groups in diabetes prevention pro-grams. Adapted from Baker M et al. 2011.
* Energy expenditure ≥700 kcal/week was the primary objective, and the targetvolume (min/week) was allowed to be increased/decreased based on the inten-sity of activities performed.† 35–210 min/week for persons ≥50 years; 70–420 min/week for persons <50years.‡ 2.5 hours per day prescribed as supervised exercise in the first month. PRT =Progressive resistance training; DPP = Diabetes Prevention Program (US);DPS = Diabetes Prevention Study (Finland); DQS = Da Qing IGT and DiabetesStudy (China); IDPP = Diabetes Prevention Program (India); JDPP = DiabetesPrevention Program (Japan); VIP = Västerbotten Intervention Program (Swe-den).Ж PRT: progressive resistance training.
Table 1. Lifestyle change goals in the intervention groups in diabetes prevention pro-grams. Adapted from Baker M et al. 2011.
Study(country)
Exercise / physical activity Diet / nutrition
Duration(min/wk)
Intensity Structuredexercise
Supervisedexercise
Aerobicactivity
PRT ac-tivityЖ
Occupationalactivity
Portioncontrol
Fat Alcohol Fibre
DPP(US)
≥150* Moderate
DPS ≥210 Moderate
16 The role of physical activity in the prevention and treatment of diabetes
339

(Finland) to strenu-ous
DQS(China)
≥35–420† Light toverystrenuous
IDPP(India)
≥210 Moderate
JDPP(Japan)
210–280 Moderate
VIP(Sweden)
≥150‡ Low-Moderate
* Energy expenditure ≥700 kcal/week was the primary objective, and the target volume(min/week) was allowed to be increased/decreased based on the intensity of activitiesperformed.
† 35–210 min/week for persons ≥50 years; 70–420 min/week for persons <50 years.
‡ 2.5 hours per day prescribed as supervised exercise in the first month. PRT = Progres-sive resistance training; DPP = Diabetes Prevention Program (US); DPS = DiabetesPrevention Study (Finland); DQS = Da Qing IGT and Diabetes Study (China); IDPP =Diabetes Prevention Program (India); JDPP = Diabetes Prevention Program (Japan);VIP = Västerbotten Intervention Program (Sweden). Ж PRT: progressive resistancetraining.
The Indian Diabetes Prevention Study (n = 531) comprised a physical activitytarget of unsupervised brisk walking for at least 30 minutes each day (210 min/week). After three years the relative risk reduction for diabetes was 28.5% forthe lifestyle intervention, 26.4% for metformin, and 28.2% for the combinationof both interventions compared to the control group [39].
A non-randomised lifestyle intervention among middle-aged males in Swe-den included a substantial physical activity component. Over six years of follow-up, the lifestyle intervention achieved a 63% risk reduction for the developmentof diabetes compared with the control group [40]. A more recent Swedish studyrandomised 194 middle-aged adults with impaired glucose tolerance to lifestyleintervention or usual care, and observed metabolic indicators and insulin resis-tance improvements at 12 months, with some improvements maintained at fiveyears (VIP program) [41].
The Japanese Diabetes Prevention Program (JDPP) followed 458 men forfour years. Twenty percent of participants were randomised to an intensive inter-vention group of diet and physical activity advice, and the others were assignedto the standard intervention (control) group. The JDPP prescribed 30 to 40 min-
A modern epidemic
340

utes per day (ie 210 to 280 minutes per week) of unsupervised moderate intensityphysical activity [42]. This prescription included sport and active commuting, andreduced diabetes incidence by 68% at four-year follow-up.
Summary of diabetes prevention evidenceThe net results of these diverse trials in people at risk of diabetes show a clearsecondary prevention benefit of lifestyle interventions [43]. There appear to be in-dependent protective benefits of both weight loss and physical activity. A recentCochrane review summarised these results, and in a meta-analysis of randomisedcontrolled diabetes prevention trials, showed that exercise and diet interventionsreduced the risk of type 2 diabetes by 37% [44]. Although most lifestyle trials didnot distinguish benefits attributed to weight loss or to physical activity [45], sev-eral studies did observe effects of activity independent of weight loss, suggestingthese risk factors partly operate independently of each other [33, 39].
Limitations of these trials include self-report of physical activity participa-tion. However, in epidemiological studies where measurement error in exposureoccurs, the observed relative risk is likely to underestimate the true relative risk,so these ‘physical activity self report’ estimates are likely to underestimate thepreventive relationship between activity and diabetes incidence. Objective mea-surement would be better [46], and in epidemiological studies, fitness measuresshow a strong protective relationship to diabetes incidence [47, 48, 49].
Recommendations for diabetes preventionFor at-risk individuals, a minimum dose of at least 150 minutes per week, andpossibly substantially more, of ‘at least moderate-intensity physical activity’ isrecommended to prevent diabetes. This is in addition to recommendations for ahealthy diet and weight loss. Physical activity advice should form part of everyclinical counselling session with individuals at risk of diabetes, and a clear planshould be developed. People can accumulate physical activity in different set-tings: through active commuting, and in their leisure time through structured orunstructured exercise programs. Higher levels of physical activity, up to an hour aday of moderate-intensity activity, yield even greater reductions in the incidenceof type 2 diabetes [1, 43, 50]. Resistance training regimens, which are important indiabetes management, should also be considered, especially for older adults [3],and three of the RCTs of diabetes prevention (DPP, DPS, VIP) have specificallyincluded this exercise modality. It also appears that long uninterrupted periods ofsitting should be avoided.
As previously mentioned, obesity is an independent risk factor for diabetes.However, while a minimum of 30 minutes of physical activity per day (150 to210 minutes per week) appears to be sufficient for a significant risk reduction in
16 The role of physical activity in the prevention and treatment of diabetes
341

type 2 diabetes, this may not be sufficient for weight maintenance or weight loss[3, 51]. At least 60 to 90 minutes of moderate-intensity physical activity daily isneeded for weight maintenance in previously overweight or obese people [51, 52,53]. Therefore, engaging in more than 30 minutes of moderate-intensity physicalactivity per day would not only reduce the risk of developing diabetes directly,but for those who are overweight or obese also by influencing body weight andimproving fat distribution.
1.5 Challenges in implementationThe epidemiological evidence relates to both the primary and secondary preven-tion of diabetes. The primary prevention of diabetes involves a whole-populationapproach, which requires actions in both clinical and community settings. Thismeans that all clinical encounters need to recommend physical activity/exercise,in the same way that tobacco cessation is almost universally recommended. Un-fortunately, many primary care physicians remain reluctant to adopt this area ofpreventive counselling [54]. Advice regarding moderate intensity physical activ-ity may have better compliance rates than vigorous-intensity prescriptions [55],so that the initial goal is to ensure all sedentary and low active individuals reachat least the minimal threshold of 150 minutes of activity each week, preferablyacross five or more days. In addition, clinicians need to become advocates forphysical activity programs and facilities across the community [56], in the sameway that they rapidly adopted and disseminated an anti-smoking stance in the1980s.
The secondary prevention goal requires identification of those at risk for di-abetes, which is itself a challenge. For these individuals, more structured andevidence-based lifestyle advice is important. Patient advice should highlight theimportance of physical activity in diabetes prevention, and include referral toappropriate structured exercise programs; in addition, some increases in inci-dental lifestyle activities are recommended to increase total energy expenditure,including active transport, increasing active chores and being active in one’s localenvironment.
MANAGEMENT OF TYPE 2 DIABETESApart from its role in the prevention of type 2 diabetes, physical activity and ex-ercise have important roles in the treatment and management of diabetes [57, 58,59, 60]. This role remains largely unincorporated into mainstream clinical manage-ment of type 2 diabetes [61]. Given that exercise has an effect as potent as mostoral hypoglycaemic agents [62], this is a critical gap in clinical care.
In this section, the health benefits of physical activity and exercise for indi-
A modern epidemic
342

viduals with type 2 diabetes will be discussed. Firstly, the evidence for the healthbenefits from various physical activity and exercise interventions for individualswith type 2 diabetes will be described. Then, physical activity and exercise rec-ommendations for the care of diabetes will be outlined. Lastly, challenges in theimplementation of strategies to increase levels of physical activity participationamong those with diabetes will be discussed.
Diabetes management evidence: aerobic trainingThe majority of studies on the role of physical activity in the management of type2 diabetes have focused on the effects of aerobic training [63]. Aerobic exerciseinvolves the usage of large muscles and relies on aerobic levels of energy expen-diture (eg brisk walking, cycling, jogging, swimming). Aerobic exercise aloneis associated with clinically significant reductions in the glycosylated haemoglo-bin level [64, 65]. The physiological adaptations responsible for improvementsin glucose control through aerobic training include increased capillary density,glucose transport (GLUT4) proteins in muscle, protein kinase B content, andglycogen synthase activity, as well as a shift from low-oxidative type 2b mus-cle fibres to moderate-oxidative, more insulin-sensitive type 2a muscle fibres[63, 66], and decreased inflammatory cytokines which impair insulin signalling inskeletal muscle [67, 68].
Aerobic training improves fitness levels and insulin sensitivity, and also re-sults in redistribution of visceral adiposity [69]. Even in the absence of weightloss, vigorous activity can improve insulin sensitivity [70], decrease insulin resis-tance and reduce arterial stiffness [71]. Diabetes markers improved by exerciseinclude insulin resistance, but also HDL and lipid profiles, as well as glycosylatedhaemoglobin levels and systemic inflammation in some studies [72, 73].
A meta-analysis pooled the results of seven randomised controlled trialson the effects of structured aerobic exercise interventions on cardio-respiratoryfitness in adults with type 2 diabetes (n = 266). Participants in the exercisegroups increased their fitness (VO2max) by 11.8%, compared to 1% in controlgroups (p < 0.003). Interventions with higher intensities tended to yield largerimprovements in fitness. Moreover, exercise intensity predicted weighted meandifference in glycosylated haemoglobin better than exercise volume [62]. A re-cent large-scale randomised trial from the US (n = 4376 overweight and obeseindividuals with type 2 diabetes) also found increases in cardio-respiratory fitnessto be significantly higher in a combined physical activity and diet interventionthan in a diabetes support and education group [74].
Diabetes management evidence: resistance trainingTraditionally, aerobic training has been used as the main exercise modality to
16 The role of physical activity in the prevention and treatment of diabetes
343

manage type 2 diabetes [75]. However, in recent years resistance training has beengaining wide acceptance as an important strategy in the treatment of diabetes[63]. In resistance training muscles work against a resistive load or weight lead-ing to hypertrophy and improved muscular strength. With increasing age adultshave decreases in muscle mass, functional capacity, resting metabolic rate, andincreases in adiposity, and insulin resistance. Resistance training is associatedwith improvements in bone mineral density, muscle strength and muscle hyper-trophy and can thereby help in the prevention of osteoporosis and sarcopenia andin the maintenance of functional status [7, 76]. However, only a small numberof wellcontrolled intervention studies have examined the benefits of resistancetraining for people with type 2 diabetes [63]. The most recent meta-analysis ofresistance training by Strasser et al. [77] included 13 RCTs in which resistancetraining reduced glycosylated haemoglobin (HbA(1c)) by 0.48% (95% CI –0.76,–0.21; p = 0.0005), fat mass by 2.33 kg (95% CI –4.71, 0.04; p = 0.05) and sys-tolic blood pressure by 6.19 mmHg (95% CI –11.38, –1.00; p = 0.02). It has beenhypothesised that the improved glucose uptake is not only due to an increase inmuscle mass that is associated with resistance training, but probably also due toqualitative changes in muscles that enhance insulin signalling and thereby sensi-tivity [78]. Furthermore, progressive resistance training (PRT) has been found topositively influence insulin resistance [79, 80]. Based on this evidence, resistancetraining should be recommended in the management of type 2 diabetes and meta-bolic disorders.
The strongest evidence for the health benefits of resistance training in type2 diabetes comes from two trials that used multiple exercises at relatively highintensities and showed a decrease in glycosylated haemoglobin of 1.1%–1.2% inthe intervention group compared to no significant change in the control group [81,82]. However, even studies that used relatively low volumes and intensities of re-sistance training achieved positive effects on glucose control [79, 83, 84, 85, 86, 87].This is particularly important for individuals who are totally sedentary and are notlikely to participate in programs involving strenuous aerobic or resistance train-ing [63]. This could apply to older adults, who may find it difficult to get to, orparticipate in, structured aerobic programs.
Other health benefits of resistance training in diabetes are an improved bodycomposition, increases in total fat-free mass, reduced blood pressure [82], im-proved muscular strength [85], lipid profiles [84], bone mineral density andmetabolic rate at rest, and a preferential mobilisation of visceral and subcuta-neous adipose tissue in the abdominal region [63]. Resistance training can alsohelp in reducing the required insulin-sensitising medication dose and therebylimit side effects [82, 88], and benefits depression [89] and cognitive impairment[90], both of which are more prevalent in those with diabetes.
While there is substantial evidence for the health benefits of resistance train-ing for people with type 2 diabetes, a Canadian study showed that 88% of
A modern epidemic
344

individuals with diabetes do not carry out resistance training activities [91]. Thisshows the unrealised potential of wide-scale interventions to promote resistancetraining among people with diabetes.
Diabetes management evidence: aerobic and resistancetraining
Resistance and aerobic training have similar beneficial effects on insulin sensitiv-ity and metabolic control in type 2 diabetes [58, 64, 92]. However, some studiescompared combinations of both resistance and aerobic exercise versus only oneof the two exercise modalities. A Canadian study (n = 28) compared the effectsof a combined aerobic and resistance training program to aerobic training onlyin postmenopausal women with type 2 diabetes. There were no differences inweight loss, fitness, or blood lipids, but the combined group showed better glu-cose uptake and larger increases in muscle mass compared to the aerobic onlygroup [87]. Similarly, an American study also reported on benefits of combin-ing resistance and aerobic training on glycaemic control, fitness and lean tissuemass [65]. Another Canadian study showed that while both aerobic and resistancetraining alone were effective in reducing glycosylated haemoglobin, the combina-tion of both exercise modalities was more effective [64]. However, in this study,the combined group had twice the volume of exercise, which may have beenresponsible for the added efficacy of this treatment, as noted by the authors. Fur-thermore, an Italian study (n = 120) that combined aerobic and resistance trainingshowed more general improvements in cardiovascular risk factors than studiesthat used resistance training only as the intervention [93]. Finally, a meta-analy-sis found that the differences in the benefits of aerobic, resistance and combinedtraining for people with diabetes were small. However, combined training gener-ally showed advantages over aerobic or resistance training alone [94]. This leadsto the optimal clinical recommendation of both modalities, but either may bemore convenient or accessible for different patient groups.
Clinically, there are many patients with multiple comorbidities who cannottolerate the dose of aerobic exercise that has proven effective in RCTs. Resistancetraining improves aerobic capacity, osteoarthritis pain and disability, depression,functional status, gait and balance impairments, bone density, and insomnia, thusaddressing the spectrum of associated clinical disorders in older type 2 adultswith diabetes [95], and providing a strong rationale for its utility in this condi-tion. Notably, high intensity PRT is feasible even when robust aerobic exerciseis impossible due to frailty, balance disorders, osteoarthritis or advanced periph-eral vascular disease for example, making it particularly suitable for the typicalolder adult with type 2 diabetes. In addition, only PRT attenuates the loss of leantissue (muscle and bone) accompanying weight loss diets typically prescribed foroverweight adults with diabetes [96], thus minimising weight cycling related to
16 The role of physical activity in the prevention and treatment of diabetes
345

lowered basal metabolic rate. By contrast, aerobic exercise is not anabolic, anddoes not increase muscle mass, precluding the associated metabolic and clinicalbenefits such a shift in body composition produces [13].
Diabetes management evidence: patho-physiologicalmechanisms
A Cochrane review and a meta-analysis, both synthesising the results of 14 ran-domised controlled trials of aerobic and resistance exercise programs, found thatlevels of glycosylated haemoglobin were reduced by around 0.6% in the exercisegroups, while there were no differences between the groups in body mass index[97, 98]. Khaw et al. found that each 1% increase in glycosylated haemoglobinwith levels between 5%–6.9% was associated with a 28% increase in mortal-ity risk, independent of other risk factors, including age, blood pressure, serumcholesterol and body mass index [99]. It was suggested that much of the excessmortality risk of diabetes in men could be profiled by the biomarker of increasedglycosylated haemoglobin.
The limited impact on the body mass index in exercising groups may be dueto increases in muscle mass, that keep body mass relatively constant [97], particu-larly in trials of resistance training. It seems likely that muscle and adipose tissuedistribution plays a crucial role in glucose metabolism, rather than body mass it-self. It has been shown that an increase in lean body mass is inversely correlatedwith changes in glycosylated haemoglobin [83, 100], which might be due to in-creased storage of glucose in the skeletal muscle [76]. Muscle hypertrophy is notonly associated with an increase in insulin sensitivity, but also with an increasein resting metabolic rate, exercise tolerance and functional mobility [65]. Fur-thermore, exercise-induced reductions in abdominal subcutaneous and visceraladipose tissue distributions are related to increased insulin sensitivity, withoutchanges in overall body weight [69, 87]. Adipose tissue is associated with secre-tion of adipocytokines, which can negatively influence insulin resistance [101]. Inconclusion, exercise-induced increases in fat-free mass and reductions in adiposetissue, as well as shifts in anabolic-catabolic hormonal profile are beneficial forglucose control and other aspects of metabolic health, regardless of changes inbody weight. These relationships are demonstrated in Figure 2.
Summary of diabetes management evidenceNumerous trials have demonstrated the health benefits of physical activity andexercise in the treatment of type 2 diabetes. Physical activity is associated withimproved insulin sensitivity and glucose control independent of weight loss [97].Moreover, regular physical activity leads to a decrease in blood lipids and bloodpressure, and has independent protective benefits on coronary heart disease risk,
A modern epidemic
346

which is elevated among those with diabetes. The benefits achieved by aerobicand resistance training seem apparent shortly after starting a structured exerciseprogram. Activity needs to be regular; the frequency of exercise sessions is opti-mally at least three or more times per week to maintain metabolic benefits. This isdue to the known acute bout effect of exercise on insulin resistance, which wanesbetween 24 and 96 hours after exercise, and is responsible for a portion of thelong-term training benefits [102]. In general, both higher volumes and higher in-tensities of exercise result in greater metabolic improvements [43].
There are a few limitations in studies on physical activity in diabetes man-agement, including trials in small selected samples. Similar to studies about theprevention of diabetes, some trials used interventions of combined physical ac-tivity, nutrition and medication [74, 103]. In order to isolate the independent effectof physical activity in diabetes management interventions, one needs to compareexercise alone versus other therapeutic modalities [97]. Current trials are under-way examining the long-term efficacy of exercise and dietary interventions in thetreatment of type 2 diabetes, such as the Look AHEAD study [104, 105, 106, 107].
16 The role of physical activity in the prevention and treatment of diabetes
347

Figure 2. Schematic representation of PRT and its role in metabolic fit-ness. Legend: OA osteoarthritis; HbA1c glycosylated haemoglobin.
In summary, because of its manifold benefits, physical activity has been de-scribed as an important ‘medicine’ for the treatment of type 2 diabetes [108].Moreover, the non-pharmacological nature of physical activity and the low costof exercise programs also makes this intervention appealing [97]. Nevertheless,physical activity is still underutilised in clinical settings to manage diabetes [60,109, 110, 111].
Recommendations for diabetes managementIndividually tailored and structured physical activity programs are important inthe management of diabetes [110]. For instance, the patient’s age, aerobic fitness,
A modern epidemic
348

muscle strength, body composition, previous level of physical activity, timingand doses of insulin and oral hypoglycaemic agents, and comorbidities and dia-betic complications should be considered in exercise prescriptions for individualswith type 2 diabetes [43, 58]. In particular, co-existent osteoarthritis, cardiovas-cular disease, orthostatic hypotension, peripheral vascular disease, and peripheralneuropathy, all common in type 2 diabetes, will influence the modality and inten-sity of exercise, the need for supervision, and other specific recommendations.
To improve glycaemic control, support weight maintenance, and reduce therisk of cardiovascular disease, the American Diabetes Association (ADA) andthe Amercian College of Sports Medicine (ACSM) recommends individuals withtype 2 diabetes to engage in at least 150 minutes per week of moderate-inten-sity physical activity (40%–60% of VO2max, which equates to 50%–70% of themaximum heart rate) or at least 60 minutes per week of vigorous aerobic exercise(>60% of VO2max or >70% of maximum heart rate) [43, 112]. Engaging in mod-erate to vigorous aerobic and/or resistance training yields greater benefits in thereduction of cardiovascular risk than lower volumes of physical activity [43], andan increased volume of activity is required for weight loss [43, 51]. Dependingon the duration and intensity of physical activity the increased insulin sensitivitylasts for 24 to 72 hours after an activity session [113]. This underlines the impor-tance of regular physical activity and therefore it is recommended that individualswith type 2 diabetes should not have more than two consecutive days withoutphysical activity [43, 112].
Physical activity recommendations for adults with type 2 diabetes tradi-tionally focused on aerobic activities, such as walking [114]. However, recentevidence has highlighted the effects of resistance training in addition to aerobicactivities. Based on the substantial evidence that highlights the benefits of re-sistance and aerobic training, a combination of both exercise modalities appearsoptimal [76]. This is also stated in the recommendations for the general pop-ulation of the American College of Sports Medicine, the American DiabetesAssociation, the American Heart Association, and the US Department of Healthand Human Services that highlight the importance of incorporating resistancetraining into physical activity, especially for older adults [1, 3, 7, 112].
Pre-exercise screening should be considered for patients with type 2 dia-betes. Screening should consider retinal disease, osteoarthritis, orthostatic hy-potension, occult cardiovascular disease, peripheral vascular disease, peripheralneuropathy and diabetic foot disease, depression, cognitive impairment and gaitand balance disorders to reduce potential risks and guide the specific exercise rec-ommendations relevant to each individual.
There have been some concerns among medical practitioners about healthrisks associated with high-intensity resistance training for older adults. Particu-larly, these concerns are about acute elevation of blood pressure and an increasein risk of stroke, myocardial infarction, and retinal haemorrhage. However, there
16 The role of physical activity in the prevention and treatment of diabetes
349

is no evidence that resistance training actually increases the risk of such events[43]. In fact, chronic resistance training is associated with lower blood pressure[77, 115] and lower risk of cardiovascular events and mortality [116].
Physical activity and diabetes complicationsPeople with diabetes have at least twice the risk of incident and fatal cardiovascu-lar events compared to the general population [117, 118, 119]. Furthermore, peoplewith diabetes with low cardio-respiratory fitness have a higher risk of overallmortality than those with higher fitness levels [120]. Physical activity improvesfitness and reduces the risk of cardiovascular disease substantially, which makesan active lifestyle particularly important for people with diabetes [74].
Additionally, diabetes is associated with other medical comorbidity, includ-ing retinopathy, peripheral neuropathy, orthostatic hypotension, mobility impair-ment, osteoarthritis, peripheral vascular disease and renal disease. These canlimit exercise capacity among patients with diabetes. Therefore, it is of particularimportance for people with diabetes in the early stages to commence regular exer-cise [121]. Specific exercise regimens may be required in the presence of diabeticcomplications. For instance, patients with peripheral neuropathy may benefitfrom non-weight-bearing activities, such as resistance training, swimming or cy-cling [43]. Among patients with autonomic neuropathy or receiving betablockers,perceived exertion rather than the heart rate should be used to adjust the intensityof physical activity [109], and pre-exercise cardiac testing should be carried outbefore embarking on vigorous activity regimens in anyone with elevated cardio-vascular risk, which includes most people with type 2 diabetes [88].
There are no known adverse effects of either resistance or aerobic trainingon vision or the progression of diabetic retinopathy. However, for patients withproliferative or severe non-proliferative retinopathy, moderate physical activityis recommended as vigorous exercise could potentially trigger vitreous haemor-rhage or retinal detachment [43].
Blood glucose monitoring may be important before, during and after pro-longed exercise. Acute bouts of exercise may require adjustment of medicationson exercise days to prevent hypoglycaemia, the latter which may otherwise occurduring exercise or many hours afterwards including nocturnally. Exercise maybe timed for the post prandial peak in blood glucose; this will reduce the risk ofexercise-related hypoglycaemia as well as reduce post-prandial hyperglycaemiaand hyperinsulinemia [43, 122].
Challenges in implementationThere is substantial evidence for the health benefits of physical activity and ex-ercise in the management of type 2 diabetes. However, as reported in studies
A modern epidemic
350

from the US [123], Canada [59, 124] and Australia [110] the proportion of peoplewith type 2 diabetes meeting the minimal physical activity recommendations issignificantly lower than in the age-matched general population. An Australianpopulation study reported significant gaps in physical activity recommendationsand uptake as part of widespread diabetes management [110].
The principles of behaviour change are needed to encourage physical activityin the treatment of diabetes [59, 91, 111, 125]. Factors that facilitate or impedeaerobic or resistance training need to be identified and addressed in clinicalcounselling. For example, older adults with diabetic complications may have dif-ficulties engaging in more vigorous aerobic activities, and resistance trainingmight be a better option. A frequent barrier is program costs, or the cost of resis-tance training equipment, and the daunting prospects of activity among sedentaryindividuals [76]. Since it is difficult to provide ongoing one-on-one supervisionin resistance or aerobic training, understanding the maintenance of skills is re-quired in the transition from supervised to independent training. Some resistancetraining interventions show long-term effects on muscle strength and body com-position, but not on glycaemic control [114, 126].
CONCLUSIONPhysical activity and exercise are effective in both prevention and treatment ofdiabetes, metabolic syndrome and cardiovascular disease. Both aerobic and re-sistance training have important roles in diabetes prevention and treatment, andthe choice depends upon patient preferences, the need for supervision and theavailability of exercise facilities. Higher doses and intensities of exercise are gen-erally more effective, although there is benefit in starting at low to moderatelevels of exercise intensity and volume, in order to reduce high dropout rates andprevent overuse injuries [75]. For some patients, exercise regimens should com-mence with moderate-intensity physical activities such as brisk walking [127, 128].High volumes of exercise and incidental physical activity are required for weightloss, but activity can produce losses of the metabolically critical visceral fat com-partment without overall change in body weight, and this can be of substantialbenefit. On account of the acute bout effects, exercise frequency should be at leastthree days per week or more.
In summary, exercise is as potent as oral hypoglycaemic agents for glucosehomeostasis, does not cause weight gain like insulin and oral agents, and providesadditional benefits for fitness, functional independence, body composition, andvascular comorbidities which cannot be gained with pharmacologic or nutritionaltreatment alone. Thus, it should be seen as core to the prevention and treatmentof type 2 diabetes, rather than an optional additional management strategy.
16 The role of physical activity in the prevention and treatment of diabetes
351

References1. US Department of Health and Human Services (2008). 2008 physical ac-
tivity guidelines for Americans. Washington, DC: US Department of Healthand Human Services.
2. US Department of Health and Human Services (1996). Physical activity andhealth: a report of the surgeon general. Atlanta: Centers for Disease Controland Prevention.
3. Haskell WL, Lee IM, Pate RR, Powell KE, Blair SN, Franklin BA, MaceraCA, Heath GW, Thompson PD & Bauman A (2007). Physical activity andpublic health: updated recommendation for adults from the American Col-lege of Sports Medicine and the American Heart Association. Medicine andScience in Sports and Exercise, 39(8): 1423–34.
4. Caspersen CJ, Powell KE & Christenson GM (1985). Physical activity, ex-ercise, and physical fitness: definitions and distinctions for health-relatedresearch. Public Health Reports, 100(2): 126–31.
5. Thompson PD, Buchner D, Pina IL, Balady GJ, Williams MA, Marcus BH,Berra K, Blair S, Costa F, Franklin B, Fletcher G, Gordon N, Pate R, Ro-driguez B, Yancy A & Wenger N (2003). Exercise and physical activityin the prevention and treatment of atherosclerotic cardiovascular disease: astatement from the Council on Clinical Cardiology (Subcommittee on Exer-cise, Rehabilitation, and Prevention) and the Council on Nutrition, PhysicalActivity, and Metabolism (Subcommittee on Physical Activity). Circulation,107(24): 3109–16.
6. Hassinen M, Lakka TA, Hakola L, Savonen K, Komulainen P, Litmanen H,Kiviniemi V, Kouki R, Heikkilá H & Rauramaa R (2010). Cardiorespiratoryfitness and metabolic syndrome in older men and women: the dose responsesto exercise training (DR’s EXTRA) study. Diabetes Care, 33(7): 1655–57.
7. Nelson ME, Rejeski WJ, Blair SN, Duncan PW, Judge JO, King AC, MaceraCA & Casteneda-Sceppa C (2007). Physical activity and public health inolder adults: recommendation from the American College of Sports Medi-cine and the American Heart Association. Medicine and Science in Sportsand Exercise, 39(8): 1435–45.
8. Bauman A, Bull F, Chey T, Craig CL, Ainsworth BE, Sallis JF, Bowles
A modern epidemic
352
HR, Hagströmer M, Sjöström M, Pratt M & The IPS Group (2009). The in-ternational prevalence study on physical activity: results from 20 countries.International Journal of Behavioral Nutrition and Physical Activity, 6(1): 21.
9. Sjöström M, Oja P, Hagströmer M, Smith B & Bauman AE (2006). Health-enhancing physical activity across European Union countries: the Euro-barometer study. Journal of Public Health, 14(5): 291–300.
10. Stamatakis E, Ekelund U & Wareham NJ (2007). Temporal trends inphysical activity in England: the health survey for England 1991 to 2004.Preventive Medicine, 45(6): 416–23.
11. Troiano RP, Berrigan D, Dodd KW, Masse LC, Tilert T & McDowell M(2008). Physical activity in the United States measured by accelerometer.Medicine and Science in Sports and Exercise, 40(1): 181–88.
12. Asia-Pacific Physical Activity Network (2008). Regional physical activityprevalence in the Asia-Pacific region. Sydney: Asia-Pacific Physical Activ-ity Network.
13. Chau J, Smith BJ, Bauman A, Merom D, Eyeson-Annan M, Chey T & Far-rell L (2008). Recent trends in physical activity in New South Wales: is thetide of inactivity turning? Australian and New Zealand Journal of PublicHealth, 32(1): 82–5.
14. Zimmet P (2000). Globalization, coca-colonization and the chronic diseaseepidemic: can the doomsday scenario be averted? Journal of Internal Medi-cine, 247(3): 301–10.
15. LaMonte MJ, Blair SN & Church TS (2005). Physical activity and diabetesprevention. Journal of Applied Physiology, 99(3): 1205–13.
16. Hu G, Lakka TA & Tuomilehto J (2009). Physical activity, fitness, andthe prevention of type 2 diabetes. In IM Lee, S Blair, J Manson & RS Paf-fenbarger Jr (Eds). Epidemiologic methods in physical activity studies (pp201–24). New York: Oxford University Press.
17. Chandran M, Phillips SA, Ciaraldi T & Henry RR (2003). Adiponectin:more than just another fat cell hormone? Diabetes Care, 26(8): 2442–50.
18. Pittas AG, Joseph NA & Greenberg AS (2004). Adipocytokines and insulinresistance. Journal of Clinical Endocrinology and Metabolism, 89(2):447–52.
19. Simpson KA & Singh MA (2008). Effects of exercise on adiponectin: a sys-
16 The role of physical activity in the prevention and treatment of diabetes
353

tematic review. Obesity, 16(2): 241–56.20. Weinstein AR, Sesso HD, Min Lee I, Cook NR, Manson JE, Buring JE &
Gaziano JM (2004). Relationship of physical activity vs body mass indexwith type 2 diabetes in women. Journal of the American Medical Associa-tion, 292(10): 1188–94.
21. James SA, Jamjoum L, Raghunathan TE, Strogatz DS, Furth ED & Khaz-anie PG (1998). Physical activity and NIDDM in African-Americans: the PittCounty study. Diabetes Care, 21(4): 555–62.
22. Hu FB, Sigal RJ, Rich-Edwards JW, Colditz GA, Solomon CG, Willett WC,Speizer FE & Manson JE (1999). Walking compared with vigorous physicalactivity and risk of type 2 diabetes in women: a prospective study. Journalof the American Medical Association, 282(15): 1433–39.
23. Orchard TJ, Temprosa M, Goldberg R, Haffner S, Ratner R, Marcovina S,Fowler S & The Diabetes Prevention Program Research Group (2005). Theeffect of metformin and intensive lifestyle intervention on the metabolic syn-drome: the Diabetes Prevention Program randomized trial. Annals of InternalMedicine, 142(8): 611–19.
24. Dempsey JC, Butler CL & Williams MA (2005). No need for a pregnantpause: physical activity may reduce the occurrence of gestational diabetesmellitus and preeclampsia. Exercises and Sport Science Reviews, 33(3):141–49.
25. Hegaard HK, Pedersen BK, Nielsen BB & Damm P (2007). Leisure timephysical activity during pregnancy and impact on gestational diabetes melli-tus, pre-eclampsia, preterm delivery and birth weight: a review. Acta Obste-tricia et Gynecologica, 86(11): 1290–96.
26. Jeon CY, Lokken RP, Hu FB & van Dam RM (2007). Physical activity ofmoderate intensity and risk of type 2 diabetes. Diabetes Care, 30(3): 744–52.
27. Healy GN, Dunstan DW, Salmon J, Cerin E, Shaw JE, Zimmet PZ & OwenN (2007). Objectively measured light-intensity physical activity is indepen-dently associated with 2-h plasma glucose. Diabetes Care, 30(6): 1384–89.
28. Hamilton MT, Healy GN, Dunstan DW, Zderic TW & Owen N (2008). Toolittle exercise and too much sitting: inactivity physiology and the need fornew recommendations on sedentary behavior. Current Cardiovascular RiskReports, 2(4): 292–98.
A modern epidemic
354

29. Owen N, Bauman A & Brown W (2009). Too much sitting: a novel and im-portant predictor of chronic disease risk? British Journal of Sports Medicine,43(2): 81–83.
30. Healy GN, Dunstan DW, Salmon J, Cerin E, Shaw JE, Zimmet PZ & OwenN (2008). Breaks in sedentary time: beneficial associations with metabolicrisk. Diabetes Care, 31(4): 661–66.
31. Hu FB, Leitzmann MF, Stampfer MJ, Colditz GA, Willett WC & Rimm EB(2001). Physical activity and television watching in relation to risk for type 2diabetes mellitus in men. Archives of Internal Medicine, 161(12): 1542–48.
32. Hu FB, Li TY, Colditz GA, Willett WC & Manson JE (2003). Televisionwatching and other sedentary behaviors in relation to risk of obesity and type2 diabetes mellitus in women. Journal of the American Medical Association,289(14): 1785–91.
33. Pan XR, Li GW, Hu YH, Wang JX, Yang WY, An ZX, Hu ZX, Lin J, XiaoJZ, Cao HB, Liu PA, Jiang XG, Jiang YY, Wang JP, Zheng H, Zhang H,Bennett PH & Howard BV (1997). Effects of diet and exercise in prevent-ing NIDDM in people with impaired glucose tolerance: the Da Qing IGT andDiabetes Study. Diabetes Care, 20(4): 537–44.
34. Li G, Zhang P, Wang J, Gregg EW, Yang W, Gong Q, Li H, Jiang Y, An Y,Shuai Y, Zhang B, Zhang J, Thompson TJ, Gerzoff RB, Roqlic G, Hu Y &Bennett PH (2008). The long-term effect of lifestyle interventions to preventdiabetes in the China Da Qing Diabetes Prevention Study: a 20-year follow-up study. The Lancet, 371(9626): 1783–89.
35. Diabetes Prevention Program Research Group (2002). Reduction in the in-cidence of type 2 diabetes with lifestyle intervention or metformin. NewEngland Journal of Medicine, 346(6): 393–403.
36. Diabetes Prevention Program Research Group (2009). 10-year follow-up ofdiabetes incidence and weight loss in the Diabetes Prevention Program Out-comes Study. Lancet, 374(9702): 1677–86.
37. Tuomilehto J, Lindström J, Eriksson JG, Valle TT, Hämäläinen H, Ilanne-Parikka P, Keinänen-Kiukaanniemi S, Laakso M, Louheranta A, Rastas M,Salminen V, Aunola S, Cepaitis Z, Moltchanov V, Hakumäki M, MannelinM, Martikkala V, Sundvall J & Uusitupa M (2001). Prevention of type 2 di-abetes mellitus by changes in lifestyle among subjects with impaired glucose
16 The role of physical activity in the prevention and treatment of diabetes
355

tolerance. New England Journal of Medicine, 344(18): 1343–50.38. Lindström J, Ilanne-Parikka P, Peltonen M, Aunola S, Eriksson JG, Hemiö
K, Hämäläinen H, Härkönen P, Keinänen-Kiukaanniemi S, Laakso M,Louheranta A, Mannelin M, Paturi M, Sundvall J, Valle TT, Uusitupa M& Tuomilehto J (2006). Sustained reduction in the incidence of type 2 dia-betes by lifestyle intervention: follow-up of the Finnish Diabetes PreventionStudy. Lancet, 368(9548): 1673–79.
39. Ramachandran A, Snehalatha C, Mary S, Mukesh B, Bhaskar AD & VijayV (2006). The Indian Diabetes Prevention Programme shows that lifestylemodification and metformin prevent type 2 diabetes in Asian Indian subjectswith impaired glucose tolerance (IDPP-1). Diabetologia, 49(2): 289–97.
40. Eriksson KF & Lindgarde F (1991). Prevention of type 2 (non-insulin-de-pendent) diabetes mellitus by diet and physical exercise: the 6-year Malmofeasibility study. Diabetologia, 34(12): 891–98.
41. Lindahl B, Nilssön TK, Borch-Johnsen K, Røder ME, Söderberg S, WidmanL, Johnson O, Hallmans G & Jansson JH (2009). A randomized lifestyle in-tervention with 5-year follow-up in subjects with impaired glucose tolerance:pronounced short-term impact but long-term adherence problems. Scandina-vian Journal of Public Health, 37(4): 434–42.
42. Kosaka K, Noda M & Kuzuya T (2005). Prevention of type 2 diabetes bylifestyle intervention: a Japanese trial in IGT males. Diabetes Research andClinical Practice, 67(2): 152–62.
43. Sigal RJ, Kenny GP, Wasserman DH, Castaneda-Sceppa C & White RD(2006). Physical activity/exercise and type 2 diabetes: a consensus statementfrom the American Diabetes Association. Diabetes Care, 29(6): 1433–38.
44. Orozco LJ, Buchleitner AM, Gimenez-Perez G, Figuls MRI, Richter B &Mauricio D (2008). Exercise or exercise and diet for preventing type 2 dia-betes mellitus. Cochrane Database of Systematic Reviews, 3: CD003054.
45. Yates T, Khunti K, Bull F, Gorely T & Davies MJ (2007). The role of phys-ical activity in the management of impaired glucose tolerance: a systematicreview. Diabetologia, 50(6): 1116–26.
46. Montoye HJ, Kemper HCG, Saris WHM & Washburn RA (1996). Measur-ing physical activity and energy expenditure. Champaign: Human Kinetics.
47. Carnethon MR, Gidding SS, Nehgme R, Sidney S, Jacobs DR, Jr & Liu K
A modern epidemic
356

(2003). Cardiorespiratory fitness in young adulthood and the development ofcardiovascular disease risk factors. Journal of the American Medical Associ-ation, 290(23): 3092–100.
48. Sawada SS, Min Lee I, Naito H, Noguchi J, Tsukamoto K, Muto T, HigakiY, Tanaka H & Blair SN (2010). Long-term trends in cardiorespiratory fit-ness and the incidence of type 2 diabetes. Diabetes Care, 33(6): 1353–57.
49. Sieverdes JC, Sui X, Lee DC, Church TS, McClain A, Hand GA & Blair SN(2010). Physical activity, cardiorespiratory fitness and the incidence of type2 diabetes in a prospective study of men. British Journal of Sports Medicine,44(4): 238–44.
50. Kesaniemi YK, Danforth E, Jr, Jensen MD, Kopelman PG, Lefebvre P &Reeder BA (2001). Dose-response issues concerning physical activity andhealth: an evidence-based symposium. Medicine and Science in Sports andExercise, 33(Suppl. 6): S351–58.
51. Jakicic JM, Otto AD, Polzien K & Davis K (2009). Physical activity andweight control. In I Min Lee, S Blair, J Manson & RS Paffenbarger Jr, (Eds).Epidemiologic methods in physical activity research (pp225–45). New York:Oxford University Press.
52. Hill JO & Wyatt HR (2005). Role of physical activity in preventing andtreating obesity. Journal of Applied Physiology, 99(2): 765–70.
53. Jakicic JM, Clark K, Coleman E, Donnelly JE, Foreyt J, Melanson E, VolekJ & Volpe SL (2001). American College of Sports Medicine position stand:appropriate intervention strategies for weight loss and prevention of weightregain for adults. Medicine and Science in Sports and Exercise, 33(12):2145–56.
54. van der Ploeg HP, Smith BJ, Stubbs T, Vita P, Holford R & Bauman AE(2007). Physical activity promotion: are GPs getting the message? AustralianFamily Physician, 36(10): 871–74.
55. Duncan GE, Anton SD, Sydeman SJ, Newton RL Jr, Corsica JA, DurningPE, Ketterson TU, Martin AD, Limacher MC & Perri MG (2005). Prescrib-ing exercise at varied levels of intensity and frequency: a randomized trial.Archives of Internal Medicine, 165(20): 2362–69.
56. Bauman A, Murphy N & Lane A (2009). The role of community pro-grammes and mass events in promoting physical activity to patients. British
16 The role of physical activity in the prevention and treatment of diabetes
357

Journal of Sports Medicine, 43(1): 44–46.57. Rosenberg DE, Jabbour SA & Goldstein BJ (2005). Insulin resistance, dia-
betes and cardiovascular risk: approaches to treatment. Diabetes Obesity &Metabolism, 7(6): 642–53.
58. Praet SFE & van Loon LJC (2007). Optimizing the therapeutic benefits ofexercise in type 2 diabetes. Journal of Applied Physiology, 103(4): 1113–20.
59. Boudreau F & Godin G (2009). Understanding physical activity intentionsamong French Canadians with type 2 diabetes: an extension of Ajzen’s the-ory of planned behaviour. International Journal of Behavioral Nutrition andPhysical Activity, 6(110): 35.
60. Kirk A, Barnett J, Leese G & Mutrie N (2009). A randomized trial in-vestigating the 12-month changes in physical activity and health outcomesfollowing a physical activity consultation delivered by a person or in writtenform in type 2 diabetes: Time2Act. Diabetic Medicine, 26(3): 293–301.
61. Plotnikoff RC, Karunamuni ND, Johnson JA, Kotovych M & Svenson LW(2008). Health-related behaviours in adults with diabetes: associations withhealthcare utilization and costs. Canadian Journal of Public Health, 99(3):227–31.
62. Boule NG, Kenny GP, Haddad E, Wells GA & Sigal RJ (2003). Meta-analy-sis of the effect of structured exercise training on cardiorespiratory fitness intype 2 diabetes mellitus. Diabetologia, 46(8): 1071–81.
63. Tresierras MA & Balady GJ (2009). Resistance training in the treatmentof diabetes and obesity: mechanisms and outcomes. Journal of Cardiopul-monary Rehabilitation & Prevention, 29(2): 67–75.
64. Sigal RJ, Kenny GP, Boule NG, Wells GA, Prud’homme D, Fortier M, ReidRD, Tulloch H, Coyle D, Phillips P, Jennings A & Jaffey J (2007). Effectsof aerobic training, resistance training, or both on glycemic control in type 2diabetes: a randomized trial. Annals of Internal Medicine, 147(6): 357–69.
65. Marcus RL, Smith S, Morrell G, Addison O, Dibble LE, Wahoff-Stice D& LaStayo PC (2008). Comparison of combined aerobic and high-force ec-centric resistance exercise with aerobic exercise only for people with type 2diabetes mellitus. Physical Therapy, 88(11): 1345–54.
66. Wang Y, Simar D & Fiatarone Singh MA (2009). Adaptations to exercisetraining within skeletal muscle in adults with type 2 diabetes or impaired
A modern epidemic
358

glucose tolerance: a systematic review. Diabetes Metabolism Research andReviews, 25(1): 13–40.
67. Yang H, Youm YH, Vandanmagsar B, Ravussin A, Gimble JM, GreenwayF, Stephens JM, Mynatt RL & Dixit VD (2010). Obesity increases theproduction of proinflammatory mediators from adipose tissue T cells andcompromises TCR repertoire diversity: implications for systemic inflamma-tion and insulin resistance. Journal of Immunology, 185(3): 1836–45.
68. Olefsky JM & Glass CK (2010). Macrophages, inflammation, and insulinresistance. Annual Review of Physiology, 72: 219–46.
69. Mourier A, Gautier JF, De Kerviler E, Bigard AX, Villette JM, GarnierJP, Duvallet A, Guezennec CY & Cathelineau G (1997). Mobilization ofvisceral adipose tissue related to the improvement in insulin sensitivity in re-sponse to physical training in NIDDM. Effects of branched-chain amino acidsupplements. Diabetes Care, 20(3): 385–91.
70. Kirwan JP, Solomon TP, Wojta DM, Staten MA & Holloszy JO (2009). Ef-fects of 7 days of exercise training on insulin sensitivity and responsivenessin type 2 diabetes mellitus. American Journal of Physiology, Endocrinologyand Metabolism, 297(1): E151–56.
71. Yokoyama H, Emoto M, Fujiwara S, Motoyama K, Morioka T, Koyama H,Shoji T, Inaba M & Nishizawa Y (2004). Short-term aerobic exercise im-proves arterial stiffness in type 2 diabetes. Diabetes Research & ClinicalPractice, 65(2): 85–93.
72. Sykes K, Yeung TLV & Ko GTC (2004). A 12-week prospective random-ized controlled trial to investigate the effects of aerobic training on type 2diabetes patients. American Journal of Recreation Therapy, 3(3): 36–42.
73. Ribeiro IC, Iborra RT, Neves MQ, Lottenberg SA, Charf AM, Nunes VS,Negrão CE, Nakandakare ER, Quintão EC & Passarelli M (2008). HDLatheroprotection by aerobic exercise training in type 2 diabetes mellitus.Medicine and Science in Sports and Exercise, 40(5): 779–86.
74. Jakicic JM, Jaramillo SA, Balasubramanyam A, Bancroft B, Curtis JM,Mathews A, Pereira M, Regensteiner JG & Ribisl PM (2009). Effect of alifestyle intervention on change in cardiorespiratory fitness in adults withtype 2 diabetes: results from the Look AHEAD Study. International Journalof Obesity, 33(3): 305–16.
16 The role of physical activity in the prevention and treatment of diabetes
359
75. Praet SF, van Rooij ES, Wijtvliet A, Boonman-de Winter LJ, Enneking T,Kuipers H, Stehouwer CD & van Loon LJ (2008). Brisk walking comparedwith an individualised medical fitness programme for patients with type 2 di-abetes: a randomised controlled trial. Diabetologia, 51(5): 736–46.
76. Eves ND & Plotnikoff RC (2006). Resistance training and type 2 diabetes:considerations for implementation at the population level. Diabetes Care,29(8): 1933–41.
77. Strasser B, Siebert U & Schobersberger W (2010). Resistance training in thetreatment of the metabolic syndrome: a systematic review and meta-analysisof the effect of resistance training on metabolic clustering in patients withabnormal glucose metabolism. Sports Medicine, 40(5): 397–415.
78. Holten MK, Zacho M, Gaster M, Juel C, Wojtaszewski JF & Dela F (2004).Strength training increases insulin-mediated glucose uptake, GLUT4 con-tent, and insulin signaling in skeletal muscle in patients with type 2 diabetes.Diabetes, 53(2): 294–305.
79. Ishii T, Yamakita T, Sato T, Tanaka S & Fujii S (1998). Resistance trainingimproves insulin sensitivity in NIDDM subjects without altering maximaloxygen uptake. Diabetes Care, 21(8): 1353–55.
80. Misra A, Alappan NK, Vikram NK, Goel K, Gupta N, Mittal K & Bhatt SL(2008). Effect of supervised progressive resistance-exercise training protocolon insulin sensitivity, glycemia, lipids, and body composition in Asian Indi-ans with type 2 diabetes. Diabetes Care, 31(7): 1282–87.
81. Dunstan DW, Daly RM, Owen N, Jolley D, De Courten M, Shaw J & Zim-mett P (2002). High-intensity resistance training improves glycemic controlin older patients with type 2 diabetes. Diabetes Care, 25(10): 1729–36.
82. Castaneda C, Layne JE, Munoz-Orians L, Gordon PL, Walsmith J, FoldvariM, Roubenoff R, Tucker KL & Nelson ME (2002). A randomized controlledtrial of resistance exercise training to improve glycemic control in olderadults with type 2 diabetes. Diabetes Care, 25(12): 2335–41.
83. Eriksson J, Taimela S, Eriksson K, Parviainen S, Peltonen J & Kujala U(1997). Resistance training in the treatment of non-insulin-dependent dia-betes mellitus. International Journal of Sports Medicine, 18(4): 242–46.
84. Honkola A, Forsen T & Eriksson J (1997). Resistance training improvesthe metabolic profile in individuals with type 2 diabetes. Acta Diabetologica,
A modern epidemic
360

34(4): 245–48.85. Dunstan DW, Puddey IB, Beilin LJ, Burke V, Morton AR & Stanton KG
(1998). Effects of a shortterm circuit weight training program on glycaemiccontrol in NIDDM. Diabetes Research and Clinical Practice, 40(1): 53–61.
86. Maiorana A, O’Driscoll G, Goodman C, Taylor R & Green D (2002). Com-bined aerobic and resistance exercise improves glycemic control and fitnessin type 2 diabetes. Diabetes Research and Clinical Practice, 56(2): 115–23.
87. Cuff DJ, Meneilly GS, Martin A, Ignaszewski A, Tildesley HD & FrohlichJJ (2003). Effective exercise modality to reduce insulin resistance in womenwith type 2 diabetes. Diabetes Care, 26(11): 2977–82.
88. Kavookjian J, Elswick BM & Whetsel T (2007). Interventions for being ac-tive among individuals with diabetes: a systematic review of the literature.The Diabetes Educator, 33(6): 962–88.
89. Singh NA, Stavrinos TM, Scarbek Y, Galambos G, Liber C & FiataroneSingh MA (2005). A randomized controlled trial of high versus low intensityweight training versus general practitioner care for clinical depression inolder adults. The Journals of Gerontology. Series A, Biological Sciences andMedical Sciences, 60(6): 768–76.
90. Perrig-Chiello P, Perrig WJ, Ehrsam R, Staehelin HB & Krings F (1998).The effects of resistance training on wellbeing and memory in elderly volun-teers. Age and Ageing, 27(4): 469–75.
91. Plotnikoff RC (2006). Physical activity in the management of diabetes:population-based perspectives and strategies. Canadian Journal of Diabetes,30(1): 52–62.
92. Ivy JL (1997). Role of exercise training in the prevention and treatment ofinsulin resistance and non-insulin-dependent diabetes mellitus. Sports Medi-cine, 24(5): 321–36.
93. Balducci S, Leonetti F, Di Mario U & Fallucca F (2004). Is a long-term aer-obic plus resistance training program feasible for and effective on metabolicprofiles in type 2 diabetic patients? Diabetes Care, 27(3): 841–42.
94. Snowling NJ & Hopkins WG (2006). Effects of different modes of exercisetraining on glucose control and risk factors for complications in type 2 dia-betic patients: a meta-analysis. Diabetes Care, 29(11): 2518–27.
95. Fiatarone Singh M (2002). Exercise comes of age: rationale and recommen-
16 The role of physical activity in the prevention and treatment of diabetes
361

dations for a geriatric exercise prescription. The Journals of Gerontology.Series A, Biological Sciences and Medical Sciences, 57(5): M262–M82.
96. Daly RM, Dunstan DW, Owen N, Jolley D, Shaw JE & Zimmet PZ (2005).Does high-intensity resistance training maintain bone mass during moderateweight loss in older overweight adults with type 2 diabetes? Osteoporosis In-ternational, 16(12): 1703–12.
97. Thomas DR, Elliott EJ & Naughton GA (2006). Exercise for type 2 diabetesmellitus. Cochrane Database of Systematic Reviews, 3: CD002968.
98. Boule NG, Haddad E, Kenny GP, Wells GA & Sigal RJ (2001). Effects ofexercise on glycemic control and body mass in type 2 diabetes mellitus: ameta-analysis of controlled clinical trials. Journal of the American MedicalAssociation, 286(10): 1218–27.
99. Khaw KT, Wareham N, Luben R, Bingham S, Oakes S, Welch A & DayN (2001). Glycated haemoglobin, diabetes, and mortality in men in Norfolkcohort of European Prospective Investigation of Cancer and Nutrition (EPIC-Norfolk). British Medical Journal, 322(7277): 15–18.
100. Baldi JC, Snowling N (2003). Resistance training improves glycaemic con-trol in obese type 2 diabetic men. International Journal of Sports Medicine,24(6): 419–23.
101. Lee SH, Park SA, Ko SH, Yim HW, Ahn YB, Yoon KH, Cha BY & KwonHS (2010). Insulin resistance and inflammation may have an additional rolein the link between cystatin C and cardiovascular disease in type 2 diabetesmellitus patients. Metabolism, 59(2): 241–46.
102. Wojtaszewski JF & Richter EA (2006). Effects of acute exercise and train-ing on insulin action and sensitivity: focus on molecular mechanisms inmuscle. Essays in Biochemistry, 42: 31–46.
103. Krook A, Holm I, Pettersson S & Wallberg-Henriksson H (2003). Reductionof risk factors following lifestyle modification programme in subjects withtype 2 (non-insulin dependent) diabetes mellitus. Clinical Physiology andFunctional Imaging, 23(1): 21–30.
104. Rubin RR, Gaussoin SA, Peyrot M, DiLillo V, Miller K, Wadden TA, WestDS, Wing RR & Knowler WC (2010). Cardiovascular disease risk factors,depression symptoms and antidepressant medicine use in the Look AHEAD(Action for Health in Diabetes) clinical trial of weight loss in diabetes. Dia-
A modern epidemic
362

betologia, 53(8): 1581–89.105. Wing RR, Rosen RC, Fava JL, Bahnson J, Brancati F, Gendrano IN,
Kitabchi A, Schneider SH & Wadden TA (2010). Effects of weight loss in-tervention on erectile function in older men with type 2 diabetes in the LookAHEAD trial. Journal of Sexual Medicine, 7(1 Pt 1): 156–65.
106. Curtis JM, Horton ES, Bahnson J, Gregg EW, Jakicic JM, Regensteiner JG,Ribisl PM, Soberman JE, Stewart KJ & Espeland MA (2010). Prevalenceand predictors of abnormal cardiovascular responses to exercise testingamong individuals with type 2 diabetes: the Look AHEAD (Action forHealth in Diabetes) study. Diabetes Care, 33(4): 901–07.
107. Albu JB, Heilbronn LK, Kelley DE, Smith SR, Azuma K, Berk ES, Pi-Sunyer FX, Ravussin E & Look AHEAD Adipose Research Group (2010).Metabolic changes following a 1-year diet and exercise intervention in pa-tients with type 2 diabetes. Diabetes, 59(3): 627–33.
108. Tucker PS, Fisher-Wellman K & Bloomer RJ (2008). Can exercise mini-mize postprandial oxidative stress in patients with type 2 diabetes? CurrentDiabetes Review, 4(4): 309–19.
109. Albright A, Franz M, Hornsby G, Kriska A, Marrero D, Ullrich I & VerityLS (2000). American College of Sports Medicine position stand: exerciseand type 2 diabetes. Medicine and Science in Sports and Exercise, 32(7):1345–60.
110. Neville L & Bauman A (2004). Self-reported risk factors and managementstrategies used by people with diabetes mellitus identified from the 1997 and1998 NSW Health Surveys. NSW Public Health Bulletin, 15(4): 57–62.
111. Kirk AF, Barnett J & Mutrie N (2007). Physical activity consultation forpeople with type 2 diabetes. Evidence and guidelines. Diabetic Medicine,24(8): 809–16.
112. American College of Sports Medicine and American Diabetes Association(2010). Exercise and type 2 diabetes. American College of Sports Medicineand the American Diabetes Association: joint position statement. Medicineand Science in Sports and Exercise, 42(12): 2282–303.
113. Wallberg-Henriksson H, Rincon J & Zierath JR (1998). Exercise in the man-agement of non-insulin-dependent diabetes mellitus. Sports Medicine, 25(1):25–35.
16 The role of physical activity in the prevention and treatment of diabetes
363

114. Dunstan DW, Daly RM, Owen N, Jolley D, Vulikh E, Shaw J & ZimmetP (2005). Home-based resistance training is not sufficient to maintain im-proved glycemic control following supervised training in older individualswith type 2 diabetes. Diabetes Care, 28(1): 3–9.
115. Fagard RH & Cornelissen VA (2007). Effect of exercise on blood pressurecontrol in hypertensive patients. European Journal of Cardiovascular Pre-vention & Rehabilitation, 14(1): 12–17.
116. Tanasescu M, Leitzmann MF, Rimm EB, Willett WC, Stampfer MJ & HuFB (2002). Exercise type and intensity in relation to coronary heart diseasein men. Journal of the American Medical Association, 288(16): 1994–2000.
117. Meltzer S, Leiter L, Daneman D, Gerstein HC, Lau D, Ludwig S, Yale JF,Zinman B, Lillie D & Steering and Expert Committees (1998). 1998 clinicalpractice guidelines for the management of diabetes in Canada. Canadian Di-abetes Association. Canadian Medical Association Journal, 159(Suppl. 8):S1–29.
118. Skerrett PJ & Manson JE (2002). Reduction in risk of coronary heart diseaseand diabetes. In N Ruderman, JT Devlin, SH Schneider & A Kriska (Eds).Handbook of exercise in diabetes (pp 155–81). Alexandria, VA: AmericanDiabetes Association.
119. Buse JB, Ginsberg HN, Bakris GL, Clark NG, Costa F, Eckel R, FonsecaV, Gerstein HC, Grundy S, Nesto RW, Pignone MP, Plutzky J, Porte D,Redberg R, Stitzel KF, Stone NJ, American Heart Association & AmericanDiabetes Association (2007). Primary prevention of cardiovascular diseasesin people with diabetes mellitus: a scientific statement from the AmericanHeart Association and the American Diabetes Association. Diabetes Care,30(1): 162–72.
120. Church TS, Cheng YJ, Earnest CP, Barlow CE, Gibbons LW, Priest EL &Blair SN (2004). Exercise capacity and body composition as predictors ofmortality among men with diabetes. Diabetes Care, 27(1): 83–88.
121. Constantini N, Harman-Boehm I & Dubnov G (2005). Exercise prescriptionfor diabetics: more than a general recommendation. Harefuah, 144(10):717–23, 50.
122. Hayes C & Kriska A (2008). Role of physical activity in diabetes manage-ment and prevention. Journal of the American Dietetic Association, 108(4):
A modern epidemic
364

S19–S23.123. Nelson KM, Reiber G & Boyko EJ (2002). Diet and exercise among adults
with type 2 diabetes: findings from the third national health and nutrition ex-amination survey (NHANES III). Diabetes Care, 25(10): 1722–28.
124. Plotnikoff RC, Taylor LM, Wilson PM, Courneya KS, Sigal RJ, Birkett N,Raine K & Svenson LW (2006). Factors associated with physical activity inCanadian adults with diabetes. Medicine and Science in Sports and Exercise,38(8): 1526–34.
125. Plotnikoff R, Lippke S, Courneya K, Birkett N & Sigal R (2008). Physicalactivity and social cognitive theory: a test in a population sample of adultswith type 1 or type 2 diabetes. Applied Psychology: An International Review,57(4): 628–43.
126. Plotnikoff RC, Eves N, Jung M, Sigal RJ, Padwal R & Karunamuni N(2010). Multicomponent, home-based resistance training for obese adultswith type 2 diabetes: a randomized controlled trial. International Journal ofObesity, 34(12): 1733–41.
127. Eyler AA, Brownson RC, Bacak SJ & Housemann RA (2003). The epidemi-ology of walking for physical activity in the United States. Medicine andScience in Sports and Exercise, 35(9): 1529–36.
128. Li F, Fisher KJ, Brownson RC & Bosworth M (2005). Multilevel modellingof built environment characteristics related to neighbourhood walking activ-ity in older adults. Journal of Epidemiology and Community Health, 59(7):558–64.
16 The role of physical activity in the prevention and treatment of diabetes
365
17Nutrition therapy in the treatment of
diabetesJennie Brand-Miller1,2 and Geoffrey Ambler3,4
The optimal nutrition therapy for diabetes, like that of obesity, remains con-troversial because of the lack of high quality studies. There is increasingevidence that the conventional low-fat, high-carbohydrate diet is not ideal.Recent randomised controlled trials suggest that alternative dietary strate-gies with moderately lower carbohydrate content, including those witha lower glycaemic index, or higher fat (Mediterranean-style) or higherprotein content are equally or more effective for managing diabetes. Obser-vational studies suggest that such dietary approaches will also reduce therisk of complications. In Australia, consideration of both quantity and typeof carbohydrate (carbohydrate counting, glycaemic index and glycaemicload) is an established part of diabetes management.
There is universal support for dietary therapy as an integral part of the treatmentof both type 1 and type 2 diabetes. Although there are aspects of managementunique to type 1 diabetes, much is similar because both types share the needto manage hyperglycaemia and hypoglycaemia on a day-to-day basis and tomanage weight effectively. They both give rise to similar microvascular andmacrovascular complications through common mechanisms arising from subop-timal glycaemic and metabolic control.
There is controversy surrounding the optimal diet or dietary pattern for di-abetes because of lack of high quality studies. Current dietary recommendationsare largely based on historical consensus and include limiting total fat, saturatedfat and trans fatty acids, choosing high fibre and wholegrain foods, and monitor-ing and regulating carbohydrate intake to assist with glycaemic control. Moderate
1 School of Molecular Bioscience, University of Sydney.2 Boden Institute of Obesity, Nutrition, Exercise and Eating Disorders, University of
Sydney.3 Institute of Endocrinology and Diabetes, Children’s Hospital at Westmead.
4 Discipline of Paedriatrics, University of Sydney.
366

weight loss achieved through energy restriction and regular physical activitymarkedly improves glycaemia and cardiovascular risk factors in those who areoverweight [1]. Unfortunately, on their own, these recommendations have beenlargely unsuccessful in practice in achieving good blood glucose control or main-tenance of weight loss over the long term. For this reason, studies employing al-ternate strategies (eg high protein, low carbohydrate, vegetarian, Mediterranean-style, low glycaemic index/glycaemic load) have been explored.
THE RATIONALEWhile there is now unequivocal evidence that dietary advice in conjunction withexercise can prevent or delay the development of type 2 diabetes in at-risk in-dividuals (ie those with prediabetes) [2, 3], the role and type of dietary advicefollowing the diagnosis is much less clear. In this chapter, we argue that theoptimal diet composition for managing diabetes is not one judged simply byimprovements in glycaemic control. Rather we contend that diets for diabetesshould have proven efficacy in all of the following parameters:
• Optimising glucose metabolism (improving HbA1c, reducing postprandialglycaemia, reducing frequency and risk of hypoglycaemia, reducing glucosevariability)
• Achieving appropriate weight loss in overweight or obese individuals orhealthy weight maintenance in those not overweight
• Maintaining weight targets over the long term (years)• In children and adolescents who are growing, providing appropriate energy in-
take and nutrients for optimal growth and development, while preventing ortreating excessive weight gain
• Improving insulin sensitivity, even in the absence of weight loss• Improving markers of the metabolic syndrome• Improving markers of inflammation• Reducing the future risk of cardiovascular disease and other complications
linked to diabetes• Being enjoyable and sustainable over the long term• Maintaining healthy attitudes to food and avoiding eating disorders• Being compatible with sustainable agricultural practices.
On this basis, there is evidence that some diets fare better than others. In theremainder of this review, we describe the best evidence available for differentdietary approaches. We use randomised controlled trials in individuals with di-abetes as our gold standard, and where not available, long-term prospectiveobservational studies in large cohorts. Not all studies have been undertaken inindividuals with diabetes, but the findings in overweight and obese individuals
17 Nutrition therapy in the treatment of diabetes
367

can be assumed to be indicative. It is also important to recognise that large-scale,long-term quality dietary composition studies are difficult to achieve in diabetesand obesity because of cost, patient-adherence factors, confounding concomitanttherapies and other practical issues.
IMPROVING HBA1C AND GLUCOSEMETABOLISM
A 2007 Cochrane systematic review [4] concluded that there were no high qualitydietary studies that demonstrated the efficacy of any form of dietary treatmentin type 2 diabetes. Indeed, in their view, there was no good evidence that dietalone (usually low-fat, high-carbohydrate advice) improved glycated haemoglo-bin, a long-term measure of blood glucose control, at one year. They found thatvery low-calorie diets were associated with a rise in glycated haemoglobin at12 months. In contrast, adoption of exercise (± diet) was highly effective, re-ducing glycated haemoglobin by a significant 1%. That review considered therewas insufficient data to compare one form of dietary advice with another, al-though their criteria excluded studies shorter than six months. In a more recentCochrane review [5], Thomas and Elliott identified 11 high quality studies oflow glycaemic index (GI) or low glycaemic load (GL) diets lasting one to 12months. They concluded that on average, glycated haemoglobin decreased by0.5% and hypoglycaemic episodes declined more on the low GI/GL diets com-pared to the conventional low-fat advice. Since then, Jenkins et al. have publishedthe largest study to date, showing that a low GI diet was more effective at improv-ing glycated haemoglobin than a high cereal fibre diet in 210 individuals withtype 2 diabetes. While some small-scale studies [6, 7] suggest that high-protein,low-carbohydrate diets are more effective than other diets in improving glucosemetabolism, there is a lack of high quality data. In a two-year trial, Shai foundthat changes in fasting glucose and insulin levels were more favourable amongthe diabetic participants assigned to the Mediterranean diet than those assigned tothe low fat.
In addition to long-term goals, the optimisation of day-to-day blood glucoselevels is also an important consideration, particularly the control of postprandialhyperglycaemia and avoidance of hypoglycaemia. Type 2 diabetes subjects (andtype 1 subjects, discussed later) treated with insulin or other hypoglycaemicagents are at risk of hypoglycaemia which poses significant health and socialrisks, and these risks need to be minimised. There is also some evidence from ob-servational data for adverse effects of blood glucose fluctuations (independent ofoverall glycaemic control) on diabetes complications [8]. For these reasons, mon-itoring and regulating the amount and type of carbohydrate on a daily basis (orcarbohydrate counting) is recommended in diabetes management [9]. Such ap-
A modern epidemic
368

proaches have been more intensively applied to type 1 diabetes and are discussedbelow, but are also widely used in type 2 diabetes.
REDUCE WEIGHTIn adults with type 2 diabetes, weight loss and weight-loss maintenance are es-sential components of management yet only in the last decade have diets ofdifferent composition been given the degree of scientific study and scrutiny theydeserve. Ideally, the management goal would be normalisation and maintenanceof weight, BMI and abdominal circumference to within the normal healthy range;however it is recognised that this is currently a rarely achievable goal and there-fore modest weight loss of 5% to 10% is an initial target [10]. In overweightchildren and adolescents who are still growing, weight maintenance is usually theinitial goal, which translates into improved BMI as they grow, although modestweight loss that still allows normal linear growth is desirable in the obese [11].Prevention of progression to overweight or obesity is also a primary goal at allages in type 2 and type 1 diabetes.
Several meta-analyses and reviews have concluded that low-carbohydrate,high-protein diets [12, 13, 14, 15] and low GI or low glycaemic load diets [5, 16, 17]may be more successful for weight loss than traditional low-fat, high-carbohy-drate diets. Similar benefits have recently been suggested for Mediterranean-stylediets [18, 19]. Indeed, in our view, a conventional low-fat, high-carbohydrate dietappears to be one of the slowest ways to lose weight. However, one high-qual-ity, long-term study found no difference in weight-loss outcomes between highvs low protein, high vs low fat, or high carbohydrate vs low carbohydrate dietsat two years [16]. Only ~15% of subjects maintained a weight loss of 10% at thetwo-year mark. Notably, carbohydrate quality (high vs low GI) was not a vari-able.
MAINTAIN WEIGHT LOSS OVER THE LONGERTERM
The ability of different diets to maintain weight loss is arguably the most im-portant attribute of a diet but there is little research to date to guide recommen-dations. Some evidence suggests that alternative dietary approaches may alsobe more successful for maintenance of the achieved weight loss than low-fat,high-carbohydrate diets [10, 11, 12, 13, 14]. In the Diogenes Study [17], ~800overweight and obese individuals were randomised to one of five ad libitum dietsafter 8% of body weight loss had been achieved by means of a very low-en-ergy diet. Two levels of protein and two levels of GI were studied. After six
17 Nutrition therapy in the treatment of diabetes
369

months, the high-protein and low GI diets were shown to be equally successful,but the combination of both high protein and low GI, produced the greatest ab-solute weight-loss maintenance and the lowest study drop-out rate. Importantly,this large well-designed study found that the conventional low-fat diet with aver-age protein and GI was associated with the fastest rate of weight re-gain.
IMPROVING INSULIN SENSITIVITYImproving insulin sensitivity is arguably the defining attribute of a good diet be-cause insulin resistance is a fundamental contributor to the pathogenesis of type2 diabetes. Indeed, insulin resistance combined with a defect in pancreatic in-sulin secretion, cause a relative insulin deficiency that occurs in most people withtype 2 diabetes. The modifiable factors that worsen insulin resistance are exces-sive body weight, physical inactivity and smoking. Increasing muscle mass andlowering abdominal fat both markedly improve insulin sensitivity. Hence a com-bination of weight loss and physical activity, particularly resistance exercise, isthe ideal lifestyle intervention to reduce the risk of type 2 diabetes.
However, diet composition has been shown to have a separate additionaleffect on insulin sensitivity. Observational studies and intervention trials haveshown the macronutrient distribution (ie the ratio of fat:carbohydrate:proteinenergy) and the quality of individual macronutrients directly influence insulinsensitivity.
The effect of dietary fat and carbohydrate on insulin sensitivity have beendebated for decades. Some of the controversy stems from divergent findings inanimals versus humans, and in differing study designs. Insulin resistance can beinduced in animal models by diets high in fat, sucrose or fructose. However, asingle bout of exercise or high starch meal can completely reverse the defect. Inhumans, some studies suggest that a high intake of fat is associated with impairedinsulin sensitivity but this may be modified by the type of fat and by the typeof subject. Several studies indicate that a high-saturated-fat diet may be espe-cially deleterious in physically inactive, sedentary individuals, while short (threeto four weeks), studies in lean, healthy subjects have shown no effects on in-sulin sensitivity [18]. The KANWU study included 162 healthy subjects whoreceived isoenergetic diets for three months containing either a high proportionof saturated fatty acids (SAFA) or mono-unsaturated (MUFA) acids [19]. Withineach group there was a second assignment to fish oil supplements or placebo.Insulin sensitivity was significantly impaired by the SAFA diet (–10%) but didnot change on the MUFA diet. However, the beneficial effects of MUFA werenot seen when total fat intake exceeded 37%E (the median level of participants).Addition of n-3 fatty acids did not influence insulin sensitivity, and neither dietaltered insulin secretion. Taken together, these and other findings suggest that at
A modern epidemic
370

fat intake close to average in industrialised nations (ie ~35% E), it is preferable tomaintain the higher fat intake but to reduce relative saturated fat intake and thusincrease the proportion of MUFA or PUFA fatty acids, rather than increase thepercentage energy derived from carbohydrate.
The quantity and quality of carbohydrate can also influence insulin sen-sitivity. In a cross-sectional analysis of ~3000 individuals in the FraminghamOffspring Study, wholegrains, total fibre from all sources, as well as fibre fromcereals and fruit, were inversely related to insulin resistance [20], but there wasno relationship with total carbohydrate intake. Dietary glycaemic index (GI) andglycaemic load (GL) were also directly related to insulin resistance with approx-imately 10% more insulin resistance in the highest quintile of GI than in thelowest.
Some high-carbohydrate diets appear to have beneficial effects on insulinsensitivity. In healthy, young persons, isoenergetic substitution of high fibre car-bohydrate foods for saturated fatty acids improves insulin sensitivity within fourweeks [21]. Indeed, carbohydrates consumed without fibre may produce detri-mental effects [22]. In individuals with diabetes, higher-carbohydrate intake hasthe potential to raise postprandial glucose and increase insulin demand, an effectthat might worsen insulin resistance. Low GI diets, however, in which the carbo-hydrates are more slowly digested and absorbed, resulting in lower postprandialglycaemia, have improved insulin sensitivity in some studies. Insulin sensitivitywas 45% higher as judged by euglycaemic clamp procedure in type 2 diabetespatients who ate a low GI diet for four weeks compared with a macronutrient-matched high GI diet [23]. The alpha-glucosidase inhibitor, ecarbose, which slowscarbohydrate digestion but is not absorbed into the systemic circulation, also pro-duces improvements in insulin sensitivity [24]. Low GI diets also improve insulinsensitivity in overweight women with polycystic ovarian syndrome [25].
The evidence for wholegrains vs refined grains to improve insulin sensitivityis inconsistent. A well-designed but small intervention study, compared six toten servings of breakfast cereal, bread, rice, pasta, muffins, cookies and snacksfrom either whole or refined grains (in both cases mostly ground to flour) in aconventional high-carbohydrate, low-fat diet. Using the glucose clamp, insulinsensitivity was higher after six weeks on the wholegrain diet compared with asimilar period on the refined grain diet [26]. Unfortunately, this finding was notconfirmed in the larger WHOLEheart Study in which 60 g to 120 g per daywholegrain foods were ingested for up to 16 weeks by overweight individuals[27].
The effect of fructose and sucrose on insulin sensitivity also remains con-troversial. Studies in animals, often fed extremely high intakes (eg 70% of totalcalories), have shown a detrimental effect of fructose and sucrose compared withstarch or glucose [28]. When fructose and glucose were compared directly, fruc-tose was found to be the culpable moiety.
17 Nutrition therapy in the treatment of diabetes
371

The evidence in humans, however, suggests that fructose and sucrose in real-istic amounts have beneficial effects on insulin sensitivity. In lean, young healthymales, a diet containing 25% sucrose produced higher insulin sensitivity as as-sessed in a two-step clamp procedure than a diet containing 1% sucrose [29].Similarly, a study in patients with type 2 diabetes showed that a diet with 10%fructose produced a 34% improvement in insulin sensitivity measured by the glu-cose clamp [30]. In this study, patients lived in a hospital environment and all foodwas provided. Finally, using the glucose clamp, no effects on insulin sensitivitywere noted after three months of a 13% fructose vs sucrose diet in type 2 diabetes[31]. It is conceivable, however, that at very high intakes (>30% E), sucrose andfructose have adverse effects.
IMPROVING MARKERS OF THE METABOLICSYNDROME
The best evidence that dietary changes can improve the metabolic syndromecomes from landmark studies in which intensive lifestyle interventions preventedor delayed progression from impaired glucose tolerance to type 2 diabetes mel-litus [2, 3, 36]. Both studies employed low-fat, high-carbohydrate diets (30% ofenergy from fat, 10% from saturated fat) in combination with physical activityto achieve the goal of weight loss. Mistakenly, these findings have since beenperceived as a rational basis for recommending low-fat, high-carbohydrate diets.Unfortunately, weight loss per se likely played the most important role, such thatthe superiority of low-fat diets for people with diabetes and the metabolic syn-drome is questionable.
In intervention trials, increased carbohydrate intake is well known to increaseserum triglycerides and lower HDL, two markers of the metabolic syndrome [32].Indeed, the similarity implies that high carbohydrate diets of a certain nature playan etiological role in the metabolic syndrome. Several meta-analyses and reviewshave concluded that low-carbohydrate, high-protein diets [12], low-GI or low-GLdiets [5, 33, 34] and Mediterranean-style diets [35] may be more effective (or justas effective) for improving markers of the metabolic syndrome as traditional low-fat, high-carbohydrate diets. This higher effectiveness holds true over both theshorter and the longer term.
IMPROVING INFLAMMATORY MARKERSChronic low-grade inflammation plays a recognised role in the development andthe progression of both type 2 diabetes and vascular disease [36]. Inflamma-tion is also the likely intermediary between aspects of carbohydrate nutrition
A modern epidemic
372

and chronic disease. A single glucose challenge has been shown to increase theproduction of reactive oxygen molecules with mitochondria and activation ofpro-inflammatory transcription factors, such as nuclear factor-kappaB (NF-kB).In individuals with impaired glucose tolerance, obese or persons with type 2 di-abetes, the result is pronounced and lasts longer (>2–3 h) than in non-diabeticpersons [37]. Indeed, in individuals with type 2 diabetes, glucose fluctuations dur-ing postprandial periods have a more specific triggering effect on oxidative stressthan chronic sustained hyperglycaemia [38]. High GI/GL diets that are associatedwith greater postprandial glucose excursions may therefore promote low-gradeinflammation.
In short-term metabolic ward studies in healthy individuals, the consumptionof high GI foods has been directly linked to the creation of oxidative stress, asjudged by higher activation of NF-kB and increased generation of nitrotyrosine.The presence of oxidative stress can also be detected by an acute decline in an-tioxidant concentrations in plasma following a meal. Botero et al. [39] observeddifferences in fasting and postprandial total antioxidant capacity over the courseof a five-hour observation period following one week on a low or high GI dietin overweight men. Plasma total antioxidant capacity in response to diet maytherefore be the first metabolic adaptation linking carbohydrate nutrition to type2 diabetes.
REDUCING FUTURE RISK OF MICROVASCULARAND MACROVASCULAR COMPLICATIONS
There are no intervention studies examining the risk of diabetes complicationsfor diets of differing composition. In their absence, large, long-term prospectiveobservational studies in healthy individuals can be regarded as indicative. Inmeta-analyses, replacing saturated fat with polyunsaturated fat is associated witha 26% reduction in risk of cardiovascular disease [40]. In contrast, replacingsaturated fat with carbohydrate is linked to a non-significant increase in risk. Car-bohydrate intake (whether high or low) is not usually an independent predictorof the development of type 2 diabetes mellitus. In meta-analyses, however, qual-ity of carbohydrate intake as assessed as the GI, GL and dietary fibre shows aconsistent positive relationship to the risk of type 2 diabetes mellitus and car-diovascular disease (CVD), despite non-significant findings in some individualprospective studies [41]. The highest relative risks (>2) are observed among thosewith both a higher dietary GI or GL and lower (cereal) fibre intake. Recently,some prospective cohort studies have demonstrated that higher intake of high GIcarbohydrates, but not low GI carbohydrates, is associated with greater risk ofdeveloping CVD [42]. Similarly, there is increased risk of type 2 diabetes mellitusand overweight associated with dietary patterns that are characterised by higher
17 Nutrition therapy in the treatment of diabetes
373

intakes of refined grains or white bread, ready-to-eat breakfast cereals, sugar-sweetened beverages, potatoes or French fries, sweets or sweet bakery products[43]. In contrast, a protective pattern commonly included carbohydrate choicessuch as fruits, vegetables, legumes, wholemeal or wholegrain bread and high-fi-bre breakfast cereals.
The dietary approaches that reduce the risk of developing type 2 diabetes,obesity or CVD are likely to be the same as those that reduce the risk of com-plications in individuals with diabetes. Interestingly, the apparently protectivediets share a unifying mechanism of reducing postprandial glycaemia and in-sulinaemia, despite variable macronutrient distribution. Thus it is possible butremains unproven at present whether any diet that facilitates a reduction in post-prandial glycaemia without worsening dyslipidemia, is likely to improve insulinsensitivity and relieve the burden on the beta cell, thereby reducing the risk ofcomplications. The least effective diet will be one that increases postprandial gly-caemia and places extra demands on beta-cell function. These adverse effects willbe most detrimental for individuals with severe insulin resistance, that is, manyindividuals with diabetes.
ENJOYABLE AND SUSTAINABLE DIETSIn the short term, a wide variety of diets will reduce weight and improve car-diovascular risk factors under realistic clinical conditions. But only a minority ofindividuals have been found to sustain dietary adherence over the longer term.There is no single diet that is associated with satisfactory dietary adherence,although a high protein–low GI diet was associated with significantly highercompletion rates in the Diogenes Study of weight-loss maintenance [17]. Moreextreme diets, such as very low carbohydrate diets (Atkins) or very low-fat diets(eg Ornish) are more likely to be discontinued [44]. To manage the epidemic ofobesity and diabetes, practical techniques to increase dietary adherence are ur-gently needed.
One way to do this is to offer a broad range of healthy diet options, tobetter match individual patient preferences, lifestyles and cultural backgrounds.Dansinger et al. [44] found that only one in four individuals were adherent oneyear after counselling, yet those individuals who sustained the greatest weightloss and risk reduction were those who were able to comply, no matter what thediet composition. Thus a diet’s ease of adoption, rather than diet composition perse, is an important attribute of an effective diet. These findings challenge the as-sumption that one type of diet is appropriate for everyone and that popular dietscan be ignored.
Another way to increase adherence is to offer intensive, systematic andindividualised dietary counselling. In the Diabetes Prevention Program, freely
A modern epidemic
374

available intensive dietary counselling was effective in sustaining weight loss,and cardiovascular and diabetes risk reduction over a three-year period, irrespec-tive of ethnicity, socioeconomic group or cultural background [2]. Only 7.5% ofindividuals dropped out of the study despite the large number of face-to-face vis-its over a long period. While dietary counselling requires more resources fromthe health system, cost-effectiveness analyses show that the intensive lifestyle in-terventions cost no more than drug interventions [45]. Moreover, over the longterm, we can expect fewer side effects and more benefits (eg reduced risk of otherlifestyle diseases) associated with adherence to a healthy diet.
VEGETARIAN DIETS FOR DIABETESA vegetarian or semi-vegetarian diet, with emphasis on plant foods such aswholegrains, legumes, nuts, fruits, vegetables, is widely believed to have a num-ber of nutritional benefits over a meat-based diet for the management of diabetes.Vegetarian diets can be (but not necessarily) lower in saturated fat, higher in di-etary fibre and richer in micronutrients such as magnesium, ie factors that areassociated with higher insulin sensitivity. Observational studies show that a veg-etarian or vegan diet is associated with reduced risk of development of type 2diabetes and lower risk of complications in those with existing diabetes. TheEuropean Prospective Investigation into Cancer and Nutrition study found thatamong participants with diabetes, there was a significant inverse association be-tween cardiovascular mortality and intake of total vegetables, legumes and fruit[46]. In women with type 2 diabetes, frequent consumption of nuts was associ-ated with a 50% reduction in the risk of CVD and a more favourable lipid profile[47]. One long-term intervention study, in which animal protein was partly re-placed with soy protein, reported significant improvements in total cholesterol,LDL cholesterol, triglycerides and CRP levels in individuals with diabetes [48].Nonetheless, it is difficult to separate vegetarianism from other healthy lifestylebehaviours, which also improve risk factors. Some evidence suggests it is the ab-sence of processed meat products from vegetarian diets rather than meat per sethat offers benefits.
COMPATIBILITY WITH SUSTAINABLEAGRICULTURAL PRACTICES
Some health authorities have recommended vegetarian diets over meat-based di-ets on the grounds of environmental sustainability. However, the issue is debatedeven among the experts. Much of Australia is classed as arid or semi-arid, withvast areas that are unsuitable for crop agriculture, but suitable for grazing. In the
17 Nutrition therapy in the treatment of diabetes
375

Australian context, most agriculturalists and those who are knowledgeable con-sider extensive, free-range grazing systems with relatively low stocking rates anda rotation of cropping and pastures as sustainable. Such relatively low input–lowoutput systems have been sustained for decades, eg the sheep-wheat-legume-based pasture systems in south-eastern Australia. The animal/pasture componentin the rotation actively promotes sustainability. In Australia, Good AgriculturalPractice and Best Management Practice production systems are widely recog-nised and used.
The notion that we should not eat meat or dairy for environmental reasonsmay in itself be a flawed argument because avoidance of meat requires the pro-duction of more grain to obtain the same nutrition. Animal source foods arenutrient dense and generally are able to nourish the human population more ef-fectively than plants. Overconsumption and waste are profoundly more importantfor both sustainability and health than simply considering plant vs animal con-sumption. At present, over a quarter of all foods consumed are ‘non-core foods’,ie foods that are not essential to good health, yet demand a disproportionatelylarge amount of scarce resources such as water, and generate large amounts ofgreenhouse gases.
PARTICULAR ASPECTS OF NUTRITION THERAPYFOR TYPE 1 DIABETES
Although the underlying pathogenesis is initially different in type 1 vs type 2diabetes (absolute insulin deficiency vs relatively greater insulin resistance, re-spectively) and mean age of onset differ, the subsequent metabolic derangementsthat stem from chronic hyperglycaemia and that are involved in the pathogen-esis of diabetes complications are common to both. The principles discussedabove for the nutritional management of type 2 diabetes therefore also apply tothe management of type 1 diabetes, particularly as they relate to weight control,avoidance of hyperglycaemia and hypoglycaemia and optimisation of metaboliccontrol and insulin sensitivity. There are some particular considerations for type1 diabetes, mainly relating to carbohydrate counting and type of carbohydrate.
Type 1 diabetes has an acute and earlier age of onset than type 2 diabetes,with the majority of cases diagnosed in children and adolescents after a short du-ration of symptoms. Most people diagnosed with type 1 diabetes are not obese,even prior to the weight loss that often occurs before the diagnosis. Becauseall type 1 subjects require insulin therapy, nutritional management commenceswith a different focus. A major priority is to have a nutritional and insulin planthat meets short- and long-term glycaemic goals, including control of hypergly-caemia, and minimises hypoglycaemia and glucose fluctuations. Additional goalsare long-term maintenance of a healthy weight and prevention or reduction in
A modern epidemic
376

risk of long-term complications that are not usually present at diagnosis (but canoften be in type 2 diabetes). Not surprisingly, in line with trends to increasingprevalence of overweight and obesity in society, children diagnosed with type 1diabetes are heavier and taller than their peers [49] and this has been postulated tobe associated with the earlier onset of type 1 diabetes seen in various registriesand termed the ‘accelerator hypothesis’. This hypothesis suggests that the rela-tive insulin resistance associated with being overweight or obese accelerates theprogression to clinical onset of type 1 diabetes in those that are genetically pre-disposed [50]. There is also evidence that in the longer term, those with type 1diabetes are heavier than their non-diabetic peers [51]. There is also a subgroupwith type 1 diabetes who have significant inherent insulin resistance in addi-tion to that associated with obesity; the term ‘double diabetes’ has been used forthis group and they are often considered for co-treatment with insulin sensitis-ing agents. Therefore the management of overweight and obesity in young peoplewith type 1 diabetes is a frequent necessity.
Carbohydrate counting has become an established part of the nutritionalmanagement in type 1 diabetes and is a necessary component of flexible multipledaily injection plans and insulin pump therapy. There has been a movement awayfrom recommending relatively fixed carbohydrate intake (or carbohydrate pre-scription) to more flexible and physiological approaches in which subjects aretaught to match their insulin doses with their desired and counted carbohydrateintake. There is reasonable evidence to conclude that the use of carbohydratecounting with flexible insulin to carbohydrate ratio is associated with improvedHbA1c and quality of life, but no conclusions regarding effects on body weightor severe hypoglycaemia [52, 53]. The DAFNE study demonstrated that adult type1 diabetes subjects using such an approach achieved a significant improvementin HbA1c and quality of life over six months, without worsening severe hypo-glycaemia or cardiovascular risk. However, there are not yet comparable datain children and adolescents. Despite such studies, there are limited data on thebest methods and teaching to employ or the degree of accuracy required in car-bohydrate counting. While trends have been to aim for more accurate matchingof insulin to carbohydrate, one study demonstrated that postprandial BGL con-trol was not affected by variations of up to 17% in the carbohydrate amountcovered by the same insulin dose [54]. With insulin pump therapy, the only avail-able randomised prospective study recently demonstrated that in adults, accuratecarbohydrate counting had advantages over empirical estimation of doses in anumber of parameters over 24 weeks, including HBA1c, BMI, waist circumfer-ence and quality of life [55].
There is also evidence that the type of carbohydrate as well as the quantityis important in minimisimg glucose fluctuations and hypoglycaemia; these arethe concepts of glycaemic index and glycaemic load [4]. While there are no datain children and adolescents, the conclusions from the adult studies cited above
17 Nutrition therapy in the treatment of diabetes
377

should also be applicable to young people and their diabetes nutritional plansshould incorporate these concepts.
CONCLUSIONSThe findings of recent, high quality studies have been surprising and yet remark-ably consistent. The conventional low-fat diet is probably not the optimal dietfor managing diabetes, weight or risk factors for cardiovascular disease. Rather,there appear to be superior dietary patterns that offer good diabetes control, moreflexibility and greater ability for individuals to choose a diet that they enjoy andcan sustain over the longer term. These alternative nutritional strategies includethose with a moderately lower carbohydrate content, those with a lower gly-caemic index, or higher fat (Mediterranean-style), or higher protein content. Verylow-carbohydrate diets (with higher protein and fat) cannot be recommended topeople with type 1 diabetes because of adverse effects on renal function. In indi-viduals with type 2 diabetes, there is a lack of long-term dietary studies that gobeyond the measurement of risk factors (eg glycated haemoglobin) to assess hardoutcomes such as death and diabetes-related complications. Unfortunately, suchstudies are difficult and expensive to conduct, not amenable to patent generationand unlikely to eventuate. Long-term prospective observational studies in healthyindividuals remain our best guide. At the present time, diets low in saturated fatand trans fats, with a lower GI and GL, and higher fibre content, represent ourbest advice for increasing life expectancy and quality of life in individuals withdiabetes. With current insulin delivery methods in type 1 diabetes, carbohydratecounting and consideration of glycaemic index and glycaemic load remain an im-portant component of the nutritional plan.
References1. American Diabetes Association (2008). Nutrition recommendations and in-
terventions for diabetes. Diabetes Care, 31(Suppl. 1): S61–S78.2. Diabetes Prevention Program Research Group (2002). Reduction in the in-
cidence of type 2 diabetes with lifestyle intervention or metformin. The NewEngland Journal of Medicine, 346(6): 393–403.
3. Tuomilehto J, Lindstrom J, Eriksson JG, Valle TT, Hamalaninen H, Ilanne-Parikka P, et al. (2001). Prevention of type 2 diabetes mellitus by changes inlifestyle among subjects with impaired glucose tolerance. The New EnglandJournal of Medicine, 344: 1343–50.
4. Thomas D & Elliott E (2009). Low glycaemic index, or low glycaemic load,
A modern epidemic
378

diets for diabetes mellitus. Cochrane Database of Systematic Reviews.[On-line]. Available: onlinelibrary.wiley.com/doi/10.1002/14651858.CD006296.pub2/pdf [Accessed 12 December 2011].
5. Nield L, Moore H, Hooper L, Cruickshank K, Vyas A, Whittaker V, et al.(2009). Dietary advice for treatment of type 2 diabetes mellitus in adults.Cochrane Database of Systematic Reviews [Online]. Avaliable: onlineli-brary.wiley.com/doi/10.1002/14651858.CD004097.pub4/pdf [Accessed 12December 2011].
6. Boden G, Sargrad K, Homko C, Mozzoli M & Stein TP (2005). Effect ofa low-carbohydrate diet on appetite, blood glucose levels, and insulin resis-tance in obese patients with type 2 diabetes. Annals of Internal Medicine,142(6): 403–11.
7. Gannon MC & Nuttall FQ (2004). Effect of a high-protein, low-carbohy-drate diet on blood glucose control in people with type 2 diabetes. Diabetes,53(9): 2375–82.
8. Nalysnyk L, Hernandez-Medina M & Krishnarajah G (2010). Glycaemicvariability and complications in patients with diabetes mellitus: evidencefrom a systematic review of the literature. Diabetes, 12(4): 288–98.
9. American Diabetes Association (2011). Standards of medical care in dia-betes. Diabetes Care, 34(Suppl. 1): S11–61.
10. Bantle JP, Wylie-Rosett J, Albright AL, Apovian CM, Clark NG, Franz MJHoogwerf BJ, Lichtenstein AH, Mayer-Davis E, Mooradian AD & WheelerML (2008). Nutrition recommendations and interventions for diabetes: aposition statement of the American Diabetes Association. Diabetes Care,(Suppl. 1): S61–78.
11. Smart C, Aslander-van Vliet E & Waldron S (2009). Nutritional manage-ment in children and adolescents with diabetes. Pediatric Diabetes, (Suppl.12): 100–17.
12. Halton TL & Hu FB (2004). The effects of high protein diets on thermo-genesis, satiety and weight loss: a critical review. Journal of the AmericanCollege of Nutrition, 23(5): 373–85.
13. Krieger JW, Sitren HS, Daniels MJ & Langkamp-Henken B (2006). Effectsof variation in protein and carbohydrate intake on body mass and composi-tion during energy restriction: a meta-regression 1. The American Journal of
17 Nutrition therapy in the treatment of diabetes
379

Clinical Nutrition, 83(2): 260–74.14. Nordmann AJ, Nordmann A, Briel M, Keller U, Yancy WS Jr., Brehm
BJ & Bucher HC (2006). Effects of low-carbohydrate vs low-fat diets onweight loss and cardiovascular risk factors: a meta-analysis of randomizedcontrolled trials. Archives of Internal Medicine, 166(3): 285–93.
15. Samaha F, Foster G & Makris A (2007). Low-carbohydrate diets, obesity,and metabolic risk factors for cardiovascular disease. Current Atherosclero-sis Reports, 9(6): 441–47.
16. Sacks FM, Bray GA, Carey VJ, Smith SR, Ryan DH, Anton SD, et al.(2009). Comparison of weight-loss diets with different compositions of fat,protein, and carbohydrates. New England Journal of Medicine, 360(9):859–73.
17. Larsen TM, Dalskov SM, van Baak M, Jebb SA, Papadaki A, Pfeiffer AFH,et al. (2010). Diets with high or low protein content and glycemic indexfor weight-loss maintenance. New England Journal of Medicine, 363(22):2102–13.
18. Vessby B (2000). Dietary fat and insulin action in humans. British Journalof Nutrition, 83: S91–S6.
19. Vessby B, Uusitupa M, Hermansen K, Riccardi G, Rivellese A, Tapsell L,et al. (2001). Insulin sensitivity in healthy men and women: the KANWUstudy. Diabetologia, 44(3): 312–19.
20. McKeown N, Meigs J, Liu S, Saltzman E, Wilson P & Jacques P (2004).Carbohydrate nutrition, insulin resistance, and the prevalence of the meta-bolic syndrome in the Framingham offspring cohort. Diabetes Care, 27(2):538–46.
21. Perez-Jimenez F, Lopez-Miranda J, Pinillos M, Gomez P, Paz-Rojas E,Montilla P, et al. (2001). A Mediterranean and a high carbohydrate diet im-prove glucose metabolism in healthy young persons. Diabetologia, 44(11):2038–43.
22. Due A, Larsen TM, Mu H, Hermansen K, Stender S, Astrup A (2008).Comparison of 3 ad libitum diets for weight-loss maintenance, risk of cardio-vascular disease, and diabetes: a 6-month randomized, controlled trial. TheAmerican Journal of Clinical Nutrition, 88(5): 1232–41.
23. Rizkalla S, Taghrid L, Laromiguiere M, Huet D, Boillot J, Rigoir A, et al.
A modern epidemic
380

(2004). Improved plasma glucose control, whole-body glucose utilization,and lipid profile on a low-glycemic index diet in type 2 diabetic men: a ran-domized controlled trial. Diabetes Care, 27(8): 1866–72.
24. Holman RR, Cull CA & Turner RC (1999). A randomized double-blind trialof acarbose in type 2 diabetes shows improved glycemic control over 3 years(UKPDS 44). Diabetes Care, 22(6): 960–64.
25. Marsh KA, Steinbeck KS, Atkinson FS, Petocz P & Brand-Miller JC (2010).Effect of a low glycemic index compared with a conventional healthy dieton polycystic ovary syndrome. The American Journal of Clinical Nutrition,92(1): 83–92.
26. Pereira M, Jacobs D, Pins J, Raatz S, Gross M, Slavin J & Seaquist, ER(2002). Effect of wholegrains on insulin sensitivity in overweight hyperinsu-linemic adults. The American Journal of Clinical Nutrition, 75(5): 848–55.
27. Brownlee IA, Moore C, Chatfield M, DP R, Ashby P, Kuznesof SA, JebbSA & Seal CA (2010). Markers of cardiovascular risk are not changed by in-creased wholegrain intake: the WHOLEheart study, a randomised, controlleddietary intervention. British Journal of Nutrition, 104(1): 125–34.
28. Daly ME, Vale C &Walker M (1997). Dietary carbohydrates and insulinsensitivity: a review of the evidence and clinical implications. The AmercianJournal of Clinical Nutrition, 66(5): 1072–85.
29. Kiens B & Richter E (1996). Types of carbohydrate in an ordinary diet affectinsulin action and muscle substrates in humans. The American Journal ofClinical Nutrition, 63(1): 47–53.
30. Koivisto VA & Yki-Jarvinen H (1993). Fructose and insulin sensitivity inpatients with type 2 diabetes. Journal of Internal Medicine, 233(2): 145–53.
31. Thorburn A, Crapo P, Beltz W, Wallace P, Witztum J & Henry R (1989).Lipid metabolism in non-insulin-dependent diabetes: effects of long-termtreatment with fructose-supplemented mixed meals. The American Journalof Clinical Nutrition, 50: 1015–22.
32. Garg A (1998). High-mono-unsaturated-fat diets for patients with diabetesmellitus: a meta-analysis. The American Journal of Clinical Nutrition,67(Suppl. 3): 577S–82S.
33. Livesey G, Taylor R, Hulshof T & Howlett J (2008). Glycemic responseand health a systematic review and meta-analysis: relations between dietary
17 Nutrition therapy in the treatment of diabetes
381

glycemic properties and health outcomes. The American Journal of ClinicalNutrition, 87(1): 258S–68.
34. Thomas D, Elliott E & Baur L (2007). Low glycaemic index or low gly-caemic load diets for overweight and obesity. Cochrane Database of Sys-tematic Reviews, Issue 3: Art. No.: CD005105. DOI: 10.1002/14651858.CD005105.pub2.
35. Shai I, Schwarzfuchs D, Henkin Y, Shahar DR, Witkow S, Greenberg I, etal. (2008). Weight loss with a low-carbohydrate, mediterranean, or low-fatdiet. New England Journal of Medicine, 359(3): 229–41.
36. Couzin-Frankel J (2010). Inflammation bares a dark side. Science,330(6011): 1621.
37. Kempf K, Rose B, Herder C, Kleophas U, Martin S, Kolb H (2006). Inflam-mation in metabolic syndrome and type 2 diabetes. Annals of the New YorkAcademy of Sciences, 1084: 30-48.
38. Monnier L, Mas E, Ginet C, Michel F, Villon L, Cristol J-P, Colette C(2006). Activation of oxidative stress by acute glucose fluctuations com-pared with sustained chronic hyperglycemia in patients with type 2 diabetes.The Journal of the American Medical Association, 295(14): 1681-87.
39. Botero D, Ebbeling CB, Blumberg JB, Ribaya-Mercado JD, Creager MA,Swain JF, et al. (2009). Acute effects of dietary glycemic index on antioxi-dant capacity in a nutrient-controlled feeding study. Obesity, 17(9): 1664–70.
40. Jakobsen MU, O’Reilly EJ, Heitmann BL, Pereira MA, BälterK, Fraser GE,et al. (2009). Major types of dietary fat and risk of coronary heart disease: apooled analysis of 11 cohort studies. The American Journal of Clinical Nu-trition, 89(5): 1425–32.
41. Barclay A, Petocz P, McMillan-Price J, Flood V, Prvan T, Mitchell P,et al. (2008). Glycemic index, glycemic load and chronic disease risk: ameta-analysis of observational studies. The American Journal of ClinicalNutrition, 87(3): 627–37.
42. Sieri S, Krogh V, Berrino F, Evangelista A, Agnoli C, Brighenti F, et al.(2010). Dietary glycemic load and index and risk of coronary heart diseasein a large Italian cohort: the EPICOR Study. Archives of Internal Medicine,170(7): 640–47.
43. Buyken A, Mitchell P, Ceriello A & Brand-Miller J (2010). Optimal dietary
A modern epidemic
382

approaches for prevention of type 2 diabetes: a lifecourse perspective. Dia-betologia, 53(3): 406–18
44. Dansinger ML, Gleason JA, Griffith JL, Selker HP & Schaefer EJ (2005).Comparison of the Atkins, Ornish, Weight Watchers and Zone Diets forweight loss and heart disease risk reduction. The Journal of the AmericanMedical Association, 293(1): 43–53.
45. The Diabetes Prevention Progrom Research Group (2003). Within-trialcost-effectiveness of lifestyle intervention or metformin for the primary pre-vention of type 2 diabetes. Diabetes Care, 26(9): 2518–23.
46. Nothlings U, Schulze MB, Weikert C, Boeing H, van der Schouw YT,Bamia C, et al. (2008). Intake of vegetables, legumes, and fruit, and risk forall-cause, cardiovascular, and cancer mortality in a European diabetic popu-lation. Journal of Nutrition, 138(4): 775–81.
47. Li TY, Brennan AM, Wedick NM, Mantzoros C, Rifai N & Hu FB (2009).Regular consumption of nuts is associated with a lower risk of cardiovasculardisease in women with type 2 diabetes. Journal of Nutrition, 139(7):1333–38.
48. Azadbakht L, Atabak S & Esmaillzadeh A (2008). Soy protein intake, car-diorenal indices, and C-reactive protein in type 2 diabetes with nephropathy:a longitudinal randomized clinical trial. Diabetes Care, 31(4): 648–54.
49. Knerr I, Wolf J, Reinehr T, Stachow R, Grabert M, Schober E, et al.(2005). The ‘accelerator hypothesis’: relationship between weight, height,body mass index and age at diagnosis in a large cohort of 9248 Germanand Austrian children with type 1 diabetes mellitus. Diabetologia, 48(12):2501–04.
50. Wilkin TJ (2009). The accelerator hypothesis: a review of the evidence forinsulin resistance as the basis for type 1 as well as type 2 diabetes. Interna-tional Journal of Obesity, (7): 716–26.
51. Mortensen HB, Robertson KJ, Aanstoot HJ, Danne T, Holl RW, HougaardP, et al. (1998). Insulin management and metabolic control of type 1 diabetesmellitus in childhood and adolescence in 18 countries. HvidØre Study Groupon Childhood Diabetes. Diabetic Medicine, 15(9): 752–59.
52. Gilbertson HR, Brand-Miller JC, Thorburn AW, Evans S, Chondros P &Werther GA (2001). The effect of flexible low glycemic index dietary advice
17 Nutrition therapy in the treatment of diabetes
383

versus measured carbohydrate exchange diets on glycemic control in chil-dren with type 1 diabetes. Diabetes Care, 24(7): 1137–43.
53. DAFNE Study Group (2002). Training in flexible, intensive insulin man-agement to enable dietary freedom in people with type 1 diabetes: doseadjustment for normal eating (DAFNE) randomised controlled trial. BritishMedical Journal, 325(7367): 746.
54. Smart CE, Ross K, Edge JA, Collins CE, Colyvas K & King BR (2009).Children and adolescents on intensive insulin therapy maintain postprandialglycaemic control without precise carbohydrate counting. Diabetic Medi-cine, 26(3): 279–85.
55. Laurenzi A, Bolla AM, Panigoni G, Doria V, Uccellatore A, Peretti E, et al.(2011). Effects of carbohydrate counting on glucose control and quality oflife over 24 weeks in adult patients with type 1 diabetes on continuous subcu-taneous insulin infusion: a randomized, prospective clinical trial (GIOCAR).Diabetes Care, 34(4): 823–27.
A modern epidemic
384

18Current therapies and pharmacy pro-
grams for obesity and diabetesCarol Armour,1 Betty Chaar,2 Michael Murray,2 Geoffrey Ambler3,4 and Ines
Krass2
A growing body of Australian and international literature has reported thebenefits and improved health outcomes resulting from various trials ofpharmaceutical care, self-management support and other cognitive servicesin chronic conditions such as diabetes and obesity. This review will focuson existing medications, the reasons why they might not work for someindividuals and the potential for new ways to treat both diseases. It willalso review novel ways to manage the diseases, including using communitypharmacy as a site for intervention, once effective therapies are available.
The burden of diabetes and obesity for individuals and for the community is high.The complications of both diseases are related and of the order that adequatetreatment and control are vital to limit an epidemic of severe morbidity and mor-tality. Medications and how they are used play a key role in the managementof these chronic conditions. Current antidiabetic therapies enhance insulin se-cretion by pancreatic beta-cells, reducing insulin resistance, modulating glucosemetabolism or in type 1 diabetes or refractory type 2 diabetes, replacing insulin.Although several subclasses of non-insulin agents have been in use for sometime, detailed information on their modes of action, use in various combinationsand factors that prevent their optimal use are only recently emerging and requirefurther understanding. Pharmacotherapy is also being increasingly used as a com-ponent of preventive programs targeting insulin resistance and obesity beforeonset of diabetes (‘prediabetes’), especially in children and adolescents. Phar-macists contribute significantly to quality use of medicines when they provideinformation, advice and recommendations to patients and providers to optimise
1 Woolcock Institute of Medical Research, Sydney Medical School, University ofSydney.
2 Faculty of Pharmacy, University of Sydney.3 Discipline of Paediatrics, University of Sydney.
4 Institute of Endocrinology and Diabetes, Children’s Hospital, Westmead.
385

therapeutic outcomes. In recent years, pharmacists have also sought to developan expanded role in contributing to the management of chronic diseases to meetthe needs of this growing patient population.
DiabetesType 2 diabetes mellitus (T2DM), the most common form of diabetes, is now anescalating worldwide epidemic. It contributes significantly to premature mortal-ity, morbidity and disability through the development of micro- and macrovascu-lar complications of uncontrolled disease. In Australia, the 2007–2008 NationalHealth Survey estimated that 818 200 Australians (4%) have diabetes, based onself-reports [1]. The earlier national Australian Diabetes, Obesity and Lifestylestudy found that approximately 1.2 million (7.4%) of Australians aged 25 yearsand over had diabetes with half of the respondents unaware [1]. A further 16% ofAustralians have been estimated to have impaired glucose metabolism or predia-betes [2]. The total economic burden is estimated at A$6 billion annually (2003)arising mainly from the costs associated with the treatment of complications [3].
The incidence and prevalence of T2DM in adolescents is increasing globally,but especially in those of non-white European descent [4]. The InternationalDiabetes Federation estimates that 285 million people around the world havediabetes. This total is expected to rise to 438 million within 20 years. Highestrisk groups are those of black African descent, native North American, Hispanic,Asian, South Asian and Native Pacific Islanders. These groups have higher ge-netic risk factors with the clinical expression of T2DM being accelerated byincreasing rates of childhood and adolescent overweight and obesity [5]. WhileT2DM is being seen in increasing prevalence in younger age groups, it is rarelyseen until the second decade of life since it requires the trigger of the physiologi-cal increase in insulin resistance that occurs with puberty [4].
ObesityObesity is a major global public health and economic problem as it is associatedwith significant morbidity and mortality. In 2005, the World Health Organisationreported approximately 1.6 billion adults as overweight; 400 million of thosewere obese [6]. Australia is one of the most overweight developed nations [7],with a growing incidence over the last 12 years, approximately 68% of adult menand 55% of adult women were overweight or obese in 2007–2008 [8]. The totalcost of obesity in 2008 was A$58.2 billion which included the costs attributableto associated diseases [9].
Overweight and obesity are both disease states and risk factors for manyother chronic conditions. Overweight is defined as a body mass index (BMI) ≥25in adults or 85th percentile in children and adolescents and obesity as a body mass
A modern epidemic
386

index ≥30 in adults or the 95th percentile in children and adolescents. Higherbody mass was responsible for 7.5% of the total burden of disease and injury in2003, ranked behind tobacco (7.8%) and high blood pressure (7.6%) [10].
Excess body mass predicts higher mortality and/or morbidity in cardiovascu-lar disease, T2DM, some cancers and increasingly, osteoarthritis [11]. Obesity isalso strongly associated with back, reproductive and mental health problems, andobstructive sleep apnoea. Modest weight losses of 5% to 10% have been shownto improve hypertension and dyslipidaemia [10, 12].
In response to this problem the Australian Government recommended inJune 2009, strategies for the treatment, management and prevention of obesity in‘Weighing it up – obesity in Australia’, as well as better regulation of weight-lossproducts and programs to ensure safety and efficacy[9].
ADDRESSING THE PROBLEMSEvidence-based strategies addressing the problem of T2DM support the benefitsof early interventions in prediabetes and strict control of glycaemia, blood pres-sure and lipids in established diabetes to reduce the risk and delay the onsetof the complications such a cardiovascular and kidney disease [13, 14, 15]. Inrecent years, a plethora of clinical and management guidelines which recommendtherapeutic targets to optimise disease control have become widely available tohealthcare practitioners. This, coupled with advances in understanding of thepathophysiology of T2DM and the introduction of a range of new managementtherapies in the past decade, have ushered in the possibility of reducing the dis-ease burden associated with T2DM and its complications.
There is broad agreement that the most appropriate first-line therapy foroverweight and obesity in all age groups is behavioural and lifestyle interven-tions, including nutritional and exercise interventions [16]. This is particularly soin children and adolescents in whom the problem is generally less entrenched andhas fewer complications. Also, there is lower availability of licensed drugs forthe use of obesity in children and adolescents and greater reluctance to use phar-macotherapy in the young because of concern about long-term side effects. Thelessons of history have shown these concerns to be justified.
MANAGEMENT OF T2DMThe clinical management of T2DM aims to achieve control of glycaemia, as wellas other risk factors such as blood pressure, dyslipidaemia and obesity to pre-vent or reduce the progression of the micro- and macrovascular complicationsassociated with the condition. Initial and then ongoing management involves rec-
18 Current therapies and pharmacy programs for obesity and diabetes
387

ommended modifications to diet and physical activity to address blood glucoseas well as cholesterol and blood pressure. For blood glucose, if satisfactory gly-caemic control is not achieved through weight loss and increased physical activityalone, pharmacotherapy is indicated. The current guidelines recommend thatpharmacological therapy is commenced with metformin [17]. However, over timebeta-cell function progressively declines, usually necessitating the addition of ad-ditional agents which include sulfonylureas, meglitinides, thiazolidinediones, andpotentially incretin mimetics such as the oral DPPIV inhibitors, injectable agentssuch as exenatide, or insulin. The therapeutic use of each of these classes is dis-cussed in the next section.
T2DM is a complex condition to manage, requiring all elements of thebiopsychosocial model to be considered. Addressing lifestyle issues such as dietand exercise, as well as care in commencing and up-titrating medications, andvigilance in monitoring of the disease including achieving and sustaining bloodglucose and other targets in therapy, is demanding on the person with diabetes,their families and on healthcare resources. The membership of the health profes-sional team that supports the person with T2DM is broad, and depending uponindividual patient’s needs may include the general practitioner, practice nurse anddietitian, as well as the diabetes nurse educator, specialist endocrinologist, podia-trist, optometrist, ophthalmologist and psychologist. As described in later parts ofthis chapter the pharmacist can, and should, be an integral member of the health-care team supporting the care of the person with diabetes.
The rest of this chapter will focus on pharmacotherapy for blood glucosein T2DM and pharmacotherapy in obesity, and management of these diseases inadults and adolescents. Commercial programs available for obesity managementwill be discussed, as well as optimising management of T2DM and obesity in ourcurrent health system and the evidence and potential role of pharmacy in improv-ing outcomes for these diseases.
OPTIMISATION OF CURRENT THERAPIES FORDIABETES
Current antidiabetic agents enhance the secretion of insulin by pancreatic beta-cells, improve insulin resistance in tissues or modulate glucose metabolism.Although several classes of drugs have been used in the treatment of diabetes forsome time it is only recently that detailed information on their modes of actionand the factors that prevent their optimal use in patients have emerged.
A modern epidemic
388

Major classes of antidiabetic agents
(a) Insulin secretagoguesATP is generated during mitochondrial glucose metabolism and modulates theopening of ATP-sensitive potassium channels on the plasma membrane. Thesechannels are composed of eight polypeptides: four sulfonylurea receptor (SUR1)subunits that are members of the ATP-binding cassette transporter family andfour Kir6 subunits that are members of the inwardly rectifying potassium channelfamily [18]. Hypoglycaemic sulfonylureas, such as glibenclamide, glipizide andtolbutamide, stimulate insulin secretion by interaction with SUR1. SUR1-inducedclosure of the ATP-sensitive potassium channel mediated by sulfonylureas depo-larises the plasma membrane and promotes the release of insulin [19].
The meglitinides, such as repaglinide and nateglinide, are non-sulfonylureainsulin secretagogues whose mechanism of action resembles that of the sulfony-lureas but is mediated through a different binding site on SUR1 [20]. Unlike thesulfonylureas, the meglitinides stimulate first-phase insulin release in a glucose-sensitive manner [21]. These properties enhance the control of serum glucose andinsulin concentrations.
(b) Insulin sensitisersThe storage of lipid in adipocytes and other cells is dysregulated in T2DM anddesensitises insulin signalling. As a result, adipocytes do not store triglyceridesadequately or release adipokines that regulate food intake. Thiazolidinedionesare agonists for the nuclear peroxisome proliferator-activated receptor-gamma(PPAR-gamma), which regulates lipid storage in adipocytes [22]. These agentsenhance insulin sensitivity by modulating the production of adipokines, includingleptin, adiponectin, resistin and tumour necrosis factor-alpha, by adipocytes. Byactivating PPAR-gamma thiazolidinediones alter the transcription of genes thatregulate glucose and lipid metabolism, such as lipoprotein lipase, fatty acyl-CoAsynthase, glucokinase and the glucose transporter GLUT4.
Although PPAR-gamma appears to be an important target for thiazolidine-diones the receptor is expressed primarily in adipocytes. That these drugs im-prove insulin resistance in other cells that do not express PPAR-gamma suggeststhat there may be additional targets. Thus, thiazolidinediones may also target theadenosine monophosphate-activated protein kinase (AMPK), which is an impor-tant fuel sensor that regulates glucose and lipid metabolism.
(c) BiguanidesThe most important biguanide in current use is metformin but its mechanismof action is not entirely clear. In diabetic patients metformin decreases hepatic
18 Current therapies and pharmacy programs for obesity and diabetes
389

glucose output by decreasing gluconeogenesis and by increasing glucose uptakeby skeletal muscle. However, it has also been shown that metformin activatesAMPK in liver and muscle [23]. AMPK inhibits acetyl-coenzyme A carboxylase,which is the rate-limiting step of lipogenesis and down-regulates hepatic sterol-regulatory-element-binding-protein-1, which is a major regulator of lipogenicgenes. This decreases triglyceride synthesis and facilitates the normalisation oflipid and glucose metabolism.
(d) Incretin mimeticsExenatide is the only drug in this group currently available in Australia. Exe-natide binds to the human GLP-1 receptor, which provides glycaemic control viavarious mechanisms [24]. It is an insulin secretagogue that stimulates glucose de-pendent insulin secretion and therefore only works during hyperglycaemia butnot during hypoglycaemia. The functioning of pancreatic beta-cells in patientswith T2DM may also be improved by exenatide [24]. The secretion of glucagonis suppressed by exenatide, which lowers the blood glucose levels in both fastingand postprandial periods.
Furthermore, exenatide delays gastric emptying in patients with T2DM [24].This is very important in the regulation of postprandial blood glucose control,since the latter is strongly determined by the delivery of nutrients from thestomach to the small intestine. Exenatide also suppresses appetite, leading to areduction in food intake and a decrease in body weight in the longer term usuallyof some kilograms.
It is indicated in Australia as adjunctive therapy to improve glycaemic con-trol in patients with T2DM who are taking metformin, a sulfonylurea, or acombination of metformin and a sulfonylurea but are not achieving adequate gly-caemic control.
(e) DPP-IV inhibitorsAnother new class of oral antidiabetic agents are the dipeptidyl peptidase IV inhi-bitors (DPP-IV) or ‘incretin enhancers’. They work by delaying the degradationof GLP-1 and thus extend the action of insulin in a glucose dependent manner,while also suppressing the release of glucagon [24]. There are currently threeagents in this class approved in Australia: saxagliptin, sitagliptin and vildagliptin.
(f) Alpha-glucosidase inhibitorsThese agents, acarbose and miglitol, are taken orally and slow absorption of glu-cose by inhibiting alpha-glucosidases in the upper GI tract. These enzymes areresponsible for converting complex polysaccharide carbohydrates into monosac-
A modern epidemic
390

charides in a dose dependent fashion. They are less potent than other oral agentswith an HbA1c lowering effect of 0.4% to 0.9% generally reported and are usu-ally used in combination with other agents rather than as monotherapy [25].
(g) InsulinHistorically, insulin has been used late in the therapeutic cascade in T2DM aftertrial and failure to achieve targets through lifestyle modification and oral med-ications. Since decline in beta-cell function and reduced effectiveness of otheragents over time is common in the pathophysiology of T2DM, many if not mostpatients will require insulin therapy, usually within ten years of the diagnosisof T2DM. In general, physicians have been reluctant to add insulin to therapybecause of concerns about increased complexity, risk of hypoglycaemia and pa-tient acceptance, and the possible need to commence insulin injections has beenused as a motivator or ‘threat’ to improve lifestyle factors [26]. Yet insulin is themost efficacious agent to lower blood glucose levels in diabetes mellitus. A va-riety of insulin regimens are employed including simple basal supplements (withisophane, insulin-glargine or insulin-detemir) to suppress hepatic glucose produc-tion, with the addition of prandial doses (regular human insulin or rapid-actinganalogue) if needed to control meal-related hyperglycaemia. Premixed insulincombinations are also frequently used. To date, insulin pump therapy has notbeen generally recommended as a means of insulin delivery in T2DM becausesimpler injection regimens are effective and cheaper; however increasing use islikely in subgroups with T2DM who have blood glucose levels that are difficultto stabilise.
(h) Combination therapyThe agents outlined above are frequently used in combination, especially if gly-caemic targets are not being met with single agents. As yet, there is no clearevidence as to which combinations are most effective or the order in which theyare used and often the decision relates to individual patient factors and physicianpreference. The American Diabetes Association and the European Associationfor the Study of Diabetes have published a consensus algorithm for the metabolicmanagement of T2DM [27]. The NHMRC of Australia has also published an al-gorithm as part of the Evidence-based clinical care guidelines in blood glucosecontrol in type 2 diabetes [28]. In each of these guidelines, metformin is a cor-nerstone of therapy, often with the addition of a secretagogue agent as a secondline and then the addition or substitution of insulin. A number of combinationmedications are available that combine metformin with a sulphonylurea, or witha DPP-IV inhibitor. We can expect changes in these drug therapy paradigms asexperience is gained with newer agents such as incretin mimetics and the safety
18 Current therapies and pharmacy programs for obesity and diabetes
391

concerns with other agents (eg thiazolidinediones) are clarified.
Adverse effects of current therapies and pharmacokineticconsiderations
(a) Insulin secretagoguesThe major side effect of sulfonylureas and meglitinides is hypoglycaemia, butthis is usually mild and by definition is self-treated. Additional adverse effects ofmeglitinides include upper respiratory tract infections, rhinitis, bronchitis, dizzi-ness and headache.
Pharmacokinetic studies have shown that serum concentrations of sulfony-lureas and meglitinides are subject to marked inter-individual variation. Hepaticcytochromes P450 (CYPs) 2C8, 2C9 and 2C19 mediate the phase I oxidationof most of these drugs. These CYPs exhibit polymorphisms that give rise toaltered drug pharmacokinetics. The two major variant alleles of CYP2C9 –CYP2C9*2 and CYP2C9*3 – occur at frequencies of ~11% and ~7%, respec-tively, in Caucasians, but exhibit lower incidence in African-Americans andAsians [29]. These CYP2C9 polymorphisms influence the apparent clearance oftolbutamide, glimepiride and glibenclamide and may complicate therapy in Cau-casians in particular [29]. In contrast, in vivo pharmacokinetics of gliclazide weredependent on CYP2C19. The poor metaboliser phenotype for CYP2C19 is im-portant in Asians due to the higher incidence of defective CYP2C19*2 and *3alleles (~20% in Asians, but only 2% in Caucasians).
Repaglinide is eliminated by CYP2C8 and, to a lesser extent,CYP3A4-mediated oxidation to inactive phase I metabolites and by UDP-glu-curonosyltransferases to the acyl glucuronide [30]. The CYP2C8*1/*3 genotypehas been associated with decreased plasma concentrations of repaglinide. In com-parison, nateglinide is metabolised by CYP2C9 and CYP3A4. However, theconcordance between CYP2C alleles and the pharmacodynamics of these drugsis imperfect [29], and CYP2C genotyping to direct drug and dose selection is notcurrently indicated.
(b) Insulin sensitisersAdverse effects of thiazolidinediones such as rosiglitazone and pioglitazone in-clude weight gain and increase in peripheral fat mass, oedema, anaemia, pul-monary oedema, congestive heart failure and myocardial ischaemia [31]. Oedemais a drug class effect that precludes the use of the thiazolidinediones in patientswith evidence of cardiac failure. The incidence of peripheral oedema was about27% in one Australian study, which was reportedly somewhat higher than inother studies [31]. This was attributed to broader inclusion criteria or to the con-
A modern epidemic
392

current use of drugs such as non-steroidal anti-inflammatory drugs and calcium-channel blockers.
CYP2C8 is primarily responsible for the hydroxylation and N-demethylationof rosiglitazone in the human liver, with minor contributions from CYP2C9 [32].By comparison, pioglitazone is oxidised by CYP2C8 and to a lesser extent byCYP3A4 [33]. The involvement of CYP3A4 in these pathways increases thepotential for drug–drug interactions because this enzyme is involved in the me-tabolism of most drugs. CYP3A4 is also inducible by coadministered drugsincluding anti-epileptic agents and St John’s wort. Thus, avoidance of potentCYP3A4 inducers in patients receiving thiazolidinediones is advisable.
The future role of thiazolidinediones is increasingly uncertain because ofsafety issues, which also include an increased risk of fracture and osteoporosisas well as exacerbation of diabetic macular oedema in some patients [28]. Pre-dominantly because of concerns about myocardial ischaemia risk, the use ofrosiglitazone has been suspended in the European Union and restricted in theUS [34] and additional warnings have been added in other countries, includingAustralia [35]. Recently pioglitazone has been reported to be associated with anincreased risk of bladder cancer in those with the longest cumulative exposure; asafety warning has been issued by the FDA [36] and its use has been suspended insome countries. An earlier agent, troglitazone, was discontinued in 2000 becauseof concerns of liver toxicity [37].
(c) BiguanidesThe most serious potential adverse effect of the biguanide class of oral hypo-glycaemic agents is lactic acidosis. Phenformin was withdrawn some years agobecause of high risk of lactic acidosis. However, metformin is safer than phen-formin, and the risk of developing lactic acidosis is low, at less then one in 10000 patients prescribed the agent [28], providing the drug is not used in patientsfrom high-risk groups. Metformin itself causes few adverse effects with gastroin-testinal upset the most common.
Metformin does not undergo oxidative biotransformation and is excreted un-changed by the kidneys [38]. In normal renal function, metformin is unlikely toaccumulate but is contraindicated in patients with risk factors for lactic acidosisor drug accumulation because of kidney, liver or cardiac dysfunction. Recently,it has been recognised in guidelines that metformin can be prescribed with vigi-lance, in people with stable chronic kidney disease down to an eGFR of 30 ml/min [28].
As per the product information, metformin may also lower serum vitaminB12 levels by reducing B12 absorption, and, while this vitamin is stored longterm in the liver, it is prudent to assess the blood vitamin B12 level each coupleof years to ensure it remains in the health range.
18 Current therapies and pharmacy programs for obesity and diabetes
393

(d) Incretin mimeticsSubcutaneously administered exenatide is generally well tolerated. The most fre-quently reported adverse effect is nausea which leads to a discontinuation oftreatment in about 2%–4% of patients although it usually improves with time[39]. The incidence of nausea is higher during the initial weeks of treatment anddeclines thereafter. The observed weight loss in patients using exenatide is notassociated with the occurrence of nausea. Other, usually minor and transientgastrointestinal complications such as vomiting and diarrhoea are also reported.Further adverse effects include feeling jittery, dizziness and headache [24, 39].
Severe hypoglycaemia causing unconsciousness, is rare in patients using ex-enatide. However, mild to moderate hypoglycaemia might occur more often withthis agent, especially when used in combination with a sulphonylurea [24]. Sim-ilar to nausea, the incidence of hypoglycaemia peaks during the initiation oftreatment and decreases over time.
Because exenatide delays gastric emptying, it can influence the efficacy ofagents that require rapid gastrointestinal absorption. Therefore, medications thatdepend on threshold concentrations such as oral contraceptives and antibioticsshould be administered at least one hour before exenatide.
Exenatide is administered by subcutaneous injection. The initial dosageshould be 5 μg twice daily and if tolerated, should be increased to 10 μg twicedaily after one month of treatment. Elimination of exenatide occurs mainly viaglomerular filtration, hence the use of this agent is not recommended in patientswith a severely impaired renal function.
(e) DPP-IV inhibitorsThese agents are generally well tolerated. The most common side effects areupper respiratory tract infection and headache. Use is also associated with ab-dominal pain, nausea and diarrhoea. A key advantage is that this class do notcause hypoglycaemia at nearly the rate of the sulphonylureas, nor do they causeweight gain [24].
(f) Alpha-glucosidase inhibitorsFlatulence and diarrhoea are the main, very common side effects of this class ofdrugs which often limit their use [25].
(g) InsulinThe predominant adverse effects with insulin therapy are risk of hypoglycaemiaand weight gain. One target of therapy in people requiring insulin treatment isthat hypoglycaemia should be minimised. Mild hypoglycaemia occurs in ~30%
A modern epidemic
394

of people at least once a year. Severe hypoglycaemia, which may be life-threaten-ing, through causing trauma or triggering heart events such as myocardial infarct,occurs in 1%–2% yearly [28]. Occurrence of severe hypoglycaemia should be a‘red flag’ to the diabetes healthcare team that the entire treatment approach needsrevision, to identify the precipitating and predisposing factors and prevent recur-rence.
Variations in genes that influence the pharmacodynamics ofantidiabetic drugs
(a) Insulin secretagoguesThere is considerable inter-individual variation in the response to these drugs.Several SUR1 variants have been identified including common polymorphisms inexon 16 and 18. It has been suggested that the Ser1369Ala variant of the ABCC8gene that encodes SUR1 and also the Glu23Lys variant of Kir6.2 may be associ-ated with the development of T2DM, especially if additional risk factors such asobesity are present [40].
(b) Insulin sensitisersPPAR-gamma forms transcriptionally active heterodimers with RXR-beta so thatdefects in one or both genes may constitute an increased risk of insulin resistance.Thus, the common Pro12Ala variant of PPAR-gamma may contribute to the in-sulin resistant phenotype [41]. Obese individuals carrying the Ala-12 variant wereat higher risk, especially if their dietary mono-unsaturated fatty acid intake waslow. The observation that carriers of the RXR-beta C51T genotype who had ahigh body mass index also had an increased risk of gallstones may be relevantsince both obesity and diabetes are important risk factors for gallstones [42]. Apartfrom possible contributions to disease development, as yet there is little informa-tion regarding the action of thiazolidinediones at variant PPAR-gamma.
(c) BiguanidesIt now appears that AMPK is also a target for the biguanides. AMPK is a het-erotrimeric complex containing a catalytic (alpha) subunit and two regulatorysubunits (beta and gamma). In AMPK alpha2-null mice body weight and fat masswere increased and insulin sensitivity was impaired when they were adminis-tered a high-fat diet [43]. Single nucleotide polymorphisms in the AMPK alpha2subunit gene were associated with altered serum lipoprotein concentrations in apatient cohort [44]. Similarly, relationships between diabetes and the –26C/T andIVS1+43C/T polymorphisms of the AMPK gamma2 subunit gene were evalu-
18 Current therapies and pharmacy programs for obesity and diabetes
395
ated. Patients who were homozygous for the –26T allele were associated with ahigher risk of developing T2DM and patients who carried the IVS1+43TT vari-ant had higher serum concentrations of triglycerides and cholesterol [45]. To date,information on the role of AMPK beta-subunit gene variation and disease devel-opment have not been delineated. Moreover, how AMPK subunit polymorphismsinfluence metformin efficacy in T2DM is yet to be established.
(d) and (e) Incretin mimetics and DPP-IV inhibitorsA single nucleotide polymorphism in the GLP-1 gene that encodes the majorGLP-1 receptor variant, in which threonine 149 is replaced by methionine, is ac-tivated differentially by GLP-1 in vitro [46]. This receptor variant could account,in part, for different responses to GLP-1 agonists such as exenatide, but this pos-sibility has not yet been actively explored.
With the exception of saxagliptin the available DPP-IV agents are not CYPsubstrates and so are seldom associated with pharmacokinetic drug-drug interac-tions. Vildagliptin has a half-life of 2.8 hours and generates several metabolitesby CYP-independent pathways [47], whereas the mean apparent half-life forplasma sitagliptin is 9–14 hours [48]. In contrast, saxagliptin is oxidised by CYPs3A4 and 3A5 to a major metabolite that is pharmacologically active. Instead, re-nal excretion is the most important elimination pathway for the drugs. It has beenestablished that dose adjustments are recommended for patients with renal im-pairment.
MANAGEMENT OF TYPE 2 DIABETES INADOLESCENTS
The principles of T2DM therapy in adolescents are similar to those in adults, al-though a much more limited range of pharmacological agents are approved andused. Again, lifestyle modification including nutritional components, physical ac-tivity and weight loss are first-line management tools [4]. However, in manyinstances, these are insufficient to meet treatment goals and the addition of phar-macotherapy is needed. In most countries, insulin and metformin are the onlydrugs approved for use in children and adolescents. Sulphonylurea agents are ap-proved in fewer countries, but other agents have generally not yet had adequateappraisal of safety and efficacy in children and adolescents, and are not approved.The treatment options for T2DM in Adolescents and Youth (TODAY) study[49] is a randomised trial evaluating three arms of pharmacological interventionfor T2DM in newly diagnosed T2DM adolescents. It compares the efficacy ofmetformin alone or in combination with rosiglitazone or lifestyle intervention.However, as described earlier, there is increasing concern about emerging serious
A modern epidemic
396

adverse effects of the thiazolidinediones in any age group and it is unlikely theywill have a significant future role. In any case, their known class effect to causeweight gain [50] has always been a disincentive to their use in adolescents.
The choice of initial therapy in T2DM in adolescents depends on the clinicalpresentation including symptoms, severity of hyperglycaemia and presence orabsence of diabetic ketoacidosis. The differentiation of type 1 from type 2 dia-betes is not always clear at presentation in adolescents and T2DM can presentwith ketosis (up to 33%) or ketoacidosis (5%–25%) [51]. In those with severe hy-perglycaemia and/or ketosis/ketoacidosis, initial treatment should always be withinsulin for initial stabilisation and rapid metabolic control, in conjunction withlifestyle measures. Laboratory investigations (particularly type 1 diabetes relatedantibodies and C-peptide) and clinical course will help clarify the diagnosis andit is common practice to add metformin and wean insulin to the point of cessationif possible. Asymptomatic patients will usually have a trial of lifestyle modifica-tion without drug therapy, while those with mild-to-moderate symptoms withoutketosis will usually be treated with metformin in addition to lifestyle modifica-tion [52, 53]. The adequacy of ongoing therapy is judged by a number of clinicalcriteria, but mainly HbA1c <7% and fasting plasma glucose <7 mmol/l.
The proportion of adolescents with T2DM treated with lifestyle modificationalone is reported to be 11%–50% [53]. However, as in adults, failure of therapyincreases with duration. When lifestyle modification alone is inadequate, met-formin is commonly added. Surveys indicate that a substantial proportion ofadolescents with T2DM take metformin (28%–71%) [53]. Metformin is approvedby the FDA and also recommended by the American Diabetes Association andthe International Society for Paediatric and Adolescent Diabetes as the first-linepharmacological agent in adolescents with T2DM. Doses up to a maximum of2000 mg per day are usually recommended [53], divided twice daily, althoughthe whole dose can be taken once a day using an extended release preparationwhich may improve gastrointestinal tolerability and compliance [54]. Metforminis also used as an adjunct to therapy in type 1 diabetes in adolescents with sig-nificant insulin resistance. A recent systematic review [55] (including adults andadolescents) demonstrated reduced insulin requirement with metformin, but noimproved metabolic outcome and no data on cardiovascular outcomes are avail-able.
When lifestyles measures and metformin are inadequate, or metformin is nottolerated or is contraindicated, insulin is added or substituted. Randomised con-trolled trials (RCT) comparing various insulin regimens in T2DM in adolescentsdo not exist, however data from adult experience are generally applicable. A bed-time long-acting insulin analogue is commonly used as initial insulin therapy, buta wide range of other regimens are used according to local preference, includ-ing multiple daily injections. Some guidelines in adults [56] suggest that isophaneinsulin should be used first and insulin analogues reserved for special indica-
18 Current therapies and pharmacy programs for obesity and diabetes
397

tions. However there are some data to suggest lower rates of hypoglycaemia withanalogues [57] and they are favoured as first-line insulin therapy by paediatricendocrinologists [53]. At present, insulin pump therapy is generally not recom-mended in T2DM [58, 59]. This is largely due to the increased intensity and costof therapy, and because targets can often be met with simpler insulin therapy.However lower rates of hypoglycaemia and increased sensitivity to insulin whendelivered by pump are attractive potential benefits.
Drugs other than metformin or insulin for adolescents with T2DM are not ap-proved by regulatory authorities, although surveys indicate significant usage bysome providers [53]. Newer agents such as GLP1 agonists and DPP4 inhibitors[50] may play a future role, especially in more difficult clinical situations.
MANAGEMENT OF OBESITY IN ADOLESCENTSLifestyle intervention through exercise and dietary modification should be theprimary treatment for obesity in children and adolescents; drug therapy should beconsidered a secondary option in refractory situations and usually only in ado-lescents. Family-targeted behavioural and lifestyle intervention programs havebeen shown to have clinically significant benefits [16], although these benefitsare not always sustained. Drug therapy used as an adjunct to lifestyle interventionin adolescents with obesity was analysed in a recent Cochrane review, includingsibutramine, orlistat and metformin [16]. The use of sibutramine (a serotoninand noradrenaline reuptake inhibitor) in adolescents was examined in five stud-ies, with data showing improved BMI over lifestyle alone; adverse events weregreater in sibutramine than placebo-treated adolescents, but with low rates of anyserious adverse events. Subsequently, however, sibutramine has been withdrawnfrom most parts of the world, including the US, Europe and Australia becauseof post-marketing surveillance data which indicated increased risk of myocardialinfarction and stroke in patients with existing cardiovascular disease [60]. In twoavailable RCTs of orlistat (a gastrointestinal lipase inhibitor) in combination withlifestyle measures in adolescents there was also a greater improvement in BMIover placebo; however orlistat-treated patients had a much higher prevalenceof gastrointestinal adverse effects, particularly oily stool evacuation, cramps,abdominal pain and increased defaecation, but also increased asymptomatic gall-stones in one study [61]. While orlistat is still available, in May 2010 the FDAwarned about a possible link with severe liver injury in rare cases [62], and la-belling was revised to include this.
The most relevant drug used as an adjunct to lifestyle measures in adoles-cents with obesity is metformin, a biguanide oral hypoglycaemic agent. Thereare now several studies indicating its safety and efficacy in adolescents with in-sulin resistance and obesity (or prediabetes). In a recent systematic review and
A modern epidemic
398

meta-analysis that included five suitable RCTs [63], metformin was concludedto have moderate efficacy in reducing BMI and insulin in hyperinsulinaemicobese children and adolescents, although no long-term studies were available. Inpooled analysis, metformin reduced BMI by a mean 1.42 mg/m2 which was con-sidered moderate compared to available data on subitramine (–1.66 kg/m2) ororlistat (–0.76 kg/m2) [16]. Gastrointestinal adverse events were more frequentlyreported in those receiving metformin (risk difference 10%–14%), but there wereno serious adverse events. There is a need to further evaluate metformin inlonger-term studies as an adjunct to more intensive lifestyle interventions [64].Even without this further evidence, metformin is commonly used in clinical prac-tice in adolescents with obesity, insulin resistance and other features of metabolicsyndrome because of its favourable safety profile and its established use as phar-macotherapy in T2DM in adolescents.
MANAGEMENT OF OBESITY IN ADULTS ANDCOMMERCIAL PROGRAMS IN AUSTRALIA
There is a wide range of weight-loss programs available including commercialweight-loss programs provided in the pharmacy as well as Jenny Craig andWeight Watchers, internet-based programs, weight-loss products such as mealreplacements available from supermarkets, and community-based weight-man-agement or exercise programs. The Weight Management Council of Australiaprovides a voluntary code of practice for commercial weight-loss companies [65].Although commercial weight-loss programs are very popular, they usually onlyinduce large short-term changes in weight and these changes are mostly transient.There is a need to establish evidence-based practices that demonstrate efficacy,safety and long-term weight maintenance. At this point in time there is very littledata on the efficacy or outcomes of the commercial weight-loss programs in Aus-tralia [75].
Various factors affect an individual’s efforts in terms of short-term weightloss and maintenance [66]. The majority of overweight adults have a history ofprevious weight-loss treatments. A study by Burke et al. (2008) examined in-dividuals’ past experiences with weight-loss treatments [67]. Program featuresidentified as least satisfying included dissatisfaction with diet product (20.4%)and concerns about safety of program or product (17.2%). The most commonreasons for difficulty in successfully losing weight that were identified were dif-ficulty to make and maintain lifestyle change (38%), no time (32.4%) and lackof support (18.5%). Similarly, a study by Jeffery et al. (2004) examined howindividuals’ attitudes about weight-loss efforts change during weight loss [68].Individuals who lost less weight during the six months reported feeling more neg-
18 Current therapies and pharmacy programs for obesity and diabetes
399

ative reactions. Reported satisfaction in relation to weight-loss effort declinedover time, and in the last two months, perceived benefits were approximatelyequal to perceived costs of weight change.
Various studies have shown that superior weight loss occurs when cognitivebehavioural therapy is added to diet and exercise interventions. Health educationis required to facilitate patients making informed choices about their health. Astudy by Swift et al. (2009) showed that intended weight loss and outcomes werepositively associated with health beliefs [69]. The results of this study also sug-gest that healthcare professionals may find it productive to discuss the socialand aesthetic benefits associated with weight management. Cognitive strategiesthat have been identified in weight management include increasing awareness ofnegative thoughts, problemsolving alternatives to negative self-talk and pre-in-tervention strategies such as motivational interviewing and establishing objectiveweight-loss outcomes [70]. Establishing readiness for change via motivationalinterviewing has been shown to predict sustained change efforts in physical exer-cise, dietary change and adherence [70].
In all of these programs there is a need to clarify patients’ expectations forweight-loss outcomes, provide objective and realistic goals, and re-evaluate thesegoals over the course of management.
MANAGEMENT OF TYPE 2 DIABETES ANDOBESITY IN THE HEALTH SYSTEM
There are a variety of effective therapies available and new approaches to betrialled in future. Notwithstanding the availability of effective therapies and treat-ment guidelines, translation of evidence into practice and delivering optimal carerepresents a significant challenge to healthcare systems. Because of the nature ofT2DM and the need for patients to understand and take control of their lifestylein order to reduce their health risk, people with T2DM are especially vulnera-ble and need intensive chronic disease management and ongoing support. From asystems perspective, however, limited patient access to diabetes healthcare pro-fessionals, as a result of personnel shortages [71], especially in rural and remoteareas, and lack of systems to support chronic disease management with continuityof care [72, 73], are well recognised barriers to achieving optimal health outcomesfor diabetes. Hence, there is a need to develop cost-effective innovative modelsof diabetes and weight management care based on more intensive continuity ofcare [74] including self-management support, regular monitoring and follow-up inorder to enable patients to achieve the recommended targets.
A modern epidemic
400

PHARMACISTS IN TYPE 2 DIABETES CAREIn recent years, pharmacists, as highly trained healthcare professionals with ex-pertise in medicines, have sought to develop an expanded role in diabetes careto meet the burgeoning needs of this growing patient population. There arecompelling arguments which support this expanded involvement. Communitypharmacies provide an established and visible network, extending to remote ar-eas, of easily accessible healthcare professionals. Through regular and less formalcontact than that with doctors, pharmacists are able to build strong relationshipswith patients and become a reliable source of information. Pharmacists can alsohave ongoing relationships with other healthcare providers and can serve as the‘bridge’ between healthcare providers and the patients, thus ensuring continuityof care. Therefore visits to the community pharmacy offer an excellent opportu-nity to screen at-risk patients and to provide education and support to diagnosedT2DM patients, particularly if they do not regularly visit a general practitioner(GP) or diabetes educator. In addition, as medications play a key role in prevent-ing the complications of T2DM, ensuring their effectiveness through monitoringand adherence support as well as screening for drug-related problems, is criticalto achieving improved health outcomes.
Specific services that pharmacists have offered patients in T2DM includeopportunistic screening for undiagnosed disease [76], diabetes self-managementeducation, medication-adherence support and medication management such asthe at-home medicines review, ensuring the quality and evidence-based use ofmedications, monitoring clinical outcome measures eg blood glucose levels,blood pressure, lipid levels, and reminding patients of the importance of regularexaminations for diabetic complications [77].
Two recent systematic reviews of the effects of these pharmacist–outpatientinterventions on adults with diabetes mellitus showed significant improvementsin HbA1C for patients in a diverse group of clinical settings and countries. Over-all, the results suggest that pharmacist interventions can reduce long-term costsby improving glycaemic control and thus diminishing future diabetes complica-tions [78, 79].
DIABETES CARE IN AUSTRALIAN PHARMACYIn 1999, a specialised T2DM service, the Diabetes Medication Assistance Service(DMAS), was developed for delivery in Australian community pharmacy. Its fo-cus was on the provision of self-management support through a series of regularvisits with a credentialed pharmacist to assist people with T2DM more effectivelyself-manage their condition and improve their use of medicines. At each visit,the pharmacist tailored the consultation to the individual needs of the patient. By
18 Current therapies and pharmacy programs for obesity and diabetes
401

using motivational interviewing and goal setting, in combination with education,the pharmacist aimed to empower the patient to take better control of their dia-betes [80].
A systematic program of research involving two pilot studies, an RCT and animplementation trial has provided a strong evidence base for the clinical efficacyand cost-effectiveness of the DMAS. The RCT used a multi-site, control versusintervention, repeated measures design within five states in Australia. Fifty-sixcommunity pharmacies, 28 interventions and 28 controls, were randomly selectedfrom a representative sample of urban and rural areas. Intervention pharmaciesdelivered the DMAS to patients with T2DM during the course of five visits to thepharmacy over a period of six months. Control pharmacists assessed patients atbirth and six months and delivered no intervention. A total of 289 patients (149interventions and 140 controls) completed the study. Significantly greater im-provements in glycaemic control were seen in the intervention group compared tothe control, ie a mean reduction in HbA1c of –0.97% (95% CI: –0.8, –1.14) in theintervention group compared with –0.27% (95% CI: –0.15, –0.39) in the controlgroup. Improvements were also seen in blood pressure control and quality of lifein the intervention group. Pharmacists identified a range of interventions (4309for 149 patients) to improve the care and wellbeing of their patients. Monitoringof the progress of the disease and as well as the outcomes of the interventions ap-peared to be the essential element of the disease state management process. Bothpharmacists and patients identified the outstanding benefits of the service and ex-pressed great satisfaction with service provision. The DMAS was shown to becost-effective when compared to other government funded programs [75].
The RCT was followed by a national implementation trial, the Diabetes PilotProgram (DPP) which aimed to answer three further questions regarding theDMAS service: 1) what are the key barriers and facilitators to national imple-mentation of the DMAS service 2) what is the optimal number of pharmacy visitsand 3) what is the sustainability of clinical improvements beyond DMAS ser-vice delivery. A national quota sample of 90 community pharmacies in Australiawere randomly assigned into Group 1 (six-month DMAS) or Group 2 (12-monthDMAS) and subsequently recruited a total of 524 patients. The implementationprocess was carefully tracked with data collected through individual or group in-terviews with 100 patients, 28 pharmacists and 41 GPs at the beginning and atthe end of DMAS to explore their experiences and perceptions of DMAS and toidentify barriers and facilitators. A wide range of clinical (HbA1c, blood pres-sure, lipids) and quality of life outcome measures were assessed.
The results indicated that the DMAS may be successfully implemented indiverse community pharmacy settings providing: 1) the pharmacy has adequatestaff and infrastructure; 2) there are good pharmacist-GP relationships; 3) thepharmacy has a pool of eligible patients; 4) there is effective promotion and in-tegration of the DMAS within the healthcare sector; and 5) there is adequate
A modern epidemic
402

remuneration for service delivery. The clinical outcomes of the implementationtrial mirrored those of the RCT. Both the six-month and 12-month DMAS re-sulted in significant and similar reductions in HbA1c (–0.9; 95% CI:–0.65,–1.12), total cholesterol (–0.3; 95% CI:–0.07, –0.38), triglycerides (–0.3; 95%CI:–0.10, –0.53) and overall ten year CVD risk; moreover the benefits weresustained up to 12 months after the end of the DMAS [81]. The extent and sus-tainability of clinical improvements achieved by the DMAS together with theresulting reduction in cardiovascular risk should translate into future cost savingsto healthcare systems by delaying and reducing diabetes related complications.Collectively these studies support the feasibility and efficacy of community phar-macy T2DM diabetes care in the Australian healthcare setting.
In addition to the effectiveness of pharmacy support for people with T2DM,several studies have also supported the feasibility and efficacy of opportunisticscreening for T2DM in community pharmacy [82, 83, 84]. Community pharmacyprovides a logical site with its established, expansive and visible network of eas-ily accessible health professionals, able to access a broad population who areapparently healthy and who rarely come into contact with GPs or nurses.
WEIGHT-MANAGEMENT PROGRAMS INCOMMUNITY PHARMACY
In the context of weight management in the UK, the government recognised thecontribution that pharmacy can make in managing the obesity epidemic in thewhite paper Pharmacy in England [85]. In doing so, pharmacy contract nego-tiators recommended a government-funded national weight-management serviceinitiative in community pharmacies [86].
Several other studies have illustrated that community pharmacists’ involve-ment in weight-loss programs has been associated with successful weight loss. Astudy in Denmark reported the results of ‘slimming courses’ held at 19 commu-nity pharmacies for 269 obese patients [87]. Average weight loss was 5.3 kg forfemales and 6.2 kg for males. At one year follow-up 20% of the patients who hadcompleted the course had maintained a weight loss of greater than five kilograms[87]. Community pharmacists could play a key role in providing holistic weight-loss programs and collaborating with healthcare professionals, rather than beingseen as product suppliers [88].
A recent Pharmacy Pulse survey showed that more than 17% of pharmaciesin Australia want to be known as a destination for a weight-loss solution [89].In 2003, the National Pharmacy Database Project reported that 8.7% of 1131Australian community pharmacies surveyed conducted weight-management pro-grams by trained staff [90]. At present, the majority of commercial weight-lossprograms are based on very low-calorie diets that are mostly achieved by meal
18 Current therapies and pharmacy programs for obesity and diabetes
403
replacement shakes and soups. Other factors necessary for weight change such asincreased physical activity are supplementary to the weight-loss product and usedto augment the product specifically. Most programs provide ongoing support ei-ther by in-store consultants, a website or telephone support services.
LifeweightTM was the first nationally released weight-management programspecifically designed for community pharmacy. The program combines the prod-uct Xenical® (orlistat) with pharmacist-delivered cognitive services to provide aholistic package [75].
It was launched in 2004, following the decision to down schedule Xenical®(orlistat) from a prescription to pharmacist-only medication. The program wasdeveloped in collaboration with the Pharmacy Guild of Australia, the Pharmaceu-tical Society of Australia, the Australian Institute of Pharmacy Management andRoche, the manufacturers of Xenical®. Training programs and resources weremade available for pharmacists and pharmacy assistants to increase their skillsin delivering the program. Content of the program is comprehensive and wellstructured, based on evidence-based material and is aligned with National Healthand Medical Research Council guidelines [75]. Baseline and longitudinal patientdata is collected including age, weight, body mass index, target weight, mea-sured progress to target, final weight on completion of or withdrawal from theprogram. Adoption and uptake of LifeweightTM in community pharmacies hasdeclined in recent times, as both consumers and pharmacists have articulated aneed for a well-planned, accredited, community pharmacy-based, remuneratedservice that would deliver a more comprehensive collaborative service [91]. Sucha service would ideally not be based on a product but a wholistic, evidence-based program. This would allow for increased numbers of overweight and obeseAustralians to have access to a consistent, evidence-based, integrated health-care weight-management program. Improvement in health for the overweight andobese, and better management of diabetes, hypertension, hypercholesterolemiaand other obesity-related health issues would be the outcome. This would resultin decreased costs to the healthcare system due to reduced mortality and morbid-ity attributed to the overweight and obese Australian population.
CONCLUSIONInnovation of service delivery is critical to address the burgeoning problems ofT2DM, obesity and related diseases. The complications of these diseases place aconsiderable burden on the healthcare system.
The review of available pharmacotherapy for T2DM and obesity shows thatthere is considerable inter-individual variation in response to the various drugclasses and the reasons for this are currently under investigation. In adolescents
A modern epidemic
404

and children the approach to therapy is not merely a reflection of recommenda-tions for adults. In terms of support for pharmacotherapy and lifestyle interven-tions, community pharmacy programs have provided evidence of effectiveness inT2DM, however at this point in time support for weight-loss programs has beeninhibited by the focus on individual commercial products. Nevertheless, commu-nity pharmacists are a valuable resource of trained healthcare professionals thatshould be utilised to provide diabetes and obesity prevention and care services aspart of an integrated primary care sector approach.
ACKNOWLEDGEMENTSThe authors would like to thank Kate LeMay for her careful editing of this chap-ter.
References1. Australian Institute of Health and Welfare (2011). Diabetes [Online]. Avail-
able: www.aihw.gov.au/diabetes/ [Accessed 2 June 2011].2. Diabetes Australia Victoria (2008). Diabetes facts [Online]. Available:
www.diabetesvic.org.au/health-professionals/diabetes-facts [Accessed 2June 2011].
3. Colagiuri S, Colagiuri R, Conway B, Grainger D & Davey P (2003).DiabCo$t Australia: assessing the burden of type 2 diabetes in Australia.Diabetes Australia, Canberra [Online]. Available:www.australiandiabetescouncil.com/AustralianDiabetesCouncil/media/PDFs/diabcost_finalreport.pdf [Accessed 2 June 2011].
4. Rosenbloom AL, Silverstein JH, Amemiya S, Zeitler P & KlingensmithGJ (2009). Type 2 diabetes in children and adolescents. Pediatric Diabetes,10(12): 17–32.
5. Han JC, Lawlor DA & Kimm SY (2010). Childhood obesity. The Lancet,375(9727): 1737–48.
6. World Health Organization (2006). Obesity and overweight fact sheet No311 [Online]. Available: www.who.int/mediacentre/factsheets/fs311/en/in-dex.html [Accessed 23 May 2010].
7. Australian Bureau of Statistics (2009). National health survey: summary ofresults, 2007–08. Canberra: Australian Bureau of Statistics.
18 Current therapies and pharmacy programs for obesity and diabetes
405

8. National Preventative Health Task Force (2009). Australia: the healthiestcountry by 2020. The report of the National Preventative Health Strategy:the roadmap for action. Including addendum for October 2008 to June 2009[Online]. Available: www.health.gov.au/internet/preventativehealth/publish-ing.nsf/Content/tech-obesity [Accessed 5 September 2011].
9. House of Representatives Standing Committee on Health and Ageing(2009). Weighing it up: obesity in Australia. Canberra: Commonwealth ofAustralia.
10. World Health Organization (2000). WHO Technical Report Series 894.Obesity: preventing and managing the global epidemic. Report of a WorldHealth Organization consultation. Geneva: World Health Organization.
11. Australian Institute of Health and Welfare (2008). Australia’s health 2008Cat. no. AUS 99. Canberra: Australian Institute of Health and Welfare.
12. National Health and Medical Research Council (2003). Clinical practiceguidelines for the management of overweight and obesity in adults. Can-berra: Commonwealth of Australia.
13. UK Prospective Diabetes Study (UKPDS) Group (1998). Intensive blood-glucose control with sulphonylureas or insulin compared with conventionaltreatment and risk of complications in patients with type 2 diabetes (UKPDS33). The Lancet, 352(9131): 837–53.
14. Patel A, Group AC, MacMahon S, Chalmers J, Neal B, Woodward M, etal. (2007). Effects of a fixed combination of perindopril and indapamide onmacrovascular and microvascular outcomes in patients with type 2 diabetesmellitus (the ADVANCE trial): a randomised controlled trial. The Lancet,370(9590): 829–40.
15. Del Prato S (2009). Megatrials in type 2 diabetes: from excitement to frus-tration? Diabetologia, 52(7): 1219–26.
16. Oude Luttikhuis H, Baur L, Jansen H, Shrewsbury VA, O’Malley C, StolkRP & Summerbell CD (2009). Interventions for treating obesity in children.Cochrane Database of Systematic Reviews, 2009(1):CD001872.
17. Diabetes Australia (2011). Diabetes management in general practice. 17thedn 2011–12 [Online]. Available: www.racgp.org.au/guidelines/diabetes[Accessed 27 July 2011].
18. Seino S (1999). ATP-sensitive potassium channels: a model of heteromulti-
A modern epidemic
406

meric potassium channel/receptor assemblies. Annual Review of Physiology,61(88): 337–62.
19. Yokoshiki H, Sunagawa M, Seki T & Sperelakis N (1998). ATP-sensitiveK+ channels in pancreatic, cardiac, and vascular smooth muscle cells. Amer-ican Journal of Physiology, 274(1 Pt 1): C25–37.
20. Meyer M, Chudziak F, Schwanstecher C, Schwanstecher M & Panten U(1999). Structural requirements of sulphonylureas and analogues for interac-tion with sulphonylurea receptor subtypes. British Journal of Pharmacology,128(1): 27–34.
21. Modi P (2007). Diabetes beyond insulin: review of new drugs for treatmentof diabetes mellitus. Current Drug Discovery Technologies, 4(1): 39–47.
22. Lehmann JM, Moore LB, Smith-Oliver TA, Wilkison WO, Willson TM &Kliewer SA (1995). An antidiabetic thiazolidinedione is a high affinity lig-and for peroxisome proliferator-activated receptor gamma (PPAR gamma).Journal of Biological Chemistry, 270(22): 12953–956.
23. Zhou G, Myers R, Li Y, Chen Y, Shen X, Fenyk-Melody J, et al. (2001).Role of AMP-activated protein kinase in mechanism of metformin action.Journal of Clinical Investigation, 108(8): 1167–74.
24. Campbell RK (2011). Clarifying the role of incretin-based therapies in thetreatment of type 2 diabetes mellitus. Clinical Therapeutics, 33(5): 511–27.
25. Campbell LK, White JR & Campbell RK (1996). Acarbose: its role inthe treatment of diabetes mellitus. Annals of Pharmacotherapy, 30(11):1255–62.
26. Pevrot M, Rubin RR, Lauritzen T, Skovlund SE, Snoek FJ, Matthews DR,et al. (2005). Resistance to insulin therapy among patients and providers. Di-abetes Care, 28(11): 2673–79.
27. Nathan DM, Buse JB, Davidson MB, Ferrannini ELE, Holman RR, SherwinR, et al. (2009). Medical management of hyperglycaemia in type 2 diabetes:a consensus algorithm for the initiation and adjustment of therapy. A con-sensus statement of the American Diabetes Association and the EuropeanAssociation for the Study of Diabetes. Diabetes Care, 32(1): 193–203
28. Colagiuri S, Dickinson S, Girgis S & Colagiuri R (2009). National evidence-based guidelines for blood glucose control in type 2 diabetes. Canberra:Diabetes Australia and the NHMRC.
18 Current therapies and pharmacy programs for obesity and diabetes
407

29. Kirchheiner J, Roots I, Goldammer M, Rosenkranz B & Brockmöller J(2005). Effect of genetic polymorphisms in cytochrome P450 (CYP) 2C9and CYP2C8 on the pharmacokinetics of oral antidiabetic drugs: clinical rel-evance. Clinical Pharmacokinetics, 44(12): 1209–25.
30. Bidstrup TB, Bjørnsdottir I, Sidelmann UG, Thomsen MS & Hansen KT(2003). CYP2C8 and CYP3A4 are the principal enzymes involved in thehuman in vitro biotransformation of the insulin secretagogue repaglinide.British Journal of Clinical Pharmacology, 56(3): 305–14.
31. Hussein Z, Wentworth JM, Nankervis AJ, Proietto J & Colman PG (2004).Effectiveness and side effects of thiazolidinediones for type 2 diabetes:real-life experience from a tertiary hospital. Medical Journal of Australia,181(10): 536–39.
32. Niemi M, Backman JT & Neuvonen PJ (2004). Effects of trimethoprimand rifampin on the pharmacokinetics of the cytochrome P450 2C8 substraterosiglitazone. Clinical Pharmacology and Therapeutics, 76(3): 239–49.
33. Jaakkola T, Laitila J, Neuvonen PJ & Backman JT (2006). Pioglitazoneis metabolised by CYP2C8 and CYP3A4 in vitro: potential for interactionswith CYP2C8 inhibitors. Basic and Clinical Pharmacology and Toxicology,99(1): 44–51.
34. US Food and Drug Administration (2010). FDA significantly restricts ac-cess to the diabetes drug Avandia [Online]. Available: www.fda.gov/Drugs/DrugSafety/PostmarketDrugSafetyInformationforPatientsandProviders/ucm226956.htm [Accessed 27July 2011].
35. Therapeutics Goods Administration (2010). Rosiglitazone (Avandia/Avan-damet). Advisory statement [Online]. Available: www.tga.gov.au/safety/alerts-medicine-rosiglitazone-100924.htm [Accessed 27 July 2011].
36. US Food and Drug Administration (2010). Actos (pioglitazone): ongoingsafety review. Potential increased risk of bladder cancer [Online]. Available:www.fda.gov/Safety/MedWatch/SafetyInformation/SafetyAlertsforHumanMedicalProducts/ucm226257.htm [Accessed 27 July2011].
37. US Food and Drug Administration (2010). Rezulin (troglitazone). [Online].Available: www.fda.gov/Safety/MedWatch/SafetyInformation/
A modern epidemic
408

SafetyAlertsforHumanMedicalProducts/ucm173081.htm [Accessed 27 July2011].
38. Graham GG, Punt J, Arora M, Day RO, Doogue MP, Duong JK, et al.(2011). Clinical pharmacokinetics of metformin. Clinical Pharmacokinetics,50(2): 81–98.
39. Amori RE, Lau J & Pittas AG (2007). Efficacy and safety of incretin therapyin type 2 diabetes. Journal of the American Medical Association, 298(2):194–206.
40. Laukkanen O, Pihlajamäki J, Lindström J, Eriksson J, Valle TT, HämäläinenH, et al. (2004). Polymorphisms of the SUR1 (ABCC8) and Kir6.2 (KCN-J11) genes predict the conversion from impaired glucose tolerance to type2 diabetes: the Finnish diabetes prevention study. Journal of Clinical En-docrinology and Metabolism, 89(12): 6286–90.
41. Hasstedt SJ, Ren QF, Teng K & Elbein SC (2001). Effect of the peroxisomeproliferator-activated receptor-g2 pro12Ala variant on obesity, glucosehomeostasis, and blood pressure in members of familial type 2 diabetic kin-dreds. Journal of Clinical Endocrinology and Metabolism, 86(2): 536–41.
42. Chang SC, Rashid A, Gao YT, Andreotti G, Shen MC, Wang BS, et al.(2008). Polymorphism of genes related to insulin sensitivity and the risk ofbiliary tract cancer and biliary stone: a population-based case-control studyin Shanghai, China. Carcinogenesis, 29(5): 944–48.
43. Fujii N, Ho RC, Manabe Y, Jessen N, Toyoda T, Holland WL, et al. (2008).Ablation of AMP-activated protein kinase a2 activity exacerbates insulin re-sistance induced by high-fat feeding of mice. Diabetes, 57(11): 2958–66.
44. Spencer-Jones NJ, Ge D, Snieder H, Perks U, Swaminathan R, SpectorTD, et al. (2006). AMPkinase a2 subunit gene PRKAA2 variants are associ-ated with total cholesterol, low-density lipoproteincholesterol and high-den-sity lipoprotein-cholesterol in normal women. Journal of Medical Genetics,43(12): 936–42.
45. Xu M, Li X, Wang JG, Du P, Hong J, Gu W, et al. (2005). Glucose and lipidmetabolism in relation to novel polymorphisms in the 5’-AMP-activated pro-tein kinase g2 gene in Chinese. Molecular Genetics and Metabolism, 86(3):372–78.
46. Beiborn M, Worrall CI, McBride EW & Kopin AS (2005). A human
18 Current therapies and pharmacy programs for obesity and diabetes
409

glucagon-like peptide-1 receptor polymorphism results in reduced agonistresponsiveness. Regulation Peptides, 130(1–2): 1–6.
47. Tran HH, Smith PYH, Batard H, Wang Y, Einolf L, Gu H, et al. (2009). Ab-sorption, metabolism, and excretion of [14C]vildagliption, a novel dipeptifulpeptidase 4 inhibitor, in humans. Drug Metabolism & Disposition, 37(3):536–44.
48. Herman GA, Mistry GC, Bergman YB, Wang AQ, Zeng W, Chen L, etal. (2011). Evaluation of pharmacokinetic parameters and dipeptidyl pep-tidase-4 inhibition following single doses of sitagliptin in healthy, youngJapanese males. British Journal of Clinical Pharmacology, 71(3): 429–36.
49. Zeitler P, Epstein L, Grey M, Hirst K, Kaufman F, Tamborlane W, et al.(2007). Treatment options for type 2 diabetes in adolescents and youth: astudy of the comparative efficacy of metformin alone or in combination withrosiglitazone or lifestyle intervention in adolescents with type 2 diabetes. Pe-diatric Diabetes, 8(2): 74–87.
50. Waugh N, Cummins E, Royle P, Clar C, Marien M, Richter B, et al. (2010).Newer agents for blood glucose control in type 2 diabetes: systematic reviewand economic evaluation. NIHR Health Technology Assessment Journal,14(36): 1–248.
51. American Diabetes Association (2000). Type 2 diabetes in children and ado-lescents. Diabetes Care, 23(3): 381–89.
52. Laffel L & Svoren BM (2011). Management of type 2 diabetes in childrenand adolescents. UpToDate Inc [Online]. Available: www.uptodate.com/contents/management-of-type-2-diabetes-mellitus-in-children-and-adoles-cents?source=search_result&selectedTitle=1~150 [Accessed 17 June 20112011].
53. Flint A & Arslanian S (2011). Treatment of type 2 diabetes in youth. Dia-betes Care, 34(Suppl. 2): S177–83.
54. Jabbour S & Ziring B (2011). Advantages of extended-release metforminin patients with type 2 diabetes mellitus. Postgraduate Medicine, 123(1):15–23.
55. Vella S, Buetow L, Royle P, Livingstone S, Colhoun HM & Petrie JR(2010). The use of metformin in type 1 diabetes: a systematic review of effi-cacy. Diabetologia, 53(5): 809–20.
A modern epidemic
410
56. Adler AI, Shaw EJ, Stokes T & Ruiz F (2009). Newer agents for blood glu-cose control in type 2 diabetes: summary of NICE guidance. British MedicalJournal, 338: b1668.
57. Nathan DM, Buse JB, Davidson MB, Heine RJ, Holman RR, Sherwin R, etal. (2006). Management of hyperglycemia in type 2 diabetes: a consensus al-gorithm for the initiation and adjustment of therapy. A consensus statementfrom the American Diabetes Association and the European Association forthe Study of Diabetes. Diabetes Care, 29(8): 1963–72.
58. Cummins E, Royle P, Snaith A, Greene A, Robertson L, McIntyre L, etal. (2010). Clinical effectiveness and cost-effectiveness of continuous sub-cutaneous insulin infusion for diabetes: systematic review and economicevaluation. NIHR Health Technology Assessment Journal, 14(11): iii–iv,xi–xvi, 1–181.
59. Kirk SE (2003). Insulin pump therapy for type 2 diabetes. Current DiabetesReports, 3(5): 373–77.
60. US Food and Drug Administration (2010). Meridia (sibutramine): marketwithdrawal due to risk of serious cardiovascular events [Online]. Available:www.fda.gov/safety/medwatch/safetyinformation/safetyalertsforhumanmedicalproducts/ucm228830.htm [Accessed 17 June2011].
61. Chanoine JP, Hampl S, Jensen C, Boldrin M & Hauptman J (2005). Effectof orlistat on weight and body composition in obese adolescents: a random-ized controlled trial. Journal of the American Medical Association, 293(23):2873–83.
62. US Food and Drug Administration (2010). Orlistat (marketed as Alli andXenical): labeling change [Online]. Available: www.fda.gov/Safety/Med-Watch/SafetyInformation/SafetyAlertsforHumanMedicalProducts/ucm213448.htm [Accessed 17 May2011].
63. Park MH, Kinra S, Ward KJ, White B & Viner RM (2009). Metforminfor obesity in children and adolescents: a systematic review. Diabetes Care,32(9): 1743–45.
64. Garnett SP, Baur LA, Noakes M, Steinbeck K, Woodhead HJ, Burrell S, etal. (2010). Researching effective strategies to improve insulin sensitivity in
18 Current therapies and pharmacy programs for obesity and diabetes
411

children and teenagers: RESIST. A randomised control trial investigating theeffects of two different diets on insulin sensitivity in young people with in-sulin resistance and/or pre-diabetes. BMC Public Health, 10: 575.
65. Weight Management Council Australia (2005). Weight management code ofpractice. 3rd edn. East Melbourne: Weight Management Council AustraliaLimited.
66. Elfhag K & Rossner S (2005). Who succeeds in maintaining weight loss?A conceptual review of factors associated with weight loss maintenance andweight regain. Obesity Reviews, 6(1): 67–85.
67. Burke LE, Steenkiste A, Music E & Styn MA (2008). A descriptive studyof past experiences with weight-loss treatment. Journal of American DieteticAssociation, 108(4): 640–47.
68. Jeffery RW, Kelly KM, Rothman AJ Sherqood NE & Boutelle KN (2004).The weight loss experience: a descriptive analysis. Annals of BehavioralMedicine, 27(2): 100–06.
69. Swift JA, Glazebrook C, Anness A & Goddard R (2009). Obesity-relatedknowledge and beliefs in obese adults attending a specialist weight-manage-ment service: implications for weight loss over 1 year. Patient Education andCounseling, 71(1): 70–76.
70. Van Dorsten B & Lindley EM (2008). Cognitive and behavioral approachesin the treatment of obesity. Endocrinology & Metabolism Clinics of NorthAmerica, 37(4): 905–22.
71. Burge MR, Lucero S, Rassam AG & Schade DS (2000). What are the bar-riers to medical care for patients with newly diagnosed diabetes mellitus?Diabetes, Obesity and Metabolism, 2: 351–54.
72. Georgiou A, Burns J, McKenzie S, Penn D, Flack J & Harris MF (2006).Monitoring change in diabetes care using diabetes registers: experience fromdivisions of general practice. Australian Family Physician, 35(1–2): 77–80.
73. Proudfoot J, Infante F, Holton C, Powell-Davies G, Bubner T, Beilby J, etal. (2007). Organisational capacity and chronic disease care: an Australiangeneral practice perspective. Australian Family Physician, 36(4): 193–288.
74. Dennis SM, Zwar N, Griffiths R, Roland M, Hasan I, Powell Davies G, etal. (2008). Chronic disease management in primary care: from evidence topolicy. Medical Journal of Australia, 188(Suppl. 8): S53–S56.
A modern epidemic
412

75. Rieck A, Clifford R & Everett A (2006). Community pharmacy weight man-agement project (Stages 1 and 2). Crawley: University of Western Australia.
76. Krass I & Armour CL (2011). Preventing disease: screening in the phar-macy. In Krska J (Ed). Pharmaceutical public health (pp221–44). London:Pharmacy Press.
77. Krass I, Armour CL, Mitchell B, Brillant M, Dienaar R, Hughes J, et al.(2007). The Pharmacy Diabetes Care Program: assessment of a communitypharmacy diabetes service model in Australia. Diabetic Medicine, 24(6):677–83
78. Wubben DP & Vivian EM (2008). Effects of pharmacist outpatient interven-tions on adults with diabetes mellitus: a systematic review. Pharmacother-apy, 28(4): 421–36.
79. George PP, Molina JA, Cheah J, Chan SC & Lim BP (2010). The evolvingrole of the community pharmacist in chronic disease management: a litera-ture review. Annals of the Academy of Medicine Singapore, 39(11): 861–67.
80. Mitchell B, Armour C, Lee M, Song YJ, Stewart K, Peterson G, et al.(2011). Diabetes medication assistance service: the pharmacist’s role in sup-porting patient self-management of type 2 diabetes (T2DM) in Australia.Patient Education and Counseling, 83(3): 288–94.
81. Krass I, Mitchell B, Song YJ, Stewart K, Peterson G, Hughes J, et al. (2011).Diabetes medication assistance service stage 1: impact and sustainability ofglycaemic and lipids control in patients with Type 2 diabetes. Diabetic Med-icine, 28(8): 987–93.
82. Hourihan F, Krass I & Chen TC (2003). Rural community pharmacy: a fea-sible site for a health promotion and screening service for cardiovascular riskfactors. Australian Journal of Rural Health, 11(1): 28–35.
83. Hersberger KE, Botomino A, Mancini M & Bruppacher R (2006). Sequen-tial screening for diabetes: evaluation of a campaign in Swiss communitypharmacies. Pharmacy World & Science, 28(3): 171–79.
84. Krass I, Mitchell B, Clarke P, Brillant M, Dienaar R, Hughes J, et al. (2007).Pharmacy Diabetes Care Program: analysis of two screening methods forundiagnosed type 2 diabetes in Australian community pharmacy. DiabetesResearch and Clinical Practice, 75(3): 339–47.
85. Department of Health (2008). Pharmacy in England: building on strengths
18 Current therapies and pharmacy programs for obesity and diabetes
413

– delivering the future. London: HM Government.86. Blenkinsopp A, Anderson C & Armstrong M (2010). Community phar-
macy’s contribution to improving the public’s health: the case of weightmanagement. International Journal of Pharmacy Practice, 16(3): 123–25.
87. Toubro S DI, Hermansen I, Herborg H & Astrup A (1999). Dietary guide-lines on obesity at Danish pharmacies: results of a 12-week course with a1-year follow-up. Ugeskrift for Laeger, 161(38): 5308–13.
88. Maryon-Davis A (2005). Weight management in primary care: how can it bemade more effective? Proceedings of the Nutrition Society, 64(1): 97–103.
89. Offord L (2009). Turning losses into healthy gains. Australian Journal ofPharmacy, 90(1065): 42–44, 46.
90. Berbatis CG, Sunderland VB, Mills CR & Bulsara M (2003). National Phar-macy Database Project. Perth: Curtin University of Technology of WesternAustralia.
91. Offord L (2006). Lifeweight’s just like losing weight: stick to the program(The Lifeweight weight loss program). The Australian Journal of Pharmacy,87: 30–33.
A modern epidemic
414
19Diabetes healthcare strategies tocope with the growing epidemic
Marg McGill1, 2, 3 and Jane Overland1, 2
Globally, the spectrum of diabetes services varies from a single healthcareprovider working in an isolated community setting, to small groups of pri-mary care doctors and nurses working in health centres or district hospitals,through to highly sophisticated tertiary units in major urban areas with ac-cess to a range of specialists, nurses and other diabetes team members. Inthis chapter we explore how diabetes care may be best delivered at thesevarious levels, taking into consideration political, cultural and economicenvironments. Not every case of diabetes can be looked after at the com-munity level. Likewise, not every case of diabetes can be looked after at thespecialist level. How to support and balance these two services to optimisehealthcare delivery for the total community of people with diabetes, is oneof the most important questions in organising diabetes care.
Diabetes care is becoming a priority for health systems as costs and health out-comes are being closely scrutinised. Traditional health systems are designed toprovide symptom-driven responses to acute illnesses. Consequently, they arepoorly configured to meet the needs of the chronically ill. Simply seeing moreand more patients within the traditional model will lead to shorter consultationsthat can only focus on a quick review of blood glucose and providing a prescrip-tion. Models of care that are focused on outcomes and prevention of acute andchronic complications have been developed and proposed as viable alternativesto current care systems to address these problems.
Globally, the spectrum of diabetes services varies from a single healthcareprovider working in an isolated community setting, to small groups of primarycare doctors and nurses working in clinics, health centres or district hospitals,
1 Diabetes Centre, Royal Prince Alfred Hospital.2 Sydney Nursing School, University of Sydney.3 Central Clinical School, University of Sydney.
415

through to highly sophisticated tertiary units in major urban areas with accessto a range of specialist physicians, nurses and other diabetes team members. Inthis chapter we explore how diabetes care may be best delivered at these vari-ous levels. Not every case of diabetes can be looked after at the community level.Likewise, not every case of diabetes can be looked after at the specialist level.How to support and balance these two extremes is one of the most importantquestions in organising diabetes care in Australia today. Irrespective of where di-abetes care is being provided along the healthcare delivery continuum, servicesbased on the chronic care model (CCM) [1] help healthcare systems provide moreclinically effective and cost-efficient care.
THE CHRONIC CARE MODELThe CCM provides a paradigm shift from our current model of healthcare de-livery, to a system that is prevention based and focused on avoiding long-termproblems, including diabetes complications [2]. Due to its multi-faceted nature,quality diabetes care requires an integration of the person with diabetes into ahealth system that promotes long-term management. [3]. Unlike acute illnesses,diabetes encompasses behavioural, psychosocial, psychological, environmentaland clinical factors, all of which require team-based support from a variety ofhealthcare disciplines [4, 5, 6]. The premise of the model is that quality diabetescare is not delivered in isolation, but with community resources, delivery sys-tem design, decision support and clinical information systems working in tandemleading to productive interactions between a proactive practice team and preparedactivated patient [2]. Indeed, in a recent meta-analysis by Shojania et al. [7], thestrategy most effective in improving diabetes care, as measured by HbA1c (gly-cated haemoglobin), is multi-disciplinary team-based care, a fundamental featureof the chronic care model. Other key elements of this model include:
1. Healthcare organisation – this provides the structural foundation (philosoph-ically and literally) upon which the remaining four components of the CCMrely. Diabetes service providers who are able to gain the support of theirhealth system and organisation are more likely to facilitate and sustain theirprograms.
2. Community resources and policies – provide individuals with diabetes, theircaregivers, service providers with a variety of ancillary services that providesupport for self-management.
3. Decision support – uses expertise to establish evidence-based clinical prac-tice guidelines, standards and protocols which provide a framework to assurequality and consistency.
4. Self-management – engages the patient in the active self-management oftheir condition.
A modern epidemic
416

5. Clinical information systems – are necessary for collecting and housingtimely, useful data about individual patients and populations of patients, us-ing tools such as patient registries and databases. Diabetes service providersnot only need to rely on information systems for patient monitoring, but to alarger extent for tracking and reporting data for practice and system’s reportsand feedback.
6. Delivery system design – affords opportunities to restructure practices tofacilitate team care and define team roles, and delegates tasks such as explo-ration of reconfiguring the delivery of care in primary care, community clinicand hospital settings.
DIABETES IN PRIMARY CAREPrimary care in the community forms an integral part of healthcare and is the firstlevel of contact for the majority of people with diabetes. The sheer number ofpeople with diabetes would dictate this to be a necessity. How we improve dia-betes care at this level is therefore a matter of great importance.
Worldwide, primary care is usually provided by a doctor, acting alone andalmost invariably also treating many other diseases. In many ways, diabetes isjust a condition that the patient ‘happens to have’ and its management can be sur-reptitiously relegated to a lesser role than the clinical problem of the day. Variousattempts have been made to overcome these issues and it is beyond the scope ofthis chapter to outline them all, but some examples will be mentioned here. Inthe UK, a ‘mini-diabetes clinic’ has been promoted within the auspices of generalpractice. Doctors are rewarded if the percentage of their diabetic patients reach-ing a target HbA1c level exceeds a predefined requirement.
In Australia, general practice is the mainstream of the primary care system,and is supported by a single government-controlled universal health insurancefund, Medicare. Together with the public hospital system and community healthcentres, the Medicare program provides non-user-pays access to medical servicesfor all residents. Under this program the majority of medical practitioner servicesare funded on a Medicare fee-for-service basis and access to most specialistservices is dependent on referral from a general practitioner. As such, generalpractitioners have always played an important role in managing people withchronic disease such as diabetes. A novel study in the late 1990s, which usedMedicare data to look at health service utilisation for the population of NewSouth Wales (NSW), showed that people with diabetes saw their general practi-tioners nearly twice as often as their non-diabetes counterparts [8].
Regardless of where care is provided, effective management of diabetes re-quires scheduled and regular patient visits for monitoring diabetes, detectingcomplications, adjusting medications, negotiating lifestyle changes and providing
19 Diabetes healthcare strategies to cope with the growing epidemic
417

ongoing support; such visits are a critical element to successful outcomes. Untilrecently this level of care was not supported by general practitioner fundingarrangements. There were also issues in relation to accessing non-medical health-care professionals, who are well recognised as integral to diabetes healthcareteams. Access to a multidisciplinary team was only offered by hospitals, fundedby state governments, and services provided by nursing and allied health pro-fessionals outside this setting were not covered by Medicare. As such, fundingsupported one-to-one medical service provision rather than multidisciplinarycare.
However, in the last decade, Australian healthcare reform has seen a plethoraof new Medicare benefits to support chronic disease management at the primarycare level. In terms of diabetes, this reform provided funding to support generalpractitioners complete a diabetes annual cycle of care (DACC). As outlined inTable 1, the DACC encompasses routine measurement of glycaemic control andmacrovascular risk factor parameters, assessment for diabetes-related eye, kid-ney and foot disease, and lifestyle education. It also includes medication review.In general, completion of the DACC requires the person with diabetes to attendmultiple appointments with their general practitioner as well as, where indicated,appointments with specialists, diabetes educators, allied health professionals andlaboratories. This can be inconvenient to the patient, so there is a risk that not allactivities within the DACC are completed. To lessen this risk Medicare offers ad-ditional funding, as a service incentive payment, for each diabetic patient withina general practice who has completed the full cycle of care within a 13-monthtime frame [8]. This is further supplemented by an outcomes payment based onthe proportion of patients with diabetes within a practice reaching general tar-get levels of care each year [9]. These incentives, while welcomed, put increasedpressure on general practitioners to ensure the delivery of effective primary care.To relieve this pressure, many practices have turned to nurses working in thegeneral practice environment to help coordinate and complete the DACC. To-day it appears these nurses have been accepted unequivocally by the Australianmedical profession as a viable option to augment the services of general prac-titioners, with well over half of general practices in Australia now employingat least one practice nurse, thereby expanding the primary care team. Further tothis, the federal government realised that better planned and coordinated care thatlooked beyond individual episodes of care to a more broad view was required, soMedicare funding of care plans was introduced in 1999.
In 2005 Medicare went a step further and provided a funding basis for teamcare arrangements, designed to enable general practitioners to shift from episodicfragmented care to whole person care that is integrated with other healthcareproviders [10]. Under this initiative reduced fee allied health services (eg podia-try, dietetics, psychological counselling, etc) are available to patients for whom acare plan and team care arrangements have been written.
A modern epidemic
418

Funding of the DACC, care plans and team care arrangements are all in-tended to improve patient outcomes. To date, however, there is a paucity ofpublished evidence that these initiatives have improved patient care, althoughsome improvements in patients with diabetes have been noted [11, 12]. An auditof 230 patients by Zwar et al. in 2007 [12] found that patients were more likelyto be involved in multidisciplinary care for diabetes after a care plan was written(47.8% before versus 63.5% after). Zwar also reported a statistically significantimprovement in HbA1c, systolic and diastolic blood pressure, and total cho-lesterol in these patients. However, as admitted by the authors, some of theimprovements were relatively small and may have been of limited clinical signif-icance. Despite this, we have certainly noted the impact of these health reformsover recent years as an increasing number of patients referred to our DiabetesCentre at Royal Prince Alfred Hospital in Sydney already have a diabetes organcomplication assessment performed in the primary care setting. As a result, dia-betes specialist centres need to reassess their roles to avoid costly duplication ofservices.
Table 1. The diabetes annual cycle of care.
Activity Frequency/description
Assess diabetes control by measuringHbA1c
At least once every cycle
Ensure that a comprehensive eye examina-tion is carried out††
At least once every two years
Measure weight and height and calculatebody mass index (BMI)†††
At least twice every cycle
Measure blood pressure At least twice every cycle
Examine feet†††† At least twice every cycle
Measure total cholesterol, triglycerides andHDL cholesterol
At least once every cycle
Test for microalbuminuria At least once every cycle
Provide self-care education Patient education regarding diabetes man-agement
Review diet Reinforce information about appropriatedietary choices
Review levels of physical activity Reinforce information about appropriate
19 Diabetes healthcare strategies to cope with the growing epidemic
419

levels of physical activity
Check smoking status Encourage cessation of smoking (if rele-vant)
Review of medication Medication review
†† Not required if the patient is blind or does not have both eyes.
††† Initial visit: measure height and weight and calculate BMI as part of the ini-tial assessment. Subsequent visits: measure weight.
†††† Not required if the patient does not have both feet.
Source: Department of Human Services (2011). Practice Incentives Program:Diabetes Incentive Guidelines. Australian Government [Online]. Accessed at:www.medicareaustralia.gov.au/provider/incentives/pip/files/2709-4-diabetes-incentive-guidelines.rtf [Accessed 12 January 2012].
In rural and remote Australia, primary care is often delivered through a system ofhealth centres or clinics. Appropriately supported, these centres can provide rou-tine diabetes management to the majority of people with diabetes within a localarea, but require the ability to refer more complicated cases such as patients withnewly diagnosed type 1 diabetes, or those with an active foot problem. The suc-cess of this approach was evidenced by a randomised cluster trial conducted inthe Torres Strait, located between Australia and Papua New Guinea and inhabitedby Indigenous Australians scattered over a wide area in small communities [14].The study aimed to implement a sustainable system of care by providing basictraining in clinical diabetes care to local Indigenous health workers employed inrandomly selected health centres. The study team also assisted local staff withinthese centres to establish diabetes registers and recall systems, and to developdiabetes care plans. Diabetes specialist outreach services were established con-currently for all health centres within the Torres Strait, and were designed tofacilitate referral and provide care to more complicated patients. It also provideda secondary benefit for local staff to learn up-to-date diabetes management prin-ciples through working alongside the diabetes specialist during visits to the healthcentres. It was found that diabetes care processes improved in all health centresand the intervention sites showed greatest progress, with significant improve-ments in weight, blood pressure and glycaemic control parameters. Moreover,people with diabetes managed by the intervention clinics were 40% less likely tobe admitted to hospital for a diabetes-related condition. Over time, local serviceproviders have assumed increasing responsibility for routine diabetes care, thusensuring sustainability of the service. Similarly, the Royal Prince Alfred Hospi-tal Diabetes Centre has recently established a collaborative partnership with theMaari Ma Health Aboriginal Cooperation in Far Western NSW to assist them
A modern epidemic
420

in providing specialised team-based care within their local community to peoplewith diabetes.
TRADITIONAL SPECIALIST CARE
The hospital clinicIn many urban areas around the world the majority of diabetes care is providedby a hospital, often characterised by a large inpatient unit supported by outpatientclinics. While some hospitals have diabetes-specific outpatient services, manypeople with diabetes are seen within the context of a large general medical clinic.Although specialists are often notionally in charge in this setting and the clinic isconsidered a ‘specialised diabetes clinic’, much of the time the duty of actuallyseeing people with diabetes is delegated to junior and rotating medical staff. Typ-ically, nursing staff undertake process tasks such as preparing medical records,measuring the patient’s height and weight and testing blood glucose levels. Manyof these clinics are not prepared to cope with caring for people with a chronicdisease, and are entrenched with unsuitable systems, often as a result of hospi-tal regulations. For example, providing patients only with a few week’s supplyof medications means that clinics are overwhelmed by people attending to havea prescription written. This ultimately leads to shorter consultation times to copewith increased throughput of clinic attendees. As a consequence, care tends notto be patient-focused nor up-to-date, resulting in poor clinical outcomes.
Whilst these clinics in all likelihood will remain the backbone of specialistdiabetes treatment for many countries, simple policy changes can improve dia-betes care without imposing too much of a cost penalty. An example that canimprove continuity of care is to link the rotating junior doctors’ clinic with thatof a more permanent senior doctor. In that way, patients will see someone famil-iar and if, for example, they have a specific difficult diabetic problem, the juniorrotating doctor can be supervised in its management by the senior consultant. Afurther step that can improve diabetes care within the traditional system is to allo-cate nurses to the specialised position of diabetes educator or diabetes specialistnurse so they can complement and enhance what the doctors provide. For this tobe successful, it is important their roles are separate from that of the clinic nurse,and not just be seen as ‘an additional pair of hands’ to help with routine clinicor ward duties. Rather, they should be employed to provide education regardingself-management principles to either in- or outpatients, or a combination of both.In some cases their role may be fully dedicated to educating patients; however,with further training, the specialist nurse can well provide many areas of diabetesmanagement. These staff can be trained to make clinical decisions about the man-agement of diabetes, including management of glycaemic control, hypertension
19 Diabetes healthcare strategies to cope with the growing epidemic
421

and dyslipidaemia; provide self-management education; and coordinate team ser-vices to meet the patient’s health needs. Utilising nursing staff to provide manyof the routine clinical services is less expensive than using medical staff, andtakes the load from the medical staff so they can concentrate on more complexcases. Indeed, a meta-analysis comparing clinical outcomes from protocol-dri-ven, nurse-led clinics with traditional physician-led clinics has shown care is noworse in a nurse or allied health driven system [15]. However, the success of thisapproach may lie in the careful selection and training of staff. Recognising theadvanced skills of the diabetes specialist nurse, both through a career structureand improved financial incentives, is important to ensure continuity of staff.
Traditional diabetes clinics have often been considered to be antiquated.However, they can be made to work and realistically will likely remain the back-bone of specialist diabetes care worldwide. However, for them to be effective,there are organisational and system issues to which the senior doctor in the clinicmust pay attention, rather than limiting his/her role to a medical one.
Medical specialist diabetes care provided in private practiceIn Australia a system of private specialist diabetes care exists to offer choice andto reduce some of the burden on publicly funded services. Subsidy or insuranceof private health services is available. However, patients may be faced with aco-payment if their diabetes practitioner charges above the subsidised fee. Thesecosts are a major barrier to many patients receiving the level and type of carethey require, particularly when multiple specialists are involved. In the majorityof cases private services are run by solo practitioners and access to support ser-vices provided by allied health professionals can be difficult and also costly. Inmany ways similar to their primary care counterparts, the private specialists facethe same difficulty of providing multidisciplinary care required by some diabeticpatients.
Specialist team-based integrated careSpecialist diabetes care can also be provided in a more integrated and multidis-ciplinary manner, addressing not only glucose control but also complications andcomorbidities of diabetes, involving doctors as well as allied health profession-als. Such integrated care is often conveniently provided at a ‘diabetes centre’, anentity which is distinct from the diabetes clinic. To appreciate the full potentialof such a diabetes centre, it is worthwhile noting its heterogeneous nature. Al-though many facilities may function under the same generic name, they can differquite considerably if one scratches below the surface. Initially, the role of suchdiabetes centres in Australia was to provide diabetes education. For many this re-mains their primary function and hence ‘diabetes education centre’ is perhaps a
A modern epidemic
422

more appropriate name. These education centres have generally been developedto support large diabetes clinics and are usually located separately from wheremedical consultations are made. In this model, clinical care is provided by physi-cians and patient self-management education and support is conducted by otherdiabetes team members. It is a system of care repeated in many countries aroundthe world, and can be highly successful in meeting the clinical, educational andpsychological needs of the person with diabetes and their family.
Toward the other end of the spectrum, a diabetes centre can incorporateclinical activities. In this manner the duties of doctors and other health profes-sionals become more integrated, co-located and co-dependent. This is the modelwe have relied on extensively at Royal Prince Alfred Hospital in Sydney forthe last three decades. Initially, a prime motive of such initiatives was initiationof insulin therapy and stabilisation of diabetes without the need for hospitalisa-tion; in this system duties are largely provided by diabetes nurses but with thebacking of doctors. Over the years more specialised clinical services, such asscreening and management of diabetes complications, diabetic foot disease, dia-betes in pregnancy, neuropathic pain and use of insulin pump treatment have beenprogressively added to the service provided by our Diabetes Centre. In many ofthese activities, the nursing and allied health professionals play such a specialisedrole that the doctor’s function can become a supporting, as well as a supervisory,one. We have found nursing and allied health professionals to be better in theseroles than rotating doctors, if for nothing else because patients appreciate morecontinuity. Conceptually, there is no reason why one single good doctor cannotprovide all these services to his/her patients and we have indeed witnessed somewho were able to do so, but in our experience it is logistically difficult. In manyways, in our system there are many specialists that make up the team but not all ofthem are doctors. This concept of, for example, a nurse being more ‘specialised’in a clinical area of diabetes management than a doctor is sometime difficult fora traditionalist to understand or with which to feel comfortable.
Obviously to provide such specialised services, diabetes centre staff mem-bers require ongoing training which is at one time more specialised and yet alsobroader in scope, identical philosophically to that required by their medical coun-terparts undergoing specialist training.
By its very ‘Rolls Royce’ nature, this type of integrated specialist diabetescare is more resource hungry than diabetes in primary care. By creating such ‘su-per centres’ there will be constant ambivalence between balancing ‘state of theart’ services with providing day-to-day diabetes care to a large number of people.Due to resource constraints, this will always be a problem and it is even worsefor a unit which is dependent on throughput for its funding. This dilemma willnecessitate a rational debate of who needs specialist care.
19 Diabetes healthcare strategies to cope with the growing epidemic
423

LINKING DIABETES CARE BETWEENCOMMUNITY CARE AND SPECIALIST CARE
Many cases of diabetes management can be capably provided at the communitylevel. It therefore makes sense for the majority of patients without complicationsor comorbidities of diabetes to be managed within the community. On the otherhand, patients with more complicated disease warrant referral to the specialists,depending on their individual need. Whilst conceptually sound and obvious, aseamless delivery for such a division of labour is not easy to achieve.
Medicare Locals are a key part of the Labor government’s national healthreform measures in Australia. They will be primary healthcare organisationsworking to make it easier for patients to access the services they need by betterlinking local general practitioners, nursing and other health professionals, hospi-tals and aged care, and maintaining up-to-date local service directories.
Medicare Locals are designed to:
• Improve the patient journey through developing integrated and coordinatedservices
• Provide support to clinicians and service providers to improve patient care• Identify the health needs of local areas and develop locally focused and re-
sponsive services• Successfully implement primary healthcare initiatives and programs• Be efficient and accountable with strong governance and effective manage-
ment systems.
Over time, Medicare Locals will be provided with more flexible funding to targetservices to meet their local community’s specific needs. This could mean, for ex-ample, supporting local diabetes care or anti-smoking activities. Exactly how thiswill be done and what an integrated system of care between Medicare Locals andother health service providers will look like is yet to be determined. Neverthelessit is clear that hospital-based diabetes services will need to be more communityfocused in their outlook. In response to healthcare reform they will need to de-velop and implement communication systems that enhance discussion betweenprimary care and the hospital and offer complementary services to ensure that theindividualised needs of the person with diabetes, their family and their healthcareproviders are met, services are not duplicated and the gaps are filled.
HOW COULD WE IMPROVE SYNERGISMBETWEEN PRIMARY AND SPECIALIST CARE?
A possible solution is the system we have used at the Diabetes Centre of RoyalPrince Alfred Hospital in Sydney. We rely on a Shared Care System to partition
A modern epidemic
424

responsibilities between primary care doctors and ourselves and in 1986 we es-tablished a Complication Assessment Service [16] to underpin such a sharingarrangement. A recent study comparing outcomes of patients cared for under ourmodel with those of patients attending traditional specialist services found thatthe adherence to management guidelines in our shared care model was superior totraditional specialist care. Moreover, a significantly higher proportion of patientsmanaged under the shared care model achieved an HbA1c within 1% of normalrange, and/or a blood pressure at target [17]. This would suggest that the major-ity of patients with the most common form of diabetes known as type 2 diabetes,do not need to see a specialist service in the traditional three to four monthlycycle to receive a similar quality of care. Apart from achieving good endpoints ofglycaemic control and complication detection, this system is more cost-effectivebecause specialists services to ophthalmologist, nephrologist, etc are generallyonly sought when recommended by a diabetes specialist.
It is worth noting a certain approaches can make such a system maximallyeffective. The specialist multidisciplinary team which examined the patients andreported to the primary care doctor at the Diabetes Centre must have good clin-ical skills and judgement in the various diabetes complications. This will allowthe diabetes specialist to provide more precise recommendations about the tim-ing of referrals to other specialists or indeed to provide appropriate treatment ofsome complications. For example, ability of the diabetes specialist to recognisenot only retinopathy in a particular patient but also be confident that it is not vi-sion threatening for the foreseeable future, may appropriately delay the referraluntil later. Another example is the ability to identify the occasional patient withnon diabetes-related neuropathic pain may save many other patients with typicaldiabetes neuropathic pain from unnecessary referral to neurologists.
There are many other approaches to facilitate complementary primary andspecialist diabetes care. For example, we have used telemedicine to make adviceof our foot clinic staff more readily available to communities in rural and remoteAustralia [18].
WHAT ASPECTS OF DIABETES NEED SPECIALISTCARE?
One concern of diabetes healthcare professionals is that the current focus on fund-ing diabetes care at the general practice level may be to the detriment of specialistcare, particularly specialist and tertiary services. As discussed earlier, there arepatients who, due to the nature or severity of their disease, need specialist care.People with type 1 diabetes are a case in point. Both national and internationalguidelines emphasise the critical importance of regular access to a specialist mul-tidisciplinary team for people affected by this type of diabetes, particularly so
19 Diabetes healthcare strategies to cope with the growing epidemic
425

for children and adolescents. Australia has the sixth highest rate of type 1 dia-betes in children and adolescents in the world. Approximately 1000 children aged14 years and younger are diagnosed in Australia each year and this continues toincrease. There is evidence to suggest that this rise is already straining hospitalresources and that increased caseloads on diabetes teams is placing young peoplein jeopardy of not receiving the recommended level of diabetes care. For exam-ple, a recent three-year longitudinal study by Hatherly et al. [19] found that thecare provided to a sample of young people with type 1 diabetes living in the Aus-tralian Capital Territory and NSW fell significantly below recommended levels.Previous Australian research had identified that less than 25% of young peoplewith type 1 diabetes living in the same area had achieved an HbA1c less thanthe recommended 7.5% [20, 21]. Results from the Hatherly study suggest that thenumber of young people achieving the target HbA1c had fallen even lower.
The study also showed that the attendance to healthcare professionals fellbelow what is recommended and declined over the three-year study period. Inter-estingly, where declines were seen, services were mainly provided in the publichospital setting. The authors suggested a number of possible contributing factorsfor this, including under-resourcing of these services. Their hypothesis was sup-ported by the qualitative phase of Hatherly’s study, where participants reporteddifficulties in making appointments especially for nursing and allied health ser-vices due to insufficient staff.
Issues were also raised in relation to accessing specialist care for those peo-ple living in rural areas. In Australia, as with most countries, specialist diabetesservices are predominantly located within major urban centres. To address the is-sue of access, outreach services have been developed to help complement careprovided by rural and regional healthcare providers. Under this ‘shared care’model, endocrinologists from urban centres travel to regional sites around Aus-tralia. People are only seen by these specialists once or twice a year, if lucky, andall other diabetes care is provided by local medical professionals such as generalpractitioners, paediatricians or general physicians. Despite the widespread use ofthis shared-care approach to service delivery, there is a dearth of systematic evi-dence on its impact on diabetes outcomes. A recent study in young people foundno differences with respect to the short-term impact of specialist versus sharedcare on glycaemic control [22]. However data are lacking on the development ofdiabetes complications and non-glycaemic risk factors. Despite this, the results ofthis study suggest that even minimal involvement of a specialist may play a rolein improving health outcomes, an important finding given Australia’s widely dis-persed population.
To rationalise diabetes care, there are many areas which will need decisionsabout who is to do what and at which level. There is no single correct answer tothis as the local situation will influence the decision, but some pertinent examplesand relevant points can be raised.
A modern epidemic
426

For example, emotion would often dictate that the management of gesta-tional diabetes should be at the specialist level. However, the large numbersof woman with this diagnosis now overwhelm diabetes pregnancy clinics. Thisplaces increased pressure on staff and means that women with pre-existing type1 and type 2 diabetes may not get the level of care they need. The morbidity ofgestational diabetes is relatively low in comparison with the type 1 and type 2diabetes. A better use of resources would be to provide the care for woman withgestational diabetes in the community combined with appropriate protocols andguidelines to ensure referral to specialist services as required.
Treatment of diabetic foot disease is another example of how care betweenthe community and the specialist services needs to be carefully partitioned, de-pending on the person’s degree of risk. Guidelines often suggest that all peoplewith diabetes should have their feet assessed and managed by podiatrists. Thiswill place great stress on availability of podiatrists when their service is better di-rected to high-risk individuals, notably those with active foot lesions. It is betterto assign the level of care depending on whether a patient has risk factors of footulceration such as impaired sensation or peripheral circulation and whether thereare active foot lesions. This would allow patients with foot ulceration, severe footinfection and Charcot arthropathy to receive specialised attention that they need.
The care of people with type 1 diabetes is challenging for anyone. They needmore multidisciplinary care and support such as dietary counselling of carbo-hydrate counting or intensive teaching for use of insulin infusion pumps. Theseskills are not readily available in the community. The lower prevalence of type 1diabetes also means that most primary care doctors do not have enough exposureto this group of patients to gain experience. Therefore this group of individualsas adults are probably better managed at the specialist level and when in child oradolescent years, regularly by a specialist paediatrician skilled in diabetes care –usually a paediatric endocrinologist.
There is also the broader (and economically most important) question of whoshould look after the glycaemic control for the majority of people with type 2diabetes. To date, there is a great deal of uncertainty about the optimal line ofdivision between primary care and specialist care, both from medical and eco-nomical points of view.
THE FUTURE: THE WAY FORWARDThe challenge ahead is to organise high-quality diabetes care that is accessibleand affordable to an increasing number of people with diabetes. We need todocument what we do and report outcomes so that effective models, specificto diabetes care in Australia, can be implemented widely. The evidence thatteam-based care provides the best outcomes needs to be embraced broadly, un-
19 Diabetes healthcare strategies to cope with the growing epidemic
427

derpinned by expanding the roles of all health disciplines. If diabetes care is toachieve the healthcare benefits that the diabetes research described in this bookhas made possible, it must be tackled at both the community and specialist levels.In this regard, the complementarity between primary and specialist care plays apivotal role, and a balanced approach is required by healthcare planners.
References1. Wagner EH, Austin BT & Von Korfs M (1996). Improving outcomes in
chronic illness. Managed Care Quarterly, 4(2): 12–25.2. Wagner EH, Grothaus LX, Andhu N, et al. (2001). Chronic care clinics for
diabetes in primary care: a system-wide randomized trial. Diabetes Care, 24:695–700.
3. Wagner EH, Glasgow RE, Davis C, et al. (2001). Quality improvement inchronic illness care: a collaborative approach. Joint Commission Journal onQuality and Patient Safety, 27: 63–80.
4. Siminerio L, Funnell M, Peyrot M & Rubin R (2007). US nurses’ perceptionof their role in diabetes care: results of the cross-national Diabetes, Attitudes,Wishes and Needs (DAWN) study. The Diabetes Educator, 33(1): 152–62.
5. Skovlund SE & Peyrot M (2005). DAWN International Advisory Panel:lifestyle and behavior: The Diabetes Attitudes, Wishes and Needs (DAWN)program: a new approach to improving outcomes of diabets care. DiabetesSpectrum, 18: 136–42.
6. Funnell MM, Peyrot MF, Rubin RR & Siminerio LM (2005). Steering to-ward a new DAWN in diabetes management: using diabetes nurse educatorsin primary care for patient empowerment, psychological support, and im-proved outcomes. The Diabetes Educator, 31(suppl.): 1–18.
7. Shojania K, Ranji SM, McDonald K, et al. (2006). Quality improvementstrategies for type 2 diabetes. Journal of the American Medical Association,296(22): 2681.
8. Department of Human Services (2010). GPII outcomes payment. AustralianGovernment. 19 March [Online]. Available: www.medicareaustralia.gov.au/provider/incentives/gpii/outcome-payments.jsp [Accessed on 31 August2011].
9. Department of Human Services (2010). GPII outcomes payment. Australian
A modern epidemic
428

Government. 19 March [Online]. Available: www.medicareaustralia.gov.au/provider/incentives/gpii/outcome-payments.jsp [Accessed 31 August 2011].
10. Overland J, Yue DK & Mira M (2000). The pattern of diabetes care in NewSouth Wales: a five-year analysis using Medicare occasions of service data.The Australian and New Zealand Journal of Public Health, 24(4): 389–93.
11. Wilkinson D, Mott K, Morey S, et al. (2003). Evaluation of the EnhancedPrimary Care (EPC) Medicare Benefits Schedule (MBS) items and GeneralPractitioner Education, Support and Community Linkage Program(GPESCL). Final report. Canberra: Australian Government Department ofHealth and Aging.
12. Zwar NA, Hermiz O, Comino EJ, et al. (2007). Do multidisciplinary careplans result in better care for type 2 diabetes? Australian Family Physician,36(1–2): 85–89.
13. Georgiou A, Burns J, McKenzie S, et al. (2006). Monitoring change in di-abetes care using diabetes registers: experience from divisions of generalpractice. Australian Family Physician, 35: 77–80
14. McDermott R, Tulip F, Schmidt B & Sinha A (2003). Sustaining better di-abetes care in remote Indigenous Australian communities. British MedicalJournal, 327(7412): 428–30.
15. Courtenay M & Carey N (2011). Nurse led interventions to improve controlof blood pressure in people with hypertension: systematic review and meta-analysis. British Medical Journal, 341: c3995.
16. McGill M, Molyneaux DK & Yue JR (1993). A single visit diabetes com-plication assessment service: a complement to diabetes management at theprimary care level. Diabetic Medicine, 10(4): 366–70.
17. Cheung N, Yue D, Kotowicz M, Jones P & Flack J (2008). A comparisonof diabetes clinics with different emphasis on routine care, complications as-sessment and shared care. Diabetic Medicine, 25: 974–78.
18. McGill M, Constantino M & Yue DK (2000). Integrating telemedicine intoa national diabetes footcare network. Practical Diabetes, 17(7): 235–38.
19. Hatherly K, Smith L, Overland J, Johnston C & Brown-Singh L (2011).Application of Australia clinical management guidelines: the current state ofplay in a sample of young people with type 1 diabetes in the state of NewSouth Wales and the Australian Capital Territory. Diabetes Research and
19 Diabetes healthcare strategies to cope with the growing epidemic
429

Clinical Practice, 93(3): 379–84.20. Craig ME, Handelsman P, Donaghue KC, Chan A, Blades B, et al. (2002).
Predictors of glycaemic control and hypoglycaemia in children and adoles-cents with type 1 diabetes from NSW and the ACT. The Medical Journal ofAustralia, 177(5): 235–38.
21. Handelsman P, Craig ME, Donaghue KC, Chan A, Blades B, et al. (2001).Homogeneity of metabolic control in New South Wales and the AustralianCapital Territory, Australia. Diabetes Care, 24(9): 1690–91.
22. Hatherly K, Smith L, Overland J, Johnston C, Brown-Singh L, Waller D &Taylor S (2011). Glycemic control and type 1 diabetes: the differential im-pact of model of care and income. Pediatric Diabetes,12: 115–19.
A modern epidemic
430

20Managing diabetes complications in
the clinical arenaStephen M Twigg1,2 and Susan V McLennan
In the absence of a complete prevention or cure for diabetes mellitus in allits forms, complications will occur in most people with diabetes. These arecommon and varied. The spectrum includes psychosocial as well as bio-logical complications and they may be acute, as in those causing very lowor high blood glucose. Chronic biological end-organ complications of dia-betes include so-called microvascular complications of diabetic eye, kidneyand nerve disease and the macrovascular complications of cardiovascular,cerebrovascular and peripheral vascular disease. Evidence from clinical tri-als indicates that using current healthcare and therapy standards, much canbe done to prevent onset and progression of diabetes complications; indeed,over recent years, serial reductions in death rates in people with diabetesreflect such beneficial outcomes. This chapter will focus on trends andoptions in care as well as therapies that hold promise to improve complica-tions outcomes in people with diabetes.
THE SPECTRUM OF DIABETES COMPLICATIONSDiabetes mellitus is essentially a syndrome where the hormone insulin is deficientin the body. As a result there is not enough insulin to prevent increases in bloodglucose, or to normally regulate protein and body fat [1]. While blood glucose lev-els may be quite mildly elevated at certain times in some people with diabetes, ifinsulin is severely lacking it can rapidly lead to emergency, life-threatening con-ditions of diabetic ketoacidosis, where acid in the blood occurs, or hyperosmolarcoma where blood glucose levels rise to very high levels and may cause coma [2].
A major breakthrough occurred in diabetes care when insulin was discovered
1 Sydney Medical School, University of Sydney.2 Department of Endocrinology, Royal Prince Alfred Hospital.
431
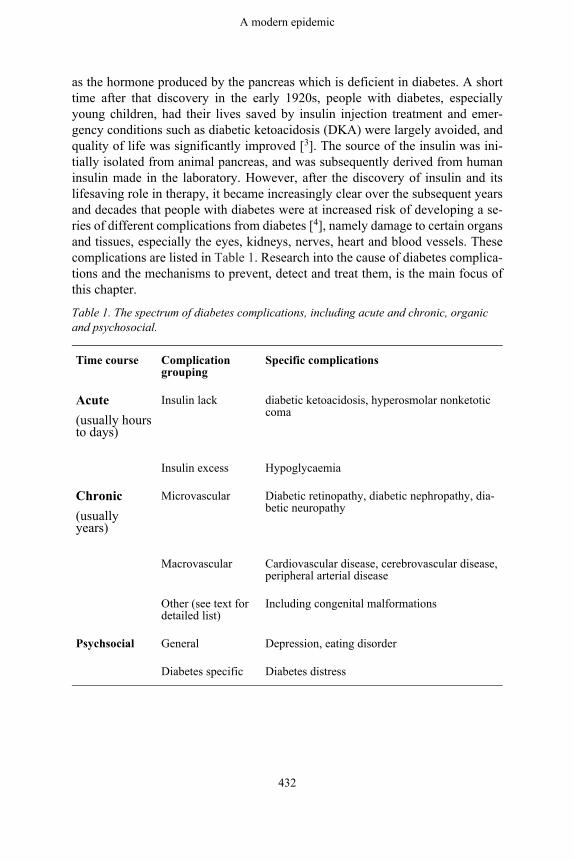
as the hormone produced by the pancreas which is deficient in diabetes. A shorttime after that discovery in the early 1920s, people with diabetes, especiallyyoung children, had their lives saved by insulin injection treatment and emer-gency conditions such as diabetic ketoacidosis (DKA) were largely avoided, andquality of life was significantly improved [3]. The source of the insulin was ini-tially isolated from animal pancreas, and was subsequently derived from humaninsulin made in the laboratory. However, after the discovery of insulin and itslifesaving role in therapy, it became increasingly clear over the subsequent yearsand decades that people with diabetes were at increased risk of developing a se-ries of different complications from diabetes [4], namely damage to certain organsand tissues, especially the eyes, kidneys, nerves, heart and blood vessels. Thesecomplications are listed in Table 1. Research into the cause of diabetes complica-tions and the mechanisms to prevent, detect and treat them, is the main focus ofthis chapter.
Table 1. The spectrum of diabetes complications, including acute and chronic, organicand psychosocial.
Time course Complicationgrouping
Specific complications
Acute(usually hoursto days)
Insulin lack diabetic ketoacidosis, hyperosmolar nonketoticcoma
Insulin excess Hypoglycaemia
Chronic(usuallyyears)
Microvascular Diabetic retinopathy, diabetic nephropathy, dia-betic neuropathy
Macrovascular Cardiovascular disease, cerebrovascular disease,peripheral arterial disease
Other (see text fordetailed list)
Including congenital malformations
Psychsocial General Depression, eating disorder
Diabetes specific Diabetes distress
A modern epidemic
432

ACUTE COMPLICATIONS OF DIABETES
(i) Acute complications due to a lack of insulinAmongst the three main types of diabetes mellitus – type 1, type 2, and ges-tational diabetes – the former two in the absence of a pancreas transplant, areincurable and persist, whereas the latter condition is transient. In type 1 diabetesthere is absolute insulin deficiency. This means that in the absence of insulin ther-apy, cells in the body will become starved of glucose. Insulin is an importantanabolic, or building-up, hormone that helps blood glucose move into tissues,and cells to create cellular energy, and it prevents breakdown of body fats andmuscle. Insulin acts like a key to help glucose move into cells. In the completeabsence of insulin, the cells in the body, especially the liver and skeletal muscle,cannot ‘see’ glucose outside the cell. As a result, the alternative form of storedglucose, known as glycogen, is rapidly broken down by fat and muscle. How-ever glycogen is completely used up within 24 hours. The fat and muscle in thebody are then broken down and the liver takes up fatty acids from the circulationto make an alternative form of energy for the body known as keto acids. Whilethese acids, also known as ketone bodies, provide a source of energy to cells, oversubsequent hours and days in the absence of any insulin the production of ketoacids increases to severe levels [2]. The tissues and the circulation become pro-gressively acidic, placing the defenses against pH imbalance at these sites undergreat physiologic stress. If the blood glucose is high, the blood is acidic and theblood or urine ketones are elevated, then a person is said to have ‘diabetic ke-toacidosis’ (DKA). A person who develops DKA, will become ‘hot and dry’; heor she will increasingly become dehydrated as large volumes of urine are passeddue to elevated blood glucose, and will often be febrile due to having acid in theblood, causing an elevated body temperature. The person with DKA also attemptsto breathe off carbon dioxide (CO2) which is formed to excess in the body whenCO2 is produced from the alkali bicarbonate as a buffer combining with the ex-cessive blood acid from ketones.
DKA is a medical emergency. If it is detected early enough, it can be readilytreated with intravenous fluid and insulin and restoration of the body’s ions, es-pecially potassium, all with close monitoring [5]. Each year in Australia, somepeople with type 1 diabetes die due to diabetic ketoacidosis [6]. The risk of DKAin established type 1 diabetes is 1%–10% per patient per year [7]. The risk ofDKA is increased in people with poor glycaemic control or previous episodesof DKA; peripubertal and adolescent girls; children with psychiatric disorders,including those with eating disorders; children with difficult or unstable familycircumstances; children with limited access to medical services; and people whoomit insulin [7]. Any death due to DKA is a disaster. If treatment is providedearly enough, mortality should not occur, especially in people who have known
20 Managing diabetes complications in the clinical arena
433

type 1 diabetes. Increasingly, guidelines to help prevent DKA and to detect thisacute complication early are being developed [8].
If a person with type 2 diabetes becomes severely deficient in insulin, theblood glucose levels may become markedly elevated over subsequent days andweeks [9]. For example, some people may develop levels of blood glucose above50 mmol/L, compared with the normal non-diabetic range of about four to eightmmol/L. As blood glucose levels become elevated the glucose is lost into theurine, taking water with it and causing dehydration. The very high blood glucoselevels affect consciousness and can cause confusion, and loss of consciousnessor coma. This condition known as ‘hyperosmolar non-ketotic coma’, (or HONC),is life-threatening. It requires emergency room treatment and intensive care sup-port. With careful rehydration and infusion of insulin, as well as treatment of thefactor that may have destabilised diabetes, such as an infection, most people withHONC will survive.
Why people with type 2 diabetes may develop HONC, and yet people withtype 1 diabetes can develop DKA, is an important clinical observation that has notbeen fully explained. In brief, it appears that in HONC, the body makes enoughinsulin to prevent keto acid formation but not enough to prevent blood glucoserising excessively, whereas the absolute insulin lack in type 1 diabetes leads toDKA. It has been observed repeatedly however that if some people with type 2 di-abetes become severely acutely unwell, for example from a severe infection in thebody or due to a heart attack (myocardial infarct), then DKA may transiently de-velop or they may develop a mix of HONC and DKA [9]. Distinguishing betweentype 1 and type 2 diabetes can be difficult and it is increasingly being recognisedthat some people with apparent type 2 diabetes, on careful assessment or in thecourse of time, develop a picture of type 1 diabetes [8].
(ii) Acute complications due to an excess of insulinIf blood glucose levels fall below the normal range, causing hypoglycaemia, itcan make a person with diabetes feel unwell, with sweating and tremor and othersymptoms, and in the most severe situation, loss of consciousness, known as ‘hy-poglycaemia coma’. Severe hypoglycaemia may be life-threatening, for example,by causing seizure, injury or precipitating heart attack or abnormal heart rhythmevents [8, 10]. Essentially, hypoglycaemia occurs because treatments used for di-abetes, either insulin or medications that cause increased insulin release from thepancreas, lower blood glucose excessively for the needs of the body at a certainpoint in time [11].
Hypoglycaemia of all forms is, understandably, feared by people with dia-betes and their immediate carers and family [12]. Fear of hypoglycaemia and itsconsequences, including night-time episodes, is a major barrier to optimal bloodglucose control in type 1 diabetes and in type 2 diabetes when insulin treatment
A modern epidemic
434

is required [13]. For most people with type 1 diabetes, mild (ie self-treated) hy-poglycaemia remains a regular occurrence. It may occur about twice weekly [14]and adversely affect quality of life. In contrast, severe hypoglycaemia occurson average once every three or more years in type 1 diabetes [11, 14]. There ismarked individual variation in the rate of severe hypoglycaemia. Some peoplenever experience it, whereas in others it occurs multiple times a year, despite in-tensive diabetes support in management [11]. Nocturnal hypoglycaemia accountsfor close to half of the episodes of severe hypoglycaemia in type 1 diabetes [14].In type 2 diabetes, for people on insulin therapy, mild hypoglycaemia occurs inabout 30% of people each year, and severe hypoglycaemia in 1%–2% [15]. Riskfactors for severe hypoglycaemia in type 1 and type 2 diabetes include a long du-ration of diabetes and aiming for tighter blood glucose control [8, 11, 15].
Prevention of hypoglycaemia is an important aspect of diabetes care. In peo-ple with type 1 diabetes or type 2 diabetes on therapy that may lower bloodglucose such as insulin, balancing blood glucose across the day by consideringcarbohydrate intake, physical activity and insulin dosage is a constant consider-ation [8, 11]. Some forms of insulin therapy and diabetes management regimenscan help to prevent mild and severe hypoglycaemia. So too can insulin pumptherapy, especially those that combine state of the art technology with real-timecontinuous blood glucose monitors [8].
Treatment of mild hypoglycaemia by oral glucose is usually highly effective,taking 15 to 20 minutes to begin to have effect [11]. In severe hypoglycaemiacausing unconscious, intravenous treatment with glucose by a paramedic or amedical doctor, is usually effective. Alternatively, a hormone therapy known asglucagon, which mobilises glucose into the blood stream from glycogen stores inthe liver, can be administered by intramuscular injection by a carer who has beeneducated in the administration, or by a health professional [13].
Table 2. Differing perspectives on diabetes complications.
More negative perspectives More positive perspectives
Diabetes end-organ complica-tions occur in most people withdiabetes
Most diabetes complications that occur are mild tomoderate in severity and complications can often bedetected early and their progression prevented
Due to its high prevalence inAustralia diabetes is the singlecommonest cause of kidney fail-ure, and also working ageblindness
Less than 2% of people with diabetes will developend-stage kidney disease or blindness annually
More than 15% of people withdiabetes will develop at least onefoot ulcer in their life-time
The vast majority of foot ulcers that occur in peoplewith diabetes will heal with proper care without re-quiring extensive amputation
20 Managing diabetes complications in the clinical arena
435

The commonest cause of death inpeople with diabetes is cardio-vascular disease
Yearly rates of death due to cardiovascular diseasein people with diabetes have been falling by morethan 50% in developed countries over recentdecades, due likely to multiple improvements in pa-tient care including blood cholesterol, bloodpressure and blood glucose control
Routine screening for some dia-betes complications on a regularbasis is not yet established forsome conditions such as diabeticcardiomyopathy or liver diseaserelated to diabetes
Screening for some diabetes complications such asdiabetic retinopathy, nephropathy and neuropathyand foot disease are well established and can help toprevent severe complications
Hypoglycaemia is common inpeople with diabetes and is dueto doses of certain medicationssuch as insulin causing an exces-sive lowering of blood glucose
While severe hypoglycaemia is ten to 20 times morecommon in those with type 1 compared with type 2diabetes, most hypoglycaemia that occurs in alltypes of diabetes is mild, and severe hypoglycaemiacan be prevented
CHRONIC DIABETES COMPLICATIONSDiabetes complications can be divided into those affecting the small vessels ofthe body, so-called microvascular, and those affecting the larger vessels termedmacrovascular. Microvascular complications are mainly those affecting eyes(diabetic retinopathy), kidneys (diabetic nephropathy) and nerves (diabetic neu-ropathy). Macrovascular complications are those of the heart (cardiovasculardisease), brain vessels (cerebrovascular disease) and the limbs (peripheral arterialdisease). There are other diabetes complications which may be mixed in type andare discussed subsequently.
In 2009, diabetes was among the top ten leading causes of death, being thedirect cause of 3% of deaths in Australia, and contributing to another 7.1% ofdeaths [16]. In addition, the presence of diabetes complications increases the fi-nancial cost of diabetes at least twofold [10]. Diabetes is over-represented as acause of death in the Indigenous population, where it was responsible for 8% ofall Indigenous deaths, compared with 2.9% of deaths in non-Indigenous people[16]. Probably due mainly to the increased prevalence of diabetes in the Aus-tralian community, the total number of deaths to which diabetes has contributedhas progressively increased over the last 20 years [10, 16].
(i) Pathogenesis of diabetes complicationsWhy some organs, and tissues in them, are more susceptible to injury than othersis not clear and is the subject of ongoing intensive research [17]. However, there
A modern epidemic
436

are some common elements amongst the differing body parts that develop di-abetes complications. In body sites affected by elevated blood glucose, tissuesmay become inflamed, or they may develop fibrosis/scar tissue or both [18]. Fig-ure 1 indicates a schematic implicating biochemical pathways and adverse tissuechanges that occur in diabetes complications. In inflammation, white cells areattracted into the tissue and inflammatory fluid may accumulate. The inflamma-tion is persistent and of low intensity. In other cases the native cells in the tissuedie and are replaced by scar tissue, also known as fibrosis, which involves newblood vessel growth and lay down of proteins termed extracellular matrix (ECM).Amongst the organs and tissues affected by diabetes complications, some maypredominantly develop inflammation, some fibrosis, and others a mixture of thetwo. For example in diabetic nephropathy, there is evidence that inflammation inthe kidney then leads to fibrosis with loss of kidney function [19].
Figure 1. Schematic showing pathogenesis of diabetes complicationsbased on biochemical and other cellular pathways activated (tissue in-jury), and tissue pathological change, which may lead to functionalloss. High glucose interacts with genetic factors to cause tissue injury,tissue cell loss and in some cases, loss of function in a tissue. For fur-ther explanation refer to the text.
How elevated blood glucose in diabetes leads to diabetes complications is underintensive research [20, 21]. In brief, from a biochemical perspective, high glucosein the blood will ultimately diffuse into cells and cause elevated cell glucose.The main biochemical pathway that normally handles glucose, known as the gly-colytic pathway, and the subsequent biochemical pathways known as the TCAcycle and oxidative phosphorylation, become overwhelmed by the excess glucose
20 Managing diabetes complications in the clinical arena
437

being metabolised and forced into it. As a result, a number of changes occur inthe biochemistry of cells. The high activity in the oxidative phosphorylation path-way leads to dysfunction in the main energy forming part of the cell known asthe mitochondria and to formation of excessive oxidative stress in cells. In addi-tion, a number of overflow metabolic pathways that are not usually very active,become much more active as metabolites in the glycolytic pathway accumu-late downstream of glucose. These overflow pathways include those termed thepolyol pathway, the advanced glycation end-product pathway, the hexosaminepathway, and the diacylglycerol-protein kinase C related pathway [20]. Other fac-tors that may mediate adverse effects of elevated glucose in cells and tissues areproteins known as growth factors and cytokines. For example, the growth factorknown as connective tissue growth factor is induced by all of the glucose over-flow pathways, and it can cause both inflammation and fibrosis in tissues affectedby diabetes [18, 19]. Alterations in matrix degradation, in particular by matrixmetalloproteinases and their regulators, also contribute to tissue damage in dia-betes [22, 23, 24].
Despite the above knowledge, the development of diabetes complications re-mains somewhat of an enigma. Diabetes complications to some degree occur inpractically every person who develops diabetes, although severe complicationsoccur in only a minority [8]. For example, elevated blood and tissue glucoseis only one important risk factor for diabetes complications. Amongst the mi-crovascular complications, identical twin studies have shown that genetic factorsaccount for one-third to one-half the variation in diabetes complications, andthere are likely both protective genetic factors as well as susceptibility factors[25]. To date only some of these genetic factors have been identified. It is thoughtthat the interaction between genetic susceptibility with the metabolic effects ofelevated blood glucose causes the tissue complications of diabetes [21, 25]. It isnotable that, while increasingly elevated blood glucose levels increase the riskof diabetes complications, some people with diabetes can have quite poor bloodglucose levels long term and yet they develop minimal or no damage to tissues,whereas, in others, mildly elevated blood glucose can be associated with severeorgan complications.
In addition to elevated glucose, there are other factors that can affect diabetescomplications risk. Elevated fats, especially saturated fats, and abnormal choles-terol levels with low levels of ‘good cholesterol’ (termed high-density lipopro-tein cholesterol or HDL-C) and elevated and reduced quality ‘bad cholesterol’(termed low-density lipoprotein cholesterol or LDL-C), contribute especially tomacrovascular complications risk [26]. Haemodynamic factors, especially ele-vated general body (systemic) blood pressure contribute to both micro- andmacrovascular complications risk [26, 27]. Increased waist circumference andcentral body fat are associated with high blood pressure, abnormal fats and alsoresistance to the action of insulin. In people who have these characteristic fea-
A modern epidemic
438

tures of insulin resistance, abnormal blood fats and cholesterol, and high bloodpressure, the ‘insulin resistance’ or ‘metabolic syndrome’ is said to be present.Presence of the metabolic syndrome increases the risk and severity of complica-tions in people with type 1 diabetes [27, 28].
In pregnancy, women who have pre-existing diabetes (type 1 or type 2) are atincreased risk of having a pregnancy complicated by miscarriage, or certain birthdefects, or having large babies due to effects of excess blood glucose on the de-veloping fetus [29, 30]. In contrast, gestational diabetes, or GDM, develops in laterpregnancy (usually 24+ weeks of gestation) and likely occurs due to metaboliceffects of the placenta and pregnancy placing metabolic pressure on the mother’spancreas. GDM is usually a temporary form of diabetes and the elevated bloodglucose tendency resolves after delivery. In pregnant women where the pancreascannot make more insulin to overcome insulin resistance of the pregnancy, GDMdevelops. GDM increases the risk, in particular, of large babies at birth, leadingpotentially to obstetric complications at birth, stillbirth, and also increased riskof metabolic syndrome, overweight and obesity, and diabetes in later life [31, 32].GDM also increases the risk of development of type 2 diabetes in the mother oversubsequent years [32].
Research into diabetes complications occurs at the clinical and pre-clinicallevels. As end-organ diabetes complications take many years to develop in hu-mans, animal studies and cell-based research in the laboratory can help to ex-amine diabetes complications in a more timely manner and to test differinginterventions to prevent and treat diabetes complications [33]. The preclinicalstudies thus have advantages, although each is only a model of human diabetesand its complications, and are what is termed ‘hypothesis generating’. Ultimatelyhuman clinical studies are required to determine best evidence methods to man-age diabetes complications.
(ii) Specific organ diabetes complications described
A. Microvascular complications
Diabetic retinopathyIn the course of time, most people with diabetes will develop some form ofchange to the back of the eye (retina) [34]. The most common and non-vision-threatening type of diabetic retinopathy is termed ‘non-proliferative’, where nei-ther growth of new vessels or severe leakiness of the retina is a concern. There aretwo vision-threatening types of diabetic retinopathy. One is proliferative, wherenew and fragile vessels grow in the retina, possibly as a result of poor oxygensupply from damaged initial blood vessels in the retina. The other, and most com-mon, type of vision-threatening diabetic retinopathy is diabetic macular oedema
20 Managing diabetes complications in the clinical arena
439

where excessive leakiness of vessels occurs in the part of the retina that is criti-cal to high-quality vision acuity termed the macula (and more centrally the fovea)[34]. In Australia, while diabetes remains the commonest cause of blindness inpeople of working age, less than 1% of people per year will develop blindnessdue to diabetes [35].
Diabetic nephropathyWhile in each year only about 2% of people with diabetes develop very end-stagekidney disease (stage 5 chronic kidney disease), because diabetes mellitus is socommon, diabetic nephropathy is the single commonest cause of end-stage kid-ney disease in Australia [35]. The damage to the kidney in diabetes may cause aprogressive protein leak termed albuminuria, and also in the course of time, lossof kidney-filtering function (loss of the glomerular filtration rate). It is the com-bination of progressive albuminuria/proteinuria and loss of glomerular filtrationrate that most clearly characterises diabetic nephropathy. It is thought that up to30% of people with diabetes, in the course of time, will develop some nephropa-thy [36, 37]. In the early stages, small amounts of albumin loss in the urine, knownas microalbuminuria, occur. Subsequently, the albumin and protein loss in theurine becomes more marked, and renal filtration function is lost. People with di-abetic nephropathy not only have an increased risk of end-stage kidney failuredeveloping but also increased cardiovascular disease risk – heart attack and heartfailure [37].
Diabetic neuropathyThe commonest form of nerve damage in diabetes is to those supplying the feet.The sensory nerves are damaged more severely than the motor nerves. Loss ofsensation in the feet increases the risk of foot ulceration in people with diabetes,and in their lifetime about 20% of people with diabetes will develop a foot ul-cer, with less than 10% of these cases leading to the need for amputation [38]. Insome people with diabetes, the feet and leg nerves become irritated and a painfulform of neuropathy develops. This can be disabling, especially if prolonged, andrequires specific medication to control, if not fully relieve, it.
There is debate as to whether the microvessels supplying the nerves (termedthe ‘vasa nervorum’), or the nerves themselves, are directly affected by elevatedglucose, with evidence from animal and human studies that both may be involved[38].
In addition to peripheral neuropathy, there are other forms of nerve damagethat can occur in diabetes. These forms of neuropathy include those involvingthe automatic nerves of the body known as autonomic neuropathy. Autonomicneuropathy can cause heart rhythm problems and a proneness to low blood pres-
A modern epidemic
440

sure on standing, as well as stomach and bowel upset. Rarer forms of neuropathy,which often improve over some months, involve the cranial nerves or and thenerve plexus in the pelvis, known as ‘diabetic amyotrophy’ [38].
B. Macrovascular complications
Cardiovascular diseaseThe commonest cause of death in people with diabetes is heart disease, account-ing for about half of the deaths [10]. The heart can be affected by disease of thecoronary arteries, which is increased two- to six-fold in people with diabetes [39].The presentation of heart disease may be through a classic history of chest painknown as angina, although in some people with diabetes the symptoms may bemore subtle, such as new shortness of breath on less exertion.
Cerebrovascular diseaseLack of blood supply causing stroke is twice as common in people with diabetesas in the general population [40]. Large strokes can lead to death or major disabil-ity. In contrast, recurrent mini-strokes (causing damage to small parts of the brainknown as ‘lacunes’), can lead over the years to a form of vascular dementia, es-pecially if blood pressure is elevated.
Peripheral artery diseasePeripheral artery disease is more common in people with diabetes. It can causea number of health problems such as calf pain on walking, and delayed healingin people who develop foot ulcers, thus increasing the risk of amputation [41].Smoking markedly increases the risk of peripheral artery disease in people withdiabetes, and for this and many other reasons smoking avoidance and cessation isvital in diabetes care.
C. Other organ complications in diabetesThere are many other complications that are caused by diabetes or may be relatedto it. Diabetic foot disease occurs due to combinations of neuropathy, periph-eral artery disease, ulceration and infection and foot deformity [42]. Cataract andglaucoma are increased in people with diabetes [34]. Erectile dysfunction (somedegree of impotence) is common in men with diabetes due to nerve damage andblood vessel injury [43]. Limited joint mobility and skin thickening can occur inpeople with diabetes [44]. Diabetes is known to directly adversely affect heartmuscle to cause ‘diabetic cardiomyopathy’ in at least one-third of people [45]. In
20 Managing diabetes complications in the clinical arena
441

type 2 diabetes, fatty liver known as non-alcoholic liver disease occurs in most,and diabetes accelerates its rate of deterioration to an inflammatory and scarringform known as non-alcoholic steatohepatitis and in some cases across decades,liver cirrhosis [46, 47]. People with type 1 diabetes have an increased risk of devel-oping immune related conditions that may affect the thyroid gland to cause over-or under-activity, and also the small bowel condition known as coeliac disease,which is a where effects of gluten in the diet can cause a toxic effect on the bowel[8].
(iii) Psychosocial complications in diabetesDiabetes places major psychological stress and self-care demands on the personwith diabetes and the caring family members. People with diabetes have an in-creased rate of clinical depression and eating disorders, which can exacerbateadverse organ effects of diabetes and also adversely affect quality of life [8]. Sui-cide rates may be higher in young people with diabetes compared with the generalpopulation [6]. There is also a diabetes condition known as ‘diabetes distress’ thatdescribes an underlying anxiety and psychological unwellness in people with dia-betes [8]. Diabetes can adversely affect psychosocial development in children andadolescence [8]. The increased frequency of these conditions reflects that psych-social support is commonly indicated in those with diabetes.
(iv) Clinical trials data in diabetes complications: metaboliccontrol matters
While elevated blood glucose is a marker for increased diabetes complicationsrisk, it took long-term clinical trials to prove that diabetes complications canbe prevented by tight blood glucose control. Landmark studies in people withtype 1 [8, 14] and type 2 diabetes [10, 48, 49, 50, 51, 52] have shown that betterlong-term average blood glucose, measured by a blood marker termed HbA1cor glycated haemoglobin, leads to reduced diabetes complications onset and inthose who already have diabetes complications, their worsening. In studies vary-ing from three to 10 years in duration, the onset and progression of microvascularcomplications were clearly prevented. For the macrovascular complications, car-diovascular events were shown to be prevented in longer-term studies of about 17years’ duration [53, 54]. In those longer-term studies, tight blood glucose controlin the first six to 10 years led to sustained reduction in the subsequent ten yearsor so, indicating that the body has a ‘memory’ effect of elevated blood glucose.This ‘metabolic memory’ is intriguing. Some recent preclinical data suggest thatglucose regulation of factors that control genes, so-called epigenetics, is involvedin the memory effect [55].
A recent study in type 2 diabetes indicates that very tight blood glucose
A modern epidemic
442

control long term in people with cardiovascular disease may lead to increasedmortality [51]. The exact cause of death in the study was unclear, although severehypoglycaemia episodes causing heart attacks or abnormal heart rhythms may atleast partly explain the increased death rate. This study has led to the conceptthat tight blood glucose control and targets are indicated early in diabetes, but inpeople with a history of cardiovascular disease, especially if they require insulintherapy, the blood glucose targets should be more relaxed [10, 56].
(v) Blood pressure and cholesterol control also preventdiabetes complications
A number of important studies in type 1 and type 2 diabetes have shown thatblood pressure control can prevent onset and worsening of microvascular com-plications, especially diabetic nephropathy and diabetic retinopathy, and allmacrovascular complications, especially stroke. The class of medications knownas angiotensin converting enzyme inhibitors and angiotensin receptor antag-onists/blockers, appear to have special protective roles and are the preferredfirst-line agents in people with diabetes [57]. Other studies have shown that reduc-tion in blood levels of bad (LDL) cholesterol, especially with medications knownas ‘statins’, even in those without known cardiovascular disease, will reduce therisk of cardiovascular complications such as heart attack and stroke [58].
A study of people with type 2 diabetes in Denmark examined whether thecombined simultaneous targeting of blood pressure, cholesterol and blood glu-cose would lead to improved outcomes [59]. It clearly demonstrated that targetingall three end-points over eight years or more, led to a more than 50% reductionin macro- and microvascular complications. These studies form the evidence fortargeting blood glucose, blood pressure and cholesterol in people with diabetes.
(vi) Screening for diabetes complicationsIn people with diabetes, there is a clear evidence showing that screening todetect certain diabetes complications is important [8, 10]. This is because, inthose developing complications, some therapies can be intensified to help preventworsening of the complication to its end stages. For example, in diabetic retinopa-thy, vision-threatening forms (proliferative retinopathy or macular oedema) canbe treated with laser therapy, or intraocular corticosteroids or anti-growth factortherapy, to help prevent vision loss. In diabetic nephropathy, even tighter bloodpressure control (to less than 125/75 mmHg, rather than less than 130/80 mmHg)can help prevent its progression, and in people with diabetic foot disease, inten-sive patient education combined with protective foot wear and early treatment offoot ulcers, can help to prevent amputation.
The screening for diabetic retinopathy requires a thorough examination of
20 Managing diabetes complications in the clinical arena
443

the retinae and measurement of visual acuity. In diabetic nephropathy, urine testsfor albumin and in some cases protein, as well as blood tests for renal function(glomerular filtration rate) are required. For neuropathy and foot problems, feetneed to be carefully examined for sensation, pulses and mechanical foot problemsas well as ulcers.
In people with type 2 diabetes, microvascular screening for complicationsshould begin from diagnosis [10], as a delay in recognition of diabetes and dia-betes diagnosis of some years is common in type 2 diabetes, and effects of highblood glucose often occur for many years before diabetes diagnosis. In type 1 di-abetes, screening should occur after about three years of diabetes. In each case,screening should usually occur annually thereafter [8].
In terms of macrovascular disease, complications screening is usually byhistory taking and physical examination. The role for extensive heart investiga-tions, including exercise tests, is unclear and studies have shown that unless aperson has symptoms of heart disease, tight blood pressure, blood glucose andcholesterol control, as well as avoidance of smoking and possibly blood thinning(anti-platelet) therapy are the cornerstone of care.
In people with type 1 diabetes, screening approximately annually for autoim-mune thyroid disease and also coeliac disease, each by blood test, is indicated inchildren and adults [8].
(vii) Major challenges in diabetes complications careManaging diabetes and its complications has a number of inherent challenges.One dynamic tension is that long-term blood glucose control is important to pre-vent long-term organ complications of diabetes, yet tight blood glucose controlcan increase the risk of severe hypoglycaemia, especially in cases where insulintherapy is required, such as in all people with type 1 diabetes and in those withtype 2 diabetes requiring insulin therapy. A second tension is that diabetes placemajor demands on a person’s lifestyle in terms of healthy diet and exercise and,simultaneously, people with diabetes usually need to take multiple preventivemedications to manage blood glucose, blood pressure and cholesterol. The per-son with diabetes needs to self-monitor blood glucose multiple times daily usinga finger prick device and people with type 1 diabetes need to inject insulin fourto five times daily. In people with type 1 diabetes this equates to more than 1000blood glucose self-tests and more than 1000 insulin injections yearly. Diabetes isunrelenting and does not provide any ‘holidays’.
Considering the demands that diabetes places on the person with diabetesand their families, the health professional support and healthcare delivery ser-vices required are extensive and high level. Services for people with diabetesneed to be comprehensive yet individualised in their targets and emphasis [8, 10,56, 60]. Multidisciplinary healthcare teams are required, involving a skilled doc-
A modern epidemic
444

tor, diabetes nurse educator or practice nurse, and dietitian. In type 1 diabetes andcomplex type 2 diabetes, to support the general practitioner, an endocrinologistis indicated to help lead chronic care. Other members of the diabetes healthcareteam will often include the podiatrist, exercise physiologist, psychologist or psy-chiatrist, orthotist, foot and vascular surgeon, renal physician, ophthalmologist,cardiologist and microbiologist. Care of the person with diabetes thus requireshighly coordinated care in order to optimise targets in therapy and to ensure thatregular diabetes complications screening is undertaken [8, 10, 56, 60].
(viii) Transplantation and diabetes complicationsKidney transplant is often an option in a person with diabetes who has end-stagerenal failure requiring dialysis. Outcomes are good if cardiovascular disease andheart failure is not severe in a patient. Kidney transplant can be combined withpancreas transplant in some cases, resulting in reduced need for insulin therapyand a reduction in severe hypoglycaemia. There is also evidence that some formsof neuropathy and kidney disease can improve after pancreas transplant [61].
(ix) Reversibility of diabetes complicationsWhile most diabetes complications are progressive, some are transient. The mi-crovascular complications of diabetes may in some cases regress, especially withintensive therapy. For example, diabetic nephropathy in its early micro-albumin-uria stages may regress to normo-albuminuria with treatment of blood pressure[62], and painful diabetic neuropathy symptoms may resolve with time and im-proved blood glucose control, as may early diabetic retinopathy. Even somechanges of fibrosis in tissues such as the kidney may become less marked withtight control of blood pressure and blood glucose in diabetic nephropathy [61].Most studies in diabetes complications to date have examined prevention of pro-gression rather than regression of complications.
(x) Diabetes and obstetric careIt is beyond the scope of this chapter to address obstetric aspects of diabetes indetail. It should be noted however that in women with type 1 or type 2 diabetes,tight control of blood glucose before conception and across a pregnancy can leadto marked reduction in birth defects, stillbirth and large-at-birth babies [29, 30].Outcomes are also improved for the baby in a mother with gestational diabetes,in terms of reduced complications at birth and possibly, less stillbirth [31]. Thedata from series of high quality studies, including Australian clinical trials [31],provides reassuring data that much can be achieved to prevent diabetes compli-cations in pregnancies complicated by diabetes, whether it be type 1, type 2 or
20 Managing diabetes complications in the clinical arena
445

gestational diabetes in the mother.
(xi) Outcomes are improving in diabetes complicationsData from multiple databases in Australia and other developed countries have in-dicated that the rate of death in people with diabetes has reduced over the decadesin both type 1 and type 2 diabetes [63, 64]. Factors that have likely contributed tothis beneficial outcome include the increasing evidence to support more intensivecontrol of cholesterol (with statins), blood pressure (with angiotensin convertingenzyme inhibitors or angiotensin receptor blocker therapy) and blood glucose inpeople with diabetes, and possibly more complete screening for diabetes compli-cations. Reductions in smoking rates have also likely helped. However, peoplewith diabetes continue to have a reduced life expectancy on average comparedwith an age-matched general population and the earlier diabetes onset occurs, thegreater the reduction in average life expectancy due to diabetes-related compli-cations [63, 10]. This, combined with the end-stage complications that occur indiabetes and the morbidity complications caused and related healthcare costs [8,10], demand no complacency in diabetes complications detection and its manage-ment.
(xii) Prospects in diabetes complications and related careIt is envisaged that healthcare services delivery will progressively be enhanced toensure that most if not all people with diabetes have complications screening asclinically indicated and that they have their major risk factors of blood pressure,cholesterol and blood glucose tightly and safely controlled.
It may also be the case that an increasing focus on regression of diabetescomplications will indicate whether actual regression of changes should be a tar-get in treatment rather than just the prevention of worsening of complications.For example, regression of albuminuria may be shown in the course of time topredict fewer kidney and cardiovascular events than stabilisation of albuminurialevels alone. It may well be that our treatment of blood pressure improves with in-creasing and new combination of agents, as will our control of both good and badcholesterol through combined therapies. In type 1 and type 2 diabetes improvedknowledge in healthcare delivery and advances in technology, such as more so-phisticated insulin pumps and blood glucose monitoring, will likely further helpto improve long-term blood glucose diabetes and thus prevent organ complica-tions and minimise severe hypoglycaemia.
Considering the adverse effects of high blood glucose on cells and cellularpathways to cause tissue injury (Figure 1), it is envisaged that therapies targetedat, for example, growth factors may increasingly help to prevent, stabilise andpossibly reverse diabetes complications. Such is already being realised in diabetic
A modern epidemic
446

retinopathy where anti-vascular endothelial growth factor therapy is becoming areality for vision-threatening retinopathy to complement the traditional treatmentof laser photocoagulation therapy [34]. As described in other chapters, the agentfenofibrate is showing remarkable effects in preventing microvascular complica-tions of diabetes [65].
Lastly, as interventions for diabetic cardiomyopathy in prevention of heartfailure and diabetes and liver disease develop, it is envisaged that screening forthese two conditions will improve. Worldwide, despite the epidemic of obesityand diabetes, increased access to insulin and blood glucose monitoring throughprograms such as Insulin for Life [66], and to skilled teams of healthcare profes-sionals, through the support of the International Diabetes Federation and UnitedNations spearheaded campaigns, are expected to improve global outcomes in di-abetes.
References1. World Health Organization (2006). Definition and diagnosis of diabetes
mellitus and intermediate hyoerglycemia report of a World Health Organiza-tion/IDF consultation. Geneva: World Health Organization Press.
2. Balasubramanyam A, Nalini R, Hampe CS & Maldonado M (2008). Syn-dromes of ketosis-prone diabetes mellitus. Endocrine Reviews, 29(3):292–302.
3. Banting FG & Best CH (1987 [1922]). The internal secretion of the pan-creas. The Journal of Laboratory and Clinical Medicine: Nutrition Classics,45(2): 55–57.
4. Deckert T, Poulsen JE & Larsen M. (1978). Prognosis of diabetics with dia-betes onset before the age of thirty-one. Diabetologia, 14: 363–77.
5. Foster DW & McGarry JD (1983). The metabolic derangements and treat-ment of diabetic ketoacidosis. New England Journal of Medicine, 309(3):159–69.
6. Tu E, Twigg SM, Duflou C & Semsarian C (2008). Causes of death in youngAustralians with type 1 diabetes: a review of coronial post-mortem cases.Medical Journal of Australia,188(12): 699–702.
7. Wolfsdorf J, Craig ME, Daneman D, Dunger D, Edge J, Lee W, Rosen-bloom A, Sperling M & Hanas R (2009). Diabetic ketoacidosis in childrenand adolescents with diabetes. Pediatric Diabetes, 10(Suppl. 12): 118–33.
8. Craig ME, Twigg SM, Donaghue KC, Cheung NW, Cameron FJ, Conn J,
20 Managing diabetes complications in the clinical arena
447

Jenkins AJ, Silink M, for the Australian Type 1 Diabetes Guidelines ExpertAdvisory Group (in press accepted 16 August, 2011). National evidence-based clinical care guidelines for type 1 diabetes in children, adolescents andadults. Canberra: Australian Government Department of Health and Ageing.
9. Kitabchi AE & Nyenwe EA (2006). Hyperglycemic crises in diabetesmellitus: diabetic ketoacidosis and hyperglycemic hyperosmolar state. En-docrinology and Metabolism Clinics of North America, 35(4): 725–51.
10. Colagiuri S, Dickinson S, Girgis S & Colagiuri R (2009). National evidencebased guideline for blood glucose control in type 2 diabetes. Canberra: Dia-betes Australia and the NHMRC.
11. Cryer PE, Axelrod L, Grossman AB, Heller SR, Montori VM, Seaquist ER,Service FJ & The Endocrine Society (2009). Evaluation and management ofadult hypoglycemic disorders: an Endocrine Society Clinical Practice Guide-line. Journal of Clinical Endocrinology & Metabolism, 94(3): 709–28.
12. Anderbro T, Amsberg S, Adamson U, Bolinder J, Lins P, Wredling R,Moberg E, Lisspers J & Johansson UB (2010). Fear of hypoglycaemia inadults with type 1 diabetes. Diabetic Medicine, 27(10): 1151–58.
13. Pearson T (2008). Glucagon as a treatment of severe hypoglycemia: safe andefficacious but underutilized. The Diabetes Educator, 34(1): 128–34.
14. DCCT Research Group (Diabetes Control and Complications Trial ResearchGroup) (1991). Epidemiology of severe hypoglycemia in the diabetes controland complications trial. American Journal of Medicine, 90(4): 450–59.
15. UKPDS Study Group (1998). Intensive blood-glucose control with sulpho-nylureas or insulin compared with conventional treatment and risk of com-plications in patients with type 2 diabetes. (UKPDS 33). UK ProspectiveDiabetes Study (UKPDS) Group. The Lancet, 352(9131): 837–53.
16. Australian Bureau of Statistics (2009). Causes of death in Australia [On-line]. Available: abs.gov.au/AUSSTATS/[email protected]/mf/3303.0/ [Accessed 14December 2011].
17. Bierhaus A & Nawroth PP (2009). Multiple levels of regulation determinethe role of the receptor for AGE (RAGE) as common soil in inflammation,immune responses and diabetes mellitus and its complications. Diabetologia,52(11): 2251–63.
18. Twigg SM & Cooper ME (2004). The time has come to target connective
A modern epidemic
448

tissue growth factor in diabetic complications. Diabetologia, 47(6): 965–68.19. Twigg SM (2010). Mastering a mediator: blockade of CCN-2 shows early
promise in human diabetic kidney disease. Cell Communication and Signal-ing, 4(4): 189–96.
20. Brownlee M (2001). Biochemistry and molecular cell biology of diabeticcomplications. Nature, 414(6865): 813–20.
21. Jeong IK & King GL (2011). New perspectives on diabetic vascular compli-cations: the loss of endogenous protective factors induced by hyperglycemia.Diabetes & Metabolism Journal, 35(1): 8–11.
22. Yu Liu D, Min T, Bolton V, Nubé SM, Twigg, DK Yue & SV McLennan(2009). Increased matrix metalloproteinase-9 predicts poor wound healing indiabetic foot ulcers. Diabetes Care, 32(1): 117–19.
23. McLennan SV, Wang XY, Moreno V, Yue DK & Twigg SM (2004).Connective tissue growth factor mediates high glucose effects on matrixdegradation through tissue inhibitor of matrix metalloproteinase type 1: im-plications for diabetic nephropathy. Endocrinology, 145(12): 5646–55.
24. Min D, Lyons JG, Bonner J, Twigg SM, Yue DK & McLennan SV (2009).Mesangial cell-derived factors alter monocyte activation and functionthrough inflammatory pathways: possible pathogenic role in diabeticnephropathy. American Journal of Physiology – Renal Physiology, 297(5):F1229–37.
25. Freedman BI, Bostrom M, Daeihagh P & Bowden DW (2007). Genetic fac-tors in diabetic nephropathy. Clinical Journal of the American Society ofNephrology, 2: 1306–16.
26. Fitzgerald AP & Jarrett RJ (1991). Are conventional risk factors for mortal-ity relevant in type 2 diabetes? Diabetic Medicine, 8(5): 475–80.
27. Castellino P, Tuttle KR & DeFronzo RA (1994). Diabetic nephropathy. Cur-rent Therapy in Endocrinology and Metabolism, 5: 426–36.
28. McGill M, Molyneaux L, Twigg SM & Yue DK (2008). The metabolic syn-drome in type 1 diabetes: does it exist and does it matter? Journal of Diabetesand its Complications, 22(1): 18–23.
29. Ray JG, O’Brien TE & Chan WS (2001). Preconception care and the riskof congenital anomalies in the offspring of women with diabetes mellitus: ameta-analysis. Quarterly Journal of Medicine, 94(8): 435–44.
20 Managing diabetes complications in the clinical arena
449

30. Tieu J, Middleton P & Crowther CA (2010). Preconception care for diabeticwomen for improving maternal and fetal health. Cochrane Database of Sys-tematic Reviews, 12: CD007776.
31. Crowther CA, Hiller JE, Moss JR, McPhee AJ, Jeffries WS & RobinsonJS (2005). Effect of treatment of gestational diabetes mellitus on pregnancyoutcomes. Australian Carbohydrate Intolerance Study in Pregnant Women(ACHOIS) Trial Group. The New England Journal of Medicine, 352(24):2477–86.
32. Jacqueminet S & Jannot-Lamotte MF (2010). Therapeutic management ofgestational diabetes. Diabetes & Metabolism, 36(6 Pt 2): 658–71.
33. Thomson SE, McLennan SV, Kirwan PD, Heffernan SJ, Hennessy A, YueDK & Twigg SM (2008). Renal CTGF correlates with glomerular base-ment membrane thickness and prospective albuminuria in a non-humanprimate model of diabetes: possible predictive marker for incipient diabeticnephropathy. Journal of Diabetes and its Complications, 22(4): 284–94.
34. Australian Government Department of Health and Ageing (2008). Guide-lines for the management of diabetic retinopathy. Canberra: Australian Gov-ernment Department of Health and Ageing.
35. Australian Government Department of Health and Ageing (2009). Aus-tralian national diabetes information audit & benchmarking. Canberra: Aus-tralian Government Department of Health and Ageing.
36. Nathan DM, Zinman B, Cleary PA, Backlund JY, Genuth S, Miller R & Or-chard TJ (2009). Modern-day clinical course of type 1 diabetes mellitus after30 years’ duration: the diabetes control and complications trial/epidemiologyof diabetes interventions and complications and Pittsburgh epidemiology ofdiabetes complications experience (1983–2005). Archives of Internal Medi-cine, 169: 1307–16.
37. Lehmann R & Schleicher ED (2000). Molecular mechanism of diabeticnephropathy. Clinica Chimica Acta, 297: 135–44.
38. Tesfaye S, Boulton AJ, Dyck PJ, Freeman R, Horowitz M, Kempler P, Lau-ria G, Malik RA, Spallone V, Vinik A, Bernardi L, Valensi P & TorontoDiabetic Neuropathy Expert Group (2010). Diabetic neuropathies: update ondefinitions, diagnostic criteria, estimation of severity, and treatments. Dia-betes Care, 33(10): 2285–93.
A modern epidemic
450

39. Ford ES (2011). Trends in the risk for coronary heart disease among adultswith diagnosed diabetes in the US: findings from the National Health andNutrition Examination Survey (1999–2008). Diabetes Care, 34(6): 1337–43.
40. Kothari V, Stevens RJ, Adler AI, Stratton IM, Manley SE, Neil HA & Hol-man RR (2002). UKPDS 60: risk of stroke in type 2 diabetes estimated bythe UK Prospective Diabetes Study risk engine. Stroke, 33(7): 1776–81.
41. Adler AI, Stevens RJ, Neil A, Stratton IM, Boulton AJ & Holman RR(2002). UKPDS 59: hyperglycemia and other potentially modifiable risk fac-tors for peripheral vascular disease in type 2 diabetes. Diabetes Care, 25(5):894–99.
42. Australian Government Department of Health and Ageing (2011). Nationalevidence-based guideline: prevention, identification and management of footcomplications in diabetes. Canberra: Australian Government Department ofHealth and Ageing.
43. Hermans MP, Ahn SA & Rousseau MF (2009). Erectile dysfunction, mi-croangiopathy and UKPDS risk in type 2 diabetes. Diabetes & Metabolism,35(6): 484–89.
44. Kordonouri O, Maguire AM, Knip M, Schober E, Lorini R, Holl RW &Donaghue KC (2009). Other complications and associated conditions withdiabetes in children and adolescents. Pediatric Diabetes, 10(Suppl. 12):204–10.
45. Brooks BA, Franjic B, Ban CR, Swaraj K, Yue DK, Celermajer DS &Twigg SM. (2008). Diastolic dysfunction and abnormalities of the micro-circulation in type 2 diabetes. Diabetes, Obesity and Metabolism, 10(9):739–46
46. Lo L, McLennan SV, Williams PF, Bonner J, Chowdhury S, McCaughanGW, Gorrell MD, Yue DK & Twigg SM (2011). Diabetes is a progressionfactor for hepatic fibrosis in a high fat fed mouse obesity model of non-alco-holic steatohepatitis. Journal of Hepatology, 55(2): 435–44.
47. Clark JM (2006). The epidemiology of nonalcoholic fatty liver disease inadults. Journal of Clinical Gastroenterology, 40: S5–S10.
48. UKPDS Study Group (1998). Effect of intensive blood-glucose control withmetformin on complications in overweight patients with type 2 diabetes.(UKPDS 34). The Lancet, 352(9131): 854–65.
20 Managing diabetes complications in the clinical arena
451

49. UKPDS Study Group (1998). Intensive blood-glucose control with sulpho-nylureas or insulin compared with conventional treatment and risk of com-plications in patients with type 2 diabetes. (UKPDS 33). The Lancet,352(9131): 837–53.
50. ADVANCE Collaborative Group (2008). Intensive blood glucose controland vascular outcomes in patients with type 2 diabetes. New England Journalof Medicine, 358(24): 2560–72.
51. ACCORD Study Group (2008). Effects of intensive glucose lowering intype 2 diabetes. New England Journal of Medicine, 358(24): 2545–59.
52. Duckworth W, Abraira C, Moritz T, Reda D, Emanuele N, Reaven PD,Zieve FJ, Marks J, Davis SN, Hayward R, Warren SR, Goldman S, McCar-ren M, Vitek ME, Henderson WG & Huang GD (2009). Glucose control andvascular complications in veterans with type 2 diabetes. New England Jour-nal of Medicine, 360(2): 129–39.
53. Nathan DM, Cleary PA, Backlund JY, Genuth SM, Lachin JM, OrchardTJ, Raskin P, Zinman B & DCCT/EDIC Study Research Group (2005). In-tensive diabetes treatment and cardiovascular disease in patients with type 1diabetes, New England Journal of Medicine, 353(25): 2643–53.
54. Holman RR, Paul SK, Bethel MA, Matthews DR & Neil HA (2008). 10-yearfollow-up of intensive glucose control in type 2 diabetes. New England Jour-nal of Medicine, 359(15): 1577–89.
55. Tonna S, El-Osta A, Cooper ME & Tikellis C (2010). Metabolic memoryand diabetic nephropathy: potential role for epigenetic mechanisms. NatureReviews Nephrology, 6: 332–41.
56. Cheung NW, Conn JJ, d’Emden MC, Gunton JE, Jenkins AJ, Ross GP,Sinha AK, Andrikopoulos S, Colagiuri S & Twigg SM (2009). Positionstatement of the Australian Diabetes Society: individualisation of glycatedhaemoglobin targets for adults with diabetes mellitus. Medical Journal ofAustralia, 191(6): 339–44.
57. Chobanian AV, Bakris GL, Black HR, Cushman WC, Green LA, Izzo JLJr, Jones DW, Materson BJ, Oparil S, Wright JT Jr & Roccella EJ (2003).The seventh report of the Joint National Committee on Prevention, Detec-tion, Evaluation, and Treatment of High Blood Pressure: the JNC 7 report.National Heart, Lung, and Blood Institute Joint National Committee on
A modern epidemic
452

Prevention, Detection, Evaluation, and Treatment of High Blood Pressure;National High Blood Pressure Education Program Coordinating Committee.Journal of the American Medical Association, 289(19): 2560–72.
58. Colhoun HM, Betteridge DJ, Durrington PN, Hitman GA, Neil HA, Liv-ingstone SJ, Thomason MJ, Mackness MI, Charlton-Menys V, Fuller JH &CARDS investigators (2004). Primary prevention of cardiovascular diseasewith atorvastatin in type 2 diabetes in the Collaborative Atorvastatin Dia-betes Study (CARDS): multicentre randomised placebo-controlled trial. TheLancet, 364(9435): 685–96.
59. Gaede P, Vedel P, Larsen N, Jensen GV, Parving HH & Pedersen O (2003).Multifactorial intervention and cardiovascular disease in patients with type 2diabetes. New England Journal of Medicine, 348(5): 383–93.
60. Colagiuri R, Girgis S, Eigenmann C, Gomez M & Griffiths R (2009). Na-tional evidence based guideline for patient education in type 2 diabetes.Canberra: Diabetes Australia and the NHMRC.
61. Han DJ & Sutherland DE (2010). Pancreas transplantation. Gut Liver, 4(4):450–65.
62. Ismail-Beigi F, Craven T, Banerji MA, Basile J, Calles J, Cohen RM, Cud-dihy R, Cushman WC, Genuth S, Grimm RH Jr, Hamilton BP, Hoogwerf B,Karl D, Katz L, Krikorian A, O’Connor P, Pop-Busui R, Schubart U, Sim-mons D, Taylor H, Thomas A, Weiss D, Hramiak I & ACCORD trial group(2010). Effect of intensive treatment of hyperglycaemia on microvascularoutcomes in type 2 diabetes: an analysis of the ACCORD randomised trial.The Lancet, 376(9739): 419–30.
63. Secrest AM, Becker DJ, Kelsey SF, LaPorte RE & Orchard TJ (2010). All-cause mortality trends in a large population-based cohort with long-standingchildhood-onset type 1 diabetes: the Allegheny County type 1 diabetes reg-istry, Diabetes Care, 33(12): 2573–79.
64. Gu K, Cowie CC & Harris MI (1999). Diabetes and decline in heartdisease mortality in US adults. Journal of the American Medical Association,281(14): 1291–97.
65. Rajamani K, Colman PG, Li LP, Best JD, Voysey M, D’Emden MC, LaaksoM, Baker JR, Keech AC & FIELD study investigators (2009). Effect offenofibrate on amputation events in people with type 2 diabetes mellitus
20 Managing diabetes complications in the clinical arena
453

(FIELD study): a prespecified analysis of a randomised controlled trial. TheLancet, 373(9677): 1780–88.
66. Insulin for Life website: www.insulinforlife.org/
A modern epidemic
454

21Obesity treatment for adults, adoles-
cents and childrenIan Caterson,1 Nick Finer,2 Louise A Baur3, and Kate Steinbeck4
Obesity treatment aims to produce weight loss and weight-loss mainte-nance, as well as risk reduction, disease prevention, amelioration or cure.Treatment needs to be designed according to the person’s need. A smallloss (5%–10% of initial body weight) may suffice for disease prevention,but greater weight loss is often needed for mobility or for disease cure inthose with a greater degree of obesity. For children and adolescents, familyinvolvement and a developmentally appropriate approach are vital. For ex-ample, for pre-pubertal children, who are still growing in height, reductionin the rate of weight gain, or weight stability, may be sufficient to achievehealth improvement. Lifestyle interventions to achieve energy restrictionand increase energy expenditure (through activity and exercise) are theinitial approach. Pharmacotherapy can improve the efficacy of lifestyle in-terventions. Intragastric devices and bariatric surgery may be appropriatefor those with more severe disease, including selected older adolescents.While weight loss can be achieved, the major issue in treatment of obesityremains weight maintenance and efforts need to be directed to this end.
Overweight and obesity are common in Australia, with approximately one in fiveadults being obese, two in five overweight and approximately one in four of ourchildren being overweight or obese. This condition has essentially become thenorm. As is discussed elsewhere in this volume, this increasing obesity preva-lence has come with increasing health problems and diseases. Whilst many ofthese diseases can be treated directly (and at continuing expense) it would be bet-
1 Boden Institute of Obesity, Nutrition, Exercise and Eating Disorders, University ofSydney.
2 University College Hospital, London, UK.3 Children’s Hospital, Westmead Clinical School, University of Sydney.
4 Adolescent Medicine, University of Sydney.4 Adolescent Medicine, University of Sydney.
455

ter to prevent such obesity-associated diseases by treating their underlying cause,that is by managing overweight and obesity properly. In fact, it would be evenbetter to prevent overweight and obesity occurring in our society!
Traditionally the health professionals have been pessimistic about their abil-ity to treat obesity but with the new realisations of what successful treatmentreally is, and with the newer treatment modalities, obesity treatment can be, andis, successful. What is needed is a practical approach, individual goals for eachpatient and a system which provides the appropriate intervention as well as con-tinuing support and follow-up. These aspects of obesity management for adults,adolescents and children will be discussed in the chapter.
MANAGEMENT OF OBESITY IN ADULTS: WHOMTO TREAT AND HOW TO TREAT?
There are a number of modalities involved in the management of obesity, whichshould be delivered as an integrated program. These modalities include standardlifestyle interventions (eating and activity), behaviour and group therapy, adjunc-tive therapy (pharmacotherapy, meal replacement regimes), some special devices(intragastric balloons) and bariatric surgery. A suggested approach utilising thepatient’s body mass index (BMI, weight/height2, kg/m2), the presence of obesity-associated comorbidities, and a range of treatment options is outlined in Table 1.
Table 1. A management approach for obesity in adults.
BMI (kg/m2)* Lifestyle** Obesitydrugs
VLEDs Devices: eg intragas-tric balloon
Bariatricsurgery
25 to 26.9 Advice
27 to 34.9 Lifestyleprogram
Consider Possibly
27 to 34.9 ±co-morbidity
Lifestyleprogram
Consider Probably Possibly
>35 ±comorbid-ity
Lifestyleprogram
Consider Utilise Possibly Consider
>40 (if no co-morbidities)
Lifestyleprogram
Consider Utilise Possibly Consider
* If there is increased waist circumference (the importance of which is describedelsewhere in this volume) then a more intensive therapeutic regimen may beutilised at a lower BMI range.
A modern epidemic
456

** All the components of the lifestyle program and other therapies are describedbelow. Obesity pharmacotherapy may be utilised to help maintain weight after itis lost using other treatment modalities instead of just being used to produceweight loss. Very low energy diets (VLEDs) are useful for initiating and obtain-ing weight loss, in weight maintenance and prior to bariatric surgery.
It is important that healthcare practitioners recognise when a patient has a weightproblem and for them to be able to prescribe an appropriate management plan forthe patient’s degree of obesity, life stage and situation.
LIFESTYLE MANAGEMENTA lifestyle-management program remains the basis of all obesity treatment [1].Such a program has a number of components, the most obvious of which areeating and physical activity plans. Another major component is a behaviour-mod-ification program. Other aspects include goal setting, psychological support (andcounselling if necessary), proper medical management and a long-term plan formaintaining weight loss. Such lifestyle programs have been shown to be effec-tive [2], and losses of 6% or more of initial body weight can be achieved andmaintained. There is no reason for such programs to be delivered solely by healthprofessionals [3]. For those with a BMI in the lower overweight and obesity range(ie BMI 27 to 34.9 kg/m2), and without major medical complications, such pro-grams can be delivered effectively in the community setting.
GOAL SETTINGThis is often ignored, or not specifically discussed with the patient. The goals willvary from patient to patient. It is important to set realistic goals for weight loss,of course, but other goals may be individual and/or medical. Other than weightloss, goals may include prevention and control of disease (such as diabetes), bet-ter mobility, less medications, ability to have a joint replacement, or a specificgoal that the patient wants to achieve. Such goals should be discussed, recordedand when reached the achievement should be noted and the patient congratulated.
EATINGIt is better to use the term ‘eating plan’ rather than ‘diet’. Diets tend to be seenas short term and there are many which are pushed by magazines, in books, andonline, and there is a large industry producing these diet plans. This plethora of
21 Obesity treatment for adults, adolescents and children
457

diets is confusing and unhelpful for someone attempting to lose and then maintainweight loss. It has been shown that the amount of weight loss obtained does notdepend on the type of eating plan prescribed; most produce similar weight lossesat six months with gradual weight regain thereafter [4, 5]. Compliance to the plan,not the type of plan, is what produces weight loss [6]. What is really necessary is a500 to 600 kcal (2100 to 2500 kJ) energy deficit and a plan that starts by makingsmall changes to a patient’s habitual consumption. Such changes may include de-creases in portion size, a reduction in fat (and in particular saturated fat), possiblyan increase in mono-unsaturated fat, a reduction in sugar-sweetened beveragesand a low glycaemic index diet. An increase in protein in the diet may increasesatiety. Any changes must be made specifically in the context of the patient’s ha-bitual diet. It is useful to keep food logs at regular intervals to check complianceand to use as a tool to suggest further changes in intake or eating patterns.
PHYSICAL ACTIVITYThe term ‘physical activity plan’ is preferred to ‘exercise’, because the prescribedplan will include both planned exercise as well as incidental activity. A formalprescription of such a plan does produce greater compliance. Activity helps main-tain lean mass and because of the increased energy deficit it promotes weight (kg)and fat mass loss. A simple initial approach is to use a physical activity ques-tionnaire, determine how much time is spent walking or in specific exercise andperhaps suggest the use of a pedometer to get an activity baseline.
The activity prescription itself should be specific to the patient. It may in-clude increased time walking, more incidental activity (taking an active option),and/or specific exercises, gym programs or training, or involvement in sport. Fordiabetes prevention, supervised exercise sessions have been shown to be partof all-effective programs. It is good to remember that the greater the patient’sweight, the fewer ‘steps’ they have to do to lose weight. Activity should bemonitored and the amount done recorded. Again this will help in assessment ofcompliance and will also be a tool for increasing the amount of activity per-formed.
Increased activity alone (as a weight-loss program) does not produce a greatdeal of weight loss. It may affect fat distribution [7, 8] but, for reasonable weightloss to ensue, activity must be combined with an eating plan [9].
BEHAVIOUR MODIFICATIONThe use of food and activity logs is part of behaviour modification. Another logthat may be useful is one for mood, particularly at time of eating, as well as gen-
A modern epidemic
458
eral affect. Cognitive behaviour therapy may be useful, particularly for optimis-ing weight maintenance. Other techniques are those of cognitive restructuring,motivational enhancement therapy, psychological support and counselling. Thereare many techniques that may be used but to describe these in any detail is be-yond the scope of this chapter. The techniques utilised need to be individualisedto the patient’s situation and life stage, so there really is no ‘standard’ program –rather, a series of techniques used when necessary [10].
An effective lifestyle program must contain some or all of these elements,and though patient education alone is not effective in producing weight loss, ittoo is a part of a successful program. A multidisciplinary team providing care isessential. Regular visits (at least fortnightly initially and then at longer intervals)are important. Weight regain does tend to recur, particularly in the second yearof a program and it is at this stage that there needs to be further research on theeffect of repeated, brief acute interventions, the use of pharmacotherapy for main-tenance, and/or the use of very low energy diets (VLEDs).
If the lifestyle program is not successful, with goals not being attained, thenadjunctive therapy should be considered. Such consideration should begin earlyin any program, say at one month, with reconsideration at regular intervals.
ADJUNCTIVE THERAPY
Very low energy diets (VLEDs)Such formulations are effective at producing early weight loss [11], although aftera time (two to three years) they appear to produce no more weight loss thana standard lifestyle program. However if their use is continued (as one to twomeal replacements per day) then significant weight loss can be both achieved andmaintained [12]. These diets tend to contain 500 to 800 kcal/day and the neces-sary vitamins and micronutrients. Early formulations did not contain high-qualityprotein and a number of deaths ensued, but these difficulties have been addressedand current formulations are safe, provided they are used according to protocol,and preferably under medical supervision [13].
These formulations are available as shakes, soups and bars, and in mostcountries they are classified as ‘Foods’. They may be used as a full meal replace-ment protocol (every meal a VLED) or as a partial protocol (one to two mealsa day as a VLED). The full protocol is best performed under clinical supervi-sion, particularly if the patient has diabetes or cardiac disease. The full protocolhas been used as the ‘control treatment’ in randomised trials of bariatric surgeryand quite reasonable weight losses, of the order of 15% or more of initial bodyweight, are obtained.
Initial full-meal replacement protocols usually run for 12 to 16 weeks though
21 Obesity treatment for adults, adolescents and children
459

under supervised conditions there is no reason why they should not be used forlonger. They can be used as one to two meals per day to help maintain weightloss. They are generally used prior to bariatric surgery [14] to reduce some weightand to reduce fat in the liver (which makes surgery easier).
PharmacotherapyThe relatively limited success of lifestyle interventions has driven the search foreffective anti-obesity drugs. Drug treatment of obesity is driven by similar prin-ciples for pharmacotherapy of other chronic diseases: it needs to be effective andsafe (particularly as it will need to be used long term), acceptable to patientsand affordable [15]. While the physiological control of body weight theoreticallyprovides many targets (satiety, nutrient absorption and energy expenditure), inpractice it has proven hard to find safe and effective drugs and regulatory au-thorities such as the Food and Drugs Administration in US, European MedicinesEvaluation Agency and Therapeutics Goods Administration in Australia, have setguidelines and standards of evidence for efficacy and safety that have proven abarrier to new drug development.
Drugs available in the past 20 years but no longer licensedAmphetamine-like drugs with predominant actions of enhancing brain dopaminepathways included phentermine and diethylpropion. They produced anorexia(rather than satiety) and had some CNS stimulant properties. Although theyproduced weight loss of about 5%–10% they were not evaluated according tocontemporary standards for clinical trials. Phentermine is available and used shortterm in the US, Asia and Australia, but not in Europe. The fenfluramines de-veloped in the 1980s were effective satiety-enhancing drugs that acted mainlythrough enhancing central serotoninergic neuronal transmission (by both releaseand reuptake inhibition of serotonin). However they were associated with pul-monary hypertension and cardiac valve abnormalities (especially when combinedwith phentermine) and withdrawn from use in 2004. The endocannaboid receptor(CB1 receptor) was identified as an attractive target since it had long been knownthat stimulation of this receptor led to hunger; a number of selective CB1 receptorblockers were developed in the early 2000s, with rimonabant being licensed inEurope on the basis of four clinical trials that showed it could produce weight lossof about 10% absolute, 5.6 kg placebo-subtracted, and that efficacy was main-tained over at least two years. Furthermore rimonabant use was associated withmetabolic improvements of lipids and glycaemic control. However shortly afterapproval it became clear that there was an unacceptable incidence of depressionand suicidal ideation with the drug that led to its withdrawal [16].
Sibutramine, a selective serotonin and norepinephrine-uptake inhibitor had
A modern epidemic
460

been licensed and in use worldwide since the 1990s. It produced placebo-sub-tracted weight loss of about 5% over one year, but appeared to have greaterefficacy when combined with intensive lifestyle interventions: in one trial an av-erage 12·1 kg weight loss compared to five kilograms with sibutramine alone.Concerns remained that the drug had unwanted and potentially dangerous sym-pathomimetic effects that could raise blood pressure and pulse, so at the demandof the European Medicines Agency the Sibutramine Cardiovascular Outcomes(SCOUT) trial assessed the efficacy of sibutramine in reducing myocardial in-farction, stroke, and cardiovascular mortality in 11 000 obese and overweightpatients. In order to produce enough cardiovascular endpoints, patients with ex-isting cardiovascular disease and diabetes and at high risk for future events wererecruited (a population that would have been excluded according to the drug li-cence). The trial reported that despite well-sustained weight loss, there was anexcess of non-fatal cardiovascular events in the subjects receiving sibutramine forup to four years [17] and this led to the withdrawal of the drug.
Current drugs licensed for obesity treatmentIn 2011 orlistat, a pancreatic and intestinal lipase inhibitor, was the major drug li-censed for obesity treatment. It produces malabsorption of about 30% of ingesteddietary fat. Its use is limited by gastro-intestinal side effects (steatorrhea, flatus,urgency of defecation and sometimes even faecal incontinence) such that unlesssubjects are on a low-fat diet (maximum 90 gm fat daily) it is unlikely to be tol-erated. In this setting the drug can produce an approximate 300 kcal/day energyloss through undigested fat. In a meta-analysis of 11 placebo-controlled trials ofone year in over 6000 overweight or obese patients, orlistat 120 mg thrice dailyreduced weight by about 3% more than placebo, with 21% reaching a 5% loss,and 12% a 10% or greater weight loss. Orlistat has favourable effects on bloodpressure, lipids and blood glucose. In some countries orlistat is available at a doseof 60 mg thrice daily either over the counter or through pharmacist prescription[18, 19, 20].
Phentermine is available in Australia, the US and Asia. It is an older drugwith a central action on appetite. There are no long-term studies, but it has beenshown to be effective short term and may be used to help produce or maintainweight loss. Further studies are really needed to define its place in obesity man-agement.
Drugs producing weight loss licensed for other indicationsThe glucagon-like peptide 1 (GLP-1) incretin analogues exenatide and liraglutideare both licensed for use as hypoglycaemic drugs for treating type 2 diabetes,and they produce a weight loss of two to four kilograms. GLP-1 agonists have
21 Obesity treatment for adults, adolescents and children
461

complex modes of action on weight loss that include delayed gastric emptying,and both direct, and indirect via the vagus nerve, stimulation of central nervoussystem satiety pathways. The drug has to be given by subcutaneous injection.Liraglutide given at higher doses than used to treat diabetes is in clinical trialsas a weight-loss agent in non-diabetics. Early results have shown body weightlosses of about 10% associated with marked metabolic and cardiovascular im-provements sustained for two years [21].
Currently much focus is on combining drugs at low doses to produce syn-ergistic weight-loss effects while minimising side and unwanted effects [22].Combining naltrexone (an opioid receptor antagonist) with bupropion (an an-tidepressant) showed synergistic effects on the firing of hypothalamic pro-opi-omelanocortin neurons in mice. In a trial of nearly 2000 overweight and obesesubjects the highest dose combination produced weight loss of 6.1% at one yearcompared to 1.3% on placebo. Side effects were mainly gastrointestinal, but therewere transient increases in blood pressure with less fall than might have been ex-pected from the weight-loss achieved [23].
The anti-epilepsy drug topiramate has been combined with phentermine andalso investigated in clinical trials. In nearly 2500 patients the highest dose com-bination produced a weight loss after 56 weeks of just under 10% compared to1.2% of those on placebo. Dizziness, depression and anxiety were the most com-mon side effects and will need further evaluation before the drug will be licensed.
Bariatric surgeryBariatric procedures aim to produce and maintain weight loss by altering energybalance primarily by reducing food intake and mitigating the physiologicalchanges that drive weight regain. Most guidelines recommend that bariatricsurgery be considered for those with a BMI above 35 kg/m2 with an obesity-re-lated comorbidity, or above 40 kg/m2 in those without. A multidisciplinary teamincluding surgeon, anaesthetist, physician, dietitian, specialist nurse and psychol-ogist or psychiatrist is needed to provide optimal care.
Four procedures are most commonly performed, in modern practice alllaparascopically: Roux-en-Y gastric bypass, adjustable gastric banding, sleevegastrectomy and biliopancreatic diversion (Figure 1), with considerable variationbetween countries in the preferred procedures.
Roux-en-Y gastric bypass creates a small gastric remnant that empties di-rectly into the transposed jejunum, bypassing the main body of the stomach,duodenum and proximal jejunum. Although the procedure was initially thoughtto produce weight loss by both restriction and malabsorption of food intake, itis clear that the impact of food entering rapidly into the distal jejunum is associ-ated with the rapid release of gastrointestinal peptide satiety hormones including
A modern epidemic
462

GLP-1 and Peptide YY (PYY), as well as decreasing the orexigenic hormoneghrelin, released from the stomach. Other factors postulated to produce weightloss include altered bile salt secretion and altered gut microbiota. Patients re-quire lifelong vitamin B12 and vitamin D replacement. Weight losses average35%–40% at five years.
Figure 1. Types of bariatric surgery, shown schematically from top leftto bottom right: normal stomach, adjustable gastric band, gastric by-pass, sleeve gastrectomy.
Adjustable gastric bypass is a simpler procedure in which an adjustable silasticband is placedaround the proximal fundus of the stomach to leave a pouch ofabout 15 to 30 ccs. A tube leads from the band to a port positioned subcuta-neously through which saline can be injected to tighten (or loosen) the band.Frequent adjustments of band filling are required and success is critically depen-dent on this process as well as the patient’s willingness and ability to adapt theirdiet and respond to the sense of fullness that the band produces. Weight lossesaverage 25%–30% at five years. Sleeve gastrectomy was originally introduced asa first step for patients at too high a surgical risk for a Roux-en-Y procedure, withthe intention to convert the gastrectomy to a bypass at a second operation after the
21 Obesity treatment for adults, adolescents and children
463

patient had lost some weight. The finding that sleeve gastrectomy led to similarweight loss and metabolic benefit as the full Roux-en-Y procedure led to enthu-siasm for this technically simpler procedure, but more recent evaluation suggestsweight-loss and metabolic improvement are less durable.
Bilio-pancreatic diversion with or without a duodenal switch procedure is amajor malabsorptive procedure that is not widely performed and has been lesswell evaluated than other procedures. Although weight loss may be 40%–60%,nutritional complications are frequent.
The most compelling data for the success of bariatric surgery at producingweight loss and improving the clinical outcomes for obese patients comes fromthe 15-year follow-up data of the Swedish Obese Subjects study (SOS) [24]. Thiswas a case controlled study, and the surgical techniques were not as advanced asperformed nowadays. The persistent weight loss in the surgical groups was as-sociated with a much reduced mortality: the unadjusted overall hazard ratio was0.76 in the surgery group (P = 0.04), as compared with the control group, andthe hazard ratio adjusted for sex, age and risk factors was 0.71 (P = 0.01). Otherstudies have confirmed that bariatric surgery is associated with reduced all-causemortality including deaths from cardiovascular disease, diabetes and cancer.
Bariatric surgery has important benefits in patients with type 2 diabetes thatextend beyond weight loss [14]. Up to 80% of people with type 2 diabetes mayexperience remission of their diabetes (normoglycaemia without the need forhypoglycaemic medication), the exact remission rate being determined by thetype of surgery and the duration of diabetes prior to surgery. Systematic re-views suggest that about 60% will have remission after gastric banding (and thatthe remission is of slower onset and more closely related to weight loss) com-pared to 80% after Roux-en-Y bypass, and 95% after bilio-pancreatic diversion.The International Federation of Diabetes position statement in 2011 concludesthat bariatric surgery: a) constitutes a powerful option to ameliorate diabetesin severely obese patients, often normalising blood glucose levels, reducing oravoiding the need for medications and providing a potentially cost-effective ap-proach to treating the disease; b) is an appropriate treatment for people with type2 diabetes and obesity not achieving recommended treatment targets with med-ical therapies; c) should be an accepted option in people who have type 2 diabetesand a BMI >35; and even d) an alternative treatment option in patients with aBMI between 30 and 35 when diabetes cannot be adequately controlled by op-timal medical regimen, especially in the presence of other major cardiovasculardisease risk factors [25].
Though it is effective for weight loss, the complications of bariatric surgeryare significant [26]. The mortality risks of surgery itself are <0.5% overall, al-though the risks for those individuals with pre-existing cardiovascular disease orother morbidity may be substantially higher. Short-term complications are sub-stantially lower with gastric banding compared to other procedures, but later
A modern epidemic
464

complications are common. Re-operation rates for ‘slipped’ bands or erosion ofthe band through the stomach wall may occur in as many as 30% of banded pa-tients after five years and a third may fail to lose or maintain weight loss [27].Other longer-term complications in gastric bypass patients include strictures, ex-cessive weight loss, and hypoglycaemic dumping. The latter appears to be drivenby excessive incretin, and hence insulin responses to (inappropriate) high-carbo-hydrate meals.
Figure 2. Weight trajectories from Swedish Obese Subjects study. Source: Sjöström L,Narbro K, Sjöström DC, Karason K, Larsson B, et al. (2007). Effects of bariatric surgeryon mortality in Swedish obese subjects. The New England Journal of Medicine, 357(8):747.
While bariatric surgery has much to offer, for optimal results highly experiencedsurgeons doing high volumes of surgery, in patients who have an adequate under-standing that surgery is an aid not a ‘quick fix’ to weight loss, and with excellentnutritional support and more general psychological counseling are needed.
DEVICESThere are a number of devices which have been used to manage obesity. One in
21 Obesity treatment for adults, adolescents and children
465

relatively common use is the intragastic balloon. This is placed endoscopically,inflated with fluid, and for the first week after placement the patient stays onVLEDs until the balloon becomes fixed. This device restricts eating and in arecent trial with obese subjects we have shown weight losses of 14% of initialbody weight at six months compared to 4.8% in controls who were treated witha lifestyle program [28]. After the balloon is removed at the six month time point,there is some weight regain but at 12 months there is still more weight lost bythe ‘balloon’ group (some 9% of initial weight), whilst those in the control groupmaintain their weight loss. There are side effects of the balloon, especially cramp-ing and vomiting, but those treated this way have a significant increase in theirmeasured quality of life. Other devices being investigated include endoduode-nal sleeves (a plastic sleeve which lines the duodenum) and gastric pacemakers.These too need to be placed endoscopically.
GENERAL ISSUESObviously many of those overweight or obese will already have an obesity-re-lated comorbidity, either metabolic or mechanical (these are discussed elsewherein this volume). These problems should be treated actively, but at the same timea weight-loss program should be instituted and conversely during a weight-lossprogram there should be active, effective treatment of such comorbidities. Weightloss can help improve these medical problems [29] and also reduce the medica-tions required to treat them [30], as well as improving quality of life.
At the same time care should be taken to not use, or minimise the use anddose of, drugs which may cause weight gain. These include antipsychotics andantidepressants, steroid therapy, anticonvulsants (especially valproate) and med-ications used to manage diabetes. Where possible an alternate drug which has noeffect on weight, or which can help weight loss should be chosen. For example,use of an SSRI such as fluoxetine in depression can promote weight loss, topira-mate is an anti-epileptic which promotes weight loss [31], metformin may produceor assist with weight loss and some of the newer anti-diabetic agents, such as theGLP1 agonists, promote weight loss.
MAINTENANCE OF WEIGHT LOSSThis is a vexed issue. Within three to five years of completed and effectiveweight-loss programs most of the weight loss will have been regained, thoughthere is increasing evidence these programs can be effective [32]. Even followingbariatric surgery, where there is substantial weight loss which can be maintainedfor years, there tends to be a slow regain (though not to initial weight). This regain
A modern epidemic
466

is due to ‘relaxation’ of the lifestyle program and is caused by underlying phys-iological drivers, such as elevated appetite hormones causing increased hunger,which force a reversion to old eating patterns (as an example).
There are some individuals who lose weight and do keep it off for years.These individuals undertake high levels of physical activity, eat breakfast andregular meals, a diet that is low in fat, and they self monitor which is a way ofcatching ‘slips’ early and correcting them. However, this type of response is notthe common one.
Does that mean weight-loss programs are always failures and thereforeshould not really be attempted? The answer to this is a resounding ‘no’ on at leasttwo counts. Firstly, weight loss does have an effect on many aspects: the controland prevention of disease, greater mobility, better quality of life and so on. Thereis even evidence from the diabetes prevention trials that a beneficial metaboliceffect, the so-called metabolic memory, persists for years after the program hasceased and even if weight is regained.
Secondly, most of the reported weight-loss ‘failures’ are the follow-up of asingle intervention. It is important that it is realised that the struggle against theissue of excess weight is a chronic, lifelong one. Programs need to be developedwhich include regular follow-up, which use pharmacotherapy to maintain loss,and have acute interventions if there is a small amount of regain (in our clinic weuse a regain of three kilograms as the trigger for a more intense effort). The US-based Look AHEAD program in people with type 2 diabetes is one such example[32]. Multidisciplinary chronic care programs will become even more necessaryas the cohort of those who have had bariatric surgery increases – this group willneed such lifetime follow-up. With the development of these long-term programsthere must be research on effectiveness and over time, long-term weight loss andmaintenance will be achieved.
MANAGEMENT OF OBESITY IN CHILDREN ANDADOLESCENTS: WHOM AND WHEN TO TREAT?
Presentations to healthcare settingsChildren and adolescents who are overweight or obese attend both primary andtertiary healthcare settings more frequently than might be expected from thebackground prevalence of this condition [33, 34, 35, 36]. This is probably becauseof the health complications linked to their weight status. However, they rarelypresent to the doctor specifically for the problem of obesity. In a large randomsample of Australian general practice surgeries, the BEACH study, 29.6% of two-to 18-year-olds were overweight or obese (11.4% overall were obese), comparedwith a background population prevalence of 23%–25% (5%–8% obese). Unfor-
21 Obesity treatment for adults, adolescents and children
467

tunately, these patients are unlikely to have the problem of obesity addressed bythe clinician. In the BEACH study, only 1:60 of those who were overweight orobese had any form of management provided for this issue [34].
Why might this situation be? While Australian general practitioners (GPs)state that they are committed to dealing with the consequences of obesity, theyalso cite a range of barriers to managing it, including inadequate time and reim-bursement, an apparent lack of effective interventions and support services, lowlevels of parent or patient motivation, the complexity and sensitivity of the issue,and the need for further training [37]. Families themselves are somewhat circum-spect about the role of GPs on this issue and do not see GPs as the primary sourceof advice about management of obesity in young people [38].
Indicators for treatmentSo, should children and adolescents affected by obesity seek or receive treatment,and, if so, where? As a general principle, assessment and treatment is especiallywarranted for the following individuals [39, 40, 41, 42]:
• Those who are moderately to severely obese• Adolescents• Those with obesity-associated complications, such as insulin resistance, ob-
structive sleep apnoea, psychosocial distress, fatty liver disease, cardio-meta-bolic risk factors, or orthopaedic complications
• Those with a high risk family history, such as parents, grandparents, siblingsor aunts/uncles with type 2 diabetes, premature heart disease, a history ofbariatric surgery, obstructive sleep apnoea, hypertension or dyslipidaemia
• Those from a high-risk ethnic group, where cardio-metabolic complicationsare more common, such as Aboriginal and Torres Strait Islanders, Maori andPacific people, those from Mediterranean or Middle-Eastern countries or theIndian subcontinent, and native Americans.
Where should treatment be provided?Given the high prevalence of child and adolescent obesity in most Westernised,and rapidly Westernising, countries, and its chronicity, coordinated models ofcare for health service delivery are needed. However, no country has yet es-tablished a cost-effective model of care for obesity management. One potentialapproach is that adapted from the UK National Health Service [43] and KaiserPermanente [44] chronic disease pyramid of care. This is based upon a tiered levelof service delivery relating to severity of disease.
Ideally, the vast majority of those affected by the problem of obesity shouldbe managed via self-care or family-based care, with support from GPs orcommunity-based health service providers. Such patients should be offered
A modern epidemic
468

healthy lifestyle counselling or community-based group programs. The next stageof management involves more targeted recommendations for behavioural change,supported by involvement of allied health professionals, such as dietitians, or,indeed, a multidisciplinary team of therapists. The final stage, which is offeredto children and adolescents with severe obesity, is provided by a specialist teamand may include provision of pharmacotherapy, very low energy diets, or evenbariatric surgery. The patient’s age, severity of obesity and obesity-associatedcomplications, and level of engagement with, and success of, previous interven-tions, should determine which stage of therapy is offered.
Unfortunately, such a staged approach to care is yet to be resourced or im-plemented widely in countries such as Australia. In reality, most children andadolescents who are affected by obesity will be managed by their GP, possiblywith some involvement of a practice nurse or dietitian. Certainly, those childrenor adolescents who have severe obesity should be assessed, and have their carecoordinated, by a paediatrician or adolescent physician, ideally with involvementof a multidisciplinary team of other therapists.
Lifestyle treatmentThe mainstay of treatment of obesity in this age-group, as in adults, is lifestylechange. What is the evidence for this?
The 2009 Cochrane review on the treatment of child and adolescent obesityincluded 64 randomised controlled trials [45]. No one specific treatment programwas recommended over another; however, positive outcomes were identified inseveral studies. A meta-analysis of several studies showed that family-targetedlifestyle intervention, involving various combinations of dietary, physical activityand behaviour modification, led to a significantly greater reduction in BMI orBMI z-score (ie BMI adjusted for age and sex) at six months than ‘standard care’.For children aged less than 12 years there was a modest average reduction of 0.06in BMI z-score, and in adolescents there was an average reduction of just overthree BMI units.
However, many published studies are limited by varying attrition rates, smallsample sizes, different measures of change in body size, and lack of assessmentof other outcomes (for example, broader medical, psychosocial and behaviouraloutcomes). And they have typically involved fairly homogeneous patient samplesmanaged in a tertiary care setting. Although recent trials are addressing some ofthese issues, much of the evidence to support effective intervention may not bereadily generalisable to other clinical settings. For example, ‘real-world’ obesityclinics are usually less well resourced than programs in clinical trials, and patientsseen in such clinics may be quite different from those who volunteer for trials.They may have more social disadvantage, or have psychosocial complicationsand other problems that make adherence to treatment more difficult. Not surpris-
21 Obesity treatment for adults, adolescents and children
469

ingly, therefore, studies in clinical practice have demonstrated poorer results thanin formal clinical trials [46]. Nevertheless, the broad principles of management arewell recognised and are outlined in Box 1.
Box 1. Principles of obesity management in children andadolescents
• management of obesity-associated comorbidities• family involvement• a developmentally appropriate approach• long-term behaviour modification• dietary change• increased physical activity• decreased sedentary behaviours• consideration of the use of pharmacotherapy and other forms of non-
conventional therapy• plan for longer-term weight maintenance strategies.
Effective management of obesity-associated comorbidities, such as sleep apnoea,dyslipidaemia, hypertension, non-alcoholic fatty liver disease or type 2 diabetesmellitus, is vital. Ideally, patients should be co-managed, in a coordinated way,by relevant specialist teams. In all cases, effective weight management should bea key element of the treatment of the comorbidity. Further discussion of the man-agement of these comorbidities is beyond the scope of this review.
Family focusMany clinical trials show that family-based interventions can lead to long-termrelative weight loss (that is, from two to ten years) [45, 47, 48, 49, 50]. Parental in-volvement is vital when managing obese younger children in particular [45, 48, 51,52, 53]. This makes sense, as parents are normally the people in the family who areresponsible for the food and physical activity environment, such as buying andcooking food, the types of routines around meals and meal times, rules aroundTV viewing and bed-time, role-modelling of eating and activity behaviours, andthe use of the family car.
A developmentally appropriate approachThe developmental age of the patient – whether they are pre-adolescent, or ado-lescent, or, indeed, whether they have a developmental disability – will influence
A modern epidemic
470
whether the patient per se is involved in treatment, and the type of parental en-gagement. A different approach is usually needed for pre-adolescent childrencompared to adolescents.
Pre-adolescent childrenWhen managing pre-adolescent children, a parent-focused intervention, withoutdirect engagement of the child, appears to have better outcomes to a child-centredapproach [50, 54]. Obese children aged six to 11 years and their parents were ran-domly assigned to either parent-only group sessions (with an emphasis on generalparenting skills), or child-only group sessions. At one and seven years follow-upfrom baseline, a significant reduction in overweight was observed in the parent-only group compared with the child-only group. At one year, there was a 14.6%reduction in overweight in the parent-only group versus 8.1% in the child-onlygroup (p <0.03), with a nine times greater dropout rate in the child-only group[50]. At the seven-year follow-up, 60% of the children in the parent-only group,versus 31% of those in the child-only group, were classified as non-obese [54].These and other studies suggest that when treating pre-adolescent children withobesity, therapy sessions involving the parent or parents alone, without the youngchild being present, could be the most effective.
AdolescentsThere are fewer studies looking specifically at treatment of adolescents affectedby obesity. The previously mentioned 2009 Cochrane review included 27 trialsinvolving participants aged 12 years and older [45]. Twelve studies used be-havioural lifestyle modification, ten involved drug therapy, three used physicalactivity, and two involved diet. Most included studies were of high intensity andwere offered in secondary or tertiary level care settings. Many offered separatesessions for adolescents and parents. In clinical practice, it may be useful to haveat least some of the session time just involving the adolescent and therapist, en-gaging the parent later.
Behaviour modificationBehaviour modification in weight management includes a set of techniques em-ployed to change thought processes and actions associated with eating, physicalactivity and sedentary behaviours [55]. Many trials of obesity management in chil-dren and adolescents have included a behavioural component, although these areoften poorly described. In general, the greater the range of behaviour change tech-niques used, the better the weight outcomes [48]. Goal setting, stimulus controland self-monitoring are three key behaviour change techniques used.
21 Obesity treatment for adults, adolescents and children
471

Goal setting can include performance goals (such as changing eating or ac-tivity behaviours) or outcome goals (such as specific weight loss). An example ofa well-specified goal is:
I will not buy any biscuits, chocolates or other high-fat foods during theweekly shopping. In order to make this easier, I will leave the children athome and shop on my own. If the children ask for junk food, then I willoffer yoghurt or fruit instead.
Considerable session time may be required to set and review behaviour changestrategies with families and young people [56].
Stimulus control refers to modifying or restricting environmental influencesto aid weight control. The broader environment, whether at home, school or be-yond, has a profound influence on a person’s decisions around eating, physicalactivity or sedentary behaviours. Although many of these environmental influ-ences are beyond the scope of an individual or family to change (for example,food marketing or food pricing), many opportunities exist for families to imple-ment stimulus control in the everyday environment. Examples include: not eatingin front of the television; not having television or other screens in bedrooms; us-ing smaller plates, bowls and spoons; and not storing unhealthy food choices inthe house [47].
Self-monitoring is the detailed recording of a specific behaviour and cancontribute to better weight control in children and adolescents [57]. This self-mon-itoring can take several forms: use of a food diary, television use diary, dailypedometer measurement of physical activity, or weekly weighing, as examples[58].
Motivational interviewing is a ‘client-centred, directive method for enhanc-ing intrinsic motivation to change by exploring and resolving ambivalence’ that isincreasingly being used in obesity management [59]. It requires an empathetic andcollaborative therapist who responds to the patient’s (or parent’s) ambivalenceto change in a nonjudgmental fashion. In addition, the therapist uses open-endedquestions and reflective listening techniques to help direct communication towardchange in behaviour [41, 59, 60].
DIETARY CHANGE AND EATING BEHAVIOURSA 2006 systematic review of paediatric obesity trials showed that interventionscontaining a dietary component were effective in achieving relative weight loss[61]. The Traffic Light (also known as the Stop Light) diet was the most com-monly used diet intervention. Briefly, in the Traffic Light diet, foods are colour-coded to indicate those to be eaten freely (green) and those to be eaten more
A modern epidemic
472

cautiously (amber and especially red) [55]. Although food or kilojoule exchangeprograms were also identified as common dietary interventions in the above re-view, only one trial compared diets of varying macronutrient composition. Sincethen, a substantial body of evidence has accumulated on the effects of dietswith different macronutrient profiles on weight loss or maintenance, especiallyin adults, with results tending to favour diets proportionately higher in proteinrelative to carbohydrate and with a low glycaemic index [62, 63, 64, 65, 66]. Forexample, results published in 2010 from the DiOGenes randomised controlledtrial compared the effect of five ad libitum diets (with variations in glycaemicindex and protein content) on body composition in European children: a low pro-tein–high glycaemic index diet increased body fat, whereas overweight or obesitydecreased in the high protein–low glycaemic index diet group [65].
What recommendations should currently be given? Dietary interventionsshould follow national nutrition guidelines and have an emphasis on the follow-ing [47, 52, 66, 67, 68]:
• regular meals• eating together as a family• choosing nutrient-rich foods that are lower in energy and glycaemic index• increased vegetable and fruit intake• healthier snack food options• decreased portion sizes• promotion of water as the main beverage, and a reduction in sugary drink in-
take• involvement of the entire family in making the change to a sustainable and
healthy food intake.
In advising patients and families on dietary change, is there a potential risk ofan eating disorder developing? Although most people with obesity do not havebinge-eating disorder, the more severe the obesity, the more likely the patient isto have binge-eating disorder [69]. In addition, obesity in childhood, or parentalobesity, is a risk factor for later bulimia, and overweight adolescents are morelikely to use a range of unhealthy behaviours to binge-eat [70]. On the other hand,evidence indicates that professionally run paediatric obesity programs do not in-crease the risk of disordered eating and might, indeed, improve psychologicalwellbeing [71]. For these reasons, Hill has highlighted the need for ‘properly andexpertly managed’ weight-control interventions to avoid the risk of an eating dis-order [72].
21 Obesity treatment for adults, adolescents and children
473

PHYSICAL ACTIVITY AND SEDENTARYBEHAVIOURS
Physical activityInvolvement of children in a lifestyle program (for example, walking, running,cycling or swimming, based on the family’s preference) leads to greater reduc-tions in percentage overweight at six months and 17 months when compared witha program of organised aerobic exercise involving the same prescribed level ofenergy expenditure [73]. A study of similar design, but including a third controlgroup involved in calisthenics, and with follow-up for ten years, showed thatthe lifestyle and aerobic exercise programs were superior in terms of percentageoverweight reduction to the calisthenics control group [74].
A systematic review and meta-analysis of exercise interventions in over-weight children and adolescents indicated that 155 to 180 minutes per week ofsupervised moderate-to-high intensity physical activity (with or without an as-sociated dietary intervention) was effective in reducing body fat, although theeffects on body weight and abdominal fat were inconclusive [75]. In 2008, the ef-fect of resistance training on metabolic fitness in children and adolescents wasinvestigated in a systematic review of 12 trials, with eight of them targetingpeople who were overweight or obese [76]. Most of the interventions includedin that review involved circuit-type resistance training (moderate–high velocity,low–moderate load) involving machine weights. Unfortunately, limitations instudy design and reporting prohibited definitive conclusions being established,but the beneficial effect of resistance training on health outcomes in adults wasnoted by the study authors.
Sedentary behavioursSeveral studies and clinical guidelines address the issue of targeting sedentarybehaviours. For example, in one study, 90 families of children aged eight to12 years with obesity were assigned to different arms of a behavioural weight-control program in which either sedentary behaviours or physical activity weretargeted, with two different levels of behaviour change being required. At two-year follow-up, similar improvements in aerobic fitness, body-fat percentage andpercentage overweight were observed for all treatment arms, indicating that mod-ifying sedentary behaviour is as effective as changing physical activity levels [77].
What recommendations can be given in terms of physical activity and reduc-tion of sedentary behaviour? [39, 41, 42, 43, 45, 68]
• Increased physical activity may best result from a change in incidental orunplanned activity; for example, walking or cycling for transport, householdchores, and playing with friends or family.
A modern epidemic
474

• Organised exercise programs, such as playing sports, are also important.• Encourage children or adolescents to choose activities that they enjoy as these
activities are more likely to be sustainable.• Limit television and other ‘small screen’ recreational viewing to less than two
hours per day. This may be extremely challenging given the multiple types ofscreen-based activities available to young people.
• Parental involvement is crucial if an increase in physical activity or a decreasein sedentary behaviour is to occur, including monitoring and limiting tele-vision use, role-modelling of healthy behaviours, and providing access torecreation areas or recreational equipment.
THE CHILDREN’S HOSPITAL BIG FIVEAt the Children’s Hospital at Westmead, in Sydney, five strategies are empha-sised when initially managing families with obese children or adolescents:
• Eat breakfast• Choose water as your main drink• Eat together as a family once a day, without the TV being on• Limit TV and other ‘small screens’ to less than two hours per day• Play, or be active, outside for at least 60 minutes each day.
ADJUNCTIVE THERAPYThe evidence to guide the use of less orthodox treatment approaches – such asVLEDs, pharmacological therapy or bariatric surgery – in the treatment of se-vere obesity is more limited than for behavioural interventions. In general, suchtherapies should occur on the background of a behavioural weight-managementprogram and be restricted to specialist centres with expertise in managing severeobesity.
Very low energy diets (VLEDs)As noted above, in adults, VLEDs are used to achieve rapid weight-loss prior to,or in conjunction with, the use of other longer-term treatment interventions [78].VLEDs can also be associated with safe and substantial rapid weight loss in ado-lescents, typically producing six to 15 kg weight loss over three to 12 weeks [79,80, 81]. However, most studies have been based on small sample sizes (less than 20participants) and have lacked a control group, with very few studies having long-term follow-up [82]. To date, no randomised controlled trials have examined theeffectiveness of a weight-management program incorporating initial VLED treat-
21 Obesity treatment for adults, adolescents and children
475

ment in obese adolescents. The US Expert Committee recommended that VLEDsshould ideally be used with severely obese patients who are managed by a mul-tidisciplinary team in a tertiary care setting. They are not appropriate for use inyoung children.
Pharmacology in the treatment of childhood and adolescentobesity
The use of most anti-obesity agents (whether previously or currently available,or in development) is off label for children and adolescents. These agents shouldnot be used in children and younger adolescents, as the risk outweighs the benefitand weight management depends primarily on parental control of the environ-ment. There will be exceptional cases when anti-obesity agents might be trialled,with the appropriate consents in place. This will usually be for secondary obesity,for example hypothalamic hyperphagia syndromes. Somatostatin analogues havealso been used with some success in children in this situation [83].
The choice of anti-obesity agents is limited and these should be prescribedas part of a lifestyle intervention, with diet and activity modification and behav-ioural intervention [84]. These agents may also be prescribed as part of bariatricsurgery considerations and to enhance weight maintenance after weight loss inthe older adolescent. As with adults, adolescents are likely to have unrealistic ex-pectations of the benefits of drug therapy and these expectations may be greaterin mid-adolescence when cognitive developmental stage limits their ability to un-derstand the degree of weight loss possible. Adolescents generally have a verylow tolerance for side effects and are likely to discontinue medication for tenuousreasons, including the lack of instantaneous benefit.
There is some data on orlistat use in adolescents with greater weight losscompared to placebo [84, 85]. The side effects of flatulence, diarrhoea with ur-gency and faecal leakage are highly socially distressing and for most adolescentsunacceptable. If they are prescribed orlistat they will simply not take it when theyhave a fatty meal away from home, which may be when most higher calorie mealsare consumed. For those who persist, careful monitoring of, and supplementationof, fat-soluble vitamins is important as adolescents appear more prone to defi-ciencies than adults.
Phentermine remains available in some jurisdictions and also for use in thoseover 12 years old. It has adverse effects including palpitations, headaches, hy-pertension, insomnia and euphoric states. Phentermine also has the potential forabuse and should not be used in adolescents, many of whom already have binge-eating disorders and will be seeking medication to produce some anorexia. Asdepression is often present in this situation, fluoxetine might be beneficial as acentrally acting psychotropic which does not induce weight gain.
There is some evidence in children and adolescents that metformin may have
A modern epidemic
476

a beneficial effect on body weight. It is the drug of choice in those with type2 diabetes, who are invariably overweight, as it does not induce further weightgain. There is some evidence from small trials that metformin improves meta-bolic profile and reduces visceral fat in clinical scenarios where there is insulinresistance and weight gain, but not overt diabetes. These trials include the useof atypical anti-psychotics, such as risperidone, which are frequently prescribedfor behavioural disturbances [86], and in medical conditions where physical ac-tivity is severely restricted [87]. The actual weight-loss results are less consistent.Metformin, also off label, may be advantageous in the obese adolescent femalewith the polycystic ovary syndrome and anovulatory bleeding or acanthosis ni-gricans. Both these conditions will improve and in some there may be a weightbenefit, based on some small clinical trials. It is essential that a low start doseof metformin is chosen, 250 mg daily commencing with the evening meal. Thedose should be built up to two grams over three to four weeks to minimise risk ofthe well-known side effects of abdominal pain and diarrhoea. Vitamin B12 levelsshould be monitored as the development of deficiency is not uncommon.
Puberty is a time where weight gain can accelerate in an overweight childor adolescent [88]. While it is clear from the previous discussion that there areno available pharmacotherapeutic agents to counter this, clinicians should care-fully consider prescription of commonly used drugs which may further increaseweight. Select if possible an oral contraceptive which contains one of the newergestagens, such as desogestrel or drospirenone. Consider etonogestrel, rather thanmedroxyprogesterone acetate as a long-acting contraceptive preparation.
Bariatric surgeryBariatric surgery is a well-recognised form of therapy for adults with severeobesity, especially if medical therapy has failed [89]. What about its role in ado-lescents? Almost all of the literature in this area is of case studies or case series,with only one published randomised controlled trial to date [90].
Evidence for bariatric surgery in adolescentsA 2008 systematic review of bariatric surgery for adolescent obesity includedstudies that reported outcome data for patients under the age of 21 years (averageage 16.8 years, range nine to 21) who were followed up for at least 12 months[91]. Nineteen papers were included, including eight studies of laparoscopic gas-tric banding, six studies of Roux-en-Y gastric bypass, and five studies of othersurgical procedures. The laparoscopic adjustable banding procedures, with one tothree years follow-up, had 95% confidence intervals for weight loss of –13.7 to–10.6 BMI units. No perioperative deaths were reported, and the main complica-tion reported was the need for re-operation (for band slippage), which occurred
21 Obesity treatment for adults, adolescents and children
477

in 8% of patients. For Roux-en-Y gastric bypass procedures, the mean weightloss was greater, with 95% confidence intervals of –17.8 to –22.3 BMI units,albeit over a longer period of follow-up (as the procedure has been establishedfor longer). Some deaths were reported after this type of surgery. The mostfrequently reported complications related to protein-energy malnutrition and mi-cronutrient deficiency. Note that none of the included studies in this systematicreview was a randomised controlled trial, and hence the strength of evidencecould only be classed as moderate to weak. However, these findings are similarto those seen in comparisons of bariatric surgery in adults [89].
After this review was published, the results of the first randomised controlledtrial of bariatric surgery in adolescents with severe obesity became available in2010 [90]. This study was undertaken in Melbourne and included 50 adolescentswith severe obesity (BMI >35 kg/m2) aged between 14 and 18 years who wererandomly assigned to receive either a supervised lifestyle intervention, involvingreduced energy intake, increased physical activity and behaviour modification, orlaparascopic adjustable gastric banding. By 24 months, the surgical group had anaverage reduction in BMI of 12.7 units, versus 1.3 units in the lifestyle group.The surgical group also had marked improvements in both cardiometabolic statusand quality of life. However, eight operations (33%) were required in seven pa-tients for revisional procedures.
Guidelines on bariatric surgeryIn 2009, Australian and New Zealand consensus recommendations for bariatricsurgery in adolescents were published by the professional bodies representingpaediatricians, paediatric surgeons and bariatric surgeons [92]. The recommenda-tions included the following:
• Patient: A minimum age of 15 years (or 14 years in exceptional circum-stances); post-pubertal; presence of severe obesity (a BMI >40 kg/m2, al-though it should be considered in adolescents with a BMI >35 kg/m2 in thepresence of severe obesity-associated complications); presence of an asso-ciated severe comorbidity; persistence of obesity despite involvement in aformal multidisciplinary and supervised program of lifestyle modification andpharmacotherapy; the adolescent and family understand, and are motivated toparticipate in, the ongoing treatment, lifestyle change and review followingsurgery; the adolescent is able to provide informed consent for the surgery.
• Surgical expertise and facilities: Surgery should be performed by an experi-enced bariatric surgeon affiliated with a team experienced in the assessmentand long-term follow-up of the metabolic and psychosocial needs of the ado-lescent bariatric patient and family; the working party strongly recommendedthat publicly funded bariatric surgery be made available to those in need.
A modern epidemic
478

• Type of surgery: The majority recommendation was that the primary bariatricsurgical procedure of choice for adolescents in Australia and New Zealand islaparoscopic adjustable gastric banding as it has good weight-based outcomes,has a low complication rate and is potentially reversible.
• Post-operative management and follow-up: Patients should be managed in theimmediate post-operative period by a surgeon and bariatric surgical team withexperience in adolescent care; adolescents will need more frequent post-oper-ative follow-up than adult patients (eg four to six on weekly basis initially);patients will need ongoing care by a multidisciplinary team; issues such as im-proved fertility following weight loss, and hence the need for contraception,need to be considered; follow-up needs to extend beyond ten years, and ideallyfor the whole life.
One of the major challenges in Australia, as elsewhere, is how to ensure equitableaccess to such services for affected adolescents.
LONG-TERM WEIGHT MAINTENANCEFew high-quality studies have reported long-term outcomes of treatment of child-hood and adolescent obesity [45]. In those which have reported long-term out-comes, a high proportion of participants maintained a reduction in overweightfrom two to ten years from baseline without additional intervention after the ini-tial treatment phase (weeks to months) [45, 67, 93, 94]. However, in those who haveundergone initial weight-management intervention, a period of further therapeu-tic contact (varying from four to 12 months) seems to slow weight regain [95].At present, there is only limited evidence to guide the nature and type of weight-maintenance interventions in the child and adolescent age group.
CONCLUSIONSObesity and overweight are common problems at most life stages. They producemany associated comorbidities and psychosocial issues contributing to substan-tial public health problems and costs.
Treatment can be, and is effective. A lifestyle program should be associatedclosely with the treatment. Such a multidisciplinary program includes appropriatehealthy eating, increased activity (both planned and incidental), behavioural tech-niques and counselling to help overcome ingrained habits and issues which maylead to weight gain. For children, the involvement of family in treatment is ab-solutely necessary. Finally, the program should not just be a ‘once-off’ becauseweight is regained due to physiological systems which drive appetite after weightloss. The program should be reinstituted or reinforced at regular intervals and
21 Obesity treatment for adults, adolescents and children
479

patients given a weight regain limit at which to return for a ‘booster’ program.A single treatment may be effective for those who need to lose a few kilos(5% or so of their initial weight), but for those with higher grades of obesity orcomplications of obesity, appropriate adjunctive therapies should be utilised andconsideration given, when necessary, to bariatric surgery.
References1. Caterson I (2009). Medical management of obesity and its complications.
Annals Academy of Medicine Singapore, 38: 22–27.2. Bjorvell H & Rossner S (1992). A ten-year follow-up of weight change in
severely obese subjects treated in a combined behavioural modification pro-gramme. International Journal of Obesity, 16(8): 623–25.
3. Jebb S, Ahern A, Olson A, Aston L, Holzapfel C, Stoll J, et al. (2011).Primary care referral to a commercial provider for weight loss treatment,relative to standard care: an international randomised controlled trial. TheLancet, 378(9801): 1485–92.
4. Sacks F, Bray G, Carey V, Smith S, Ryan D, Anton S, et al. (2009). Com-parison of weight-loss diets with different compositions of fat, protein andcarbohydrates. New England Journal of Medicine, 360: 859–73.
5. McMillan-Price J, Petocz P, Atkinson F, O’Neill K, Samman S, SteinbeckK, et al. (2006). Comparison of 4 diets of varying glycemic load on weightloss and cardiovascular risk reduction in overweight and obese young adults:a randomized controlled trial. Archives of Internal Medicine, 166: 1466–75.
6. Dansinger ML, Gleason JL, Griffith JL, Selker HP & Schaefer EJ (2005).Comparison of the Atkins, Ornish, Weight Watchers, and Zone diets forweight loss and heart disease risk reduction: a randomized trial. Journal ofthe American Medical Association, 293(1): 43–53.
7. Despres JP, Tremblay A, Nadeau A & Bouchard C (1988). Physical trainingand changes in regional adipose tissue distribution. Acta Medica Scandinav-ica, Supplementum, 723: 205–12.
8. Despres JP & Lamarche B (1993). Effects of diet and physical activity onadiposity and body fat distribution: implications for the prevention of cardio-vascular disease. Nutrition Research Reviews, 6(1): 137–59.
9. Despres J-P, Pouliot M-C, Moorjani S, Nadeau A, Tremblay A, Lupien PJ,
A modern epidemic
480

et al. (1991). Loss of abdominal fat and metabolic response to exercise train-ing in obese women. American Journal of Physiology, 261(2): E159–E67.
10. Wadden TA & Clark VL (2005). Behavioural treatment of obesity: achieve-ments and challenges. In PG Kopelman, ID Caterson & WH Dietz (Eds).Clinical obesity in adults and children. (pp350–62). 2nd edn. Malden OxfordCarlton: Blackwell.
11. Richman RM, Steinbeck KS & Caterson ID (1992). Severe obesity: the useof very low energy diets or standard kilojoule restriction. Medical Journal ofAustralia, 156(11): 768–70.
12. Flechtner-Mors M, Ditschuneit HH, Johnson TD, Suchard MA & Adler G(2000). Metabolic and weight loss effects of long-term dietary interventionin obese patients: four-year results. Obesity Research, 8(5): 399–402.
13. Lau N & Caterson I (2011). Meal replacement products and very low caloriediets in adult obesity. Royal College of Pathologists Bulletin, 155: (172–74).
14. Dixon J, O’Brien PE, Playfair J, Chapman L, Schachter LM, Skinner S, etal. (2008). Adjustable gastric banding and conventional therapy for type 2diabetes: a randomized controlled trial. Journal of American Medical Asso-ciation, 299(3): 316–23.
15. Lean M & Finer N (2006). ABC of obesity. Management: Part II – Drugs.British Medical Journal, 333(7572): 794–97.
16. Padwal R & Majumdar S (2007). Drug treatments for obesity: orlistat, sibu-tramine, and rimonabant. The Lancet, 369(9555): 71–77.
17. James W, Caterson I, Coutinho W, Finer N, Van Gaal L, Maggioni A, et al.(2010). Effect of sibutramine on cardiovascular outcomes in overweight andobese subjects. New England Journal of Medicine, 363(10): 309–17.
18. Swinburn BA, Carey D, Hills AP, Hooper M, Marks S, Proietto J, et al.(2005). Effect of orlistat on cardiovascular disease in obese adults. DiabetesObesity and Metabolism, 7(3): 254–62.
19. Caterson ID (1988). Overweight, obesity and the role of the pharmacist.Australian Pharmacist, 7: 13–16.
20. Wittert G, Caterson I & Finer N (2007). The clinical effectiveness of weightloss drugs. Journal of Obesity Research and Clinical Practice, 1(1): 1–5.
21. Astrup A, Carraro R, Finer N, Harper A, Kunesova M, Lean M, et al. (2011).Safety, tolerability and sustained weight loss over 2 years with the once-dail
21 Obesity treatment for adults, adolescents and children
481

human GLP-1 analog, liraglutide. International Journal of Obesity, Advanceonline publication, 16 August 2011.
22. Gadde K & Allison D (2009). Combination therapy for obesity and meta-bolic disease. Current Opinion in Endocrinology, Diabetes and Obesity,16(5): 353–58.
23. Greenway F, Fujioka K, Plodkowski R, Mudaliar S, Guttadauria M, Erick-son J, et al. (2010). Effect of naltrexone plus bupropion on weight loss inoverweight and obese adults (COR-I): a multicentre, randomised, double-blind, placebo-controlled, phase 3 trial. The Lancet, 376(9741): 595–605.
24. Sjostrom L, Narbro K, Sjostrom C, Karason K, Larsson B, Wedel H, et al.(2007). Effects of bariatric surgery on mortality in Swedish obese subjects.New England Journal of Medicine, 357: 741–52.
25. Panel IDFC (2011). Bariatric surgical and procedural interventions in thetreatment of obese patients with type 2 diabetes: a position statement fromthe International Diabetes Federation Taskforce on Epidemiology and Pre-vention. September [Online]. Available: www.idf.org/webdata/Bariatric-Surgery-Press-Briefing.pdf [Accessed 24 October 2011].
26. Padwal R, Klarenbach S, Wiebe N, Birch D, Karmali S, Manns B, et al.(2011). Bariatric surgery: a systematic review and network meta-analysis ofrandomized trials. Obesity Reviews, 12: 602–21.
27. Tice J, Karliner L, Walsh J, Petersen A & Feldman M (2008). Gastric band-ing or bypass? A systematic review comparing the two most popular bariatricprocedures. American Journal of Medicine, 121: 885–93.
28. Fuller N, Pearson S, Lau N, Markovic T, Steinbeck K, Chettiar R, et al.(2010). A prospective, randomized, controlled trial of the bioenterics intra-gastric balloon (BIB) in the treatment of obese individuals with the metabolicsyndrome. Obesity Reviews, 11(Suppl. 1): 436.
29. Unick J, Beavers D, Jakicic J, Kitabachi A, Knowler W, Wadden T, et al.(2011). Effectiveness of lifestyle interventions with severe obesity and type 2diabetes: results from the Look AHEAD trial. Diabetes Care: (Aug 11) epubahead of print.
30. Group TLAR (2007). Reduction in weight and cardiovascular disease riskfactors in individuals with type 2 diabetes: one-year results of the lookAHEAD trial. Diabetes Care, 30: 1374–83.
A modern epidemic
482

31. Astrup A, Caterson I, Zelissen P, Guy-Grand B, Carruba M, Levy B, et al.(2004). Topiramate for long-term weight maintenance of weight loss inducedby a low-calorie diet in obese subjects. Obesity Research, 12: 1658–69.
32. Wing R & Group LAR (2010). Long-term effects of a lifestyle interventionon weight and cardiovascular risk factors in individuals with type 2 diabetesmellitus: four-year results of the Look AHEAD trial. Archives of InternalMedicine, 170: 1566–75.
33. Benson L, Baer H & Kaelber D (2007). Trends in the diagnosis in over-weight and obesity in children and adolescents: 1999–2007. Pediatrics, 123:e153–e8.
34. Cretikos M, Valenti L, Britt H & Baur L (2008). General practice man-agement of overweight and obesity in children and adolescents in Australia.Medical Care, 4: 1163–69.
35. O’Connor J, Youde L, Allen J & Baur L (2004). Obesity and under-nutritionin a tertiary paediatric hospital. Journal of Paediatrics and Child Health, 40:299–304.
36. Woo J, Zeller M, Wilson K & Inge T (2009). Obesity identified by dischargeICD-9 codes underestimates the true prevalence of obesity in hospitalisedchildren. Journal of Paediatrics, 154: 327–31.
37. King L, Loss J, Wikenfeld, Pagnini D, Booth M & Booth S (2007). Aus-tralian GPs’ perceptions about child and adolescent overweigth and obesity:the Weight of Opinion study. British Journal of General Practice, 57:124–29.
38. Shrewsbury V, King L, Hattersley L, Howlett S, Hardy L & Baur L (2010).Adolescent-parent interactions and communication preferencesregardingbody weight and weight management: a qualitative study. The InternationalSociety of Behavioral Nutrition and Physical Activity, 7: 16.
39. Barlow S & The Expert Committee (2007). Expert Committee recommen-dations regarding the prevention, assessment, and treatment of children andadolescent overweight and obesity: summary report. Pediatrics, 120(Suppl.4): S164–S92.
40. Krebs N, Himes J, Jacobson D, Nicklas T, Guilday P & Styne D (2007).Assessment of child and adolescent overweight and obesity. Pediatrics,120(Suppl. 4): S193–S228.
21 Obesity treatment for adults, adolescents and children
483

41. National Health and Medical Research Council (2003). Clinical practiceguidelines for the management of overweight and obesity in children andadolescents. Canberra: NHMRC.
42. Network SIG (2007). Management of obesity: a national clinical guideline.Edinburgh: SIGN.
43. National Institute for Health and Clinical Excellence (2010). Obesity: guid-ance on the prevention, identification, assessment and management of over-weight and obesity in adults and children. National Health Service NationalInstitute for Health and Clinical Excellence [Online]. Available: guid-ance.nice.org.uk/CG43/NICEGuidance/pdf/English [Accessed 2011].
44. Feacham R, Sekhri N & White K (2002). Getting more for their dollar: acomparison of the NHS with California’s Kaiser Permanente. British Med-ical Journal, 324: 135–41.
45. Luttikhuis HO, Baur L, Jansen H, Shrewsbury V, O’Malley C, Stolk R, etal. (2009). Interventions for treating obesity in children. Cochrane Databaseof Systematic Reviews, 1.
46. Reinehr T, Widhalm K, L’Allemand D, Wiegand S, Wabitsch M, Holl R,et al. (2009). Two-year follow-up in 21,784 overweight children and adoles-cents with lifestyle intervention. Obesity, 17: 1196–99.
47. Dietz W & Robinson T (2005). Clinical practice: overweight children andadolescents. New England Journal of Medicine, 352: 2100–09.
48. McLean N, Griffin S, Toney K & Hardeman W (2003). Family involvementin weight contril, weight maintenance and weight-loss interventions: a sys-tematic review of randomised trials. International Journal of Obesity, 27:987–1005.
49. Nuutinen O & Knip M (1992). Predictors of weight reduction in obese chil-dren. European Journal of Clinical Nutrition, 46: 785–94.
50. Golan M, Weizman A, Apter A & Fainaru M (1998). Parents as the ex-clusive agents of change in the treatment of childhood obesity. AmericanJournal of Clinical Nutrition, 67: 1130–35.
51. Nowicka P & Flodmark C-E (2008). Family in pediatric obesity man-agement: a literature review. International Journal of Pediatric Obesity,3:(Suppl. 1): 44–50.
52. Young K, Northern J, Lister K, Drummond J & O’Brien W (2007). A meta-
A modern epidemic
484

analysis of family-behavioural weight-loss treatments for children. ClinicalPsychology Reviews, 27: 240–49.
53. Shrewsbury V, Steinbeck K, Torvaldsen S & Baur L (2011). The role ofparents in pre-adolescent and adolescent overweight and obesity treatment:a systematic review of clinical recommendations. Obesity Reviews, 12(10):759–69.
54. Golan M & Crow S (2004). Targeting parents exclusively in the treatmentof childhood obesity: long-term results. Obesity Research, 12: 357–61.
55. Epstein L, Myers M, Raynor H & Saelens B (1998). Treatment of pediatricobesity. Pediatrics, 101(Suppl. 2): 554–70.
56. Brennan L, Walkley J, Lukeis S, Rsiteska A, Archer L, et al. (2009). Acognitive behavioural intervention for overweight and obese adolescents il-lustrated by four case studies. Behaviour Change, 26: 190–213.
57. Saelens B & McGrath A (2003). Self-monitoring adherence and adolescentweight control efficacy. Child Health Care, 32: 137–52.
58. Alm M, Neumark-Sztainer D, Story M & Boutelle K (2009). Self-weighingand weight control behaviors among adolescents with a history of over-weight. Journal of Adolescent Health, 44: 424–30.
59. Miller W & Rollnick S (2002). Motivational interviewing: preparing peoplefor change. 2nd edn. New York: Guildford Press.
60. Carels R, Darby L, Cacciapaglia H, Konrad K, Coit C, Harper J, et al.(2007). Using motivational interviewing as a supplement to obesity treat-ment: a stepped care approach. Health Psychology, 26: 369–74.
61. Collins C, Warren J, Neve M, McCoy P & Stokes B (2006). Measuring ef-fectiveness of dietetic interventions in child obesity: a systematic review ofrandomised trials. Archives of Pediatric and Adolescent Medicine, 160(9):906–22.
62. Abete I, Astrup A, Martinez J, Thorsdottir I & Zulet M (2010). Obesity andthe metabolic syndrome: role of different dietary macronutrient distributionpatterns and specific nutritional components on weight loss and mainte-nance. Nutrition reviews, 68(4): 214–31.
63. Hession M, Rolland C, Kulkarni U, Wise A & Broom J (2009). Systematicreview of randomised controlled trials of low-carbohydrate vs. low fat/low-calorie diets in the management of obesity and its comorbidities. Obesity
21 Obesity treatment for adults, adolescents and children
485

Reviews, 10(1): 36–50.64. Thomas DE, Elliott EJ, Baur L (2007). Low glycaemic index or low gly-
caemic load diets for overweight and obesity Low glycaemic index or lowglycaemic load diets for overweight and obesity. Cochrane Database of Sys-tematic Reviews. Issue 3. Article number CD005105.
65. Papadaki A, Linardakis M, Larsen T, VanBaak M, Lindroos A, Pfeiffer A, etal. (2010). The effect of protein and glycemic index on children’s body com-position: the DIOGenes randomised study. Pediatrics, 126(5): E1143–E52.
66. Larsen T, Dalskov S, VanBaak M, Jebb S, Papadaki A, Pfeiffer A, et al.(2010). Diets with high or low protein content and glycemic index for weightloss maintenance. New England Journal of Medicine, 363(22): 2102–13.
67. Epstein L, Valoski A, Wing R & McCurley J (1990). Ten-year follow-up ofbehavioral, family based treatment for obese children. Journal of the Ameri-can Medical Association, 264(19): 2519–23.
68. Whitaker R (2003). Obesity prevention in pediatric primary care: four be-haviors to target. Archives of Pediatric and Adolescent Medicine, 157(8):725–27.
69. Fairburn C, Welch S, Doll H, Davies B & O’Connor M (1997). Riskfactors for bulimia nervosa: a community-based case-control study. Archivesof General Psychiatry, 54(6): 509–17.
70. Patton C, Selzer R, Coffey C, Carlin J & Wolfe R (1999). Onset of ado-lescent eating disorders: population-based cohort study over 3 years. BritishMedical Journal, 318(7186): 765–68.
71. Butryn M & Wadden T (2005). Treatment of overweight in children andadolescents: does dieting increase the risk of eating disorders? InternationalJournal of Eating Disorders, 37(4): 285–93.
72. Hill A (2007). Obesity and eating disorders. Obesity Reviews, 8(Suppl. 1):151–55.
73. Epstein L, Wing R, Koeske R & Valoski A (1982). A comparison of lifestylechange and programmed exercise on weight and fitness in obese children.Behavior Therapy, 16(4): 345–56.
74. Epstein L, Valoski A, Wing R & McCurley J (1994). Ten year outcomes ofbehavioral family-based treatment for childhood obesity. Health Psychology,13(5): 373–83.
A modern epidemic
486

75. Atlantis F, Barnes E & Singh M (2006). Efficacy of exercise for treatingoverweight in children and adolescents: a systematic review. InternationalJournal of Obesity, 30(7): 1027–40.
76. Benson A, Torode M & FiataroneSingh M (2008). Effects of resistancetraining on metabolic fitness in children and adolescents: a systematic re-view. Obesity Reviews, 9(1): 43–66.
77. Epstein L, Paluch R, Gordy C & Dorn J (2000). Decreasing sedentary be-haviors in treating pediatric obesity. Archives of Pediatric and AdolescentMedicine, 154(3): 220–26.
78. Tsai A & Wadden T (2005). Systematic review: an evaluation of majorcommercial weight loss programs in the United States. Annals of InternalMedicine, 142(1): 56–66.
79. Figueroa-Colon R, VonAlmen T, Franklin F, Schuftan C & Suskind R(1993). Comparison of two hypocaloric diets in obese children. AmericanJournal of Disease in Childhood, 147(2): 160–66.
80. Suskind R, Sothern M, Farris R, VonAlmen T, Schumacher H, Carlisle L, etal. (1993). Recent advances in the treatment of childhood obesity. Annals ofthe New York Academy of Sciences, 699: 181–99.
81. Widhalm K & Zwiauer K (1987). Metabolic effects of a very low caloriediet in obese children and adolescents with special reference to nitrogen bal-ance. Journal of the American College of Nutrition, 6(6): 467–74.
82. Sothern M, Udall J, Suskind R, Vargas A & Blecker U (2002). Weight lossand growth velocity in obese children after very low calorie diet, exerciseand behavior modification. Acta Paediatrica, 89(9): 1036–43.
83. Tzotzas T, Papazisis K, Perros P & Krassas G (2008). Use of somatostatinanalogues in obesity. Drugs, 68(14): 1963–73.
84. Greydanus D, Bricker L & Feucht C (2011). Pharmacotherapy for obeseadolescents. Pediatric Clinics of Noth America, 58(1): 139–53.
85. Chanoine JP, Hampi S, Jensen C, Boldrin M & Hauptman J (2005). Effectof orlistat on weight and body composition in obese adolescents: a random-ized controlled trial. Journal of the American Medical Association, 293(23):2873–83.
86. Shin L, Bregman H, Breeze J, Noyes N & Frazier J (2009). Metforminfor weight controlin pediatric patientson atypical antipsychotic medication.
21 Obesity treatment for adults, adolescents and children
487

Journal of Child and Adolescent Psychopharmacology, 19(3): 275–79.87. Casteels K, Fieuws S, VanHelvoirt M, Verpoorten C, Goermans N,
Coudyzer W, et al. (2010). Metformin therapy to reduce weight gainandvisceral adiposity in children and adolescents with neurogenic or myogenicmotor deficit. Pediatric Diabetes, 11(1): 61–69.
88. Jasik C & Lustig R (2008). Adolescent obesity and puberty: the ‘perfectstorm’. Annals of the New York Academy of Sciences, 1135: 265–79.
89. Colquitt J, Picot J, Loveman E & Clegg A (2009). Surgery for obesity.Cochrane Database of Systematic Reviews, 2.
90. O’Brien P, Sawyer S, Laurie C, Brown W, Skinner S & Veit F (2010).Laparoscopic adjustable gastric banding in severely obese adolescents: arandomized trial. Journal of the American Medical Association, 303(23):519–26.
91. Treadwell J, Sun F & Schoelles K (2008). Systematic review and meta-analysis of bariatric surgery for pediatric obesity. Annals Surgery, 248(5):763–76.
92. Baur L & Fitzgerald D (2010). Recommendations for bariatric surgery inadolescents in Australia and New Zealand. Journal of Paediatrics and ChildHealth, 46(12): 704–07.
93. Magarey A, Perry R, Baur L, Steinbeck K, Sawyer M, Hills A, et al. (2011).A parent-led family-focused treatment program for overweight 5–9 yearolds: the PEACH RCT. Pediatrics, 127: 214–22.
94. Collins C, Okely A, Morgan P, Jones R, Burrows T, Cliff D, et al. (2011).Parent diet modification, child-centered activity or both in obese children: anRCT. Pediatrics, 127(4): 619–27.
95. Wilfley D, Stein R, Saelens B, Mockus D, Matt G, Hayden-Wade H, et al.(2007). Efficacy of maintenance treatment approaches for childhood over-weight: a randomised controlled trial. Journal of the American MedicalAssociation, 298(14): 1661–73.
A modern epidemic
488

22A ‘cure’ for diabetes and its compli-
cationsKim Donaghue,1,2 Tony Keech,3,4 Maria Craig5,6 and Philip O’Connell7
The new millennium has brought continued hope for a ‘cure’ with majordevelopments in immunology and understanding of pathogenesis of dia-betes and its complications. Intervention studies to slow the progressionof beta-cell destruction by using insulin to induce immune tolerance haveshown promise in some subsection analysis but without overall benefitfor primary outcome. The ongoing INIT 11 study delivers insulin nasally.The TRIGR study eliminates cow milk in babies at risk with promisingeffect for antibody generation. Stem cells also offer promise. Islet celltransplantation from cadavers is minimally invasive and has shown greatpromise, but has been slowed due to lack of donors and immunosup-pression needs. For those with established diabetes, randomised controlledtrials have demonstrated minimising and slowing of progression of diabetesvascular complications. These interventions include intensive glycaemictreatment, blood pressure lowering and lipid lowering agents. Good ran-domised controlled clinical trials provide the best evidence of these ben-efits, which must then be followed by more research to better understandmechanisms of disease pathogenesis and treatment effects.
The elusive cure for diabetes is a dream of many individuals and their familieswho live with diabetes. Increasing numbers of children are now diagnosed with
1 Children’s Hospital, Westmead.2 Discipline of Paediatrics and Child Health, Sydney Medical School, University of
Sydney.3 Sydney Medical School, University of Sydney.
4 NHMRC Clinical Trials Centre, University of Sydney.5 St George Hospital.
6 School of Women’s and Children’s Health, University of New South Wales.7 Centre for Transplant and Renal Research, Westmead Millennium Institute for
Medical Research.
489

diabetes, with the prevalence in Australia recently reported to be one in 724 chil-dren aged less than 15 years, and one in 391 adolescents aged ten to 14 years [1].Much clinical research is making this dream closer to delivery. Family membersare enrolling in natural history and clinical intervention trials to help understand,delay and hopefully stop the disease.
Research to cure diabetes is now multipronged. A number of studies havefocused on predicting risk, which then has allowed development of studies tointervene in the prediabetes period, before the glucose levels are abnormal. Treat-ment within the first 100 days after the clinical diagnosis to switch off theimmune process or boost the immune defenses is currently under investigation.Research aimed at curing established diabetes uses cell-based therapies includingtransplantation of islets, the insulin-producing beta cell. Such therapies currentlyrequire immunosuppression to prevent rejection and recurrence of the initial dia-betogenic process.
Type 1 diabetes is an autoimmune disease, meaning that the body fights itselfby activation of the immune system and not recognising the pancreas beta cells as‘self’ but as ‘foreign’. Our understanding of this loss of ‘self-tolerance’, is pivotalto development of a cure with many intervention trials now aimed at ‘inducingself-tolerance’. In the development of diabetes there is activation of both arms ofthe immune system: humoral immunity (antibody production by B lymphocytes)and cellular immunity (T lymphocytes). We can measure antibodies with rela-tive ease but measurement of T-cell function is more difficult. Most interventionstudies use antibodies to identify the population at risk for diabetes, and use anti-bodies as a surrogate marker of progression. However T-cell activation precedesantibody production.
Figure 1. Progression of beta-cell failure in type 1 diabetes.
A modern epidemic
490

We now know that the autoimmune process occurs in individuals who are genet-ically predisposed and that this process appears to be triggered by environmentalfactors, including viral infection (Figure 1). The autoimmune reaction results inloss of beta-cell mass and hence function which occurs over months to years,during which time prevention may be possible (preclinical preservation). The in-sulin response to glucose given intravenously is a well-established method tomeasure beta-cell function in this preclinical phase, prior to abnormal glucoselevels. After clinical diagnosis and/or presentation with hyperglycaemia, there isstill some functioning pancreas or beta-cell function. This remaining function re-sults in the well-recognised ‘remission phase’ during which exogenous insulinrequirements can be reduced substantially. Clinical diabetes intervention aims topreserve beta-cell function. This can be measured by C peptide production in re-sponse to stimuli, as C peptide is secreted by the beta cell at the same time asinsulin.
For those with established diabetes, as detailed in other chapters in diabetescomplications (Twigg and McLennan), the risks of long-term end-organ diabetescomplications can be reduced by risk factor minimisation targeted at modificationof lipids, blood pressure as well as glucose (Figure 2).
Figure 2. Overview of pathogenesis of long-term vascular complications andmodifiers of glucose action.
STUDIES TO UNDERSTAND THE GENETIC AND
22 A ‘cure’ for diabetes and its complications
491

ENVIRONMENTAL RISKSThe Type 1 Diabetes Genetics Consortium (T1DGC) is an international projectdesigned to identify genes that modify the risk of diabetes. Families with two ormore members with type 1 diabetes have provided blood for this purpose, throughfour regional centres (Asia Pacific, Europe, UK and North America). More than2500 families to date have contributed. It is sponsored by US National Institutefor Diabetes and Digestive and Kidney Diseases (NIDDK) and the Juvenile Di-abetes Research Foundation (JDRF) [2]. The major genetic risk is still locatedon the HLA region, but others genes have been identified, including other im-munoregulatory genes [3]. The Australian National Health and Medical ResearchCouncil (NHMRC) is currently funding the Australian Childhood Diabetes DNARepository (ACDDR), for family members with type 1 and type 2 diabetes, whocontribute saliva from which genetic material is derived for subsequent analy-sis. Further the Type 1 Diabetes TrialNET is an international consortium aimedat understanding natural history, in particular antibodies, in family members andundertakes prevention and intervention trials. Family members can enroll for an-tibody screening at 200 sites worldwide, in North America, Australia and Europe.
The charmingly named TEDDY study (The Environmental Determinants ofDiabetes in the Young) aims to determine infectious agents, dietary factors orother that may impact on diabetes development in children at high risk based onHLA genotyping. Recruitment has been from three centres in the US (Colorado,Washington and Georgia/Florida) and three centres in Europe (Finland, Germanyand Sweden). Children from the general population as well as children from fam-ilies placing them at high risk are recruited [4].
Infections have long been considered to be possible environmental triggersfor the autoimmune process. Transmission of enteroviruses occurs by sheddingfrom the respiratory or gastrointestinal tracts. A recent meta-analysis of 26 case-control studies showed a tenfold increase of enterovirus infection in patient atdiabetes onset compared to controls [5]. In addition children were nearly fourtimes more likely to have autoimmunity to the pancreas when there was mole-cular evidence of enterovirus (by finding RNA or viral protein in blood, stoolor tissue). This meta-analysis was based on studies from 12 countries, mostly ofchildren but some studies included adults up to the age of 53 years.
While there is a clear distinction between type 1 and type 2 diabetes in termsof pathogenesis, greater weight gain may also be an initiator and/accelerator forautoimmunity and type 1 diabetes. Younger age of diabetes onset is associatedwith higher body mass index (BMI) at diagnosis, particularly in very young chil-dren [6, 7]. Retrospective case control studies have demonstrated increased lineargrowth and weight gain in early childhood, independent of feeding, with type 1diabetes [8, 9, 10, 11]. The Australian BabyDiab study has followed babies with afirst-degree relative with diabetes (parents or siblings) from birth to six years of
A modern epidemic
492

age. Children with weight above average had more than twofold increase in anti-body development than thinner children [12]. Those that gained the most weightduring infancy also had an increased risk of islet autoimmunity. Insulin resis-tance, and associated inflammation, may underlie the role of overweight in thedevelopment of type 1 diabetes [13]. Insulin resistance predicted progression fromislet autoimmunity to type 1 diabetes [14] and was greater in young children withislet autoimmunity in the German BabyDiab study [15]. Therefore, insulin resis-tance associated with overweight may be a key factor in both the developmentand progression of islet autoimmunity. The process may begin in utero; maternalweight before pregnancy and more than 15 kg weight gain during pregnancy pre-dicted risk of islet autoimmunity in their offspring [16].
Vitamin D is an anti-inflammatory steroid with multiple immunomodulatoryeffects that can promote immune tolerance, however its role in type 1 diabetesremains controversial. A systematic review of observational studies examinedwhether vitamin D supplementation in infancy reduced the risk of type 1 diabetesin later life [17]. Infants who were supplemented with vitamin D had 29% lowerrisk of developing type 1 diabetes compared to those who were not supplemented.There was also some evidence of a dose–response effect, with those using largeramounts of vitamin D being at lower risk of developing type 1 diabetes. However,there are no randomised controlled trials examining the effect of vitamin D sup-plementation and type 1 diabetes risk.
IMMUNOMODULATORY TRIALSWith most autoimmune diseases the main focus of therapy is to treat the abnormalimmune response with immunosuppression. Diabetes, however, presents later inthe autoimmune process when it is estimated more than 90% of islet function isdestroyed, so immunosuppression may not be comparable to other autoimmunediseases some of which are relapsing. Nevertheless, recently a number of largermulticentre studies have reported the outcomes of short-term immunosuppressionin new onset diabetes. Many of these treatments are currently marketed for thetreatment of rheumatoid arthritis with good safety profiles. Therapy has aimed tomodulate T-cell action, or reduce B cells with some success.
One TrialNET study used abatacept, which modulates T-cell co-stimulation,preventing full T-cell activation. In this study 112 newly diagnosed patients wererandomised to either treatment or placebo injections at day 1, 14, 28 and thenmonthly for two years. There was a positive effect of the intervention with preser-vation of C peptide reserve for 9.6 months compared to the placebo treated groupbut this declined in parallel, meaning the effect was short term [18].
Another TrialNET used anti-CD20 monoclonal antibody, rituximab, whichdepletes B cells. In 78 newly diagnosed patients aged between eight and 40 years,
22 A ‘cure’ for diabetes and its complications
493

the intervention compared to placebo showed positive effects for preservation ofC-peptide production, glucose control and lower insulin dose [19].
The Protégé study used teplizumab, anti-CD3 therapy, which binds to T-cellsand modulates their action. Enrolled were 516 subjects aged from eight to 35years, within 12 weeks of diabetes onset in 83 centres across North America, Eu-rope, India and Israel. The primary endpoint was a significant treatment effect atone year of insulin dose <0.5 units/kg/day with HbA1c <6.5%. Whilst this out-come was not achieved, a positive treatment effect was found in children agedfrom eight to 11 years, and earlier treatment within six weeks of diagnosis [20].
INDUCING IMMUNE TOLERANCE:ANTIGEN-BASED THERAPY
Glutamic acid decarboxylase (GAD) is a principle target (or antigen) for autoim-munity antibody production in diabetes. Consequently GAD therapy (two or threeGAD injections or placebo) has been trialled after onset of clinical diabetes inpatients aged three to 45 years. The initial pilot study in adolescents with two in-jections of GAD was promising, but the 15-site North American clinical trial wasunsuccessful in preserving beta-cell function in the 145 participants [21].
For those in the prediabetes phase, the autoimmune process may be turnedoff by a process of ‘immune tolerance’. Induction of immune tolerance has beensought by using GAD and by insulin itself to which antibodies are made in theprediabetes phase.
Prediction to progression of diabetes has focused on measurement ofdiabetes-associated antibodies in family members. Models are derived wherebythere is a 26%–50% chance of progression to diabetes within five years based onthe presence of positive antibodies.
The first trial to use insulin itself as the intervention was the Diabetes Preven-tion Trial – Type 1 Diabetes (DPT-1) [22]. In one arm low-dose insulin was givenby injection to those at highest risk to progression (greater than 50%), and in theother arm insulin was given orally to those with moderate risk of progression.Unfortunately 241 of 670 developed diabetes at a mean age of 13.9 years. Thenumbers required to screen, in this case using the islet cell antibody, were veryhigh: 103,000 relatives of T1 D patients. Whilst the analysis of the total group ofparticipants did not show a positive effect of the intervention, subsequent analysishas provided evidence that insulin can induce ‘self-tolerance’ during prediabetes.Those with higher antibodies at baseline showed a significant treatment effectwith a lower rate of developing diabetes than placebo treated individuals: 6% vs10% per year, with a delay of 4.5 years, but after cessation the risk of developingdiabetes reverted to that of the placebo treated group [23].
A better method of inducing tolerance potentially is delivering the treatment
A modern epidemic
494

through the mucosa [24]. The Intranasal Insulin Trial 11 (INIT 11) is currentlyunderway in 11 sites in Australia and New Zealand. The principal investigatorsare Len Harrison and Peter Colman in Melbourne, and the study is sponsoredby Melbourne Health, funded by JDRF and NHMRC through the Diabetes Vac-cine Development Centre (DVDC). Risk for diabetes is based on family membersfound to have two positive antibodies on screening. These individuals are thenstaged to determine sufficient beta-cell reserve: the insulin response to an intra-venous glucose load. Prior to the onset of diabetes the first phase to be lost is theinitial response to intravenous glucose. Those in the unsuccessful DIPP study hadlittle insulin reserve, so the time to intervene in the disease process was probablytoo late, to salvage beta-cell function [25].
Better tests of T-cell function, in particular the T-cell regulatory (TReg)function, are required to help determine the early stages of the autoimmuneprocess during which time intervention may be most successful. Screening oflarge numbers of family members is required to detect those at risk.
DIETARY TRIALS TO MODIFY THEENVIRONMENT
Changing the environment may prevent the autoimmune process. Babies at highrisk of developing diabetes may be amenable to dietary intervention. Cow milkhas been investigated in observational studies and early introduction may be atrigger for the autoimmune process.
In Finland babies at risk of diabetes were randomised to delay in cow milksupplementation. This led to a delay in development of diabetes related autoan-tibodies [26]. This has led to the Trial to Reduce IDDM in Genetically at Risk(TRIGR), a multinational study, including Australia. Recruitment of 2160 infantsis complete (enrolment 2002 to 2007) and the intervention completed mid 2007,with follow-up planned over ten years. Infants have been screened by cord bloodor heel prick for HLA susceptibility, protection genotype and those without theprotective genotype randomised to delay in introduction of cow milk protein [27].
Another possible triggering antigen may be gluten. In Germany delay in in-troduction of gluten has been investigated in a randomised control study (BABY-DIET) of 150 infants: prior to two months of age, after six months and after 12months. However recent outcome data have not shown a delay in onset of au-toimmune markers, with 12% of children developing diabetes related antibodiesat age of three years, seven developing diabetes, including four in the late expo-sure group [28]. This was a pilot study and compliance with the intervention waspoor at 30%. Three times more infants are needed to properly examine this hy-pothesis.
22 A ‘cure’ for diabetes and its complications
495

HAEMOPOIETIC STEM CELL TRANSPLANTATIONAS A TREATMENT FOR DIABETES
Another more controversial form of therapy is haemopoietic stem cell trans-plantation (HSCT) to treat new onset T1D. HSCT involves mobilisation ofhaemopoetic stem cells (CD34+ cells) from the bone marrow, ablation of the re-cipients immune system followed by reinfusion of the autologous stem cells. Theaim is to destroy the auto-reactive islet immune T-cells and to reconstruct the im-mune system without autoimmunity. The strategy has been used successfully inother autoimmune diseases where it is generally reserved for patients that are re-sistant to other treatments. In 2007 a study was undertaken in Brazil where HSCTwas used to treat T1D within six weeks of diagnosis [29]. Twenty-three patients,aged between 13 and 33 years, were enrolled in the study. The investigators re-ported an improvement in diabetes with 20 of the 23 becoming insulin free forvarying periods of time (one to 52 months). Eight of the 20 had relapsed dur-ing the time of reported follow-up. The remainder were still being followed atthe time of the last report [30]. There was also evidence of improvement in C-peptide, and reduced HbA1c. There was a reduction but not an elimination ofislet autoantibodies which suggests that the autoimmune disease was suppressedbut not eliminated. This study, although instructive, needs to be interpreted withcaution [31]. The authors themselves readily admit this. First, the study was anearly-phase, proof-of-concept study, and was not a randomised controlled trial.The well-known honeymoon period that can occur at the onset of T1D compli-cates the interpretation of the results. The follow-up is relatively limited and thelong-term benefits and side effects are unknown. We do know that a third ofpatients had relapsed and returned to insulin within three years, which is a rela-tively small gain for such aggressive therapy. Whilst there were no deaths, HSCTis not benign therapy. Two patients developed pneumonia and others developedendocrine abnormalities, including nine of 17 males developing oligospermia. Afinal point that makes investigations of this nature difficult in T1D is that all therecipients were young, which increases the anxiety and implications around long-term complications such as malignancy which may yet develop. Despite all thesecaveats the trial should be seen for what it is, the first of many attempts to cureT1D with cellular therapy rather spending a lifetime treating the consequences ofislet destruction.
HSCT has been used as an adjunct to other treatments in T1D [32]. Not onlyis bone-marrow a source of haemopoetic progenitors, it is also a source of mes-enchymal and endothelial stem cells. There is experimental evidence that thesestem cells enhance immunomodulation and tolerance, as well as promote engraft-ment and enhance tissue repair. As a result HSCT is being evaluated in severalautoimmune and degenerative conditions and has been proposed as adjunct ther-apy for other treatments in T1D. In fact there are more than 20 registered trials
A modern epidemic
496

of HSCT in T1D. Several of these trials are using HSCT as a tolerising strat-egy to reduce or eliminate chronic immunosuppression in islet transplantation. Inother studies HSCT is being trialled as a therapy to prevent progression of com-plications such as peripheral neuropathy. In all cases the study are exploratoryproof-of-concept studies. While ongoing no study has conclusively demonstratedsustained benefit.
CLINICAL ISLET TRANSPLANTATIONClinical human islet transplantation is a new and emerging therapy for a selectgroup of patients with severe metabolic complications as a result of their diabetes.If successful it can provide near perfect blood glucose control without insulininjections and has brought forward the prospect of a cure for this debilitatingchronic disease. Currently islet transplantation can be considered a novel therapyfor a new indication and the objective benefits and potential risks remain to befully established by clinical trials. At present the two main indications for islettransplantation are severe hypoglycaemia unawareness, refractory to conven-tional treatment and islet transplantation in conjunction with a kidney transplant.On the positive side, islet transplantation has been shown to abolish severe hy-poglycaemic episodes and patients can expect to have an improved quality oflife and reduced risk of end-organ complications. On the negative side, patientsmust take lifelong immunosuppression with all its short- and long-term com-plications. Despite these caveats, islet transplantation has created great interestamongst physicians as well as patient groups and several major clinical trials areongoing. If nothing else, patient enthusiasm for these early trials has highlightedthe lifelong burden and deficiencies of current insulin regimens.
Clinical islet transplantation is still a difficult procedure to perform. Islet iso-lation from a human pancreas requires a skilled laboratory team, a specialisedGMP (good manufacturing practice) facility, and has been a limiting factor in thespread of the procedure beyond specialised institutions. Despite the fact that islettransplantation had been performed successfully in rodents, translation into theclinic has been difficult. Researchers in Edmonton were the first to develop islettransplantation into a reliable clinical therapy [33]. Their successes was based onthe following principles:
• Selection of the appropriate group of patients for transplantation• Using a non-toxic effective immunosuppressive regimen• Isolating appropriate numbers of viable islets• Transplanting sufficient numbers of islets to control blood glucose levels.
The basic premise of the Edmonton protocol has been that successful islet trans-plantation is dependent on the isolation and ongoing survival of the maximum
22 A ‘cure’ for diabetes and its complications
497

number of islets possible. This has meant that most patients require two or moreislet transplants to achieve insulin independence. Patients must not be overweightand therefore should be on a low-insulin dose compared to body weight. Oncetransplanted, islets face rejection and possibly autoimmune disease recurrenceand hence islet recipients must take lifelong immunosuppression.
Added to this, pancreatic islets come from organ donors and there is a largemismatch between the number of people with type 1 diabetes and the number oforgan donors. For instance in Australia there are 150,000 people suffering fromtype 1 diabetes and only 250 to 300 organ donors annually. Under the most op-timistic of circumstances only 150 of these would be suitable or available forislet transplantation. For this reason definite sources of islet-cell replacement arebeing developed. These include pancreatic islets from pigs, so-called xenotrans-plantation, and stem cells. Although early phase I studies have been undertakenin humans, both these sources of islets remain in preclinical development.
Clearly human islet transplantation is not going to be an option for most peo-ple with diabetes. This and the current uncertainty has put pressure on transplantunits to develop selection criteria that optimises the chances of a successful out-come whilst at the same time ensuring that the benefits of insulin independenceare worth the long-term risks of life-long immunosuppression. The patients, whobest satisfy these dual objectives, are those with severe hypoglycaemic unaware-ness. These patients no longer have warning signals of hypoglycaemia, and lowblood sugar levels are not detected until they reach dangerously low levels. Thesepatients require constant and intensive medical supervision. If it persists, it canlead to significant cognitive impairment and, in severe cases, can be fatal [34].Not surprisingly patients who suffer from this problem have poor metabolic con-trol with wide and sudden swings between hypo- and hyperglycaemia. In thesecircumstances successful islet transplantation will normalise blood glucose levelsand prevent hypoglycaemic episodes [35].
Patients who have successfully achieved insulin independence followingislet transplantation certainly have a life-changing experience. After many yearsof difficulty controlling diabetes with insulin, they find themselves insulin inde-pendent with perfect control and normal HbA1C. In our experience patients whowere once housebound are able to return to active work. There is an obvious im-provement in the patient’s mood and quality of life. Even patients, who are notinsulin independent but have documented evidence of islet graft function, achievemarked improvements in glycaemic control. Physiologic background basal in-sulin secretion appears to be sufficient to eliminate severe hypoglycaemia andoften this is sufficient to dramatically improve the patient’s quality of life. Fur-thermore, there is evidence that C-peptide secretion provides some protectionagainst cardiac complications even in patients that still require exogenous insulintherapy. A study of kidney transplant recipients with type 1 diabetes who subse-quently received an islet transplant, found that those that were C-peptide positive
A modern epidemic
498

had improved cardiac outcomes compared to those with graft failure [36].Thus far it would seem that the main negatives for patients are the side ef-
fects from immunosuppression. Despite this, there have been surprisingly fewopportunistic infections and no deaths. Most immunosuppressive regimens in-clude Tacrolimus and Sirolimus. Most transplanted patients suffer nagging com-plications such as mouth ulcers, ankle oedema and headaches. These are commonside effects of Sirolimus and are often self-limiting although they have been se-rious enough to lead to withdrawal from the study in some cases. Many patientsalso need to commence lipid-lowering therapy for hypercholesterolaemia. Moreworrying are the side effects from Tacrolimus. In particular nephrotoxicity isa concern and it may be exacerbated by concomitant Sirolimus therapy. Manyrecipients have had a significant reduction in renal function, some even com-mencing dialysis therapy as a result. Many patients also need to start or increaseanti-hypertensive medication [37].
For the islet transplantation to be really successful the majority of patientneed to achieve long-term islet graft function. At the moment it is too early to de-termine whether this can be achieved easily. Many of the initial cohort of patientsfrom Edmonton are back on insulin, although most have retained some graft func-tion with good glycaemic control. This gradual loss of function has proven to bea difficult problem for investigators as it is not clear whether it is due to chronicrejection, disease recurrence or ‘islet exhaustion’. This problem is exacerbated bythe fact that there is no easy way to monitor graft function. Monitoring graft func-tion by tissue biopsy has been a major reason for the improved survival of renal,liver and cardiac transplantation and the lack of a similar test for islet grafts isproving to be a major hurdle in determining the natural history of islet transplan-tation.
In 2002 the National Pancreas Transplant Unit at Westmead Hospital begana trial of pancreatic islet transplantation. Initially we are selecting patients withtype 1 diabetes who suffer from severe hypoglycaemic unawareness that hasfailed to respond to intensive management by an endocrinologist. Of the six pa-tients transplanted, three were able to cease insulin injections [38]. The good newsfor these patients is that they no longer suffer life-threatening ‘hypos’ and thishas resulted in a substantial improvement in their quality of life. However, theimmunosuppressive drugs cause significant side effects, and our view remainsthat this treatment should be reserved for those patients with the most severemetabolic complications from their diabetes. These promising findings led to theAustralian Government funding a second multi-centre Australian trial which wasled by the Westmead Hospital Centre. In this second trial 16 patients have beentransplanted with measurable graft function in all patients bar one. Eight patientswere insulin independent and all patients had abolition of their hypoglycaemicepisodes. A new immunosuppressive regimen was evaluated which was benefi-cial at preventing rejection and better tolerated. These patients were compared
22 A ‘cure’ for diabetes and its complications
499

with a similar cohort of patients who had severe hypoglycaemia and who weremanaged with intensive medical follow-up and insulin pumps. Those patients un-dergoing islet transplantation had improved blood glucose control and abolitionof hypoglycaemia whereas those patients on insulin pumps had no reduction ofhypoglycaemia.
These are early days in the development of this therapy and much needs to bedone before this treatment can be offered to a wider group of patients. These tri-als are an important proof of principle and bring us a step closer to finding a curefor type 1 diabetes. We can help some patients but the treatment comes at a price.Areas requiring improvement include a need for more reliable islet isolation pro-cedures, better and safer anti-rejection drugs and long-term studies to show thatthis treatment provides real benefits for patients. In addition to solving these tech-nical problems, we need to develop alternative sources of donor islet tissue. Someresearchers are developing stem cells. Our unit, in collaboration with others, isusing gene therapy to develop pig islet cells for transplantation into humans. Overthe past decade there has been substantial progress in cell-based therapy to treattype 1 diabetes. The current trials of human pancreatic islet transplantation havedemonstrated that this type of approach can abolish the need for exogenous in-sulin and provide real benefits to patients. In addition the ongoing developmentof an indefinite source of islets provides hope that cell-based therapies could be-come the norm for type 1 diabetes rather than a life-changing therapy for a few.
PREVENTION OF LONG-TERM COMPLICATIONSBoth type 1 and type 2 diabetes lead to long-term complications of vascular dis-ease affecting the eye, kidney, nerves and larger blood vessels of the heart andlimbs. The biological contributors are similar but in type 2 diabetes there is pos-sibly a greater impact of accompanying high blood pressure and abnormal lipids.For those with type 1 diabetes the features of the metabolic syndrome increasetheir risk of complications substantially, threefold in a recent study [39]. We areunderstanding more about the relative contributions to vascular disease and alsothe contribution of the autonomic nervous system which innervates the vascula-ture [40, 41].
Statins are of proven benefit to reduce vascular outcomes in line with thebenefit demonstrated in those without diabetes [42], but its is unclear whetherit is appropriate to initiate in all young people, especially when not consideredsafe during pregnancy. The Adolescent Type 1 Diabetes Cardiorenal InterventionTrial (AdDIT) will help determine whether adolescents at high risk to progressionwill benefit from Angiotensin converting enzyme inhibitors or statins [43]. Thisis a multinational study in the UK, Canada and Australia currently recruiting 500at-risk adolescents as defined by the urinary concentration of the protein, albu-
A modern epidemic
500

min.As well as statin therapy to reduce cholesterol, recent studies have examined
triglyceride-lowering treatment in diabetes [44, 45]. The Fenofibrate Interventionand Event Lowering in Diabetes (FIELD) trial was a large randomised trial offenofibrate to prevent vascular complications, in particular cardiovascular diseasein T2DM patients. A total of 9795 T2DM subjects aged between 50 and 75 yearswere recruited from 63 centres in Australia, New Zealand and Finland betweenFebruary 1998 and November 2000 and study closeout was early 2005. Subjectswere randomised to receive either 200 mg co-micronised fenofibrate or matchingplacebo for an average of five years follow-up. The primary endpoint of non-fa-tal MI + CHD death was not significantly reduced by fenofibrate (HR = 0.89:0.75 –1.05; p = 0.16), however, most other macrovascular endpoints were sig-nificantly reduced by treatment, including hospitalisation of ACS, non-fatal MIalone, coronary or carotid revascularisation [46]. Fenofibrate also profoundly re-duced microvascular events, including eye complications (by 37%), albuminuria(18%) and loss of renal function (3.7 kidney-years saved), together with amputa-tions (36%) [47, 48, 49].
Work is now underway exploring the blood biomarkers and genetic markersassociated with both the cardiovascular and microvascular complications seen inthe FIELD study, as well as with any predictors of benefit of treatment, supportedby National Health and Medical Research Council (NHMRC) of Australia grantsand the main study sponsor, Abbott, who market fenofibrate globally. Basic sci-ence (cellular and animal) research work is being conducted in parallel, in orderto understand how fenofibrate might protect so powerfully against microvasculardisease in type 2 diabetes. A better knowledge of how fenofibrate might mediatethese large benefits may offer hope for even more potent treatments against dia-betic complications in future.
DESIGN OF CLINICAL TRIALS FOR DIABETESTREATMENT AND COMPLICATIONS
Evaluations of potential new therapies for improving the treatment of type 1 ortype 2 diabetes mellitus use classical methods of clinical trials design. This meansthat after short-term exposure trials in normal subjects (phase 1) and then patients(Phase 2) to establish the pharmacology of a new drug and then the activity ofsuch an intervention and immediate safety of use, larger randomised trials, usu-ally with placebo control are conducted in a parallel-group schema (Figure 3).Follow-up is over some months (Phase 2) in order to explore acceptance andcompliance with planned dosing schedules, and more reliably establish the mag-nitude of benefits on glycaemic control, blood pressure, or similar. Thereafter,over some years usually (Phase 3), clinical trials designed to yield harder clin-
22 A ‘cure’ for diabetes and its complications
501

ical endpoints such as changes in renal function, progression of retinopathy, orcardiovascular event reductions are conducted, to determine whether the soughtbenefits of the treatment are in fact borne out.
Figure 3. Parallel group randomised trial design
Table 1. Traditional clinical trial phases and their purposes.
Phase 1 Determines the action, distribution, metabolism and toxicity of differentdosages of a drug in humans, healthy volunteers or patients with the diseasebeing studied for whom alternative treatment options may have been ex-hausted. Only a few patients participate. Alternatively, it may be a smallpilot study to establish safety and calibration of a device.
Phase 2 Determines the levels of efficacy and safety on a broader group of patientswith the condition of interest.
Phase 3 Compares the intervention with the current standard treatment in a largenumber of patients (often hundreds or thousands) who suffer from the con-dition of interest. Patients are randomly allocated to either the newintervention or the standard treatment. A phase 3 trial usually determineswhether the new intervention is sufficiently superior to the current or stan-dard treatment to replace it or be a viable alternative. A phase 3 trial mayalso reveal further side effects of the intervention or identify subgroups forwhom the intervention is particularly beneficial.
Phase 4 Long-term surveillance after drug approval may detect rare adverse effectsor those that are apparent only over a long period. Unexpected benefits mayalso be identified, requiring further phase 3 trials for confirmation.
At the stage of a phase 3 trial, the results of which are of most direct potentialapplicability to clinician practice, most of the more common safety issues asso-ciated with an investigational treatment will have been identified. However, thepossibility of previously unknown rarer side effects being recognised with longer
A modern epidemic
502

exposure time, larger numbers or both remains, and it has not been uncommonfor marketed products to be later withdrawn or more restricted in approved usesas more real-life experience becomes available, making these phase 3 trials, andafter-market surveillance programs (phase 4) invaluable in identifying real ad-vances for patient treatment policies [50, 51].
When large phase 3 trials of new drug therapy are designed, ideally theyare set on a background of standard care, and the new therapy, or its matchingplacebo, are added to existing care. This often offers the advantage of moreclosely mimicking how the drug might be used in real life, and does not denytrial participants ongoing use of current best standard care. Occasionally, the newtreatment might be proposed to replace an existing treatment, in which case acomparative trial of new versus established treatment may be conducted (in thisinstance a double-placebo or so-called double-dummy design would be needed inorder to preserve blinding, if possible) [52].
Strong randomisation is pivotal to a good trial result, and ever more so-phisticated methods to stratify a randomisation by important prognostic patientcharacteristics is making interpretation of trials results simpler, based on crudenumbers of events. Randomisation ensures that the key variables influencing out-comes of interest are balanced between the group allocated to receive the activeintervention and the control treatment. Processes used to randomise must be se-cure and unpredictable in advance, so as to ensure their integrity. This is oftenachieved by using a central web-based system [52].
Blinding or masking of treatments has become an important hallmark ofgood trials, when practicable. Because both trial participants or patients and theirdoctors may have in-built prejudices one way or another about the potentialadvantages of a new therapy under test, this can lead to inadvertent biases inassessing side effects, complications, outcomes and perceived links to study treat-ments. For that reason, great lengths are undertaken in order to try to avoid suchbiases from arising [52]. Part of this process is to mask study treatment with aplacebo wherever possible, with matching colour, appearance, consistency, tasteand so on, in order to avoid any party knowing which treatment is being receivedduring the study. Of course, if an emergency clinical situation arises, then the op-portunity to unmask immediately must be provided within the trial organisation,as the patients’ best interests must remain foremost.
For the same reasons, outcome adjudication is also often set out to be per-formed at arms length from the trial apparatus, by a group of people with noother direct involvement in a study, so that decisions about the nature of outcomeevents or untoward complications can be judged impartially. Centres such as theNHMRC Clinical Trials Centre have decades of experience in helping investiga-tors set up clinical trials with these considerations built in to the trial protocol andoperational structures.
22 A ‘cure’ for diabetes and its complications
503

Figure 4. A two-period cross-over trial design.
When new devices are being tested, such as insulin pumps and continuous glu-cose monitors, blinding of the intervention is usually not possible. Some attemptscan be made to reduce differences between groups, for example, whereby allsubjects have devices installed, but not all are activated (early activation couldbe randomised), but generally in these circumstances, investigators rely on im-partial assessments of outcomes being possible. This could include instances ofhospitalisation or medical intervention being required for documented severe hy-poglycaemia, in this example. This sort of trial might lend itself to a cross-overdesign whereby each subject experiences two phases of treatment with and with-out device support, each for sufficient time periods that reliable estimates of anyadvantages emerge (Figure 4). After pancreatic islet transplantation, insulin dos-ing requirements for glucose homeostasis may be the primary outcome studied.
There are many opportunities to enhance the design of phase 3 trials in prac-tice. One way is to consider a run-in period prior to randomisation of patients intoa trial. Most often, such a run-in period would be ‘single-blind’ meaning that onlythe patient would be unaware of what treatment was being offered to them, withstudy staff knowing that the patient was receiving (most commonly) a placeboat that point [52]. The potential advantages of a run-in period include (i) that thepatient has already been entered into the trial routine; (ii) time is allowed to es-tablish that subject characteristics meet all the inclusion criteria, including anyspecial pathology results that are not immediately available; (iii) subjects have anopportunity to discuss trial participation with spouses and their usual doctors andto reflect on whether they wish to make what is often a long-term commitment toa tight schedule of follow-up visits (if they change their mind at this stage theyhave not upset the randomisation yet); (iv) subjects who are not likely to be goodcompliers can be identified in advance and excluded from randomisation if de-sired (though generalisability of final results may be affected if many subjects areexcluded in this way); and (v) less commonly, the use of an active rather than
A modern epidemic
504

placebo run-in period can characterise subjects in terms of their responsiveness totreatment, allowing later analyses identifying whether big-responders gain morebenefit from treatment than small responders in some biomarker or other putativemeasure of treatment mechanism.
Another useful strategy might be to consider a washout period at the end ofthe study. Where a drug treatment may have exerted a potentially adverse effectin some way, it becomes important to know whether such an effect is reversiblewhen the treatment is withdrawn. So, for example, a number of drugs developedfor use in type 2 diabetes, including pan-PPAR agents, have shown renal injury interms of increased proteinuria and loss of glomerular filtration rate (GFR) suffi-cient to prevent the drug development proceeding. In some cases, the renal injuryhas been permanent for some patients [53]. In the FIELD study, use of fenofi-brate rapidly increased plasma creatinine levels by around 12%, a signal of someconcern clinically, as this could potentially represent a small drop in GFR. Fur-thermore, the creatinine rise remained present for the duration of the five-yearaverage treatment period, raising legitimate concerns about whether this couldadversely affect cardiovascular risk. As it turned out, a washout study in over 600patients showed that the increase in creatinine was fully reversible even after fiveyears, and also unmasked a more favourable final GFR among subjects who hadreceived fenofibrate rather than placebo during the trial [48].
Results of FIELD analysed by the extent of changes in creatinine during asix weeks active run-in period immediately prior to randomisation, among all9795 patients further showed that cardiovascular events were reduced most bystudy treatment among subjects with a larger rise in creatinine (perhaps such anincrease is a marker of greater drug bioactivity). Preservation of renal filtrationfunction was no different according to the extent of the creatinine rise before ran-domisation during active run-in treatment [48].
Pre-specifying a number of secondary and tertiary outcomes in advance isimportant for how such results are perceived by the general community. Because‘data-dredging’ can so easily lead to spurious findings, outcomes that have beenplanned out in detail before trial results are known carry much more weight bothwith journals and with peers. A significant time is required to set these out in aprotocol ahead of trial commencement [52].
Uniquely in the disease area of type 2 diabetes, there are greater hurdles fornew drug development and registration than in other disease domains. For prod-ucts planning to be accessible in the US, the recently updated Food and DrugAdministration (FDA) regulations mean that drugs intended for use in type 2 di-abetes must prove their safety with respect to cardiovascular events. While drugscan reach market prior to the results of such trials being known, such trials mustbe planned or underway to ensure that a hazard from treatment exceeding a 30%increase in CVD risk (HR >1.3) can be ruled out at the end of such a study [53].This has arisen after several drugs reaching routine clinical use in the market
22 A ‘cure’ for diabetes and its complications
505

have been found to potentially give rise to CVD harm, most notably rosiglita-zone, though the correct interpretation of the data from a number of relevant trialsremains contested [54].
CONCLUSIONSWe are understanding more about the development of diabetes and its compli-cations. Much exciting work has already been done but many critical studies areunderway. We await the outcomes with hope that the increase in type 1 and type2 diabetes may be reduced and diabetes complications minimised. Randomisedclinical trials remain the best way to identify such advances, and must be wellplanned with clearly defined prespecified primary, secondary and tertiary out-comes to ensure the maximum scientific value is achieved.
References1. Australian Institute of Health and Welfare (2011). Prevalence of type 1 di-
abetes in Australian children, 2008 (14/06/11 edition). Canberra: AustralianInstitute of Health and Welfare.
2. Hilner JE, Perdue LH, Sides EG, Pierce JJ, Wägner AM, Aldrich A, et al.(2010). Designing and implementing sample and data collection for an inter-national genetics study: the Type 1 Diabetes Genetics Consortium (T1DGC).Clinical Trials, 7(Suppl. 1): S5–S32.
3. Barrett JC, Clayton DG, Concannon P, Akolkar B, Cooper JD, Erlich HA, etal. (2009). Genome-wide association study and meta-analysis find that over40 loci affect risk of type 1 diabetes. Nature Genetics, 41(6): 703–07.
4. Ziegler AG, Pflueger M, Winkler C, Achenbach P, Akolkar B, Krischer JP,et al. (2011). Accelerated progression from islet autoimmunity to diabetes iscausing the escalating incidence of type 1 diabetes in young children. Jour-nal of Autoimmunity, 37(1): 3–7.
5. Yeung W-CG, Rawlinson WD, Craig ME (2011). Enterovirus infection andtype 1 diabetes mellitus: systematic review and meta-analysis of observa-tional molecular studies. British Medical Journal, 342: d35.
6. Knerr I, Wolf J, Reinehr T, Stachow R, Grabert M, Schober E, et al.(2005). The ‘accelerator hypothesis’: relationship between weight, height,body mass index and age at diagnosis in a large cohort of 9248 German
A modern epidemic
506

and Austrian children with type 1 diabetes mellitus. Diabetologia, 48(12):2501–04.
7. Clarke SL, Craig ME, Garnett SP, Chan AK, Cowell CT, Cusumano JM, etal. (2006). Increased adiposity at diagnosis in younger children with type 1diabetes does not persist. Diabetes Care, 29(7): 1651–53.
8. Hyppönen E, Virtanen SM, Kenward MG, Knip M & Akerblom HK (2000).Childhood diabetes in Finland Study Group: obesity, increased lineargrowth, and risk of type 1 diabetes in children. Diabetes care, 23(12):1755–60.
9. Colman PG, Steele C, Couper JJ, Beresford SJ, Powell T, Kewming K, et al.(2000). Islet autoimmunity in infants with a type I diabetic relative is com-mon but is frequently restricted to one autoantibody. Diabetologia, 43(2):203–09.
10. Ziegler A-G, Schmid S, Huber D, Hummel M & Bonifacio E (2003). Earlyinfant feeding and risk of developing type 1 diabetes-associated autoantibod-ies. The Journal of the American Medical Association, 290(13): 1721–28.
11. Virtanen SM, Kenward MG, Erkkola M, Kautiainen S, Kronberg-Kippilä C,Hakulinen T, et al. (2006). Age at introduction of new foods and advancedbeta cell autoimmunity in young children with HLA-conferred susceptibilityto type 1 diabetes. Diabetologia, 49(7): 1512–21.
12. Couper JJ, Beresford S, Hirte C, Baghurst PA, Pollard A, Tait BD, et al.(2009). Weight gain in early life predicts risk of islet autoimmunity in chil-dren with a first-degree relative with type 1 diabetes. Diabetes Care, 32(1):94–99.
13. Couper J & Donaghue KC (2009). Phases of diabetes in children and ado-lescents. Pediatric Diabetes, 10(Suppl. 12):13–16.
14. Fourlanos S, Narendran P, Byrnes GB, Colman PG & Harrison LC (2004).Insulin resistance is a risk factor for progression to type 1 diabetes. Dia-betologia, 47(10): 1661–67.
15. Winkler C, Marienfeld S, Zwilling M, Bonifacio E & Ziegler AG (2009). Isislet autoimmunity related to insulin sensitivity or body weight in children ofparents with type 1 diabetes? Diabetologia, 52(10): 2072–78.
16. Rasmussen T, Stene LC, Samuelsen SO, Cinek O, Wetlesen T, TorjesenPA, et al. (2009). Maternal BMI before pregnancy, maternal weight gain
22 A ‘cure’ for diabetes and its complications
507
during pregnancy, and risk of persistent positivity for multiple diabetes-as-sociated autoantibodies in children with the high-risk HLA genotype: theMIDIA study. Diabetes Care, 32(10): 1904–06.
17. Zipitis CS & Akobeng AK (2008). Vitamin D supplementation in earlychildhood and risk of type 1 diabetes: a systematic review and meta-analysis.Archives of Disease in Childhood, 93(6): 512–17.
18. Orban T, Bundy B, Becker DJ, DiMeglio LA, Gitelman SE, Goland R, et al.(2011). Co-stimulation modulation with abatacept in patients with recent-on-set type 1 diabetes: a randomised, double-blind, placebo-controlled trial. TheLancet, 378(9789): 412–19.
19. Pescovitz MD, Greenbaum CJ, Krause-Steinrauf H, Becker DJ, GitelmanSE, Goland R, et al. (2009). Rituximab, B-lymphocyte depletion, and preser-vation of beta-cell function. The New England Journal of Medicine, 361(22):2143–52.
20. Sherry N, Hagopian W, Ludvigsson J, Jain SM, Wahlen J, Ferry RJ, et al.(2011). Teplizumab for treatment of type 1 diabetes (Protégé study): 1-yearresults from a randomised, placebo-controlled trial. The Lancet, 378(9790):487–97.
21. Wherrett DK, Bundy B, Becker DJ, DiMeglio LA, Gitelman SE, GolandR, et al. (2011). Antigen-based therapy with glutamic acid decarboxylase(GAD) vaccine in patients with recent-onset type 1 diabetes: a randomiseddouble-blind trial. The Lancet, 378(9788): 319–27.
22. Diabetes Prevention Trial--Type 1 Diabetes Study Group (2002). Effects ofinsulin in relatives of patients with type 1 diabetes mellitus. The New Eng-land Journal of Medicine, 346(22): 1685–91.
23. Vehik K, Cuthbertson D, Ruhlig H, Schatz DA, Peakman M, Krischer JP,et al. (2011). Long-term outcome of individuals treated with oral insulin:Diabetes Prevention Trial-Type 1 (DPT-1) oral insulin trial. Diabetes Care,34(7): 1585–90.
24. Fourlanos S, Perry C, Gellert SA, Martinuzzi E, Mallone R, Butler J, et al.(2011). Evidence that nasal insulin induces immune tolerance to insulin inadults with autoimmune diabetes. Diabetes, 60(4): 1237–45.
25. Ryhanen SJ, Harkonen T, Siljander H, Nanto-Salonen K, Simell T, HyotyH, et al. (2011). Impact of intranasal insulin on insulin antibody affinity and
A modern epidemic
508

isotypes in young children with HLA-conferred susceptibility to type 1 dia-betes. Diabetes Care, 34(6): 1383–88.
26. Akerblom HK, Virtanen SM, Ilonen J, Savilahti E, Vaarala O, Reunanen A,et al. (2005). Dietary manipulation of beta cell autoimmunity in infants at in-creased risk of type 1 diabetes: a pilot study. Diabetologia, 48(5): 829–37.
27. TRIGR Study Group, Akerblom HK, Krischer J, Virtanen SM, BersethC, Becker D, et al. (2011). The trial to reduce IDDM in the genetically atrisk (TRIGR) study: recruitment, intervention and follow-up. Diabetologia,54(3): 627–33.
28. Hummel S, Pfluger M, Hummel M, Bonifacio E & Ziegler AG (2011). Pri-mary dietary intervention study to reduce the risk of islet autoimmunity inchildren at increased risk for type 1 diabetes: the BABYDIET study. Dia-betes Care, 34(6): 1301–05.
29. Voltarelli JC, Couri CEB, Stracieri ABPL, Oliveira MC, Moraes DA,Pieroni F, et al. (2007). Autologous nonmyeloablative hematopoietic stemcell transplantation in newly diagnosed type 1 diabetes mellitus. The Journalof the American Medical Association, 297(14): 1568–76.
30. Couri CEB, Oliveira MCB, Stracieri ABPL, Moraes DA, Pieroni F, BarrosGMN, et al. (2009). C-peptide levels and insulin independence following au-tologous nonmyeloablative hematopoietic stem cell transplantation in newlydiagnosed type 1 diabetes mellitus. The Journal of the American Medical As-sociation, 301(15): 1573–79.
31. Skyler JS (2007). Cellular therapy for type 1 diabetes: has the time come?The Journal of the American Medical Association, 297(14): 1599–600.
32. Fotino C, Ricordi C, Lauriola V, Alejandro R & Pileggi A (2010). Bonemarrow-derived stem cell transplantation for the treatment of insulin-depen-dent diabetes. The Review of Diabetic Studies, 7(2): 144–57.
33. Shapiro AM, Lakey JR, Ryan EA, Korbutt GS, Toth E, Warnock GL, et al.(2000). Islet transplantation in seven patients with type 1 diabetes mellitususing a glucocorticoid-free immunosuppressive regimen. The New EnglishJournal of Medicine, 343(4): 230–38.
34. Cryer PE (2008). The barrier of hypoglycemia in diabetes. Diabetes, 57(12):3169–76.
35. Ryan EA, Lakey JR, Rajotte RV, Korbutt GS, Kin T, Imes S, et al. (2001).
22 A ‘cure’ for diabetes and its complications
509

Clinical outcomes and insulin secretion after islet transplantation with theEdmonton protocol. Diabetes, 50(4): 710–19.
36. Fiorina P, Folli F, Maffi P, Placidi C, Venturini M, Finzi G, et al. (2003).Islet transplantation improves vascular diabetic complications in patientswith diabetes who underwent kidney transplantation: a comparison betweenkidney-pancreas and kidney-alone transplantation. Transplantation,75(8):1296–01.
37. Shapiro AMJ, Ricordi C, Hering BJ, Auchincloss H, Lindblad R, RobertsonRP, et al. (2006). International trial of the Edmonton protocol for islet trans-plantation. The New English Journal of Medicine, 355(13): 1318–30.
38. O’Connell PJ, Hawthorne WJ, Holmes-Walker DJ, Nankivell BJ, GuntonJE, Patel AT, et al. (2006). Clinical islet transplantation in type 1 diabetesmellitus: results of Australia’s first trial. The Medical Journal of Australia,184(5): 221–25.
39. McGill M, Molyneaux L, Twigg SM & Yue DK (2008). The metabolic syn-drome in type 1 diabetes: does it exist and does it matter? Journal of Diabetesand its Complications, 22(1): 18–23.
40. Gallego PH, Wiltshire E & Donaghue KC (2007). Identifying childrenat particular risk of long-term diabetes complications. Pediatric Diabetes,Suppl. 6: 40–48.
41. Maguire AM, Craig ME, Craighead A, Chan AKF, Cusumano JM, Hing SJ,et al. (2007). Autonomic nerve testing predicts the development of compli-cations: a 12-year follow-up study. Diabetes Care, 30(1): 77–82.
42. Cholesterol Treatment Trialists’ Collaborators (2008). Efficacy ofcholesterol-lowering therapy in 18,686 people with diabetes in 14 ran-domised trials of statins: a meta-analysis. The Lancet, 371(9607): 117–25.
43. Adolescent Type 1 Diabetes Cardio-renal Intervention Trial Research Group(2009). Adolescent type 1 Diabetes Cardio-renal Intervention Trial (AdDIT).BMC Pediatrics, 9: 79.
44. ACCORD Study Group, Ginsberg HN, Elam MB, Lovato LC, Crouse JR,Leiter LA, et al. (2010). Effects of combination lipid therapy in type 2 dia-betes mellitus. The New England Journal of Medicine, 362(17): 1563–74.
45. ACCORD Study Group, ACCORD Eye Study Group, Chew EY, AmbrosiusWT, Davis MD, Danis RP, et al. (2010). Effects of medical therapies on
A modern epidemic
510
retinopathy progression in type 2 diabetes. The New England Journal ofMedicine, 363(3): 233–44.
46. Keech A, Simes RJ, Barter P, Best J, Scott R, Taskinen M-R, et al. (2005).Effects of long-term fenofibrate therapy on cardiovascular events in 9795people with type 2 diabetes mellitus (the FIELD study): randomised con-trolled trial. The Lancet, 366(9500): 1849–61.
47. Keech A, Mitchell P, Summanen P, O’Day J, Davis T, Moffitt M, et al.(2007). Effect of fenofibrate on the need for laser treatment for diabeticretinopathy (FIELD study): a randomised controlled trial. The Lancet,370(9600): 1687–97.
48. Davis TME, Ting R, Best JD, Donoghoe MW, Drury PL, Sullivan DR, et al.(2011). Effects of fenofibrate on renal function in patients with type 2 dia-betes mellitus: the Fenofibrate Intervention and Event Lowering in Diabetes(FIELD) Study. Diabetologia, 54(2):280–90.
49. Rajamani K, Colman PG, Li LP, Best JD, Voysey M, D’Emden MC, etal. (2009). Effect of fenofibrate on amputation events in people with type2 diabetes mellitus (FIELD study): a prespecified analysis of a randomisedcontrolled trial. The Lancet, 373(9677): 1780–88.
50. Furberg CD & Pitt B (2001). Withdrawal of cerivastatin from the world mar-ket. Current Controlled Trials in Cardiovascular Medicine, 2(5): 205–07.
51. Baron JA, Sandler RS, Bresalier RS, Lanas A, Morton DG, Riddell R, et al.(2008). Cardiovascular events associated with rofecoxib: final analysis of theAPPROVe trial. The Lancet, 372(9651): 1756–64.
52. Keech A & Gebski V (2007). Interpreting and reporting clinical trials: aguide to the consort statement and the principles of randomised controlledtrials. Sydney: Australasian Medical Publishing.
53. Ratner RE, Parikh S, Tou C & GALLANT 9 Study Group (2007). Efficacy,safety and tolerability of tesaglitazar when added to the therapeutic regimenof poorly controlled insulin-treated patients with type 2 diabetes. Diabetesand Vascular Disease Research, 4(3): 214–21.
54. Davis TM, Ting R, Best JD, Donoghoe MW, Drury PL, Sullivan DR, et al.(2011). Effects of fenofibrate on renal function in patients with type 2 dia-betes mellitus: the Fenofibrate Intervention and Event Lowering in Diabetes(FIELD) Study. Diabetologia, 54(20): 280–90.
22 A ‘cure’ for diabetes and its complications
511

55. Furberg CD & Pitt B (2001). Withdrawal of cerivastatin from the world mar-ket. Current Controlled Trials in Cardiovascular Medicine, 2(5): 205–07.
56. Baron JA, Sandler RS, Bresalier RS, Lanas A, Morton DG, Riddell R,Iverson ER & Demets DL (2008). Cardiovascular events associated withrofecoxib: final analysis of the APPROVe trial. The Lancet, 372(9651):1756–64.
57. Keech A, Gebski V & Pike R (2007). Interpreting and reporting clinicaltrials: a guide to the CONSORT statement and the principles of randomisedcontrolled trials. Sydney: Australasian Medical Publishing Company.
58. Food and Drug Administration Center for Drug Evaluation and Research(CDER) (2008). Guidance for industry diabetes mellitus: evaluating car-diovascular risk in new antidiabetic therapies to treat type 2 diabetes [On-line]. Available: www.fda.gov/Drugs/GuidanceComplianceRegulatoryInfor-mation/Guidances [Accessed 26 September 2011].
59. European Medicines Agency recommends suspension of Avandia, Avan-damet and Avaglim [press release] (2010). London: European MedicinesAgency; 23 Sep 2010 [Online]. Available: www.ema.europa.eu/ema/in-dex.jsp?curl=pages/news_and_events/news/2010/09/news_detail_001119.jsp&mid=WC0b01ac058004d5c1&murl=menus/news_and_events/news_and_events.jsp [Accessed 24 October 2011).
A modern epidemic
512

Index
academic achievement and health 146–181acanthosis nigricans 203accelerator hypothesis 376ACE inhibitors 151acromegally 110activity-friendly environments 304–306adipocyte expansion 60adipocyte hypertrophy 60–49, 60adipogenesis 62adipose tissue 58adipose tissue macrophages (ATMs) 59adiposity. See fat distributionadjustable gastric bypass 463adolescent obesity. See also childhood obesity
use of bariatric surgery for 477–478Adolescent Type 1 Diabetes Cardiorenal Intervention Trial (AdDIT) 500aerobic training and diabetes management 342–345affect-regulation model 325alpha-glucosidase inhibitors 390, 394American College of Sports Medicine 275American Diabetes Association 390angiogenesis 66antibodies 495antidiabetic agents 388–391antigen-based therapy 493–494antigens 62, 87, 89, 495.
See also glutamic acid decarboxylase (GAD)anti-obesity agents 475anti-obesity drugs 459–462appetite. See also non-hungry eating
‘eating to’ 10increase of 5, 11reduction in 6–7, 9, 12, 13, 389, 460
513

athletic ability 198AusAID (the Australian Government’s Overseas Aid Program) 171AusDiab study 148Australian Association of National Advertisers (AANA Code) 164, 272Australian Childhood Diabetes DNA Repository (ACDDR) 491Australian Diabetes, Obesity and Lifestyle study 386Australian Food and Grocery Council (AFGC) 164, 272Australian Health Survey (AHS) 152Australian National Preventive Health Agency 268, 279Australian Primary Care Collaboratives program 261autoimmune disease 493, 495–497.
See also type 1 diabetesautoimmune reaction 490, 492, 494autoimmunity 87, 492, 493, 495.
See also islet autoimmunity
BabyDiab studyAustralia 89, 492Germany 492
BABYDIET study (Germany) 495bariatric surgery 462–465
complications of 464used to treat adolescents 476–478
BEACH study 467behavioural factors and weight gain 258behavioural weight-loss treatment (BWT) 326behaviour modification 261, 456, 458
in children and adolescents 470–472beta cell 70, 108
apoptosis 114–117dedifferentiation 117destruction 90dysfunction 113exhaustion 118failure 110, 111, 114, 490function 108, 110–113, 118–119, 200mass 112–113neogenesis 95physiology 108regeneration 95, 113
biguanides 389, 393, 395binge eating disorder (BED) 5, 186, 322, 323, 326, 473biological weight-control systems 6, 15, 16.
See also endogenous weight-control systemseffectiveness of 9factors interfering with 11, 13, 15
Index
514

blood glucosecontrol 90, 151, 258, 300, 367, 368, 387, 496, 497fluctuations 368, 373monitoring 349pharmacotherapy for 388–390
blood pressure 148, 151, 255, 256, 442resistance training and 349
Blounts disease 201BMI (body mass index) 210
definition of 20impact of exercise on 346
body and social practice 132body image 188–189
disturbance 322school-based improvement initiatives 188–189
breakfast consumption 181Brighter Smiles Africa oral health program 184Broadcasting Services Act 1992 (Australia) 271bulimia nervosa 322, 326, 473bullying 138, 198, 243, 326
cancer 34, 46, 107, 172, 201, 254, 255, 275, 386carbohydrate
counting 368, 376–377nutrition 371, 373
carbohydrates. See also high-carbohydrate dietsoverconsumption of 47
cardiovascular disease (CVD) 199, 200, 373, 440cathexis 138, 141cell-based therapy 500Centers for Disease Control and Prevention (US) 274cerebrovascular disease 441childhood obesity
athletic ability and 198contributing factors 161definition 160, 210–211discrimination and 323–324‘First, do no harm’ approach to 185–186food marketing and 129–160, 160–161, 269impact on health 197, 199–203, 219in Asia 171–230indicators for treatment 467–468lifestyle treatment 468–470management of 397–398, 468pharmacology in the treatment of 475–476prevalence of 171, 212–217, 467
Index
515

psychosocial impact of 197–198, 322.See also bullyingschool-based intervention studies (Asia) 221–222socioeconomic status (SES) and 212, 216urban/rural disparity in Asia 219
children. See also childhood obesityacademic achievement of 146–181benefits of sound nutrition 186impact of television advertising on 269, 273life expectancy of 255physical activity and 189–190, 198
Children’s Food and Beverage Advertising Initiative (CFBAI) (US) 270–271Children’s Hospital Big Five, the 474Children’s Television Standards 2009 (CTS) (Australia) 271–272China Health and Nutrition Survey (CHNS) 213China National Survey on Students’ Constitution and Health (CNSSCH) 213cholesterol 255, 375, 437, 442chronic care model 416–417chronic disease risk surveillance 259chronic kidney disease (CKD) 148–154.
See also ACE inhibitorsclinical ethics 236, 238Cochrane review 340, 345, 368, 397, 468, 470Code for Advertising & Marketing Communications to Children (Australia) 272coeliac disease 441cognitive behavioural strategies 328combination therapy 390Commercial Television Industry Code of Practice (Australia) 271community-based interventions against obesity 6, 244–247Connell, Raewyn 135cow milk supplementation, delay in 495Coxsackie virus 88–89Crohn’s disease 61–64Cushing’s disease 110cycling 301–303, 342, 349, 473
DAFNE study 376Da Qing study (China) 338decisional balance 327Department of Health and Ageing Central Australia Renal Study 152depression 133, 186, 441deprivation amplification 307devices used in obesity management 456, 465diabetes 353.
See also gestational diabetes;prediabetes; type 1 diabetes; type 2 diabetes
Index
516

dietary intervention in babies 494–495distress 441kidney disease and 151pathogenesis of 492prevalence in children and adolescents 401
diabetes annual cycle of care (DACC) 417–419Diabetes Autoimmunity Study in the Young (DAISY) 89Diabetes Centre of Royal Prince Alfred Hospital 424–425diabetes complications 349
clinical trials data in 442design of clinical trials for 501–505due to a lack of insulin 432–433due to an excess of insulin 434macrovascular 435, 440–441management of 443–444microvascular 435, 439–440pathogenesis of 436–439prevention of 442, 500–501psychosocial 441reversibility of 444screening for 443, 445transplantation in 444types of 353–435vascular 491
diabetes management 351aerobic training in 342–345carbohydrate counting in 368, 376–377chronic care model in 416–417community care in 422–424haemopoietic stem cell transplantation 495–496hospital clinic and 420in adolescents 396–397in rural areas 419, 426nutrition therapy in 300–377patho-physiological mechanisms of 345primary care in 417–419private practice in 421recommendations for 348resistance training in 343role of pharmacies in 399–402team-based integrated care in 421–424vegetarian diet in 374–375
Diabetes Medication Assistance Service (DMAS) 401–402Diabetes Pilot Program (DPP) 402Diabetes Prediction and Prevention (DIPP) study 88, 89, 494diabetes prevention 301, 301–302, 310
Index
517

evidence of 337–340individual approach in 341lifestyle interventions in 340, 351recommendations for 340–342whole-population approach in 341
Diabetes Prevention Program 374Diabetes Prevention Trial – Type 1 Diabetes (DPT-1) 494diabetes treatment
design of clinical trials for 501–505islet transplantation 496–500
Diabetes Vaccine Development Centre (DVDC) 494diabetic amyotrophy 440diabetic cardiomyopathy 447diabetic foot disease 426, 441diabetic ketoacidosis (DKA) 433diabetic nephropathy 439diabetic neuropathy 440diabetic retinopathy 439dietary adherence 374dietary counselling 374dietary supplementation 69diet-induced brain changes 15diets 457.
See also high-protein diet; See also weight-reducing diets; See also low glycaemic in-dex (GI) diets; See also low glycaemic load (GL) diets
fad 186Mediterranean-style 369recommended 172Traffic Light diet 472type 1 diabetes and 89type 2 diabetes and 367vegetarian 374–375very low energy diets (VLEDs) 458–459‘yo-yo’ effect 44
Diogenes Study 369, 374disability-adjusted life years (DALYs) 254discrimination 141, 323
parenting practices and 324school-based 186, 324
disposition index 112DPP-IV inhibitors 394, 395dyslipidaemia 200.
See also metabolic syndrome
eating behaviours 11, 472–473eating disorders 441.
Index
518

See also binge eating disorder (BED); See also bulimia nervosaeating episodes 41eating plan 457economic factors 262
protein intake and 42–43economic policies 273Edmonton protocol 497employment and obesity 324endogenous weight-control systems 10endoplasmic reticulum (ER) 117end-stage kidney disease (ESKD) 148, 151, 152, 152–154, 154energy
effects of deficit 5homeostasis 66requirements 4
energy-dense, nutrient-poor (EDNP) foods, 161, 40.See also processed foods
energy excess 59appetite-inhibiting effects of 6neuroendocrine responses to 7–9physical activity and 7
energy expenditure 15, 87.See also physical activityprotein leverage hypothesis and 45
environmental factorsautoimmune process and 492type 1 diabetes and 87, 490weight gain and 256, 258, 262
environmental sustainability 375epigenetic changes 15erectile dysfunction in diabetic men 441ethical implications of weight interventions 191–247ethics. See clinical ethics; public health ethics; principle-based ethicsEuropean Association for the Study of Diabetes 390European Prospective Investigation into Cancer and Nutrition study 375evidence-based health programs 274exercise. See also physical activity
beneficial effect of 15impact on metabolic physiology 45
extracellular matrix (ECM) 60
fataccumulation of 46overconsumption of 47wrapping 61
fat distribution 46
Index
519

gender-specific differences in 57metabolic risk factors and 57–59
Fenofibrate Intervention and Event Lowering in Diabetes (FIELD) trial 500FIELD study 504Finnish Diabetes Prevention Study 338food
addiction 13advertising. See food marketingpyramid 172reformulation 277–279
food and activity logs 458Food and Drug Administration (FDA) 278, 505Food and Health Dialogue 278food availability 11, 16
genetic adaptation and 26–27food marketing. See also television advertising
changing models of 167childhood obesity and 160–161industry expenditure on 162industry self-regulation 163–164, 270–272, 308of healthy foods 161, 172‘pester power’ 162–163, 269role of government in 164–165socioeconomic status and 163
food regulation 277–278, 307–308Food Standards Agency (FSA) (UK) 273Food Standards Australia New Zealand 279Food Standards Code (US) 277front-of-pack (FOP) signposting schemes 307–308fructose 371
gastric banding 323gastrointestinal hormones (incretins) 95, 108, 113gastrointestinal tract (GIT) 64–66gender relations theory 107–135genes. See also Human Leucocyte Antigen complex (HLA)genetic adaptation in response to food availability 26–27genetic predisposition 13
type 1 diabetes and 70–87, 90weight gain and 258
genome-wide association studies (GWAS) 87, 96, 113gestational diabetes 110, 426, 439, 444gluconeogenesis 45glucose
homeostasis 351intolerance 113
Index
520

metabolism 346, 367, 367–368, 368, 385, 386, 388–389tolerance test 110toxicity 117
glutamic acid decarboxylase (GAD) 86, 87, 88, 89, 90, 493.See also antigens
gluten 441, 495glycaemic control 345glycaemic index (GI) 377.
See also low glycaemic index (GI) dietsglycaemic load (GL) 377.
See also low glycaemic load (GL) dietsglycated haemoglobin 367glycosylated haemoglobin 346goal setting 457, 470–472governance structures for policy development for obesity prevention 267–269government interventions 277, 279.
See also legal interventions in obesity prevention; See also plausible policy basketgut health 69gut microbiota 64–67
barrier function of 65probiotic supplementation and 68
haemoglobin A1c, manatory reporting of 258haemopoietic stem cell transplantation 495–496health behaviours 141
impact of gender on 132Healthcare Identifiers Service 258healthcare system
attitudes towards obese in 324managament of diabetes in 399, 339–427, 444performance incentives 259–261regulation of 258–259
health education 399adolescents and 183whole-school approach to 183
health interventions, population-wide 235healthism 244health-promoting schools framework 181–182
development of 182–185in Africa 183–184nutrition acitvities 187–188
health promotion. See also obesity preventiongovernment campaigns 257harmful effect of 188nutrition information and 307–308, 309social marketing 309
Index
521

workplace-based programs 273–277health status and academic achievement 146–181healthy behaviours 474Healthy Food Compact 278–279healthy foods, availability of 307hepatic glucose production 43, 113hepatic lipid metabolism 66high-carbohydrate diets 370
proten intake and 40–41high-fat, high-sugar diet 12–15
brain changes and 15–16proten intake and 40–41
high-fibre foods 172high-protein diet 34, 42, 44.
See also protein intakeimpact on glucose metabolism of 368weight loss and 42
Holistic Health Framework program (Singapore) 221Human Leucocyte Antigen complex (HLA) 86, 87, 91–94, 491, 495.
See also genesgenotyping 492
hunger signals 12hunter-gatherer lifestyle 26hygiene hypothesis 89hypercholesterolaemia 498hyperglycaemia 109, 110, 112–117, 258, 375–376, 396, 490hyperinsulinaemia 110hyperinsulinaemic-euglycaemic clamp 110hyperlipidemia 67hyperosmolar non-ketotic coma (HONC) 433hyperplasia 62hypertension 200hypoglycaemia 394, 434–435, 498
idiopathic intracranial hypertension 203Immune Tolerance Network 93immunomodulators 67immunomodulatory trials 493–494immunosuppression 490, 493, 496impaired glucose tolerance 371incidental activity 457–458incretin-based therapy 119incretin enhancers 390incretin mimetics 389, 393–395incretins. See gastrointestinal hormonesIndian Diabetes Prevention Study 340
Index
522

Indigenous Australians 133chronic kidney disease (CKD) 148, 152diabetes care for 419end-stage kidney disease (ESKD) 148, 152life expectancy of 120, 152, 435
individual approachto obesity prevention 257–258
individual approach to diabetes prevention 341inflammation 59, 371–373
decreased insulin sensitivity and 58Institute of Medicine (US) 160, 278insulin 94, 396
acute complications due to a lack of 432–433acute complications due to an excess of 434discovery of 353secretagogues 388, 391, 395secretion 108–110, 113, 118, 119sensitisers 388, 391–393, 395sensitivity 46, 111, 345, 367, 369–371signalling 59
insulin deficiencyin type 1 diabetes 432–433in type 2 diabetes 433
Insulin for Life 447insulin resistance 57, 59, 67, 90, 110, 203, 346, 492
progressive resistance training (PRT) 343protein requirements and 43, 45type 1 diabetes and 90
insulin therapy 95–78, 376, 390adverse effects of 394in adolescents 397
insulitis 86, 91–93Interagency Working Group on Food Marketed to Children (US) 270INTERHEART study 256International Diabetes Federation 261, 386, 447International Diabetes Foundation 87International Federation of Diabetes 464International Obesity Task Force (IOTF)
child obesity, definition 210, 211, 213–215, 217, 218, 222intragastic balloon 465Intranasal Insulin Trial 11 (INIT 11) 494islet
amyloidosis 115–117autoimmunity 88, 90, 492cells 108graft function 497, 498
Index
523

pig’s cells 500transplantation 496–500
Japanese Diabetes Prevention Program (JDPP) 340Juvenile Diabetes Research Foundation (JDRF) (US) 93, 491
Kanyini Vascular Collaboration (KVC) 148, 151ketoacidosis 91, 200kidney disease.
See also chronic kidney disease (CKD); See also end-stage kidney disease (ESKD)prevention of 149–150
kidney transplantation 444kilojoule counting 3
law, role of in obesity prevention 258–267leaky gut 61–62legal interventions in obesity prevention 263–265, 264–267.
See also plausible policy basketfront-of-pack (FOP) signposting schemes 307–308
leptin 15, 115resistance 13
life history method 134, 140lifestyle behaviours 107lifestyle factors
insulin resistance and 110type 1 diabetes 89
lifestyle interventions 339, 371, 374, 456in children and adolescents 397, 468–470, 473–474in treatment of type 2 diabetes 396
lipotoxicity 118Look AHEAD study (US) 347, 467low-carbohydrate diets 377low-fat diet 10, 12, 15, 377low-fat, high-carbohydrate diets 369low glycaemic index (GI) diets 181, 368, 370low glycaemic load (GL) diets 368low-protein diet 44low-protein food 47
macrobiotic diet 40macronutrients intake 27–30.
See also rule of compromisecapacity to regulate 27–29, 48changing supply pattern of 30diet and 34–37economic cost of 42–43
Index
524

excess of 47insulin sensitivity and 369nitrogen 34protein 29
macrophagesinfiltration of 59phenotypic switching of 61
macrovascular complications 435, 440–441Magnetic Resonance Imaging (MRI) 93marginalisation in society. See societal marginalisationMartin, Robyn 207masculinity 140–141mass media health campaigns 257.
See also television advertisingMaturity Onset Diabetes of the Young 112meal replacement protocol 459Medical Benefits Schedule 259Medicare 259, 276, 417, 418Medicare Locals 261, 269, 424mesenteric fat 61, 62mesenteric hypertrophy 62metabolically healthy obese (MHO) 46metabolic dysfunction, role of gut in 61–64metabolic endotoxemia 64metabolic fitness 275metabolic memory 466metabolic physiology 45metabolic risk and subcutaneous fat 58metabolic syndrome 200, 371.
See also dyslipidaemiametformin 387, 389, 391, 393, 396–398, 476microbial dysbiosis 67microvascular complications 435, 437, 439–440Millian harm principle 238Mill, John Stuart 238mitogen-activated protein kinase (MAPK) signalling pathway 60motivational enhancement therapy (MET) 327–328motivational interviewing 472motivational strategies 325, 327musculoskeletal complications 201
nanny state 264National Basic Health Research (Indonesia) 216–217National Framework for Active Living (Australia) 269National Health and Medical Research Council (NHMRC) 403, 491National Health Survey (Australia) 133, 254, 386
Index
525

National Healthy Workplace Charter (Australia) 276National Indigenous Health Equality Summit 152National Institute for Diabetes and Digestive and Kidney Diseases (NIDDK) (US) 491National Obesity Prevention Act (US) 267National Pancreas Transplant Unit at Westmead Hospital 498National Partnership Agreement on Preventive Health (Australia) 276National Pharmacy Database Project (Australia) 403National Preventative Health Taskforce (Australia) 269National Preventative Health Taskforce National Preventative Health Taskforce (Aus-
tralia) 259, 263, 273, 276, 278National Prevention, Health Promotion and Public Health Council (US) 268National Prevention Strategy (US) 268New South Wales Schools Physical Activity and Nutrition Study 199NHMRC Clinical Trials Centre 503nitrogen 34non-alcoholic fatty liver disease (NAFLD) 201non-exercise activity thermogenesis (NEAT) 7non-television ‘screen time’ 169normoglycaemia 110NSW Healthy Workers Initiatives 276nutrient absorption 66nutrient density 40nutrition.
See also nutritional environmentdiabetes management and 300–377education 306food industry-developed criteria 164impact of Industrial Revolution on 26in childhood 186information systems 307–308knowledge among children 160school-based promotion of 186–188
nutritional environment 26historical perspective on 25–26impact on regulatory physiology 47
nutritional physiology, rodents as model for 27nuts consumption, benefits of 375
obesity 60.See also childhood obesityassociated comorbidities 469beta-cell failure 115bullying and 138costs of 243, 256, 386employment and 136, 141, 323, 324ethnicity and 133
Index
526

gender and 132–133, 215genetic predisposition to 13, 107impact on health 20, 46, 254–255, 386.
See weight-related health problemsimpact on identity 134impact on self-esteem 243impact on social relationships 138–139in adults 456, 456–458insulin resistance and 110lifestyle behaviours and 107low-protein diet and 44obstructive sleep aponea (OSA) and 198Oceanic populations and 45prevalence of (Australia) 133, 254, 386, 372prevalence of (US) 25, 255prevalence of (worldwide) 386protein appetite and 44psychosocial problems and 133, 263–323, 328sexual relations and 139socioeconomic status and 133symbolism of 140television viewing and 168, 171
obesity managementbariatric surgery 462–465devices used in 456, 465healthcare system and 399in adults 398–399in children and adolescents 397–398, 467–478pharmacotherapy in 459–462role of pharmacies in 403–404
obesity prevention. See also public health intervention; See also health promotioncommunity-based 244–247government approach 267–269, 279individual-based 257–258, 301legal interventions in 263–267school-based 185socio-ecological perspective 301–302, 310
obesity treatment. See also weight-loss treatment; See also obesity managementcommunity interventions 6family-based 469psychological issues in 326
obesogenic diet 13, 16obesogenic environment 263, 245
impact on biological weight-control systems 11–12obstetric care 444obstructive sleep aponea (OSA) 198
Index
527

Oceanic populations 45orlistat 403, 475overconsumption of sugars and fat 47oxidative stress 60–49, 373
pancreas 112systematic histological study of 91–93
pancreatectomy 113pancreatic beta cell. See beta cellpancreatic islet 108
inflammation of 114pandemic preparedness 207parent-focused intervention 470parenting. See also role-modelling of healthy behaviours
permissive style of 168practices 324
Partnership Agreement on Preventive Health (Australia) 269paternalism 238, 243patho-physiological mechanisms in diabetes management 345Patient Protection and Affordable Care Act (PPACA) (US) 274peripheral artery disease 441pharmacodynamics of antidiabetic drugs 395–396pharmacotherapy
adverse effects of 391–395impact of genes on 395–396in management of obesity 459–462in management of obesity in adolescents 398, 475–476in management of type 2 diabetes in adolescents 396–397in treatment of type 2 diabetes 387–390
pharmacyPharmacy in England (UK) 403role in diabetes care 399–402role in weight management 403–404
Pharmacy Pulse survey 403physical activity 189–190, 275.
See also energy expenditureacademic achievement and 146–181decrease in 170diabetes complications and 349environments 302–306for children and adolescents 473–474parental socioeconomic status and 171prescription 457–458promotion of 189–190type 2 diabetes and 336, 341, 346, 348–351
physical fitness 275
Index
528

Pima Indians study 110, 111plausible policy basket 263, 265policy approach to population weight gain 256–257, 261, 267–269polycystic ovary syndrome (PCOS) 201population-level interventions. See public health interventionspopulation strategy 235, 240, 262population weight gain 256–257positive energy balance. See energy excesspositron-emission tomography 93Practice Incentive Program (Australia) 261Prader Willi syndrome 11prebiotics 68.
See also probiotic stimulationprediabetes 93, 87, 112, 367, 385–387, 398, 490, 494pregnancy. See also gestational diabetes
insulin resistance and 110principle-based ethics 236principlism 236probiotics 68, 69processed food 42, 43, 278.
See also energydense, nutrient-poor (EDNP) foodsprogressive resistance training (PRT) 343, 347Protégé study 493protein catabolism 43protein intake 29, 48.
See also protein leverage hypothesisassymetry in 34environmental implications of 43high-fat, high-carbohydrate diet and 40–41, 48obesity and 44regulation of 47, 48
protein leverage hypothesis 33–34, 39–40energy expenditure and 45Sydney trial 37
protein-seeking behaviour 39proteinuria 148, 151, 440, 504pseudotumour cerebri 203.
See also idiopathic intracranial hypertensionpsychosocial complications in diabetes 441public health
ethics 236–238interventions 17, 242–247, 262, 245legislation 207nutrition 277
Public Health Act (SA) 254public infrastructure for physical and recreational activities 304–306
Index
529
Quick Service Restaurant Industry (Australia) 272
Regional Collaboration for Childhood Obesity Prevention Research program (Australia)171
regulation of healthcare system 258–259regulatory interventions. See legal interventions in obesity prevention
food reformulation 277–279regulatory physiology 47renal function 377, 393, 394, 443, 498, 501resistance training 345
diabetes management and 343Responsible Children’s Marketing Initiative (Australia) 164, 272role-modelling of healthy behaviours 469, 474Romp & Chomp project (Australia) 222Rose, Geoffrey 235, 240, 243, 245, 262, 309rotavirus 88–89Roux-en-Y gastric bypass 462–463rule of compromise 27, 32–37
animals and 36
salt intake 278–279school health promotion. See health-promoting schools framework
in Asia 221–222screening 401
for chronic kidney disease 150–151for diabetes 348, 494for diabetes complications 348, 435, 443for diabetes in pregnancy 149
sedentary behaviours 171–139, 469, 470, 472, 474self-efficacy 325, 327self-esteem 198, 243, 322self-monitoring 472self-perception 323–326
impact on weight-related behavious 324–325sexuality 132, 139skin problems 203, 441sleeve gastrectomy 463societal marginalisation 132, 138, 140, 141socio-ecological perspective 301–302, 304, 309–310socioeconomic status (SES)
childhood obesity and 212, 216obesity and 133, 304–306
statins 442, 445, 500statutory regulations of food marketing 165stigmatisation 240, 243, 323
school-based 186
Index
530

stimulus control 470, 472sucrose 67, 369, 371Swedish Obese Subjects study (SOS) 464symbolism of obesity 140synbiotics 69systemic metabolic dysfunction 62–64
taste stimuli 47taxation of unhealthy food 261T cell function 93, 494TEDDY study (The Environmental Determinants of Diabetes in the Young) 492television advertising 161, 168–170, 269, 270, 273television viewing 168–170
obesity and 168parental socioeconomic status and 171type 2 diabetes and 337
thin ideal 323, 326tobacco control 265TrialNET study 492, 493Trial to Reduce IDDM in Genetically at Risk (TRIGR) study 94, 495Trim and Fit program (Singapore) 221, 243type 1 diabetes 490
autoantibodies and 90environmental factors in 87genetic predisposition and 70–87, 90insulin deficiency in 432–433insulin resistance and 90insulitis and 91–93interventions in at-risk individuals 94lifestyle factors and 89management in adolescents of 397management of 443nutrition therapy in 375–377pathogenesis of 90, 93prevalence of (Australia) 425, 497specialist care in 425, 425–427, 426T cell function and 93viral infections and 88–89vitamin D intake and 90, 492
Type 1 Diabetes Genetics Consortium (T1DGC) 491type 2 diabetes
benefits of bariatric surgery in 464costs of 386dietary advice in 367, 373economic cost of 87, 256genetic predisposition and 113, 386
Index
531

gut microbiota and 67impact of 386impaired beta cell function and 110–111in children and adolescents 199, 396in Oceanic populations 45insulin deficiency in 433islet amyloidosis 115–117management of 342–347, 368, 371, 387–388, 396–397, 399–402pathogenesis of 109, 369pharmacotherapy and 387–395physical activity and 336, 349, 349–351prevalence of (Asia) 219–221prevalence of (Australia) 87, 258, 386prevalence of (worldwide) 87, 386prevention of 336–339risks of developing 58–59, 245
UK Code of Broadcast Advertising (BCAP Code) 272United Nations’ 2010 Human Development Report 146US Diabetes Prevention Program (DPP) 338utilitarianism 237, 243
vascular complications 491vegetarian diet in diabetes 374–375very low energy diets (VLEDs) 458–459
in children and adolescents 475victimisation 326viral infections and type 1 diabetes 88–89vitamin D 90, 201, 492voluntarism 238
walking 303weight-control behaviours, motivation to engage in 325weightism 188weight loss
as an embodied transformative process 140maintenance 466type 2 diabetes management and 368–369
weight-loss surgery 141.See also bariatric surgery
weight-loss treatment 141adjunctive therapy 458behavioural (BWT) 326cognitive behavioural strategies 328, 399commercial 234, 398, 403motivational enhancement therapy (MET) 327–328
Index
532

weight management and protein intake 48Weight Management Council of Australia 398weight-reducing diets
Atkins 234, 374effectiveness of 3, 133limitations of 4low-fat, high-carbohydrate 369Ornish 374types of 3, 4, 186
weight-related health problems 240, 242Western diet 44, 48, 219wholegrains vs refined grains 370whole-population approach. See also see also public health interventions
to diabetes prevention 341workplace-based health promotion 273–277Workplace Wellness Alliance (US) 276World Economic Forum 274World Health Organization Child Growth Standard 211, 215, 216, 217, 222World Health Organization (WHO) 160, 165, 181, 171, 221, 308, 386
child obesity, definition 210, 211health-promoting schools framework 182Multicentre Growth Reference Study 211
xenotransplantation 497
‘yo-yo’ diet effect 44
Index
533