Sustainable Building Immunization
108
Sustainable Building Immunization Prof. Ir. Daniel W.T. Chan Professor 12 th January 2015 Sustainable Immunized Building Research
-
Upload
independent -
Category
Documents
-
view
0 -
download
0
Transcript of Sustainable Building Immunization

Sustainable Building Immunization
Prof. Ir. Daniel W.T. Chan
Professor12th January 2015
Sustainable Immunized Building Research

Introduction Over half the energy used by the developed world is consumed
by buildings. As global concern increases about the impact of energy use, so does the importance of sustainable and energy-efficient building. No less important is the concern on the Indoor Air Quality (IAQ) since 1980s.
In the early 21st century we have experienced several disease outbreaks over the world, such as Avian Flu and SARS. The life losses and economical losses in these outbreak incidents are disastrous that a search for proper measures to minimize such a risk in future is necessary.
To help the community on enhancing building environmental safety, comfort and health – a concept of “sustainable immunization management” implementation in building, is proposed, in particular to response to the need of a safe IAQ.

Review on Building Quality Theme
Kyoto Face House, 1998
Buildings environment may facilitate the proliferation of diseases or sickness syndromes, as proved by past incidents. Hence, immunization management is a critical aspect. Let’s look at the past …
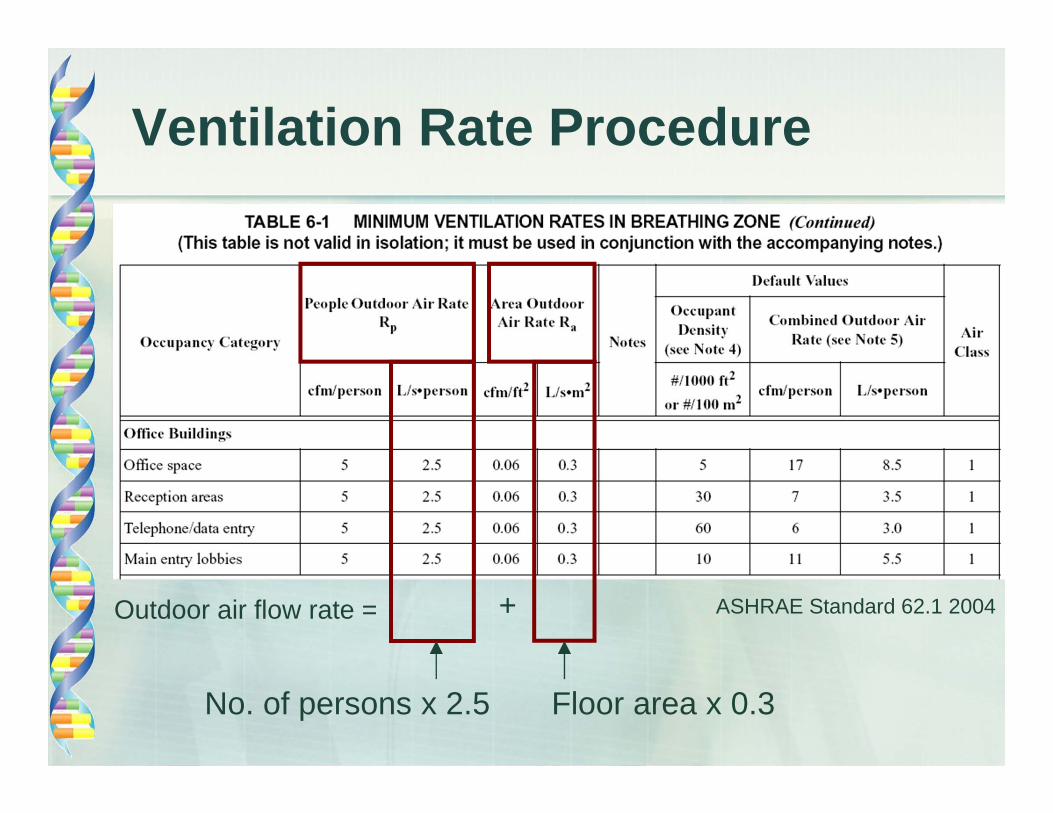
Review of Building Performance Requirement -Summary
Contemporary Requirement Lesson Learned
2003 SARS: Infection Control Search for Immunization
1970s Energy Conservation Avoid “Over Cutting Corners”
1990s “Nominal” Healthy Building Fail to Resist SARS in 2003
1980s Intelligent Building Proper Instrumentation
1960s Sense of Coolness Redefine “True Comfort Building”
1880s Immune from Black Death Hygienic EnvironmentVentilation & Drainage Provision

Review of Building Performance Requirement1880s 1960s 1970s 1980s 1990s 2003 2005
Building Development After Black DeathIn May 1894 the deadly bubonic plague (Black Death) outbreak occurred in these squatter houses in Tai Ping Shan.
Learning:Unacceptable indoor environmental quality could impose a higher risk of spread of disease.After the outbreak of bubonic plague, the Legislative Council passed the Building Ordinance on ventilation, sanitary fitments and drainage provisions in buildings.

Review of Building Performance Requirement
Cold air???
Energy Conservation & Building Sickness
“Air-conditioning system”(空調)
=
“cold air system” (冷氣)
Learning:The saying that “you can find the coldest spot in Hong Kong during Summer” is still common. It is basically because almost all design and operation of indoor environmental conditions are based on engineering preference rather than based on occupant activity scenarios.
1880s 1960s 1970s 1980s 1990s 2003 2005

Review of Building Performance Requirement
Learning:Finally, the issue of healthy building was a hot agenda in research activities. Sustainable building was thought to encompass healthy building.
The Electrical and Mechanical Services Department issued the Code on Overall Thermal Transmission Value for energy effectiveness and Code on Prevention of Outbreak of Legionnaires’ Disease for healthy buildings.
Real Estate and Developer Association and the Hong Kong Polytechnic University released the Hong Kong Building Environmental Assessment Method in 1997.
The Environmental Protection Department released the first Indoor Air Quality Study in 1997, followed by a voluntary scheme of Certification for Indoor Air Quality in 1999.
Healthy Building & Sustainable Development
1880s 1960s 1970s 1980s 1990s 2003 2005

Review of Building Performance Requirement
Energy Conservation & Building Sickness
Learning:Energy conservation stimulates inconsiderate degraded indoor built environment. Energy efficiency is a term applicable to system operation only. Energy effectiveness is the appropriate measure for built environmental performance in terms of energy efficacy
Cut down fresh air rate Increase use of artificial material in building
Since then, the “air-conditioning sickness” was prevailing. The World Health Organization collectively named these related sick symptoms as “Sick Building Syndrome”.
1880s 1960s 1970s 1980s 1990s 2003 2005

Building Sickness IAQ Guidelines
Building Sick-symptom Score
0.0
0.5
1.0
1.5
2.0
2.5
3.0
3.5
1 2 3 4 5 6 7 8 9 10 11 12 13 14 15 16 17Office
No.
of s
ympt
om/p
erso
n
Overall BSS 10 sick-symptom normalised BSS
Jones & O'Sullivan (1995)
Raw et al. (1990)
Building Sick-symptom Score

Review of Building Performance Requirement
Learning:Many buildings remained ‘sick’.
Also, application of technology should be continuously supported with qualified and well trained personnel.
Building Intelligence
While the concept of “healthy building” prevailed in the developed countries, Hong Kong buildings competed with “building intelligence” as quality theme. Unfortunately, engineering support was insufficient. Many of these systems became “white elephants”.
1880s 1960s 1970s 1980s 1990s 2003 2005

Review of Building Performance Requirement
Learning:Many of the discussions on healthy building in 1990s are notional and not comprehensive. A complete review and inspiration in a different strategy and approach are needed.A distinction of comfort, health and safety in indoor environmental quality is required.Air purification technology requires more engineering support.Building management is in need of an innovative strategy.
“Severe Acute Respiratory Syndrome” (SARS) outbreak occurred in Hong Kong in 2003. Two hypotheses were accepted by the World Health Organization for the traumatic disease spread in Amoy Garden:1. Vertical spread of virus through the narrow re-entrant (or light-well)
between the flats.2. Viral spread through the vertical drainage stack and the dried-up floor
drain trap.
SARS outbreak cast doubts on the then standards and practices of comfortable and healthy environment. The society has been continuously under threats of spread of Avian Flu and other viable diseases.
Communicable Disease Outbreak
1880s 1960s 1970s 1980s 1990s 2003 2005

Review of Building Performance Requirement1880s 1960s 1970s 1980s 1990s 2003 2005
Warning:In view of the growing concerns over the potential human influenza pandemic caused by the outbreak of H5N1 Avian Flu in Asian and European countries, a new building theme is necessary to response set up a contingency plan for the School to response to Prevent and Protect the outbreak in the community level.
As of November 29, 2005, H5N1 has caused illness in 133 people, 68 of whom have died. H5N1 infections have been confirmed in Thailand, Vietnam, Indonesia, Cambodia, and China. Researchers are especially concerned because this flu strain, which is transmitted by birds and is quite deadly, is becoming endemic in Asia and has infected humans in an unprecedented number of countries. In addition, from 2003 to the present, several other strains of bird flu have caused illness in Egypt, Canada, and the Netherlands.
Communicable Disease Outbreak

Flu attack in 2008
5 March 2008 Metro

Sustainable Immunized Buildings Aims and Objectives
Development of an implementation model for building healthiness
Review the approach for building health design, testing & commissioning, operation & maintenance (life cycle of a building)
Harmonization of building health and sustainability

“ To design and to sustain for the health of human being,To consolidate the fundamental functions to restore vitality”
Motto of“Sustainable Immunized Building”
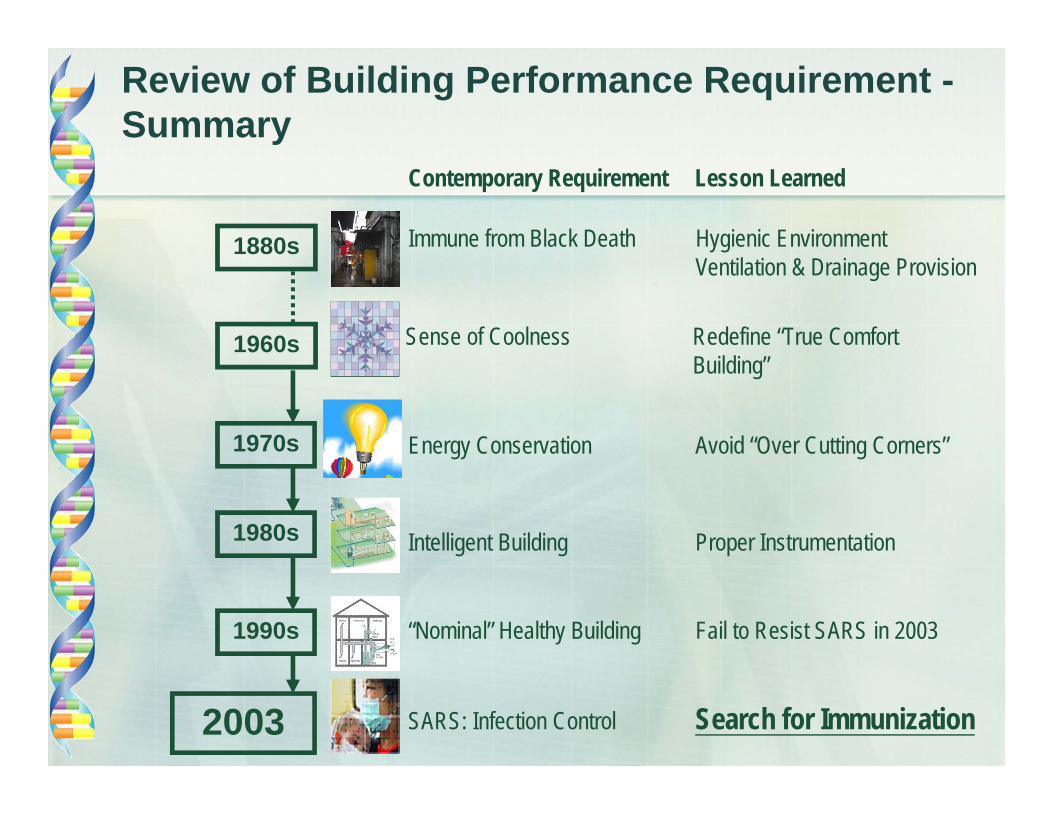
The most economical way to cure sickness is not to get sick.
The most effectiveway to cure sickness is by one’s own immunity.
Axiom of SIB

Healthy&
Sustainable Building
EngineeringArchitecture
Health
Synergy and Integrated Approach

Building science & engineering
Diagnosis, causes & curing of problems
Balance of loading & system capability
Protection in advance
Principle 1: Building Physiology
Principle 2: Building Pathology
Principle 3: Building Dietetic
Principle 4: Building Immunization
Sustainable Immunized Buildings:The Principles

On Building Services Systems:Fluency in Air, Chilled water and Drainage systems (三通)
Aim: To develop a model of the fluency in air, chilled water and drainage systems
Model: Intestine (腸通): Sufficient water supply for flushing Proper provision and monitoring of
drainage pipesBlood circulation (血通): Crucial rule
ensure capable prime movers “the organs” (e.g. chiller plants, LV switch rooms)
a smooth flow of matter in pipes and cables (the distribution network).
Air system (氣通): Air balancing
balance of air supply and exhaust Filtration of pollutants

Blood circulation / Thermal regulation
In human body, blood circulation ensures the even distribution of heat among the whole body.
Inside a building, thermal regulation is achieved through the operation of mechanical air-conditioning system.
Crucial rule
Chiller plants operation match with the load.
Balanced chilled water distribution in response to thermal load.
Controlling the operation of air-side equipment – in particular the chilled water flow across cooling coil.

Comfort criteria :International –• ASHRAE Standard
Thermal Environmental Conditions for HumanOccupancy (ASHRAE Standard 55-1992)Ventilation for Acceptable Indoor Air Quality (ASHRAE Standard 62.1-2004)
• CIBSE Guide
• CEN Report Ventilation for Buildings – Design Criteria for theIndoor Environment (CR1752)
Air circulation: Ventilation & IAQ

Perception of comfortable IAQ is detected by the nasal sense as odour
• Comfortable IAQ does not imply a healthy and safe IAQ
• Uncomfortable IAQ does not necessarily imply unhealthy or unsafe IAQ
• Comfortable IAQ is achievable by adequate ventilation of fresh air to dilute human odour
• Fresh air is defined as air quality at or better than that set out in Hong Kong outdoor air quality objectives
Comfortable IAQ

• Rate of human bio-effluents emission is usually proportional to rate of metabolic carbon dioxide
• Majority (80% or more) of occupants will perceive the indoor air as comfortable at a ventilation rate of 7.5 L/s/person; at the rate the corresponding concentration of metabolic carbon dioxide is 1000 ppm
• Uncomfortable IAQ with concentration of metabolic carbon dioxide higher than 5000 ppm is usually set as a level of concern
Comfortable IAQ

Air circulation: Ventilation & IAQ
To determine design ventilation rate –ASHRAE Standard 62.1 (2004)
3 approaches
Ventilation rate procedure (prescriptive)
Indoor Air Quality procedure
Fanger’s approach
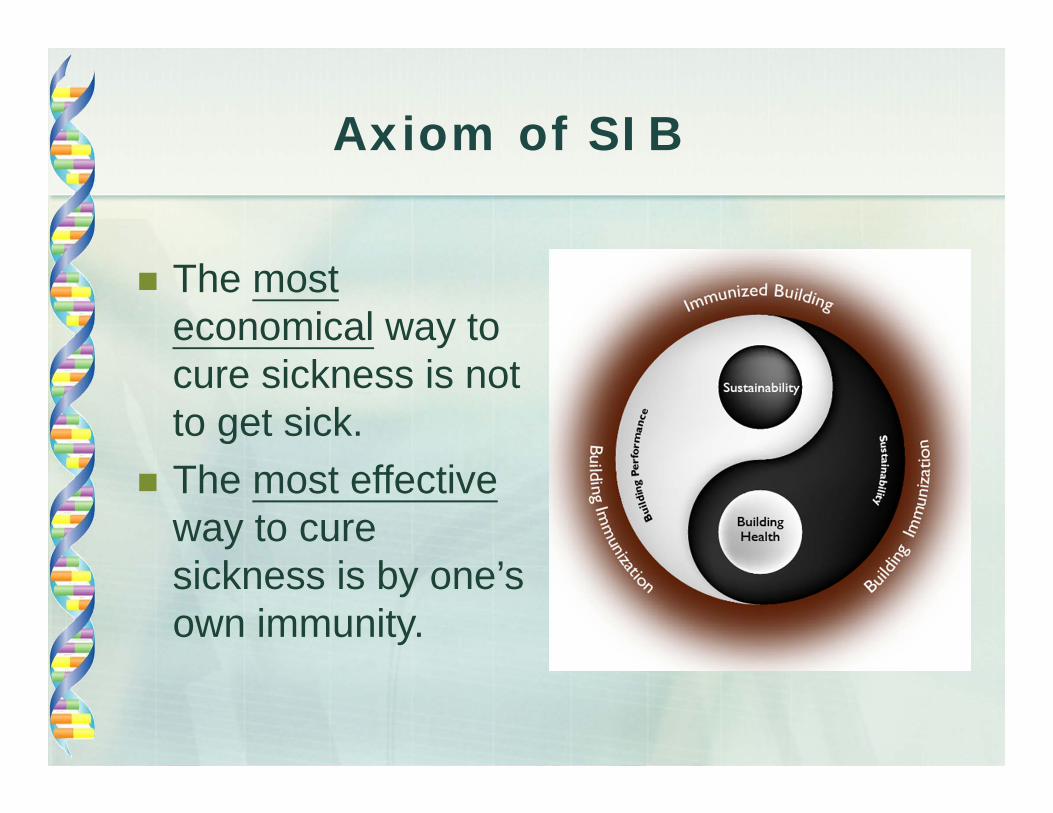
Ventilation Rate Procedure
Outdoor air flow rate = +
No. of persons x 2.5 Floor area x 0.3
ASHRAE Standard 62.1 2004

Required Outdoor Air or Space Contaminant Concentration with Recirculation and Filtration (ASHRAE Standard 62-2004 Table D-1)
Indoor Air Quality Procedure

Outdoor Air comply
with HKOAO
Any significant indoor
pollutants other than people
Determine Outdoor
Air Quality
Determine Indoor
Air Pollutant Sources
Ventilation Rate
Procedure
Mitigation Strategy ?
Treatment to OAQ
Use of Environmental
FriendlyMaterial orDedicatedExhaust
IAQ Procedure
(Yes) (No)
(No)(Yes)
ASHRAE 62
Procedures for Designing Comfortable/Healthy IAQ
Clean outdoor air
(Yes)
(No)
Comfortable IAQ
Healthy IAQ

Air Quality Comfort Method developed by P.O. Fanger
Parameter Unit Good ACH Addition ExcellentCarbon Dioxide ppm < 1000 1.25 ACH < 800
Carbon Monoxide g/m3 < 10000 5 ACH < 2000Respirable Suspended Particulates g/m3 < 180 9 ACH < 20
Nitrogen Dioxide g/m3 < 150 3.75 ACH < 40Ozone g/m3 < 120 2.4 ACH < 50
Formaldehyde g/m3 < 100 3.33 ACH < 30Total Volatile Organic Compounds g/m3 < 600 3 ACH < 200
Radon Bq/m3 < 200 1.33 ACH < 150Airborne Bacteria cfu/m3 < 1000 2 ACH < 500
Room Temperature oC < 25.5 - 20 – 25.5Relative Humidity % < 70 - 40 – 70
Air Movement m/s < 0.3 - < 0.2
• Assuming pollutant source strength (olf) is linear proportional to the expected level of IAQ parameter

In the theory, two new units, 'Olf' for emission rate of pollutantsand 'decipol' for perceived air pollution, were defined. Theolfactory model is described by equations 1 to 3 (Fanger 1988).
C = 112 [ln(PD) - 5.98]-4 (1)
where C = perceived air quality in space (decipol)
PD = percent dissatisfied (%)
Air Quality Comfort Method
Ct = Co + 10 G/Q (2)
where Ct = perceived air quality in air (decipol)
Co = perceived air quality outdoors (decipol)
G = pollutant source strength (olf)
Q = ventilation rate (l/s)
Rearranging G = (Ct - Co) * Q/10 (3)

According to ASHRAE Standard 62-1989, if 20% dissatisfactionis a guideline for acceptable air quality in terms of comfort, fromequation (1), C = 1.4.
Then, from equation (3)
Q = 10 G /(1.4 - Co) (4)
Since the olf is additive, if all the olfs from all the odour sourcesare known, the ventilation rate can be calculated according toequation (4).
Air Quality Comfort Method

On the management of healthy IAQ……

Healthy IAQ refers to air quality in which concentration of all the air constituents are within the safe limits as recommended by cognizant authorities.
The GN provides healthy limits of the most common contaminants found in indoor space.
Healthy IAQ

• Achieved by diluting the indoor air contaminants by outdoor air and/or through treatment of recirculated indoor air by filters to remove the indoor air contaminants
• With dilution principle, the indoor concentration of air contaminant is a function of outdoor air quality, outdoor air quantity and indoor air contaminant emission rate
• With filtration principle, the concentration of an air contaminant is a function of the filter removal efficiency, indoor air contaminant emission rate and indoor air recirculation rate
Healthy IAQ

IAQ Objectives
Health criteria :International –• World Health Organization (WHO)
• American Conference of Governmental Industrial
Hygienists (ACGIH)
• Occupational Safety & Health Administration
(OSHA) – U.S. Department of Labor

IAQ Objectives
Health criteria :Local –• Reference Note on Occupational Exposure Limits
(OEL) for Chemical Substances in the WorkEnvironment – Labour Department
• Guidance Notes for the Management of IAQ in Offices and Public Places (Good Class) – EPD

HKEPD Guidance Notes for IAQ management
Guidance Notes for the Management of IAQ in Offices and Public Places- Indoor Air Quality
Management Group(Implement – September 2003)
(Draft - November 1999)

A Guide on Indoor Air Quality Certification Scheme
- Indoor Air QualityManagement Group(Implement – September 2003)
(Draft - August 2000)
HKEPD Guidance Notes for IAQ management

Parameter Unit8-hr average
Excellent GoodCarbon Dioxide ppm < 800 < 1000
Carbon Monoxide g/m3 < 2000 < 10000Respirable Suspended Particulates g/m3 < 20 < 180
Nitrogen Dioxide g/m3 < 40 < 150Ozone g/m3 < 50 < 120
Formaldehyde g/m3 < 30 < 100Total Volatile Organic Compounds g/m3 < 200 < 600
Radon Bq/m3 < 150 < 200Airborne Bacteria cfu/m3 < 500 < 1000
Room Temperature oC 20 – 25.5 < 25.5Relative Humidity % 40 – 70 < 70
Air Movement m/s < 0.2 < 0.3
Recommended IAQ objectives

Recommended minimum number of sampling points
Total Certified Area within the Premises (served by MVAC system)
(m2)
Minimum Number of Sampling Points
< 3 000 1 per 500 m2
3 000 - < 5 000 85 000 - < 10 000 12
10 000 - < 15 000 1515 000 - < 20 000 1820 000 - < 30 000 21
> 30 000 1 per 1200 m2
GN benchmarks IAQ into 2 levelsExcellent – represents very good IAQ that a high-class and
comfortable building should have
Good – represents IAQ that provides protection to the public
at large including the very young and the aged
Non-compliance to IAQ objectives may worsen the health of citizen.
Compliance to IAQ Objectives vs. effective use of resources.
HKEPD Guidance Notes for IAQ management

Practical Measures & IAQ Management Plan
Principle 1 Determining the ‘population’ of measurement points
Principle 2 Determining the number of sampling points
Principle 3 Reducing the number of sampling parameters in each sampling point
Principle 4 Reducing the amount of sampling time for eachparameter in each sampling point
This measurement protocol is adopted in the Hong Kong Building Environmental Assessment Method (HK-BEAM).
Before carrying out IAQ sampling according to GN, we should plan to manage how to sample the IAQ parameters by following principles:

Principle 1 Determining the ‘population’ of measurement points
First – Define measurement zone (with one representative location) :IAQ parameters are uniform within a tolerance band
Ideal case for determining IAQMonitor all IAQ parameters for continuous period of time in every occupied location simultaneously
Pragmatic Approach

Mass Balance Equation
By conservation of mass
Massaccumulated = Massgenerated + Massin – Massout – Masssink
where V = indoor volumeCAroom = uniform room concentration of At = timeGA = generation rate of AQ = ventilation rateCAin = concentration of A in incoming air Ksink = rate constant for sink
VdCAroomdt = GA + QCAin – QCAroom – KsinkCAroom
Principle 1 Determining the ‘population’ of measurement points

1st factor1st factor
Outdoor air system & quality
Outdoor air system & quality
2nd factor2nd factor
PollutantinventoryPollutantinventory
3rd factor3rd factor
Ventilation rate & effectiveness
Ventilation rate & effectiveness
Test on uniformityTest on uniformity
Preliminary investigation Walkthrough inspection
Principle 1 Determining the ‘population’ of measurement points

Principle 2 Determining the number of sampling points
Snapshot sampling during walkthrough inspection
The contaminant concentration is assumed to be normally distributed

Estimation goal of sample size calculation
To estimate the average pollutant levels under prescribed conditions with a stated degree of precision
Sample size, n =
where t = no. of standard deviations (approx. 1.96) that accountfor the central 95% of the area under a normal curve
S = standard deviation for the variable to be estimated
d = the margin of error (i.e. 10% of true value)
t2S2
d2
Principle 2 Determining the number of sampling points

Number of specified air quality parameters can be reduced if:
- the source is known to be absent in the building and its concentration in the outdoor air is lower than that specified in the GN
- Example: Carbon monoxide (no heavy smoking and cooking)Nitrogen dioxide (no heavy smoking and cooking)Ozone (no heavy duty of photocopiers / electrical machines)
Principle 3Reducing the number of parameters in each sampling point

- Daily profile of pollutant should be more or less the same if the building is operating at steady state
- Snapshot sampling can be effectively used for estimating 8-hr exposure
Typical Carbon Dioxide Signature
0
200
400
600
800
1000
1200
4:48 9:36 14:24 19:12 0:00 4:48
Time
CO
2 Con
cent
ratio
n, p
pm
Typical CO2 Signature in Office
Principle 4Reducing the amount of sampling time for each parameter in each point

The Chinese and Western medical principles to diagnose and cure human sickness provides inspiration on curing building sickness.
Similar to the indices reflecting the human health condition, a set of indices can be adopted to indicate the “healthiness” of the indoor environment and the operating engineering systems.
ECG diagnosis
Building Sick-symptom Score
0.0
0.5
1.0
1.5
2.0
2.5
3.0
3.5
1 2 3 4 5 6 7 8 9 10 11 12 13 14 15 16 17Office
No.
of s
ympt
om/p
erso
n
Overall BSS 10 sick-symptom normalised BSS
Jones & O'Sullivan (1995)
Raw et al. (1990)
Building Sickness Score
Building Pathology

Building Indexing System (Pathological)
Aim: To develop a protocol for a more effective an optimized approaches for operation and maintenance system of BS systems and equipment.
Model:
Equipment and components
Health performance Occupants’ health
Holistic performance Indoor environment
Human system performance Building system performance
Organic Performance
System
Quality Delivery
Receptor
Component
Application: Wed-based IEQ survey and Health Indices System and component performance monitoring decision model Real-time monitoring by BMS Built-in sensors In-situ instrumentation Measurement Pockets Field measurement

The “pathology” of degraded IAQ……

Findings9% locations can achieve Excellent Level;74% locations can achieve Good Level;17% locations cannot achieve Excellent/Good Level.
Background54 locations from 5 Grade-A office building
Pathological Investigation: Our Experience

Results of Site Measurement
8-hour average ITF Project (54 locations of 5 Buildings)
Other Studies(200 locations of 20 buildings)
Excellent Good Fail Excellent Good FailCO2 77% 19% 4% 73% 15% 13%CO 100% 0% 0% 100% 0% 0%PM10 66% 34% 0% 10% 78% 12%NO2 100% 0% 0% 100% 0% 0%O3 100% 0% 0% 100% 0% 0%HCHO 69% 31% 0% 24% 70% 6%TVOC 0% 54% 46% 11% 21% 68%Radon 93% 3% 3% 90% 7% 3%Bacteria 100% 0% 0% 40% 49% 11%Temp 95% 5% 0% 100% 0% 0%RH 91% 2% 7% 100% 0% 0%Air Movement 86% 10% 4% 100% 0% 0%
Difficult to achieve Excellent/Good LevelDifficult to achieve Excellent Level
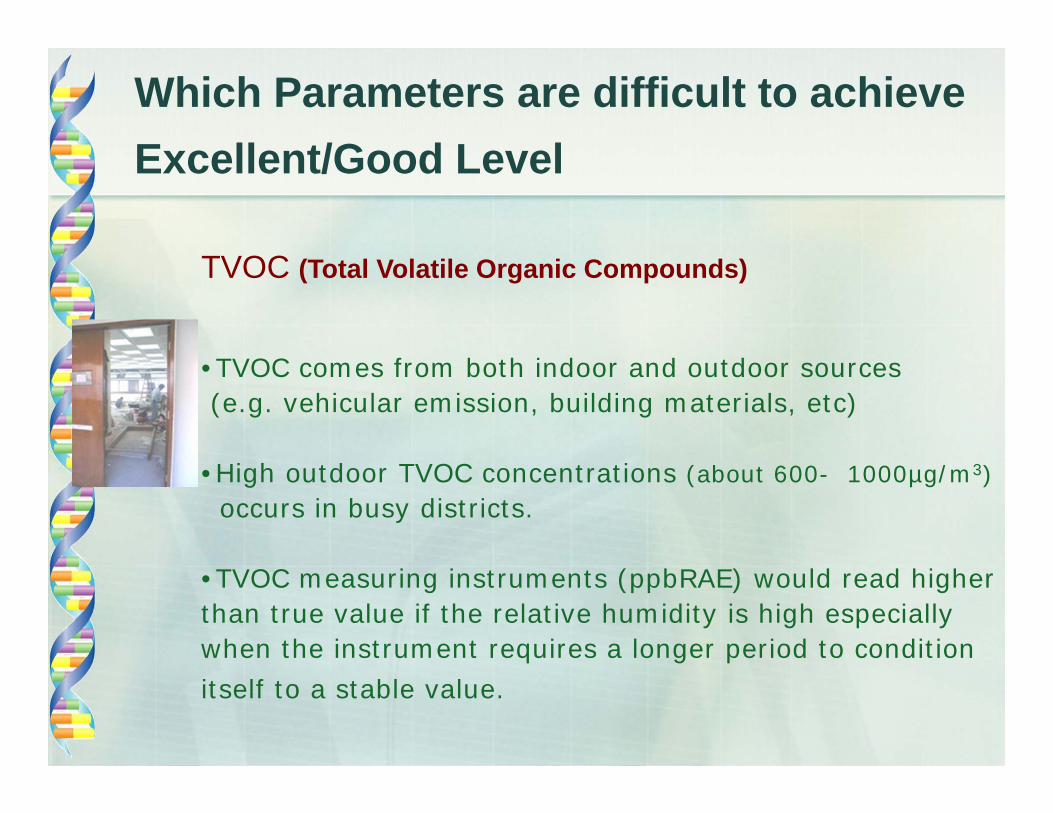
TVOC (Total Volatile Organic Compounds)
•TVOC comes from both indoor and outdoor sources (e.g. vehicular emission, building materials, etc)
•High outdoor TVOC concentrations (about 600- 1000µg/m3)occurs in busy districts.
•TVOC measuring instruments (ppbRAE) would read higher than true value if the relative humidity is high especially when the instrument requires a longer period to condition itself to a stable value.
Which Parameters are difficult to achieve Excellent/Good Level

• Select building materials with low VOC emission;
• Choose outdoor intake locations with clean outdoor air;
• Purge thoroughly indoor space after new renovation is completed;
• Use flexible ventilation set up for temporary high VOC emission.
Strategy to reduce TVOC

Which Parameters are difficult to achieve Excellent Level
PM10 (Respirable Suspended Particulates)
• PM10 comes from indoor and outdoor sources (e.g. vehicular emission).
• If the building is leaky (especially in old buildings), infiltration can increase the indoor PM10 concentration.
• High outdoor PM10 conc. (about 120-190µg/m3) is common in busy districts;
• DustTrak (light scattering) usually gets a higher value than gravimetric method (more accurate). For Hong Kong, in general cases a multiplier of 1.95 should be applied.

- Maintain a proper filtration system can effectively reduce the PM10 concentration.
- Reduce infiltration.
- Carefully locate the outdoor intakes.
Strategy to reduce PM10

HCHO (Formaldehyde)
- HCHO mainly comes from indoor sources (e.g. partitions, building material, furniture etc)
Which Parameters are difficult to achieve Excellent Level

Strategy to reduce Formaldehyde
• Select materials with low HCHO emission;
• Purge thoroughly after new renovation completed;
• Strategy in general would be the same as dealing with TVOC.

Which Parameters are difficult to achieve Excellent Level
Carbon dioxide
• CO2 concentration depends on several factors, such as occupant density, ventilation effectiveness, quality and quantity of outdoor air source.
• High CO2 value always record in crowded office. If the number of occupancy is over the outdoor air design flow rate, it is difficult to get an excellent or good level if the ventilation rate is not increased to satisfy the conditions.

Parameters to achieve Excellent IAQStrategy to reduce carbon dioxide
• Increase outdoor air quantity (while causing a significant increase in energy consumption of HVAC systems and may increase PM10 level, {and the loading to air filters})
• Air-balancing to distribute more fresh air to densely occupied zone, to match the higher demand of fresh air.
• Carefully locate the outdoor air intake.

Which Parameters are comparatively less difficult to achieve Excellent Level
Bacteria
• Mould growth is commonly associated with poor humidity control.
• Not difficult to achieve Excellent class in Grade A buildings if the environment is maintained at a RH level below 70%.
Radon
• Not difficult to achieve excellent class if sufficient ventilation is provided.

Parameters to achieve Excellent IAQ
Which Parameters are less difficult to achieve Excellent LevelTemperature
• Not difficult to achieve excellent class if the temperature set-point is appropriate.
Relative Humidity
• Not difficult to achieve excellent class if the dehumidification is performed well in HVAC system.
Air Movement
• Not difficult to achieve excellent class if the sampling location is away from draught risk, or distributed air is well balanced.

Parameters to achieve Excellent IAQ
Which Parameters are less difficult to achieve Excellent Level
Ozone
• Ozone comes from outdoor and indoor sources.
• Not difficult to achieve Excellent class if the outdoor air intakes are located away from exhaust, busy road, and car-park; and if local exhaust system is provided for heavy-duty office equipments, such as printers, which emit ozone.
Nitrogen Dioxide (NO2), carbon monoxide (CO)
• NO2 and CO mainly comes from outdoor.
• Not difficult to achieve Excellent class if the outdoor air intakes are located away from busy road, car-park, and exhaust.

On the safe IAQ……

A safe IAQ is indoor air containing no pathogenic or infective micro-organisms such as fungi, bacteria or viruses.
• No guideline of ventilation rate for safe IAQ
• As reference, a doctor in US in 1893 had used ventilation rate of 28 L/s/person to avoid cross infection of tuberculosis
Safe IAQ

ACH and time required for removal efficiencies of 90%, 99% and 99.9% of airborne contaminants(Brian 1994)
ACH Minutes required for removal efficiency90% 99% 99.9%
1 138 276 4142 69 138 2073 46 92 1384 35 69 1045 28 55 836 23 46 697 20 39 598 17 35 529 15 31 4610 14 28 41…. …. …. ….25 6 11 17…. …. …. ….50 3 6 8
Safe IAQ

Relationship between Ventilation Rate & Metabolic CO2
Litre/sec/person Significance Year of concern
Expected CO2
(ppm)
Fanger’s PPD(%)
28 Reduced risk of spread of viable disease, e.g. tuberculosis 1893 500 6
17 Reduce microbial pollution 1996 600 10
14 Use before recirculation is allowed
Before 1973 650 11
10 Allowed for low smoking rate Since 1989 800 15
7.5Minimum for adapted person +
odour contribution from ventilation system and furnishing
1996 1000 20
2.5 – 3.0 Adapted person 1973 2200 401.0 Level of concern - 5000 63

Historical review: outdoor air flow rate design criteria

CDC’s Guidelines for Environmental Infection Control in Health-Care Facilities.(June 6, 2003)
Airborne infection isolation (AII)This refers to the isolation of patients infected with organisms spread via airborne droplet nuclei <5 µm in diameter.
This isolation area:(1) receives numerous air changes per hour (ACH) (>12 ACH for
new construction as of 2001; >6 ACH for construction before 2001), and
(2) is under negative pressure, such that the direction of the air flow is from the outside adjacent space (e.g., the corridor) into the room.
Safe IAQ: Ventilation Guidelines for Healthcare Facilities

CDC’s Guidelines for Environmental Infection Control in Health-Care Facilities. (2003)
Airborne infection isolation (AII) [continue]
• The air in an AII room is preferably exhausted to the outside, but may be recirculated provided that the return air is filtered
through a high-efficiency particulate air (HEPA) filter.
• The use of personal respiratory protection is also indicated for persons entering these rooms when caring for TB or smallpox patients and for staff who lack immunity to airborne viral diseases
(e.g., measles or varicella zoster virus [VZV] infection).
For further details, please consult the full document on-line:http://www.cdc.gov/mmwr/preview/mmwrhtml/rr5210a1.htm

Other reference documents:
• American Society of Heating, Refrigerating and Air-conditioning Engineers:
HVAC Design Manual for Hospitals and Clinics, 2003
Safe IAQ: Ventilation for Healthcare Facilities

• For example, good practice design criteria (e.g. on air changes) in different spaces in hospitals:
Safe IAQ: Ventilation for Healthcare Facilities

Tools for building engineering management, diagnosing problems and curing……

Indoor Environmental Health & Comfort Analyzer (IEHCA)
Building Sick-symptom Score
0.0
0.5
1.0
1.5
2.0
2.5
3.0
3.5
1 2 3 4 5 6 7 8 9 10 11 12 13 14 15 16 17
Office
No.
of s
ympt
om/p
erso
n
Overall BSS 10 sick-symptom normalised BSS
Jones & O'Sullivan (1995)
Raw et al. (1990)
A. Sickness and comfort sensation survey among the occupants:
(1) Generation of Building Sickness Score(2) Comfort equation: Relative weighting
among various IEQ qualifiers
B. Monitoring the environmental quality in occupied space:
Understanding the relationshipbetween physical parameters and occupants’ response.
C. System and equipment performance monitoring:
Operating the systems according to the occupants’ perception and the physical parameters of the occupied space.
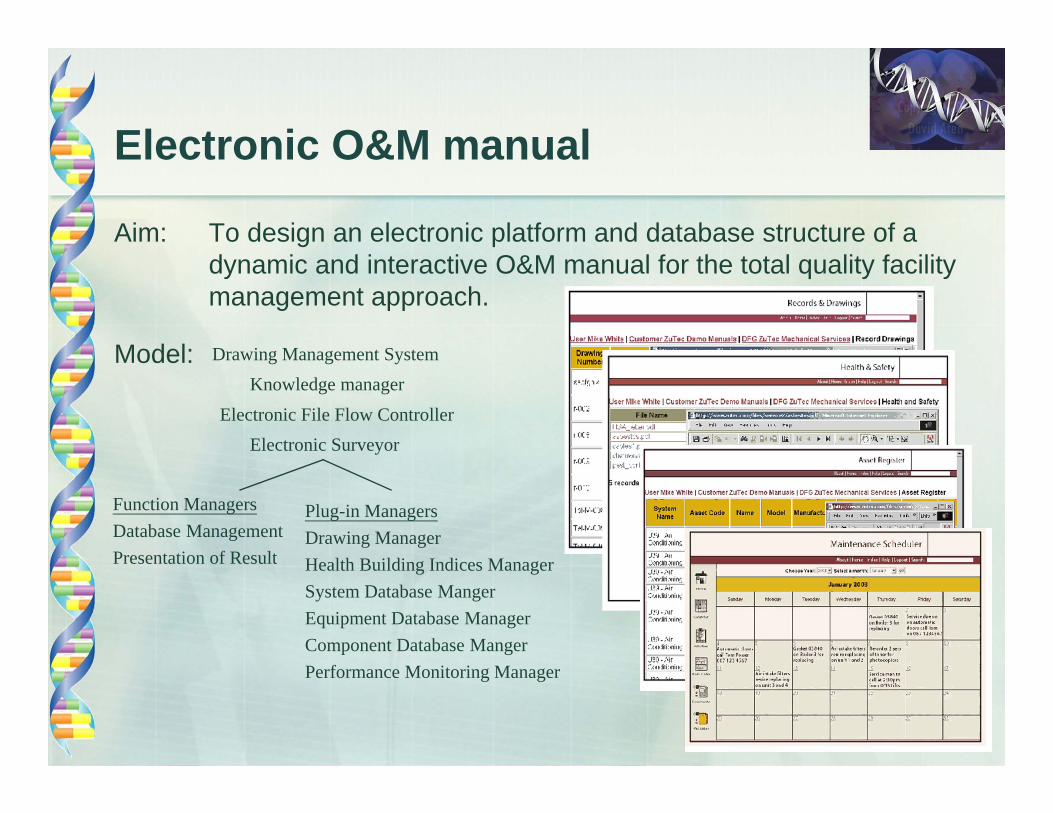
Electronic O&M manual
Aim: To design an electronic platform and database structure of a dynamic and interactive O&M manual for the total quality facility management approach.
Model:
Plug-in ManagersDrawing ManagerHealth Building Indices ManagerSystem Database MangerEquipment Database ManagerComponent Database MangerPerformance Monitoring Manager
Function ManagersDatabase ManagementPresentation of Result
Drawing Management System
Electronic File Flow ControllerElectronic Surveyor
Knowledge manager

Indoor Air QualityManagement
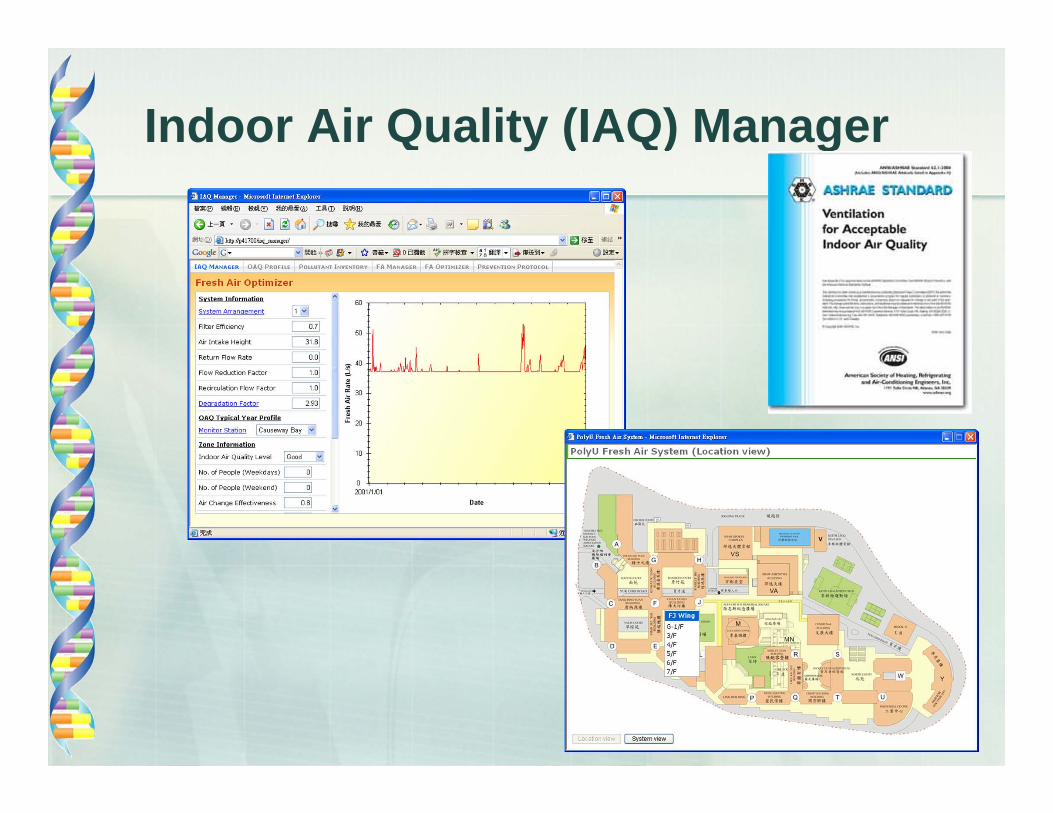
Indoor Air Quality (IAQ) Manager

IAQ Manager
ASHRAE 62 2004
IAQ Certification Scheme Pollutant Inventory
Outdoor Air Degradation
Outdoor Air Quality
Indoor FreshAir demand

Outdoor Air Quality Pollutant’s concentration
data of outdoor air from EPD, form 1983 to 2005
Typical Year of outdoor air quality For IAQ management
and user reference
Real Time Data from EPD For operator reference
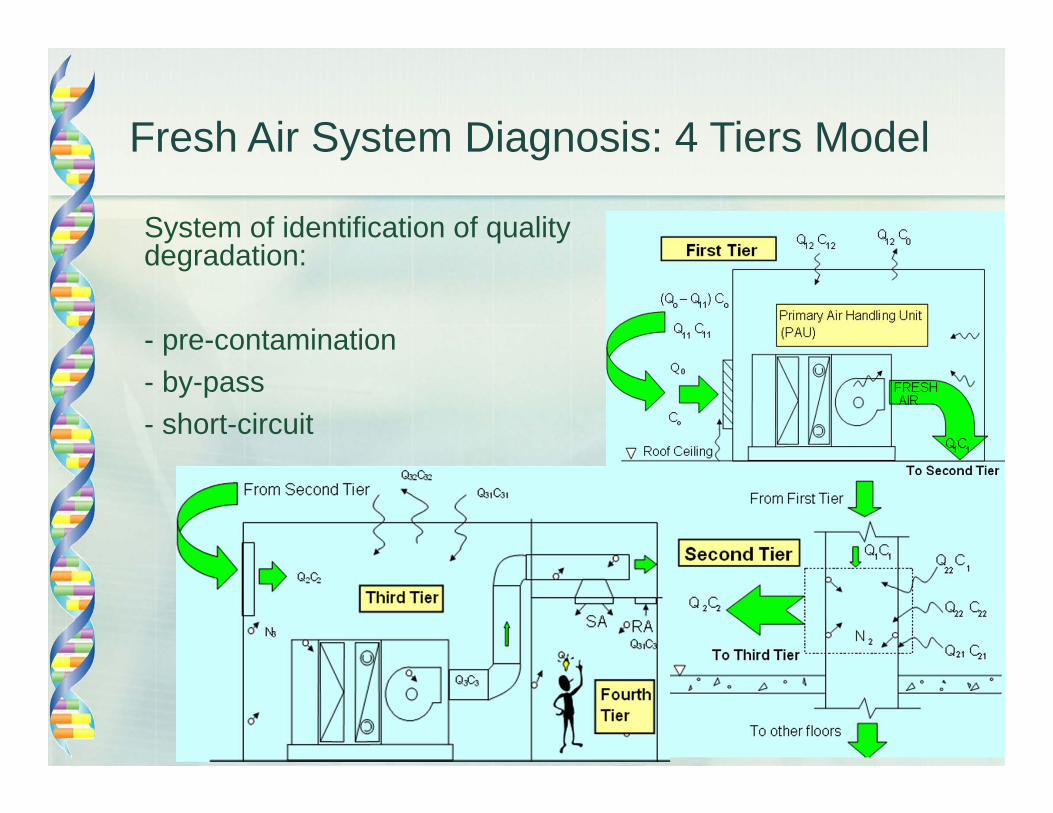
Fresh Air System Diagnosis: 4 Tiers Model
System of identification of quality degradation:
- pre-contamination- by-pass- short-circuit

Degradation of the Outdoor Air
Pre-contamination Short-circuit By-pass

Principle 3 - Building Dietetic:Pollutant Inventory Management
Aim: To develop a management protocol of pollutant inventory for recording the indoor air pollutants presence in the built environment with respect to the as installed ventilation capacity.
Model:
Proper selection of
building materials
Food intakes Building materials and consumables
Diet and nutrient
Application: Pollutant inventory measurement protocol for T&C and re-commissioning of a building. Determination of optimized outdoor air supply quantity based on strength of indoor air pollutants (emission distribution and profile in zones)
Healthy
living

Level 1: Safe operation of building services system – ensure the building itself shall NOT be the source of proliferation of pathogens.
Typical issue: Management of cooling tower operation.
Level 2: Disinfection of imported pathogensfrom infected occupants or from the outside.
Principle 4 - Building Immunization

Cooling Tower - Risk Assessment
Testing Protocol for Antifungal Performance and Minimum Inhibition Concentration Testing of Biocides
PCR Detection Methodology Development

Early in 1950s, the use of Upper Room UVGI installations in hospitals and schools were reported in the literature.
Attempting to reduce the risk of air-borne infections, including TB and measles.
New development: Delivery of air to the UVGI system by mechanical means.
To enhance the disinfection effectiveness and energy effectiveness.
Disinfection in Built Environment
Supply Air
Return Air
CFD simulation
Comparsion of TiO2 Performance by TVOC Decay Log-Curve
y = -0.2402x + 9.2009R2 = 0.9941
y = -0.3194x + 9.3381R2 = 0.9982
5.5
6.0
6.5
7.0
7.5
8.0
8.5
9.0
9.5
0 1 2 3Time(hour)
TVO
C Co
ncen
trat
ion
(ppm
30Hz(without TiO2)
30Hz (with TiO2)
Regression Line
Experiment

Disinfection Model Development
Ductwork cleaning Surface cleaning Space cleaning Air cleaning protocol – air cleaner model Special design:
- ventilated sterilizing wall- ventilated sterilizing partition
Pesticide / Rodent control Fumigation
Aim: Integrated management protocol of disinfection/cleaning in space, air and on surfaces.
Application: Air cleaner design protocol

On the “safeness” of indoor environment…

2003 SARS outbreak
Hypothesis of Stack Contamination in a WHO investigation
panel on Amoy Garden case, 30th April 2003
Case Review

If drainage stack is a route for the Amoy Garden case…
Significant quantity of air flow is required to carry the virus from 16/F to 36/F…
…and in upward direction.
Case Review

Contaminated SewageBathroom floor drains with dried-up traps provided a pathway through which residents came into contact with small droplets containing viruses from the contaminated sewage
One Probable Explanation of Outbreak in Amoy Garden Investigation Report by the Department of Health on 17th April:
Case Review

Tracer Gas Injection at 16/F
Case Review

Measurement at 37/F
Case Review

Measurement Result
SF6 measurement on vertical drainage stack
0200400600800
1000
11:33
:0011
:34:00
11:35
:0011
:36:00
11:37
:0011
:38:00
11:39
:0011
:40:00
11:41
:00
Time (24 hr format)
SF6 C
once
ntra
tion
(ppm
)
16/F Injection37/F Receiver
Injection startedat 11:35:00
First data received from 1302 Analyzer:11:35:46
SF6 at 16/F injection pt.: 852 – 854 ppm
SF6 at 37/F cleansing eye: 217 ppm @ 11:38:43
Case Review

Measurement result at 37/F
SF6 is detected at 37/F after 3 minutes 43 seconds from injection.
With an induced air velocity of 2.75m/s at the 37/F pipe, air from 16/F goes upward and reaches 21 storeys above the injection point.
Upward flow is possible!!
Case Review

SF6concentration at other floors
Floor SF6 concentration Air velocity at 40mm dia. pipe-end ACH Time* (minutes)
14/F 0.076 to 0.082 ppm 1.17 m/s 0.54 111
16/F (Gas injection) 797 to 867 ppm (Blocked for tracer gas injection) --- ---
17/F 180 to 197 ppm 2.60 m/s 1.20 50
27/F 141 to 179 ppm 2.85 m/s 1.32 46
37/F 217 to 266 ppm 2.75 m/s 1.27 47
14
16
18
20
22
24
26
28
30
32
34
36
38
0 100 200 300 400 500 600 700 800 900 1000
Tracer gas concentration
Floo
r
Concentration along drainage stack
Predicted viral concentration through re-entrant transmission [Li, Y. et al. 2003]
* Time = Estimated time for the air from drainage stack to fill up the entire room.
Case Review

Then……How should we ventilate the toilet and kitchen in a residential flat?
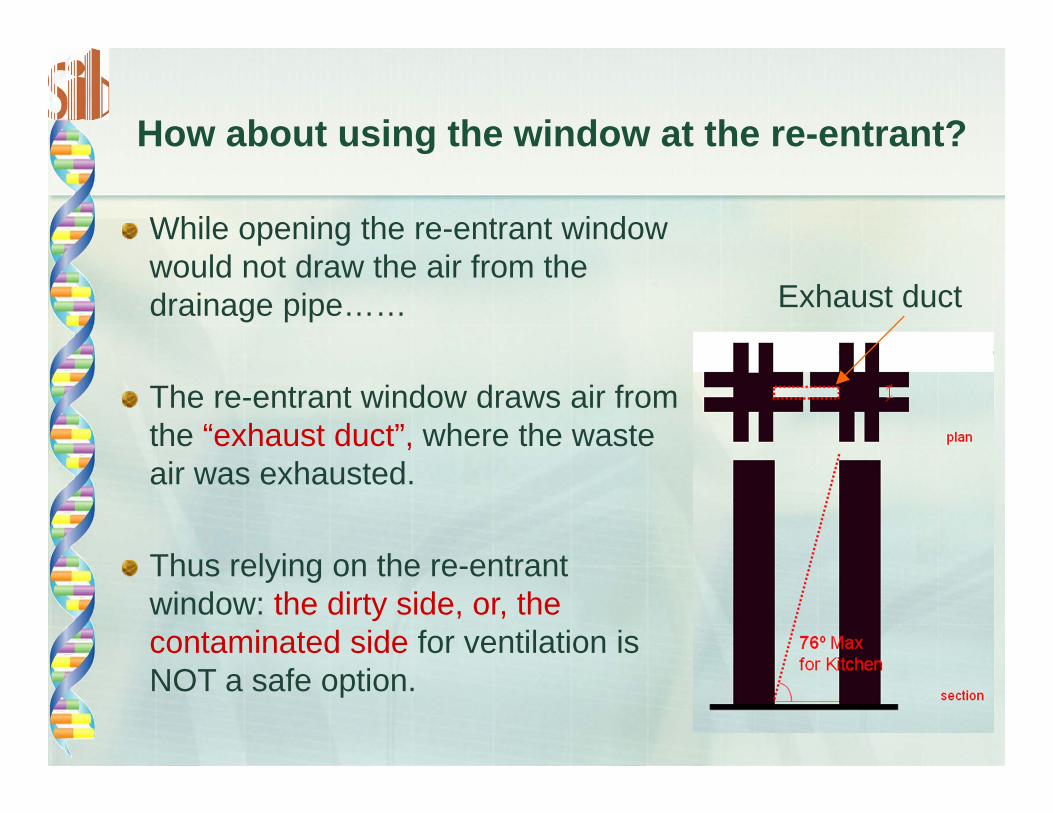
How about using the window at the re-entrant?
While opening the re-entrant window would not draw the air from the drainage pipe……
The re-entrant window draws air from the “exhaust duct”, where the waste air was exhausted.
Thus relying on the re-entrant window: the dirty side, or, the contaminated side for ventilation is NOT a safe option.
Exhaust duct

The proper way of ventilating your toilets:
Clean air & clean path: Incoming air pass through clean area first, then exhaust to less clean air.
(1) Open the windows at cleaner side:living rooms & bedrooms.
(2) Add a door louver at the toilet door.
(3) Ensure ALL the water traps are filled-up.
(4) Then, you can switch on the exhaust fan to drive the used air away from your flat.
Clean Source
Door Louver Exhaust FanALL Water traps filled

Sustainable Building Immunization: Implementation experience in HKCC
Sustainable Immunized Building Research Group

Towards sustainability and enhanced immunity: HKCC campus

Strategies towards sustainability and immunity
Air VentilationBaseline/Common Practice Enhancement in HKCC (1) Enhancement in HKCC (2)
• Curtain-walled
• Ventilated solely bymechanical system
• Openable glazing• Enhancing air exchange
in moderate climate
HKCC
Variable speed drives in Outdoor Air Unit for space purging & effective use of energy
•Fixed air flow ratefresh air system designbased on rule of thumb

Strategies towards sustainability and immunity
Immunization by lightConcept Implementation in HKCC Possible advancement
"Exposure to the sun is highly necessary for persons whose health is in need of restoring.” – Ancient wisdom
“Body immune system was activated under ambient light exposure”
Hyun (2005), article in SCI academic journal:“Chronobiology International”
Glazing - Exposure to light in communal area
Stairs in semi-open location
Open garden – ambient light exposure
<<<
Supply Air
Return Air
*UV light sterilization integrated with air ventilation
<< *System in use in PolyU main campus clinic

Strategies towards sustainability and immunity
Toilet Ventilation
Traditional Practice Design in HKCC
• Low level exhaust design• Prevent upward dispersion of
aerosol droplets from WC to occupied zone
• Supply & Return at the same level.• By-pass?• Small size aerosol droplets can
travel upward.
SupplyExhaust
ExhaustTransfer air grille
Supply

Strategies towards sustainability and immunity
Building DrainageBaseline/Common Practice Enhancement Possible advancement
• Fulfill Building Regulations
• Conventionalventing (vent pipe, roof opening)
• Provision designed for pressure sensors to monitor stack pressure
*Positive pressure attenuators for better drainage stack venting as necessary
*System in use in PolyU main campus

Strategies towards sustainability and immunity
Immunization by LightConcept Implementation in HKCC Possible advancement
"Exposure to the sun is highly necessary for persons whose health is in need of restoring.” – Ancient wisdom
“Body immune system was activated under ambient light exposure”
Hyun (2005), article in SCI academic journal:“Chronobiology International”
Glazing - Exposure to light in communal area
Stairs in semi-open location
Open garden – ambient light exposure
<<<
Supply Air
Return Air
*UV light sterilization integrated with air ventilation
<< *System in use in PolyU main campus clinic

Strategies towards sustainability and immunity
Escalate Physical Adequacy & Body ImmunityFacilities for physical exercise in HKCC

Traditional provision of Air ventilation, lighting and sanitary drainage in buildings are essential for a healthy and safe indoor environment.
In the 21st century, an increased awareness of the importance of building services engineering systems, and an advancement -
by adopting the available technologies we have, into building design and routine operation practices……
should assist the community to get prepared for thealarming risk of disease outbreak indoor.
Thank you!
The epilogue