Spatial and temporal variations in groundwater nitrate at an intensive dairy farm in south-east...
11
Agriculture, Ecosystems and Environment 144 (2011) 308–318 Contents lists available at SciVerse ScienceDirect Agriculture, Ecosystems and Environment journal homepage: www.elsevier.com/locate/agee Spatial and temporal variations in groundwater nitrate at an intensive dairy farm in south-east Ireland: Insights from stable isotope data A. Baily a,b,c,∗ , L. Rock c , C.J. Watson d , O. Fenton a a Teagasc, Johnstown Castle, Environmental Research Centre, Co Wexford, Ireland b Institute of Agri-Food & Land Use, Queen’s University Belfast, UK c Environmental Engineering Research Centre, Queen’s University Belfast, UK d Agriculture, Food and Environmental Science Division, Agri-Food & Biosciences Institute, Belfast, UK article info Article history: Received 16 December 2010 Received in revised form 20 September 2011 Accepted 22 September 2011 Available online 14 October 2011 Keywords: Nitrate contamination Shallow groundwater Water Framework Directive Nitrate sources Fractionation processes Stable isotopes abstract Achievement of at least “good ecological status” in all waterbodies under the EU Water Framework Direc- tive by 2015 will in some cases be a challenge. The twin challenge is to manage expectations of policy makers for such waterbodies as to a realistic length of time required for improvement in water quality. Hence, understanding the source, transformation processes and residence time of nitrate in a hydrologi- cal system is an essential part of meeting such challenges. On a dairy farm with 24 shallow groundwater wells, the dual isotopic composition of nitrate ( 15 N and 18 O) was used to clarify nitrate sources, to assess spatial and temporal variability in nitrate concentrations and to determine if and where denitrification was occurring. Vertical travel time was estimated to correlate nitrate concentrations with management practices. Organically derived nitrogen was the predominant source contributing to groundwater nitrate concentrations. Denitrification was identified as prevalent within specific regions of the study site. The distinct low temporal variability in the isotopic data suggests constancy among nitrate sources and pro- cesses over time across the study site. Vertical travel times of up to 3 years were estimated on site indicating the influence of recent management practices on nitrate concentrations. Very slow horizontal migration of groundwater (decades) indicates a legacy of older management practices. Stable isotope techniques, together with an understanding of time lag, provide an extra mechanism to test the efficacy of monitoring and mitigation programmes. © 2011 Elsevier B.V. All rights reserved. 1. Introduction Nitrate contamination of shallow groundwater is a recognised problem resulting from diffuse or point sources associated with intensive agriculture (Aravena et al., 1993), industry, high den- sity housing and unsewered sanitation (Keeney, 1986). The World Health Organisation (WHO, 1996) sets a limit of 10 mg l −1 nitrate- N for drinking water, while the EU sets maximum admissible concentrations (MAC) at 11.3 mg l −1 nitrate-N (Rodgers et al., 2003). However, a much lower level may be required to main- tain the status of freshwater ecosystems (Vitousek et al., 1997). Under the European Union (EU) Water Framework Directive (WFD- 2000/60/EC; OJEC, 2000), River Basin District managers must implement a programme of measures (POM) by 2012, within a catchment, where an individual waterbody has been classi- fied as below good status or is at risk of not reaching at least ∗ Corresponding author at: Teagasc, Johnstown Castle, Environmental Research Centre, Co Wexford, Ireland. Tel.: +353 53 9171249. E-mail address: [email protected] (A. Baily). “good ecological status” by 2015 (Kavanagh and Bree, 2009). In Ireland, the Nitrates Directive (under Statutory Instrument (SI) 101 2009), which is already the current farm management structure in place, will form the basic POM to limit nutrient losses at farm level. Protection of aquifers from a build up of nitrate depends on identification of sources and an understanding of hydro- geochemical processes (e.g. Misstear et al., 2009). Nutrient loss pathways between soils and groundwater are complex (Collins and McGonigle, 2008) and vary depending on soil type (van Beek et al., 2009) and geology (Meinardi et al., 1995). These can vary so widely that evidence of nitrate attenuation in groundwater may not be seen for months to decades (Fenton et al., 2009a, 2011). Nitrate concentrations in groundwater, as a result of intensive agricul- tural nutrient management, increase much faster than they reduce when such practices are modified, because there is a natural iner- tia in hydrological systems (Grimvall et al., 2000). The time taken from inception of nitrate reduction programmes to first detection of improvements in water quality is called the ‘time lag’ and it should, therefore, be considered by policy makers and catchment managers (Kronvang et al., 2008). Schulte et al. (2010) reported a similar lag 0167-8809/$ – see front matter © 2011 Elsevier B.V. All rights reserved. doi:10.1016/j.agee.2011.09.007
-
Upload
independent -
Category
Documents
-
view
0 -
download
0
Transcript of Spatial and temporal variations in groundwater nitrate at an intensive dairy farm in south-east...
Si
Aa
b
c
d
a
ARR2AA
KNSWNFS
1
pisHNc2tU2iafi
C
0d
Agriculture, Ecosystems and Environment 144 (2011) 308–318
Contents lists available at SciVerse ScienceDirect
Agriculture, Ecosystems and Environment
journa l homepage: www.e lsev ier .com/ locate /agee
patial and temporal variations in groundwater nitrate at an intensive dairy farmn south-east Ireland: Insights from stable isotope data
. Bailya,b,c,∗, L. Rockc, C.J. Watsond, O. Fentona
Teagasc, Johnstown Castle, Environmental Research Centre, Co Wexford, IrelandInstitute of Agri-Food & Land Use, Queen’s University Belfast, UKEnvironmental Engineering Research Centre, Queen’s University Belfast, UKAgriculture, Food and Environmental Science Division, Agri-Food & Biosciences Institute, Belfast, UK
r t i c l e i n f o
rticle history:eceived 16 December 2010eceived in revised form0 September 2011ccepted 22 September 2011vailable online 14 October 2011
eywords:itrate contaminationhallow groundwaterater Framework Directive
a b s t r a c t
Achievement of at least “good ecological status” in all waterbodies under the EU Water Framework Direc-tive by 2015 will in some cases be a challenge. The twin challenge is to manage expectations of policymakers for such waterbodies as to a realistic length of time required for improvement in water quality.Hence, understanding the source, transformation processes and residence time of nitrate in a hydrologi-cal system is an essential part of meeting such challenges. On a dairy farm with 24 shallow groundwaterwells, the dual isotopic composition of nitrate (�15N and �18O) was used to clarify nitrate sources, to assessspatial and temporal variability in nitrate concentrations and to determine if and where denitrificationwas occurring. Vertical travel time was estimated to correlate nitrate concentrations with managementpractices. Organically derived nitrogen was the predominant source contributing to groundwater nitrateconcentrations. Denitrification was identified as prevalent within specific regions of the study site. The
itrate sourcesractionation processestable isotopes
distinct low temporal variability in the isotopic data suggests constancy among nitrate sources and pro-cesses over time across the study site. Vertical travel times of up to 3 years were estimated on siteindicating the influence of recent management practices on nitrate concentrations. Very slow horizontalmigration of groundwater (decades) indicates a legacy of older management practices. Stable isotopetechniques, together with an understanding of time lag, provide an extra mechanism to test the efficacyof monitoring and mitigation programmes.
. Introduction
Nitrate contamination of shallow groundwater is a recognisedroblem resulting from diffuse or point sources associated with
ntensive agriculture (Aravena et al., 1993), industry, high den-ity housing and unsewered sanitation (Keeney, 1986). The Worldealth Organisation (WHO, 1996) sets a limit of 10 mg l−1 nitrate-for drinking water, while the EU sets maximum admissible
oncentrations (MAC) at 11.3 mg l−1 nitrate-N (Rodgers et al.,003). However, a much lower level may be required to main-ain the status of freshwater ecosystems (Vitousek et al., 1997).nder the European Union (EU) Water Framework Directive (WFD-000/60/EC; OJEC, 2000), River Basin District managers must
mplement a programme of measures (POM) by 2012, withincatchment, where an individual waterbody has been classi-
ed as below good status or is at risk of not reaching at least
∗ Corresponding author at: Teagasc, Johnstown Castle, Environmental Researchentre, Co Wexford, Ireland. Tel.: +353 53 9171249.
E-mail address: [email protected] (A. Baily).
167-8809/$ – see front matter © 2011 Elsevier B.V. All rights reserved.oi:10.1016/j.agee.2011.09.007
© 2011 Elsevier B.V. All rights reserved.
“good ecological status” by 2015 (Kavanagh and Bree, 2009). InIreland, the Nitrates Directive (under Statutory Instrument (SI) 1012009), which is already the current farm management structurein place, will form the basic POM to limit nutrient losses at farmlevel.
Protection of aquifers from a build up of nitrate dependson identification of sources and an understanding of hydro-geochemical processes (e.g. Misstear et al., 2009). Nutrient losspathways between soils and groundwater are complex (Collins andMcGonigle, 2008) and vary depending on soil type (van Beek et al.,2009) and geology (Meinardi et al., 1995). These can vary so widelythat evidence of nitrate attenuation in groundwater may not beseen for months to decades (Fenton et al., 2009a, 2011). Nitrateconcentrations in groundwater, as a result of intensive agricul-tural nutrient management, increase much faster than they reducewhen such practices are modified, because there is a natural iner-tia in hydrological systems (Grimvall et al., 2000). The time taken
from inception of nitrate reduction programmes to first detection ofimprovements in water quality is called the ‘time lag’ and it should,therefore, be considered by policy makers and catchment managers(Kronvang et al., 2008). Schulte et al. (2010) reported a similar lag
s and
pa
t2npctctoratB(spttShv
wtecistatbtf
2
2
alat
l(skmwFurlmmfiats
A. Baily et al. / Agriculture, Ecosystem
henomenon for phosphorus (P) declines in highly fertilized soilss a function of total P, available P and P balance.
The components of time lag are vertical unsaturated zone travelime, horizontal travel time and aquifer flushing (Fenton et al.,011). For the present study it is important to relate sources ofitrate pollution in shallow groundwater with a particular farmractice, in relation to time and this forms the basis of the firstomponent of the time lag estimation, i.e. vertical unsaturated zoneravel time. Realistic estimation will be critical in assessing the effi-acy of a POM under the WFD; this requires an understanding ofravel time from surface application of nitrogen as manure (organic)r synthetic (inorganic) fertilizer to when it might be expected toeach groundwater (Masetti et al., 2008). Stable isotopes provideunique tool to identify nitrate sources and can provide informa-
ion on natural attenuation through denitrification or dilution (e.g.öttcher et al., 1990). Studies using this technique at various scalesregional to local) have provided clarification where overall nitrateources are known but differentiation between sources is unex-lained (e.g. Wassenaar, 1995; Mayer et al., 2002). Most relevanto this study are those looking at shallow groundwater contamina-ion beneath areas of intensive agriculture (e.g. Wassenaar, 1995;ingleton et al., 2007; Kaown et al., 2009). However, limited workas been done in terms of assessing the significance of seasonalariation in isotope values.
Whereas, previously, the natural abundance of nitrate isotopesas used for source tracking and transformational process iden-
ification, they are used here in conjunction with vertical time lagstimation to link nutrient management at farm scale with nutrientoncentrations in shallow groundwater. Also, ‘temporal variabil-ty’ in �15N, �18O values of nitrate was investigated over spring,ummer and autumn. The aims of this study, therefore, were (a)o elucidate nitrate sources, (b) to assess spatial and temporal vari-bility in groundwater nitrate and its causes, (c) to determine if, ando what extent, denitrification is occurring in shallow groundwatereneath an intensive dairy farm in SE Ireland, using stable isotopeechniques, and (d) to correlate present nitrate concentrations witharm management practices.
. Materials and methods
.1. Study area
The study site is located on a 52 hectare (ha) dairy farm, locatedt Johnstown Castle, Wexford, south-east Ireland (latitude 52◦ 12N,ongitude 6◦ 30W) (Fig. 1). It has a temperate maritime climate with
30-year-average annual rainfall of 1000 mm and a mean dailyemperature of 9.6 ◦C.
Soils are poor to moderately well-drained fine loam to clayoam (classified as a gleyic cambisol after the World Reference BaseWRB)) derived from Irish Sea till (Gardiner and Ryan, 1964). Theite comprises a mature glacial till subsoil (moderate permeability,s, 5 × 10⁻⁸ m s−1 to 5 × 10⁻⁴ m s−1), which is heterogeneous andorainic in nature. On site, mean depth of the perched watertableithin the subsoil was 2.75 m with a range from 0.72 m (well C8,
ig. 1) to 7.45 m (well C3, Fig. 1). Topography on site consists ofndulating slopes and groundwater flow direction mirrors topog-aphy. The aquifer is an unproductive, low conductivity, high toow vulnerability (GSI, 2010), pre-Cambrian greywacke, schist and
assive schistose quartzites that have been subjected to low gradeetamorphism (Dhonau, 1972). Groundwater on site is not used
or abstraction purposes. Nitrate pollution of shallow groundwater
s of concern because of the water course (Fig. 1) on the farm anddown-gradient surface waterbody. Vertical unsaturated travelime (approximately 1 year) on a neighbouring site with similaroil and subsoil properties varied, based on mean unsaturated zone
Environment 144 (2011) 308–318 309
thickness of 1.01 m, effective rainfall (ER) of 553 mm and averageeffective porosity (ne) of 32%. Horizontal travel time on this sitedue to moderate permeability (ks, 9 × 10⁻⁸ m s−1 to 1 × 10⁻⁷ m s−1)was in the order of decades, but high denitrification potential alongthe migration pathway protected the nearby surface waterbody(Fenton et al., 2009a,b).
The intensive dairy farm has been established for over 50 years,with swards of permanent perennial (mid-season) ryegrass (Loliumperenne). Nitrogen is applied as urea (February–April) and calciumammonium nitrate (CAN) thereafter (May–September). Fields havereceived varying levels of synthetic chemical N and P fertilizersover these years, depending on research trials in progress. Theyhave also received organic fertilizer via the spreading of farm yardmanure (FYM), slurry, soiled water (a mixture of rainwater andparlour/concrete yard washings), and spent timber residue (STR)from out-wintering pads. Manure is generally applied in springin fields that are to be cut for silage. There is an average stock-ing density of 2.5 livestock units (LU) per hectare (ha−1), where1 LU is equivalent to1 adult cow. For a number of years, soiledwater irrigation has been occurring to the north of the farm yard,from February to October, through a centre pivot irrigator (Roto-Rainer, Briggs, New Zealand) (Fig. 1 shaded areas). Soiled waterhas a Biological Oxygen Demand (BOD) of less than 2500 mg l−1
and a dry matter (DM) content of less than 1% (EC, 1991). In arecent Irish study of soiled water from 60 dairy farms, Minogueet al. (2010) found that the mean Total N concentration was587 mg l−1 while ammonium (NH4
+–N) was 212 mg l−1, the bal-ance consisting mostly of organic N. This shows that a third ofthe N in soiled water consists of rapidly plant-available NH4
+–N.Mean total P was 80 mg l−1 and K was 568 mg l−1. Therefore, soiledwater represents a potentially significant source of nutrients (N,P, and K) for plant uptake, or loss to water if not managed cor-rectly. However, nutrient concentrations are an order of magnitudelower than in slurry. The mean total N content of soiled wateris equivalent to 0.6 kg N m−3, in contrast to the 5 kg N m−3 that isassumed for cattle slurry in the Nitrates Directive (under SI 1012009).
The total nitrogen input to the study site was approximately502 kg N ha−1 in 2008. Organically derived nitrogen (FYM, slurry,soiled water and STR) contributed about 255 kg N ha−1, whichincluded about 105 kg N ha−1 which was deposited in excreta fromgrazing cattle (Lantinga et al., 1987; McGechan and Topp, 2004) andis distributed over all grazed fields. Synthetic (inorganic) fertilizercontributed an estimated 235 kg N ha−1 in 2008 while atmosphericnitrogen deposition (wet and dry) in Ireland is estimated to bearound 12 kg ha−1 yr−1 (Watson and Foy, 2001). Hence, the nitro-gen inputs were 50.8% organic N, 46.8% inorganic N and 2.4% fromatmospheric deposition. As well as the above direct nitrogen inputsto the study area, there is a suspected nitrate source moving down-gradient in shallow groundwater from a beef farm to the northoriginating from long-term dumping of soiled water (Fig. 1). Otherprobable sources of nitrate are the milking parlour, winter cattle-housing and modern out-wintering pads located in the farmyardat the centre of the farm. Land uses outside the boundaries of thepresent study site are indicated in Fig. 1.
2.2. Sampling and monitoring on site
Based on an existing monitoring network installed between1996 and 2007, duplicate groundwater samples for chemical anal-yses were collected from the middle of the screened intervals(1 m at base of each well) of 24 groundwater wells (Fig. 1). Wells
were drilled within the glacial subsoil, several meters below waterstrike. Drilled depths varied from 2.64 to 8.62 m (Table 1). InApril, August and December 2008, additional samples were takenfor isotopic analysis. After purging the previous day, a Waterra
310 A. Baily et al. / Agriculture, Ecosystems and Environment 144 (2011) 308–318
F Groupa ed rec
hlwSnala
ig. 1. Map of the dairy farm showing well locations: Group A (high nitrate wells),reas shown in diagonal stripes and dots; stream as dashed line. Ellipsoid and dash
and-held pump (Van Walt Ltd., Surrey, UK) was used to col-ect 100 ml water samples. On those days, the watertable depths
ere also measured using an electronic dipper (Van Walt Ltd.,urrey, UK) and later converted to hydraulic heads (m above ord-
ance datum – AOD). The samples were filtered immediately, using0.45 �m Micropore membrane filter, transferred to polyethy-ene screw top bottles, and frozen prior to chemical and isotopicnalysis.
B (medium nitrate wells) and Group C (low nitrate wells); soiled water irrigationtangle areas refer to data groupings from Fig. 4.
2.3. Chemical and isotopicanalyses
The chemical concentrations of nitrite (NO2−–N), total oxidised
N (TON–N) and NH4+–N were determined using an Aquakem 600
analyser at Johnstown Castle, Teagasc. The limits of precision were0.01, 0.08 and 0.09 mg N l−1 respectively. At this study site, TON(nitrate + nitrite) can be taken as nitrate (NO3
−–N) as nitrite was
A. Baily et al. / Agriculture, Ecosystems and Environment 144 (2011) 308–318 311
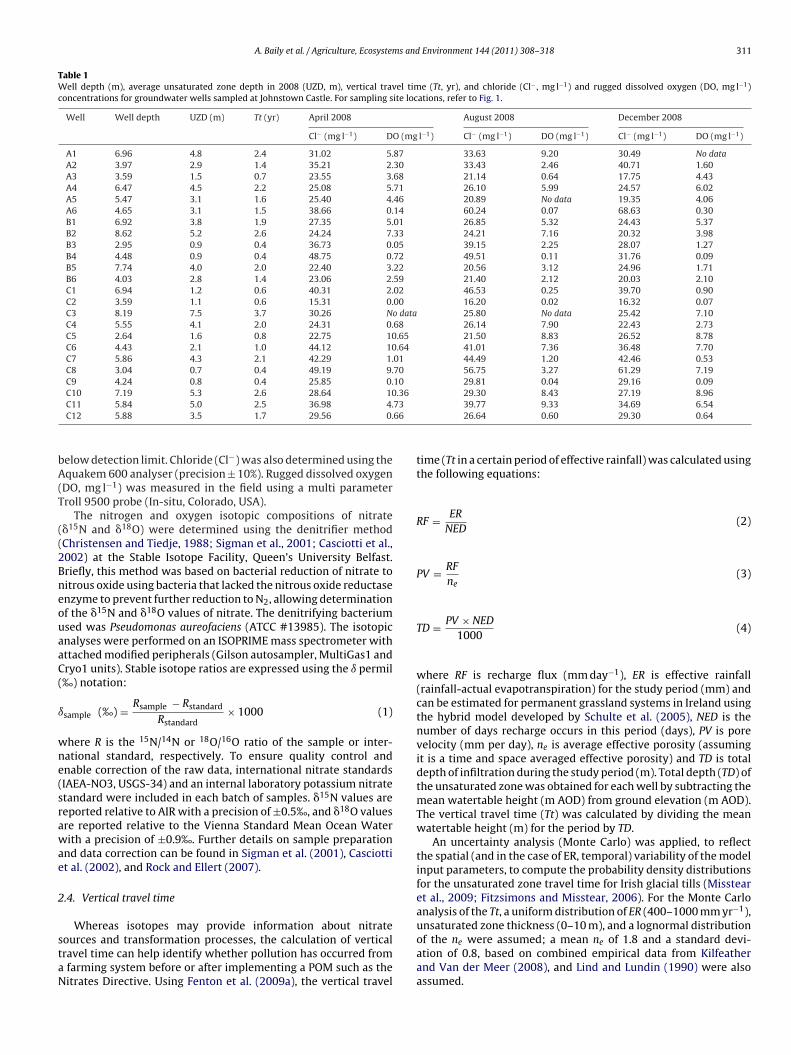
Table 1Well depth (m), average unsaturated zone depth in 2008 (UZD, m), vertical travel time (Tt, yr), and chloride (Cl− , mg l−1) and rugged dissolved oxygen (DO, mg l−1)concentrations for groundwater wells sampled at Johnstown Castle. For sampling site locations, refer to Fig. 1.
Well Well depth UZD (m) Tt (yr) April 2008 August 2008 December 2008
Cl− (mg l−1) DO (mg l−1) Cl− (mg l−1) DO (mg l−1) Cl− (mg l−1) DO (mg l−1)
A1 6.96 4.8 2.4 31.02 5.87 33.63 9.20 30.49 No dataA2 3.97 2.9 1.4 35.21 2.30 33.43 2.46 40.71 1.60A3 3.59 1.5 0.7 23.55 3.68 21.14 0.64 17.75 4.43A4 6.47 4.5 2.2 25.08 5.71 26.10 5.99 24.57 6.02A5 5.47 3.1 1.6 25.40 4.46 20.89 No data 19.35 4.06A6 4.65 3.1 1.5 38.66 0.14 60.24 0.07 68.63 0.30B1 6.92 3.8 1.9 27.35 5.01 26.85 5.32 24.43 5.37B2 8.62 5.2 2.6 24.24 7.33 24.21 7.16 20.32 3.98B3 2.95 0.9 0.4 36.73 0.05 39.15 2.25 28.07 1.27B4 4.48 0.9 0.4 48.75 0.72 49.51 0.11 31.76 0.09B5 7.74 4.0 2.0 22.40 3.22 20.56 3.12 24.96 1.71B6 4.03 2.8 1.4 23.06 2.59 21.40 2.12 20.03 2.10C1 6.94 1.2 0.6 40.31 2.02 46.53 0.25 39.70 0.90C2 3.59 1.1 0.6 15.31 0.00 16.20 0.02 16.32 0.07C3 8.19 7.5 3.7 30.26 No data 25.80 No data 25.42 7.10C4 5.55 4.1 2.0 24.31 0.68 26.14 7.90 22.43 2.73C5 2.64 1.6 0.8 22.75 10.65 21.50 8.83 26.52 8.78C6 4.43 2.1 1.0 44.12 10.64 41.01 7.36 36.48 7.70C7 5.86 4.3 2.1 42.29 1.01 44.49 1.20 42.46 0.53C8 3.04 0.7 0.4 49.19 9.70 56.75 3.27 61.29 7.19C9 4.24 0.8 0.4 25.85 0.10 29.81 0.04 29.16 0.09C10 7.19 5.3 2.6 28.64 10.36 29.30 8.43 27.19 8.96
7366
bA(T
((2BneouaaC(
ı
wne(srawae
2
staN
C11 5.84 5.0 2.5 36.98 4.C12 5.88 3.5 1.7 29.56 0.
elow detection limit. Chloride (Cl−) was also determined using thequakem 600 analyser (precision ± 10%). Rugged dissolved oxygen
DO, mg l−1) was measured in the field using a multi parameterroll 9500 probe (In-situ, Colorado, USA).
The nitrogen and oxygen isotopic compositions of nitrate�15N and �18O) were determined using the denitrifier methodChristensen and Tiedje, 1988; Sigman et al., 2001; Casciotti et al.,002) at the Stable Isotope Facility, Queen’s University Belfast.riefly, this method was based on bacterial reduction of nitrate toitrous oxide using bacteria that lacked the nitrous oxide reductasenzyme to prevent further reduction to N2, allowing determinationf the �15N and �18O values of nitrate. The denitrifying bacteriumsed was Pseudomonas aureofaciens (ATCC #13985). The isotopicnalyses were performed on an ISOPRIME mass spectrometer withttached modified peripherals (Gilson autosampler, MultiGas1 andryo1 units). Stable isotope ratios are expressed using the ı permil‰) notation:
sample (‰) = Rsample − Rstandard
Rstandard× 1000 (1)
here R is the 15N/14N or 18O/16O ratio of the sample or inter-ational standard, respectively. To ensure quality control andnable correction of the raw data, international nitrate standardsIAEA-NO3, USGS-34) and an internal laboratory potassium nitratetandard were included in each batch of samples. �15N values areeported relative to AIR with a precision of ±0.5‰, and �18O valuesre reported relative to the Vienna Standard Mean Ocean Waterith a precision of ±0.9‰. Further details on sample preparation
nd data correction can be found in Sigman et al. (2001), Casciottit al. (2002), and Rock and Ellert (2007).
.4. Vertical travel time
Whereas isotopes may provide information about nitrate
ources and transformation processes, the calculation of verticalravel time can help identify whether pollution has occurred fromfarming system before or after implementing a POM such as theitrates Directive. Using Fenton et al. (2009a), the vertical travel39.77 9.33 34.69 6.5426.64 0.60 29.30 0.64
time (Tt in a certain period of effective rainfall) was calculated usingthe following equations:
RF = ER
NED(2)
PV = RF
ne(3)
TD = PV × NED
1000(4)
where RF is recharge flux (mm day−1), ER is effective rainfall(rainfall-actual evapotranspiration) for the study period (mm) andcan be estimated for permanent grassland systems in Ireland usingthe hybrid model developed by Schulte et al. (2005), NED is thenumber of days recharge occurs in this period (days), PV is porevelocity (mm per day), ne is average effective porosity (assumingit is a time and space averaged effective porosity) and TD is totaldepth of infiltration during the study period (m). Total depth (TD) ofthe unsaturated zone was obtained for each well by subtracting themean watertable height (m AOD) from ground elevation (m AOD).The vertical travel time (Tt) was calculated by dividing the meanwatertable height (m) for the period by TD.
An uncertainty analysis (Monte Carlo) was applied, to reflectthe spatial (and in the case of ER, temporal) variability of the modelinput parameters, to compute the probability density distributionsfor the unsaturated zone travel time for Irish glacial tills (Misstearet al., 2009; Fitzsimons and Misstear, 2006). For the Monte Carloanalysis of the Tt, a uniform distribution of ER (400–1000 mm yr−1),unsaturated zone thickness (0–10 m), and a lognormal distribution
of the ne were assumed; a mean ne of 1.8 and a standard devi-ation of 0.8, based on combined empirical data from Kilfeatherand Van der Meer (2008), and Lind and Lundin (1990) were alsoassumed.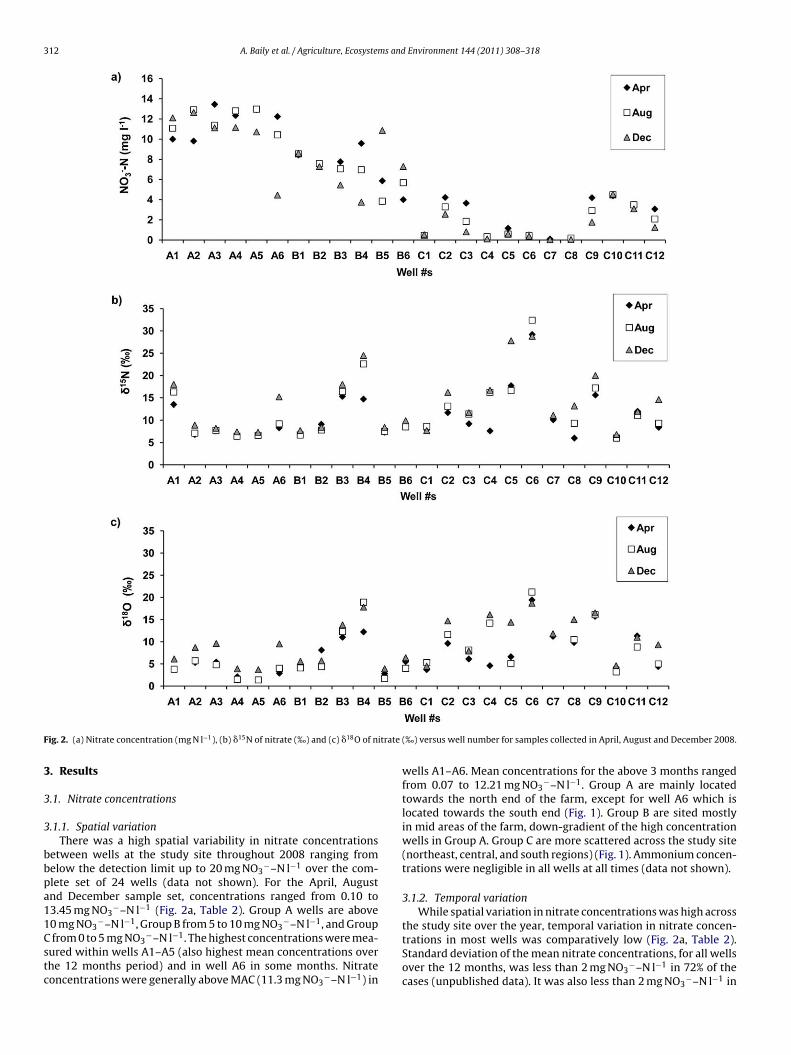
312 A. Baily et al. / Agriculture, Ecosystems and Environment 144 (2011) 308–318
F itrate
3
3
3
bbpa11Cstc
ig. 2. (a) Nitrate concentration (mg N l−1), (b) �15N of nitrate (‰) and (c) �18O of n
. Results
.1. Nitrate concentrations
.1.1. Spatial variationThere was a high spatial variability in nitrate concentrations
etween wells at the study site throughout 2008 ranging fromelow the detection limit up to 20 mg NO3
−–N l−1 over the com-lete set of 24 wells (data not shown). For the April, Augustnd December sample set, concentrations ranged from 0.10 to3.45 mg NO3
−–N l−1 (Fig. 2a, Table 2). Group A wells are above0 mg NO3
−–N l−1, Group B from 5 to 10 mg NO3−–N l−1, and Group
from 0 to 5 mg NO3−–N l−1. The highest concentrations were mea-
ured within wells A1–A5 (also highest mean concentrations overhe 12 months period) and in well A6 in some months. Nitrateoncentrations were generally above MAC (11.3 mg NO3
−–N l−1) in
(‰) versus well number for samples collected in April, August and December 2008.
wells A1–A6. Mean concentrations for the above 3 months rangedfrom 0.07 to 12.21 mg NO3
−–N l−1. Group A are mainly locatedtowards the north end of the farm, except for well A6 which islocated towards the south end (Fig. 1). Group B are sited mostlyin mid areas of the farm, down-gradient of the high concentrationwells in Group A. Group C are more scattered across the study site(northeast, central, and south regions) (Fig. 1). Ammonium concen-trations were negligible in all wells at all times (data not shown).
3.1.2. Temporal variationWhile spatial variation in nitrate concentrations was high across
the study site over the year, temporal variation in nitrate concen-
trations in most wells was comparatively low (Fig. 2a, Table 2).Standard deviation of the mean nitrate concentrations, for all wellsover the 12 months, was less than 2 mg NO3−–N l−1 in 72% of thecases (unpublished data). It was also less than 2 mg NO3
−–N l−1 in
A.Baily
etal./A
griculture,Ecosystems
andEnvironm
ent144
(2011)308–318
313
Table 2Nitrate-N concentrations (mg l−1), �15N and �18O values (‰) and corresponding mean (AV) and standard deviation (StDev) values for groundwater collected in April, August and December 2008 from 24 wells located at JohnstownCastle. For sampling site locations, refer to Fig. 1.
Group and well April August December NO3−-N (mg l−1) �15N (‰) �18O (‰)
NO3−–N (mg l−1) �15N (‰) �18O (‰) NO3
−–N (mg l−1) �15N (‰) �18O (‰) NO3−–N (mg l−1) �15N (‰) �18O (‰) AV StDev AV StDev AV StDev
A1 10.00 13.5 3.8 11.08 16.3 3.8 12.12 18.0 6.1 11.06 1.10 15.9 2.3 4.6 1.4A2 9.81 6.8 5.3 12.92 7.1 5.7 12.65 8.9 8.7 11.79 1.70 7.6 1.1 6.5 1.9A3 13.45 7.6 5.4 11.37 7.7 4.8 11.13 8.2 9.6 11.98 1.30 7.8 0.4 6.6 2.6A4 12.35 6.4 2.1 12.81 6.4 1.5 11.16 7.4 3.9 12.11 0.90 6.7 0.5 2.5 1.3A5 12.93 6.8 1.4 12.98 6.6 1.4 10.72 7.3 3.7 12.21 1.30 6.9 0.4 2.2 1.3A6 12.24 8.3 2.9 10.43 9.2 4.0 4.45 15.2 9.5 9.04 4.10 10.9 3.8 5.5 3.5B1 8.42 7.3 4.6 8.54 6.7 4.1 8.61 7.7 5.6 8.53 0.10 7.2 0.5 4.8 0.8B2 7.32 9.1 8.1 7.57 7.8 4.4 7.28 8.4 5.7 7.39 0.20 8.4 0.7 6.1 1.9B3 7.76 15.3 11.0 7.07 16.4 12.3 5.45 18.0 13.8 6.76 1.20 16.5 1.4 12.4 1.4B4 9.58 14.7 12.2 6.97 22.6 18.9 3.75 24.5 17.8 6.77 2.90 20.6 5.2 16.3 3.6B5 5.86 7.3 2.8 3.84 7.5 1.7 10.87 8.4 3.9 6.86 3.60 7.7 0.6 2.8 1.1B6 4.00 8.7 5.5 5.68 8.5 4.0 7.29 9.9 6.4 5.66 1.60 9.0 0.8 5.3 1.2C1 0.48 7.9 3.7 0.44 8.6 5.3 0.53 7.7 4.5 0.48 0.00 8.1 0.5 4.5 0.8C2 4.22 11.7 9.6 3.28 13.1 11.6 2.56 16.2 14.7 3.36 0.80 13.7 2.3 12.0 2.5C3 3.65 9.2 6.1 1.84 11.4 8.1 0.81 11.7 7.9 2.10 1.40 10.8 1.4 7.4 1.1C4 0.25 7.6 4.6 0.33 16.2 14.2 0.11 16.7 16.1 0.23 0.10 13.5 5.1 11.6 6.2C5 1.17 17.7 6.6 0.58 16.6 5.1 0.60 27.8 14.4 0.78 0.30 20.7 6.2 8.7 5.0C6 0.50 29.2 19.4 0.44 32.4 21.2 0.38 28.8 18.7 0.44 0.10 30.1 2.0 19.8 1.3C7 0.10 10.1 11.2 No data No data No data 0.04 11.1 11.8 0.07 0.00 10.6 0.7 11.5 0.4C8 0.05 6.0 9.8 0.19 9.3 10.5 0.05 13.2 15.0 0.09 0.10 9.5 3.6 11.7 2.8C9 4.19 15.6 15.7 2.91 17.2 16.1 1.77 20.0 16.5 2.96 1.20 17.6 2.3 16.1 0.4C10 4.38 6.3 4.2 4.47 6.0 3.2 4.54 6.8 4.6 4.46 0.10 6.4 0.4 4.0 0.7C11 3.34 12.0 11.3 3.48 11.1 8.8 3.09 11.9 11.0 3.30 0.20 11.7 0.5 10.4 1.4C12 3.07 8.4 4.4 2.08 9.3 5.0 1.24 14.6 9.3 2.13 0.90 10.8 3.3 6.3 2.6
3 s and Environment 144 (2011) 308–318
8H(2
3
3
nA+vaeDfe�(Cwwm
3
icocbcb7aCvttwA
3
issrITp
4
4
nnTffct
14 A. Baily et al. / Agriculture, Ecosystem
8% of cases for the study months, April, August and December.igher temporal variations were found in the remaining 12%
wells B4, B5 and A6) with standard deviations greater thanmg NO3
−–N l−1 over the sampling months.
.2. Isotopic values
.2.1. Spatial variationAs with nitrate concentrations, the isotopic composition of
itrate varied between wells (Fig. 2b and c, Table 2) over April,ugust and December 2008. The �15N values ranged from +6.0 to32.4‰ and �18O values from +1.4 to +21.2‰. The highest �15Nalues of nitrate were measured in wells (A1, B3, B4, C2, C5, C6nd C9). The �18O values of nitrate were also highest in these wellsxcept for wells A1 and C5, where they were much lower except inecember. Wells B3 and B4 are located mid-farm, down-gradient
rom the present irrigation area; well C9, is at the south easterndge of the farm; C5 and C6 are adjacent to the stream. Lowest15N values were found in wells A2, A3, A4, A5, B1, C1, C8 and C10between +6 and +8.6‰ in all sampling months) and in wells B5 and4 in April. Lowest �18O values were, generally, found in the sameells. Wells with low isotopic signatures are also variously locatedith A2, A3, A4, A5, B1 and C1 towards the north of the farm, C8 isid-farm and C10 is near the water course.
.2.2. Temporal variationAlthough there was high variation in isotope values between
ndividual wells, the isotopic composition of nitrate remained fairlyonstant within wells over the sampling period as suggested by 63%f cases with a standard deviation in �15N of 2‰ or less (Fig. 2b and, Table 2). Of the remaining wells, 25% have standard deviationsetween 2 and 4‰ and 3 wells vary from 5 to 6.2‰. The largesthanges in �15N of nitrate were observed for well C5 (increasingy 11.2‰ between April and December), well B4 (increasing by.9‰ between April and August and a further 1.9‰ in December)nd well C4 (increasing by 9.1‰ between April and December).hanges in �18O values were similar to those observed within �15Nalues with a standard deviation of <2‰ in 66% of the wells. A fur-her 25% of wells had standard deviations between 2 and 4‰. Onlywo wells, C4 and C5, had higher standard deviations, which talliesith increasing �18O values (by 9.6‰ for well C4 between April andugust and by 9.3‰ for well C5 between August and December).
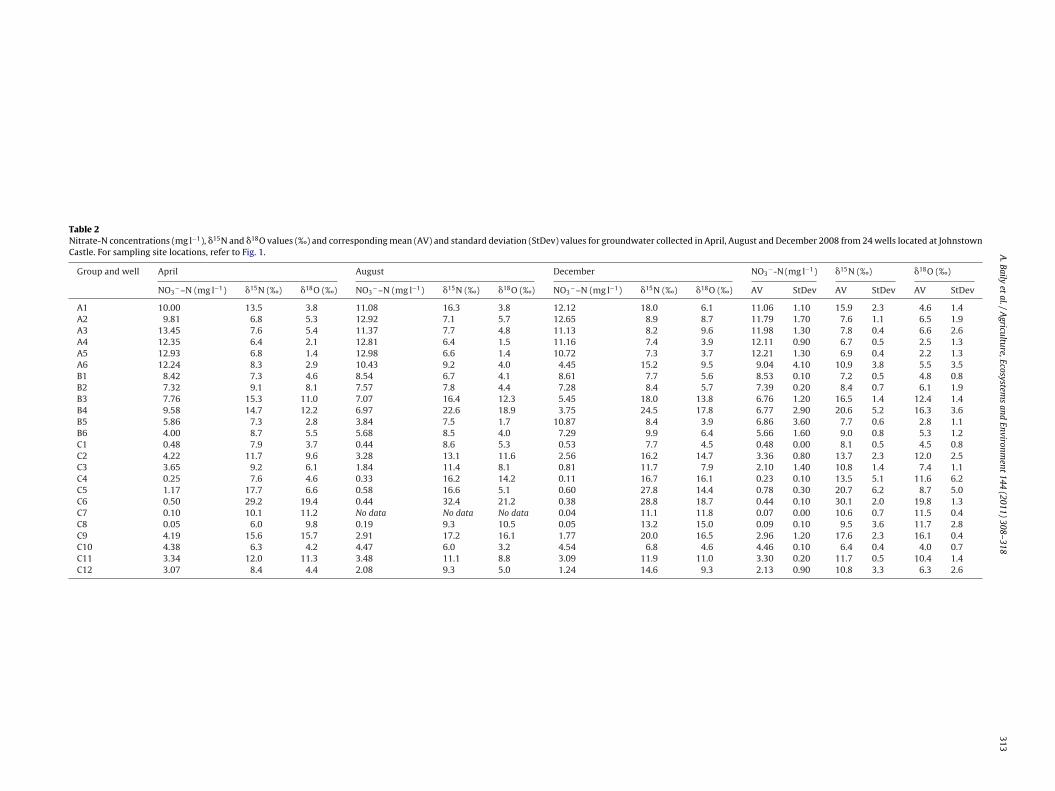
.2.3. Vertical travel timeTt from the uncertainty analysis for Irish glacial tills is approx-
mately two years or less for the vast majority of sites (Fig. 3). Theite in this study falls within the above range. Estimated Tt, for wellpecific unsaturated zone depths, ne of 30% and ER of 600 mm yr−1
esulted in RF of 5 mm day−1, PV of 16.7 mm day−1 and TD of 2 m.n turn, Tt for the study site ranged from 0.4 to 3.7 yr (Table 1).he probability of having a Tt > 2.4 years is <1%. Conversely, therobability of having a travel time of <0.6 years is <1%.
. Discussion
.1. Source or process signal
It is clear from the literature that isotopic values can be sig-ificantly altered by fractionation processes such as volatilisation,itrification and denitrification (Kendall, 1998; Xue et al., 2009).hese processes will clearly have occurred in this intensive dairy
arm where surface application of organic manures and inorganicertilizers has occurred over many decades, influencing the isotopicomposition of groundwater nitrate. Thus, prior to interpreting iso-opic data, it is essential to establish whether the data, gatheredFig. 3. Frequency distribution of vertical travel time (Tt) due to different ER, ne andunsaturated zone thicknesses for Irish glacial tills.
from a particular site, are primarily indicative of a source or pro-cess signal. No single consistent relationship between �15N and�18O values and nitrate concentration was observed. Some datapoint towards the characteristic increase in both �15N and �18Ovalues associated with denitrification (e.g. Böttcher et al., 1990),but a distinct clustering of data points with low �15N and �18Ovalues can also be observed (Fig. 4). This suggests a source sig-nal representative of organically derived nitrate. At this study site,organic N from various types of manure (slurry, FYM, DW, and STR)has contributed to the soil nitrate pool over many years. Hence,the isotopic data reflect both a source and a process signal, eachof which appear to be predominant in a particular area across thestudy site, as will be discussed in the following sections. The con-sistency in �15N and �18O values of nitrate within wells, shownby the low standard deviations over the three sampling months,suggests no significant changes in N inputs or transformation pro-cesses at a particular site. Low temporal variability is probably theresult of rainfall fairly evenly distributed throughout the year and agenerally temperate climate. In Ireland, rainfall is relatively evenlydistributed over the year with the 30 year record indicating that inboth spring and summer average rainfall is 250 mm and in bothautumn and winter 350 mm (Met Éireann, 2011). Temperaturesaverage 4.5 ◦C in winter and 15.5◦ C in summer allowing miner-alisation of soil N and grass growth to continue throughout theyear, allied to the microbial processes of nitrification and denitri-fication (Humphreys, 2007). Average groundwater temperature atthe study site was 11.6 ◦C. Thus microbial nitrification of nitrate islikely to mask the isotopic ratio indicating the original source, asreported by Mengis et al. (2001).
4.2. Nitrate source identification
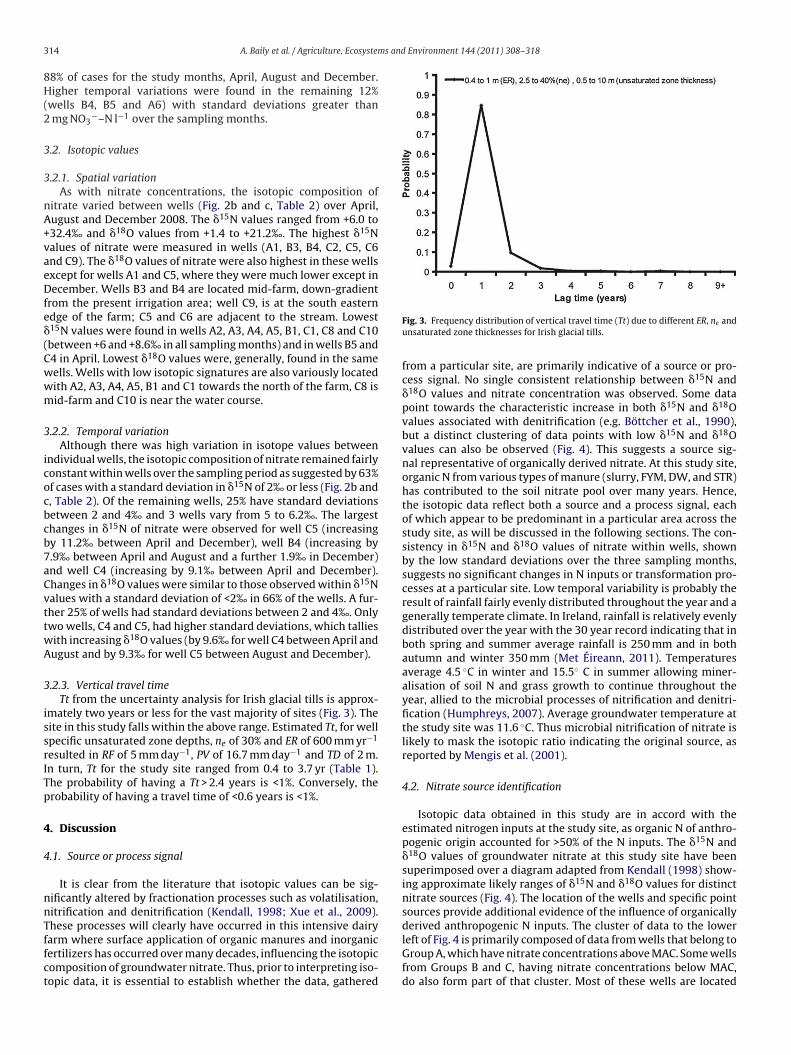
Isotopic data obtained in this study are in accord with theestimated nitrogen inputs at the study site, as organic N of anthro-pogenic origin accounted for >50% of the N inputs. The �15N and�18O values of groundwater nitrate at this study site have beensuperimposed over a diagram adapted from Kendall (1998) show-ing approximate likely ranges of �15N and �18O values for distinctnitrate sources (Fig. 4). The location of the wells and specific pointsources provide additional evidence of the influence of organicallyderived anthropogenic N inputs. The cluster of data to the lower
left of Fig. 4 is primarily composed of data from wells that belong toGroup A, which have nitrate concentrations above MAC. Some wellsfrom Groups B and C, having nitrate concentrations below MAC,do also form part of that cluster. Most of these wells are located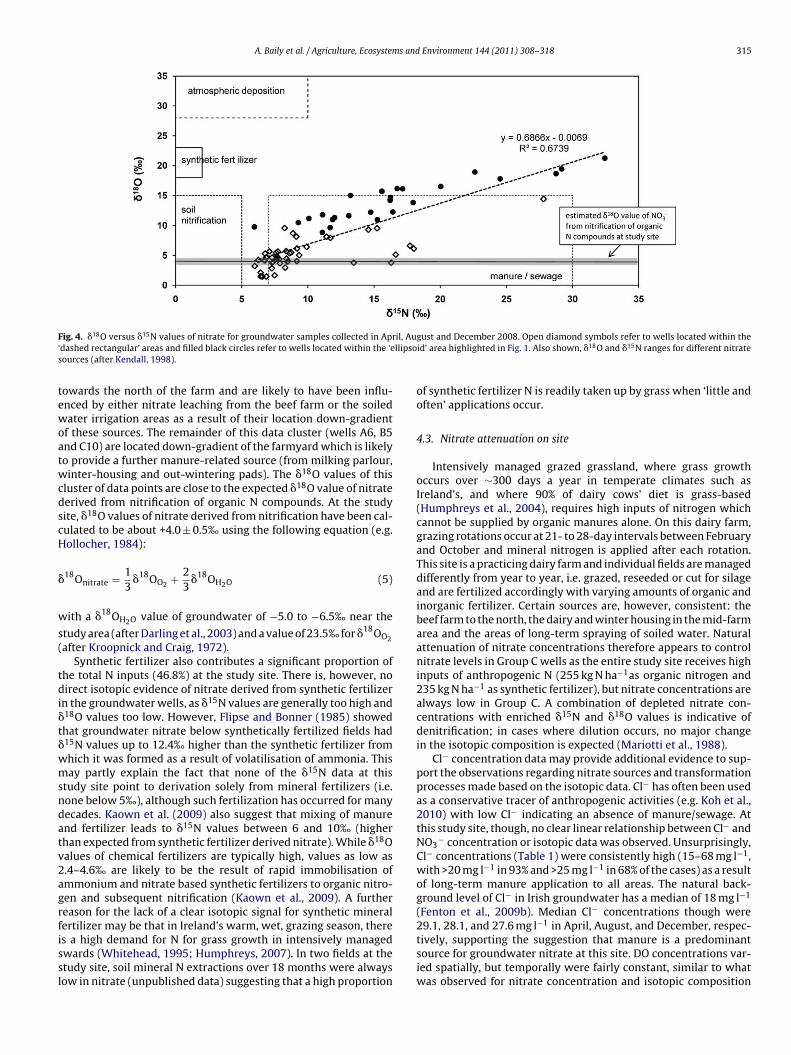
A. Baily et al. / Agriculture, Ecosystems and Environment 144 (2011) 308–318 315
F il, Au‘ llipsos
tewoatwcdscH
�
w
s(
tdi�t�wmsndatv2agrfissl
ig. 4. �18O versus �15N values of nitrate for groundwater samples collected in Aprdashed rectangular’ areas and filled black circles refer to wells located within the ‘eources (after Kendall, 1998).
owards the north of the farm and are likely to have been influ-nced by either nitrate leaching from the beef farm or the soiledater irrigation areas as a result of their location down-gradient
f these sources. The remainder of this data cluster (wells A6, B5nd C10) are located down-gradient of the farmyard which is likelyo provide a further manure-related source (from milking parlour,inter-housing and out-wintering pads). The �18O values of this
luster of data points are close to the expected �18O value of nitrateerived from nitrification of organic N compounds. At the studyite, �18O values of nitrate derived from nitrification have been cal-ulated to be about +4.0 ± 0.5‰ using the following equation (e.g.ollocher, 1984):
18Onitrate = 13
�18OO2 + 23
�18OH2O (5)
ith a �18OH2O value of groundwater of −5.0 to −6.5‰ near the
tudy area (after Darling et al., 2003) and a value of 23.5‰ for �18OO2after Kroopnick and Craig, 1972).
Synthetic fertilizer also contributes a significant proportion ofhe total N inputs (46.8%) at the study site. There is, however, noirect isotopic evidence of nitrate derived from synthetic fertilizer
n the groundwater wells, as �15N values are generally too high and18O values too low. However, Flipse and Bonner (1985) showedhat groundwater nitrate below synthetically fertilized fields had15N values up to 12.4‰ higher than the synthetic fertilizer fromhich it was formed as a result of volatilisation of ammonia. Thisay partly explain the fact that none of the �15N data at this
tudy site point to derivation solely from mineral fertilizers (i.e.one below 5‰), although such fertilization has occurred for manyecades. Kaown et al. (2009) also suggest that mixing of manurend fertilizer leads to �15N values between 6 and 10‰ (higherhan expected from synthetic fertilizer derived nitrate). While �18Oalues of chemical fertilizers are typically high, values as low as.4–4.6‰ are likely to be the result of rapid immobilisation ofmmonium and nitrate based synthetic fertilizers to organic nitro-en and subsequent nitrification (Kaown et al., 2009). A furthereason for the lack of a clear isotopic signal for synthetic mineralertilizer may be that in Ireland’s warm, wet, grazing season, there
s a high demand for N for grass growth in intensively managedwards (Whitehead, 1995; Humphreys, 2007). In two fields at thetudy site, soil mineral N extractions over 18 months were alwaysow in nitrate (unpublished data) suggesting that a high proportiongust and December 2008. Open diamond symbols refer to wells located within theid’ area highlighted in Fig. 1. Also shown, �18O and �15N ranges for different nitrate
of synthetic fertilizer N is readily taken up by grass when ‘little andoften’ applications occur.
4.3. Nitrate attenuation on site
Intensively managed grazed grassland, where grass growthoccurs over ∼300 days a year in temperate climates such asIreland’s, and where 90% of dairy cows’ diet is grass-based(Humphreys et al., 2004), requires high inputs of nitrogen whichcannot be supplied by organic manures alone. On this dairy farm,grazing rotations occur at 21- to 28-day intervals between Februaryand October and mineral nitrogen is applied after each rotation.This site is a practicing dairy farm and individual fields are manageddifferently from year to year, i.e. grazed, reseeded or cut for silageand are fertilized accordingly with varying amounts of organic andinorganic fertilizer. Certain sources are, however, consistent: thebeef farm to the north, the dairy and winter housing in the mid-farmarea and the areas of long-term spraying of soiled water. Naturalattenuation of nitrate concentrations therefore appears to controlnitrate levels in Group C wells as the entire study site receives highinputs of anthropogenic N (255 kg N ha−1as organic nitrogen and235 kg N ha−1 as synthetic fertilizer), but nitrate concentrations arealways low in Group C. A combination of depleted nitrate con-centrations with enriched �15N and �18O values is indicative ofdenitrification; in cases where dilution occurs, no major changein the isotopic composition is expected (Mariotti et al., 1988).
Cl− concentration data may provide additional evidence to sup-port the observations regarding nitrate sources and transformationprocesses made based on the isotopic data. Cl− has often been usedas a conservative tracer of anthropogenic activities (e.g. Koh et al.,2010) with low Cl− indicating an absence of manure/sewage. Atthis study site, though, no clear linear relationship between Cl− andNO3
− concentration or isotopic data was observed. Unsurprisingly,Cl− concentrations (Table 1) were consistently high (15–68 mg l−1,with >20 mg l−1 in 93% and >25 mg l−1 in 68% of the cases) as a resultof long-term manure application to all areas. The natural back-ground level of Cl− in Irish groundwater has a median of 18 mg l−1
(Fenton et al., 2009b). Median Cl− concentrations though were29.1, 28.1, and 27.6 mg l−1 in April, August, and December, respec-
tively, supporting the suggestion that manure is a predominantsource for groundwater nitrate at this site. DO concentrations var-ied spatially, but temporally were fairly constant, similar to whatwas observed for nitrate concentration and isotopic composition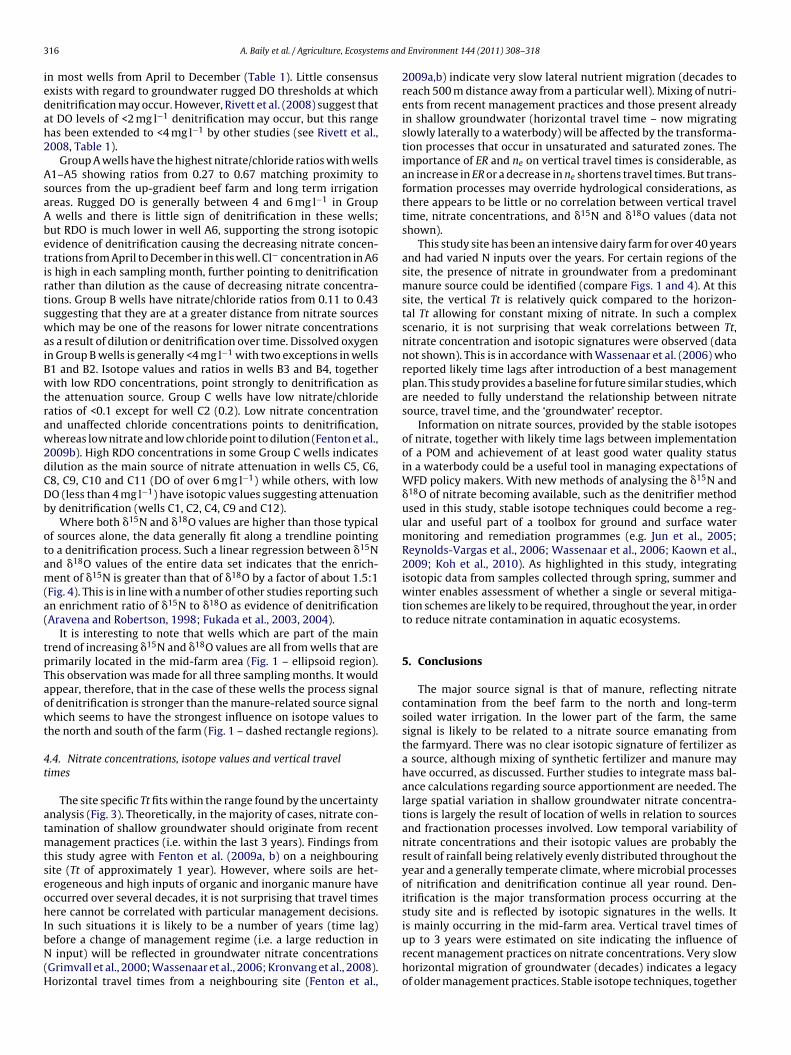
3 s and
iedah2
AsaAbetirtswaiBwtraw2dCDb
otam(a(
tpTaowt
4t
atmtseohIbN(H
16 A. Baily et al. / Agriculture, Ecosystem
n most wells from April to December (Table 1). Little consensusxists with regard to groundwater rugged DO thresholds at whichenitrification may occur. However, Rivett et al. (2008) suggest thatt DO levels of <2 mg l−1 denitrification may occur, but this rangeas been extended to <4 mg l−1 by other studies (see Rivett et al.,008, Table 1).
Group A wells have the highest nitrate/chloride ratios with wells1–A5 showing ratios from 0.27 to 0.67 matching proximity toources from the up-gradient beef farm and long term irrigationreas. Rugged DO is generally between 4 and 6 mg l−1 in Group
wells and there is little sign of denitrification in these wells;ut RDO is much lower in well A6, supporting the strong isotopicvidence of denitrification causing the decreasing nitrate concen-rations from April to December in this well. Cl− concentration in A6s high in each sampling month, further pointing to denitrificationather than dilution as the cause of decreasing nitrate concentra-ions. Group B wells have nitrate/chloride ratios from 0.11 to 0.43uggesting that they are at a greater distance from nitrate sourceshich may be one of the reasons for lower nitrate concentrations
s a result of dilution or denitrification over time. Dissolved oxygenn Group B wells is generally <4 mg l−1 with two exceptions in wells1 and B2. Isotope values and ratios in wells B3 and B4, togetherith low RDO concentrations, point strongly to denitrification as
he attenuation source. Group C wells have low nitrate/chlorideatios of <0.1 except for well C2 (0.2). Low nitrate concentrationnd unaffected chloride concentrations points to denitrification,hereas low nitrate and low chloride point to dilution (Fenton et al.,
009b). High RDO concentrations in some Group C wells indicatesilution as the main source of nitrate attenuation in wells C5, C6,8, C9, C10 and C11 (DO of over 6 mg l−1) while others, with lowO (less than 4 mg l−1) have isotopic values suggesting attenuationy denitrification (wells C1, C2, C4, C9 and C12).
Where both �15N and �18O values are higher than those typicalf sources alone, the data generally fit along a trendline pointingo a denitrification process. Such a linear regression between �15Nnd �18O values of the entire data set indicates that the enrich-ent of �15N is greater than that of �18O by a factor of about 1.5:1
Fig. 4). This is in line with a number of other studies reporting suchn enrichment ratio of �15N to �18O as evidence of denitrificationAravena and Robertson, 1998; Fukada et al., 2003, 2004).
It is interesting to note that wells which are part of the mainrend of increasing �15N and �18O values are all from wells that arerimarily located in the mid-farm area (Fig. 1 – ellipsoid region).his observation was made for all three sampling months. It wouldppear, therefore, that in the case of these wells the process signalf denitrification is stronger than the manure-related source signalhich seems to have the strongest influence on isotope values to
he north and south of the farm (Fig. 1 – dashed rectangle regions).
.4. Nitrate concentrations, isotope values and vertical travelimes
The site specific Tt fits within the range found by the uncertaintynalysis (Fig. 3). Theoretically, in the majority of cases, nitrate con-amination of shallow groundwater should originate from recent
anagement practices (i.e. within the last 3 years). Findings fromhis study agree with Fenton et al. (2009a, b) on a neighbouringite (Tt of approximately 1 year). However, where soils are het-rogeneous and high inputs of organic and inorganic manure haveccurred over several decades, it is not surprising that travel timesere cannot be correlated with particular management decisions.
n such situations it is likely to be a number of years (time lag)
efore a change of management regime (i.e. a large reduction ininput) will be reflected in groundwater nitrate concentrationsGrimvall et al., 2000; Wassenaar et al., 2006; Kronvang et al., 2008).orizontal travel times from a neighbouring site (Fenton et al.,
Environment 144 (2011) 308–318
2009a,b) indicate very slow lateral nutrient migration (decades toreach 500 m distance away from a particular well). Mixing of nutri-ents from recent management practices and those present alreadyin shallow groundwater (horizontal travel time – now migratingslowly laterally to a waterbody) will be affected by the transforma-tion processes that occur in unsaturated and saturated zones. Theimportance of ER and ne on vertical travel times is considerable, asan increase in ER or a decrease in ne shortens travel times. But trans-formation processes may override hydrological considerations, asthere appears to be little or no correlation between vertical traveltime, nitrate concentrations, and �15N and �18O values (data notshown).
This study site has been an intensive dairy farm for over 40 yearsand had varied N inputs over the years. For certain regions of thesite, the presence of nitrate in groundwater from a predominantmanure source could be identified (compare Figs. 1 and 4). At thissite, the vertical Tt is relatively quick compared to the horizon-tal Tt allowing for constant mixing of nitrate. In such a complexscenario, it is not surprising that weak correlations between Tt,nitrate concentration and isotopic signatures were observed (datanot shown). This is in accordance with Wassenaar et al. (2006) whoreported likely time lags after introduction of a best managementplan. This study provides a baseline for future similar studies, whichare needed to fully understand the relationship between nitratesource, travel time, and the ‘groundwater’ receptor.
Information on nitrate sources, provided by the stable isotopesof nitrate, together with likely time lags between implementationof a POM and achievement of at least good water quality statusin a waterbody could be a useful tool in managing expectations ofWFD policy makers. With new methods of analysing the �15N and�18O of nitrate becoming available, such as the denitrifier methodused in this study, stable isotope techniques could become a reg-ular and useful part of a toolbox for ground and surface watermonitoring and remediation programmes (e.g. Jun et al., 2005;Reynolds-Vargas et al., 2006; Wassenaar et al., 2006; Kaown et al.,2009; Koh et al., 2010). As highlighted in this study, integratingisotopic data from samples collected through spring, summer andwinter enables assessment of whether a single or several mitiga-tion schemes are likely to be required, throughout the year, in orderto reduce nitrate contamination in aquatic ecosystems.
5. Conclusions
The major source signal is that of manure, reflecting nitratecontamination from the beef farm to the north and long-termsoiled water irrigation. In the lower part of the farm, the samesignal is likely to be related to a nitrate source emanating fromthe farmyard. There was no clear isotopic signature of fertilizer asa source, although mixing of synthetic fertilizer and manure mayhave occurred, as discussed. Further studies to integrate mass bal-ance calculations regarding source apportionment are needed. Thelarge spatial variation in shallow groundwater nitrate concentra-tions is largely the result of location of wells in relation to sourcesand fractionation processes involved. Low temporal variability ofnitrate concentrations and their isotopic values are probably theresult of rainfall being relatively evenly distributed throughout theyear and a generally temperate climate, where microbial processesof nitrification and denitrification continue all year round. Den-itrification is the major transformation process occurring at thestudy site and is reflected by isotopic signatures in the wells. Itis mainly occurring in the mid-farm area. Vertical travel times of
up to 3 years were estimated on site indicating the influence ofrecent management practices on nitrate concentrations. Very slowhorizontal migration of groundwater (decades) indicates a legacyof older management practices. Stable isotope techniques, together
s and
wt
A
saMnQti
R
A
A
B
C
C
C
D
D
E
F
F
F
F
F
F
F
G
G
G
H
H
H
A. Baily et al. / Agriculture, Ecosystem
ith an understanding of time lag, provide an extra mechanism toest the efficacy of monitoring and mitigation programmes.
cknowledgements
The first author would like to thank the Teagasc Walsh Fellow-hip scheme; also Professor Phil Jordan for general advice. Theuthors would like to thank Denis Brennan, Con Dowdal, EddiecDonald, John Murphy, and Maria Radford from Teagasc, Ron-
ie Laughlin and Michael Nicholson from AFBI, and Ian Grant fromueen’s University, Belfast, for advice, logistical and technical assis-
ance, as well as Jürg Fuhrer and two anonymous reviewers for theirnsightful comments.
eferences
ravena, R., Evans, M.L., Cherry, J.A., 1993. Stable isotopes of oxygen and nitrogen insource identification of nitrate from septic tanks. Ground Water 31, 180–186.
ravena, R., Robertson, W.D., 1998. Use of multiple isotope tracers to evaluate den-itrification in ground water: study of nitrate from a large-flux septic systemplume. Ground Water 36, 975–982.
öttcher, J., Strebel, O., Voerkelius, S., Schmidt, H.L., 1990. Using isotope fractionationof nitrate–nitrogen and nitrate–oxygen for evaluation of microbial denitrifica-tion in a sandy aquifer. J. Hydrol. 114, 413–424.
asciotti, K.L., Sigman, D.M., Hastings, M.G., Bohlke, J.K., Hilkert, A., 2002. Measure-ment of the oxygen isotopic composition of nitrate in seawater and freshwaterusing the denitrifier method. Anal. Chem. 74, 4905–4912.
hristensen, S., Tiedje, J.M., 1988. Sub-parts-per-billion nitrate method: use of anN2O producing denitrifier to convert NO3
− or 15NO3− to N2O. Appl. Environ.
Microbiol. 54, 1409–1413.ollins, A.L., McGonigle, D.F., 2008. Monitoring and modelling diffuse pollution from
agriculture for policy support: UK and European experience. Environ. Sci. Policy11, 97–101.
arling, W.G., Bath, A.H., Talbot, J.C., 2003. The O & H stable isotopic compositionof fresh waters in the British Isles. 2. Surface waters and ground water. Hydrol.Earth Syst. Sci. 7, 183–195.
honau, N.B., 1972. The lower Palaeozoic rocks of the Bannow coast, Co. Wexford.Geol. Surv. Ireland Bull. 1, 231–244.
uropean Community (EC), 1991. Council Directive 91/676/EEC of 21st May 1991concerning the protection of waters against pollution caused by nitrates fromagricultural sources. Off. J. Eur. Commun. L375, 1–8.
enton, O., Schulte, R.P.O., Jordan, P., Lalor, S., Richards, K.G., 2011. Time lag: amethodology for the estimation of vertical and horizontal travel and flushingtimescales to nitrate threshold concentrations in Irish aquifers. Environ. Sci.Policy 14, 419–431.
enton, O., Coxon, C.E., Haria, A.H., Horan, B., Humphreys, J., Johnson, P., Murphy,P., Necpalova, M., Premrov, A., Richards, K.G., 2009a. Variations in travel timesand remediation potential for N loading to groundwater in four case studies inIreland: implications for policy makers and regulators. Tearmann: Irish J. Agric.-Environ. Res. 7, 1–14.
enton, O., Richards, K.R., Kirwan, L., Khalil, M.I., Healy, M.G., 2009b. Factors affectingnitrate distribution in shallow groundwater under a beef farm in South EasternIreland. J. Environ. Manage. 90, 3135–3146.
itzsimons, V.P., Misstear, B.D.R., 2006. Estimating groundwater recharge throughtills: a sensitivity analysis of soil moisture budgets and till properties in Ireland.Hydrogeol. J. 14, 548–561.
lipse, W.J., Bonner, F.T., 1985. Nitrogen-isotope ratios of nitrate in groundwaterunder fertilized fields, Long Island, New York. Ground Water 23, 59–67.
ukada, T., Hiscock, K.M., Dennis, P.F., Grischek, T., 2003. A dual isotope approachto identify denitrification in groundwater at a river-bank infiltration site. WaterRes. 37, 3070–3078.
ukada, T., Hiscock, K.M., Dennis, P.F., 2004. A dual-isotope approach to the nitrogenhydrochemistry of an urban aquifer. Appl. Geochem. 19, 709–719.
ardiner, M.J., Ryan, P., 1964. Soils of County Wexford. Soil Survey Bulletin. An ForasTaluntais, Dublin, 1964.
eological Survey of Ireland (GSI), 2010. Interim Vulnerability Groundwater Map ofIreland. http://www.gsi.ie/Programmes/Groundwater/ (accessed 17.12.10).
rimvall, A., Stalnacke, P., Tonderski, A., 2000. Time scales of nutrient losses fromland to sea – a European perspective. Ecol. Eng. 14, 363–371.
ollocher, T.C., 1984. Source of the oxygen atoms of nitrate in the oxidation of nitriteby Nitrobacter agilis and evidence against a P–O–N anhydride mechanism inoxidative phosphorylation. Arch. Biochem. Biophys. 233, 721–727.
umphreys, J., 2007. Cutting Back on Fertilizer for Grassland in 2007. The FertilizerAssociation of Ireland: Proceedings of Spring Scientific Meeting, Publication No.43. http://www.fertilizer-assoc.ie/publications.htm (accessed 15.12.10).
umphreys, J., Casey, I.A., Carton, O.T., 2004. Meeting environmental objectives andpotential constraint on dairy production in Ireland. In: Bos, J., Aarts, F., Pflimlis,A. (Eds.), Nutrient Management at Farm Scale: Attaining Policy Objectives withintensive dairy farming. Proceedings of European Grassland and EnvironmentalIssues, Quimper (France) 23–25 June 2003, pp 145–164.
Environment 144 (2011) 308–318 317
Jun, S.-C., Bae, G.-O., Lee, K.-K., Chung, H.-J., 2005. Identification of the source ofnitrate contamination in ground water below an agricultural site, Jeungpyeong,Korea. J. Environ. Qual. 34, 804–815.
Kaown, D., Koh, D.-C., Mayer, B., Lee, K.-K., 2009. Identification of nitrate and sulfatesources in groundwater using dual stable isotope approaches for an agriculturalarea with different land use (Chuncheon, mid-eastern Korea). Agric. Ecosyst.Environ. 132 (3–4), 223–231.
Kavanagh, P., Bree, T., 2009. Water framework directive programme of measures:sites, forest, water and on-site wastewater-treatment systems. Biol. Environ.Proc. R. Irish Acad. 109B.
Keeney, D., 1986. Sources of nitrate to groundwater. CRC Crit. Rev. Environ. Control16, 257–304.
Kendall, C., 1998. Tracing nitrogen sources and cycling in catchments. In: Kendall,C., McDonnell, J.J. (Eds.), Isotope Tracers in Catchment Hydrology. Elsevier, Ams-terdam, pp. 521–576.
Kilfeather, A.A., Van der Meer, J.J.M., 2008. Pore size, shape and connectivity in tillsand their relationship to deformation processes. Quat. Sci. Rev. 27, 250–266.
Koh, D.-C., Mayer, B., Lee, K.-S., Ko, K.-S., 2010. Land-use controls on sources and fateof nitrate in shallow groundwater of an agricultural area revealed by multipleenvironmental tracers. J. Cont. Hydrol. 118, 62–78.
Kronvang, B., Anderson, H.E., Borgesen, C., Dalgaard, T., Larsen, S.E., Bogestrand,J., Blicher-Mathiasen, G., 2008. Effects of policy measures implemented inDenmark on nitrogen pollution of the aquatic environment. Environ. Sci. Pollut.11, 144–152.
Kroopnick, P.M., Craig, H., 1972. Atmospheric oxygen: isotopic composition andsolubility fractionation. Science 175, 54–55.
Lantinga, E.A., Keuning, J.A., Groenwold, J., Deenen, P.J.A.G., 1987. Distribution ofexcreted nitrogen by grazing cattle and its effects on sward quality, herbageproduction and utilization. In: Van der Meer, H.G., Unwin, R.J., Van Dijk, T.A.,Ennik, G.D. (Eds.), Animal Manure on Grassland and Fodder Crops. Fertilizer orWaste? Martinus Nijhoff, Wageningen, The Netherlands, pp. 103–117.
Lind, B.B., Lundin, L., 1990. Saturated hydraulic conductivity of Scandinavian Tills.Nordic Hydrol. 21, 107–118.
Mariotti, A., Landreau, A., Simon, B., 1988. 15N biogeochemistry and natural deni-trification process in groundwater: application to the chalk aquifer in northernFrance. Geochim. Cosmochim. Acta 52, 1869–1878.
Masetti, M., Polt, S., Sterlacchini, S., Beretta, G.P., Facchi, A., 2008. Spatial and statis-tical assessment of factors influencing nitrate contamination in groundwater. J.Environ. Manage. 86, 272–281.
Mayer, B., Boyer, E.W., Goodale, C., Jaworski, N.A., van Breemen, N., Howarth, R.W.,Seitzinger, S., Billen, G., Lajtha, K., Nadelhoffer, K., van Dam, D., Hetling, L.J., Nosal,M., Paustian, K., 2002. Sources of nitrate in rivers draining sixteen watershedsin the northeastern U.S.: isotopic constraints. Biogeochemistry 57/58, 171–197.
McGechan, M.G., Topp, C.F.E., 2004. Modelling environmental impacts of deposi-tion of excreted nitrogen by grazing dairy cows. Agric. Ecosyst. Environ. 103,149–164.
Meinardi, C.R., Beusen, A.H.W., Bollen, M.J.S., Klepper, O., Willems, W.J., 1995. Vul-nerability to diffuse pollution and average nitrate contamination of Europeansoils and groundwater. Water Sci. Technol. 31 (8), 159–165.
Mengis, M., Walther, U., Bernasconi, S.M., Hehrli, B., 2001. Limitations of using �18Ofor the source identification of nitrate in agricultural soils. Environ. Sci. Technol.35, 1840–1844.
Met Éireann, 2011. 30 Year Averages for Rosslare.http://www.met.ie/climate/rosslare.asp (accessed 13.04.11).
Minogue, D., Murphy, P., French, P., Coughlan, F., Bolger, T., 2010. Characterisation ofSoiled Water on Irish Dairy Farms. BSAS & Agricultural Research Forum, Belfast,N. Ireland.
Misstear, B.D.R., Brown, L., Daly, D., 2009. A methodology for making initial estimatesof groundwater recharge from groundwater vulnerability mapping. Hydrogeol.J. 17, 275–285.
Official Journal of the European Communities (OJEC), 2000. Directive 2000/60/EC ofthe European Parliament and of the Council of 23 October 2000 establishing aframework for Community action in the field of water policy. L327.
Reynolds-Vargas, J., Fraile-Merino, J., Hirata, R., 2006. Trends in nitrate concentra-tions and determination of its origin using stable isotopes (18O and 15N) ingroundwater of the Western Central Valley, Costa Rica. Ambio 35, 229–236.
Rivett, M.O., Buss, S.R., Morgan, P., Smith, J.W.N., Bemment, C.D., 2008. Nitrate atten-uation in groundwater: a review of biogeochemical controlling processes. WaterRes. 42, 4215–4232.
Rock, L., Ellert, B.H., 2007. Nitrogen-15 and oxygen-18 natural abundance of potas-sium chloride extractable soil nitrate using the denitrifier method. Soil Sci. Soc.Am. J. 71, 355–361.
Rodgers, M., Gibbons, P., Mulqueen, J., 2003. Nitrate leaching on a sandy soilunder different dairy wastewater applications. In: Diffuse Pollution Conference,Dublin.
Schulte, R.P.O., Melland, A.R., Fenton, O., Herlihy, M., Richards, K., Jordan, P., 2010.Modelling soil phosphorus decline: expectations of Water Framework Directivepolicies. Environ. Sci. Policy 13, 472–484.
Schulte, R.P.O., Diamond, J., Finkele, K., Holden, N.M., Brereton, A.J., 2005. Predict-ing the soil moisture conditions of Irish grasslands. Irish J. Agric. Food Res. 44,95–110.
Sigman, D.M., Casciotti, K.L., Andreani, M., Barford, C., Galanter, M., Böhlke, J.K., 2001.A bacterial method for the nitrogen isotopic analysis of nitrate in seawater andfreshwater. Anal. Chem. 73, 4145–4153.
Singleton, M.J., Esser, B.K., Moran, J.E., Hudson, G.B., McNab, W.W., Harter, T.,2007. Saturated zone denitrification: potential for natural attenuation of nitrate

3 s and
v
V
W
W
18 A. Baily et al. / Agriculture, Ecosystem
contamination in shallow groundwater under dairy operations. Environ. Sci.Technol. 41, 759–765.
an Beek, C.L., van der Salm, C., Plette, A.C.C., van de Weerd, H., 2009. Nutrient losspathways from grazed grasslands and the effects of decreasing inputs: experi-mental results for three soil types. Nutr. Cycl. Agroecosyst. 83, 99–110.
itousek, P.M., Aber, J.D., Howarth, R.W., Likens, G.E., Matson, P.A., Schindler, D.W.,Schlesinger, W.H., Tilman, D.G., 1997. Human alteration of the global nitrogencycle: sources and consequences. Ecol. Appl. 7, 737–750.
assenaar, L.I., 1995. Evaluation of the origin and fate of nitrate in the Abbots-ford Aquifer using the isotopes of 15N and 18O in NO3
− . Appl. Geochem. 10,391–405.
assenaar, L.I., Hendry, M.J., Harrington, N., 2006. Decadal geochemical andisotopic trends for nitrate in a transboundary aquifer and implications for
Environment 144 (2011) 308–318
agricultural beneficial management practices. Environ. Sci. Technol. 40 (15),4626–4632.
Watson, C.J., Foy, R.H., 2001. Environmental impacts of nitrogen and phosphoruscycling in grassland systems. Outlook Agric. 30 (2), 117–127.
Whitehead, D.C., 1995. Grassland Nitrogen. CAB International, Wallingford, Oxon,UK.
World Health Organisation (WHO), 1996. Guidelines for drinking water quality. In:Health Criteria and Other Supporting Information, vol. 2, 2nd edn. World Health
Organization, Geneva, Switzerland.Xue, D., Botte, J., De Baets, B., Accoe, F., Nestler, A., Taylor, P., Van Cleemput, O.,Berglund, M., Boeckx, P., 2009. Present limitations and future prospects of stableisotope methods for nitrate source identification in surface and groundwater.Water Res. 43, 1159–1170.