Spatial and Temporal Changes in Tsunami Risk Perception in ...
213
Spatial and Temporal Changes in Tsunami Risk Perception in Canterbury A thesis submitted in partial fulfilment of the requirements for the Degree of Master Science in Hazard and Disaster Management in the University of Canterbury by Jennifer Faith DuBois University of Canterbury 2007
-
Upload
khangminh22 -
Category
Documents
-
view
0 -
download
0
Transcript of Spatial and Temporal Changes in Tsunami Risk Perception in ...
Spatial and Temporal Changes in Tsunami Risk Perception in Canterbury
A thesis submitted in partial fulfilment of the requirements for the Degree
of Master Science in Hazard and Disaster Management
in the University of Canterbury
by Jennifer Faith DuBois
University of Canterbury 2007

Table of contents Table of contents ...................................................................................... - 2 - Abstract ..................................................................................................... - 5 - Chapter 1 Introduction............................................................................................... - 6 -
1.1 Introduction............................................................................................... - 6 - 1.2 Methodology............................................................................................. - 7 -
Chapter 2 Tsunamis and New Zealand..................................................................... - 8 -
2.1 Introduction..................................................................................................... - 8 - 2.2 Historical Tsunamis ........................................................................................ - 9 - 2.3 The Damage Potential................................................................................... - 14 - 2.4 Hazard Mitigation ......................................................................................... - 19 -
Chapter 3 Non-resident Survey............................................................................... - 21 -
3.1 Introduction................................................................................................... - 21 - 3.2 Methodology................................................................................................. - 21 - 3.3 Results........................................................................................................... - 24 -
3.3.1 Personal Information.............................................................................. - 24 - 3.3.2 Knowledge of Risk ................................................................................ - 29 - 3.3.3 During a Tsunami .................................................................................. - 41 -3.3.4 Changes in Perception............................................................................ - 44 -
3.4 Discussion ..................................................................................................... - 44 - Chapter 4 Resident Survey...................................................................................... - 47 -
4.1 Introduction................................................................................................... - 47 - 4.2 Methodology................................................................................................. - 47 - 4.3 Response Rate............................................................................................... - 50 - 4.4 Representativeness of the sample ................................................................. - 50 - 4.4 Results........................................................................................................... - 52 -
4.4.1 Awareness and experience of natural hazards in general ...................... - 52 - 4.4.2 General tsunami questions ..................................................................... - 55 - 4.4.3 Tsunami warnings and preparation........................................................ - 57 - 4.4.5 Attitude about community ..................................................................... - 70 -
4.5 Discussion ..................................................................................................... - 77 -
- 2 -
Chapter 5 Variations in Risk Perception between Residents and Visitors.......... - 79 -
5.1 Introduction................................................................................................... - 79 - 5.2 Risk perception ............................................................................................. - 79 -
5.2.1 Introduction............................................................................................ - 79 - 5.2.2 Experience.............................................................................................. - 80 - 5.2.3 The media............................................................................................... - 81 - 5.2.4 Demographic factors.............................................................................. - 82 - 5.2.5 Other factors........................................................................................... - 83 -
5.3 Natural hazards and the tourist industry ....................................................... - 84 - 5.4 Residents and non-residents- the results ....................................................... - 86 -
5.4.1 General tsunami knowledge................................................................... - 86 - 5.4.2 Information Sources............................................................................... - 87 - 5.4.3 Tsunami warnings.................................................................................. - 89 - 5.4.4 During a tsunami.................................................................................... - 91 -
5.6 Discussion ..................................................................................................... - 93 - Chapter 6 Changes in Hazard Perception since the 2004 Boxing Day Tsunami - 94 -
6.1 Introduction................................................................................................... - 94 - 6.2 The 2004 Sumatra-Andaman Earthquake and Boxing Day Tsunami........... - 95 -
6.2.1 The earthquake....................................................................................... - 95 - 6.2.2 The tsunami............................................................................................ - 96 - 6.2.3 Tsunami science since Boxing Day- lessons learned ............................ - 99 -
6.3 Hazard perception and catastrophic events................................................. - 100 - 6.4 Survey results.............................................................................................. - 102 -
6.4.1 Since Boxing Day ................................................................................ - 102 - 6.4.2 Comparing the 2003 and 2006 surveys................................................ - 103 -
6.5 Discussion ................................................................................................... - 113 - Chapter 7 Mitigating the tsunami hazard in Canterbury ..................................... - 115 -
7.1 The tsunami threat to Canterbury ............................................................... - 115 - 7.2 Preparedness in Canterbury ........................................................................ - 119 -
7.2.1 The Perception-preparation model....................................................... - 119 - 7.2.2 Risk perception .................................................................................... - 119 - 7.2.2 Outcome expectancy............................................................................ - 120 - 7.2.3 Self efficacy ......................................................................................... - 120 - 7.2.4 Intention/information search................................................................ - 121 - 7.2.5 Prior experience ................................................................................... - 121 - 7.2.6 Perceived responsibility ....................................................................... - 122 - 7.2.7 Sense of community............................................................................. - 122 - 7.2.8 Reasons for low preparedness.............................................................. - 123 -
7.3 Evacuation behaviour.................................................................................. - 123 -
- 3 -

Chapter 8 Conclusions .......................................................................................... - 126 -
8.1 Conclusions................................................................................................ - 126 - Acknowledgments ................................................................................ - 128 - References ............................................................................................ - 129 - Appendices ........................................................................................... - 138 - Appendix 1 New Zealand Tsunamis .................................................... - 139 -Appendix 2 Surveys and Letters ......................................................... - 144 -Appendix 3 Answers to open ended questions and “other” answers - 171 -
- 4 -
Abstract
Risk perception for rare, low-probability hazards, such as tsunamis, tends to be low
due to individual’s unfamiliarity with them and the tendency to see them as
synonymous with non-occurrence events. Visitors to an area tend to have even lower
risk perception and knowledge of hazards, warning systems and appropriate actions to
take during an event. Risk perception, however, can increase, if only temporarily,
after a catastrophic event, such as the 2004 Boxing Day tsunami. To determine the
changes in resident’s knowledge and perception and the differences between those of
residents and visitors two surveys were conducted. In the first survey interview style
surveying was conducted at eleven locations in the coastal Christchurch and Banks
Peninsula area of the Canterbury Region The questionnaire was composed of scaled,
open, and closed ended questions and the main themes included knowledge of risk,
preparation and warnings, what to do during a tsunami, and changes since the 2004
Boxing Day tsunami. The second survey of five coastal communities was conducted
via a postal questionnaire and was aimed at obtaining residential views. Survey data
was then analysed with Statistical Package for the Social Sciences (SPSS) statistical
software. The residential data was compared with that of the non-residents to
determine the differences in perception of residents and visitors. The residential
information was then compared with survey data from the 2003 National Coastal
Survey. Visitors knew less about general tsunami information such as when the last
tsunami occurred and were less likely to believe that a tsunami could occur
imminently. Non-residents reported less receipt of information and did considerably
less information seeking. Differences in knowledge of warning systems were difficult
to ascertain. The Boxing Day event certainly made an impact, increasing people’s
knowledge and awareness, though most likely only temporarily.
- 5 -

Chapter 1
Introduction
1.1 Introduction
During an average year, there are millions of dollars worth of damage from
earthquakes, millions are affected by drought, thousand are killed by floods, and
hundreds are left homeless from wind storms and hurricanes (EM-DAT, 2007). In
contrast most tsunamis that occur are so small that they go by almost completely
unnoticed. This is not the case every year, though, with 1946, 1960, 1998 and
especially 2004 bringing devastating tsunamis.
People are familiar with earthquakes, floods, windstorms and droughts
because they occur frequently. Individuals have more accurate risk perception for
such familiar hazards and are therefore more likely to take preparatory measures
before a natural disaster and self-protective actions during an event (Weinstein, 1989).
However, many individuals see low-probability events, such as tsunamis, as
synonymous with non-occurrence events (Rogers, 1997). Given the low probability of
occurrence and a history of minimal damage, individuals are likely to have very low
risk perception, little knowledge of the hazard and warning systems and are unlikely
to be prepared. With an average of 12-13 one-meter tsunamis each century and higher
world population than ever before, the potential for future damage is very great. With
the low-probability of occurrence and a history of minimal damage, individuals are
likely to have very low risk perception, little knowledge of the hazard and warning
system and are unlikely to be prepared.
This is an even greater issue for tourists to an area who are likely to have even
less knowledge and awareness of possible hazards and what to do in the event of a
tsunami (Alexander, 2002). Tourists also bring a temporary increase the population to
an area, further increasing the risk.
However, after a large-scale disaster such as the 2004 Boxing Day Tsunami,
changes can occur in perceptions of tsunami hazards, how they are viewed and what
is known about them.
- 6 -
1.2 Methodology
To understand individuals’ knowledge, understanding and perceptions about various
facets of tsunamis are two surveys, were conducted. The first survey was aimed at
non-residents at campground sites. Interview-style surveying was conducted at eleven
locations in the coastal Christchurch and Banks Peninsula area of the Canterbury
Region.
A total of 211 interviews were conducted between December 23rd, 2005 and
January 31st, 2006, during the peak holiday occupancy period. The survey questions
were based on the National Coastal Survey conducted by Geological and Nuclear
Sciences (GNS) in 2003 (Johnston et al, 2003). The questionnaire was composed of
scaled, open-ended, and closed-ended questions and the main themes included
knowledge of risk, preparation and warnings, what to do during a tsunami, and
changes since the 2004 Boxing Day tsunamis.
The second survey was aimed at residents of five coastal communities of the
Canterbury Region. A postal questionnaire was delivered to residents during October
of 2006. All the communities but one were chosen because they were surveyed as part
of the National Coastal Survey carried out by GNS in 2003. Addresses from the 2003
survey were reused with 710 surveys were posted initially.
The survey was based on several other surveys to allow cross-comparison of
results. The other surveys included the 2003 National Coastal Survey (Johnston et al,
2003), the present campground survey of non-residents, and a similar tsunami survey
that was conducted in Oregon, USA early in 2006. The questionnaire was composed
of scaled, open- and closed-ended questions, and the main themes included risk
perception and hazard experience, general tsunami knowledge, tsunami warnings,
sources of information and preparedness, and attitude about community.
Survey data were analysed with Statistical Package for the Social Sciences
(SPSS) statistical software. The residential data were compared with that of the non-
residents to determine the differences in perception between residents and visitors.
The residential information was then compared with survey data from the 2003
National Coastal Survey (Johnston et al, 2003) to see what changes in perception had
occurred since the 2004 Boxing Day tsunami.
- 7 -
Chapter 2
Tsunamis and New Zealand
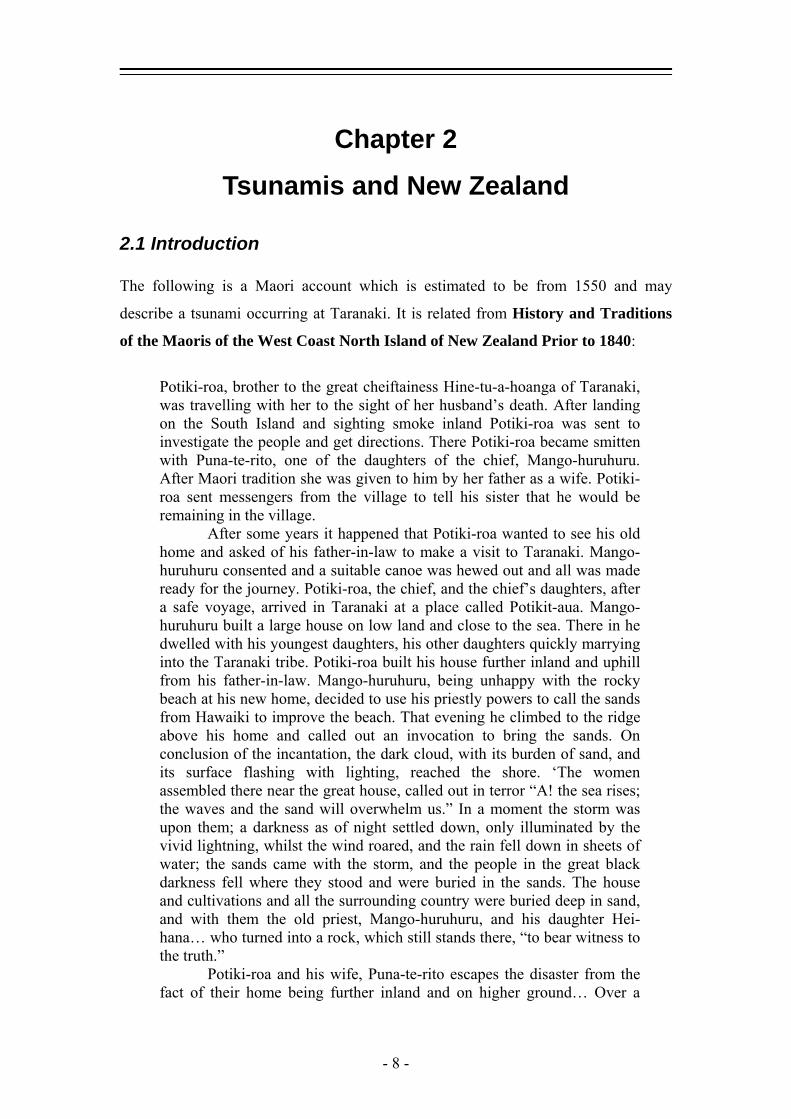
2.1 Introduction The following is a Maori account which is estimated to be from 1550 and may
describe a tsunami occurring at Taranaki. It is related from History and Traditions
of the Maoris of the West Coast North Island of New Zealand Prior to 1840:
Potiki-roa, brother to the great cheiftainess Hine-tu-a-hoanga of Taranaki, was travelling with her to the sight of her husband’s death. After landing on the South Island and sighting smoke inland Potiki-roa was sent to investigate the people and get directions. There Potiki-roa became smitten with Puna-te-rito, one of the daughters of the chief, Mango-huruhuru. After Maori tradition she was given to him by her father as a wife. Potiki-roa sent messengers from the village to tell his sister that he would be remaining in the village.
After some years it happened that Potiki-roa wanted to see his old home and asked of his father-in-law to make a visit to Taranaki. Mango-huruhuru consented and a suitable canoe was hewed out and all was made ready for the journey. Potiki-roa, the chief, and the chief’s daughters, after a safe voyage, arrived in Taranaki at a place called Potikit-aua. Mango-huruhuru built a large house on low land and close to the sea. There in he dwelled with his youngest daughters, his other daughters quickly marrying into the Taranaki tribe. Potiki-roa built his house further inland and uphill from his father-in-law. Mango-huruhuru, being unhappy with the rocky beach at his new home, decided to use his priestly powers to call the sands from Hawaiki to improve the beach. That evening he climbed to the ridge above his home and called out an invocation to bring the sands. On conclusion of the incantation, the dark cloud, with its burden of sand, and its surface flashing with lighting, reached the shore. ‘The women assembled there near the great house, called out in terror “A! the sea rises; the waves and the sand will overwhelm us.” In a moment the storm was upon them; a darkness as of night settled down, only illuminated by the vivid lightning, whilst the wind roared, and the rain fell down in sheets of water; the sands came with the storm, and the people in the great black darkness fell where they stood and were buried in the sands. The house and cultivations and all the surrounding country were buried deep in sand, and with them the old priest, Mango-huruhuru, and his daughter Hei-hana… who turned into a rock, which still stands there, “to bear witness to the truth.”
Potiki-roa and his wife, Puna-te-rito escapes the disaster from the fact of their home being further inland and on higher ground… Over a
- 8 -

hundred people were killed by the sands, and there bones are still there.’ (Smith, 1984).
According to McFadgen (Winder, 2005) there are Maori legends and stories about
large waves affecting the Taranaki and Waikato coast and although this could have
been a storm surge, it is also likely that this history refers to a tsunami. In pre-
European times approximately 30% of Maori lived within half a kilometre of the
coast and less than 20 meters above sea level, so would have been at risk from such
events (Winder, 2005). Recent paleotsunami research indicates that sites in the Cook
Strait region have been inundated by tsunamis and subsequently abandoned by Maori
(Goff et al, 2001) although prehistoric accounts of tsunamis are rare (Sidle et al,
2004) and the paleotsunami database will always be incomplete (Berryman, 2005).
New Zealand is subject to local, regional, and distantly generated tsunamis
from spanning a plate boundary which regularly generates large earthquakes
(Berryman, 2005) and from being located in the Pacific Ocean which is “by far” the
most active zone for tsunamis (Lander, 2003). This makes the country particularly
vulnerable to tsunami hazards. With the incomplete and unreliability nature of both
oral accounts and the paleotsunami record it is necessary to examine the historical
record to get a better understanding of the risk to New Zealand from tsunamis
including tsunami sources, locations affected, and possible wave heights and damage.
2.2 Historical Tsunamis
Date Source Location Source Mechanism Max Run-up
1843 8-Jul Wanganui, NZ 7.5 EQ 0.5
1845 5-Jul Wanganui, NZ EQ 1 1848 15-Oct Lower Wairau Valley, NZ 7.1 EQ 0.36 1848 17-Oct NZ 7.0 EQ 1855 23-Jan W. Wairarapa 8.0 EQ & Landslide 9.1 1856 2-Mar Canterbury, NZ, Chatham Rise Unknown 3 1868 13-Aug Arica, N. Chile 8.6-9.1 EQ 10 1868 18-Oct Cape Farewell, NZ 1877 10-May Inique, N. Chile 8.3-8.8 EQ 3.6 1883 27-Aug Krakatau, Indonesia Volcanic & Meteorological 2 1887 10-May Bay of Islands, NZ EQ 2 1891 22-Jun Aotea Harbour, Waikato, NZ EQ 3 1897 21-Sep W. Mindanao, Sulu, Philippines 8.5 EQ 1897 21-Sep Wellington, NZ EQ 1 1904 7-Aug Cape Turnaga, NZ 7.2 EQ 3 1913 22-Feb Tasman Sea, Westport 6.8 EQ & Landslide 1.5 1917 1-May Kermadec
- 9 -
1922 11-Nov Caldera, N. Chile 8.3-8.5 EQ 0.2
1922 25-Dec S.E. NZ, Rangiora 6.2 EQ 3 1923 1-Sep 35.23N,135E, Kwanto, Japan 7.9 EQ <0.1 1927-28 Tolaga Bay, NZ possible landslide >4 1929 16-Jun West Coast, Karamea, NZ 7.5 EQ & Landslide 2.5 1931 2-Feb N. NZ, Waikare, Hawkes Bay 7.7 EQ & Landslide 15.3 1931 2-Feb Napier 7.75 EQ ~3 1931 13-Feb 39.7S, 176.7E, 7.1 EQ 1931 19-Feb Hawkes Bay, NZ 1932 15-Sep N. NZ 6.8 EQ 3 1937 16-Apr Tonga 8.1 EQ 0.9 1946 26-Mar NZ EQ 1947 25-Mar Gisborne, NZ 7 EQ & possible landslide 10 1947 6-May Melanesia 7.6 EQ 6
1947 17-May NZ, Gisborne 7.2 EQ & possible landslide 6
1950 13-Mar N. NZ, Bay of Plenty 5.8 EQ 1 1952 4-Nov SE of Kamchatka 1 1960 22-May Corral, S. Chile 8.6 EQ 5.5 1964 28-Mar Gulf of Alaska, USA 8.4 EQ & Landslide 1.5 1970 28-Sep NZ 5.1 EQ 1 1976 14-Jan Kermadec 7.8 EQ 0.75 1977 22-Jun Tonga Trench 7.2 EQ 0.15 1981 25-May NZ, Macquarie Ridge 7.6 EQ 0.3 1982 19-Dec Kermadec 7.7 EQ 0.1 1986 October Kermadec <0.1 1986 7-May Andreanof Island, Alaska, USA 8.0 EQ 0.4 1987 20-May Doubtful Sound, NZ Landslide 3 1993 June Kermadec <0.1 1994 6-Oct Kuril Islands <0.1 1995 16-Jan Kobe, Honshu Island, Japan 6.8 EQ 0.1 1998 25-Mar Balleny Islands 0.2 1998 17-Jul Sissano Lagoon, Papua New Guinea 7 EQ 0.1-0.2 1999 26-Nov Vanuatu 7.5 EQ 0.05 2001 23-Jun Peru 8.4 EQ 0.55 2003 21-Aug S. Island, NZ Landslide 0.15 2004 26-Dec Indonesia 9.0 EQ 1.05
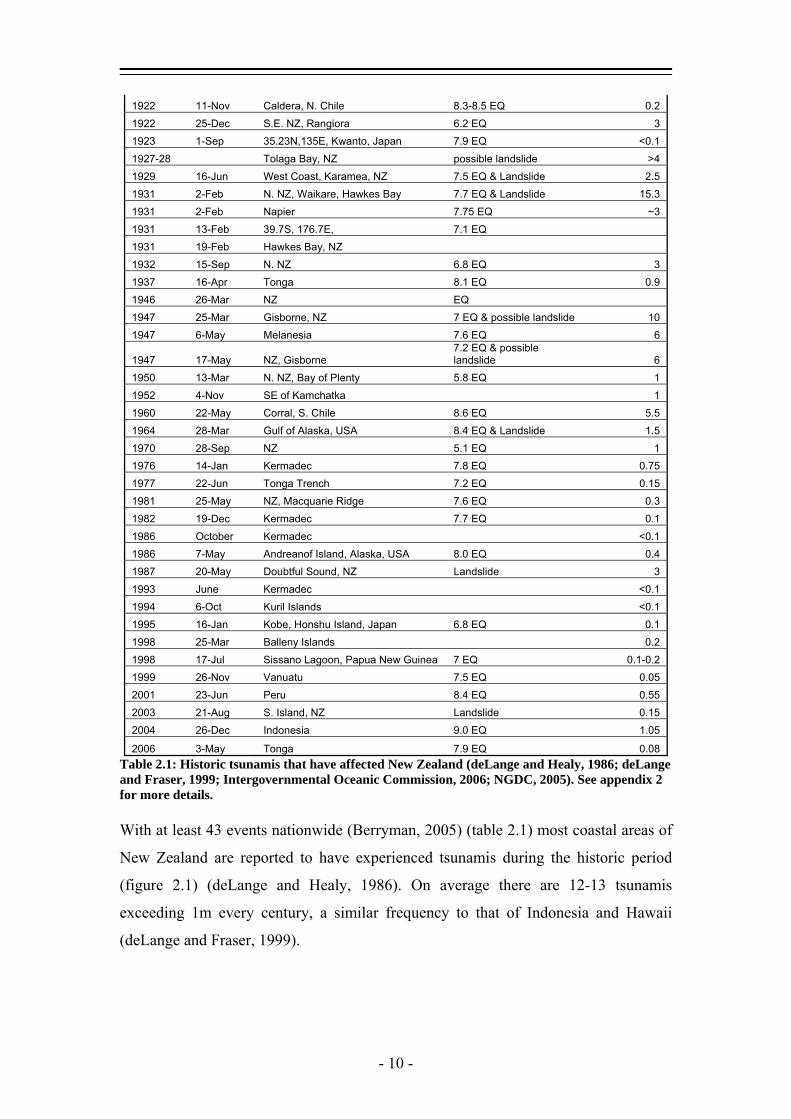
2006 3-May Tonga 7.9 EQ 0.08 Table 2.1: Historic tsunamis that have affected New Zealand (deLange and Healy, 1986; deLange and Fraser, 1999; Intergovernmental Oceanic Commission, 2006; NGDC, 2005). See appendix 2 for more details. With at least 43 events nationwide (Berryman, 2005) (table 2.1) most coastal areas of
New Zealand are reported to have experienced tsunamis during the historic period
(figure 2.1) (deLange and Healy, 1986). On average there are 12-13 tsunamis
exceeding 1m every century, a similar frequency to that of Indonesia and Hawaii
(deLange and Fraser, 1999).
- 10 -

Figure 2.1: New Zealand locations that have reported tsunamis between 1840 and 1982 (from deLange and Healy, 1986).
Sources for tsunamis that have affected New Zealand are distant, regional, and
local earthquakes, coastal landslides accompanying earthquakes, spontaneous
landslides, submarine landslides (Berryman, 2005) and from atmospheric coupling
after a volcanic eruption (deLange and Healy, 1986).
- 11 -
Earthquakes occurring anywhere in the pacific from Chile to the Aleutians can
generate tsunamis that could affect New Zealand (Ridgeway, 1984), although the
most significant source for distant source tsunamis is South America as was the case
in the 1868, 1877, and 1960 tsunamis (deLange and Healy, 1986, Berryman, 2005,
deLange and Fraser, 1999, deLange 2003, deLange, 1998). Locations that represent
either minimal or no risk to New Zealand are Hawaii, Papua New Guinea, the
Solomon Islands, Indonesia, the Philippines, islands of the South Pacific, Japan, the
Kurile Islands, Mexico and Kamchatka. This is because they are either unlikely to
produce tsunamis or the travel path is indirect and energy to produce a tsunami would
dissipate before arrival in New Zealand (deLange, 1998, Berryman, 2005). Sources
that pose indeterminate risk to New Zealand are the west coast of North America
(deLange, 1998), specifically the Cascadian margin (Berryman, 2005), and the
Alaska/Aleutians area (deLange, 2003). In the case of the Cascadian margin, it is
believed that the region ruptures with a magnitude 9.0 earthquake at approximately
800 year intervals. With the last Cascadian event occurring in 1700, before New
Zealand written records began, it is only possible to estimate the likely affects to New
Zealand using numerical modelling, which estimate wave heights of 2-3 meters
(Berryman, 2005). Distant source tsunamis have been generated from Alaska and the
Aleutians in 1946, 1957, and 1964. These tsunamis, however, do not reflect all
possible tsunami sources from this area (Berryman, 2005) nor do they provide enough
information to determine tsunami characteristics from this area (deLange, 2003).
Regional source tsunamis, which occur
with 1-3 hours of warning time, could be
generated from earthquakes, landslides, and
volcanic eruptions that occur in Tonga, the
Kermadecs, Southern New Hebrides, and south
of New Zealand (Berryman, 2005).
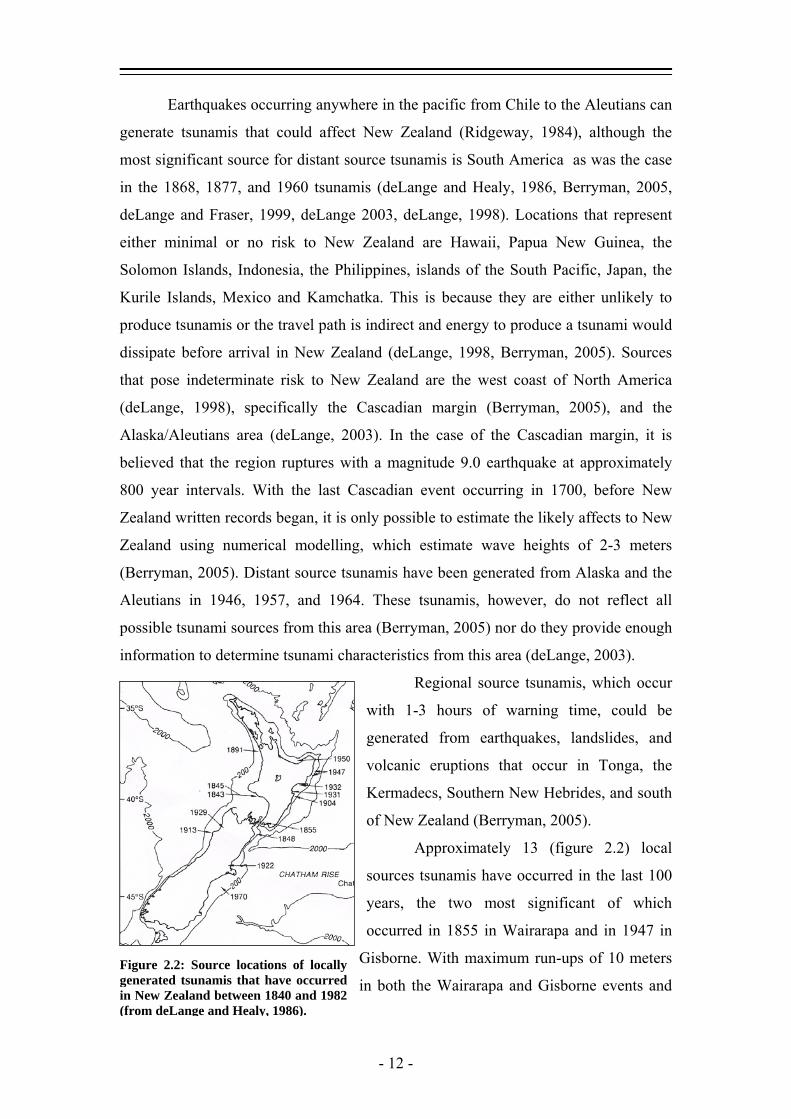
Approximately 13 (figure 2.2) local
sources tsunamis have occurred in the last 100
years, the two most significant of which
occurred in 1855 in Wairarapa and in 1947 in
Gisborne. With maximum run-ups of 10 meters
in both the Wairarapa and Gisborne events and Figure 2.2: Source locations of locallygenerated tsunamis that have occurredin New Zealand between 1840 and 1982(from deLange and Healy, 1986).
- 12 -
little warning time, tsunamis from local earthquakes pose a greater risk to a smaller
geographical area. Large earthquakes occur regularly in New Zealand because of the
large number of faults and the countries location on a plate boundary. Because of that
fact and exposure to both coastal and submarine landslides there is no location in New
Zealand that is completely free from local source tsunamis (Berryman, 2005).
Some locations in New Zealand are more at risk than others. The majority of
tsunamis have been reported from the east coast (figure 2.1) because the main sources
for distantly generated tsunamis are to the east of New Zealand (deLange, 2003 and
deLange and Healy, 1986), whereas tsunamis coming from the east are obstructed by
islands and a shallow sea (deLange, 1998). In addition, Banks Peninsula and Poverty
Bay experience amplifying effects. The Chatham rise is though to concentrate energy
thus increasing wave heights by 200-300% in the Banks Peninsula area (deLange,
1998).
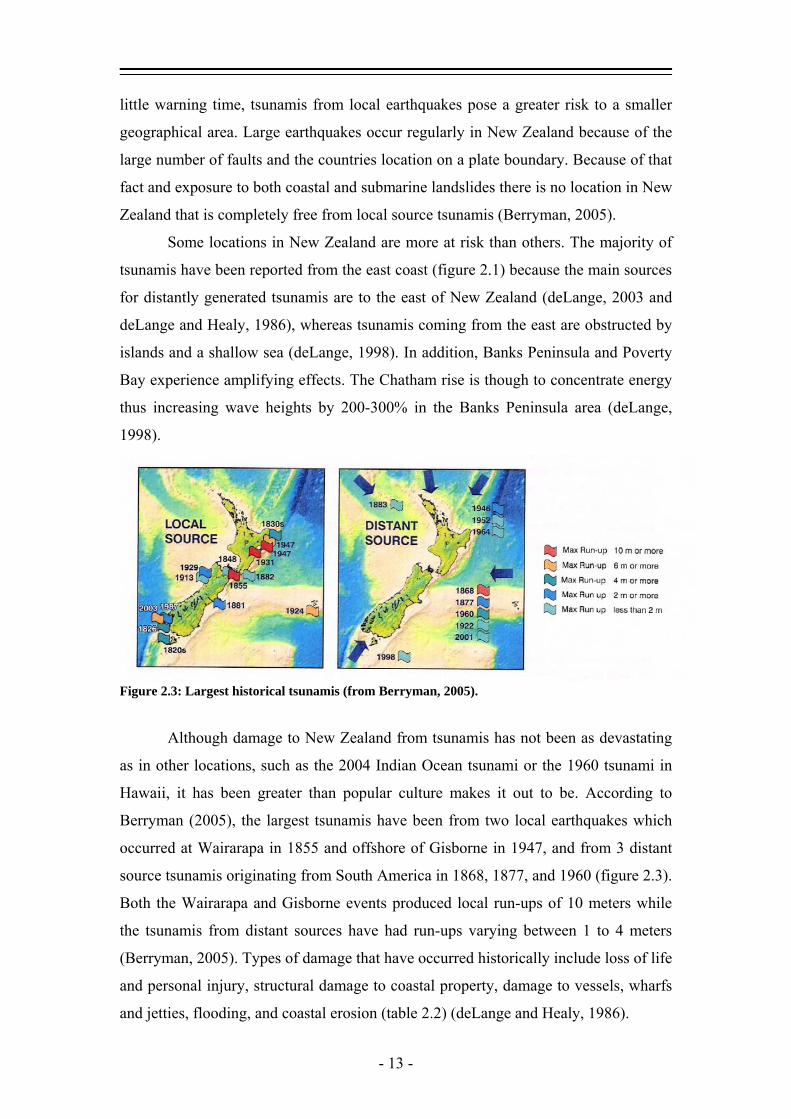
Figure 2.3: Largest historical tsunamis (from Berryman, 2005).
Although damage to New Zealand from tsunamis has not been as devastating
as in other locations, such as the 2004 Indian Ocean tsunami or the 1960 tsunami in
Hawaii, it has been greater than popular culture makes it out to be. According to
Berryman (2005), the largest tsunamis have been from two local earthquakes which
occurred at Wairarapa in 1855 and offshore of Gisborne in 1947, and from 3 distant
source tsunamis originating from South America in 1868, 1877, and 1960 (figure 2.3).
Both the Wairarapa and Gisborne events produced local run-ups of 10 meters while
the tsunamis from distant sources have had run-ups varying between 1 to 4 meters
(Berryman, 2005). Types of damage that have occurred historically include loss of life
and personal injury, structural damage to coastal property, damage to vessels, wharfs
and jetties, flooding, and coastal erosion (table 2.2) (deLange and Healy, 1986).
- 13 -

The hazards to New Zealand from
tsunamis is not as great as in other countries,
such as Japan and Chile, however, the
frequency of historic events indicates that the
return period is similar to that of other regions
which are considered to have problems with
tsunamis, such as Hawaii and Indonesia (Goff
and McFadgen, 2003). Tsunamis have
appened in the past and can be expected to
ccur in the future. All of the New Zealand
coast is at risk from this hazard (Ridgeway,
984; Berryman, 2005) and the potential for
damage is greater than the historical record
indicates.
Tsunami event A B C D E 1848 Oct. 15 1855 Jan. 23 1868 Aug. 13 1877 May 10 1883 Aug. 27 1913 Feb. 13 1922 Dec. 25 1929 June 16 1931 Feb. 2 1947 Mar. 26 1947 May 17 1952 Nov. 4 1960 May 22 1976 Jan. 14
h
o
1
Table 2.2: Tsunami damage from historical tsunamis. A) Loss of life or injury, B) Damage to shore base structures (docks, etc.), C) Damage to or loss of floating objects, D) Coastal Flooding, E) Geological (scouring, erosion) (from deLange and Healy 1986).
2.3 The Damage Potential The worldwide record of
tsunami occurrence goes back
thousands of years (Lander and
Lockridge, 1989; Bryant,
2001) during which time there
have been at least 20 tsunamis
where the death toll has been
greater than five thousand
(table 2.3) (Bryant, 2005;
Wikipedia, 2006). In the
Pacific alone there have been
almost 1490 historical
tsunamigenic events. Of these
at least 295 have caused
fatalities (Intergovernmental
Oceanic Commission, 1999).
Date Location Fatalities 2004 26 Dec Indian Ocean 229,000 1755 1 Nov Lisbon, Portugal 100,000 1908 Messina, Italy 70,000 1782 22 May South China Sea, Taiwan 50,000 1883 7 Aug Krakatau, Indonesia 36,417 1707 28 Oct Nankaido, Japan 30,000 1896 15 June Sanriku, Japan 27,122 1826 Japan 27,000 1498 20 Sept Nankaido, Japan 26,000 1868 12 Aug Arica, Chile 25,674 1293 27 May Sagami Bay, Japan 23,024 1976 4 Feb Guatemala 22,778 1746 29 Oct Lima, Peru 18,000 1917 12 Jan Bali, Indonesia 15,000 1792 21 May Unzen, Ariake Sea, Japan 14,524 1771 24 Apr Ryukyu Archipelago 13,486 1815 22 Nov Bali, Indonesia 10,253 1765 May Guanzhou, South China Sea 10,000 1976 16 Aug Moro Gulf, Philippines 8,000 1703 Tokaido-Kashima, Japan 5,233 1605 Nankaido, Japan 5,000
Table 2.3: Worldwide tsunamis with the highest death toll (Bryant, 2001; Bryant, 2005; Wikipedia, 2006).
- 14 -
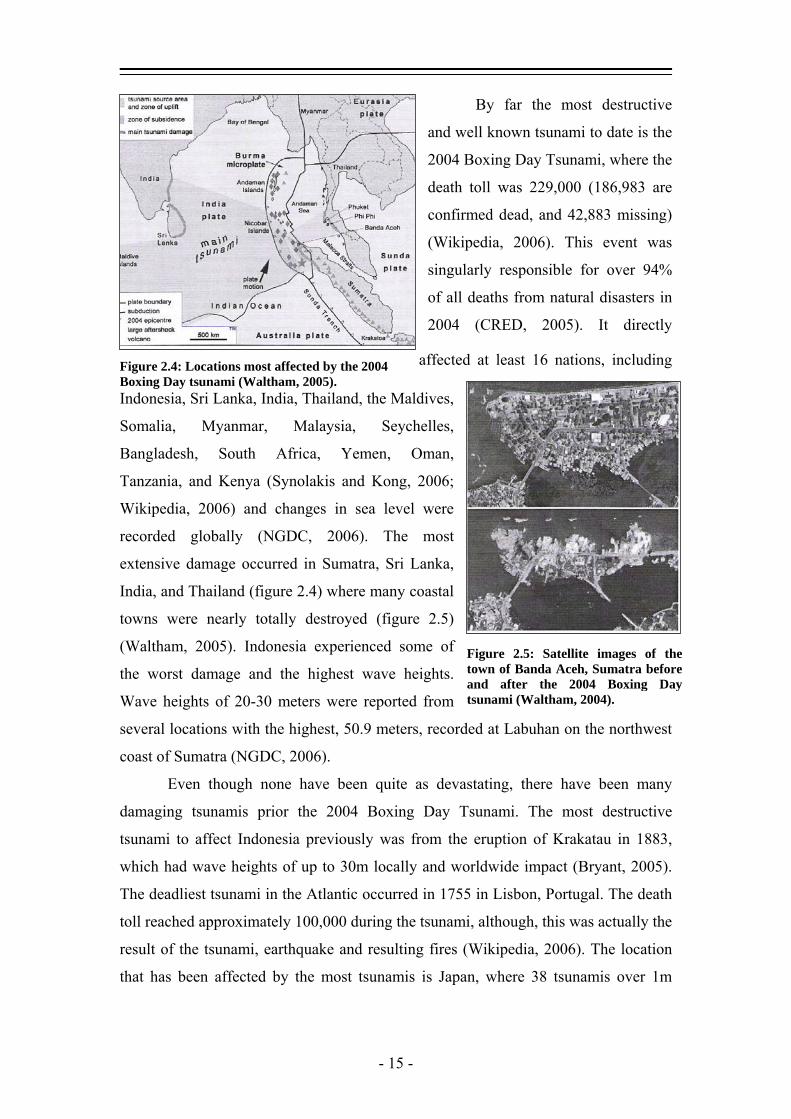
By far the most destructive
and well known tsunami to date is the
2004 Boxing Day Tsunami, where the
death toll was 229,000 (186,983 are
confirmed dead, and 42,883 missing)
(Wikipedia, 2006). This event was
singularly responsible for over 94%
of all deaths from natural disasters in
2004 (CRED, 2005). It directly
affected at least 16 nations, including
Indonesia, Sri Lanka, India, Thailand, the Maldives,
Somalia, Myanmar, Malaysia, Seychelles,
Bangladesh, South Africa, Yemen, Oman,
Tanzania, and Kenya (Synolakis and Kong, 2006;
Wikipedia, 2006) and changes in sea level were
recorded globally (NGDC, 2006). The most
extensive damage occurred in Sumatra, Sri Lanka,
India, and Thailand (figure 2.4) where many coastal
towns were nearly totally destroyed (figure 2.5)
(Waltham, 2005). Indonesia experienced some of
the worst damage and the highest wave heights.
Wave heights of 20-30 meters were reported from
several locations with the highest, 50.9 meters, recorded at Labuhan on the northwest
coast of Sumatra (NGDC, 2006).
Figure 2.4: Locations most affected by the 2004 Boxing Day tsunami (Waltham, 2005).
Figure 2.5: Satellite images of the town of Banda Aceh, Sumatra before and after the 2004 Boxing Day tsunami (Waltham, 2004).
Even though none have been quite as devastating, there have been many
damaging tsunamis prior the 2004 Boxing Day Tsunami. The most destructive
tsunami to affect Indonesia previously was from the eruption of Krakatau in 1883,
which had wave heights of up to 30m locally and worldwide impact (Bryant, 2005).
The deadliest tsunami in the Atlantic occurred in 1755 in Lisbon, Portugal. The death
toll reached approximately 100,000 during the tsunami, although, this was actually the
result of the tsunami, earthquake and resulting fires (Wikipedia, 2006). The location
that has been affected by the most tsunamis is Japan, where 38 tsunamis over 1m
- 15 -

occur each century (deLange and Fraser, 1999) and an estimated 211,300 deaths have
been attributed to tsunamis (Bryant, 2005).
Figure 2.6: National risk curves depicting deaths, injuries and cost (Berryman, 2005).
So the question is could a tsunami cause that kind of death and destruction in
New Zealand? In response to the 2004 Boxing Day tsunami the New Zealand
Ministry of Civil Defence commissioned two reports to determine just that. These
reports are Review of Tsunami Hazard and Risk in New Zealand, known as the
Science Report (Berryman, 2005) and Review of New Zealand’s preparedness
tsunami hazard, comparison to risk and recommendations for treatment, known
as the Preparedness Report (Webb, 2005). The Science Report deals with a New
Zealand’s vulnerability to tsunamis and provides a probabilistic hazard assessment
including casualty, injury, and cost estimates for major coastal urban areas and for the
nation as a whole (figure 2.6). Since a distant tsunami could affect more than one
location the national totals are aggregated for individual events and take into account
the relative tides. According to this report New Zealand would not suffer such
devastation. For a 500 year return period (probability of 1 in 500 of occurring in any
given year) median estimated deaths for the ten largest urban centres would total
approximately 5,500, though, this is most likely an overestimate because it assumes
no warning and occurrence at night when most people would be at home (Berryman,
2005). Estimated wave heights would also be less than what has been experienced
globally during catastrophic tsunamis. The greatest wave heights are expected to
occur in the Chatham Islands, Gisborne, Wellington, and Canterbury and do not
exceed 14m for a 2500 year return period (figure 2.7) (Berryman, 2005).
- 16 -
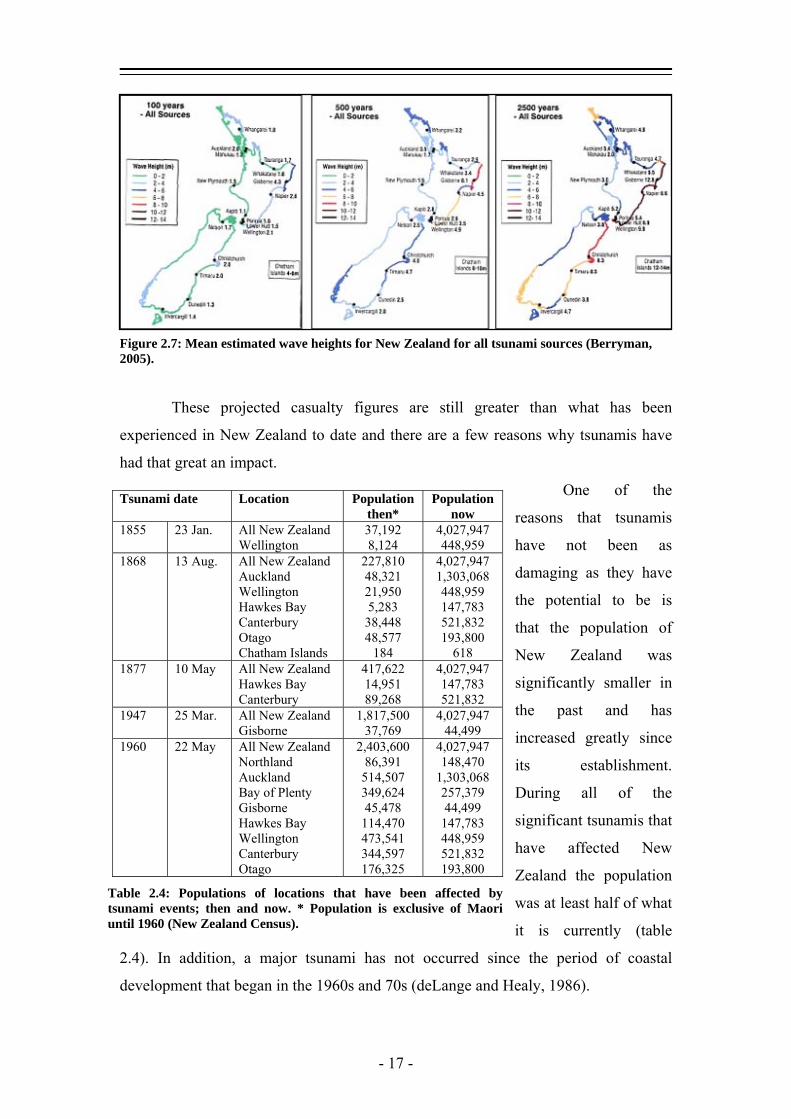
Figure 2.7: Mean estimated wave heights for New Zealand for all tsunami sources (Berryman, 2005).
These projected casualty figures are still greater than what has been
experienced in New Zealand to date and there are a few reasons why tsunamis have
had that great an impact.
One of the
reasons that tsunamis
have not been as
damaging as they have
the potential to be is
that the population of
New Zealand was
significantly smaller in
the past and has
increased greatly since
its establishment.
During all of the
significant tsunamis that
have affected New
Zealand the population
was at least half of what
it is currently (table
2.4). In addition, a major tsunami has not occurred since the period of coastal
development that began in the 1960s and 70s (deLange and Healy, 1986).
Tsunami date Location Population then*
Population now
1855 23 Jan. All New Zealand Wellington
37,192 8,124
4,027,947 448,959
1868 13 Aug. All New Zealand Auckland Wellington Hawkes Bay Canterbury Otago Chatham Islands
227,810 48,321 21,950 5,283 38,448 48,577
184
4,027,947 1,303,068 448,959 147,783 521,832 193,800
618 1877 10 May All New Zealand 417,622
14,951 89,268
4,027,947 Hawkes Bay Canterbury
147,783 521,832
1947 25 Mar. All New Zealand Gisborne
1,817,500 37,769
4,027,947 44,499
1960 22 May All New Zealand Northland Auckland Bay of Plenty Gisborne Hawkes Bay Wellington Canterbury Otago
2,403,600 86,391
514,507 349,624 45,478
114,470 473,541 344,597 176,325
4,027,947 148,470
1,303,068 257,379 44,499
147,783 448,959 521,832 193,800
Table 2.4: Populations of locations that have been affected by tsunami events; then and now. * Population is exclusive of Maori until 1960 (New Zealand Census).
- 17 -
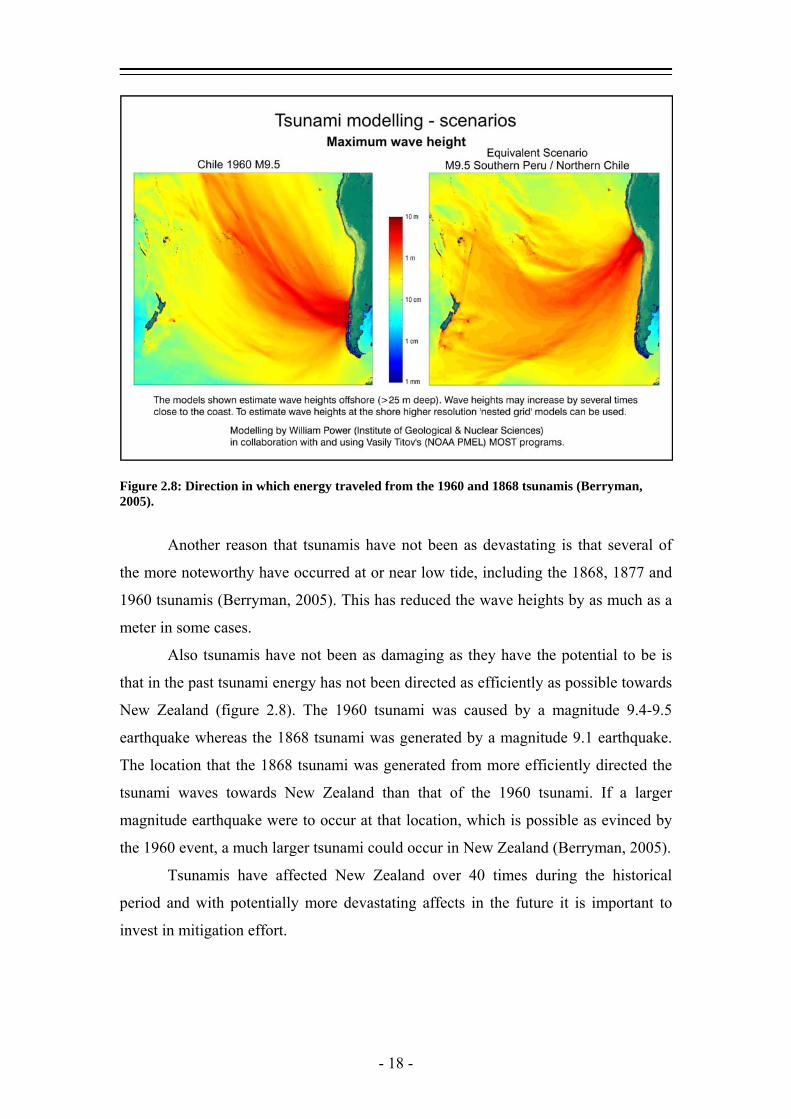
Figure 2.8: Direction in which energy traveled from the 1960 and 1868 tsunamis (Berryman, 2005).
Another reason that tsunamis have not been as devastating is that several of
the more noteworthy have occurred at or near low tide, including the 1868, 1877 and
1960 tsunamis (Berryman, 2005). This has reduced the wave heights by as much as a
meter in some cases.
Also tsunamis have not been as damaging as they have the potential to be is
that in the past tsunami energy has not been directed as efficiently as possible towards
New Zealand (figure 2.8). The 1960 tsunami was caused by a magnitude 9.4-9.5
earthquake whereas the 1868 tsunami was generated by a magnitude 9.1 earthquake.
The location that the 1868 tsunami was generated from more efficiently directed the
tsunami waves towards New Zealand than that of the 1960 tsunami. If a larger
magnitude earthquake were to occur at that location, which is possible as evinced by
the 1960 event, a much larger tsunami could occur in New Zealand (Berryman, 2005).
Tsunamis have affected New Zealand over 40 times during the historical
period and with potentially more devastating affects in the future it is important to
invest in mitigation effort.
- 18 -

2.4 Hazard Mitigation In response to the 1946
Alaskan tsunami the United
States established a tsunami
warning centre for the
Pacific Ocean. Initially set
up to issue warnings to the
United States and Hawaii,
the Pacific Tsunami
Warning Center (PTWC)
was expanded to include all
Pacific countries after the
1960 Chilean tsunami
(Bryant, 2005). PTWC
issues warning/watches
depending on the location
and magnitude of
earthquakes. Locations within three hours travel time of the epicentre are issued
tsunami warnings and areas within three to six hours are put on tsunami watch status
(Finnimore, 1999). For earthquakes with a Richter magnitude of 7.5 or greater
warnings/watches are issued to local, state, national, and international centres (Bryant,
2005; Webb, 2005).
Figure 2.9: Flowchart of the operational procedures of the National Warning System (from Webb, 2005).
New Zealand became a member of the PTWC in 1965 and the designated
recipient for communications from PTWC is the Ministry of Civil Defence and
Emergency Management (MCDEM) along with MetService and Airways
Corporation, to guarantee receipt (Webb, 2005). MCDEM used the National Warning
System to distribute national warning messages (figure 2.9). When a tsunami
watch/warning is received by MCDEM information is relayed to Regional Councils,
local Civil Defence and Emergency Management Groups, territorial authorities, the
Police and New Zealand Defence Force and other organizations responsible for
hazard mitigation (deLange and Fraser, 1999). It is then the responsibility of local
- 19 -
Civil Defence and Emergency Management Groups to respond to warnings and issue
further warnings and evacuations as they deem necessary (Webb, 2005).
Although the National Warning System is tested quarterly, with 90% of
recipients receiving warnings within 15 minutes (Finnimore, 1999), no distant source
tsunami has affected New Zealand since it joined the PTWC so it has yet to be seen
how effective the system really is (Bryant, 2005).
Since distant source tsunamis have a relatively long lead time for warnings
(~14 hours for tsunamis from South America), warning systems have time to
distribute messages and evacuate people, however, for local source tsunamis time is
not available. It is therefore extremely important to educate the public as a method of
hazard mitigation (Webb, 2005).
Also early warning systems are only part of an effective mitigation strategy
(Webb, 2005). Reactions of individuals to warning messages determine the overall
effectiveness of mitigation measures. People’s knowledge and perception of the
hazard and of the warning system play a great role in how they will react.
- 20 -
Chapter 3
Non-resident Survey
3.1 Introduction With a death toll of over 226,000 (Wikipedia, 2006; CRED, 2005), the Indian Ocean
Tsunami of 2004 brought the realization of just how devastating a tsunami could be.
This prompted the Ministry of Civil Defence to commission two reports from
Geological and Nuclear Sciences (GNS) to determine the level of preparedness and
the current state of knowledge on tsunamis for New Zealand (Webb, 2005). These
reports are the Science Report (Berryman, 2005) and the Preparedness Report (Webb,
2005). The scope of the reports, however, was limited due to time restrictions and did
not address the issue of non-resident summer populations and tourism concerns
(Berryman, 2005).
Summer populations are considerably higher than that of other seasons due to
the influx of visitors. Coastal holiday parks, which are an integral part of the New
Zealand tourism industry, place an increased proportion of the population in the
hazard zone. Tourists can be more vulnerable to hazards due to their unfamiliarity
with possible local disasters (Faulkner and Vikulov, 2001), warning systems, and
evacuation procedures. Surveying was undertaken during the peak summer months to
ascertain tourist perceptions and knowledge of the tsunami hazard.
3.2 Methodology Location Altitude (m)
Distance to shore (km)
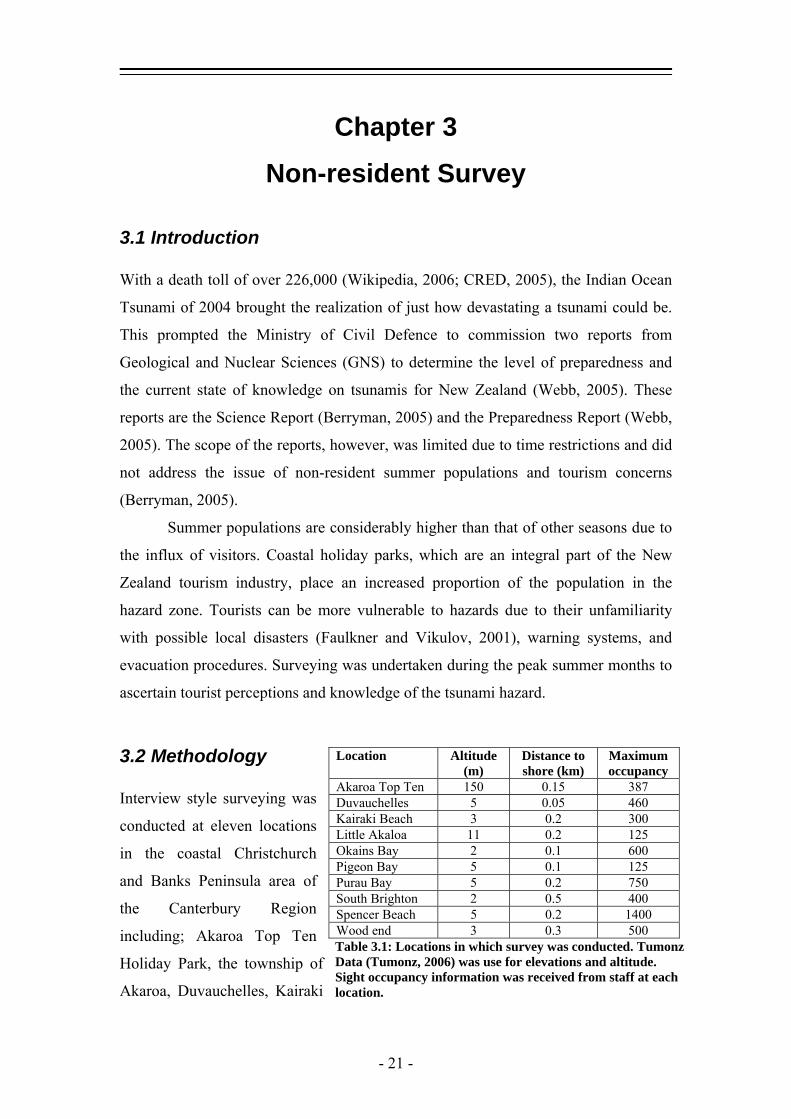
Interview style surveying was
conducted at eleven locations
in the coastal Christchurch
and Banks Peninsula area of
the Canterbury Region
including; Akaroa Top Ten
Holiday Park, the township of
Akaroa, Duvauchelles, Kairaki
Maximum occupancy
Akaroa Top Ten 150 0.15 387 Duvauchelles 5 0.05 460 Kairaki Beach 3 0.2 300 Little Akaloa 11 0.2 125 Okains Bay 2 0.1 600 Pigeon Bay 5 0.1 125 Purau Bay 5 0.2 750 South Brighton 2 0.5 400 Spencer Beach 5 0.2 1400 Wood end 3 0.3 500 Table 3.1: Locations in which survey was conducted. Tumonz Data (Tumonz, 2006) was use for elevations and altitude. Sight occupancy information was received from staff at each location.
- 21 -
Beach Camping Ground, Little Akaloa, Okains Bay, Pigeon Bay, Purau Bay Holiday
Park, South Brighton Motor Camp, Spencer Beach Holiday Park, and Wood end
Beach Holiday Park (table 3.1, figure 3.1). All locations, except Akaroa Top Ten are
located in the likely tsunami inundation zone, which is 1 km from the shore and under
35m in elevation.
A total of 211 interviews were conducted between December 23rd, 2005 and
January 31st, 2006, during the peak holiday occupancy period. The survey questions
were based on the National Coastal Survey conducted by Geological and Nuclear
Sciences (GNS) in 2003 (Johnston et al, 2003). The questionnaire was composed of
scaled, open, and closed ended questions and the main themes included:
Knowledge of risk: This included questions on the likely hazards for the area, when
the last tsunamis occurred, and when the participant believed a future tsunami could
occur.
Preparation and warnings: Visitors were asked a range of questions about where
tsunamis originated, whether they had heard, received, or sought information about
tsunamis, who issued tsunamis warnings, what some natural signs of tsunamis were,
and what the components of the tsunami warning system are.
During a tsunami: Participants answered on what they would do during both a local
and distant source tsunami, how much time they would have to move to safety, and
what they would expect from the holiday park staff/owners in the event of a tsunami.
Changes since the 2004 Boxing Day tsunamis: Participants were asked whether
they knew what a tsunami was prior to the Boxing Day tsunami of 2004 and how they
had been affected from the tsunami.
Survey data was analysed with SPSS statistical software. In order to simplify
the results, answers to open ended questions were categorized and have been reported
by those categories. The full answers and any answers reported in the “other”
category are located in Appendix 3.
- 22 -
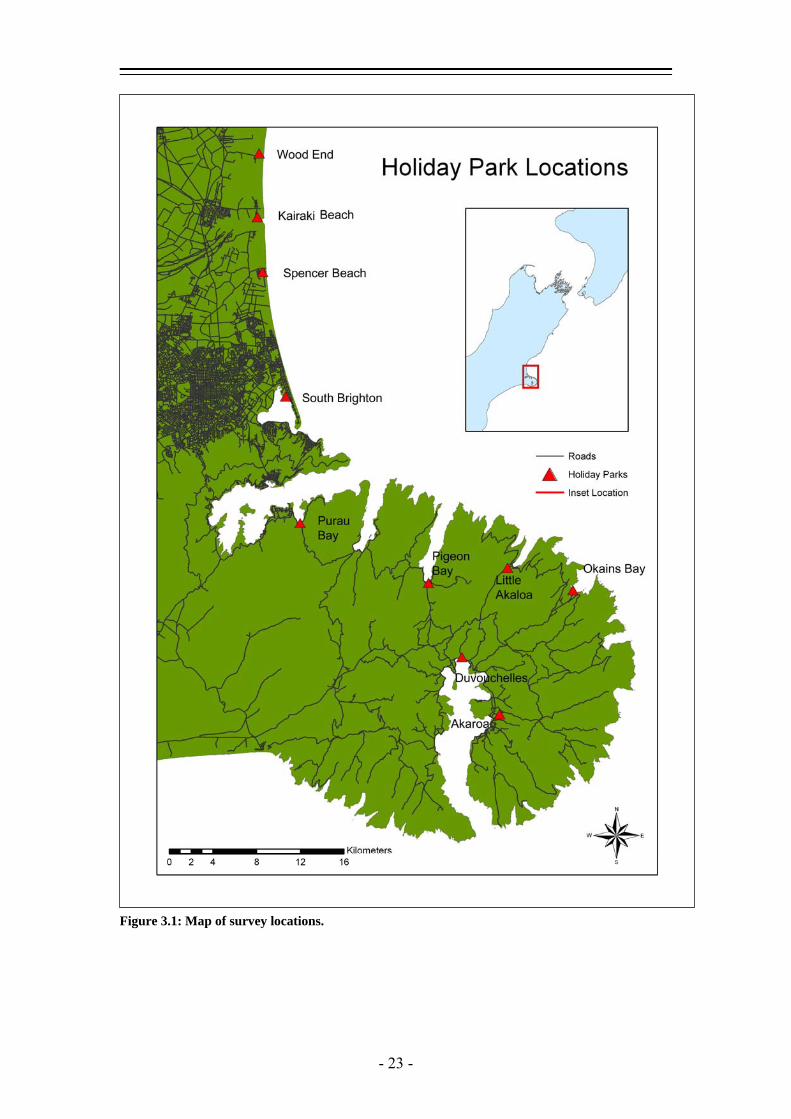
Figure 3.1: Map of survey locations.
- 23 -

3.3 Results
1 Are you an overnight camping visitor, camping visitor for an extended period (camping for more than 2 weeks), a day visitor, or an employee?
total n= 211 n % Camping Visitor 149 70.6 Extended Camping Visitor 35 16.6 Day Visitor 14 6.6 Permanent Resident 7 3.3 Employee 6 2.8
3.3.1 Personal Information
The highest percentage of participants was camping visitors whose stays were
less than two weeks in length.
2 How many days per year on average do you visit? average standard deviation Camping Visitor 5.7 3.3 Extended Camping Visitor 35.1 44.0 Day Visitor 1 - Permanent Resident 365 - Employee -
- All visitors 22.32 65.5
Average number of days per year was greater for campers who were staying
for an extended period although the mean average, 35.1 days, was two times higher
than the median, which was only 15 days. This was from a few individuals who spent
the entire summer season or several months of the year at the holiday park.
- 24 -
3 How many years have you been visiting? (avg.)
average standard deviation Camping visitors 8.20 10.7 Extended camping visitors 11 9.7 Day visitors - - Permanent resident 3.83 2.5 Employee - - All 8.14 10.6
There was no significant variation between camping visitors, extended stay
campers, and permanent residents in numbers of years visiting the location.
4 Are you from the Canterbury Region, New Zealand, or abroad? total n= 211 n % Canterbury Region 195 92.4 New Zealand 11 5.2 Abroad 5 2.4
By far the highest percentage of respondents was from the Canterbury region.
This is not surprising since the majority of participants were on holiday for less than
two weeks.
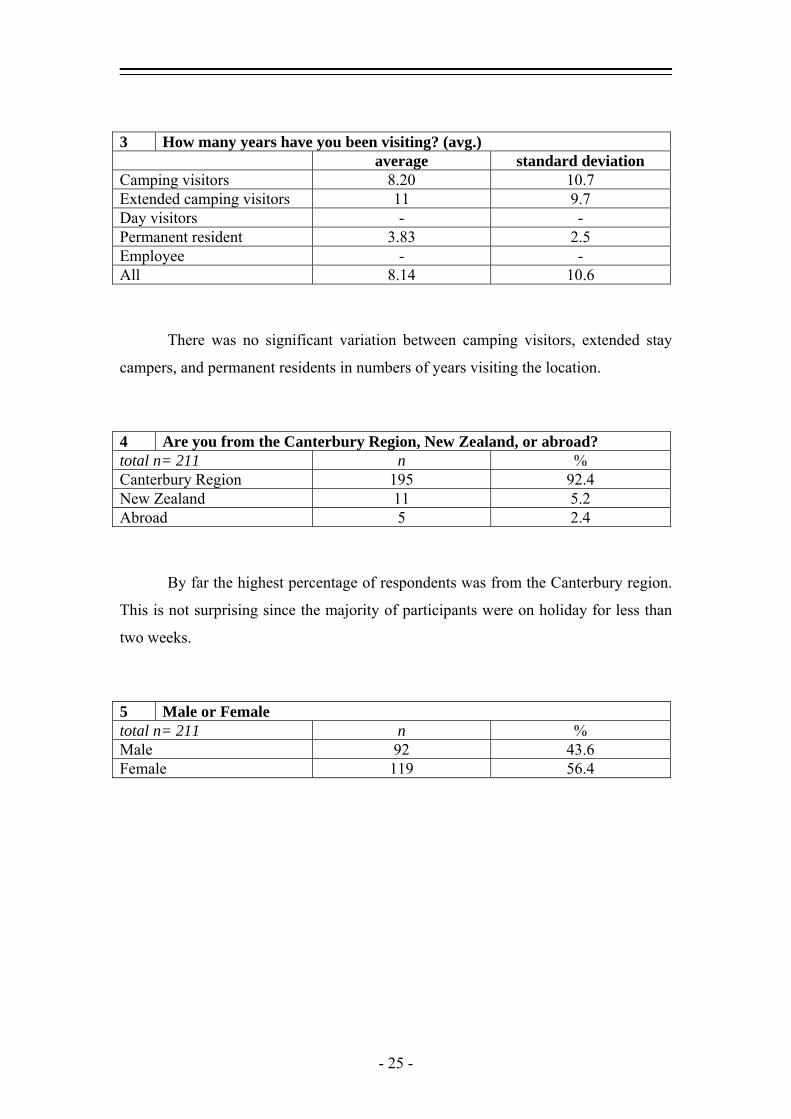
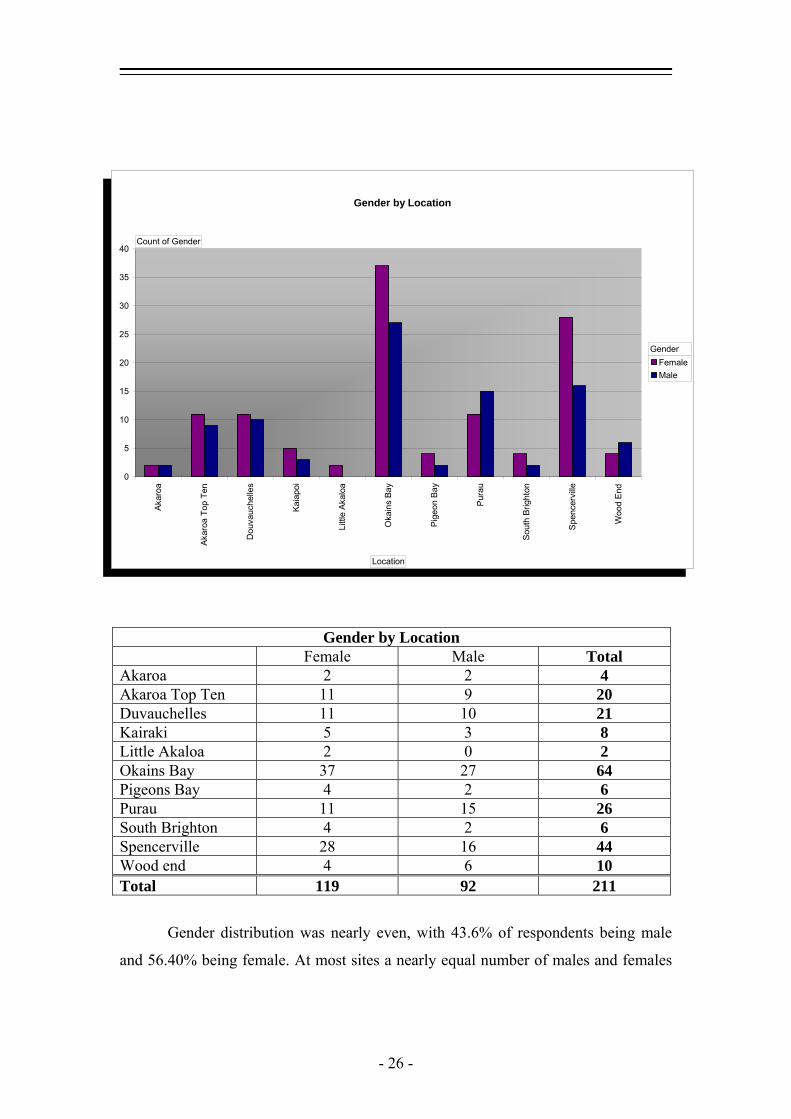
5 Male or Female total n= 211 n % Male 92 43.6 Female 119 56.4
- 25 -
Gender by Location
0
5
10
15
20
25
30
35
40
Akar
oa
Akar
oa T
op T
en
Dou
vauc
helle
s
Kaia
poi
Littl
e Ak
aloa
Oka
ins
Bay
Pige
on B
ay
Pura
u
Sout
h Br
ight
on
Spen
cerv
ille
Woo
d En
d
FemaleMale
Count of Gender
Location
Gender
Gender by Location
0
5
10
15
20
25
30
35
40
Akar
oa
Akar
oa T
op T
en
Dou
vauc
helle
s
Kaia
poi
Littl
e Ak
aloa
Oka
ins
Bay
Pige
on B
ay
Pura
u
Sout
h Br
ight
on
Spen
cerv
ille
Woo
d En
d
FemaleMale
Count of Gender
Location
Gender
Gender by Location
Fe ale Total male MAkaroa 2 2 4 Akaroa Top Ten 11 9 20 Duvauchelles 11 10 21 Kairaki 5 3 8 Little Akaloa 2 0 2 Okains Bay 37 27 64 Pigeons Bay 4 2 6 Purau 11 15 26 South Brighton 4 2 6 Spencerville 28 16 44 Wood end 4 6 10 Total 1 19 92 211
ender distribution was nearly even, with 43.6% of respondents being male
and 56
G
.40% being female. At most sites a nearly equal number of males and females
- 26 -

were surveyed, with the exceptions of Okains Bay and Spencerville Beach Park, were
far more females were interviewed.
6 Age Group total n= 211 n % 18-20 8 3.8 20s-30s 10 4.7 30s-40s 51 24.2 40s-50s 65
Age Group by Location
20
25
0
5
10
15
Akar
oa
Akar
oa T
op T
en
Dou
vauc
helle
s
Kaia
poi
Littl
e Ak
aloa
Oka
ins
Bay
Pige
on B
ay
Pura
u
Sout
h Br
ight
on
Spen
cerv
ille
Woo
d En
d
18-2020s-30s30s-40s40s-50s50+
Count of Age
Location
Age
Age Group by Location
20
25
0
5
10
15
Akar
oa
Akar
oa T
op T
en
Dou
vauc
helle
s
Kaia
poi
Littl
e Ak
aloa
Oka
ins
Bay
Pige
on B
ay
Pura
u
Sout
h Br
ight
on
Spen
cerv
ille
Woo
d En
d
18-2020s-30s30s-40s40s-50s50+
Count of Age
Location
Age
30.8 50s-60s 77 36.5
Age Group by Location 18-20 20s-30s 30s-40s 40s-50s 50+ Total Akaroa 0 0 2 1 1 4 Akaroa Top Ten 0 3 6 5 6 20 Duvauchelles 0 2 3 4 12 21 Kairaki 0 0 1 0 7 8 Little Akaloa 0 0 0 1 1 2 Okains Bay 6 2 13 22 21 64 Pigeons Bay 0 0 1 4 1 6 Purau 2 1 8 8 7 26 South Brighton 0 1 2 1 2 6 Spencerville 0 0 13 15 16 44 Wood End 0 0 3 3 4 10 Total 8 9 52 65 77 211
- 27 -
Over two thirds of respondent were over 40 years of age. This may reflect the
time of day in which surveying was done, between 9 am and 5 pm, when many of the
people visiting campgrounds, especially the younger ones, are away doing other
activities. This also may be due to the familial nature of the camping excursion, with
many of the participants having children too young to participate in the survey. More
persons between the ages of 18 to 30 were present during New Years Eve (when all of
the campsites were at maximum capacity), however, most declined to participate.
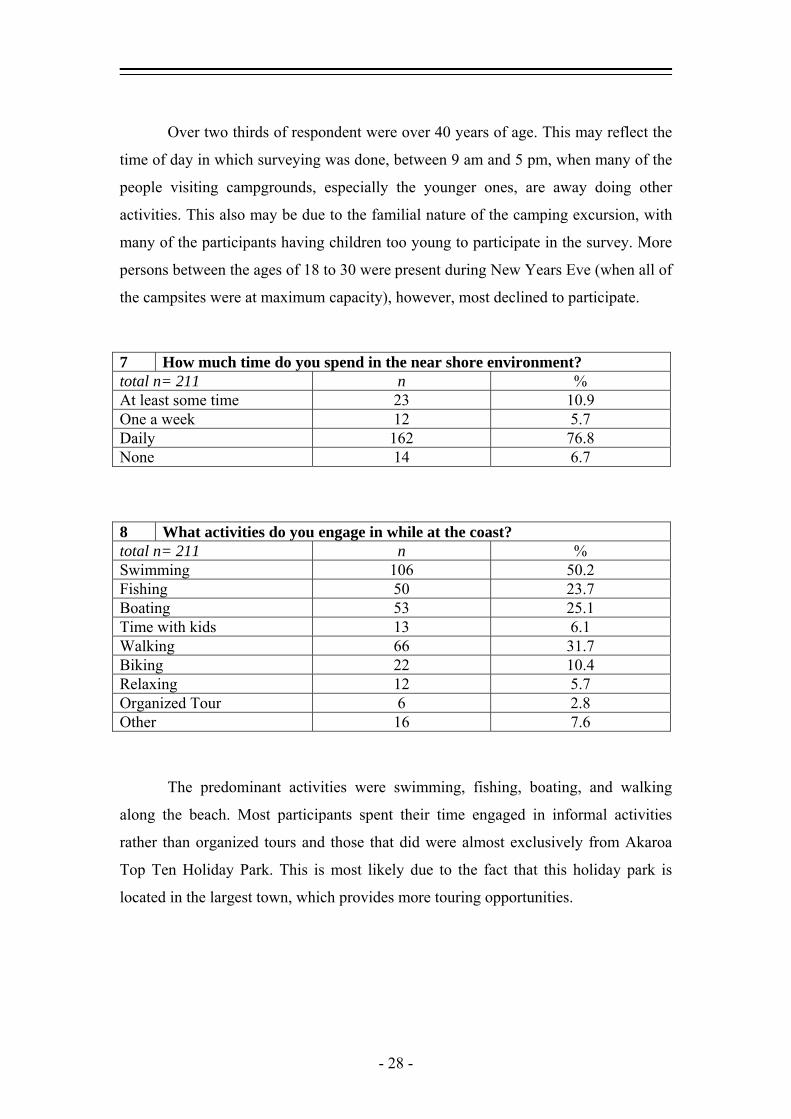
7 How much time do you spend in the near shore environment? total n= 211 n % At least some time 23 10.9 One a week 12 5.7 Daily 162 76.8 None 14 6.7
8 What activities do you engage in while at the coast? total n= 211 n % Swimming 106 50.2 Fishing 50 23.7 Boating 53 25.1 Time with kids 13 6.1 Walking 66 31.7 Biking 22 10.4 Relaxing 12 5.7 Organized Tour 6 2.8 Other 16 7.6
The predominant activities were swimming, fishing, boating, and walking
along the beach. Most participants spent their time engaged in informal activities
rather than organized tours and those that did were almost exclusively from Akaroa
Top Ten Holiday Park. This is most likely due to the fact that this holiday park is
located in the largest town, which provides more touring opportunities.
- 28 -
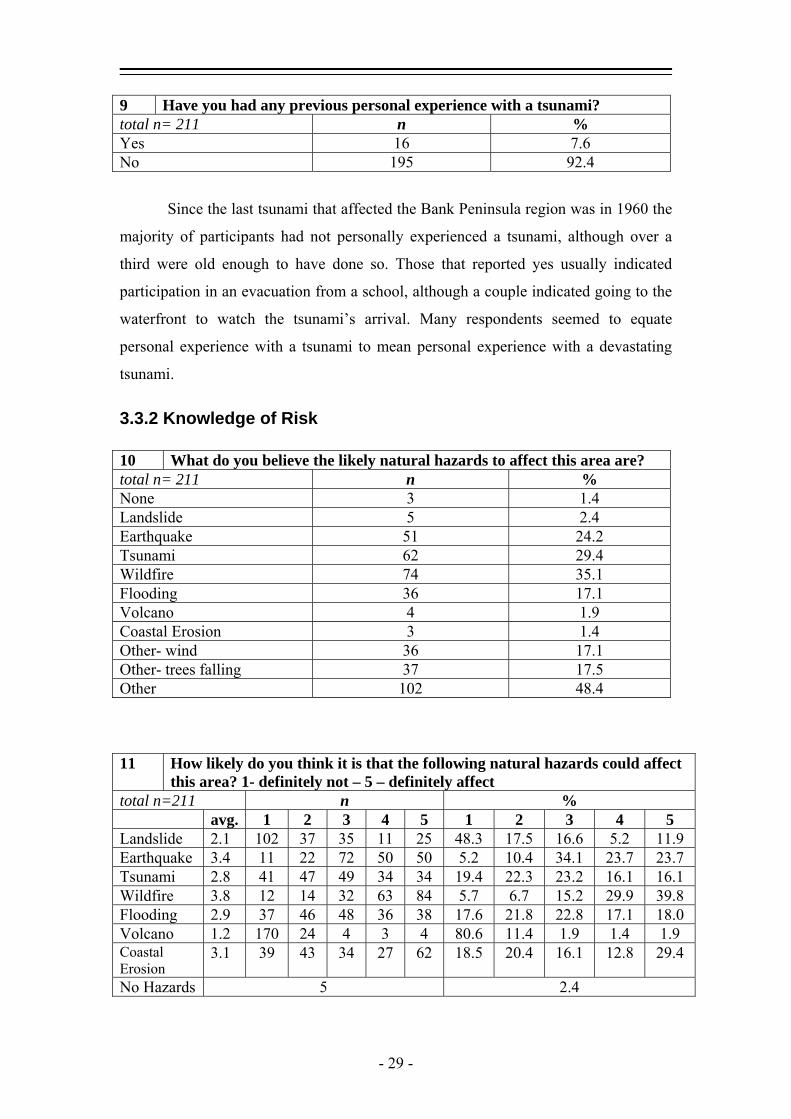
9 Have you had any previous personal experience with a tsunami? total n= 211 n % Yes 16 7.6 No 195 92.4
Since the last tsunami that affected the Bank Peninsula region was in 1960 the
majority of participants had not personally experienced a tsunami, although over a
third were old enough to have done so. Those that reported yes usually indicated
participation in an evacuation from a school, although a couple indicated going to the
waterfront to watch the tsunami’s arrival. Many respondents seemed to equate
personal experience with a tsunami to mean personal experience with a devastating
tsunami.
3.3.2 Knowledge of Risk 10 What do you believe the likely natural hazards to affect this area are? total n= 211 n % None 3 1.4 Landslide 5 2.4 Earthquake 51 24.2 Tsunami 62 29.4 Wildfire 74 35.1 Flooding 36 17.1 Volcano 4 1.9 Coastal Erosion 3 1.4 Other- wind 36 17.1 Other- trees falling 37 17.5 Other 102 48.4 11 How likely do you think it is that the following natural hazards could affect
this area? 1- definitely not – 5 – definitely affect total n=211 n %
avg. 1 2 3 4 5 1 2 3 4 5 Landslide 2.1 102 37 35 11 25 48.3 17.5 16.6 5.2 11.9 Earthquake 3.4 11 22 72 50 50 5.2 10.4 34.1 23.7 23.7 Tsunami 2.8 41 47 49 34 34 19.4 22.3 23.2 16.1 16.1 Wildfire 3.8 12 14 32 63 84 5.7 6.7 15.2 29.9 39.8 Flooding 2.9 37 46 48 36 38 17.6 21.8 22.8 17.1 18.0 Volcano 1.2 170 24 4 3 4 80.6 11.4 1.9 1.4 1.9 Coastal Erosion
3.1 39 43 34 27 62 18.5 20.4 16.1 12.8 29.4
No Hazards 5 2.4
- 29 -
For the Canterbury region, the hazards that were believed to be the most
predominant were earthquakes and wildfires, with tsunamis, landslides, and flooding
believed to be of moderate threat and volcanoes though to be not a problem. Most
people were aware that Banks Peninsula was of volcanic origin but was extinct. The
perceived hazards varied for individual campsite locations.
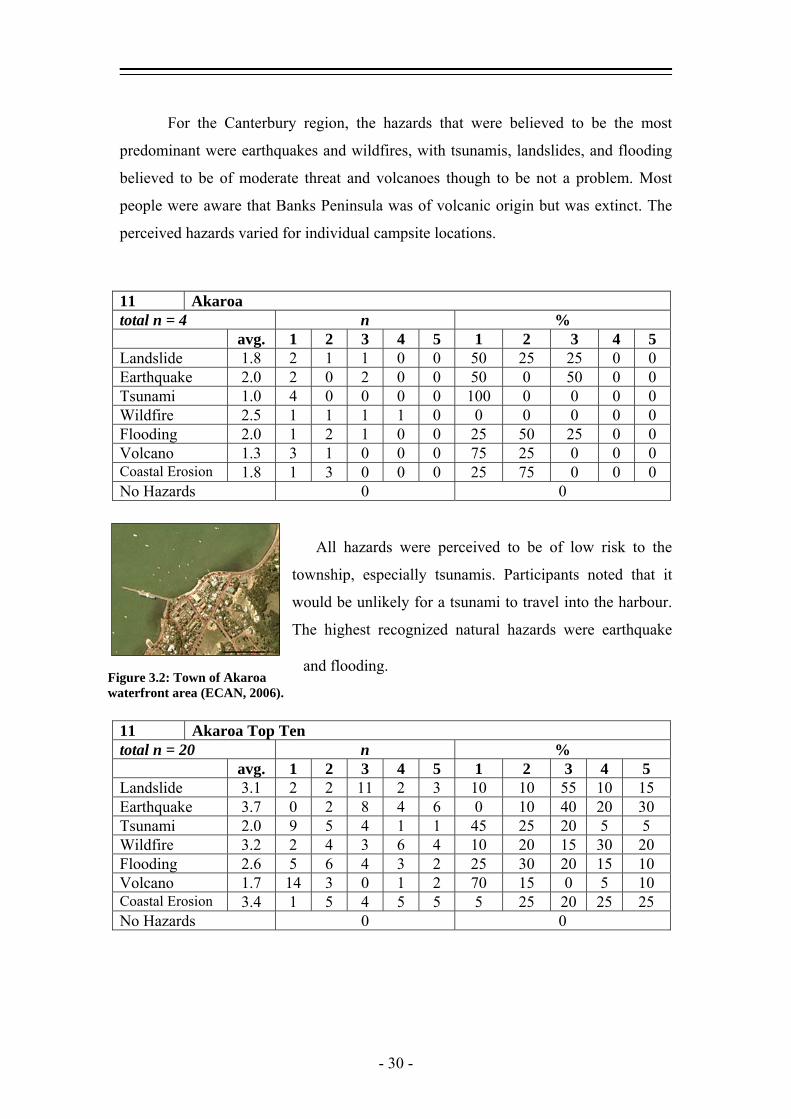
11 Akaroa total n = 4 n %
avg. 1 2 3 4 5 1 2 3 4 5 Landslide 1.8 2 1 1 0 0 50 25 25 0 0 Earthquake 2.0 2 0 2 0 0 50 0 50 0 0 Tsunami 1.0 4 0 0 0 0 100 0 0 0 0 Wildfire 2.5 1 1 1 1 0 0 0 0 0 0 Flooding 2.0 1 2 1 0 0 25 50 25 0 0 Volcano 1.3 3 1 0 0 0 75 25 0 0 0 Coastal Erosion 1.8 1 3 0 0 0 25 75 0 0
0 No Hazards 0 0
All hazards were perceived to be of low risk to the
township, especially tsunamis. Participants noted that it
would be unlikely for a tsunami to travel into the harbour.
The highest recognized natural hazards were earthquake
and flooding.
11 Akaroa Top Ten total n = 20 n %
avg. 1 2 3 4 5 1 2 3 4 5 Landslide 3.1 2 2 11 2 3 10 10 55 10 15 Earthquake 3.7 0 2 8 4 6 0 10 40 20 30 Tsunami 2.0 9 5 4 1 1 45 25 20 5 5 Wildfire 3.2 2 4 3 6 4 10 20 15 30 20 Flooding 2.6 5 6 4 3 2 25 30 20 15 10 Volcano 1.7 14 3 0 1 2 70 15 0 5 10 Coastal Erosion 3.4 1 5 4 5 5 5 25 20 25 25 No Hazards 0 0
Figure 3.2: Town of Akaroa waterfront area (ECAN, 2006).
- 30 -

The greatest perceived natural hazards at
this location were from earthquakes and coastal
erosion and the lowest were from volcanoes and
tsunamis. Akaroa Top Ten Holiday Park is located
on a hill approximately 150 meters above sea
level, which limits the likelihood of tsunamis to
extreme events such as those caused by bolide
impact or very large landslides.
11 Duvauchelles total n = 21 n %
avg. 1 2 3 4 5 1 2 3 4 5 Landslide 1.8 7 8 2 1 1 33.3 38.1 9.5 4.8 4.8 Earthquake 3.4 1 2 5 4 7 4.8 9.5 23.8 19.0 33.3 Tsunami 2.1 7 7 2 3 1 33.3 33.3 9.5 14.3 4.8 Wildfire 3.1 2 2 5 5 5 9.5 9.5 23.8 23.8 23.8 Flooding 2.8 4 3 4 3 5 19.0 14.3 19.0 14.3 23.8 Volcano 1.2 16 2 0 0 1 76.2 9.5 0.0 0.0 4.8 Coastal Erosion 3.2 3 2 5 0 9 14.3 9.5 23.8 0.0 42.9 No Hazards 1 4.8
People recognized that volcanoes were
improbable, but landslides were also indicated to be
unlikely, though the hilly nature of the peninsula
makes landslides a feasible hazard. Earthquake was
indicated as the highest possible event. Tsunamis
were though to be of minor consideration, which is
reasonable since the site is located far inside the
harbour and not directly exposed to the open ocean.
Figure 3.3: Akaroa Top Ten Holiday Park (ECAN, 2006).
Figure 3.4: Duvauchelles Holiday Park (ECAN, 2006).
- 31 -
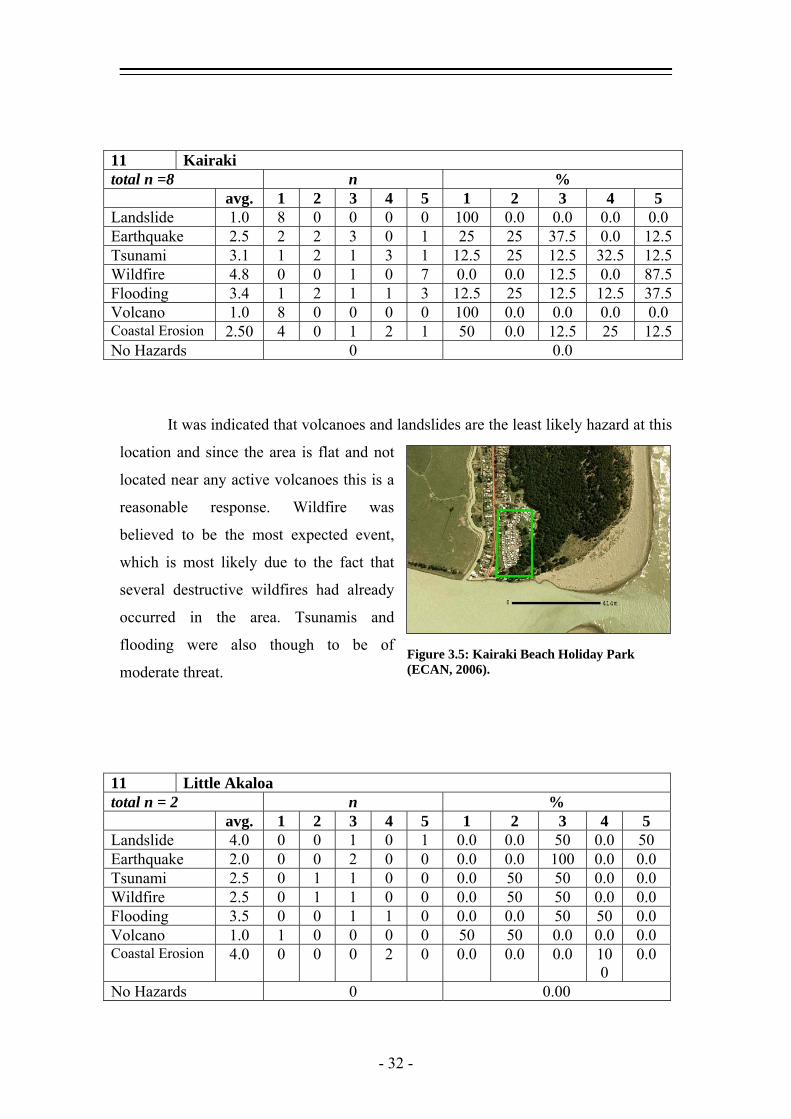
11 Kairaki total n =8 n %
avg. 1 2 3 4 5 1 2 3 4 5 Landslide 1.0 8 0 0 0 0 100 0.0 0.0 0.0 0.0 Earthquake 2.5 2 2 3 0 1 25 25 37.5 0.0 12.5 Tsunami 3.1 1 2 1 3 1 12.5 25 12.5 32.5 12.5 Wildfire 4.8 0 0 1 0 7 0.0 0.0 12.5 0.0 87.5 Flooding 3.4 1 2 1 1 3 12.5 25 12.5 12.5 37.5 Volcano 1.0 8 0 0 0 0 100 0.0 0.0 0.0 0.0 Coastal Erosion 2.50 4 0 1 2 1 50 0.0 12.5 25 12.5 No Hazards 0 0.0
It was indicated that volcanoes and landslides are the least likely hazard at this
location and since the area is flat and not
located near any active volcanoes this is a
reasonable response. Wildfire was
believed to be the most expected event,
which is most likely due to the fact that
several destructive wildfires had already
occurred in the area. Tsunamis and
flooding were also though to be of
moderate threat. Figure 3.5: Kairaki Beach Holiday Park (ECAN, 2006).
11 Little Akaloa total n = 2 n %
avg. 1 2 3 4 5 1 2 3 4 5 Landslide 4.0 0 0 1 0 1 0.0 0.0 50 0.0 50 Earthquake 2.0 0 0 2 0 0 0.0 0.0 100 0.0 0.0 Tsunami 2.5 0 1 1 0 0 0.0 50 50 0.0 0.0 Wildfire 2.5 0 1 1 0 0 0.0 50 50 0.0 0.0 Flooding 3.5 0 0 1 1 0 0.0 0.0 50 50 0.0 Volcano 1.0 1 0 0 0 0 50 50 0.0 0.0 0.0 Coastal Erosion 4.0 0 0 0 2 0 0.0 0.0 0.0 10
0 0.0
No Hazards 0 0.00
- 32 -

This campsite was occupied primarily
in the period between Christmas and New
Years. Being a very small campsite there
were only a few people available to survey.
The perceived hazards, therefore, only
reflects the opinions of two people and may
not be accurate. The highest perceived
hazard was landslide and coastal erosion.
Landslides are highly likely since the
campsite is located in a narrow valley. Tsunamis were thought to be of minor
importance probably because the campsite is not located within direct viewing of the
ocean, though a tsunami could easily travel the distance to the site.
11 Okains Bay total n = 64 n %
avg.
1 2 3 4 5 1 2 3 4 5
Landslide 2.1 26 17 8 7 5 40.6 26.6 12.5 10.9 7.8 Earthquake 3.4 2 8 23 20 10 3.1 12.5 35.9 31.3 15.6 Tsunami 3.0 8 17 13 13 12 12.5 26.6 20.3 30.3 18.8 Wildfire 4.0 3 2 6 31 21 4.7 3.1 9.4 48.4 32.8 Flooding 3.7 9 5 30 17 12 14.1 7.8 46.9 26.6 18.8 Volcano 1.3 52 6 3 1 1 81.3 9.4 4.7 1.6 1.6 Coastal Erosion 3.0 12 18 8 7 18 18.8 28.1 12.5 10.9 28.1 No Hazards 1 1.6
Wildfire and flooding were though
to be the most significant threat at this
location. There had been minor flooding of
tent sites located along the estuary and
several wildfires in the Canterbury Region
at the time of surveying. Earthquake and
tsunamis were considered a moderate
problem.
Figure 3.6: Little Akaloa campground (ECAN, 2006).
Figure 3.7: Okains Bay Forest Reserve (ECAN, 2006).
- 33 -
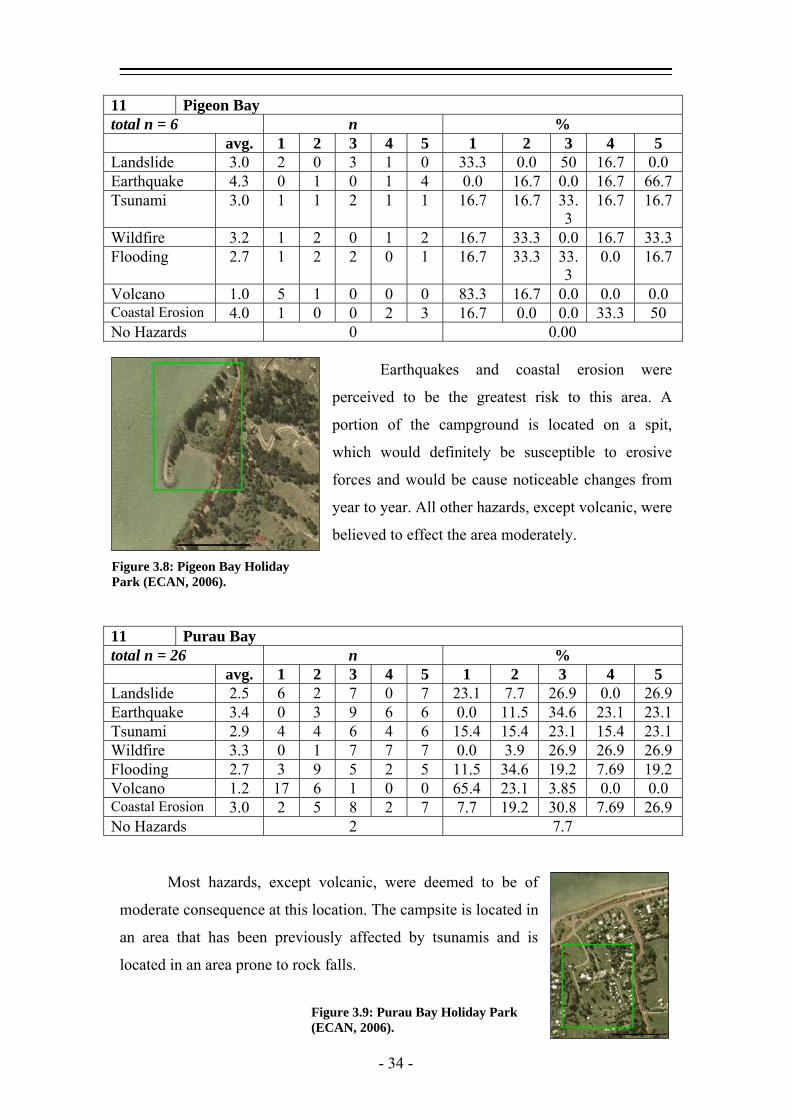
11 Pigeon Bay total n = 6 n %
avg. 1 2 3 4 5 1 2 3 4 5 Landslide 3.0 2 0 3 1 0 33.3 0.0 50 16.7 0.0 Earthquake 4.3 0 1 0 1 4 0.0 16.7 0.0 16.7 66.7 Tsunami 3.0 1 1 2 1 1 16.7 16.7 33.
3 16.7 16.7
Wildfire 3.2 1 2 0 1 2 16.7 33.3 0.0 16.7 33.3 Flooding 2.7 1 2 2 0 1 16.7 33.3 33.
3 0.0 16.7
Volcano 1.0 5 1 0 0 0 83.3 16.7 0.0 0.0 0.0 Coastal Erosion 4.0 1 0 0 2 3 16.7 0.0 0.0 33.3 50 No Hazards 0 0.00
Earthquakes and coastal erosion were
perceived to be the greatest risk to this area. A
portion of the campground is located on a spit,
which would definitely be susceptible to erosive
forces and would be cause noticeable changes from
year to year. All other hazards, except volcanic, were
believed to effect the area moderately.
11 Purau Bay total n = 26 n %
avg. 1 2 3 4 5 1 2 3 4 5 Landslide 2.5 6 2 7 0 7 23.1 7.7 26.9 0.0 26.9 Earthquake 3.4 0 3 9 6 6 0.0 11.5 34.6 23.1 23.1 Tsunami 2.9 4 4 6 4 6 15.4 15.4 23.1 15.4 23.1 Wildfire 3.3 0 1 7 7 7 0.0 3.9 26.9 26.9 26.9 Flooding 2.7 3 9 5 2 5 11.5 34.6 19.2 7.69 19.2 Volcano 1.2 17 6 1 0 0 65.4 23.1 3.85 0.0 0.0 Coastal Erosion 3.0 2 5 8 2 7 7.7 19.2 30.8 7.69 26.9 No Hazards 2 7.7
Most hazards, except volcanic, were deemed to be of
moderate consequence at this location. The campsite is located in
an area that has been previously affected by tsunamis and is
located in an area prone to rock falls.
Figure 3.8: Pigeon Bay Holiday Park (ECAN, 2006).
Figure 3.9: Purau Bay Holiday Park (ECAN, 2006).
- 34 -
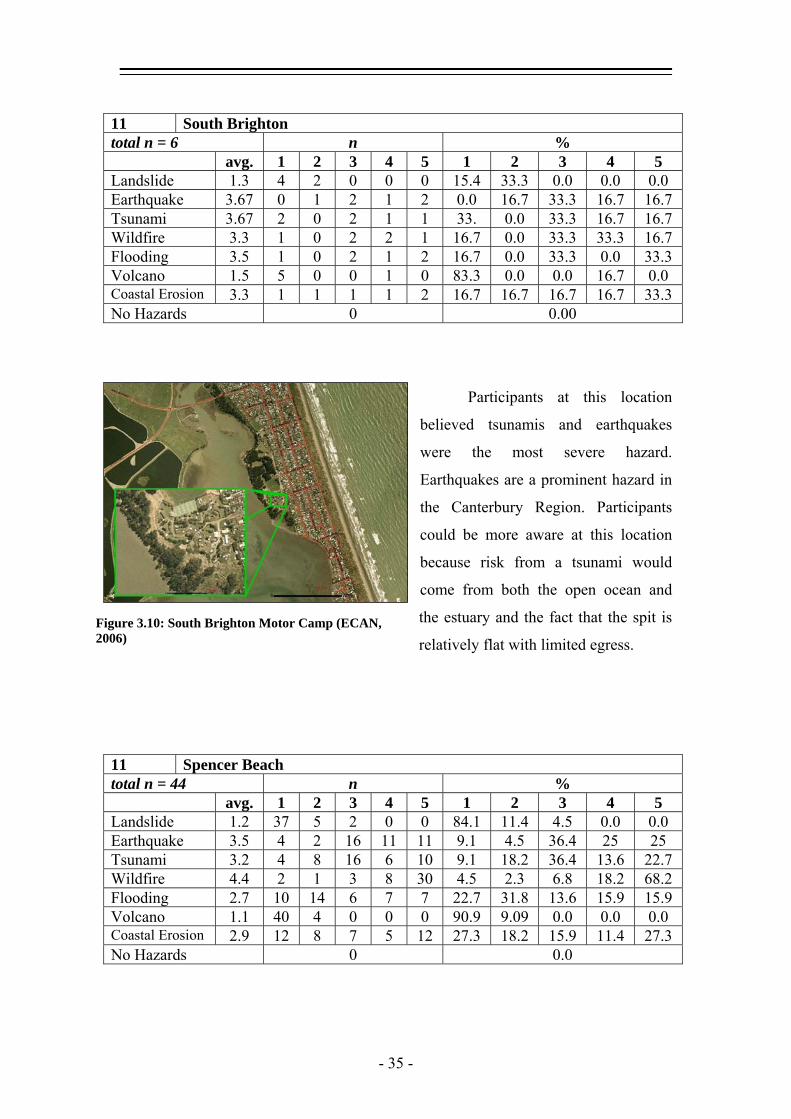
11 South Brighton total n = 6 n %
avg. 1 2 3 4 5 1 2 3 4 5 Landslide 1.3 4 2 0 0 0 15.4 33.3 0.0 0.0 0.0 Earthquake 3.67 0 1 2 1 2 0.0 16.7 33.3 16.7 16.7 Tsunami 3.67 2 0 2 1 1 33. 0.0 33.3 16.7 16.7 Wildfire 3.3 1 0 2 2 1 16.7 0.0 33.3 33.3 16.7 Flooding 3.5 1 0 2 1 2 16.7 0.0 33.3 0.0 33.3 Volcano 1.5 5 0 0 1 0 83.3 0.0 0.0 16.7 0.0 Coastal Erosion 3.3 1 1 1 1 2 16.7 16.7 16.7 16.7 33.3 No Hazards 0 0.00
Participants at this location
believed tsunamis and earthquakes
were the most severe hazard.
Earthquakes are a prominent hazard in
the Canterbury Region. Participants
could be more aware at this location
because risk from a tsunami would
come from both the open ocean and
the estuary and the fact that the spit is
relatively flat with limited egress. Figure 3.10: South Brighton Motor Camp (ECAN, 2006)
11 Spencer Beach total n = 44 n %
avg. 1 2 3 4 5 1 2 3 4 5 Landslide 1.2 37 5 2 0 0 84.1 11.4 4.5 0.0 0.0 Earthquake 3.5 4 2 16 11 11 9.1 4.5 36.4 25 25 Tsunami 3.2 4 8 16 6 10 9.1 18.2 36.4 13.6 22.7 Wildfire 4.4 2 1 3 8 30 4.5 2.3 6.8 18.2 68.2 Flooding 2.7 10 14 6 7 7 22.7 31.8 13.6 15.9 15.9 Volcano 1.1 40 4 0 0 0 90.9 9.09 0.0 0.0 0.0 Coastal Erosion 2.9 12 8 7 5 12 27.3 18.2 15.9 11.4 27.3 No Hazards 0 0.0
- 35 -

Wildfire was clearly the biggest
concern at the Spencerville location.
This is not surprising since the
campground was nearly evacuated from
a bush fire during the survey period.
Tsunamis were perceived to be a higher
risk than at many other locations. This is
remarkable since this is one of the few
locations where the ocean was not
visible from the campsite.
11 Wood end total n = 10 n %
avg. 1 2 3 4 5 1 2 3 4 5 Landslide 1.3 8 0 0 0 1 80 0.0 0.0 0.0 10 Earthquake 3.5 0 1 2 3 3 0.0 10 20 30 30 Tsunami 2.9 1 2 2 2 2 10 20 20 20 20 Wildfire 3.9 0 0 2 2 5 0.0 0.0 20 20 50 Flooding 2.3 2 3 2 1 1 20 30 20 10 10 Volcano 1.4 9 0 0 0 0 90 0.0 0.0 0.0 0.0 Coastal Erosion 3.3 2 1 0 1 5 20 10 0.0 10 50 No Hazards 1 10
Again, wildfire was a major
concern for this area due to the large
number of wildfires that occurred on the
Canterbury plains during the summer
season. Coastal erosion and earthquake
were the next greatest concern. Tsunamis
and flooding were of moderate concern.
Figure 3.11: Spencer Beach Holiday Park (ECAN 2006).
Figure 3.12: Wood end Holiday Park (ECAN, 2006).
- 36 -

12 When was the last tsunami that caused damage in Banks Peninsula? total n= 211 n % Never 15 7.1 Within the last year 0 0 In the last 1-10 years 6 2.8 In the last 10-100 years 66 31.3 In the last 100-1000 years 5 2.4 Don’t know 119 56.4
The last tsunami that caused damage to Banks Peninsula was the 1960 Chilean
tsunami (see Chapter 2). Over half of the respondents did not know and about a third
was aware of approximately when the last tsunami had occurred.
13 Do you think that a tsunami could occur: n % While you are visiting 6 2.8 Within the year 5 2.4 In the next 1-10 years 65 30.8 In the next 10-100 years 101 47.9 Not within 100 years 6 2.8 Never 4 1.9 Don’t know 24 11.4
The majority of participants though that a tsunami was likely and would occur
within 10-100 years, with 1-10 years coming in close second. Most, however, did not
believe that a tsunami would occur imminently.
14a Have you actively sought information about tsunamis from any of the
following sources about this area? total n= 211 n % Friends or Family 2 1.0 Central Government 0 0.0 Civil Defence 2 1.0 Local Council 0 0.0 Region Council 0 0.0 Business Establishment 0 0.0 Child’s School 0 0.0 Research Organization 0 0.0 Other 0 0.0
- 37 -

A very small percentage, 2%, of participants indicated that they had actively
sought information on tsunamis with sources being equally from formal and informal
sources.
14b Have you heard or received information about tsunamis from any of the
following sources? total n= 211 n % Friends or Family 37 17.5 Central Government 6 2.8 Civil Defence 34 16.1 Local Council 5 2.4 Region Council 2 1.0 Business Establishment 2 1.0 Child’s School 12 5.7 Research Organization 2 1.0 Other- media 31 14.7 Other- phonebook 11 5.2 Other 9 4.3
Many more participants had received information than had actively sought it
out. The most common sources were friends or family, Civil Defence (most people
who indicated Civil Defence specified that they had received a Civil Defence
pamphlet in the mail), and the media.
15 Where do New Zealand tsunamis come from? total n= 211 n % Ocean/ Pacific 88 41.7 Tectonic Plates/ Earthquakes
42 19.9
Tasman/ Australia 8 3.8 South America 50 23.7 Kaikoura 7 3.3 New Zealand 10 4.7 Don’t Know 43 20.4 Other 18 8.5
- 38 -
The majority of people answered either the ocean or the Pacific Ocean which
is correct, though, really general. Almost a quarter of respondents knew that the most
likely source for tsunamis was South America, however almost as many people
responded that they did not know the source. The question had an unforeseen
ambiguity, with some respondents interpreting the question to mean what caused
tsunamis. This is why nearly 20% of people said that tsunamis come from
earthquakes.
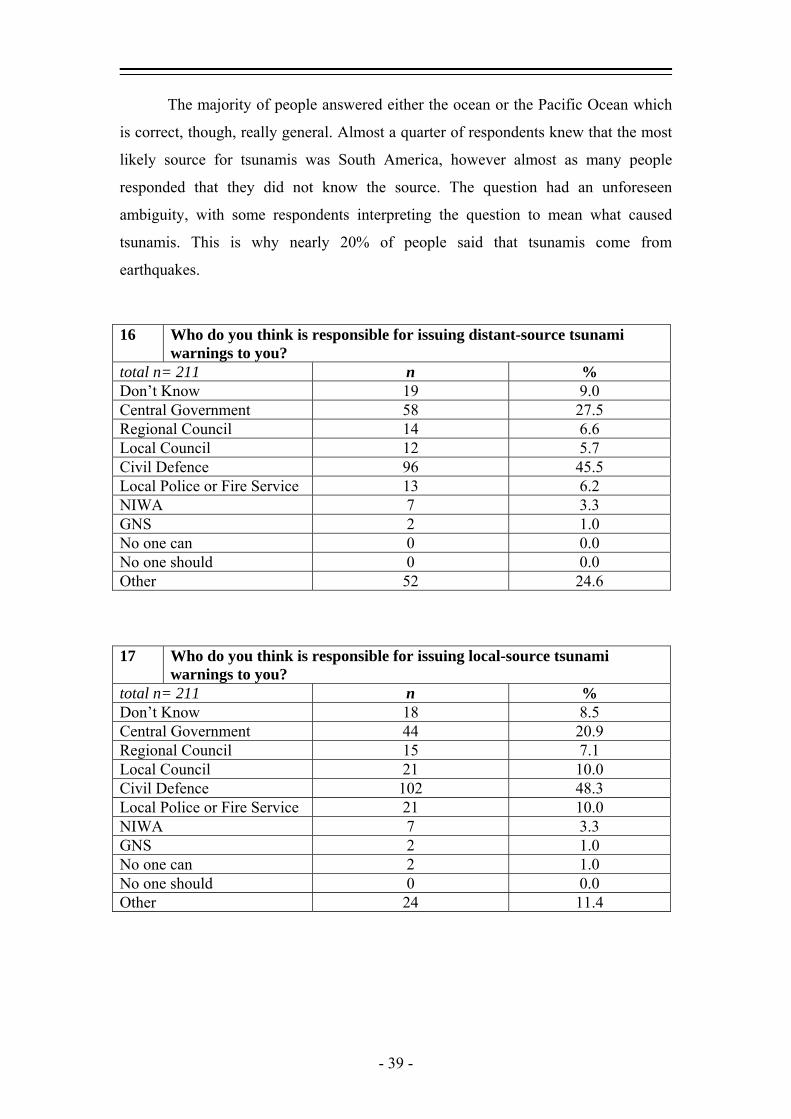
16 Who do you think is responsible for issuing distant-source tsunami
warnings to you? total n= 211 n % Don’t Know 19 9.0 Central Government 58 27.5 Regional Council 14 6.6 Local Council 12 5.7 Civil Defence 96 45.5 Local Police or Fire Service 13 6.2 NIWA 7 3.3 GNS 2 1.0 No one can 0 0.0 No one should 0 0.0 Other 52 24.6
17 Who do you think is responsible for issuing local-source tsunami warnings to you?
total n= 211 n % Don’t Know 18 8.5 Central Government 44 20.9 Regional Council 15 7.1 Local Council 21 10.0 Civil Defence 102 48.3 Local Police or Fire Service 21 10.0 NIWA 7 3.3 GNS 2 1.0 No one can 2 1.0 No one should 0 0.0 Other 24 11.4
- 39 -

Responses were widespread with most participants knowing that Civil
Defence was responsible for issuing tsunami warnings to the public. Although,
through the National Warning System all of these organizations are a part of the
process so any answer would have been correct. There was little variation about who
was responsible for local and distant source tsunami warnings.
18 Does New Zealand have a tsunami warning system? total n= 211 n % Yes 101 47.9 No 61 28.9 Don’t Know 49 23.2 19 What does the New Zealand public warning notification system consist
of? total n= 211 n % Radio 122 57.8 TV 55 26.1 Siren 57 27.0 Text 3 1.4 Word of Mouth 9 4.3 Don’t Know 38 18.0 Other 51 24.2
Approximately half of respondents knew that New Zealand has a tsunami
warning system and that it consists of radio broadcast. Only about a quarter, though,
knew that there is TV broadcast as well. Many, 27%, also expected sirens, which few
communities have.
20 Which do you think would be the most effective way of delivering a
warning? total n= 211 n % Radio 101 47.9 TV 53 25.1 Siren 55 26.1 Text 13 6.2 Word of Mouth 21 10.0 Don’t Know 3 1.4 Other 37 34.6
- 40 -
Most people preferred the existing methods of delivering a warning using
radio and television broadcast. Also over a quarter of the participants referred a siren
system. A siren system may be more appropriate to campground locations since there
is limited radio and cell phone reception and few televisions.
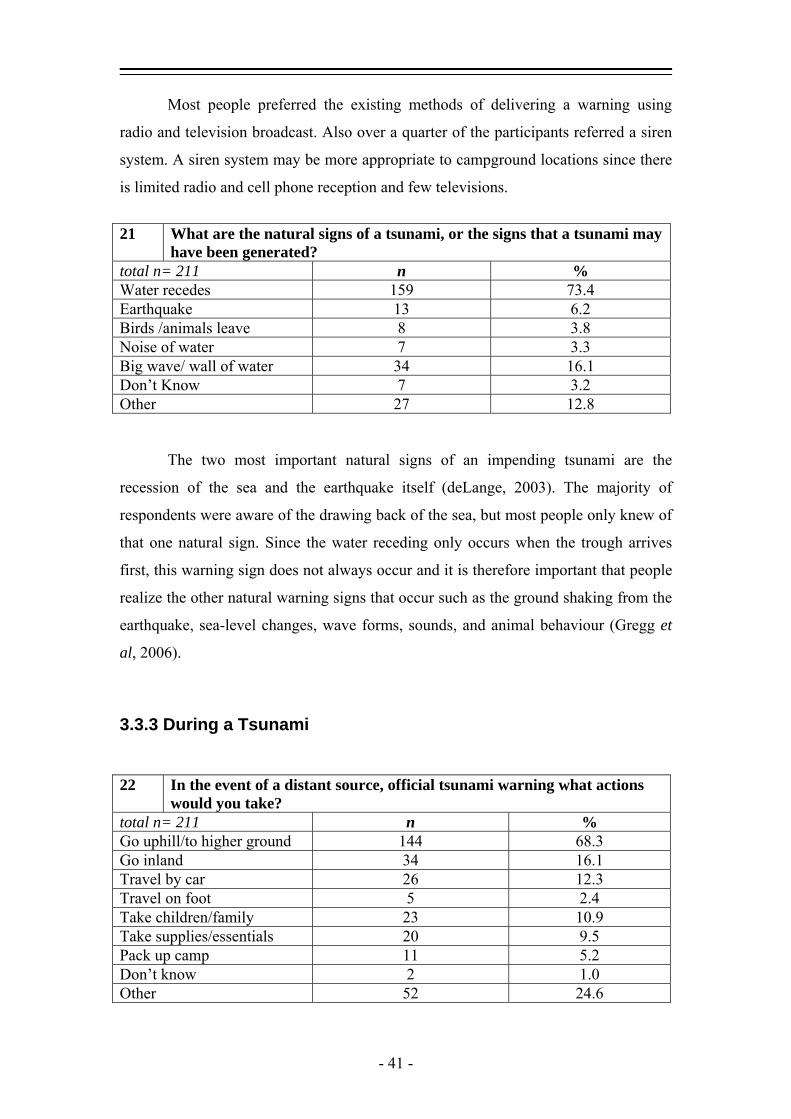
21 What are the natural signs of a tsunami, or the signs that a tsunami may
have been generated? total n= 211 n % Water recedes 159 73.4 Earthquake 13 6.2 Birds /animals leave 8 3.8 Noise of water 7 3.3 Big wave/ wall of water 34 16.1 Don’t Know 7 3.2 Other 27 12.8 The two most important natural signs of an impending tsunami are the
recession of the sea and the earthquake itself (deLange, 2003). The majority of
respondents were aware of the drawing back of the sea, but most people only knew of
that one natural sign. Since the water receding only occurs when the trough arrives
first, this warning sign does not always occur and it is therefore important that people
realize the other natural warning signs that occur such as the ground shaking from the
earthquake, sea-level changes, wave forms, sounds, and animal behaviour (Gregg et
al, 2006).
3.3.3 During a Tsunami 22 In the event of a distant source, official tsunami warning what actions
would you take? total n= 211 n % Go uphill/to higher ground 144 68.3 Go inland 34 16.1 Travel by car 26 12.3 Travel on foot 5 2.4 Take children/family 23 10.9 Take supplies/essentials 20 9.5 Pack up camp 11 5.2 Don’t know 2 1.0 Other 52 24.6
- 41 -
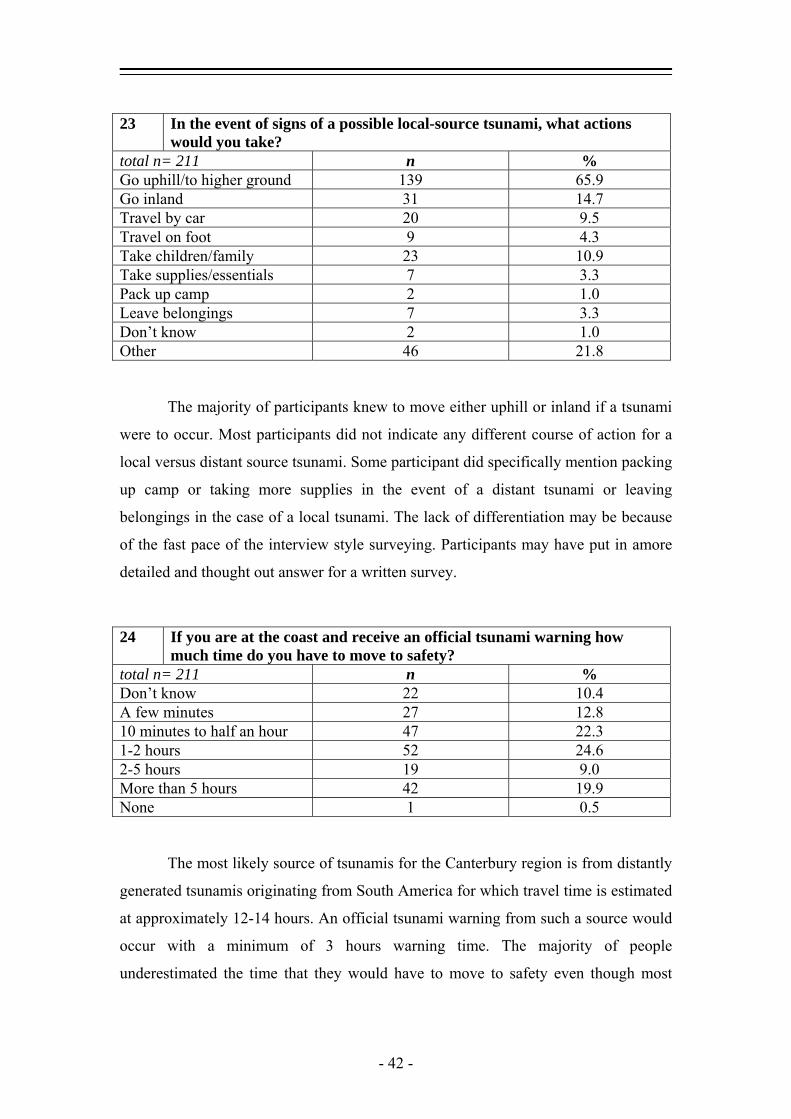
23 In the event of signs of a possible local-source tsunami, what actions
would you take? total n= 211 n % Go uphill/to higher ground 139 65.9 Go inland 31 14.7 Travel by car 20 9.5 Travel on foot 9 4.3 Take children/family 23 10.9 Take supplies/essentials 7 3.3 Pack up camp 2 1.0 Leave belongings 7 3.3 Don’t know 2 1.0 Other 46 21.8
The majority of participants knew to move either uphill or inland if a tsunami
were to occur. Most participants did not indicate any different course of action for a
local versus distant source tsunami. Some participant did specifically mention packing
up camp or taking more supplies in the event of a distant tsunami or leaving
belongings in the case of a local tsunami. The lack of differentiation may be because
of the fast pace of the interview style surveying. Participants may have put in amore
detailed and thought out answer for a written survey.
24 If you are at the coast and receive an official tsunami warning how
much time do you have to move to safety? total n= 211 n % Don’t know 22 10.4 A few minutes 27 12.8 10 minutes to half an hour 47 22.3 1-2 hours 52 24.6 2-5 hours 19 9.0 More than 5 hours 42 19.9 None 1 0.5 The most likely source of tsunamis for the Canterbury region is from distantly
generated tsunamis originating from South America for which travel time is estimated
at approximately 12-14 hours. An official tsunami warning from such a source would
occur with a minimum of 3 hours warning time. The majority of people
underestimated the time that they would have to move to safety even though most
- 42 -

participants understood the question to mean how long would it take the tsunami to
arrive from a distant source.
25 If you feel a strong earthquake while at the beach, how much time do you have to move to safety?
total n= 211 n % Don’t know 26 12.3 A few minutes 91 43.1 10 minutes to half an hour 61 28.9 1-2 hours 14 6.6 2-5 hours 1 0.5 More than 5 hours 3 1.4 None 11 5.2 Wouldn’t need to 3 1.4
Although some respondents believed that there would be no time or no need to
move to safety, most, 72% knew that it would take between a few minutes to 15
minutes for a locally generated tsunami to arrive after an earthquake.
26 What do you expect from campground/accommodation staff during a tsunami?
total n= 211 n % Nothing 35 16.6 Evacuate themselves 11 5.2 Warn people 50 23.7 Provide information 51 24.2 Evacuate people 13 6.2 Have a meeting point 11 5.2 Organize people 2 1.0 Set off siren/alarm 25 11.6 Other 72 34.1 The most common response was that guest expected either information or a
warning from campground owners or staff. A large percentage expected owners or
staff to do nothing. Other respondents expected a prearranged meeting location, for
staff to organize the people to evacuate or to facilitate an evacuation, or that staff
would set off an alarm or siren.
- 43 -

3.3.4 Changes in Perception 27 Did you know what a tsunami was before the 2004 Boxing Day tsunami?total n= 211 n % Yes 180 85.3 No 31 14.7 28 Since the 2004 Boxing Day tsunami you: total n= 211 n % Have learned more about tsunamis 177 83.9 Have actively sought information on tsunamis 1 0.5 Feel more at risk from tsunamis 71 33.7 Feel less at risk 15 7.1 Have not been affected 23 10.9 Fell more aware about tsunamis 11 5.2 Other 5 2.4
Even though the majority of participants, 85.3%, indicated that they knew
what a tsunami was prior to the Boxing Day Tsunami, 83.9% indicated that they had
learned more about tsunamis since then. Moreover, out of the 31 respondents who did
not know what a tsunami was beforehand, only 3 or 9.6% have not learned more
about tsunamis since.
3.4 Discussion Although there is a common belief in the possibility that tsunamis could and have
occurred, there is only moderate understanding of the warning system including who
issues warnings and how they are received. The majority of participants indicated a
preference for the existing method of receiving warning by radio broadcast. Most
individuals were generally aware of the proper actions to take during a tsunami, but
responses given for local and distantly generated tsunamis varied only marginally.
This is consistent with the facts that most respondents underestimated the time for
evacuation from a distant tsunami believing that they would not have much more time
than a local tsunami.
In study by Drabek (2000), he found that visitors had higher expectations of
accommodations personnel than managers/owners were willing or able to provide
including that they should have written disaster plans that incorporated the needs for
- 44 -

disabled individuals or those with language barrier issues. Campground visitors had
generally lower expectations of the staff in regards to hazard preparation and
evacuations. They often cited the lower number of employees present and the need for
the staff to self-evacuate. Of the campground surveyed, only one, Okains Bay, had
any visible hazards notices in regards to appropriate actions to take in case of a brush
fire. The office also had an “emergency plan” regarding flooding or tsunamis. In his
survey of 185 executives in the tourism industry Drabek (1995a and 1995b) found
that although there had been some degree of planning it was mostly informal. The
Okains Bay plan was definitely of an informal nature (Figure 3.13).
Emergency Procedures in case of Flooding
(Tsunami Warning)
Ring emergency services
Ring members on telephone tree
Evacuate everyone to high ground
Account for all people at all times
Keep “sightseers” away from beach area
Do not drink floodwater
Figure 3.13: Okains Bay emergency plan regarding flooding or tsunamis.
It is important, however, for managers and staff to understand the nature of
hazards and to have plans in place, because they are often the first source of
information for tourist or when the media is the first source individuals will often seek
to confirm the information with accommodations operators (Drabek, 2000). Of those
visitors surveyed, about a quarter expected information and about a quarter expected
some degree of warning from campground owners/staff. This is especially important
in the campground situation with minimal forms of media communication available
especially in the Banks Peninsula sites where cell phone coverage is limited to non-
existent, few radio stations are available and televisions are very rare. Although the
- 45 -

coastal Christchurch locations had better reception, it is common for campground
visitors not to have a radio or to spend minimal time using it.
With respect to changes in perception since Boxing Day, the majority of
participants noted some change with many learning more about tsunamis (see Chapter
6).
- 46 -
Chapter 4
Resident Survey
4.1 Introduction
During June of 2003, through a collaborative effort of GNS and NIWA, a large-scale
national survey of residents and visitors was undertaken to examine perceptions of
and preparedness for coastal hazards, especially tsunamis and coastal erosion
(Johnson et al, 2003). It was decided to resurvey those populations in 2006 in the
continuing effort to understand resident’s awareness of coastal hazards with particular
emphasis on tsunamis and to examine what changes in perceptions may have occurred
as a result of the 2004 Boxing Day Tsunami.
4.2 Methodology
A postal questionnaire was delivered to residents of five coastal communities in the
Canterbury Region during October of 2006. The communities were Kaikoura, New
Brighton, Pareora, Southshore and Sumner (figure 4.1) and were chosen because all
but Pareora were surveyed as part of the National Coastal Survey carried out by GNS
in 2003. Pareora was added at the request of the regional council since it is a high-risk
location. Addresses from the 2003 survey were reused. A total of 710 surveys were
posted during the initial send-out; 100 to Kaikoura, 150 to New Brighton, 160 to
Pareora, 150 to Southshore, and 150 to Sumner. A second follow-up mailing was
conducted after three weeks to increase the return rate
The survey was based on several other surveys to allow cross comparison of
data afterwards including the 2003 National Coastal Survey, the campground survey
of non-residents used in Chapter 2, and a similar tsunami survey that was conducted
in Oregon, USA earlier in 2006. The questionnaire was composed of scaled questions
and open and closed ended questions and the main themes included:
- 47 -
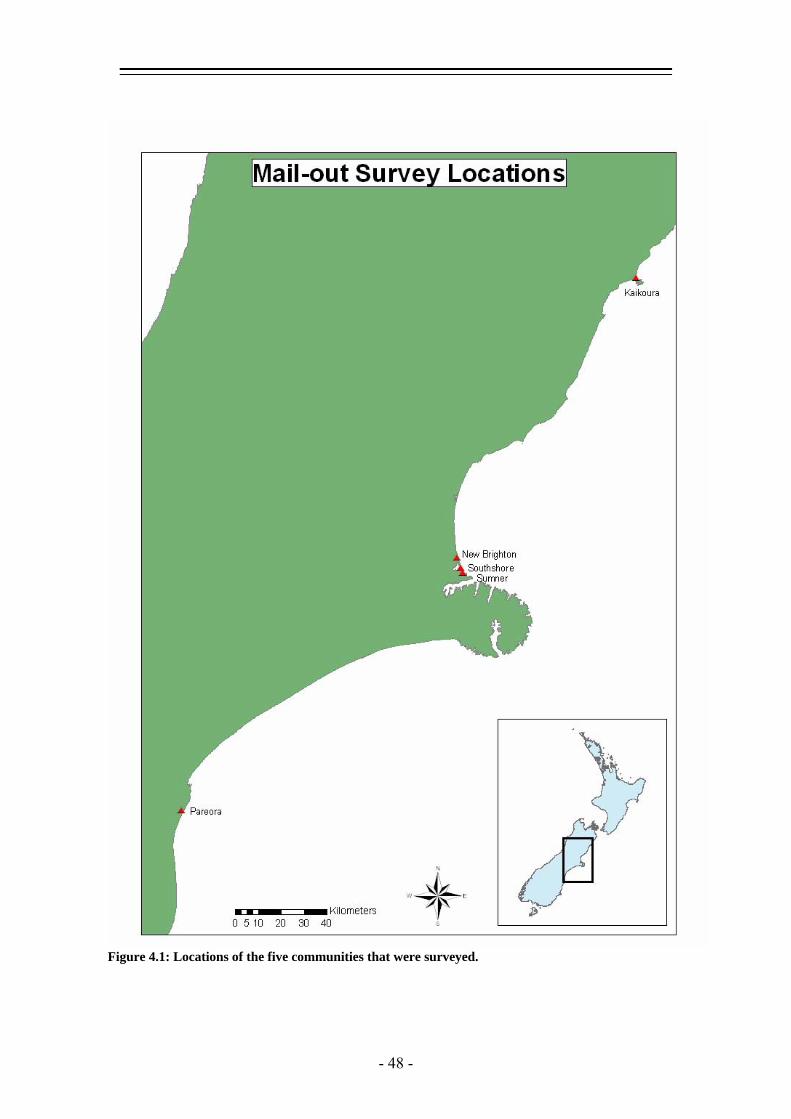
Figure 4.1: Locations of the five communities that were surveyed.
- 48 -
Risk perception and hazard experience: This consisted of questions on the two
most likely hazards to affect the community, the likeliness of tsunamis occurring in
the future, individual susceptibility to harm from tsunamis, and previous hazards that
had affected them and two what degree they had been impacted.
General tsunami knowledge: Participants were asked about the most common cause
of tsunamis, how they occur, when the last tsunami affected their community, what
they would do during and event, and how much time they would have to move to
safety after either an official warning or an earthquake.
Tsunami warnings: This included questions the components of New Zealand’s
warning system, who is responsible for issuing warnings, and which natural and
official warnings would be received.
Sources of information and preparedness: Residents were asked whether they had
heard, received, or asked for information on tsunami hazards from a variety of
sources, what steps they were taking to become more prepared, what had prompted
their preparedness, what emergency supplies they had, and how often they checked
emergency supplies.
Attitude about community: This consisted of questions on the respondent’s interest,
involvement, and time spent in the community, residential status, and reasons for
living in the community.
Survey data was analysed with SPSS statistical software. In order to simplify
the results answers to open ended questions were categorized and have been reported
by those categories. The full answers and any answers reported in the “other”
category are located in Appendix 3.
- 49 -
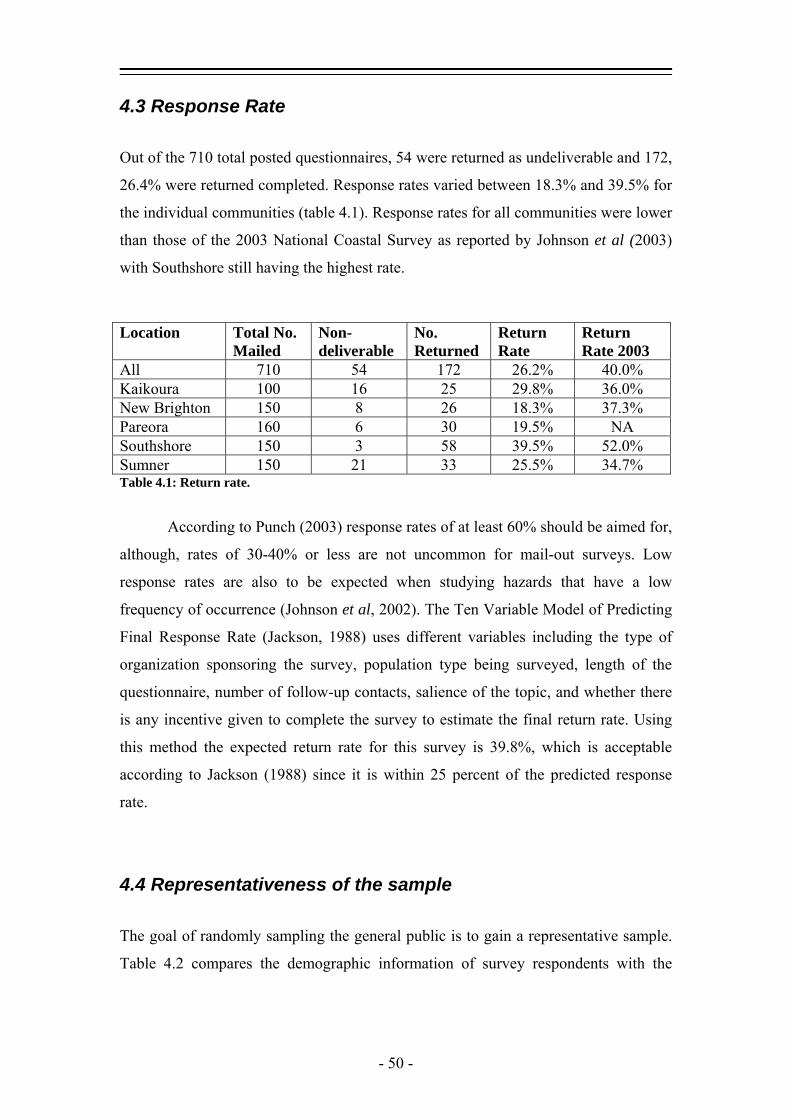
4.3 Response Rate
Out of the 710 total posted questionnaires, 54 were returned as undeliverable and 172,
26.4% were returned completed. Response rates varied between 18.3% and 39.5% for
the individual communities (table 4.1). Response rates for all communities were lower
than those of the 2003 National Coastal Survey as reported by Johnson et al (2003)
with Southshore still having the highest rate.
Location Total No.
Mailed Non-deliverable
No. Returned
Return Rate
Return Rate 2003
All 710 54 172 26.2% 40.0% Kaikoura 100 16 25 29.8% 36.0% New Brighton 150 8 26 18.3% 37.3% Pareora 160 6 30 19.5% NA Southshore 150 3 58 39.5% 52.0% Sumner 150 21 33 25.5% 34.7% Table 4.1: Return rate.
According to Punch (2003) response rates of at least 60% should be aimed for,
although, rates of 30-40% or less are not uncommon for mail-out surveys. Low
response rates are also to be expected when studying hazards that have a low
frequency of occurrence (Johnson et al, 2002). The Ten Variable Model of Predicting
Final Response Rate (Jackson, 1988) uses different variables including the type of
organization sponsoring the survey, population type being surveyed, length of the
questionnaire, number of follow-up contacts, salience of the topic, and whether there
is any incentive given to complete the survey to estimate the final return rate. Using
this method the expected return rate for this survey is 39.8%, which is acceptable
according to Jackson (1988) since it is within 25 percent of the predicted response
rate.
4.4 Representativeness of the sample
The goal of randomly sampling the general public is to gain a representative sample.
Table 4.2 compares the demographic information of survey respondents with the
- 50 -
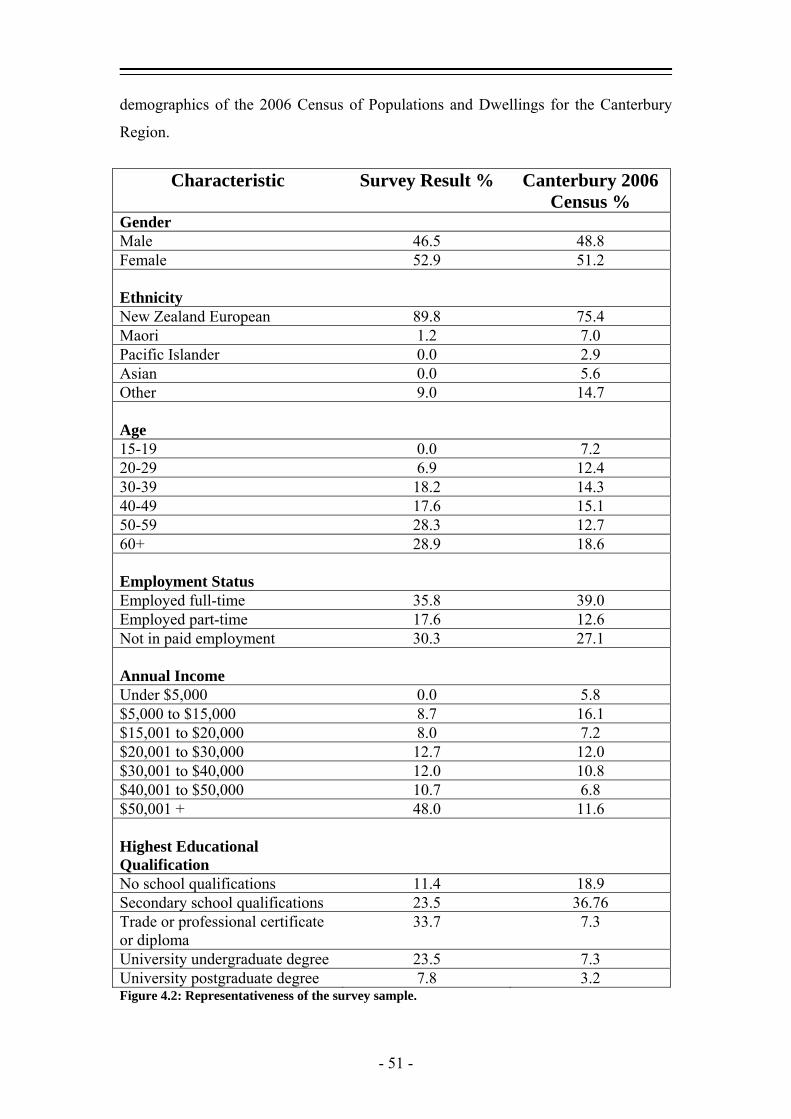
demographics of the 2006 Census of Populations and Dwellings for the Canterbury
Region.
Characteristic Survey Result % Canterbury 2006
Census % Gender Male 46.5 48.8 Female 52.9 51.2 Ethnicity
New Zealand European 89.8 75.4 Maori 1.2 7.0 Pacific Islander 0.0 2.9 Asian 0.0 5.6 Other 9.0 14.7 Age
15-19 0.0 7.2 20-29 6.9 12.4 30-39 18.2 14.3 40-49 17.6 15.1 50-59 28.3 12.7 60+ 28.9 18.6 Employment Status
Employed full-time 35.8 39.0 Employed part-time 17.6 12.6 Not in paid employment 30.3 27.1 Annual Income
Under $5,000 0.0 5.8 $5,000 to $15,000 8.7 16.1 $15,001 to $20,000 8.0 7.2 $20,001 to $30,000 12.7 12.0 $30,001 to $40,000 12.0 10.8 $40,001 to $50,000 10.7 6.8 $50,001 + 48.0 11.6 Highest Educational Qualification
No school qualifications 11.4 18.9 Secondary school qualifications 23.5 36.76 Trade or professional certificate or diploma
33.7 7.3
University undergraduate degree 23.5 7.3 University postgraduate degree 7.8 3.2 Figure 4.2: Representativeness of the survey sample.
- 51 -

The survey sampled is moderately representative of the target population.
Although all major groups are represented, there was significant under-representation
of Maori, Pacific Islanders and Asians, younger age groups and low-income
individuals. On the other hand older age groups, wealthier individuals, and those with
trade certificates and undergraduate degrees are over-represented. These over-
represented groups embody socially empowered (Leonard et al, 2004) individuals
who tend to have greater resources, authority and control over their environment. A
demographic bias towards this group it is not uncommon in such voluntary surveys
and has been seen in previous New Zealand studies (Leonard et al, 2004).
4.4 Results
4.4.1 Awareness and experience of natural hazards in general 1 Which are the two natural hazards that you think are most likely to affect
this community? (Tick only two) total n= 170 n % Ash fall from a volcanic eruption 1 0.6 Coastal erosion (shoreline erosion) 63 37.1 Earthquake 75 44.1 Flooding (river or storm surge) 47 27.6 Forest or bush fire 3 1.8 Landslide 5 2.9 Storm or cyclone with high winds 40 23.5 Tsunami (previously called tidal wave) 100 58.8
Over half of all respondents believe that tsunamis have the greatest potential to
affect their community while earthquake was believed to be the second highest
hazard. Very few people indicated fire, landslide or ash fall to be the most likely.
Coastal erosion, flooding and storm were of moderate concern.
- 52 -

2 Have you ever been affected by any of the following events? Tick all that apply)
total n= 161 n % Chemical spill or gas leak 8 5.0 Climate change 14 8.7 Earthquake 49 30.4 Fire 19 11.8 Flood 37 23.0 Infrastructural failure (e.g. loss of electricity) 69 42.8 Landslide 8 5.0 Pandemic 0 0.0 Storm with high winds (e.g. cyclone) 38 23.6 Tornado 2 1.2 Volcanic eruption 2 1.2 No events have affected me 45 28.0
The hazard that affected the largest
number of people was infrastructural failure. This
most likely referred to the snow that blanketed the
South Island during the 2006 winter, during
which power service was interrupted for two to
three weeks at some locations (figure 4.2). Over a
third of respondents have experienced
earthquakes making this the next greatest hazard,
although this was closely followed by a third of
participant reporting that no natural hazards had
affected them. The number of people affected by
“no hazards”, however, may be slightly higher.
About thirteen individuals did not specify any particular hazards, but also did not
indicate “no events”. This was quite possibly due to individuals not reading through
the entire list since the “no events” selection was located at the bottom. Flood and fire
affected the next greatest number of people and chemical spill, climate change,
landslide, pandemic, tornado, and volcanic eruption each affected under ten percent of
respondents.
Figure 4.10: Snowfall from the 2006 snowstorm (NASA, 2006).
- 53 -
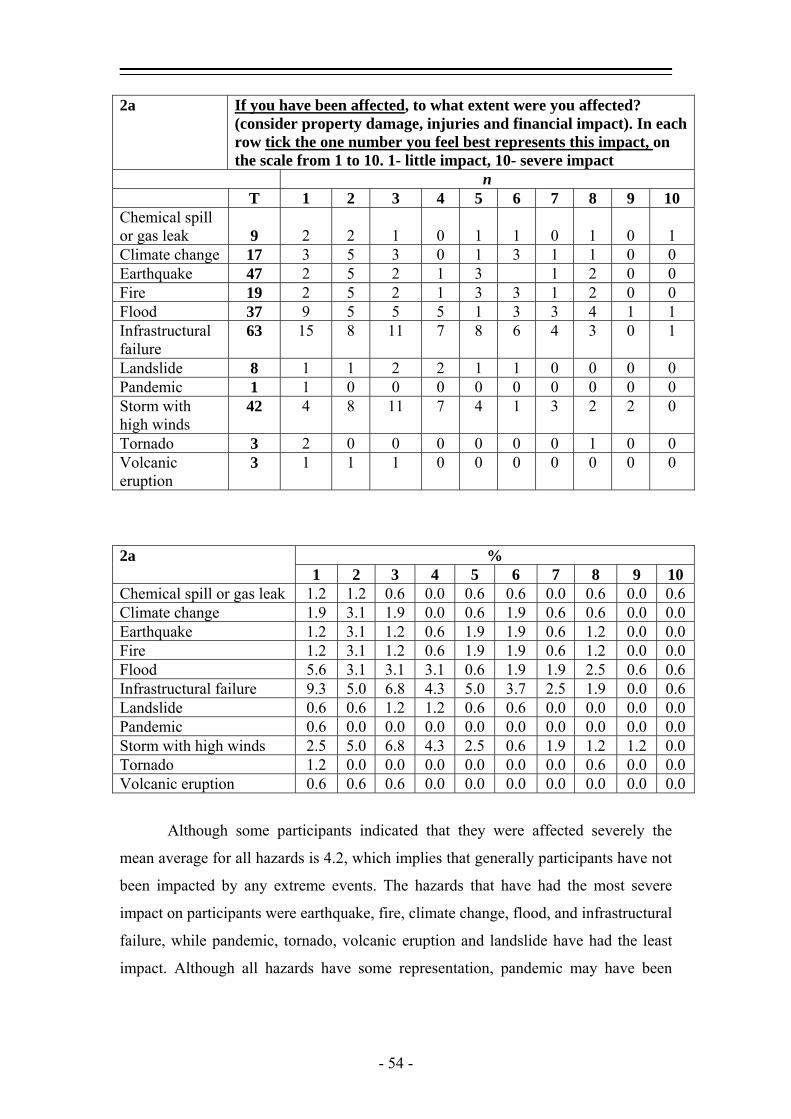
If you have been affected, to what extent were you affected? (consider property damage, injuries and financial impact). In each row tick the one number you feel best represents this impact, on the scale from 1 to 10. 1- little impact, 10- severe impact
2a
n T 1 2 3 4 5 6 7 8 9 10 Chemical spill or gas leak
9
2
2
1
0
1
1
0
1
0
1
Climate change 17 3 5 3 0 1 3 1 1 0 0 Earthquake 47 2 5 2 1 3 1 2 0 0 Fire 19 2 5 2 1 3 3 1 2 0 0 Flood 37 9 5 5 5 1 3 3 4 1 1 Infrastructural failure
63 15 8 11 7 8 6 4 3 0 1
Landslide 8 1 1 2 2 1 1 0 0 0 0 Pandemic 1 1 0 0 0 0 0 0 0 0 0 Storm with high winds
42 4 8 11 7 4 1 3 2 2 0
Tornado 3 2 0 0 0 0 0 0 1 0 0 Volcanic eruption
3 1 1 1 0 0 0 0 0 0 0
% 2a 1 2 3 4 5 6 7 8 9 10
Chemical spill or gas leak 1.2 1.2 0.6 0.0 0.6 0.6 0.0 0.6 0.0 0.6 Climate change 1.9 3.1 1.9 0.0 0.6 1.9 0.6 0.6 0.0 0.0 Earthquake 1.2 3.1 1.2 0.6 1.9 1.9 0.6 1.2 0.0 0.0 Fire 1.2 3.1 1.2 0.6 1.9 1.9 0.6 1.2 0.0 0.0 Flood 5.6 3.1 3.1 3.1 0.6 1.9 1.9 2.5 0.6 0.6 Infrastructural failure 9.3 5.0 6.8 4.3 5.0 3.7 2.5 1.9 0.0 0.6 Landslide 0.6 0.6 1.2 1.2 0.6 0.6 0.0 0.0 0.0 0.0 Pandemic 0.6 0.0 0.0 0.0 0.0 0.0 0.0 0.0 0.0 0.0 Storm with high winds 2.5 5.0 6.8 4.3 2.5 0.6 1.9 1.2 1.2 0.0 Tornado 1.2 0.0 0.0 0.0 0.0 0.0 0.0 0.6 0.0 0.0 Volcanic eruption 0.6 0.6 0.6 0.0 0.0 0.0 0.0 0.0 0.0 0.0
Although some participants indicated that they were affected severely the
mean average for all hazards is 4.2, which implies that generally participants have not
been impacted by any extreme events. The hazards that have had the most severe
impact on participants were earthquake, fire, climate change, flood, and infrastructural
failure, while pandemic, tornado, volcanic eruption and landslide have had the least
impact. Although all hazards have some representation, pandemic may have been
- 54 -
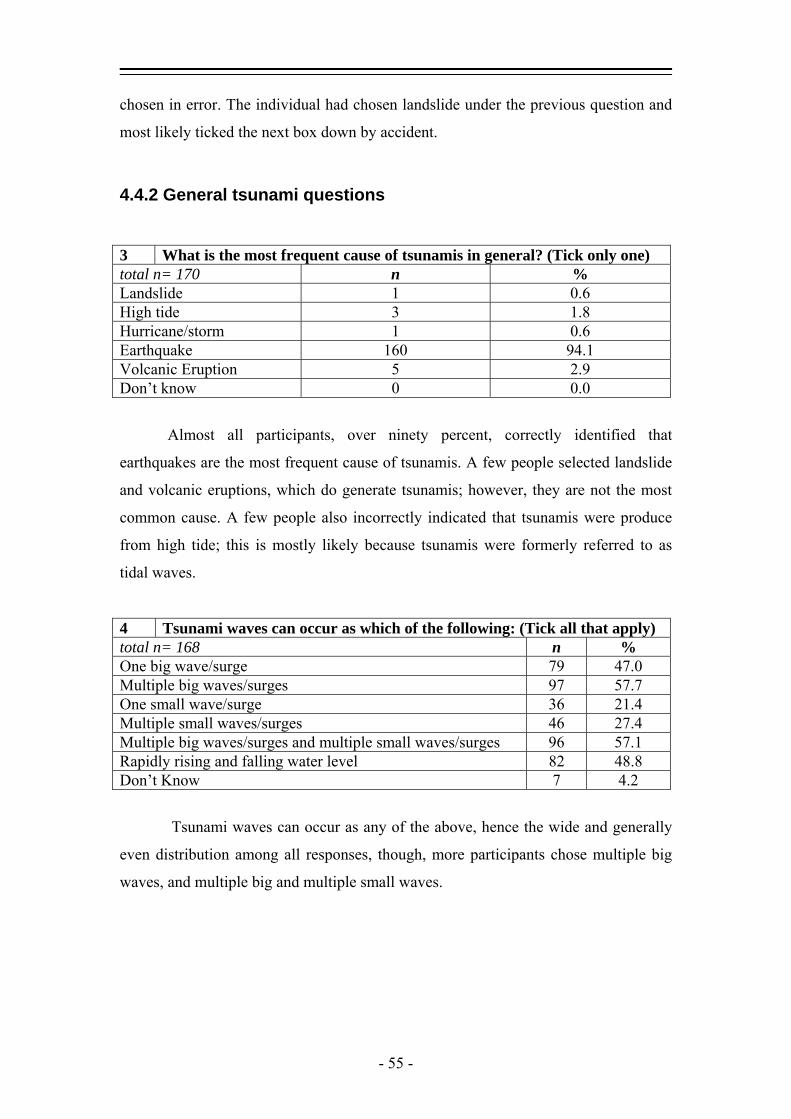
chosen in error. The individual had chosen landslide under the previous question and
most likely ticked the next box down by accident.
4.4.2 General tsunami questions 3 What is the most frequent cause of tsunamis in general? (Tick only one) total n= 170 n % Landslide 1 0.6 High tide 3 1.8 Hurricane/storm 1 0.6 Earthquake 160 94.1 Volcanic Eruption 5 2.9 Don’t know 0 0.0
Almost all participants, over ninety percent, correctly identified that
earthquakes are the most frequent cause of tsunamis. A few people selected landslide
and volcanic eruptions, which do generate tsunamis; however, they are not the most
common cause. A few people also incorrectly indicated that tsunamis were produce
from high tide; this is mostly likely because tsunamis were formerly referred to as
tidal waves.
4 Tsunami waves can occur as which of the following: (Tick all that apply) total n= 168 n % One big wave/surge 79 47.0 Multiple big waves/surges 97 57.7 One small wave/surge 36 21.4 Multiple small waves/surges 46 27.4 Multiple big waves/surges and multiple small waves/surges 96 57.1 Rapidly rising and falling water level 82 48.8 Don’t Know 7 4.2
Tsunami waves can occur as any of the above, hence the wide and generally
even distribution among all responses, though, more participants chose multiple big
waves, and multiple big and multiple small waves.
- 55 -

5 When was the last tsunami that affected this community? (Tick only one) total n= 171 n % Never 26 15.2 In the last 10 years 7 4.1 In the last 100 years 78 45.6 In the last 1000 years 5 2.9 In the last 10 000 years 0 0.0 Don’t know 55 32.2
The greatest number of participants believed that the last tsunami was in the
last hundred years, though a third of respondents did not know. A small amount of
individuals responded that one had occurred as few as ten years or a long as one
thousand years ago and no one believed that it had been ten thousand years.
6 When was the last damaging tsunami that affected this community? (Tick only one)
total n= 170 n % Never 44 25.9 In the last 10 years 0 0.0 In the last 100 years 39 22.9 In the last 1000 years 8 4.7 In the last 10 000 years 1 .6 Don’t know 78 45.9
Over half of individuals did not know when the last damaging tsunami was. Of
those that though they knew about equal numbers believed it was never and in the last
hundred years.
7 Do you think a tsunamis could occur: (Tick only one) total n= 169 n % Within the year 22 13.0 In the next 1-10 years 42 25.0 In the next 10-100 years 65 38.5 Not within 100 years 2 1.2 Never 3 1.8 Don’t know 35 20.7
The majority of participants though that a tsunami was likely and would occur
within 10-100 years, with 1-10 years coming in close second. Most, however, did not
believe that a tsunami would occur imminently. Few respondents believe that a
tsunami will never occur.
- 56 -

4.4.3 Tsunami warnings and preparation 8 Have you seen any tsunami hazard zone maps for this community? total n= 169 n % Yes 27 16.0 Not sure 6 3.6 No 136 80.5
Most respondents, almost 80%, have not seen tsunami hazard zone maps for
their community.
9 Do you live in a tsunami inundation (hazard or danger) zone? (Tick only one)
total n= 169 n % Yes 122 72.2 No 11 6.5 Don’t Know 36 21.3
The majority of individuals indicated that they live in a tsunami inundation
zone, which is within one kilometre of the ocean and below 35 meters in elevation.
The communities were chosen due to their proximately to the ocean and their likely
inundation during a tsunami.
10 Which of the following make up New Zealand’s public tsunami warning system? (Tick all that apply)
total n= 161 total n= 169 n % Don’t know 36 22.4 Siren 113 70.2 Loudspeaker announcements 42 26.1 Flashing lights 10 6.2 Radio and TV announcements 119 73.9 Door-to-door visits by emergency services or civil defence staff 51 31.7 Other 3 1.9
Participants indicated that sirens and radio and TV announcements were the
components of New Zealand’s warning system. Though most people responded that
sirens were a component they are not incorporated into the National Warning System.
- 57 -
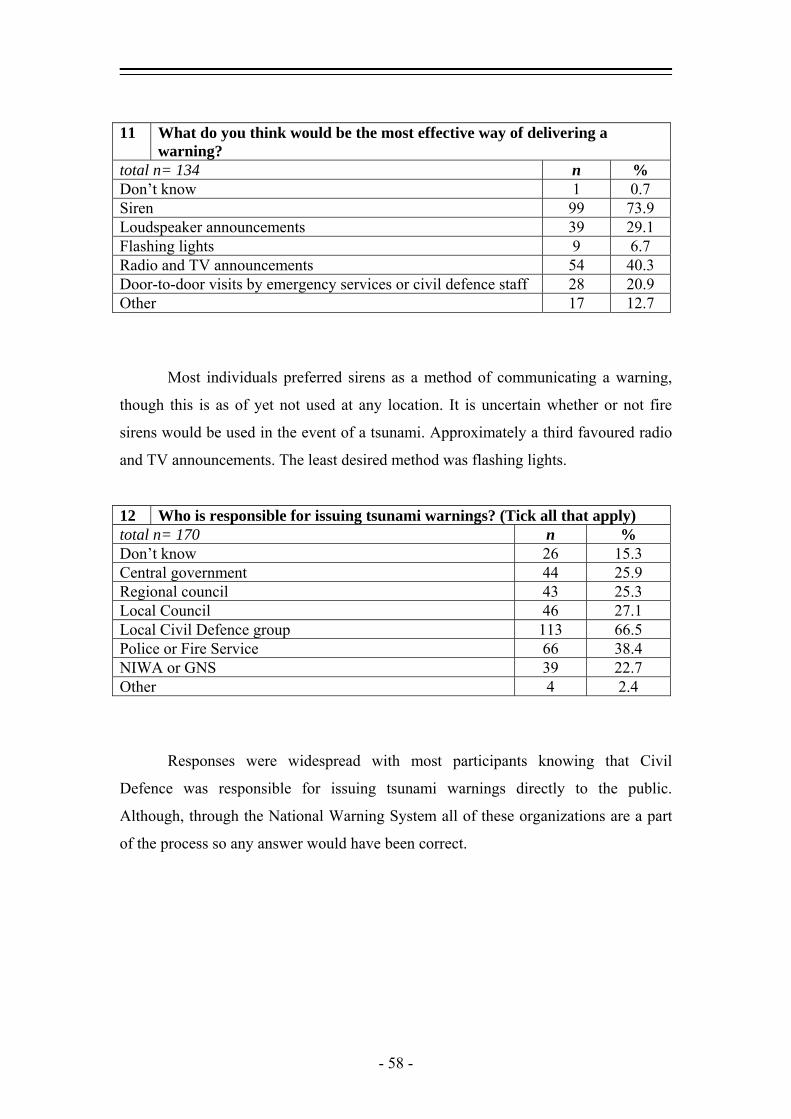
11 What do you think would be the most effective way of delivering a warning?
total n= 134 n % Don’t know 1 0.7 Siren 99 73.9 Loudspeaker announcements 39 29.1 Flashing lights 9 6.7 Radio and TV announcements 54 40.3 Door-to-door visits by emergency services or civil defence staff 28 20.9 Other 17 12.7
Most individuals preferred sirens as a method of communicating a warning,
though this is as of yet not used at any location. It is uncertain whether or not fire
sirens would be used in the event of a tsunami. Approximately a third favoured radio
and TV announcements. The least desired method was flashing lights.
12 Who is responsible for issuing tsunami warnings? (Tick all that apply) total n= 170 n % Don’t know 26 15.3 Central government 44 25.9 Regional council 43 25.3 Local Council 46 27.1 Local Civil Defence group 113 66.5 Police or Fire Service 66 38.4 NIWA or GNS 39 22.7 Other 4 2.4
Responses were widespread with most participants knowing that Civil
Defence was responsible for issuing tsunami warnings directly to the public.
Although, through the National Warning System all of these organizations are a part
of the process so any answer would have been correct.
- 58 -
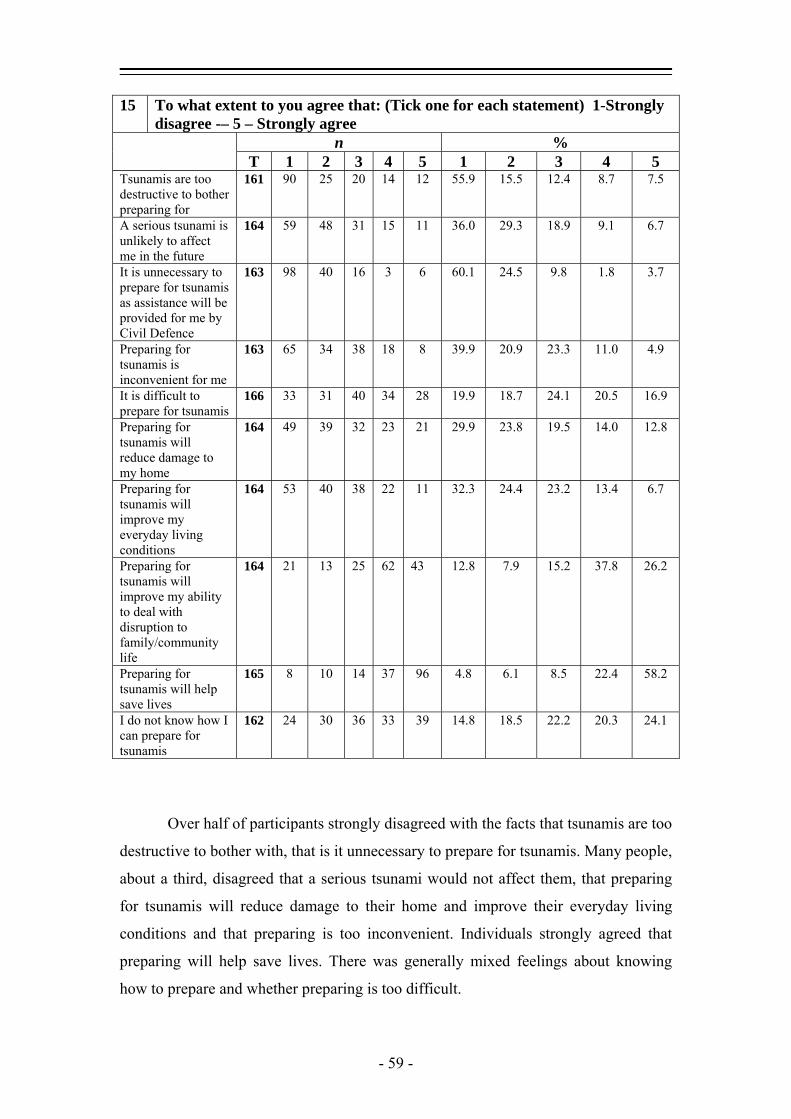
15 To what extent to you agree that: (Tick one for each statement) 1-Strongly disagree -– 5 – Strongly agree
n % T 1 2 3 4 5 1 2 3 4 5
Tsunamis are too destructive to bother preparing for
161 90 25 20 14 12 55.9 15.5 12.4 8.7 7.5
A serious tsunami is unlikely to affect me in the future
164 59 48 31 15 11 36.0 29.3 18.9 9.1 6.7
It is unnecessary to prepare for tsunamis as assistance will be provided for me by Civil Defence
163 98 40 16 3 6 60.1 24.5 9.8 1.8 3.7
Preparing for tsunamis is inconvenient for me
163 65 34 38 18 8 39.9 20.9 23.3 11.0 4.9
It is difficult to prepare for tsunamis
166 33 31 40 34 28 19.9 18.7 24.1 20.5 16.9
Preparing for tsunamis will reduce damage to my home
164 49 39 32 23 21 29.9 23.8 19.5 14.0 12.8
Preparing for tsunamis will improve my everyday living conditions
164 53 40 38 22 11 32.3 24.4 23.2 13.4 6.7
Preparing for tsunamis will improve my ability to deal with disruption to family/community life
164 21 13 25 62 43 12.8 7.9 15.2 37.8 26.2
Preparing for tsunamis will help save lives
165 8 10 14 37 96 4.8 6.1 8.5 22.4 58.2
I do not know how I can prepare for tsunamis
162 24 30 36 33 39 14.8 18.5 22.2 20.3 24.1
Over half of participants strongly disagreed with the facts that tsunamis are too
destructive to bother with, that is it unnecessary to prepare for tsunamis. Many people,
about a third, disagreed that a serious tsunami would not affect them, that preparing
for tsunamis will reduce damage to their home and improve their everyday living
conditions and that preparing is too inconvenient. Individuals strongly agreed that
preparing will help save lives. There was generally mixed feelings about knowing
how to prepare and whether preparing is too difficult.
- 59 -
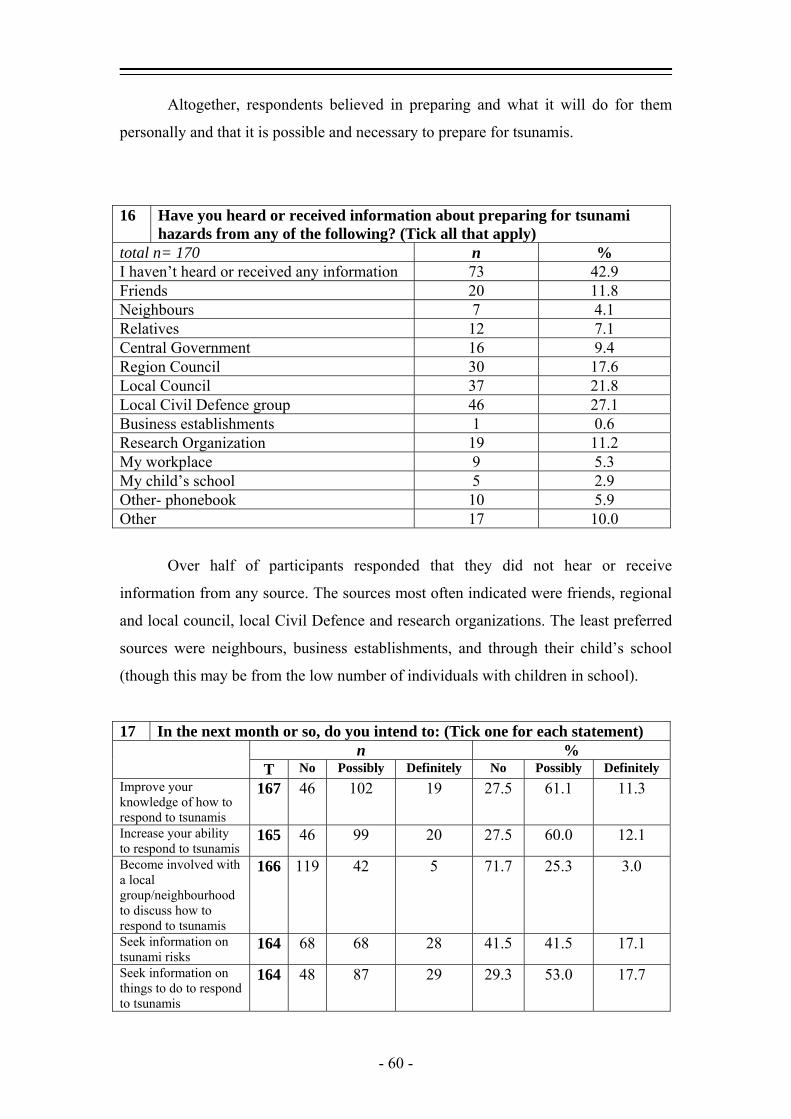
Altogether, respondents believed in preparing and what it will do for them
personally and that it is possible and necessary to prepare for tsunamis.
16 Have you heard or received information about preparing for tsunami hazards from any of the following? (Tick all that apply)
total n= 170 n % I haven’t heard or received any information 73 42.9 Friends 20 11.8 Neighbours 7 4.1 Relatives 12 7.1 Central Government 16 9.4 Region Council 30 17.6 Local Council 37 21.8 Local Civil Defence group 46 27.1 Business establishments 1 0.6 Research Organization 19 11.2 My workplace 9 5.3 My child’s school 5 2.9 Other- phonebook 10 5.9 Other 17 10.0
Over half of participants responded that they did not hear or receive
information from any source. The sources most often indicated were friends, regional
and local council, local Civil Defence and research organizations. The least preferred
sources were neighbours, business establishments, and through their child’s school
(though this may be from the low number of individuals with children in school).
17 In the next month or so, do you intend to: (Tick one for each statement) n %
T No Possibly Definitely No Possibly Definitely Improve your knowledge of how to respond to tsunamis
167 46 102 19 27.5 61.1 11.3
Increase your ability to respond to tsunamis
165 46 99 20 27.5 60.0 12.1
Become involved with a local group/neighbourhood to discuss how to respond to tsunamis
166 119 42 5 71.7 25.3 3.0
Seek information on tsunami risks
164 68 68 28 41.5 41.5 17.1
Seek information on things to do to respond to tsunamis
164 48 87 29 29.3 53.0 17.7
- 60 -
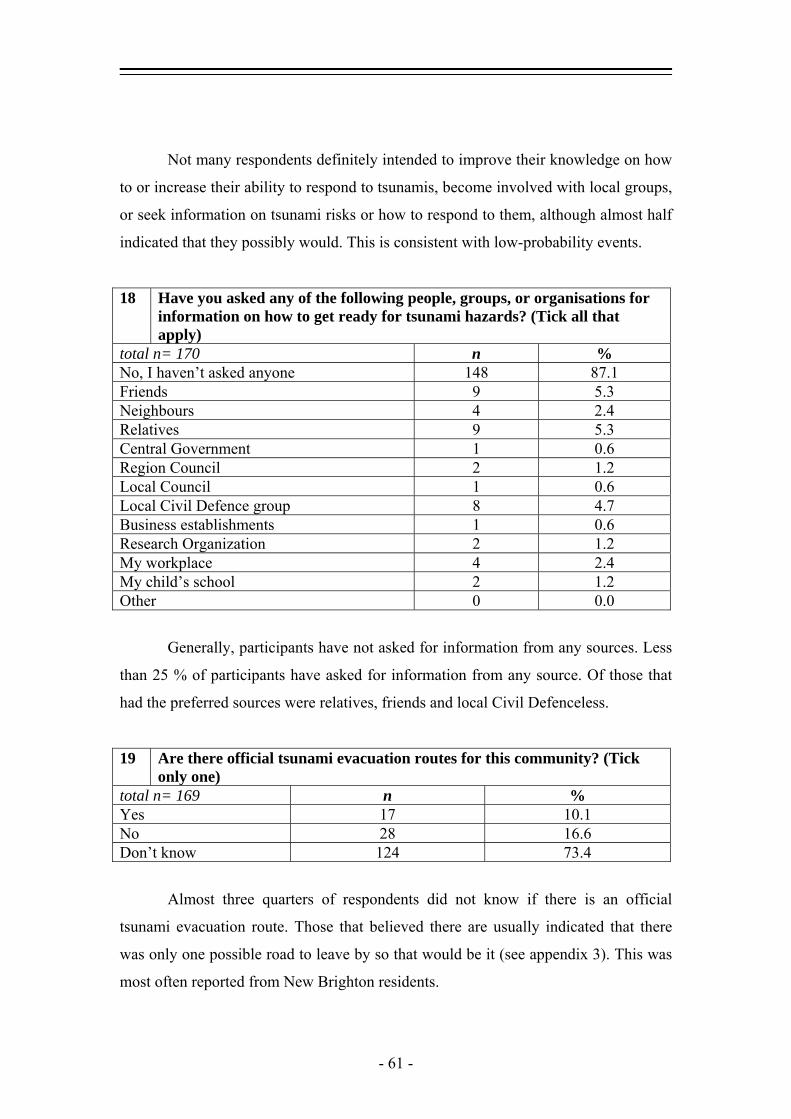
Not many respondents definitely intended to improve their knowledge on how
to or increase their ability to respond to tsunamis, become involved with local groups,
or seek information on tsunami risks or how to respond to them, although almost half
indicated that they possibly would. This is consistent with low-probability events.
18 Have you asked any of the following people, groups, or organisations for information on how to get ready for tsunami hazards? (Tick all that apply)
total n= 170 n % No, I haven’t asked anyone 148 87.1 Friends 9 5.3 Neighbours 4 2.4 Relatives 9 5.3 Central Government 1 0.6 Region Council 2 1.2 Local Council 1 0.6 Local Civil Defence group 8 4.7 Business establishments 1 0.6 Research Organization 2 1.2 My workplace 4 2.4 My child’s school 2 1.2 Other 0 0.0
Generally, participants have not asked for information from any sources. Less
than 25 % of participants have asked for information from any source. Of those that
had the preferred sources were relatives, friends and local Civil Defenceless.
19 Are there official tsunami evacuation routes for this community? (Tick only one)
total n= 169 n % Yes 17 10.1 No 28 16.6 Don’t know 124 73.4
Almost three quarters of respondents did not know if there is an official
tsunami evacuation route. Those that believed there are usually indicated that there
was only one possible road to leave by so that would be it (see appendix 3). This was
most often reported from New Brighton residents.
- 61 -
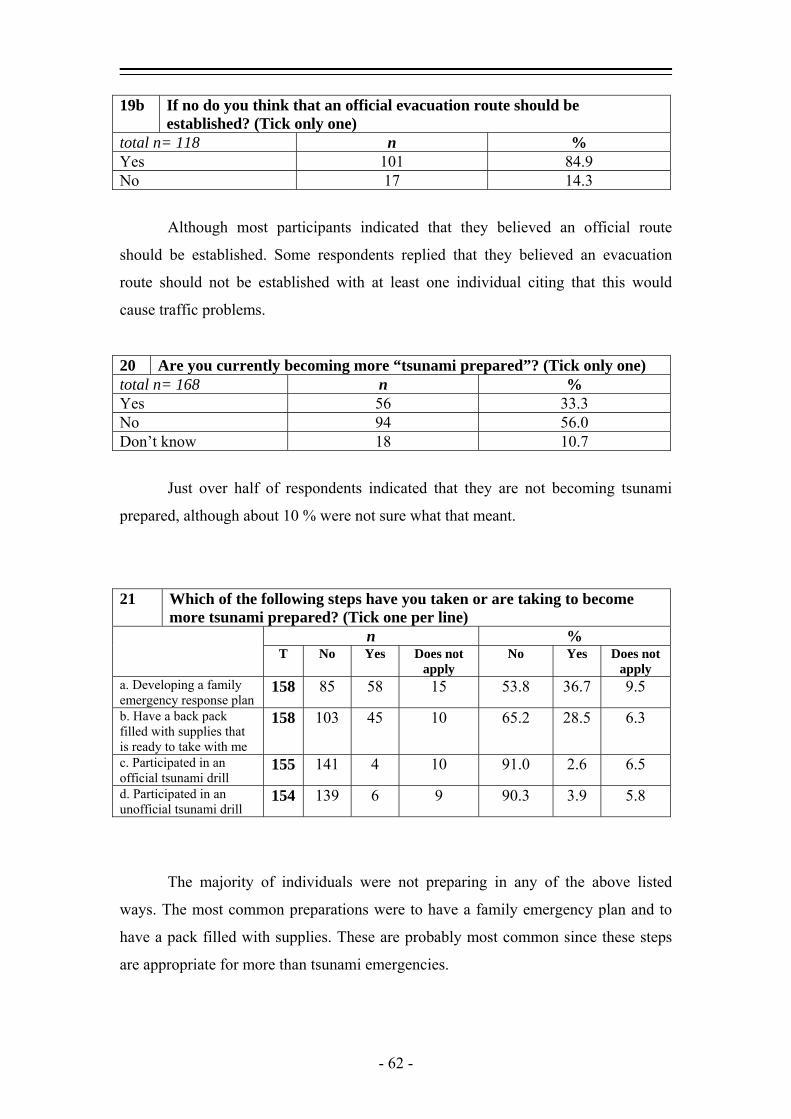
19b If no do you think that an official evacuation route should be established? (Tick only one)
total n= 118 n % Yes 101 84.9 No 17 14.3
Although most participants indicated that they believed an official route
should be established. Some respondents replied that they believed an evacuation
route should not be established with at least one individual citing that this would
cause traffic problems.
20 Are you currently becoming more “tsunami prepared”? (Tick only one) total n= 168 n % Yes 56 33.3 No 94 56.0 Don’t know 18 10.7
Just over half of respondents indicated that they are not becoming tsunami
prepared, although about 10 % were not sure what that meant.
21 Which of the following steps have you taken or are taking to become more tsunami prepared? (Tick one per line)
n % T No Yes Does not
apply No Yes Does not
apply a. Developing a family emergency response plan
158 85 58 15 53.8 36.7 9.5
b. Have a back pack filled with supplies that is ready to take with me
158 103 45 10 65.2 28.5 6.3
c. Participated in an official tsunami drill
155 141 4 10 91.0 2.6 6.5
d. Participated in an unofficial tsunami drill
154 139 6 9 90.3 3.9 5.8
The majority of individuals were not preparing in any of the above listed
ways. The most common preparations were to have a family emergency plan and to
have a pack filled with supplies. These are probably most common since these steps
are appropriate for more than tsunami emergencies.
- 62 -

22 Please indicate how much you agree or disagree that the following sources of information influenced your willingness to prepare. (Tick one per line) 1-Strongly disagree -– 5 – Strongly agree
n % T 1 2 3 4 5 1 2 3 4 5
a. Public education meetings
136 49 28 28 18 13 36.0 20.6 20.6 13.2 9.6
b. World events such as the 2004 Indian Ocean Tsunami
150 6 9 32 50 53 4.0 6.0 21.3 33.1 35.3
c. Neighbourhood educators (door to door)
134 61 23 36 8 6 45.5 17.2 26.9 5.9 4.5
d. School programs 129 48 20 30 15 16 37.2 15.5 23.3 11.6 12.4 e. Council Newsletters
146 29 17 37 39 24 19.9 11.6 25.3 26.7 16.4
f. Public tsunami drills
133 58 18 29 21 7 43.6 13.5 21.8 15.8 5.2
The sources with the greatest indicated influence are world events such as the
2004 Indian Ocean Tsunami. Most respondents disagreed that public education
meetings, neighbourhood educators, school programs, or public tsunami drills
influenced their willingness to prepare. There was mixed agreement on the
importance of council newsletters, though a newsletter was returned with one survey
(see chapter 5).
23 Did you know what a tsunami was before the 2004 Boxing Day Tsunami total n= 170 n % Yes 159 93.5 No 11 6.5
Most individuals reported that they knew what a tsunami was prior to the
Boxing Day event.
24 Since the 2004 Boxing Day Tsunami you: (Tick all that apply) total n= 170 n % Have learned more about tsunamis 111 64.5 Have actively sought more information about tsunamis 25 14.7 Feel more at risk from tsunamis 94 55.5 Feel less at risk from tsunamis 3 1.8 Have not been affected 44 25.9 Other 3 1.8
- 63 -
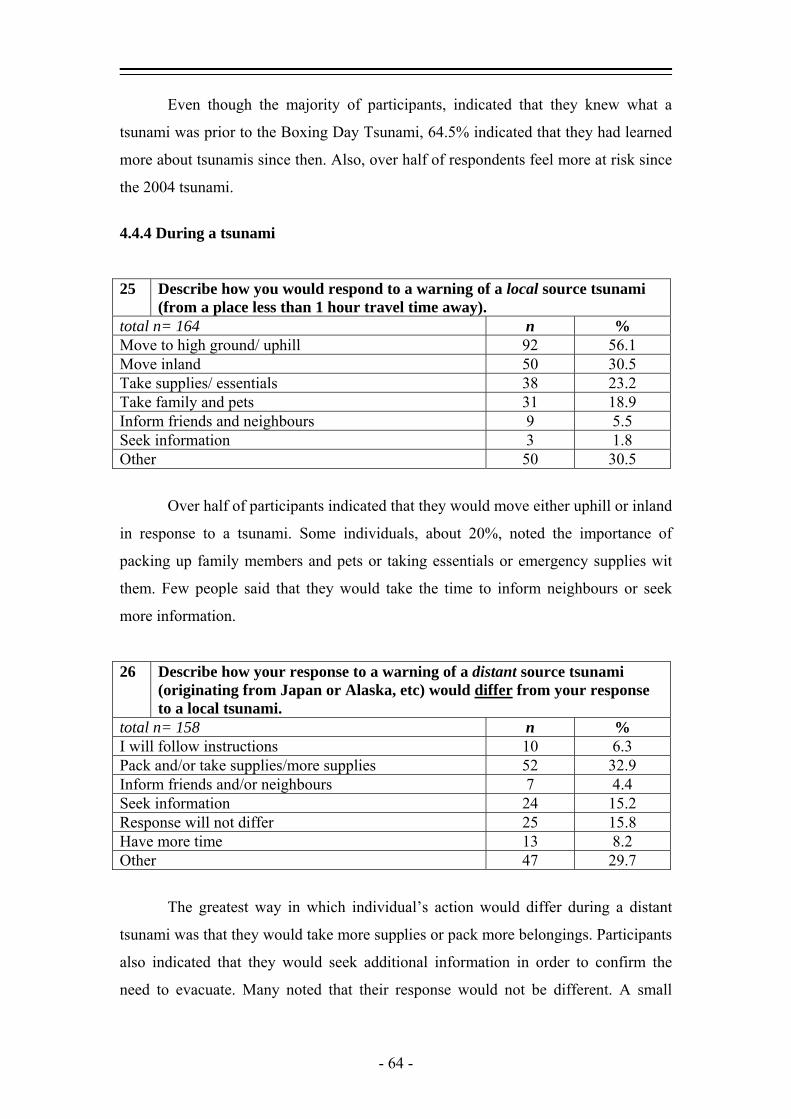
Even though the majority of participants, indicated that they knew what a
tsunami was prior to the Boxing Day Tsunami, 64.5% indicated that they had learned
more about tsunamis since then. Also, over half of respondents feel more at risk since
the 2004 tsunami.
4.4.4 During a tsunami 25 Describe how you would respond to a warning of a local source tsunami
(from a place less than 1 hour travel time away). total n= 164 n % Move to high ground/ uphill 92 56.1 Move inland 50 30.5 Take supplies/ essentials 38 23.2 Take family and pets 31 18.9 Inform friends and neighbours 9 5.5 Seek information 3 1.8 Other 50 30.5
Over half of participants indicated that they would move either uphill or inland
in response to a tsunami. Some individuals, about 20%, noted the importance of
packing up family members and pets or taking essentials or emergency supplies wit
them. Few people said that they would take the time to inform neighbours or seek
more information.
26 Describe how your response to a warning of a distant source tsunami (originating from Japan or Alaska, etc) would differ from your response to a local tsunami.
total n= 158 n % I will follow instructions 10 6.3 Pack and/or take supplies/more supplies 52 32.9 Inform friends and/or neighbours 7 4.4 Seek information 24 15.2 Response will not differ 25 15.8 Have more time 13 8.2 Other 47 29.7
The greatest way in which individual’s action would differ during a distant
tsunami was that they would take more supplies or pack more belongings. Participants
also indicated that they would seek additional information in order to confirm the
need to evacuate. Many noted that their response would not be different. A small
- 64 -
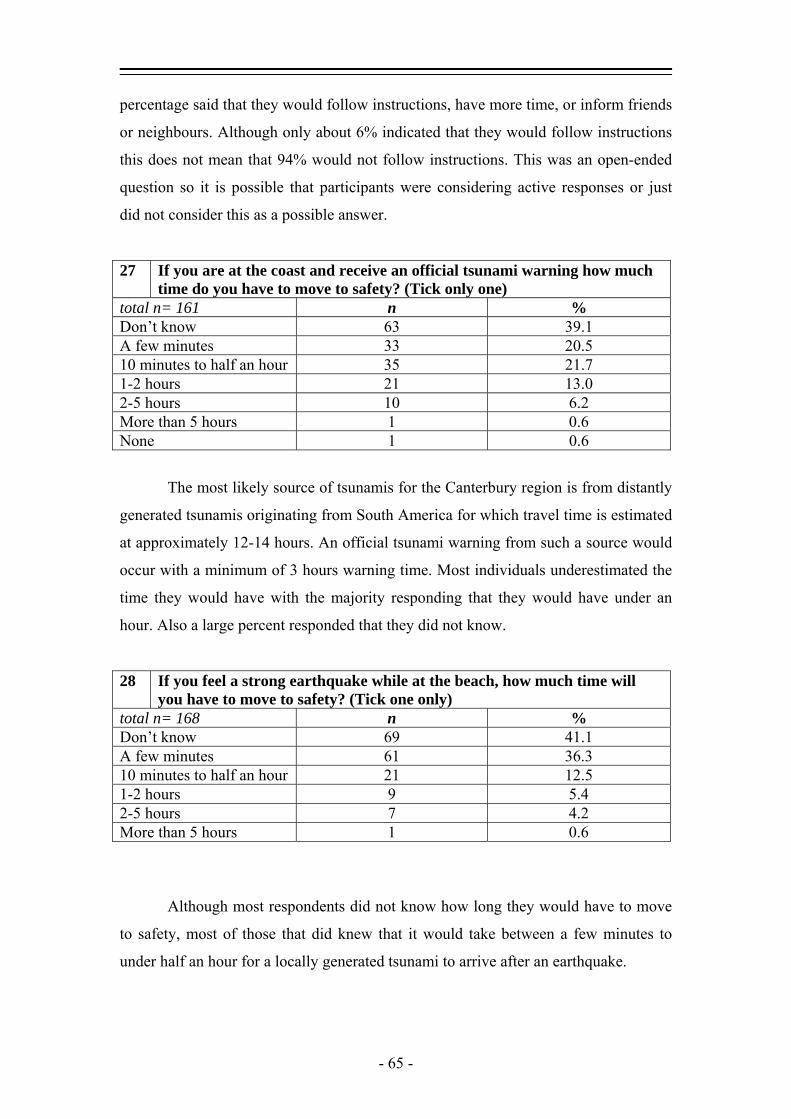
percentage said that they would follow instructions, have more time, or inform friends
or neighbours. Although only about 6% indicated that they would follow instructions
this does not mean that 94% would not follow instructions. This was an open-ended
question so it is possible that participants were considering active responses or just
did not consider this as a possible answer.
27 If you are at the coast and receive an official tsunami warning how much time do you have to move to safety? (Tick only one)
total n= 161 n % Don’t know 63 39.1 A few minutes 33 20.5 10 minutes to half an hour 35 21.7 1-2 hours 21 13.0 2-5 hours 10 6.2 More than 5 hours 1 0.6 None 1 0.6
The most likely source of tsunamis for the Canterbury region is from distantly
generated tsunamis originating from South America for which travel time is estimated
at approximately 12-14 hours. An official tsunami warning from such a source would
occur with a minimum of 3 hours warning time. Most individuals underestimated the
time they would have with the majority responding that they would have under an
hour. Also a large percent responded that they did not know.
28 If you feel a strong earthquake while at the beach, how much time will you have to move to safety? (Tick one only)
total n= 168 n % Don’t know 69 41.1 A few minutes 61 36.3 10 minutes to half an hour 21 12.5 1-2 hours 9 5.4 2-5 hours 7 4.2 More than 5 hours 1 0.6
Although most respondents did not know how long they would have to move
to safety, most of those that did knew that it would take between a few minutes to
under half an hour for a locally generated tsunami to arrive after an earthquake.
- 65 -
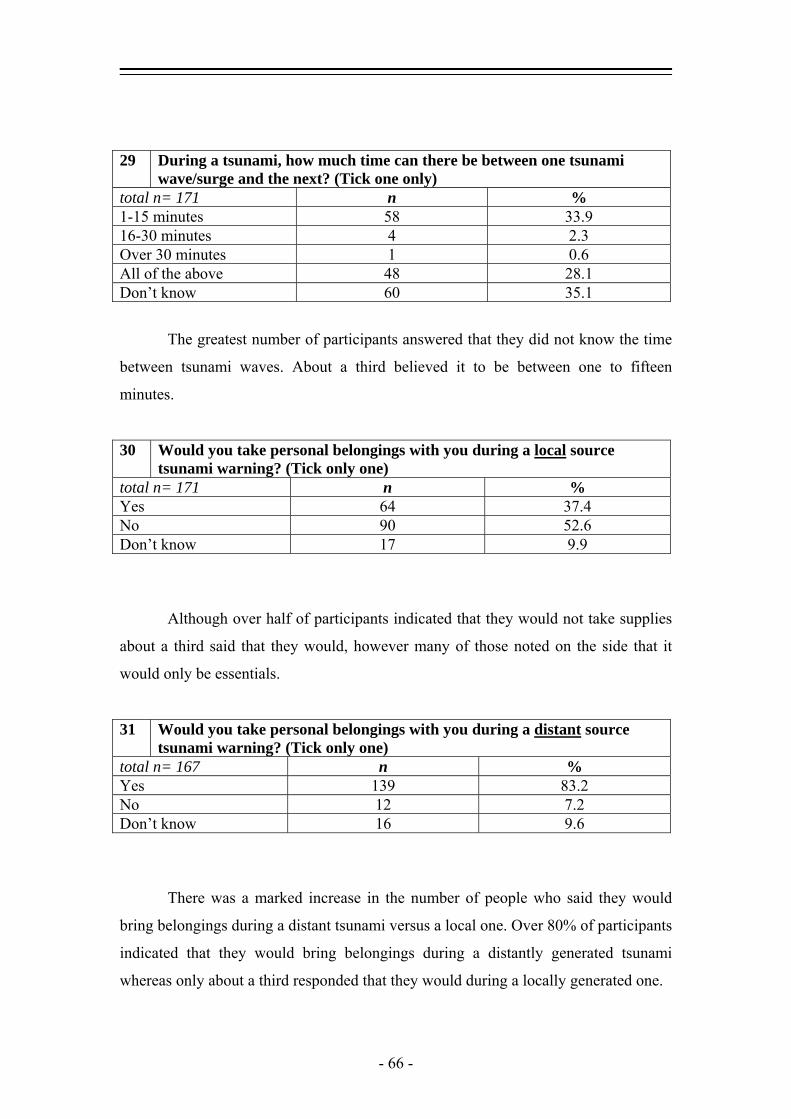
29 During a tsunami, how much time can there be between one tsunami wave/surge and the next? (Tick one only)
total n= 171 n % 1-15 minutes 58 33.9 16-30 minutes 4 2.3 Over 30 minutes 1 0.6 All of the above 48 28.1 Don’t know 60 35.1
The greatest number of participants answered that they did not know the time
between tsunami waves. About a third believed it to be between one to fifteen
minutes.
30 Would you take personal belongings with you during a local source tsunami warning? (Tick only one)
total n= 171 n % Yes 64 37.4 No 90 52.6 Don’t know 17 9.9
Although over half of participants indicated that they would not take supplies
about a third said that they would, however many of those noted on the side that it
would only be essentials.
31 Would you take personal belongings with you during a distant source tsunami warning? (Tick only one)
total n= 167 n % Yes 139 83.2 No 12 7.2 Don’t know 16 9.6
There was a marked increase in the number of people who said they would
bring belongings during a distant tsunami versus a local one. Over 80% of participants
indicated that they would bring belongings during a distantly generated tsunami
whereas only about a third responded that they would during a locally generated one.
- 66 -
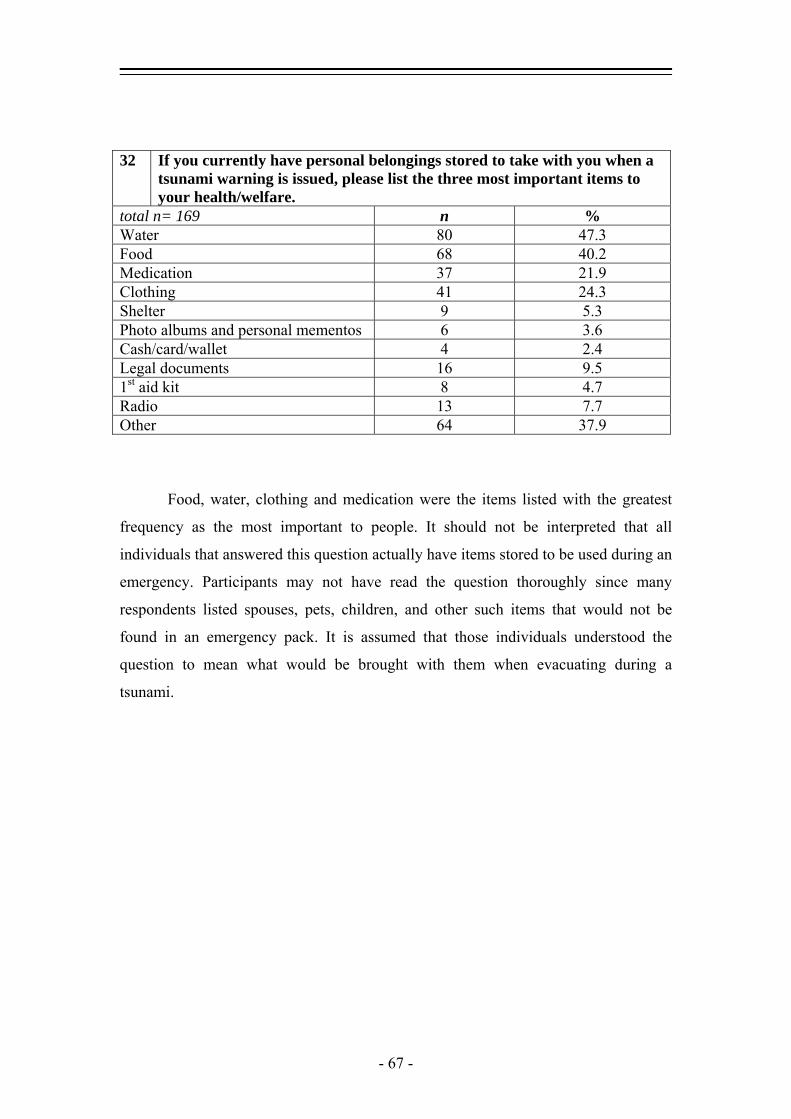
32 If you currently have personal belongings stored to take with you when a tsunami warning is issued, please list the three most important items to your health/welfare.
total n= 169 n % Water 80 47.3 Food 68 40.2 Medication 37 21.9 Clothing 41 24.3 Shelter 9 5.3 Photo albums and personal mementos 6 3.6 Cash/card/wallet 4 2.4 Legal documents 16 9.5 1st aid kit 8 4.7 Radio 13 7.7 Other 64 37.9
Food, water, clothing and medication were the items listed with the greatest
frequency as the most important to people. It should not be interpreted that all
individuals that answered this question actually have items stored to be used during an
emergency. Participants may not have read the question thoroughly since many
respondents listed spouses, pets, children, and other such items that would not be
found in an emergency pack. It is assumed that those individuals understood the
question to mean what would be brought with them when evacuating during a
tsunami.
- 67 -
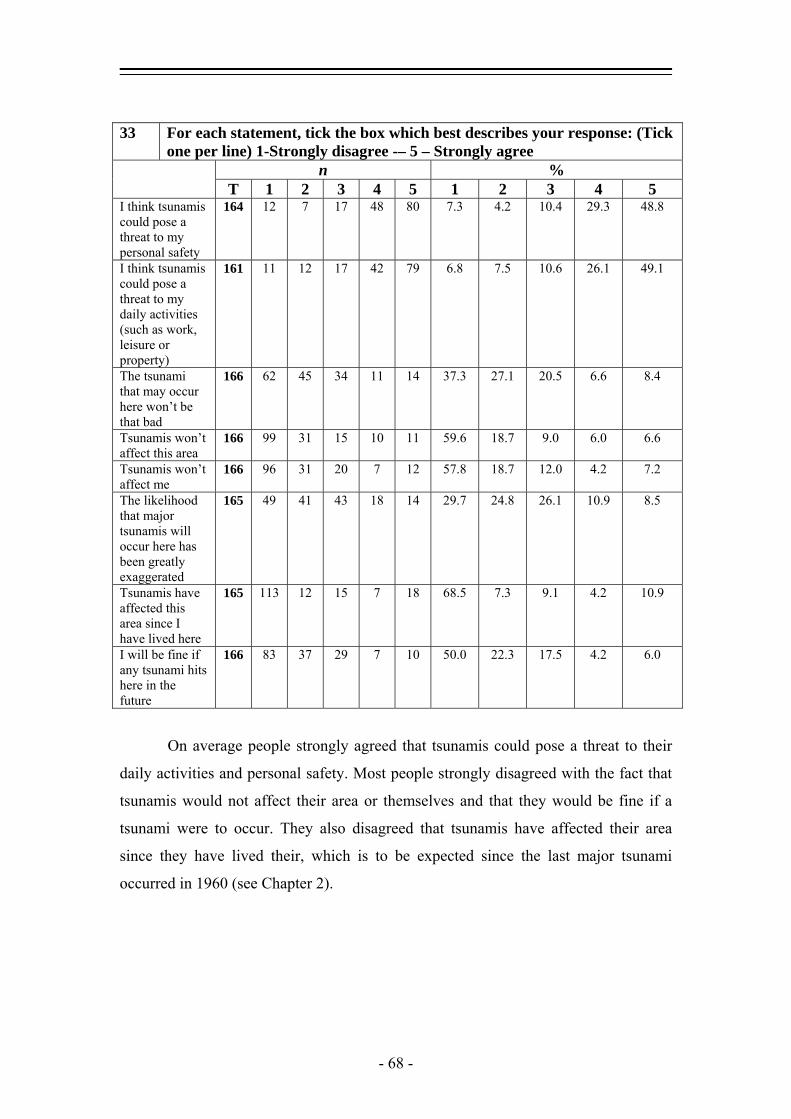
33 For each statement, tick the box which best describes your response: (Tick one per line) 1-Strongly disagree -– 5 – Strongly agree
n % T 1 2 3 4 5 1 2 3 4 5
I think tsunamis could pose a threat to my personal safety
164 12 7 17 48 80 7.3 4.2 10.4 29.3 48.8
I think tsunamis could pose a threat to my daily activities (such as work, leisure or property)
161 11 12 17 42 79 6.8 7.5 10.6 26.1 49.1
The tsunami that may occur here won’t be that bad
166 62 45 34 11 14 37.3 27.1 20.5 6.6 8.4
Tsunamis won’t affect this area
166 99 31 15 10 11 59.6 18.7 9.0 6.0 6.6
Tsunamis won’t affect me
166 96 31 20 7 12 57.8 18.7 12.0 4.2 7.2
The likelihood that major tsunamis will occur here has been greatly exaggerated
165 49 41 43 18 14 29.7 24.8 26.1 10.9 8.5
Tsunamis have affected this area since I have lived here
165 113 12 15 7 18 68.5 7.3 9.1 4.2 10.9
I will be fine if any tsunami hits here in the future
166 83 37 29 7 10 50.0 22.3 17.5 4.2 6.0
On average people strongly agreed that tsunamis could pose a threat to their
daily activities and personal safety. Most people strongly disagreed with the fact that
tsunamis would not affect their area or themselves and that they would be fine if a
tsunami were to occur. They also disagreed that tsunamis have affected their area
since they have lived their, which is to be expected since the last major tsunami
occurred in 1960 (see Chapter 2).
- 68 -
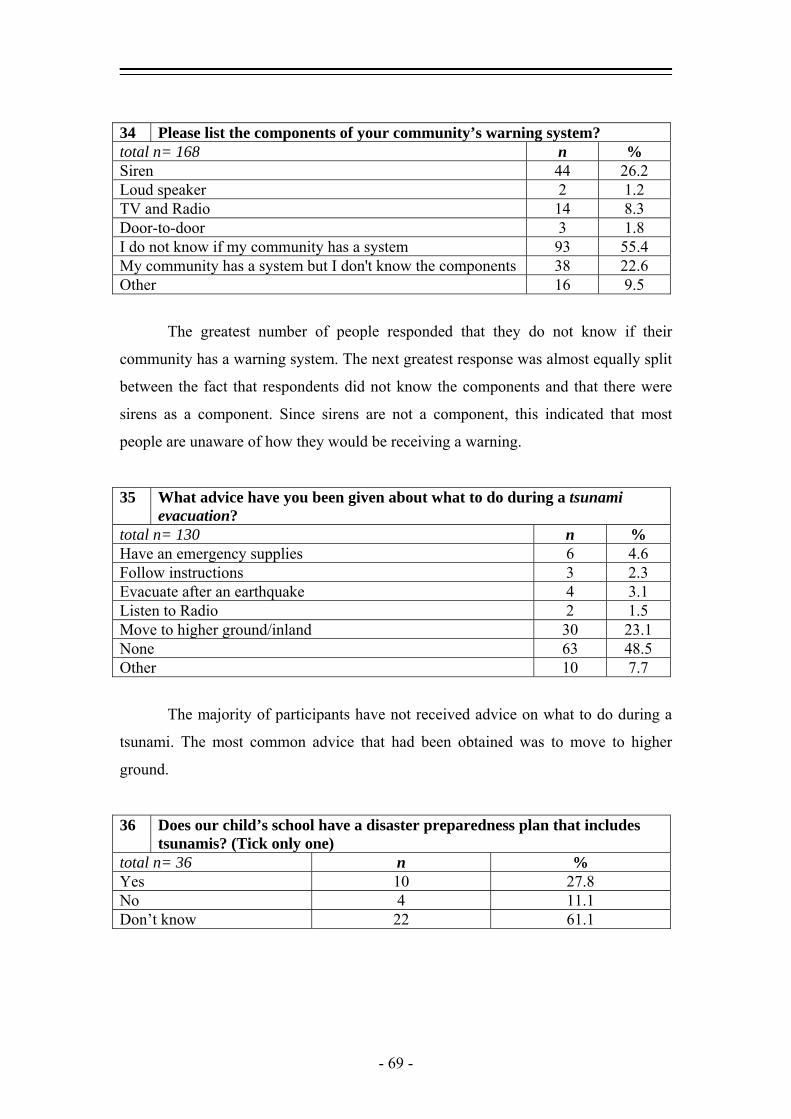
34 Please list the components of your community’s warning system? total n= 168 n % Siren 44 26.2 Loud speaker 2 1.2 TV and Radio 14 8.3 Door-to-door 3 1.8 I do not know if my community has a system 93 55.4 My community has a system but I don't know the components 38 22.6 Other 16 9.5
The greatest number of people responded that they do not know if their
community has a warning system. The next greatest response was almost equally split
between the fact that respondents did not know the components and that there were
sirens as a component. Since sirens are not a component, this indicated that most
people are unaware of how they would be receiving a warning.
35 What advice have you been given about what to do during a tsunami evacuation?
total n= 130 n % Have an emergency supplies 6 4.6 Follow instructions 3 2.3 Evacuate after an earthquake 4 3.1 Listen to Radio 2 1.5 Move to higher ground/inland 30 23.1 None 63 48.5 Other 10 7.7
The majority of participants have not received advice on what to do during a
tsunami. The most common advice that had been obtained was to move to higher
ground.
36 Does our child’s school have a disaster preparedness plan that includes tsunamis? (Tick only one)
total n= 36 n % Yes 10 27.8 No 4 11.1 Don’t know 22 61.1
- 69 -
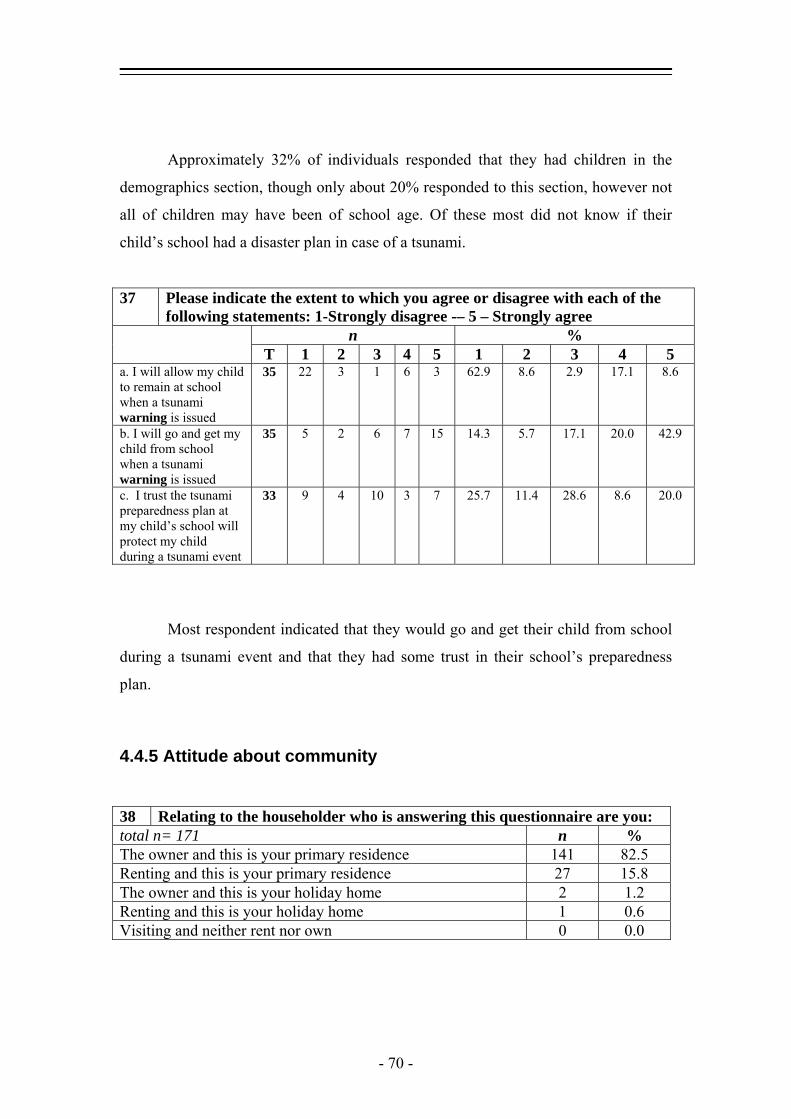
Approximately 32% of individuals responded that they had children in the
demographics section, though only about 20% responded to this section, however not
all of children may have been of school age. Of these most did not know if their
child’s school had a disaster plan in case of a tsunami.
37 Please indicate the extent to which you agree or disagree with each of the following statements: 1-Strongly disagree -– 5 – Strongly agree
n % T 1 2 3 4 5 1 2 3 4 5
a. I will allow my child to remain at school when a tsunami warning is issued
35 22 3 1 6 3 62.9 8.6 2.9 17.1 8.6
b. I will go and get my child from school when a tsunami warning is issued
35 5 2 6 7 15 14.3 5.7 17.1 20.0 42.9
c. I trust the tsunami preparedness plan at my child’s school will protect my child during a tsunami event
33 9 4 10 3 7 25.7 11.4 28.6 8.6 20.0
Most respondent indicated that they would go and get their child from school
during a tsunami event and that they had some trust in their school’s preparedness
plan.
4.4.5 Attitude about community 38 Relating to the householder who is answering this questionnaire are you: total n= 171 n % The owner and this is your primary residence 141 82.5 Renting and this is your primary residence 27 15.8 The owner and this is your holiday home 2 1.2 Renting and this is your holiday home 1 0.6 Visiting and neither rent nor own 0 0.0
- 70 -

Relating to the householder
0
10
20
30
40
50
60
70
80
90
Owner/primary residence Renting/primary residence Owner/holiday home Renting/holiday home Visiting
%
Most respondents were at their primary residence, 98.3 %, and the majority
were the owners 82.0 %. There were very few visitors were surveyed.
39 The following is a list of statement on how you feel about living in this community. Please use the scale below to show how much each statement matches your views. (Tick one per line) 1-Strongly disagree -– 5 – Strongly agree
n % T 1 2 3 4 5 1 2 3 4 5
I feel ‘at home’ in this community 164 0 2 19 45 98 0.0 1.2 11.6 27.4 59.8 I am satisfied living in this community
163 0 4 12 54 93 0.0 2.5 7.4 33.1 57.0
I am a useful member of this community
161 6 22 51 38 44 3.7 13.7 31.7 23.6 27.3
I have the same values and beliefs as my neighbours
153 5 26 47 40 35 3.3 17.0 30.7 26.1 22.9
I feel I don’t belong in this community
159 112 25 17 3 2 70.4 15.7 10.7 1.8 1.3
I am interested in what goes on in this community
164 8 13 29 56 58 4.9 7.9 17.7 34.1 35.4
I would be happy to leave this community
158 75 24 39 11 9 47.5 15.2 24.7 7.0 5.7
I know my neighbours and/or other community members
164 17 12 24 62 49 10.4 7.3 14.6 37.8 29.9
I have no active involvement in this community
160 48 31 33 28 20 30.0 19.4 20.6 17.5 12.5
- 71 -

Most people felt both at home and satisfied living in their community. People
felt moderately useful and interested in their community and about a third felt that
they knew their neighbours and community members. Few people felt that they would
be happy to leave or like they did not belong. Overall, participants had positive
feelings about the community they were living in.
41 What are your main reasons for choosing to live in this community? (Choose the TWO most important reasons from the list below).
total n= 165 n % The natural beauty of the coast 97 58.8 Sea views 32 19.4 Escape from city life 69 41.8 Easy access to the beach 58 35.2 Fishing and shellfish gathering 8 4.8 Boating 7 4.2 Recreation (swimming, surfing, walking etc) 55 33.3 Sunbathing 4 2.4 Other 31 18.8
The main reasons given for choosing the community were due to the natural
beauty of the coast and to escape from city life. Access to the beach, sea views, and
recreation were also considered to be important. Of the “other” responses the most
common were family, work and cost.
42 How often do you visit this community? (Tick one only) total n= 3 n % Very infrequently (once a year or less) 0 0.0 Infrequently (2-3 times per year) 0 0.0 Frequently (4-6 times per year) 1 33.3 Very frequently (at least 6 times per year) 2 66.7
All of the few visitors described the frequency of their visits as very often with
four or more visits a year being usual. Two of the visitors are from Christchurch so
such frequent visits would not be unusual and although the third is from Australia, he
indicated that his reason for visiting was business.
- 72 -
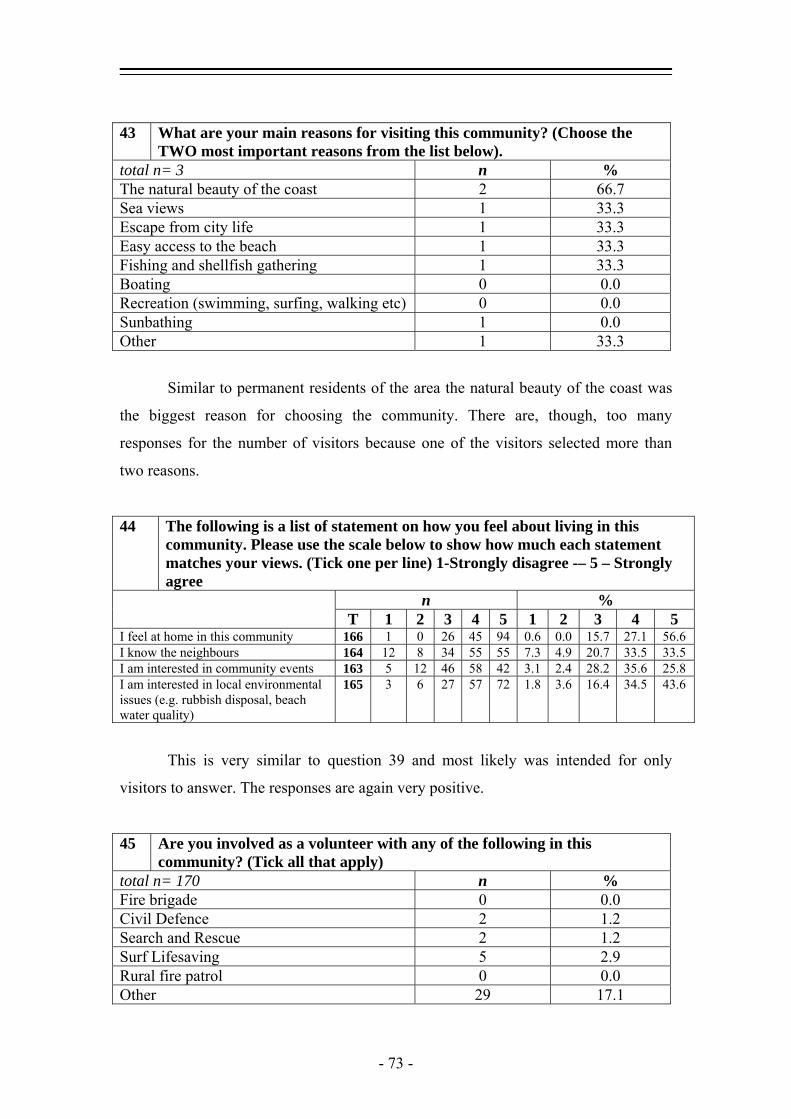
43 What are your main reasons for visiting this community? (Choose the TWO most important reasons from the list below).
total n= 3 n % The natural beauty of the coast 2 66.7 Sea views 1 33.3 Escape from city life 1 33.3 Easy access to the beach 1 33.3 Fishing and shellfish gathering 1 33.3 Boating 0 0.0 Recreation (swimming, surfing, walking etc) 0 0.0 Sunbathing 1 0.0 Other 1 33.3
Similar to permanent residents of the area the natural beauty of the coast was
the biggest reason for choosing the community. There are, though, too many
responses for the number of visitors because one of the visitors selected more than
two reasons.
44 The following is a list of statement on how you feel about living in this community. Please use the scale below to show how much each statement matches your views. (Tick one per line) 1-Strongly disagree -– 5 – Strongly agree
n % T 1 2 3 4 5 1 2 3 4 5
I feel at home in this community 166 1 0 26 45 94 0.6 0.0 15.7 27.1 56.6 I know the neighbours 164 12 8 34 55 55 7.3 4.9 20.7 33.5 33.5 I am interested in community events 163 5 12 46 58 42 3.1 2.4 28.2 35.6 25.8 I am interested in local environmental issues (e.g. rubbish disposal, beach water quality)
165 3 6 27 57 72 1.8 3.6 16.4 34.5 43.6
This is very similar to question 39 and most likely was intended for only
visitors to answer. The responses are again very positive.
45 Are you involved as a volunteer with any of the following in this community? (Tick all that apply)
total n= 170 n % Fire brigade 0 0.0 Civil Defence 2 1.2 Search and Rescue 2 1.2 Surf Lifesaving 5 2.9 Rural fire patrol 0 0.0 Other 29 17.1
- 73 -
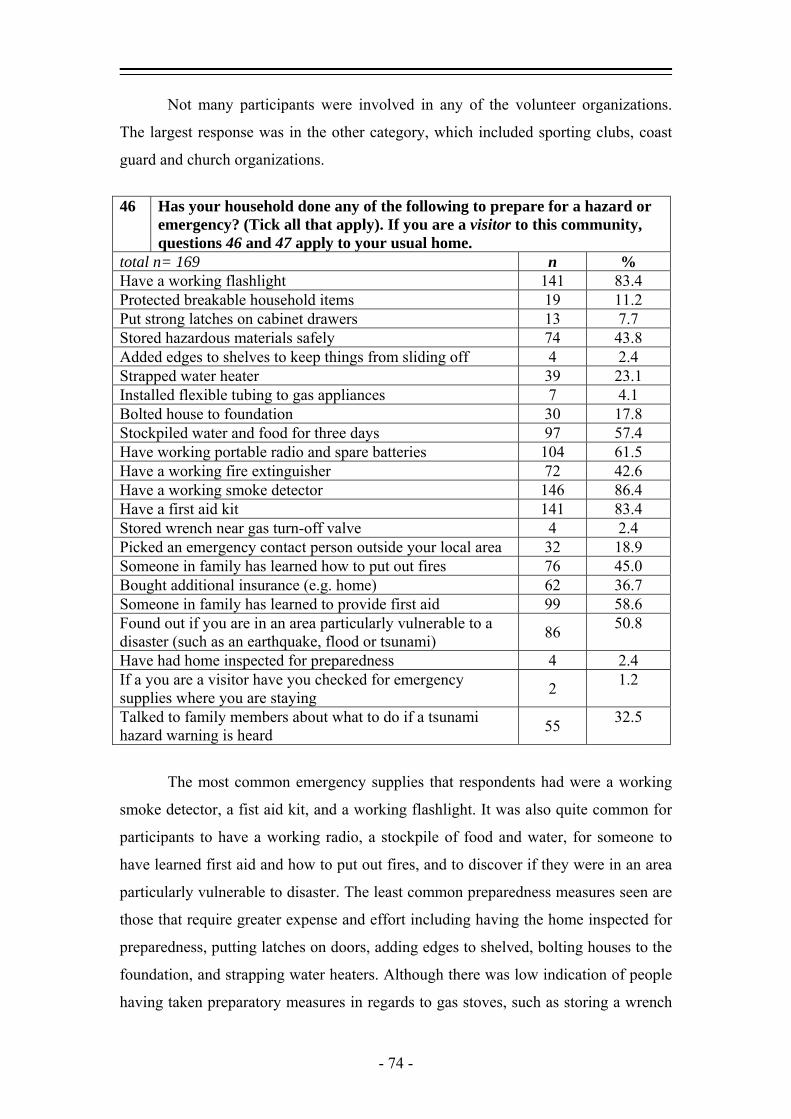
Not many participants were involved in any of the volunteer organizations.
The largest response was in the other category, which included sporting clubs, coast
guard and church organizations.
46 Has your household done any of the following to prepare for a hazard or
emergency? (Tick all that apply). If you are a visitor to this community, questions 46 and 47 apply to your usual home.
total n= 169 n % Have a working flashlight 141 83.4 Protected breakable household items 19 11.2 Put strong latches on cabinet drawers 13 7.7 Stored hazardous materials safely 74 43.8 Added edges to shelves to keep things from sliding off 4 2.4 Strapped water heater 39 23.1 Installed flexible tubing to gas appliances 7 4.1 Bolted house to foundation 30 17.8 Stockpiled water and food for three days 97 57.4 Have working portable radio and spare batteries 104 61.5 Have a working fire extinguisher 72 42.6 Have a working smoke detector 146 86.4 Have a first aid kit 141 83.4 Stored wrench near gas turn-off valve 4 2.4 Picked an emergency contact person outside your local area 32 18.9 Someone in family has learned how to put out fires 76 45.0 Bought additional insurance (e.g. home) 62 36.7 Someone in family has learned to provide first aid 99 58.6 Found out if you are in an area particularly vulnerable to a disaster (such as an earthquake, flood or tsunami) 86 50.8
Have had home inspected for preparedness 4 2.4 If a you are a visitor have you checked for emergency supplies where you are staying 2 1.2
Talked to family members about what to do if a tsunami hazard warning is heard
32.5 55
The most common emergency supplies that respondents had were a working
smoke detector, a fist aid kit, and a working flashlight. It was also quite common for
participants to have a working radio, a stockpile of food and water, for someone to
have learned first aid and how to put out fires, and to discover if they were in an area
particularly vulnerable to disaster. The least common preparedness measures seen are
those that require greater expense and effort including having the home inspected for
preparedness, putting latches on doors, adding edges to shelved, bolting houses to the
foundation, and strapping water heaters. Although there was low indication of people
having taken preparatory measures in regards to gas stoves, such as storing a wrench
- 74 -

nearby, this is from fewer respondents having gas utilities. Most participants indicated
N/A next to gas related questions.
Although only two people indicated that they had checked their emergency
supplies at the location they were staying while visiting this is due to the low number
of visitors that were surveyed.
47 How often do you check your emergency supplies like food, water, and
batteries? (Tick one only) total n= 162 n % Weekly 12 7.4 Monthly 55 34.0 Yearly 40 24.7 Never 50 30.9
The largest percent of participants checked their emergency supplies on a
monthly basis, though almost as often supplies were never checked. Very few people,
less than 7 percent, checked items on a weekly basis.
48 If you are visiting this community, where is your usual place of residence? Avonhead, Christchurch Patons Rock, Takaka, Golden Bay Sumner, Christchurch
Very few respondents were visitors, two out of three of which, were from
Christchurch.
49 If you live in this community: n avg. (yrs) σ min max a) How long have you lived in this community 162 14.4 13.8 .1 70
b) How long have you lived in your current home 143 10.6 10.4 .1 55
- 75 -
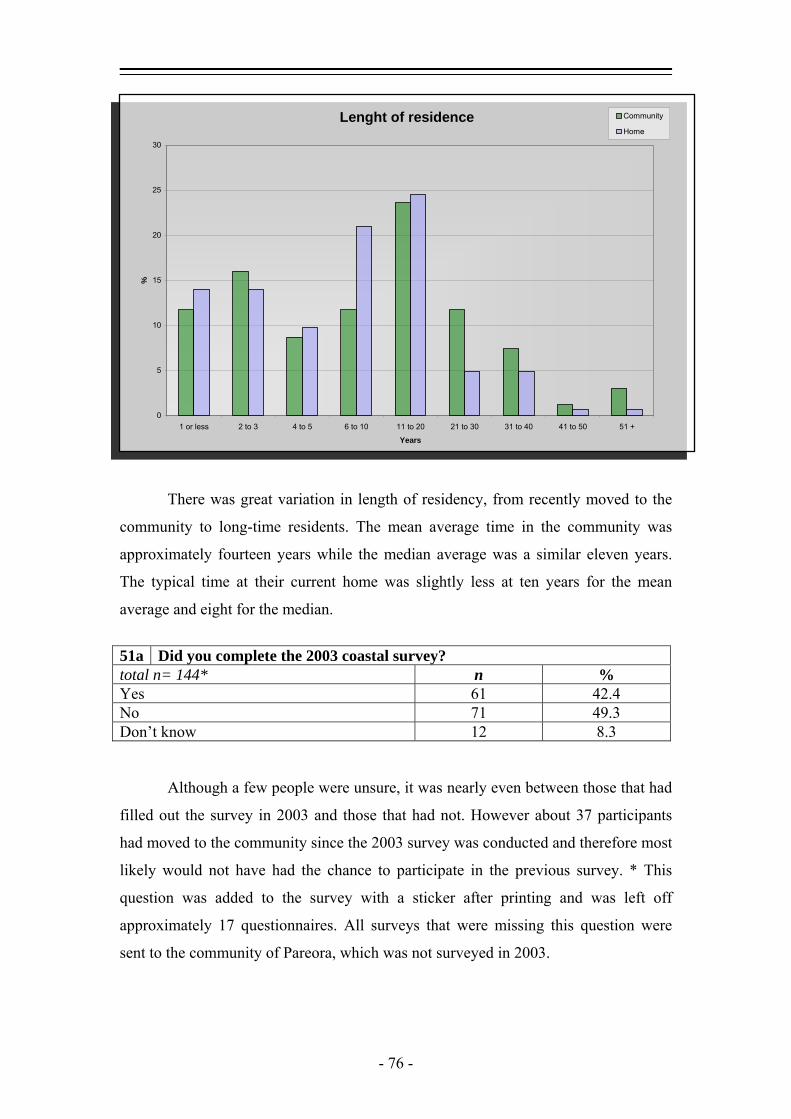
Lenght of residence
0
5
10
15
20
25
30
1 or less 2 to 3 4 to 5 6 to 10 11 to 20 21 to 30 31 to 40 41 to 50 51 +
Years
%
Community
Home
There was great variation in length of residency, from recently moved to the
community to long-time residents. The mean average time in the community was
approximately fourteen years while the median average was a similar eleven years.
The typical time at their current home was slightly less at ten years for the mean
average and eight for the median.
51a Did you complete the 2003 coastal survey? total n= 144* n % Yes 61 42.4 No 71 49.3 Don’t know 12 8.3
Although a few people were unsure, it was nearly even between those that had
filled out the survey in 2003 and those that had not. However about 37 participants
had moved to the community since the 2003 survey was conducted and therefore most
likely would not have had the chance to participate in the previous survey. * This
question was added to the survey with a sticker after printing and was left off
approximately 17 questionnaires. All surveys that were missing this question were
sent to the community of Pareora, which was not surveyed in 2003.
- 76 -
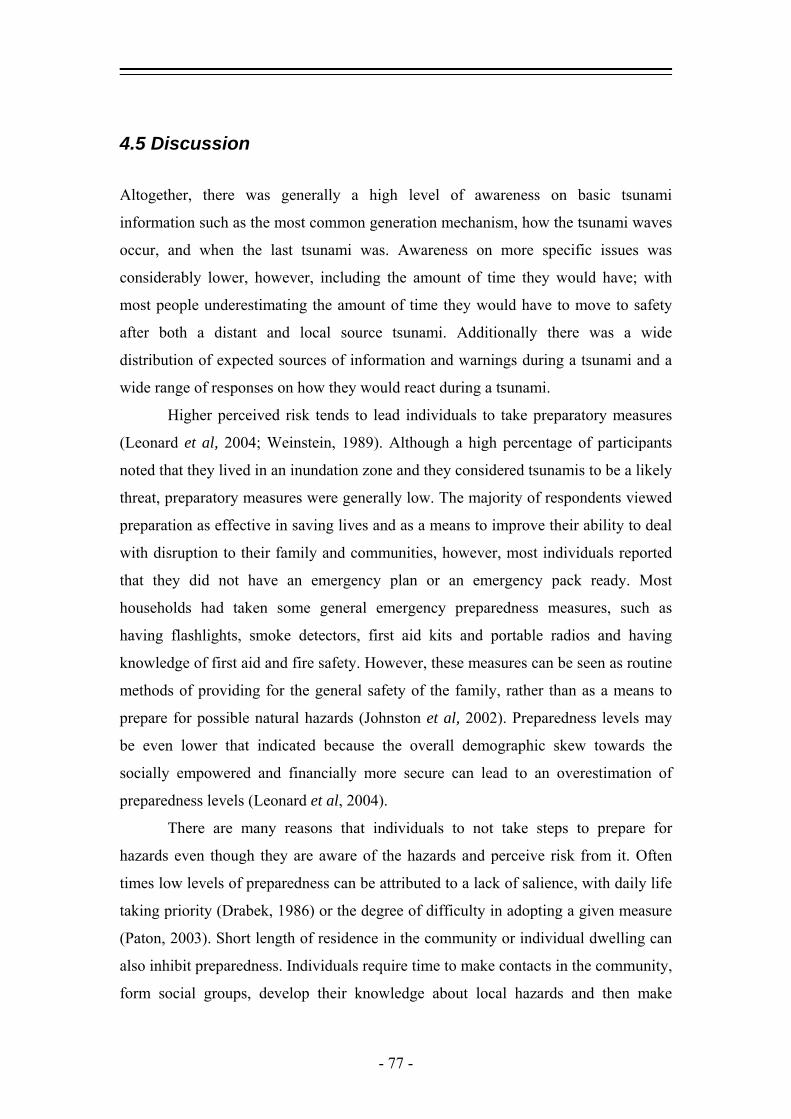
4.5 Discussion
Altogether, there was generally a high level of awareness on basic tsunami
information such as the most common generation mechanism, how the tsunami waves
occur, and when the last tsunami was. Awareness on more specific issues was
considerably lower, however, including the amount of time they would have; with
most people underestimating the amount of time they would have to move to safety
after both a distant and local source tsunami. Additionally there was a wide
distribution of expected sources of information and warnings during a tsunami and a
wide range of responses on how they would react during a tsunami.
Higher perceived risk tends to lead individuals to take preparatory measures
(Leonard et al, 2004; Weinstein, 1989). Although a high percentage of participants
noted that they lived in an inundation zone and they considered tsunamis to be a likely
threat, preparatory measures were generally low. The majority of respondents viewed
preparation as effective in saving lives and as a means to improve their ability to deal
with disruption to their family and communities, however, most individuals reported
that they did not have an emergency plan or an emergency pack ready. Most
households had taken some general emergency preparedness measures, such as
having flashlights, smoke detectors, first aid kits and portable radios and having
knowledge of first aid and fire safety. However, these measures can be seen as routine
methods of providing for the general safety of the family, rather than as a means to
prepare for possible natural hazards (Johnston et al, 2002). Preparedness levels may
be even lower that indicated because the overall demographic skew towards the
socially empowered and financially more secure can lead to an overestimation of
preparedness levels (Leonard et al, 2004).
There are many reasons that individuals to not take steps to prepare for
hazards even though they are aware of the hazards and perceive risk from it. Often
times low levels of preparedness can be attributed to a lack of salience, with daily life
taking priority (Drabek, 1986) or the degree of difficulty in adopting a given measure
(Paton, 2003). Short length of residence in the community or individual dwelling can
also inhibit preparedness. Individuals require time to make contacts in the community,
form social groups, develop their knowledge about local hazards and then make
- 77 -
preparatory adjustments to those hazards (Leonard et al, 2004). Over half of
respondents, though, had lived in their home and community for over five years,
which is sufficient time to have taken preparedness measures. Whether an individual
owns or rents their residence can also affect willingness to prepare. Renters can be
less likely to adopt some measures because they may not be allowed to make
structural changes such as securing furniture or water heaters due to their lease
agreements. Additionally, they may not see themselves as having a vested interest in
doing so because of either the temporary nature of renting (Leonard et al, 2004) or
lack of personal responsibility in making permanent improvements to the property.
This does not account for the lack of preparedness amongst those surveyed, though,
because over 80% of respondents were homeowners at their primary residence.
- 78 -
Chapter 5
Variations in Risk Perception between Residents and Visitors
5.1 Introduction
Populations of coastal areas undergo a great increase during the summer season due to
the influx of tourists. This increase in population increases risk from tsunamis by
exposing more people who are less likely to be aware of local hazards and how to
respond to them (Alexander, 2002). Residents tend to be more informed and have
more experience whereas tourist have lower risk perceptions, and will be less likely to
make appropriate decisions regarding self-protective actions (Drabek, 2000).
Surveying was undertaken during the peak summer months to ascertain tourist views
of tsunami hazards. This was later followed up by a residential survey. Comparison of
these surveys can reveal the differences in perception and knowledge between these
two groups.
5.2 Risk perception
5.2.1 Introduction
Individual’s ideas about risk are quite different from that of professionals’ (Slovic,
2000; Kates et al, 1993; Kasperson et al, 1988; Burton and Kates, 1964).
Professionals use risk analysis, the measurement of risk using the factors of
magnitude of the potential loss L, and the probability p that the loss will occur
(Wikipedia, 2007) to determine the level of risk posed by natural hazards, whereas
this process for the average individual relies more on their instinctive reasoning or
their innate judgement of risk referred to as their risk perception (Slovic, 1987;
Slovic, 2000). Moreover, professional often determine risk by estimating probably
mortalities (Covello, 1983; Lindell and Perry, 1992) which does not factor highly into
individual’s perception of risk (Lindell, and Perry, 1992; Slovic, 2000).
- 79 -
Risk perception results from a combination of social and cultural processes
through which hazards are understood (Zschau and Küppers, 2003). “Community
emergency planners are most likely to be successful in gaining compliance with their
recommendations for protective actions if they understand how those who receive
their warning messages interpret the information provided” (Lindell and Perry, 1992).
The affects of natural hazards can be greatly amplified if the at risk population does
not believe in the possibility that such an event will occur and therefore does not take
preparatory measures (Burton and Kates, 1964). Experience, the media and
demographic factors are some of the variables that affect people’s risk perception.
5.2.2 Experience
In general, experience with a hazard will increase the risk perception
(Kasperson et al, 1988) by increasing awareness of the event (Baker, 1991). People
with personal experience are more likely think of the risks more often, to be able to
recognize the risks associated with a hazard, to see hazards as occurring more
frequently, to view themselves as potential victims, and are therefore more likely to
take preparatory measure for the future (Weinstein, 1989). Although many studies
have positively linked an increase in perceived risk with experience (Weinstein, 1989,
Saarinen, 1982) for natural hazards this increase may only be short-lived and may
relate to the severity of the experience (Weinstein, 1989), the more severe the longer
it is remembered. Risk perception is affected more by regular and repeated experience
than with single occurrences. Even experience with a false alarm, where an
unnecessary evacuation has occurred, can lead to an increase in risk perception (Vogt
and Sorensen, 1992) and as long as the reasons for the evacuation are presented to the
public this will not decrease willingness to evacuate in the future (Vogt and Sorensen,
1992; Dow and Cutter, 1998; Lindell and Perry, 1992).
Experience, however, does not always increase perceived risk. Individuals
who have experienced minor effects that are considerably smaller than what can
potentially occur from a hazard will feel that they have had experience with the
hazard. This is referred to as “false experience” (Baker, 1991) or a “normalisation
bias” (Johnston et al, 1999; Johnston et al, 2002; Leonard et al, 2004). This
commonly occurs with hurricanes during which those who were on the fringes of the
- 80 -

storm or have been through a minor one feel that they have experience what a
hurricane is like (Drabek, 1986; Baker, 1991; Weinstein, 1989; Lindell and Perry,
1992). Those with false experience will have a lower risk perception than those
without, especially because individuals often assume that the next occurrence of the
hazard will have the same severity as the last one (Weinstein, 1989). Long-time
residents of an area are more likely to have false experience and therefore can have
lowered risk perception (Baker, 1991).
On the other hand, people who have experienced relatively small hazards
events will sometimes overlook there experience altogether, only considering
experience that has involved fatalities or damage (Gregory et al, 1997). This will also
lead to a lowering of risk perception with individuals believing that the hazard has
never occurred in their location.
Another effect of experience is that once a rare or low-probability event has
occurred, residents will believe that it will not happen again, exemplifying the attitude
that “lighting never strikes the same place twice” (Drabek, 1986; Lindell and Perry,
1992; Burton and Kates, 1964) or that the odds are that it will not occur again for a
long time (Lindell and Perry, 1992).
5.2.3 The media
Since risk from natural hazards rarely includes experience with the actual
hazard (Rogers, 1997) individuals commonly learn of risks from media sources
(Slovic, 2000; Kasperson et al, 1988) such as television, radio and newspapers. In
fact, in one report 60 to 75% of respondents had indicated that radio and television
were important sources of hazard information and sometimes these were the only
sources (Drabek, 1986).
So to what degree does the media affect the way risks are perceived? It has
been described of the media that by selecting, emphasizing, and arranging the
information it conveys to the public the media constructs reality instead of merely
reflecting it and it presents a superficial and fragmentary viewpoint (Singer and
Endreny, 1993).
By choosing what information to present and what emphasis to place on it, the
media has a definite influence on public risk perception. Generally, people
- 81 -
overestimate risks from well-publicised hazards and underestimated the likeliness of
those that are underreported or not reported at all (Singer and Endreny, 1993). A
particular example is the fear of radiation from nuclear power plants, which the
publics' perceived risk of is disproportionately high compared to experts (Slovic,
1987; Slovic 2000; Kasperson et al, 1988). The Three Mile Island and Chernobyl
accidents have substantially increased the risks associated with nuclear power and
over-dramatized headlines afterwards “certainly increased public fears near the
nuclear power plant (and around the world)” (Slovic, 2000).
Although the media is supposed to report facts after an event in an unbiased
manner a number of factors affect how and what are actually reported. Audience
interests, deadlines (Singer and Endreny, 1993), cultural biases, and profit (Miles and
Morse, 2006) influence media coverage to varying degrees. Media often
overemphasises the dramatic giving more coverage to rare events or those with higher
fatalities (Singer and Endreny, 1993; Slovic, 2000). This can lead to media hypes,
giving more and more attention to unusual events (Miles and Morse, 2006).
The media can also skew views on risk from inaccuracy or distortion in
reporting (Slovic, 2000). Reporting errors can occur from attempting to present
technical information in a more easily understood manner (Miles and Morse, 2006)
omissions of facts or overgeneralization in order to shorten reports, alterations or
distortions used for emphasis, or outright errors (Singer and Endreny, 1993).
5.2.4 Demographic factors
Gender
It is well documented that there are differences in risk perception related to
gender (Slovic, 2000; Riad at al, 1998; Bateman and Edwards, 2002; Drabek, 1986).
In general, men tend to perceive less overall risk or to judge risks as smaller. Women,
on the other hand, are more likely to perceive disasters as serious or risky (Bateman
and Edwards, 2002; Riad et al, 1998).
There are a number of social reasons given for females being more risk averse
and having higher perceived risks than male. One of the reasons is that women are
considered to be socially conditioned towards having a nurturing attitude, leading
them to be more concerned about health and safety issues (Slovic, 2000).
- 82 -

Also women are seen as being “risk avoiders” whereas males are considered to
be “risk takers” (Bateman and Edwards, 2002). This can be attributed to the fact that
men and women occupy different societal positions of authority. Men perceive less
risk than women because they “more often feel empowered and in control” whereas
the opposite holds true for women (Bateman and Edwards, 2002). Males were also
more likely to have higher levels of education and income (Slovic, 2000), which tends
to add to feelings of security and reduce feelings of vulnerability.
Ethnicity
This is not as well studied as gender differences and risk perception and
findings have been somewhat inconclusive because of the many other factors that
determine an individual’s perception of risk (Drabek, 1986). Overall, minorities
experience higher perceived risks especially in comparison to caucasian males
(Slovic, 2000). Ethnic minorities are in the same societal position as women and are
more likely to feel a lack of control and power, which leads to feeling more
vulnerable, and a heightened sense of risk (Bateman and Edwards, 2002).
5.2.5 Other factors
Many other factors have been suggested to have some influence on perceived
risk, although there is not detailed documentation on how. These include
controllability, (Slovic, 2000; Covello, 1983), age, residential setting (Drabek, 1986),
dread, potential for mass fatalities, personal exposure, hazards with unknown risk,
new risks (Lindell and Perry, 1992), familiarity with the hazard, voluntariness of the
hazard, hazards with delayed consequences, potential to affect future generations, and
potential for catastrophe (Slovic, 2000; Covello, 1983; Lindell and Perry, 1992).
- 83 -
5.3 Natural hazards and the tourist industry
The tourism industry is sensitive to the impact of natural disasters and as one of the
world’s largest economic sectors (WTO, 2006) much of the literature in regard to
tourism and natural hazards focuses on recovery of the industry after an event
(Pottorff and Neal, 1994; Huang and Min, 2002; Milo and Yoder, 1991; Durocher,
1994; and Barton, 1994). And although, there is a growing body of literature on
disaster planning and evacuating for the industry (Drabek, 1993; Drabek, 1995a;
Murphy and Bailey, 1989; and Barton, 1994) there is little regarding tourist behaviour
(Drabek, 1996) or perception of hazards (Johnston et al, 2005). There is a definite
need for incorporating non-residents requirements into disaster planning (Murphy and
Bailey, 1989) especially since a lack of planning has been exhibited by tourist
industry executives (Drabek, 1995b). When it comes to natural hazards, though,
tourists represent a particularly vulnerable group for several reasons.
Visitors often frequent
exotic beachfront or mountainous
locations that are susceptible to
natural disasters (Murphy and
Bailey, 1989; Faulkner, 2001).
Yet tourists, who are often
unfamiliar with the locations they
visit, are also unlikely to be
aware of the potential hazards
(Drabek, 2000, Alexander, 2002;
WTO/WMO, 1998; Faulkner,
2001, Murphy and Bailey, 1989)
let alone what to do during a disaster or how the warning systems work. Johnston et al
(2005) surveyed both visitors and residents of coastal Washington communities where
extensive public education on tsunamis including warning and evacuation signs
(figure 5.1), public displays, books, pamphlet and school kits, has been ongoing for
many years. While these efforts had been moderately to highly effective amongst
residents, Johnston et al (2005) found that tourist knew less about the hazard and
warning systems and overall were less aware about tsunami issues. While
approximately three quarters of residents had heard or received information on
Figure 5.1: Tsunami warning sign such as those used in the Washington state public education program (Atwater et al, 2005).
- 84 -
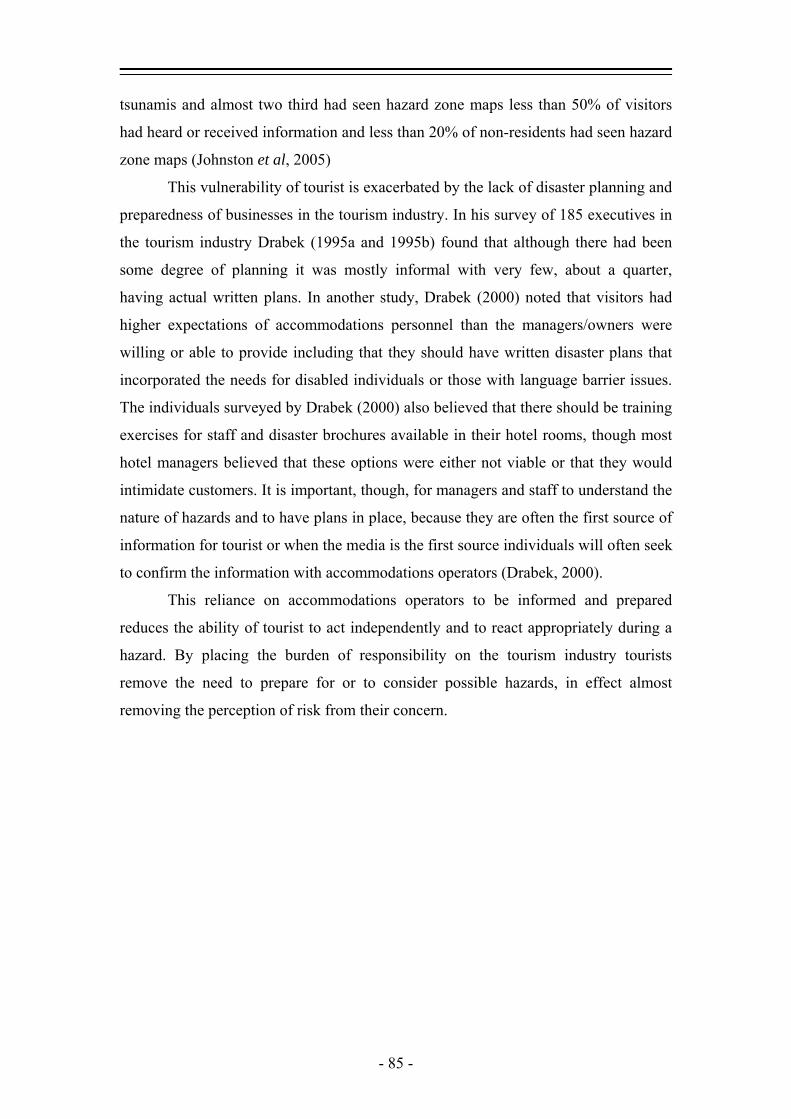
tsunamis and almost two third had seen hazard zone maps less than 50% of visitors
had heard or received information and less than 20% of non-residents had seen hazard
zone maps (Johnston et al, 2005)
This vulnerability of tourist is exacerbated by the lack of disaster planning and
preparedness of businesses in the tourism industry. In his survey of 185 executives in
the tourism industry Drabek (1995a and 1995b) found that although there had been
some degree of planning it was mostly informal with very few, about a quarter,
having actual written plans. In another study, Drabek (2000) noted that visitors had
higher expectations of accommodations personnel than the managers/owners were
willing or able to provide including that they should have written disaster plans that
incorporated the needs for disabled individuals or those with language barrier issues.
The individuals surveyed by Drabek (2000) also believed that there should be training
exercises for staff and disaster brochures available in their hotel rooms, though most
hotel managers believed that these options were either not viable or that they would
intimidate customers. It is important, though, for managers and staff to understand the
nature of hazards and to have plans in place, because they are often the first source of
information for tourist or when the media is the first source individuals will often seek
to confirm the information with accommodations operators (Drabek, 2000).
This reliance on accommodations operators to be informed and prepared
reduces the ability of tourist to act independently and to react appropriately during a
hazard. By placing the burden of responsibility on the tourism industry tourists
remove the need to prepare for or to consider possible hazards, in effect almost
removing the perception of risk from their concern.
- 85 -
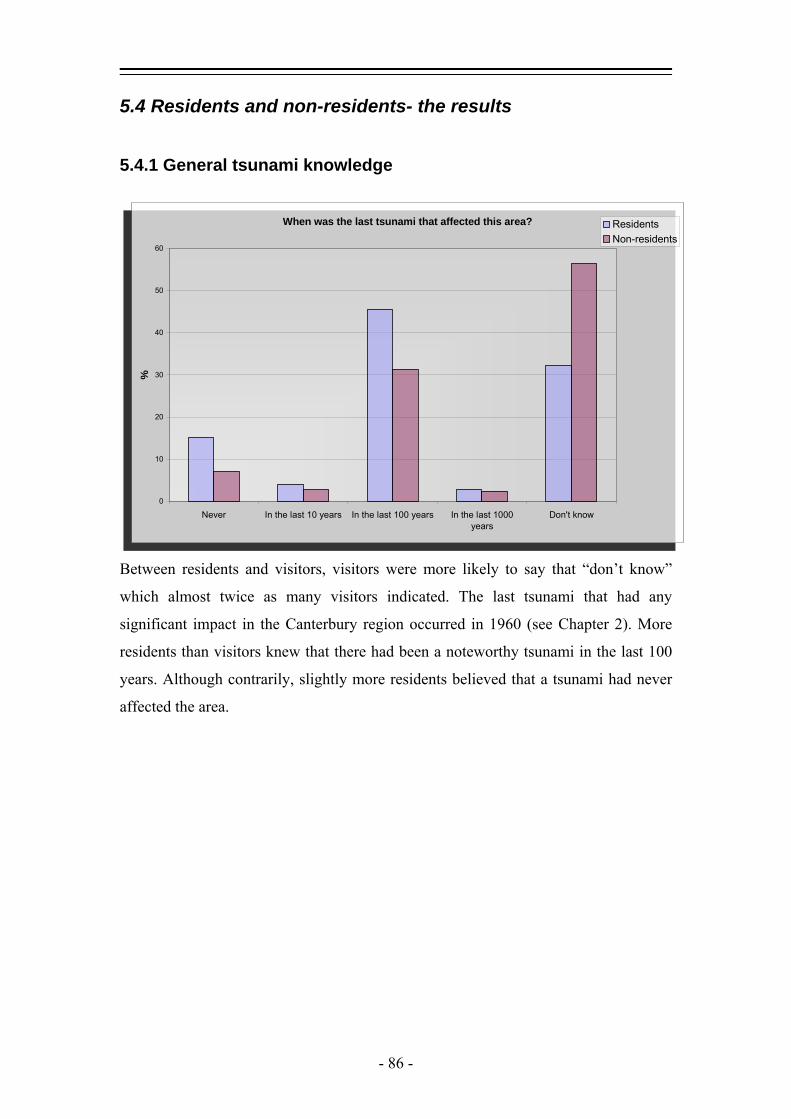
5.4 Residents and non-residents- the results
5.4.1 General tsunami knowledge
When was the last tsunami that affected this area?
0
10
20
30
40
50
60
Never In the last 10 years In the last 100 years In the last 1000years
Don't know
%
ResidentsNon-residents
Between residents and visitors, visitors were more likely to say that “don’t know”
which almost twice as many visitors indicated. The last tsunami that had any
significant impact in the Canterbury region occurred in 1960 (see Chapter 2). More
residents than visitors knew that there had been a noteworthy tsunami in the last 100
years. Although contrarily, slightly more residents believed that a tsunami had never
affected the area.
- 86 -
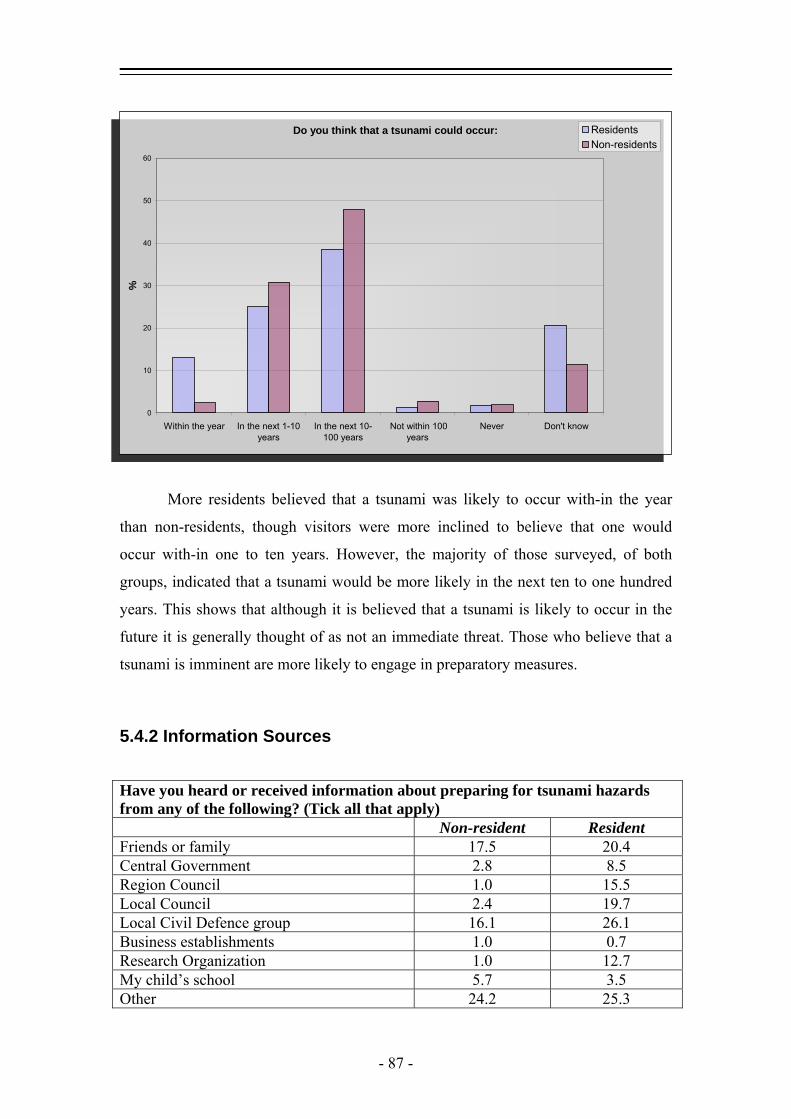
Do you think that a tsunami could occur:
0
10
20
30
40
50
60
Within the year In the next 1-10years
In the next 10-100 years
Not within 100years
Never Don't know
%ResidentsNon-residents
More residents believed that a tsunami was likely to occur with-in the year
than non-residents, though visitors were more inclined to believe that one would
occur with-in one to ten years. However, the majority of those surveyed, of both
groups, indicated that a tsunami would be more likely in the next ten to one hundred
years. This shows that although it is believed that a tsunami is likely to occur in the
future it is generally thought of as not an immediate threat. Those who believe that a
tsunami is imminent are more likely to engage in preparatory measures.
5.4.2 Information Sources
Have you heard or received information about preparing for tsunami hazards from any of the following? (Tick all that apply) Non-resident Resident Friends or family 17.5 20.4 Central Government 2.8 8.5 Region Council 1.0 15.5 Local Council 2.4 19.7 Local Civil Defence group 16.1 26.1 Business establishments 1.0 0.7 Research Organization 1.0 12.7 My child’s school 5.7 3.5 Other 24.2 25.3
- 87 -
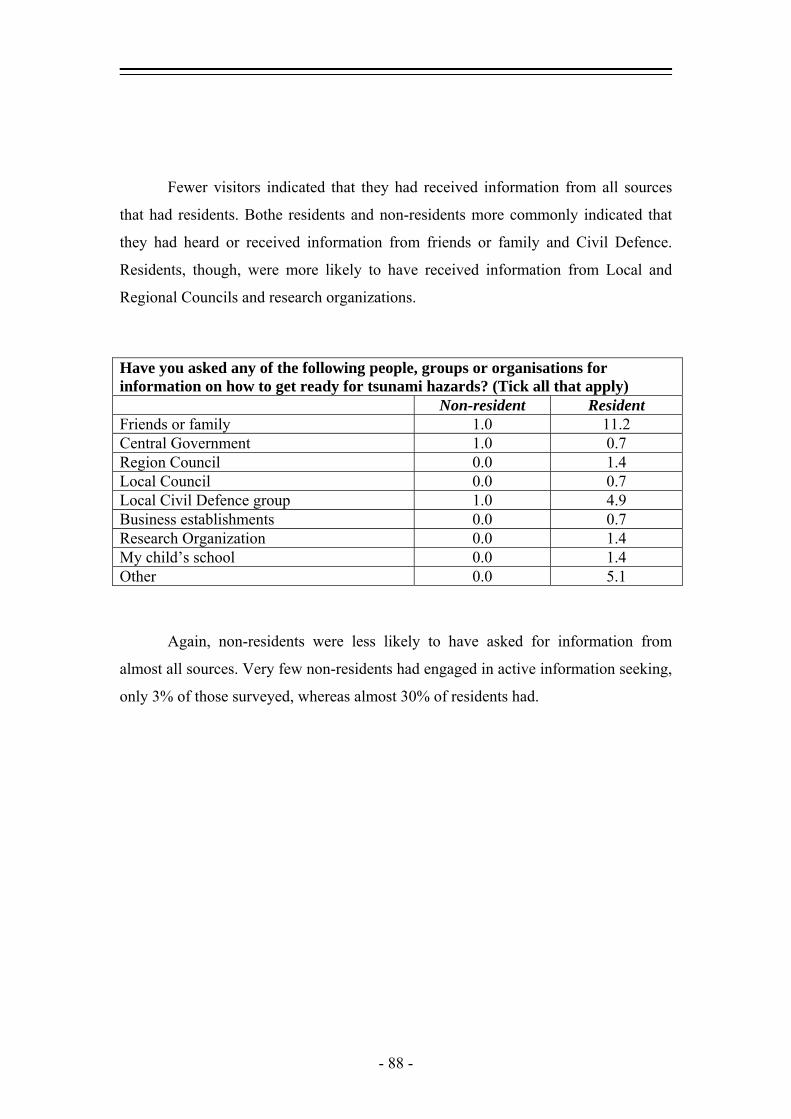
Fewer visitors indicated that they had received information from all sources
that had residents. Bothe residents and non-residents more commonly indicated that
they had heard or received information from friends or family and Civil Defence.
Residents, though, were more likely to have received information from Local and
Regional Councils and research organizations.
Have you asked any of the following people, groups or organisations for information on how to get ready for tsunami hazards? (Tick all that apply) Non-resident Resident Friends or family 1.0 11.2 Central Government 1.0 0.7 Region Council 0.0 1.4 Local Council 0.0 0.7 Local Civil Defence group 1.0 4.9 Business establishments 0.0 0.7 Research Organization 0.0 1.4 My child’s school 0.0
1.4 Other 0.0 5.1
Again, non-residents were less likely to have asked for information from
almost all sources. Very few non-residents had engaged in active information seeking,
only 3% of those surveyed, whereas almost 30% of residents had.
- 88 -
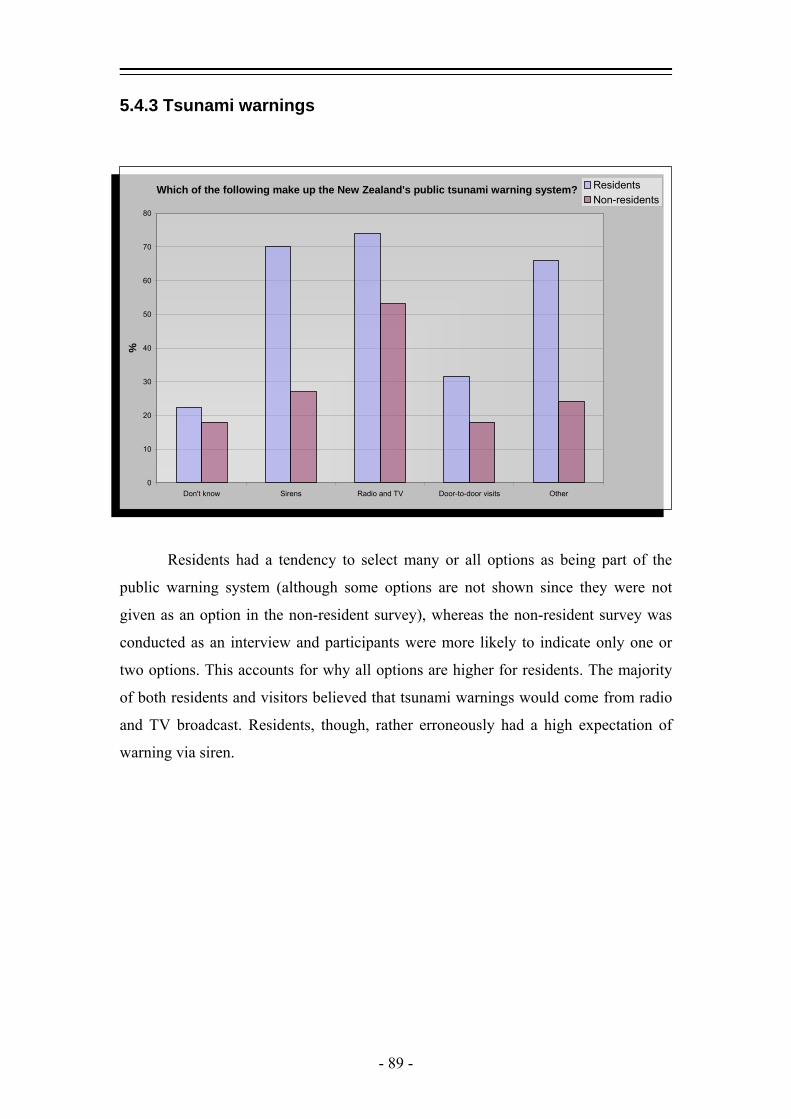
5.4.3 Tsunami warnings
Which of the following make up the New Zealand's public tsunami warning system?
0
10
20
30
40
50
60
70
80
Don't know Sirens Radio and TV Door-to-door visits Other
%
ResidentsNon-residents
Residents had a tendency to select many or all options as being part of the
public warning system (although some options are not shown since they were not
given as an option in the non-resident survey), whereas the non-resident survey was
conducted as an interview and participants were more likely to indicate only one or
two options. This accounts for why all options are higher for residents. The majority
of both residents and visitors believed that tsunami warnings would come from radio
and TV broadcast. Residents, though, rather erroneously had a high expectation of
warning via siren.
- 89 -
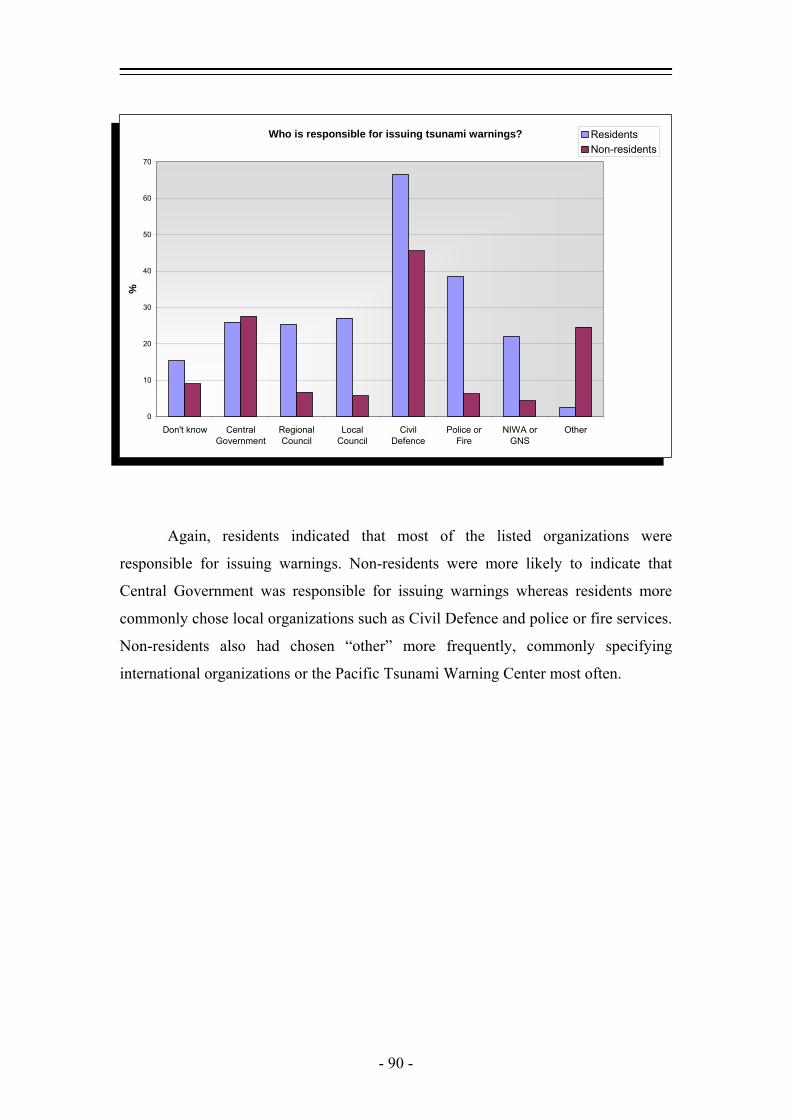
Who is responsible for issuing tsunami warnings?
0
10
20
30
40
50
60
70
Don't know CentralGovernment
RegionalCouncil
LocalCouncil
CivilDefence
Police orFire
NIWA orGNS
Other
%ResidentsNon-residents
Again, residents indicated that most of the listed organizations were
responsible for issuing warnings. Non-residents were more likely to indicate that
Central Government was responsible for issuing warnings whereas residents more
commonly chose local organizations such as Civil Defence and police or fire services.
Non-residents also had chosen “other” more frequently, commonly specifying
international organizations or the Pacific Tsunami Warning Center most often.
- 90 -
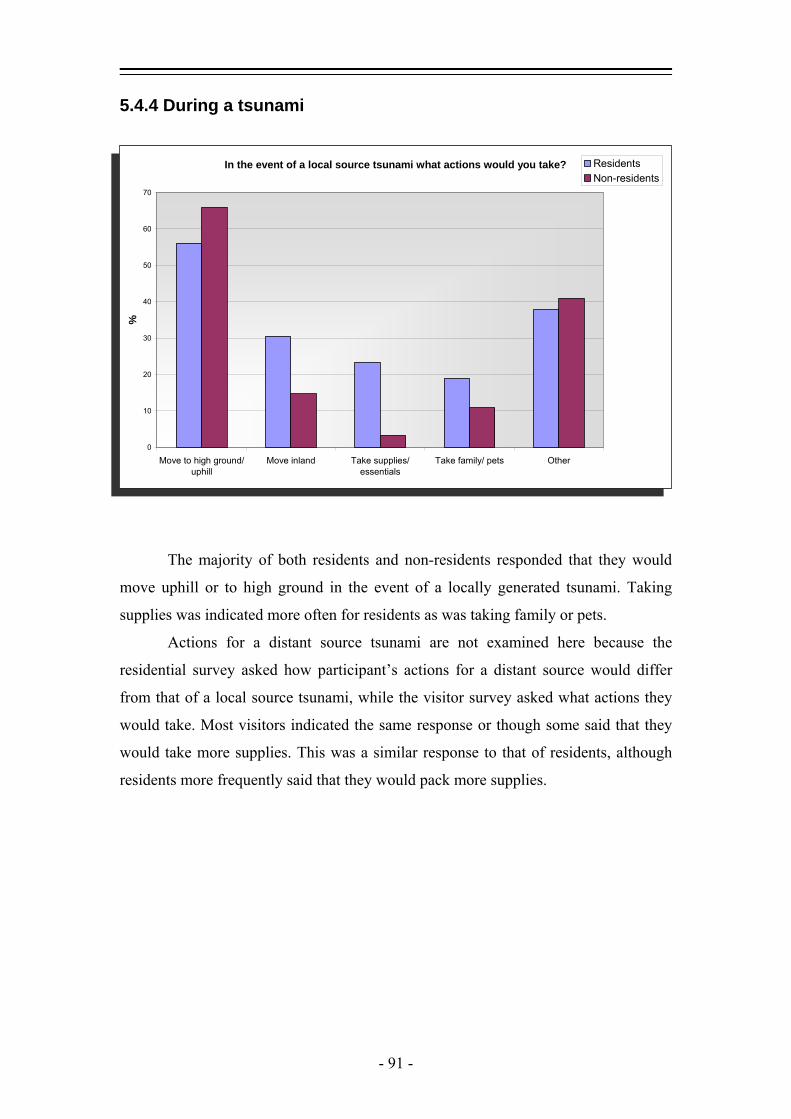
5.4.4 During a tsunami
ResidentsIn the event of a local source tsunami what actions would you take?
0
10
20
30
40
50
60
70
Move to high ground/uphill
Move inland Take supplies/essentials
Take family/ pets Other
%
Non-residents
The majority of both residents and non-residents responded that they would
move uphill or to high ground in the event of a locally generated tsunami. Taking
supplies was indicated more often for residents as was taking family or pets.
Actions for a distant source tsunami are not examined here because the
residential survey asked how participant’s actions for a distant source would differ
from that of a local source tsunami, while the visitor survey asked what actions they
would take. Most visitors indicated the same response or though some said that they
would take more supplies. This was a similar response to that of residents, although
residents more frequently said that they would pack more supplies.
- 91 -
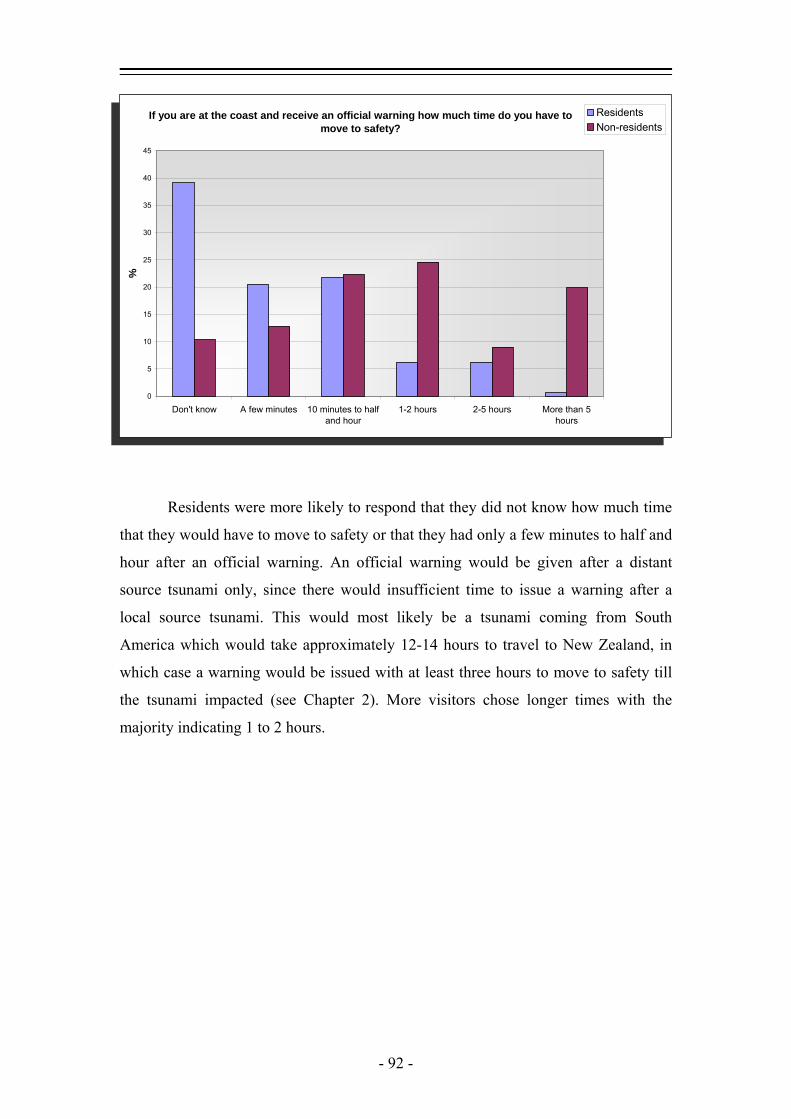
If you are at the coast and receive an official warning how much time do you have to move to safety?
0
5
10
15
20
25
30
35
40
45
Don't know A few minutes 10 minutes to halfand hour
1-2 hours 2-5 hours More than 5hours
%
ResidentsNon-residents
Residents were more likely to respond that they did not know how much time
that they would have to move to safety or that they had only a few minutes to half and
hour after an official warning. An official warning would be given after a distant
source tsunami only, since there would insufficient time to issue a warning after a
local source tsunami. This would most likely be a tsunami coming from South
America which would take approximately 12-14 hours to travel to New Zealand, in
which case a warning would be issued with at least three hours to move to safety till
the tsunami impacted (see Chapter 2). More visitors chose longer times with the
majority indicating 1 to 2 hours.
- 92 -
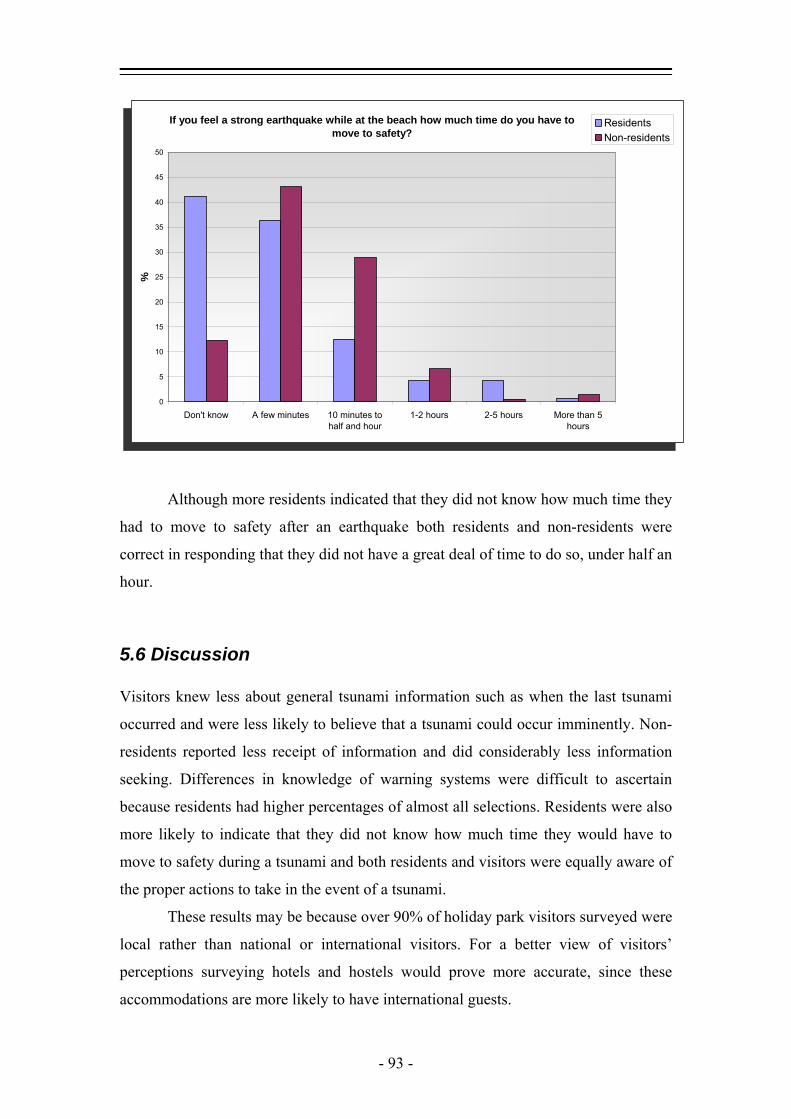
If you feel a strong earthquake while at the beach how much time do you have to move to safety?
0
5
10
15
20
25
30
35
40
45
50
Don't know A few minutes 10 minutes tohalf and hour
1-2 hours 2-5 hours More than 5hours
%
ResidentsNon-residents
Although more residents indicated that they did not know how much time they
had to move to safety after an earthquake both residents and non-residents were
correct in responding that they did not have a great deal of time to do so, under half an
hour.
5.6 Discussion Visitors knew less about general tsunami information such as when the last tsunami
occurred and were less likely to believe that a tsunami could occur imminently. Non-
residents reported less receipt of information and did considerably less information
seeking. Differences in knowledge of warning systems were difficult to ascertain
because residents had higher percentages of almost all selections. Residents were also
more likely to indicate that they did not know how much time they would have to
move to safety during a tsunami and both residents and visitors were equally aware of
the proper actions to take in the event of a tsunami.
These results may be because over 90% of holiday park visitors surveyed were
local rather than national or international visitors. For a better view of visitors’
perceptions surveying hotels and hostels would prove more accurate, since these
accommodations are more likely to have international guests.
- 93 -
Chapter 6
Changes in Hazard Perception since the 2004 Boxing Day Tsunami
6.1 Introduction
The 2004 Boxing Day tsunami has been referred to as a “megatsunami” (Synolakis
and Kong, 2006; Synolakis et al, 2005) a “megadisaster” (Iwan, 2006) and “the most
devastating tsunami in modern history” (Titov and Arcas, 2005). By some accounts,
the death toll for this single event was higher than all other tsunamis in the last 300
years, put together (Synolakis et al, 2005).
Infrastructure in some locations was completely devastated (Saatcioglu et al,
2006a) including the destruction of many coastal villages, lifelines were significantly
disrupted (Scawthorn et al, 2006) and even now the economy continues to suffer from
impacts on the tourist industry, a major source of income for the region (Birkland et
al, 2006). It will be years before the areas that were directly affected fully recover, but
the tsunami had further reaching effects than just the physical and economical ones.
This tsunami had impact on a global scale. In an interview after the event, it
was quoted that “Before December 25, very few people knew what a tsunami was.
After December 26, almost everyone does” (Lautenbacher Jr., 2005). Such a large
scale and devastating natural disaster can affect worldwide perceptions of tsunami
hazards, how they are viewed and what is known about them, motivates law changes,
and can brings about advancement in the sciences.
- 94 -
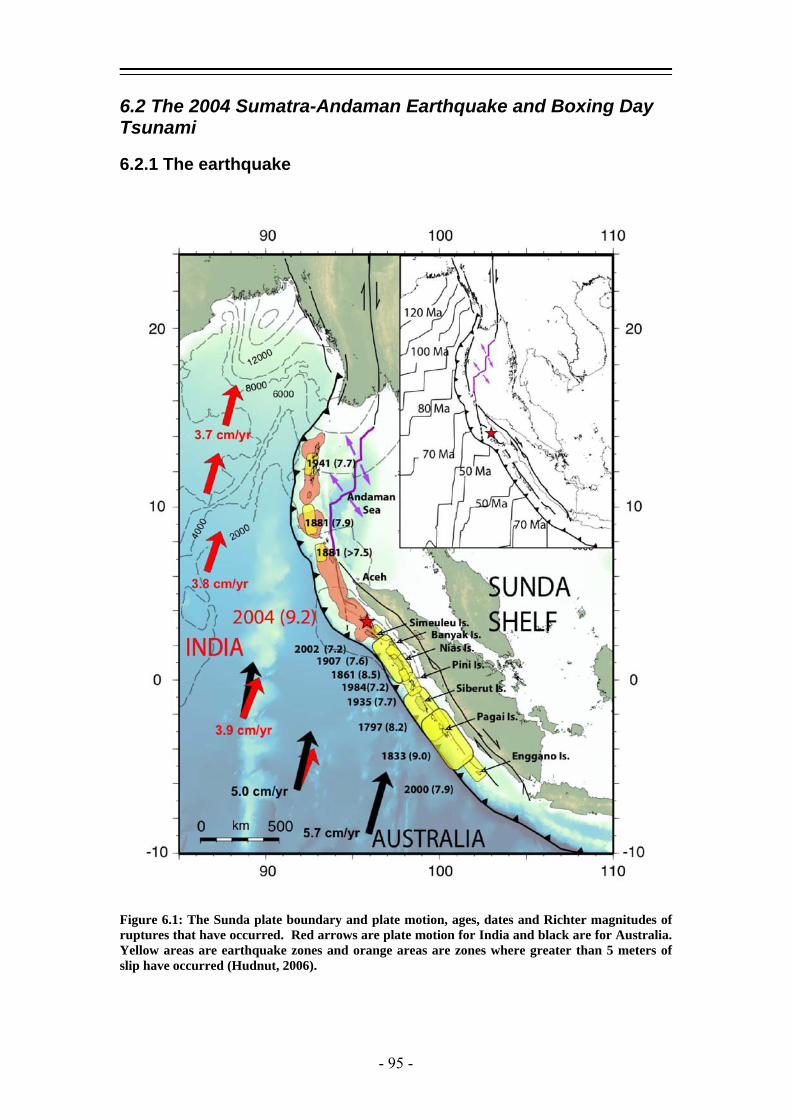
6.2 The 2004 Sumatra-Andaman Earthquake and Boxing Day Tsunami
6.2.1 The earthquake
Figure 6.1: The Sunda plate boundary and plate motion, ages, dates and Richter magnitudes of ruptures that have occurred. Red arrows are plate motion for India and black are for Australia. Yellow areas are earthquake zones and orange areas are zones where greater than 5 meters of slip have occurred (Hudnut, 2006).
- 95 -

At 7:58 am local time or 58:50 UTC, approximately 160 km west of Sumatra
(Wikipedia, 2006) the boundary between the Indo-Australian and the Eurasian plate
(figure 6.1) ruptured in what was one of the largest instrumentally recorded
earthquakes ever (Iwan, 2006). Initially recorded at Richter magnitude 9.0, the
magnitude was later revised to 9.3. The quake was felt as far away as Bangladesh,
India, Malaysia, Myanmar, Thailand, Singapore and the Maldives (Wikipedia, 2006).
Prior to this event, large quakes, of up to magnitude 9, had been produced on the
southern portion of the fault. This earthquake was produced in a region that was
known for slower plate motion and smaller events (Geist et al, 2006). In the week
following the earthquake stress redistribution on the fault was responsible for 13
aftershocks between magnitude 6.0-7.1 and numerous smaller ones (Waltham, 2005).
The slip occurred over about a 1,200 km (Kanamori, 2006; Stein and Okal,
2005; Wikipedia, 2006; Geist et al, 2006) to 1,600 km (Hudnut, 2006) length of fault
in at least two separate movements (Wikipedia, 2006) which cascaded northward
from the original rupture location (Hudnut, 2006). As the slip progressed northward it
slowed and it is conjectured that this later slow slip may have amplified the resultant
tsunami (Stein and Okal, 2005).
6.2.2 The tsunami
Hundreds of cubic
kilometres of seawater
were displaced as a result
of the three (Waltham,
2005) to eight meters
(Geist et al, 2006) of
vertical offset produced
by the earthquake. At
least 16 countries were
affected directly by the
resulting tsunami (figure
6.2) including Indonesia,
Malaysia, Thailand, Figure 6.2: Reported run-ups from around the Indian Ocean basin from the Boxing Day tsunami (Synolakis and Kong, 2006).
- 96 -
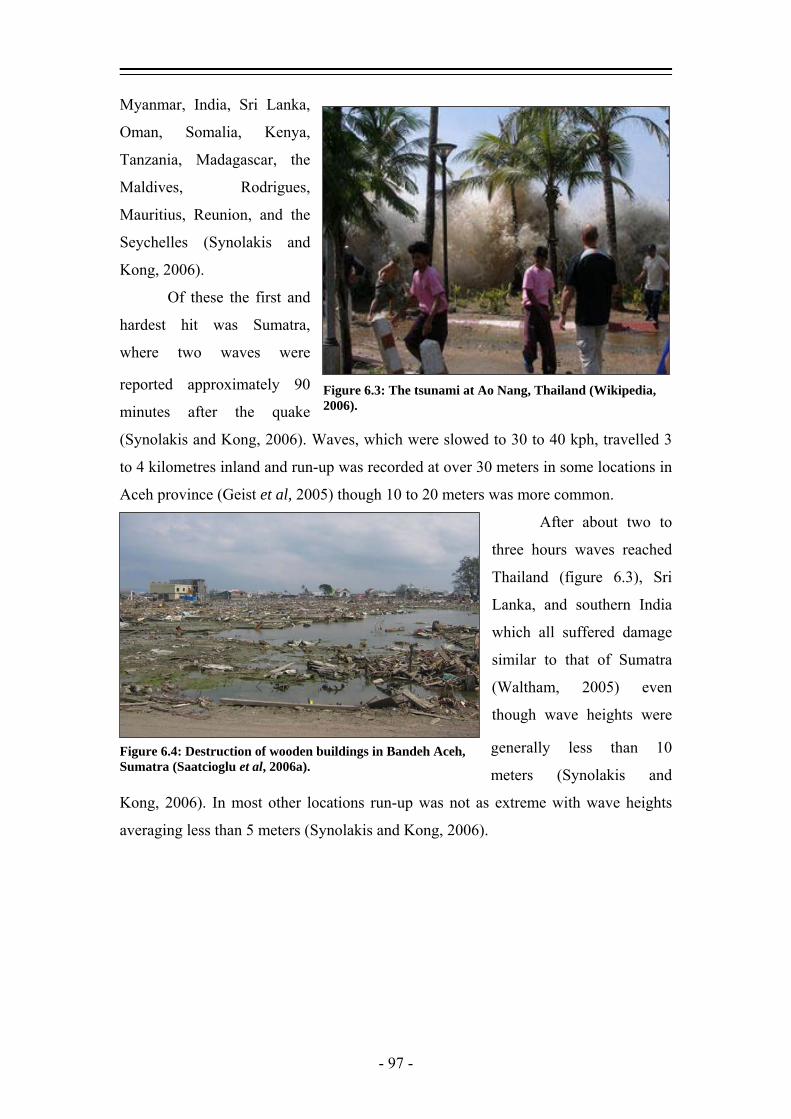
Myanmar, India, Sri Lanka,
Oman, Somalia, Kenya,
Tanzania, Madagascar, the
Maldives, Rodrigues,
Mauritius, Reunion, and the
Seychelles (Synolakis and
Kong, 2006).
Of these the first and
hardest hit was Sumatra,
where two waves were
reported approximately 90
minutes after the quake
(Synolakis and Kong, 2006). Waves, which were slowed to 30 to 40 kph, travelled 3
to 4 kilometres inland and run-up was recorded at over 30 meters in some locations in
Aceh province (Geist et al, 2005) though 10 to 20 meters was more common.
After about two to
three hours waves reached
Thailand (figure 6.3), Sri
Lanka, and southern India
which all suffered damage
similar to that of Sumatra
(Waltham, 2005) even
though wave heights were
generally less than 10
meters (Synolakis and
Kong, 2006). In most other locations run-up was not as extreme with wave heights
averaging less than 5 meters (Synolakis and Kong, 2006).
Figure 6.3: The tsunami at Ao Nang, Thailand (Wikipedia, 2006).
Figure 6.4: Destruction of wooden buildings in Bandeh Aceh, Sumatra (Saatcioglu et al, 2006a).
- 97 -
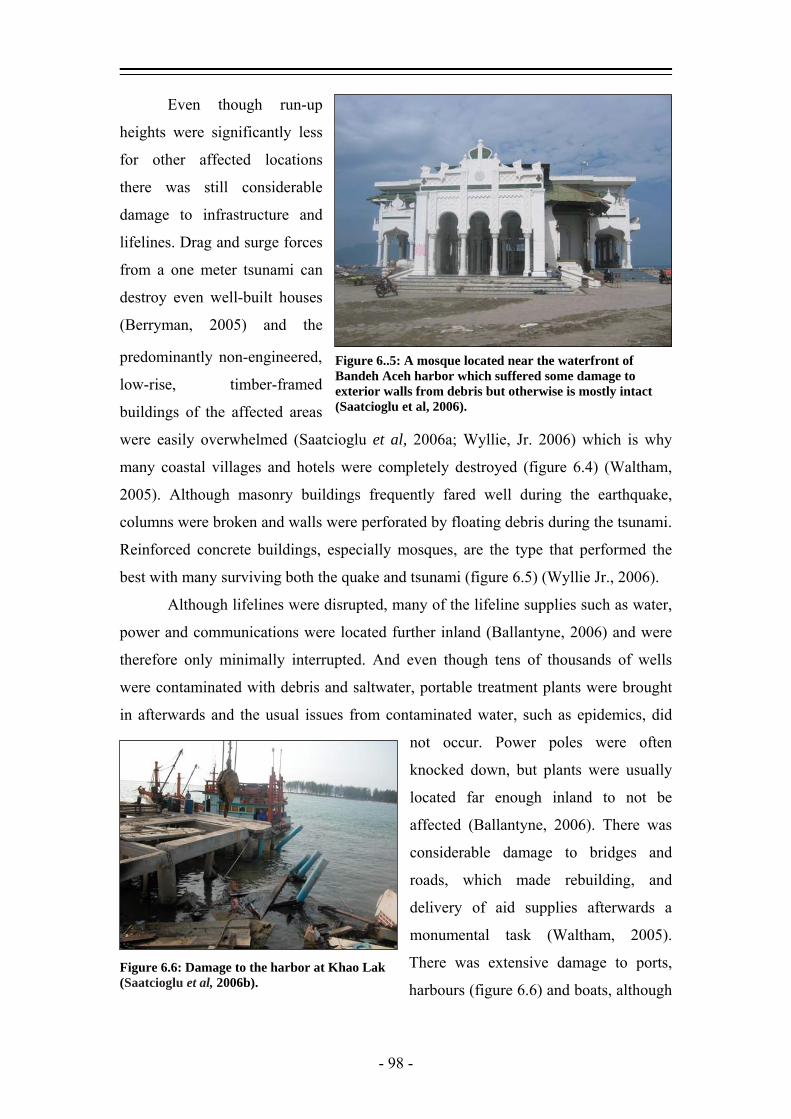
Even though run-up
heights were significantly less
for other affected locations
there was still considerable
damage to infrastructure and
lifelines. Drag and surge forces
from a one meter tsunami can
destroy even well-built houses
(Berryman, 2005) and the
predominantly non-engineered,
low-rise, timber-framed
buildings of the affected areas
were easily overwhelmed (Saatcioglu et al, 2006a; Wyllie, Jr. 2006) which is why
many coastal villages and hotels were completely destroyed (figure 6.4) (Waltham,
2005). Although masonry buildings frequently fared well during the earthquake,
columns were broken and walls were perforated by floating debris during the tsunami.
Reinforced concrete buildings, especially mosques, are the type that performed the
best with many surviving both the quake and tsunami (figure 6.5) (Wyllie Jr., 2006).
Figure 6..5: A mosque located near the waterfront of Bandeh Aceh harbor which suffered some damage to exterior walls from debris but otherwise is mostly intact (Saatcioglu et al, 2006).
Although lifelines were disrupted, many of the lifeline supplies such as water,
power and communications were located further inland (Ballantyne, 2006) and were
therefore only minimally interrupted. And even though tens of thousands of wells
were contaminated with debris and saltwater, portable treatment plants were brought
in afterwards and the usual issues from contaminated water, such as epidemics, did
not occur. Power poles were often
knocked down, but plants were usually
located far enough inland to not be
affected (Ballantyne, 2006). There was
considerable damage to bridges and
roads, which made rebuilding, and
delivery of aid supplies afterwards a
monumental task (Waltham, 2005).
There was extensive damage to ports,
harbours (figure 6.6) and boats, although Figure 6.6: Damage to the harbor at Khao Lak (Saatcioglu et al, 2006b).
- 98 -

seawalls reduced the impact to some facilities (Ballantyne, 2006). In many locations
damage was increased because protective features such as mangroves and dunes had
been removed to improve beach views (Synolakis, 2006).
With billions of dollars worth of damage (Ballantyne, 2006), millions left
homeless, and hundreds of thousands dead (Iwan, 2006; Waltham, 2005; Wikipedia,
2006; CRED, 2005), this was the single worst tsunami ever recorded. Yet because this
was such a devastating event, and came at such a high cost, there is much that has
been learned from it.
6.2.3 Tsunami science since Boxing Day- lessons learned
The Boxing Day tsunami greatly improved our understanding of tsunamis and a
number of important observations were made during the event. One of the most
important is that this was the first time instrumental readings had been taken of a
tsunami traversing the open ocean. These came from a group of satellites that passed
over the Indian Ocean between two and nine hours after the earthquake adding images
and altimetry readings to verify what were previously just models (Synolakis, 2006)
from near shore tide gauges measurements (Geist et al, 2006). They confirmed that
tsunami waves in the open ocean are indeed relatively small (~half meter high) waves
(Geist et al, 2006). There were also several other phenomena that were identified
during the Boxing Day tsunami (Synolakis, 2006).
One of these is the guiding effect of mid-ocean ridges which funnelled the
tsunami away from the tip of Africa (Synolakis and Bernard, 2006).
There was also the fact that the Maldives were relatively unscathed from the
tsunami even though they rise only 2 meters above sea level. Usually tsunamis are
amplified from the small wave that is seen in the open ocean to the larger devastating
wave when it reaches shallow water. Since the Maldives rise as “pillared structures”
from the ocean floor they did not experience this amplification effect (Synolakis and
Bernard, 2006). Although this it had been previously theorized, this was the first time
it had been observed (Synolakis and Bernard, 2006).
Another important observation from the Boxing Day tsunami was the location
from which it originated. The event was produced from a location previously thought
unable to generate tsunamis because the plate was characterized by slow motion. New
- 99 -
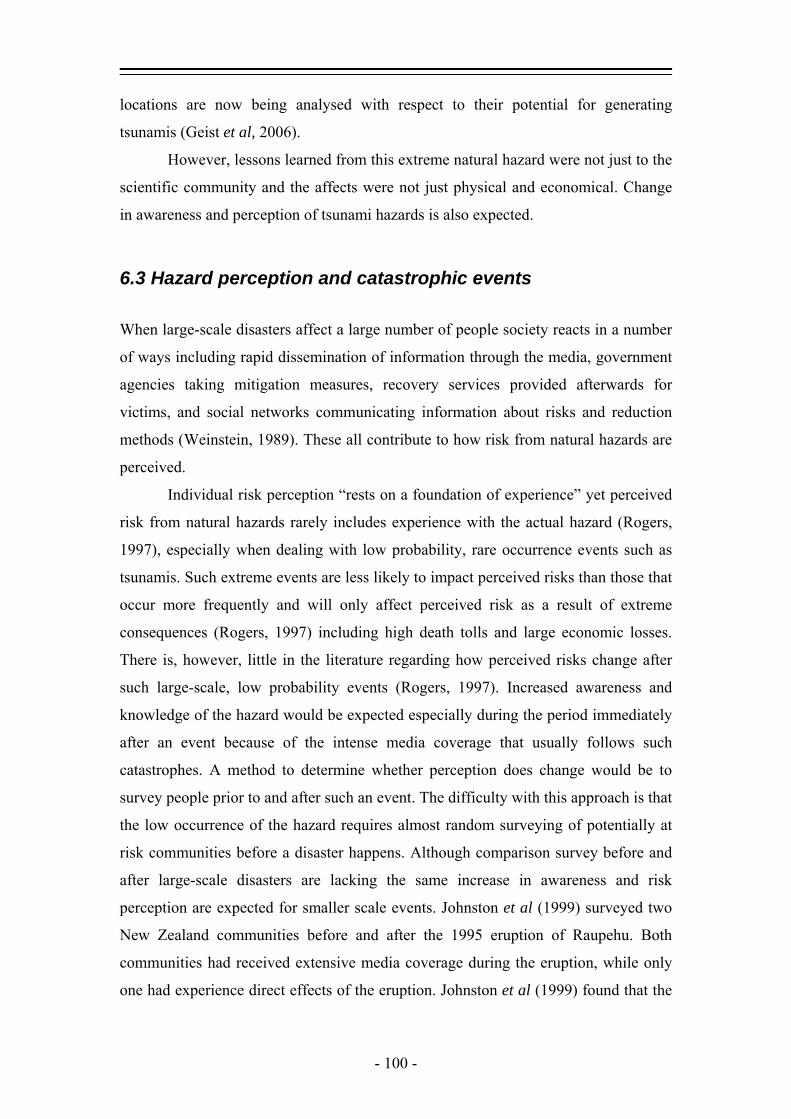
locations are now being analysed with respect to their potential for generating
tsunamis (Geist et al, 2006).
However, lessons learned from this extreme natural hazard were not just to the
scientific community and the affects were not just physical and economical. Change
in awareness and perception of tsunami hazards is also expected.
6.3 Hazard perception and catastrophic events
When large-scale disasters affect a large number of people society reacts in a number
of ways including rapid dissemination of information through the media, government
agencies taking mitigation measures, recovery services provided afterwards for
victims, and social networks communicating information about risks and reduction
methods (Weinstein, 1989). These all contribute to how risk from natural hazards are
perceived.
Individual risk perception “rests on a foundation of experience” yet perceived
risk from natural hazards rarely includes experience with the actual hazard (Rogers,
1997), especially when dealing with low probability, rare occurrence events such as
tsunamis. Such extreme events are less likely to impact perceived risks than those that
occur more frequently and will only affect perceived risk as a result of extreme
consequences (Rogers, 1997) including high death tolls and large economic losses.
There is, however, little in the literature regarding how perceived risks change after
such large-scale, low probability events (Rogers, 1997). Increased awareness and
knowledge of the hazard would be expected especially during the period immediately
after an event because of the intense media coverage that usually follows such
catastrophes. A method to determine whether perception does change would be to
survey people prior to and after such an event. The difficulty with this approach is that
the low occurrence of the hazard requires almost random surveying of potentially at
risk communities before a disaster happens. Although comparison survey before and
after large-scale disasters are lacking the same increase in awareness and risk
perception are expected for smaller scale events. Johnston et al (1999) surveyed two
New Zealand communities before and after the 1995 eruption of Raupehu. Both
communities had received extensive media coverage during the eruption, while only
one had experience direct effects of the eruption. Johnston et al (1999) found that the
- 100 -
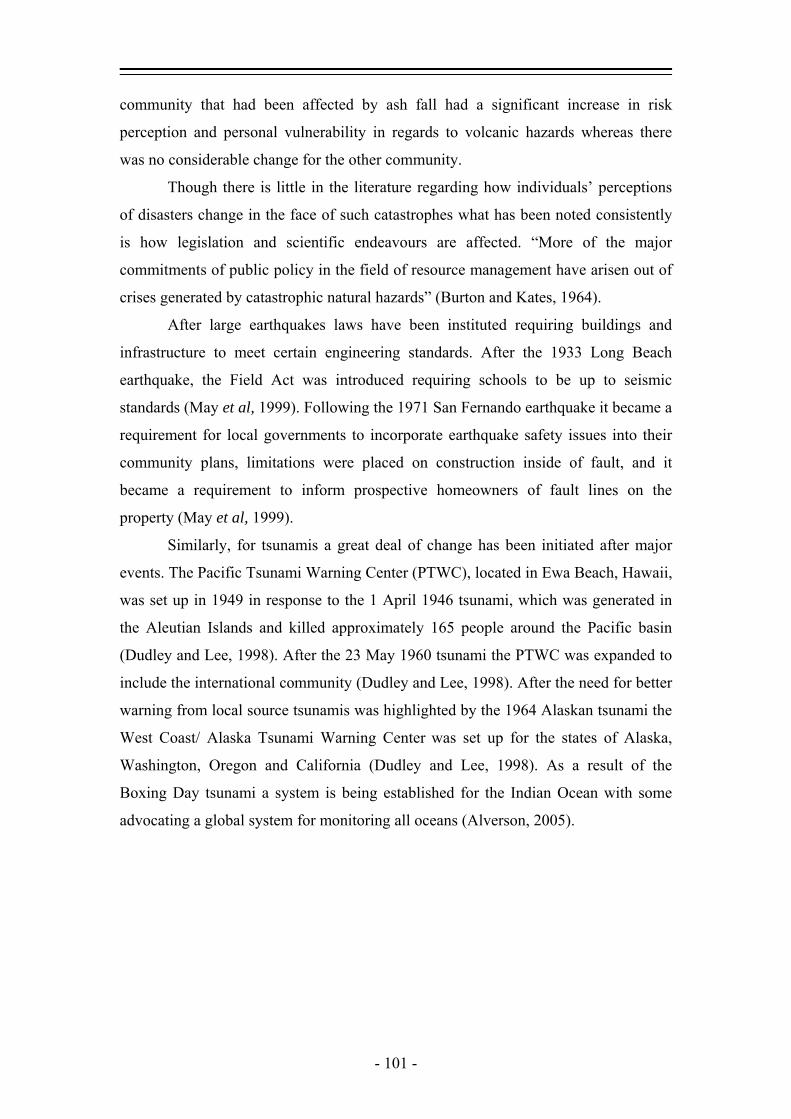
community that had been affected by ash fall had a significant increase in risk
perception and personal vulnerability in regards to volcanic hazards whereas there
was no considerable change for the other community.
Though there is little in the literature regarding how individuals’ perceptions
of disasters change in the face of such catastrophes what has been noted consistently
is how legislation and scientific endeavours are affected. “More of the major
commitments of public policy in the field of resource management have arisen out of
crises generated by catastrophic natural hazards” (Burton and Kates, 1964).
After large earthquakes laws have been instituted requiring buildings and
infrastructure to meet certain engineering standards. After the 1933 Long Beach
earthquake, the Field Act was introduced requiring schools to be up to seismic
standards (May et al, 1999). Following the 1971 San Fernando earthquake it became a
requirement for local governments to incorporate earthquake safety issues into their
community plans, limitations were placed on construction inside of fault, and it
became a requirement to inform prospective homeowners of fault lines on the
property (May et al, 1999).
Similarly, for tsunamis a great deal of change has been initiated after major
events. The Pacific Tsunami Warning Center (PTWC), located in Ewa Beach, Hawaii,
was set up in 1949 in response to the 1 April 1946 tsunami, which was generated in
the Aleutian Islands and killed approximately 165 people around the Pacific basin
(Dudley and Lee, 1998). After the 23 May 1960 tsunami the PTWC was expanded to
include the international community (Dudley and Lee, 1998). After the need for better
warning from local source tsunamis was highlighted by the 1964 Alaskan tsunami the
West Coast/ Alaska Tsunami Warning Center was set up for the states of Alaska,
Washington, Oregon and California (Dudley and Lee, 1998). As a result of the
Boxing Day tsunami a system is being established for the Indian Ocean with some
advocating a global system for monitoring all oceans (Alverson, 2005).
- 101 -
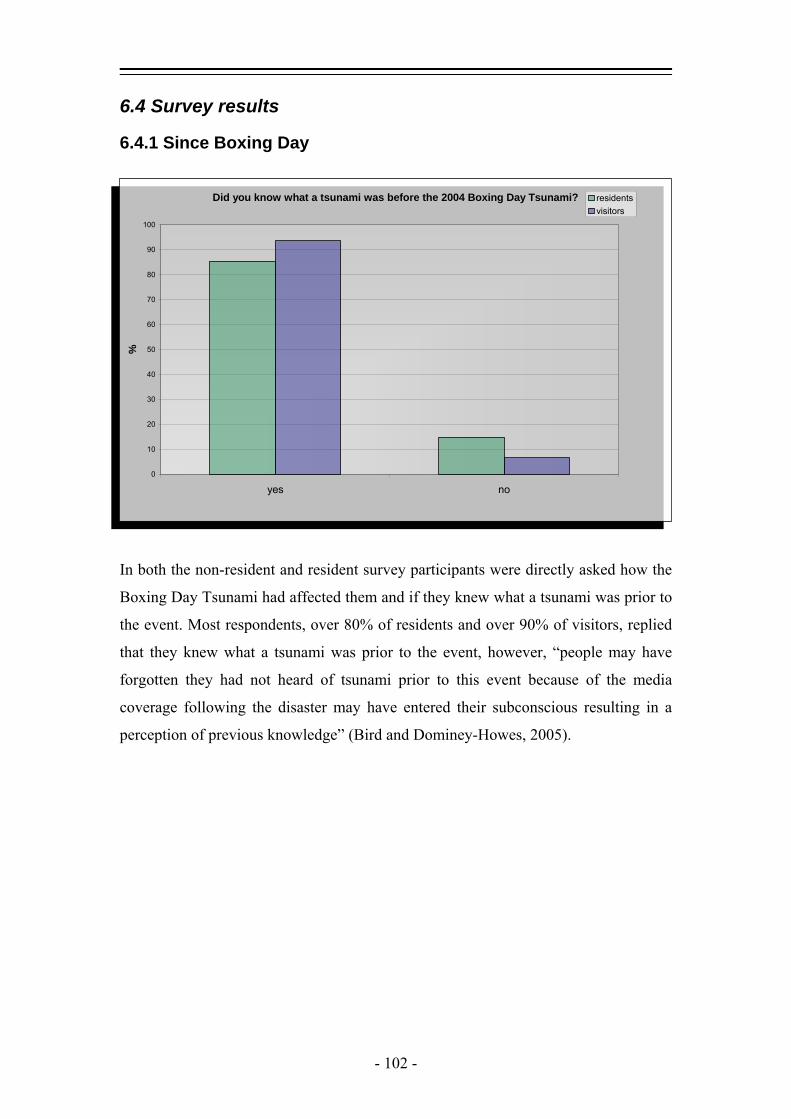
6.4 Survey results
6.4.1 Since Boxing Day
Did you know what a tsunami was before the 2004 Boxing Day Tsunami?
0
10
20
30
40
50
60
70
80
90
100
yes no
%
residentsvisitors
In both the non-resident and resident survey participants were directly asked how the
Boxing Day Tsunami had affected them and if they knew what a tsunami was prior to
the event. Most respondents, over 80% of residents and over 90% of visitors, replied
that they knew what a tsunami was prior to the event, however, “people may have
forgotten they had not heard of tsunami prior to this event because of the media
coverage following the disaster may have entered their subconscious resulting in a
perception of previous knowledge” (Bird and Dominey-Howes, 2005).
- 102 -
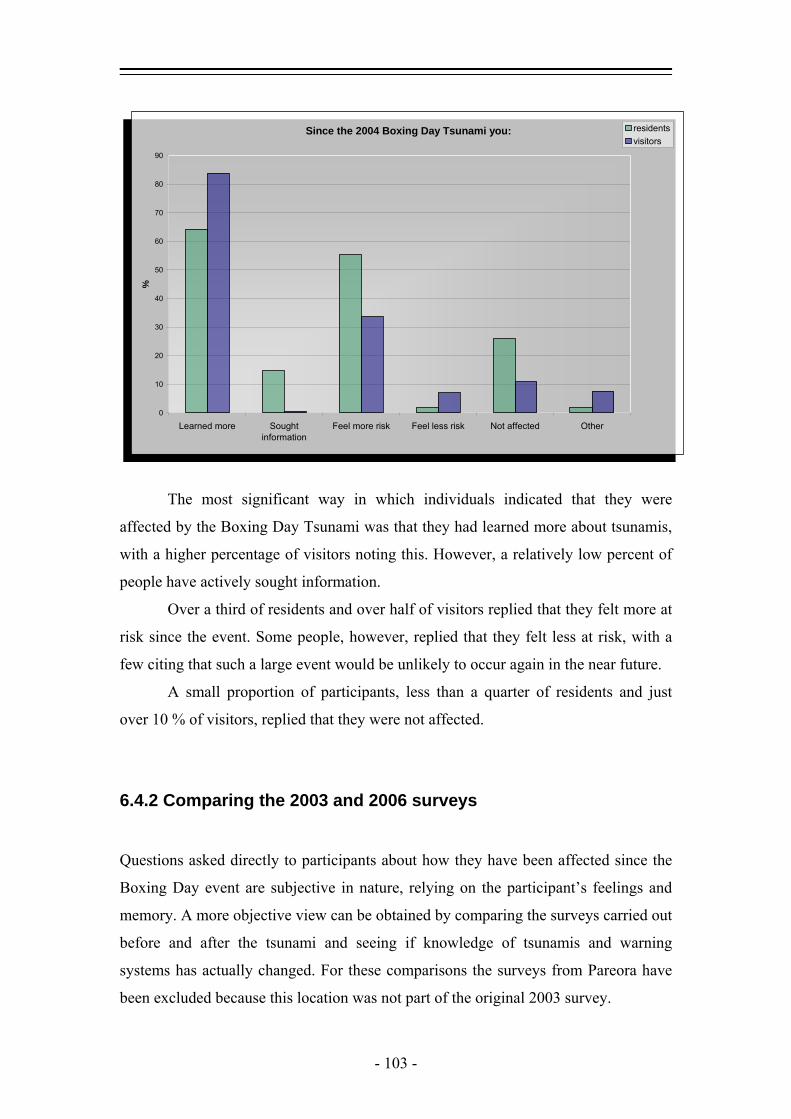
residentsSince the 2004 Boxing Day Tsunami you:
0
10
20
30
40
50
60
70
80
90
Learned more Soughtinformation
Feel more risk Feel less risk Not affected Other
%visitors
The most significant way in which individuals indicated that they were
affected by the Boxing Day Tsunami was that they had learned more about tsunamis,
with a higher percentage of visitors noting this. However, a relatively low percent of
people have actively sought information.
Over a third of residents and over half of visitors replied that they felt more at
risk since the event. Some people, however, replied that they felt less at risk, with a
few citing that such a large event would be unlikely to occur again in the near future.
A small proportion of participants, less than a quarter of residents and just
over 10 % of visitors, replied that they were not affected.
6.4.2 Comparing the 2003 and 2006 surveys Questions asked directly to participants about how they have been affected since the
Boxing Day event are subjective in nature, relying on the participant’s feelings and
memory. A more objective view can be obtained by comparing the surveys carried out
before and after the tsunami and seeing if knowledge of tsunamis and warning
systems has actually changed. For these comparisons the surveys from Pareora have
been excluded because this location was not part of the original 2003 survey.
- 103 -
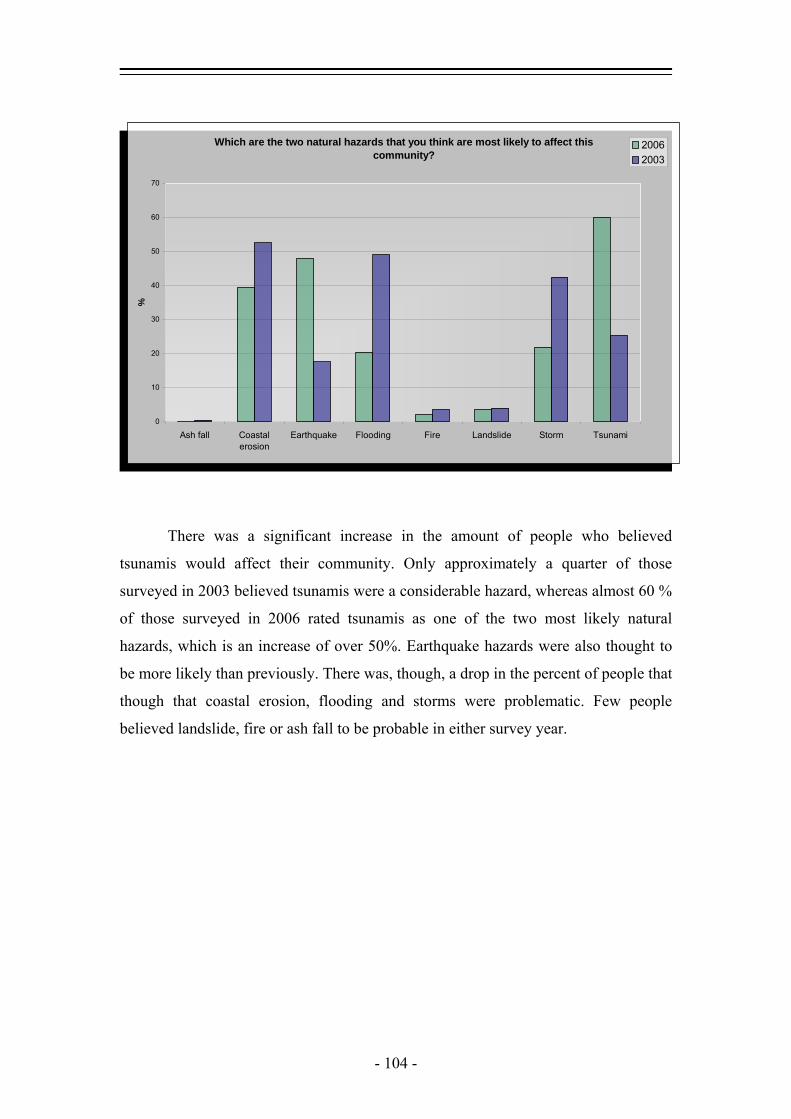
Which are the two natural hazards that you think are most likely to affect this community?
0
10
20
30
40
50
60
70
Ash fall Coastalerosion
Earthquake Flooding Fire Landslide Storm Tsunami
%20062003
There was a significant increase in the amount of people who believed
tsunamis would affect their community. Only approximately a quarter of those
surveyed in 2003 believed tsunamis were a considerable hazard, whereas almost 60 %
of those surveyed in 2006 rated tsunamis as one of the two most likely natural
hazards, which is an increase of over 50%. Earthquake hazards were also thought to
be more likely than previously. There was, though, a drop in the percent of people that
though that coastal erosion, flooding and storms were problematic. Few people
believed landslide, fire or ash fall to be probable in either survey year.
- 104 -
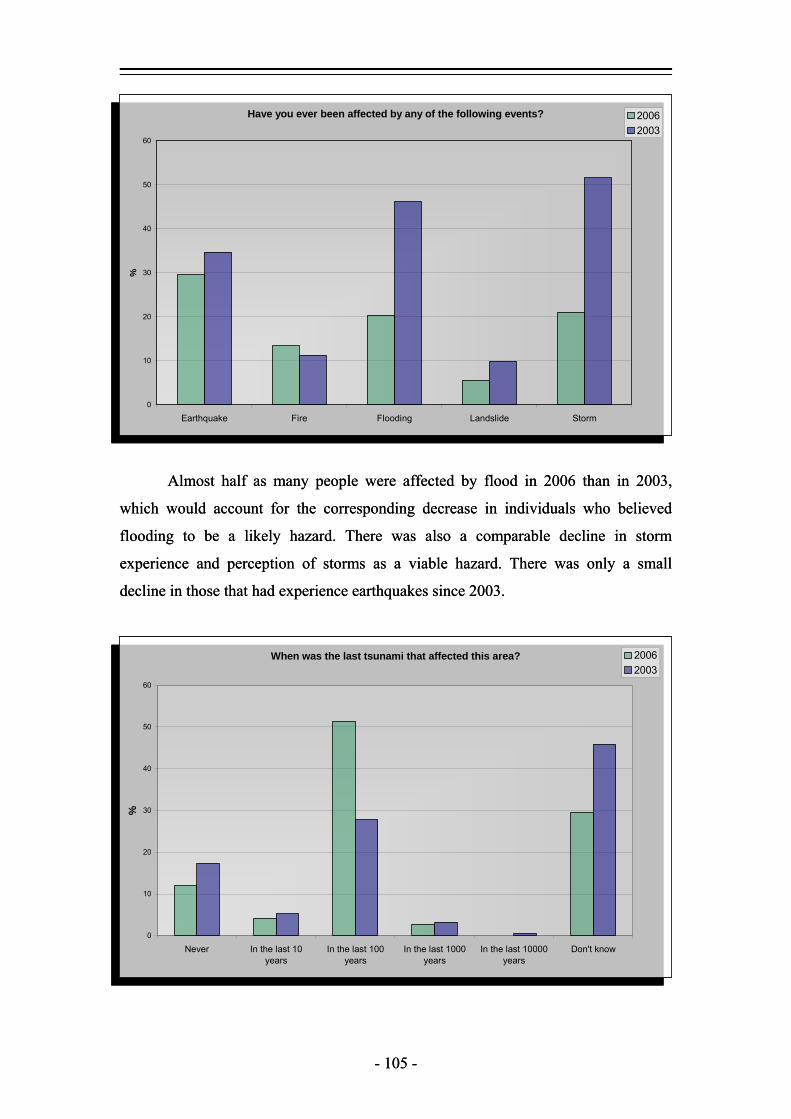
Have you ever been affected by any of the following events?
0
10
20
30
40
50
60
Earthquake Fire Flooding Landslide Storm
%
20062003
When was the last tsunami that affected this area?
0
10
20
30
40
50
60
Never In the last 10years
In the last 100years
In the last 1000years
In the last 10000years
Don't know
%
20062003
Have you ever been affected by any of the following events?
0
10
20
30
40
50
60
Earthquake Fire Flooding Landslide Storm
%
20062003
Almost half as many people were affected by flood in 2006 than in 2003,
which would account for the corresponding decrease in individuals who believed
flooding to be a likely hazard. There was also a comparable decline in storm
experience and perception of storms as a viable hazard. There was only a small
decline in those that had experience earthquakes since 2003.
2006When was the last tsunami that affected this area?
0
10
20
30
40
50
60
Never In the last 10years
In the last 100years
In the last 1000years
In the last 10000years
Don't know
%
2003
- 105 - - 105 -
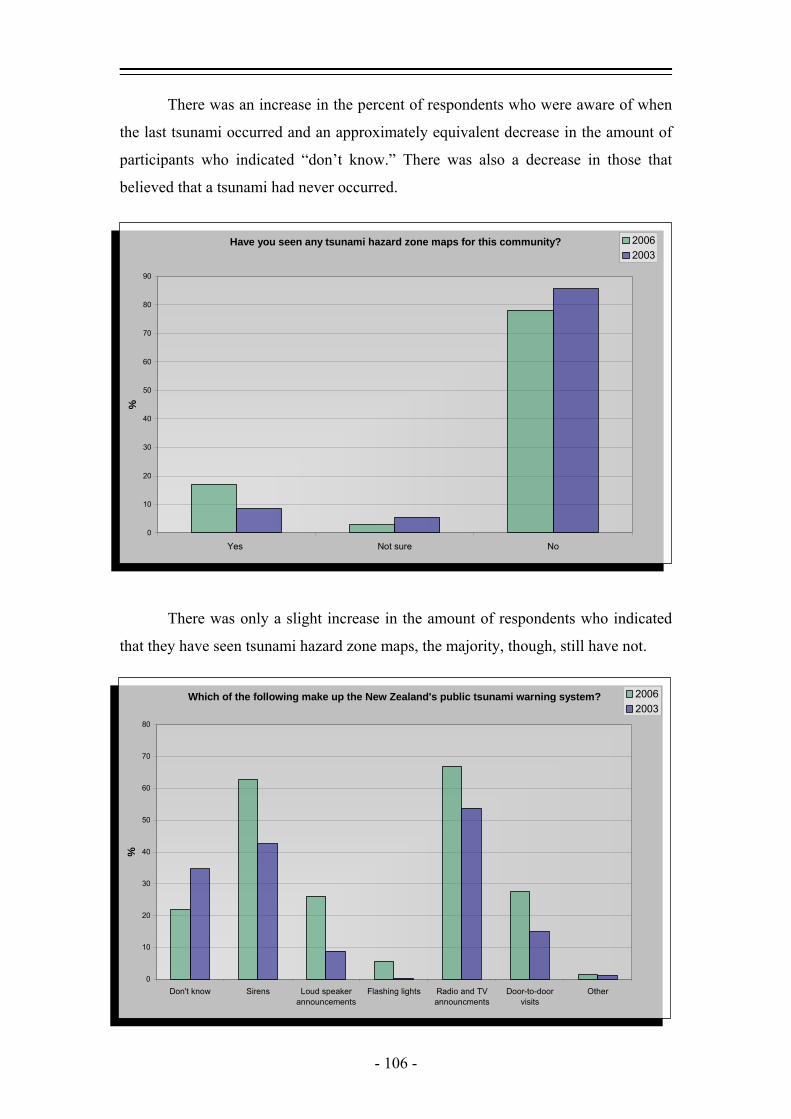
There was an increase in the percent of respondents who were aware of when
the last tsunami occurred and an approximately equivalent decrease in the amount of
participants who indicated “don’t know.” There was also a decrease in those that
believed that a tsunami had never occurred.
2006Have you seen any tsunami hazard zone maps for this community?
0
10
20
30
40
50
60
70
80
90
Yes Not sure No
%
2003
There was only a slight increase in the amount of respondents who indicated
that they have seen tsunami hazard zone maps, the majority, though, still have not.
Which of the following make up the New Zealand's public tsunami warning system?
0
10
20
30
40
50
60
70
80
Don't know Sirens Loud speakerannouncements
Flashing lights Radio and TVannouncments
Door-to-doorvisits
Other
%
20062003
- 106 -
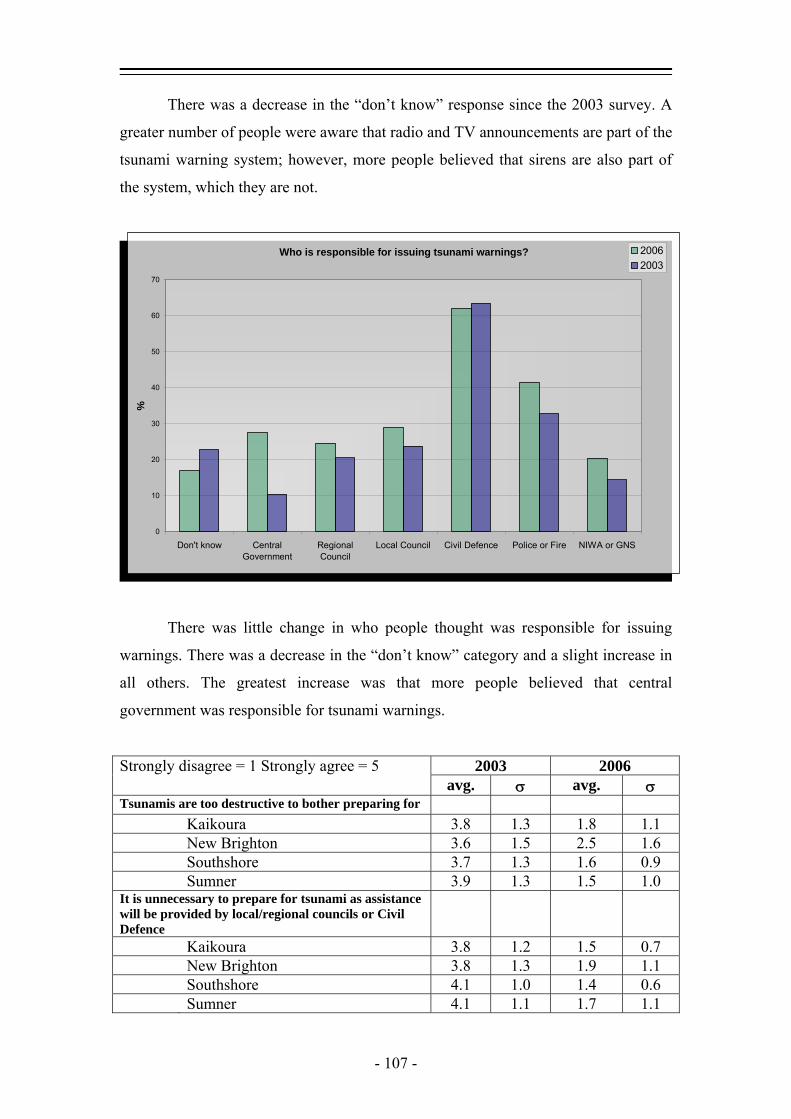
There was a decrease in the “don’t know” response since the 2003 survey. A
greater number of people were aware that radio and TV announcements are part of the
tsunami warning system; however, more people believed that sirens are also part of
the system, which they are not.
Who is responsible for issuing tsunami warnings?
0
10
20
30
40
50
60
70
Don't know CentralGovernment
RegionalCouncil
Local Council Civil Defence Police or Fire NIWA or GNS
%
20062003
There was little change in who people thought was responsible for issuing
warnings. There was a decrease in the “don’t know” category and a slight increase in
all others. The greatest increase was that more people believed that central
government was responsible for tsunami warnings.
2003 2006 Strongly disagree = 1 Strongly agree = 5 avg. σ avg. σ
Tsunamis are too destructive to bother preparing for Kaikoura 3.8 1.3 1.8 1.1 New Brighton 3.6 1.5 2.5 1.6 Southshore 3.7 1.3 1.6 0.9 Sumner 3.9 1.3 1.5 1.0 It is unnecessary to prepare for tsunami as assistance will be provided by local/regional councils or Civil Defence
Kaikoura 3.8 1.2 1.5 0.7 New Brighton 3.8 1.3 1.9 1.1 Southshore 4.1 1.0 1.4 0.6 Sumner 4.1 1.1 1.7 1.1
- 107 -
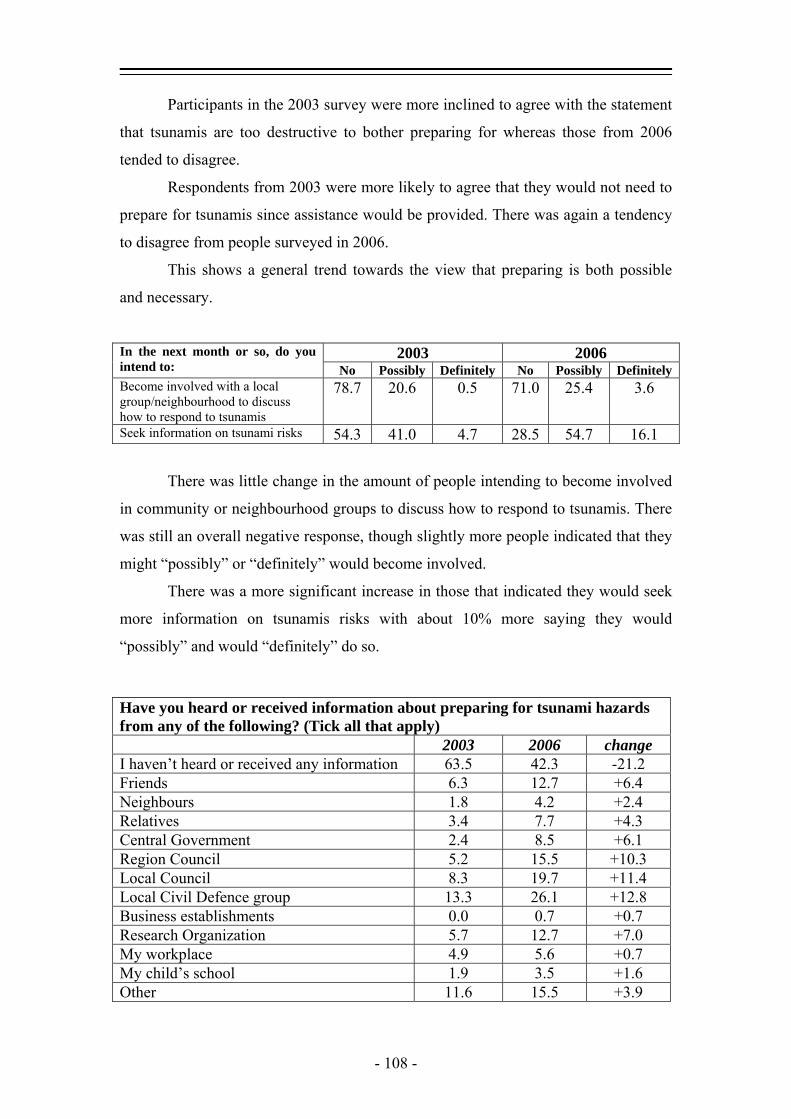
Participants in the 2003 survey were more inclined to agree with the statement
that tsunamis are too destructive to bother preparing for whereas those from 2006
tended to disagree.
Respondents from 2003 were more likely to agree that they would not need to
prepare for tsunamis since assistance would be provided. There was again a tendency
to disagree from people surveyed in 2006.
This shows a general trend towards the view that preparing is both possible
and necessary.
2003 2006 In the next month or so, do you intend to: No Possibly Definitely No Possibly Definitely Become involved with a local group/neighbourhood to discuss how to respond to tsunamis
78.7 20.6 0.5 71.0 25.4 3.6
Seek information on tsunami risks 54.3 41.0 4.7 28.5 54.7 16.1
There was little change in the amount of people intending to become involved
in community or neighbourhood groups to discuss how to respond to tsunamis. There
was still an overall negative response, though slightly more people indicated that they
might “possibly” or “definitely” would become involved.
There was a more significant increase in those that indicated they would seek
more information on tsunamis risks with about 10% more saying they would
“possibly” and would “definitely” do so.
Have you heard or received information about preparing for tsunami hazards from any of the following? (Tick all that apply) 2003 2006 change I haven’t heard or received any information 63.5 42.3 -21.2 Friends 6.3 12.7 +6.4 Neighbours 1.8 4.2 +2.4 Relatives 3.4 7.7 +4.3 Central Government 2.4 8.5 +6.1 Region Council 5.2 15.5 +10.3 Local Council 8.3 19.7 +11.4 Local Civil Defence group 13.3 26.1 +12.8 Business establishments 0.0 0.7 +0.7 Research Organization 5.7 12.7 +7.0 My workplace 4.9 5.6 +0.7 My child’s school 1.9 3.5 +1.6 Other 11.6 15.5 +3.9
- 108 -
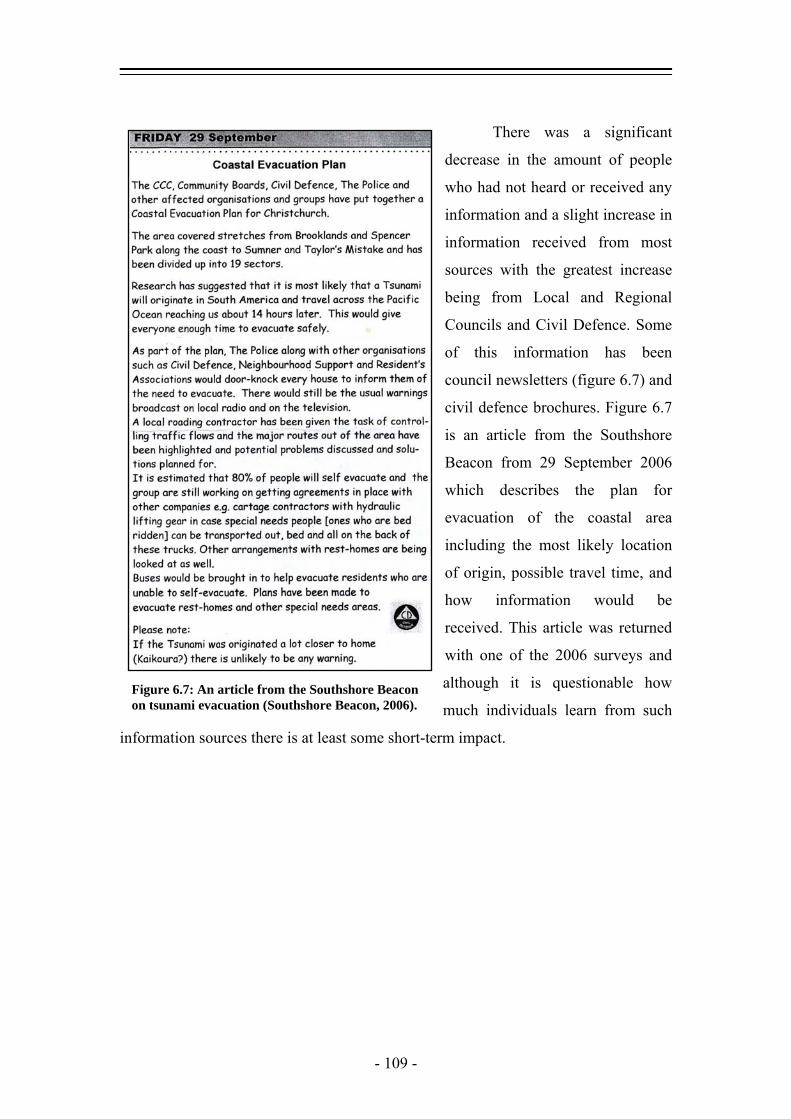
There was a significant
decrease in the amount of people
who had not heard or received any
information and a slight increase in
information received from most
sources with the greatest increase
being from Local and Regional
Councils and Civil Defence. Some
of this information has been
council newsletters (figure 6.7) and
civil defence brochures. Figure 6.7
is an article from the Southshore
Beacon from 29 September 2006
which describes the plan for
evacuation of the coastal area
including the most likely location
of origin, possible travel time, and
how information would be
received. This article was returned
with one of the 2006 surveys and
although it is questionable how
much individuals learn from such
information sources there is at least some short-term impact.
Figure 6.7: An article from the Southshore Beacon on tsunami evacuation (Southshore Beacon, 2006).
- 109 -

Have you asked any of the following people, groups or organisations for information on how to get ready for tsunami hazards? (Tick all that apply) 2003 2006 change I haven’t heard or received any information 86.9 85.9 -1.0 Friends 5.6 5.6 0.0 Neighbours 2.9 2.8 -0.1 Relatives 1.9 5.6 +3.7 Central Government 0.0 0.7 +0.7 Region Council 1.2 1.4 +0.2 Local Council 2.8 0.7 -2.1 Local Civil Defence group 1.6 4.9 +3.3 Business establishments 0.0 0.7 +0.7 Research Organization 0.0 1.4 +1.4 My workplace 1.7 2.3 +0.6 My child’s school 0.7 1.4
If you are at the coast and receive an official tsunami warning how much time do you have to move to safety?
0
5
10
15
20
25
30
35
40
45
Don't know A few minutes 10 minutes to halfand hour
Half an hour to onehour
1-2 hours More than 2 hours
%
20062003
+0.7 Other 0.9 0.0 -0.9
There was very little change in sources used for individuals engaging in active
information seeking. In both the 2003 and 2006 surveys over 85% of participants
indicated that they had not heard or received any information.
In both the 2003 and 2006 survey participants greatly underestimated the
amount of time that they would have for distantly generated tsunamis, this was
especially true for the 2006 survey where 25% more people thought that they would
- 110 -
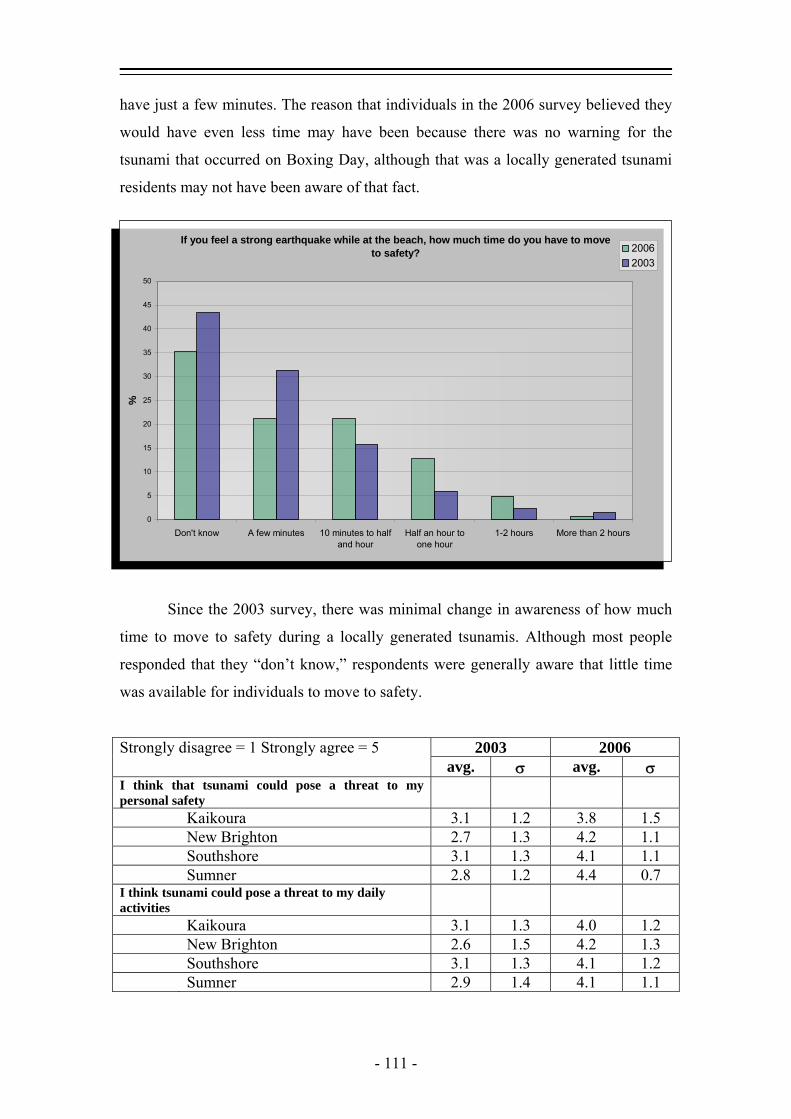
have just a few minutes. The reason that individuals in the 2006 survey believed they
would have even less time may have been because there was no warning for the
tsunami that occurred on Boxing Day, although that was a locally generated tsunami
residents may not have been aware of that fact.
If you feel a strong earthquake while at the beach, how much time do you have to move to safety?
0
5
10
15
20
25
30
35
40
45
50
Don't know A few minutes 10 minutes to halfand hour
Half an hour toone hour
1-2 hours More than 2 hours
%
20062003
Since the 2003 survey, there was minimal change in awareness of how much
time to move to safety during a locally generated tsunamis. Although most people
responded that they “don’t know,” respondents were generally aware that little time
was available for individuals to move to safety.
2003 2006 Strongly disagree = 1 Strongly agree = 5 avg. σ avg. σ
I think that tsunami could pose a threat to my personal safety
Kaikoura 3.1 1.2 3.8 1.5 New Brighton 2.7 1.3 4.2 1.1 Southshore 3.1 1.3 4.1 1.1 Sumner 2.8 1.2 4.4 0.7 I think tsunami could pose a threat to my daily activities
Kaikoura 3.1 1.3 4.0 1.2 New Brighton 2.6 1.5 4.2 1.3 Southshore 3.1 1.3 4.1 1.2 Sumner 2.9 1.4 4.1 1.1
- 111 -

There was a tendency to agree more strongly in 2006 than in 2003 to the
statements that tsunamis could pose a threat to both the individuals’ personal safety
and daily activities, though the results are within the error margin so it is difficult to
ascertain for certain.
Has your household done any of the following to prepare for a hazard or emergency? (Tick all that apply). total n= 169 2003 2006 chan
ge Have a working flashlight 82.4 80.2 -2.2 Protected breakable household items 12.1 12.7 +0.6 Put strong latches on cabinet drawers 11.3 7.7 -3.6 Stored hazardous materials safely 42.0 42.3 +0.3 Added edges to shelves to keep things from sliding off 3.1 2.1 -1.0 Strapped water heater 23.1 24.6 +1.5 Installed flexible tubing to gas appliances 5.7 4.2 -1.5 Bolted house to foundation 15.0 19.0 +4.0 Stockpiled water and food for three days 28.3 54.2 +25.9 Have working portable radio and spare batteries 49.0 57.0 +8.0 Have a working fire extinguisher 41.0 42.3 +1.3 Have a working smoke detector 74.8 84.5 +9.7 Have a first aid kit 70.4 81.0 +10.6 Stored wrench near gas turn-off valve 2.3 2.8 +0.5 Picked an emergency contact person outside your local area 16.1 18.3 +2.2 Someone in family has learned how to put out fires 40.2 42.3 +2.1 Bought additional insurance (e.g. home) 41.7 34.5 -7.2 Someone in family has learned to provide first aid 52.8 56.3 +3.5 Found out if you are in an area particularly vulnerable to a disaster (such as an earthquake, flood or tsunami) 24.6 54.9 +30.3
Have had home inspected for preparedness 0.5 2.8 +2.3 If a you are a visitor have you checked for emergency supplies where you are staying 0.7 1.4 +0.7
Talked to family members about what to do if a tsunami hazard warning is heard 14.1 33.1 +19.0
There were generally slight changes in preparatory measures taken by
respondents although there were some very notable increases. There was an almost
30% increase in those who had stockpiled three days worth of food and water. There
was also an increase of over 30% in those that had found out if they were in an area
particularly vulnerable to disasters. Almost 20% more people had talked with their
families about what to do in the event of a tsunami warning. More participants had
first aid kits, working smoke detectors, and a portable radio and batteries. Some of
these increases in preparatory activities could result from influences other than the
- 112 -

2004 Boxing Day tsunami including the blizzard that affected most of southern
Canterbury during the winter of 2006 and the advertisements for the Civil Defence
webpage www.getthru.govt.nz, which has emphasized the stockpiling of food. The
largest decrease was in those who had bought additional insurance.
2006How often do you check your emergency supplies?
0
5
10
15
20
25
30
35
40
45
50
Weekly Monthly Yearly Never
%
2003
There was a substantial increase in the amount of people that checked their
emergency supplies on a monthly basis and decrease in those that never had, with
approximately 15% less people having never checked supplies. Neither weekly nor
yearly checks changed significantly, though there was a 7% increase in monthly
supply checks.
6.5 Discussion In an interview after the event it was quoted that “Before December 25, very few
people knew what a tsunami was. After December 26, almost everyone does”
(Lautenbacher Jr., 2005). Although most people reported already knowing what a
tsunamis was most people also indicated that they learned more.
In terms of general tsunami knowledge there was a significant increase in
those who knew when the last tsunami had occurred, though there was minimal
- 113 -
change in information receipt or seeking. In addition, most individuals still do not
plan to engage in future information seeking or group discussions.
There was an increase in those who knew the proper authorities to expect a
warning from, though there was also an erroneous increase in those who expected to
hear a siren warning. Another noteworthy change was that more people believed that
they would have less time to move to safety after an official warning. This may have
been because there was no warning for the tsunami that occurred on Boxing Day, and
although that was a locally generated tsunami residents may not have been aware of
that fact. And even though there was an increase in those who perceived tsunamis as a
possible risk and more people believed that preparing was possible, there were
generally minor increases in preparatory measures.
Though, it may not be quite true that “that December day forever changed the
world’s appreciation for how much damage tsunamis can inflict” (Geist et al, 2006),
this event certainly made an impact, increasing people’s knowledge and awareness,
but not necessarily forever. Only years after the 1946 tsunami, funding for the
warning centre virtually dried up and when the 1960 tsunami occurred 61 people were
killed, many of whom had returned to the hazards zone between waves (Dudley and
Lee, 1998) or did not evacuate at all because of misunderstanding of the warning
system (Gregg et al, 2007). In the case of the 2004 Boxing Day tsunami the death toll
and destruction were far greater, so it may be remembered for longer, but eventually
the lessons learned will fade.
- 114 -
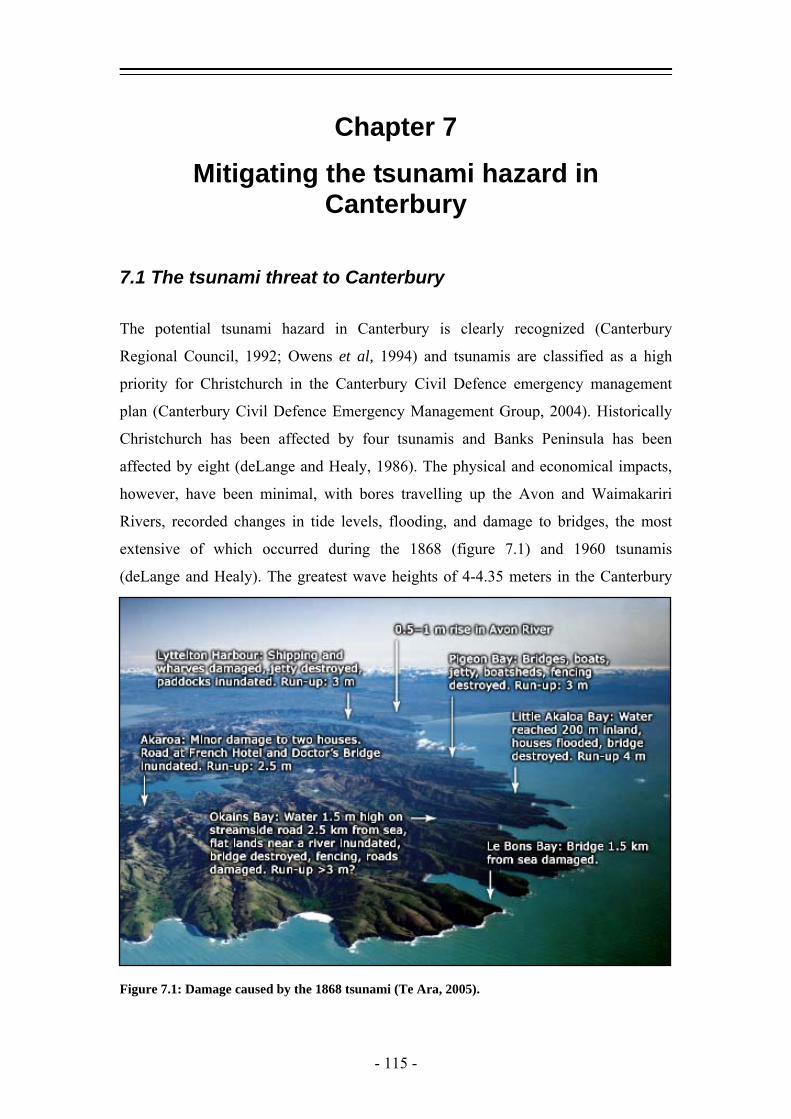
Chapter 7
Mitigating the tsunami hazard in Canterbury
7.1 The tsunami threat to Canterbury
The potential tsunami hazard in Canterbury is clearly recognized (Canterbury
Regional Council, 1992; Owens et al, 1994) and tsunamis are classified as a high
priority for Christchurch in the Canterbury Civil Defence emergency management
plan (Canterbury Civil Defence Emergency Management Group, 2004). Historically
Christchurch has been affected by four tsunamis and Banks Peninsula has been
affected by eight (deLange and Healy, 1986). The physical and economical impacts,
however, have been minimal, with bores travelling up the Avon and Waimakariri
Rivers, recorded changes in tide levels, flooding, and damage to bridges, the most
extensive of which occurred during the 1868 (figure 7.1) and 1960 tsunamis
(deLange and Healy). The greatest wave heights of 4-4.35 meters in the Canterbury
Figure 7.1: Damage caused by the 1868 tsunami (Te Ara, 2005).
- 115 -
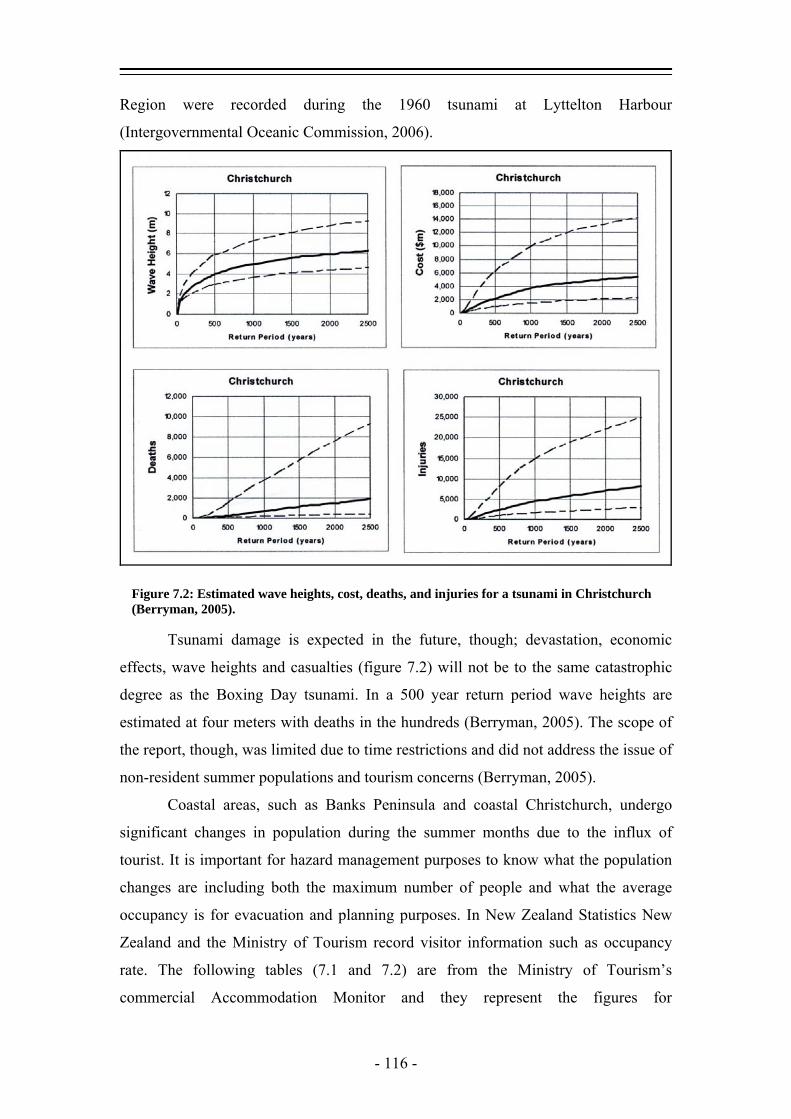
Region were recorded during the 1960 tsunami at Lyttelton Harbour
(Intergovernmental Oceanic Commission, 2006).
Figure 7.2: Estimated wave heights, cost, deaths, and injuries for a tsunami in Christchurch (Berryman, 2005).
Tsunami damage is expected in the future, though; devastation, economic
effects, wave heights and casualties (figure 7.2) will not be to the same catastrophic
degree as the Boxing Day tsunami. In a 500 year return period wave heights are
estimated at four meters with deaths in the hundreds (Berryman, 2005). The scope of
the report, though, was limited due to time restrictions and did not address the issue of
non-resident summer populations and tourism concerns (Berryman, 2005).
Coastal areas, such as Banks Peninsula and coastal Christchurch, undergo
significant changes in population during the summer months due to the influx of
tourist. It is important for hazard management purposes to know what the population
changes are including both the maximum number of people and what the average
occupancy is for evacuation and planning purposes. In New Zealand Statistics New
Zealand and the Ministry of Tourism record visitor information such as occupancy
rate. The following tables (7.1 and 7.2) are from the Ministry of Tourism’s
commercial Accommodation Monitor and they represent the figures for
- 116 -

accommodations in both the Christchurch City and the former Banks Peninsula
districts (now incorporated into the Christchurch City district) (Ministry of Tourism,
2006).
Banks Peninsula
2005 2006
Measure May June July Aug Sep Oct Nov Dec Jan Feb
34 31 27 29 32 38 39 39 39 Establishments 39
1,130 1,075 1,054 1,074 1,120 1,182 1,186 1,163 1,165 Daily Capacity 1,168 Capacity Per Period 35,030 32,250 32,674 33,294 33,600 36,642 35,580 36,053 36,115 32,704
4,428 3,107 3,585 2,856 4,666 6,533 9,022 9,982 15,219 13,108 Stay Unit Nights 6,993 5,348 6,152 5,044 7,906 11,648 15,215 22,621 39,611 24,737 Guest Nights 4,282 3,347 3,754 3,208 4,624 7,054 9,478 12,058 18,401 14,655 Guest Arrivals
2 2 2 2 2 2 2 2 2 Length Of Stay 2 Occupancy Rate % 13 10 11 9 14 18 25 28 42 40
Table 7.1: Holiday park figures for the Banks Peninsula district (Ministry of Tourism, 2006).
Christchurch
2005 2006
Measure May June July Aug Sep Oct Nov Dec Jan Feb
Establishments 211 209 202 208 210 213 217 217 216 216
Daily Capacity 8,686 8,677 8,625 8,699 8,734 8,811 8,878 8,869 8,874 8,875 Capacity Per Period 269,266 260,310 267,375 269,669 262,020 273,141 266,340 274,939 275,094 248,500
Stay Unit Nights 122,115 131,580 125,257 116,780 127,948 151,870 168,192 153,921 173,805 182,915
Guest Nights 195,598 218,716 218,220 194,071 222,380 263,263 286,323 281,129 328,636 319,099
Guest Arrivals 109,717 109,047 115,644 104,376 125,608 146,700 160,574 157,425 172,084 179,343
Length Of Stay 2 2 2 2 2 2 2 2 2 2 Occupancy Rate % 45 51 47 43 49 56 63 56 63 74
Table 7.2: Table 2: Holiday park figures for the Banks Peninsula district (Ministry of Tourism, 2006).
As can be seen from the tables there is a
definite seasonal variance in visitors by month with
January and February being the peak months. Not all of
the accommodations represented in the dataset are
coastal establishments nor are they holiday parks. The
occupancy rate for coastal accommodations, though,
can be approximated from the average occupancy rate
for each month and from the peak occupancy, which
was provided by managers at each of the survey
locations (table 7.3). The percentages given are only for holiday parks and are
calculated from Statistics New Zealand data from 1997 to 2005 (Statistics New
Location Maximum occupancy
Duvauchelles 460 Kairaki Beach 300 Little Akaloa 125 Okains Bay 600 Pigeon Bay 125 Purau Bay 750 South Brighton 400 Spencer Beach 1400 Wood end 500 Total 4660 Table 7.3: Peak capacity for coastal holiday parks.
- 117 -
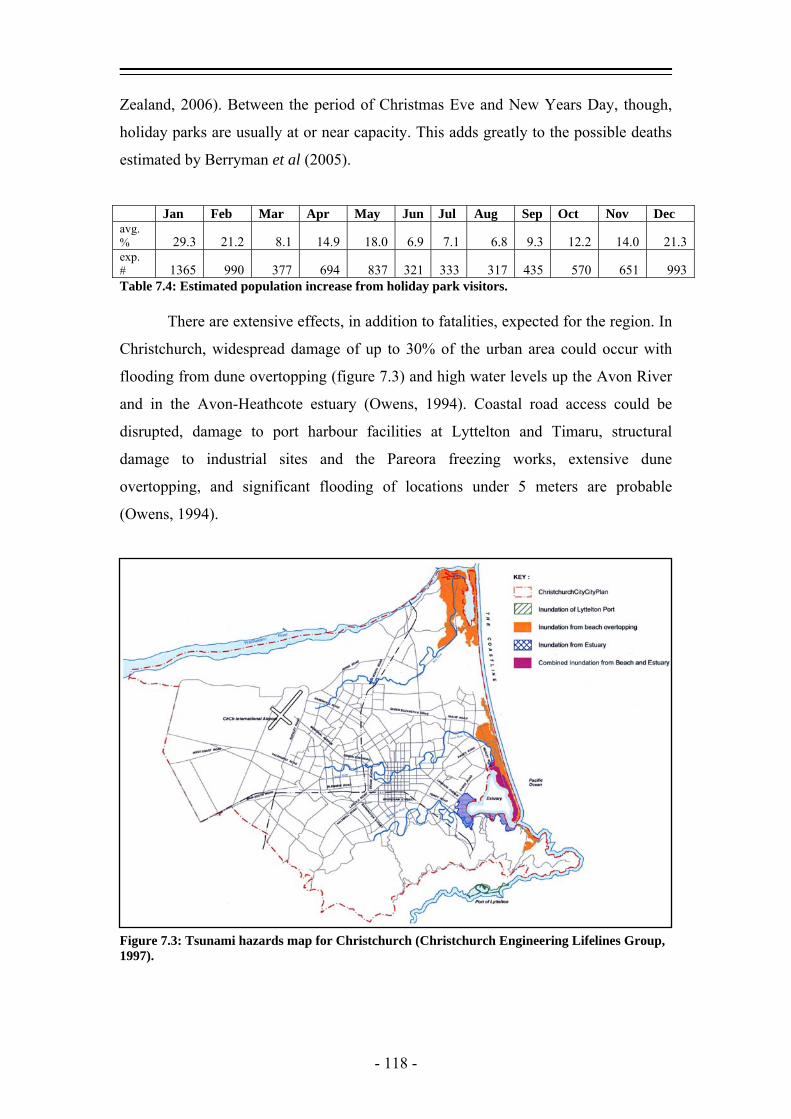
Zealand, 2006). Between the period of Christmas Eve and New Years Day, though,
holiday parks are usually at or near capacity. This adds greatly to the possible deaths
estimated by Berryman et al (2005).
Jan Feb Mar Apr May Jun Jul Aug Sep Oct Nov Dec avg. % 29.3 21.2 8.1 14.9 18.0 6.9 7.1 6.8 9.3 12.2 14.0 21.3 exp. # 1365 990 377 694 837 321 333 317 435 570 651 993 Table 7.4: Estimated population increase from holiday park visitors.
There are extensive effects, in addition to fatalities, expected for the region. In
Christchurch, widespread damage of up to 30% of the urban area could occur with
flooding from dune overtopping (figure 7.3) and high water levels up the Avon River
and in the Avon-Heathcote estuary (Owens, 1994). Coastal road access could be
disrupted, damage to port harbour facilities at Lyttelton and Timaru, structural
damage to industrial sites and the Pareora freezing works, extensive dune
overtopping, and significant flooding of locations under 5 meters are probable
(Owens, 1994).
Figure 7.3: Tsunami hazards map for Christchurch (Christchurch Engineering Lifelines Group, 1997).
- 118 -
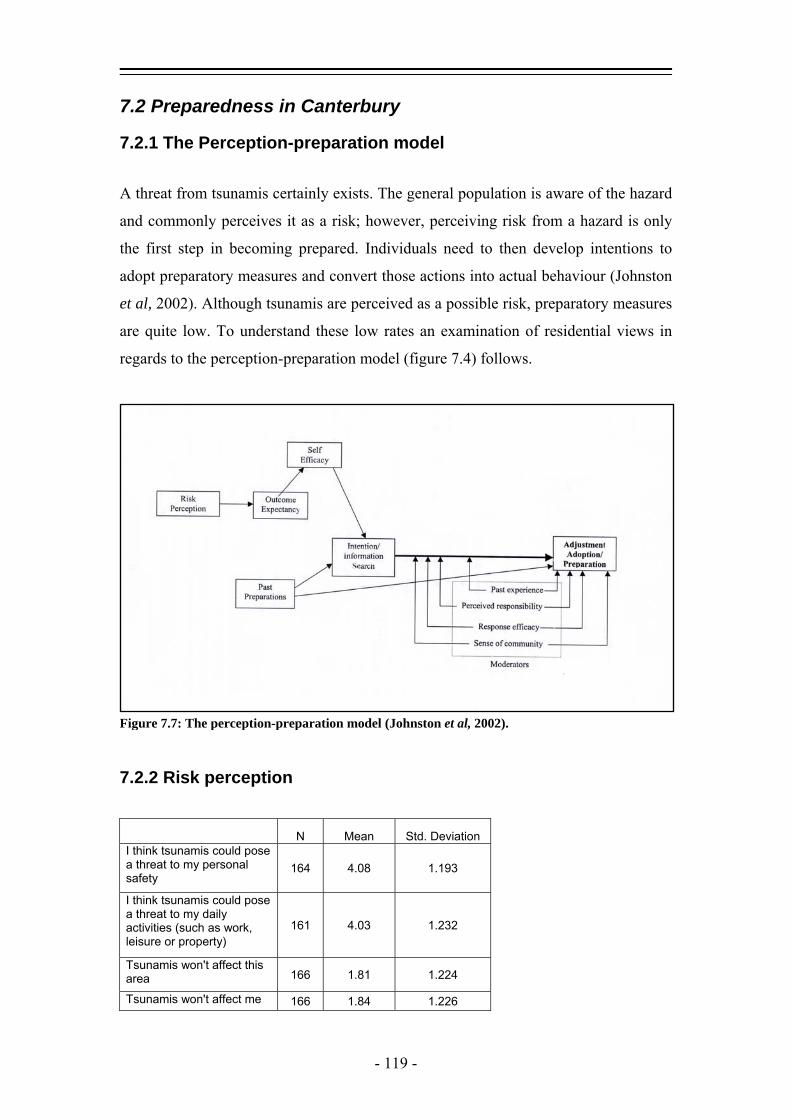
7.2 Preparedness in Canterbury
7.2.1 The Perception-preparation model
A threat from tsunamis certainly exists. The general population is aware of the hazard
and commonly perceives it as a risk; however, perceiving risk from a hazard is only
the first step in becoming prepared. Individuals need to then develop intentions to
adopt preparatory measures and convert those actions into actual behaviour (Johnston
et al, 2002). Although tsunamis are perceived as a possible risk, preparatory measures
are quite low. To understand these low rates an examination of residential views in
regards to the perception-preparation model (figure 7.4) follows.
7.2.2 Risk perception
N Mean Std. Deviation I think tsunamis could pose a threat to my personal safety
164 4.08 1.193
I think tsunamis could pose a threat to my daily activities (such as work, leisure or property)
161 4.03 1.232
Tsunamis won't affect this area 166 1.81 1.224
Tsunamis won't affect me 166 1.84 1.226
Figure 7.7: The perception-preparation model (Johnston et al, 2002).
- 119 -

Response to these questions indicates high level of perceived threat from
tsunamis with individuals believing tsunamis could affect their safety, daily activities
and their locations.
7.2.2 Outcome expectancy
N Mean Std. Deviation Tsunamis are too destructive to bother preparing for
161 1.96 1.308
Outcome expectancy describes the degree to which an individual believes their
preparatory actions will be effective (Johnston et al, 2002) and is relatively high for
Canterbury residents. The majority of respondents viewed preparation as effective and
possible in saving lives and as a means to improve their ability to deal with disruption
to their family and communities.
7.2.3 Self efficacy
“Self-efficacy is defined as people's beliefs about their capabilities to produce
designated levels of performance that exercise influence over events that affect their
lives” (Bandura, 1994). Unfortunately, none of the survey questions dealt with self-
efficacy.
- 120 -

7.2.4 Intention/information search
N
No
Possibly
Definitely Improve your knowledge of how to respond to tsunamis
167
27.5
61.1
11.3
Increase your ability to respond to tsunamis
165
27.5
60.0
12.1
Become involved with a local group/neighbourhood to discuss how to respond to tsunamis
166
71.7
25.3
3.0
Seek information on tsunami risks
164
41.5
41.5
17.1
Seek information on things to do to respond to tsunamis
165
29.3
53.0
17.7
There was generally low to moderate tendencies towards information seeking.
This is consistent with the fact that few people had engaged in any information
seeking at present.
7.2.5 Prior experience 1- little impact, 10- severe impact
n Mean Std. Dev
Chemical spill 9 4.2 3.23 Climate change 17 3.5 2.29 Earthquake 47 2.0 1.33 Fire 19 4.2 2.30 Flood 37 4.0 2.74 Infrastructure failure 63 3.6 2.28 Landslide 8 3.5 1.60 Pandemic 1 1.0 0.00 Storm 42 3.8 2.18 Tornado 3 3.3 4.04 Volcanic eruption 3 2.0 1.00
There was a wide range of prior hazard experience, most of which had
negligible impact. Individuals who have experienced minor effects that are
considerably smaller than what can potentially occur from a hazard will feel that they
- 121 -
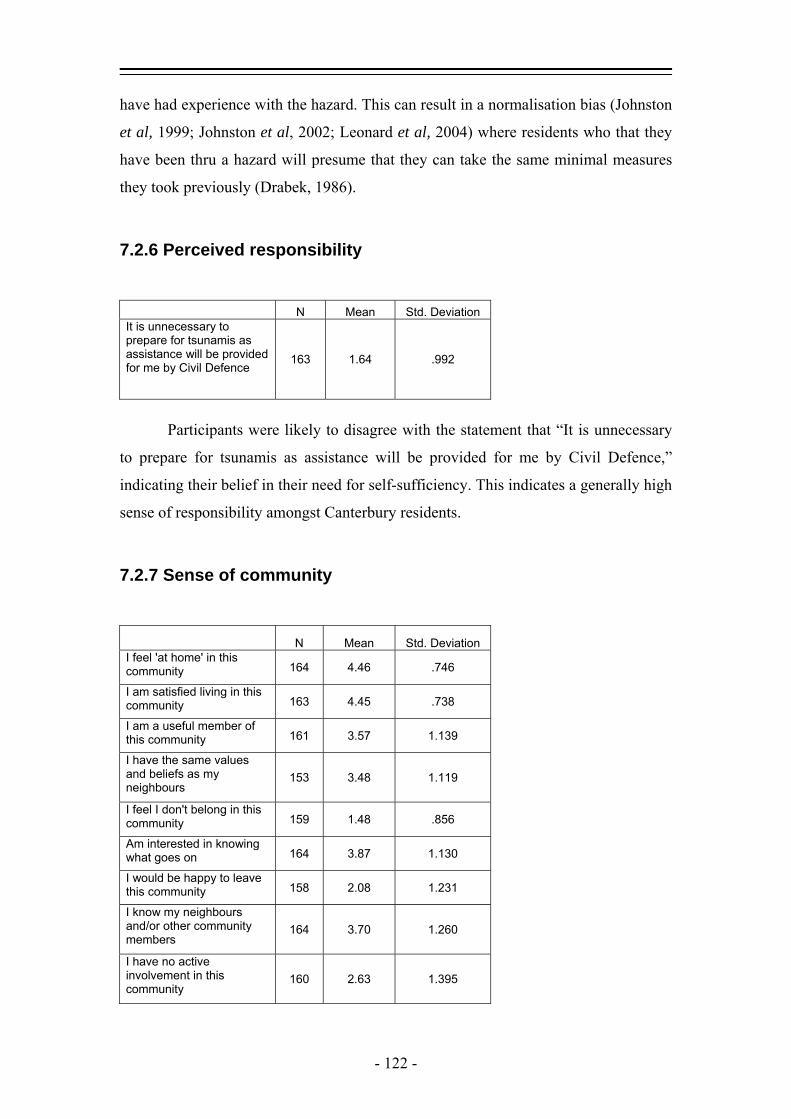
have had experience with the hazard. This can result in a normalisation bias (Johnston
et al, 1999; Johnston et al, 2002; Leonard et al, 2004) where residents who that they
have been thru a hazard will presume that they can take the same minimal measures
they took previously (Drabek, 1986).
7.2.6 Perceived responsibility N Mean Std. Deviation It is unnecessary to prepare for tsunamis as assistance will be provided for me by Civil Defence
163 1.64 .992
Participants were likely to disagree with the statement that “It is unnecessary
to prepare for tsunamis as assistance will be provided for me by Civil Defence,”
indicating their belief in their need for self-sufficiency. This indicates a generally high
sense of responsibility amongst Canterbury residents.
7.2.7 Sense of community N Mean Std. Deviation I feel 'at home' in this community 164 4.46 .746
I am satisfied living in this community 163 4.45 .738
I am a useful member of this community 161 3.57 1.139
I have the same values and beliefs as my neighbours
153 3.48 1.119
I feel I don't belong in this community 159 1.48 .856
Am interested in knowing what goes on 164 3.87 1.130
I would be happy to leave this community 158 2.08 1.231
I know my neighbours and/or other community members
164 3.70 1.260
I have no active involvement in this community
160 2.63 1.395
- 122 -
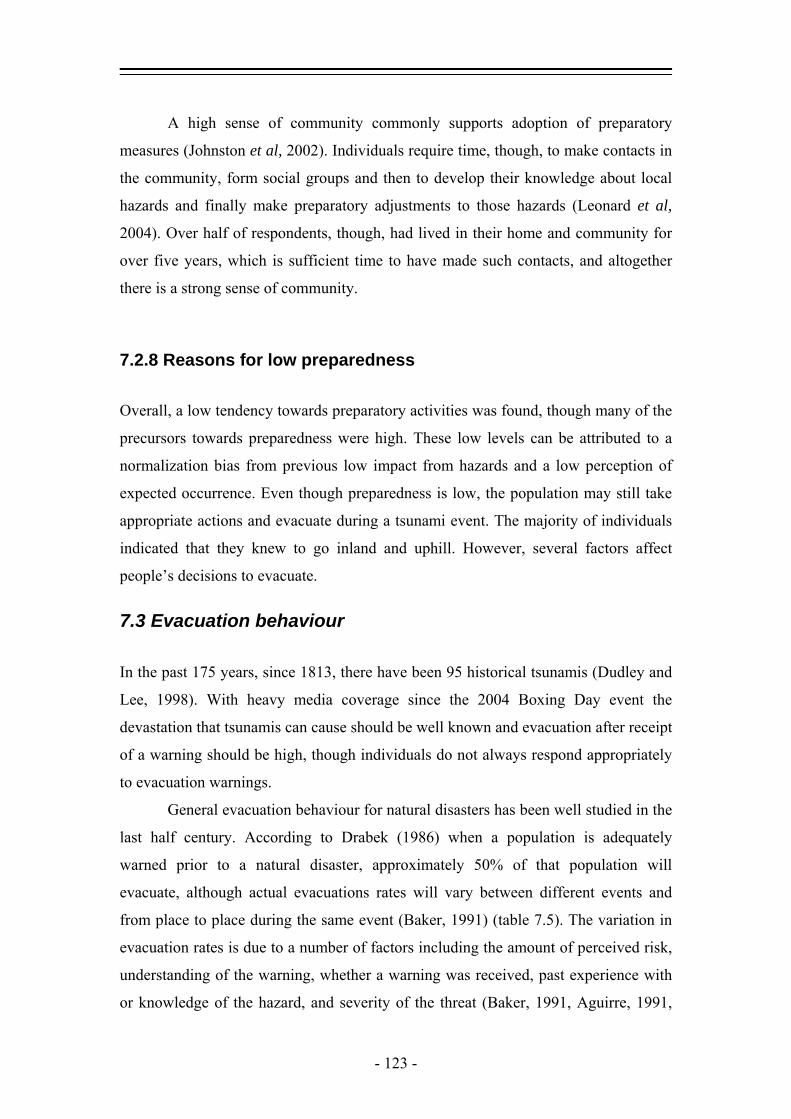
A high sense of community commonly supports adoption of preparatory
measures (Johnston et al, 2002). Individuals require time, though, to make contacts in
the community, form social groups and then to develop their knowledge about local
hazards and finally make preparatory adjustments to those hazards (Leonard et al,
2004). Over half of respondents, though, had lived in their home and community for
over five years, which is sufficient time to have made such contacts, and altogether
there is a strong sense of community.
7.2.8 Reasons for low preparedness
Overall, a low tendency towards preparatory activities was found, though many of the
precursors towards preparedness were high. These low levels can be attributed to a
normalization bias from previous low impact from hazards and a low perception of
expected occurrence. Even though preparedness is low, the population may still take
appropriate actions and evacuate during a tsunami event. The majority of individuals
indicated that they knew to go inland and uphill. However, several factors affect
people’s decisions to evacuate.
7.3 Evacuation behaviour
In the past 175 years, since 1813, there have been 95 historical tsunamis (Dudley and
Lee, 1998). With heavy media coverage since the 2004 Boxing Day event the
devastation that tsunamis can cause should be well known and evacuation after receipt
of a warning should be high, though individuals do not always respond appropriately
to evacuation warnings.
General evacuation behaviour for natural disasters has been well studied in the
last half century. According to Drabek (1986) when a population is adequately
warned prior to a natural disaster, approximately 50% of that population will
evacuate, although actual evacuations rates will vary between different events and
from place to place during the same event (Baker, 1991) (table 7.5). The variation in
evacuation rates is due to a number of factors including the amount of perceived risk,
understanding of the warning, whether a warning was received, past experience with
or knowledge of the hazard, and severity of the threat (Baker, 1991, Aguirre, 1991,
- 123 -
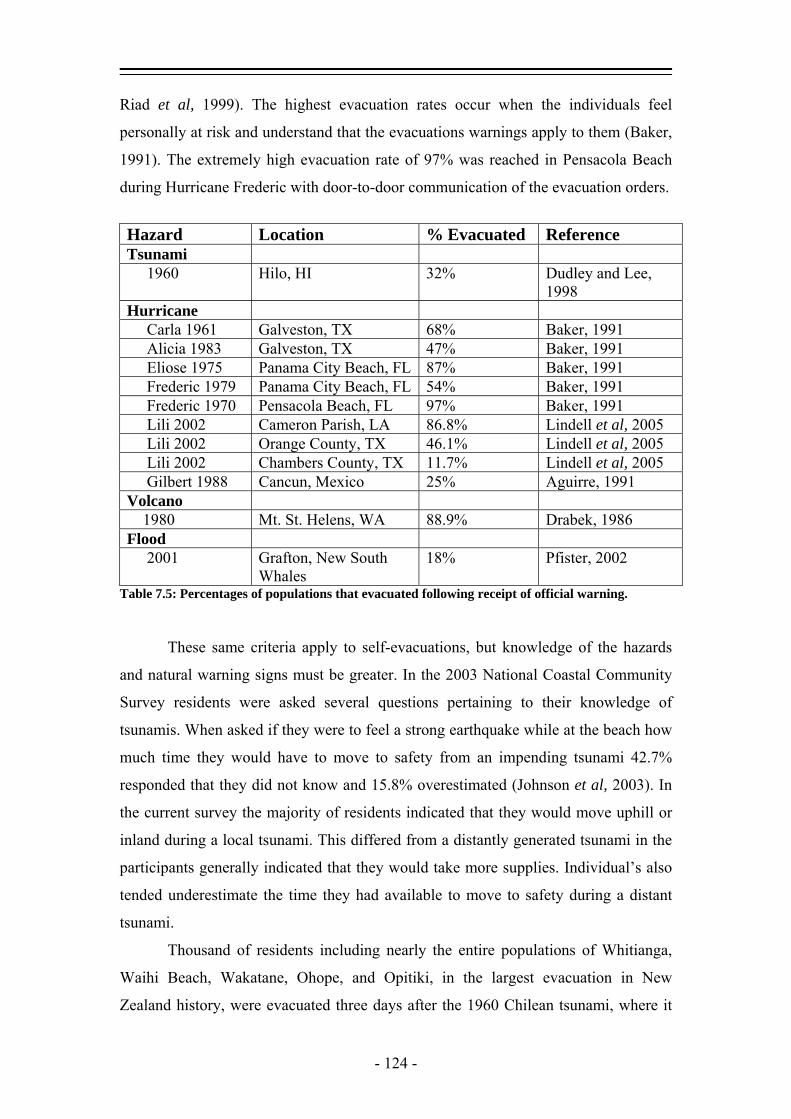
Riad et al, 1999). The highest evacuation rates occur when the individuals feel
personally at risk and understand that the evacuations warnings apply to them (Baker,
1991). The extremely high evacuation rate of 97% was reached in Pensacola Beach
during Hurricane Frederic with door-to-door communication of the evacuation orders.
Hazard Location % Evacuated Reference Tsunami 1960 Hilo, HI 32% Dudley and Lee,
1998 Hurricane Carla 1961 Galveston, TX 68% Baker, 1991 Alicia 1983 Galveston, TX 47% Baker, 1991 Eliose 1975 Panama City Beach, FL 87% Baker, 1991 Frederic 1979 Panama City Beach, FL 54% Baker, 1991 Frederic 1970 Pensacola Beach, FL 97% Baker, 1991 Lili 2002 Cameron Parish, LA 86.8% Lindell et al, 2005 Lili 2002 Orange County, TX 46.1% Lindell et al, 2005 Lili 2002 Chambers County, TX 11.7% Lindell et al, 2005 Gilbert 1988 Cancun, Mexico 25% Aguirre, 1991 Volcano 1980 Mt. St. Helens, WA 88.9% Drabek, 1986 Flood 2001 Grafton, New South
Whales 18% Pfister, 2002
Table 7.5: Percentages of populations that evacuated following receipt of official warning. These same criteria apply to self-evacuations, but knowledge of the hazards
and natural warning signs must be greater. In the 2003 National Coastal Community
Survey residents were asked several questions pertaining to their knowledge of
tsunamis. When asked if they were to feel a strong earthquake while at the beach how
much time they would have to move to safety from an impending tsunami 42.7%
responded that they did not know and 15.8% overestimated (Johnson et al, 2003). In
the current survey the majority of residents indicated that they would move uphill or
inland during a local tsunami. This differed from a distantly generated tsunami in the
participants generally indicated that they would take more supplies. Individual’s also
tended underestimate the time they had available to move to safety during a distant
tsunami.
Thousand of residents including nearly the entire populations of Whitianga,
Waihi Beach, Wakatane, Ohope, and Opitiki, in the largest evacuation in New
Zealand history, were evacuated three days after the 1960 Chilean tsunami, where it
- 124 -
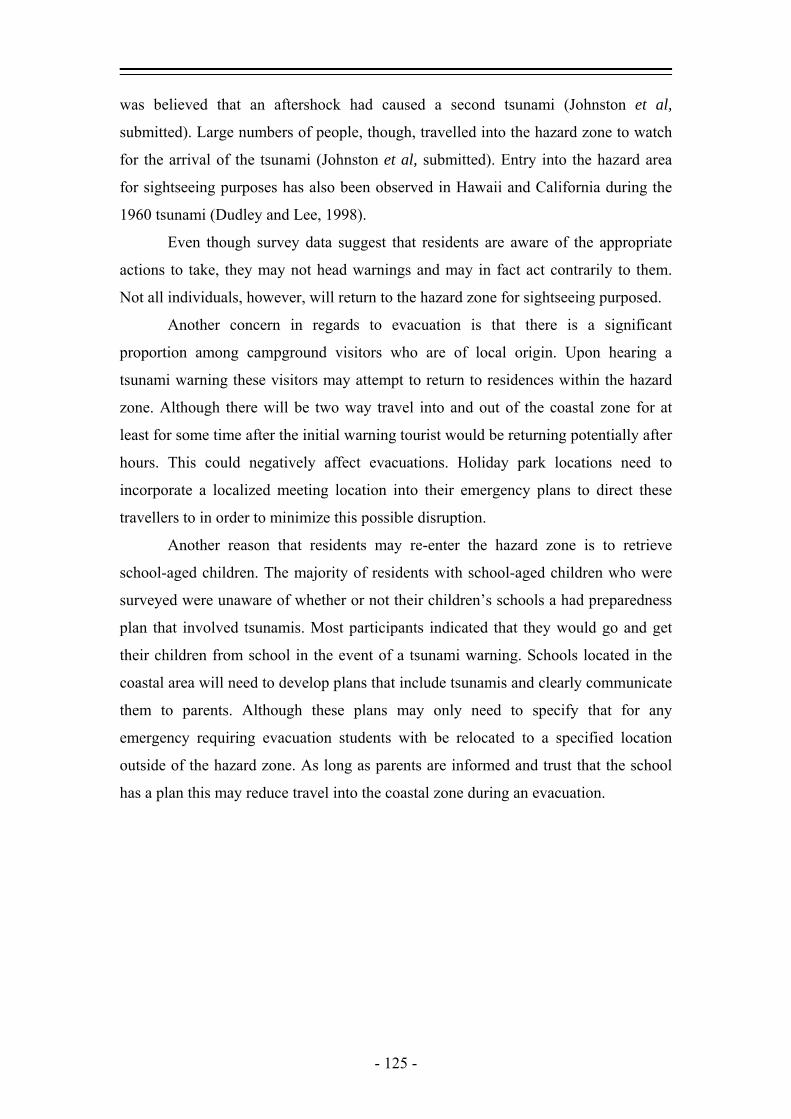
was believed that an aftershock had caused a second tsunami (Johnston et al,
submitted). Large numbers of people, though, travelled into the hazard zone to watch
for the arrival of the tsunami (Johnston et al, submitted). Entry into the hazard area
for sightseeing purposes has also been observed in Hawaii and California during the
1960 tsunami (Dudley and Lee, 1998).
Even though survey data suggest that residents are aware of the appropriate
actions to take, they may not head warnings and may in fact act contrarily to them.
Not all individuals, however, will return to the hazard zone for sightseeing purposed.
Another concern in regards to evacuation is that there is a significant
proportion among campground visitors who are of local origin. Upon hearing a
tsunami warning these visitors may attempt to return to residences within the hazard
zone. Although there will be two way travel into and out of the coastal zone for at
least for some time after the initial warning tourist would be returning potentially after
hours. This could negatively affect evacuations. Holiday park locations need to
incorporate a localized meeting location into their emergency plans to direct these
travellers to in order to minimize this possible disruption.
Another reason that residents may re-enter the hazard zone is to retrieve
school-aged children. The majority of residents with school-aged children who were
surveyed were unaware of whether or not their children’s schools a had preparedness
plan that involved tsunamis. Most participants indicated that they would go and get
their children from school in the event of a tsunami warning. Schools located in the
coastal area will need to develop plans that include tsunamis and clearly communicate
them to parents. Although these plans may only need to specify that for any
emergency requiring evacuation students with be relocated to a specified location
outside of the hazard zone. As long as parents are informed and trust that the school
has a plan this may reduce travel into the coastal zone during an evacuation.
- 125 -
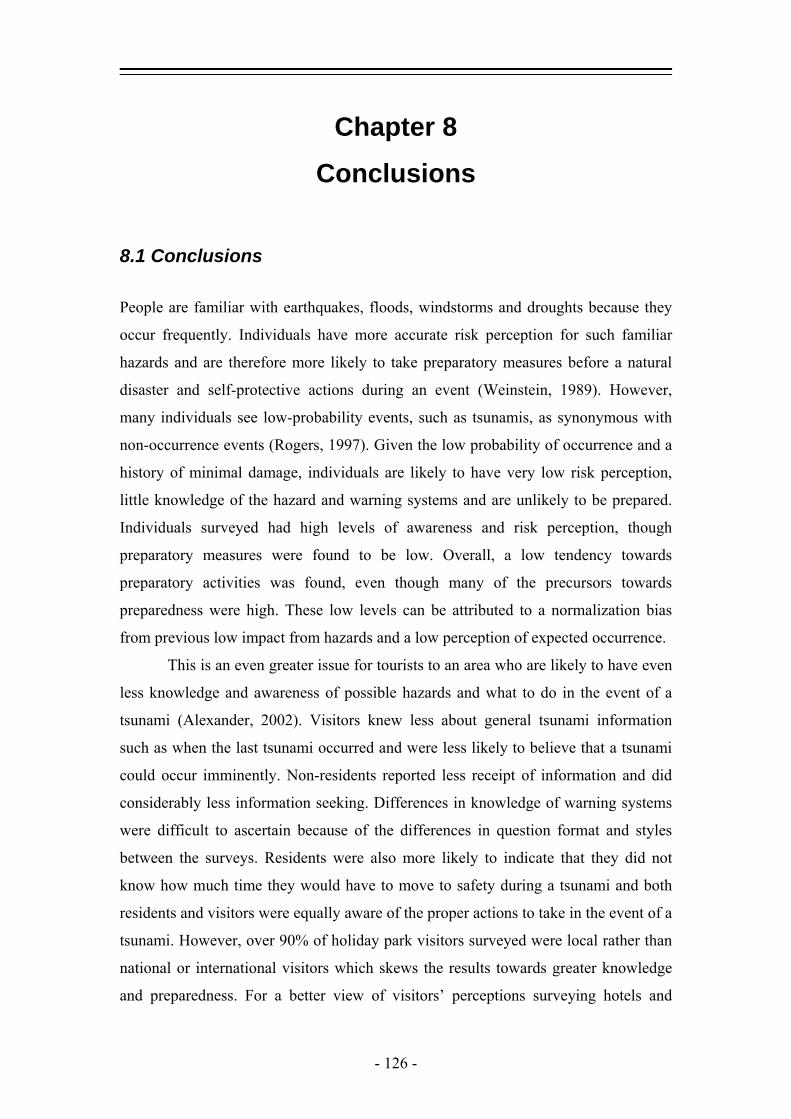
Chapter 8
Conclusions
8.1 Conclusions
People are familiar with earthquakes, floods, windstorms and droughts because they
occur frequently. Individuals have more accurate risk perception for such familiar
hazards and are therefore more likely to take preparatory measures before a natural
disaster and self-protective actions during an event (Weinstein, 1989). However,
many individuals see low-probability events, such as tsunamis, as synonymous with
non-occurrence events (Rogers, 1997). Given the low probability of occurrence and a
history of minimal damage, individuals are likely to have very low risk perception,
little knowledge of the hazard and warning systems and are unlikely to be prepared.
Individuals surveyed had high levels of awareness and risk perception, though
preparatory measures were found to be low. Overall, a low tendency towards
preparatory activities was found, even though many of the precursors towards
preparedness were high. These low levels can be attributed to a normalization bias
from previous low impact from hazards and a low perception of expected occurrence.
This is an even greater issue for tourists to an area who are likely to have even
less knowledge and awareness of possible hazards and what to do in the event of a
tsunami (Alexander, 2002). Visitors knew less about general tsunami information
such as when the last tsunami occurred and were less likely to believe that a tsunami
could occur imminently. Non-residents reported less receipt of information and did
considerably less information seeking. Differences in knowledge of warning systems
were difficult to ascertain because of the differences in question format and styles
between the surveys. Residents were also more likely to indicate that they did not
know how much time they would have to move to safety during a tsunami and both
residents and visitors were equally aware of the proper actions to take in the event of a
tsunami. However, over 90% of holiday park visitors surveyed were local rather than
national or international visitors which skews the results towards greater knowledge
and preparedness. For a better view of visitors’ perceptions surveying hotels and
- 126 -
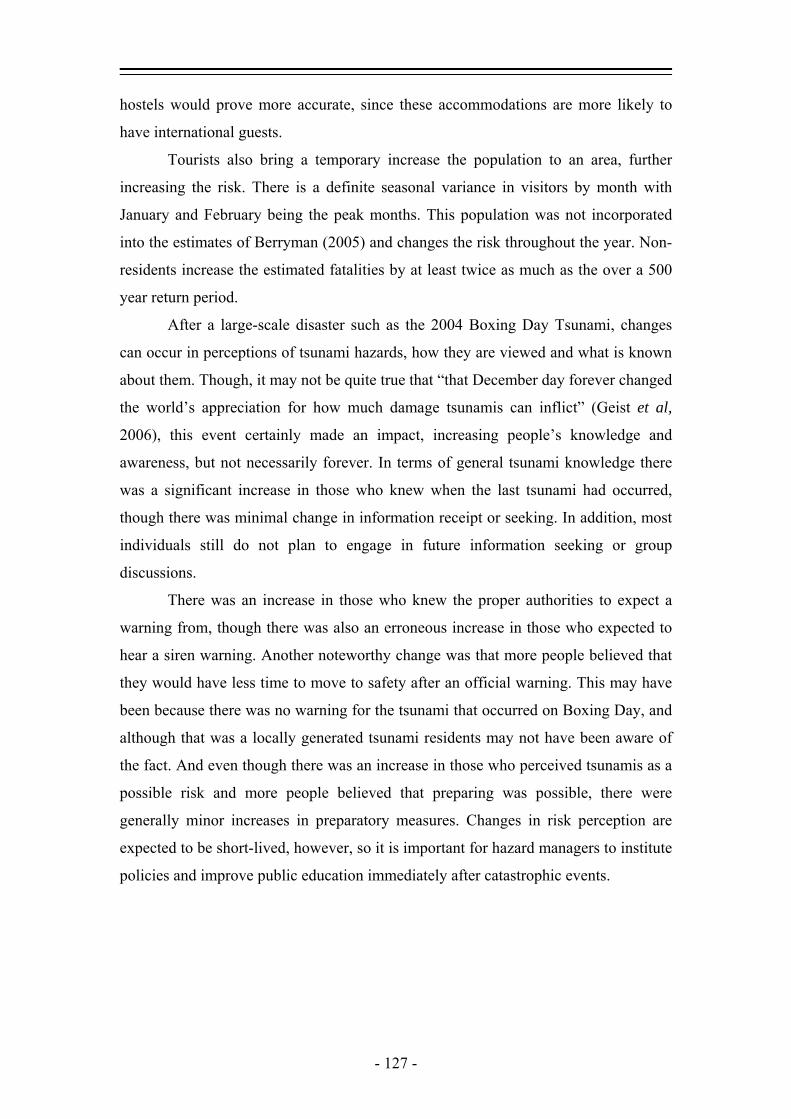
hostels would prove more accurate, since these accommodations are more likely to
have international guests.
Tourists also bring a temporary increase the population to an area, further
increasing the risk. There is a definite seasonal variance in visitors by month with
January and February being the peak months. This population was not incorporated
into the estimates of Berryman (2005) and changes the risk throughout the year. Non-
residents increase the estimated fatalities by at least twice as much as the over a 500
year return period.
After a large-scale disaster such as the 2004 Boxing Day Tsunami, changes
can occur in perceptions of tsunami hazards, how they are viewed and what is known
about them. Though, it may not be quite true that “that December day forever changed
the world’s appreciation for how much damage tsunamis can inflict” (Geist et al,
2006), this event certainly made an impact, increasing people’s knowledge and
awareness, but not necessarily forever. In terms of general tsunami knowledge there
was a significant increase in those who knew when the last tsunami had occurred,
though there was minimal change in information receipt or seeking. In addition, most
individuals still do not plan to engage in future information seeking or group
discussions.
There was an increase in those who knew the proper authorities to expect a
warning from, though there was also an erroneous increase in those who expected to
hear a siren warning. Another noteworthy change was that more people believed that
they would have less time to move to safety after an official warning. This may have
been because there was no warning for the tsunami that occurred on Boxing Day, and
although that was a locally generated tsunami residents may not have been aware of
the fact. And even though there was an increase in those who perceived tsunamis as a
possible risk and more people believed that preparing was possible, there were
generally minor increases in preparatory measures. Changes in risk perception are
expected to be short-lived, however, so it is important for hazard managers to institute
policies and improve public education immediately after catastrophic events.
- 127 -
Acknowledgments
I would like to thank my advisors Dr. David Johnston and Dr. Tim Davies, for advice, assistance and editing,
John Mitchell, Environment Canterbury and GNS Science for funding, the Department of Geology the
Mason Trust Fund, Michelle Herd for editing and Robbie Thomson for help with GIS mapping.
- 128 -
References Aguirre, B., 1991. Evacuation in Cancun during Hurricane Gilbert, International
Journal of Mass Emergencies and Disasters, v.9, n.1, p.31-45 Alexander, D., 2002. Making research on geological hazards relevant to stakeholders’
need, Quaternary International, Article in press, doi:10.1016/j.quaint.2007.01.006
Alverson, K., 2005. Watching over the world's oceans, Nature, v. 434, p. 19-20 Atwater, B., Cisternas, M. V., Bourgeois, J. , Dudley, W. C., Hendley II, J. W., and
Stauffer, P. H., 2005. Surviving a Tsunami—Lessons from Chile, Hawaii, and Japan, U.S. Geological Survey Circular 1187
Baker, E., 1991. Hurricane evacuation behavior, International Journal of Mass
Emergencies and Disasters, v. 9, n. 2, p. 287-310 Ballantyne, D., 2006. Lifelines, In Iwan, W. Summary Report on the Great Sumatra
Earthquakes and Indian Ocean Tsunamis of 26 December 2004 and 28 March 2005, Earthquake Engineering Research Institute, Oakland, California, p. 45-52
Bandura, A.,1994. Self-efficacy. In Ramachaudran, V. S., Encyclopedia of human
behavior Vol. 4, pp. 71-81. New York: Academic Press, http://www.des.emory.edu/mfp/BanEncy.html, [23 May 2007]
Barton, L., 1994. Crisis Management: Preparing for and managing disasters, Cornell
Hotel and Restaurant Administration Quarterly, v35 (2) p. 59-65 Bateman, J., and Edwards, B., 2002. Gender and evacuation: A closer look at why
women are more likely to evacuates for hurricanes, Natural Hazards Review, v. 3, n. 3, p. 107-117
Berryman, K., 2005. Review of Tsunami Hazard and Risk in New Zealand, Institute
of Geological and Nuclear Sciences, Lower Hutt, New Zealand Bird and Dominey-Howes, 2005. Tsunami risk mitigation and the issue of public
awareness, Australian Journal of Emergency Management, v. 21. n. 4, p. 29-35
Birkland, T. A., Herabat, P., Little, R. G., and Wallace, W. A. 2006, The Impact of
the December 2004 Indian Ocean Tsunami on Tourism in Thailand, 2004 Great Sumatra Earthquakes and Indian Ocean Tsunamis of December 26, 2004 and March 28, 2005, Earthquake Spectra, v. 22, (S3) p. S889-S900
- 129 -
Bryant, E., 2001. Tsunamis: the underrated hazard, Cambridge University Press, Cambridge
Bryant, E., 2005. Natural Hazards, Cambridge University Press, Cambridge Burton, I. and Kates, R., 1964. The perception of natural hazards in resource
management, Natural Resources Journal, v. 3, p. 412-440 Canterbury Civil Defence Emergency Management Group, 2004. Draft Canterbury
Civil Defence Emergency Management Group plan, 2005-2010, Environment Canterbury, Christchurch, NZ
Canterbury Regional Council, 1992. Managing natural hazards in Canterbury,
Strategic Policy Unit, Canterbury Regional Council, Christchurch, NZ Christchurch Engineering Lifelines Group, 1997. Risks & realities : a multi-
disciplinary approach to the vulnerability of lifelines to natural hazards, Centre for Advanced Engineering, University of Canterbury, Christchurch, NZ
Covello, V., 1983. The Perception of Technological Risks: A Literature Review,
Technological Forecasting and Social Change, v. 23 (4) p. 285-297 CRED, 2005. Disaster Data: A Balanced Perspective, CRED Crunch, May 2005, p. 1-
2 deLange, W. P., 1998. The last wave, In Hick, G., and Campbell, H, Awesome
Forces, Te Papa Press, Wellington deLange, W. P., 2003. Tsunami and storm-surge hazard in New Zealand In Goff,
James R., Nichol, Scott L., and Rouse, Helen L., The New Zealand Coast: Te Tai o Aotearoa, Palmerston North, New Zealand, Dunmore Press, p. 79-95
deLange, W. P. and Fraser, R., 1999. Overview of tsunami hazard in New Zealand,
Tephra, October, p. 3-9 deLange, W. P., and Healy, T. R., 1986. New Zealand tsunamis 1840-1982, New
Zealand Journal of Geology and Geophysics, v.29, p. 115-134 Dow, K. and Cutter, S., 1998. Crying Wolf: Repeat Responses to Hurricane
Evacuation Orders, Coastal Management, v. 26, p. 237-252 Drabek, T. E., 1986. Human System Responses to Disaster: An Inventory of
Sociological Findings, Springer-Verlag, New York Drabek, T. E., 1993. Disaster evacuation planning in the tourist industry, Disaster
Recovery Journal, v. 6, p. 30-35 Drabek, T. E., 1995a. Disaster planning and response by tourist business executives,
Cornell Hotel and Restaurant Administration Quarterly, v. 36, p. 86-96
- 130 -
Drabek, T. E., 1995b. Disaster responses within the tourist industry, International
Journal of Mass Emergencies and Disasters, v. 13, n. 1, p. 7-23 Drabek, T. E., 1996. Disaster Evacuation Behavior: Tourist and Other Transients,
Institute on Behavioral Science, University of Colorado, Boulder Drabek, T. E., 2000. Disaster evacuations: Tourist-business managers rarely act as
customers expect, Cornell Hotel and Restaurant Administration Quarterly, v. 41 (4) p. 48-57
Dudley, W. and Lee, M., 1998. Tsunami! University of Hawaii Press, Honolulu Durocher, J., 1994. Recovery marketing: what to do after a natural disaster, Cornell
Hotel and Restaurant Administration Quarterly, v. 35 (2) p. 66–71 ECAN, 2006. GIS Mapping, www.ecan.govt.nz , [25 Jan. 2007] EM-DAT, 2007, EM-DAT: The OFDA/CRED International Disaster Database,
Université catholique de Louvain, Brussels, Belgium, http://www.em-dat.net/, [11 May 2007]
Faulkner, B., 2001. Towards a framework for tourism disaster management, Tourism
Management, v. 22, p. 135-147 Faulkner, B. and Vikulov, S., 2001. Katherine, washed out one day, back on track the
next: a post-mortem of a tourism disaster, Tourism Management, v. 22 (5) pg. 331-334
Finnimore, T., 1999. The tsunami warning system in the Pacific-New Zealand's place,
Tephra, October, p. 59-60 Geist, E., Titov, V., and Synolakis, C., 2006. Tsunami: Wave of change, Scientific
American, v. 294, n. 1, p. 42-49 Goff, J., Changue -Goff, C., and Nichol, S., 2001. Paleotsunami deposits: a New
Zealand perspective, Sedimentary Geology, v. 143, p.1-6 Goff, J. R. and McFadgen, B. G., 2003. Large Earthquakes and the Abandonment of
Prehistoric Coastal Settlements in the 15th Century New Zealand, Geoarchaeology: An International Journal, v. 18 (6), p. 609-623
Gregg, C., Houghton, B., Paton, D., Johnston, D., Swanson, D., and Yanagi, B., 2007.
Tsunami Warnings: Understanding in Hawaii, Natural Hazards, v. 40, p. 1-87 Gregory, G., Loveridge, A., and Gough, J.D., 1997. Social and cultural aspects of
natural hazards perception and response, The New Zealand Geographer, v. 53 (1) p. 47-54
- 131 -
Huang, J. and Min, J., 2002. Earthquake devastation and recovery in tourism: the Taiwan case, Tourism Management, v. 23, p. 145–154
Hudnut, K., 2006, Geologic and Geodetic Aspects of the December 2004. Great
Sumatra-Andaman and 2005 Nias-Simeulue Earthquakes, 2004 Great Sumatra Earthquakes and Indian Ocean Tsunamis of December 26, 2004 and March 28, 2005, Earthquake Spectra, v. 22, (S3) p. S13-S42
Intergovernmental Oceanic Commission, 1999. Historical Tsunami Database for the
Pacific 47 B.C. to present, http://tsun.sscc.ru/htdbpac/, [16 October, 2006] Iwan, W., 2006. Summary of major observations and lessons learned, In Iwan,
Wilfred Summary Report on the Great Sumatra Earthquakes and Indian Ocean Tsunamis of 26 December 2004 and 28 March 2005, Earthquake Engineering Research Institute, Oakland, California, p. 1-12
Jackson, W., 1988. Research Methods: Rules for Survey Design and Analysis,
Prentice-Hall Canada, Inc., Scarborough, Ontario Johnston, D., Bebbington, M., Lai, C., Houghton, B., and Douglas, P., 1999. Volcanic
hazard perceptions: comparative shifts in knowledge and risk, Disaster Prevention and Management, v. 8, n. 2, p. 118-126
Johnston, D., Paton, D., Houghton, B., Becker, J., and Crumbie, G., 2002. Results of
the August-September 2001 Washington State Tsunami Survey, Institute of Geological and Nuclear Sciences, Lower Hutt, New Zealand
Johnston, D., Leonard, G., Bell, R., Stewart, C., Hickman, M., Thompson, J., Kerr, J.,
and Glassey, P., 2003. Tabulated Results of the 2003 National Coastal Community Survey, Institute of Geological and Nuclear Sciences, Lower Hutt, New Zealand
Johnston, D., Paton, D., Crawford, G., Ronan, K., Houghton, B., and Burgelt, P.,
2005. Measuring tsunami preparedness in coastal Washington, United States, Natural Hazards, v. 35, p. 173-184
Johnston, D., Downes, G., Paton, D., Leonard, G., Pettersson, R., and Bell, R.,
submitted, Public response to tsunami warnings: Lessons from the warning of the 1960 earthquake tsunami in New Zealand coastal communities, Natural Hazards Review
Kanamori, H., 2006. Seisimology, Summary Report on the Great Sumatra
Earthquakes and Indian Ocean Tsunamis of 26 December 2004 and 28 March 2005, Earthquake Engineering Research Institute, Oakland, California, p. 45-52
Kasperson, R., Renn, O., Slovic, P., Brown, H., Emel, J., Goble, R., Kasperson, J.,
and Ratick, S., 1988. The social amplification of risk: A conceptual framework, Risk Analysis, v. 8, n.2, p. 177-187
- 132 -
Kates, R. W., White, G. F., and Burton, I., 1993. The Environment as Hazard,
Guilford Press, Abingdon Lander, J. F., and Lockridge, P.A., 1989. United States Tsunamis (Including United
States Possessions) 1690-1988, National Geophysical Data Center, Boulder, Colorado
Lander, J. F, Whiteside, L. S. and. Lockridge, P. A., 2003, Two decades of global tsunamis, 1982-2002, International Journal of the Tsunami Society, v. 21 (1) p. 3-82
Lautenbacher Jr., C., 2005. Tsunami warning systems, The Bridge, v. 35, n. 2, p.21-
26 Leonard, G. S., Paton, D., Johnston, D. M., and Mitchell, J., 2004. Analysis of
Canterbury Civil Defence and Emergency Management 2004 Aawareness and Preparedness Survey, Institute of Geological and Nuclear Sciences, Lower Hutt, New Zealand
Lindell, M. K. and Perry, R., W., 1992. Behavioral Foundations of Community
Emergency Planning, Hemisphere Publishing Corporation, Washington Lindell, M., Lu, J., and Prater, C., 2005. Household Decision Making in Response to
Hurricane Lili, Natural Hazards Review, v. 6, n. 4, p.171-179 May, P., Feeley, T., Jens, T., Wood, R., Burby, and Raymond, J., 1999. Adoption and
enforcement of earthquake risk-reduction measures, Pacific Earthquake Engineering Research Center, Berkeley
Miles, B., and Morse, S., 2006. The role of the news media in natural disaster risk and
recovery, Ecological Economics, Article in Press, doi:10.1016/j.ecolecon.2006.08.007
Milo, K. J., & Yoder, S. L., 1991. Recovery from natural disaster: Travel writers and
tourist destinations, Journal of Travel Research, v. 30 (1) p. 36–39 Ministry of Tourism, 2006. Commercial Accommodations Monitor
http://www.tourismresearch.govt.nz/Datasets/Commercial+Accommodation+Monitor/default.htm, [10 May 2006]
Murphy, P. and Bailey, R., 1989. Tourism and disaster planning, Geographical
Review, v. 79, p.36-46 NASA, 2006. http://rapidfire.sci.gsfc.nasa.gov/gallery, Image 13-164, 13 June 2006,
[1/29/07] New Zealand Census
Registrar General's Office, 1858. Statistics of New Zealand for 1853, 1854, 1855, an 1856, W. C. Wilson, for the New Zealand Government, Auckland
- 133 -
Registrar General's Office, 1869. Statistics of New Zealand for 1868, New Zealand Government by George Didsbury, Government Printer, Wellington
Census and Statistics Office, 1921. Results of a Census of the Dominion of New Zealand Taken for the Night of the 17th, April, 1921, Marcus, F. Marks, Government Printer, Wellington
Department of Statistics, 1961. New Zealand Population Census 1961, J. V. T. Baker, Government Statistician, Wellington
Statistics New Zealand, 2006. 2006 Census Data, http://www.stats.govt.nz/census/default.htm, [8 January 2007]
NGDC, 2006. NOAA/WDC Historical Tsunami Database at NGDC, National Oceanic and Atmospheric Administration National Geophysical Data Center, http://www.ngdc.noaa.gov/seg/hazard/tsu_db.shtml, [16 October, 2006]
Owens, I. F., Kirk, R. M., Bell, D. H., Cowan, H., Pettinga, J., and Todd, D., 1994.
Natural hazards in Canterbury, Canterbury Regional Council Christchurch, NZ Paton, D., 2003. Disaster preparedness: a social-cognitive perspective, Disaster
Prevention and Management, v. 12, n. 3, p. 210-216 Pfister, N., 2002. Community response to flood warnings: the case of an evacuation
from Grafton, Australian Journal of Emergency Management, V. 17, No. 2, p.19-29
Pottorff, S. and Neal, D., 1994. Marketing implications for post-disaster tourism
destinations, Journal of Travel and Tourism Marketing, v. 3 (1) p. 115-122 Punch, K., 2003. Survey Research: The Basics, Sage Publications, London Riad, J., Waugh, W., and Norris, F., 1998. The Psychology of Evacuation and the
Design of Policy, University of Delaware, Disaster Research Center, Newark Riad, J. R., Norris, F. H., and Ruback, R. B., 1999. Predicting in two major disasters:
risk perception, social influence, and access to resources, Journal of Applied Social Psychology, v. 29, n. 5, p. 918-934
Ridgway, N.M., 1984. Tsunami hazard in New Zealand, In Hessell, J. W. D.,
Holloway, R. H. F., Knowles, D. G., and Roberts, J. L., Scientific, Economic, and Social Reviews of Natural Hazards in New Zealand, New Zealand National Commission for UNESCO, Wellington, p 375-382
Rogers, G., 1997. The dynamic of risk perception: How does perceived risk respond
to risk events? Risk Analysis, v. 17, n. 6, p. 745-757 Saarinen, T., 1982. Perspectives on Increasing Hazard Awareness, Institute of
Bahavioral Science, University of Colorado, Boulder
- 134 -

Saatcioglu, M., Ghobarah, A., and Nistor, I., 2006a. Performance of Structures in
Indonesia during the December 2004 Great Sumatra Earthquake and Indian Ocean Tsunami, 2004 Great Sumatra Earthquakes and Indian Ocean Tsunamis of December 26, 2004 and March 28, 2005, Earthquake Spectra, v. 22, (S3) p. S295-S319
Saatcioglu, M., Ghobarah, A, and Nistor, I., 2006b. Performance of Structures in
Thailand during the December 2004 Great Sumatra Earthquake and Indian Ocean Tsunami, 2004 Great Sumatra Earthquakes and Indian Ocean Tsunamis of December 26, 2004 and March 28, 2005, Earthquake Spectra, v. 22, (S3) p. S355-S375
Scawthorn, C., Ono, Y., Iemura, H., Ridha, M., and Purwanto, B., 2006. Performance
of Lifelines in Banda Aceh, Indonesia, during the December 2004 Great Sumatra Earthquake and Tsunami, 2004 Great Sumatra Earthquakes and Indian Ocean Tsunamis of December 26, 2004 and March 28, 2005, Earthquake Spectra, v. 22, (S3) p. S511-S544
Sidle, R. C. Taylor, D., Lu, X. X., Adger, W. N., Lowe, D. J., de Lange, W. P.,
Newnham, R. M., and Dodson, J. R., 2004. Interactions of natural hazards and society in Austral-Asia: evidence in past and recent records, Quaternary International v. 118-119, p.181-203
Singer, E. and Endreny, P., 1993. Reporting on Risk, Russell Sage Foundation, New
York Slovic, P., 1987. Perception of Risk, Science, v. 236, p. 280-286 Slovic, P., 2000. The Perception of Risk, Earthscan Publications Ltd, London Smith, P. S., 1984. History and Traditions of the Maoris of the West Coast: North
Island of New Zealand Prior to 1840, Capper Press Limited, Christchurch, Originally published New Plymouth, NZ :Printed for the Society by Thomas Avery, 1910.
Southshore Beacon, 2006. Coastal Evacuation Plan, Southshore Beacon, issue 186, 26
September 2006 Statistics New Zealand, 2006. Accommodation Survey, http://www2.stats.govt.nz/, [1
April 2006] Stein, S. and Okal, E., 2005. Speed and size of the Sumatra earthquake, Nature, v.
434, p. 581-582 Synolakis, C. and Bernard, E., 2006. Tsunami science before and after Boxing Day
2004, Philosophical transactions of the Royal Society of London. A 364, v. 364, n. 1845, p. 2231- 2265
- 135 -

Synolakis, C., 2006. Hydrodynamic observations In Iwan, W. Summary Report on the Great Sumatra Earthquakes and Indian Ocean Tsunamis of 26 December 2004 and 28 March 2005, Earthquake Engineering Research Institute, Oakland, California, p. 31-40
Synolakis, C. and Kong, L., 2006. Runup Measurements of the December 2004 Indian
Ocean Tsunami, 2004 Great Sumatra Earthquakes and Indian Ocean Tsunamis of December 26, 2004 and March 28, 2005, Earthquake Spectra, v. 22, (S3) p. S67-S91
Synolakis, C., Okal, E., and Bernard, E., 2005. The Megatsunami of December 26,
2004, The Bridge, v. 35, n.2, p. 26-35 Te Ara, 2005, Banks Peninsula impact, 1868.
http://www.teara.govt.nz/EarthSeaAndSky/NaturalHazardsAndDisasters/Tsunamis/2/ENZ-Resources/Standard/5/en Te Ara: The Encyclopedia of New Zealand, http://www.teara.govt.nz, [24 May, 2007]
Titov, V. and Arcas, D., 2005. Indian Ocean tsunami generation and propagation from
modelling observations, Abstracts with Programs- Geological Society of America, v.37, no. 7, p. 93
Tumonz, 2006. The Ultimate Map of New Zealand http://www.tumonz.co.nz/,
[October 2006] Vogt, B. and Sorensen, J., 1992. Evacuation Research: A reassessment, Oak Ridge
National Laboratory, Oak Ridge, Tennessee Waltham, T., 2005, The Asian Tsunami disaster, December 2004. Geology Today, v.
21 (1) p. 22-26 Webb, T., 2005. Review of New Zealand's preparedness tsunami hazards, comparison
to risk and recommendations for treatment, Institute of Geological and Nuclear Sciences Lower Hutt, New Zealand
Weinstein, N., 1989. Effects of personal experience on self-protective behavior,
Psychological Bulletin, v. 105, n. 1, p. 31-50 Wikipedia, 2006. 2004 Indian Ocean earthquake,
http://en.wikipedia.org/wiki/2004_Indian_Ocean_earthquake, [16 October 2006]
Wikipedia, 2007. Risk Assessment http://en.wikipedia.org/wiki/Risk_assessment [24
April 2007] Winder, V., 2005. Tsunamis wipe away memories, Taranaki Daily News, 19/02/2005 WTO, 2006. Disaster Response: The Tourism Dimension, World Tourism
Organization and World Economic Forum, http://www.unwto.org/risk/pdf/volume01.pdf [16 May 2007]
- 136 -
WTO/WMO, 1998. Handbook on Natural Disaster Reduction in Tourist Areas, World
Tourism Organization and World Meteorological Organization, Madrid Wyllie Jr., L. 2006. Structural performance, In Iwan, W. Summary Report on the
Great Sumatra Earthquakes and Indian Ocean Tsunamis of 26 December 2004 and 28 March 2005, Earthquake Engineering Research Institute, Oakland, California, p. 41-44
Zschau, J. and Küppers, A., 2003. Early Warning Systems for Natural Disaster
Reduction, Springer, New York
- 137 -

Appendices
- 138 -
Appendix 1
New Zealand Tsunamis
- 139 -
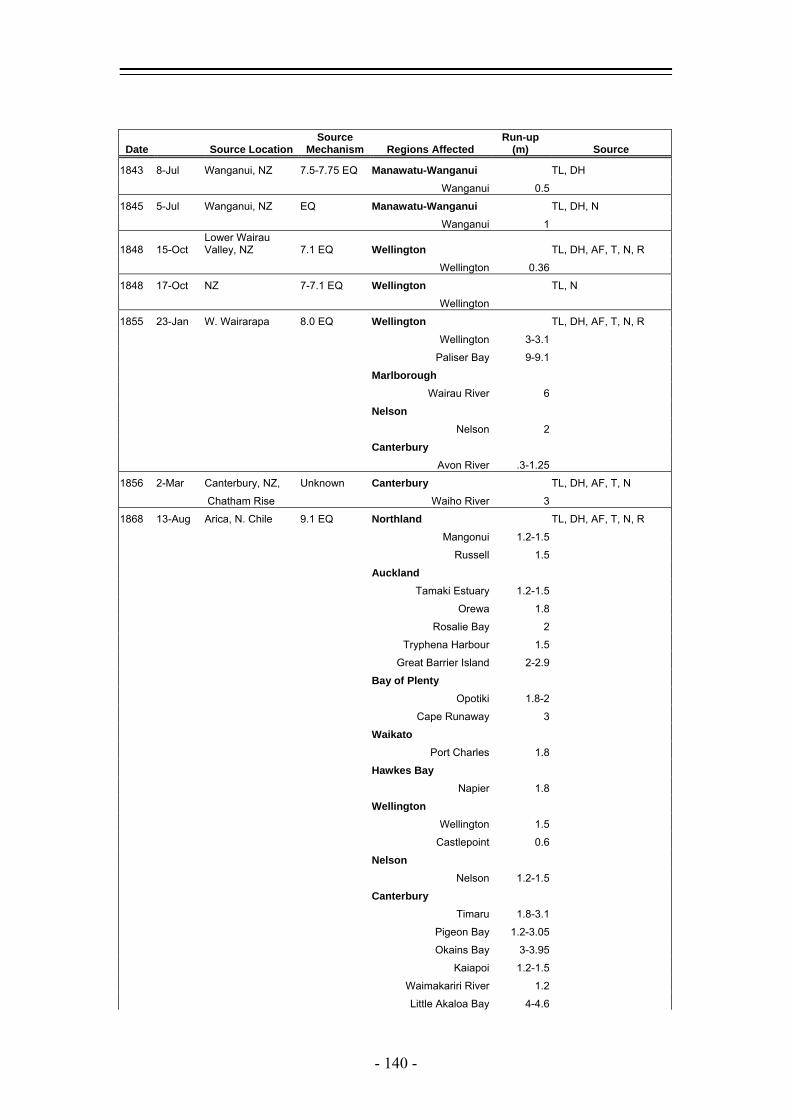
Date Source Location Source
Mechanism Regions Affected Run-up
(m) Source
1843 8-Jul Wanganui, NZ 7.5-7.75 EQ Manawatu-Wanganui TL, DH
Wanganui 0.5
1845 5-Jul Wanganui, NZ EQ Manawatu-Wanganui TL, DH, N
Wanganui 1
1848 15-Oct Lower Wairau Valley, NZ 7.1 EQ Wellington TL, DH, AF, T, N, R
Wellington 0.36
1848 17-Oct NZ 7-7.1 EQ Wellington TL, N
Wellington
1855 23-Jan W. Wairarapa 8.0 EQ Wellington TL, DH, AF, T, N, R
Wellington 3-3.1
Paliser Bay 9-9.1
Marlborough
Wairau River 6
Nelson
Nelson 2
Canterbury
Avon River .3-1.25
1856 2-Mar Canterbury, NZ, Unknown Canterbury TL, DH, AF, T, N
Chatham Rise Waiho River 3
1868 13-Aug Arica, N. Chile 9.1 EQ Northland TL, DH, AF, T, N, R
Mangonui 1.2-1.5
Russell 1.5
Auckland
Tamaki Estuary 1.2-1.5
Orewa 1.8
Rosalie Bay 2
Tryphena Harbour 1.5
Great Barrier Island 2-2.9
Bay of Plenty
Opotiki 1.8-2
Cape Runaway 3
Waikato
Port Charles 1.8
Hawkes Bay
Napier 1.8
Wellington
Wellington 1.5
Castlepoint 0.6
Nelson
Nelson 1.2-1.5
Canterbury
Timaru 1.8-3.1
Pigeon Bay 1.2-3.05
Okains Bay 3-3.95
Kaiapoi 1.2-1.5
Waimakariri River 1.2
Little Akaloa Bay 4-4.6
- 140 -
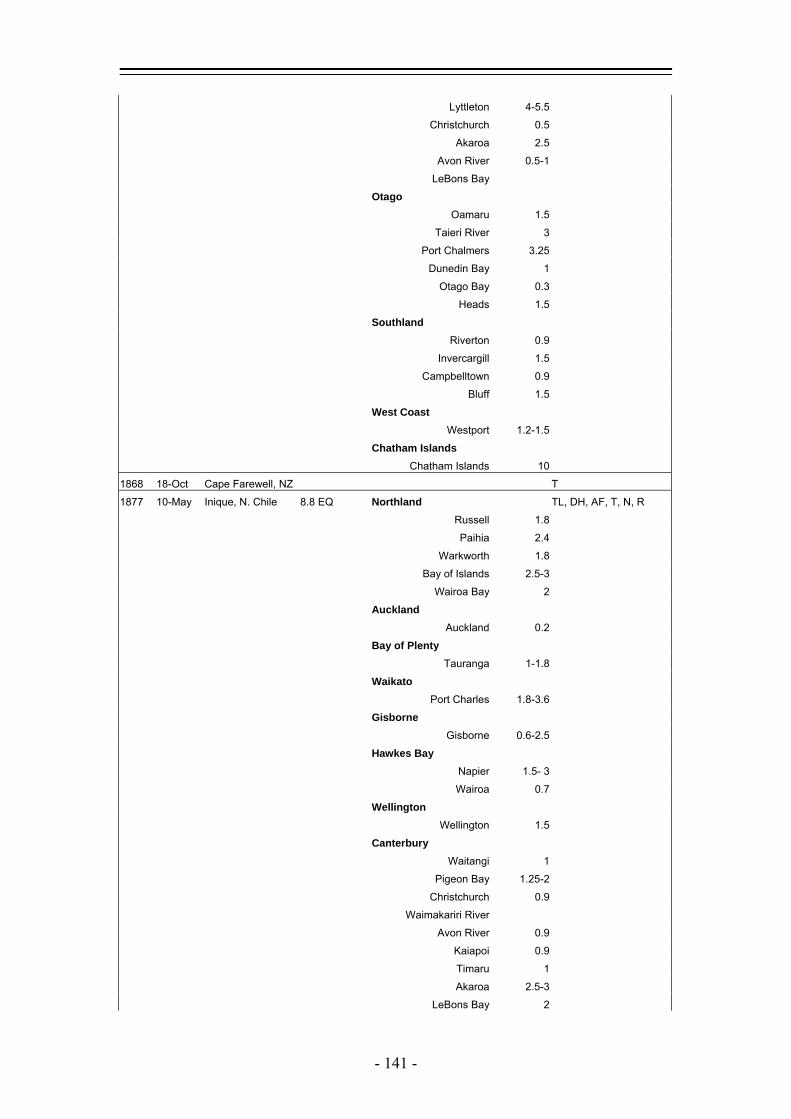
Lyttleton 4-5.5
Christchurch 0.5
Akaroa 2.5
Avon River 0.5-1
LeBons Bay
Otago
Oamaru 1.5
Taieri River 3
Port Chalmers 3.25
Dunedin Bay 1
Otago Bay 0.3
Heads 1.5
Southland
Riverton 0.9
Invercargill 1.5
Campbelltown 0.9
Bluff 1.5
West Coast
Westport 1.2-1.5
Chatham Islands
Chatham Islands 10
1868 18-Oct Cape Farewell, NZ T
1877 10-May Inique, N. Chile 8.8 EQ Northland TL, DH, AF, T, N, R
Russell 1.8
Paihia 2.4
Warkworth 1.8
Bay of Islands 2.5-3
Wairoa Bay 2
Auckland
Auckland 0.2
Bay of Plenty
Tauranga 1-1.8
Waikato
Port Charles 1.8-3.6
Gisborne
Gisborne 0.6-2.5
Hawkes Bay
Napier 1.5- 3
Wairoa 0.7
Wellington
Wellington 1.5
Canterbury
Waitangi 1
Pigeon Bay 1.25-2
Christchurch 0.9
Waimakariri River
Avon River 0.9
Kaiapoi 0.9
Timaru 1
Akaroa 2.5-3
LeBons Bay 2
- 141 -
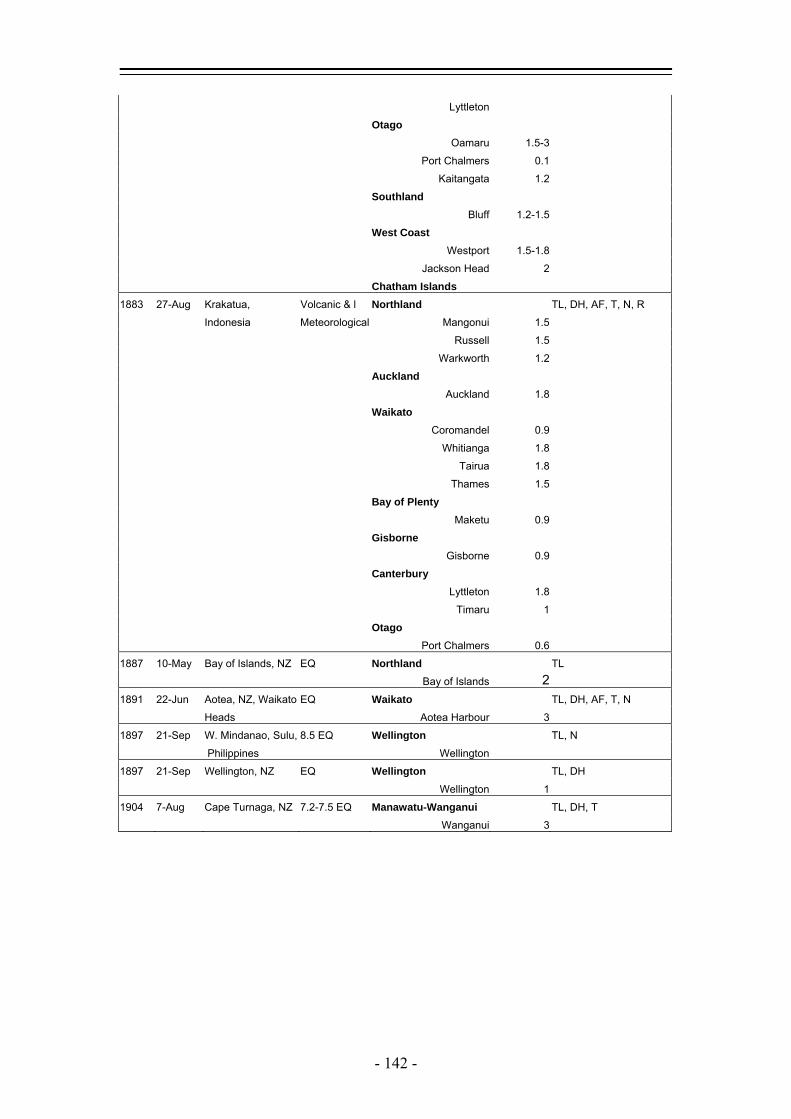
Lyttleton
Otago
Oamaru 1.5-3
Port Chalmers 0.1
Kaitangata 1.2
Southland
Bluff 1.2-1.5
West Coast
Westport 1.5-1.8
Jackson Head 2
Chatham Islands
1883 27-Aug Krakatua, Volcanic & l Northland TL, DH, AF, T, N, R
Indonesia Meteorological Mangonui 1.5
Russell 1.5
Warkworth 1.2
Auckland
Auckland 1.8
Waikato
Coromandel 0.9
Whitianga 1.8
Tairua 1.8
Thames 1.5
Bay of Plenty
Maketu 0.9
Gisborne
Gisborne 0.9
Canterbury
Lyttleton 1.8
Timaru 1
Otago
Port Chalmers 0.6
1887 10-May Bay of Islands, NZ EQ Northland TL
Bay of Islands 2
1891 22-Jun Aotea, NZ, Waikato EQ Waikato TL, DH, AF, T, N
Heads Aotea Harbour 3
1897 21-Sep W. Mindanao, Sulu, 8.5 EQ Wellington TL, N
Philippines Wellington
1897 21-Sep Wellington, NZ EQ Wellington TL, DH
Wellington 1
1904 7-Aug Cape Turnaga, NZ 7.2-7.5 EQ Manawatu-Wanganui TL, DH, T
Wanganui 3
- 142 -
TL= Intergovernmental Oceanic Commission, 1999, Historical Tsunami Database for the Pacific 47 B.C. to present, http://tsun.sscc.ru/htdbpac/, [16 October, 2006]
DH= deLange, W. P., and Healy, T. R., 1986, New Zealand tsunamis 1840-1982, New Zealand Journal of Geology and Geophysics, v.29, p. 115-134
AF= deLange, W. P., 1998, The last wave, In Hick, G., and Campbell, H, Awesome Forces, Te Papa Press, Wellington
T= deLange, W. P. and Fraser, R., 1999, Overview of tsunami hazard in New Zealand, Tephra, October, p. 3-9
N= NGDC, 2006, NOAA/WDC Historical Tsunami Database at NGDC, National Oceanic and Atmospheric Administration National Geophysical Data Center, http://www.ngdc.noaa.gov/seg/hazard/tsu_db.shtml, [16 October, 2006]
R= Ridgway, N.M., 1984, Tsunami hazard in New Zealand, In Hessell, J. W. D., Holloway, R.
H. F., Knowles, D. G., and Roberts, J. L., Scientific, Economic, and Social Reviews of Natural Hazards in New Zealand, New Zealand National Commission For UNESCO, Wellington, p. p 375-382
- 143 -

Appendix 2
Surveys and Letters
- 144 -
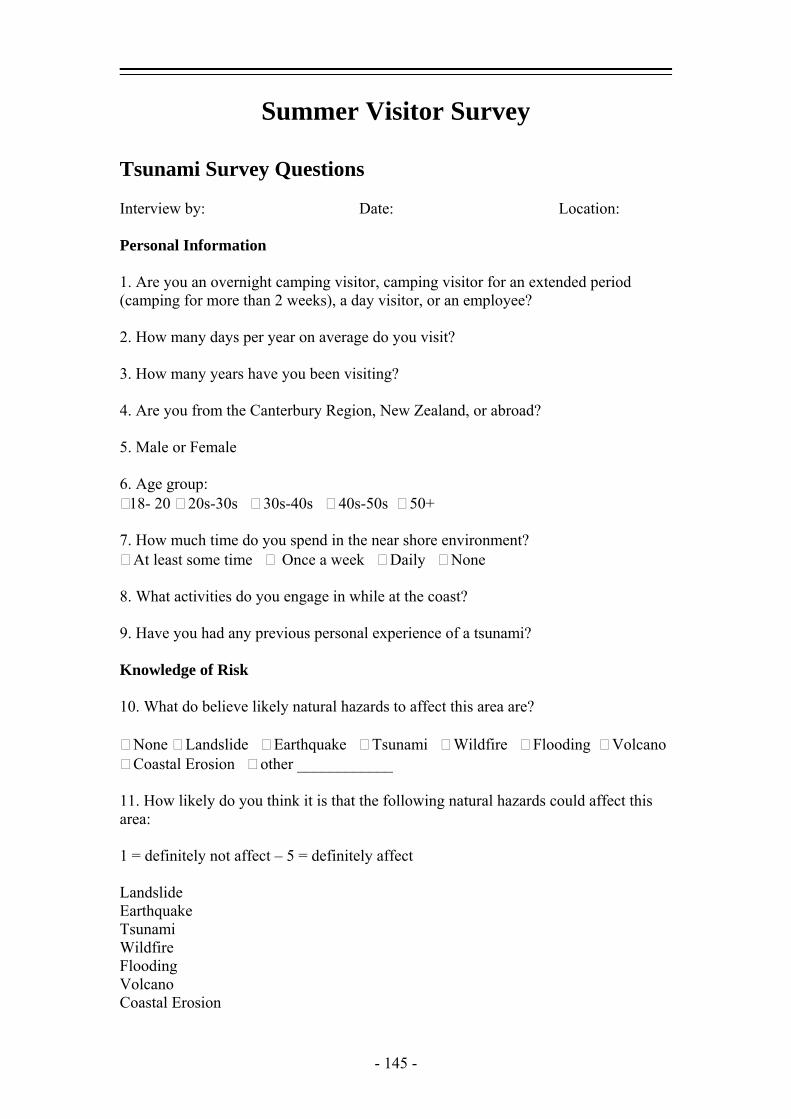
Summer Visitor Survey Tsunami Survey Questions Interview by: Date: Location: Personal Information 1. Are you an overnight camping visitor, camping visitor for an extended period (camping for more than 2 weeks), a day visitor, or an employee? 2. How many days per year on average do you visit? 3. How many years have you been visiting? 4. Are you from the Canterbury Region, New Zealand, or abroad? 5. Male or Female 6. Age group:
18- 20 20s-30s 30s-40s 40s-50s 50+ 7. How much time do you spend in the near shore environment?
At least some time Once a week Daily None 8. What activities do you engage in while at the coast? 9. Have you had any previous personal experience of a tsunami? Knowledge of Risk 10. What do believe likely natural hazards to affect this area are?
None Landslide Earthquake Tsunami Wildfire Flooding Volcano Coastal Erosion other ____________
11. How likely do you think it is that the following natural hazards could affect this area: 1 = definitely not affect – 5 = definitely affect Landslide Earthquake Tsunami Wildfire Flooding Volcano Coastal Erosion
- 145 -

Or no natural hazards will affect this area 12. When was the last tsunami that caused damage in Banks Peninsula?
Never Within the last year In the last 1-10 years In the last 10-100 years In the last 100-1000 years Don’t know
13. Do you think that a tsunami could occur:
While you are visiting Within the year In the next 1-10 years In the next 10-100 years Not within 100 years Never
Preparation and Warnings 14. Have you a) actively sought information about this area and/or b) heard or received information about tsunamis from any of the following sources? (List under (a) and (b)) a b
Friends or Family Central Government Civil Defense Local Council Regional Council Business establishment Child’s school Research organization (e.g. GNS, University) Other_______________________
15. Where do New Zealand tsunamis come from? 16. Who do you think is responsible for issuing distant-source tsunami warnings to you?
Don’t know Central Government Regional Council Local Council Civil Defense Local Police or Fire Service NIWA GNS No one can No one should Other _________________________
17. Who do you think is responsible for issuing local-source tsunami warnings to you?
Don’t know Central Government Regional Council Local Council Civil Defense Local Police or Fire Service NIWA GNS No one can No one should Other _________________________
18. Does New Zealand have a tsunami warning system?
- 146 -
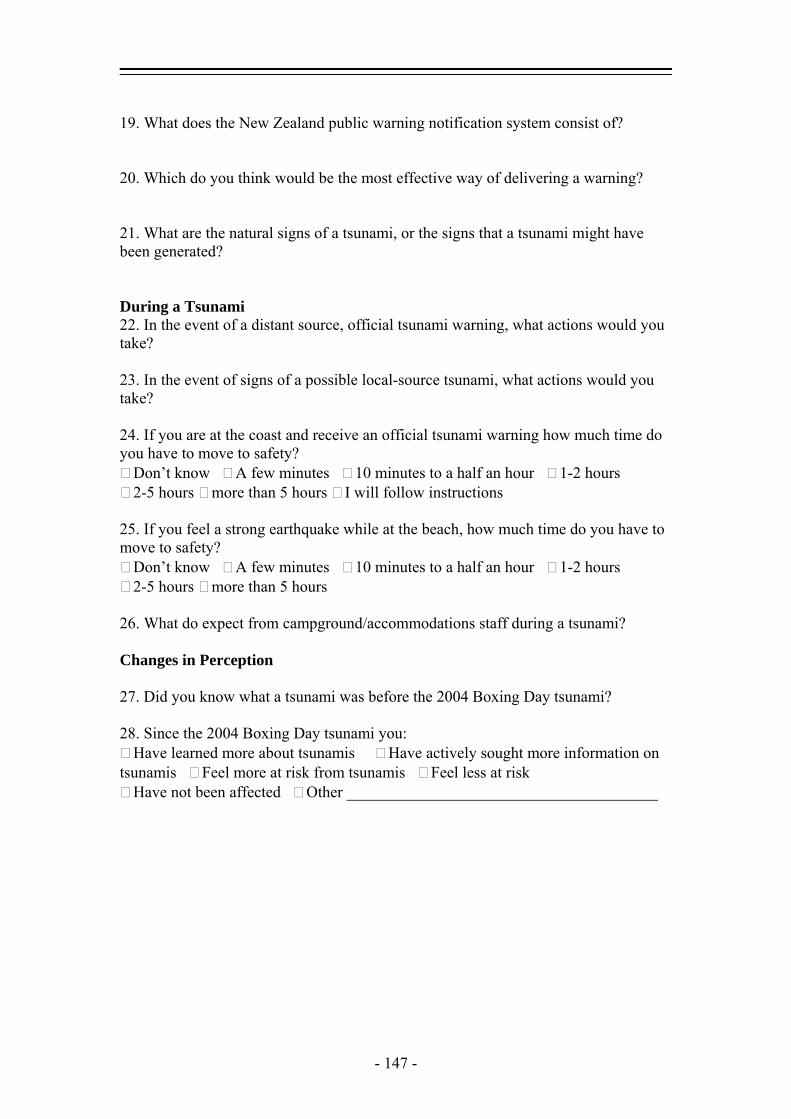
19. What does the New Zealand public warning notification system consist of? 20. Which do you think would be the most effective way of delivering a warning? 21. What are the natural signs of a tsunami, or the signs that a tsunami might have been generated? During a Tsunami 22. In the event of a distant source, official tsunami warning, what actions would you take? 23. In the event of signs of a possible local-source tsunami, what actions would you take? 24. If you are at the coast and receive an official tsunami warning how much time do you have to move to safety?
Don’t know A few minutes 10 minutes to a half an hour 1-2 hours 2-5 hours more than 5 hours I will follow instructions
25. If you feel a strong earthquake while at the beach, how much time do you have to move to safety?
Don’t know A few minutes 10 minutes to a half an hour 1-2 hours 2-5 hours more than 5 hours
26. What do expect from campground/accommodations staff during a tsunami? Changes in Perception 27. Did you know what a tsunami was before the 2004 Boxing Day tsunami? 28. Since the 2004 Boxing Day tsunami you:
Have learned more about tsunamis Have actively sought more information on tsunamis Feel more at risk from tsunamis Feel less at risk
Have not been affected Other _______________________________________
- 147 -
September 2006 Information for participants Dear householder, GNS Science is conducting a national study of community beliefs about natural hazards, with a special focus on tsunami hazards. The findings from the study will be used to help local communities better prepare for future extreme events. In 2003 your household was randomly selected to participate in a coastal survey. If the person who participated in that study is still a resident at this address, we invite them to please complete this new questionnaire. Otherwise, if the 2003 respondent no longer lives here, then the person who should complete this questionnaire is the adult (age 18 or older) who most recently had a birthday. All replies will be confidential, and we will only report on general trends. You are not asked to record your name. Filling in the questionnaire implies that you are consenting to participate. Completing the questionnaire should take about 15 minutes or so of your time. When you have completed it, please put it in the enclosed Freepost envelope and post it. Your views are very important to the success of this study, and we look forward to hearing from you. Dr David Johnston GNS For further information, please contact Dr David Johnston at: Phone: 04-570 1444 or Email: [email protected]
- 148 -
September 2006 Information for participants Dear householder, GNS Science is conducting a national study of community beliefs about natural hazards, with a special focus on tsunami hazards. The findings from the study will be used to help local communities better prepare for future extreme events. In 2003 your household was randomly selected to participate in a coastal survey. If the person who participated in that study is still a resident at this address, we invite them to please complete this new questionnaire. Otherwise, if the 2003 respondent no longer lives here, then the person who should complete this questionnaire is the adult (age 18 or older) who most recently had a birthday. All replies will be confidential, and we will only report on general trends. You are not asked to record your name. Filling in the questionnaire implies that you are consenting to participate. Completing the questionnaire should take about 15 minutes or so of your time. When you have completed it, please put it in the enclosed Freepost envelope and post it. Your views are very important to the success of this study, and we look forward to hearing from you. Dr David Johnston GNS For further information, please contact Dr David Johnston at: Phone: 04-570 1444 or Email: [email protected]
- 149 -
November 2006 Dear householder, Recently you received a questionnaire as part of a study of tsunami hazards in New Zealand. Findings from the study will be used to help local communities become more effectively involved in coastal issues. If you have already completed and returned the questionnaire we would like to take this opportunity to thank you. If not, we hope you will be able to assist us by completing the questionnaire and returning it to us in the Freepost envelope enclosed. Your views are very important to the success of this study, and we look forward to hearing from you. To understand the range of community views, we need responses from many different types of people - women and men, young and old. In your household, the person who should complete this questionnaire is the adult (age 18 or older) who most recently had a birthday. All replies will be confidential, and we will only report on general trends. You are not asked to record your name. Filling in the questionnaire implies that you are consenting to participate. Completing the questionnaire should take about 15 minutes or so of your time. When you have completed it, please put it in the enclosed Freepost envelope and post it. Dr David Johnston GNS Science For further information, please contact Dr David Johnston at: Phone: 04-570 1444 or Email: [email protected]
- 150 -

2006 National Coastal Survey
- 151 -
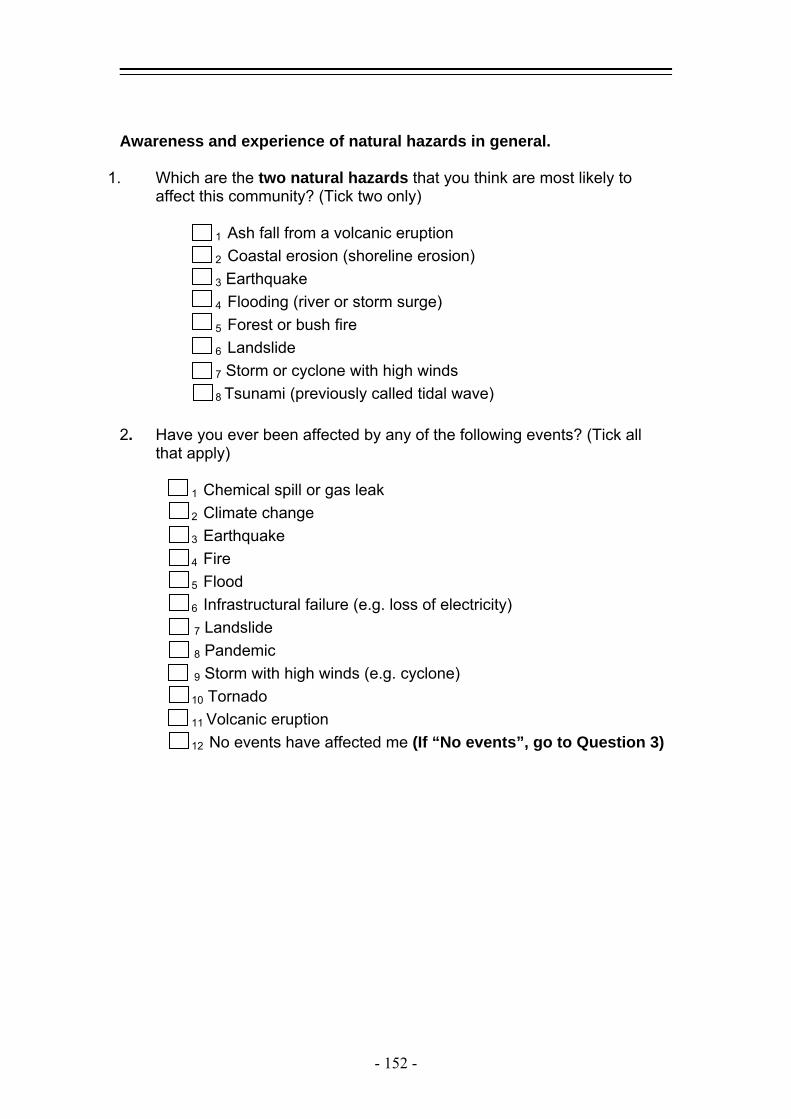
Awareness and experience of natural hazards in general.
1. Which are the two natural hazards that you think are most likely to affect this community? (Tick two only)
1
Ash fall from a volcanic eruption 2 Coastal erosion (shoreline erosion) 3 Earthquake 4 Flooding (river or storm surge) 5
Forest or bush fire 6 Landslide 7 Storm or cyclone with high winds 8 Tsunami (previously called tidal wave)
2. Have you ever been affected by any of the following events? (Tick all
that apply)
1 Chemical spill or gas leak
2 Climate change
3 Earthquake
4 Fire
5 Flood
6 Infrastructural failure (e.g. loss of electricity)
7 Landslide 8 Pandemic
9 Storm with high winds (e.g. cyclone) 10 Tornado 11
Volcanic eruption 12
No events have affected me (If “No events”, go to Question 3)
- 152 -

2a. If you have been affected, to what extent were you affected? (considering property damage, injuries and financial impact). In each row please tick the one number you feel best represents this impact, on the scale from 1 to 10. Little impact Severe impact
1 2 3 4 5 6 7 8 9 10 Chemical spill or gas leak 1 2 3 4 5 6 7 8 9 10
Climate change 1 2 3 4 5 6 7 8 9 10
Earthquake 1 2 3 4 5 6 7 8 9 10
Fire 1 2 3 4 5 6 7 8 9 10
Flood 1 2 3 4 5 6 7 8 9 10
Infrastructural failure 1 2 3 4 5 6 7 8 9 10
Landslide 1 2 3 4 5 6 7 8 9 10
Pandemic 1 2 3 4 5 6 7 8 9 10
Storm with high winds (e.g. cyclone)
1 2 3 4 5 6 7 8 9 10
Tornado 1 2 3 4 5 6 7 8 9 10
Volcanic eruption 1 2 3 4 5 6 7 8 9 10
General tsunami questions
3. What is the most frequent cause of tsunamis in general? (Tick one only)
1 Landslide
2 High tide
3 Hurricane/storm
4 Earthquake 5
Volcanic eruption 6
Don’t know 4. Tsunami waves can occur as which of the following: (Tick all that
apply):
1 One big wave/surge
2 Multiple big waves/surges
3 One small wave/surge
4 Multiple small waves/surges 5
Multiple big waves/surges and multiple small wave/surges 6
Rapidly rising and falling water level 7
Don’t know
- 153 -
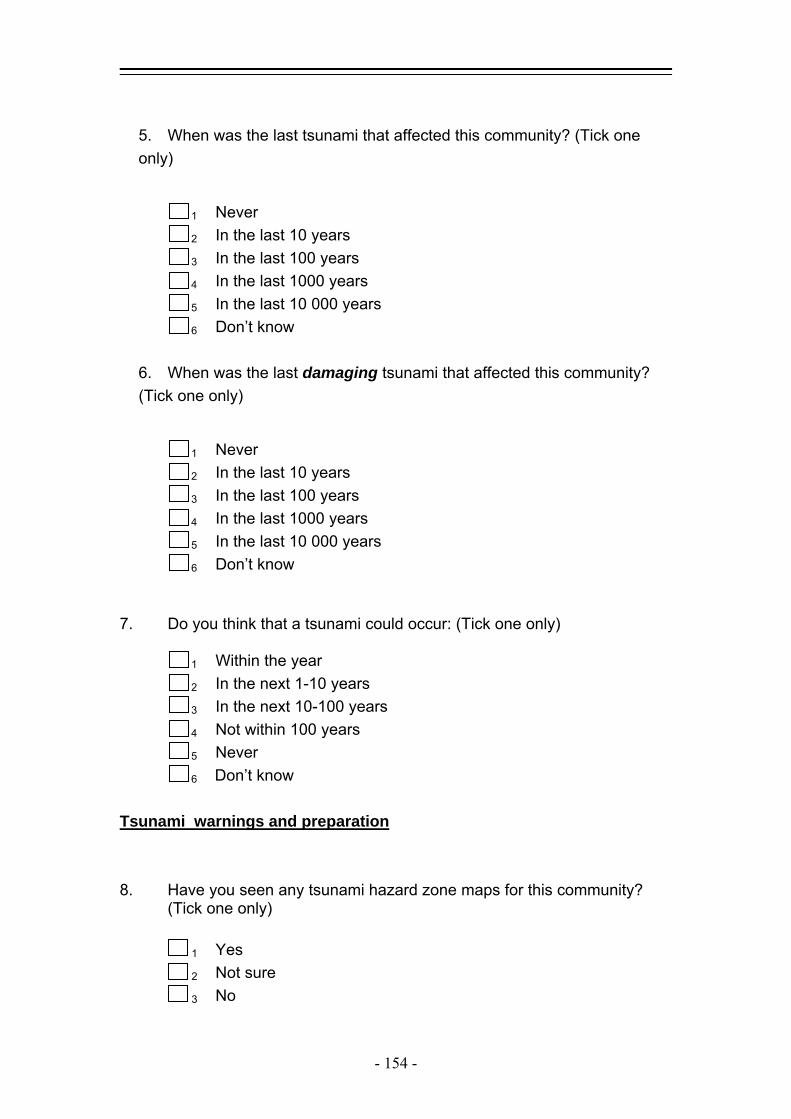
5. When was the last tsunami that affected this community? (Tick one only)
1
Never 2
In the last 10 years 3
In the last 100 years 4 In the last 1000 years 5
In the last 10 000 years 6
Don’t know
6. When was the last damaging tsunami that affected this community? (Tick one only)
1
Never 2
In the last 10 years 3
In the last 100 years 4 In the last 1000 years 5
In the last 10 000 years 6
Don’t know 7. Do you think that a tsunami could occur: (Tick one only)
1 Within the year
2 In the next 1-10 years
3 In the next 10-100 years
4 Not within 100 years 5
Never 6
Don’t know Tsunami warnings and preparation 8. Have you seen any tsunami hazard zone maps for this community?
(Tick one only)
1 Yes
2 Not sure
3 No
- 154 -
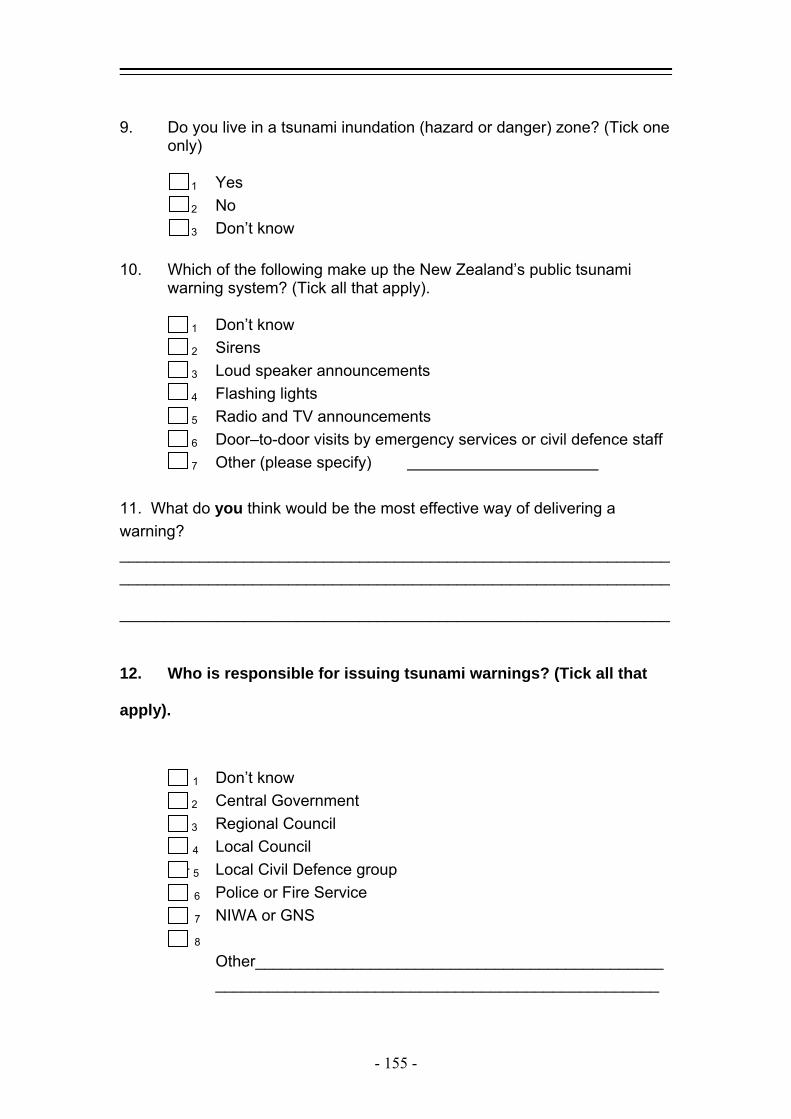
9. Do you live in a tsunami inundation (hazard or danger) zone? (Tick one
only)
1 Yes
2 No
3 Don’t know
10. Which of the following make up the New Zealand’s public tsunami
warning system? (Tick all that apply).
1 Don’t know
2 Sirens
3 Loud speaker announcements
4 Flashing lights
5 Radio and TV announcements 6 Door–to-door visits by emergency services or civil defence staff 7 Other (please specify) 11. What do you think would be the most effective way of delivering a warning? ______________________________________________________________ ______________________________________________________________
______________________________________________________________
12. Who is responsible for issuing tsunami warnings? (Tick all that
apply).
1 Don’t know
2 Central Government
3 Regional Council
4 Local Council + 5 Local Civil Defence group 6 Police or Fire Service
7 NIWA or GNS
8
Other________________________________________________________________________________________________
- 155 -

13.* The following is a list of signs that might alert you of an arriving local
source tsunami (from a place less than 1 hour travel time away). Rate how unlikely or likely each sign will occur. (Tick one per line)
Sign Unlikely Maybe Likelya. Siren sounding b. Loudspeaker/bullhorn from Civil Defence/ Police c. TV or radio broadcast d. Relative, friend, or neighbour e. Ground shaking from an earthquake f. Sea-level draw down (receding ocean) g. Unusual waves (wall of water, breaking wave, etc) h. Unusual sounds 14.* Now, consider the same signs as above, but rate how unlikely or likely
each sign will occur for an arriving distant source tsunami (originating from Japan or Alaska, etc). (Tick one per line)
Sign Unlikely Maybe Likelya. Siren sounding b. Loudspeaker/bullhorn from Civil Defence/ Police c. TV or radio broadcast d. Relative, friend, or neighbour e. Ground shaking from an earthquake f. Sea-level draw down (receding ocean) g. Unusual waves (wall of water, breaking wave, etc) h. Unusual sounds *These questions were not included in the analysis because the data was not valid due to a misprinting. Only seven boxes are available instead of eight.
- 156 -
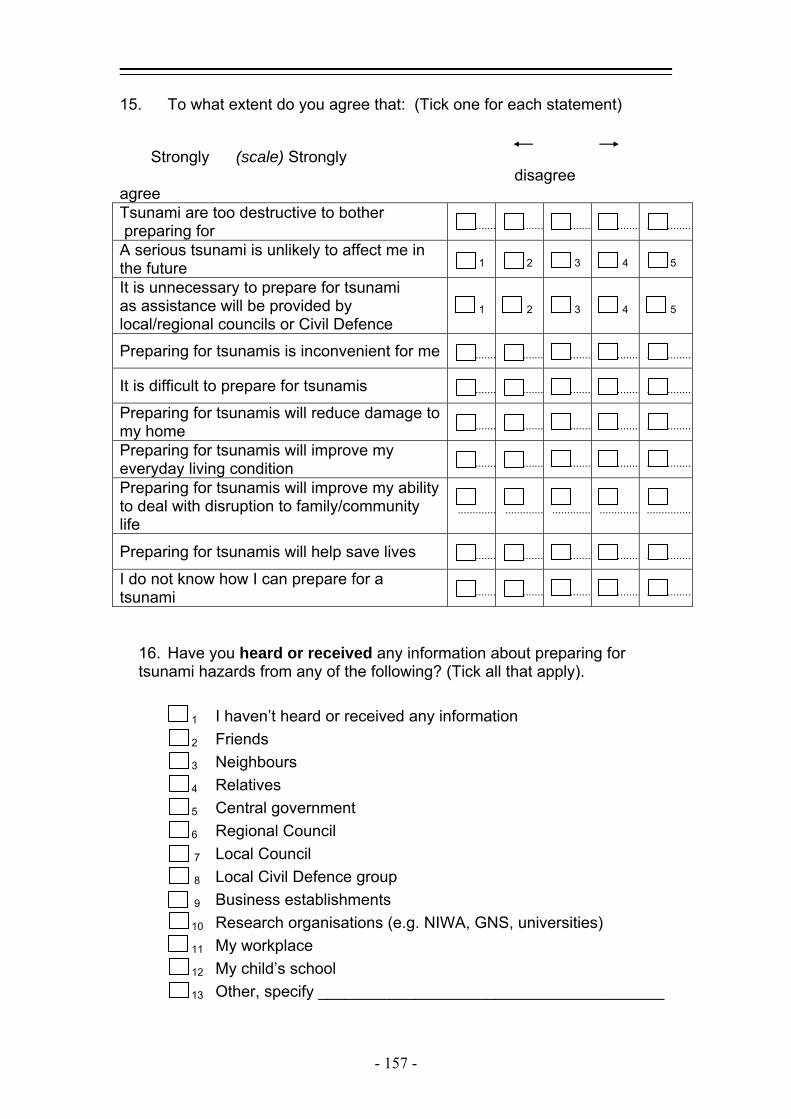
15. To what extent do you agree that: (Tick one for each statement)
Strongly (scale) Strongly disagree agree Tsunami are too destructive to bother preparing for ............. ............. ............. .............. ................
A serious tsunami is unlikely to affect me in the future 1 2 3 4 5
It is unnecessary to prepare for tsunami as assistance will be provided by local/regional councils or Civil Defence
1 2 3 4 5
Preparing for tsunamis is inconvenient for me ............. ............. ............. .............. ................
It is difficult to prepare for tsunamis ............. ............. ............. .............. ................
Preparing for tsunamis will reduce damage to my home ............. ............. ............. .............. ................
Preparing for tsunamis will improve my everyday living condition ............. ............. ............. .............. ................
Preparing for tsunamis will improve my ability to deal with disruption to family/community life
............. ............. ............. .............. ................
Preparing for tsunamis will help save lives ............. ............. ............. .............. ................
I do not know how I can prepare for a tsunami ............. ............. ............. .............. ................
16. Have you heard or received any information about preparing for tsunami hazards from any of the following? (Tick all that apply).
1
I haven’t heard or received any information 2
Friends 3
Neighbours 4
Relatives 5
Central government 6
Regional Council 7 Local Council
8 Local Civil Defence group 9 Business establishments
10 Research organisations (e.g. NIWA, GNS, universities) 11
My workplace 12
My child’s school 13
Other, specify _______________________________________
- 157 -

17...... In the next month or so, do you intend to: (Tick one for each statement) No Possibly Definitely Improve your knowledge of how to respond to tsunamis 1 2 3
Increase your ability to respond to tsunamis 1 2 3
Become involved with a local group/neighbourhood to discuss how to respond to tsunamis
1 2 3
Seek information on tsunami risks 1 2 3
Seek information on things to do to respond to tsunamis 1 2 3
18. Have you asked any of the following people, groups or organisations
for information on how to get ready for tsunami hazards? (Tick all that apply).
1 No, I haven’t asked anyone
2 Friends
3 Neighbours
4 Relatives
5 Central Government agencies
6 Regional Council
7 Local Council 8 Local Civil Defence group
9 Business establishments 10 Research organisations (e.g. NIWA, GNS, universities)
11 My workplace
12 My child’s school
13 Other, specify _______________________________________
19. Are there official tsunami evacuation routes for this community? (Tick
one only)
1 Yes
- 158 -
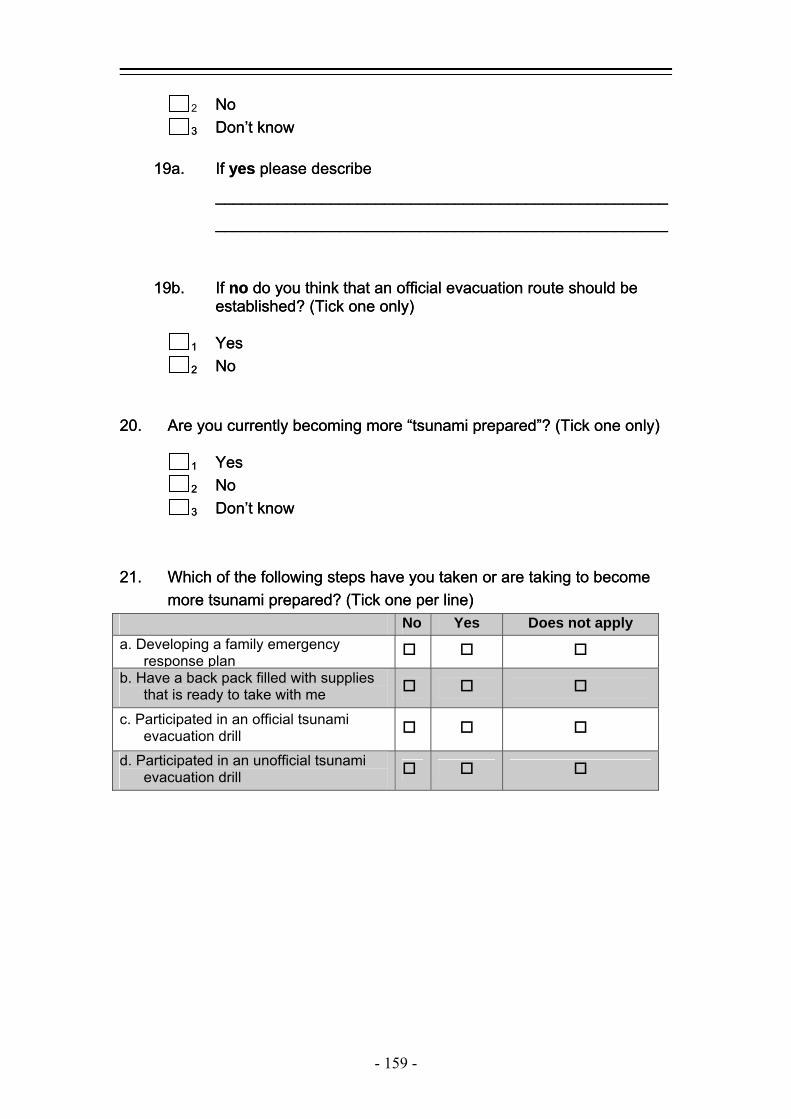
2 No
3 Don’t know
No 3
Don’t know 19a. If yes please describe
___________________________________________________
___________________________________________________
19a. If yes please describe
___________________________________________________
___________________________________________________
19b. If no do you think that an official evacuation route should be
established? (Tick one only) 19b. If no do you think that an official evacuation route should be
established? (Tick one only)
1 Yes
2 No
1 Yes
2 No
20. Are you currently becoming more “tsunami prepared”? (Tick one only) 20. Are you currently becoming more “tsunami prepared”? (Tick one only)
1 Yes
2 No
1 Yes
3 Don’t know
2 No
3 Don’t know
21. Which of the following steps have you taken or are taking to become
more tsunami prepared? (Tick one per line) 21. Which of the following steps have you taken or are taking to become
more tsunami prepared? (Tick one per line) No Yes Does not apply a. Developing a family emergency
response plan
b. Have a back pack filled with supplies that is ready to take with me
c. Participated in an official tsunami evacuation drill
d. Participated in an unofficial tsunami evacuation drill
- 159 -
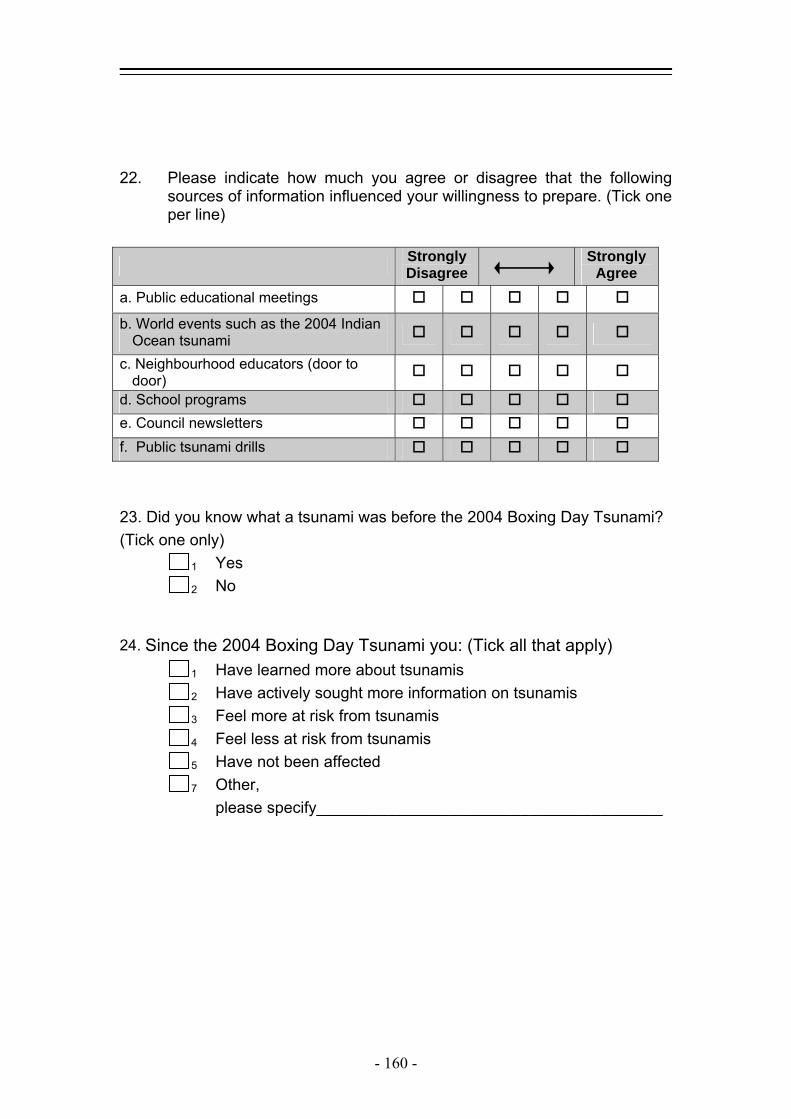
22. Please indicate how much you agree or disagree that the following
sources of information influenced your willingness to prepare. (Tick one per line)
23. Did you know what a tsunami was before the 2004 Boxing Day Tsunami? (Tick one only)
1 Yes
2 No
24. Since the 2004 Boxing Day Tsunami you: (Tick all that apply) 1
Have learned more about tsunamis 2 Have actively sought more information on tsunamis 3
Feel more at risk from tsunamis 4 Feel less at risk from tsunamis 5
Have not been affected 7
Other, please specify_______________________________________
Strongly Disagree
Strongly Agree
a. Public educational meetings b. World events such as the 2004 Indian
Ocean tsunami
c. Neighbourhood educators (door to door)
d. School programs e. Council newsletters
f. Public tsunami drills
- 160 -
During a tsunami
25. Describe how you would respond to a warning of a local source tsunami (from a place less than 1 hour travel time away). ____________________________________________________________________________________________________________________________________________________________________________________________________________
26. Describe how your response to a warning of a distant source tsunami
(originating from Japan or Alaska, etc) would differ from your response to a local tsunami. _____________________________________________________________________________________________________________________________________________________________________________________________
27. If you are at the coast and receive an official tsunami warning how
much time do you have to move to safety? (Tick one only) 1 Don’t know
2 A few minutes
3 10 minutes to half an hour
4 Half an hour to one hour
5 1-2 hours
6 2-5 hours
7 More than 5 hours
28. If you feel a strong earthquake while at the beach, how much time will
you have to move to safety? (Tick one only) 1 Don’t know 2
A few minutes 3
10 minutes to half an hour 4
Half an hour to one hour 5
1-2 hours 6
2-5 hours 7
More than 5 hours
- 161 -
29. During a tsunami, how much time can there be between one tsunami
wave/surge and the next? (Tick one only)
1 1-15 minutes
2 16-30 minutes
3 Over 30 minutes
4 All of the above 5
Don’t know 30. Would you take personal belongings with you during a local source tsunami warning? (Tick one only)
1 Yes
2 No
3 Don’t know
31. Would you take personal belongings with you during a distant source
tsunami warning? (Tick one only)
1 Yes
2 No
3 Don’t know
32. If you currently have personal survival belongings stored to take with
you when a tsunami warning is issued, please list the three most important of these items to your health/welfare?
1. ____________________________________________________________ 2._______________________________________________________ 3._______________________________________________________
- 162 -

33. For each statement, tick the box which best describes your response:
Strongly (scale) Strongly disagree agree I think tsunami could pose a threat to my personal safety 1 2 3 4 5
I think tsunami could pose a threat to my daily activities (such as work, leisure or property)
1 2 3 4 5
The tsunami that may occur here won’t be that bad 1 2 3 4 5
Tsunamis won’t affect this area 1 2 3 4 5
Tsunamis won’t affect me 1 2 3 4 5
The likelihood that major tsunamis will occur here has been greatly exaggerated 1 2 3 4 5
Tsunamis have affected this area since I have lived here 1 2 3 4 5
I will be fine if any tsunami hits here in the future 1 2 3 4 5
34. Please list the component’s of your community’s tsunami warning
system? (Please be specific) _______________________________________________________________
______________________________________________________________________________________________________________________________
I do not know if my community has a tsunami warning system. My community has a warning system, but I do not know the
components of it. 35. What advice have you been given about what to do during a tsunami
evacuation? (Please be specific) _____________________________ ________________________________________________________ ________________________________________________________
- 163 -
If you do not have a school aged child or children (year 1-13) then skip
to question 38 36. Does your child’s school have a disaster preparedness plan that
includes tsunamis? (Tick one only)
1 Yes
2 No
3 Don’t know
37. Please indicate the extent to which you agree or disagree with each of
the following statements: Strongly
Disagree Strongly Agree Does not
Apply a. I will allow my child to remain at
school when a tsunami warning is issued
b. I will go and get my child from school when a tsunami warning is issued
c. I trust that the tsunami preparedness plan at my child’s school will protect my child during a tsunami event
Attitude about community 38. Relating to the householder who is answering this questionnaire are
you:
1 the owner and this is your primary residence
2 renting and this is your primary residence 3 the owner and this is your holiday home 4 renting and this is your holiday home 5 visiting but neither rent nor own
- 164 -
If you live in this community please answer questions 39, 40, and 41. If you are visiting this community, please answer questions 42 and 43. 39. Following is a list of statements on how you feel about living in this community. Please use the scale below to show how much each statement matches your views. (Tick one per line)
Strongly disagree
1
2
(scale) 3
4
Strongly agree
5
I feel ‘at home’ in this community 1 2 3 4 5
I am satisfied living in this community 1 2 3 4 5
I am a useful member of this community 1 2 3 4 5
I have the same values and beliefs as my neighbours 1 2 3 4 5
I feel I don’t belong in this community 1 2 3 4 5
I am interested in knowing what goes on in this community 1 2 3 4 5
I would be happy to leave this community 1 2 3 4 5
I know my neighbours and/or other community members 1 2 3 4 5
I have no active involvement in this community 1 2 3 4 5
40.* Please think about your life in this community at present. Choose a number from the scale below that shows how much you agree or disagree with each of the following statements. (Tick one per line)
Strongly
disagree
(scale)
Strongly Disagree
1 2 3 4 5 I feel I have control over the things that happen in my life
1 2 3
4 5
I feel I have control over the things that happen in this community
1 2 3 4 5
There is no way I can solve some of the problems I have by myself 1 2 3 4 5
I can’t do much to change what happens in my life 1 2 3 4 5
I can’t do much to change what happens in this community 1 2 3 4 5
Somehow problems in my life usually solve themselves 1 2 3 4 5
- 165 -

* This question was not included in the analysis due to misprinting of the scale. 41. What are your main reasons for choosing to live in this community? (Choose the TWO most important reasons from the list below).
1 The natural beauty of the coast 2 Sea views 3 Escape from city life 4 Easy access to the beach 5 Fishing and shellfish gathering 6 Boating 7 Recreation (swimming, surfing, walking etc) 8 Sunbathing 9 Other (please describe)
If you are visiting this community, please answer questions 42 and 43.
42. How often do you visit this community? (Tick one only)
1 Very infrequently (once a year or less) 2 Infrequently (2-3 times per year) 3 Frequently (4-6 times per year) 4 Very frequently (at least 6 times per year) 43. What are your main reasons for visiting this community? (Choose the
TWO most important reasons from the list below).
1 The natural beauty of the coast 2 Sea views 3 Easy access to the beach 4 Fishing and shellfish gathering 5 Boating 6 Recreation (swimming, surfing, walking etc) 7 Sunbathing 8 Other (please describe)
- 166 -
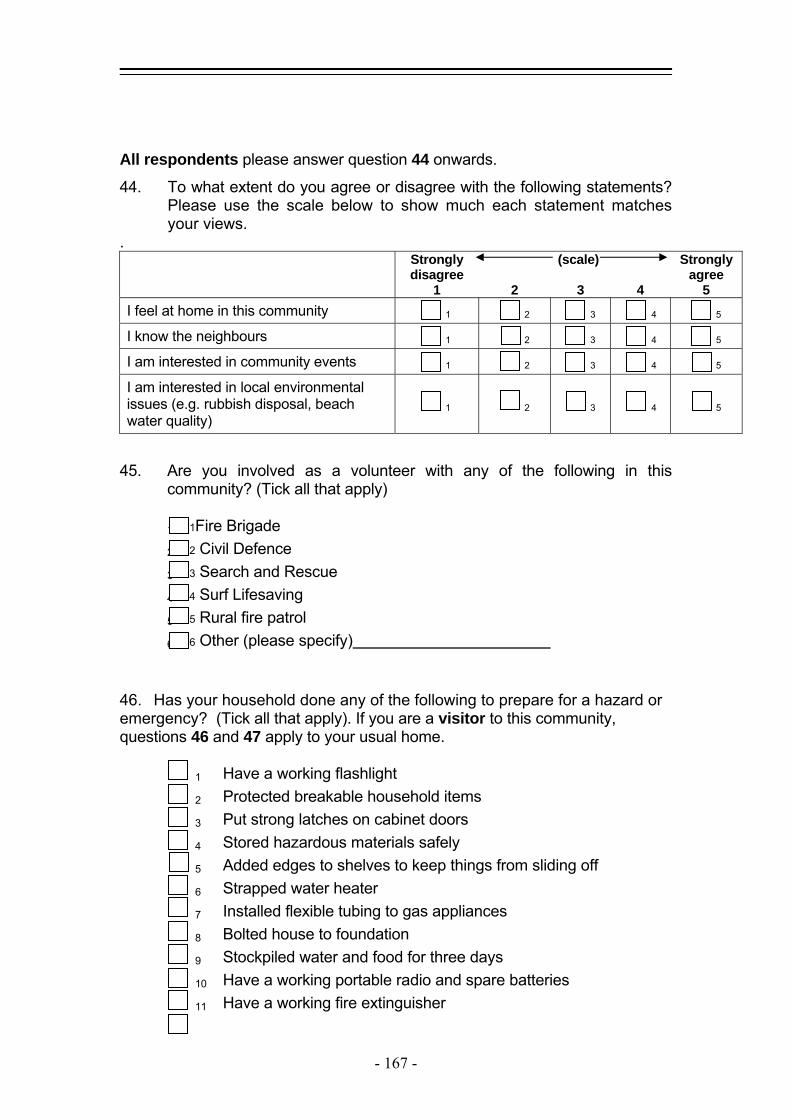
All respondents please answer question 44 onwards.
44. To what extent do you agree or disagree with the following statements? Please use the scale below to show much each statement matches your views.
. Strongly
disagree 1
2
(scale) 3
4
Strongly agree
5 I feel at home in this community 1 2 3 4 5
I know the neighbours 1 2 3 4 5
I am interested in community events 1 2 3 4 5
I am interested in local environmental issues (e.g. rubbish disposal, beach water quality)
1 2 3 4 5
45. Are you involved as a volunteer with any of the following in this community? (Tick all that apply)
1 1Fire Brigade 2 2 Civil Defence 3 3 Search and Rescue 4 4 Surf Lifesaving 5 5 Rural fire patrol 6 6 Other (please specify) 46. Has your household done any of the following to prepare for a hazard or emergency? (Tick all that apply). If you are a visitor to this community, questions 46 and 47 apply to your usual home. 1
Have a working flashlight 2
Protected breakable household items 3
Put strong latches on cabinet doors 4
Stored hazardous materials safely 5
Added edges to shelves to keep things from sliding off 6
Strapped water heater 7
Installed flexible tubing to gas appliances 8
Bolted house to foundation 9
Stockpiled water and food for three days 10
Have a working portable radio and spare batteries 11
Have a working fire extinguisher
- 167 -

12 Have a working smoke detector
13 Have a first aid kit
14 Stored wrench near gas turn-off valve
15 Picked an emergency contact person outside of your local area
16 Someone in family has learned how to put out fires
17 Bought additional insurance (e.g. home)
18 Someone in family has learned to provide first aid
19 Found out if you are in an area particularly vulnerable to a
disaster (such as an earthquake, flood or tsunami) 20 Have had home inspected for preparedness
21 If you are a visitor have you checked for emergency supplies where you are staying
22 Talked to family members about what to do if a tsunami hazard
warning is heard
47. How often do you check your emergency supplies like food, water and
batteries? (Tick one only) 1
Weekly 2
Monthly 3 Yearly 4
Never 48. If you are visiting this community where is your usual place of
residence? _________________________________________________
49. If you live in this community:
a) How long have you lived in this community? Years
b) How long have you lived in your current home? Years
If you are visiting this community:
c) How long are you visiting this community? ___days _ weeks
- 168 -
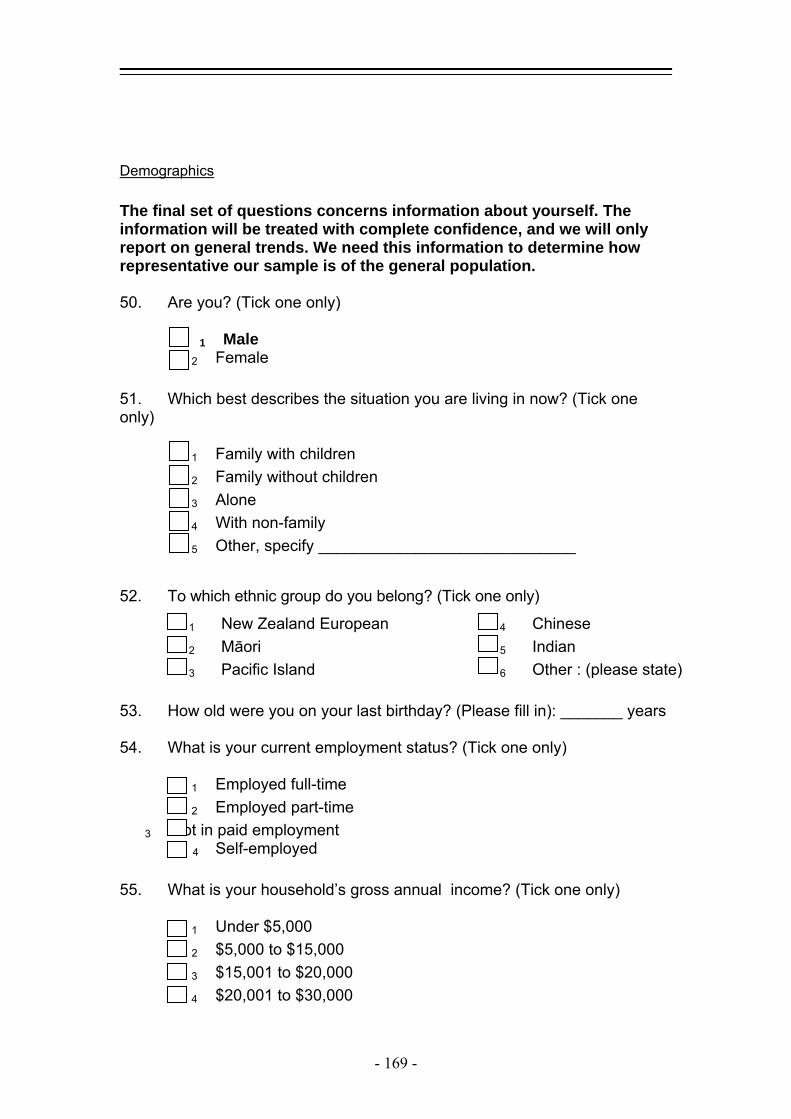
Demographics The final set of questions concerns information about yourself. The information will be treated with complete confidence, and we will only report on general trends. We need this information to determine how representative our sample is of the general population. 50. Are you? (Tick one only) 1 Male 2
Female 51. Which best describes the situation you are living in now? (Tick one only) 1
Family with children 2
Family without children 3
Alone 4
With non-family 5
Other, specify _____________________________
52. To which ethnic group do you belong? (Tick one only)
1 New Zealand European 4 Chinese 2 Māori 5 Indian 3 Pacific Island 6 Other : (please state)
53. How old were you on your last birthday? (Please fill in): _______ years 54. What is your current employment status? (Tick one only) 1
Employed full-time 2
Employed part-time 3 Not in paid employment 4 Self-employed 55. What is your household’s gross annual income? (Tick one only) 1
Under $5,000 2
$5,000 to $15,000 3
$15,001 to $20,000 4
$20,001 to $30,000
- 169 -
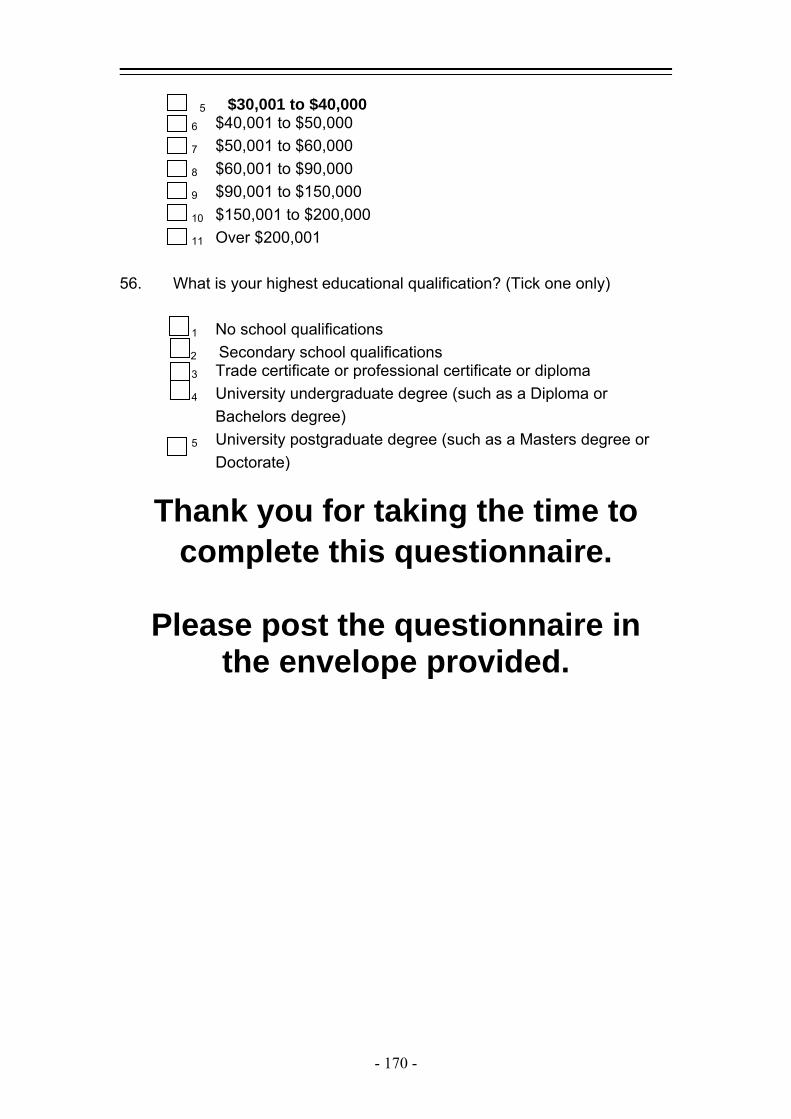
5 $30,001 to $40,000 6
$40,001 to $50,000 7
$50,001 to $60,000 8 $60,001 to $90,000 9 $90,001 to $150,000 10 $150,001 to $200,000 11 Over $200,001 56. What is your highest educational qualification? (Tick one only) 1
No school qualifications 2 Secondary school qualifications 3
Trade certificate or professional certificate or diploma 4
University undergraduate degree (such as a Diploma or Bachelors degree)
5 University postgraduate degree (such as a Masters degree or
Doctorate)
Thank you for taking the time to complete this questionnaire.
Please post the questionnaire in
the envelope provided.
- 170 -

Appendix 3
Answers to open ended questions and “other” answers
- 171 -
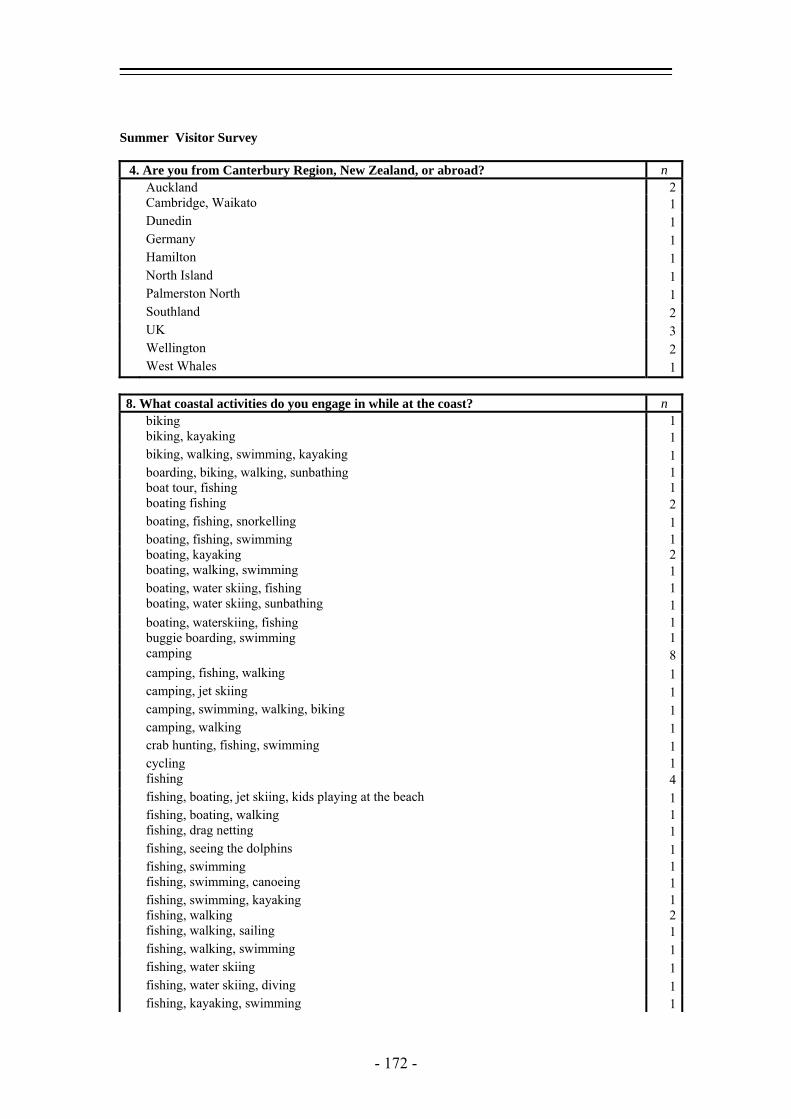
Summer Visitor Survey 4. Are you from Canterbury Region, New Zealand, or abroad? n Auckland 2 Cambridge, Waikato 1 Dunedin 1 Germany 1 Hamilton 1 North Island 1 Palmerston North 1 Southland 2 UK 3 Wellington 2 West Whales 1
8. What coastal activities do you engage in while at the coast? n biking 1 biking, kayaking 1 biking, walking, swimming, kayaking 1 boarding, biking, walking, sunbathing 1 boat tour, fishing 1 boating fishing 2 boating, fishing, snorkelling 1 boating, fishing, swimming 1 boating, kayaking 2 boating, walking, swimming 1 boating, water skiing, fishing 1 boating, water skiing, sunbathing 1 boating, waterskiing, fishing 1 buggie boarding, swimming 1 camping 8 camping, fishing, walking 1 camping, jet skiing 1 camping, swimming, walking, biking 1 camping, walking 1 crab hunting, fishing, swimming 1 cycling 1 fishing 4 fishing, boating, jet skiing, kids playing at the beach 1 fishing, boating, walking 1 fishing, drag netting 1 fishing, seeing the dolphins 1 fishing, swimming 1 fishing, swimming, canoeing 1 fishing, swimming, kayaking 1 fishing, walking 2 fishing, walking, sailing 1 fishing, walking, swimming 1 fishing, water skiing 1 fishing, water skiing, diving 1 fishing, kayaking, swimming 1
- 172 -
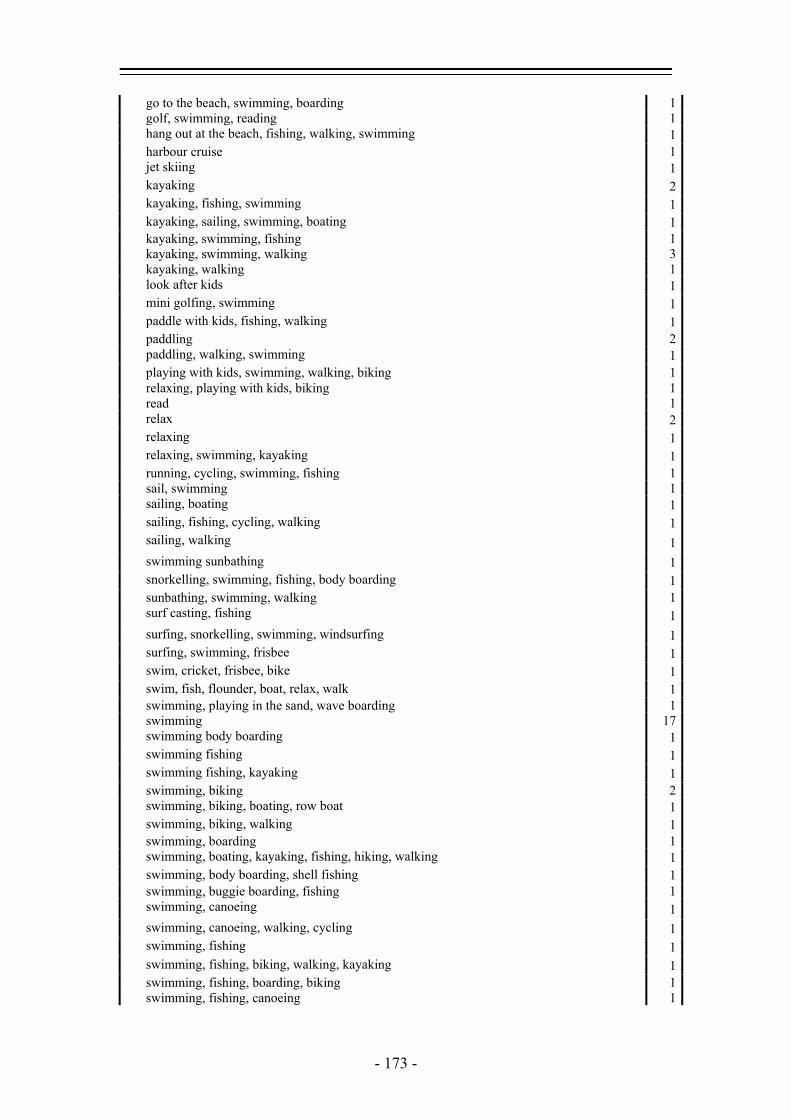
go to the beach, swimming, boarding 1 golf, swimming, reading 1 hang out at the beach, fishing, walking, swimming 1 harbour cruise 1 jet skiing 1 kayaking 2 kayaking, fishing, swimming 1 kayaking, sailing, swimming, boating 1 kayaking, swimming, fishing 1 kayaking, swimming, walking 3 kayaking, walking 1 look after kids 1 mini golfing, swimming 1 paddle with kids, fishing, walking 1 paddling 2 paddling, walking, swimming 1 playing with kids, swimming, walking, biking 1 relaxing, playing with kids, biking 1 read 1 relax 2 relaxing 1 relaxing, swimming, kayaking 1 running, cycling, swimming, fishing 1 sail, swimming 1 sailing, boating 1 sailing, fishing, cycling, walking 1 sailing, walking 1 swimming sunbathing 1 snorkelling, swimming, fishing, body boarding 1 sunbathing, swimming, walking 1 surf casting, fishing 1 surfing, snorkelling, swimming, windsurfing 1 surfing, swimming, frisbee 1 swim, cricket, frisbee, bike 1 swim, fish, flounder, boat, relax, walk 1 swimming, playing in the sand, wave boarding 1 swimming 17 swimming body boarding 1 swimming fishing 1 swimming fishing, kayaking 1 swimming, biking 2 swimming, biking, boating, row boat 1 swimming, biking, walking 1 swimming, boarding 1 swimming, boating, kayaking, fishing, hiking, walking 1 swimming, body boarding, shell fishing 1 swimming, buggie boarding, fishing 1 swimming, canoeing 1 swimming, canoeing, walking, cycling 1 swimming, fishing 1 swimming, fishing, biking, walking, kayaking 1 swimming, fishing, boarding, biking 1 swimming, fishing, canoeing 1
- 173 -

swimming, fishing 1 swimming, jet skiing, relaxing 1 swimming, kayaking 1 swimming, kayaking, biking, go karts 1 swimming, paddling 1 swimming, people watching, sightseeing, boating 1 swimming, playing with kids 1 swimming, relaxing 1 swimming, sunbathing 3 swimming, surfing 1 swimming, surfing, walking 1 swimming, walking 5 swimming, walking, fishing 1 swimming, walking, playing with kids 1 swimming, walking, touring 1 tennis, walking 1 time with kids 1 touring 1 visit ocean front 1 walking 14 walking, biking 1 walking, biking, swimming 1 walking, fishing, swimming 1 walking, swimming 5 walking, swimming, boat tour 1 walking, swimming, canoeing, fishing 1 walking, swimming, fishing 1 walking, swimming, time with kids 1 walking, swimming, wave skiing, biking 1 walking, time with family 1 walking, time with kids, canoeing 1 walking, time with kids, swimming 1 water skiing, boarding, swimming 1 water sports 1 windsurfing, sailing, fishing 1 yachting 1
10. What do you believe likely natural hazards to affect this area are? n bad weather 1 beach, water 1 beach, wind 1 broken glass, trees falling 1 cars going to fast 1 coastal tides, storms 1 currents 1 don't know 6 drinking water 1 drowning 1 drowning, sunburn 1 drowning, water contamination, uneven ground 1 drowning, wind, children from cars 1 falling pine cones, trees, ocean 1 high winds 1
- 174 -

lack of water, pollution 1 lagoon, sea 1 minimal 1 north west wind 1 ocean 1 people, rubbish 1 peoples impact on the environment 1 pine cones, trees falling down 1 pollution in river, trees falling 1 pollution 1 prickles in grass 1 rain, wind, sea 1 rip currents 1 road 1 road hazards, speeding 1 rocks around sea, southerlies 1 rocks, trees falling 1 rough sea 1 sea 1 sea goes up 1 sea, drowning 1 sea, river 1 sea, trees 1 sea, trees when windy 1 shell fish 1 snowfall 1 southerly wind 1 southerly winds 1 sticks on the ground 1 storm, sunburn 1 storm, tree falling from wind 1 storm, trees falling 1 storms 2 storms, wind 1 storm, trees falling, wind 1 storms 1 sun 1 sun, water- swimming, storms 1 sunburn 2 tidal wave 3 tidal wave, seagull poop, wind, infection, unclean water 1 tordanoes, hurricanes 1 tornado 1 traffic, rubbish 1 trees 10 trees blowing down 1 trees falling 2 trees falling from wind 1 trees falling, people speeding on motorbikes 1 trees falling, water 1 trees in wind 2
- 175 -
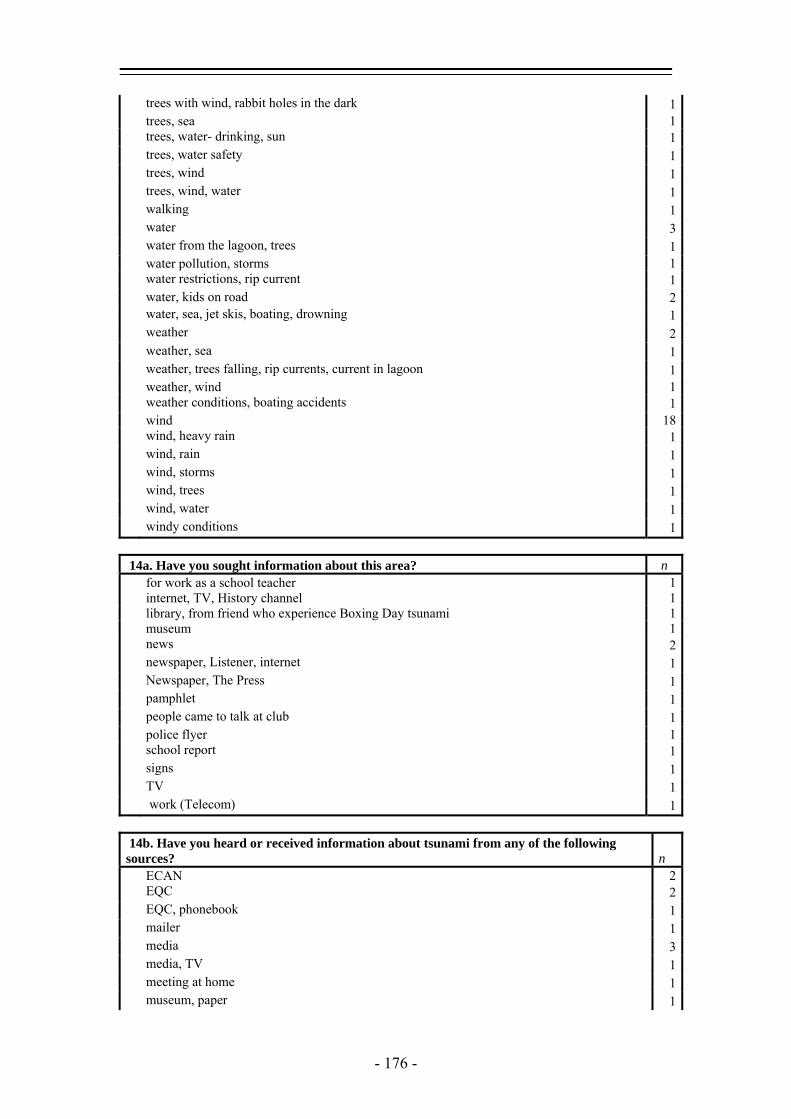
trees with wind, rabbit holes in the dark 1 trees, sea 1 trees, water- drinking, sun 1 trees, water safety 1 trees, wind 1 trees, wind, water 1 walking 1 water 3 water from the lagoon, trees 1 water pollution, storms 1 water restrictions, rip current 1 water, kids on road 2 water, sea, jet skis, boating, drowning 1 weather 2 weather, sea 1 weather, trees falling, rip currents, current in lagoon 1 weather, wind 1 weather conditions, boating accidents 1 wind 18 wind, heavy rain 1 wind, rain 1 wind, storms 1 wind, trees 1 wind, water 1 windy conditions 1
14a. Have you sought information about this area? n for work as a school teacher 1 internet, TV, History channel 1 library, from friend who experience Boxing Day tsunami 1 museum 1 news 2 newspaper, Listener, internet 1 Newspaper, The Press 1 pamphlet 1 people came to talk at club 1 police flyer 1 school report 1 signs 1 TV 1 work (Telecom) 1
14b. Have you heard or received information about tsunami from any of the following sources? n ECAN 2 EQC 2 EQC, phonebook 1 mailer 1 media 3 media, TV 1 meeting at home 1 museum, paper 1
- 176 -
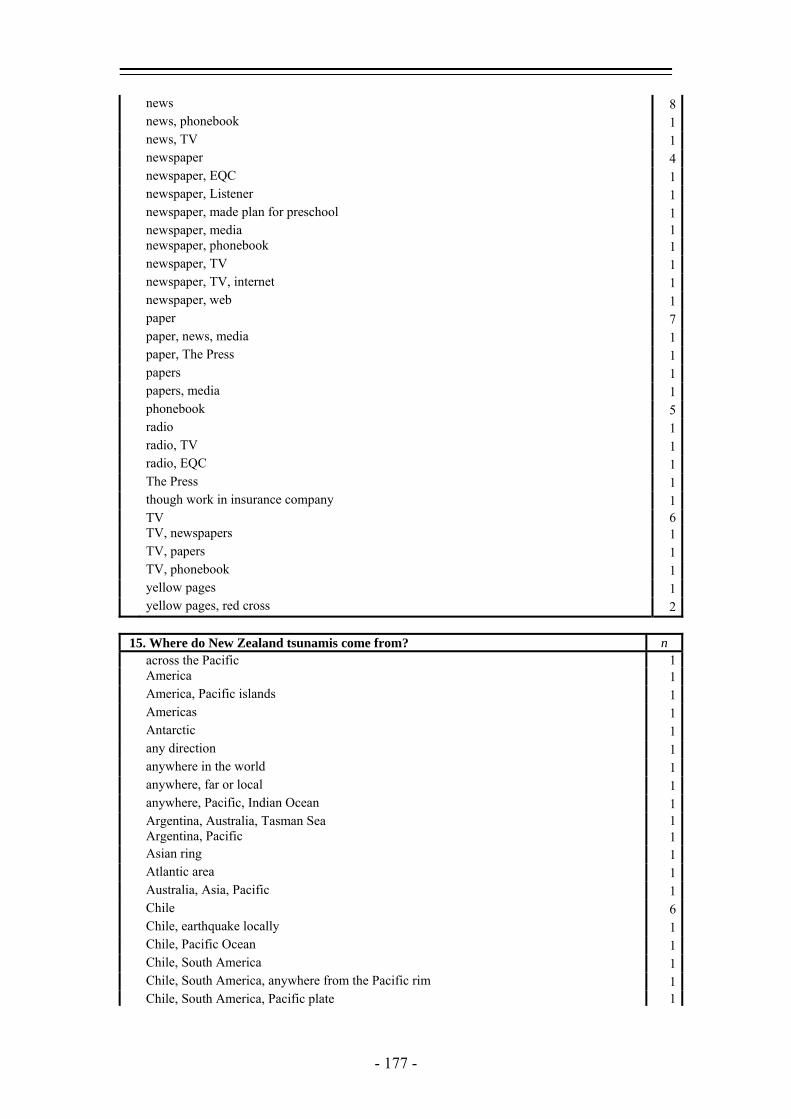
news 8 news, phonebook 1 news, TV 1 newspaper 4 newspaper, EQC 1 newspaper, Listener 1 newspaper, made plan for preschool 1 newspaper, media 1 newspaper, phonebook 1 newspaper, TV 1 newspaper, TV, internet 1 newspaper, web 1 paper 7 paper, news, media 1 paper, The Press 1 papers 1 papers, media 1 phonebook 5 radio 1 radio, TV 1 radio, EQC 1 The Press 1 though work in insurance company 1 TV 6 TV, newspapers 1 TV, papers 1 TV, phonebook 1 yellow pages 1 yellow pages, red cross 2
15. Where do New Zealand tsunamis come from? n across the Pacific 1 America 1 America, Pacific islands 1 Americas 1 Antarctic 1 any direction 1 anywhere in the world 1 anywhere, far or local 1 anywhere, Pacific, Indian Ocean 1 Argentina, Australia, Tasman Sea 1 Argentina, Pacific 1 Asian ring 1 Atlantic area 1 Australia, Asia, Pacific 1 Chile 6 Chile, earthquake locally 1 Chile, Pacific Ocean 1 Chile, South America 1 Chile, South America, anywhere from the Pacific rim 1 Chile, South America, Pacific plate 1
- 177 -
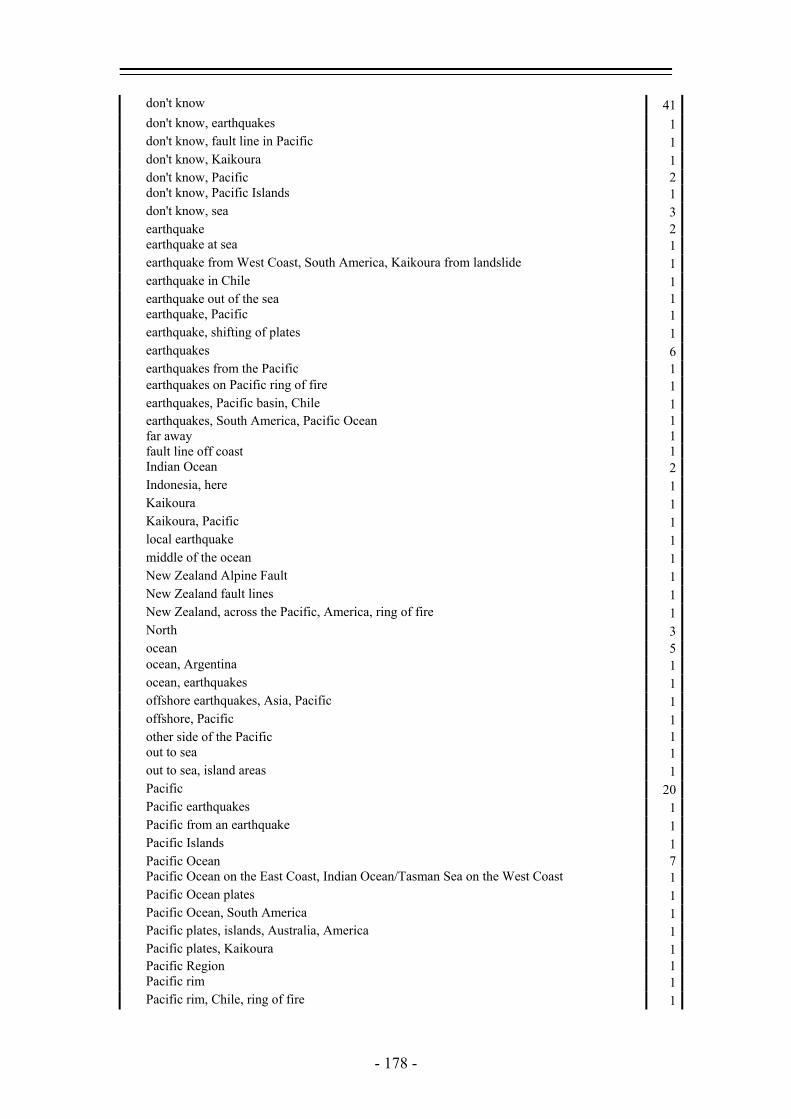
don't know 41 don't know, earthquakes 1 don't know, fault line in Pacific 1 don't know, Kaikoura 1 don't know, Pacific 2 don't know, Pacific Islands 1 don't know, sea 3 earthquake 2 earthquake at sea 1 earthquake from West Coast, South America, Kaikoura from landslide 1 earthquake in Chile 1 earthquake out of the sea 1 earthquake, Pacific 1 earthquake, shifting of plates 1 earthquakes 6 earthquakes from the Pacific 1 earthquakes on Pacific ring of fire 1 earthquakes, Pacific basin, Chile 1 earthquakes, South America, Pacific Ocean 1 far away 1 fault line off coast 1 Indian Ocean 2 Indonesia, here 1 Kaikoura 1 Kaikoura, Pacific 1 local earthquake 1 middle of the ocean 1 New Zealand Alpine Fault 1 New Zealand fault lines 1 New Zealand, across the Pacific, America, ring of fire 1 North 3 ocean 5 ocean, Argentina 1 ocean, earthquakes 1 offshore earthquakes, Asia, Pacific 1 offshore, Pacific 1 other side of the Pacific 1 out to sea 1 out to sea, island areas 1 Pacific 20 Pacific earthquakes 1 Pacific from an earthquake 1 Pacific Islands 1 Pacific Ocean 7 Pacific Ocean on the East Coast, Indian Ocean/Tasman Sea on the West Coast 1 Pacific Ocean plates 1 Pacific Ocean, South America 1 Pacific plates, islands, Australia, America 1 Pacific plates, Kaikoura 1 Pacific Region 1 Pacific rim 1 Pacific rim, Chile, ring of fire 1
- 178 -
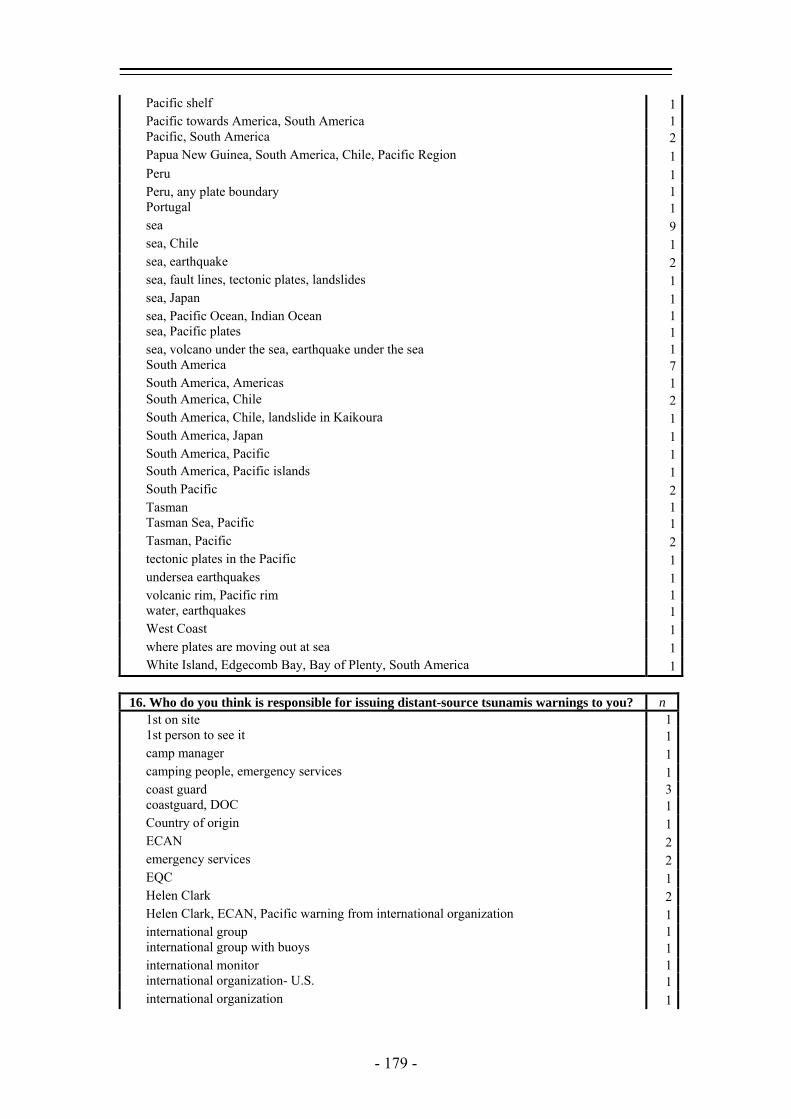
Pacific shelf 1 Pacific towards America, South America 1 Pacific, South America 2 Papua New Guinea, South America, Chile, Pacific Region 1 Peru 1 Peru, any plate boundary 1 Portugal 1 sea 9 sea, Chile 1 sea, earthquake 2 sea, fault lines, tectonic plates, landslides 1 sea, Japan 1 sea, Pacific Ocean, Indian Ocean 1 sea, Pacific plates 1 sea, volcano under the sea, earthquake under the sea 1 South America 7 South America, Americas 1 South America, Chile 2 South America, Chile, landslide in Kaikoura 1 South America, Japan 1 South America, Pacific 1 South America, Pacific islands 1 South Pacific 2 Tasman 1 Tasman Sea, Pacific 1 Tasman, Pacific 2 tectonic plates in the Pacific 1 undersea earthquakes 1 volcanic rim, Pacific rim 1 water, earthquakes 1 West Coast 1 where plates are moving out at sea 1 White Island, Edgecomb Bay, Bay of Plenty, South America 1
16. Who do you think is responsible for issuing distant-source tsunamis warnings to you? n 1st on site 1 1st person to see it 1 camp manager 1 camping people, emergency services 1 coast guard 3 coastguard, DOC 1 Country of origin 1 ECAN 2 emergency services 2 EQC 1 Helen Clark 2 Helen Clark, ECAN, Pacific warning from international organization 1 international group 1 international group with buoys 1 international monitor 1 international organization- U.S. 1 international organization 1
- 179 -
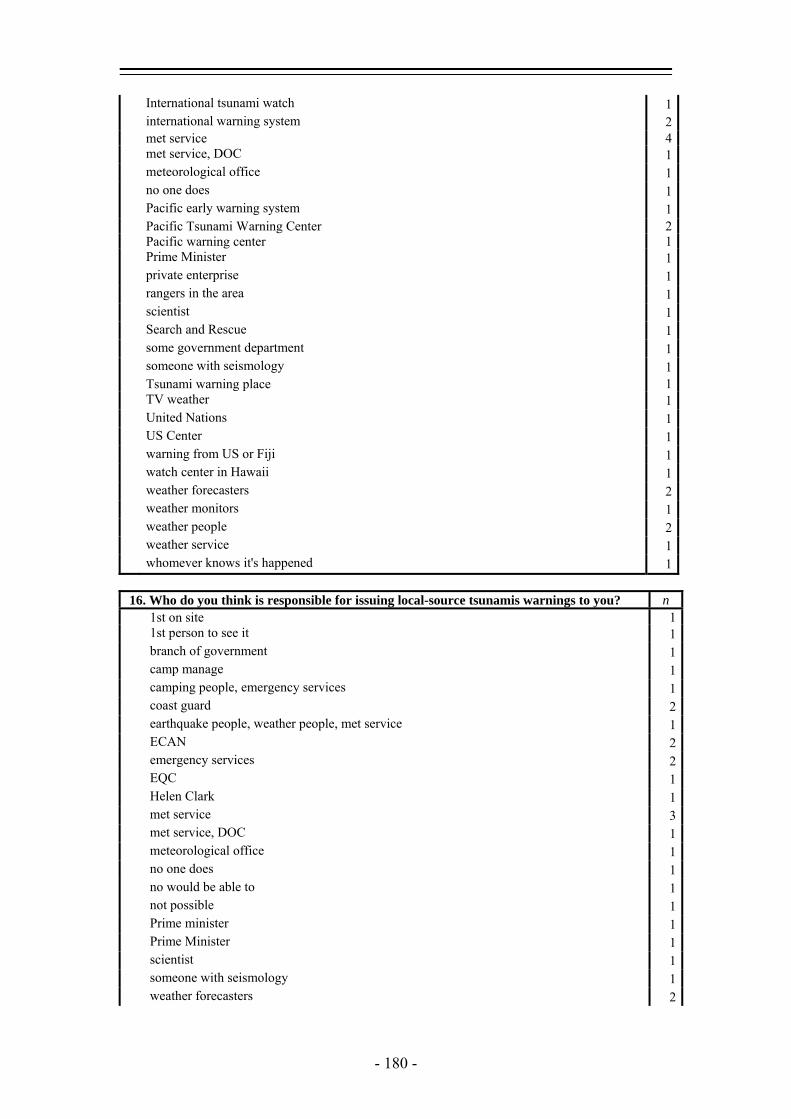
International tsunami watch 1 international warning system 2 met service 4 met service, DOC 1 meteorological office 1 no one does 1 Pacific early warning system 1 Pacific Tsunami Warning Center 2 Pacific warning center 1 Prime Minister 1 private enterprise 1 rangers in the area 1 scientist 1 Search and Rescue 1 some government department 1 someone with seismology 1 Tsunami warning place 1 TV weather 1 United Nations 1 US Center 1 warning from US or Fiji 1 watch center in Hawaii 1 weather forecasters 2 weather monitors 1 weather people 2 weather service 1 whomever knows it's happened 1
16. Who do you think is responsible for issuing local-source tsunamis warnings to you? n 1st on site 1 1st person to see it 1 branch of government 1 camp manage 1 camping people, emergency services 1 coast guard 2 earthquake people, weather people, met service 1 ECAN 2 emergency services 2 EQC 1 Helen Clark 1 met service 3 met service, DOC 1 meteorological office 1 no one does 1 no would be able to 1 not possible 1 Prime minister 1 Prime Minister 1 scientist 1 someone with seismology 1 weather forecasters 2
- 180 -
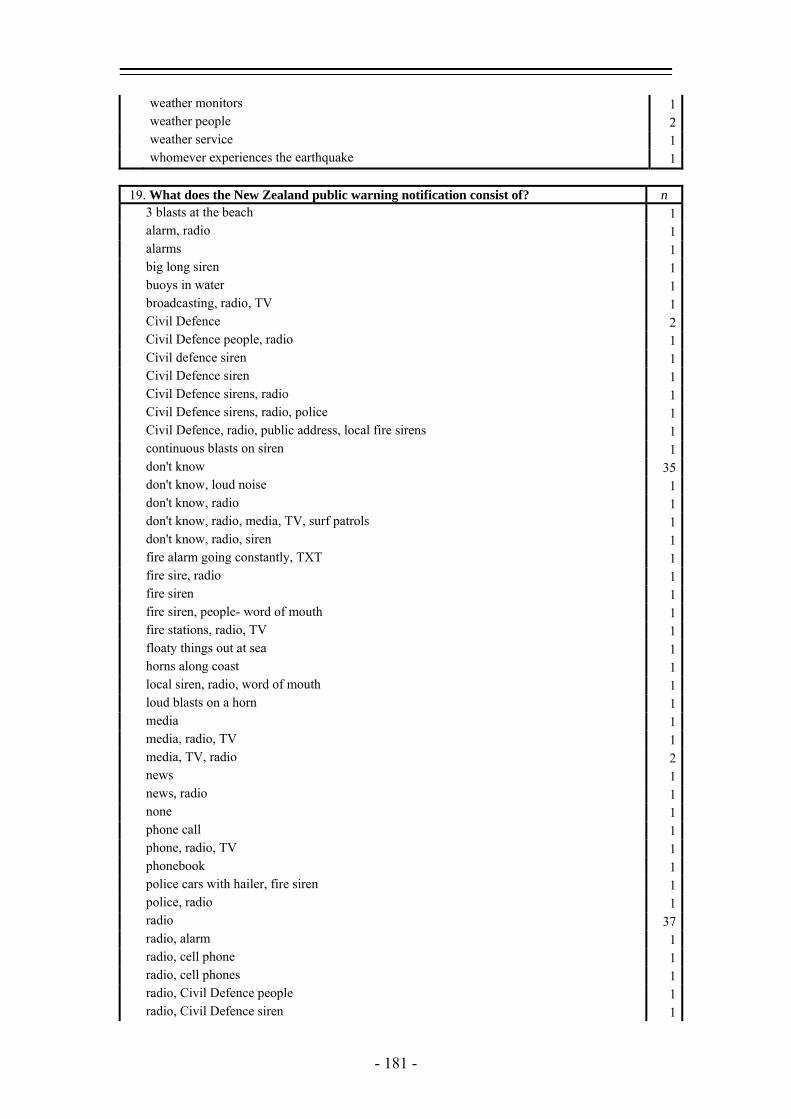
weather monitors 1 weather people 2 weather service 1 whomever experiences the earthquake 1
19. What does the New Zealand public warning notification consist of? n 3 blasts at the beach 1 alarm, radio 1 alarms 1 big long siren 1 buoys in water 1 broadcasting, radio, TV 1 Civil Defence 2 Civil Defence people, radio 1 Civil defence siren 1 Civil Defence siren 1 Civil Defence sirens, radio 1 Civil Defence sirens, radio, police 1 Civil Defence, radio, public address, local fire sirens 1 continuous blasts on siren 1 don't know 35 don't know, loud noise 1 don't know, radio 1 don't know, radio, media, TV, surf patrols 1 don't know, radio, siren 1 fire alarm going constantly, TXT 1 fire sire, radio 1 fire siren 1 fire siren, people- word of mouth 1 fire stations, radio, TV 1 floaty things out at sea 1 horns along coast 1 local siren, radio, word of mouth 1 loud blasts on a horn 1 media 1 media, radio, TV 1 media, TV, radio 2 news 1 news, radio 1 none 1 phone call 1 phone, radio, TV 1 phonebook 1 police cars with hailer, fire siren 1 police, radio 1 radio 37 radio, alarm 1 radio, cell phone 1 radio, cell phones 1 radio, Civil Defence people 1 radio, Civil Defence siren 1
- 181 -
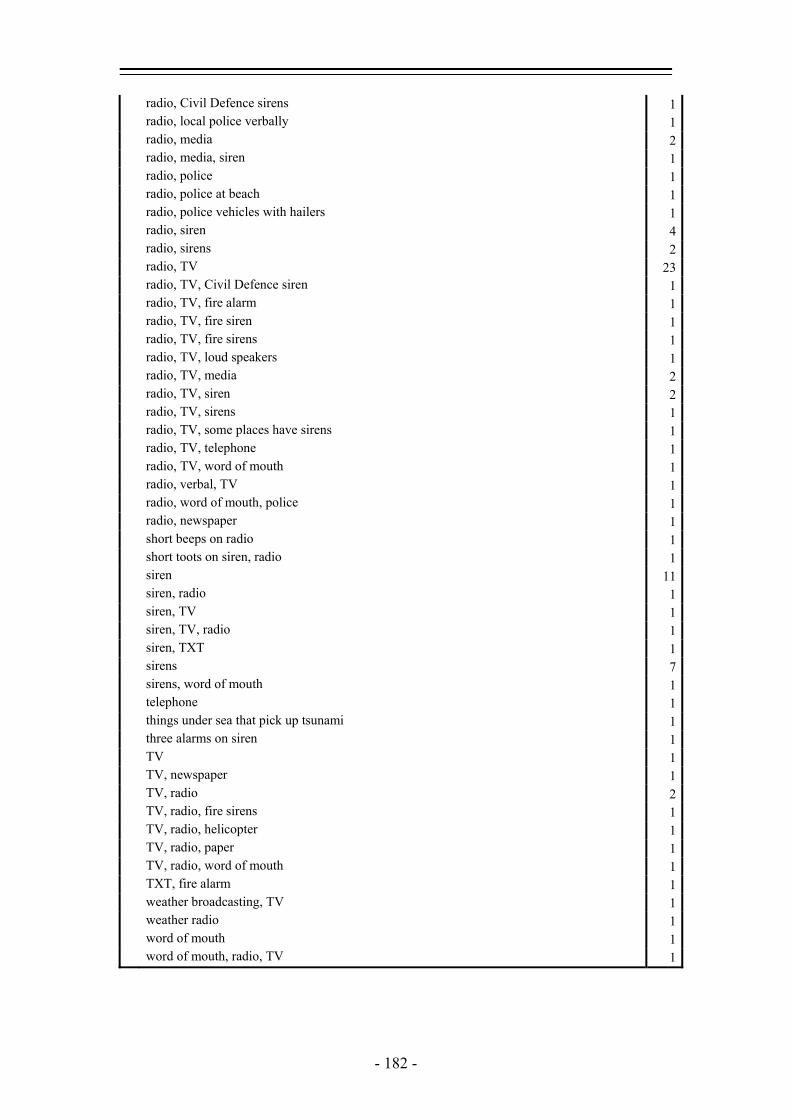
radio, Civil Defence sirens 1 radio, local police verbally 1 radio, media 2 radio, media, siren 1 radio, police 1 radio, police at beach 1 radio, police vehicles with hailers 1 radio, siren 4 radio, sirens 2 radio, TV 23 radio, TV, Civil Defence siren 1 radio, TV, fire alarm 1 radio, TV, fire siren 1 radio, TV, fire sirens 1 radio, TV, loud speakers 1 radio, TV, media 2 radio, TV, siren 2 radio, TV, sirens 1 radio, TV, some places have sirens 1 radio, TV, telephone 1 radio, TV, word of mouth 1 radio, verbal, TV 1 radio, word of mouth, police 1 radio, newspaper 1 short beeps on radio 1 short toots on siren, radio 1 siren 11 siren, radio 1 siren, TV 1 siren, TV, radio 1 siren, TXT 1 sirens 7 sirens, word of mouth 1 telephone 1 things under sea that pick up tsunami 1 three alarms on siren 1 TV 1 TV, newspaper 1 TV, radio 2 TV, radio, fire sirens 1 TV, radio, helicopter 1 TV, radio, paper 1 TV, radio, word of mouth 1 TXT, fire alarm 1 weather broadcasting, TV 1 weather radio 1 word of mouth 1 word of mouth, radio, TV 1
- 182 -
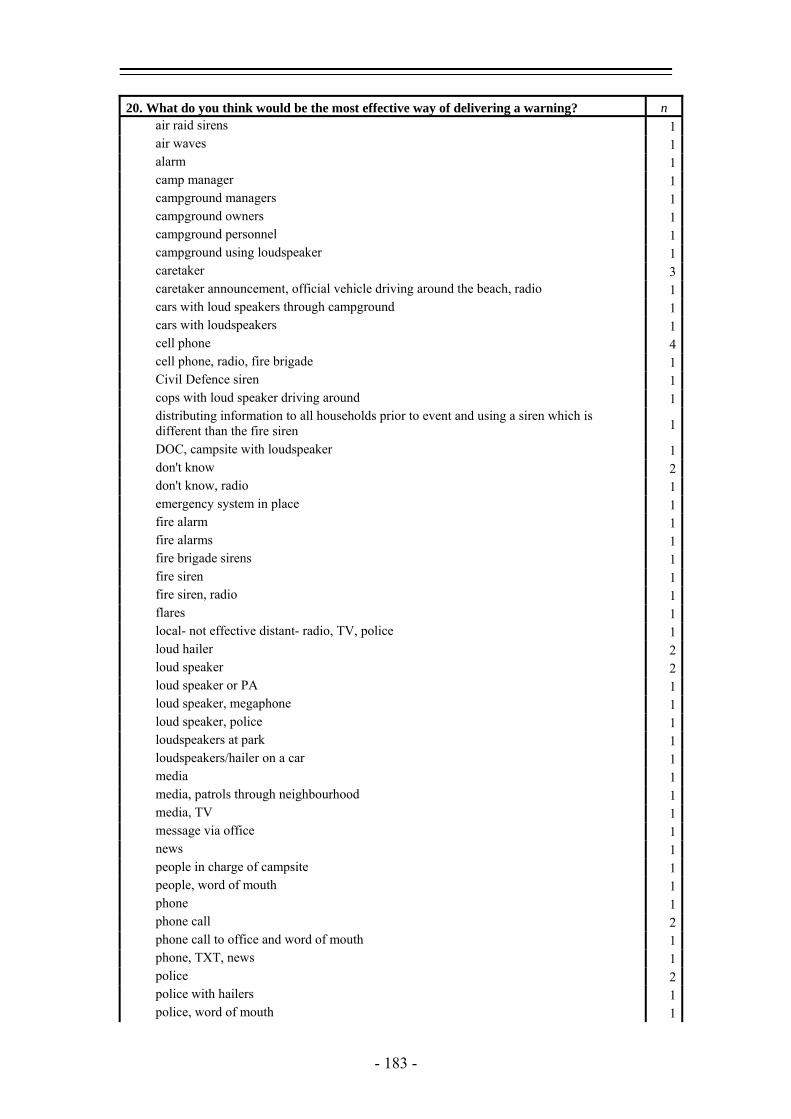
20. What do you think would be the most effective way of delivering a warning? n air raid sirens 1 air waves 1 alarm 1 camp manager 1 campground managers 1 campground owners 1 campground personnel 1 campground using loudspeaker 1 caretaker 3 caretaker announcement, official vehicle driving around the beach, radio 1 cars with loud speakers through campground 1 cars with loudspeakers 1 cell phone 4 cell phone, radio, fire brigade 1 Civil Defence siren 1 cops with loud speaker driving around 1 distributing information to all households prior to event and using a siren which is
different than the fire siren 1
DOC, campsite with loudspeaker 1 don't know 2 don't know, radio 1 emergency system in place 1 fire alarm 1 fire alarms 1 fire brigade sirens 1 fire siren 1 fire siren, radio 1 flares 1 local- not effective distant- radio, TV, police 1 loud hailer 2 loud speaker 2 loud speaker or PA 1 loud speaker, megaphone 1 loud speaker, police 1 loudspeakers at park 1 loudspeakers/hailer on a car 1 media 1 media, patrols through neighbourhood 1 media, TV 1 message via office 1 news 1 people in charge of campsite 1 people, word of mouth 1 phone 1 phone call 2 phone call to office and word of mouth 1 phone, TXT, news 1 police 2 police with hailers 1 police, word of mouth 1
- 183 -
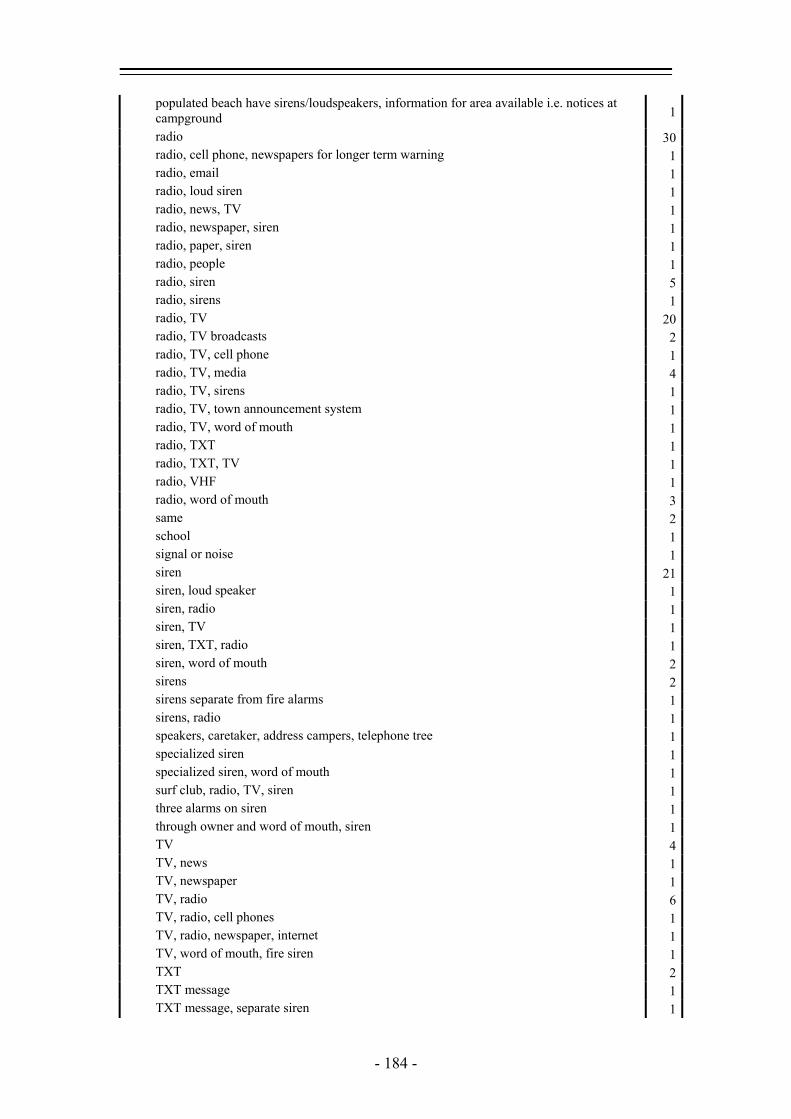
populated beach have sirens/loudspeakers, information for area available i.e. notices at campground 1
radio 30 radio, cell phone, newspapers for longer term warning 1 radio, email 1 radio, loud siren 1 radio, news, TV 1 radio, newspaper, siren 1 radio, paper, siren 1 radio, people 1 radio, siren 5 radio, sirens 1 radio, TV 20 radio, TV broadcasts 2 radio, TV, cell phone 1 radio, TV, media 4 radio, TV, sirens 1 radio, TV, town announcement system 1 radio, TV, word of mouth 1 radio, TXT 1 radio, TXT, TV 1 radio, VHF 1 radio, word of mouth 3 same 2 school 1 signal or noise 1 siren 21 siren, loud speaker 1 siren, radio 1 siren, TV 1 siren, TXT, radio 1 siren, word of mouth 2 sirens 2 sirens separate from fire alarms 1 sirens, radio 1 speakers, caretaker, address campers, telephone tree 1 specialized siren 1 specialized siren, word of mouth 1 surf club, radio, TV, siren 1 three alarms on siren 1 through owner and word of mouth, siren 1 TV 4 TV, news 1 TV, newspaper 1 TV, radio 6 TV, radio, cell phones 1 TV, radio, newspaper, internet 1 TV, word of mouth, fire siren 1 TXT 2 TXT message 1 TXT message, separate siren 1
- 184 -
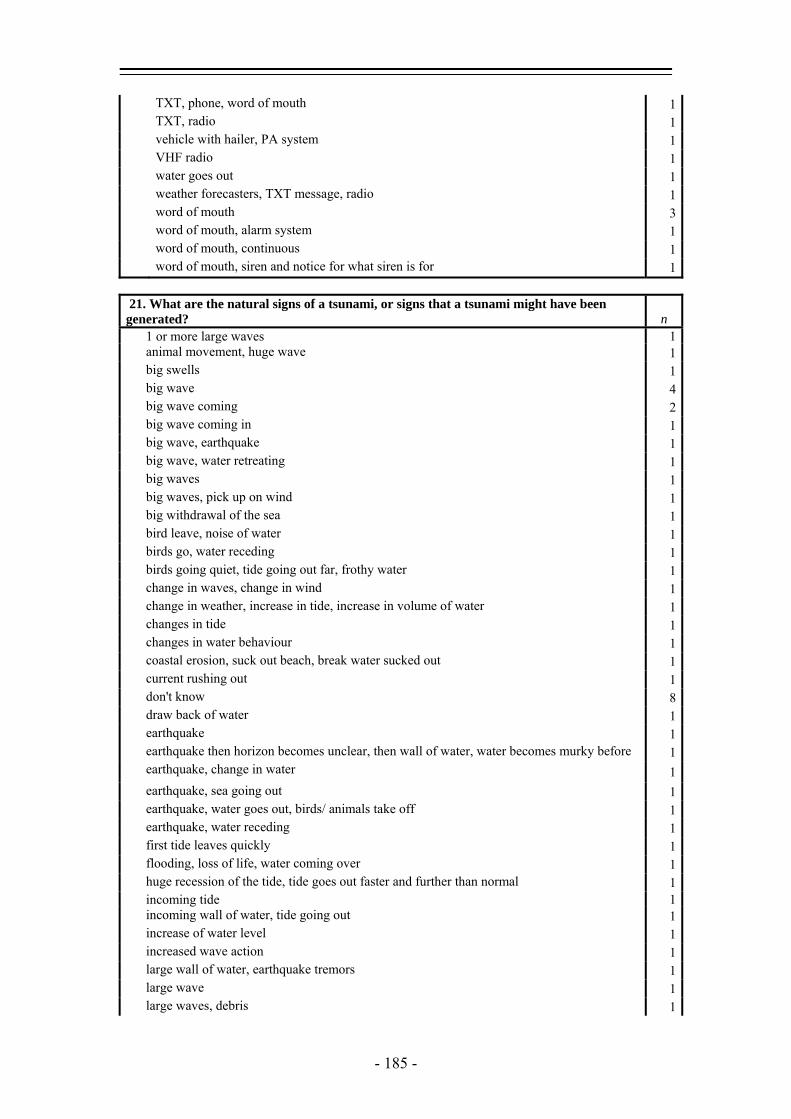
TXT, phone, word of mouth 1 TXT, radio 1 vehicle with hailer, PA system 1 VHF radio 1 water goes out 1 weather forecasters, TXT message, radio 1 word of mouth 3 word of mouth, alarm system 1 word of mouth, continuous 1 word of mouth, siren and notice for what siren is for 1
21. What are the natural signs of a tsunami, or signs that a tsunami might have been generated? n 1 or more large waves 1 animal movement, huge wave 1 big swells 1 big wave 4 big wave coming 2 big wave coming in 1 big wave, earthquake 1 big wave, water retreating 1 big waves 1 big waves, pick up on wind 1 big withdrawal of the sea 1 bird leave, noise of water 1 birds go, water receding 1 birds going quiet, tide going out far, frothy water 1 change in waves, change in wind 1 change in weather, increase in tide, increase in volume of water 1 changes in tide 1 changes in water behaviour 1 coastal erosion, suck out beach, break water sucked out 1 current rushing out 1 don't know 8 draw back of water 1 earthquake 1 earthquake then horizon becomes unclear, then wall of water, water becomes murky before 1 earthquake, change in water 1 earthquake, sea going out 1 earthquake, water goes out, birds/ animals take off 1 earthquake, water receding 1 first tide leaves quickly 1 flooding, loss of life, water coming over 1 huge recession of the tide, tide goes out faster and further than normal 1 incoming tide 1 incoming wall of water, tide going out 1 increase of water level 1 increased wave action 1 large wall of water, earthquake tremors 1 large wave 1 large waves, debris 1
- 185 -
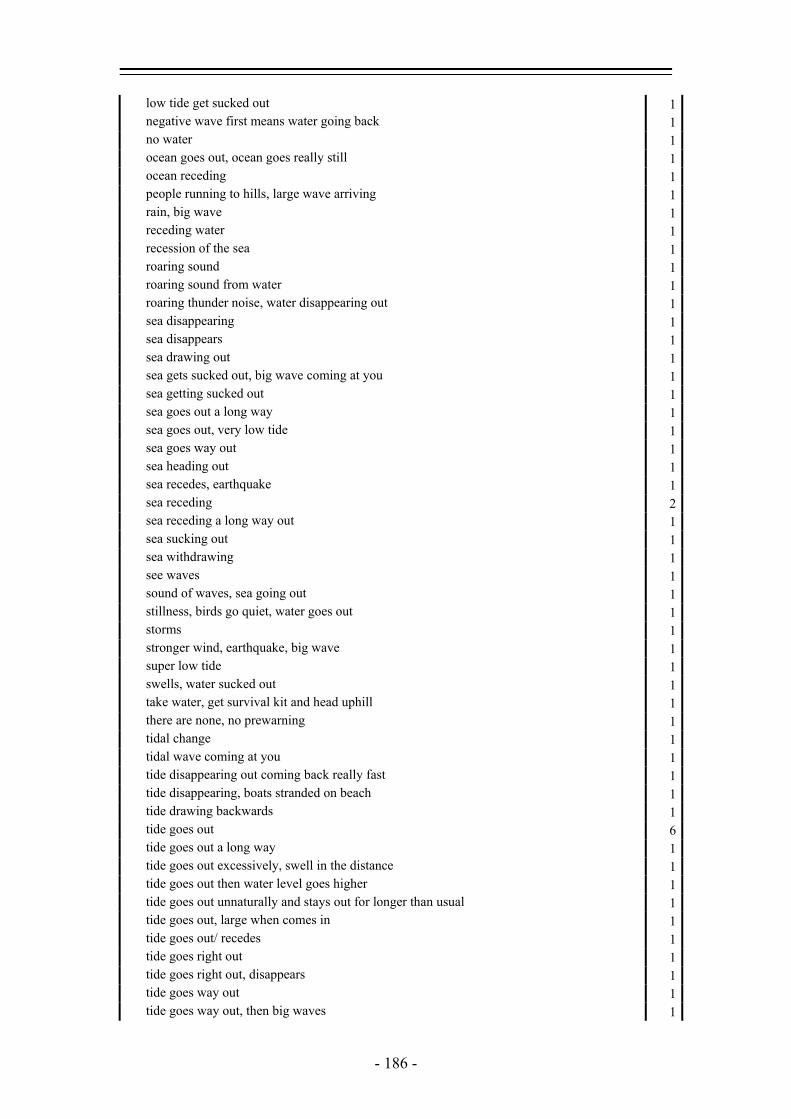
low tide get sucked out 1 negative wave first means water going back 1 no water 1 ocean goes out, ocean goes really still 1 ocean receding 1 people running to hills, large wave arriving 1 rain, big wave 1 receding water 1 recession of the sea 1 roaring sound 1 roaring sound from water 1 roaring thunder noise, water disappearing out 1 sea disappearing 1 sea disappears 1 sea drawing out 1 sea gets sucked out, big wave coming at you 1 sea getting sucked out 1 sea goes out a long way 1 sea goes out, very low tide 1 sea goes way out 1 sea heading out 1 sea recedes, earthquake 1 sea receding 2 sea receding a long way out 1 sea sucking out 1 sea withdrawing 1 see waves 1 sound of waves, sea going out 1 stillness, birds go quiet, water goes out 1 storms 1 stronger wind, earthquake, big wave 1 super low tide 1 swells, water sucked out 1 take water, get survival kit and head uphill 1 there are none, no prewarning 1 tidal change 1 tidal wave coming at you 1 tide disappearing out coming back really fast 1 tide disappearing, boats stranded on beach 1 tide drawing backwards 1 tide goes out 6 tide goes out a long way 1 tide goes out excessively, swell in the distance 1 tide goes out then water level goes higher 1 tide goes out unnaturally and stays out for longer than usual 1 tide goes out, large when comes in 1 tide goes out/ recedes 1 tide goes right out 1 tide goes right out, disappears 1 tide goes way out 1 tide goes way out, then big waves 1
- 186 -
tide going out 5 tide going out a long way 1 tide going out rapidly/dramatically 1 tide going out really quickly 1 tide going out then wave coming in 1 tide going out, earthquake 1 tide going out, earthquake, extreme wind 1 tide going out, rivers going low 1 tide going quickly a long way 1 tide going way out 3 tide going way out very fast 1 tide going way out, frothy water 1 tide recedes 1 tide recedes way out and then comes back 1 tide receding 2 unnatural low tide, initial abnormal low tide, water going out 1 wall of water 1 water's gone 1 water goes out 1 water being sucked out 2 water coming in a hurry 1 water disappearing 6 water disappearing backwards 1 water disappearing towards the sea a long way out 1 water disappears 3 water drawing out 1 water ebbs out and comes back in a big rush 1 water goes all the way out 1 water goes and comes back 1 water goes out 13 water goes out further than normal 1 water goes out, wall of water 1 water goes right out 3 water goes way out 1 water goes way out then thunders in 1 water goes way out, birds go out 1 water going back 1 water going out 10 water going out a long way 1 water going out and then back in 1 water going out past horizon 1 water going out, animals taking off 1 water going out, take a while to come back 1 water hisses and froths like in a pan 1 water recedes very far, big wave 1 water recedes 1 water recedes significantly 1 water receding 1 water receding real quick 1 water rising 1 water rushes out 1
- 187 -
water rushing out then in fast 1 water sucking out 4 water sucking out, big tidal change 1 water sucks back 1 water sucks out 1 water to recede 1 water will go out 1 waves disappearing further out 1 waves getting bigger 1 waves going out 1 waves recede, abnormally low tide 1
22. In the event of a distant source, official tsunami warning, what actions would you take? n alert campers to move to higher ground 1 at home make sure we had provisions and radio with batteries. at campground pack up kids
and stuff and leave 1
clear out and head for higher ground 1 climb hill 1 climb the hill 1 climb up a tree 1 collect kids, get in car and drive away 1 don't know 2 drive as fast as you can, go uphill/ inland 1 drive uphill 1 ensure parents left, head up Cashmere hills at home, get in car and go here 1 evacuate 1 find high ground 1 find information on where it is safe to go 1 find out where highest point is and go there 1 follow instructions, move to higher ground 1 get as far away from beach as possible 1 get as high as possible 2 get away from camping places, notify people 1 get away from coast 1 get away from the beach 1 get cars out and go 1 get family together, head inland and up 1 get high, head for hills 1 get in car an go to higher ground 1 get in car an go, leave caravan 1 get in car and drive as far away as possible uphill 1 get in car and drive uphill 1 get in car and go 1 get in car and go, go high up 1 get in car, drive uphill 1-2 km away 1 get in car, go high, get in boat 1 get in the car with family and others if necessary and drive far away 1 get in van and go 1 get inland/uphill 1 get kids and go straight uphill 1 get kids and run, get up high 1
- 188 -
get kids, go high inland, bring survival kit 1 get kids/self in car and get to higher ground quickly, if no time then walk not use the car 1 get kinds and essentials into car and head uphill then watch it come in 1 get necessities and go far inland 1 get on bikes and go inland, vehicle transport too complicated 1 get out 1 get out of area, get inland 1 get out of here 2 get out of here to higher ground 1 get out of here, uphill 1 get out very quickly 1 get somewhere high 1 get supplies and get to higher ground 1 get to high ground 1 get to high ground as soon as possible 1 get to high ground, go as far inland as possible 1 get to high ground, nothing to do while at the coast 1 get to higher ground 7 get to higher ground or up a tree 1 get to higher ground, grab necessities 1 get to higher ground, make sure to have water, food, kids 1 get to higher ground, pack up a bit- valuables 1 get up high 1 get up to higher ground as fast as possible 1 get uphill 1 get uphill with camera 1 get water and food and organize, go where directed 1 go as far inland and uphill as possible 1 go as far inland as possible and uphill 1 go for high ground 1 go for higher ground 1 go for hills, get personal papers and family then go 1 go high up 1 go home 2 go inland 2 go inland, leave tent and stuff 1 go to high ground 2 go to high ground with a good view 1 go to high ground/ inland 1 go to higher ground 7 go to highest ground, to mom's 1 go to Mt. Hutt moving as far inland as possible 1 go up high 1 go up the hill 1 go up to higher ground 1 go up to hills 1 go uphill 4 go uphill as fast as possible with kids 1 go uphill as high as possible 1 grab kids and go uphill as quickly as possible 1 grab kids, move to higher ground 1
- 189 -
head for high ground 1 head for high land 1 head for higher ground 2 head for higher ground, take others with 1 head for hills 6 head for hills in car 1 head for hills or higher 1 head for hills with kids and animals 1 head for hills/foothills as quickly as possible 1 head for the hills 5 head for the hills, take water, batteries, food 1 head for the hills/ higher ground, leave stuff 1 head inland 4 head inland as far as possible and as quickly as possible 1 head to higher ground 1 head to hills 1 head up hill as soon as possible 1 head up the hill 1 high ground 1 jump in car and grab cats and food an go 1 jump in car and head inland 1 just go, no packing except essentials 1 leave area as fast as possible 1 leave as soon as heard about it 1 leave belongings and run away 1 leave campground and Christchurch 1 leave coastal area immediately 1 leave, take water and go inland with survival pack 1 locate kids, get vehicle, go up closest hill 1 make sure people close to you are safe, gather people to go to safe place 1 move away from water quickly to high ground or tree 1 move fast in the car, leave the camper 1 move higher up 1 move inland 2 move to high ground 1 move to higher ground 3 move to higher ground/ inland 2 notify campers, get to higher ground 1 pack up and get out quickly, tell others on the way out 1 pack up and go home 2 pack up and go inland 1 pack up and go uphill to watch it coming 1 pack up and head inland 1 pack up and head to higher ground 1 pack up and head towards hill 1 pack up car and get to higher ground 1 pack up everything and drive to hills 1 pack up family and minor possessions and go uphill 1 pack up kids, sort animals, take photos food, and water 1 pick up essentials, animals, and leave 1 prepare to shift stock to higher ground 1
- 190 -

put people in car and drive away 1 receding 1 run 1 run away to higher ground 1 run away, head for higher ground 1 run far from water, as far as possible 1 run for car 1 run for high ground 1 run for higher ground 1 run for higher ground with kids 1 run for hills 1 run for the hills, stay home, don't go to beach 1 run inland 1 run to higher ground 1 run to hills 1 run uphill 4 run uphill as fast as possible 1 run uphill to high ground 1 run, pack up supplies, head inland 1 seek high ground 1 seek higher ground 1 straight in car and go 1 take family and head inland 1 take family, water, warm clothing, animals, first aid, and go 1 take personal belongings and family and seek higher ground 1 take supplies 1 tell others, move uphill 1 try to get more information, prepare for evacuation, wait for advice from officials 1 try to get to high ground 1 warm clothes, get food, get in car 1
23. In the event of signs of a possible local-source tsunami, what actions would you take? n clear out right away 1 don't know 2 evacuate 1 evacuate beach 1 evacuate, get out of the way, take family 1 get away from beach 1 get away from the beach 1 get children, get in car and go uphill 1 get family, get uphill immediately 1 get in car and head high up 1 get in car and leave 1 get kids and head for higher ground 1 get out of the place 1 get out straight away 1 get people with flotation device and go 2-3 km inland and help organize people 1 get to higher ground 3 get uphill (stay here if here) 1 go faster to higher ground 1 go high up 1
- 191 -
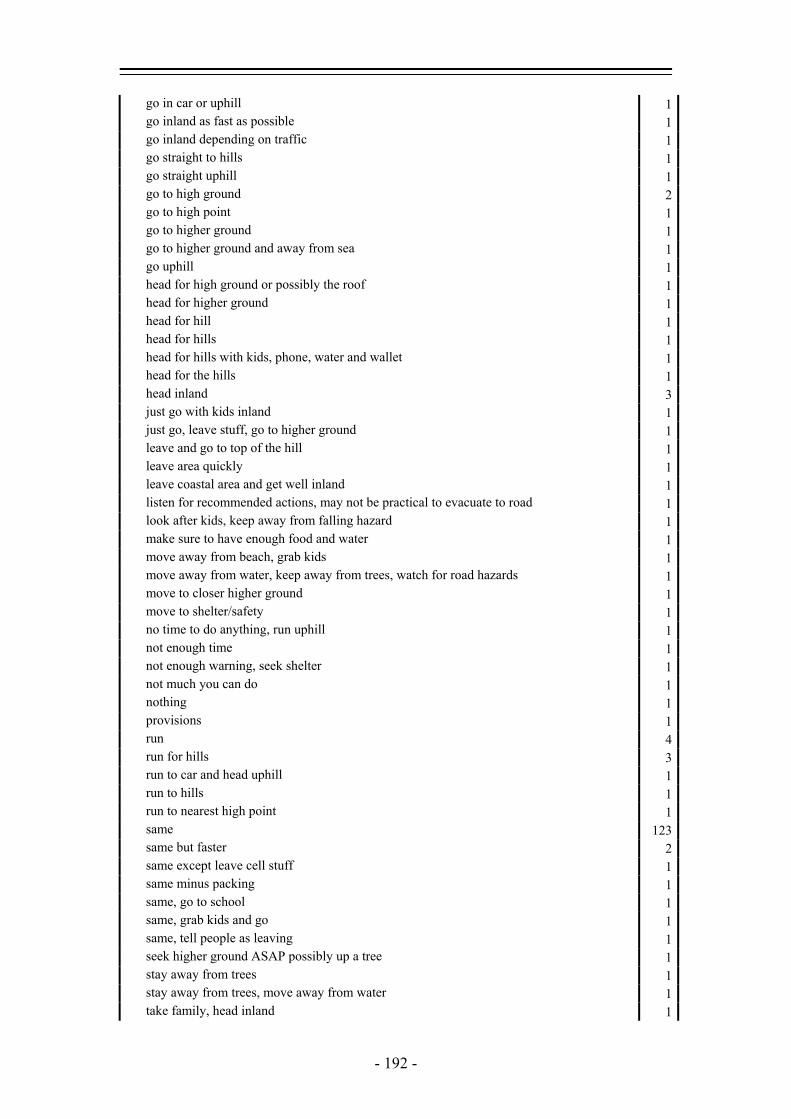
go in car or uphill 1 go inland as fast as possible 1 go inland depending on traffic 1 go straight to hills 1 go straight uphill 1 go to high ground 2 go to high point 1 go to higher ground 1 go to higher ground and away from sea 1 go uphill 1 head for high ground or possibly the roof 1 head for higher ground 1 head for hill 1 head for hills 1 head for hills with kids, phone, water and wallet 1 head for the hills 1 head inland 3 just go with kids inland 1 just go, leave stuff, go to higher ground 1 leave and go to top of the hill 1 leave area quickly 1 leave coastal area and get well inland 1 listen for recommended actions, may not be practical to evacuate to road 1 look after kids, keep away from falling hazard 1 make sure to have enough food and water 1 move away from beach, grab kids 1 move away from water, keep away from trees, watch for road hazards 1 move to closer higher ground 1 move to shelter/safety 1 no time to do anything, run uphill 1 not enough time 1 not enough warning, seek shelter 1 not much you can do 1 nothing 1 provisions 1 run 4 run for hills 3 run to car and head uphill 1 run to hills 1 run to nearest high point 1 same 123 same but faster 2 same except leave cell stuff 1 same minus packing 1 same, go to school 1 same, grab kids and go 1 same, tell people as leaving 1 seek higher ground ASAP possibly up a tree 1 stay away from trees 1 stay away from trees, move away from water 1 take family, head inland 1
- 192 -
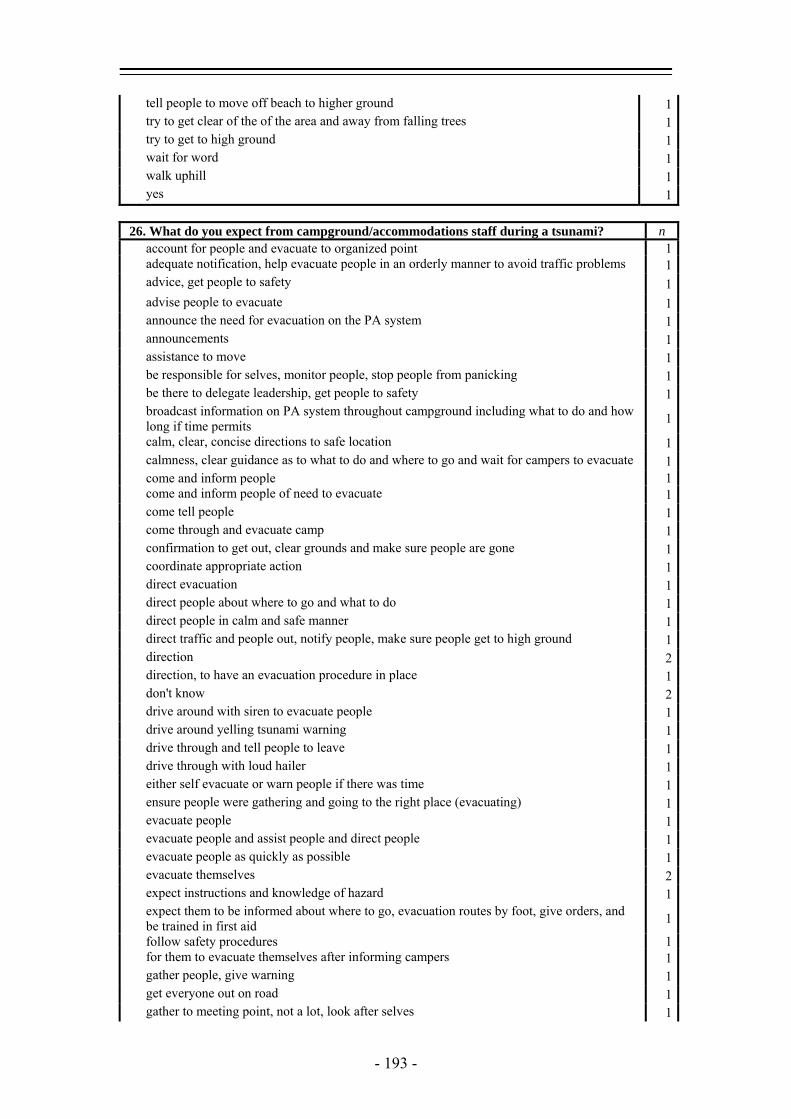
tell people to move off beach to higher ground 1 try to get clear of the of the area and away from falling trees 1 try to get to high ground 1 wait for word 1 walk uphill 1 yes 1
26. What do you expect from campground/accommodations staff during a tsunami? n account for people and evacuate to organized point 1 adequate notification, help evacuate people in an orderly manner to avoid traffic problems 1 advice, get people to safety 1 advise people to evacuate 1 announce the need for evacuation on the PA system 1 announcements 1 assistance to move 1 be responsible for selves, monitor people, stop people from panicking 1 be there to delegate leadership, get people to safety 1 broadcast information on PA system throughout campground including what to do and how
long if time permits 1
calm, clear, concise directions to safe location 1 calmness, clear guidance as to what to do and where to go and wait for campers to evacuate 1 come and inform people 1 come and inform people of need to evacuate 1 come tell people 1 come through and evacuate camp 1 confirmation to get out, clear grounds and make sure people are gone 1 coordinate appropriate action 1 direct evacuation 1 direct people about where to go and what to do 1 direct people in calm and safe manner 1 direct traffic and people out, notify people, make sure people get to high ground 1 direction 2 direction, to have an evacuation procedure in place 1 don't know 2 drive around with siren to evacuate people 1 drive around yelling tsunami warning 1 drive through and tell people to leave 1 drive through with loud hailer 1 either self evacuate or warn people if there was time 1 ensure people were gathering and going to the right place (evacuating) 1 evacuate people 1 evacuate people and assist people and direct people 1 evacuate people as quickly as possible 1 evacuate themselves 2 expect instructions and knowledge of hazard 1 expect them to be informed about where to go, evacuation routes by foot, give orders, and
be trained in first aid 1
follow safety procedures 1 for them to evacuate themselves after informing campers 1 gather people, give warning 1 get everyone out on road 1 gather to meeting point, not a lot, look after selves 1
- 193 -
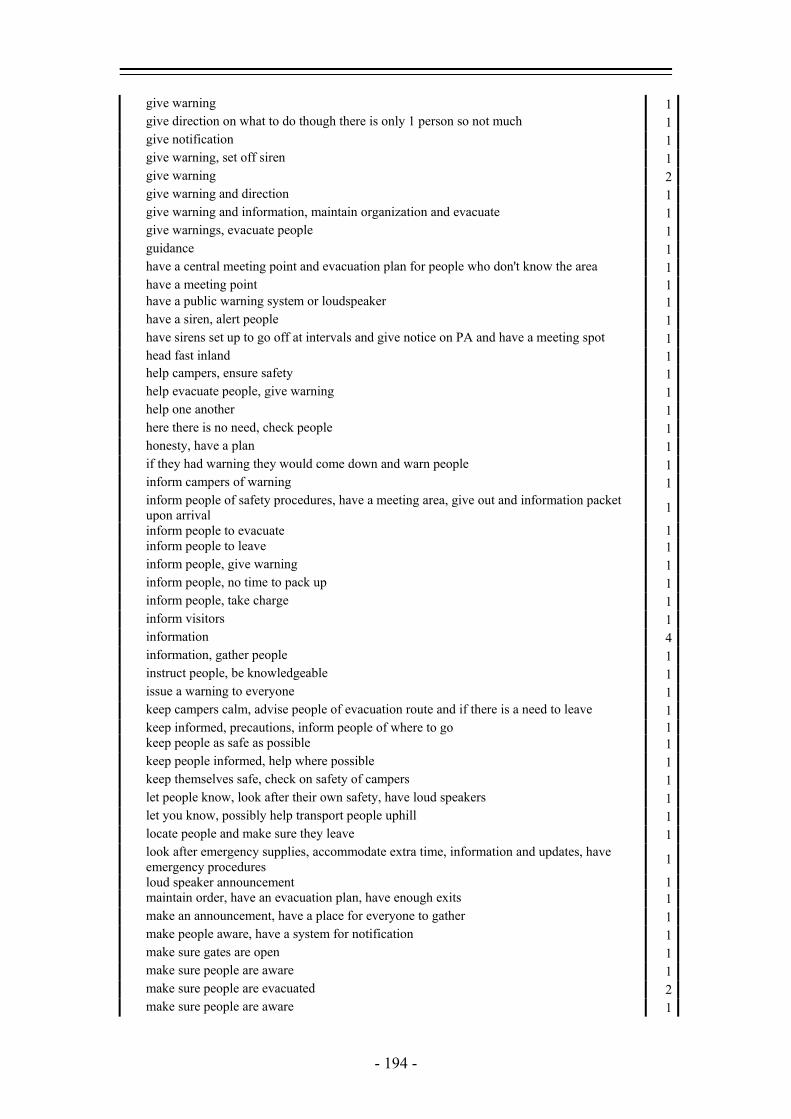
give warning 1 give direction on what to do though there is only 1 person so not much 1 give notification 1 give warning, set off siren 1 give warning 2 give warning and direction 1 give warning and information, maintain organization and evacuate 1 give warnings, evacuate people 1 guidance 1 have a central meeting point and evacuation plan for people who don't know the area 1 have a meeting point 1 have a public warning system or loudspeaker 1 have a siren, alert people 1 have sirens set up to go off at intervals and give notice on PA and have a meeting spot 1 head fast inland 1 help campers, ensure safety 1 help evacuate people, give warning 1 help one another 1 here there is no need, check people 1 honesty, have a plan 1 if they had warning they would come down and warn people 1 inform campers of warning 1 inform people of safety procedures, have a meeting area, give out and information packet
upon arrival 1
inform people to evacuate 1 inform people to leave 1 inform people, give warning 1 inform people, no time to pack up 1 inform people, take charge 1 inform visitors 1 information 4 information, gather people 1 instruct people, be knowledgeable 1 issue a warning to everyone 1 keep campers calm, advise people of evacuation route and if there is a need to leave 1 keep informed, precautions, inform people of where to go 1 keep people as safe as possible 1 keep people informed, help where possible 1 keep themselves safe, check on safety of campers 1 let people know, look after their own safety, have loud speakers 1 let you know, possibly help transport people uphill 1 locate people and make sure they leave 1 look after emergency supplies, accommodate extra time, information and updates, have
emergency procedures 1
loud speaker announcement 1 maintain order, have an evacuation plan, have enough exits 1 make an announcement, have a place for everyone to gather 1 make people aware, have a system for notification 1 make sure gates are open 1 make sure people are aware 1 make sure people are evacuated 2 make sure people are aware 1
- 194 -

make sure that people are evacuated, have staff pass on messages and point out exits 1 not a lot 2 not a lot, fend for individual selves, inform people 1 not a lot, help warn people 1 not a lot, inform people 1 not a lot, set off siren or hailer 1 not a lot, to be involved with local Civil Defence after to locate people 1 not much 1 not much since there's not enough time 1 not much, have a hailer to inform people 1 not much, too few 1 not sure 1 nothing 15 nothing specific, all people would help 1 nothing, direct people to highest point 1 nothing, let people know with loud speaker 1 nothing, maybe alert people but most likely self evacuate 1 nothing, maybe loud speaker system to warn people 1 nothing, might use speaker system 1 nothing, people should know, possibly issue warning 1 nothing, people would have to evacuate themselves 1 nothing, possible warning but not enough time 1 nothing, too far away 2-3 km away 1 nothing, warning 1 nothing, would look after themselves 1 notice to tell people 1 notification 2 notification of tsunami 1 notification, instruction 1 notify about the event 1 notify people and make sure that people could get out 1 notify people to evacuate 1 notify people, have a system for orderly evacuation 1 organize campers and relief, have meeting locations 1 organize evacuation 1 panic like everyone else 1 pass around word 1 patrol and make sure people left, have manned meeting point 1 permanent people working together 1 person to come and give warning 1 run as well for a close one / warn people for a distant one 1 save themselves, warning 1 set off siren 1 set off siren, open facilities to house people after 1 shift people out, organize people 1 siren 1 siren, someone to direct traffic, tell people to leave belongings and go 1 some procedure 1 sound bell/ warning signal 1 stay and ensure safety of campers 1 support 1
- 195 -
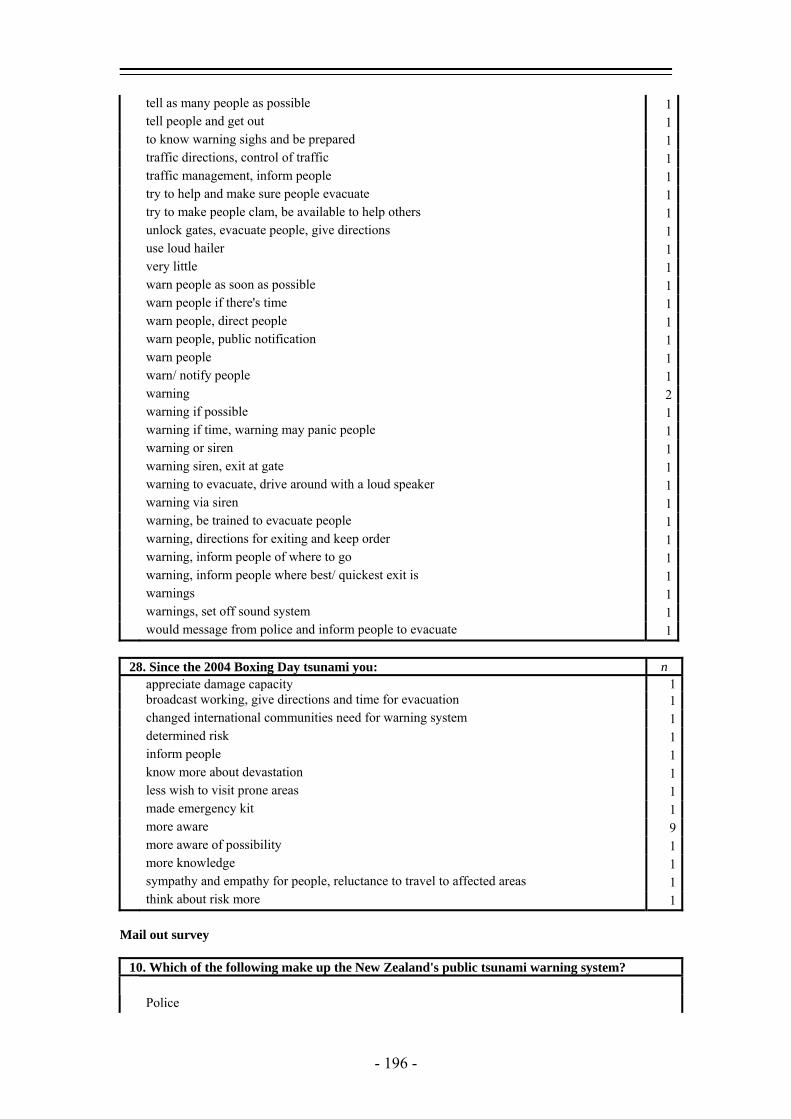
tell as many people as possible 1 tell people and get out 1 to know warning sighs and be prepared 1 traffic directions, control of traffic 1 traffic management, inform people 1 try to help and make sure people evacuate 1 try to make people clam, be available to help others 1 unlock gates, evacuate people, give directions 1 use loud hailer 1 very little 1 warn people as soon as possible 1 warn people if there's time 1 warn people, direct people 1 warn people, public notification 1 warn people 1 warn/ notify people 1 warning 2 warning if possible 1 warning if time, warning may panic people 1 warning or siren 1 warning siren, exit at gate 1 warning to evacuate, drive around with a loud speaker 1 warning via siren 1 warning, be trained to evacuate people 1 warning, directions for exiting and keep order 1 warning, inform people of where to go 1 warning, inform people where best/ quickest exit is 1 warnings 1 warnings, set off sound system 1 would message from police and inform people to evacuate 1
28. Since the 2004 Boxing Day tsunami you: n appreciate damage capacity 1 broadcast working, give directions and time for evacuation 1 changed international communities need for warning system 1 determined risk 1 inform people 1 know more about devastation 1 less wish to visit prone areas 1 made emergency kit 1 more aware 9 more aware of possibility 1 more knowledge 1 sympathy and empathy for people, reluctance to travel to affected areas 1 think about risk more 1
Mail out survey 10. Which of the following make up the New Zealand's public tsunami warning system?
Police
- 196 -
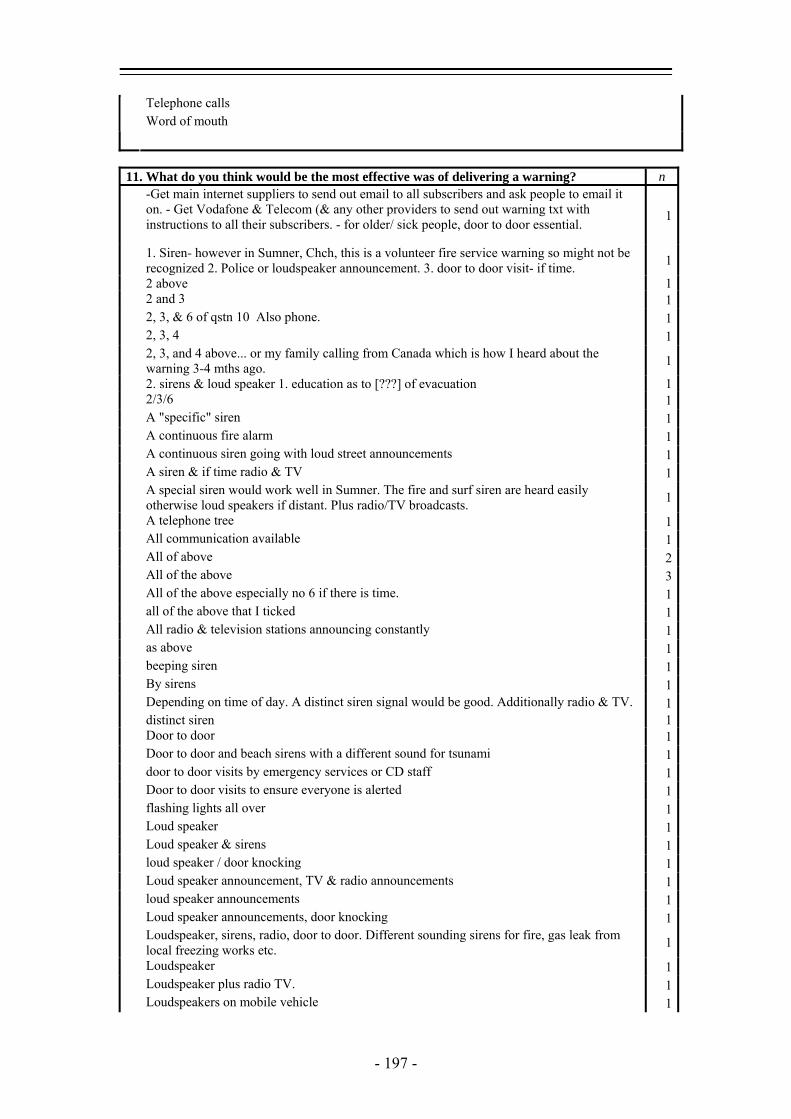
Telephone calls Word of mouth
11. What do you think would be the most effective was of delivering a warning? n -Get main internet suppliers to send out email to all subscribers and ask people to email it
on. - Get Vodafone & Telecom (& any other providers to send out warning txt with instructions to all their subscribers. - for older/ sick people, door to door essential.
1
1. Siren- however in Sumner, Chch, this is a volunteer fire service warning so might not be recognized 2. Police or loudspeaker announcement. 3. door to door visit- if time. 1
2 above 1 2 and 3 1 2, 3, & 6 of qstn 10 Also phone. 1 2, 3, 4 1 2, 3, and 4 above... or my family calling from Canada which is how I heard about the
warning 3-4 mths ago. 1
2. sirens & loud speaker 1. education as to [???] of evacuation 1 2/3/6 1 A "specific" siren 1 A continuous fire alarm 1 A continuous siren going with loud street announcements 1 A siren & if time radio & TV 1 A special siren would work well in Sumner. The fire and surf siren are heard easily
otherwise loud speakers if distant. Plus radio/TV broadcasts. 1
A telephone tree 1 All communication available 1 All of above 2 All of the above 3 All of the above especially no 6 if there is time. 1 all of the above that I ticked 1 All radio & television stations announcing constantly 1 as above 1 beeping siren 1 By sirens 1 Depending on time of day. A distinct siren signal would be good. Additionally radio & TV. 1 distinct siren 1 Door to door 1 Door to door and beach sirens with a different sound for tsunami 1 door to door visits by emergency services or CD staff 1 Door to door visits to ensure everyone is alerted 1 flashing lights all over 1 Loud speaker 1 Loud speaker & sirens 1 loud speaker / door knocking 1 Loud speaker announcement, TV & radio announcements 1 loud speaker announcements 1 Loud speaker announcements, door knocking 1 Loudspeaker, sirens, radio, door to door. Different sounding sirens for fire, gas leak from
local freezing works etc. 1
Loudspeaker 1 Loudspeaker plus radio TV. 1 Loudspeakers on mobile vehicle 1
- 197 -
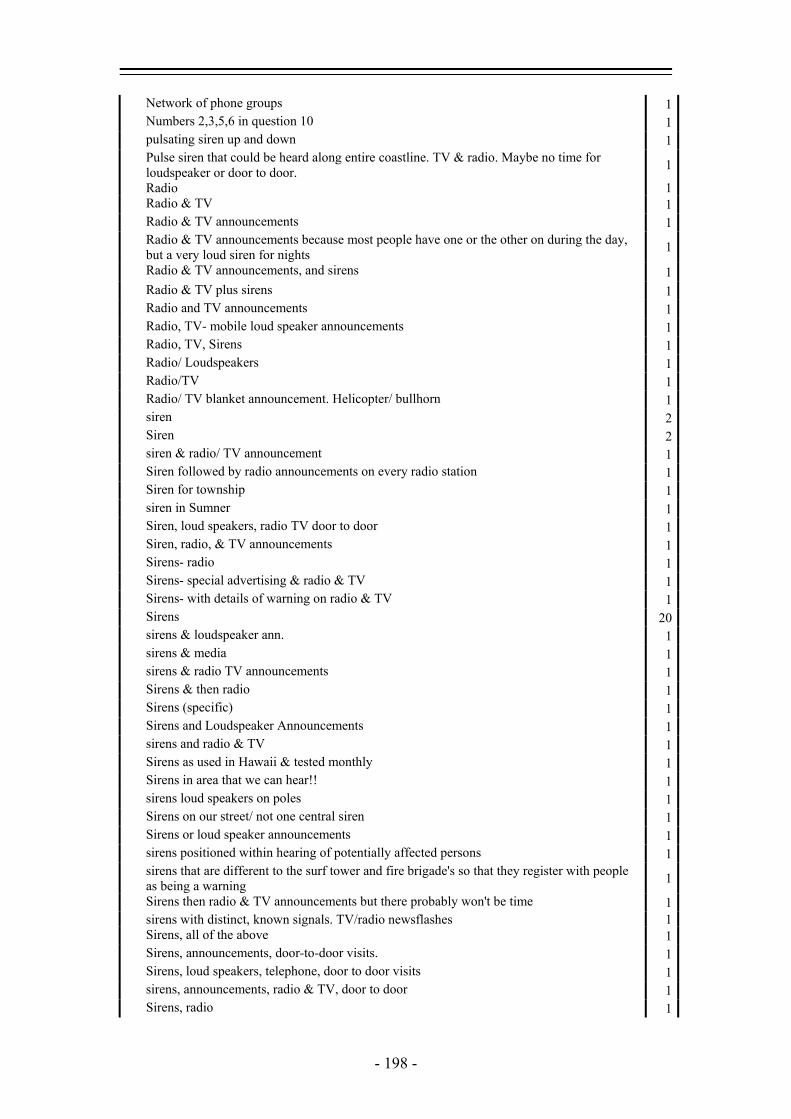
Network of phone groups 1 Numbers 2,3,5,6 in question 10 1 pulsating siren up and down 1 Pulse siren that could be heard along entire coastline. TV & radio. Maybe no time for
loudspeaker or door to door. 1
Radio 1 Radio & TV 1 Radio & TV announcements 1 Radio & TV announcements because most people have one or the other on during the day,
but a very loud siren for nights 1
Radio & TV announcements, and sirens 1 Radio & TV plus sirens 1 Radio and TV announcements 1 Radio, TV- mobile loud speaker announcements 1 Radio, TV, Sirens 1 Radio/ Loudspeakers 1 Radio/TV 1 Radio/ TV blanket announcement. Helicopter/ bullhorn 1 siren 2 Siren 2 siren & radio/ TV announcement 1 Siren followed by radio announcements on every radio station 1 Siren for township 1 siren in Sumner 1 Siren, loud speakers, radio TV door to door 1 Siren, radio, & TV announcements 1 Sirens- radio 1 Sirens- special advertising & radio & TV 1 Sirens- with details of warning on radio & TV 1 Sirens 20 sirens & loudspeaker ann. 1 sirens & media 1 sirens & radio TV announcements 1 Sirens & then radio 1 Sirens (specific) 1 Sirens and Loudspeaker Announcements 1 sirens and radio & TV 1 Sirens as used in Hawaii & tested monthly 1 Sirens in area that we can hear!! 1 sirens loud speakers on poles 1 Sirens on our street/ not one central siren 1 Sirens or loud speaker announcements 1 sirens positioned within hearing of potentially affected persons 1 sirens that are different to the surf tower and fire brigade's so that they register with people
as being a warning 1
Sirens then radio & TV announcements but there probably won't be time 1 sirens with distinct, known signals. TV/radio newsflashes 1 Sirens, all of the above 1 Sirens, announcements, door-to-door visits. 1 Sirens, loud speakers, telephone, door to door visits 1 sirens, announcements, radio & TV, door to door 1 Sirens, radio 1
- 198 -

Sirens, radio, TV 1 Sirens, TXT to mobile, Radio 1 Sirens/ loud speaker 1 Special Civil Defence warning with sirens 1 special siren 1 Special siren that is tested so people know that it sounds different to a fire engine or police 1 Special sound sirens 1 Specific coloured flares at 10 second intervals accompanied by an unusual siren sound-
wirrrr- beep beep beep 1
Text Door to door Phone tree each phone in community calls 2 etc. 1 Text to all mobile users! 1 The above 3 1 The ones I've marked (i.e. 2, 5, 6) above. 1 the quickest & loudest way possible 1 TV announcements, radio announcements, text- mobile phone 1 TV door to door 1 TV, radio 1 TXT MSGS 1 Unique sounding siren. We have two sounding sirens already in Sumner. 1 Unsure as never been trialled 1
12. Who is responsible for issuing tsunami warnings? A combination of all of the above? [Central Government, Regional Council, Local Council, Local
Civil Defence group, Police or Fire Service, NIWA or GNS] Central Civil Defence Headquarters depends if national, regional, or local emergency called First to notice it Hawaii Pacific Tsunami Warning Centre
16. Have you heard or received any information about preparing for tsunami hazards from any of the following? n back of phone book 1 documentary on TV, ads on TV 1 don't remember 1 EQC 1 EQIQ Website 1 Holiday in Hawaii, read literature 1 Local newsletter (Beacon) 1 local newspapers 1 media- community newspaper 1 Media & TV news/ back of phone book 1 newspaper 2 on TV 1 phone book 3 Reading books & newspapers 1 telephone book, civil defence 1 Television 1 Television advertising 1 TV 2 TV programs about tsunami 1
- 199 -
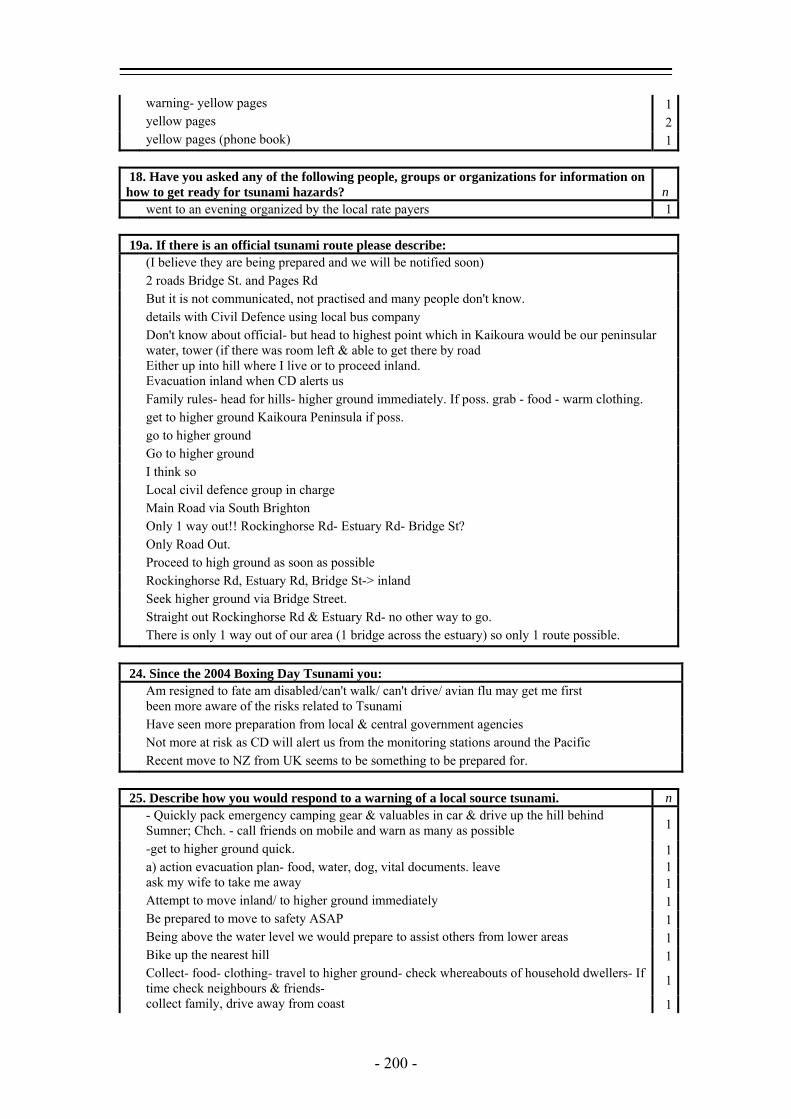
warning- yellow pages 1 yellow pages 2 yellow pages (phone book) 1
18. Have you asked any of the following people, groups or organizations for information on how to get ready for tsunami hazards? n went to an evening organized by the local rate payers 1
19a. If there is an official tsunami route please describe: (I believe they are being prepared and we will be notified soon) 2 roads Bridge St. and Pages Rd But it is not communicated, not practised and many people don't know. details with Civil Defence using local bus company Don't know about official- but head to highest point which in Kaikoura would be our peninsular
water, tower (if there was room left & able to get there by road Either up into hill where I live or to proceed inland. Evacuation inland when CD alerts us Family rules- head for hills- higher ground immediately. If poss. grab - food - warm clothing. get to higher ground Kaikoura Peninsula if poss. go to higher ground Go to higher ground I think so Local civil defence group in charge Main Road via South Brighton Only 1 way out!! Rockinghorse Rd- Estuary Rd- Bridge St? Only Road Out. Proceed to high ground as soon as possible Rockinghorse Rd, Estuary Rd, Bridge St-> inland Seek higher ground via Bridge Street. Straight out Rockinghorse Rd & Estuary Rd- no other way to go. There is only 1 way out of our area (1 bridge across the estuary) so only 1 route possible.
24. Since the 2004 Boxing Day Tsunami you: Am resigned to fate am disabled/can't walk/ can't drive/ avian flu may get me first been more aware of the risks related to Tsunami Have seen more preparation from local & central government agencies Not more at risk as CD will alert us from the monitoring stations around the Pacific Recent move to NZ from UK seems to be something to be prepared for.
25. Describe how you would respond to a warning of a local source tsunami. n - Quickly pack emergency camping gear & valuables in car & drive up the hill behind
Sumner; Chch. - call friends on mobile and warn as many as possible 1
-get to higher ground quick. 1 a) action evacuation plan- food, water, dog, vital documents. leave 1 ask my wife to take me away 1 Attempt to move inland/ to higher ground immediately 1 Be prepared to move to safety ASAP 1 Being above the water level we would prepare to assist others from lower areas 1 Bike up the nearest hill 1 Collect- food- clothing- travel to higher ground- check whereabouts of household dwellers- If
time check neighbours & friends- 1
collect family, drive away from coast 1
- 200 -
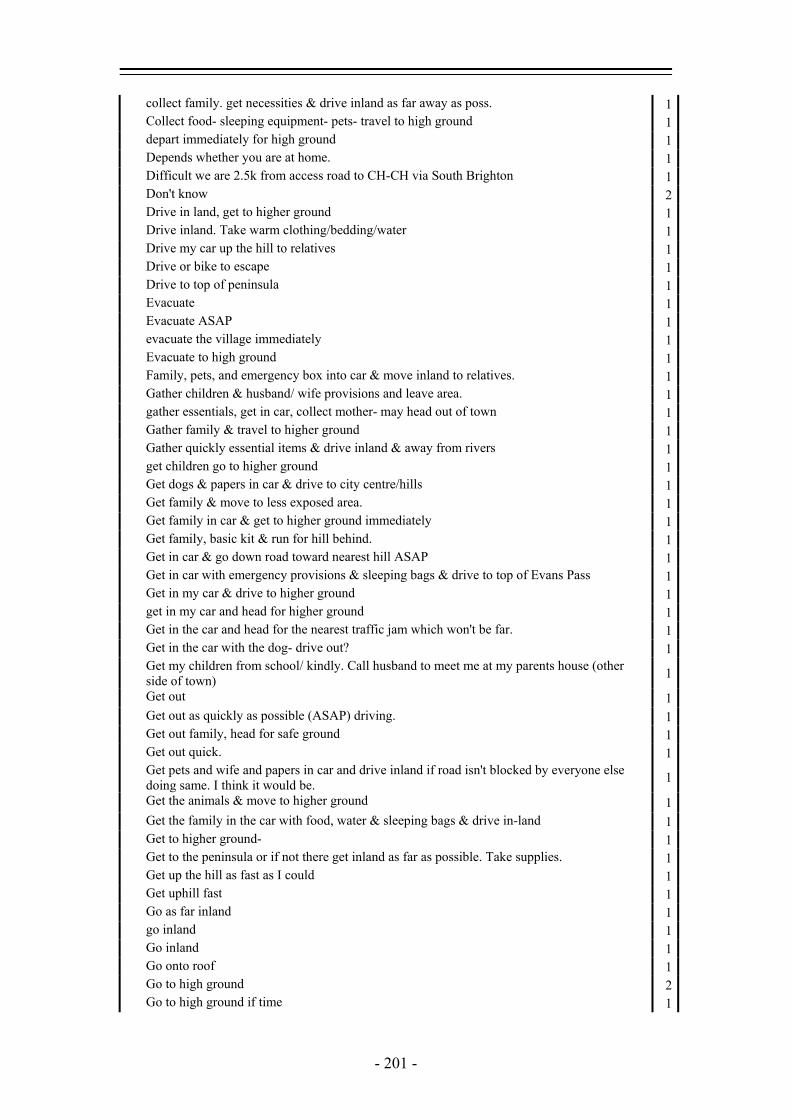
collect family. get necessities & drive inland as far away as poss. 1 Collect food- sleeping equipment- pets- travel to high ground 1 depart immediately for high ground 1 Depends whether you are at home. 1 Difficult we are 2.5k from access road to CH-CH via South Brighton 1 Don't know 2 Drive in land, get to higher ground 1 Drive inland. Take warm clothing/bedding/water 1 Drive my car up the hill to relatives 1 Drive or bike to escape 1 Drive to top of peninsula 1 Evacuate 1 Evacuate ASAP 1 evacuate the village immediately 1 Evacuate to high ground 1 Family, pets, and emergency box into car & move inland to relatives. 1 Gather children & husband/ wife provisions and leave area. 1 gather essentials, get in car, collect mother- may head out of town 1 Gather family & travel to higher ground 1 Gather quickly essential items & drive inland & away from rivers 1 get children go to higher ground 1 Get dogs & papers in car & drive to city centre/hills 1 Get family & move to less exposed area. 1 Get family in car & get to higher ground immediately 1 Get family, basic kit & run for hill behind. 1 Get in car & go down road toward nearest hill ASAP 1 Get in car with emergency provisions & sleeping bags & drive to top of Evans Pass 1 Get in my car & drive to higher ground 1 get in my car and head for higher ground 1 Get in the car and head for the nearest traffic jam which won't be far. 1 Get in the car with the dog- drive out? 1 Get my children from school/ kindly. Call husband to meet me at my parents house (other
side of town) 1
Get out 1 Get out as quickly as possible (ASAP) driving. 1 Get out family, head for safe ground 1 Get out quick. 1 Get pets and wife and papers in car and drive inland if road isn't blocked by everyone else
doing same. I think it would be. 1
Get the animals & move to higher ground 1 Get the family in the car with food, water & sleeping bags & drive in-land 1 Get to higher ground- 1 Get to the peninsula or if not there get inland as far as possible. Take supplies. 1 Get up the hill as fast as I could 1 Get uphill fast 1 Go as far inland 1 go inland 1 Go inland 1 Go onto roof 1 Go to high ground 2 Go to high ground if time 1
- 201 -

Go to high land 1 Go to higher ground - Port Hills 1 Go to higher ground 1 go to higher ground away from coast 1 Go to higher ground immediately 1 Go to higher ground in land 1 go to higher ground unprepared 1 Go to higher ground. 2 Go up a nearby hill. 1 go upstairs 1 Grab essentials (back pack prepared) to a higher ground 1 Grab evac kit, kids & pets. Head for hills. 1 Grab family & drive away. 1 Grab food & water container, some clothes & blankets- first aid kit etc. kept in car. Leave and
drive to higher ground. 1
Grab food etc & head up hill 100m away. 1 Grab my survival kit, ring family nearby & get out 1 Grab our backpack and walk to higher ground. 1 grab photos and drive to hills (or bike if road blocked with cars as is only one road out) Go on
roof if can't get out in time. 1
Grab some food, drink & warm clothes and walk/ run up Scarborough hill 1 Grab supplies, kids, animals and head for the hills 1 Head for high ground 1 Head for higher ground 1 Head for inland mountains, Southern Alps 1 Head for the hills 1 head for the hills take nothing 1 Head inland 1 head to the hills (local) 5-10 mins away 1 head up to hills- 5 mins drive- 20 min walk (with back pack kids etc) 1 I would drive to my son's school to pick him up and then drive inland 1 I would drive up the hill 1 If away from home (house which is on high ground) either return home or to high ground. 1 If the road along the coast was open I might go Kaikoura Peninsular- but I now live INLAND
Rd- the wave might come straight up the Kowhai River- so would drive in front of wave towards Hamner.
1
If warned an hour earlier. I'd pack a bit of food & water & walk up Clifton Hill. 1 Kaikoura Muiri 1 Learn to swim. 1 Leave area immediately. Travel to higher ground by car. 1 Leave ASAP 1 Leave immediately, inland to high ground 1 Leave my home & travel to higher ground- immediately. Check that my neighbours are
aware. 1
Leave the area by car. (inland) Dad would go to the pier as he thinks it would be high enough. 1
Leave the district 1 leave the vicinity and move as far away as possible 1 Listen to radio Climb a tree 1 Listen to radio. 1 Live on a hill 1 make sure warning was correct, then move up to higher ground. Scarborough 1
- 202 -
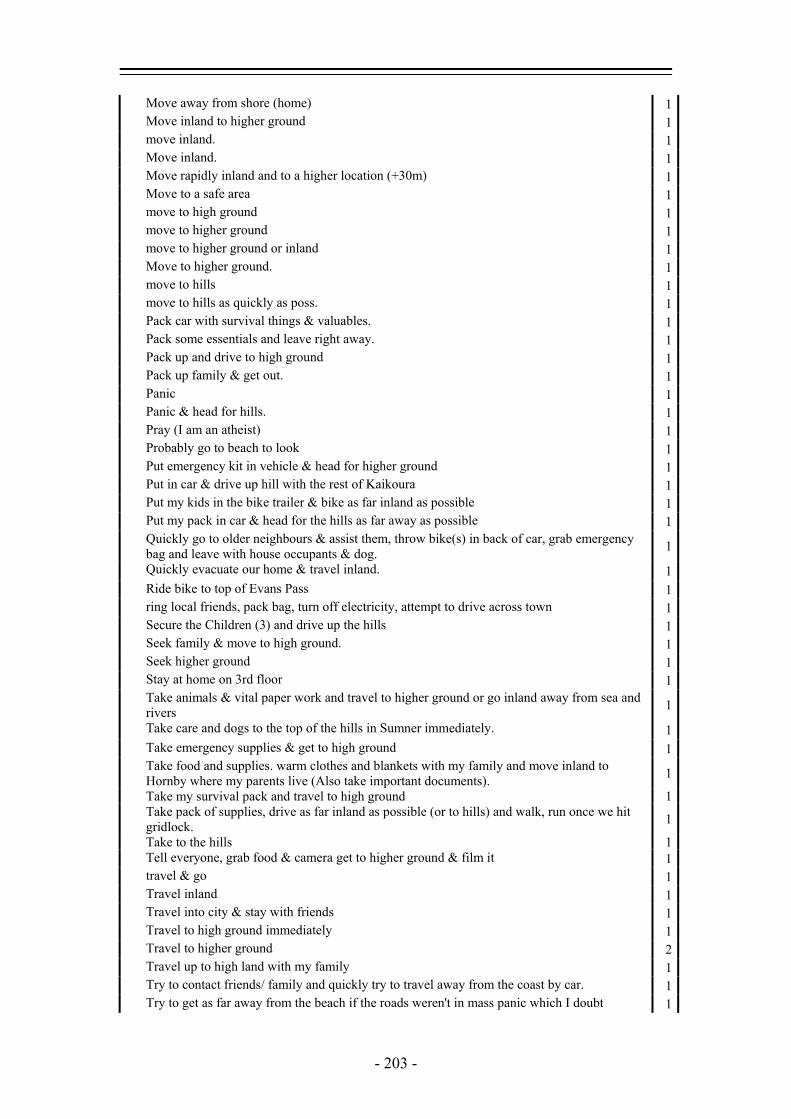
Move away from shore (home) 1 Move inland to higher ground 1 move inland. 1 Move inland. 1 Move rapidly inland and to a higher location (+30m) 1 Move to a safe area 1 move to high ground 1 move to higher ground 1 move to higher ground or inland 1 Move to higher ground. 1 move to hills 1 move to hills as quickly as poss. 1 Pack car with survival things & valuables. 1 Pack some essentials and leave right away. 1 Pack up and drive to high ground 1 Pack up family & get out. 1 Panic 1 Panic & head for hills. 1 Pray (I am an atheist) 1 Probably go to beach to look 1 Put emergency kit in vehicle & head for higher ground 1 Put in car & drive up hill with the rest of Kaikoura 1 Put my kids in the bike trailer & bike as far inland as possible 1 Put my pack in car & head for the hills as far away as possible 1 Quickly go to older neighbours & assist them, throw bike(s) in back of car, grab emergency
bag and leave with house occupants & dog. 1
Quickly evacuate our home & travel inland. 1 Ride bike to top of Evans Pass 1 ring local friends, pack bag, turn off electricity, attempt to drive across town 1 Secure the Children (3) and drive up the hills 1 Seek family & move to high ground. 1 Seek higher ground 1 Stay at home on 3rd floor 1 Take animals & vital paper work and travel to higher ground or go inland away from sea and
rivers 1
Take care and dogs to the top of the hills in Sumner immediately. 1 Take emergency supplies & get to high ground 1 Take food and supplies. warm clothes and blankets with my family and move inland to
Hornby where my parents live (Also take important documents). 1
Take my survival pack and travel to high ground 1 Take pack of supplies, drive as far inland as possible (or to hills) and walk, run once we hit
gridlock. 1
Take to the hills 1 Tell everyone, grab food & camera get to higher ground & film it 1 travel & go 1 Travel inland 1 Travel into city & stay with friends 1 Travel to high ground immediately 1 Travel to higher ground 2 Travel up to high land with my family 1 Try to contact friends/ family and quickly try to travel away from the coast by car. 1 Try to get as far away from the beach if the roads weren't in mass panic which I doubt 1
- 203 -
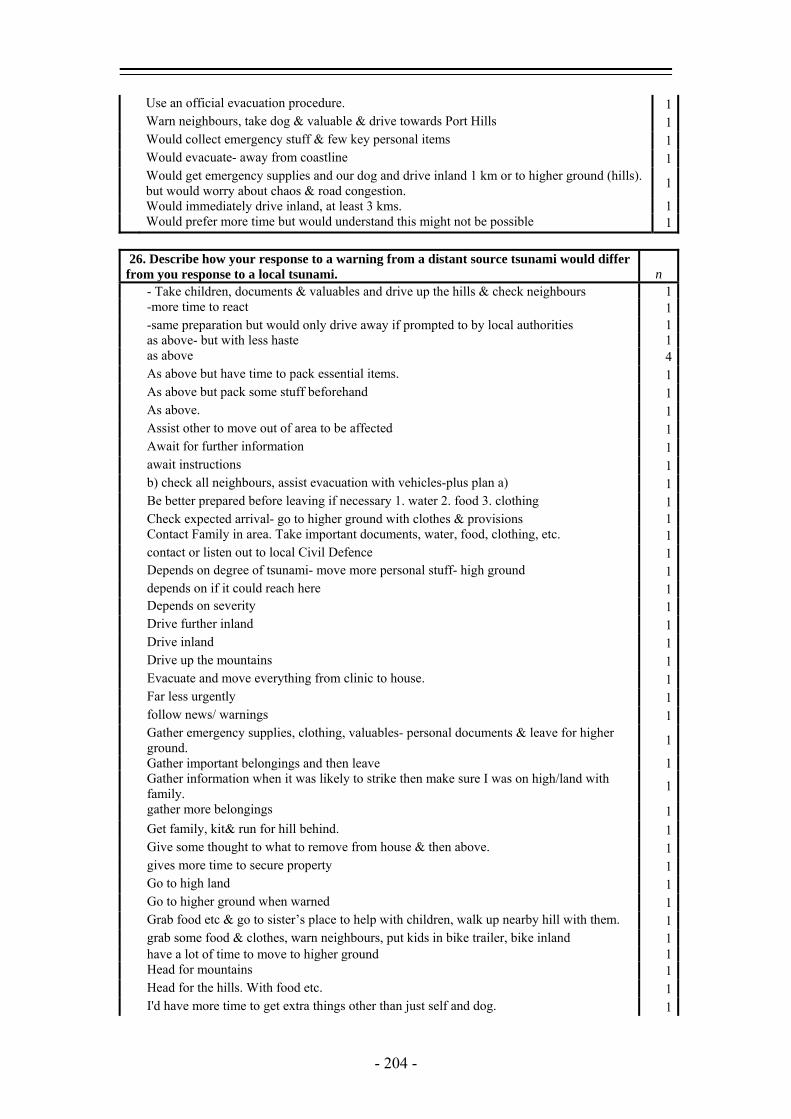
Use an official evacuation procedure. 1 Warn neighbours, take dog & valuable & drive towards Port Hills 1 Would collect emergency stuff & few key personal items 1 Would evacuate- away from coastline 1 Would get emergency supplies and our dog and drive inland 1 km or to higher ground (hills).
but would worry about chaos & road congestion. 1
Would immediately drive inland, at least 3 kms. 1 Would prefer more time but would understand this might not be possible 1
26. Describe how your response to a warning from a distant source tsunami would differ from you response to a local tsunami. n - Take children, documents & valuables and drive up the hills & check neighbours 1 -more time to react 1 -same preparation but would only drive away if prompted to by local authorities 1 as above- but with less haste 1 as above 4 As above but have time to pack essential items. 1 As above but pack some stuff beforehand 1 As above. 1 Assist other to move out of area to be affected 1 Await for further information 1 await instructions 1 b) check all neighbours, assist evacuation with vehicles-plus plan a) 1 Be better prepared before leaving if necessary 1. water 2. food 3. clothing 1 Check expected arrival- go to higher ground with clothes & provisions 1 Contact Family in area. Take important documents, water, food, clothing, etc. 1 contact or listen out to local Civil Defence 1 Depends on degree of tsunami- move more personal stuff- high ground 1 depends on if it could reach here 1 Depends on severity 1 Drive further inland 1 Drive inland 1 Drive up the mountains 1 Evacuate and move everything from clinic to house. 1 Far less urgently 1 follow news/ warnings 1 Gather emergency supplies, clothing, valuables- personal documents & leave for higher
ground. 1
Gather important belongings and then leave 1 Gather information when it was likely to strike then make sure I was on high/land with
family. 1
gather more belongings 1 Get family, kit& run for hill behind. 1 Give some thought to what to remove from house & then above. 1 gives more time to secure property 1 Go to high land 1 Go to higher ground when warned 1 Grab food etc & go to sister’s place to help with children, walk up nearby hill with them. 1 grab some food & clothes, warn neighbours, put kids in bike trailer, bike inland 1 have a lot of time to move to higher ground 1 Head for mountains 1 Head for the hills. With food etc. 1 I'd have more time to get extra things other than just self and dog. 1
- 204 -
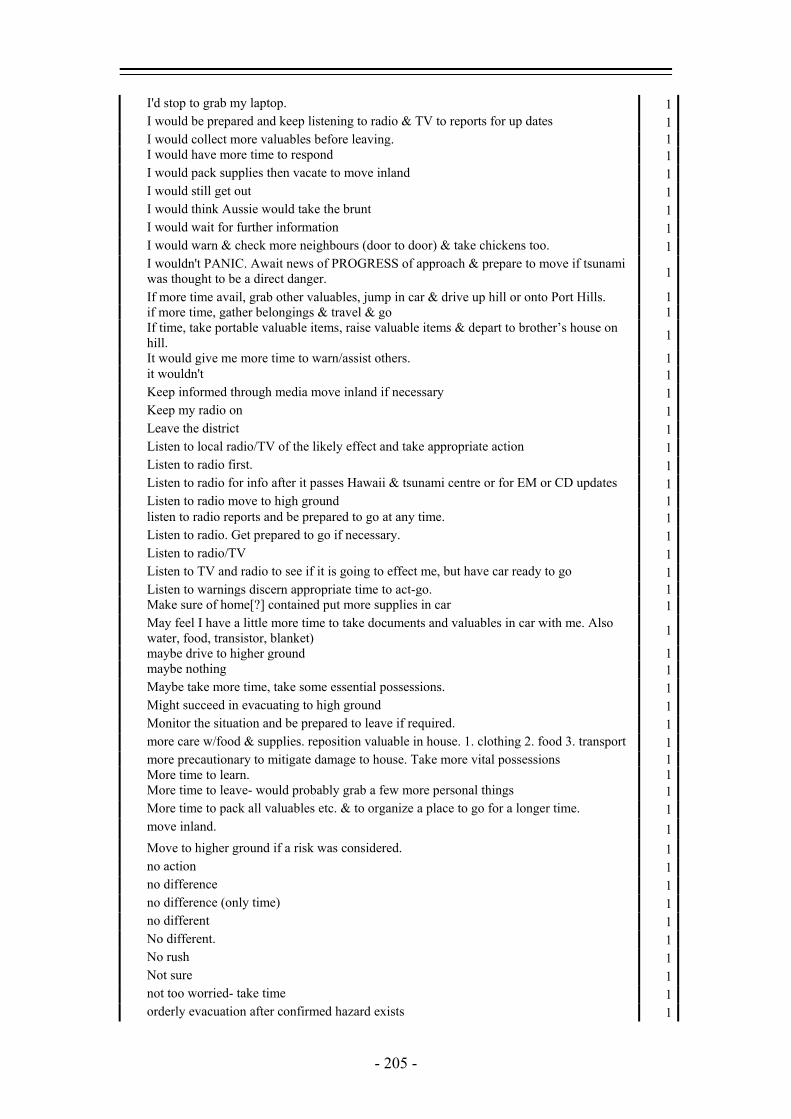
I'd stop to grab my laptop. 1 I would be prepared and keep listening to radio & TV to reports for up dates 1 I would collect more valuables before leaving. 1 I would have more time to respond 1 I would pack supplies then vacate to move inland 1 I would still get out 1 I would think Aussie would take the brunt 1 I would wait for further information 1 I would warn & check more neighbours (door to door) & take chickens too. 1 I wouldn't PANIC. Await news of PROGRESS of approach & prepare to move if tsunami
was thought to be a direct danger. 1
If more time avail, grab other valuables, jump in car & drive up hill or onto Port Hills. 1 if more time, gather belongings & travel & go 1 If time, take portable valuable items, raise valuable items & depart to brother’s house on
hill. 1
It would give me more time to warn/assist others. 1 it wouldn't 1 Keep informed through media move inland if necessary 1 Keep my radio on 1 Leave the district 1 Listen to local radio/TV of the likely effect and take appropriate action 1 Listen to radio first. 1 Listen to radio for info after it passes Hawaii & tsunami centre or for EM or CD updates 1 Listen to radio move to high ground 1 listen to radio reports and be prepared to go at any time. 1 Listen to radio. Get prepared to go if necessary. 1 Listen to radio/TV 1 Listen to TV and radio to see if it is going to effect me, but have car ready to go 1 Listen to warnings discern appropriate time to act-go. 1 Make sure of home[?] contained put more supplies in car 1 May feel I have a little more time to take documents and valuables in car with me. Also
water, food, transistor, blanket) 1
maybe drive to higher ground 1 maybe nothing 1 Maybe take more time, take some essential possessions. 1 Might succeed in evacuating to high ground 1 Monitor the situation and be prepared to leave if required. 1 more care w/food & supplies. reposition valuable in house. 1. clothing 2. food 3. transport 1 more precautionary to mitigate damage to house. Take more vital possessions 1 More time to learn. 1 More time to leave- would probably grab a few more personal things 1 More time to pack all valuables etc. & to organize a place to go for a longer time. 1 move inland. 1 Move to higher ground if a risk was considered. 1 no action 1 no difference 1 no difference (only time) 1 no different 1 No different. 1 No rush 1 Not sure 1 not too worried- take time 1 orderly evacuation after confirmed hazard exists 1
- 205 -
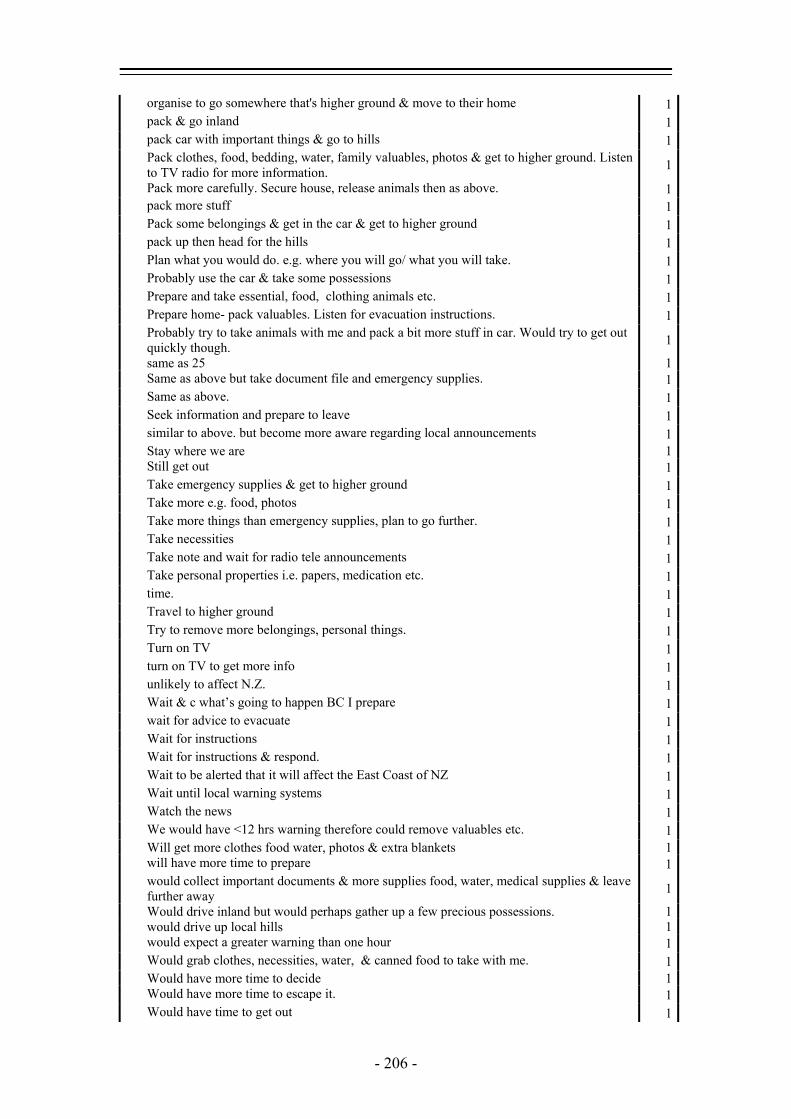
organise to go somewhere that's higher ground & move to their home 1 pack & go inland 1 pack car with important things & go to hills 1 Pack clothes, food, bedding, water, family valuables, photos & get to higher ground. Listen
to TV radio for more information. 1
Pack more carefully. Secure house, release animals then as above. 1 pack more stuff 1 Pack some belongings & get in the car & get to higher ground 1 pack up then head for the hills 1 Plan what you would do. e.g. where you will go/ what you will take. 1 Probably use the car & take some possessions 1 Prepare and take essential, food, clothing animals etc. 1 Prepare home- pack valuables. Listen for evacuation instructions. 1 Probably try to take animals with me and pack a bit more stuff in car. Would try to get out
quickly though. 1
same as 25 1 Same as above but take document file and emergency supplies. 1 Same as above. 1 Seek information and prepare to leave 1 similar to above. but become more aware regarding local announcements 1 Stay where we are 1 Still get out 1 Take emergency supplies & get to higher ground 1 Take more e.g. food, photos 1 Take more things than emergency supplies, plan to go further. 1 Take necessities 1 Take note and wait for radio tele announcements 1 Take personal properties i.e. papers, medication etc. 1 time. 1 Travel to higher ground 1 Try to remove more belongings, personal things. 1 Turn on TV 1 turn on TV to get more info 1 unlikely to affect N.Z. 1 Wait & c what’s going to happen BC I prepare 1 wait for advice to evacuate 1 Wait for instructions 1 Wait for instructions & respond. 1 Wait to be alerted that it will affect the East Coast of NZ 1 Wait until local warning systems 1 Watch the news 1 We would have <12 hrs warning therefore could remove valuables etc. 1 Will get more clothes food water, photos & extra blankets 1 will have more time to prepare 1 would collect important documents & more supplies food, water, medical supplies & leave
further away 1
Would drive inland but would perhaps gather up a few precious possessions. 1 would drive up local hills 1 would expect a greater warning than one hour 1 Would grab clothes, necessities, water, & canned food to take with me. 1 Would have more time to decide 1 Would have more time to escape it. 1 Would have time to get out 1
- 206 -
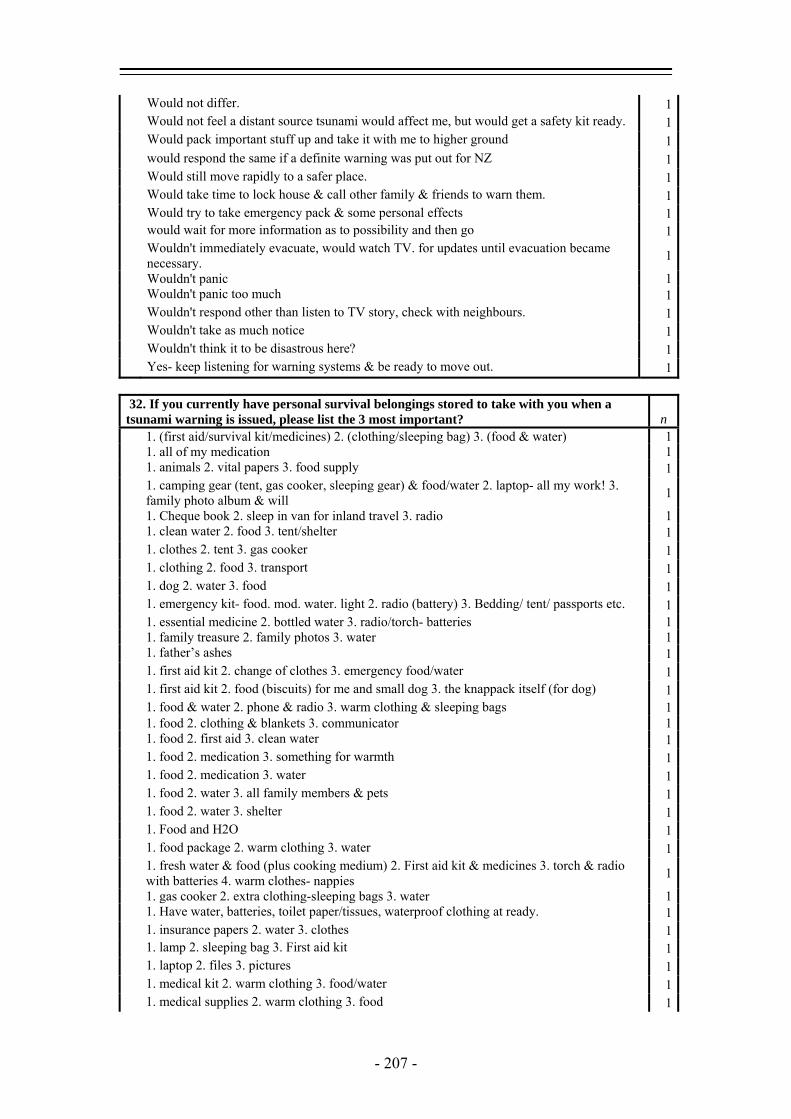
Would not differ. 1 Would not feel a distant source tsunami would affect me, but would get a safety kit ready. 1 Would pack important stuff up and take it with me to higher ground 1 would respond the same if a definite warning was put out for NZ 1 Would still move rapidly to a safer place. 1 Would take time to lock house & call other family & friends to warn them. 1 Would try to take emergency pack & some personal effects 1 would wait for more information as to possibility and then go 1 Wouldn't immediately evacuate, would watch TV. for updates until evacuation became
necessary. 1
Wouldn't panic 1 Wouldn't panic too much 1 Wouldn't respond other than listen to TV story, check with neighbours. 1 Wouldn't take as much notice 1 Wouldn't think it to be disastrous here? 1 Yes- keep listening for warning systems & be ready to move out. 1
32. If you currently have personal survival belongings stored to take with you when a tsunami warning is issued, please list the 3 most important? n 1. (first aid/survival kit/medicines) 2. (clothing/sleeping bag) 3. (food & water) 1 1. all of my medication 1 1. animals 2. vital papers 3. food supply 1 1. camping gear (tent, gas cooker, sleeping gear) & food/water 2. laptop- all my work! 3.
family photo album & will 1
1. Cheque book 2. sleep in van for inland travel 3. radio 1 1. clean water 2. food 3. tent/shelter 1 1. clothes 2. tent 3. gas cooker 1 1. clothing 2. food 3. transport 1 1. dog 2. water 3. food 1 1. emergency kit- food. mod. water. light 2. radio (battery) 3. Bedding/ tent/ passports etc. 1 1. essential medicine 2. bottled water 3. radio/torch- batteries 1 1. family treasure 2. family photos 3. water 1 1. father’s ashes 1 1. first aid kit 2. change of clothes 3. emergency food/water 1 1. first aid kit 2. food (biscuits) for me and small dog 3. the knappack itself (for dog) 1 1. food & water 2. phone & radio 3. warm clothing & sleeping bags 1 1. food 2. clothing & blankets 3. communicator 1 1. food 2. first aid 3. clean water 1 1. food 2. medication 3. something for warmth 1 1. food 2. medication 3. water 1 1. food 2. water 3. all family members & pets 1 1. food 2. water 3. shelter 1 1. Food and H2O 1 1. food package 2. warm clothing 3. water 1 1. fresh water & food (plus cooking medium) 2. First aid kit & medicines 3. torch & radio
with batteries 4. warm clothes- nappies 1
1. gas cooker 2. extra clothing-sleeping bags 3. water 1 1. Have water, batteries, toilet paper/tissues, waterproof clothing at ready. 1 1. insurance papers 2. water 3. clothes 1 1. lamp 2. sleeping bag 3. First aid kit 1 1. laptop 2. files 3. pictures 1 1. medical kit 2. warm clothing 3. food/water 1 1. medical supplies 2. warm clothing 3. food 1
- 207 -

1. medication 1 1. medication 2. food/ water 3. clothing/ sleeping bags 1 1. medication 2. insurance papers 3. jewellery 1 1. Medication 2. papers e.g. insurance etc. 1 1. medication 2. personal papers 3. food & water 1 1. Medication 2. photos 1 1. medication 2. water 3. food 2 1. medication 2. water 3. warm clothing to wear on evacuation. 1 1. medication 2. wet weather gear 3. food 1 1. medication, 2. papers-ID/ banking/ insurance 3. food &water 1 1. medication/medical records 2. financial/professional records 1 1. medicine 2. clothing 3. radio 1 1. medicine 2. water 3. food 1 1. medicine 2. water 3. warm clothes 1 1. medicines 2. additional clothing 3. passports 1 1. medicines 2. legal papers 3. family mementos 1 1. medicines 2. water 3. food 1 1. mobile phone 2. radio and battery 3. identification 1 1. my dog 2. medication 3. food, drink, supplies 1 1. my wife 2. my pills 3. my wheelchair & walking stick & mobility scooter. 1 1. passports 2. water 3. food 1 1. personal documents 2. food/ water 3. clothing 1 1. photos, 2. medicines, 3. a few clothes 1 1. pills 2. clothes 3. food (tins) 1 1. radio 2. food 3. clothing 1 1. survival kit (water etc) 2. Torch 3. Radio 1 1. The wife 2. the cat 3. me 1 1. tinned food 2. fresh water 3. radio 1 1. torch food water & sleeping bag 1 1. warm clothes & footwear 2. water & food 3. medication & torch 1 1. warm clothes sleeping bag 2. food & gas stove 3. cash & cards 1 1. warm clothing 2. torch 3. water 1 1. water- canned food 2. torch, radio (batteries) 1 1. water & food 2. medication (if needed) & communication (phone) 3. Warm clothing 1 1. water 2. basic food 3. first aid kit & warm dry clothing 1 1. water 2. blankets 3. food 1 1. water 2. canned food 3. blankets 1 1. water 2. clothing 3. food 1 1. water 2. dried food 3. medical box (first aid) 1 1. water 2. first aid 3. beer 1 1. Water 2. first aid kit 3. radio 1 1. water 2. food 2 1. water 2. food & cooking utensils 3. shelter i.e. tent & blankets 1 1. water 2. food 3. blankets 2 1. water 2. food 3. clothes 4 1. water 2. food 3. extra clothes with personal papers 1 1. water 2. food 3. Medical kit 1 1. water 2. food 3. shelter/ blankets/ sleeping bags 1 1. water 2. food 3. shelter/camping gear 1 1. water 2. food 3. sleeping bag & shelter 1 1. water 2. food 3. suitable clothing 1 1. water 2. food 3. warm dry clothing & tent 1
- 208 -

1. water 2. food. 3. first aid kit. 1 1. water 2. medicine 3. important documents 1 1. water 2. money 3. dry clothes 1 1. water 2. non-perishable food 3. medication 1 1. water 2. presc medices 3. food 1 1. water 2. radio & btys 3. warm clothing 1 1. water 2. radio 3. torch 1 1. water 2. survival blankets 3. dried food 1 1. water 2. torch/ batteries 3. radio 1 1. water 2. warm clothing 3. food 1 1. water 2. warm clothing 3. radio 1 1. water 2., food 3. warm jacket or blankets. 1 1. water/ food 2. clothing 3. important Documents 1 1. water 2. food 3. cooker-matches 1 Don't know 1 personal belongings not important 1 water 1
34. Please list the component's of your community's tsunami warning system? n -siren? 1 ? 3 CDEM response, police fire action 1 Civil defence alarms 1 Civil Defence, police, council 1 continuous siren 1 continuous siren for fire etc 1 don't know 6 Don't know of anything. 1 Door to door visits maybe. 1 fire siren 1 fire siren goes off in one long sound, different from normal sound 1 fire/ like guard siren community- e.g. phone calls 1 freezing works siren 1 I do not know!! 1 I don't know what they are. 1 I have no idea! 1 I think the local siren would sound 1 move to higher ground 1 New Brighton & Sumner fire sirens 1 New Brighton fire alarm, police car PA warnings 1 none 2 none worth bothering about. 1 Not aware what exactly is in place but would assume the fire siren would sound and the
radio would give warnings 1
Not sure - siren I think 1 Our problem is the fire alarm & civil defence alarm sound the same (rise & fall siren). 1 Police car sirens 1 Police, radio, siren 1 Radio & TV, fire brigade sirens 1 Radio TV Sirens 1 Radio. Police. Siren, Door to door visits 1 short blasts on fire siren- (our fire alarm is like this also, loud voice hailers 1 siren 3
- 209 -
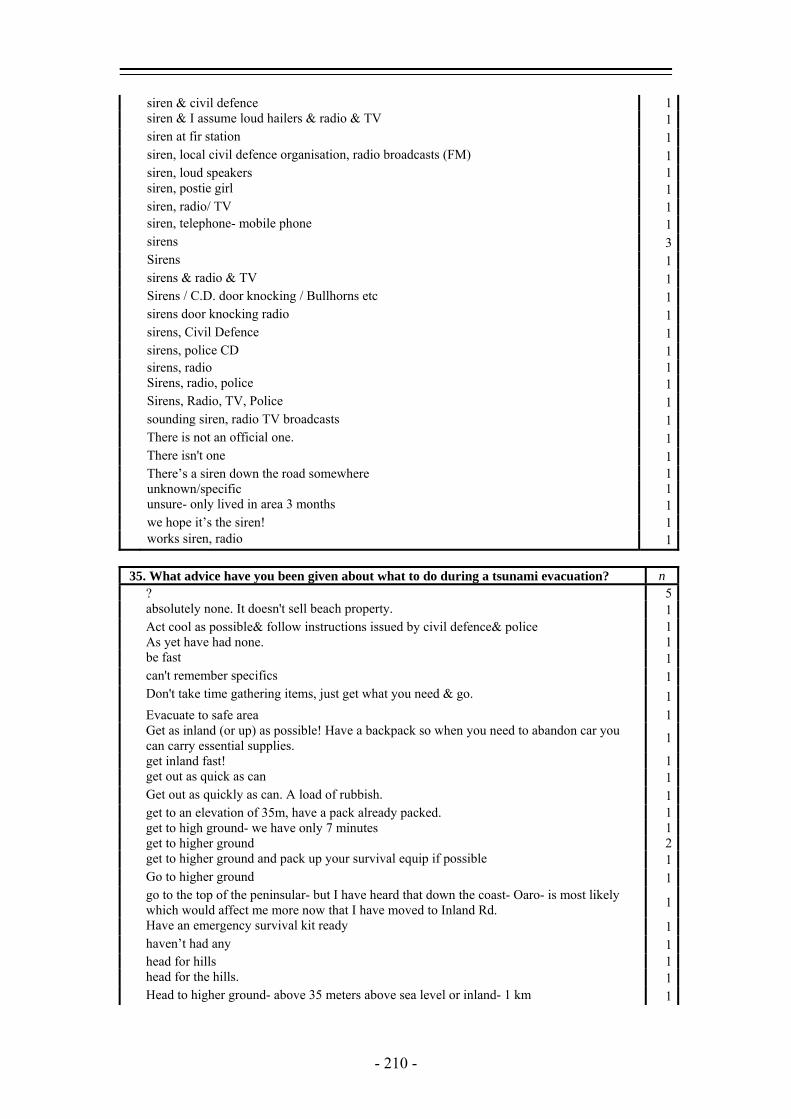
siren & civil defence 1 siren & I assume loud hailers & radio & TV 1 siren at fir station 1 siren, local civil defence organisation, radio broadcasts (FM) 1 siren, loud speakers 1 siren, postie girl 1 siren, radio/ TV 1 siren, telephone- mobile phone 1 sirens 3 Sirens 1 sirens & radio & TV 1 Sirens / C.D. door knocking / Bullhorns etc 1 sirens door knocking radio 1 sirens, Civil Defence 1 sirens, police CD 1 sirens, radio 1 Sirens, radio, police 1 Sirens, Radio, TV, Police 1 sounding siren, radio TV broadcasts 1 There is not an official one. 1 There isn't one 1 There’s a siren down the road somewhere 1 unknown/specific 1 unsure- only lived in area 3 months 1 we hope it’s the siren! 1 works siren, radio 1
35. What advice have you been given about what to do during a tsunami evacuation? n ? 5 absolutely none. It doesn't sell beach property. 1 Act cool as possible& follow instructions issued by civil defence& police 1 As yet have had none. 1 be fast 1 can't remember specifics 1 Don't take time gathering items, just get what you need & go. 1 Evacuate to safe area 1 Get as inland (or up) as possible! Have a backpack so when you need to abandon car you
can carry essential supplies. 1
get inland fast! 1 get out as quick as can 1 Get out as quickly as can. A load of rubbish. 1 get to an elevation of 35m, have a pack already packed. 1 get to high ground- we have only 7 minutes 1 get to higher ground 2 get to higher ground and pack up your survival equip if possible 1 Go to higher ground 1 go to the top of the peninsular- but I have heard that down the coast- Oaro- is most likely
which would affect me more now that I have moved to Inland Rd. 1
Have an emergency survival kit ready 1 haven’t had any 1 head for hills 1 head for the hills. 1 Head to higher ground- above 35 meters above sea level or inland- 1 km 1
- 210 -
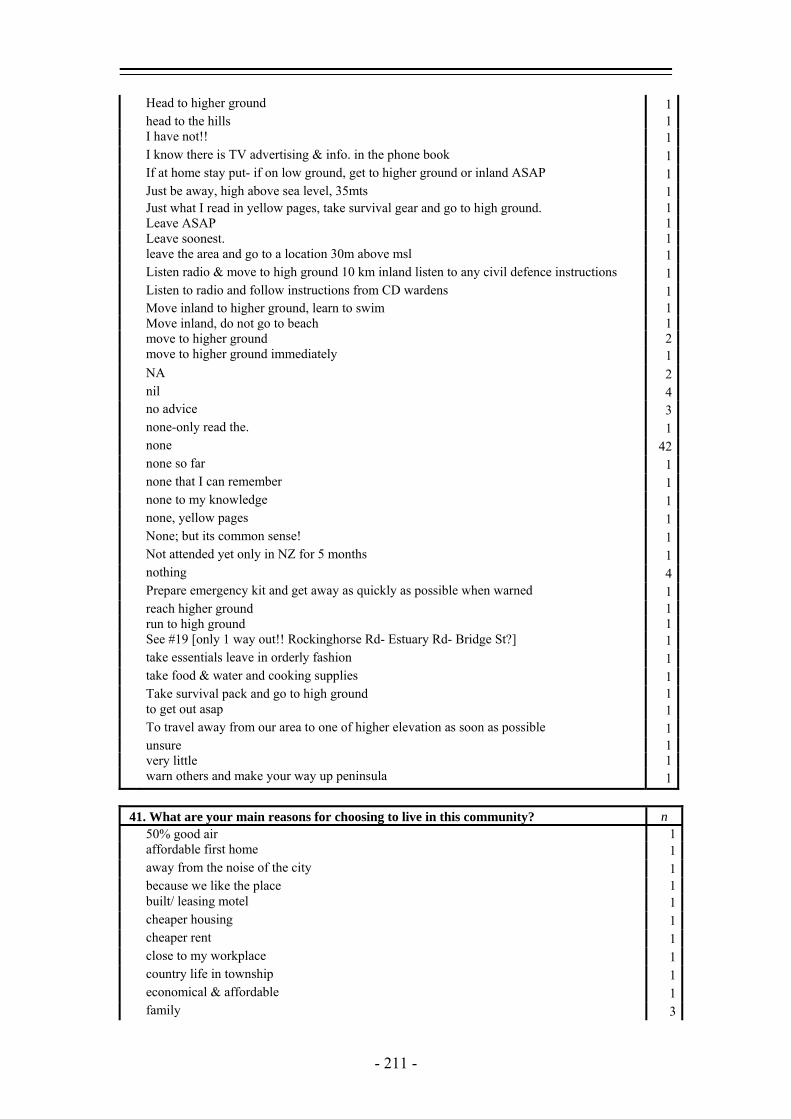
Head to higher ground 1 head to the hills 1 I have not!! 1 I know there is TV advertising & info. in the phone book 1 If at home stay put- if on low ground, get to higher ground or inland ASAP 1 Just be away, high above sea level, 35mts 1 Just what I read in yellow pages, take survival gear and go to high ground. 1 Leave ASAP 1 Leave soonest. 1 leave the area and go to a location 30m above msl 1 Listen radio & move to high ground 10 km inland listen to any civil defence instructions 1 Listen to radio and follow instructions from CD wardens 1 Move inland to higher ground, learn to swim 1 Move inland, do not go to beach 1 move to higher ground 2 move to higher ground immediately 1 NA 2 nil 4 no advice 3 none-only read the. 1 none 42 none so far 1 none that I can remember 1 none to my knowledge 1 none, yellow pages 1 None; but its common sense! 1 Not attended yet only in NZ for 5 months 1 nothing 4 Prepare emergency kit and get away as quickly as possible when warned 1 reach higher ground 1 run to high ground 1 See #19 [only 1 way out!! Rockinghorse Rd- Estuary Rd- Bridge St?] 1 take essentials leave in orderly fashion 1 take food & water and cooking supplies 1 Take survival pack and go to high ground 1 to get out asap 1 To travel away from our area to one of higher elevation as soon as possible 1 unsure 1 very little 1 warn others and make your way up peninsula 1
41. What are your main reasons for choosing to live in this community? n 50% good air 1 affordable first home 1 away from the noise of the city 1 because we like the place 1 built/ leasing motel 1 cheaper housing 1 cheaper rent 1 close to my workplace 1 country life in township 1 economical & affordable 1 family 3
- 211 -
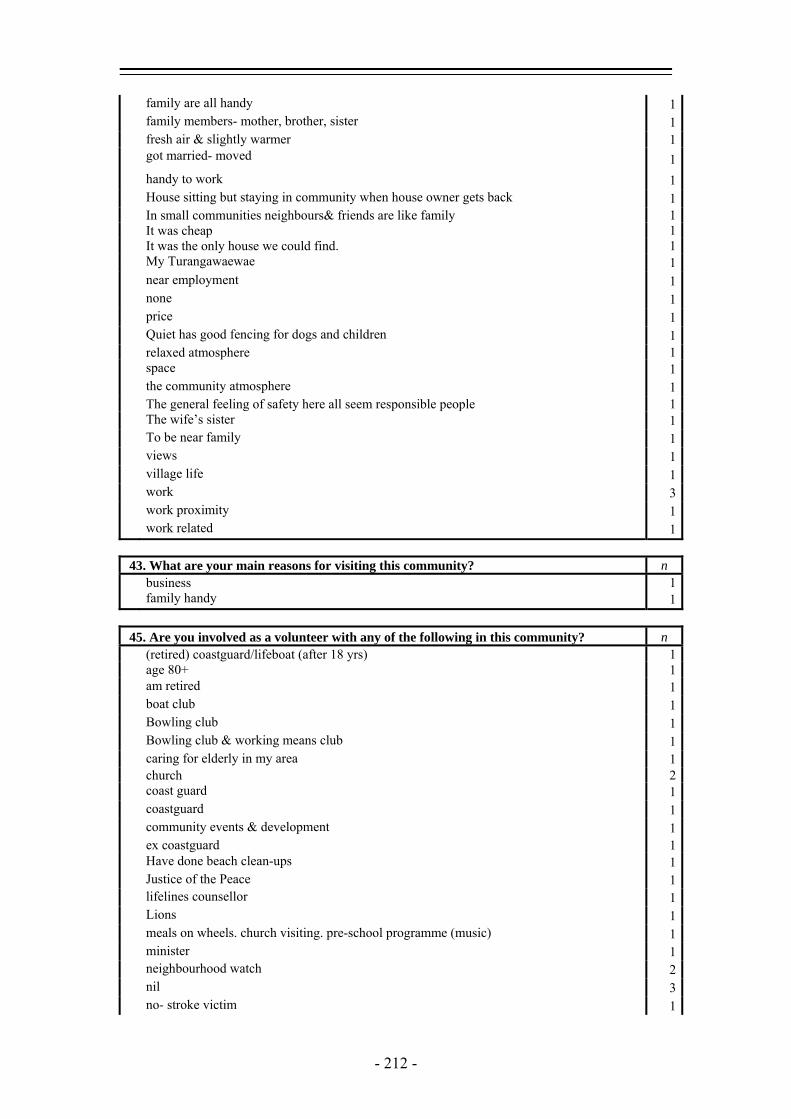
family are all handy 1 family members- mother, brother, sister 1 fresh air & slightly warmer 1 got married- moved 1 handy to work 1 House sitting but staying in community when house owner gets back 1 In small communities neighbours& friends are like family 1 It was cheap 1 It was the only house we could find. 1 My Turangawaewae 1 near employment 1 none 1 price 1 Quiet has good fencing for dogs and children 1 relaxed atmosphere 1 space 1 the community atmosphere 1 The general feeling of safety here all seem responsible people 1 The wife’s sister 1 To be near family 1 views 1 village life 1 work 3 work proximity 1 work related 1
43. What are your main reasons for visiting this community? n business 1 family handy 1
45. Are you involved as a volunteer with any of the following in this community? n (retired) coastguard/lifeboat (after 18 yrs) 1 age 80+ 1 am retired 1 boat club 1 Bowling club 1 Bowling club & working means club 1 caring for elderly in my area 1 church 2 coast guard 1 coastguard 1 community events & development 1 ex coastguard 1 Have done beach clean-ups 1 Justice of the Peace 1 lifelines counsellor 1 Lions 1 meals on wheels. church visiting. pre-school programme (music) 1 minister 1 neighbourhood watch 2 nil 3 no- stroke victim 1
- 212 -

no 6 not now 1 play centre 1 previously 3 [search and rescue] 1 PTA, kindy etc. 1 Residents assoc. executive committee 1 retire 1 rugby club 1 school 1 Takahanga Marae 1 Tennis club 1 too old!- 80yrs 1 victim support 1 was St Johns 1 weekly rubbish collection after all the careless people each weekend 1
48. If you are visiting this community where is your usual place of residence? Avonhead, Christchurch Christchurch, Sumner Paton's Rock, Takaka Golden Bay
51. Which best describes the situation you are living in now? alone but family nearby Alone, but have partner & family children every weekend couple NZ Kiwi retire/ with married children in the same city self plus wife with daughter staying with me with partner
52. To which ethnic group do you belong? n American 1 Dutch 1 European 1 Kiwi 2 New Zealand European and Maori 1 New Zealander 1 NZer 1 Swede 1
- 213 -