ANALYSIS OF SPATIAL VARIATIONS OF ABUJA LAND USE ...
10
FUTY Journal of the Environment, Vol. 3 No.1, July 2008 © School of Environmental Sciences, Federal University of Technology, Yola – Nigeria.. ISSN 1597-8826 19 ACCURACY ASSESSMENT BETWEEN DIFFERENT IMAGE CLASSIFICATION ALGORITHMS USING LANDSAT-7 OF ABUJA Ojigi M. L. Department of Surveying & Geoinformatics Federal University of Technology, P. M. B. 65, Minna, Nigeria. E-mail: [email protected] , or [email protected] Abstract What image classification does is to assign pixel to a particular land cover and land use type that has the most similar spectral signature. However, there are possibilities that different methods or algorithms of image classification of the same data set could produce appreciable variant results in the sizes, shapes and areas of the classified polygons, which is capable of misleading the user. This study attempts a comparative analysis of four (4) image classification methods (maximum likelihood, parallepiped minimum distance and fisher’s methods) to experiment which method best classifies the 2001 Landsat-7 ETM 345 imagery of part of Abuja Nigeria. The results of the classifications were displayed in qualitative palette of Idrisi-32 and it was discovered that, each cover type which includes, closed canopy vegetation, water, open vegetation, urban built-up, rock outcrops and bare ground were best classified by the maximum likelihood method, followed by the minimum distance method. This conclusion was made based on the prior knowledge of the land cover and land use characteristics in the study area. It is recommended that, this experimental approach be used for different data set from various sensor platforms to provide a standard guideline for specific applications by users in different parts of the world, particularly in Africa where data and the relevant software are often scarce. Key Words: Land Use, Land Cover, Image Classification Algorithms, Analysis, Spatial Variations Introduction Land Use (LU) and Land Cover (LC) recognition and classification of an urban environment or landscape depends largely on three major factors; one of which is a good knowledge of the area of study; which is usually acquired through thorough fieldworks and ground truthing exercises. The development of good training sites and spectral signatures for land use and land cover classification is a product of such knowledge when combined with the applications of the image characteristics such as size, shape, pattern, shadows, tone texture, location and sometimes colors. The second and the third factors are the qualities of the image data and hardware/software available to the user or image analyst. On a general note, CCRS (2003) observed that, the understanding of the relationship between the remote sensing system unit (i.e. energy source, transmission, recording and calibration of electromagnetic radiation) is very vital in the interpretability and effective application of its data products by users and scientists. The mapping of LU and LC for a fast growing city like Abuja in Nigeria is most essential to its planning, land resource management, and urban development control and monitoring. For effective and sustainable land use and cover mapping, Lo, (1986) suggested that the classification scheme should be without ambiguity and easy in defining each use and cover category, which is adopted in this study.
-
Upload
khangminh22 -
Category
Documents
-
view
4 -
download
0
Transcript of ANALYSIS OF SPATIAL VARIATIONS OF ABUJA LAND USE ...

FUTY Journal of the Environment, Vol. 3 No.1, July 2008© School of Environmental Sciences, Federal University of Technology, Yola – Nigeria.. ISSN 1597-8826
19
ACCURACY ASSESSMENT BETWEEN DIFFERENT IMAGE CLASSIFICATION ALGORITHMS USING LANDSAT-7 OF ABUJA
Ojigi M. L.Department of Surveying & Geoinformatics
Federal University of Technology, P. M. B. 65, Minna, Nigeria.E-mail: [email protected], or [email protected]
AbstractWhat image classification does is to assign pixel to a particular land cover and land use type that has the most similar spectral signature. However, there are possibilities that different methods or algorithms of image classification of the same data set could produce appreciable variant results in the sizes, shapes and areas of the classified polygons, which is capable of misleading the user. This study attempts a comparative analysis of four (4) image classification methods (maximum likelihood, parallepiped minimum distance and fisher’s methods) to experiment which method best classifies the 2001 Landsat-7 ETM 345 imagery of part of Abuja Nigeria. The results of the classifications were displayed in qualitative palette of Idrisi-32 and it was discovered that, each cover type which includes, closed canopy vegetation, water, open vegetation, urban built-up, rock outcrops and bare ground were best classified by the maximum likelihood method, followed by the minimum distance method. This conclusion was made based on the prior knowledge of the land cover and land use characteristics in the study area. It is recommended that, this experimental approach be used for different data set from various sensor platforms to provide a standard guideline for specific applications by users in different parts of the world, particularly in Africa where data and the relevant software are often scarce.
Key Words: Land Use, Land Cover, Image Classification Algorithms, Analysis, SpatialVariations
IntroductionLand Use (LU) and Land Cover (LC) recognition and classification of an urban
environment or landscape depends largely on three major factors; one of which is a good knowledge of the area of study; which is usually acquired through thorough fieldworks and ground truthing exercises. The development of good training sites and spectral signatures for land use and land cover classification is a product of such knowledge when combined with the applications of the image characteristics such as size, shape, pattern, shadows, tone texture, location and sometimes colors. The second and the third factors are the qualities of the image data and hardware/software available to the user or image analyst.
On a general note, CCRS (2003) observed that, the understanding of the relationship between the remote sensing system unit (i.e. energy source, transmission, recording and calibration of electromagnetic radiation) is very vital in the interpretability and effective application of its data products by users and scientists.
The mapping of LU and LC for a fast growing city like Abuja in Nigeria is most essential to its planning, land resource management, and urban development control and monitoring. For effective and sustainable land use and cover mapping, Lo, (1986) suggested that the classification scheme should be without ambiguity and easy in defining each use and cover category, which is adopted in this study.

FUTY Journal of the Environment, Vol. 3 No.1, July 2008© School of Environmental Sciences, Federal University of Technology, Yola – Nigeria.. ISSN 1597-8826
20
Background of the Study AreaThe Federal Capital City (FCC), Abuja (the city centre) was designed and structured
into four Phases (I-IV) of developments, and located in the northern part of the Federal Capital Territory (FCT) of Nigeria (Fig. 1). It became the new administrative capital of Nigeria in February 1976 after Lagos, but the actual development and movement into Abuja started in 1980, after the master plan was completed by International Planning Associates (IPA) in 1979. The entire FCT is located in the centre of the country in the guinea savanna of the middle belt between longitudes 6o 20’E and 7o 33’E of the Greenwich meridian, and with latitudes 8o 30’N and 9o 20’N of the equator and occupies an area of about 8,000 square kilometers.
#
#
#
#
#
#
#
#
#
#
##
#
Suleja -Minn a Rd
Lok
oja
Roa
d
Kad
una
Ro a
d
Keffi RoadGwagwalada
Gomani
Kwali
Kuje
Zuba
Sukuku
Rubochi
Abaji
Karshi
Bwari
JabiAbu ja (Aso Rock)
LugbeNA Int. Airport
FCC
FCT
Fctboundary1.shpFccarea.shpAirport.shpFccboundary.shpStateroad.shpAirstrip.shpMajorivers.shp
# Settlements.shp
50000 0 50000 100000 Meters
N
LEGEND
280000
280000
320000
320000
360000
360000
960000 960000
1000000 1000000
1040000 1040000
(Source: Author's Research, 2005)
Figure 1: The Federal Capital Territory and City (FCT & FCC) Abuja, Nigeria.
The beauty of the FCT is in its landscape profiled by rolling hills, isolated highlands and gaps with low dissected plains (NTDC, 1997). Topographically, the area is typified by gentle undulating terrain interlaced with riverine depressions and generally; the local relief from hilltops to valley bottom varies around 50m (IPA, 1979). The southwest section contains the flood plain of Gurara Rivers having the lowest elevation of about 61m above the mean sea level. The land rises irregularly from Gurara River eastwards to elevation of about 915m above mean sea level. The study area (FCC) falls within the Gwagwa plains with terrain elevation ranging between 305m in the west to 610m in the east, (Ojigi, 2005). The soil structure of the area is thin with texture generally stony to gravelly sand with smaller occurrences of loam.
From 1980 to date, the changes in urban land use(s) and surface cover has been on the increase due to massive social, economic and construction activities in the designated areas of the FCC.
Statement of Research ProblemDifferent methods of image classification of the same set of data could produce
appreciable variant results in the sizes, shapes and areas of the classified LU and LC types, which is capable of misleading data users and application scientists. As a result of this, an experimental approach for different data set from various sensor platforms is necessary to provide a personal standard guideline and interpretability model for specific applications by users in different parts of the world, particularly in Africa, where data and the relevant software are often scarce.

FUTY Journal of the Environment, Vol. 3 No.1, July 2008© School of Environmental Sciences, Federal University of Technology, Yola – Nigeria.. ISSN 1597-8826
21
Aim and ObjectivesThe aim of the study is to carry out the spatial variation analysis of Abuja land use and
cover types from different classification algorithms in order to establish which method produces the most probable result.The Objectives of the study include:
a. To carry out detailed fieldwork and ground truthing of the site for confirmation and effective validation of the prevailing land use(s) and cover types, to be used for the development of the training sites and spectral signatures.
b. To adopt four (4) supervised classification algorithms namely; maximum likelihood, parrallepiped, minimum distance and fisher’s classifiers for the land use and cover types.
c. To carry out a comparative spatial analysis of the four classification algorithms and display findings.
d. To asses the accuracy of the classifications.
Scope of StudyThe effective area under study is the northern part of the Federal Capital City (FCC),
Abuja. Only land use and cover classifications are considered in the study and the dataset is limited to one epoch image data (2001) and of one sensor platform (Landsat-7 ETM 345). This is aimed at factoring out the inequalities that may result in the classifications of multi-source data due to variable spatial resolution (pixel sizes). The study is trying to explore the low variability nature of the land use and cover types in the area of study to assess and establish the best classification algorithm for the area. The effective coverage area of the image in figure 2 is about 11,340 hectares.
Justification of StudyEastman (2001) referred to classification as perhaps the most important aspect of
Image Processing and Geographic Information System (GIS); hence this study sees it adequate for a critical study.
On the other hand, the reflectance values of the spectral signatures in the imagery overlaps to varying degrees across the three bands of Landsat-7 ETM 345; which is a source of spectral confusion between cover types or land use classes. This spectral confusion will be more terrible if the land use and cover variability in an area is higher, resulting in classification ambiguities and inaccuracies. This simply means that, suitable classification method(s) for a particular area is largely a function of the land use and cover variability; hence it could be said that no particular algorithm is ‘all-perfect’ for all applications. Therefore, it is scientifically important and justifiable to verify the level at which the software system develops a statistical characterization of the reflectance or assignment of pixels for each cover types and land use in order to establish a practical basis for the algorithm(s) that best solves our problems.
Brief Review of Related StudyIn order to prepare the LU map of the old USSR, Snyder (1981) used Landsat MSS
imagery, in which the black and white positive prints of bands 5 and 7 of image were used in resolving some LU ambiguities. Band 7 (0.8-1.1µm) helped to determine the wetland coverage area and water bodies, while band 5 revealed landscape elements such as woodlands, cropland, grassland, built-up areas, and linear features.
The LC changes along the lower reaches of river Gongola, northeast Nigeria was assessed by Tukur et al, (2002) using 1976 Landsat MSS and SPOT-XS 1994 data. Supervised classification was adopted using maximum likelihood technique and the study

FUTY Journal of the Environment, Vol. 3 No.1, July 2008© School of Environmental Sciences, Federal University of Technology, Yola – Nigeria.. ISSN 1597-8826
22
revealed that, between 1976 and 1994, the LU and LC such as bare surfaces, cultivated and grazed fields, wood and shrub vegetations were on the increase, while marshy areas and storm channel had reduced.
Van der meer et al, (2002) used Landsat ETM+ images combined with fieldwork and ground truthing to estimate the acreage infested with Imperata Cylindrica and Stiga in the moist savanna of Nigeria. The spectral signatures of Imperata and other LC types assisted in the classification of the LU/LC types in the area.
ERS SAR and Landsat ETM images were used by Okhimamhe, (2002) in which maximum likelihood classification (MLC), Normalized differences vegetation indices (NDVI) and Interferometric Land Use (ILU) techniques were adopted, and the study showed that ILU and NDVI images could be used to measure the accuracy of the MLC for woody vegetation cover
The characterization of Lokoli Swampy Forest dynamics in Benin Republic was demonstrated by Toko and Adomou (2002), using Landsat-5 image of 1986 and SPOT (Pan) of 1990 image data.
Methodology of ResearchThe methodology of research is principally by remote sensing data collection, field
validation and ground truthing and image processing.
Data Collection Mode and SourceThe data collected for the study includes, 2001 Landsat-7 ETM 345 image of the study
area (Source; Gilruth etal, 2002), the base map (scale 1:10,000) of the area obtained from the survey department, Federal Capital Development Authority, Abuja, and the rectangular grid coordinates (Easting (x) and Northing (y)) of some strategic topographical locations and features in the study area..
Figure 2: 2001 Landsat-7 ETM345 of Northern Part of FCC, Abuja Nigeria (Source: Gilruth et al, 2002).
The coordinates were acquired in a period of two weeks through the use of a Garmin-76 Handheld GPS instrument. Vehicles and motor cycles were used to facilitate mobility in and around the study area

FUTY Journal of the Environment, Vol. 3 No.1, July 2008© School of Environmental Sciences, Federal University of Technology, Yola – Nigeria.. ISSN 1597-8826
23
Image Enhancement and Geo-referencingThe image data was split in the three bands (red, green and blue) and re-saved as 24-
color bit image in TIF format in order to retain the original values. Each of the bands was geo-referenced using the rectangular grid coordinates (Easting (x) and Northing (y)) of the edges and other verified terrain features (e.g. road junctions, drainage seed points and hill tops) in the image on importation into Idrisi-32 software. The linear stretched (with saturation points) images of the three bands formed the working image data for the process of supervised classification in this study.
Training Site and Spectral Signature DevelopmentThe training site for six land use and cover types was created based on the in-situ
assessment of the site carried out during the fieldwork and ground truthing exercise. The representative land use and cover types in the image which includes, closed canopy vegetation, water, open vegetation, urban built-up, rock outcrops and bare ground were assigned unit integer identifier 1-6 and digitized logically to form the training site. At this point the software is not yet aware of the land use classes or legend, but the identifier integer.
The signature files which contain the statistical information about the reflectance values of the pixels within the training site for each of the six land use and cover types or classes has to be developed. In doing this, the MAKESIG sub-module of the Image Processing/Signature development module of Idrisi-32 was used. Each integer identifier (1-6) was then replaced by the respective land uses and cover types, enabling the software to assign and create them as the classification legend in the next procedure.
Image Classification ProcedureHaving created the signature file, each pixel in the study area now have a land use
and land cover value in each of the three (3) bands of the Landsat-7 ETM Imagery, hence the data is ready for supervised classification.
Four (4) image classification algorithms namely; Maximum Likelihood (MLC), Parallepiped (PC), Minimum Distance (MDC) and Fisher’s Classifier (FC) were carried out on the 2001 Landsat-7 ETM 345 imagery of northern part of the FCC, Abuja, Nigeria using the Image Classification/Hard Classifier module of Idrisi-32 GIS.
Calculation of Land Use and Cover AreasEach classification image map was used as input file name for the computation of the
area using the GIS Analysis Module. Areas in hectares of the six land use and cover types were computed and compared for each map.
Evaluation of Image Classification AccuracyThe graphical inspection of the spectral signatures was carried out on the image, and
the chart of all classes was considered in order to ascertain the image band with the highest spectral confusion. The stratified random option of the SAMPLE Module of Idrisi-32 was used to generate random sets of locations, which were verified on the ground to ascertain the true LU/LC and the value file created using the integer numbers or identifiers. A categorical map image (raster) was created for the true (field verified) classes and compared with the four classification maps using ERRMAT module in order to tabulate the accuracy and error matrix.

FUTY Journal of the Environment, Vol. 3 No.1, July 2008© School of Environmental Sciences, Federal University of Technology, Yola – Nigeria.. ISSN 1597-8826
24
Results and DiscussionSpectral Confusion Analysis
Figure 3 shows some level of spectral confusion between open vegetation and closed canopy vegetation, urban built-up and bare ground in mainly in the green and blue bands of the image.
Figure 3: Image Spectral Signature Comparison Chart
The spectral signatures are clearly separated in the red band of the image, hence the LU/LC are relatively free from serious confusion. There is an intersection of rock outcrops and water in the blue band, but it is more tolerable when compared with other classes in the same band.
Results of the Classifications AlgorithmsThe classified LU/LC maps (figures 4 -7) are displayed in the qualitative color palette
and the spatial variations are conspicuous. Figure 4 is the result of maximum likelihood classification, while figures 5, 6, and 7 are the results of minimum distance, parallelepiped, and fisher’s classifications respectively. Feature identification and validation during the ground truthing/field work; which is an important pre-condition for effective satellite image data classification supports figures 4 and 5 as the best and better representation or results of the LU/LC at the study area respectively (see Table 2).
Figure4: 2001 LU/LC Image Map of Part of FCC, Abuja by MLC
FUTY Journal of the Environment, Vol. 3 No.1, July 2008© School of Environmental Sciences, Federal University of Technology, Yola – Nigeria.. ISSN 1597-8826
25
Figure5: 2001LU/LC Image Map of Part of FCC, Abuja by MDC
Figure 6: 2001 LU/LC Image Map of Part of FCC, Abuja by PC
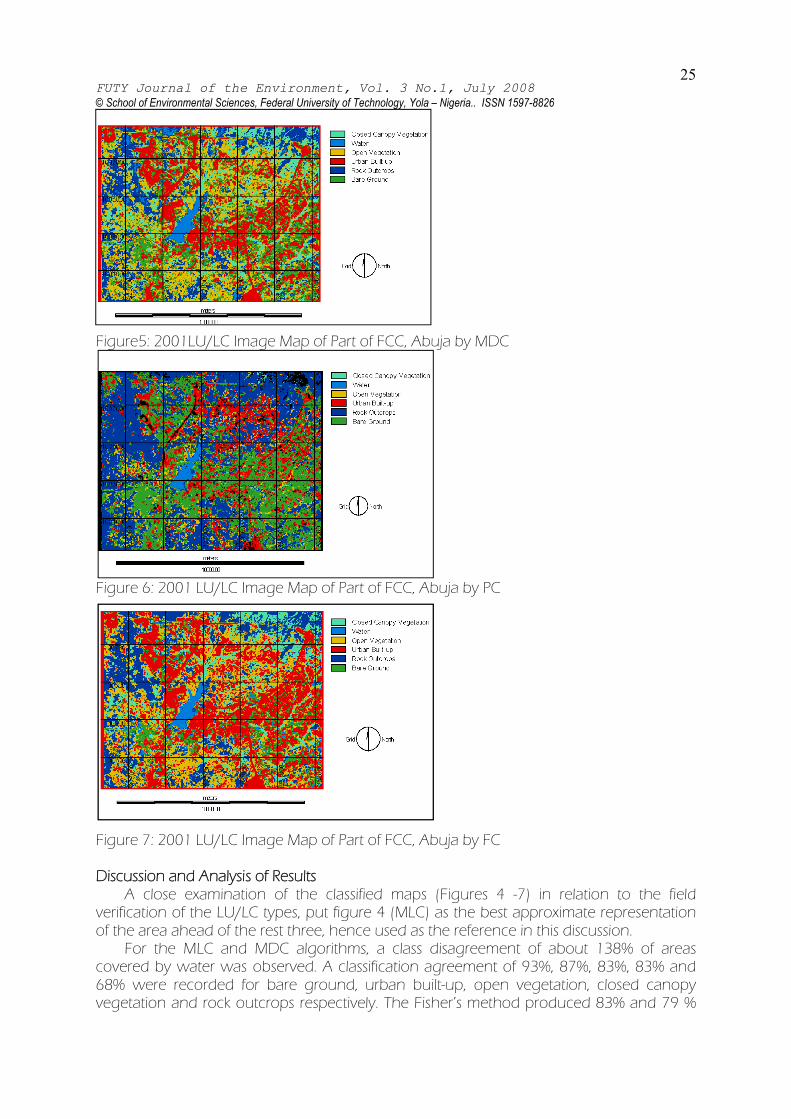
Figure 7: 2001 LU/LC Image Map of Part of FCC, Abuja by FC
Discussion and Analysis of ResultsA close examination of the classified maps (Figures 4 -7) in relation to the field
verification of the LU/LC types, put figure 4 (MLC) as the best approximate representation of the area ahead of the rest three, hence used as the reference in this discussion.
For the MLC and MDC algorithms, a class disagreement of about 138% of areas covered by water was observed. A classification agreement of 93%, 87%, 83%, 83% and 68% were recorded for bare ground, urban built-up, open vegetation, closed canopy vegetation and rock outcrops respectively. The Fisher’s method produced 83% and 79 %

FUTY Journal of the Environment, Vol. 3 No.1, July 2008© School of Environmental Sciences, Federal University of Technology, Yola – Nigeria.. ISSN 1597-8826
26
classification agreement with the MLC for closed canopy vegetation and open vegetation respectively. This result shows a 100% and 97% agreement with the MDC for those two classes. The other LU/LC classes are disagreement within the range of 58% - 121% when compared with the MLC results.
The result from PC varied greatly from those of MLC, MDC, and FC (Table 1). The coverage area classified by the PC is less than that of MLC, MDC and FC, explaining thatsome pixels were left unclassified in the process. The PC for bare ground and closed canopy vegetation are not realistic. This algorithm produced the poorest result in this experiment (Table 2)
The Kappa Index of Agreement is a statistical evidence of the agreement or validation between the category image map or training sites and the image of the area of study. The higher and more uniform the agreement score, the better the classification results. The MLC has the most uniform high scores, while MDC, PC and FC has one and three scores below 40% respectively.

FUTY Journal of the Environment, Vol. 3 No.1, July 2008© School of Environmental Sciences, Federal University of Technology, Yola – Nigeria.. ISSN 1597-8826
27
Table 1: Areas (Hectares) of LU/LC of Part of FCC, Abuja from Classification Algorithms
LU/LC Types
Classification AlgorithmsMLC MD
CPC FC
Closed Canopy Vegetation
1387.6
1184.9
3981.4
1185.8
Water 749.5
315.0
157.2 402.4
Open Vegetation
3294.4
2814.8
987.6 2720.7
Urban Built-up
2551.7
2927.9
1817.6
4034.7
Rock Outcrops
1251.6
1836.6
836.2 2045.0
Bare Ground
2105.1
2260.8
3495.9
951.3
Total (hectares)
11340
11340
11276 11340
(Source: Author’s Research)
Table 2: Classification Accuracy Index of Agreement
LU/LC Types
Classification Algorithms/Kappa Index of Agreement (KIA) %MLC MD
CPC FC
Closed Canopy Vegetation
46.03
46.26
04.98 47.52
Water 74.87
69.52
65.42 72.27
Open Vegetation
68.62
21.80
02.56 14.19
Urban Built-up
47.88
58.56
28.04 65.65
Rock Outcrops
53.70
47.86
79.22 66.03
Bare Ground
79.31
59.39
89.18 52.22
K = 0.0531
0.0530
0.0358
0.0536
(Source: Author’s Research)

FUTY Journal of the Environment, Vol. 3 No.1, July 2008© School of Environmental Sciences, Federal University of Technology, Yola – Nigeria.. ISSN 1597-8826
28
Conclusion This study has shown that maximum likelihood classification (MLC) algorithms
produces best result for urban LU/LC classification of the FCC, Abuja Nigeria using Landsat-7 ETM data. Different satellite image data from other sensors could be experimented in similar way for the same area for a more conclusive analysis on the best algorithm suitable for the most probable LU/LC results.
References
CCRS, (2003) Fundamentals of Remote Sensing.
Canadian Centre for Remote sensing, R/S Tutorial, Publ. Natural Resources, Canada 231pp.
IPA, (1979). Master Plan for Abuja, the New Federal Capital of Nigeria. Inter. Planning Associates (IPA). Pp. 20- 208
Lo, C.P., (1986). Applied Remote Sensing. Publ. by Longman Scientific & Tech., UK, NY Pp. 227-235.
Eastman, R.J. (2001). Guide to GIS and Image Processing Volume.2. Clarke Lab. Clark University Worcester, MA, USA. Pp.57-74.
Gilruth, P., Kalluri, S., Kiebuzinski, A., Bergman, R., (2002).Applications of NASA Earth Observing System Data for Sustainable Development in Africa: Lessons from theSynergy Program. A Paper Presented at the 4th Inter.Conference of AARSE, Abuja 2002 Raytheon, 1616
McCormick Drive Upper Marlboro, MD 20774 USA. Corresponding email: [email protected].
NTDC, (1997). Tourist Attractions in Abuja Destinations Nigerian Tourism Dev. Corporation (NTDC). Pp 1-8
Ojigi, M. L, (2005). Digital Terrain Modeling & Drainage Analysis of the Northern part of Abuja Phase II Development Area, Using Geospatial Techniques. An Unpublished Ph.D. Thesis in Remote Sensing Applications. Federal University of Technology, Minna,Nigeria pp.178.
Snyder, D. R.(1981). Using Landsat Imagery to study Soviet Land use. Journal of Geography 80; 217-23.
Tukur, A. L, Musa, A. A. and Mubi, A. M., (2002). Assessment of Changes in Land Cover along the Lower Reaches of River Gongola, Northeast of Nigeria. 4th Int. Conf. of AARSE, Abuja Nigeria.
Van der Meer, B., Nielsen O.K., & Omitogun, A. A (2002). Determining the Acreage infested with Imperata and Striga in the moist Savanna of Nigeria. 4th Inter. Conf. of AARSE, Abuja, Nigeria.
Okhimamhe, A. A. (2002). Multi-Source Remote Sensing Data for Greenness Mapping in a Savanna Region of Nigeria. 4th Int. Conf. of AARSE. Abuja, Nigeria.
Toko, M. I. & Adomou, I. A. C, (2002). Satellite Remote Sensing Application to the Lokoli Swampy forest plant Communities mapping, 4th Inter. Conf of AARSE. Abuja, Nigeria.