Abuja Journal ofBusiness and Management (AJBAM) is a ...
180
Ab1lja Joual ofBusiness and Managemenl Vo/.1, Issue I, March-2015 About the Journal Abuja Joual ofBusiness and Management (AJBAM) is a quarterly double-blind peer reviewed refereed open access online and print-journal that provides outlet for articles in al l fields of business and management. The J oual is a publication of the Department of Business Administration, Faculty ofManagement Sciences, University ofAbuja, Nigeria which welcomes high quality papers on theoretical developments and practical applications in business and management. Original research papers, sound reviews and high quality technical notes are invited for publications. Guidelines for Contributors All Research contributions should conform to high standards of scholarly research article by ensuring that the contents of al l manuscripts are original and has not been published e lsewhere in any language fully or partly, nor is it under review fo r publication elsewhere. Any article intended for publication inAJBAM should be in compliance with the following format: purpose/objective of the article, sound conceptualization/theoretical foundation, statement of the research problem or hypothesis, research methodology (where applicable), analysis/discussion of r e search findings (where appl icable) and conclusion. Guidelines for Manuscripts 1. Articles should preferably not exceed 5000 words including tables, figures and graphs, using the font Times New Roman ( 12 point) and 1 .5 line spacing. Authors should ensure that the contents ofvery short articles are substantial enough to warrant publication. 2. Al l tables, i l lustrations and figures should be incorporated in the body of the manuscript. The editor reserves the right to refuse publication of any submission for which the artwork is not ofan acceptable standard. 3. Since the AJ BAM fol lows a policy of blind peer review, the f irst page of the text proper should carry the title ofthe article, but not the name(s) ofthe author(s). 4. A separate page should carry the title of the article, its author(s) incl uding full name, academic title, current position and institution (where appropriate). Postal and e-mail addresses should also be provided. 5. The article should be preceded by a single paragraph abstract of the article, Italicized, not exceeding 200 words. The abstract should not form part ofthe text. A list of key words that is not fewer than four and not more than six should be submitted per article fo r cataloguing purposes. 6. The reference technique should be according to the Harvard Style. 7. Please remove al l page numbers. Submission and Review Process l. Manuscripts fo r the review process should be submitted by e-mail in MS Word to the address below. 2. Manuscripts will be submitted to independent reviewers. A policy of double blind peer review is fol lowed. The editor will make the final decision on whether to publish an article. 3. If approved subject to revision, the manuscript wil l be retued to the author(s) wh o wil l make the necessary alteations/corrections. The final copy of the manuscript will then be retued to the editors. This copy should be submitted in MS Word by e-mai l. 4. It is required that al l authors have their draft articles reviewed for language proficiency before submitting them to the editors. Sometimes excellent submissions have to be drastically amended or even rejected because oflinguistic ineptitude. The editors reserve the right to make minor editorial adjustments without consulting the author. The use of abbreviations should be avoided as far as possible. w.abuj ajournalofbusinessandmanagement.org.ng Page I
-
Upload
khangminh22 -
Category
Documents
-
view
0 -
download
0
Transcript of Abuja Journal ofBusiness and Management (AJBAM) is a ...

Ab1lja Journal of Business and Managemenl Vo/.1, Issue I, March-2015
About the Journal Abuja Journal ofBusiness and Management (AJBAM) is a quarterly double-blind peer reviewed refereed open access online and print-journal that provides outlet for articles in all fields of business and management. The J ournal is a publication of the Department of Business Administration, Faculty ofManagement Sciences, University ofAbuja, Nigeria which welcomes high quality papers on theoretical developments and practical applications in business and management. Original research papers, sound reviews and high quality technical notes are invited for publications.
Guidelines for Contributors All Research contributions should conform to high standards of scholarly research article by ensuring that the contents of all manuscripts are original and has not been published elsewhere in any language fully or partly, nor is it under review for publication elsewhere. Any article intended for publication inAJBAM should be in compliance with the following format: purpose/objective of the article, sound conceptualization/theoretical foundation, statement of the research problem or hypothesis, research methodology (where applicable), analysis/discussion of research findings (where applicable) and conclusion.
Guidelines for Manuscripts 1. Articles should preferably not exceed 5000 words including tables, figures and graphs,
using the font Times New Roman ( 12 point) and 1 .5 line spacing. Authors should ensure that the contents of very short articles are substantial enough to warrant publication.
2. All tables, illustrations and figures should be incorporated in the body of the manuscript. The editor reserves the right to refuse publication of any submission for which the artwork is not of an acceptable standard.
3. Since the AJ BAM follows a policy of blind peer review, the first page of the text proper should carry the title ofthe article, but not the name(s) ofthe author(s).
4. A separate page should carry the title of the article, its author(s) including full name, academic title, current position and institution (where appropriate). Postal and e-mail addresses should also be provided.
5. The article should be preceded by a single paragraph abstract of the article, Italicized, not exceeding 200 words. The abstract should not form part of the text. A list of key words that is not fewer than four and not more than six should be submitted per article for cataloguing purposes.
6. The reference technique should be according to the Harvard Style. 7. Please remove all page numbers.
Submission and Review Process l. Manuscripts for the review process should be submitted by e-mail in MS Word to the
address below. 2. Manuscripts will be submitted to independent reviewers. A policy of double blind peer
review is followed. The editor will make the final decision on whether to publish an article.
3. If approved subject to revision, the manuscript will be returned to the author(s) who will make the necessary alternations/corrections. The final copy of the manuscript will then be returned to the editors. This copy should be submitted in MS Word by e-mail.
4. It is required that all authors have their draft articles reviewed for language proficiency before submitting them to the editors. Sometimes excellent submissions have to be drastically amended or even rejected because oflinguistic ineptitude. The editors reserve the right to make minor editorial adjustments without consulting the author. The use of abbreviations should be avoided as far as possible.
www.abujajournalofbusinessandmanagement.org.ng Page I
A buja Joumal ofBusiness and Management Vo/.1, issue I, March-201-
5. Footnotes should be avoided. Endnotes may be used, which should be consecutively numbered and listed at the end of the text, before the list of references.
6. Each document should be submitted through email: [email protected] or [email protected]
7. Since, AJBAM is a quarterly journal, manuscripts can be submitted up to 20th of each last month of the quarter of a year.
8 . The review process may take approximately l 0 to 14 days. As part of the submission process, authors are required to check off their submission's compliance with all of the above guidelines; submissions may be returned to authors that do not adhere to these guidelines.
Publication Fees The sum ofN5, 000 is paid as assessment fees to carter for the cost of editorial review report, while publication fees ofN20, 000 or US$ 1 00 for foreign authors (per article) is payable on the acceptance of the article to cover the cost of production of hard print copy, Internet-servicing, editing, handling, etc. The author(s) will receive written acknowledgement of acceptance payment accompanied by original receipt.
Account Payment Details: Account Name: Department ofBusiness Administration, University of Abuja, Gwagwalada. Banker: First Bank Nigeria PLC, Gwagwalada, Abuja. Account Number: 2005892921
Copyrights Agreements Authors relinquish the manuscript's copyright to theAbuja Journal of Business and Management, published by the Department of Business Administration, University of Abuja and must accept and adhere to the journal's publication policy. After acceptance, the copyright form will be mailed to the corresponding author; one of the authors must complete the copyright form.
Editorial Policy
All Correspondences to: The Editor-In-Chief, Abuja Journal ofBusiness and Management, Department ofBusiness Administration, Faculty ofManagement Sciences, University ofAbuja, P.M.B 1 1 7, Gwagwalada, Abuja, Federal Capital Territory, Nigeria. Email: [email protected] Website: www.abujajoumalofbusinessandmanagement.org.ng GSM: +2348036340963 or+2348 1 79275933
The editorial policy of the journal is to provide access not only to world class research materials, but through our professionals, hope to bring about a significant transformation in the realm of print and online open access journal in Nigeria. AJBAM is committed to ensuring a 'Paradigm Shift' in academic research which will result in major breakthroughs in the area of Scholarly Business and Management Research in Nigeria and the entire world.
Publication Ethics AJBAM publishes peer-reviewedjoumal in business and management discipline. This statement should guide the ethical behaviour of all parties involved in contributing articles for the journal, i .e. : the author, the Editor in Chief, the peer reviewer and the publisher. This statement is in line with the intemationally accepted Best Practice Guidelines for Joumal Editors.
www.abujajournalofbusinessandmanagement.org.ng Page I I
Abuja Joumal ofBw;iness and Manageme/11 Vol. I, Issue I, March-2015
Duties of Editors: Decision on the Publication of Articles The Editor in Chief of the Journal is responsible for deciding which of the articles submitted to the journal should be published. The Editor in Chief may be guided by the policies of the journal's editorial board and subjected to such legal requirements regarding libel, copyright infringement and plagiarism. The Editor in Chief may confer with other editors or reviewers in making this decision.
Fairplay Manuscripts shall be evaluated solely on their intellectual merit without regard to authors' race, gender, sexual orientation, religious belief, etlmic origin, citizenship, or political phi losophy.
Duties of Reviewers: Contribution of Peer Review Peer review assists the Editor in Chief and the editorial board in making editorial decisions while editorial communications with the author may also assist the author in improving the paper.
Acknowledgement ofSources Reviewers should identify relevant published work that has not been cited by the authors. Any statement that had been previously reported elsewhere should be accompanied by the relevant citation. A reviewer should also call to the Editor in Chiefs attention any substantial similarity or overlap between the manuscript under consideration and any other published paper of which they have personal knowledge.
Duties of Authors: Reporting standards Authors of reports of original research should present an accurate account of the work performed as well as an objective discussion of its significance. Underlying data should be represented accurately in the paper. A paper should contain sufficient detail and references to permit others to replicate the work. Fraudulent or knowingly inaccurate statements constitute unethical behaviour and are unacceptable.
Data Access and Retention Authors may be asked to provide the raw data in connection with a paper for editorial review, and should be prepared to provide public access to such, if practicable, and should in any event be prepared to retain such data for a reasonable time after publication.
Originality and Plagiarism Authors should ensure that they have written entirely original works, and if the authors have used the work and/or words of others this must be appropriately cited or quoted.
Multiple Publications An author should not in general publish manuscripts describing essentially the same research that was previously published in another journal. Submitting such manuscript to more than one journal constitutes unethical publishing behaviour and is unacceptable.
Acknowledgement of Sources Proper acknowledgment of the work of others must always be given. Authors should cite publications that have been influential in determining the nature of the reported work.
www.abujajournalofbusinessandmanagement.org.ng Page Ill

Abuja Joumal of Business and Management Vol. /, Issue I, March-2015
Authorship of the Paper Authorship should be limited to those who have made a significant contribution to the conception, design, execution, or interpretation of the reported study. All those who have made significant contributions should be listed as co-authors. Where there are others who have participated in certain substantive aspects of the research project, they should be acknowledged or listed as contributors.
Fundamental errors in published work When an author discovers a significant error or inaccuracy in his/her own published work, it is the author's obligation to promptly notify the journal editor or publisher and cooperate with the editor to retract or correct the paper.
www.abujajournalofbusinessandmanagement.org.ng Page IV

Ahuja Joumal of Business and Management Vol./, Issue /, Jv!arch-2015
Editorial Board Editor-In-Chief:
Dr. Bello Ayuba, Department of Business Administration, University of Abuja, Gwagwalada, Abuja, N igeria.
Editor: Associate Prof. N.C. Ozigbo, Department of Business Administration,
University of Abuja, Gwagwalada, Abuja, Nigeria.
Deputy Editor: Dr. U.D. Mohammed, Department of Business Administration,
University of Abuja, Gwagwalada, Abuja, Nigeria.
Editorial Advisory Board: Prof. G. C. Nzelibe,
Department of Business Administration, University of Abuja, Gwagwalada, Abuja, Nigeria.
Prof. A.B Akpan, Department of Business Administration,
Salem University, Lokoja, Kogi State, Nigeria.
Prof. Aminu A. Ayuba, Dean Faculty of Management Sciences,
University of Maiduguri, Borno State, Nigeria.
Prof. U. J. F. Ewurum, Department of Business Administration,
University of Nigeria Nsuka, Enugu State, Nigeria.
Prof. Sani Abdullahi, Department of Business Administration,
Ahmadu Bello University, Zaria.
Prof. A.K Kurfi, Department of Business Administration,
Bayero University Kano, Nigeria.
Prof. Victor E. Ekaetor, Dean, Faulty of Management Sciences,
University of Abuja, Gwagwalada, Abuja, Nigeria.
Prof. Ambrose. A. Okwoli, Dean, Faculty of Management Sciences,
University of Jos, Nigeria.
Dr. Munirat 0. Yusuf, Department of Business Administration,
University of Abuja, Gwagwalada, Abuja, Nigeria.
Dr. A. Y. Dutse, School of Management Technology,
Abubakar Tafawa Balewa University, Bauchi, Bauchi State, Nigeria.
www.abujajournalofbusinessandmanagement.org.ng Page V

A huja Journal of Business and Management Vo/.1, issue 1 March-2015
Associate Editot·s
Prof Siyan Peter, Department of Economics.
University of Ahuja, Gwagwalada, Ahuja, Nigeria.
Associate Prof Y. M. Damagum, Department of Accounting,
University of Ahuja, Gwagwalada, Abuja, Nigeria.
Associate Prof Sule Magaji, Department of Economics,
University of Ahuja, Gwagwalada, Ahuja, Nigeria.
Dr. Musa L Fodio, Department of Accounting,
University of Ahuja, Gwagwalada, Ahuja, Nigeria.
Dr. Hamid Ozohu-Suleiman, Department of Public Administration,
University of Ahuja, Gwagwalada, Ahuja, Nigeria.
Dt: U.G. Moti, Department of Public Administration,
University of Ahuja, Gwagwalada, Ahuja, Nige1ia.
Consulting Editor Waziri Garba
Department of Public Administration, Head of lnfonnation and Publications Unit
University of Abuja, Gwagwalada, Ahuja, Nigeria.
Technical Advisor: Mr. Osagie Samauel E.
Legal Advisor: A.M. Kontagora Faculty ofLaw
University of Ahuja, Gwagwalada, Ahuja, Nigeria.
Administrative Secretary: Mrs. Gloria Samari
Department of Business Administration, University of Ahuja
www.abujajournalofbusinessandmanagement.org.ng Page VI
Ahuja Joumal of Business and Management Vol. I, Issue I, March-2015
Table of Contents: Articles; Vol. 1, Issue 1, March 2015: Investigating the Relationship between Employee Motivation and Job Satisfaction: A Study of Patterson Zochonis (PZ) Nigeria Limited Dr. Ezekiel Adeleye, Yekini Lawai, Omolara Olatunde
The Influence of Investors Sentiment on Stock Market Reforms in Nigeria Mohammed Zubairu
Effect of Basic Planning Factors on Performance of Manufacturing Firms in Nigeria Prof Ayuba A. Aminu, Prof S.K. Msheliza, I.M.B. Chekene
Empirical Assessment of the Willingness to Pay for Waste Collection and Disposal Services in Kano Metropolis, Nigeria Mustapha Mukhtar, PhD, Nura Aliyu Kabuga.
The Impact of Public Expenditure on Economic Growth in Nigeria:1982-2012 D1� Mohammed Yelwa, Prof S.A.J Obansa, Alfa Mohammed Danlami
Small and Medium Enterprises Development in Nigeria: A sustainable Approach to Employment Generation Dr. Umaru Danladi Mohammed, Abdullahi Ndaman, Kaka Abdullahi, Theresa Ndulue, Roko Lumi Peter
Influence of Motivational Factors on Teachers Job Performance in Public Senior Secondary Schools in the FCT, Abuja Hauwa Mohammed, PhD
Effect of Electronic- Customer Relationship Management (e-CRM) On Business Organizations Idris Bashir Bugaje
Principals' Transformational Leadership Behaivour and Teachers Commitment to Duty in public Schools in Borno State, Nigeria Dr. Zaifada B.l, Dr. Hauwa Mohammed, Dr. Garbadeen WO
Analysis of Investment Climate Reforms on Foreign Direct Investment (FDI):
The Case of Nigeria Hamza Zubairu Kofarbai
Customer Relationship Management as a Strategic Marketing Tool in the
Nigerian Banking Sector Ibrahim Fari Okeji
www.abujajournalofbusinessandmanagement.org.ng
1-10
11-29
37-44
45-55
65-72
73-80
81-88
100-109
Page VI I
Abu} a .Journal of Business and Management Vo/.1, Issue /, Marclt-20 15
The Impact of Electricity on the Growth of Small and Medium Enterprises (SMEs) in Nigeria Dr. Nuhu Dogara Gada, Ezie Obumneke
Takaful (Islamic Insurance) in Nigeria: Hopes, Hurdles and Harmonization Abdul-Maliq, 0. Yekeen, Dr. Salaudeen M. Yinka.
The Role of a Company's Specific Characteristics in Enhancing Business Performance in Nigeria Musa Adeiza Faruk, Lawai Bawa Maru Muhammad
Appraising Corporate Finance Application in the Nigerian Banking Industry Ibrahim Fari Okeji
Influence of Micro - Credit on Asset Accumulation: A Study of Selected Local Government Areas (LGA's) In Bauchi State Mohammed Sani lsyaka, Dr. Sule, Magaji
Assessing the Impact of Micro-finance Banks on Economic Empowerment of Female Entrepreneurs in Kaduna State Anietie Charles Dikld
www.abujajournalofbusinessandmanagement.org.ng
110-123
124- 131
132-141
142-152
153-160
161-171
Page VIII
Investigating the Relationship Between Employee Motivation and Job Satisfactio.n: A Study of Paterson Zochonis (PZ) �ig. Limited
Dr. Ezekiel Adeleye\ Yekini Lawaf, Omolara Olatunde3 1 (Department of Business Administration, E/izade University, Jlara-Mokin. Ondo State)
1 'Department of Business Administration, Afe Babalola University, Ado Eldti) �'Department of Busin:ess-Administration, Afe Babalola University, Ado Ekiti)
Abstract: Workers' expectations are endless even as the practice of motivation as a means of ensuringjob satisfaction and maximum performance may be hard to realise. It is therefore important to understand the factors that arouse and sustain the interest of employees in their work and measure the impact of motivation on employee job satisfaction. Most work in this area either studied the individual impact of motivation and job satisfaction on business performance or discussed job satisfaction as a means of achieving motivation. In contrast, this paper proposes a reversal of the relationship and argued that motivation is a means of enhancing job satisfaction. It discusses the nature of motivation and job satisfaction, and investigates the relationship between them. Data were collected from the staff of the Ikorodufactory ofPZ Cussons (Nigeria) PLC via a survey by questionnaire. The hypotheses were tested using Chi-square, Regression and Analysis of Variance (ANOVA) tests. Although many studies have established a relationship between motivational practices and organizational performance, the intervening process through job satisfaction remained largely unexplored. The research explored this missing link and discovered a strong relationship between motivation and job satisfaction. In addition, it was found out that intrinsic and_g�trimJk..mo#-vation dfffers in their impacts on business performance. The main implication of the study is that businesses need to motivate employees as a means of eliciting higher job satisfaction. In addition, businesses need to focus more on aspects of motivation with greater impact on job satisfaction. Keywords: Chi-square, Job satisfaction, Motivation, PZNigeria Limited
1 . Introduction The management of people at work has become an important aspect of the employers' duty if organisational performance objectives are to be achieved. An employee that is adequately motivated would have a higher level of job satisfaction and would likely put in more effort and commitment. For many years, motivation and job satisfaction have been studied in isolation as drivers of organizational effectiveness. A few studies that have explored the business performance impact of both concepts expressed motivation as the intervening variable between job satisfaction and business performance. The position taken in this.. paper is that motivation would cause a positive change in business performance only if it impacts positi�y on job satisfaction. However, empirical studies of this link between motivation and business performance through job sat-tifaeti-on-are rare.
In other words, low achievement of organizational objectives arises from poor motivational effort caused by low levels of job satisfaction. The problem remains that most organizations failed to consider employees' needs or get them involved in initiatives that can adequately motivate and keep them servicefocused. Given that each employee has a motive for working, once these desires are not fully met; there are negative consequences on effort, commitment and petfotmance. Hence, this work explores the empirical link between employee motivation and job satisfaction which is crucial to the attainment of business objectives.
Given that each employee has a motive for joining a given organization and once these desires or goals arc not fully met, it has negative effect on employees' performance at work. For this reason, in most organizations today, job satisfaction appears rather low. However, by rethinking our approach to employee motivation as a determinant to job satisfaction, business performance could improve.
1.1 Objectives of the Study The main objective of the study is to investigate motivation as a determinant of job satisfaction with special focus on employees ofPZ Cussons Nigeria PLC. The specific objectives are:
Ahuja Joumal of Business and Management Vol. /, issue I [1-10}, March-2015 www.abujajournalofbusinessandmanagement.org.ng Page 1
Investigating the Relationship Beflveen Employee Motivation and Job Satisfaction: A Study of Paterson Zochonis (PZ) Nig. Limited
1. To study current practices of employee motivation at PZ Cussons PLC Ikorodu. 2 . To identify the relative effect o f extrinsic and intrinsic motivation on business perfonnance. 3 . To explore the relationship between motivation and job satisfaction.
1.2 Hypotheses of the Study In order to answer the questions that emerge directly from these objectives, the following Null hypotheses were formulated, which shall be tested and discussed:
•
H01 PZ Cussons PLC does not motivate their employees.
H02 There is no difference i n performance induced by extrinsic and intrinsic motivation.
H03 There is no significant relationship between motivation and job satisfaction in PZ PLC.
The study reviewed the literature on need-based theories of motivation and job satisfaction. This was followed by a survey of motivation and job satisfaction in PZ Cussons Nigeria PLC. The goal is to understand motivational practices in companies gauge the level of employee's job satisfaction and identify the link between employee motivation and job satisfaction.
2. Literature Review This section reviews some prior theoretical and empirical work on motivation and job satisfaction, and presents the theoretical basis for the study.
2.1 Concept ofMotivation _ _ ..
Motivation is the psycho-social process of arousing the interest of employees in their work. In work organisations, it consists of management efforts to stimulate the desire, energy, interest and commitment of employees towards the attainment of organisational goals (Sansone and Harackiewicz, 2000; TeckHong and Waheed, 20 1 1 ) . Such efforts can be extrinsic or intrinsic (Schmidt and Scholl, 2014; Akanbi, 2014). Extrinsically motivated bchavioms are actions that result in the attainment of externally administered rewards, including pay, material possessions, prestige, and positive evaluations from others. It is a drive to action that springs from outside influences instead of own inner feelings. This seems quite unlike motivation in learning which mostly comes from within, through self-applied positive behaviour and attitude displayed for its own sake or prestige rather than for material or social rewards. The latter is intrinsic motivation, which even if also available at work, may wane sooner than later if not appropriately supported by extrinsic motivation. Nevertheless, if both intrinsic and extrinsic motivation are combined, employees would experience a tremendous degree of job satisfaction and work place commitment which stimulates performance (Ajila and Awonusi, 2004; Ojokuku, 2007; Akanbi, 20 14). In order to maximize job satisfaction as a means of achieving performance objectives, organizations need to continuously motivate their employees from both the intrinsic and extrinsic dimensions. . ... -·--·
Work is inevitable and in whatever form it is done, people desire satisfaction in what they do and managers need to understand and find the ways and means of helping employees reasonable aspirations. This is because an adequately motivated worker performs even above the level expected of their intelligence and ability (Paul and Anantharaman, 2003; Pratheepkanth, 201 1). When conscientious efforts are made to fulfill employees motivational needs, they derive job satisfaction and tend to contribute maximally.
Motivational needs have been discussed extensively within the need-based and the process-based theories (Ryan and Deci, 2000; Schmidt and Scholl, 20 14). The Need- based theories focus on the specific needs within the person that energize, direct and sustain behaviour. In contrast, the process-based theories accm.mt for factors external to the person tpat affect how behaviour is energized, directed, sustained and. stopped. The process-based theories often focus on complex psychological processes relating to behaviour, and are often not pursued in mainstream business research.
Maslow ( 1 943; 1 954) for instance, proposed five levels of hierarchical needs ananged in an ascending order of importance. The first is the physiological needs for food, water, sex, rest, clothing and other existential needs required for body chemistry and biology that must be satisfied in order to live. Following
Ahuja Journal of Business and Management Vol.!, Issue I [1- 10]. March-2015 www.abujajournalofbusinessandmanagement.org.ng Page 2

Investigating the Relationship Between Employee Motivation and Job Satisfaction: A Study of Paterson Zochonis (PZ) Nig. Limited
next is safety needs in terms of prevention from physical and psychological harm at work. The third is social needs including love, care, belonging and affection. The fourth is esteem needs including job enrichment, enhanced status, le�ser supervision, more holistic jobs, reputation and rccognition.within and outside the munedtate work environment. The fifth IS self-actualization in terms of achieving the maximum possible in one's lifetime relative to one's ability, competences and talents.
Alderfer ( 1 972) also developed a hierarchy of three needs namely- existence, relatedness and growth needs. The first is similar to the ·physiological needs while the second is similar to the safety !belonging needs of the Maslow model. The third is also close-knit with Maslow's esteem and actualization categories combined. David McClelland ( 1 96 1 ) also articulated three classes of human needs namely: achievement, affiliation and power. These three theories captured the same elemental details of hwnan needs ranging from food to esteem to power and to a sense of personal accomplishment in that order.
Alderfer and Maslow differ on how people move through the different sets of needs. Maslow proposed that a lower level need must be significantly met before attempts on a higher level need. Although Alderfer agreed with the progression process proposed by Maslow, he identified a frustration-regression process at work. If a person is continually frustrated in meeting an esteem need for instance, a relatedness need may re-emerge as a major motivating force, causing the individual to redirect efforts toward exploring new ways to satisfy this lower-order category of need. David McClelland ( 1 961) also introduced a cultural dimension to the effect that managers should recognize cultural differences- that human needs and their order of importance vary across cultures.
Some other need-based theories are David McGregor's Theory XY, WiJJiam Ouchi's Theory Z and the 2-factor theory by Frederick Herzberg. They all opined that motivation accounts for high levels of commitment, loyalty and productivity (Olagunju, 20 I I; Reece and Brandt, 1 996; Ogungbamila, 2006). By and large, the 2-factor theory has received the greatest research interest because it is practical and grounded in rounds of empirical studies of two hundred engineers and accountants from over nine companies in the United States (Herzberg et. al., 1959; Jibowo, 1 997).
The Herzberg approach has the additional benefit of departing from other need-based theories which perceived job satisfaction as the opposite of job dissatisfaction (Herzberg, 1 966). Hygiene factors of motivation were identified, which prevent bad feeling and job dissatisfaction but are not the real motivators that lead to job satisfaction. The theory argues that a satisfied need ceases to motivate. AJJ these theories provide the pointer that motivation is a dynamic process- a journey not a destination. It requires evetyday preparation, improvement, sustenance and testofimpactonjob satisfaction.
2.2 Extrinsic and Intrinsic Motivation Organisations deploy a wide range of tools and techniques to motivate employees, the most popular being money by way of higher salaries and wages as well as several other financial perquisites (Deci, 1 975; Jibowo, 1997; Pinder, 1 998; Selden and Facer, 2000; Tyilana, 2005; Teck-Hong and Waheed, 20 11) . Classical theories of motivation are grounded in the use of financial incentives and other external rewards to motivate workers. Some other extemal I extrinsic tools which deal with behaviours motivated by factors external to the individual include leadership, supervision; group solidarity and company policy.
Financial and the other extrinsic rewards sometime provide the carrot that people want because they symbolize many goals. In their study of the affluent worker, Goldthorpe et al ( 1 969) found that considerations over wages and other financial rewards seem the most powerful factor in holding people to their present jobs. Employees who disliked their repetitive jobs in their Coventry car assembly plant were found to hold on to the jobs rather than move on to more interesting jobs with lower financial rewards in nearby plants. Financial rewards have the benefitofmeasmability and constitute the most direct means of rewarding employees for their contributions towards the achievements of organizational goals ( TcckHongand Wahced, 20 1 1 ) .
Neo-classical theory and research evidence was less supportive of money and the other extrinsic tools but stressed the need to motivate employees from within via intrinsic means such as job enrichment and
Ahuja Journal of Business and Management Vol./, Issue I [1-10]. March-2015 www.abujajournalofbusinessandmanagement.org.ng Page 3
Investigating the Relationship Between Employee Motivation and Job Satisfaction: A Study of Paterson Zoclzonis (PZ) Nig. Limited
challenging work, whose impacts are less transient and more permanent (Herzberg et a!, 1 966; Goldthorpe et.al., 1 969; Deci, 1975; Jibowo, 1997; Kirkman and Shapiro, 200 1 ; Ogungbamila, 2006). Such tools harp on competence, indepcl')dencc, self-determination and job-orientation irrespective of<}ny external rewards. Nevertheless, there are conflicting results on the relative impact o!' extrinsic and intnnsic motivation even as the former tend to have greater impact in industrial sectors characterized by rapid change (Teck-Hong and Waheed, 201 1 ).
2.3 Job Satisfaction Job satisfaction is an expression of personal attitude and well-being associated with performing an assigned job or role (Tella et. al., 2007; Aziri, 201 1 ) . Simply, it is a measure of how people feel generally about their job- the like or dislike. It is an attitude of commitment arising from positive or negative feeling about the work. This commitment is the willingness to exert high levels of effort for the organization (Bailey, 1993). Higher job satisfaction implies a generally positive attitude whilst lower job satisfaction entails a negative attitude (Teck-Hong and Waheed, 20 1 1 ; Kian, et. al., 20 1 4) . The strength of the feeling of responsibility towards higher job performance, which is achievable via job satisfaction, is cmcial to business survival.
The direction and magnitude of these attitudes originate significantly from the motivational climate made up of variables such as pay, working conditions, leadership, recognition and achievement (Aziri, 201 1 ; Schmidt and Scholl, 20 1 4). Equity, fairness and the processes used to meet employees' motivational needs are also crucial to feelings of job satisfaction or dissatisfaction. A positive motivational climate is cmcial to job satisfaction and consequently the effectiveness and optimal functioning of work organizations (Tell a et. al, 2007). Hence, motivation may be everything and a happy worker would be surely productive (Bailey, 1 993; Paul andAnantharaman, 2003; Dawson, 2005; Aziri, 20 1 1 ) .
2.4 Theoretical Bases for the Study Several studies have highlighted the importance of motivation to work performance, the relative merit of intrinsic and extrinsic motivation as well as the impact of job satisfaction on the attainment of business objectives (Herzberg, 1 966; Ajila and Awonusi, 2004; Tella et. al., 2007; Ajayi, 20 1 1 ). However, the literature on motivation and job satisfaction has two major weaknesses.
First, empirical studies on the relative performance impact of intrinsic and extrinsic motivation as the two major dimensions of motivation generate conflicting results (Jibowo, 1 997; Fuller et. al., 2008; Robbins and Judge, 20 1 0; Pratheepkanth, 20 1 1 ; Teck-Hong and Waheed, 201 1 ) . As a consequence, many researchers prefer to study the effect of individual motivators such as pay, supervision and recognition. Secondly, there are specification and modeling problems as regards which of motivation and job satisfaction is the dependent or intervening variable in their relationship with business performance. This study proposes that job satisfaction is dependent on motivation and that the two dimensions of motivationextrinsic and intrinsic- would have different levels of impact on performance outcomes (Herzberg et. a!., 1 959; Herzberg, 1 966; Jibowo, 1 997; Tella et. al., 2007; Teck-Hong and Wabeed, 20 1 1 ; Kian et. a!., 201 4) .
The study also adopts the notion of "locus of causality"- a cyclical and positive relationship between extrinsic and intrinsic motivation, to the effect that both could be deployed jointly (Deci, 1 975; Ryan and Deci,' 2000). However, they wamed that the joint effect of intrinsic and extrinsic rewards may be quite complex, not be additive in their overall effects and that their interaction may be negative under some conditions. Nevertheless, in spite of the debate on their relative merit, it has been argued that organisations that motivate from both dimensions of motivation would get the best out of employees (Tella et. al, 2007; Ajayi, 20 1 1 ; Teck-Hong and Waheed, 201 1 ; Akanbi, 20 1 4; Kian et. al., 20 1 4) . Yet, managers may need to strengthen the dimension that adds greater value to job satisfaction.
3. Methodology This is a single case study of Paterson Zochonis (PZ), a company founded in 1 879 as a trading post in Sierra Leone. A branch office in Nigeria was opened in 1 899, followed by its first soap factory via acquisition in 1 9 48 . PZ has grown into an international and highly diversified business conglomerate. The PZ vision states in part: We shall profitably grow our business, strengthen our products portfolio, and
Ahuja Joumal of Business and Management Vol. I, Issue I [/-10], March-2015 www.abujajournalofbusinessandmanagement.org.ng Page 4
Investigating the Relationship Between Employee Motivation and Job Satisfaction: A Study of Paterson Zoclzonis (PZ) Nig. Limited
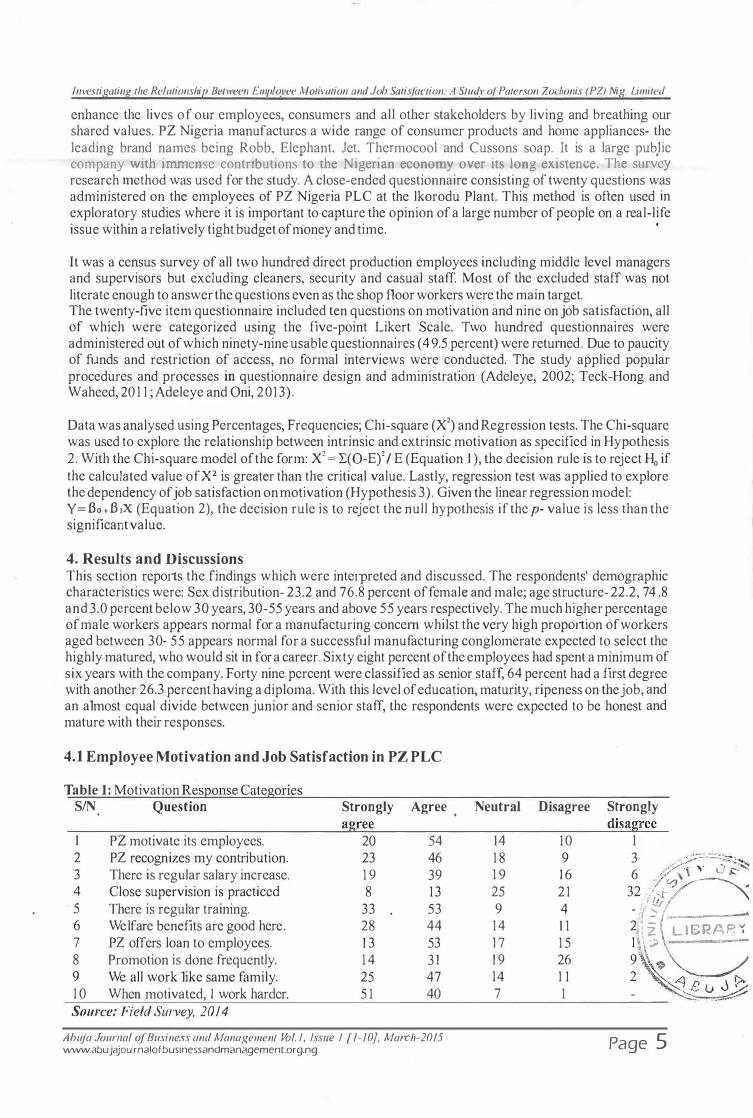
enhance the lives of om employees, consumers and all other stakeholders by living and breathing our shared values. PZ Nigeria manufactures a wide range of consumer products and home appliances- the leading brand names being Robb, Elephant, Jet, Thermocool and Cussons soap. It is a large pub)ic company with immense contributions to the Nigerian economy over its long existence. The survey research method was used for the study. A close-ended questionnaire consisting of twenty questions was administered on the employees of PZ Nigeria PLC at the lkorodu Plant. This method is often used in exploratory studies where it is important to capture the opinion of a large number of people on a real-life issue within a relatively tight budget of money and time. •
It was a census survey of all two hundred direct production employees including middle level managers and supervisors but excluding cleaners, security and casual staff. Most of the excluded staff was not literate enough to answer the questions even as the shop floor workers were the main target. The twenty-five item questionnaire included ten questions on motivation and nine on job satisfaction, all of which were categorized using the five-point Likert Scale. Two hundred questionnaires were administered out of which ninety-nine usable questionnaires ( 49.5 percent) were returned. Due to paucity of funds and restriction of access, no formal interviews were conducted. The study applied popular procedures and processes in questionnaire design and administration (Adeleye, 2002; Teck-Hong and Waheed, 20 1 1 ;Adeleye and Oni, 2013).
Data was analysed using Percentages, Frequencies; Chi-square (X2) and Regression tests. The Chi-square was used to explore the relationship between intrinsic and extrinsic motivation as specified in Hypothesis 2. With the Chi-square model of the form: X2 == �(0-E/ IE (Equation 1 ), the decision rule is to reject H0 if the calculated value ofX2 is greater than the critical value. Lastly, regression test was applied to explore the dependency ofjob satisfaction on motivation (Hypothesis 3). Given the linear regression model: Y== Bo+ B ,x (Equation 2), the decision rule is to reject the null hypothesis if the p- value is less than the significant value.
4. Results and Discussions This section reports the findings which were interpreted and discussed. The respondents' demographic characteristics were: Sex distribution- 23.2 and 76.8 percent of female and male; age structure- 22.2, 74.8 and 3.0 percent below 30 years, 30-55 years and above 55 years respectively. The much higher percentage of male workers appears normal for a manufacturing concern whilst the very high proportion of workers aged between 30- 55 appears normal for a successful manufacturing conglomerate expected to select the highly matured, who would sit in for a career. Sixty eight percent of the employees had spent a minimum of six years with the company. Forty nine percent were classified as senior staff, 6 4 percent had a first degree with another 26.3 percent having a diploma. With this level of education, maturity, ripeness on the job, and an almost equal divide between junior and senior staff, the respondents were expected to be honest and mature with their responses.
4.1 Employee Motivation and Job Satisfaction in PZ PLC
Table 1: Motivation ResQonse Categories SIN Question Strongly Agree Neutral Disagree Strongly
agree disagree 1 PZ motivate its employees. 20 5 4 1 4 10 1 2 PZ recognizes my contribution. 23 46 1 8 9 3 . . ' �:-.=...:::..:.;,:::-:- · ....
6 ��1 y lJ'i� 3 There is regular salaty increase. 1 9 39 4 Close supervision is practiced 8 13 5 There is regular training. 33 53 6 Welfare benefits are good here. 28 44 7 PZ offers loan to employees. 1 3 53 8 Promotion is done frequently. 1 4 3 1 9 We all work like same family. 25 47 1 0 When motivated, I work harder. 5 1 40 Source: Field Survey, 2014
Abu} a Journal of Business and Management Vol. I, Issue I [1-10}, March-2015 www.abujajournalofbusinessandmanagement.org.ng
1 9 1 6 25 2 1 9 4 1 4 1 1 17 1 5 1 9 26 1 4 1 1 7 1
32 ./ . ,y- � - :1 !.1/j �I -2'- v ,. z LIE;RAR I 1 \\;) -
� �
�'� -.:. ��
Page 5
Investigating the Relationship Between Employee Motivation and Job Satisfaction: A Study of Paterson Zochonis (PZ) Nig. Limited
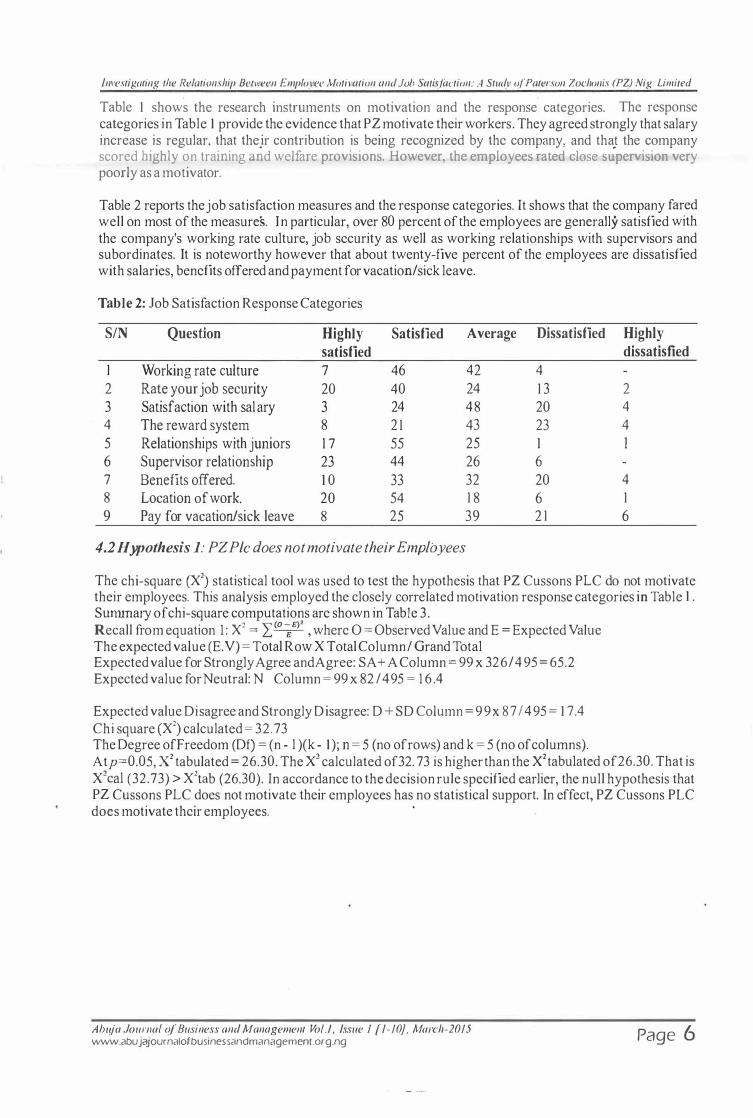
Table 1 shows the research instruments on motivation and the response categories. The response categories in Table 1 provide the evidence that PZ motivate their workers. They agreed strongly that salary increase is regular, that thejr contribution is being recognized by the company, and tha_t the company scored highly on training and welfare provisions However, the employees rated close supervision very poorly as a motivator.
Table 2 reports the job satisfaction measures and the response categories. It shows that the company fared well on most of the measures. In particular, over 80 percent of the employees are generally satisfied with the company's working rate culture, job security as well as working relationships with supervisors and subordinates. It is noteworthy however that about twenty-five percent of the employees are dissatisfied with salaries, benefits offered and payment for vacation/sick leave.
Table 2: Job Satisfaction Response Categories
SIN Question Highly Satisfied Average Dissatisfied Highly
satisfied dissatisfied
1 Working rate culture 7 46 42 4 2 Rate your job security 20 40 24 1 3 2
3 Satisfaction with salary 3 24 48 20 4 4 The reward system 8 2 1 43 23 4 5 Relationships with juniors 1 7 55 25 1 1 6 Supervisor relationship 23 44 26 6 7 Benefits offered. 1 0 33 32 20 4 8 Location of work. 20 5 4 1 8 6 1 9 Pay for vacation/sick leave 8 25 39 2 1 6
4.2 Hypothesis 1: PZ Pic does not motivate their Employees
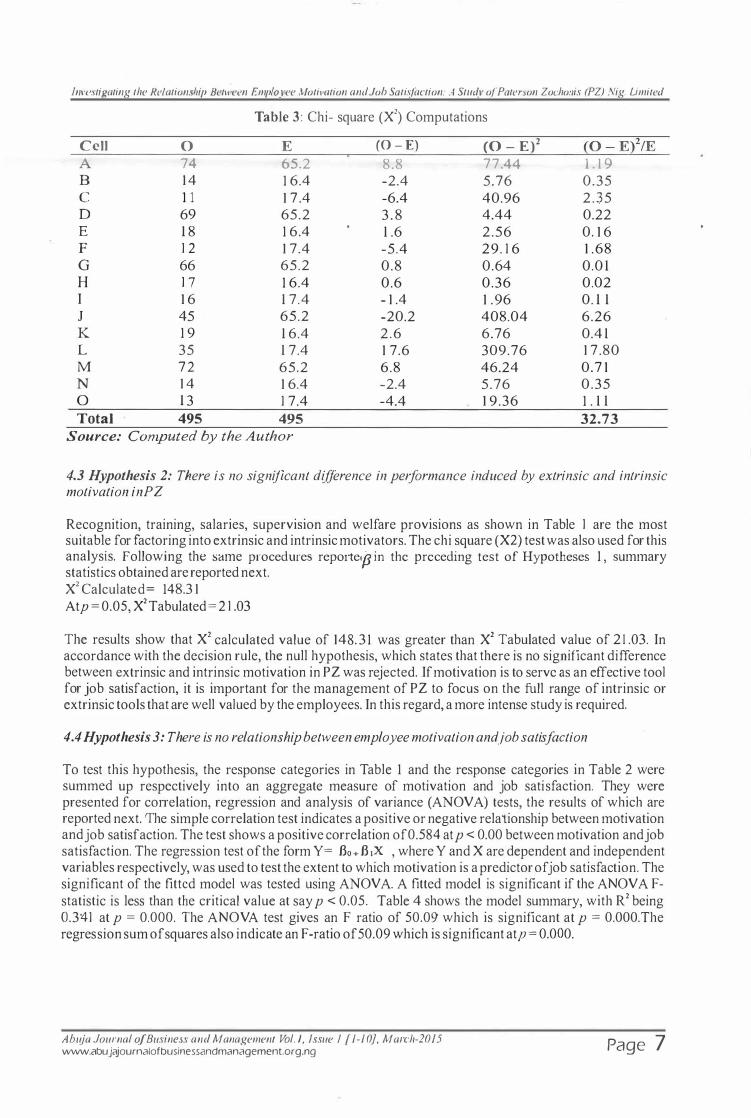
The chi-square (X2) statistical tool was used to test the hypothesis that PZ Cussons PLC do not motivate their employees. This analysis employed the closely correlated motivation response categories in Table 1 . Summary of chi-square computations are shown in Table 3 . Recall from equation 1 : X2 = I(O�E)' ' where O = Observed Value and E = Expected Value The expected value (E. V) = Total Row X Total Column I Grand Total Expected value for Strongly Agree and Agree: SA+ A Column = 99 x 326/ 495 = 65.2 Expected value for Neutral: N Column = 99 x 82 I 495 = 1 6 .4
Expected value Disagree and Strongly Disagree: D + SD Column = 99 x 87 I 495 = 1 7. 4 Chi square (X2) calculated= 32.73 The Degree ofFreedom (Df) = (n - l )(k - 1 ); n = 5 (no of rows) and k = 5 (no of columns). Atp=0.05, X2 tabulated = 26.30. The X2 calculated of32. 73 is higher than the X2tabulated of26.30. That is X2cal (32.73) > X2tab (26.30). In accordance to the decision rule specified earlier, the null hypothesis that PZ Cussons PLC does not motivate their employees has no statistical support. In effect, PZ Cussons PLC does motivate their employees. ·
Abu) a Jouma/ of Business and Management Vol./, Issue I [1-10]. March-2015 www.abujajournalofbusinessandmanagement.org.ng Page 6
Investigating the Relationship Between Employee Motivation and Job Satisfaction: A Study of Paterson Zochonis (PZ) Nig. Limited
Table 3 : Chi- square (X2) Computations
Cell 0 E (0 - E) (0 - E)2 {0 - E}2/E A 74 65.2 8.8 77.44 1 . 1 9 B 1 4 1 6.4 -2.4 5.76 0.35 c 1 1 1 7 .4 -6.4 40.96 2 . 3 5 D 69 65.2 3 . 8 4.44 0.22 E 1 8 1 6.4 1 .6 2.56 0. 1 6 F 1 2 1 7.4 -5.4 29. 1 6 1 . 68 G 66 65.2 0.8 0.64 0.0 1 H 1 7 1 6.4 0.6 0.36 0.02 I 1 6 1 7.4 - 1 .4 1 . 96 0. 1 1 J 45 65.2 -20.2 408.04 6.26 K 1 9 1 6.4 2 . 6 6.76 0.4 1 L 35 1 7.4 1 7.6 309.76 1 7 .80 M 7 2 65.2 6.8 46.24 0.7 1 N 1 4 1 6.4 -2.4 5.76 0.35 0 1 3 1 7.4 -4.4 1 9 .36 1 . 1 1 Total 495 495 32.73
Source: Computed by the Author
4.3 Hypothesis 2: There is no significant difference in performance induced by extrinsic and intrinsic motivation inPZ
Recognition, training, salaries, supervision and welfare provisions as shown in Table 1 are the most suitable for factoring into extrinsic and intrinsic motivators. The chi square (X2) test was also used for this analysis. Following the same procedures repo1te•,B in the preceding test of Hypotheses 1 , summary statistics obtained are reported next. X2 Calculated= 148.3 1 Atp = 0.05, X2Tabulated = 2 1 .03
The results show that X2 calculated value of 148. 3 1 was greater than X2 Tabulated value of 2 1 .03. In accordance with the decision rule, the null hypothesis, which states that there is no significant difference between extrinsic and intrinsic motivation in PZ was rejected. If motivation is to serve as an effective tool for job satisfaction, it is important for the management of PZ to focus on the full range of intrinsic or extrinsic tools that are well valued by the employees. In this regard, a more intense study is required.
4.4 Hypothesis 3: There is no relationship between employee motivation and job satisfaction
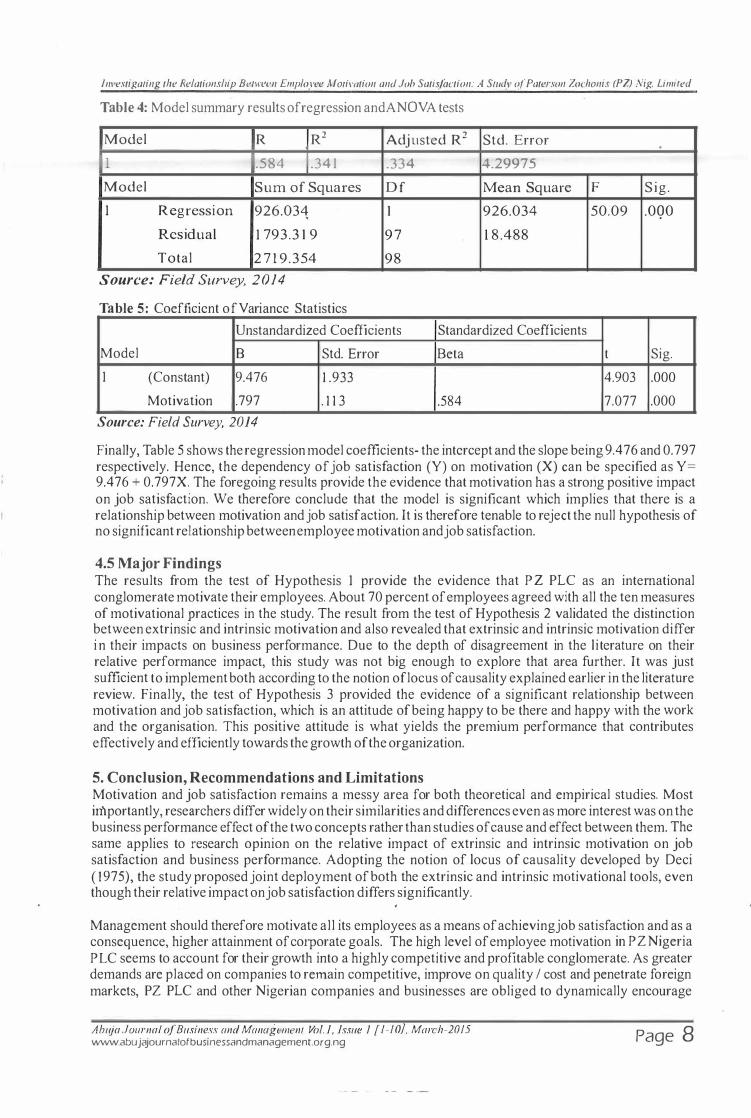
To test this hypothesis, the response categories in Table 1 and the response categories in Table 2 were summed up respectively into an aggregate measure of motivation and job satisfaction. They were presented for conelation, regression and analysis of variance (ANOVA) tests, the results of which are reported next. The simple correlation test indicates a positive or negative relationship between motivation and job satisfaction. The test shows a positive correlation of0.584 atp < 0.00 between motivation and job satisfaction. The regression test of the form Y= Bo+ B ix , where Y and X are dependent and independent variables respectively, was used to test the extent to which motivation is a predictor of job satisfaction. The significant of the fitted model was tested using ANOVA. A fitted model is significant if the ANOVA Fstatistic is less than the critical value at say p < 0.05. Table 4 shows the model summary, with R2 being 0.341 at p = 0.000. The ANOVA test gives an F ratio of 50.09 which is significant at p = O.OOO.The regression sum of squares also indicate an F-ratio of50.09 which is significant atp = 0.000.
Ahuja Journal of Business and Management Vol. /, Issue 1 [ 1-1 OJ, March-2015 www.abujajournalofbusinessandmanagement.org.ng Page 7
Investigating the Relationsllip Bellreen Employee Motivation and Job Satisfaction: A Study of Paterson Zochonis (PZ) Nig. Limited
Table 4: Model summary results of regression andANOVA tests
Model R Rz Adjusted R2 Std. Error .
1 .584 .34 1 .334 4.29975 Model Sum of Squares Df Mean Square F Sig.
1 Regression 926.034 < 1 926.034 50.09 .OQO Residual 1 793.3 1 9 9 7 1 8 .488
Total 2 7 1 9.354 98
Source: Field Survey, 2014 Table 5 : Coefficient of Variance Statistics
Unstandardized Coefficients Standardized Coefficients
Model B Std. Error Beta t Sig.
1 (Constant) 9.476 1 .933 4.903 .000
Motivation .797 . 1 1 3 .584 7.077 .000
Source: Field Survey, 2014 Finally, Table 5 shows the regression model coefficients- the intercept and the slope being 9.476 and 0. 797 respectively. Hence, the dependency of job satisfaction (Y) on motivation (X) can be specified as Y= 9.476 + 0.797X. The foregoing results provide the evidence that motivation has a strorig positive impact on job satisfaction. We therefore conclude that the model is significant which implies that there is a relationship between motivation and job satisfaction. It is therefore tenable to reject the null hypothesis of no significant relationship between employee motivation and job satisfaction.
4.5 Major Findings The results from the test of Hypothesis 1 provide the evidence that PZ PLC as an international conglomerate motivate their employees. About 70 percent of employees agreed with all the ten measures of motivational practices in the study. The result from the test of Hypothesis 2 validated the distinction between extrinsic and intrinsic motivation and also revealed that extrinsic and intrinsic motivation differ i n their impacts on business performance. Due to the depth of disagreement in the literature on their relative perfotmance impact, this study was not big enough to explore that area further. It was just sufficient to implement both according to the notion oflocus of causality explained earlier in the literature review. Finally, the test of Hypothesis 3 provided the evidence of a significant relationship between motivation and job satisfaction, which is an attitude of being happy to be there and happy with the work and the organisation. This positive attitude is what yields the premium performance that contributes effectively and efficiently towards the growth of the organization.
5. Conclusion, Recommendations and Limitations Motivation and job satisfaction remains a messy area for both theoretical and empirical studies. Most importantly, researchers differ widely on their similarities and differences even as more interest was on the business performance effect of the two concepts rather than studies of cause and effect between them. The same applies to research opinion on the relative impact of extrinsic and intrinsic motivation on job satisfaction and business performance. Adopting the notion of locus of causality developed by Deci ( 1975), the study proposed joint deployment of both the extrinsic and intrinsic motivational tools, even though their relative impact on job satisfaction differs significantly.
Management should therefore motivate all its employees as a means of achievingjob satisfaction and as a consequence, higher attainment of corporate goals. The high level of employee motivation in PZ Nigeria PLC seems to account for their growth into a highly competitive and profitable conglomerate. As greater demands are placed on companies to remain competitive, improve on quality I cost and penetrate foreign markets, PZ PLC and other Nigerian companies and businesses are obliged to dynamically encourage
Abuja Journal of Business and Management Vol. I, Issue I [1-10}, March-2015 www.abujajournalofbusinessandmanagement.org.ng Page 8
Investigating the Relationship Between Employee Motivation and Job Satisfaction: A Study of Paterson Zochonis (PZ) Nig. Limited
their employees from both dimensions of extrinsic and intrinsic motivation. The need arises however to identify and strengthen the dimension that are of greater value to employees. Unless this is done, most spending and programmes of motivation may be money .down the drain. One powerful motivational tool which however is hard to position between extnnsic and intrinsic motivation is share ownerships scheme. Over a long working l ife, an employee may become a major shareholder in a company to which he has committed his life and career.
This study has some limitations- time and money. Als6, the permission to conduct this kind of study appears rather hard to secme. The regular excuse was no time and that operations would get disrupted. Accordingly, only one company was studied even as the researcher was made to scale down the investigation. Further studies are required to gauge the relative effectiveness of the two dimensions of motivation. This is in addition to modeling studies which could clarify the direction of cause and effect between motivation and job satisfaction.
References Adeleye, E.O. 2002, "An Investigation into Agile Manufacturing Design", Nottingham UK: The
Nottingham Trent University Press, Unpublished PhD Thesis Adeleye, E.O. and Oni, M.O. 2014, "A Study of the Impact of Organisational Structure on the
Performance of Mobile Telecoms Network (MTN) Nig. Ltd., African Journal of Stability and Development, 8 ( 1 ) : 38- 50.
Ajayi, A.B. 201 1 , " Motivation and Job Satisfaction as a Basis for Productivity". University of Ilorin, Nigeria, UnpublishedMSc. Dissertation
Ajila, C. and Awonusi, A. 2004, "Influence of Rewards on Workers Performance in an Organization", Journal ofSocial Science, 8( 1 ) : 7- 1 2
Akanbi, P.A. 20 1 4, " Influence o f Extrinsic and Intrinsic Motivation o n Employees' Performance" ,Accessed 1 3/8/ 14 : http://www. indabook. org/previewlarlotrtdbRb Y5XdW
Alderfer, C. P. 1 972, "Existence, Relatedness and Growth: Human Needs in Analysis of the Factors that Affect Job Satisfaction: A Case Study on Private Companies Employees of Bangladesh", Retrieved 1 9/3/ 1 3 www.iiste.org
Aziri, B . 20 1 1 , "Job Satisfaction: A LiteratW'e Review", ManagementResearch andPractice, 3(4):77-86 Bailey, T. 1 993, "Discretionary Effort and the Organization ofWork: Employee Participation and Work
Reform since Hawthorne", Columbia University, New York, Working Paper David, M. S . and DavenpOJi, M. A. 200 1 , Using SPSS to Solve Statistical Problems: A Self-Instruction
Guide, USA: Merrill Prentice Hall Dawson, B. 2005, "Motivation Leads to Better Results", Journal of Rubber and Plastics, 3 7:11-15 Deci, E.L. 1 975, Intrinsic Motivation, New York: Plenum Fuller, M.A, Valacich, J.S. and George, J.F. 2008, "Information Systems Project Management: A Process
and Team Approach ", New Jersey: Prentice Hall Inc. Goldthorpe, J.H., Lockwood, D., Bechhofer F. and Platt J . 1 969, "The Affluent Worker: Industrial
A ttitudes and Behaviour, " Cambridge Studies in Sociology, 1:167- 1 69 Herzberg, F., Manser, J. and Synde1man, B.B. 1 959, "The Motivation ofWork'. New York: John Wiley and
Sons Inc. Herzberg, F. 1 966, "Work and the Nature of Man ", Cleveland: World Publishing Company
Jibowo, A.A. 1 997, "Effect of Motivators and Hygiene Factors on Job Performance among Extension Workers in the Former Western State ofNigeria", The Quarterly Journal of Administration, 1 2 ( 1 ) : 45-54
Kian T.S., Yusoff, W.F. and Rajah S. 2014, "Job Satisfaction and Motivation: What are the Difference among these Two?" European Journal ojBusiness and Social Sciences, 3(2): 94- 1 02
Kirkman, B. L. and Shapiro, D. L. 200 1 , "The Impact of Cultmal Values on Job Satisfaction and Organizational Commitment in Self-Managing Work Teams: The Mediating Role of Employee Resistance", Academy ofManagementJournal, 44(3):557-570.
Maslow, A. 1 943, "ATheoiy ofHuman Motivation", Psychologica/Review,July: 370-396. Maslow, A. 1 954, "Motivation and Personality ", New York: Harper and Row McClelland, D. C. 1 96 1 , "The Achieving Society ", New York : Van Nostrand Reinhold
Abuja Journal of Business and Management Vol. /, Issue I [ 1-1 OJ, March-2015 www.abujajournalofbusinessandmanagement.org.ng Page 9

Investigating the Relationship Between Employee 1\1/otivation and Job Satisfaction: A Study of Paterson Zochonis (PZ) Nig. Limited
Ogungbamila, B . 2006, "Psychological Needs and Workplace Commitment of Selected Local Government Workers", Aji·ican Journal for the Psychological Study ofSocialissues, 9(2): 1 52- 1 6 1
Ojokuku, R . M . 2007, "Impact of Rewards Ol) Motivation ofWorkcrs: A Study of the Civil Service ofOsun State, Nigeria",lnternational Business Management, 1 (4):99-103
Olagunju, O.A. 201 1 , "Impact ofMotivation on Productivity in the Service Industry", University ofllorin, Nigeria, Unpublished B.Sc. Dissertation
Paul, A.K. and Anantharaman, R.N. 2003, "Impact of People Management Practices on Organizational Perfom1ance: Analysis of a Causal Model", International Journal of Human Resource Management, 1 4(7): 1 246-1266
Pinder, C. C. 1 998, "WorkMotivation in Organizational Behavior". N.J. : Prentice Hall Pratheepkanth, P. 20 1 1 , "Reward System and its Impact on Employee Motivation in Commercial Bank of
Sri Lanka Plc in Jaffna District", Global Journal of Management and Business Research, 1 1 ( 4 ): 84-92
Reece, L. B. and Brandt, R. 1 996, "Effective human Relations in Organizations ". 6th Edition. Boston
Toronto: Houghton Mifflin Company Ryan, R.M. and Deci, E.L. 2000, "Self -determination Theory and the Facilitation oflntrinsic Motivation,
Social Development and Well-being", American Psychologist, 55 : 68-78 . Robbins, S.P. and Judge, T.A. 20 10, "Essentials of Organisational Behaviour". 1 Oth Edition. New Jersey:
Pearson Educational Publishers. Sansone C. and Harackiewicz, J. M. 2000, Intrinsic and Extrinsic Motivation - the Search for Optimal
Motivation andPe1jormance, California: Academy Press Schmidt, C.T and Scholl, R.W 20 14, "Sources of Motivation", Accessed 1 2/08/2014 :
http :1 lwww. uri. edu/researchllrclscholllwebnotes/Motivation _Sources. htm Selden, A. and Facer, Q. 2000, "Introduction to Human Resource Management". Theory and Practice,
New York: Palgrave. Teck-Hong, T. and Waheed, Amna 201 1 , "Herzberg's Motivation-Hygiene and Job Satisfaction in the
Malaysian Retail Sector: Mediating Effect of Love of Money", Asian Academy of management Journal, 16 ( 1 ):73-94
Tella, A., Ayeni, C.O. and Popoola, S.O. 2007, "Work motivation, Job satisfaction and Organisational Commitment of L ibrary personnel in Academic and Research Libraries in Oyo State, Nigeria", Library Philosophy and Practice, April : 1 - 1 6
Tyi1ana, G . 2005, "The Relationship of Extrinsic, Intrinsic and Demographic Predictors to Various Types ofWithdrawal Behaviours", Journal of Applied Psychology, 70:442-450
Abu) a Journal of Business and Management Vol. !, Issue 1 [ 1-1 OJ, March-20 15 www.abujajournalofbusinessandmanagement.org.ng Page 1 0

The Influence of Investors Sentiment on Stock Market Returns in Nigeria
Mohammed Zubairu Department of Business Administration, Ahmadu Bello University, Zaria - Nigeria
Abstract: The study investigates how investors ' sentiment index (Non- market fundamental), equity market fundamentals (long term interest rate and excess demand for equity) and economic fundamentals (expected inflation) impact on equity prices. In the estimation of collected data, an econometric technique known as the ordinary least square regression (OLS), error-correction models (ECM), unit root and cointegration test were adopted. Results show that investors' sentiment had a statistically significantly relationship with equity prices in Nigeria for both in the short and long run. In the case of long term interest rate and excess demand for equity, in the short run the impact of excess demand for equities was statistically significant but both of them became statistically insignificant in the long run. This means that investors in Nigerian often consider short run equity marketfundamentals than long run. The expected inflation rate was statistically insignificant both in the short and long run. This shows that investors in Nigeria's equity market are likely to ignore economic news but focus more on sentiment when investing in shares. The study recommended that investors would be better off when they know and avoid the potential psychology bias that is detrimental to their investment policy guideline or objectives. · Keywords: Investor Sentiment, Stock Returns, Consumer Confidence Index, and Economic Sentiment Indicator.
1.0 Introduction There have been controversies among scholars, researchers and finance professionals with regards to what triggers movement in equity prices in emerging equity markets. This disagreement among financial experts has taken a new dimension since the coming of indices for measuring investors' sentiment. The introduction of investor's sentiment as an explanatmy variable in predicting equity price moves is now being considered. The disagreement has created different perspective on the issue of investors' sentiment. The classical finance theorists leave no role for investors' sentiment in explaining equity price movement rather they consider competition among rational investors to be the ultimate. Fama ( 1 98 1 ) in his efficient market hypothesis (EMH) argued that available information in the market is all that matters and this information can be either market, economic or non-market driven. This therefore implies that he suppmts the idea of investors' sentiment (non-market) as a determinant of financial asset prices. Technical analysts are another group that have also provided explanations for stock price movement. They used historical financial data, chart and price pattern index to predict equity price movement. In the case of the Capital asset pricing model (CAPM) and the Arbitrager pricing Theory (APT), the CAPM focused only on stock market risk factor in explaining changes in stock prices while the APT related stock prices to unspecified risk factors which may likely include investor's bias. The fusion theory which is a holistic approach uses market, economic and non-factors (investors' sentiment) in explaining the systematic variations in equity prices but the fusion theory lack empirical evidence in Nigeria. In explaining stock market price dynamics in Nigeria, there has been quiet a large volume of literature and these literatures tend to use firm specific factors, CAPM and APT models without given consideration to investors sentiments.( see Osaze, 2000; Alilc and Anao, l 986; Udcgbunam and Oaikhenan, l 999; Omole and Falokun, l 999; Emenuga 1989; Yohannes 1999; !nanga and Emcnuga, 1 997; Edo, l 996 among others). This study therefore seeks to fill this gap.
This study seeks to provide answers to the following research questions; Does investors' sentiment cause significant movement in equity prices in emerging stock market? And to what extent do market and economic fundamentals explain variations in stock market prices?
Abu) a Journal of Business and Management Vol. /, Issue 1 [ 11-29], March-2015 www.abujajournalofbusinessandmanagement.org.ng Page 1 1

The fnjluence of Investors Sentiment on Stock Market Retums in Nigeria
The objectives of this study are to evaluate the impact of investor's sentiment on equity price movement in an emerging stock market like that of Nigeria and also to evaluate the extent to which economic and market fundamentals contribute to equity price movement in Nigeria. In order to realize the objectives of this research, the following hypothesis have been formulated and tested:
H01: Investors sentiment has no significant relationship with equity prices. H01: Mai·ket rate ofreturns (long term interest rate) has no significant relationship with equity prices. H03: Inflation exerts a non significant impact on equity prices. H04: Equity market demand and supply imbalance (excess demand for securities) is not related to equity prices movement.
1.0 Review of Literature 2.1 Concept and Evidence of investors Sentiment The need to integrate investors' sentiment as a factor responsible for equity price movement has recently being debated in behavioural finance. In describing the concept of investors' sentiment, there have been arguments among financial economists and finance experts. Barker and Stein (2004) described investors' sentiment as the misevaluation that is created by a group of investors. Lee, Shleifer and Thaler ( 1 99 1 ) viewed investors' sentiment as investors' beliefs that are not justified by market and economic fundamentals. In Zwerg ( 1973), Brown and Cliff (2005), it was revealed that investors' sentiment is the discrepancy that exist between rational and irrational investors. This therefore means that investors' heterogeneity can also be called investors sentiment. Prior empirical studies on investors' sentiment and how the concept can be measured have generated the issue of whether investors' sentiment is directly observable or not. This is why investors' sentiment i s viewed by some researchers from a normative perspective. The definition of Baker and Wurgler (2007) confirms the subjective nature of investors' sentiment. They described investors' sentiment as what asset prices should be and not what it is.
There are quite a numbers of ways investors' sentiment can be developed and these investors sentiment formation process are rooted in behavioural finance. Traditional finance theory centered on market and economic fundamentals in explaining equity price movement but recent market situations all over the world have shown that behavioural factors have a strong influence on the valuation process of financial assets. The major forms of investor's' sentiment are drawn from heuristic-driven bias, noise trading, limits to arbitrage, frame dependence, emotions and social influence and others. The heuristic-driven bias centred on overconfidence, anchoring, representatives, innumeracy and aversion to ambiguity. Overconfidence manifests itself in excessive trading in equity markets. Solt and Statman(l 989) and Shefrin and Statman(1 996) relate investor's bias in pricing assets to overconfidence and this tends to occur when the investor's overestimate the accuracy of asset prices forecasts. Overconfidence to investor's is like a stimulant that is based on the use of special information or knowledge. This means that investor's trade excessively when they are overconfident. Anchoring bias results when after forming an investment opinion, investor's are unwilling to change their opinions even when market and economic fundamentals are changing. The anchoring bias is a major attack on the efficient market hypothesis (EMH).
Representativeness, as another form of heuristic-driven bias is the tendenc1' of investor's to form investment judgements based on stereotypes. Equity investors may beliefthat a stable growth of corporate earnings in the past may be representative of high growth rate in future. This is why investor's would continue to buy stock even when economic and market fundamentals arc weak. Innumeracy as a form of investor's sentiment affects investors' asset pricing process and it simply describes the investors experience in calculating and estimating data for stock market price determination. The innumeracy bias is a potential explanation of why investors ignore market and economic mathematics in pricing equity. Aversion to ambiguity bias as a type of investors' sentiment that is heuristic-driven refers to the investors fear for ambiguous information and uncertainty. This aspect of investor's biases creates a situation where investors trade irrationally when there is rum om or unclear information.
Frame dependence is an aspect of investor's sentiment formation that is derived from emotional and cognitive factors. The emotional aspects of frame dependence focuses on how investors feel when they
Abu) a Journal of Business and Management Vo/. 1, Issue 1 [11-29], March-2015 www.abujajournalofbusinessandmanagement.org.ng Page 1 2
The Influence of Investors Sentiment 011 Stock Market Returns in Nigeria
receive and digest stock market information while the cognitive aspect refers to how investors organise information mentally, in particular how investors react to gains and loss outcomes. Kahneman and Tversky ( 1.982) in their prospect the01y followed the frame dependence approach in explaining investors' decision making under uncertainty. They stated that investors frame and values plays a vital role in their actions under uncertainty, and that investors feel more strongly about the pains from loss than the pleasure from an equal gain. Thaler ( 1985) used the concept of mental accounting to explain frame dependence. In mental accounting, investors tend to mentally operate two accounts, one of the accounts is managed rationally and the other is managed itTationally. This means that investoi·s are conservative about losing capital invested while the dividend income stream can be spent irrationally. Narrow framing as a form of frame dependence often leads to myopic risk aversions which captured how investors evaluate their asset returns separately rather than as a whole p01tfolio. Market inefficiency and investment mistakes are often common because investors focus on changes in wealth that are narrow in scope both across investment class and over time. Shefrin and Statman ( 1996) in explaining frame dependence they used behavioural portfolio which follows a pyramid pattern and helped on diversifications that result from investors' diversification goals, not from their purposeful asset diversification. This means that most investors do not have efficient portfolio. They often ignore economic and market fundamentals in planning their asset portfolio and take too much risk for the returns expected from their asset portfolio. In explaining frame dependence, the snake bite effect or house-money effect or shadow of the past biases refers to a situation where investors are less inclined to take risk after incurring a huge financial loss.
Herd instincts, overreaction and emotional time line are some of the emotional and social influence that can also affect investors' rationality. Among these emotional and social influence, herd instinct and overreaction has taken center stage. There is a natural propensity for investors to follow market sentiment or follow group investors' investment strategy rather than using market and economic fundamentals. The existence of herd behaviour in most fmancial markets has been greatly discussed by scholars. Scharfstern and Stem ( 1 990) provide evidence that herd instincts, characterised the behaviour of fund managers. The fact that a significant changes in equity prices in most stock market in the world are not necessarily related to the use of markel information or to the fundamental change in economic and corporate performance indexes may lead to the conclusion that certain investors crowd effect exist (Count and Bouchaud,2000). Overreaction as a form of investor bias tend to occur when investors ignore new economic and market information and follow imitated behaviour of certain large group of investors which often overreact to both good and bad news. The overreaction of investors to news is today suspected to be the major cause of stock market bubbles and crashes. This therefore means herd behaviour and overreaction are non-market fundamental factors that cause upward or downward trend in stock price. This in other words means that investors' sentiment is a potential factor to consider when predicting stock market price crashes or bubbles.
Noise trading and limits of arbitrage are also accepted causes of market inefficiency. Noise traders are group of investors that are not rational. They trade equity base on their beliefs or sentiment and not by stock fundamentals. De Long and Shleifer ( I 989) found out that prices can actually diverge significantly from fundamental values even in the absence of fundamental risk and that noise traders strategy is becoming more attractive due to high chance of the noise trader earning higher than the rational investors. The continued practice of noise trading has generated the arbitrage profit opportunities. Arbitragers operations are also a cause of price v·ariations as they try to take advantage of mood swings of noise traders. Shleifer and Summers (1 990) identify arbitrage practices as a stimulant which interest other rational investors to contribute to further deviation between asset prices and their fundamental values. This means that arbitrageurs in the short-rw1 create market prices jw11ps and at the same time help to return asset prices to their fundamentals. Brown ( 1999) explain the effect of noise traders, he described noise traders as non-professional traders with no special information. He found out that when there is shifts in investors' market sentiment, noise traders move together and take similar actions thereby increase the prices ofthei r targeted securities.
2.2 Measurement oflnvestors Sentiment Fmihcnnorc, recognizing the fact that investors sentiment exist is no longer an issue in finance, what matters is how the concept can be quantified and how it triggers movement in equity prices in the stock
Abu) a Journal of Business and Management Vol. /, Issue I [11-29], March-2015 www.abujajournalofbusinessandmanagement.org.ng Page 1 3

The Influence of Investors Sentiment on Stock Market Retums in Nigeria
market. Many investors sentiment index have been identified in the academic literature, for instance Fisher and Statman (2003) used the ratio of investors optimism to pessimism from a survey to proxy
. investors sentiment. Investors and consumer confidence ind.ex was adopted by Charocnrock (2003) and Fisher and Statman (2003) while Lashgair (2003) used a specific confidence index called Barron's confidence index to measure investors sentiment/confidence in the market. Dennis and Mayhow (2002) use the ratio of put to call. This index is highly limited in emerging stock markets due to the non-existence of a recognised options market. Whaley (2000) usc VIX investors fear Gauge which is popularly known · as implied option volatility. This index i s also limited due to the absence ofunorganised options market in emerging countries. Branch ( 1 976), Randhall, Suk and Tully (2003), Neal and Wheatley ( 1 998) measured investors sentiment using mutual fund cash reserve. They stressed that low cash holding of mutual fund managers is an indicator of aggressive buying (investors' optimism) while large cash balance is as a result of investors pessimism or uncertainty in the market. Kein and Madhavan (2000) use bid-ask spread of quoted traded stock in New York stock exchange (NYSE) to explaining investor's sentiment. To them, a wide deviation between the bid and ask seat prices indicates high level of investors sentiment. The closedend fund discount was also heavily use by researchers in capturing investors sentiment, see Lee, Schleifer and Thaler ( 1 99 1 ), Neal and Wheatley ( 1 998), Baker and Wurgler (2006) and Chopra, Lee, Schleifer and Thaler ( 1993 ).
The problem of finding a best proxy for investors' sentiment was also tackled by some researchers through the use of composite/group index. The most respected and popular composite index for investors' sentiment is found in the work of Baker and Stein (2004) and Baker and Wurgler (2004). In their composite sentiment index they used measures like investors survey, retail investors trades, investors mood proxies (weather, seasonal and periodical factors which affects investors attitude to invest), mutual fund flows, dividend premium, closed end fund discounts, option implied volatility, first day retums on initial public offerings, volume of initial public offering (IPO), new equity issues and trading volume. Guohua (2008), uses four sentiment measures and these are short sell volume, turnover ratio (average turnover for 10 days divided by averaged turnover for 250 days), Relative strength index, money flow index, insider trading and the level of institutional ownership. The relative strength index which is popular known as RSI index is used to determine the level of oversold and overbought attitude of investors while the insider trading and institutional ownership was seen as a good proxy for investors' sentiment because owners and executives of companies have material information. This therefore means that insider trading patterns may indicate sentiment. Seyhun ( 1 998) gives evidence that users of insider trading information can predict stock returns.
Baker and Wurgler (2006), the measurement of investors sentiment can also be viewed from two perspectives and these are Microeconomic approach (Bottom-up) and Macroeconomic approach (Topbottom or Mass investors psychology). The microeconomic approach sees investors' sentiment from a specific firm, investor, stock or industry. The adoption of this method favours the use of cross sectional data. The macroeconomic approach evaluates investors' sentiment from an aggregate perspective and most often through the use of time series data. In the Nigerian stock market, there are available time series data on the volume of trading, new issues and initial public offers (IPO) volume. The above discussion shows that these three indicators are part of the composite for measuring investors' sentiment and as such can be used to proxy investors' sentiment in Nigeria. There are some consensuses among researchers in the use of new issues and the volume of initial public offers (IPO) as proxies for investors' animalistic behaviour (bull and bear sentiment).
The use of traded volume of stock as an indicator for investors' sentiment is subjected to debate and modification. Osaze (2000) ascertained that the volume of trading in stock to some extent actually measures the degree of investors' emotions. Baker and Stein (2004) in their composite index mentioned trading volw110 as a measure of investors' sentiment. Trading volume which is generally refcned to as market liquidity, can also be used to represent investors' emotions. !national investors are more likely to trade, and thus add to market liquidity. Karpoff(1 986) and Harris and Raviv (1 993) revealed that investors sentiment/emotions becomes high when trading volume increases. This shows that investors' sentiment becomes high when there is increase in investors' heterogeneity which serves as oxygen for continuous increase in stock trading. Johnson, Lei, Lin and Sanger (2006) argued that the use of trading volume at
Abuja .Joumal of Business and Management Vo/. 1, issue I [11-29}, March-2015 www.abujajournalofbusinessandmanagement.org.ng Page 1 4
The Influence of Investors Senlimenl on Stock Markel Returns in Nigeria
levels is not a good measure of investors' sentiment. They see trading volume trend as a better measure. They also stress that there is the need to empirically differentiate levels oftrading volume from trend of trading volume. Triiding volume at levels according to them is a snapshot of the investors' sentiment at a point in tlme while trend volume summarizes the dynaiDJc process of investors' sentiment/emotions. Another powerful time series index for measuring investors sentiment can be derived from the all share price index (Asle) such as from the Nigerian all share price index, Dow Jones industrial average price index, Standard and poor(S&P) 500 index amongst others as used in other countries. Bandopadhyaya (2006) utilized the S&P 500 stock price index to generate a barometer for measuring investors' sentiment. The conclusion from his data estimation and analysis revealed that the obtained residual or error term from regressing current S&P 500 price index against previous S&P 500 price index is a sound indicator of nonmarket factor or investors' sentiment. This method of measuring investor sentiment is highly efficient in countries where option and investor's survey or mutual fund data are not readily available. The Bandopadhyaya investors' sentiment index is time series in nature and makes it possible to summarize investors' emotions over time.
2.3 Asset Pricing Theory and Investors Sentiment In pricing financial assets, most stock price models linked price adjustment to changes in market and economic fundamentals. These models include the Random-walk hypothesis, Capital asset pricing model (CAPM), Arbitrage pricing theory (APT) and the efficient market hypothesis (EMH).The Random-walk hypothesis as one of the fundamental equity price models attempt to explain the movement of prices around its fundamental values. Fama ( 1 965) pointed out that the theory relates fundamental value to potential earnings of stocks and that the current prices of any equity traded are based on its fundamental value. The fundamentals value of equity in the theory was related to all forms of new information and any discrepancies between the current prices and the fundamental values would be random and short-lived.
The basic theme of the random walk hypothesis theory of equity prices determination is traced to the assumption that the fundamental value of equity is determined by new information and when this new information gets to the market, the current prices would adjust to them immediately. The issue of investors' sentiment is a serious concern to the theorist of random-walk hypothesis because sometimes, new information might come in the form of noise, rumours, hearsay etc which are part of investors' sentiment. The presence of irrational investors can create a golden opportunity for traders to embark on speculative activities and panic trading which widen the discrepancy between current equity prices and their fundamental values. Fama ( 1970), in extension of the pattern of equity price behaviour brought into literature the concept of efficient market hypothesis (EMH). The hypothesis stress that predicting equity prices using market fundamentals or trends and charts is a waste of time and resources. According to Fama, cunent stock market prices move in a random pattern and it has no memory of past prices pattern. In EMH, equity prices would always reflect their tlue values and any deviation is immediately restored but this restoration process might be limited by information asymmetry and investors irrationality. Stock market price correction process is attributed to the activities of arbitrager. The actions of equity market price arbitragers if disturbed can create abnormal market prices movement such as market boom or crash. Investors' sentiment, when related to the above issue becomes a major driving force of abn01mal returns and arbitrage activities.
APT model as formulated by Ross ( 1976) rests on the assumption that equity prices are determined by some selected number of multi-risk factors. The APT model unlike the CAPM which uses beta as the single-market risk uses macroeconomic variables and non-market factors as risk factors. Brealey (2006), related equity price returns to pervasive macroeconomic factors and partly on noise. This means that the APT model if extended can accommodate investors' sentiment which is the cause of noise trading. There is a recent approach to explaining asset price determination called the fusion approach. This approach has further become important due to the huge criticism most behavioural finance expert has mounted on the popular CAPM and APT pricing models. They argued that the assumption of investors' homogeneity and the complete neglect of investors' psychological bias in pricing asset are unacceptable (Lee, 2003). This approach supports the usc of market and economic fundamentals (such as rate of return, demand and supply for securities, market risk and macroeconomic factors) and investors' sentiment in explaining asset pricing. Pindyck ( 1 988) revealed that cqu i ty prices react more readily and faster to macroeconomic news
Abuja Journal of Business and Management Vol. /, Issue I [11-29], March-2015 www.abujajournalofbusinessandmanagement.org.ng Page 1 5
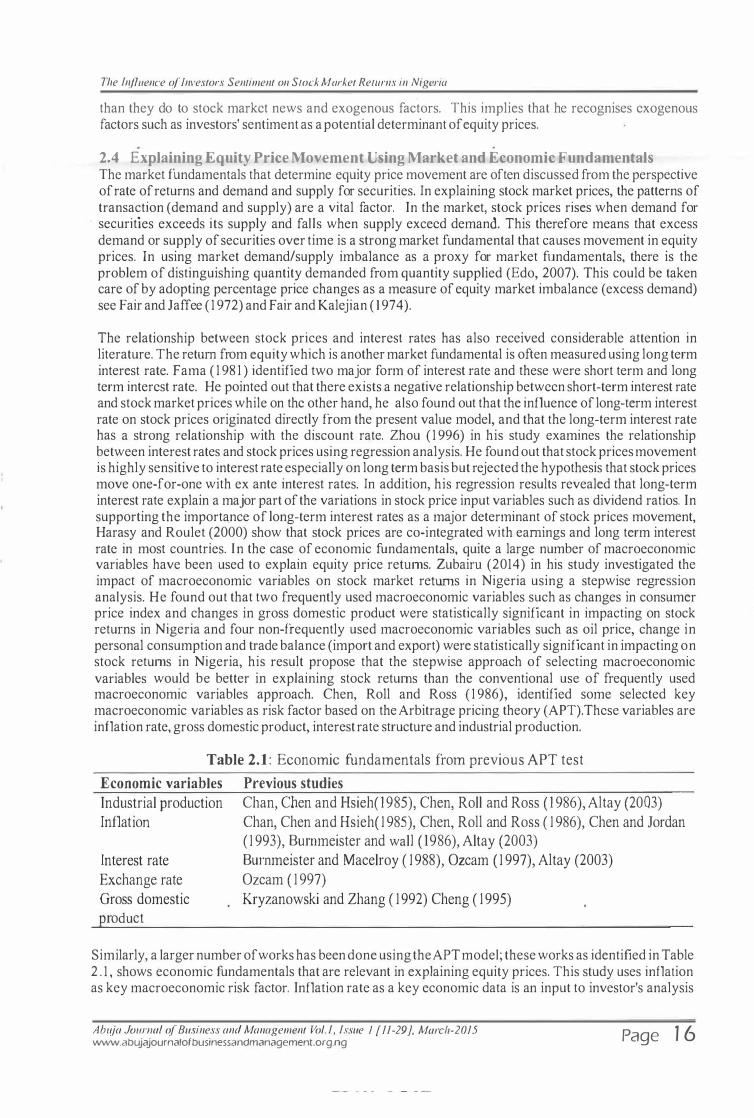
The Influence of Investors Sentiment on Stock Market Retums in Nigeria
than they do to stock market news and exogenous factors. This implies that he recognises exogenous factors such as investors' sentiment as a potential determinant of equity prices.
. .
2.4 Explaining Equity Price Movement Using Market and Economic Fundamentals The market fundamentals that determine equity price movement are often discussed from the perspective of rate of returns and demand and supply for securities. In explaining stock market prices, the patterns of transaction (demand and supply) are a vital factor. In the market, stock prices rises when demand for securities exceeds its supply and falls when supply exceed demand. This therefore means that excess demand or supply of securities over time is a strong market fundamental that causes movement in equity prices. In using market demand/supply imbalance as a proxy for market fundamentals, there is the problem of distinguishing quantity demanded from quantity supplied (Edo, 2007). This could be taken care of by adopting percentage price changes as a measure of equity market imbalance (excess demand) see Fair and Jaffee ( 1 972) and Fair and Kalejian ( 1 974).
The relationship between stock prices and interest rates has also received considerable attention in literature. The retw-n from equity which is another market fundamental is often measured using long term interest rate. Fama ( 1 98 1 ) identified two major form of interest rate and these were short term and long term interest rate. He pointed out that there exists a negative relationship between short-term interest rate and stock market prices while on the other hand, he also found out that the influence of long-term interest rate on stock prices originated directly from the present value model, and that the long-term interest rate has a strong relationship with the discount rate. Zhou ( 1 996) in his study examines the relationship between interest rates and stock prices using regression analysis. He found out that stock prices movement is highly sensitive to interest rate especially on long term basis but rejected the hypothesis that stock prices move one-for-one with ex ante interest rates. In addition, his regression results revealed that long-term interest rate explain a major part of the variations in stock price input variables such as dividend ratios. In supporting the importance of long-term interest rates as a major determinant of stock prices movement, Harasy and Roulet (2000) show that stock prices are co-integrated with eamings and long term interest rate in most countries. In the case of economic fundamentals, quite a large number of macroeconomic variables have been used to explain equity price returns. Zubairu (2014) in his study investigated the impact of macroeconomic variables on stock market returns in Nigeria using a stepwise regression analysis. He found out that two frequently used macroeconomic variables such as changes in consumer price index and changes in gross domestic product were statistically significant in impacting on stock returns in Nigeria and four non-frequently used macroeconomic variables such as oil price, change in personal consumption and trade balance (import and export) were statistically significant in impacting on stock returns in Nigeria, his result propose that the stepwise approach of selecting macroeconomic variables would be better in explaining stock returns than the conventional use of frequently used macroeconomic variables approach. Chen, Roll and Ross ( 1 986), identified some selected key macroeconomic variables as risk factor based on the Arbitrage pricing theory (APT).These variables are inflation rate, gross domestic product, interest rate structure and industrial production.
Table 2.1 : Economic fundamentals from previous APT test
Economic variables
Industrial production Inflation
Interest rate
Exchange rate
Gross domestic roduct
Previous studies
Chan, Chen and Hsieh( 1 985), Chen, Roll and Ross ( 1 986), Altay (2003)
Chan, Chen and Hsieh( 1985), Chen, Roll and Ross ( 1986), Chen and Jordan ( 1993), Burnmeister and wall ( 1986), Altay (2003)
Burnmeister and Macelroy ( 1988), Ozcam ( 1997), Altay (2003)
Ozcam ( 1997)
Kryzanowski and Zhang ( 1992) Cheng ( 1995)
Similarly, a larger number of works has been done using the APT model; these works as identified in Table 2 . 1 , shows economic fundamentals that are relevant in explaining equity prices. This study uses inflation as key macroeconomic risk factor. Inflation rate as a key economic data is an input to investor's analysis
Ahuja Journal of Business and Management Vol. I, Issue I [11-29], March-2015 www.abujajournalofbusinessandmanagement.org.ng Page 1 6
The Influence of Investors Sentiment on Stock Market Returns in Nigeria
(see Fama and Gibbons, 1 984). For inflation rate and how it affects stock prices, there has been two major blocks. The first block argued that equity does not hedge against inflation. Giammarino (2000) cited studies of various time peri9ds and for many countries and provided empirical evidence th�t equity price is not a perfect hedge agamst inflatiOn. This means that both variables are not positively related. The other block which is generally supported by empirical studies, argued that equity prices is negatively affected by inflation rate. See Domain, Gilster and Louton ( 1 996) and Reilly ( 1997). The work of Reilly clearly explains that inflation is most often a cmse than a blessing to firms that cannot pass the increase prices of production to their final co'nsumers. His finding also revealed that inflation negatively impact on firms decomposed performance ratios such as returns on equity(ROE), returns on asset(ROA) and returns on capital employed(ROCE).
Real world experience has shown that investors are more concerned about expected inflation and not necessarily on cunent inflation. Fama and Gibbond( l 984), Brandt and Wang(2003), Fama and Schwert ( 1 977), Jaffe and Mandelker ( 1 976) and Nelson( 1 976) forms a wide literature that stresses the point, that expected inflation is what matters to equity prices movement and not the rate of inflation. Expected inflation if quantified would be a major determinant of companies expected real income, expenses and cash flow which are fundamental to equity price valuation. Niemira and Klein ( 1994) revealed that an inverse relationship exist between inflation expectation and the stock market prices. It was found out from their work, that leading inflation indicators were derived from inflation expectations.
2.5 Explaining Equity Price Movement Using Investor Sentiment Investor's sentiment is a non-market factor that is also subjected to debate as regards its impact on equity price movement. Johnson, Lee, Lim and Sanger (2006) argued that investor's sentiment has no influence on equity pricing especially in a frictionless market and that even if it does generate abnormality in prices, arbitrager would estimate and eliminate the differences immediately. Delong, Shleifcr, Summers and Waldman ( 1990), Miller ( 1977), Black ( 1 986) and Shleifer .and Vashny(l 997) all posited that in real market situations, market frictions limit arbitrage activities and that investors sentiment causes movement in equity prices. They further identified institutional friction such as noise trader risk as a factor that limits the activities of rational investors. Baker and Wurgler (2004) argued that investors' sentiment affects asset prices and are commonly observed in investors' attitude to stock from young, small, unprofitable, extreme growing or distressed stocks.
The relationship between investors' sentiment and equity prices is clearly deduced from the work ofMiller ( 1977). He argued that stock prices reflect investors' optimistic opinions. That is prices are driven upwards when investors become more optimistic (investors sentiment is high). This therefore suggests that investors' sentiment and equity prices are positively related. This in another way shows that pessimistic investors will ginger fall in equity prices through panic selling which when unchecked, can lead to stock market price crash.
3.0 Analytical Framework and Model Specification In formulating the model for this study, the following variables, all share price index (dependent variable), investors' sentiment index, expected inflation, excess demand for equity; long term interest rate I rate of returns (independent variables) were used. To proxy investors' sentiment over time, three measurement indicators were considered. These are new issues or IPO volume index, Volume of shares traded (liquidity) index and the Bandopadhayaya investor sentiment index. The new issues or initial public offer (IPO) volume index of measuring the degree of investors' emotions in the capital market is clearly supported by Baker and Wurgler (2006) and Brown and Cliff (2004).They argued that the demand for initial public offer in the new issues market is extremely sensitive to investor's sentiment. This therefore means that investors sentiment are high when the volume of shares bought through IPO in the new issues market is large while the reverse is the case when equity traded through IPO is low. The recent drastic fall ·
in shares sold through IPO window in Nigeria is a clear indicator that investors' confidence in the market is low while the boom in the same IPO market (i .e animalist attitude of investors) during the Bank consolidation and economic reforms period was a clear indication that investors' confidence in the capital market was high.
Abu) a Journal of Business and Management Vol. I, Issue I [ 11-29], March-20 15 www.abujajournalofbusinessandmanagement.org.ng Page 1 7
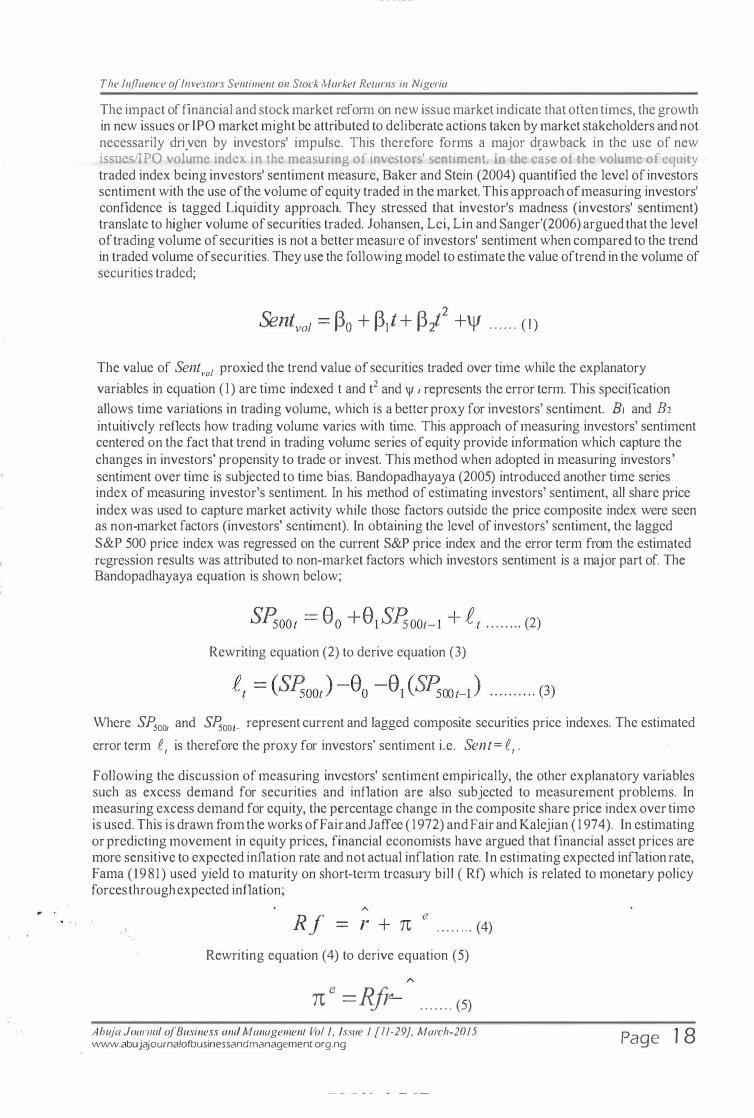
The Influence oflm•estors Sentiment 011 Stock Markel Returns in Nigeria
The impact of financial and stock market reform on new issue market indicate that often times, the growth in new issues or IPO market might be attributed to deliberate actions taken by market stakeholders and not necessarily driyen by investors' impulse. This therefore forms a major d�awback in the use of new issues IPO volume index in the measuring of investors' sentiment. b .he case o!' the volume of equity traded index being investors' sentiment measure, Baker and Stein (2004) quantified the level of investors sentiment with the use of the volume of equity traded in the market. This approach of measuring investors' confidence is tagged Liquidity approach. They stressed that investor's madness (investors' sentiment) translate to higher volume of securities traded. Johansen, Lei, Lin and Sanger'(2006) argued that the level of trading volume of securities is not a better measw·e of investors' sentiment when compared to the trend in traded volume of securities. They use the following model to estimate the value oftrend in the volume of securities traded;
Sentvol = �0 + �J+ �l2 +\jf . . . . . . ( l )
The value of Sentvol proxied the trend value of securities traded over time while the explanatory
variables in equation ( l ) are time indexed t and t2 and \jl 1 represents the error term. This specification
allows time variations in trading volume, which is a better proxy for investors' sentiment. B1 and B2 intuitively reflects how trading volume varies with time. This approach of measuring investors' sentiment centered on the fact that trend in trading volume series of equity provide information which capture the changes in investors' propensity to trade or invest. This method when adopted in measuring investors'
sentiment over time is subjected to time bias. Bandopadhayaya (2005) introduced another time series index of measuring investor's sentiment. In his method of estimating investors' sentiment, all share price index was used to capture market activity while those factors outside the price composite index were seen as non-market factors (investors' sentiment). In obtaining the level of investors' sentiment, the lagged S&P 500 price index was regressed on the current S&P price index and the error term from the estimated regression results was attributed to non-market factors which investors sentiment is a major part of. The Bandopadhayaya equation is shown below;
Rewriting equation (2) to derive equation (3)
Where SP5001 and SPs001_ represent current and lagged composite securities price indexes. The estimated
error term .e 1 is therefore the proxy for investors' sentiment i.e. Sent= .e 1 •
Following the discussion of measuring investors' sentiment empirically, the other explanatory variables such as excess demand for securities and inflation are also subjected to measurement problems. In measuring excess demand for equity, the percentage change in the composite share price index over timo is used. This is drawn from the works ofF air and Jaffee ( 1972) and Fair and Kalejian ( 1 974). In estimating or predicting movement in equity prices, financial economists have argued that financial asset prices are more sensitive to expected inflation rate and not actual inflation rate. In estimating expected inflation rate, Fama ( 198 1 ) used yield to maturity on short-term trcasllly bill ( Rf) which is related to monetary policy forces through expected inflation;
A Rf = r + n e . . . . . . . . (4)
Rewriting equation (4) to derive equation (5)
n e =Rfp- . . . . . . . (5)
Abt(jq .Journal of Business and Management Vol./, issue 1 [11-29}, March-2015 www.abujajournalofbusinessandmanagement.org.ng Page 1 8

The Influence of investors Sentiment 011 Stock Market Returns in Nigeria
Where 7{ is the expected rate of inflation, Rf is the yield to maturity of treasury bills and the constant �
expected real returns on treasuty bills is represented by r . Fama and Schwert ( I 977) and Fama and .
e Gibbons ( 1984) used the estimated expected inflation rate 7t to estimate unexpected mflatton rate.
Following the above, a more popular and standard framework for estimating expected inflation is the fishers hypotheses,( Mankiw 1 997) .
. e
R = i - 7t . . . . . . . (6)
e Where R= Real interest rate, i = nominal interest rate and 1t = expected inflation. The real interest rate(R) is computed by dividing nominal interest rate (i) by Consumer price index. Equation (6) can be re
e written as; 1t = i - R. See Cozier and Rahman (1 988) for more on the use of expected inflation rate and how it matters to financial markets and asset pricing.
The rate of returns on long term financial asset is a major detenninant of stock price variations and it is often proxied by long term interest rate. There is also a clear evidence that interest rate depresses corporate profitability and leads to an increase in the discount rate applied by equity investors, both of which have an adverse impact on stock prices. The long term interest rate or returns on capital market instruments are usually not available but are proxied by interest rate on treasury certificates, treasury bonds or interest of over 12 months (Bursar, 2009).
3.1 Model Specification The appropriate econometric model for this study is specified as follows;
Where: Alse,= Nigeria composite share price index proxy for equity prices, Sent, = Investors' sentiment proxy by bandopadhayaya ind ex, ROR = rate of returns proxy by long term interest rate of over 12 months, ExD, = equity market excess demand (percentage change in composite share price index), Infle = expected inflation, e I = Error tenn or disturbance term and a != Coefficient of estimates. In explaining equity prices as it can be deduced from the above model (i.e equation 7), market, economic and non-market factors (investors aggregate sentim ent) are given consideration. The market fundamental from these variables are excess demand for equities ( ExD. ) and long term rate of returns ( ROR, ) . In representing non-market factors, the investors sentiment index was used ( Sent ) while expected inflation (Infle) is used to proxy economic fundamental rather than actual inflation rate as stock returns are more sensitive to expected inflation rate.
This study adopted the Error correction model in examining the long-run and short-run dynamic relationship in equation (7). According to Granger ( 1 988) and Miller and Russell ( 1 990) there are two potential sources of causation of dependent variables by the independent variables. This includes the error correction coefficient W) and short run coefficient (o) which measures the long-run and short-run relationship between the dependent variable and the independent variables. This therefore necessitates the need to re-specify equation (7) into an en·or correction model. This is shown in equation (8);
Mise � a. + a, t,!;Exd H + a, t,!;Sent,_, + a, t.!;ROR,_, + a. t.Mnfle,_, + p ecm, + <, . . . . . (�!-<.{ •3Jo�·-· -�· :1/. ' <.:_':>
The apriori expectations are; :1'f.VJ G.; i ,...:� , ..... f I.!.J v I
8, >0, 82>0, 8) >0, 84 > or < O while 0 s; � 2 1 ���-;, ��p.f� · . \ v
Abuja Journal of Business and Management Vol. I, issue 1 [11-29], March-2015 IJVIMN.abujajournalofbusinessandmanagement.org.ng
� - \ .. J"' II ., . 7-) \ ? -
i-;>--· J '. ' ....
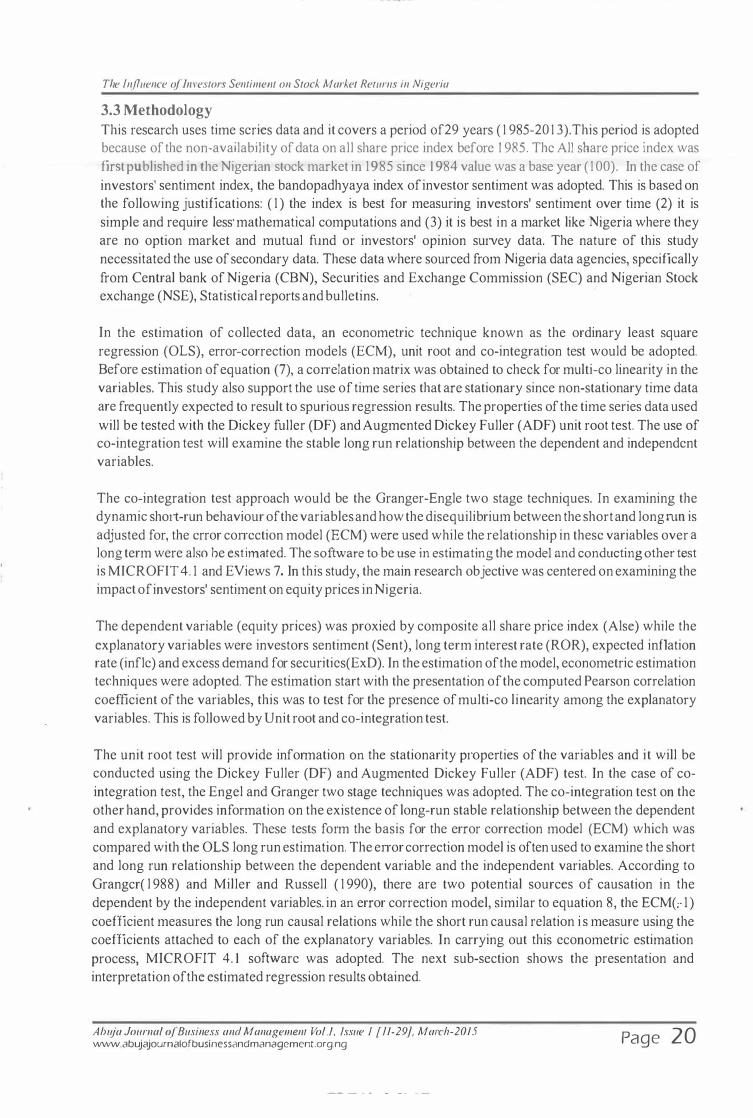
The Influence of bn·eslors Sen limen/ on SJock Markel ReJums in Nigeria
3.3 Methodology This research uses time series data and it covers a period of29 years ( 1 985-20 1 3).This period is adopted because of the non-availability of data on all share price index before 1 985. The All share price index was first published m the Nigerian stock market in 1985 smce 1 984 value was a base year ( 1 00). In the case of investors' sentiment index, the bandopadhyaya index of investor sentiment was adopted. This is based on the following justifications: ( 1 ) the index is best for measuring investors' sentiment over time (2) it is simple and require less· mathematical computations and (3) it is best in a market like Nigeria where they are no option market and mutual fund or investors' opinion survey data. The nature of this study necessitated the use of secondary data. These data where somced from Nigeria data agencies, specifically from Central bank of Nigeria (CBN), Secmities and Exchange Commission (SEC) and Nigerian Stock exchange (NSE), Statistical reports and bulletins.
In the estimation of collected data, an econometric technique known as the ordinary least square regression (OLS), error-correction models (ECM), unit root and co-integration test would be adopted. Before estimation of equation (7), a conelation matrix was obtained to check for multi-co linearity in the variables. This study also support the use of time series that are stationary since non-stationary time data are frequently expected to result to spurious regression results. The properties of the time series data used will be tested with the Dickey fuller (DF) and Augmented Dickey Fuller (ADF) unit root test. The use of co-integration test will examine the stable long run relationship between the dependent and independent variables.
The co-integration test approach would be the Granger-Engle two stage techniques. In examining the dynamic shott-run behaviour of the variables and how the disequilibrium between the short and long nm is adjusted for, the error conection model (ECM) were used while the relationship in these variables over a long term were also he estimated. The software to be use in estimating the model and conducting other test
is MICRO FIT 4. 1 and EViews 7. In this study, the main research objective was centered on examining the impact of investors' sentiment on equity prices in Nigeria.
The dependent variable (equity prices) was proxied by composite all share price index (Alse) while the explanatory variables were investors sentiment (Sent), long term interest rate (ROR), expected inflation rate (infle) and excess demand for securitics(ExD). In the estimation of the model, econometric estimation techniques were adopted. The estimation start with the presentation of the computed Pearson con-elation coefficient of the variables, this was to test for the presence of multi-co linearity among the explanatory variables. This is followed by Unit root and co-integration test.
The unit root test will provide information on the stationarity properties of the variables and it will be conducted using the Dickey Fuller (DF) and Augmented Dickey Fuller (ADF) test. In the case of cointegration test, the Engel and Granger two stage techniques was adopted. The co-integration test on the other hand, provides information on the existence of long-run stable relationship between the dependent and explanatory variables. These tests form the basis for the error correction model (ECM) which was compared with the OLS long run estimation. The enor correction model is often used to examine the short and long run relationship between the dependent variable and the independent variables. According to Grangcr( l 988) and Miller and Russell ( 1 990), there are two potential sources of causation in the dependent by the independent variables. in an error correction model, similar to equation 8, the ECM(:- 1 ) coefficient measures the long run causal relations while the short run causal relation i s measure using the coefficients attached to each of the explanatory variables. In carrying out this econometric estimation process, MICROFIT 4. 1 software was adopted. The next sub-section shows the presentation and interpretation of the estimated regression results obtained.
Abu} a Joumal of Business and Managemenl Vol./, Issue I [11-29], March-2015 www.abujajournalofbusinessandmanagement.org.ng Page 20
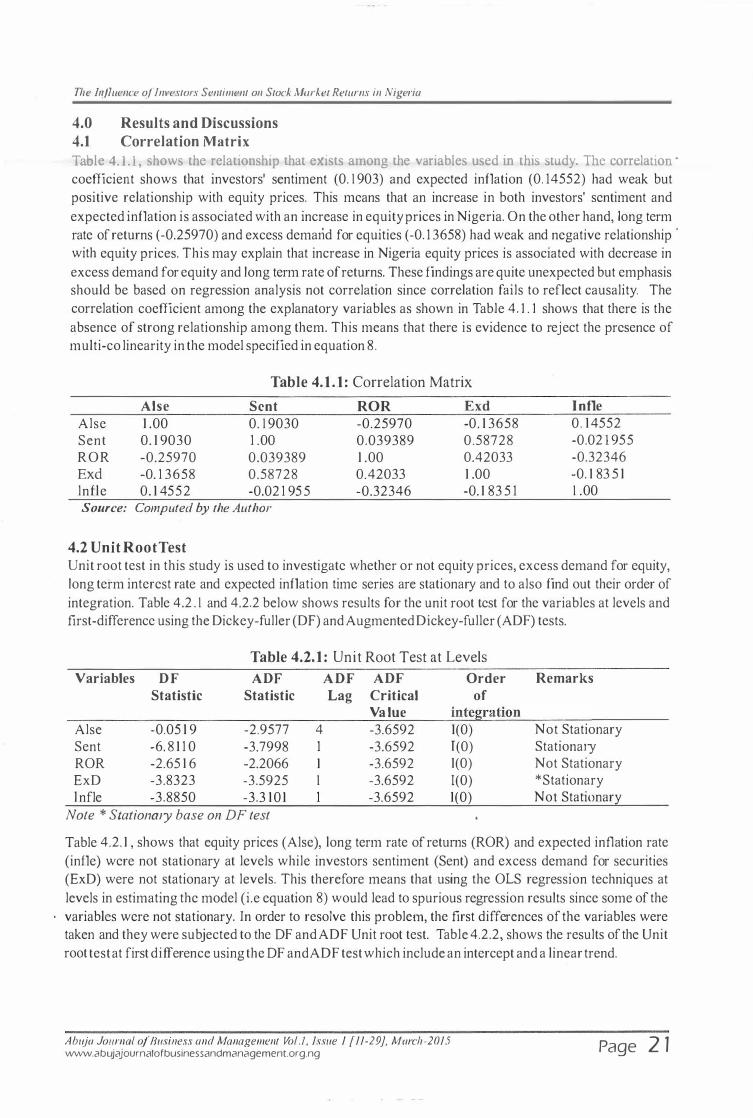
The b?fluence of Investors Sentiment on Stock Market Returns in Nigeria
4.0 Results and Discussions 4.1 Correlation Matrix Table 4. 1 .1 , shows the relationship that e�ists among the variables used in this study The correlation ·
coefficient shows that investors' sentiment (0. 1 903) and expected inflation (0. 14552) had weak but positive relationship with equity prices. This means that an increase in both investors' sentiment and expected inflation is associated with an increase in equity prices in Nigeria. On the other hand, long term rate of returns (-0.25970) and excess demand for equities (-0. 1 3658) had weak and negative relationship ·
with equity prices. This may explain that increase in Nigeria equity prices is associated with decrease in excess demand for equity and long term rate of returns. These findings are quite unexpected but emphasis should be based on regression analysis not correlation since correlation fails to reflect causality. The correlation coefficient among the explanatory variables as shown in Table 4. 1 . 1 shows that there is the absence of strong relationship among them. This means that there is evidence to reject the presence of multi-co linearity in the model specified in equation 8.
Table 4. 1 . 1 : Correlation Matrix
Alse Sent ROR Exd I nfle Alse 1 .00 0. 1 9030 -0.25970 -0. 1 3658 0 . 1 4552
Sent 0. 1 9030 1 .00 0.039389 0.58728 -0.02 1 95 5
ROR -0.25970 0.039389 1 .00 0.42033 -0.32346
Exd -0. 1 3 658 0.58728 0.42033 1 .00 -0. 1 83 5 1
lnfle 0. 1 45 5 2 -0.02 1 95 5 -0.32346 -0. 1 83 5 1 1 .00
Source: Computed by the Author
4.2 Unit RootTest Unit root test in this study is used to investigate whether or not equity prices, excess demand for equity, long term interest rate and expected inflation time series are stationary and to also find out their order of integration. Table 4.2 . 1 and 4.2.2 below shows results for the unit root test for the variables at levels and first-difference using the Dickey-fuller (DF) and Augmented Dickey-fuller (ADF) tests.
Table 4.2.1 : Unit Root Test at Levels Variables D F ADF ADF ADF Order Remarks
Statistic Statistic Lag Critical of Va lue integration
Alse -0.05 1 9 -2.9577 4 -3.6592 1(0) Not Stationary Sent -6. 8 1 1 0 -3.7998 1 -3.6592 1(0) Stationary ROR -2.65 1 6 -2.2066 1 -3.6592 1(0) Not Stationary ExD -3.8323 -3.5925 1 -3.6592 1(0) *Stationary l nfle -3.8850 -3.3 1 0 1 1 -3.6592 1(0) Not Stationary
Note * Stationmy base on DF test
Table 4.2. 1 , shows that equity prices (Alse ), long term rate of returns (ROR) and expected inflation rate (infle) were not stationary at levels while investors sentiment (Sent) and excess demand for securities (ExD) were not stationary at levels. This therefore means that using the OLS regression techniques at levels in estimating the model (i.e equation 8) would lead to spurious regression results since some of the variables were not stationary. In order to resolve this problem, the first differences of the variables were taken and they were subjected to the OF and ADF Unit root test. Table 4.2.2, shows the results of the Unit root test at first difference using the OF andADF test which include an intercept and a linear trend.
Ahuja Journal of Business and Management Vol./, Issue I [11-29}, March-2015 www.abujajournalofbusinessandmanagement.org.ng Page 2 1
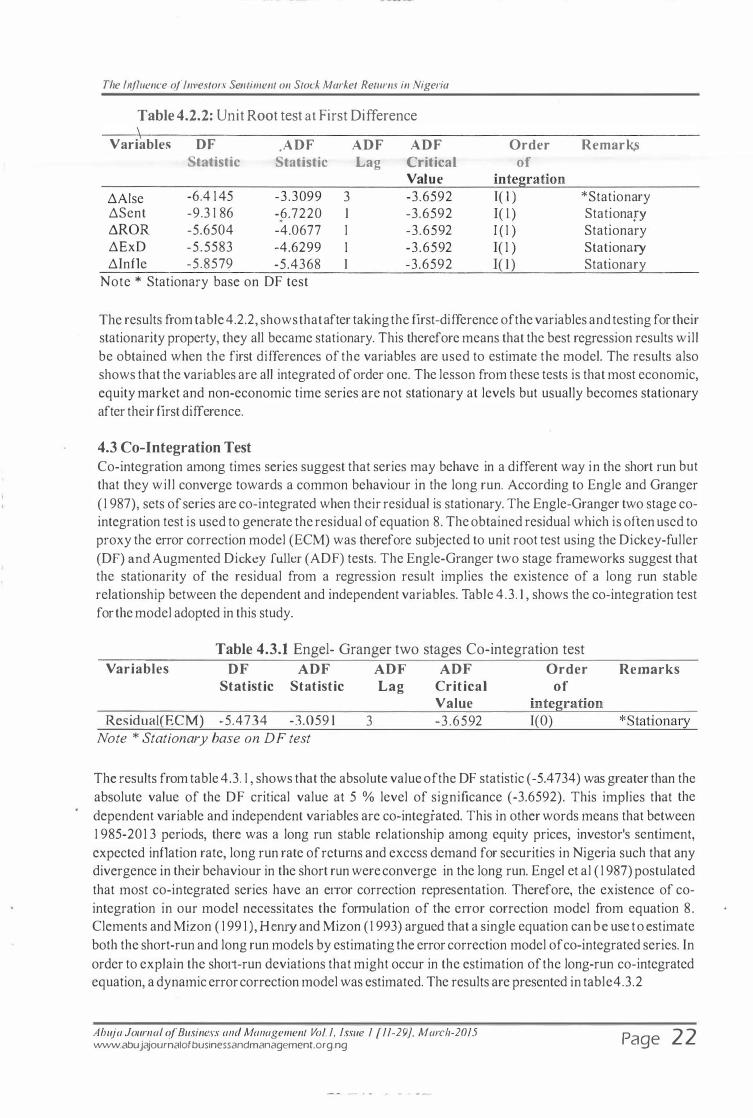
The li!fluence of Investors Sentiment on Stock Market Returns in Nigeria
Table 4.2.2: Unit Root test at First Difference
Variables DF .ADF ADF ADF Order Remark:; Statistic Statistic Lag Critical of
Value integration �Aise -6.4 1 45 -3 .3099 3 -3.6592 1( 1 ) *Stationary �Sent -9.3 1 86 -6.7220 1 -3.6592 1( 1 ) StationarY �ROR -5.6504 -4.0677 1 -3 .6592 I ( 1 ) Stationary �ExD -5.5583 -4.6299 1 -3 .6592 1( 1 ) Stationary �Infle -5 .8579 -5.4368 1 -3.6592 1( 1 ) Stationary
Note * Stationary base on DF test
The results from table 4.2.2, shows that after taking the first-difference of the variables and testing for their stationarity property, they all became stationary. This therefore means that the best regression results will be obtained when the first differences of the variables are used to estimate the model. The results also shows that the variables are all integrated of order one. The lesson from these tests is that most economic, equity market and non-economic time series are not stationary at levels but usually becomes stationary after their first difference.
4.3 Co-Integration Test Co-integration among times series suggest that series may behave in a different way in the short run but that they will converge towards a common behaviour in the long run. According to Engle and Granger ( 1 987), sets of series are co-integrated when their residual is stationary. The Engle-Granger two stage cointegration test is used to generate the residual of equation 8. The obtained residual which is often used to proxy the error correction model (ECM) was therefore subjected to unit root test using the Dickey-fuller (DF) and Augmented Dickey fuller (ADF) tests. The Engle-Granger two stage frameworks suggest that the stationarity of the residual from a regression result implies the existence of a long run stable relationship between the dependent and independent variables. Table 4.3 . 1 , shows the co-integration test for the model adopted in this study.
Table 4.3.1 Engel- Granger two stages Co-integration test Variables DF ADF ADF ADF Order Remarks
Statistic Statistic Lag Critical of Value integration
Rcsidual(ECM) -5.4734 -3.059 1 3 -3 .6592 I(O) *Stationary Note * Stationary base on DF test
The results from table 4.3. 1 , shows that the absolute value of the DF statistic (-5.4734) was greater than the absolute value of the DF critical value at 5 % level of significance (-3.6592). This implies that the dependent variable and independent variables are co-integrated. This in other words means that between 1 985-201 3 periods, there was a long run stable relationship among equity prices, investor's sentiment, expected inflation rate, long run rate of returns and excess demand for securities in Nigeria such that any divergence in their behaviour in the short run were converge in the long run. Engel et al ( 1 987) postulated that most co-integrated series have an error correction representation. Therefore, the existence of cointegration in our model necessitates the formulation of the enor correction model from equation 8 . Clements and Mizon ( 1 99 1 ) , H e my and Mizon ( 1 993) argued that a single equation can be use to estimate both the short-run and long run models by estimating the error correction model of co-integrated series. In order to explain the sho1t-run deviations that might occur in the estimation of the long-run co-integrated equation, a dynamic error correction model was estimated. The results are presented in table4.3.2
Abuja Joumal of Business and Management Vo/. 1, Issue 1 [11-29], March-2015 www.abujajournalofbusinessandmanagement.org.ng Page 22
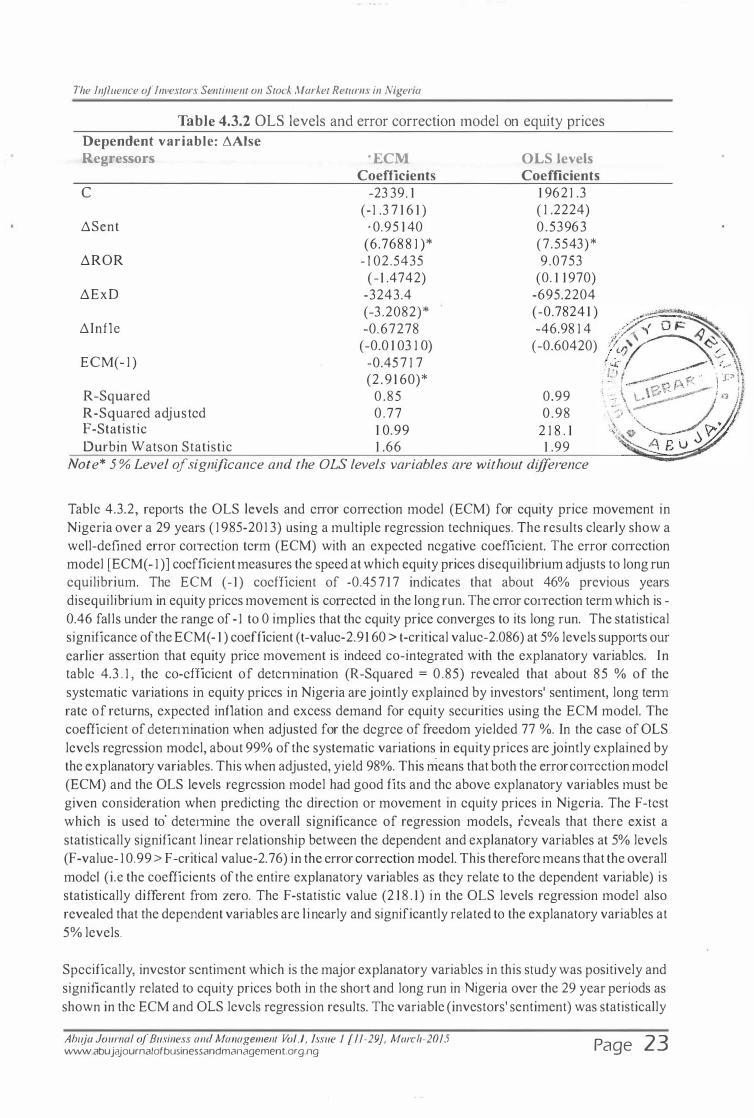
The Influence of Investors Sentiment on Stock Market Returns in Nigeria
Table 4.3.2 OLS levels and error correction model on equity prices Dependent variable: �Aise Regressors
c
�Sent
�ROR
�ExD
ECM Coefficients
-23 39. 1 (- 1 .3 7 1 6 1 )
· 0.95 1 40 (6.768 8 1 )*
- 1 02.5435
OLS levels Coefficients
1 962 1 .3 ( 1 .2224) 0.53963 (7 .5543)* 9.0753
(0. 1 1 970) -695.2204
�Infle
(- 1 .4742) -3243.4 (-3 .2082)* -0.67278
(-0.7824 1 ) �� -46.98 1 4 .. � <{ 0 J=:� 4�
ECM(- 1 ) (-0.0 1 03 1 0)
-0.45 7 1 7 (2 . 9 1 60)*
(-0.60420) /0'�s-�� • •4. '/ _...--\ .�.�
R-Squared 0 . 85 0.99 R-Squarcd adjusted 0 .77 0 .98 F-Statistic 1 0.99 2 1 8 . 1 Durbin Watson Statistic 1 .66 1 .99
Note* 5 % Level of significance and the OLS levels variables are without difference
I}} t .----.:::;:: � i J/ i . . · oO P.. · • , l :: \ L ·\i;'<�:.,......-- I 0 !
- ·� ':J \ . ' " . ��- � .) � A B U
Table 4.3.2, reports the OLS levels and enor conection model (ECM) for equity price movement in Nigeria over a 29 years ( 1 985-201 3) using a multiple regression techniques. The results clearly show a well-defined error correction term (ECM) with an expected negative coefficient. The error conection model [ECM( - 1 )] coefficient measw-es the speed at which equity prices disequilibrium adjusts to long run equilibrium. The ECM ( - 1 ) coefficient of -0.45 7 1 7 indicates that about 46% previous years disequilibrium in equity prices movement is cmTected in the long run. The enor cotTection term which is -0.46 falls under the range of - 1 to 0 implies that the equity price converges to its long run. The statistical significance of the ECM( - 1 ) coefficient (t-value-2.9 1 60 > t-critical value-2.086) at 5% levels supports om earlier assertion that equity price movement is indeed co-integrated with the explanatory variables. In table 4.3 . 1 , the co-efficient of detcnnination (R-Squared = 0.85) revealed that about 85 % of the systematic variations in equity prices in Nigeria are jointly explained by investors' sentiment, long tenn rate of returns, expected inflation and excess demand for equity securities using the ECM model. The coefficient of determination when adjusted for the degree of freedom yielded 77 %. In the case of OLS levels regression model, about 99% of the systematic variations in equity prices are jointly explained by the explanatory variables. This when adjusted, yield 98%. This rrieans that both the error cotTcction model (ECM) and the OLS levels regression model had good fits and the above explanatory variables must be given consideration when predicting the direction or movement in equity prices in Nigeria. The F-test which is used to' detetmine the overall significance of regression models, reveals that there exist a statistically significant linear relationship between the dependent and explanatory variables at 5% levels (F -value- 1 0.99 > F -critical value-2. 76) in the error correction model. This therefore means that the overall model (i.e the coefficients of the entire explanatory variables as they relate to the dependent variable) is statistically different from zero. The F-statistic value (2 1 8 . 1 ) in the OLS levels regression model also revealed that the dependent variables are linearly and significantly related to the explanatory variables at 5% levels.
Specifically, investor sentiment which is the major explanatory variables in this study was positively and significantly related to equity prices both in the short and long run in Nigeria over the 29 year periods as shown in the ECM and OLS levels regression results. The variable (investors' sentiment) was statistically
Abuja Journal of Business and Management Vol./, Issue I [11-29}, March-2015 www.abujajournalofbusinessandmanagement.org.ng Page 23

The Influence of Investors Sentiment on Stock Market Returns in Nigeria
significant at 5% levels both in the short and long run and their respective t-value are (6.7688 1 ) and (7.5543) as against their t-critical value of2.086. This finding confirms with the contributions of Delong, Shleifcr, Summers and Waldman ( 1 990), Miller ( 1 977), Black ( 1986), Baker and Wurglcr (2004) and Shleifer and Vashny ( 1997) that investors sentiment is a major factor that causes movement in equity prices. In the case of the controlled variables, long tem1 interest rate which is a key market ftmdamental performed poorly in explaining equity prices movement in Nigeria both in the sh01t and long run while excess demand for equities had a negati've and significant relationship with equity prices in the short-run but the relationship became statistically insignificant in the long tun. The impact of excess demand for securities on equity prices as deduced from the results was wrongly signed as it is not logically right to conclude that increase in excess demand for equity necessitates a decrease in equity prices. The reason for this can be related to the problem of measuring imbalance in secmities market using demand rather than supply (see Edo, 2007, Jaffee 1 972 and Fair and Kalejian 1 974). A more appropriate interpretation would be equity market imbalance which influences equity prices negatively in the short-run and becomes statistically insignificant in the long run. In the case of economic fundamental, expected inflation performed poorly in explaining equity prices movement in Nigeria both in the short and long mn. This finding reveals that macroeconomic risk factors as used in the APT model must be systematically selected so as to identify those that will impact significantly on equity price movement (see Zubairu, 20 14 among others). This in other word means that not all economic fundamentals will significantly influence the movement in equity prices.
5.1 Conclusion and Recommendations The preceding section reveals that investors' sentiment plays a significant role in detetmining the movement in equity prices in Nigeria. Moreover, the market and economic fundamentals were related to equity prices but had an insignificant impact when compared to investor's sentiments. By way of the recommendation extracted from this study, it is important to consider further studies on the powerful influence of investor's sentiment in valuing and pricing equities in Nigeria.
Given the findings of this study, it is now clear that investor's psychology matters more than market and economic fundamentals in predicting movement in equity prices. The recent equity market crash in Nigerian can therefore be attributed to investor's sentiment. In order to ensure that investors' sentiment do not disturb investor's returns and market normality, the following were suggested; (a) Understand investor's emotion biases: this study suggested that investors would be better off when they know and avoid the potential psychology bias that is detrimental to their investment policy guideline or objectives. (b) Eam market returns: this study also reveals that the presence of many form of investors' sentiment makes predicting the stock market prices almost impossible. Therefore investors must not strive to outperform the market since trying to make more than what the market can offer necessitate psychological biases. (c) Fusion investment evaluation: the relevant role of investors emotions in explaining equity prices, also led to the suggestion in the use of investors sentiment and market fundamentals in predicting equity prices. (d) Diversification: the disturbances in equity prices that are caused by investors' sentiment especially from stock in young, fast growing, technology, unprofitable etc can be managed through diversification of portfolio. (e)Regular review of biases: to also manage investors' emotion biases, this study also suggests that timely review of investment mistakes caused by sentiments, rumours, hearsay, emotions etc can be detected and prevented in subsequent trading if they are reviewed regularly. (f) Forecasting equity prices: in predicting the prices of equity in emerging stock market where there are investor's sentiment and market manipulations, this study recommends the use of empirical models that consider both market and non-market factors (g) lastly, this study also recommends the need for professional ethics and standards that prevent market participant from generating market sentiment that benefit them and cause abn01mality in equity prices movement.
Abtlja Joumal of Business and Management Vol./, Issue I [11-29}, March-2015 www.abujajournalofbusinessandmanagement.org.ng Page 24
The Influence of investors Sentiment on Stock Market Returns in Nigeria
References Alile, H.I . andA.R. Anao ( 1 986): The Nigerian StockMarket in operation. Jeromelaiho & A s s o c i ates Press Ltd. Altay, E (2003) The ef
fect of macroeconomic factors on asset returns: A comparative analysis of the
Getman and Turkish stock markets in an APT framework, Martin-Luther-Universitat Press. Bandopadhyaya. A (2006) "Measures of investors sentiment: who wins the horse race? College of
management, Boston", working papet: Bandopadhyaya. A and Anne.L.J (2005) "Measuring investor sentiment in equity market,
college of ' management", Boston working paper. Bummeister .E and Wall. K. D ( 1 986) "The Arbitrage pricing theory and macroeconomic factors
measures", thejinancial Review, Vol 21, No 1 . Bummeister .E. and Macelroy. M . B ( 1 988) "Joint estimation offactors sensitivities and risk
premiwn for the Arbitrage pricing theory", Journal of finance, Vol 43. Baek, In-Mee, A. Bandopadhyaya and Chan Du, (2005), "Determinants of Market Assessed Sovereign
Risk: Economic Fundamentals or market Risk Appetite?", Journal of International Money and Finance, volume 24, Issue 4, pp 533-548.
Baker. M. and Wurgler .1(2006) "Investor sentiment and the cross-section of stock returns" Journal of finance, Vol LX1, No 4. Baker, M and Stein. J, (2002), "Market Liquidity as a Sentiment Indicator", Harvard Institute research
Working paper, No. 1 977. Branch ,B ( 1 976), "The Predictive Power of Stock Market indicators", Journal of Financial and
Quantitative Analysis, Vol. 11, Issue 2, pp.269-286. Brown, G. W., and M.T.Cliff (2005). "Investor Sentiment and the near-tem1 Stock market", Journal of Empirical Finance 11, 1-27. Black, F ( 1 986) "Noise" Journal of finance, 41,529-543 Bursar, G (2009) "Long term interest rate and stock price retums", Journal of Nigerian securities, Vol
2. Chan,K.C. N, Chen. and D.A Hsieh, ( 1 985), "An explanatory investigation of the firm size effects", Journal of financial econometrics, Vo/ 14. Chen,N, R. Roll. and S. Ross. ( 1 986) "Economic forces and the stock market" Journal of
business, Vol 59, no 3. Chen S. J and B.D Jordan ( 1 993) "Some empirical tests on the Arbitrage pricing theory": Journal of
Business finance, Vol 25, No ll. Cheng .A.C.S ( 1 995) "The UK stock market and economic factors": A New approach, Journal of
Business finance and accounting, Vol 22, No 1. Cbaroenrook, A (2003), "Change in Conswner Sentiment and Aggregate Stock market Returns",
The Owen Graduate School of Management, Vanderbilt University, Working paper. Chopra N. , Charlse M.C. Lee, Andrei S, and R. H .Thaler ( 1 993), "Yes, Discount on Closed-End Funds
Are a Sentiment index", Journal of Finance, 48, pp. 801-808 Clements, M, P and G.E, Mizon ( 1 99 1 ) "Empirical analysis of macroeconomic time series", European economic reviews, 35 Cozier, B and A, Rahman ( 1 988), "Stock Returns, Inflation and Real Activity in Canada" Canadian Journal of Economics 21· (Nov) 759-74 Clarke, Roger G. and Meir Statman. ( 1 998). "Bullish or Beatish?" Financial Analysts Journal,
(May/June): 63-72 Domain, D. J.Gilster and D. Louton( 1 996) "Expected inflation, interest rates and stock returns": The
financial review 31,Nov. 809-830. Dennis P and M. Stewatt(2002), "Risk-neutral Skewness:Evidence from Stock options",Journal of
Financial and Quantitative Analysis, Vol. 3 7, Issue 3, pp.471-493. ·
De-long, .Bradford, J. S. Andrei., H.S Lawrence , and W.Robert ( 1 990) "Noise Trader Risk in Financial Markets" Journal of political Economy 98, 703-738
Dcnnis,P and S. Mayhew(2002) "Risk- Neutral skewness: evidence from stock options", Journal of
financial and quantitative analysis, vol 3 7, issue 1, 35-58. Dornbush.R and S. Fisher. ( 1 980) "Exchange rate and cunent account", American Economic Review
Ahuja Journal o.f Business and Management Vol.!, Issue I [11-29], March-2015 www.abujajournalofbusinessandmanagement.org.ng Page 25

The Influence of lnl'estors Sentiment on Stock Market Returns in Nigeria
70, 960-971. Edo, S.E. ( 1 997): "An Error-Correction Model of Stock Price Determination in Nigeria," Journal of
Economic Management 3 (2): 153-568. Edo.S.E (2005) "Recent e\ idence on stock market inefficicnc)' m a developing economy", International Journal of economics Research, Vol 2, no. I , I -16. Emenuga C. ( 1 998): "The Nigeria Capital Market and Nigeria's Economic Development". Paper presented at the seminar organized by the Nigerian Economic Society, Lagos. Emenuga .C and E. Inanga( l 997) "Institutional, traditional and Asset pricing characteristics of Nigeria
enterprise": Journal of accounting, Vol 3I, No 1. Fair R. C and Jaffee J.F ( 1 972) "Methods of estimation for markets in disequilibrium", Econometrica, Vol 49, No 3. Fair. R. C and H. Kalejian (1 974) "Methods of estimation for Markets in disequilibrium: A further study", Econometrica, Vol 22, No 4 Fama. E.F ( 1 98 1 ) "Stock returns, real activity, inflation and money", American economic review, Vol
71(4) Fama, E.( l 975) "Short-term interest rates as a predictor of inflation". The American Economic Review 65, June. 269-82 Fama, E and M. Gibbons ( 1 984) "A compatison of inflation forecasts", Journal of monetaty economics. Fama, E and G. Schwert ( 1997) "Asset Returns and Inflation", Journal of financial economics,Nov, I 15-46 Fisher.K .L and M. Statunan (2000) "Investor sentiment and stock returns",financial analyst Journal, vol.56, issue 2. Granger .C. W.J ( 1 988) "Some Recent Developments in the concept of causality", Journal of Econometrics, Vol. 39. Guohua .L.(2008) "Institutional investor sentiment and individual stocks", Research proposal, university of Cornell. Giamrnarino.R(2000) "Central bank policy, inflation and stock prices", Journal of Business finance,
Vol 42, No 31 . Harasy . R and G. Roulet (2000) "Stock prices, earnings and long term interest rate", Review of
economic and financial studies, No 4. Harris, R and R. Soli is (2003) Applied time series modelling and forecasting: New york, John wiley
and sons. Harris,M and A. Raviv.( 1 993) "Difference of option make a house race", review of financial studies 6,473-506. Henry, D, F and G.E, Mizon ( 1 993) Evaluating dynamic econometric models by encompassing the
VAR models, methods and applications of econometrics, Cambridge, Blackwall Press. Jaffe, J and G. Mandeiker ( 1 976) "The fisher effect for risky assets: An empirical
investigation", Journal ojfinance 31 may.447-58. Johnson, S. A, Lei, A, Lin Ji-Chai and C.G Sanger (2006) Trading volume trend, investor sentiment, and stock returns, Louisiana state university, Baton, USA. Lakonishok, J, Andrei S. and R. W. Vishny, ( 1994) "Contrarian Investment, extrapolation and Risk".
Journal of Finance 49, 1541-1578 Lashgair, M(2003) "The role of TED spread and confidence index in explaining the behaviour of stock
prices", America Business Review, 18(2) 9-11. Lce.C, Andrei S., and R.H.Thaler. ( 1 99 1 ) "Investor Sentiment and the Closed-End Fund puzzle",
Journal of Finance 46, 75-I09. Lee. C (2009) "Equity and bond analysis, A section in CFA curriculum", Journal of accounting, Vol 2,
No 3. Mankiw .S. ( 1 997) "Inflationary expectation", Journal of Economics and Finance, No 43. Miller. E. M(l 977) "Risk, uncertainty, and divergence of option", Journal of Finance 32. 1151-1168 Miller. S. and C. Russell ( 1990) "Investigating causal Relations by econometric models", Econometrica, 37. Neal, R. and W. Simon. ( I 998) "Do measures of l nvcstment Sentiment predict Stock Return". Journal
Abu} a Joumal of Business and Management Vol. I, Issue I [I 1-29], March-201 5 www.abujajournalofbusinessandmanagement.org.ng Page 26
The Influence of Investors Sentiment on Stock Market Returns in Nigeria
o.f Finance and Quantitative Analysis 34, 551-584. Nelson, C ( 1 976) "Inflation and rates of return on common stock": The Journal o.f Finance 3I may
4 71-83 Osaze. B .E ( 1 985) "The effect of corporate earnings, dividend and Volume on stock pnce movement in Nigeria: 1 976- 1 980", Benin Journal of social science. Osaze .B.E(2000) "The Nigeria capital market in the Africa and Global financial system", Boflc consulting Group Ltd, Nigeria. Omole .D.and A . Falokun( 1 999) "Financial refonns, stock market development and corporate
performance in Nigeria", lbandan;NJSER. Ozcam .M( 1 997) "An analysis of the macroeconomic factors that determine stock returns in Turkey", Capital market Board of Turkey, Pub No 75. Pindyck, R. S ( 1998), "Risk aversion and determinants of stock market behaviour", the review of
economics and statistics. LXX(2):I83-I90 May. Kahneman. D. and S. Tversky. ( 1 982) Judgement under uncertainty; heuristics and biases, Cambrige University Press, United Kingdom. K.ryzanowski .L and H. Zhang. ( 1 992) "Economic forces and Seasonality in security returns", Review
of quantitative finance and accounting, Vol 2. Karpoff, J. M ( 1 986) "A theory of trading volume", Journal of finance 4I, 1069-I087 Keirn, D.B and A. Madhavan (2002) "The relation between stock market movements and NYSE seat
prices", Journal of finance, vol.55 issue 6, 281 7-284I Randall,M.R, D. Y. Suk and W, S. Tully(2003) "Mutual fund cash flows and stock market perfonnance", Journal of investing, I2(1), 78-8I . Reilly, F( 1 997) "The impact of inflation on ROE, growth and stock prices",Financial services review 6(1)3-I 7. Reilly.F.K and K.C.Brown ( 1 999) Investment analysis and portfolio management, eight edition,
USA. Thomson south-western publication. Shefrin, Hersh and Meir Statman, ( 1 996). "Behavioral Capital Asset Pricing Theory." Journal of
Financial and Quantitative Analysis, 29, 323-349 Seyhun, H. N. ,( 1998) "Investment intelligence from insider trading, MIT Press, Cambridge Shleifer, A and Vishny, R ( 1 997) "The Limits of arbitrage", Journal of finance, 35-55. Summers, L .H and R. Stambougb.(1 986) "Does the stock market rationality reflects fundamental values", Journal of finance 4I(3) 59I-603. Whaley,R.E (2000) "The investor fear gauge", Journal of portfolio management, 26(3). Yohannes.L.G(1 999) "The Nigeria capital market; The first three decades of operation", 1 96 1 -1 990. African development Review, II (2) Dec. Zweig, M.E(l 973) "An investor expectations stock price predictive model using closed-end fund premiums", Journal of finance 28-87. Zhou .M ( 1996) "Interest rate and stock market returns", Journal of finance, Vo/32, No 1 . Zubairu, M (201 4) Macroeconomic Variables and Nigeria Stock Market Returns: A Stepwise
Regression Analysis, Being Ph.D Seminar Paper Presented to Department of Business Administration, Ahmadu Bello University, Zaria in Partial Fulfilment of the Requirements for the Award of the Doctor of Philosophy in Business Administration (Ph.D)
Abuja Jouma! o.f Business and Management Vol. /, lmte I [I 1-29}, March-201 5 www.abujajournalofbusinessandmanagement.org.ng Page 27

� � � � � 'cr o & t: �: � 0 0 c -3 � 9:!. t;:, 0 �
g �. �· � VI 0 � ;::s ::J !:l.. � � � ::: ::J 0 � ()q lO CI> (1) -3 � tb ::: ::J -6 & ... ,_
lQ .._ ::, -l0 9 �
'"::::: .._
� � � ;:; ;:,-� <:::> .._ '""
u � l.Q (1)
N (X)
YEAR· DEXD DSENT DROR
1 9 84 - - -
1985 0.273 -427.735 0
1986 0.01 3724 4.933 0
1987 -0. 1 2 1 2 8 - �5 . 1 04 0
1 988 0.058232 1 1 .364 5.8
1 989 0 . 1 68874 42.327 - 1 .5
1990 0 . 1 869 1 4 82.469 6.9
1 9 9 1 -0.05455 5 1 .741 1 .8
1 992 -0. 1 1 075 12.65 -2.9
1 993 -0.02067 60.787 0.4
1994 0.034607 1 56.8603 7.52
1 995 0.88 1 1 88 2 1 22.698 - 1 3.02
1996 -0.936 1 6 -1438. 1 9 -0.73
1 997 -0.45366 -2759.94 -0.72
1 998 -0.03707 - 1 05.01 -6. 1 2
1999 0.045849 467. 1 5 2.66
2000 0.61 2002 3 3 1 5.61 4.2 1
2001 -0.1 8863 -437.53 -3.86
2002 -0.24449 - 2 1 23.23 -0.35
2003 0.5 5 1 237 6633.03 1 .06
2004 -0.47379 -5524.49 ! . I I 2005 -0.1 7447 -4054.98 - 1 .59
2006 . 0.367842 8824.49 0.23
2007 -0.37006 - 1 0263.8 1 .92
2008 0.257139 8562.79 1 .68
2009 0.0066 1 1 833.3 1 8 2 1 .428857
2 0 1 0 0.008508 YtJ9.3543 1 .657464
20 1 1 0.0 1 0405 985.3905 1 .886071
20 1 2 0.012301 1 06 1 .427 2. 1 1 4679
2 0 1 3 0.0 1 4 1 98 1 1 37.4§_ 2.343286
SOURCE: Authors computation, CBN, SEC and NSE
APPENDIX I Table 1.0 Data for Regression analysis DINFLE DALSE EXD !NFL£
- - - 4.709
-0.639R4 27.3 0.273 -5.34884
- 1 .99862 36.5 0.286724 -7.34746
-2.04728 27.1 0 . 1 65446 -9.39474
- 1 .03708 42.7 0.223677 - 1 0.43 1 8
-4.82257 9 1 .7 0.39255 1 - 1 5.2544
-0.60276 1 88.5 0.579465 - 1 5.8571
2.748698 269.7 0.5249 1 2 - 1 3 . 1 085
-3.34989 324.5 0.414167 - 1 6.4583
-8.60304 436 0.393502 -25.06 1 4
1 1 .86 1 1 7 661 0.428 109 - 1 3.2002
-0.0375 1 2887 1 .309297 - 1 3 .2377
-0.02432 1900 0.373 134 - 1 3 .262
-0.82258 -563 -0.08052 - 1 4.0846
-3.6325 -756 -0. 1 1 759 - 1 7.7 1 7 1
4.402376 -407 -0.07 174 - 1 3.3 1 47
-0.82671 2845 0.540258 - 1 4 . 1 4 1 5
-4.65897 2852.1 0.35 1 634 - 1 8 .8004
3 . 1 84008 1 1 74.6 0. 1 07 1 4 1 - 1 5 . 6 1 64
0.732064 799 1 .2 0.658378 - 1 4.8844
1 .98458 3 7 1 5.6 0 . 1 8459 - 1 2.8998
0.982699 241.3 0.0 1 0 1 2 - 1 1 .9 1 7 1
1 .980724 9 1 03.5 0.377961 -9.93635
0.493097 262.4 0.007906 -9.44325
-0.25 6 1 3 8866.2 0.265045 -9.69938
-0.42929 5845.8 1 1 0. 1 00 1 69 - 1 1 . 1 225
-0.61097 6236.755 0.076492 -1 0.8282
-0.79264 6627.699 0.052 8 1 6 - 1 0.5338
-0.97432 70 1 8 .643 0.029 1 3 9 - 1 0.2395
- 1 . 156 7409.587 0.005463 -9.945 2 1
SENT ROR
- 1 0
-427.735 1 0
-422.802 1 0
-437.906 1 0
-426.542 1 5 .8
-384.2 1 5 14.3
-30 1 .746 2 1 .2
-250.005 23
-237.355 20.1
- 1 76.568 20.5
- 1 9.7077 28.02
2 1 02.99 1 5
664.801 14.27
-2095. 1 4 1 3 .55
-2200. 1 5 7.43
- 1 733 10.09
1 582.61 14.3
1 1 45.08 1 0.44
-978 . 1 5 10.09
5654.88 1 1 . 1 5
1 30.394 12.26
-3924.59 10.67
4899.9 10.9
-5363.92 12.82
3 1 98.87 14.5
5 1 2.6934 9.498667
5 5 1 .2395 9.0569 1 7
589.7856 8.6 1 5 1 67
628.33 1 7 8. 1 734 1 7
666.8778 7.73 1 667
ALSE
100
1 27.3
1 63.8
190.9
233.6
325.3
5 1 3.8
783.5
1 1 08
1 544
2205
5092
6992
6429
5673
5266
8 1 1 1
10963 . 1
1 2 137.7
201 28.9
23844.5
24085.8
3 3 1 89.3
3345 1 .7
42317.9
3 7 1 59.01
39804.83
32450.65
35096.46
47742.28
;a "' :?' � !§ � � :;;-� 0 c::;
� �-� g � 0 ..., >;-� :::: � ::;, � :::: ...: <;; :::·
� -'· 0
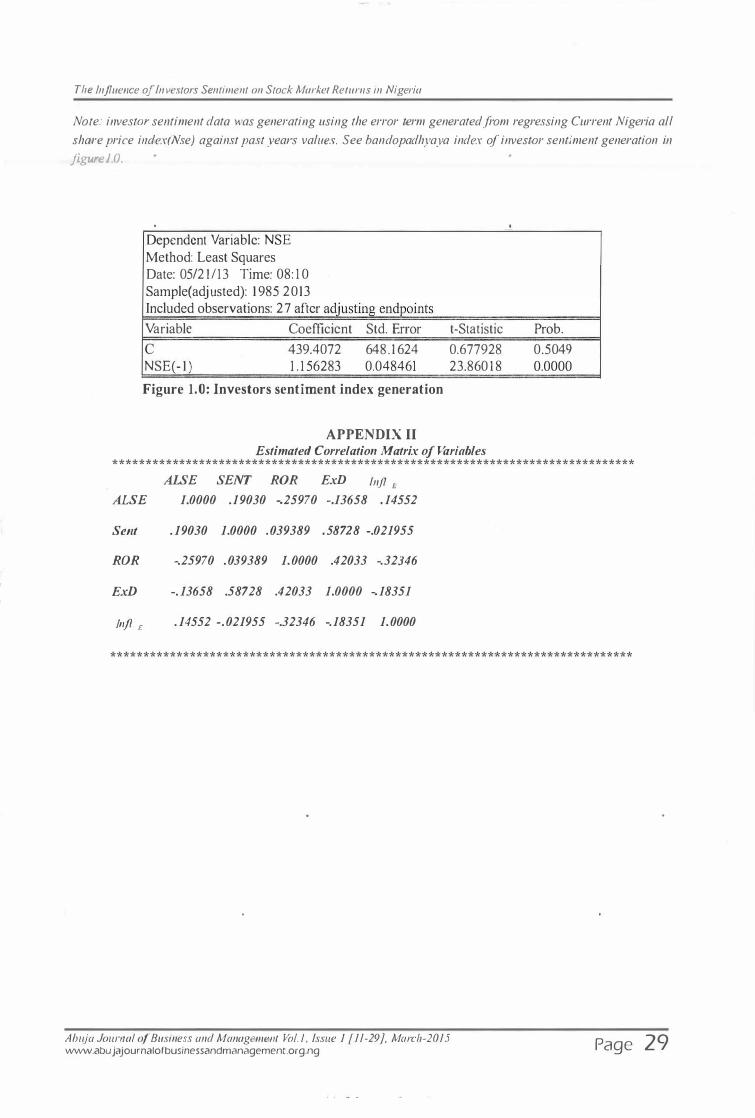
The Influence of Investors Sentiment on Stock Market Retums in Nigeria
Note: investor sentiment data was generating using the error term generated from regressing Current Nigeria all share price i11dex(Nse) against past years values. See bandopadhyaya index of investor sentiment generation in jigurel.O.
Dependent Variable: NSE Method: Least Squares Date: 05/2 1/13 Time: 08: 1 0 Sample(adjusted): 1 985 2013 Included observations: 27 after adjusting endpoints
Variable Coefficient Std. Error t-Statistic Pro b.
c 439.4072 648 . 1 624 0.677928 0.5049 NSE(- 1 ) 1 . 1 56283 0.048461 23.860 1 8 0.0000
Figure 1.0: Investors sentiment index generation
APPENDIX II Estimated Correlation Matrix of Variables
*******************************************************************************
ALSE SENT ROR ExD Injl £
ALSE 1.0000 .19030 -.25970 -.13658 . 14552
Sent . 19030 1.0000 . 039389 . 58728 -.021955
ROR -.25970 . 039389 1. 0000 .42033 -.32346
ExD -. 13658 .58728 .42033 1.0000 -.18351
Jnfl £ . 14552 -. 021955 -.32346 -.18351 1. 0000
*******************************************************************************
Abtu·a Journal of Business and Management Vof_ I , Issue I [11-29}, March-2015 www.abujajournalofbusinessandmanagement.org.ng Page 29
Effect of Basic Planning Factors on Performance of Manufacturing Firms i� Nigeria
Prof. Ayuba A. Aminu1 , Prof. S .K. Msheliza2, I .M.B. Chekene3, 1 (Department of Management. University of Maiduguri-Nigeria) 1 (Department of Finance, University of Maiduguri-Nigeria)
1 (Department of Management, University of Maiduguri-Nigeria)
Abstract: The Vision, mission, objective, strategy and policy are the basic factors of corporate planning in most business firms. It could be that these factors enhance corporate pe1jormance, which informs its popularity among companies. Since the main objective of the study is to investigate the effect of basic planningfactors on the performance of manufacturing firms in Nigeria, to achieve this, eighteen Northern Nigeria manufacturing firms were pwposively selected for the study. The relative effect of these factors on employee behaviour and company performance was assessed. Questionnaire and interview methods were used in sourcing the primary data. The targeted respondents are the members of the planning team. The qualitative data collected were subjected to logistic regression technique. The result shows that these factors have significant effect on corporate peiformance. But planning stakeholders ' knowledge of the factors as it regards corporate planning is not as one might have antic ipated. We therefore design an "explicit mechanical model of corporate planning " that shmvs the inter-relationship between these basic
planning factors and other planning variables as a necessaty management practice for enhancing corporate performance. Keywords: Vision, Mission, Objective, Strategy, CorporateP/anning, Corporate Policy, C01porate Pe1formance.
1 . Introduction Strategic planning can be viewed as a broad managerial process of developing a vision, mission statement, goals and objectives which serve as influential guides to employees using the top-bottom management approach (Warner, 2000). He looks at a vision as "a short, succinct, and inspiring statement of what the organization intends to become and to achieve at some point in the future, often stated in competitive terms". According to strange and Mumford (2005), "a vision involves a set of beliefs about how people should act, and interact, to make manifest some idealized future state". They further argued that a vision may contain commitment to: creating an outstanding value for customers and other stakeholders; developing a great new product or service; and/or developing a great company.
Wamer (2000) looks at a mission statement as "an organization's vision translated into written form. I t makes concrete the leader's view of the direction and purpose of the organization". He posits that the major outcome of strategic planning and strategic road-mapping, after gathering all necessary information, is the setting of goals for the organization based on its vision and mission statement. Therefore, having welldefined visions, mission statements and goals change nothing except if executives are seen to live with them, and constantly communicate them to their employees. Mission statements arc also regarded as critical starting point for almost every strategic initiative. More so, mission statement is intended to motivate, and in so doing, control the behaviour of organizational members towards common organizational goals. They are supposed to provide a context for strategy and they should be the ultimate reference point in making resource allocation decision (Bart et a/., 2001 ) .
Vision and mission statement contents arc sometimes misplaced because of their close relationship in tcrn1s and application. Vision statement defines the desired or intended future state of a specific organization or enterprise in terms of its f1mdamental objective and/or strategic direction. It outlines what the organization wants to be. It concentrates on the future. It is a source of inspiration. It provide clear decision-making criterion (Lowen, 1 997). While a company's mission is its rea sol) for being. It is based on the present. Business mission, often expressed in the form of a mission statement, conveys a sense of purpose to employees and serves as a projection of company image to customers. In the strategy formulation process, the mission statement sets the mood of where the company should go (Bart, 200 1 ) . I t is in view of the importance that this study was conducted to investigate the effect ofbasic planning factors on the performance of manufacturing firms in Nigeria as there are not enough studies investigating the impaet ofsuch factors on firm's perfonnance.
Abu) a Joumal of Business and Management Vol. 1, Issue 1 [30-36}, March-2015 www.abujajournalofbusinessandmanagement.org.ng Page 30
Effect of Basic Planning Factors on Pe1jormance ofManufacturing Firms in Nigeria
1.1 Hypotheses ofthe Study In order to assess the relevance of the effect of basic planning factors towards manufacturing firm's pcrfom1ance null hypqthcscs were established:
H01: vision statement does not significantly affect performance ofmanufacturingfirms. H01,.mission statement does not significantly affect performance ofmanufacturingfirms. H03: establishing a .clear statement of objective does not significantly affect performance of
man£!facturingfirms. H04: designing clear strategy does not significantly affect performance ofmanufacturingfirms. Ho 5,establish ing company policy does not significantly affect performance ofmanufacturingflrms.
2. Literature Review 2.1 Corporate Planning and Strategy Corporate planning and strategy is the course charted for the total organization in attempts to specify, what set of businesses the organization intends to be in (Ansoff, 1 965). From the foregoing explanation, corporate planning and strategy is primarily concemed with the scope and resource development components of strategy. Corporate level strategies include the overall strategies of growth, stability, turnaround and retrenchment, or combination of factors. This strategy is based on providing the best quality service that will be focused on competitive advantage and synergy.
2.2 Performance Performance is defined as the yield or results of activities carried out in relation to the purposes being pursued. Its objective is to strengthen the degree to which organizations achieve their purposes (Lebas et al, 2002). To effectively implement the strategic plan, management must know if the plan's goals are being achieved on time and with the allocated resources. Getting the right answers means having the right performance measurement framework. One cannot begin to manage performance until one can accurately measure it.
Appraisals of the reasons why companies need corporate planning suggest that; first, it should improve the performance of companies (Neely, 2002). Prescriptive strategic management theory stresses the planning of a mission, the setting of objectives, and the implementation of strategies and control systems to ensure the objectives are achieved. Secondly, strategic planning could lead to indirect improvements in performance by improving the effectiveness of management throughout an organization. Such benefits include process advantages, such as the ability to identify and exploit future marketing opportunities, personnel advantages such as the encouragement of a favorable attitude to change, and the view that strategic planning keeps the company synchronized with the external environment so that changes can be adopted accordingly. Strategic planning may therefore be effective as a process of management, regardless of the performance achieved (Mayle et a!, 2002).
3. Research Methods From the sampling frame which is Northem Nigeria Manufacturing Firms, a sampling point of 1 8 companies were purposively selected across the three geopolitical zones of northem Nigeria. The sampling points include Kano, Kaduna, Jos and Maiduguri. Through questionnaire and interview methods a primary data were sourced. The secondary data were obtained from books, journals and intcmet sources. Targeted respondents include CEOs, planning officers, company secretaries and other members of planning team. The qualitative data obtained were analyzed using logistic Regression technique in order to establish a relationship between the variables. Logistic regression model was implicitly derived, with performance as the dependent variable and mission, vision, objective, strategy and policy are the independent variables. However, in the .course of analyses 'planning' was used as proxy for perfonnancc in the model. Viz; Kumar (2005); Strange ct al (2005); Drucker ( 1 973) and Kotler ( 1991) pointed out that basically corporate planning should consist of; vision statement, mission statement, statement of objective, clear strategy and policy vis-a-vis analysis of SWOT. Going by the above work, a model of planning was implicitly specified as follows:
Abu) a Joumal of Business and Management Vol. 1, Issue I [30-36}, March-2015 www.abujajournalofbusinessandmanagement.org.ng Page 3 1

Effect of Basic Planning Factors 011 Pe1jormance of Manufacturing Firms in Nigeria
Model l Planning= j(eo + C ,stat. obj . + J..t) Where; . Stat. obj . = statement of objective 1..1. = error tetm A priori expectation e ,>o
Model2 Planning = /(Co +C2 mis. stat. + 1..1.) Where; Mis. Stat. = mission statement 1..1. = error term A priori expectation, e2>o
Model3 Planning = j(eo + e3 vis . stat. + 1..1.) Where, Vis. Stat. = vision statement 1..1. = error term A priori expectation, e)>o
Model4 Planning =/( eo + e4 clr. str. + 1..1.) Where; Clear str. = clear strategies J.! = error term A priori expectation e4>o
Model S Planning = /(Co + C5 pole. + 1..1.) Where; pole. = company policy J..t = error term A priori expectation C5>o
4. Results and Discussions Table 1 show that establishing company policy recorded the highest mean of 3.04 followed by planning department with a mean of 2 .61 and setting of clear strategy for achieving the stated objectives with the mean of2.4 1 . Clear vision statement has mean of 1 . 8, clear mission statement has I . 7 and clear statement of objective has the least mean of 1 .6.The table further shows that the most important character or the most versatile of the basic planning characters in manufacturing firm is the establishment of company policy with highest coefficient of variance (COY) of300.3, followed by having clear statement of objective with COV246.9.
Ahuja Joumal of Business and Management Vol./, Issue 1 [30-36]. March-20 15 www.abujajournalofbusinessandmanagement.org.ng Page 32

Effect of Basic Planning Factors on Pe1jormance of Manufacturing Firms in Nigeria
Table 1 : Basic Planning Factors
Mean Std. Dev. cov
clear vision statement 1 .80 0.906 1 98.6
clear mission statement 1 . 79 0.882 202.9
statement of objectives 1 .60 0.648 246.9
clear strategies for achieving the sated objectives
2.41 1 . 1 87 203.0
Company policies that drive the organisation's culture and priorities
3 . 04 1 .0 1 2 300.3
Source: Field survey, 2014.
Hence, planning team should pay special attention to the establishment of company policy. When the policies are carefully established and tactically imposed on all and sundry without exception, there is every possibility of mass compliance. In the long run if strategically managed, a new attitude would be formed among employees, which means dedication to company policy. Setting clear objective is also a difficult task in planning. It is the core factor of planning as indicated in Fig. l , the explicit model of corporate planning.
4.2 Models analysis Table 2 shows the significance of the basic planning factors in determining the possible variations in planning department. The model on Mission statement revealed a coefficient value of .7063 . It is rated highly significant with probability of .000 at 5% significance level. The R2 value for this factor = .273 which simply means 27% of variations in company performance results from having clear mission statement. This finding agrees with our a priori expectation. Therefore, we reject the null hypothesis which states that mission statement does not significantly affect performance of manufacturing companies and accept the alternative hypothesis.
Vision
Mission
Objective
Strategy
Table 2: Basic Planning Process Factors Coefficient R -value F
.7053 .20 1 3 1 .98
.7063 .273 29.35
.5901 .340 40.23
.7000 .522 85. 1 7
Policy .6771 .453 64.59
Source: Field survey, 2014.
Probability .000
.000
.000
.000
.000
It was revealed also that vision statement has a coefficient value of .7053. This value is rated highly significant with a probability of .000 at 5% confidence level. This planning factor's R2 value indicates that 20% of possible variations in performance of companies results from having clear vision statement. The finding agrees with our a priori expectation. Therefore, we reject the null hypothesis which states that vision statement does not significantly affect performance of manufacturing companies and accept the alternative.
Ahuja Journal of Business and Management Vol. /, Issue I [30-36}, March-20 15 www.abujajournalofbusinessandmanagement.org.ng Page 33
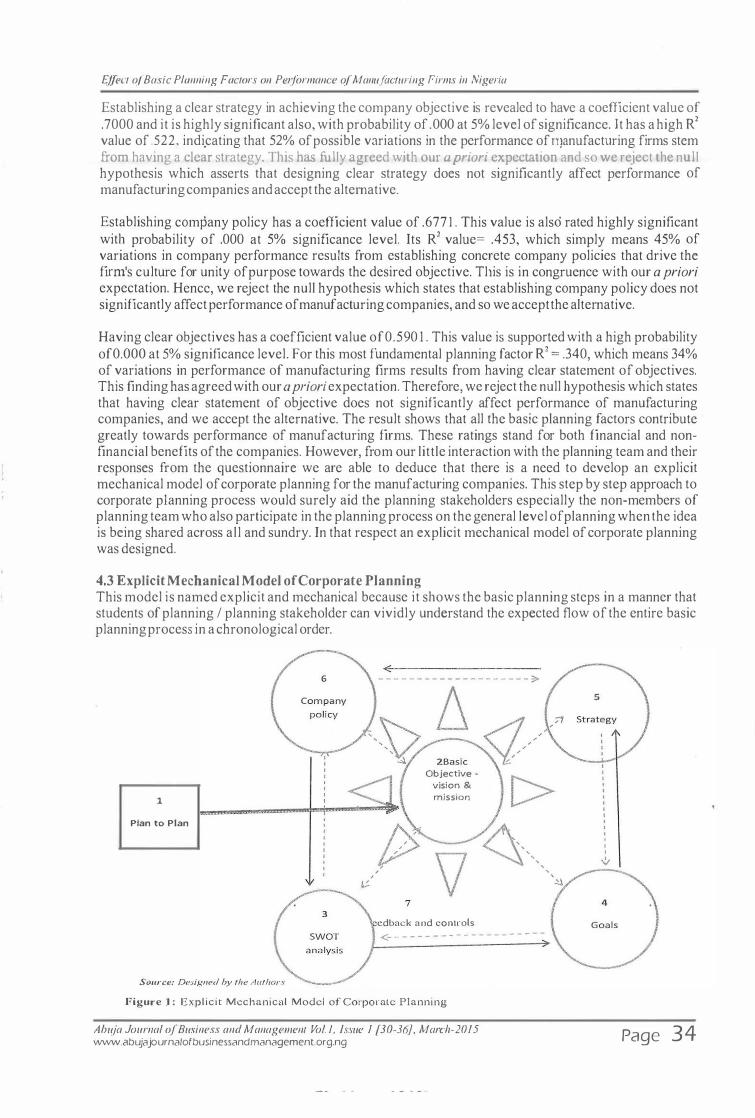
Effect of Basic Planning Factors on Pe1jormance of Manufitcturing Firms in Nigeria
Establishing a clear strategy in achieving the company objective is revealed to have a coefficient value of .7000 and it is highly significant also, with probability of .OOO at 5% level of significance. It has a high R2 value of .522, indi.cating that 52% of possible variations in the performance of 111anufacturing firms stem from having a clear strategy. This has fully agreed with our a priori expectation and so we reject the null hypothesis which asserts that designing clear strategy docs not significantly affect performance of manufacturing companies and accept the alternative.
Establishing company policy has a coefficient value of .677 1 . This value is also rated highly significant with probability of .000 at 5% significance level. Its R2 value= .453, which simply means 45% of variations in company performance results from establishing concrete company policies that drive the finn's culture for unity of purpose towards the desired objective. Tllis is in congruence with our a priori expectation. Hence, we reject the null hypothesis which states that establishing company policy does not significantly affect performance of manufacturing companies, and so we accept the alternative.
Having clear objectives has a coefficient value of0.590 1 . This value is suppot1ed with a high probability ofO.OOO at 5% significance level. For this most fundamental planning factor R2
= .340, which means 34% of variations in performance of manufacturing firms results from having clear statement of objectives. This finding has agreed with our a priori expectation. Therefore, we reject the null hypothesis which states that having clear statement of objective does not significantly affect performance of manufacturing companies, and we accept the alternative. The result shows that all the basic planning factors contribute greatly towards performance of manufacturing firms. These ratings stand for both financial and nonfinancial benefits of the companies. However, from our little interaction with the planning team and their responses from the questionnaire we are able to deduce that there is a need to develop an explicit mechanical model of corporate planning for the manufacturing companies. This step by step approach to corporate planning process would surely aid the planning stakeholders especially the non-members of planning team who also participate in the planning process on the general level of planning when the idea is being shared across all and sundry. In that respect an explicit mechanical model of corporate planning was designed.
4.3 Explicit Mechanical Model of Corporate Planning This model is named explicit and mechanical because it shows the basic planning steps in a manner that students of planning I planning stakeholder can vividly understand the expected flow of the entire basic planning process in a chronological order.
1
Plan to Plan
Source: Designed by the Authors
7
Objective vision & mission
cdback and controls
<- - - - - - - - - - - - - - - - - - - - -
Figure 1 : Explicit Mechanical Model of Corporate Planning
Abuja Joumal of Business and Management Vol. !, Issue I [30-36], March-20 15 www.abujajournalofbusinessandmanagement.org.ng
I I I
{'
Page 34
Effect of Basic Planning Factors on Pe1jormance of Manufacturing Firms in Nigeria
Step one in the model shows that introducing corporate planning in an organization needs an executive virile decision because it would radically change the entire philosophy of operations and administration of the organization. Step two, is to establish the core factors of the entire plan, the basic objectives. Planning team under the supervision of the CEO should establish the company objectives. These objectives must emanate from the corporate vision and mission statement of the organization. Step three is the total analysis ofthe company and the environment in which it operates.
The organization should assess its strengths and weaknesses in line with its basic objectives/company dream (vision and mission), and further scan its external environment to pemse for opportunities to invest in and scan for threats to manipulate and surmount, where possible (SWOT analysis). SWOT analysis simply forms the data base of the company, from where the company goals should evolve. Fourthly, goals must emanate based on the information in the company data base. Goals are the road map, the. bench mark, and the prescribed steps towards achieving the basic objective of an organization. The fifth step is the designing of strategy to use in achieving the goals and objectives. After situation analysis, a clear picture of the finn and its environment is in hand and specific alternatives can then be developed. Strategy describes how an organization intends to achieve the clearly defined objective. This step is so critical in planning, for it will dictate how resources are to be allocated - budgeting. The sixth step in the model is the company policy. Policies are the ways and manner in which the established strategies are to be executed. In other words, company policy is way the company is being mn. It is the outcome of corporate culture and philosophies that should govern the employee behaviour towards the business objective.
Organizational Culture is the commonly held attitudes, values, beliefs and behaviours of its employees. The culture of an organization is as unique and diverse as an individual's personality. Corporate culture is composed of three elements --- shared values, decision making patterns and overt behaviour patterns. It may be called organizational climate, corporate style, corporate ethos, and sometimes, beliefs, assumptions, schemas, corporate eye glasses, common maps (Barney et al, 1 992).
The seventh step is the feedback and control. This is represented with doted lines. It shows that for every action in any of the steps there must be a feedback for control purposes, so that all actions must be in harmony with the basic objective. Apart from the model, there is also the need to develop a new culture which promotes involvement through Workshops and seminars. This would enable the planning pilots to carefully formulate and communicate company philosophy and use planning to shape the future business profi le.
5. Conclusion Conclusively, since the planning stakeholders agreed that the basic planning factors enhance corporate performance it is an indication that they believe in corporate planning as a worth-while business practice. As such, this explicit mechanical model of corporate planning under the auspices of corporate culture would boost the understanding of the stakeholders and consequently improve corporate performance.
References Ansoff, Igor 1 965, "Corporate Strategy " McGraw Hill, New York Barney, J.B. & Griffiri, R. W. l 992, "The Management of Organizations: Strategy, Structure, Behaviour",
Boston: Houghton. Bart, Christopher K, Nick Bontis and Simon Tagar 200 1 , "A model of the effect ofmission. statement on.
firm performance " Erica Olsen 20 1 2, Strategic Planning Kit for Dummies, 2"d edition Drucker, P.F. 1 973, "The practice ofManagement ". New York: Harper and Row Publishers Lebas, M. and Euske, K. 2002, "A conceptual and operational delineation of performance ", In Neely, A .
Business perf01mance measuremcnt: Theory and practice, Cambridge University Press. Lowen J. 1 997, " The Power ofStrategy ". 1 st Edition, Zebra press,Sandton. Mayle, D., Hinton, M., Francis, G. and Holloway, . J. 2002, what really goes on in the name of
benchmarking? In Neely, A. Business performance measurement: Theory and practice, Cambridge University Press.
Neely, A. 2002, "Business performance measurement: Theory and practice ". Cambridge University Press
Kotler, P. 1 99 1 , "Marketing Management, analysis implementation and control". New Delhi, prentice hall.
Abt!ja Joumal of Business and Management Vol. !, Issue I [30-36], Marclt-2015 www.abujajournalofbusinessandmanagement.org.ng Page 3 5
Effect of Basic Plannmg Factors on Petformance of Manufacturmg Firms in Nigeria
Kumar, Ranjit 2005, "Research Methodology -A step - by - step Guide for Beginners ". (2"d edition), Singapore, Pearson Education.
Strange, J.M & Mumford,.M.D 2005, "the Origin of Vision Effects ofRcflcction, Mode.ls and Analysis" The leadership Quarterlv vol. 1 6 pp 1 2 1 - 1 48
Warner, Malcom 2000, "Regional Encyclopedia of Business Management: Management in Emerging Countries " AnArticlc on Management Best Practice, p . l 69- l 75
Abu) a Joumal of Business and Management Vol. /, Issue I [30-36], March-20 15 www.abujajournalofbusinessandmanagement.org.ng Page 36
Empirical Assessment of the Willingness to Pay for Waste Collection and Disposal Se�vices in Kano Metropolis, Nigeria
Dr. Mustapha Muktar' , Nura Aliyu Kabuga2 1 (Department of Economics, Bayero University Kana - Nigeria) 2 (Department of Economics, Bayero University Kana - Nigeria)
Abstract: Contingent valuation (CV) method was used to estimate households ' willingness to pay (WTP) for waste collection and disposal services in Kana Metropolis, Nigeria. A multistage sampling technique was employed to randomly select a sample of 326 respondents for the study. Using logit model, the study revealed that 86.5% of the respondents are willing to pay for waste collection and disposal services in Kana Metropolis and the major determinants of the households ' WTP are education, income and utility derived by households from service deli very which are pas itive and statistically significant at level of 1 %; age, gender and occupation are negative and statistically significant at level of 1%, and family size is positive and statistically significant on households ' willingness to pay at level of 10%. The result of the study also found out that mean willingness to pay for improved waste collection and disposal was N1228. 00. Following this, the paper advocates the need to regulate and inc01porate private sector into waste management in Kana Metropolis, thereby privatizing waste collection and disposal services. Since the stated WTP amounts were found to vary significantly, the paper also suggests that the amount of money to be charged for the waste management services should not exceed the mean willingness to pay amount found in this study. It is also recommended that government and other stakeholders should further educate the public on proper method of waste disposal in Kana Metropolis. Keywords: Log it, Contingent Valuation, willingness to pay, Waste collection, Waste disposal and Binary choice
1 . Introduction One of the major reasons for valuing waste collection and disposal is the assumption that a well designed survey aimed at determining the willingness and capacity of household to pay is a key factor in addressing challenges of improving the efficiency of waste management system in urban areas. This study explored the possibilities of applying contingent valuation method to estimate households' willingness to pay (WTP) for waste collection and disposal in Kano Metropolis. The study area was particularly chosen in this context because it is one major area in Nigeria that is battling with management of a large volume of household waste and there is a move recently to involve the private sector in providing the waste collection and disposal services, a policy that is a clear departure from the notion that local authorities must be responsible for providing waste management services free of charge in the area. The rationale for this new policy is based on the fact that public waste collection is not efficient and that involvement of private sector is expected to bring about efficiency as has been noted in other sectors of the economy. This study will assist to improve understanding of the households willingness to pay and can provide policy makers with a useful information for effective and efficient waste management policy so that if willingness of people is known the amount to be charged will be within their ability and the collection exercise is likely to be successful. The study is organised into five parts, introduction, a review of empirical literature and theoretical .framework, materials and methods, results and discussion and conclusion and recommendations.
2. Literature Review There are several contingent valuation (CV) studies conducted particularly in developing countries to investigate households· willingness to pay for waste collection and disposal services. Although, as Wang et al., (20 1 1 ) rightly observed most of the studies conducted prior to 2000 are for waste management schemes in developed countries, the period after 2000 marked watershed for most CV studies in developing countries as more papers are found on the scheme. The major differences between the CV studies undertaken in these places is that, while most of the contingent valuation studies in developing countries are more concerned with the benefits of introducing new waste management approaches such as curbside recycling, composting and incineration which aim to reduce landfil l , on the contrary most
Ahuja Journal of Business and Management Vol. I, Issue I [37-44], March-20I 5 www.abujajournalofbusinessandmanagement.org.ng Page 3 7
Empirical Assessment of the Willingness to Pay for Waste Collection and Disposal Services in Kano Metropolis, Nigeria
developing country-based CV studies are focused on the benefits of providing improved waste collection and disposal services away from conventional methods.
In another study, Yusuf, Salimonu and Ojo (2007) investigated the determinants of willingness to pa\ for improved household solid waste management in Oyo State, Nigeria using contingent valuation method. From logit regression estimates, the result of the study found that price of the service, age; educational level, household size, and households' monthly expenditure affect willingness to pay for waste management. Because majority of the household have considerable large family size and dependents, it is recommended in the study that an acceptable family planning programme should be adopted to control their population. In addition, household should improve their income and purchasing power by establishing more small scale businesses.
Similarly, Rahji and Oloruntoba (2009) conducted a study using contingent valuation method to examine determinants of willingness to pay for private solid waste disposal systems by urban households in Ibadan, Nigeria. A multistage random sampling technique was used to select 552 households for the study. Evidence from their logit model indicated that income and asset owned were positive and significant at 1 % level, but amount o f willingness to pay and finn services were negative and significant at 1 % level at the same time age was negative and significant at 1 0% while education and occupation were positive and significant at 5% level. The study recommends government intervention in a variety of forms such as encouraging public-private pa1tnership in solid waste disposal, an aggressive environmental clean campaign, and decentralization of waste management boards and privatization of some aspects of waste management to ameliorate solid waste problems and improve health.
Khattak, Khan and Ahmad (2009) examined willingness to pay for better solid waste management services in urban areas of the District of Peshawar, Pakistan using contingent valuation technique. Their findings obtained using logit model of estimation revealed that 53 percent of the households were satisfied with the existing solid waste management, and only 49 percent ofthem showed their willingness to pay for better solid waste management services. The results further show household size, income of household and higher education are determinants of households' willingness to pay while awareness and disease history of the household are statistically not significant. They went ahead to recommend that government should tap from the household's willingness to pay to provide improved solid waste management service.
Ekere, Mugisha and Drake (20 1 0) used contingent valuation to assess the determinants of waste generation and willingness by household to pay for sound waste management in urban and peri-urban areas of the Lake Victoria crescent region Uganda. The research work used a random sample of 577 selected households. In order to analyse the result of the study using econometric models, both ordinary Least Square (OLS) and Logit regression models were used. The result of ordinary least square regression shows that income, age and household size influenced waste generation. The result from the logit analysis revealed that income of the household head, location of the household, gender of the household head, level of environmental concern, age of the household head and quantity of crop waste generated by the households were significant and explained the household's willingness to pay for waste management. Since the study indicated that households were willing to pay for sound waste management, the authors suggest it should provide the basis for fixing of waste disposal fees by government but in fixing waste �ollection fees, authorities should pay attention to location and jncome ofresidents.
Mahanta and Das (20 1 1 ) used both contingent valuation method and logit model to analyze the problems of solid waste management and households' willingness to pay for improvement in waste management (collection and disposal) in Guwahati, India. Two stage sampling techniques were applied to collect information from 360 randomly selected households. The findings revealed an average household in the city was willing to pay Rs. 60.22, though, a meagre percentage of low income groups are showing a zero willingness to pay. The authors believed zero willingness to pay can be handled by other means like pmsuing low income eamers to pay, introducing lower charges or making them to work instead of paying money. Based on the research findings, they suggest door to door waste collection service should be implemented as households have shown willingness to pay. They further added due to failure of local authorities to manage waste collection and disposal, the concept of Public-Private Partnership should be introduced.
Ahuja Joumal of Business and Management Vol./, Issue I [37-44}, March-201 5 www.abujajournalofbusinessandmanagement.org.ng Page 38
Empirical Assessment of the Willingness to Pay for Waste Collection and Disposal Services in Kano Metropolis, Nigeria
Hagos, and Gebreegziabher (20 12) assessed the current sanitary service fees and willingness to pay (WTP) of residents for improved urban waste management using a cross-sectional survey of 226 randomly selected households in Mckellc city, Ethiopia. They used age, sex, education, awareness, family size, income, marriage status, perception, house ownership, household waste, type of solid waste service and starting price as explanatory variables. The results of Tobit and Probit models revealed that willingness to pay is significantly related to income and awareness of environmental quality among other factors. The mean willingness to pay for improved solid waste management per month per household is ETB 1 1 .89, while the open-ended (maximwn WTP) is ETB 7.88 per month per household. But the actual WTP of the households in the city may fall between the total monthly aggregated WTP of the city estimated as ESTB 430,566 and the monthly city WTP estimated at 532,536 using dichotomous singlebounded question. This suggests as shown by the authors that citizens are eager for improved solid waste management, thus there is more room to increase the fee and acquire sufficient funds to substantially improve and modernize waste management services in the city.
Roy and Deb (20 13) used a contingent valuation technique to establish the determinants of households' willingness to pay for improved waste management in Silchar Municipal area, Cachar District, Assam, India. Their multiple regression study revealed an average of63% of the households are willing to pay for improved waste management. Using the multiple regressions, they revealed willingness to pay was significantly affected by monthly average expenditure, household size, average education, environmental awareness and number of working women. Since most of the household waste is covered by biodegradable wastes and non-biodegradable like plastic, paper, metals and others, the authors suggest composting of biodegradable waste and increased waste recycling and recovery as area of further development. Even though, from the empirical literature reviewed contingent valuation has emerge as frequently employed methodology of valuing a proposed scheme for improving waste collection and disposal in developing countries, i t is also evident that there exist few contingent valuation research effort in relation to improved waste management services in Nigeria. This concern provides the rationale for this study and therefore adds to scant literature on contingent valuation in Nigeria and Kana in particular.
3. Research Methodology 3.1 Study Area Kana Metropolis, where the study area is located, is situated in the North-western part ofNigeria. The area consists of about eight (8) local government areas (LGAs) namely Kana Municipal, Dala, Nassarawa, Gwale, Fagge, Tarauni, and some parts of Kumbotso and Ungoggo. Additionally, a total projected population of the combined eight local government areas in 20 12 is estimated at 3 1 8,73 8 (Bayero University Kana Consultancy Unit, 20 12). This study selected and studied 326 households for the survey. In order to ensure the sample households were representative of the population, the study area was stratified into three sampling units each representing different income group (High, Middle and Low income areas) as a first stage. Thereafter, a sample was proportionately allocated into each sampling unit (strata) according to each share of total households or residential population density. For this, in each sampling unit or strata, the sampled households were chosen through multi-stage sampling. That is, since each sampling unit (strata) is composed of different residential areas, a number of residential areas were selected at random as second stage of the sampling process. The third stage involved the selection of residential structures'.
3.2 Model Specification To analyse whether households' are willing to pay for waste collection and disposal services in Kana Metropolis, a model that could predict discrete outcomes is used. For this, a binary model that allowed for two possible outcomes-yes or no type answer is needed. The type of model is adopted by Khattak, Khan and Ahmad (2009) to examine willingness to pay (WTP) for better solid waste management services in urban areas of District Peshawar, Pakistan. In their model households· willingness to pay (HH' s WTP) was treated as dependent variable and was regressed on some socioeconomic variables that include education level, income, household size, awareness and disease h istory respectively as shown below:
Abuja Journal of Business and Management Vol. !, Issue I [37-44}. March-201 5 www.abujajournalofbusinessandmanagement.org.ng Page 39
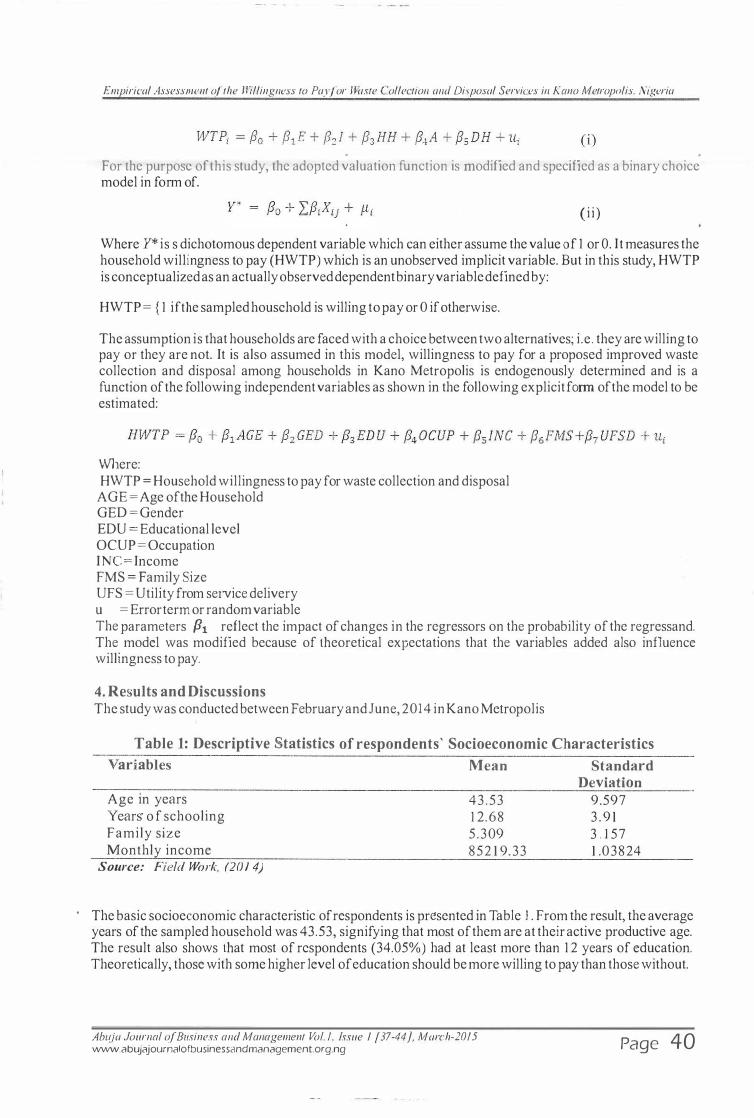
Empirical Assessment of the Willingness to Pay.for Waste Collection and Disposal Services in Kano Metropolis, Nigeria
.
For the purpose of this study, the adopted valuation function is modified and specified as a binary choice model in form of.
(i i)
Where Y* is s dichotomous dependent variable which can either assume the value of 1 or 0. It measures the household willingness to pay (HWTP) which is an unobserved implicit variable. But in this study, HWTP is conceptualized as an actually observed dependent binary variable defined by:
HWTP = { 1 if the sampled household is willing to pay or 0 if otherwise.
The assumption is that households are faced with a choice between two alternatives; i.e. they are willing to pay or they are not. It is also assumed in this model, willingness to pay for a proposed improved waste collection and disposal among households in Kano Metropolis is endogenously determined and is a function of the following independent variables as shown in the following explicit f01m of the model to be estimated:
Where: HWTP = Household willingness to pay for waste collection and disposal
AGE = Age of the Household GED = Gender EDU = Educational level OCUP = Occupation INC= Income FMS = Family Size UFS = Utility from service delivery u = Error term or random variable The parameters Pt reflect the impact of changes in the regressors on the probability of the regressand. The model was modified because of theoretical expectations that the variables added also influence willingness to pay.
4. Results and Discussions The study was conducted between February and June, 2014 in Kano Metropolis
Table 1: Descriptive Statistics of respondents' Socioeconomic Characteristics Variables
Age in years YearS' o f schooling Family size Monthly income
Source: Field Work, (201 4)
Mean
43 .53 1 2.68 5 .309 852 1 9.33
Standard Deviation
9.597 3 . 9 1 3 . 1 57 1 .03824
· The basic socioeconomic characteristic of respondents is presented in Table 1 . From the result, the average years of the sampled household was 43.53, signifying that most of them are at their active productive age. The result also shows that most of respondents (34.05%) had at least more than 1 2 years of education. Theoretically, those with some higher level of education should be more willing to pay than those without.
Abtlja Journal of Business and Management Vol. /, Issue I [37-44], March-201 5 www.abujajournalofbusinessandmanagement.org.ng Page 40
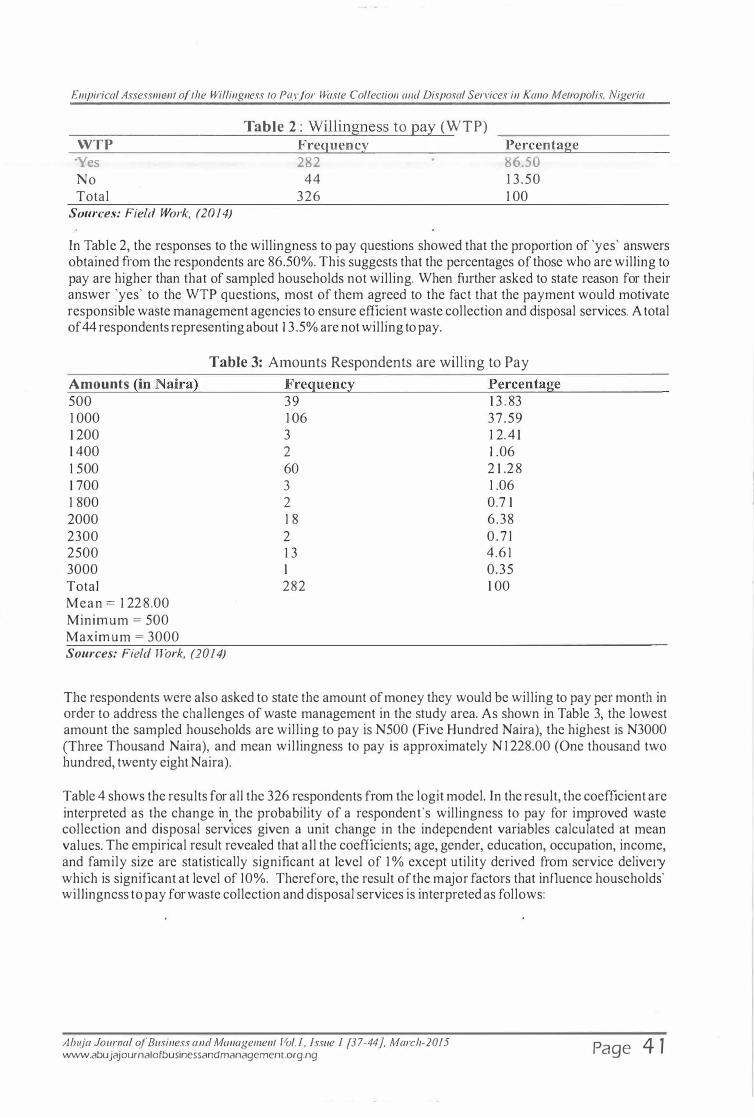
Empirical Assessment of the Willingness to Pay for Waste Collection and Disposal Services in Kana Metropolis, Nigeria
WTP ·Yes No Total
Sources: Field Work, (2014)
Table 2 : Willingness to pay (WTP) Frequency 282
44 326
Percentage 86.50 1 3 .50 1 00
In Table 2, the responses to the willingness to pay questions showed that the proportion of 'yes' answers obtained fi·om the respondents are 86.50%. This suggests that the percentages of those who are willing to pay are higher than that of sampled households not willing. When further asked to state reason for their answer 'yes' to the WTP questions, most of them agreed to the fact that the payment would motivate responsible waste management agencies to ensure efficient waste collection and disposal services. A total of 44 respondents representing about 1 3 .5% are not willing to pay.
Table 3: Amounts Respondents are willing to Pay
Amounts (in Naira) 500 1 000 1 200 1 400 1 500 1 700 1 800 2000 2300 2500 3000 Total Mean = 1 22 8 .00 Minimum = 500 Maximum = 3000 Sources: Field Work, (2014)
Frequency 39 1 06 3 2 60 3 2 1 8 2 1 3 1 282
Percentage 1 3 . 83 37.59 1 2. 4 1 1 .06 2 1 .2 8 1 .06 0.7 1 6 .38 0 . 7 1 4.6 1 0.35 1 00
The respondents were also asked to state the amount of money they would be willing to pay per month in order to address the challenges of waste management in the study area. As shown in Table 3, the lowest amount the sampled households are willing to pay is N500 (Five Hundred Naira), the highest is N3000 (Three Thousand Naira), and mean willingness to pay is approximately N 1 228.00 (One thousand two hundred, twenty eight Naira).
Table 4 shows the results for all the 326 respondents from the logit model. In the result, the coefficient are interpreted as the change in, the probability of a respondent's willingness to pay for improved waste collection and disposal services given a unit change in the independent variables calculated at mean values. The empirical result revealed that all the coefficients; age, gender, education, occupation, income, and family size are statistically significant at level of 1 % except utility derived from service delivery which is significant at level of 10%. Therefore, the result of the major factors that influence households' willingness to pay for waste collection and disposal services is interpreted as follows:
Abzlja Journal ()[ Business and Management Vol. I, Issue I [37-44}, March-201 5 www.abujajournalofbusinessandmanagement.org.ng Page 4 1
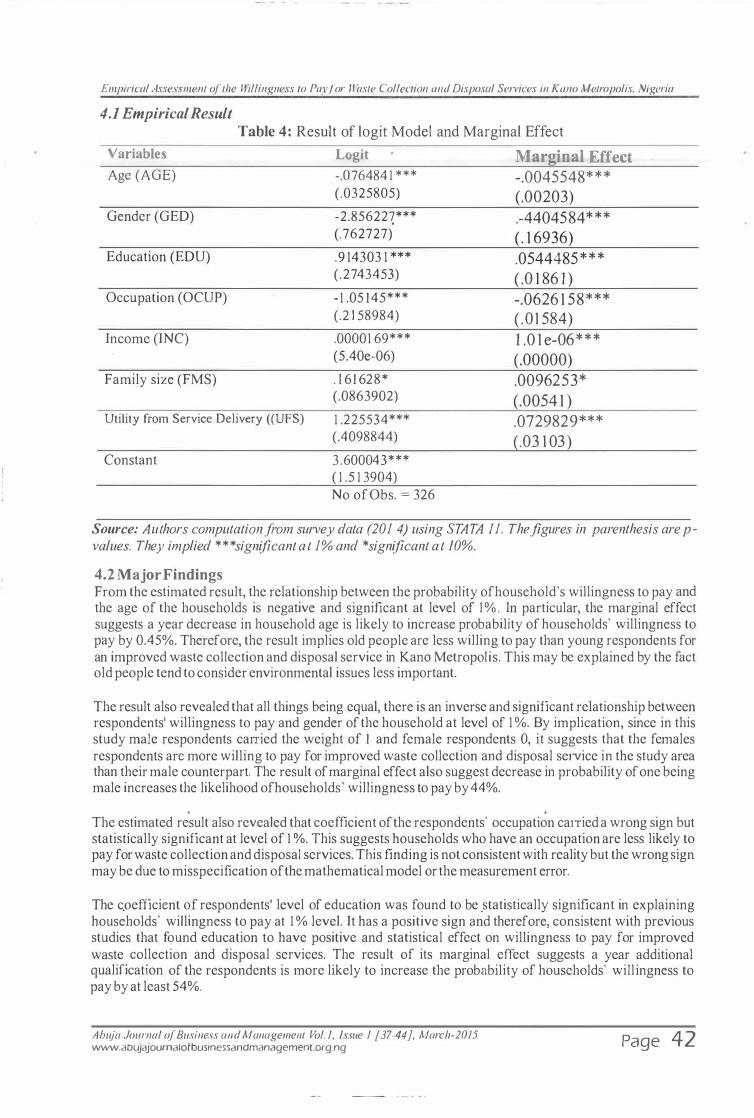
Empirical Assessment of the Willingness to Pay .for Waste Collection and Disposal Services in Kano Metropolis, Nigeria
4.1 Empirical Result Table 4: Result of logit Model and Marginal Effect
Variables Logit Marginal Effect Age (AGE) -.076484 1 *** -.0045548***
(.0325805) (.00203) Gender (GED) -2.85622�*** .-4404584***
(.762727) ( . 1 6936) Education (EDU) .9 14303 1 *** .0544485***
( .2743453) ( . 0 1 86 1 ) Occupation (OCUP) - 1 .05 145*** -.0626 1 58***
(.2 1 58984) ( .0 1 584) Income (INC) .00001 69*** 1 .0 1 e-06***
(5.40e-06) (.00000) Family size (FMS) . 1 6 1 628* .0096253*
(.0863902) (.0054 1 ) Utility from Service Delivery ((UFS) 1 .225534*** .0729829***
Constant
(.4098844) (.03 1 03 ) 3.600043*** ( 1 .5 1 3904) No of Obs. = 326
Source: Authors computation from survey data (201 4) using STATA 11. The figures in parenthesis are pvalues. They implied ***significant at 1% and *significant at 10%.
4.2 Major Findings From the estimated result, the relationship between the probability ofhouschold's willingness to pay and the age of the households is negative and significant at level of 1% . In particular, the marginal effect suggests a year decrease in household age is likely to increase probability of households' willingness to pay by 0.45%. Therefore, the result implies old people are less willing to pay than young respondents for an improved waste collection and disposal service in Kana Metropolis. This may be explained by the fact old people tend to consider environmental issues less important.
The result also revealed that all things being equal, there is an inverse and significant relationship between respondents' willingness to pay and gender of the household at level of 1 %. By implication, since in this study male respondents carried the weight of 1 and female respondents 0, it suggests that the females respondents arc more willing to pay for improved waste collection and disposal service in the study area than their male counterpart. The result of marginal effect also suggest decrease in probability of one being male increases the likelihood ofhouseholds · willingness to pay by 44%.
. .
The estimated result also revealed that coefficient of the respondents' occupation ca1Tied a wrong sign but statistically significant at level of 1 %. This suggests households who have an occupation are less likely to pay for waste collection and disposal services. This finding is not consistent with reality but the wrong sign may be due to misspecification of the mathematical model or the measurement error.
The c.oefficicnt of respondents' level of education was found to be .statistically significant in explaining households' willingness to pay at 1 % level. It has a positive sign and therefore, consistent with previous studies that found education to have positive and statistical effect on willingness to pay for improved waste collection and disposal services. The result of its marginal effect suggests a year additional qualification of the respondents is more likely to increase the probability of households· willingness to pay by at least 54%.
Ahuja Joumal of Business and Management Vol. /, Issue 1 [37-44}, March-2015 www.abujajournalofbusinessandmanagement.org.ng Page 42
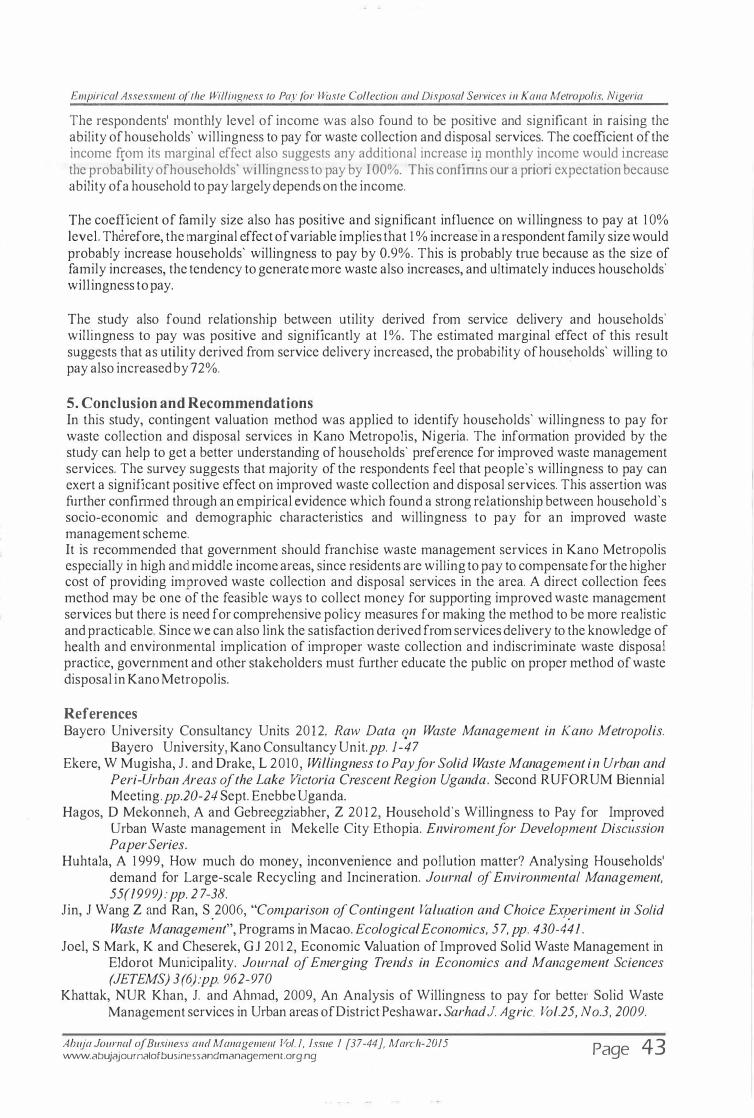
Empirical Assessment of the WiLlingness to Pay for Waste Collection and Disposal Services in Kana Metropolis, Nigeria
The respondents' monthly level of income was also found to be positive and significant in raising the ability of households' willingness to pay for waste collection and disposal services. The coefficient of the income from its marginal effect also suggests any additional increase il) monthly income would increase the probability ofhouseholds' willingness to pay by I 00%. This confinns our a priori expectation because ability of a household to pay largely depends on the income.
The coefficient of family size also has positive and significant influence on willingness to pay at 1 0% level. Therefore, the marginal effect of variable implies that 1 % increase'in a respondent family size would probably increase households' willingness to pay by 0.9%. This is probably ttue because as the size of family increases, the tendency to generate more waste also increases, and ultimately induces households' willingness to pay.
The study also found relationship between utility derived from service delivery and households' willingness to pay was positive and significantly at I%. The estimated marginal effect of this result suggests that as utility derived from service delivery increased, the probability of households' willing to pay also increased by 72%.
5. Conclusion and Recommendations In this study, contingent valuation method was applied to identify households' willingness to pay for waste collection and disposal services in Kano Metropolis, Nigeria. The information provided by the study can help to get a better understanding ofhouseholds' preference for improved waste management services. The survey suggests that majority of the respondents feel that people's willingness to pay can exett a significant positive effect on improved waste collection and disposal services. This assertion was further confinned through an empirical evidence which found a strong relationship between household's socio-economic and demographic characteristics and willingness to pay for an improved waste management scheme. It is recommended that government should franchise waste management services in Kano Metropolis especially in high and middle income areas, since residents are willing to pay to compensate for the higher cost of providing improved waste collection and disposal services in the area. A direct collection fees method may be one of the feasible ways to collect money for supporting improved waste management services but there is need for comprehensive policy measures for making the method to be more realistic and practicable. Since we can also link the satisfaction derived from services delivery to the knowledge of health and environmental implication of improper waste collection and indiscriminate waste disposal practice, government and other stakeholders must further educate the public on proper method of waste disposal in Kano Metropolis.
References Bayero University Consultancy Units 20 12, Raw Data qn Waste Management in Kana Metropolis.
Bayero University, Kano Consultancy Unit.pp. 1-47 Ekere, W Mugisha, J . and Drake, L 2010, Willingness to Pay for Solid Waste Management in Urban and
Peri-Urban Areas of the Lake Victoria Crescent Region Uganda. Second RUFORUM Biennial Meeting.pp.20-24 Sept. Enebbe Uganda.
Hagos, D Mekonneh, A and Gebreegziabher, Z 20 12, Household's Willingness to Pay for Improved Urban Waste management in Mekelle City Ethopia. Enviromentfor Development DiscL;ssion Paper Series.
Huhtala, A 1 999, How much do money, inconvenience and pollution matter? Analysing Households' demand for Large-scale Recycling and Incineration. Journal ofEnvironmental Management, 55(1999):pp. 2 7-38.
Jin, J Wang Z and Ran, S .2006, "Comparison of Contingent Valuation and Choice ExP.eriment in Solid Waste Management", Programs in Macao. Ecological Economics, 57, pp. 430-441 .
Joel, S Mark, K and Chcserek, GJ 201 2, Economic Valuation of lmproved Solid Waste Management in Eldorot Municipality. Journal of Emerging Trends in Economics and Management Sciences (JETEMS) 3(6):pp. 962-970
Khattak, NUR Khan, J. and Ahmad, 2009, An Analysis of Willingness to pay for better Solid Waste Management services in Urban areas ofDistrict Peshawar. Sarhad J Agric. Vo/.25, No.3, 2009.
Abu) a Journal of Business and Management Vol. /, Issue 1 [37-44}. March-2015 www.abujajournalofbusinessandmanagement.org.ng Page 43

Empirical Assessment of the Willingness to Pay for Waste Collection and Disposal Services in Kana Metropolis, Nigeria
Mahanta, R Das, D 20 1 1 , Municipal Solid Waste Management in Guwahati: A case study. Vol. 1 ,Issue. ! I. Nov; 2011 pp. 1-4. ISSN:-2249-894X
Rahji, MAY and Oloruntoba EO 2009, Determinants ofHo�seholds' Willingness-to-pay for Private Solid Waste Management Servtees m Ibadan, Ntgena. Waste Management & Research http://wmr.sagepub.com/content/2 7 I 1 0/961
Roy, AT and Deb, U 2013 , Households Willingness to pay for Improved Waste Management in Silchar Municipal area: A case study in Cachar District, Assam. IOSR Journal of Humanities and Social Science (IOSR-JHSS) ISSN: 2279-0837, ISBN: 2279-0845. Volume 6, Issue 5 (Jan. - Feb. 2013), pp.2I-31 wvvw.Iosrjournals. Org
Wang, H et al. 20 1 1 , Municipal Solid Waste Management in Small Towns: An Economic Analysis Conducted in Yunnan, China. Policy Research working paper. The World Bank, Development Research Group. Environmental and Energy Team. August, 20 II. pp I-2 7.
Whitehead, JC 2002, Incentive Incompatibility and Starting-Point Bias in Iterative Valuation Questions. Land Economics 7 8 (2), pp.2 85-297
Yusuf, SA Salimonu, KK and Ojo, OT 2007, Determinants of willingness to pay for improved Household Solid Waste Manangement in Oyo State, Nigeria. Research Journal of Appeal Sciences pp.233-239
Abu) a Joumal of Business and Management Vol. I , Tssue I [37-44], March-2015 www.abujajournalofbusinessandmanagemenr.org.ng Page 44
-����
/ �\� . : / ----- , .. ...,. . :i f :. : : t �""-··-·""·�""1 L� :· · . \ p.
�,�- �� � 4·A The Impact of Public Expenditure on Economic Grow��-�
Nigeria: 1 982-2012
Dr. Mohammed Yelwa'· Prof. S.A.J. Obansa2' ALFA, Mohammed Danlami3 I 1Department of Economics, University of Ahuja)
2 (Department of Economics, University of Ahuja)
3 (Department of General Studies, Federal Polytechnic, Bida. Niger State)
Abstract: This paper examined reasons why some people are still poor and why public expenditure could not lead to economic growth. The objective of this paper is to investigate the impact of public expenditure on the economic growth in the short-run and long-run. Koyck's model was adopted to test the long-run and the short-run effects of total public expenditures on Economic Growth in Nigeria. The variables were tested to determine their level of stationarity using Augmented Dickey Fuller (ADF). The result of the Jarque-Bera normality test shows that the variables used in the study were normally distributed around its zero mean and constant variance. Koyck's models were estimated and the results show that total expenditure was statistically significant in the long - run while in the short - run total expenditure was statistically insignificant. The result further reveals that Wagner's hypothesis does not hold in some of the variables in our estimated model this invalidates Keynesian Paradigm of increased government expenditure. Therefore, the study recommends, for government to ensure that total expenditure should be properly managed in a manner that will raise the nation 's productive capacity and accelerate economic growth . . Unnecessary delays in the passage ofannual budget was identified as a bottlenecks in the course of budget executions should be avoided for the budget to achieve its desired objectives within the short run. The leakages in government spending and redefining its public expenditure and strengthening of the internal mechanism for economic growth and development become necessmy. Keywords: Koycks Model, Public Expenditure, Economic Growth, Capital Expenditure and Recurrent Expenditure.
1 . Introduction Public expenditure is concerned with the utilization by government of the nation's resources with regards to the rules, regulations and policies that shape the planning, budgeting, forecasting, coordinating, directing, influencing and governing the inflow and outflow of funds in order to maximize the economic objective for the benefit of the citizenry. In other words, public expenditure deals with government spending and the level ofliquidity in the economy in order to achieve some stated objectives (Sharp and Slunger, 1 970). There is a conh·oversy regarding the economic system which would ensure that an economy is always on the path of growth. There is need to determine the size of government's involvemc;Jnt�and its impact on the growth of the economy. While the classical theorists are of the yiew.:�that go_vemment should have little or nothing to do with the economy, explaining that if government expenditure is too big, it will undermine economic growth by transferring additional resources from the productive sector of the economy to government which uses them less efficiently. The Keynesian school on the other band argued that the economy can only be boosted by active participation of government via its fiscal policy operation especially deficit spending which could provide short term stimulus to help end a recession or depression. In other words, Keynesian economies emphasize active participation in the economic activities of a nation through public expenditure and taxation. So, which of the two viewpoints would ensure that economy is always on the path of growth? And what are the reasons (Lindauer i 988)?
·
The use of economic theory therefore is important in providing a framework for understanding how the economy works but evidence helps to determine which economic theory is most accurate. It is also important to ascertain whether government expenditure helps or hinders
Ahuja Journal of Business and Management Vol. /, Issue 1 [45-55], March-201 5 www.abujajournalofbusinessandmanagement.org.ng Page 45
The Impact of Public Expenditure on Economic Growth in Nigeria: 1982-2012
economic performance. However, economic theory does not automatically generate strong conclusion about the impact of government expenditure on economic performance. Many economists would agree that there are circumstances when lower levels of government expenditure would enhance economic growth and other times when higher level of government expenditure would be desirable (Nwezeaku 20 1 0).
The role of public expenditure cannot therefore be overemphasized. In developed countries, it is employed as an instrument in the stimulation of investment activities and economic stability. Significantly, these roles are much more important in the less developed countries (LDCs) such as Nigeria. This is in view of the active part they play in developing social overhands and in structure thereby, encouraging economic growth through investment in education, health services, transportation, power and communication facilities. So also capital goods, industries, basic and key industries, enforcing contract, protecting property, and so on. So, for a successful operation of rule oflaw, there must be a government spending.(Aschauer, 1 989a).
Kwanashie ( 198 1 ) argued that the public sector in N igeria have great dominance in the economy, in particular, after independence in 1 960 and increased immediately after the civil war in 1 970 through to 1 990s particularly with the increasing revenue from oil. Since then, the significance of public expenditure has become so vital that it can be said that a larger proportion of the country's Gross Domestic Product CGDP) is anchored on the spending decision of government. The decisions provide links between government's expenditure and economic growth of the country, in which case the dominance of the public sector requires the mobilization and expenditure of vast amount of resources. Thus, through its investment policy government could influence the pattern, volume and direction of aggregate demand and investment.
Nigeria is undoubtedly one of the most endowed nations on earth, given her human and abundant nah1ral resources; she ought to be one of the richest countries in the world. For instance, the country is endowed with natural resources which are in abundance all over the country the deposits which have been explored in the last 45 years and have been a source of huge resources to the Federal government.
In spite of these resources, and after over five decades of sovereignty, Nigeria's economic contribution to global gross domestic product was put at 0.22 percent. The United Nations Development Index reports that Nigeria was ranked amongst countries with low development index at 1 53 out of 1 86 countries that were ranked. Life expectancy in Nigeria is placed at 52 years old while other health indicators reveal that only 1 .9 percent of the nation's budget is expended on health. 68.0 percent of Nigerians are stated to be living below $ 1 .25 daily while adult illiteracy rate for adult (both sexes) is 6 1 .3 percent (UNDP, 20 1 3) . Nigeria's economic growth is slow as output growth was consistently below her population growth rate for most part of 1 980 through to 2000.
Thus Nigeria has not been able to harness her large population (about 1 68 million people) and its abundant natural resources which constihite the material conditions for development to propel rapid and sustainable development (NPC,20 1 2) . According to Ahenba (2008), Nigeria has earned approximately $ 1 .8trillion from oil exports in the last four decades, but has not been able to leverage on the cmTent account surpluses to build the capacity for rapid transformation of the economy to achieve sustainable growth. Rather, sectors whose contribution would not translate to growth are top on the priorities of government such as government expenditure on recurrent expenditure as against capital expenditure which would create employment, stimulate demand, leading to increase in demand for industrial goods e.t.c. According to a world bank Poverty Assessment Report (2000), Nigeria presents a paradox of a rich nation with poor people.
Ahuja Journal of Business and Management Vol. 1, Issue I [45-55}, March-2015 www.abLljajournalofbusinessandmanagement.org.ng Page 46
The Impact of Public Expenditure on Economic Growth in Nigeria: 1 982-2012
Public expenditure is usually expressed in budgetary statements and has been a powerful tool for shaping the economy along growth path and to a considerable extent influence resource allocation in the private sector. The role of public expenditure is to accommodate economic development of an economy. According to Scully ( 1 989), data based on public expenditure as a fraction of national income show that public sector has an inevitable trend of growth in the long run. Why then would the Nigerian economy be different and remain underdeveloped despite huge public expenditure in the 30-45 years? The Nigerian case could then be said .to be a paradox. A countly rich and endowed with both human and natural resources, a country with adequate rain and sunlight with fertile agricultural land and good climatic conditions when compared to some other countries that are located in the desert or mostly covered by ice and snow almost throughout the year, yet Nigeria is a country with many poor people. There is a problem somewhere, otherwise, why would about two thirds of the Nigerian people be said to be poor, despite the country having vast potential wealth. Revenue from crude oil has been increasing over the past decades (NBS 2010).
Nigeria was noted to be the world's seventh largest exporter of oil, sixth largest producer in OPEC, Africa's largest Oil exporter and fifth biggest source of United State's oil is a good potential for effective reduction and possibly eradication of poverty (National Planning Commission, 2004, Oil statistics, and Thomas and Canagarajah, 2002). Yet Nigeria is not only one of the poorest countries in the world but also in Africa despite efforts towards reducing her poverty level. The high incidence of poverty in Nigeria has become of concern to policy makers and indeed all stakeholders in Nigeria because as observed by the United Nation Development Programme (200 1 ) it has not only increased from 27.2 percent in 1 980 to 54.4 percent in 2004, is estimated to be rising by l 0 percent every 3 years.
The huge growth could have had a major impact on the growth and development of the country. It could have taken the lead in demonstrating how growth and poverty reduction can be achieved in Africa because Nigeria has all it takes, that is human and material resources to become the strongest economy in Africa and one ofthe leading economies in the world.
This paper examined the country's huge resources and revenue over the years and why many citizens are still poor and why public expenditure did not lead to the desired economic growth in Nigeria as the case with other developed countries. As a result ofthese problems associated with government expenditure in Nigeria the paper intends to answer the following questions:
I . Does total government expenditure in the short-run have impact on economic growth in Nigeria?
2. What is the impact of total government expenditure in the long-run on economic growth in Nigeria?
2. Literature Review There have been many empirical studies; although with contradicting results on the roles of government expenditure on the economic growth. That government spending can influence the level of economy activities is evident in studies such as those of Ratner ( 1 983), Aschauer ( 1 989) and Munnell ( 1 990) which indicate that government investments are positively related to growth. Other studies such as Evans and Karas ( 1 994), on the other hand, obtained a mixed result. The adoption of ordinary least square reveals a positive con-elation between the two proxies of governn1ent spending (services and capital spending) and economic growth. However, when a two-stage least square techniques were used, a positive relationship could not be established in most cases, especially in public capita\. Evidence from Raynold, Mcmillian and Beard ( 199 1 ), using a VAR model, also reveals that the effects of government spending on economic growth are
Ahuja Journal of Business and Management Vol./, Issue 1 [45-55}, March-2015 www.abujajournalofbusinessandmanagement.org.ng Page 47
The impact of Public Expenditure on Economic Growth in Nigeria: 1 982-2012
small but generally significant. It explains about 8 - 1 0 percent of the forecast error variance in economic growth, using about 36 months, horizons. Most of these studies were from developed countries with little emphasis on developing countries like Nigeria. Resulting from dearth of empirical studies on this issue in Afnca, Amm ( 1 998) examines the effects of public mvestment expenditures on growth of the Cameroon's economic activities. Using an aggregate production function, he discovered a positive relationship between the two, even though the relationship could not be .statistically established.
Ekpo ( 1 995) and Ogiogio ( 1 995); Ekpo ( 1 995); Aschauer ( 1 989b) and Aschauer ( 1 990) regressed, the disaggregated components of government capital expenditures on private investment. The findings show that capital expenditures on transport and communication, agriculture, health and education positively influence private investments in Nigeria, which invariably enhances the growth of the overall economy. However, government capital expenditures on construction and manufacturing, crowd out private investments. By implication, the private sector is better placed to invest' in construction and manufacturing than the government.
Ogiogio ( 1 995) examines the growth impact of recurrent, capital and sectoral expenditures over the period 1 970 - 1 993. The study observes the existence of long-run relationship between economic growth and government expenditures. Meanwhile, contemporaneous government recurrent expenditures have more significant effect than the capital expenditures while five-year lags of capital expenditures are more growth inducive. The study, thus, argues that for effective assessment of the effect of capital investment programmes on economic growth, one would require a five-year planning horizon. And lastly, the study also indicates that government investment programmes in socio-economic infrastructure provide a conducive environment for private-sector led growth.
However, the fact that both government expenditures and economic growth are basically related makes any deductions from a single equation model invalid. This is owing to the possibility of simultaneity bias. In order to avoid this problem, Ekpo ( 1 995) adopted a simultaneous equations model to capture the interrelationship between military expenditures and economic growth in Nigeria. It is observed from the study that aggregate military expenditure is negatively related to growth at 1 0 percent significant level. And when decomposed into recurrent and capital military expenditures, the former was more growth retarding than the latter. Olson ( 1984) pointed out that economic theory did not provide a fully developed methodology that incorporated government in standard growth models. He however, identified two major avenues through which government activity may influence economic performance. In the first place, he posited government spending, particularly investment on goods that may enter directly into private sector production such as education and infrastructures. On the other hand, government outlays may also indirectly influence the efficiency of private se.ctor allocation of inputs and activities in such a way th�t government spending may correct market failures, guarantee property rights and the enforcement of contracts and provide essential public goods, thereby leading to positive effects on the economy. Conversely, government regulation may impose excessive burdens on the private sector by way of high taxes or borrowing to finance government spending that may distort private incentives. Moreover, if the financing of government projects bids up interest rate, the effect will be the crowding out of private investment, hence slowing down growth. The second channel mentioned by Olson was the efficiency of government as a producer as distinct from a provider of goods and services.
Taylor ( 1 988) highlighted the role of government expenditure, which was that if public spending and private spending (capital formation) are truly complementary, then government projects and
Abu) a Journal of Business and Management Vol. /, issue 1 [45-55}, March-2015 www.abujajournalofbusinessandmanagement.org.ng Page 48
The Impact of Public Expenditure on Economic Growth in Nigeria: 1982-2012
spending would stimulate entrepreneurs and enhance private investment, thus ensuring growth in the economy. Musgrave ( 1 982) noted in his study that certain goods and services should be provided by the market while others should be provided publicly and made available free of charge to the users. However, other empirical works did not support Olson's theoretical analysis ofthe relationship between government spending and economic growth.
Landau ( 1 983) found that the. share of government consumption to GDP reduced ec;onomic growth was consistent with the pro-market view that the growth in government constrains overall economic growth. These findings were consistent with varying sample periods, weighting by population and mix ofboth 'developed and developing countries. The conclusions were germane to growth in per capita output and do not necessarily speak to increase in economic welfare. Economic growth was also found to be positively related to total investment in education. Landua ( 1 986) extended the analysis to include human and physical capital, political, international conditions as well as a three year lag on government spending in GDP. Government spending was disaggregated to include investment, transfers, education, defense and other government consumption. The results in part mirrored the earlier study in that general government consumption was significant and had a negative influence on growth. Education spending was positive but not significant. It was unclear why lagged variables were included given that the channels through which government influence growth suggest a contemporaneous relationship.
Ram ( 1 986) used cross-sectional data for 1 960- 1 970 and 1 970- 1 980 on separate time series estimates for some countries as well as taking real government consumption as his measure of government size. He found a positive correlation between growth in government expenditures and overall economic growth. Ram concluded that both the externality and differential productivity effects are positive, so productivity in the government sector appears to be higher than private sector. He marked a rigorous attempt to incorporate a theoretical basis for tracing the impacts of government expenditure to growth through the use of production functions specified for both public and private sectors. The data spanned 1 1 5 countries to derive broad generalizations for the market economics investigated. He found government expenditure to have significant positive externality effects on growth particularly in the developing countries (LDC) sample, but total government spending had a negative effect on growth. Lin ( 1 994) used a sample of 62 countries ( 1 960-85) and found that non-productive spending had no effect in growth in the advanced countries but a positive impact in LDCs.
Josaphat, et. al., (2000), investigated the impact of government spending on economic growth in Tanzania using time series data for 32years ( 1 965- 1 996). They formulated a simple growth accounting model, adapting Ram ( 1 986) in which total government expenditure is disaggregated into expenditure on (physical) investment, consumption spending and human capital investment. It was found that increased productive, expenditure (physical investment) have a negative impact
. on growth and consumption expenditure relates positive�y to growth, and in particular appears to be associated with increased private consumption. The results revealed that expenditure on human capital investment was insignificant in their regression and confirm the view that public investment in Tanzania has not been productive.
Rutkowski (2009) employed simple autoregressive model on quarterly variables over the period 1 999-2007 to assess the relation between investment and growth in Poland. Impulse response functions point to positive relationship between public investment, private investment and GDP growth. In line with other papers, a demand stimulus was noticed after 1 -2 quarters, with 1 percentage point of GDP higher public investment increasing GDP growth by more than percentage point (quarter on quarter). The supply-side effect, that is, an upsurge in private investment encouraged by the expected productivity gain materializes after 2-3 quatters and
Ahuja Journal of Business and Management Vol.!, Issue I [45-55}. March-2015 www.abujajournalofbusinessandmanagement.org.ng Page 49
The Impact of Public Expenditure 011 Economic Growth in Nigeria: 1982-2012
reaches a maximum after 6 quarters, with 1 percentage point of GOP more public investment increasing private investment by more than % percentage point of GDP. Overall, his analysis points to a positive impact of public investment on growth in Poland and does not show apparent crowding-out effects.
Other researchers reported that the importance of government expenditure on Economic development has been overemphasized. For instance, Neuser ( 1 993), using. public capital data from Ford and Po ret ( 1 99 1 ) for the G7 countries over the period 1 970- 87, applied Total factor productivity growth and co-integration techniques to the sample. They reported insignificant and unstable results. Taylor-Lewis ( 1 993), using the same data set for the same countries under observation, but regressing a Cobb-Douglas function found that the contribution of public physical infrastructure to output were insignificant. Some studies have specifically examined the impact of public expenditure in infrastructure on economic growth in Nigeria. With a view to expenditure between 1 953 and 1 966, Philips ( 1 97 1 ) observed that revenue is a vital factor of public expenditure. He found that rising revenue was accompanied by rising expenditure with a high degree of correlation put at 87 percent (R2
= 0.87) between current revenue as percentage of GDP and total consumption coefficient being significant at 1 percent. He concluded that the GDP elasticity of consumption expenditure was 3 with a high degree of correlation between consumption expenditure and per capita income.
In the research carried out by Lee and Alex ( 1 989, and 1 992) on the impact of infrastructural deficiencies on the Nigerian industrial sector. The results showed that manufacturing undertook significant expenditure to affect deficiencies in publicly provided infrastructural services. This was supported by Adenikinju (2003), in his study on electricity infrastructure failures in Nigeria. These studies failed to establish if there is a relationship between infrastructure services and manufacturing output and whether the relationship even subsists in the long-run. Sola (2008) examines the direction and the strength of the relationship between infrastructural services and manufacturing output in Nigeria using time series data from 1 98 1 to 2005. To determine the shocks that are the primary causes of variability in the endogenous variables, the study used Vector Autoregressive (VAR) model. Also Granger causality test was carried out. Results showed that the present transport and electricity service in Nigeria did not cause growth to occur in the manufacturing sector. It was also revealed in the sh1dy that telecommunication and education had contributed to the growth in the manufacturing sector.
Nitoy, et al, (2003) employed the same disaggregated approach as followed by Josaphat, et al, (2000). They examined the growth effects of government expenditure for a panel of thirty developing countries (including Nigeria) over the decades of the 1 970s and 1 980s, with a particular focus on sectoral expenditures. The primary research results showed that the share of government capital expenditure in GDP is positively and significantly correlated with economic growth, but current expenditure is insignificant. The result at sectoral level revealed that government investment and total expenditures on education are the only outlays that remained significantly associated with growth throughout the analysis. Although public investments and expenditure in other sectors (transport and communication, defense) was found initially to have significant associations with growth but such relationship collapsed when government budget constraint and other sectoral expenditures were incorporated into the analysis. Also private investment share of GDP was found to be associated with economic growth in a significant·and positive manner.
Hassan and Fatai (2009} employed co-integration and ordinary least square approach to examine the relationship between public spending and economic growth in Nigeria using time series data for the period 1 970-2007. Two equations were specified. The result of the first equation showed
Ahuja Joumal of Business and Management Vo/. 1, issue I [45-55}, March-2015 www.abujajournalofbusinessandmanagement.org.ng Page 50

The Impact of Public Expenditure on Economic Growth in Nigeria: 1982-2012
that the ratio of government revenue (oil and non oil) to nominal GDP were statistically significant though the non oil exerted negative infl uence on growth rate of real per capita GDP. Also, the ratio of government expenditure on economic services and community social services to nominal GDP were statistically significant exerting positive mfluence on growth rate of real per capita GDP per capita. In the second equation, the ratios of government revenue and capital expenditure to nominal GDP and lagged ratio of private investment to nominal GDP were not statistically significant though they exert positive relationship. All test were conducted at 5 percent level of significance.
Adesoye, eta!., (20 1 0), examine the link between government spending and economic growth in Nigeria over the last three decades ( 1 977- 2006) using time series data to analyze the Ram ( 1 986) model. Three variants of Ram ( 1 986) model were developed-regressing Real GDP on Private investment, Human capital investment, Government investment and Consumption spending at absolute levels, regressing it as a share of real output and regressing the growth rate real output to the explanatory variable as share of real GDP. The result showed that private and public investments have insignificant effect on economic growth during the reviewed period. An attempt to test for presence of stationary using Augmented Dickey Fuller (ADF) unit root test reveals that all variables incorporated in the model were non-stationary at their levels. In an attempt to establish long run relationship between public expenditure and economic growth, the result reveals that the variables are co- integrated at 5% and 10% critical levels. With the Use of error correction model to detect short run behavior of the variables, the result shows that for any distortion in the short-run, the error term restores the relationship back to its original equilibrium by a unit. A num ber of suggestions were however made on how government spending should be channelled in order to influence economic growth significantly and positively in Nigeria.
Nurudeen and Usman (2009) examined the impact of government expenditure on economic growth in Nigeria using disaggregated analysis. They employed co- integration and error correction model for time series data spanning a period 1 979 to 2007. The explanatory variables account for 58.96 percent changes in economic growth. The total capital expenditure, total recurrent expenditure, health, education, transport, communication, and overall fiscal balance are statistically significant in explaining changes in economic growth. However, expenditure on defence and agriculture are not significant in explaining growth. Furthermore, a 1 percent increase in total capital expenditure, total recurrent expenditure, health and education causes growth to change by 0.04, 0.005, 0.035, and 0.07 respectively. We can deduce that most of the findings in the literature agree that public expenditure spur growth, some of the findings are rather inconclusive. There is also no generally accepted methodology for the analysis.
However, in our effort to explain the impact of total public spending on GDP, we hinged our study on Koyck's transformation model ( 1 964) and Wagner theory ( 1 970). However, in our study, we lagged. our explanatory variables on GDP to indentify the shp1t-run and long-run impact of govemment expenditure. The explanation of the growth-pattem or the growth of public expenditure has been discussed predominately by Wagner ( 1 970). Wagner's work is based on empirical observation in a number ofWestem industrializing countries. Hence, his suggestion is not prescriptive, but rather explanatory in character (Peacock & Wiseman, 1 9 1 7 : 1 6), it does not contain any prior property. He put his model forward with regard to posterior results. That is, he made his suggestions depending on empirical result observed in a number of industrializing countries. The policy implication ofhis analysis was that as nation's output increased in the past, public expenditure grew as well.
The basic Wagnerian assumption is that public expenditure growth is continuously associated with the continuing growth in nation's output in developing countries. Moreover public
Abuja Journal of Business and Management Vol. I, Issue I [45-55], March-2015 www.abujajournalofbusinessandmanagement.org.ng Page 5 1
The impact of Public E.xpendiwre on Economic Growth in Nigeria: 1 982-2012
expenditure increases at a faster rate than the growth of nations output. From this point of view, Wagner termed this as "the law of increasing expansion of public", and particular state activities becomes for the fiscal. economy the law of the increasing expansion of fiscal requirements . . . . . . "smce then, this ts well-known as the Wagner's Law.
3. Methodology, Analytical Framework and Model Specification The study employed the use of annual data (time series) of real gross domestic product (RGDP) for a period; 1 986-2012 , to assess the impact of total government expenditure on economic growth. The use of koycks model becomes relevant in our study to enable us specify model that estimated the impact of total government expenditure on Economic growth from 1 982-20 12 . Koyck's propounded an ingenious method of estimating distributed lag models. The use of this model enables us to examine the short-run and the long-run total expenditure on growth over time. The Koyck's distrusted lag model is of this form:
Y, = ()( + PoXt + fJolXt-1 + fJo 'J?· xt-2 + . . . . . . . . . . + ut . . . . . . . . . . . . . . . . . . 3 . 1
Equation (3 . 1 ) still not amenable to easy estimation since a large number of parameter remain to be estimated are the parameter () enters in a highly non-linear. Going by Koyck model and we lag equation (3 . 1 ) by one period we obtain
Hence, the multiply equation (3.4) by (l) to obtain
Subtracting equation (3.5) from equation (3.3) it becomes
+ . . . . . . -. . . + Ut- 1 . . . . . . . . . . 3 .2
Y, - )Yt-1 = <X (1 - )) + flXt + (ut - )ut- 1 ) . . . . . . . . . . . . . . . . . . . . . . . . .3.4
Or rearranging
Y, . O< (1 - ).) +PoXt + ).Yt- 1 + vt . . . . . . . . . . . . . . . . . . . . . . . . . . . . . . . . . . . . . 3.5
For the purpose of our analysis however, our model will be inform of
G D p = F [ T E + E ]. . " " . . . " " . . . " . " . " . " . : . . . " " . " " " . " " . . . . " " " . 3 . 6
Where: GDP = Gross Domestic Product TE = Total Expenditure
E. = Stochastic error term
Specifying the model in a log form 'equation (3.6) will transform into
GDP, = (J [1 - (J] + flo Xt + {JTEt-1 + vt . . . . . . . . . . . . . . . . . . . . . . . . . . . 3 .7
Abu) a Joumal of Business and Managemenl Vol. I , Issue I {45-55], March-201 5 www.abujajournalofbusinessandmanagement.org.ng Page 52
The Impact of Public Expenditure on Economic Growth in Nigeria: 1982-2012
4.3 Results and Discussions The paper examined the relative impact of the total expenditure on economic growth in Nigeria via estimation of distributed lagged model and to ideqtify the possible impact of government expenditure on economic growth in the short-run and long- run period. Table 4.1 : Presentation ofEstimated Results
Variable Coefficient Std. Error . t-S tatistic Pro b.
c 9.999763 0.207 1 6 1 48.27043 0.0000 LOGTE -0.0083 10 0 . 1457 16 -0.057027 0.9549
LOGTE(- 1 ) 0.232 1 82 0. 14407 1 1 .6 1 1 578 0.00 1 1
R-squared 0.882494 Mean dependent var 1 2.78565 Adjusted R-squared 0.873790 S.D. dependent var 0.484134 S.E. of regression 0. 1 7 1 993 Akaike info criterion -0.588083 Sum squared resid 0.798706 Schwarz criterion -0.447963 Log likelihood 1 1 .82 1 25 Ha1man-Quinn criter. -0.543258 F -statistic 1 0 1 .3882 Durbin-Watson stat 0. 1 79799 Prob(F -statistic) 0.000000
Table 4. 1 presented the estimated result which shows that the adjusted R2 and F -Statistics are 0.873 and 1 0 1 .39 respectively. This suggests that the variables in the model explain the change on the explained variable (logGDP) otherwise growth. The result ftnther shows that, given their respective probability values, total expenditure (logTE=0.0083 1 0) was not statistically significant in the short-run, while it was found signific..:anl in Lhe long - run. For this reason, both the regressors and the regressed in the model are in log form, therefore, an increase in the value of total expenditure would lead to a significant increase in growth. The above means that total expenditure; even though may have been affecting growth significantly in the long - run, it rather negated the 'a priori' economic expectation by rather affecting growth negatively. In summary, it shows that total expenditure was statistically significant in the long run on growth, while to expenditure was statistically insignificant in the short - run.
Table 4.2 : Results of the stationary (unit root) test Variable ADF test Critical values l(d) Remark
LOG GDP -4.1 056 1 %= -3.6793 l( I ) Stationary at first 5%= -2.9678 difference
1 0%= -2.6229
LOG TE -7.8552 1%= -3.6793 I( I ) Stationa1y at first 5%= -2.9678 difference
10%= -2.6229
Source: Author s computafton 2014
Furthermore, the result of the Jarque-Bera n01mality test shows that the variables used in the study were normally distributed around their zero means and constant variances. This is because the reported J-B probability value exceeds (in absolute value) the observed value under the null hypothesis meaning that a small probability value leads to the rejection of the null hypothesis of a normal distribution. Engle and Granger ( 1 987) pointed out that a l inear combination of two or more non-stationary series become stationary. As such where a stationary linear combination exists, the non-stationary time series are said to be co-integrated or otherwise called the co-integrating equation. Given the above, the model was cointegrated at level which implies that a long-run equilibrium relationship among the estimated variables is highly plausibly sustainable. However, the result of our analysis revealed that total expenditure in Nigeria affect growth, in the long - run, while in the short - run it was found to be insignificant on growth. This is because the study considered their respective lag in line with Kyock model.
Ahuja Journal o.f Business and Management Vol./, lmte I [45-55], March-20 15 www.abujajournalofbusinessandmanagement.org.ng Page 53
The Impact of Public Expenditure on Economic Gr01rth in Nigeria: 1 982-2012
Finally, the total expenditure shows that it plays a very important role in economic growth. This is because public sector spending has been on the increase due to government commitment to finance, infrastructure, civil service, defense and other ccono.mic refonn programme that cut across Ministries, Department and Agencies (�,jDA's).
4. Conclusion There is a substantial evidence to indicate that only total government expenditure in Nigeria
shows significant relationship ori growth in the long - run, while in the short -run total government expenditure bas not significant effect because of delays in passage of federal government budget and bureaucratic process. The relationship between government's spending on public infrastructure on economic growth tends to be an important analysis in developing countries, most of which have experienced increasing levels of public expenditure overtime, expenditure on infrastructure investment and productive activities which ought to contribute positively to growth.
References Adebiyi, M A 2006, Public expenditure and human capital in Nigeria: An Autoregressive Model :
Retrieved from www. isser. org/43%20Adebavo.Pd(
Aschauer, D 1 989a, Is public expenditure productive? Journal of Monetary Economics, Vol. 23, pp 167-200.
Aschauer, D 1 989b, Does Public Capital. Crowds out Private Capital? Journal of Monetary Economics. Vol. 24:pp 1 71-188.
Aschauer, D 1 990, Highway Capacity and economic Growth . . Economic Perspectives 14( 1 ): pp.14-24. Aschauer, D A. 1 989b, Public Investment and Productivity Growth in the Group
of Seven, Economic Perspectives, Vol. 13, 1 7-25. Aschauer, D A 1 989c, Does Public Capital Crowd Out Private Capital? Journal of Monetary Economics,
Vol. 24, pp 1 7 1 -88. Aschauer, D A. 1 993, Genuine Economic Returns to Infrastructure Investment .Policy Studies Journal,
vol. 2 1 No.2 pp. 380-90. Ekpo, L & Ogiogio, C 1 995, Public Expenditure and Economic Growth: A Disaggregated Analysis for
Developing Countries, University Press. Hassan, E A and Fatai, 0 2009 The Effect of Public Expenditure on Economic Growth: Evidence from
Nigeria. Journal of Economics and Allied Fields, Vol. 4, No. 1 , November: pp. 72-78. Josaphat, P.K. and Oliver, M 2000 Government Spending and Economic Growth in Tanzania, 1 965-996:
CREDIT Research Paper 5. Koyck, L M 1 954 Distributed Lags and Investment Analysis. Amsterdam: North - Holland .Introductory
Econometrics, pp: 234-245 Landau, D 1 986 Government Expenditure and Economic Growth in the less Developed Countries: An
Empirical study for 1 960- 1 980, Economic Development and cultural changes, Vol. 35, Pg 35-37.
Landau, D 1 983 Government Expenditure and Economic Growth: A Cross- Country Study. Southern EconomicJournal, Vol. 49, No, 3:pp. 783-792.
Laursen, T and B Myers, 2009 Public Investment Management 1n the New EU Member States, World Bank, WorkingPaperNo. l61 .
Munnell, A 1 990 Infrastructure investment and economic growth,' Journal of Economic Perspectives Vol. 6, pp 1 89- 1 98 Musgrave,
RAand Peacock, G. (cds) 1 962 Classics in the Theory ofPublic Finance. New York: Macmillan. Nurudeen, A and Usman, A 2009 Government Expenditure and Economic Growth in Nigeria: 1970-2008:
A dis aggregated Analysis, Journal of Economics and Allied Fields, Vol. 4, No. 1, November:pp. 137-145.
Olson, M 1984 Ideology and Economic Growth, in C.R Huttcn and LV Empirical journal ofEconomics and Social Studies. Vol.3 No 1 2. Pp 23-34
Pcacock,A and Wiseman J 196 1 , The growth of public expenditure in the united kingdom, Princeton university press, Princeton.
Abuja Joumal o.f Business and Management Vol.J, Issue 1 [45-55]. March-2015 www.abujajournalofbusinessandmanagement.org.ng Page 54
The Impact of Public Expenditure on Economic Growth in Nigeria: 1 982-2012
Philips, A 0 1 9 7 1 , Nigerian public Expenditure. Journal of Economics and Social Studies, vol. 1 3 . No, 3 Ram, R 1 986, Government Size and Economic Growth: A new Framework and some Empirical Evidence
from Cross-sectional and Time Series Data. American Economic Re1•ieH; Vol. 76: pp. 191-203.
Rutkowski, A 2009, Public investment, transport infrastmcture and growth in Poland, Economic and Financia/Affairs oftheEuropean Commission, 6(ll):pp. J-6.
Sola, 0 2008 Infrastructural services and manufacturing growth in Nigeria: A dynamic analysis. African Economic and Business Review Vol. 6 No.2, Fall: pp. 74-97.
Abu) a Joumal of Business and Management Vol. I. Issue I [45-55], March-2015 www.abujajournalofbusinessandmanagement.org.ng Page 55
Small and Medium Enterprises Development in Nigeria: A Sustainable Approa�h to Employment Generation
Dr. Umaru Danladi Mohammed', Abdullahi Ndaman2, Kaka Abdullahi\ Theresa Ndulue4, Roko Lumi Peter5
1 (Department of Business Administration, University of Abu) a, Nigeria) 1 (Department of Business Administration University of Abuja, Nigeria)
1(Department of Accounting, University of Abuja, Nigeria) '(Department of Business Administration, University of Abu) a, Nigeria) 5 (Department of Business Administration, University of Abu) a, Nigeria)
Abstract: The contribution of Small and Medium Scale Enterprises (SMEs) has been recognized as main sustenance of the economy because of their capacity in enhancing the economic output, wealth creation, employment generation and enhance human we�(are. Although, the SMEs lack of access to relative cheap and effective source of .finance have been identified as the major factors hindering their contribution to economic growth, other factors include lack of management skill, poor government policy, high taxes and security problem. On this basis, this article assesses SMEs development and their contribution to employment generation and economic growth via investment level. The main objective of the study is to critically evaluate the performance of SMEs and implications for employment generation in Nigeria and also to examine the contribution of SMEs to socio-economic development of Nigeria. The study was conducted in Nasarawa State. The study used questionnaire as an instrument of primary data collection from a stratified random sample of 150 in Nasarawa State, Nigeria. The study concludes that there is increase in the number of SMEs established in Nigeria and finance is the major hindrance to their development in Nigeria. The study recommends that the government should provide secure, conducive, political environment that enhance greater performance of SMEs that guarantees employment. The government should as a matter of urgency prioritize the SMEs sector by giving it devoted practical and visible attention with a view to making it virile, vibrant,focused and productive. Keywords: Small and Medium Enterprises, Employment Generation, Management.
1 . Introduction Small and Medium Enterprises Development (SMEs) has continued to be a popular phrase in the Business world. This is because the sector serves as a catalyst for employment generation, national growth, poverty reduction and economic development. SMEs the world over can boast of being the major employers of labour if compared to the major industries including the multinationals. According to Peterise (2003), SMEs both in the formal and informal sectors employ over 60% of the labour force in Nigeria. More so, 70% to 80% of daily necessities in the country are not high-tech product, but basic materials produced with little or no automation. Most of these products come from the Small and Medium Enterprises. Odubanjo (2000), Onwumere (2000), and Nnanna (200 1 ) all suppott that SMEs help in the achievement of improvement in mral infrastructure, improved living standard of the rural dwellers thereby creating employment utilization of indigenous technology, production of intermediate teclmology and increase in revenue base of the private individuals and government (Wahab and Ijaiya, 2006).
Small and medium scale enterprises have been considered as the engine of economic growth for promoting equitable development. The major advantage of the sector is its employment potential at low capital cost. The labour intensity of the SME sector is much higher than that of the enterprises. The role of small and medium enterprises in the economic and social development of the country is well established. The sector is a nursery of entrepreneurship, often driven by individual creativity and innovation. There is a general believe that the desired employment generation in this country can be achieved through development of small and medium scale enterprises (Awosika 1 997, Schmitz 1 995). Gunu (2004) and Aremu (20 l 0) posited that Small Scale Enterprises provide income, savings, and employment generation. They are seen as veritable engines for the development of entrepreneurial capabilities and indigenous technology which will generate employment in the country. Small and medium scale industries constitute the basis for industry and natural economy in many countries. It has been estimated that SME's employ
Abu} a Journal of Business and Management Vol. /, Issue 1 [56-64}, March-2015 www.abujajournalofbusinessandmanagement.org.ng Page 56
Small and Medium Enterprises Development in Nigeria: A Sustainable Approach to Employment Generation
22% of the adult population in developing countries (Daniel, 1 994 & Fisseha, 1 99 1 ). Small and medium scale enterprises can be regarded as one of the important elements of a country's development and this play a crqcial role in the economy of this nation.
Small and medium scale enterprises speed up the rate of socio- economic development of many countries, particularly developing countries. They served as system for attainment of national objective in terms of employment generation at low investment cost and also the development of entrepreneurial capabilities and indigenous technology. It also reduces the flow of people frorri rural area to urban area, henceforth, i t can be easily established by the relatively less skilled labour force of a developing country, Small and Medium Scale Enterprises contribute substantially to the gross domestic product, export earning, and development opportunities of the countries. After the attainment of independence much emphasis has been laid on growth of small and medium scale industries as means of reduce the incidence of poverty and employment in the country (Gunu, 2004).
At the early stages of industrialization, Japan's economy was characterized by traditional industries and a large number of small firms who as of that time drew their strength not from an abundant supply of capital, but from their vast supply of labour. So in Japan "during the interwar years ( 1 9 1 9 - 1 93 8) and after, government policies accorded and continued to accord due priority to the country's small and medium scale enterprise (Mosk, 201 0).
In Nigeria, the realization of the role ofSMEs in development sprang from the backdrop of the problems plaguing the economy in recent decades. These include slow or declining economic growth, unemployment, underemployment, and poverty. The National Bureau of Statistics (NBS) has put the figure of unemployed Nigerians in the first half of2012 at 23.9 percent, up from 2 1 . 1 percent in 2010 and 1 9.7 percent in 2009, compare to the rate at 1 9.7% in 2008 and 1 6.3% in 2007 respectively. Unemployment rate for 2006-2008 was 55.9 percent, 4 times higher (Salami, 201 1 ).
2. Literature Review There appears to be no universally accepted definition of SMEs for now. Each country or development agency or institution defines the term as it suits its purpose and, therefore, emphasize different things in its definition giving rise to varying definitional outcomes. In particular, the definition depends, among other things, on the role SMEs are required or encouraged to play in the development process and the level of economic development of a country. For example, a developing country with a large population and unemployment problem may emphasize job creation and labour intensive production practices, which are then reflected in its definition ofSMEs. This has influenced the definition ofSMEs in Nigeria (Minister of Industry, 200 1 : 1 27- 1 29).
In Nigeria, the National Economic Reconstruction Fund (NERFUND), the Central Bank of Nigeria (CBN) and the National Council on Industries (NCI) have defined SMEs differently and given different definition at different times (National Association of Small and Medium Enterprises 200 1 : 148- 1 48). The National Council of Industries in Nigeria for example, now defines SMEs in terms of number of employees (rather than the erstwhile consideration of capital invested).
A business enterprise defined as a small firm in an economically developed countly may be equivalent to a medium or even large scale enterprise in a less economically developed country. Thus, the characteristics of, and research findings for, SMEs in the developed world may not reflect those of a developing countly which suggest why what works for SMEs in one country may not work for those in another. Thus, if financial constraint is a problem for SMEs in developed countries, then it may be more severe for those in developing countries. This strengthens the call for contextual understanding ofSMEs.
In the context ofNigeria, the Central Bank ofNigcria (as cited in Inegbenebor, 2006) defines an SME as an enterprise with not less than 1 0 and not more than 300 employees. This definition considers SMEs as a band of enterprises whose main characteristic is that they employ between 1 0 and 300 persons. This definition necessarily distinguishes SMEs from micro-enterprises and large scale enterprises. This classification is very widely used in studies as, for example, in the cases of Lai (2007) and Massey ct a!
Abu) a Journal of Business and Management Vol./, Issue I [56-64}, March-20 15 www.abujajournalofbusinessandmanagement.org.ng Page 5 7
Small and Medium Enterprises Development in Nigeria: A Sustainable Approach to Employment Generation
(2004 ). In this study, the directories used for constructing the sample frame made entries in terms ofSMEs. In some cases, a finer distinction is made in which small scale enterprises and studies as such as, for example, in the case ofLai (200) and Wiklund ( 1 998) . .
Lai (2007) identifies other characteristics ofSMEs in Nigeria; they have small capital investment; they are small in size; they have low profit margins; and they have little management or few staff. Thus, Lal (2007) concluded that they cannot, on their own, provide the technical and support services they require to operate successfully. Davis et a! (as cited in Spillan ahd Ziemnowixs, 2003) suggested that small fitms differ from large scale enterprises (LSEs) in their marketing practices, that is; they have different marketing objectives; they lack marketing experience; and they have limited financial and organizational resources. The most limiting of the three features is said to be the limited availability of financial resources. Levy (2003) also maintained that funds constitute the most binding constraint for SMEs.
Further, Weinrauch (as cited in Spillan and Ziemnowicz, 2003) suggested that financial constraints impact on small firms' marketing activities in the form of; restrictive credit policies; an inability to hire marketing specialists; under-specialization which results in fewer new products (created and marketed); inadequate cash flow, causing ineffective hand-to-mouth policies; and ineffective and inflexible pricing strategies. Two other unique characteristics of SMEs may be added. One is that the enterprise is dominated by one person who is the owner-manager. As such management specialization i s very limited in SMEs with the owner-manager becoming what Ogunmokun (as cited in Spillan and Zienmowicz, 2003), adapting an old adage, called the ''jack-of-all-trades", and as the saying goes, master of none; that is, specializing in none. The other feature is that SMEs are characterized by informality. Five strategic management implications arise from the above characteristics of SMEs-in terms of strategy practice. These are the finn's strategic management orientation, strategic horizon, preferred market development strategy, devolution of strategic decision-making responsibility, and the informality in the strategic decision-makingprocess.
2.1 Small and Medium Scale Capacity Building in Nigeria The strategies and initiatives to promote SME development in Nigeria feature prominently in most of the government's economic development plans. Over the last decade, a clear path for accelerating the development of SMEs has been charted through the establishment of agencies such as DFRRI, NDE, NAPEP, SMEDAN etc. although the challenges before this establishment are daunting (Ogwurna, 1 995). The state-led models of industrialization followed immediately after Nigerian independence in 1 960 and those of 1 970s and 1 980s was a major factor constraining the growth of SMEs. There are many ways in which industrialization discriminated against SMEs during the time.
Firstly, trade was regulated in a way that followed large fitms to obtain import licenses, official exchange rates for imports, and tariffrcbates more easily than small fitms. The anti-export bias induced by import substitution strategies also discriminated against intensive SMEs. Moreover, small firms were denied access to most investment incentives because of high rent-seeking costs. Secondly, financial sector interventions also discriminated against SMEs. Selective credit controls in conjunction with controlled interest rates prevented banks from compensation for the higher cost of small loans by charging more. As a result, small clients were allocated limited credit, allowing large firms to grow at the expense of small firms. Thirdly, the problems of dealing with government regulations and tax authorities weighted more heavily on smaller firms in the shape of higher compliance costs, i.e. the fixed costs of complying with import/export and tax regulations, labour market regulations, and licensing and price control. Fourthly, Nigeria's underdeveloped physical and social infrastructures create a binding constraint to SMEs growth. SMEs rely heavily on inefficiently provided state infrastructures such as electricity and water and cannot afford the cost of developing any alternatives. Similarly, inadequate investment in human capital hampers SME growth because of the scarcity of skilled workers, managers and entrepreneurs (Tendler and Amorim 1 996). .
In more challenging environment SMEs are aware of the need to become more resilient and competitive in the face of economic changes. The continuous changes that affect the business environment, due to the globalization process and the technology innovations, force Small and Medium Scale Enterprises and other organizations in Nigeria to constantly look for new competitive advantages in order to maintain and
Abu) a Joumal of Business and Management Vol. /, Issue I [56-64], March-2015 www.abujajournalofbusinessandmanagement.org.ng Page 58
Small and Mediwn Ente1prises Development in Nigeria: A Sustainable Approach to Employment Generation
improve their market position (Aremu 2004). Towards this end, the government efforts should be directed to strengthening SMEs and thus encouraging domestic investment and promoting economic growth.
2.3 SmaU and Medium Scale (SMEs) Strategy for Sustainability Sustainable development i s recognized as an essential requirement for achieving economic goals without degrading the environment; major problems arise in implementing the concept of sustainability. At the most basic lc;vel, researchers dealing with sustainable development have svggested that the achievement of sustainabil ity requires ecologically sustainable political and economic systems, organizations, and individuals (Starik and Rands 1 995; Costanza and Daly 1 992; Gallup International Institute 1 992). Specifically, governments, consumers, and enterprises contribute and play crucial roles in reaching sustainable development. As a result, if goals of sustainability are to be achieved, small and medium-sized enterprises must be reformed to minimize their negative ecological and social impacts (Gladwin, 1 992).
Generally, SMEs will have to assist and facilitate growth, multiply and replicate into sufficient mass across industries and sectors. The SME sector is considered to be the backbone of the modem day economy. The importance of this segment is undisputed. However, the yawning gap between the needs, demands and policy response in this unorganized sector has always dampened the sector's prospects. The recent economic turbulence has only added to the sector's problems. Hence, it becomes imperative for us to ensure that SME sector, which is facing one of the toughest times in the industrial history, should be strongly supported by the relevant stakeholders - government, financial institutions, associations, etc. This is to enable the sector to play its sustainability roles in the economy.
SMEs contribution towards sustainable development is small, taken together SMEs have a vety large impact on the development quality of a specific geographic area. The more presence of SMEs in the economy of a particular area, the more important is the SMEs role for achieving sustainabili ty (Welford and Gouldson, 1 993). In comparison with large companies, SMEs show particular benefits for a geographic area interested in achieving a sustainable development, which can be grouped in the following categories: economic, socio-cultural, environmental, and collaboration contributions. Major economic contributions to sustainability come from the fact that residents and indigenous are more probably to own and run SMEs than larger companies, which frequently are multinational companies.
Specifically, in the SMEs, the management process is characterized by the highly personalized preferences, prejudices, and attitudes of the finns' entrepreneur, owner and/or owner-manager (Jcru1ings and Beaver, 1 995). As a result, SMEs allow residents and indigenes to participate in the economic development and, consequently, to obtain the economic benefits generated by the community (Howard and Hine, 1 995).
Furthermore, SMEs which are owned and run by residents are expected to reinvest their benefits in the community itself, while large companies usually act internationally. Finally, SMEs draw out capital that would otherwise remain underexploited by the economy, and help develop new markets by improving forward and backward linkages between economically, socially, and geographically diverse sectors of the economy (Howard and Hine, 1 995). These SMEs potential economic contributions to sustainability might be balanced against overall economic efficiency ofSMEs in comparison with larger companies; meaning that SMEs operating in a patticular coinmunity must be internationally competitive in order to make significant contributions to sustainability (Diego and Juan, 1 998).
2.4 Ways of Developing Small and Medium Scale Enterprises in Nigeria to Enhance National Development and Employment Generation SMEs play a crucial role in national development and to reflect its recognition towards economic development, the federal gov�mment must make good small business policy as their numbe;· one priority; it has to put up solid steps in place to ensure they are able to grow and prosper. For instance one of the ways of doing this will be to set up a national business office (NSBO) along the line of the small business agency in the United States and Medium Business Services.
Abu} a Joumal of Business and Management Vol. I, Issue I [56-64}, March-2015 www.abujajournalofbusinessandmanagement.org.ng Page 59
Small and Medium Enterprises Development in Nigeria: A Sustainable Approach to Employment Generation
The NSBO can be replicated at the state level. The state small and medium office will have responsibility for running national policies and programmes set up by national small business office (NSBO) at the state !eve) and will also be directly answerable to state Assemblies. {\nother important way of developing is by providing the SMEs with adequate financial capabilities; provision of good infrastructural base; formulation of good policies and programmes to increase SMES performance; market expansion; organizing regular seminars on entrepreneurship development in order to increase SMEs owners' managerial skills and capabilities and provision ofadcquate security throughout the country.
. .
3. Research Methodology The study used a survey to evaluate the performance of a small and medium scale enterprise and its implications on employment generation. The design was adopted because of its appropriateness in describing the current situation of phenomenon (kothari, 1 990). The population of the study is the operators of small and medium businesses operating in Nasarawa State. Nwankwo ( 1 999) stated that the population of any research work is the universe of such group; of people or object in which a researcher is interested. In obtaining the sample size of the population, SMEs owners from selected local government in Nasarawa State, North-Central Nigeria were selected through random sampling. 1 3 local government areas were selected for the study. We had in these local government areas obtained sample elements of 1 50 respondents through a probabilistic sampling technique. The primary sources of data collection were through the use of questionnaire, personal observation and interview.
3.1 Research Instrument and Technique The primary instmment used for the collection of data for this study is the questionnaire. The questionnaires were designed in open and closed ended patterns and administered directly on the operators of the SMEs directly. Further, in order to reduce the possibility of questionnaires missing or getting lost in transit, the questionnaires were retrieved the same manner in which they were administered. The data collected were presented in tables and analyzed using non-parametric simple percentages and Regression model statistical technique was used in order to confirm the stated hypothesis through the use ofSPSS.
3.2 Reliability of Research Instrument The validity of an instrument refers to the extent to which it measures what was intended to measure. The validity of the scales utilized in this study was assessed for content and constmct validity. After the survey had been completed the reliability of the scales was further examined by computing their coefficient alpha (Crombach Alpha). All scales were found to exceed a minimum threshold of 0. 7 suggested by Nunnally ( 1 978).
4. Results and Discussions of Findings In the course of this study 1 70 questionnaires were distributed to SMEs operators in order to critically evaluate the perfonnance ofSMEs and their implications on employment generation vis-a-vis the effot1s of the government on the development of the sector. The contribution was gathered from the SMEs operators within Nasarawa State, North-Central Nigeria. A total 1 60 questionnaires were returned out of which 150 were found to be valid and useful for our study. This represents 88% which is good enough, as it is reliable and generalizable�
4.1 Research Hypotheses Testing The following tables (regression model coefficients) indicate the measures of the study variables used in the study.
Y = a + bx
Where: y = the dependent variable (or employment generation) a = constant b = coefficient x = the independent variable (or SMEs)
Abuja Journal of Business and Management Vol. /, Issue 1 [56-64}, March-2015 www.abujajournalofbusinessandmanagement.org.ng Page 60

Small and Medium Ente1prises Development in Nigeria: A Sustainable Approach to Employment Generation
Ho,: There is no significant relationship between perceived political environment and performance of SMEs.
Table 4.1 : Regression Model Coefficients•
Model Unstandardized Coefficients Standardized Coefficients
B Std. Enor Beta t Sig. 1 (Constant) 1 .464 . 102 1 4.393 .000 SMEs Perfmmance and Employment Generation . 1 9 1 .070 . 1 93 2.739 .007
Source: SPSS Output 2013
a. Dependent Variable: Environmental Factors Environmental factors = 1 .464 + 0. 1 9 1 SMEs Performance & Employment Generation
Ho2: There is no significant relationship between entrepreneurial orientation and performance of SMEs towards employment generation.
Table 4.2: Regression Model Coefficients•
Model Unstandardized Coefficients Standardized Coefficients
B Std. Error Beta t Sig. 1 (Constant) 2.650 .767 3 .454 .00 1 SMEs Performance and
employment Generation .248 .525 .034 .472 .638 Source: SPSS Output 2013
a. Dependent Variable: Entrepreneurial visitation Environmental factors = 2.650 + 0.248 SMEs performance & employment generation
Ho3: There is no significant relationship between Government policy and the performance ofSMEs.
Table 4.3: Regression Model Coefficients•
Model Unstandardized Coefficients Standardized Coefficients
B Std. Error Beta t Sig. 1 . (Constant) 3.264 ' .287 1 1 .357 .000 SMEs Performance and Employment Generation
.355 . 1 97 -. 1 29 -. 1 .802 .043 Source: SPSS Output 2013 a. Dependent Variable: Governmel)t policies and programme
Government programme and policy = 2.650 + 0.248 SMEs performance & employment generation The hypothesized statements were tested using Regression analysis statistical tools with the use ofSPSS as earlier stated. The test conducted at 95% confidence interval and 0.05 significant levels. Following the decision rule of accepting or rejecting null hypothesis i .e . if calculated Sig value is less than the critical value of(0.05), We reject the null hypothesis, if not we accept. We thus hypothesized as follows;
Abuja Journal of Business and Management Vol. /, Issue I [56-64]. March-2015 www.abujajournalofbusinessandmanagement.org.ng Page 6 1
Small and Medium Entetprises Development in Nigeria: A Sustainable Approach to Employment Generation
Ho1:
As shown in Table 4. 1 ,after establishing an Ordinary least square (OLS) model of "Environmental Factors". on "SMEs Performance and Employment Generation" it js observed that the significance probability of independent variable SMEs performance IS 0.007 which is remarkably less than 0.05(5%) level of significance which is termed "significant". We reject the null hypothesis Ho and conclude that there is a positive significant connection between perceived political environment and performance of SMEs.
Ho2:
In testing this hypothesis, Table 4.2 was drawn. From the Ordinary least square (OLS) model built for "Entreprenemial orientation" on "SMEs Performance and Employment Generation" it was discovered that the significance probability of independent variable SMEs performance is 0.638 which is remarkably greater than 0.05(5%) level of significance which is termed "not significant". We accept the null hypothesis Ho and conclude that there is no significant relationship between entrepreneurial orientation and the performance ofSMEs as per the sampled population. This finding was supported by the literature review.
Ho3:
Table 4.3 has proved our stated hypothesis to be right by revealing that the Ordinary least square (OLS) model built for "Government Policies and Programmes" on "SMEs Performance and Employment Generation" it is observed that the significance probability of independent variable SMEs performance is 0.043 which is remarkably less than 0.05(5%) level of significance which is tenned "significant". We reject the null hypothesis Ho and conclude that there is significant relationship between Government policy and the performance ofSMEs as per the sampled population.
4.2 Summary ofFindings The result of the research work as regards the performance of small and medium scale enterprises and its implications on employment generations revealed that there has been a lot of increase in the number of SMEs in Nigeria over the few years but this growth has been affected by a lot of environmental factors like poor weather condition, poor locations, and insecurity especially the recent and continuous attack of the terror group "Boko-Haram" in the Northern part of the country which make it difficult for the operators of SMEs to perform efficiently and effectively. While the rowdy atmosphere created by the government such as increase in tax, non availability of infrastructure and lack of continuity by the government has a lot of negative implications on employment generations, the study concluded that there is a significant connection between the perceived political environment and the performance ofSMEs The study further shows that the entrepreneurship orientation by most SMEs owners in Nigeria is so low with a sig. value of 0.638 which·is higher than the 0.05 level of significance as shown in 'fable 4.2. This indicates lack of awareness and publicity by various government agencies on SMEs which can affect the rate of employment generation in the country.
The last hypotheses as shown in Table 4.3, there exist a positive significant relationship between various government policies towards the performance ofSMEs over the years as most policies were formulated but not executed by various govcrnrl).ents, therefore adequate measure should be taken by the govc1:nment and its agencies in formulating policies that will enhance perfmmance of SMEs towards employment generation in the country. These are in line with the assertion of Onugu (2005) cited in Fatai (20 1 1 ) that some of the challenges of the SMEs are induced by the operating environment such as government policy, globalization effects and financial institutions.
5. Conclusion and Re�ommendations 5.1 Conclusion Conclusively, lack of management skills by the operators of SMEs does not only affect the effective performance of SMEs and employment generation but also reduces their ability to compete favorably in the market with their large scale industrialist counterparts which has been a major stumbling block for the development and growth of SMEs in Nigeria. It is becoming increasingly apparent to government and policy makers that the role of small and medium scale enterprises is very important to the development and
Abuja Joumal of Business and Management Vol. /, Issue I [56-64], March-2015 www.abujajournalofbusinessandmanagement.org.ng Page 62
Small and Medium Ente1prises Development in Nigeria: A Sustainable Approach to Employment Generation
growth of any given economy. Small and medium scale enterprises will ensure efficient use of resources, employment creation, mobilization of domestic saving and investment.
5.2 Recommendations Finance is the most important and cogent key of any enterptises. Small and medium scale enterprises must be financially supported so that they can take off and expand and be able to meet the needs of Nigerians. Shortage of indigenous entrepreneurs has been identified as a major impediment to economic development. It is also rec
.ommended that there is need for supporting and strengthening SMEs'
productive capacities and market competitiveness ofSmall and Medium Scale Enterprises in the country. This therefore calls for the need for establishment of small-scale enterprises as a way of developing and providing a training ground for indigenous entrepreneurs. The mral-urban drift is due to lack of job oppmtunities in the mral area. Thus, small-scale enterprises will help to reduce this drift particularly when they are sited in mral areas. Non capital-intensive nature of small-scale industries is another important significance of small-scale enterprises. They are usually started with small savings which made them affordable to go into. The meagre capital requirement of small-scale enterprises makes them to promote an even distribution of income in the economy.
This is because if there is adequate financial support, more unemployed Nigerians will engage in small scale enterprises thereby gain their means of living easily than looking for unavailable white collar jobs. There is need for establishment of Small-scale enterprises since they ensure community stability as smallscale enterprises do less harm to the physical environment than large enterprises. They promote agroindustries, improve mral welfare and generally reduce unemployment and poverty in the country. In advanced economies, the SME sector is acclaimed as the engine of economic growth and development. However, against international best practices Nigeria is rated poorly. Extensive efforts in terms of strategic programmes, policy and practice will be required to elevate Nigeria to a leading position. Though Nigeria lacks adequate census on relevant economic indices, it is estimated that Small and Medium Enterprises in Nigeria cunently account for over 75% of employment in the country (SMEDAN 2006). This relatively high percentage is however a paradox as 60% ofNigerians still live below the poverty level (UNDP, 2005). When 60 percent living below the poverty line are taken into account, the share of those gainfully employed in the SME sector is more likely to be in the region of 1 0% as recorded by US Industry Small Business Administration (SBA).
Finally, government as a matter of urgency, should prioritize the SME sector giving it devoted practical and visible attention with a view to make it virile, vibrant, focused and productive. The era of'lip service' attention to the sector should be done away with. The employment creation cannot be developed without a vibrant SME subsector, and so government should do all within its arsenal to reverse the situation.
References African Development Bank 2007, "African Development Report; Natural Resources for
Sustainable Development in Africa". Oxford: Oxford University Press. Aremu, M. A. (2004). Small Scale Ente1prises: Panacea to Poverty Problem in Nigeria, Journal of
Enterprises Development, International Research and Development Institute, Uyo, Akwaibom, Nigeria, I(l ) : 1 -8 .
Awosika, B. 0 . ( 1 997). Evolving a National Framework/or the Emergency of a Strong and Virile Small and Medium Scale Industry Sub-Sector in Nigeria. A Seminar Paper Presented at MAN House, November 5 p.3.
Diego, M. and Juan, M. G. ( 1 998). Sustainability as a Major Source of Competitive Advantage for Small and Medium Sized Enterprises, 7th International Conference of the Greening of Industry Network, November 1 5- 1 8, Rome, Italy.
Fatai . A . (20 1 1 ) . "Small-Medium Scale Enterprises in Nigeria: The problem and Prospects ".Retrieved 'January 1 5 from. www. thecje.com/joumal/index. php/econom icsjo urnal/article.
Fissaeha, Y. ( 1 99 1 ) . Small Scale Enterprises in Lesotho: Summary of a CountJywide Survey, Gemini Technical Report, No 1 4 Washington D.C, DevelopmentAlternatives Inc.
Gunu, U. (2004). Small Scale Enterprises in Nigeria: Their Start Up, Characteristics, Sources a./Finance
Ahuja Journal of Business and Management Vol.!, Issue I [56-64}, March-2015 www.abujajournalofbusinessandmanagement.org.ng Page 63
Small and Medium Ente1prises Development in Nigeria: A Sustainable Approach to Employment Generation
and Importance,Jlorin Journal ofBusiness and Social Sciences, 9 ( 1 & 2): 36-43 . Howard, D. and Hine, D. ( 1995). The Population of Organisations Life Cycle (POLC): Implications for
small business assistance programs. . lnegbenebor, AU. (2006). Entrepreneurshzp. A Practtcal Approach. Benm City : Mindcx Pubhshmg. Lal, K. 2007, "Globalization and the Adoption of ICT in Nigeria SMEs." Science Technology & Society.
1 2 (2), pp21 7-244.Available online at http:/ /sts.sagepub.com/content/abstract/ 1 2/2/2 1 7 .
Levy, B . 1 993, "Obstacles of developing indigenous small and medium scale enterprises: an empirical assessment." The World Bank Economic Review. 7 (1 ), pp 65-83.
Massey, C., Cameron A., Cheyne, J., Harris, C., Lewi, K., Tweed, D. , Wallace, C., and Warriner, V. (2004). Stories of Growth in Small and Medium Enterprises in Nigeria in New Zealand. "A Report on the Life Cycles and Transitions projects prepared by the Newzealand Centre for SMEs Research. Pp 3- 18 .
Mosk, C. (20 1 0). Japanese Industrialization and Economic Growth, available online at http: I I eh .net/encyclopedia/ article/mosk.j a pan. fin a I Nigeria National Council of Small and Medium Enterprises, (200 I ) "The Need to Re-define Micro, Small
and Medium Enterprises (MSMEs) Memorandum ". Presented at the 1 3'h National Council Meeting Held in Makurdi, Benue State, July, 26-27.
Nnanna, O.J. (200 1 ). Financing Small Business Under The New CBN Directive and its Likely Impact on Industrial Growth ofThe Nigerian Economy. CBN Bulletin, July/September Vol. 25 No. 3
Ogwwna, P. A. (1 995). Revitalizing the manufacturing Sector CBN Bullion Vol 1 9 No2. April-June P.2.
Onugu, B.A.N (2005). Small and Medium Enterprises in Nigeria: Problems and Prospects, St. Clements University Website Small and Medium Enterprises Agency of Nigeria (2007). The American International journal ofContemporary Research. Vol. 2 No.4; pp, 1 74- 1 83 .
Peterson, R. M . and Dibrell, C. (2002) "Consumers and Teclmology in Small Business: Are we Creating Relationships or Distance? " Academy of Entrepreneurship Journal, 8 (1), pp 31-45. Available online at http:/ /-www.alliedacademies.org/ entrepreneurship/aej 8- 1
Salami CGE (20 l l ) Entrepreneurial Interventionism and Challenges ofYouth Unemployment in Nigeria. Global Journal of Management and Business Research Volume 11 Issue7 Version 1 .0 July 2011. Global Journals Inc. (USA)
Schmitz, H. ( 1 995). Collective Efficiency: Growth Path for Small - Scale Industry, Journal of Development Studies, 3 1 (4): 529-566.
Starik, M. and Rands, G. P. ( 1995). A Weaving an integrated web: Multilevel and Multisystem Perspectives of Ecologically Sustainable Organizations. Academy of Management Review. 20 ( 1 4): 908 - 935 .
Tendler, J. and Amorim, A. M. ( 1996). Small Firms and their helpers: Lessons on Demand. World Development. 24 (3): 407-426.
Wahab, L and Ijaiya M.A. (2006) Small and medium scale enterprise access to commercial banks credit and their contribution to GDP in Nigeria. CIBN Journal of
Welford, R. and Gouldson, A. ( 1 993). Environmental management and business strategy.Pitman Publishing, London.
Wik lund, J ( 1 99 8 ) . Entrepreneurial Small Business:A Resource-Based Perspective. Cheltcrnham, UK: Edward Elger Publishing.
Abuja Journal of Business and Management Vol./, Issue I [56-64}, March-2015 www.abujajournalofbusinessandmanagement.org.ng Page 64
Influence of Motivational Factors on Teachers' Job Performance in Public Senior Secondary Schools in the FCT, Ahuja
Hauwa Mohammed, PhD Department of Educational Management, University of Abuja, Gwagwalada, Abuja
Abstract: The study examined the influence of motivational factors on teachers ' job performance in public senior secondary schools in the FCT, Abuja. Three research questions were analyzed and one hypothesis was tested. The research employs a descriptive research design. The instrument for data collection was a questionnaire for the teachers '. The questionnaire was pilot-tested and returned a reliability coefficient of0. 68. The sample of the study was 270 teachers selected through simple random sampling. The findings of the study showed that there was a significant relationship between motivational factors and teachers ' job performance. It was recommended among other things that school administrators in the FCT secondmy schools should continuously employ the various motivational factors to enhance teachers 'job performance. Keywords: Influence, Motivational Factors, Teachers, Job Performance, Public Senior Secondary Schools
1 . Introduction Teachers in Nigeria are disenchanted with their jobs, managers and the overall environment within which they work Oyedeji, ( 1 998). Morale is very low among teachers in most cases, while clamouring for higher productivity is persistently being drummed. The dynamism of the nature of modern day work environment requires educational administrators and managers to be alert to employees' behaviour to avoid productivity and performance crisis in our educational system. Human resource is a unique factor in the production of a nation's wealth and they are categorized into two; the management and the workers or the subordinates who are an integral part of any organization Lai, (20 1 1 ). Tn order to understanrl the importance of people in the organization, recognition must be given to the human element and the organization as a unified body. An effective organization will ensure that there is a spirit of cooperation and sense of commitment and satisfaction within the sphere of its influence, in order to make employees perform better at various levels of the organization.
Motivation in its simplest form is a driving force behind an employee's action and behavior Imam, (2003). When an employee strives for high output, it's a function of his/her level of motivation, when he/she docs the opposite it shows lack of commitment in discharging his/her responsibilities, which may be tied to his/her lack of motivation Udeozor (2004). Agboola (2004) has opined that motivation has a direct bearing and implication on the profitable returns on investment that is made on human resources. He further stressed the need for school administrators and managers to appreciate generally, how human beings behave in particular situation and try to accommodate a range of diverging interests and aspirations among their employees so that they can accord motivation a priority to the overall purposes and values of the educational system for effective and efficient job performance and optimum productivity to raise the standard of education in Nigeria to an enviable height. Whether or not school administrators have been able to motivate their teachers and consequently influence theirjob satisfaction in public senior secondary sc11ools in the FCT needs to be determined.
·
This paper stated the problem of the study. It also discusses the theoretical framework and underpinning for the study. Related l iterature was reviewed and the findings of the study were discussed.
1.2 Statement ofthe Problem Although teachers' motivation in secondary schools is very vital to their job performance, there are indications that teachers are not well motivated for effective and efficient job perfonnance. Since teachers bear the brunt of any bad or negative outcome of students' performance in external secondary schools examination, teachers naturally and normally feel bad about the low incentives given to them. Their anger is apparently genuine because of the sensitive nature of their work, as those who execute educational policies that translate the students to f-uture leaders, and earn the schools the various standards they are
Ahuja Joumal of Business and Management Vol./, Issue I [65-72}, March-2015 www.abujajournalofbusinessandmanagement.org.ng Page 65
Influence oft\!Iotivational Factors on Teachers' Job Pe1jormance in Public Senior Secondmy Schools in the FCT, Ahuja
noted for. The outcome of their lack of motivation in most cases translates into frustration, lateness, demonstration, absenteeism, strikes and so on (Ubeku, 1 995).
Perhaps the growing te�chers' sensitivity towards this situation is attributable to their relative high academic and professional qualifications. The need to tackle the sophisticated school problems are reflections of wider world's enhanced welfare packages for professionals and the general worsening condition of the environment. So generally, it is observed and believed that since teachers' professional calling is quite instrumental and vital to the general well being of the other spheres oflives, their welfare if not properly handled would be counterproductive Imam(2003). Agboola (2004) is emphatic that the factors that motivate teachers which also affect their job performance in secondary schools in Nigeria are: administrative policy, financial incentives, better pay package/prompt payment of salary; conditions of service, work environment; societal perception of teachers, teacher patticipation in decision-making process of the school and professional growth and recognition. The concern ofthis study therefore is to find out how these motivational factors influence teachers' job performance in public senior secondary schools in the FCT,Abuja.
1 .3 Research Questions 1 . What are the motivational factors that exist in public senior secondary schools in the FCT? 2. What is the level of teachers' job performance in public senior secondary schools in the FCT? 3 . To what extent do the motivational factors influence teachers' job performance?
1.4 Statement ofHypothesis Ho: There is no significant relationship between factors of motivation and teachers job performance in public senior secondary schools in FCT, Ahuja.
2. Literature Review 2.1 Concept ofMotivation Krectner in (Imam, 2003) defined motivation as the psychological process that gives behavior purpose and direction. Acording to Peretomode (2003) motivation is the degree of readiness of an organism to pursue some designated goal and implies the determination ofthe nature and locus of the forces including the degree of readiness. However Hoy and Miskel (2000) were emphatic that motivation is the complex forces, desires, needs tension states or other mechanism that start and maintain voluntary activity directed toward the advancement of personnel goals while Baron (2002) stated that it is a set of process that energizes a person's behavior and directs it toward attaining some goals.
Suslu (2006) noted that teacher job performance can have a positive effect on students' attitudes and learning. It does not only make teaching more pleasant for teachers, but also learning more pleasant for the students. This he asserted creates an environment that is conducive for learning. Consequently, Stotz (2000) concluded that low levels ofperfonnance can lead to decrease in teacher productivity and bum out, which i s associated with the following: i) a loss of concern for and detachment from people with whom one works; ii) decreased quality of teaching; iii) depression, iv) greater sick leave; v) eff01ts to leave the profession and vi) a cynical and dehumanized perception of students.
Thus, from the foregoing it can be infened that individual performance leads to organizational commitment while low performance results in behaviours detrimental to the organization. Teachers who are satisfied with their job are likely to be devoted and hardworking. However, low job performance can tum an exciting career into a dreaded workplace. Therefore teachers need to feel good about themselves and their work in order to maximize their productive energy. Since teaching requires interaction with coworkers, adherence to rules, meeting performance standards and perfonning varied tasks, teachers must be assured in order to balance multiple dut
'ies.
·
Motivational factors have been defined in various ways by many researchers as the organizational strategies employed to help an individual worker have a sense of fulfillment of his/her needs. Factors of motivation therefore includes, salary, promotion, recognition, professional growth and advancement, working environment, participation in decision making, relationship with supervisors, societal perception
Ahuja Journal of Business and Management Vol. /, Issue I [65-72], March-2015 www.abujajournalofbusinessandmanagement.org.ng Page 66
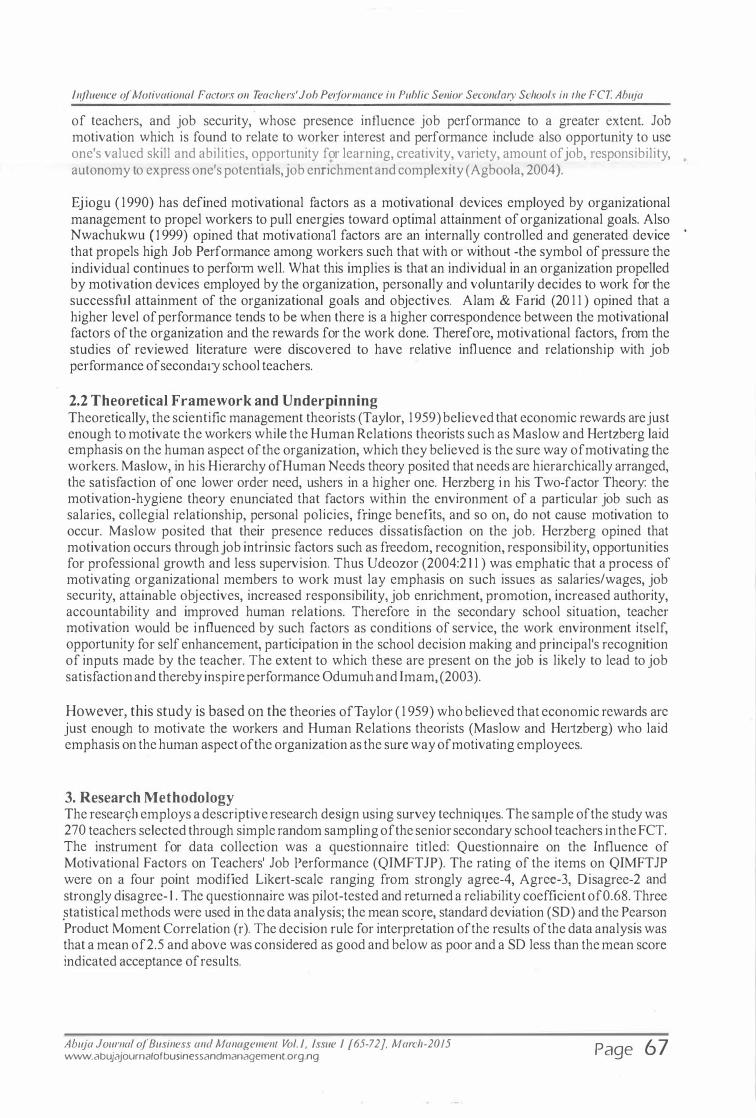
Influence of Motivational Factors on Teachers' Job Pe1jormance in Public Senior Secondwy Schools in the FCT. Ahuja
of teachers, and job security, whose presence influence job performance to a greater extent. Job motivation which is found to relate to worker interest and performance include also opportunity to usc one's valued skill and abilities, opportunity for learning, creativity, variety, amount of job, responsibility, autonomy to express one's potentials, job enrichment and complexity (Agboola, 2004).
Ej iogu ( 1990) has defined motivational factors as a motivational devices employed by organizational management to propel workers to pull energies toward optimal attainment of organizational goals. Also Nwachukwu ( J 999) opined that motivatiomil factors are an internally controlled and generated device ·
that propels high Job Performance among workers such that with or without -the symbol of pressure the individual continues to perform well. What this implies is that an individual in an organization propelled by motivation devices employed by the organization, personally and voluntarily decides to work for the successful attainment of the organizational goals and objectives. A lam & Fa rid (20 1 1 ) opined that a higher level of performance tends to be when there is a higher conespondence between the motivational factors of the organization and the rewards for the work done. Therefore, motivational factors, from the studies of reviewed literature were discovered to have relative influence and relationship with job performance of seconda1y school teachers.
2.2 Theoretical Framework and Underpinning Theoretically, the scientific management theorists (Taylor, 1 959) believed that economic rewards are just enough to motivate the workers while the Human Relations theorists such as Maslow and Hertzberg laid emphasis on the human aspect of the organization, which they believed is the sure way of motivating the workers. Maslow, in his Hierarchy ofHuman Needs theory posited that needs are hierarchically arranged, the satisfaction of one lower order need, ushers in a higher one. Herzberg in his Two-factor Theory: the motivation-hygiene theory enunciated that factors within the environment of a particular job such as salaries, collegial relationship, personal policies, fringe benefits, and so on, do not cause motivation to occur. Maslow posited that their presence reduces dissatisfaction on the job. Herzberg opined that motivation occurs through job intrinsic factors such as freedom, recognition, responsibil ity, opportunities for professional growth and less supervision. Thus Udeozor (2004:2 1 1 ) was emphatic that a process of motivating organizational members to work must lay emphasis on such issues as salaries/wages, job security, attainable objectives, increased responsibility, job enrichment, promotion, increased authority, accountability and improved human relations. Therefore in the secondary school situation, teacher motivation would be influenced by such factors as conditions of service, the work environment itself, opportunity for self enhancement, participation in the school decision making and principal's recognition of inputs made by the teacher. The extent to which these are present on the job is likely to lead to job satisfaction and thereby inspire performance Odumuh and Imam, (2003).
However, this study is based on the theories ofTaylor ( 1 959) who believed that economic rewards arc just enough to motivate the workers and Human Relations theorists (Maslow and Hertzberg) who laid emphasis on the human aspect of the organization as the smc way of motivating employees.
3. Research Methodology The researyb employs a descriptive research design using survey techniql}eS. The sample of the study was 270 teachers selected through simple random sampling of the senior secondary school teachers in the FCT. The instrument for data collection was a questionnaire titled: Questionnaire on the Influence of Motivational Factors on Teachers' Job Performance (QIMFTJP). The rating of the items on QIMFTJP were on a four point modified Likcrt-scalc ranging from strongly agree-4, Agrcc-3, Disagree-2 and strongly disagree- I . The questionnaire was pilot-tested and returned a reliability coefficient of0.68. Three .statistical methods were used in the data analysis; the mean score, standard deviation (SD) and the Pearson Product Moment Correlation (r). The decision rule for interpretation of the results of the data analysis was that a mean of2.5 and above was considered as good and below as poor and a SD less than the mean score indicated acceptance of results.
Ahuja Joumal of Business and Management Vol. I, Issue I [65-72}. March-2015 www.abujajournalofbusinessandmanagement.org.ng Page 67
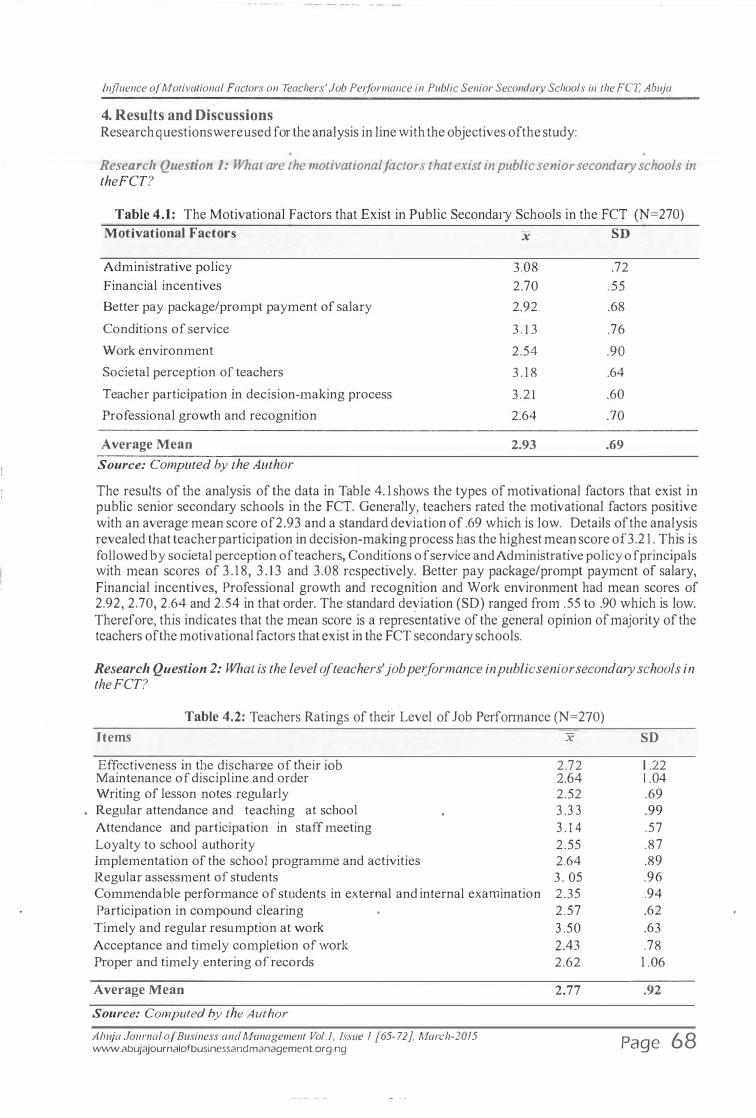
Influence of Motivational Factors on Teachers' Job Performance in Public Senior Second my Schools in the FCT, Ahuja
4. Results and Discussions Research questions were used for the analysis in line with the objectives of the study:
. .
Research Question 1: What are the motivational factors that exist in public semor secondary schools in theFCT?
Table 4.1: The Motivational Factors that Exist in Public Secondary Schools in the FCT (N=270) Motivational Factors x SD
Administrative policy 3.08 .72 Financial incentives 2.70 .55
Better pay package/prompt payment of salary 2.92 .68
Conditions of service 3 . 1 3 .76
Work environment 2.54 .90
Societal perception of teachers 3 . 1 8 .64
Teacher participation in decision-making process 3.21 .60
Professional growth and recognition 2.64 .70
Average Mean 2.93 .69 Source: Computed by the Author
The results of the analysis of the data in Table 4. 1 shows the types of motivational factors that exist in public senior secondary schools in the FCT. Generally, teachers rated the motivational factors positive with an average mean score of2.93 and a standard deviation of .69 which is low. Details of the analysis revealed that teacher participation in decision-making process has the highest mean score of3.2 1 . This is followed by societal perception of teachers, Conditions of service and Administrative policy of principals with mean scores of 3 . 1 8, 3 . 1 3 and 3.08 respectively. Better pay package/prompt payment of salary, Financial incentives, Professional growth and recognition and Work environment had mean scores of 2.92, 2.70, 2.64 and 2.54 in that order. The standard deviation (SD) ranged from .55 to .90 which is low. Therefore, this indicates that the mean score is a representative of the general opinion of majority of the teachers of the motivational factors that exist in the FCT secondary schools.
Research Question 2: What is the level ofteachers'job performance in public senior secondary schools in theFCT?
Table 4.2: Teachers Ratings of their Level of Job Perfonnance (N=270)
Items
Effectiveness in the discharge of their iob Maintenance of discipline and order Writing of lesson notes regularly Regular attendance and teaching at school Attendance and participation in staff meeting Loyalty to school authority Implementation of the school programme and activities Regular assessment of students Commendable performance of students in external and internal examination Participation in compound clearing Timely and regular resumption at work Acceptance and timely completion of work Proper and timely entering of records
Average Mean
Source: Computed by the Author Ahuja Joumal a_( Business and Management Vol.!, hwe 1 {65- 72}. March-2015 www.abujajournalofbusinessandmanagement.org.ng
X
2.72 2.64 2.52 3 .3 3
3 . 1 4
2.55 2.64 3 . 05 2.35 2 .57 3 .50 2.43 2.62
2.77
SD
1 .22 1 .04 .69 .99 .57 .87 .89 .96 .94 .62 .63 .78 1 .06
.92
Page 68
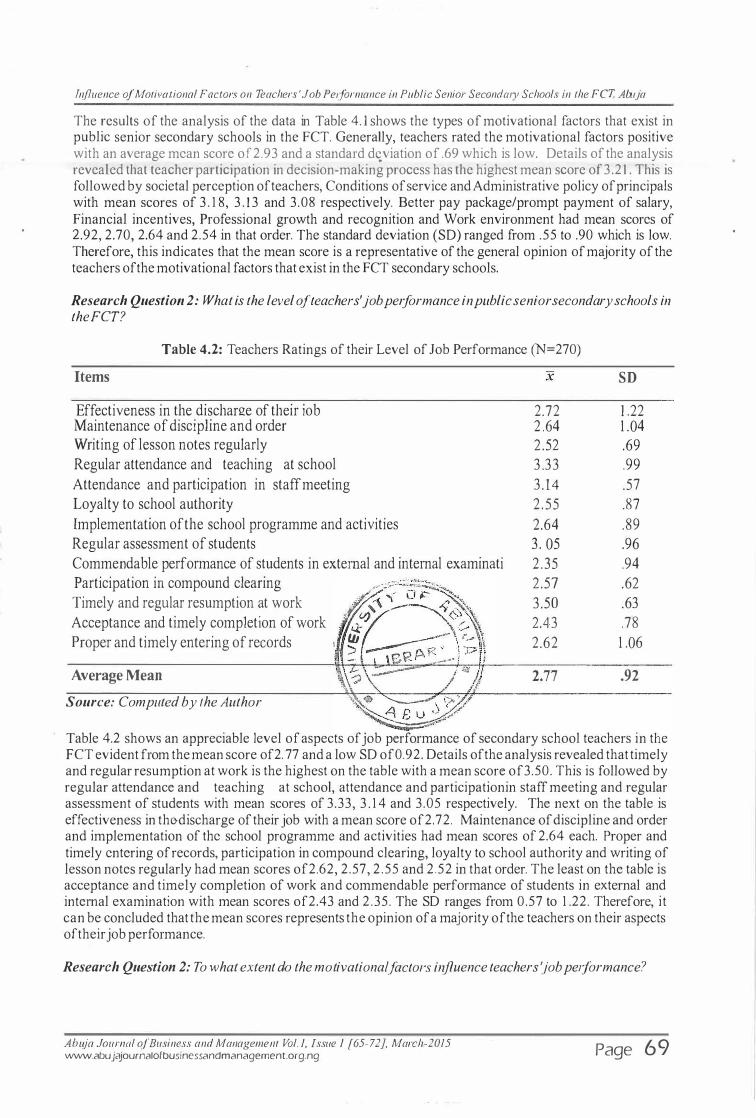
!njluence of Motivational Factors on Teachers ' Job Pe1jormance in Public Senior Secondmy Schools in the FCT, A buja
The results of the analysis of the data in Table 4. 1 shows the types of motivational factors that exist in public senior secondary schools in the FCT. Generally, teachers rated the motivational factors positive with an average mean score of2.93 and a standard d�viation of .69 which is low. Details of the analysis revealed that teacher participation in decision-making process has the highest mean score of 3 .2 1 . This is followed by societal perception of teachers, Conditions of service and Administrative policy of principals with mean scores of 3 . 1 8, 3 . 1 3 and 3.08 respectively. Better pay package/prompt payment of salary, Financial incentives, Professional growth and recognition and Work environment had mean scores of 2.92, 2.70, 2.64 and 2.54 in that order. The standard deviation (SO) ranged from .55 to .90 which is low. Therefore, this indicates that the mean score is a representative of the general opinion of majority of the teachers of the motivational factors that exist in the FCT secondary schools.
Research Question 2: What is the level o.fteachers'job performance in public senior secondary schools in theFCT?
Table 4.2: Teachers Ratings of their Level of Job Performance (N=270)
Items
Effectiveness in the discham:e of their iob Maintenance of discipline and order Writing of lesson notes regularly
Regular attendance and teaching at school
Attendance and participation in staff meeting
Loyalty to school authority
Implementation ofthe school programme and activities
Regular assessment of students
Commendable performance of students in external and internal examinati
Participation in compound clearing . w ·; .::. . .:..?-:..�.,.._ Timely and regul�r resumption �t work
, . ' · '" ��'1�t\· Acceptance and timely completion of work <J..':J "\. 2\ Proper and timely entering of records ' IJ.J �-; \ ·� � Average Mean
Source: Computed by the Author >, � · 1/1- �l ��/
X
2.72 2 .64 2 .52 3 .33 3 . 14 2 . 5 5 2.64 3 . 05 2.35 2 .57
3 .50 2.43 2.62
2.77
SD
1 .22 1 .04 .69 .99 .57 .87 .89 .96 .94 .62 .63 .78
1 .06
.92
Table 4.2 shows an appreciable level of aspects of job performance of secondary school teachers in the FCT evident from the mean score of2. 77 and a low SO of0.92. Details of the analysis revealed that timely and regular resumption at work is the highest on the table with a mean score of3.50. This is followed by regular attendance and teaching at school, attendance and participationin staff meeting and regular assessment of students with mean scores of 3.33, 3 . 1 4 and 3.05 respectively. The next on the table is effectiveness in th(}discharge of their job with a mean score of2. 72. Maintenance of discipline and order and implementation of the school programme and activities had mean scores of 2.64 each. Proper and timely entering of records, participation in compound clearing, loyalty to school authority and writing of lesson notes regularly had mean scores of2.62, 2.57, 2 .55 and 2.52 in that order. The least on the table is acceptance and timely completion of work and commendable performance of students in external and intemal examination with mean scores of2.43 and 2.35. The SO ranges from 0.57 to 1 .22. Therefore, it can be concluded that the mean scores represents the opinion of a majority of the teachers on their aspects oftheirjob performance.
Research Question 2: To what extent do the motivational .factors influence teachers 'job pe1jormance?
Ahuja Journal of Business and Management Vol. I, Issue I [65-72], March-2015 www.abujajournalofbusinessandmanagement.org.ng Page 69

influence of Motivational Factors on Teachers' Job Pe1jormance in Public Senior Secondwy Schools in the FCT, Abt!fa
Table4. 3: Extent to which the motivational factors influence teachers' job performance (N=270) Motivational Factors X Decision
Administrative policy 3.08 High influence
Financial incentives 2.70 High influence
Better pay package/prompt payment ofsalary 2.92 High influence
Conditions of service 3 . 1 3 High influence
Work environment 2.54 High influence
Societal perception of teachers 3 . 1 8 High influence
Teacher participation in decision-making process 3.21 High influence
Professional growth and recognition 2.64 High influence
Source: Computed by the Author
Table 4.3 shows the extent to which the motivational factors influence teachers' job performance in secondary schools in the FCT. The data analysis revealed that the factors of motivation that has the highest influence on teachers' job performance are teacher participation in decision-making process, societal perception of teachers, conditions of service, and administrative policy respectively. The other motivational factors are better pay package/prompt payment of salary, financial incentives, professional growth and recognition and work environment. Therefore, it can be concluded that the various motivational factors that exist in secondary schools in the FCT has greater effect on teachers' job performance.
4.2 Test of Hypothesis There is no significant relationship between factors of motivation and teachers job performance in public senior secondary schools in FCT,Abuja.
Table 4.0: Relationship between Motivational Factors and Teachers' Job Performance Variable x SD r Decision
Motivational factors 2.93 .69
0.6 1 Sig.
Teachers' job performance 2.77 .92 Source: Field Research (2014)
'
The results of the data analysis revealed a coefficient of relationship of(r=0.6 1 ) between the motivational factors and teachers' job performance in FCT secondary schools. This is an indication of a significant relationship between the variables. Therefore, the hypothesis which stated that there is no significant relationship between motivational factors and teachers' job performance in FCT secondary schools is hereby rejected.
4.3 Discussions ofFindings Descriptive statistics mean and standard deviation were used to answer the research questions ofthe study. The Pearson Product Moment Correlation (r) was used in the hypothesis testing. The findings of the study showed that the motivational factors that exist in the FCT secondary schools have a high influence on the
Abt!fa Journal of Business and Management Vol.!, issue 1 [65-72}, March-2015 www.abujajournalofbusinessandmanagement.org.ng Page 70

Influence of Motivational Factors on Teachers' Job Pe1formance in Public Senior Secondwy Schools in the FCT. Abuja
job performance of the teachers. This confinns Obi's (2003) discoveries that factors of motivation such as administrative policy, financial incentives, environment, societal perception of teachers, teacher participation in decision-making process of the school, pro(cssional growth and recognition adversely affect teachers' job performance was coherently in agreement with this study. This could be because the needs of the teachers are well provided and this lead to better commitment to their job and to a positive performance. Imam (2003) argues that the degree to which these motivational factors are present is likely to propel teachers for high job performance.
The findings of this study showed that there is improvement in the level of teachers' motivation in FCT secondaty schools. The level of this new trend in motivational index of secondary school teachers have led to industrial harmony relationship between the government and secondary school teachers in FCT, Abuja.
The study also discovered that the level of teachers' involvement in decision-making process in FCT state secondary schools was encouraging, as it was noted that teachers were always involved in taking decisions on issues bordering on their welfare as Imam (2006) opined that teachers' participation in decision making process is a motivational factor which falls under the need of subordinates for self- esteem. Imam was therefore emphatic that the degree to which this is present is likely to propel teachers for high job perf01mance. The findings ofthis study confirmed this viewpoint. Furthermore, a significant relationship exists between factors of motivation and teachers'job performance.
5. Conclusion and Recommendations 5.1 Conclusion The place of motivation and job performance of teachers has always been considered essential in the Nigerian educational system. Therefore, efforts should be made to provide the needs of the teachers so that they can perfotm well on the job. Consequently, if the factors of motivation are improved, teacher's job performance will be improved.
5.2 Recommendations Therefore this study recommends that:
1 . School administrators should ensure an improved condition of service for teachers to make them focus on their job;
2 . Teachers should be actively involved in decision making that concerns their work schedules and specification;
3 . Effective administrative policies that encourage staff development and training should be formulated and given serious attention;
4. Supervision and appraisal of teachers' work should be objectively carried out with the aim of helping teachers grow on the job; and
5 . Financial incentives, recognition, and other motivational factors should be applied by school administrators to motivate teachers to perform efficiently on their job and implementation strategies should be designed for each ofthe recommendations stated.
References Agboola, BA2004, Morale, job attitude, motivation and job satisfaction. InAgboola, B.A. (Ed), Theories
and practice of personal management in the education sector, Mimeograph. ·
Alam, MT & Farid, S 20 1 1 , Factors affecting teachers' motivation, International Journal of Business and Social Science, Vol. 2, No. 1 , pp. 298-304. Retrieved from http://www.ijbssnet.com on 22 Sept, 2014
Baron, HA 2002, Behavior in organization: Understanding the human side of work. Toronto: Allen and Balon Inc.
Ejiogu, AM 1 990, Theories of job satisfaction and job performance, Maryland, Lagos: Joja Educational Research and Publisher Limited, pp. 34 - 43 .
Hoy, WK. & Miske!, CG 2000, Educational administration: theory, research, and practice, 3"' (ed.), New York, Random House.
Imam, H 2003, Motivating factors: A survey of strategies employed by Secondary school principals for enhancing teachers' productivity FCDA, Jos Educational Forum, Vol. l , No. 2, pp. 63-74. Lead publishers.
Abuja Joumal of Business and Management Vol. !, Issue I [65-72}, March-2015 www.abujajournalofbusinessandmanagement.org.ng Page 7 1
Influence of Motivational Factors on Teachers' Job Pe1formance in Public Senior Secondwy Schools in the FC7; Ahuja
L a i , E R 2 0 1 1 , M ot i v a t i o n : a l i t e r a t u r e r e v i ew, p p . 1 -4 4 . R e t r i e v e d fro m http://www.pearsonassessmcnts.com/
Nwachuckwu, CC 1 999, Management and theorv and practice. Onitsha: Africana-FEP. Publishers Ltd. pp. 1 56- 158.
Obi, E 2003, Educational management, theo1y and practice. Enugu: Jamoe enterprise Ltd. Oyedeji, NB 1 998, Motivation as a tool for achieving efficiency and defectiveness in Nigerian secondary
schools. Retrieved from http://www.unilorin.edu.ng on 1 9 Sept, 20 14. Odumuh, TO & Imam, H 2003, Effective school administration and supervision as a means of improving
quality in education. A paper presented at the Nigerian union of teachers' seminar in Bauchi. Peretomode, OF 2003, Educational administration: Applied concepts and theoretical perspective for
students and practitioners. Ikeja: Joja Educational Research and Publishers Limited, pp. 1 90 -223.
Stotz , R 2000 , Content and process theories of motivation. Retrieved from http://www. incentivemarketing.org on 2 1 Sept, 2014.
Suslu, S 2006, Motivation of ESL teachers. Theinternet TESL Journal, Vol . 7, No. 1 . Retrieved from http://www.iteslj.org/
Ubeku, A. K, ( 1 995). Personal management in Nigeria. Benin City. Ethiope Publishing. Udeozor, RK 2004, Educational administration: perspectives and practical implications. Anambra;
Rex Charles 7 Patrick Ltd. Pp. 1 13- 1 23 .
Ahuja Journal of Business and Management Vol. I , Issue I [65-72], Marc/i-201 5 www.abujajournalofbusinessandmanagement.org.ng Page 72
Effect of Electronic-Customer Relationship Management ( e-CRM) on Business Organi.sations
Idris Bashir Bugaje Department of Business Administration, Faculty of Adminstration, Ahmadu Bello Universi ty, Zaria
Abstract: Over the last decade (2000-date), the internet phenomenon has continued to present certain advantages which have slowly changed the entire business world and its methods. The internet has become a means for both firms and customers to conduct their businesses. Electronic customer relationship management (e-CRM) presents a managerial approach that enables businessorganisations to identifY, attract, and increase the retention of profitable customers online. The main objective of the study is to identify the potential difficulties of managing e-CRM in business organisations. Through a conventional content analysis, the study identified potential challenge of e-CRM and strategies to manage them. It was found that the most iterated challenge ofe-CRMis the ability to secure company and customer information from theft, fraud and publishing. This builds trust within the customers and earns the company a remarkable reputation. The paper concluded that e-CRM can be cost effective for both small and large companies in terms of large customer coverage and reduced use of human and physical resources. It was also established that e-CRM alone is insufficient in managing customer relation. It needs to be complemented with other channels such as face-to-face and telecommunication interface. Keywords: Electronic Customer relationship (e-CRM)
1. Introduction It is evident that increasing amount of everyday activities can now be carried out through the internet -from purchasing and online banking to promotional campaigns and establishing business relations. Kotler, et al., (2008) view this as a global phenomenon that has entirely changed the way of doing business. Accot:ding to Internet world statistics (20 13) the internet users worldwide have reached about 2.4 billion by June 201 2. This number of usersmeans people are going to web not only to seek for information but also for reasons such as purchasing, communal payments, managing funds, establishing relations with business partners.eMarkcter (20 13), forecast has been made that over $ 1 .298 trillion worth of products and services should have been purchased by the end of20 1 3 .
E-commerce has not only changed the way we transact but has also created new business. The potential increase of e-business worldwide is a growing phenomenon; the internet is becoming a means for both firms and customers to conduct their business. The widespread of computer ownership and the continuous improvement of internet access have led to an increase in the use of the internet, thereby allowing business to use this mediumto conduct their business in an electronic way. Thus, it is expected that the e-business will become a universal medium for exchanging products and services.
The above argument has maintained where the whole business interface is heading to. A lot of companies have set up or are on their way toset up their business through the intemet. In brick and mortar businesses customer relationship management·(CRM) basically has to do with the traditional way of doing business where there is contact between the customer and employees but in electronic customer relationship management ( e-CRM) there is reduced contact or no such contact, The uniqueness of the platform of eCRM is that customers have an established contact and a 24- hour service, 7 days a week contact with their company, this close contact could result to loyalty for the company's brand. The importance of e-CRM in managing customer relations cannot be overemphasised because of the important role e-CRM plays in managing customer relation seen in creating and retention of customers which may grow into loyalty. Thus it is important for organisation to not only embark on using e-CRM but understand fully howto get the maximum of e-CRM.
Many have studied e-CRM looking at the dimension of security (Batchford 2003,Scullins et al 2002, Aileenk 2006) problem of consistency (Ozok et al 2007), managing the channels (Gottshalk 2000),
Abu} a Journal of Business and Management Vol. !, Issue I [73-80], March-20 15 www.abujajournalofbusinessandmanagement.org.ng Page 73

EJJect of Electronic-Customer Relationship Management (e-CRM) on Business Organisations
Database (Gottshalk 2000 Bergeron 2002), employee training and retention (Buttle 2009). To the best of our knowledge there are no studies in Nigeria that researched on the concept of e-CRM by looking at the entire dimension above. This study is aimed at rcsear�hing the concept using all of the dimensions above. The aim of this study is to identify the potential difficulties of c-CRM in any organisation and how to manage these difficulties.
2. Literature review This section provides an overview of Customer relationship management and electronic customer relationship management; it also discusses the major concepts in both CRM and e-CRM. Challenges of Managing the e-CRM would also be discussed.
2.1 CRM and e-CRM One view on customer relationship management (CRM) is as a comprehensive business and marketing strategy that integrates technology, process and all business activities towards the customer (Feinberg, et a/., 2002). Similar view is shared by Bradshaw and Brash (200 1 ), who see CRM as a management approach that enables organisation to identify, attract and increase retention of profitable customer by managing relationships with them.
Ozok, et al., (2007) and Buttlc, (2009), present a more customer-orientated definition. In their opinion, CRM is an integrated information system that is used for all activities of an organisation in order to improve customer acquisition and retention. They maintain that the primary focus of CRM is long term growth and profitability through a better understanding of customers' behaviour. Ozoket a! (2007) also add that CRM does not only deal with the retention of customers but also with motivating them to talk positively about the company and its products and services. From this perspective CRM has to do with contributing to building the image of the company and how it is going to be positioned in (potential) customers' minds. Winer (200 1 ), views CRM in a broader and phnosophical way. He considers it as an essential part of marketing strategy, calling it the new mantra of marketing. In his perception, contemporary CRM has shifted the traditional focus of marketing from acquiring new customers to retaining them. This implies a continuous dynamic process of managing customer relationships in order for the customers to continue commercial exchange with the company (Bergeron, 2002). Based on the above, in my opinion CRM can then be defined as a management approach using technology which enables organisations not only to retain and also acquire new customers but to make them commercially active.
According to Feinberg et a!, (2002) electronic customer relationship management (e-CRM) is part of company's comprehensive business and marketing strategy, which is enabled through the use of the internet. They point out the importance of e-CRM is its cost efficiency and ease of managing customer relationship through the web. In addition Bergeron (2002), describes the tools of reaching customers (Internet based customer touch points) such as E-mail, online advertisement and other e-commerce activities.A more detailed definition of e-CRM is provided by Fjerrnestad and RomanoJr (2003) who assert that e-CRM is a combination of hardware, software, processes, applications and management commitment. This view implies attracting and keeping economical valuable customer
. while repelling and
eliminating those that are unprofitable. A problematic issue in this interpretation of e-CRM is the focus only on economical valuable customers. This neglects other potential customers and leaves the process of attracting new ones vague.
Therefore, it can then be summarised that e-CRM comprises of what CRM offers, but this are offered through the internet (e-mail, online advertisement and so forth). Despite that CRM and c-CRM are two separate terms; still opposing opinions can be found of whether they are similar or different. Pan and Lee (2003) opine that CRM and e-CRM are different. They have summarised the differences in three main areas, and these are customer data, analysis of customer characteristics and customer service. In relation to customer data, they have identified that both CRM and e-CRM have to do with data warehouse which
Abu} a Journal of Business and Management Vo/.1, Issue I [73-80}, March-201 5 www.abujajournalofbusinessandmanagement.org.ng Page 74
Effect of Electronic-Customer Relationship Management (e-CRM) on Business 01ganisations
include customer information, transaction history and products information. However, e-CRM data analysis additionally includes click stream and content information.
Another difference they pomt out IS that through e-CRM a more comprehensive analysis of customer characteristics can be made by tracking shopping cart, identifying pattern in visited websites, and so forth. Finally, in relation to customer service, CRM is much more limited in tetms of real time service and access to customers. e-CRM on the other hand can provide in time service and thanks to its availability online, it can be accessed 'at anytime from anywhere.Many may find it reasonable to differentiate CRM and e-CRM. However, some believe that the two terms stand for the same thing. Such an understanding is provided by Bradshaw and Brash (2001 ), who believe that CRM and e-CRM could be described as the same. The reason behind this lays in their understanding of CRM as a managerial approach (as mentioned above). Looking at it this way, the definition does not mention any particular means of communication or channels, whether traditional or new which is why they cannot be differentiated.
3.0 Challenges of managing e-CRM One of the main issues in establishing and maintaining customer relations through the internet is the level of security for both customers and companies. Batchford (2003) posits that security concern is a major hindrance to businesses in e-commerce. People tend to see the web as a less secure channel than buying/selling at the traditional physical markets. This is why companies should be able to provide their customers safety by securing their personal information and details, and should spend considerable time, attention, efforts and funds to make themselves a trustworthy and safe-to-shop company. One of the major problems a web-based company can face is securing financial transactions and customers' debit and credit card details, together with faulty or mirrored websites which can mislead and deceive customers (Batchford, 2003). Ozok,et a!, (2007) in their research proved that the expectation of the customer concerning security issues is very high. This is also linked to their expectation of on-line. This however, makes security the main priority in choosing a company to transact business with. The consequences of a poor security system can lead to damaging company's name and losing customers' trust (Srinivasan, 2004), which inevitably will affect the financial performance of the company. The ease of entering the electronic market makes the threat of potential and actual competition very high. Thus, with a low level of security, a company is most likely to start losing its customers, who would prefer to switch to a more reliable and trustworthy website (company).
Another challenge in e-CRM is the processing and management of the huge database and the cost of archiving this data (Bergeron, 2002). e-CRM allows acquiring various information about customers and their purchase behaviour. However, the more data is collected, the more efforts on its processing is needed. This technical aspect of e-CRM is directly related to the requirements for additional workforce and costs of data management and storage. Companies need to ensure the data analysis is running smoothly and timely, without slowing down or hampering their operations.
Additionally a challenge for the business, according to Bradshaw and Brash (200 I ), is when companies treat the web as the only channel to operate their business in. What they suggest is that, except for a well designed web page, companies need the traditional front and back office systems to make the overall . function successful. The idea of the scholars implies that e-CRM activities should be backed up by the good level of operation of the other f·unctional depattments in order to provide an overall high customers' satisfaction. In other words, Bradshaw and Brash's (200 1 ) view on e-CRM is as a (preferably) interrelated with front and back office activities to provide a positive overall shopping experience.
One aspect of the choice of only one channel to conduct business is the risk oflosing potential customers. Harriganet a/ (2009), indicates that there exist a strong customers' preferences in face to face relationship between customer and company. Doing business through the internet may be a barrier for people who still haven't adapted to the fast developing digital world and may prefer the traditional way of buying from a physical store. From this perspective Harriganet a/ (2009), recornn1ends companies to focus on more than one channel for conducting their business. They add that companies "must be aware of the range of
Abu} a Journal of Business and Management Vol. !, Issue I [73-80}, March-2015 www.abujajournalofbusinessandmanagementorg.ng Page 75
E. ffect ofE/ectronic-Customer Relationsh ip Management (e-CRM) on Business Organisations
customer preferences and should devise a unique strategy establishing both for whom and in what circumstances internet technologies can improve CRM". However, this might be problematic for small and. medium companies due to their smaller resources and invcstm�nt capabilities.
Furthermore, from a corporate cultural perspective, challenge can be found in the employee motivation and training requirements in the use of e-CRM tools. This idea is proposed by Bergeron (2002) who says that employees may feel threatened by the prospect of losing their jobs due to the requirement of new technological skills. This can affect their motivation. The scholar also argues that training is costly for companies. It may be problematic if there is a high turnover of employees and, respectively, it would be difficult to maintain trained staff. This challenge can be applicable for brick-and-mortar companies that decided to start doing their business online. Since it is a new company that initially starts its business online, a brick-and-mortar company would need to adapt their staff to a new way of operating. This means changing the requirements for the employees and the skills needed to work with the new software.
A relatively unexplored issue among the challenges in c-CRM is the issue of consistency in customer treatment. Ozoket al., (2007) examined consistency and its importance in e-CRM. According to them consistency implies treating customers in the same way - before, during and after the purchase. This includes consistency in providing price quotes, timely and accurate information for products and their availability, products variety, guarantees, safety and fraud protection, and so forth. The scholars make a distinction between consistent treatment and positive treatment. They clarify that a company can treat its customers differently and still achieve high customer satisfaction.
Both being and not being consistent has its rationales, which makes the issue of consistency and its implementation so difficult. Ozok and his colleagues (Ozoket a/., 2007) provide proofs with their research that people expect to be treated equally-fairly and receive equal level of good service. However, as the scholars note, there is a positive effect in the non-consistent (non-equal) treatment. This can be explained with the fact that people like to be addressed and recognised as individuals and be provided personalized service and shopping experience. This places a dilemma for companies of whether to implement consistency in their e-CRM or rather stay on the other side, providing tailored service for each customer.
4. Methodology The researcher adopted conventional content analysis using secondary sources. Content analysis is a widely used qualitative approach. Conventional content analysis is when the researcher code directly from the text data (Hsieh and Shannon 2005). These sources consist of published documents such as journal articles, books and online sources that arc relevant to e-CRM and the challenges organisation face while implementing it. Information obtained through these sources was carefully assessed so as to find its relevance and importance to the area being researched. The issue of population and sample are of less concern since we adopted the use of conventional content analysis as suggested and used by Scull ins ct al (2002), Alim&Ozuew (20 14) and Grover (20 1 1 ).
5.1 Results and Discussions The most iterated challenges of.managing e-CRM are security, consistency, managing channels, the huge database, thus this section analyses these challenges and how they affects organisations.
5.2 Security Security is an essential part of doing business on the internet. Hence, as stated earlier, it would be of great concern if a company has low level of security. Thus, low security levels can result in losing trust in the company and consequently losing current or potential customer and sales.
According toGottshalk (2000), security should be ensured in several areas, one of which should be the security of information shared between the company and the customer. This information could comprise of card details, transaction details and other financial or personal information that should remain confidential. This area is very important for customers as proved by Ozoket al. (2007) research on
Abu) a Joumal of Business and Management Vol./, Issue I [73-80], Marcll-2015 www.abujajournalofbusinessandmanagement.org.ng Page 76
Effect of Electronic-Customer Relationship Management (e-CRM) on Business Organisations
customer perception and behaviow-. The issue for security comes from one of the main characteristics of ecommerce, namely the missing face-to-face interaction with the company. This makes customers more cautious when it comes to pw-chasing online, especially if it is an unfamiliar or new cpmpany (website). That is the reason companies need to make sure they provide the needed safety for their customers and also have perceived reputation as a trustworthy company. Or, as Scullinset al. (2002) state, a company should inspire trust in the mindset of their customer that their company is secured. This is done through the use of authentication, non repudiation, automated clearing house or 1 28 bit data encryption.
From a company's perspective, security of the network and the programming model is also very essential. Without securing their website, these could leave the company vulnerable to hackers and phishing (look alike site). Based on a study by Meridien, fraud detection technology has slashed two thirds of internet fraud (Scullinset a/., 2002). Thus, it is necessary for companies to get this technology so as to secure not only information shared but the network and programming model. Security issues could make customers lose confidence in the company and make them switch to another company since the cost of switching in online environment is very low. It is easy to switch with a click.
Even though companies provide secure environment for transaction, they still point out the risks associated with transacting with them.Amazon, an internet shopping company provides a list of potential security issues for their customers so as not to be tricked by fraudsters (www.amazon.co.uk). This shows the concern of the company for their client and provokes their awareness and self-care to be cautious when purchasing online (despite the security provided by the website). Again, this involves customers in the process of protecting and securing their online experience. This point out that security would still continue to be an issue for both customer and company even after providing facilities to reduce or prevent them.
5.3 Consistency Consistency is a less explored part of e-CRM and it is a challenge for most companies to consider when it comes to treating their customer. Consistency has to do with treating customers in the same manner for all company's activities. It is necessaty for companies to understand that treating a customer in a fair or positive manner does not prove that a company is consistent (Ozoket a/. , 2007).
Companies may choose to be fair to all customers but in a different manner, meaning not consistent. Ozoket al (2007), present a guideline for companies to follow if they choose to be consistent. This guideline has to do with being consistent in presenting promotion, providing accurate and timely "in stock" information, equal amount of protection, equal guarantees and a consistent return policies. The main question for companies is whether they need to be consistent in all of their activities or not. This decision is important because of its future impact on customers. Some customers expect to be treated equally fairly while others may choose to be treated differently, in a more personalised manner.
Any strategy a company chooses may tend to be successful. However, it is necessary for companies to consider being consistent in providing some activities. Secw-ity, as discussed, is very important for the success of the company, as such it is important for the company to provide equal protection for all their customers, inespective of what is offered to the customers.
Bradshaw and Brash (200 1 ) posit that rather than being uniform (consistent) as a misconception, a company should provide an actively managed consistency. This, as argued above means the company may choose to be consistent in providing some activities but might choose to be different in others.
5.4 Managing channels Treating the web as the only channel fo( conducting customer relations is an important area companies need to consider. As pointed out earlier companies need to put in effort both in front and back office functions. This would create more touch points for the company to gather more information and reach more customers. Furthermore, some customers are still more comfortable with the brick-and-mortar companies. Hence, companies may need to consider that some customers would prefer to be contacted through other non electronic channels.
Ahuja Joumal of Business and Management Vol. /, lssue I [73-80], March-201 5 www.abujajournalofbusinessandmanagement.org.ng Page 7 7
E.ffecl of Eleclronic-Cuslomer Relalionship Managemenl (e-CRM) on Business 01ganisa1ions
Scullinset al., (2002) mention that companies conducting business online require the use of e-CRM for managing their customers who are online. However, Aileen (2006) asserts that it is advisable for companies {both small and large) to treat their customers through what_cvcr channel they prefer. This would create a better customer relationslllp between customers and company. All comparues (small and large) should find means of reaching and managing their customer's through the channel which is most appropriate to them and their customers.
5.5 Database Another challenge for e-CRM is the processing, management and cost of handling the huge database. This database helps a company in understanding the behaviour of their customers and what to expect from them. However, this technology might lack the human experience and knowledge to recognise what is important and what is not. This could account for the huge data being collected. The cost of archiving this data is a challenge, but from a customer point of view, the huge database cause alarm for privacy issues. The software company was gathering far more personal data about their customers than what the company communicates to its customers. Although, this is basically an investigation, customers are wary on what data the software gathers and to what the company is using their personal data for. It is necessary for companies not only to make it clear on the data being gathered by them, but also what this data is to be used for. Tills would ease customers concern in relation to the amount ofinf01mation required from them.
5. 6 Employee training and retention Training is an important aspect for employees because it helps in coping with the fast changing technology. Although, training might be costly for companies, it is essential for both the company and its employees in order to be abreast. Retention of employees also becomes a challenge for companies after the employees are trained. In a research cited in Notes and News (2003) i t was noticed that a lot of employees after being recruited and trained, were leaving the job in less than four years. This prompted P.A Consulting Group to research on how to reduce the number of turnover. This was done and achieved by training of the employees and also by giving them the oppmtunity to develop through mentoring, coaching, learning through deputising and so forth.
The findings of this study conforms with the contribution of Scullins et al (2002), Ozok et a! (2007), Fje1mestad& Romano (2003 ), A lim, &Ozuew (20 1 4 ),Harrigan et a! (2009), Bradshaw & Brash (200 1 ) .
6.0 Conclusion and Recommendations 6.1 Conclusion The internet is fast becoming the only shop for most companies. With statistics showing about $ 1 .298 trillion, it is evident that companies need to adapt to this fast changing phenomena. Thus managing these large databases of customers needs technology; as such companies need CRM but even much better eCRM. e-CRM is viewed by many as a management approach by using technology which enables organisations to retain, acquire new customers. The advantages of these technologies include customer's ability to access a company's information from any part of the world, make complaints and make payments to these companies.
The most iterated challenge of e-CRM is security; customers find it very difficult to trust a new company or even an established company because of the information shared. Theft, fraud and Phishing are the major concerns for customers as regards to sharing their information even if it is a secured platform. It is necessary for companies to handle the scepticisms of customers in safeguarding their information so as to have a perceived reputation as a trustworthy company, as a result making their customers to retain their services with the company and also acquiring new customers. It is important to note that even with this a lot of customers might still be sceptical; another strategy could be assuring customers that any information that is not properly guided against either theft or fraud by the company, it will take full responsibility. Managing customer through multiple channels is a better alternative than through just one channel. So to have more outreach to their customer; companies need to put in more effort in using other channels to manage their huge customer database.
Ahuja Joumal of Business and Managemenl Vol. !, Issue I [73-80]. March-201 5 www.abujajournalofbusinessandmanagement.org.ng Page 78
Effect of Electronic-Customer Relationsh ip Management (e-CRM) on Business Organisations
From the findings of the research it was also shown that e-CRM can be cost effective for both small and large companies in terms of reduced human resources and large customer coverage. Also, information shared between companies and sustomers is faster. It was also established from the discussion tl}at c-CRM alone is insufficient in managing customer relatiOn. It needs to be complemented With other channels such as face-to-face and telecommunication interface.
Recommendations As a result of the conclusion reac'hed, the following recommendations are raised:
1 . Companies should not only secure their network and the information shared but also instil trust among their customers while communicating the potentia"] risk associated in transacting with them
2 . Consistency should be provided i n an actively managed way by providing some activities such as security, presenting promotion, timely and accurate in-stock information in a consistent manner while choosing to be different in others
3 . Companies should communicate to customers the purpose for which data i s collected about them. This would ease customers' concern about the amount of information acquired from them by the company
4. Companies should find the means of reaching and managing their customers through channels that is most appropriate for them (customers)
5 . For large organisations operating online, the best way o f managing customers should not only be through e-CRM, but i t i s necessary to have a non-electronic customer touch point as well.
6 . For small companies operating online who have a small budget, they should stick to managing customers through electronic channel as it will be more cost effective.
References Aileen, K. 2006. Electronic customer relationship management (E-CRM) opportunities and challenges in
a digital world. Irish marketing review 1 8 ( 1 &2), 59-68. Alim, S. and Ozuew W. 2014.The influences of e-CRM on customer satisfaction and loyalty in the UK
mobile industry.Journal of applied business and.finance resources 3:2,47-54 Amazon Official UK Website. (Feb 2009). Changes to the privacy notice. [Online] Available at:
http://www.amazon.co.uk/gp/help/customer/display.html/ref=hp In sp pn/?nodeld=502584 Accessed on 5'h September 20 10.
Batchford, C. (2003).Information, security, business and the internet part 1 & 2, Network security 2000( 1 ), 8- 1 2 .
Bergeron, B . 2002.Essential of CRM: a guide to customer relationship management, New York: Jolm Wiley & Sons Ltd.
Bradshaw, D. and Brash, C. 200 1 . Managing customer relationship in the E-business world: how to personalise computer relationship for increased profitability.International journal of retail and distribution management 29( 1 2), 520-529.
Buttle, F. 2009.Customer relationship management: concepts and technologies, Oxford, UK: Elscveir Ltd.
Chou, J. and Lee, K.H. 2008. Perception to E-shopping.: a cross cultural study.Journal of fashion marketing management, 7 ( 1 ), 49-64.
Grover, D. (20 1 1 ) . Effective customer relationship management thcmy E-CRM, Viewpoint 2: I . eMarketer., 2013, B2C world growth of sales. www.emarketcr.com accessed on 29'h October, 201 3 .
Feinberg R.A, Kadam, R., Hokama, L., Kim, I . 2002.The state of electronic customer relationship management in retailing.International journal of retail and distribution management, 30( 1 0), 470-48 1 .
Fjermestad, J . and Romano Jr N.C. 2003 . Electronic customer relationship management.Business process managementjournal, 9(5), 572-5 9 1 .
Gottshalk, K . 2000, Web services architecture review, the next stage of evolution for E-business, www-106.ibm.com.
Ahuja Journal of Business and Management Vo/.1, Issue I [73-80]. March-20 15 www.abujajournalofbusinessandmanagement.org.ng Page 79
Effect of Electronic-Customer Relationship Management (e-CRM) on Business Organisations
Harrigan, P., Ramsey, E., Ibbotson, P. 2009. Investigating the E-CRM activities oflrish SMES.Journal of small business and enterprise development, 1 6(3), 443-465.
Hsieh, H .F and Sharynon S.E 2005. Three approaches to Qualitative content analy,sis, Qualitatil•e Health Research15 l277-128R
I n t e r n e t W . S . , 2 0 1 3 . I n t e r n e t u s a g e s t a t i s t i c s , t h e i n t e r n e t b i g picture,http://www.intemetworldstats.com/stats.htm accessed on the 29th October 2013 .
Kotler, P., Armstrong, G., Wong, V., Saunders, J . (2008).Principles of marketing, 5'h edition, UK: Pearson education Ud.
·
Notes and News (2003). Training helps to solve retention. Journal ofEuropean industrial training, 27 (5). Ozok, A.A., Oldenburger, K., Salvendy, G., (2007).Impact of consistency in customer relationship
management on E-commerce shopping preference.Journal of organisational computing and electronic commerce, 1 7( 4), 283-309.
Pan, S.L and Lee, J.N. 2003. Using E-CRM for a unified view of the customer. Communication of ACM, 46(4), 95-99.
Festa, P. 2000. Despite legal problems, Amazoh stands by e-commerce deals, CNET news 2"d May, Available at: http://news.cnet.com/Despite-legal-problems,-Amazon-stands-by-e-commerccdeals/2 1 00- l O l 7 3-239997.html accessed on4'h September20 1 0.
Scullins, S., Allora, J., Lloyd, G.O, Fjennestad, J., (3-5 April. 2002).Electronic customer relationship management benefits, consideration, pitfalls and trends, Paper presented at IS one world c o n fe r e n c e . L a s V e g a s N e v a d a . R e t r i e v e d 2 5 ' h A u g u s t , 2 0 1 0 , frornhttp://web.njit.edu/�jen:y/Research/Scullin-ISOneWorld-2002.pdf
Srinivasan, S. 2004. Role of trust in E-busincss success .Information management and security, 12( l ), 66-72.
Winer, R.S., 200 1 . A fi·amework for customer relationship management. California management review. 43(4), 89-1 05.
Ahuja Joumal of Busi11ess a11d Ma11ageme111 Vol. /, fsSlle I [7 3-80}. Marc/r-20 15 www.abujajournalofbusinessandmanagement.org.ng Page 80

Principals' Transformational Leadership Behaviour and Teachers' Commitment to Duty in Public Schools in Borno State, Nigeria .
Dr. Zaifada, B.I ' , Dr. Hauwa Mohammed2 & Dr. Gabadeen, W.03 Department of Educational Management, Faculty of Education, University of Abuja, Gwagwalada-Nigeria
Abstract: This paper examined Principals ' Leadership Behaviour (PLB) and Teachers' Commitment to Duty (TCD) as correlates of transforming public senior secondary schools in North-East geo-political zone, Nigeria. The study adopted correlation research design. Four research questions were answered and two hypotheses were tested. The modified version of Leader Behaviour Description Questionnaire (LBDQ) of Halphin (1966) and Organizational Commitment Questionnaire (OCQ) of Porter (1974) were used for data collection. The population for the study comprised all the 3035 teachers and the 79 principals in Barno state public senior secondary schools while 40 princ ipals and 570 teachers randomly selected participated in the study. The data were computed and analyzed using means, percentages, ANO VA and Spearman 's Rho correlation and the results revealed among others that,· teachers ' perceived principals to be exhibiting initiating structure behavior (47.5%), principals ' perceived themselves to be exhibiting consideration behaviour (53. 5%), teachers were committed to their duty (7 4. 6%) but there are variations in the teachers' commitment associated with principals ' leadership behavior. It was therefore recommended that,- combination of consideration and initiating structure leadership behavior should be largely demonstrated by the principals' to enhance teachers ' commitment to duty for the transformation of public senior secondary schools in the zone. Keywords: Leadership Behavior, Teacher Commitment, Transformation, Public Senior Secondary School.
1. Introduction The administrator of a school perf01ms the administrative functions of planning, organizing, directing, controlling, and coordinating, as a leader he must possess ce1tain qualities to be able to perform effectively (Duze, 20 1 2) . Such qualities include maturity, intelligence, and initiative, sense of judgment, emotional stability, decisiveness, dependability, and high degree of personal integrity (Oyedeji & Fasasi, 2006). His ability to lead effectively therefore affects the tone of the school. Bush (20 1 1 ) opined that leadership means influencing others' actions in achieving desirable results .Leaders according to Bush (20 1 1) are people who shape the goals, motivation, and actions of others. Frequently they initiate change to reach existing and new goals. Leadership is the ability to influence a group toward the achievement of goals. It is a process by which a person influences others to accomplish a mission, task, or objectives and directs the organization in a way that makes it more cohesive and coherent (Clark, 1 993).
Oluremi (2008) stressed that the importance of the role of principals on the school organization cannot therefore be over looked. In the school system, the principal as an administrator influences his teachers to achieve the goals and objectives of the school. The fundamental goal of the school is to enhance the teaching and learning process. Hence the school administrators should endeavour to influence the behaviour of the teachers in order to achieve the goals of the school. Transformational approaches to leader-ship have been advocated for effective management of the school system. Cohen, Frick, Gadon and Willits ( 1 995) noted that transformational leader is the leader who inspires people to excel and articulates meaningful vision for the organization. A leader acts in both formal and informal ways to build employee commitment in the organization. Transforming leadership is viewed as ultimately becoming moral because it raises the level of human conduct and ethical aspiration of both the leader and the led, thus having a transforming effect on both (Hon1rig, 200 1 ).
Homrig (200 1) pointed out that the way leaders influence followers is based on their shared sense of what is imp01tant, worth doing well, and expending energy on it. In a sense the more significant the endeavor, the more the undertaking itself takes on an importance greater than either the follower or leader. Such leadership occurs when one or more persons engage with others in such a way that leaders and followers raise one another to higher levels of motivation and morality.
Abu} a Journal of Business and Management Vol. /, Issue I [8/-88]. March-2015 www.abujajournalofbusinessandmanagemenr.org.ng Page 8 1
Principals' Transformational Leadership Behaviour and Teachers' Commitment to Duty in Public Schools in Bomo State, Nigeria
K.hasawneh, Omari and Abu-Tineh (20 12) explained that transf01mational lcadership is concerned with the process of how certain leaders are able to inspire their followers to accomplish more than is usually expected of them by stimulating higher level needs; behaving in ways that make other� want to trust, respect and admire them; empowering employees to transcend their own self- interest for the good of the organization; creating an atmosphere in which followers are compelled to be more productive and by giving meaning to organizational life. Consequently the success of educational administrators depends on their effectiveness as well as the effectiveness of the classroom teachers. Effective leadership behaviour creates inspiring 'and stimulating climate for the group so that they can enjoy a high level of morale and are motivated to receive new ideas and are always ready to venture into new goals (Nadeem and Mudasir, 201 2). Nadeem and Mudasir (20 12) were emphatic that the behaviour of a leader is the inspiring force that begets healthy climate, high morale and motivation for the receptivity of new ideas for taking the organisation to higher and still higher plane.
Babayemi (2006) in Ekundayo (20 1 0) pointed out that the behaviour of leaders has been identified as one of the major factors influencing the productivity of subordinates in any organization in which the school system is not an exemption. Ekundayo (20 1 0) remarked that without leadership, an organization can best be described as a scene of confusion and chaos. According to the author, when leadership in an organization is effective, there is progress, but when the leadership is defective, the organization declines and decays. Therefore, principal's leadership behaviour has a significant relationship with teacher commitment to duty.
1 .1 Objectives ofthe Study The study was designed to achieve the following objectives: 1 . To identify the leadership behaviour of school principals in Borno State as opined by the teachers
and Principals. 2 . To find out how these behaviours relate to teacher commitment. 3. To establish whether significant difference exists among the leadership behaviour and Principals
teaching and administrative experience and their qualification.
1.2 Statement of the Problem Leadership behaviour of principals goes a long way in creating a favorable climate that makes the teachers committed to their job. It has been observed during a preliminary survey that there were cases of frequent transfer and indiscriminate appointment of principals in the State. No consideration was given to the importance of leadership qualities which are developed as the teachers become experienced on the job. Borno state is one of the educationally backward states in terms of academic achievement. There are many causes of this poor performance, one of which is lack of qualified teachers. However, even if all the teachers needed are available, their non- commitment to duty as a result of poor leadership behaviour would not change students' performance for the better. Leadership has been strongly emphasized in the literature (Peretomodc 200 1 , Undcozor 2004, Petemotode ( ed) 2007, and Ovwigho) to be a very important factor in determining school effectiveness. This fact does not seem to be true in Borno State where several issues indicate clearly that school heads are appointed not based on their qualification, experience and competence. This unhealthy practice is contrary to the general consensus among scholars, particularly in the field ofSchool administration, that no one else influences the School like, or more than the principal.
Appointment of principals in Borno State has been an issue of concern to scholars of educational administration. The experience as a teacher is not considered in the selection. The method of appointing principals for reasons of what is referred to as geographical spread has often led to the selection of inexperienced and incompetent persons to fill such very important positions in the school. Leadership qualities are developed in the process of \.\;Orking. Inexperienced teachers are not likely to have the required leadership qualities that would enhance good leadership in the Schools. Nwagwugwu ( 1 990) while showing her concern for the quota system of appointing principals advises that appointment of school heads should be based on merit qualification and competence rather than on political consideration to ensure that the huge investment being made in Secondaty education yields qualitative education. The problem of this study was to find how the principals' leadership behaviours relate to teacher commitment to their duty in the Borno state.
Abuja Journal of Business and Management Vol./, Issue I [81-88}, March-2015 www.abujajournalofbusinessandmanagement.org.ng Page 82
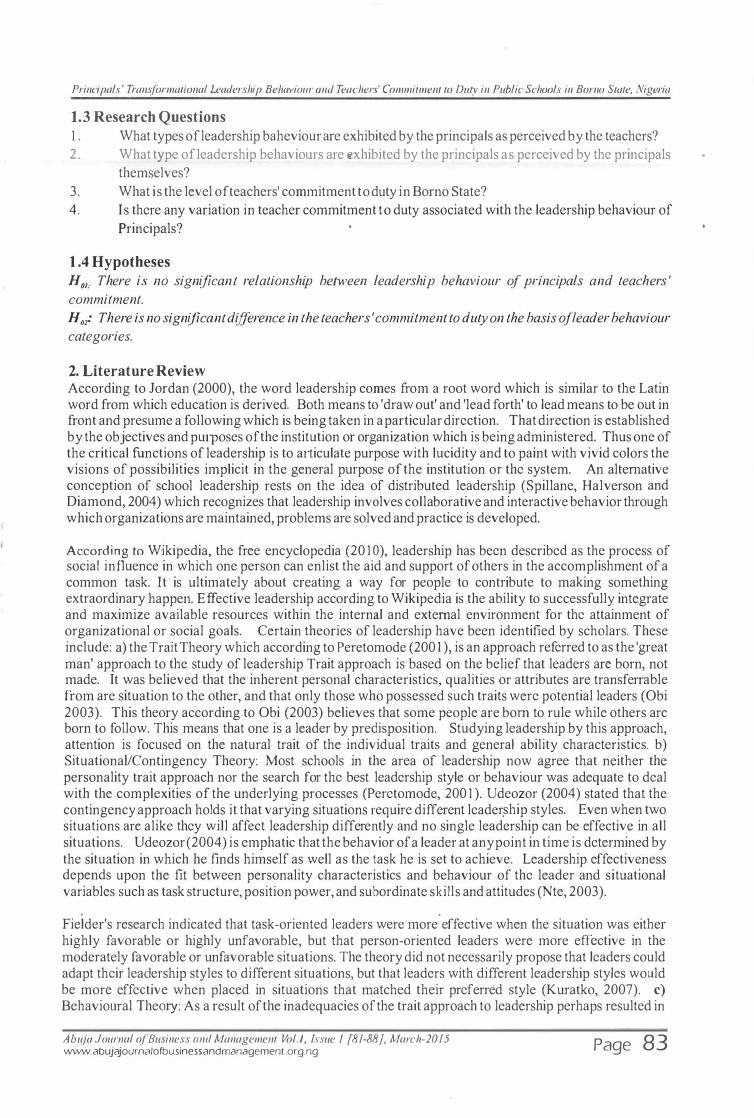
Principals ' Transformational Leadership Behaviour and Teachers' Commitment to Dury in Public Schools in Borno Stale, Nigeria
1.3 Research Questions 1 . What types ofleadership baheviour are exhibited by the principals as perceived by the teachers? 2. What type ofleadership behaviours are exhibited by the principals as perceived by the principals
themselves? 3. What is the level of teachers' commitment to duty in Borno State? 4 . Is there any variation in teacher commitment to duty associated with the leadership behaviour of
Principals?
1 .4 Hypotheses H01, There is no significant relationship between leadership behaviour of principals and teachers ' commitment. H02: There is no significant difference in the teachers ' commitment to duty on the basis of leader behaviour categories.
2. Literature Review According to Jordan (2000), the word leadership comes from a root word which is similar to the Latin word from which education is derived. Both means to 'draw out' and 'lead forth' to lead means to be out in front and presume a following which is being taken in a particular direction. That direction is established by the objectives and purposes of the institution or organization which is being administered. Thus one of the critical functions of leadership is to articulate purpose with lucidity and to paint with vivid colors the visions of possibilities implicit in the general purpose of the institution or the system. An alternative conception of school leadership rests on the idea of distributed leadership (Spillane, Halverson and Diamond, 2004) which recognizes that leadership involves collaborative and interactive behavior through which organizations are maintained, problems are solved and practice is developed.
According to Wikipedia, the free encyclopedia (20 1 0), leadership has been described as the process of social influence in which one person can enlist the aid and support of others in the accomplishment of a common task. It ' is ultimately about creating a way for people to contribute to making something extraordinary happen. Effective leadership according to Wikipedia is the ability to successfully integrate and maximize available resources within the internal and external environment for the attainment of organizational or social goals. Certain theories of leadership have been identified by scholars. These include: a) the Trait Theory which according to Peretomode (200 1 ), is an approach referred to as the 'great man' approach to the study of leadership Trait approach is based on the belief that leaders arc born, not made. It was believed that the inherent personal characteristics, qualities or attributes are transferrable from are situation to the other, and that only those who possessed such traits were potential leaders (Obi 2003). This theory according to Obi (2003) believes that some people are born to rule while others arc born to follow. This means that one is a leader by predisposition. Studying leadership by this approach, attention is focused on the natural trait of the individual traits and general ability characteristics. b) SituationaVContingency Theory: Most schools in the area of leadership now agree that neither the personality trait approach nor the search for the best leadership style or behaviour was adequate to deal with the complexities of the underlying processes (Peretomode, 200 1 ). Udeozor (2004) stated that the contingency approach holds it that varying situations require different leader.ship styles. Even when two situations arc alike they will affect leadership differently and no single leadership can be effective in all situations. Udeozor (2004) is emphatic that the behavior of a leader at any point in time is determined by the situation in which he finds himself as well as the task he is set to achieve. Leadership effectiveness depends upon the fit between personality characteristics and behaviour of the leader and situational variables such as task structure, position power, and subordinate skills and attitudes (Nte, 2003).
. . Fielder's research indicated that task-oriented leaders were more effective when the situation was either highly favorable or highly unfavorable, but that person-oriented leaders were more effective in the moderately favorable or unfavorable situations. The theory did not necessarily propose that leaders could adapt their leadership styles to different situations, but that leaders with different leadership styles would be more effective when placed in situations that matched their preferred style (Kuratko, 2007). c) Behavioural Themy: As a result of the inadequacies of the trait approach to leadership perhaps resulted in
Ahuja Joumal of Business and Management Vol./, ll·sue I [81-88], March-20 15 www.abujajournalofbusinessandmanagement.org.ng Page 83
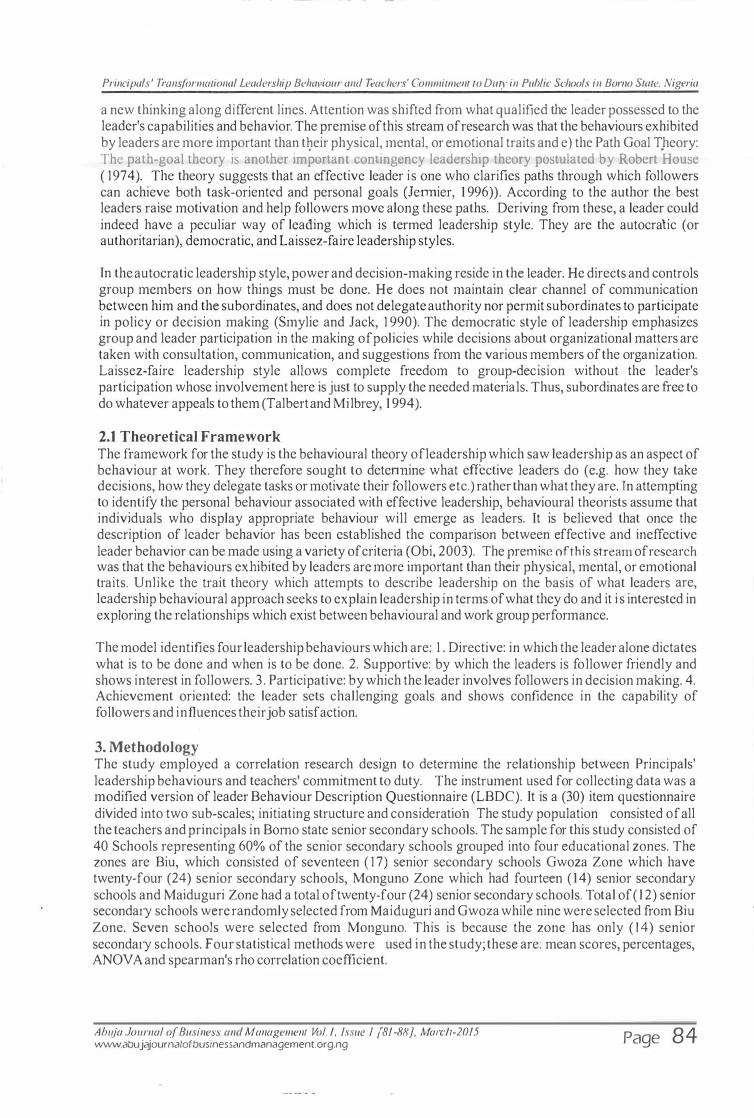
Principals' Transformalional Leadership Behaviour and Teachers' Commilmenl lo Duly in Public Schools in Bomo Swle, Nigeria
a new thinking along different lines. Attention was shifted from what qualified the leader possessed to the leader's capabilities and behavior. The premise of this stream of research was that the behaviours exhibited by leaders are more important than t�eir physical, mental, or emotional traits and e) the Path Goal T.heory: The path-goal theory is another important contingency leadership theory postulated by Robert House ( 1974). The theory suggests that an effective leader is one who clarifies paths through which followers can achieve both task -oriented and personal goals (I ennier, 1 996) ). According to the author the best leaders raise motivation and help followers move along these paths. Deriving from these, a leader could indeed have a peculiar way of leading which is termed leadership style. They are the autocratic (or authoritarian), democratic, and Laissez-fa ire leadership styles.
In the autocratic leadership style, power and decision-making reside in the leader. He directs and controls group members on how things must be done. He does not maintain clear channel of communication between him and the subordinates, and does not delegate authority nor permit subordinates to participate in policy or decision making (Smylie and Jack, 1 990). The democratic style of leadership emphasizes group and leader participation in the making of policies while decisions about organizational matters are taken with consultation, communication, and suggestions from the various members of the organization. Laissez-faire leadership style allows complete freedom to group-decision without the leader's participation whose involvement here is just to supply the needed materials. Thus, subordinates are free to do whatever appeals to them (Talbert and Milbrey, 1 994).
2.1 Theoretical Framework The framework for the study is the behavioural theory of leadership which saw leadership as an aspect of behaviour at work. They therefore sought to detennine what effective leaders do (e.g. how they take decisions, how they delegate tasks or motivate their followers etc.) rather than what they are. In attempting to identify the personal behaviour associated with effective leadership, behavioural theorists assume that individuals who display appropriate behaviour will emerge as leaders. It is believed that once the description of leader behavior has been established the comparison between effective and ineffective leader behavior can be made using a variety of criteria (Obi, 2003). The premise of this stream of research was that the behaviours exhibited by leaders are more important than their physical, mental, or emotional traits. Unlike the trait theory which attempts to describe leadership on the basis of what leaders are, leadership behavioural approach seeks to explain leadership in terms of what they do and it i s interested in exploring the relationships which exist between behavioural and work group performance.
The model identifies four leadership behaviours which are: 1 . Directive: in which the leader alone dictates what is to be done and when is to be done. 2. Supportive: by which the leaders is follower friendly and shows interest in followers. 3 . Participative: by which the leader involves followers in decision making. 4. Achievement oriented: the leader sets challenging goals and shows confidence in the capability of followers and influences their job satisfaction.
3. Methodology The study employed a correlation research design to determine the relationship between Principals' leadership behaviours and teachers' commitment to duty. The instrument used for collecting data was a modified version of leader Behaviour Description Questionnaire (LBDC). It is a (30) item questionnaire divided into two sub-scales; initiating structure and consideration The study population consisted of all the teachers and principals in Bomo state senior secondary schools. The sample for this study consisted of 40 Schools representing 60% of the senior secondary schools grouped into four educational zones. The zones are Biu, which consisted of seventeen ( 1 7) senior secondary schools Gwoza Zone which have twenty-four (24) senior secondary schools, Monguno Zone which had fourteen ( 1 4) senior secondary schools and Maiduguri Zone had a total of twenty-four (24) senior secondary schools. Total of( l 2) senior secondary schools were randomly selected from Maiduguri and Gwoza while nine were selected from Biu Zone. Seven schools were selected from Monguno. This is because the zone has only ( 1 4) senior secondary schools. Four statistical methods were used in the study; these are: mean scores, percentages, ANOVAand spearman's rho correlation coefficient.
Ahuja Joumal of Business and Managemen/ Vol. /, Issue I [81-88], Marc/i-2015 www.abujajournalofbusinessandmanagement.org.ng Page 84
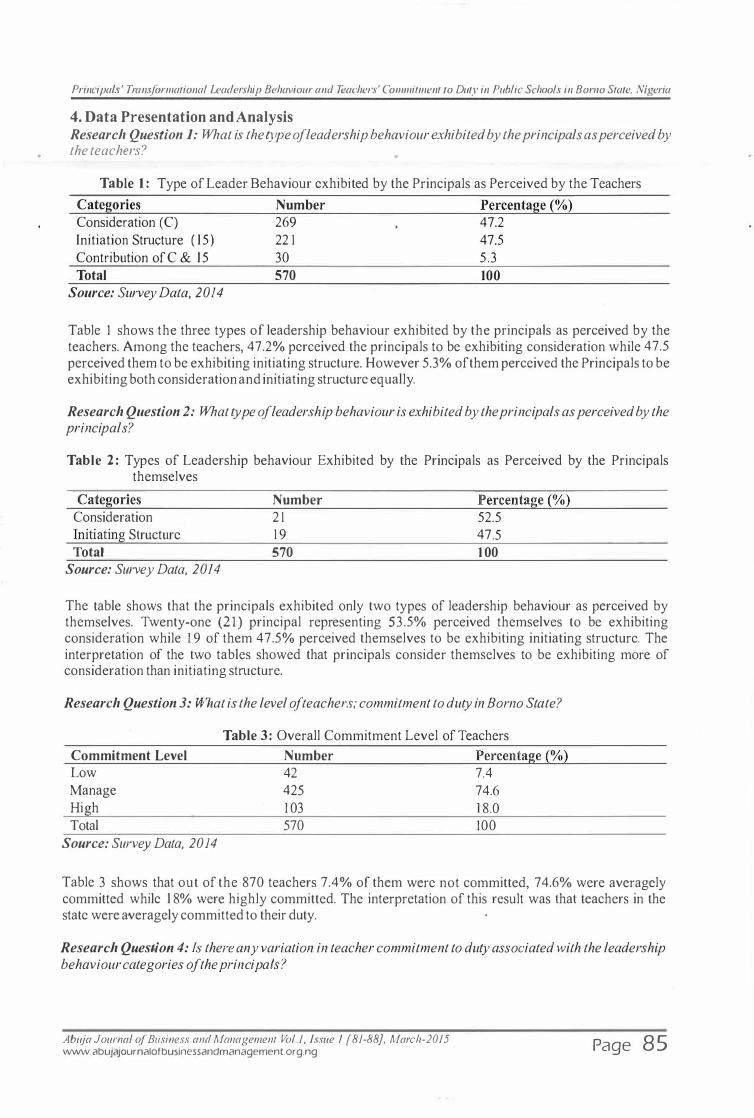
Principals' Transformational Leadership Behaviour and Teachers' Commitment to Duty in Public Schools in Bomo State, Nigeria
4. Data Presentation and Analysis Research Question 1: What is the type of leadership behaviour exhibited by the principals as perceived by the teachers?
Table 1 : Type of Leader Behaviour exhibited by the Principals as Perceived by the Teachers
Categories Consideration (C) Initiation Stmcture ( 15 ) Contribution of C & 15 Total
Source: Survey Data, 2014
Number 269 22 1 30 570
Percentage (%) 47.2 47.5 5 .3 100
Table I shows the three types of leadership behaviour exhibited by the principals as perceived by the teachers. Among the teachers, 47.2% perceived the principals to be exhibiting consideration while 47.5 perceived them to be exhibiting initiating structure. However 5.3% of them perceived the Principals to be exhibiting both consideration and initiating sttucture equally.
Research Question 2: What type of leadership behaviour is exhibited by the principals as perceived by the principals?
Table 2 : Types of Leadership behaviour Exhibited by the Principals as Perceived by the Principals themselves
Categories Consideration Initiating Structure Total
Source: Survey Data, 2014
Number 2 1 1 9 570
Percentage (%) 52.5 47.5 1 00
The table shows that the principals exhibited only two types of leadership behaviour as perceived by themselves. Twenty-one (21) principal representing 53 .5% perceived themselves to be exhibiting consideration while 1 9 of them 47.5% perceived themselves to be exhibiting initiating structure. The interpretation of the two tables showed that principals consider themselves to be exhibiting more of consideration than initiating stmcture.
Research Question 3: What is the level of teachers; commitment to duty in Borno State?
Commitment Level Low Manage Hi h Total
Source: Survey Data, 2014
Table 3: Overall Commitment Level of Teachers
Number Percentage (%) 42 7.4 425 74.6 1 03 1 8.0 570 100
Table 3 shows that out of the 870 teachers 7.4% of them were not committed, 74.6% were averagely committed while 1 8% were highly committed. The interpretation of this result was that teachers in the state were a·veragely committed to their duty.
Research Question 4: Is there any variation in teacher commitment to duty associated with the leadership behaviour categories of the principals?
Abuja Journal of Business and Management Vo/.1, Issue 1 [81-88], March-2015 www.abujajournalofbusinessandmanagement.org.ng Page 85
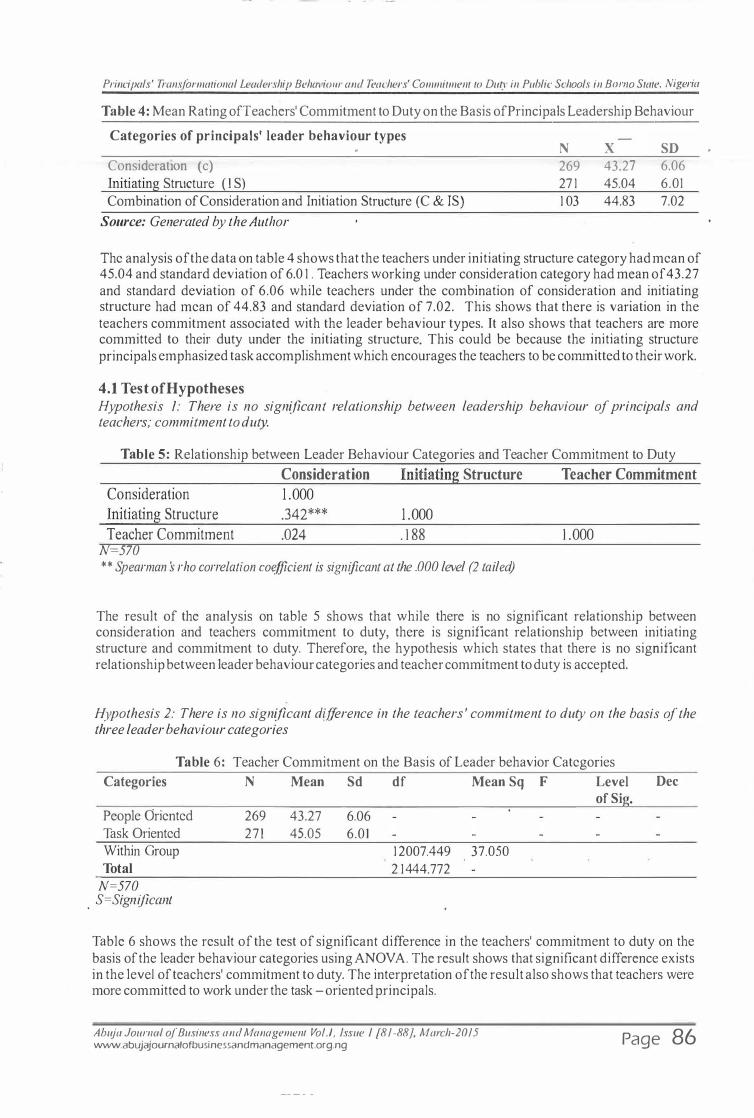
Principals' Transformational Leadership Behaviour and Teachers' Commitment to Duty in Public Schools in Barno State, Nigeria
Table 4: Mean Rating ofTeachers' Commitment to Duty on the Basis ofPrincipals Leadership Behaviour
Categories of principals' leader behaviour types
ConsideratiOn (c) Initiating Structure ( 1 S) Combination of Consideration and Initiation Structure (C & IS)
Source: Generated by the Author
N 269 27 1 1 03
X 43.27 45.04 44.83
SD 6.06 6.01 7.02
The analysis of the data on table 4 shows that the teachers under initiating structure category had mean of 45.04 and standard deviation of 6.0 1 . Teachers working under consideration category had mean of 43.27 and standard deviation of 6.06 while teachers under the combination of consideration and initiating structure had mean of 44.83 and standard deviation of 7.02. This shows that there is variation in the teachers commitment associated with the leader behaviour types. It also shows that teachers are more committed to their duty under the initiating structure. This could be because the initiating structure principals emphasized task accomplishment which encourages the teachers to be committed to their work.
4.1 Test ofHypotheses Hypothesis 1: There is no significant relationship between leadership behaviour of principals and teachers; commitment to duty.
Table 5: Relationship between Leader Behaviour Categories and Teacher Commitment to Duty
Consideration Initiating Structure Teacher Commitment Consideration 1 .000 Initiating Structure .342*** Teacher Commitment .024
N-570
1 .000 . 1 88
** Spearman s rho correlation coefficient is significant at the .000 level (2 tailed)
1 .000
The result of the analysis on table 5 shows that while there is no significant relationship between consideration and teachers commitment to duty, there is significant relationship between initiating structure and commitment to duty. Therefore, the hypothesis which states that there is no significant relationship between leader behaviour categories and teacher commitment to duty is accepted.
Hypothesis 2: There is no significant difference in the teachers ' commitment to duty on the basis of the three leader behaviour categories
Table 6: Teacher Commitment on the Basis of Leader behavior Categories Categories N Mean Sd df Mean Sq F Level Dec
of Si People Oriented Task Oriented Within Group Total
N=570
. S=Significant
269 271
43.27 45.05
6.06 6.01
1 2007.449 37.050 2 1444.772
Table 6 shows the result of the test of significant difference in the teachers' commitment to duty on the basis of the leader behaviour categories using AN OVA. The result shows that significant difference exists in the level of teachers' commitment to duty. The interpretation of the result also shows that teachers were more committed to work under the task -oriented principals.
Ahuja Joumal of Business and Management Vol./, Issue I [81-88], March-2015 www.abujajournalofbusinessandmanagement.org.ng Page 86

Principals' Transformational Leadership Behaviour and Teachers' Commitment to Duty in Public Schools in Barno State, Nigeria
4.2 Discussions ofFindings Transfonnational leadership empowers everyone involved in the process. It involves collaboration and allows leaders to be open to sharing decision making, supervision, and responsibility with members of the organization. Transformational leaders distribute power among others in an effort to get more power in return. This finding is consistent with the expression ofTarter, Hoy, and Kottkamp ( 1 990) that the school principal is the leading factor to teacher commitment. The results from the analysis show that in Bomo state secondary Schools, three Leadership behaviours were exhibited by the principals. These were initiating structure, consideration and combination of the two. The finding as to what types ofleadership behaviours were exhibited showed that in all the schools, the three categories of leader behaviours were exhibited. This is contraty to Halpin ( 1 966) who stated that only two categories existed.
Another interesting finding was that teachers' in Bomo state secondary schools seemed to be more committed under the initiating structure. The general finding is that teachers in the state were averagely committed. Tsui and Cheng ( 1 999) state that principals' being supportive and open to teachers are important for teachers' commitment to their schools. This is clearly consistent with the findings of the study. This negates the general belief that teachers in Borno state are not committed to their duty because they are not satisfied with leadership behaviours of their principals. This finding is in line with the ideas of Tarter ( 1 990) that the school principal is likely to create climate of commitment.
5. Conclusion and Recommendations 5.1 Conclusion This paper concludes that principals' in Borno state secondary schools applied the transformational leadership behaviorus to a small extent and so teachers of these schools are not committed to their jobs. Principal's leadership is an important factor in the success of a school and therefore, they need to be available to assist, support, and encourage the teachers at their schools. Teachers on the other hand also need to know that their efforts are appreciated and acknowledged. Finally, school administrators in Borno state secondary schools require the transformational leadership behaviours so as to achieve the educational goals of the state.
5.2 Recommendations The study recommends that:
I . School administrators in Borno state secondaty schools should be made to go for special training and workshop on transformational leadership behaviours in order to better apply it at school.
2. The administrators should always apply transformational leadership behaviours m the administration of their schools so that the teachers can be committed to their duties.
3 . School principals should create opportunities for teachers to exhibit their skills and knowledge and practices by encouraging cooperation and providing favorable environments for teachers to work.
References Bush, T 20 1 1 , Theories ofeducational leadership and management, 4'h ( ed.) London SAGE Publications. Inc. Clark, B R 1 993, Higher education system: Academic Organization in Cross-National Perspective. Berke
University ofCalifornia Press. Duze, CO 20 1 2, Leadership styles of principals and job performance of staff in secondary schools in
Delta State.of Nigeria. An International Journal of Arts and Humanities, Vol. 1, No.2, pp. 224-245. Retrieved from http:// www.afrrevjo.net on 1 1 August, 2014
Ekundayo, HT 201 0, Principal's leadership behaviour as a determinant of effectiveness of secondary schools in Nigeria. Europan Journal of Educational Studies, Vol. 2, No. 1, pp. 25-30. Retrieved from http://www.ozelacademy.com on 20/ Oct, 20 14.
Halpin, A 1 966, Theory and Practice in administration. New York: MacMillan Company.
Abuja Journal of Business and Management Vol./, Issue I [81-88], March-2015 www.abujajournalofbusinessandmanagement.org.ng Page 8 7
Princ ipals' Transformational Leadership Behaviour and Teachers' Commitment to Duty in Public Schools in Bomo State, Nigeria
Homrig , MC 2001 , Transformational Leadership. http://www.leadership.au.af.mil. House, RJ 1 974, Path-goal theory ofleadership. Contemporary Business, pp. 8 1 -98. Jcrmier, JJ 1 996, The path-goal theory ofleadership: ,;\. subtextual analysis. Leadership
Quarterly, Vol. 7, No. 3. Jiboyawa, DA 1 98 1 , The theoretical appraisal ofleader effectiveness. Education and Development, Vol. 1 ,
No. 2, pp. l 98 - 203. Jiboyawa, DA 1 990, School administration in Nigeria: A theoretical and behavioural approach Lagos:
John West publishing Company. '
Jordan, D 1 973 Re-definition of leadership and its implications for educational administration, pp. 1 -5 . Retrieved from http://www.edpsycinteractive on 1 2 March, 1 3 .
Kuratko, F D 2007, Entrepreneurial leadership i n the 2 1 st centwy Journal of Leadership & Organizational Studies, Vol. 13, No.4, pp. 1 - 1 1 .
Nadeem, N & Mudasir, A I 20 1 2, Research on leadership behaviour of educational administrators - a critical review of literatw·e. Scholarly Journal of Education Vol. 1, No. 2, pp. 20-30, Retrieved from http://www.scholarly-journals.com/SJE on 1 2 Oct, 2014 .
Nwagwugwu, G 1 990, Management of Secondary Schools for quality educations the Anambra State case. In Udo andAkpa G.O ( cds) Management for quality education in Nigeria, NAEAP.
Nte, AR 2003, Economics for management and decision -making in education.Port Harcourt:Minson Nig.Ltd, pp. 198-204
Obi, E 2003, Educational management. Theory and practice. Enugu: Iykazemas International, pp. 4 1 -59.
Oluremi, OF 2008, Principals' leadership behaviour and school learning culture in Ekiti state secondary schools, The Journal oflnternational Social Research, Vol . 1 , No.3.
Ovwigho, YM 2004, Fundamentals of effective management of organization in Nigeria. Benin, Justice Jeco Press Publishing Ltd.
Oyedeji, NB & Fasasi, YA 2006, Dynamics of administrative leadership. In J.B Babalola, A.O.Ayeni, S.O. Adedeji, A.A. Suleman, & M.O.Arikewuyo (eds.). Educational Management: Thoughts and Practice. Ibadan: Codat Publications.
Peretomode, VF 2001 , Educational administration: applied concepts and theoretical perspectives. Lagos: J oga Educational Research and Publication Limited.
Smylie, MA & Jack, WD 1 990, Teachers leadership tension and ambiguities. Organizational Perspectives in Educational Administration, pp. 26-59.
Spillane, JP, Halverson, R & Diamond, JB. 2004, Towards a theory of leadership practice: a distributed perspective. Journal of Curriculum Studies, Vol. 36, No. 1 ,pp.3-34.
Talbert, IE & Milbrey, WM 1 994, Teacher professionalism in local school contexts. America Journal of Education, Vol. 2,pp. 1 23 - 1 53 .
Tarter, CJ, Hoy, W K & Kottkamp, R B 1 990, School health and organizational commitment. Journal of Research and Development in Education, Vol. 23, No. 4, pp. 236-242.
Tsui, KT & Cheng, YC 1 999, School organizational health and teacher commitment: A contingency study with multi-level analysis. Educational Research and Evaluation, Vol. 5, pp. 249-268.
Udeozor, RK 2004, Educational administration: perspective and practical implication: Nimo. Rex Charles and Patrict LTD.
Wikipedia, the Free Encyclopedia, 2 0 1 1 , Organizational structure. Retrived from http://en.wikipedia.org on 2 July, 201 1
Abuja Joumal of Business and Management Vol. /, Issue I [81-88], March-2015 www.abujajournalofbusinessandmanagement.org.ng Page 88
Analysis of Investment Climate Reforms on Foreign Direct Investment (FD!): The Case of Nigeria
Hamza Zubairu Kofarbai (Department of Business Administration, Ahmadu Bello University, Zaria - Nigeria)
Abstract: This study makes an in-depth analysis of the importance of investment climate reforms in Nigeria. It also examines how good policy on in vestment climate facilitates the growth and development of private sector driven economy as well as the impact it will have onforeign Direct Investment (FDI) and cost of doing business in Nigeria. The study problem is centered on two research issues; firstly, policy inconsistency or summersault in investment climateexhibited by successive administration and secondly, the inadequacy of studies on the relationship between investment climate, economic growth, globalization and ICT The study by its nature is descriptive and will employ the use of secondary sources of data. Content analysis was used as the instrument in analyzing the data. The objective of the study is to highlight the various reforms the government of Nigeria has taken over the years in order to make Nigeria a proper investment destination in Africa. The findings have shown that, in Nigeria, the cost of a poor business environment is significant and investment climate constraints add substantially to the cost of doing business. The study concludes that investment climate in Nigeria is still poor, Largely due to infrastructural deficit and administrative bottlenecks which add to the cost of doing business. The paper recommends power supply and financing should be improved, corruptionvigorously tackled and policy inconsistencies stopped in order to attract investors, reduce cost of doing business and increase economic growth. Keywords: Investment Climate Cost of Doing Business, Reforms, Foreign Direct Investment (FDI).
1 . Introduction Nigeria is Africa's most populous nation with an estimated population of over 1 70 million people. It offers investors a low-cost labour pool, abundant natural resources, and potentially the largest domestic market in Sub-Saharan Africa. Despite these advantages, much of the market potential is still untapped and unrealized. Impediments to investment include inadequate infrastructure, corruption, inefficient property registration system, inconsistent regulatory environment, restrictive trade policies, lack of security, slow and ineffective courts and dispute resolution mechanisms (Global trade,20 1 0). For foreign direct investment (FDI) to flow and be sustained in any economy it is important that the investment climate is friendly and conducive for business. Bartholomew (20 1 0) argued that the on-going liberalization and globalization had entrusted the private sector with the economic role of wealth creation and employment generation. This study shares the view that, one cardinal thrust of economic reforms in Nigeria is growing the private sector as the engine of growth and prosperity. However, for the sector to play this role effectively it requires competitiveness of enterprises and enabling environment for investment to strive.
The. Nigerian Investment Promotion Commission (NIPC), created by an act of parliament, act No. l 6 of 1 996, is saddled with the responsibility of overseeing or regulating foreigninvestment. The flows ofFDI can be largely explained by the abrogation of certain laws and subsequent entrenchment of investment friendly laws as well as the introduction of structural reforms (SAP), facilitated the substantial flow of capital. Until 1 986, N igeria did not record any figure on portfolio investment (inflow or outflow) in her balance of payment (BOP) accounts. This was attributable to the non-internationalization of the country's money and capital markets as well as the non-disclosW"e of infmmation on the portfolio investments of Nigerian investors in foreign capital/money markets. · ·
During the past decade Nigeria's manufacturing sector has stagnated as productivity (measured in value added per worker) lagged behind that of many African countries. A UNIDO (2005) study revealed that the productivity ofNigerian workers was only 1 0 percent of Botswana and 50 percent of that in Ghana and Kenya. The deterioration of the manufacturing sector in recent years can be attributed to a number of factors, largely among them, a poor investment climate and low capacity utilization. Average capacity utilization in the manufacturing sector declined from a peak of nearly 80 percent in 1 978 to less than 30
Ahuja Journal of Business and Management Vol./, Issue I [89-99}, March-201 5 www.abujajournalofbusinessandmanagement.org.ng Page 89
Analysis of Investment Climate Reforms on Foreign Direct Investment (FDI): The Case of Nigeria
percent in the 1 990's before rising marginally at the end of the decade. (Giuseppe, Mousley, Ismail &World Bank, 2009).
According to Khan (2002), the current policy consensus is that a good investment climate is characterized by standard good govemance requirements together with the adequate supply of cetiain types of infrastructure, such as electricity, telephone lines, good road, effective and efficient transport system. Good govemance in tum is measured by the stability of property rights and, according to some, the depth
· of democracy and public accountability. The theory is that staole property rights (measured by a number of factors, including a low risk of expropriation and a low level of conuption) induce high investment rates and ensure efficiency in investment allocation, while democracy signals that govemments will not engage in ex- post expropriation (nationalization). These conditions, it is argued, are essential for ensuring rapid economic growth and sustained poverty reduction. These key policy goals, identified in the new consensus on investment climate, are best attained by policies that promote a service delivery state. This is a statethat protects property rights, i s subject to the rule oflaw, does not intervene in markets, and provides key services such as electricity, good roads and telephone lines.
Investment climate reform is the provision of the enabling environment for investment and operational competitiveness of economic agents. It is a deliberate and concerted effort at removing obstacles to investment and growth of firms. The importance of this study will be further amplified by the fact that Nigeria has initiated series of economic reforms and an investment climate reform at this time would maximize as well as sustain the gains so far achieved.
1 .1 Statement ofthe Problem The Federal government of Nigeria has identified the private sector as key to economic growth and development. For that reason, there have been series or a wide range of policy papers as well as researches conducted over the years regarding how to entrench good policies on investment and business environment with the aim of attracting or inducing both local and foreign investors to come to Nigeria and invest. Nigeria as a country, as argued by Adelegan (2000), given her natural resource base and large market size, qualifies to be a major recipient ofFDI in Africa and indeed is one of the top three leading African countries that consistently received FDI in the past decade. However, the level ofFDI attracted by Nigeria is mediocre compared with the resource base and potential need.
The research gap in this study is centred on two research problems; (i) policy inconsistency or summersault by Nigerian government and (ii) the inadequacy of studies on the relationship between investment climate, economic growth, globalization and ICT. Firstly, the issue of policy inconsistency exhibited by successive administrations has resulted in hinderinginvestment flow, especially FDI; which has the multiplier effect of growing the economy. Sub-Saharan Africa has to depend very much on FDI for a number of reasons as amplified by Adelegan (2000). One of the pillars on which the New Partnership for Africa's Development (NEPAD) was launched was to increase the availability of investment capital. The NEPAD initiative was to be raised to US$64 billion through a combination of reforms, resource mobilization and an enabling environment for FDI (NIPC, 2008).
Secondly, the inadequacy of studies on the relationship between investment climate and economic growth, globalization and ·ICT, that has played a crucial role in shaping the way we do business here in Nigeria. One of the most salient features of today's globalization drive is conscious encouragement of cross-border investments, especially by transnational corporations and firms (TNCs). Many countries and continents (especially developing) now see attracting FDI as an important element in their strategy for economic development. This is most probably because FDI is seen as an amalgamation of capital, technology, marketing and management. The impmiance ofFDI can be seen as closing the capital-gap, as the main obstacle facing developing countries like Nigeria t1ying to catch-up with advanced countries. This gap however, is more in knowledge or human capital, than the gap in physical capital.
This study attempts to outline some of the policy inconsistencies and institutional defects that contributed largely to the economic imbalances in Nigeria. It will examine some of the reforms undertaken by successive administrations to address these imbalances. Specifically, the study seeks to provide answers
Abu) a Joumal of Business and Management Vol. !, Tssue I [89-99], March-2015 www.abujajournalofbusinessandmanagement.org.ng Page 90
Analysis of Investment Climate Reforms on Foreign Direct Investment (FDI): The Case of Nigeria
to the following research questions: (i) to what extent can flow ofFDI in Nigeria explain the drive for the growth of private sector investment? (ii) What discernible factor explains impediment to reducing cost of doing business in l'{igeria? (iii) What significant impact has investment climate re(onm on FDI?
1.2 Objectives of the Study The main objectives of the study is to address some major policy reforms that were introduced in order to make doing business in Nigeria as easy as any developed country as the nation strategizes to become one of the 20 greatest ec'onomies by the year 2020. The specific objectives are to: '
1 . Identify the various regimes of investment policies in attracting FDI in Nigeria. 2. Determine areas that act as impediments to reducing cost of doing business in Nigeria. 3 . Assess the impact ofinvestment climate reforms on FDI.
2. Literature Review 2.1 Theoretical and Conceptual Framework Literature on investment climate reform is scanty. This is mainly because it was not until recently that policymakers and multilateral organizations began to emphasize the need for sound investment climate for promoting economic growth in developing countries (Stem, 2002). Previously, emphasis on investment as an engine of growth focused on the quantity rather than quality of investment under the assumption that a fmancing gap was the barrier to growth. This view has been criticized as too simplistic (Bangladesh Enterprise Institute and the World Bank, 2003).
Soludo (2004) opined that for Nigeria, investment is negatively associated with growth. Though, Soludo's conclusion in the opinion of the researcher looks somehow myopic, because forevery investment decision a country undertook, the aim is to accelerate the growth rate of its economy; and for Nigeria that has been translated recently by rebasing its GDP which saw it as the biggest economy in Africa overtaking that of South Africa.
The literature reviewed highlighted some of the notable refonns the government ofNigeria has instituted with the sole aim of making investment climate in Nigeria an investor friendly and the final destination in terms of investment in Sub-Saharan Africa taking into consideration Nigeria's population (which translate to a bigger market oppmtunities), abundant human and natural resources as well as an emerging economy (in view of projections to be among the 20 industrialized economies by the year 2020).
2.2 Concept oflnvestment Climate The Nigerian government embarked on a medium-term economic reform program in late 2003 called the National Economic.Empowerment and Development Strategy (NEEDS) for 2003-2007. NEEDS focused on privatization, good governance, macroeconomic stability, anti-corruption, and public service reforms. NEEDS has been modified to incorporate Vision 20:2020 which comprises; Seven Point Agenda and transformation agenda, of the present administration, which focuses on power and energy, food security and agriculture, wealth creation and employment, mass transportation, land refmm, security, educational reforms and economic transformation which all form the basis of good investment climate. A robust investment reforms and friendly laws will send a signal to the international and local business investors that the country i s improving its investment anq business climate horizon which will attract foreign direct investment. Investors generally, will invest their money where they felt their investment is guaranteed and protected and with a high degree of expected return.
Investments according to a Keynesian terminology simply refer to real investment which adds to capital equipment. It leads to increase in the level of income and production by increasing the production and purchase of capital goods. Investl1'1ent thus includes new plant and equipment, construction of.public works like dams, roads, and building among others, net foreign investment, inventories, stock and shares of new companies. Joan Robinson (as cited in Jhinghan, 20 1 2), defines investment as an addition to capital, such as when a new house is built or a new factory is built. Investment means making an addition to the stock of goods in existence. To be more precise, investment is the production or acquisition of real capital assets during any period oftime. From Finance point of view; investment is simply putting money in a financial asset with the aim of capital appreciation, dividend or interest rate.
Abuja Joumal of Business and Management Vol. /, issue I [89-99}, March-20 15 www.abujajournalofbusinessandmanagement.org.ng Page 9 1
Analysis of Investment Climate Reforms on Foreign Direct investment (FDJ): The Case of Nigeria
Investment could also be induced or autonomous (Joan, 20 1 0). Induced investment is profit or income motivated. Factors like prices, wages and interest change which affect profits and influence induced invest1pent. Autonomous investment is independent of the level ofins:ome and is thus income inelastic. It is influenced by exogenous factors like innovations, mvent10ns, growth of population, war, revolution, labour force and researches. Autonomous investment is not influenced by changes in demand rather it influences demand. Investment in economic and social overheads whether made by government or the private enterprise is autonomous. Looking at the various investments so far in Nigeria, the researcher is of the opinion that induced investment is what obtained in Nigeria as th'e motive of the investors is to make more profits. Investment climate therefore refers to the environment in which firms of all types and sizes invest and grow. Determinants of this environment can be classified into macroeconomic factors, governance issues and infrastructure (Bangladesh Enterprise Institute and the World Bank, 2003). Given the heterogeneity of firm's behaviour, investment climate reform has also a micro dimension and so covers in addition issues critical to the growth of individual firms. These include human resources, access to finance, among others (BPE, 20 1 0).
According to the World Bank (2005), Investment climate can be defined as about the environment in which firms and entrepreneurs of all types- from farmers and micro-enterprises to local manufacturing concerns and multinationals- have opportunities and incentives to invest productively, create jobs and expand. It consists of location specific factors that shape the enabling environment for firms to invest productively and grow (Smith &Hallward-Driemeier, 2005). Investopedia (20 1 0), see investment climate as the economic and financial conditions in a country that affect whether individuals and businesses are willing to lend money and acquire a stake (invest) in the businesses operating there. The researcher adapted this definition because it largely enumerates those areas that needed to be reformed for investment to flourish. Investment climate is affected by many factors, including: poverty, crime, infrastructure, workforce, national security, political instability, regime uncertainty, taxes, and rule of law, property rights, government regulations, government transparency and government accountability. Therefore good investment climate requires a policy that identifies the precise conditions that make up a good investment climate. Investment climate reform is also the provision of the enabling environment for investmen1 and operational competitiveness of economic agents. It is a deliberate and concerted effort at removing obstacles to investment and growth of firms by a government through a public policy.
The investment climate in Nigeria has recently witnessed a number of reforms being put in place through the regulatory framework to encourage both the inflow of FDI to Nigeria and reduce cost of doing business. In particular, Nigeria's investment regime offers a plethora of incentives including tax holiday, reduced taxes, capital allowances, capitalization of expenditure, import duty rebate (waivers), 1 00% repatriation of and transferability of funds (Oyeranti, Babatunde, Ogunkola, Bankole,20 1 0).
2.3 Constraint to Doing Business in Nigeria Doing Business according to World Bank report (2012), is recording all procedures that are officially required to start-up and formally operate a commercial or industrial small or medium to large-size limited liability Company. These include obtaining the necessary licenses and Permits and completing all required notifications, verifications, and registrations for the company and its employees with the relevant authorities. Institutional baniers to doing business as well as perceived conuption in government are critical determinants of private seetor development and prospects for sustainable growth (World Bank, 20 1 2). Doing Business investigates the regulations that enhance business activity and those that constrain it. Regulations affecting 4 stages of the life of a business are measured at the sub-national level in Nigeria: starting a business, dealing with construction permits, registering property, and enforcing contracts. These indicators are used to analyze economic outcomes and identify which reforms have worked, where, and why (World Bank report, 201 0).
Despite all these reforms the investment climate in Nigeria is largely poor when compared to other neighbouring countries in Africa and some of our peers at the international level. For example the World Bank's Composite Doing Business indicators for 201 0, 20 1 1 , and 20 1 2 ranked Nigeria a t an unsatisfactory 1 08 out of 1 75 world economies. In order to increase private-sector activity, the incorporation requirements must be easy, fast, and inexpensive. Research by World Bank (20 J 2) shows that the number
Abu} a lou mal of Business and Management Vol. /, issue I [89-99}. March-2015 www.abujajournalofbusinessandmanagement.org.ng Page 92
Analysis of Investment Climate Reforms on Foreign Direct Investment (FDI): The Case of Nigeria
of new fi1ms increases and employment grows when business entry becomes easier and all barriers for sound investment removed .
.
2.4 Theoretical Framework The theory of factor mobility has been analyzed as theory of trade using the concept of inter-temporal comparative advantage in production and h·ade. The basis for the cross border factor mobility is the differences in factor endowment, propensity to consume and preference between present and future consumption between or among nations (Oyeranti, et al, 201 0). It is argued that a labour abundant economy may witness unemployment of labour and low real wage which may lead to labour mobility since real wage may be low compared to what obtains elsewhere. It is also argued that a country that possesses a comparative advantage in future production of consumption of goods is one that without international lending and borrowing would have a relatively low price of future consumption as a result of high interest rate. This high interest rate cones ponds to a high return on investment. This means that a high interest rate in the borrowing nation influences the lending nation to divert resources from current production or consumption to lending in order to enhance their economy's future ability to produce or consume. Therefore, resources endowment, market size, real interest rate and wage are major factors determining capital and labour mobility respectively (Oyeranti et al, 201 0).
An important part of capital mobility that has received more attention in research takes the form offoreign direct investment (FDI). It is seen as foreign capital flows in which a firm in one country establishes a subsidiary in another.FDI is characterized by transfer of resources and acquisition of control. Therefore Multinational Corporations (MNC's) have been seen as a vehicle for international capital mobility. The modern theory of multinational enterprise focuses on the analysis of two important issues: the first is the reason why a commodity is produced in two (or more) different countries rather one. This is the issue of location.
The theoretical and empirical analyses of determinant ofFDI flows have been based on two main groups of fal:tors or a combination of the two. These are the pull-factors (demand side factors) and the pushfactors (supply side factors). The pull - factors are those factors that could induce multinational corporations (MNC's) to desire to create or expand their operations overseas. These factors explain why national firms evolve into MNC's, and why they decide to locate their production in another country rather than licensing or exporting (Joan, 20 1 0). On the other hand, push-factors are the host-county specific condition that influences the flow ofFDI. These are factors that attract FDI when the decision to invest out of home country is conceived by the MNC's. Many socio-economic and political factors exist in the host country that determine available business opportunities and potential political risk, and all these influence the decision ofMNC's to locate their activities in a particular country. It can be deduced that pull factors determine which country receives what share ofFDI, while push factors influence the overall size ofFDI (Adelegan, 2000). Among this factors that are commonly cited in the standard economic literature in this area are distance from major markets, market size, infrastructure, labour cost, political stability, effectiveness of legal system, fiscal and tax incentives, interest rate, human capital, openness of the economy to foreign trade and natural resources endowments such as petroleum and other mineral resources. Based on the above, a popular theoretical model that link investment climate with FDI and economic growth is the capital mobility theory (CMT). Therefore, CMT is adopted as the underpinning theory that best suits this study.
3. Research Design The research design of this study is qualitative and descriptive in nature, and content analysis is used in analyzing the data employed. The nature of the study necessitated the use of secondary data. The secondary data were obtained from the records of the Nigerian Investment Promotion Commission (NIPC), World Bank, CBN and National Bureau of Statistics (NBS) in order to ascertain the level of ·
foreign direct investment, cost of doing business and economic performance ofNigeria over the years as a result of investment cl imate reforms embarked upon by the Federal goverrunent ofNigcria.
A buja Journal of Business and Management Vol./, Issue I [89-99], March-20 15 www.abujajournalofbusinessandmanagement.org.ng Page 93
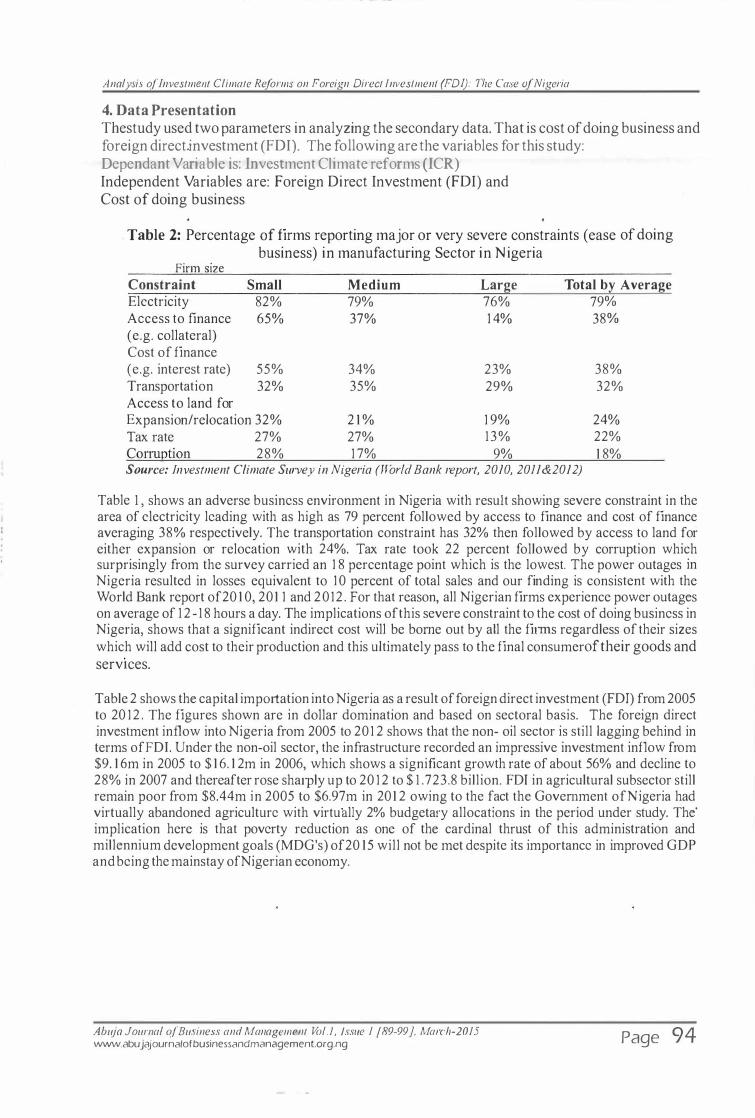
Analysis of Investment Climate Reforms on Foreign Direct Investment (FDI): The Case of Nigeria
4. Data Presentation Thestudy used two parameters in analyzing the secondary data. That is cost of doing business and foreign directinvestment (FDI). The following are the variables for this study: Dependant Variable is: Investment Climate reforms (ICR) Independent Variables are: Foreign Direct Investment (FDI) and Cost of doing business
Table 2: Percentage af firms reporting major or very severe constraints (ease of doing business) in manufacturing Sector in Nigeria
Firm size Constraint Small Medium Large Total by Average Electricity 82% Access to finance 65% (e.g. collateral) Cost of finance
79% 37%
76% 1 4%
79% 38%
(e. g. interest rate) 55% Transportation 32%
34% 35%
23% 29%
38% 32%
Access to land for Expansion/relocation 32% 2 1 % 1 9% 24% Tax rate 27% 27% 13% 22% Corruption 28% 1 7% 9% 1 8% Source: Investment Climate Survey in Nigeria (World Bank report, 2010, 2011&2012)
Table 1 , shows an adverse business environment in Nigeria with result showing severe constraint in the area of electricity leading with as high as 79 percent followed by access to finance and cost of finance averaging 38% respectively. The transportation constraint has 32% then followed by access to land for either expansion or relocation with 24%. Tax rate took 22 percent followed by corruption which surprisingly from the survey carried an 1 8 percentage point which is the lowest. The power outages in Nigeria resulted in losses equivalent to 1 0 percent of total sales and our finding is consistent with the World Bank report of20 1 0, 201 1 and 2012 . For that reason, all Nigerian firms experience power outages on average of 12 - 1 8 hours a day. The implications of this severe constraint to the cost of doing business in Nigeria, shows that a significant indirect cost will be borne out by all the fitms regardless of their sizes which will add cost to their production and this ultimately pass to the final consumerof their goods and services.
Table 2 shows the capital imp01tation into Nigeria as a result of foreign direct investment (FDI) from 2005 to 20 1 2 . The figures shown are in dollar domination and based on sectoral basis. The foreign direct investment inflow into Nigeria from 2005 to 201 2 shows that the non- oil sector is still lagging behind in terms ofFDI. Under the non-oil sector, the infrastructure recorded an impressive investment inflow from $9. 1 6m in 2005 to $ 1 6. 1 2m in 2006, which shows a significant growth rate of about 56% and decline to 28% in 2007 and thereafter rose sharply up to 20 1 2 to $ 1 .723.8 billion. FDI in agricultural subsector still remain poor from $8.44m in 2005 to $6.97m in 201 2 owing to the fact the Government ofNigeria had virtually abandoned agriculture with virtually 2% budgetary allocations in the period under study. The' implication here is that poverty reduction as one of the cardinal thrust of this administration and millennium development goals (MDG's) of20 15 will not be met despite its importance in improved GDP and being the mainstay ofNigerian economy.
Ahuja Joumal of Business and Management Vol.!, Issue I [89-99], March-2015 www.abujajournalofbusinessandmanagement.org.ng Page 94
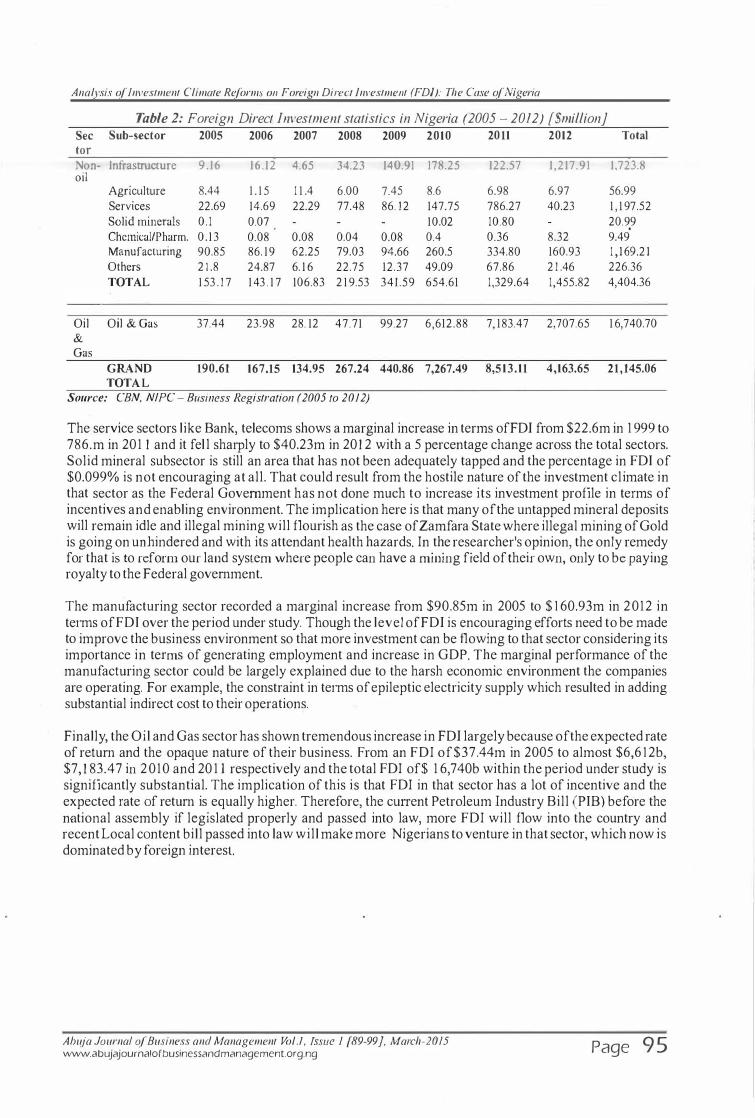
Analysis of Investment Climate Reforms on Foreign Direct Investment (FDJ): The Case of Nigeria
Table 2: Foreign Direct Investment statistics in Nigeria (2005 - 2012) [$million} Sec Sub-sector 2005 2006 2007 2008 2009 2010 20 11 2012 Total tor Non- Infrastructure 9.16 16.12 4.65 34.23 140.91 178.25 122.57 1,217.91 1,723.8 oil
Agriculture 8.44 1 . 1 5 1 1 .4 6.00 7.45 8.6 6.98 6.97 56.99
Services 22.69 14.69 22.29 77.48 86. 1 2 147.75 786.27 40.23 1 , 1 97.52
Solid minerals 0 . 1 0.07 10.02 10.80 20.9,9
Chemical/Pharm. 0 . 1 3 0.08 0.08 0.04 0.08 0.4 0.36 8.32 9.49
Manufacturing 90.85 86. 1 9 62.25 79.03 94.66 260.5 334.80 160.93 1 , 1 69.2 1
Others 2 1 .8 24.87 6. 1 6 22.75 12.37 49.09 67.86 2 1 .46 226.36
TOTAL 1 53 . 1 7 1 43 . 1 7 106.83 2 1 9.53 341 .59 654.61 1,329.64 1,455.82 4,404.36
Oil Oil & Gas 37.44 23.98 28. 12 47.71 99.27 6,612.88 7, 1 83.47 2,707.65 1 6,740.70
& Gas
GRAND 190.61 167.15 134.95 267.24 440.86 7,267.49 8,513.11 4,163.65 2 1 , 145.06
TOTAL Source: CBN, NJPC - Business Registration (2005 to 2012)
The service sectors like Bank, telecoms shows a marginal increase in terms ofFDI from $22.6m in 1 999 to 786.m in 201 1 and it fell sharply to $40.23m in 201 2 with a 5 percentage change across the total sectors. Solid mineral subsector is still an area that has not been adequately tapped and the percentage in FDI of $0.099% is not encouraging at all. That could result from the hostile nature of the investment climate in that sector as the Federal Government has not done much to increase its investment profile in terms of incentives and enabling environment. The implication here is that many of the untapped mineral deposits will remain idle and illegal mining will flourish as the case ofZamfara State where illegal mining of Gold is going on unhindered and with its attendant health hazards. In the researcher's opinion, the only remedy for that is to reform our land system where people can have a mining field of their own, only to be paying royalty to the Federal government.
The manufacturing sector recorded a marginal increase from $90.85m in 2005 to $ 1 60.93m in 2012 in terms ofFDI over the period under study. Though the level ofFDI is encouraging efforts need to be made to improve the business environment so that more investment can be flowing to that sector considering its importance in tetms of generating employment and increase in GDP. The marginal performance of the manufacturing sector could be largely explained due to the harsh economic environment the companies are operating. For example, the constraint in terms of epileptic electricity supply which resulted in adding substantial indirect cost to their operations.
Finally, the Oil and Gas sector has shown tremendous increase in FDI largely because of the expected rate of return and the opaque nature of their business. From an FDI of$37.44m in 2005 to almost $6,6 1 2b, $7, 1 83.47 in 2010 and 20 1 1 respectively and the total FDI of$ 1 6,740b within the period under study is significantly substantial. The implication of this is that FDI in that sector has a lot of incentive and the expected rate of return is equally higher. Therefore, the cunent Petroleum Industry Bill (PIB) before the national assembly if legislated properly and passed into law, more FDI will flow into the country and recent Local content bill passed into law will make more Nigerians to venture in that sector, which now is dominated by foreign interest.
Abuja Journal of Business and Management Vol.!, Issue I [89-99}. March-2015 www.abujajournalofbusinessandmanagement.org.ng Page 95
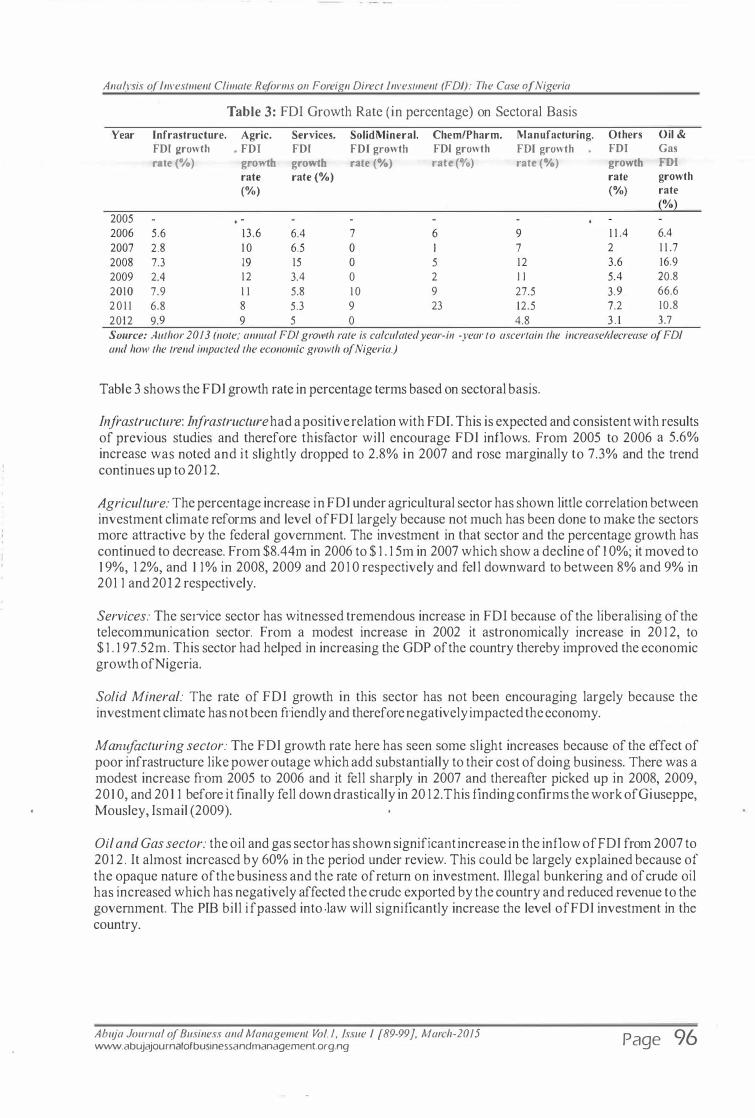
Analysis of Investment Climate Reforms 011 Foreign Direct !nvesllnent (FD/): The Case a_( Nigeria
Table 3: FDI Growth Rate (in percentage) on Sectoral Basis
Year Infrastructure. Agric. Services. SolidMineral. Chem/Pharm. Manufacturing. Others Oil & FDI growth • FDI FDI FDI growth FDI growth FDI growth . FDI Gas rate (0/o) growth growth rate (%) rate <-f•) rate (%) gro�1h FDI
rate rate (%) rate growth
(%) (%) rate
(%} 2005 2006 5.6 13 .6 6.4 7 6 9 1 1 .4 6.4 2007 2.8 1 0 6.5 0 I 7 2 1 1 .7 2008 7.3 19 15 0 5 12 3.6 16.9 2009 2.4 12 3.4 0 2 I I 5.4 20.8 2010 7.9 1 1 5.8 1 0 9 27.5 3.9 66.6 2 0 1 1 6.8 8 5.3 9 23 12.5 7.2 10.8 2012 9.9 9 5 0 4.8 3 . 1 3.7
Source: Author 2013 (note; annual FD! growth rate is calculated year-i11 -year to ascertain the increase/decrease o.f FDI and how the trend impacted the economic growth o.f Nigeria.)
Table 3 shows the FDI growth rate in percentage terms based on sectoral basis.
Infrastructure: Infrastructure had a positive relation with FDI. This is expected and consistent with results of previous studies and therefore thisfactor will encourage FDI inflows. From 2005 to 2006 a 5.6% increase was noted and it slightly dropped to 2.8% in 2007 and rose marginally to 7.3% and the trend continues up to 20 1 2.
Agriculture: The percentage increase in FDI under agricultural sector has shown little correlation between investment climate reforms and level ofFDI largely because not much has been done to make the sectors more attractive by the federal government. The investment in that sector and the percentage growth has continued to decrease. From $8.44m in 2006 to $ 1 . 1 5m in 2007 which show a decline of 1 0%; it moved to 1 9%, 1 2%, and 1 1% in 2008, 2009 and 20 1 0 respectively and fell downward to between 8% and 9% in 201 1 and 201 2 respectively.
Services: The service sector has witnessed tremendous increase in FDI because of the liberalising of the telecommunication sector. From a modest increase in 2002 it astronomically increase in 20 1 2, to $ 1 . 1 97.52m. This sector had helped in increasing the GDP of the country thereby improved the economic growth ofNigeria.
Solid Mineral: The rate of FDI growth in this sector has not been encouraging largely because the investment climate has not been friendly and therefore negatively impacted the economy.
Mamifacturing sector: The FDI growth rate here has seen some slight increases because of the effect of poor infrastructure like power outage which add substantially to their cost of doing business. There was a modest increase from 2005 to 2006 and it fell sharply in 2007 and thereafter picked up in 2008, 2009, 201 0, and 20 1 1 before it finally fell down drastically in 20 12.This finding confirms the work of Giuseppe, Mousley, Ismail (2009).
Oil and Gas sector: the oil and gas sector has shown significant increase in the inflow ofFDI from 2007 to 201 2 . It almost increased by 60% in the period under review. This could be largely explained because of the opaque nature of the business and the rate of return on investment. Illegal bunkering and of crude oil has increased which has negatively affected the crude exported by the country and reduced revenue to the government. The PIB bill if passed into ·law will significantly increase the level ofFDI investment in the country.
Ahuja Journal o.f Business and Management Vol. !, issue I [89-99}, March-2015 www.abujajournalofbusinessandmanagement.org.ng Page 96
Analysis o.f Investment Climate Reforms on Foreign Direct Investment (FDI): The Case o.f Nigeria
5. Summary, Conclusion & Recommendations The summary of the findings for this study revealed that:
1 . Major weaknesses in the business environment of Nigeria are in the area of reliable physical infrastmcture which account to almost 30% of indirect cost incurred by the businesses. These infrastructures include incessant power outages, inefficient transport system and bad roads.
2 . Cost o f financing i s still a problem in terms o f accessing bank loans which i s negatively affecting small and medium enterprises in Nigeria and adding cost to their businesses. This finding is consistent with the recent publication by Financial Derivative Company, which noted that the uncertainties sun·ounding the Nigerian Macroeconomic environment have contributed to the slow growth in foreign investment inflows as a result of high interest rate/lending rate challenges in the country (Adeyemi, 20 1 3).
3 . Inflow ofFDI has consistently increased in oil and Gas sector while the oil sector is witnessing decline most especially in the Agricultural sector and solid minerals
5.1 Conclusion Conclusively, the paper reviewed investment climate reforms on foreign direct investment (FDI) in Nigeria. Investment climate is Key to economic growth and poverty reduction, most especially in Nigeria. Govemment policies and behaviours shape investment climate and in the process play out over a wide field, from contract enforcement and business regulation to the provision of infrastmcture, labour market policy, to fighting corruption and provision of financing, to some incentives all geared towards attracting both foreign and local investors. In Nigeria the cost of a poor business environment is significant. This study has shown that investment climate constraints add substantially to the cost of doing business. Each year 1 6 percent uf sales are recorded as loss as a result of unreliable power, transport delays, crime, and corruption. Our Study shows that in Nigeria, the three most important constraints to doing business are power, access to finance, and transport (see Table 1 ). Solving the electricity crisis must remain at the very top of the policy agenda. Electricity is by far the main obstacle. Evety year almost 1 0 percent of sales are lost due to power outages. All types of firms, irrespective of size, location, expott orientation, and ownership complain about electricity shortages. All firms experience power outages and 85 percent own a generator. This is higher than any ofNigeria's comparator countries (World Bank and IFC, 20 1 3).
5.2 Recommendations Based on the conclusions reached, the following recommendations are made:
1 . Infrastmcture should be improved most especially in the area of electricity, efficient and effective transpott system which account among the major significant constraint in doing business in Nigeria. The issue of public private partnership (PPP) should be enhanced especially in the area of building roads, railway and inland water ways system in order to ease pressure on our roads.
2 . The issue of financing should also be adequately addressed so that both the small and large firms can access loans from bank without much hassle.
3 . For investors to come and invest most especially the much talked about foreign direct investment (FDI) the investment climate of the country should b� enhanced and all bottlenecks removed. The issue ofland accessibility should be simplified in such that both foreign and local investors should have equal access to land to build or expand their businesses. The multiplicity of taxes should also be streamlined such that investors should not be subjected to too many taxes. Here the joint Tax Board of the Federal Government should act and streamline the tax to be collected by the federal, state and local governments.
Abu) a Jouma/ of Business and Management Vol. 1, Issue 1 [89-99]. March-20 15 www.abujajournalofbusinessandmanagement.org.ng Page 9 7

Analysis o.f lnveslmenl Climate Reforms on Foreign Direcl lnvestmenl (FDI): The Case o.f Nigeria
4 . The Non-oil sector like Agriculture should be accorded priority by the Federal Government since that sector is the mainstay of the Nigerian economy contributing more GDP than the oil and Gas sector.
On a general note, the issue of political interference due to fiscal policy inconsistency need to be addressed by the government and also human capital in form of skills acquisition and higher education should form the fulcrum of our policy since it has been fow1d to have significant impact on the level of investment and economic growth. Also security of recent have had a profound effect in our nations drive to attract FDI and needed to be tackled by the Federal Government of Nigeria.
References: Adelegan, J.O., 2000. Foreign Direct Investment and Economic Growth in Nigeria: Seemingly unrelated
model. African Review of Money, Finance and Banking, Supplementary Issue of Savings and Development, Milan, Italy, pp: 5-25.
Adeyemi, A. 20 1 3 . Foreign direct investment in Nigeria. Retrieved from http//www. Punchnewspaper.com
Applyard and Field 2004, as cited in Oyeranti et al 2010 on China-Africa investment Relation; a case study ofNigeria. Department of economics, University oflbadan, Nigeria.
Bangladesh Enterprise Institute and the World Bank 2003. Improving Investment Climate in Bangladesh" World Bank report, Washington D.C. 20433, USA.
Bartholomew, O.N 20 1 0; investment climate reform in Nigeria: challenges and prospects, Central bank of Nigeria review,Abuja, Nigeria
Bello, M. 2010; The role of taxation in attracting foreign direct investment (FDI); By the Executive Secretary Nigerian Investment Promotion Council (NIPC), at the1 3'h annual Tax conference at Nicon Luxury, Abuja, Nigeria.
Bello,M 201 2, the Nigerian investment climate and opportunities; a paper presented atNIPC business forurn,Abuja Nigeria
Bureau for Economic energy and Business affairs 201 0; investment climate statement inNigeria. Bureau for Public Enterprises, BPE 2 0 1 0; on www.bpe.org.gov Easterly, W. 1 999 "The Ghost a/Financing Gap: How the Harrod-Damar Growth Model still Haunts
Development Economists " Policy Research Working Paper, No 1 807, The World Bank. Global trade.net 201 0; investment climate reforms in Nigeria. on http/www,globaltrend.net.com Guissepe, L ; Mousley, P ; Radwan, I 2009; An assessment of the investment climate in Nigeria. The World
Bank publication, Washington, DC. Joan, R 20 1 0; as cited in Jhingan, M.L ; Macroeconomic theory, 1 2'h edition, Vrinda Publications Ltd,
MayurVihar, Phase- 1 , Delhi, India Keyness, J 2 0 1 0; as cited in Jhingan, M.L ; Macroeconomic theory, l 2'h edition, Vrinda Publications Ltd,
MayurVihar, Phase- 1 , Delhi, India. Khan, M.H 2002; what is Good Investment Climate; a published article in the Department of economics at
the school of oriental and African studies, university ofLondon. Krugman and Obstfeld 2000, as cited in Oyeranti et al paper on China-Africa investmentRelation, a case
study ofNigeria. Investopedia 20 1 0, what is investment C!imate?an online encyclopaedia on
finance and investment on
/investmentclimate.asp National Economic Empowennent Development Strategies, NEEDS 2005, Economic blue print of
Nigerian framework, Abuja, Nigeria Nigerian Investment Promotion commission 2008; National Conference on JnvestmentHeld in Zaranda
hotel, Bauchi state, Nigeria. Nigeria Electricity Regulatoty Conunission, NERC 2005 ; The power sector reform Act, Abuja, Nigeria Pindyck, R. S. 1 990 "Irreversibility, Uncertainty and Investment" Jomnal ofEconomic Literature. Oyeranti, Babatunde, Ogunlola, Bankole 201 0; China-Afi-ica investment relation; a Study ojNigeria, a published paper submitted to the African Economic Research Consortium (AERC), Nairobi, Kenya Smith, W. and Hallward-Driemeier, M. (2005) "Understanding the Investment Climate"finance and
Development, March.
Ahuja Joumal o.f Business and Management Vol. 1, Issue 1 [89-99]. March-20 15 www.abujajournalofbusinessandmanagement.org.ng Page 98
Soludo, C. C . (2004) "Investment in the Growth Process: A Measure ofEconomists Ignorance in Africa" Nigerian Economic Society Annual Conference
Stem, N. (2002) "The investment Climate, Governajlce, and inclusion in Bangladesh 'World BankOfficc ofthe Senior Vice President, Development Economics Washington, D.C.
The World Bank (2005) "World Development Report: A Better investment Climatefor Everyone", Washington, D.C
World Bank (20 1 0); Doing business in Nigeria; A co-publication of the World Bank and Theintemational Finance Corporation, Washington D.C
•
World Bank (20 1 1 ) : investment climate survey in Nigeria, an international investment climate Survey. World Bank (20 1 2); Doing business report in Nigeria;A co-publication of the World Bank andThe
international Finance Corporation, Washington, D.C World Bank (20 1 3) ; Doing business report in Nigeria;A co-publication of the World Bank and The
international Finance Corporation, Washington, D.C World Economic Forum (200 1 ). The Africa Competitiveness Report 2000/200i andi998/J999,
U.K,London United Nations Industrial Development Organisation, UNIDO (2005); The Performance oftheNigerian
Manufacturing Firms " Report of the Nigerian ManufacturingEnterprise Survey 2004.UNIDO and Centre for Study of AfricanEconomies, Oxford, London.
Abt!ia Joumal of Business and Management Vol.l, Issue 1 [89-99], March-2015 www.abujajournalofbusinessandmanagement.org.ng Page 99

Customer Relationship Management as a Strategic Marketing Tool in th� Nigerian Banking Sector
Ibrahim Fari Okeji Department of Business Administration, University of Abuja, Gwagwalada-Nigeria
Abstract: The objective of this study is to investigate the degree to which the use of customer Relationship Management (CRM) as a strategic marketing tool influences the performance of the commercial banks in Nigeria. Questionnaires and oral interviews were used as research instruments. 120 questionnaires were administrated to a non-probability convenient sample of 120 persons (including Branch managers, Relationship managers and Operation managers) selected from branches of 4 commercial banks (Diamond bank, Access bank, First bank and United bank for Africa) located in Ahuja Metropolis. The method of data analysis used was simple percentage and Chi-square Distribution. Research findings indicate that the adoption and success.fitl implementation of CRM as a strategic marketing tool has a significant effect on the performance of commercial banks in Nigeria. The study also revealed that banks adopt CRM as a strategic marketing tool to gain competitive advantage. It is therefore recommended that all commercial banks in Nigeria should adopt CRM as a strategic marketing tool to enhance their performance. Keywords: Customer Relationship Management (CRM), Customer Retention, Strategic Marketing, Customer-Centric
1 . Introduction Today, banking institutions face many challenges including global competition for deposit, loans, underwriting fees, increasing customer demands, shrinking profit margins, and the need to be moving with the changing technology. According to Onu eta/, (2006), banks and other service providers realize the importance of customer relationship management (CRM) and it's potential to help them acquire new customers, retain existing ones, and maximize their lifetime value. In the past, creating and maintaining a good relationship with the customer was comparatively easy than today because of small businesses and identifiable customers. Today, the extended size of the business and the wide range of customers have compelled banks to explicitly manage good customer relationship if they want to be successful. This need led to the development ofCRM concept. CRM holds the promise to achieve such corporate objectives in this highly competitive arena (Karakostaskardara, & Papathanassiou, 2004).
According to Cravens & Piercy (2008) CRM covers managing all possible ways that an organization uses to interact with its customers from initial contact to the delivery of the product and services. The basic aim of CRM is to organize the bundle of business processes that deal with customers and involves the collection, spreading and interpretation of customer data in order to identify the pattems of customer's product/service usage behaviour that can be utilized to make effective marketing programs. Levine (2000) asserts that successful CRM programs are directed by carefully formulated and implemented organizational strategy.
Trad�tional marketing strategies focused on 4ps (price, product, prm;notion, and place) in order to increase market share. The basic objective was to increase the volume of transactions between the seller and the buyer. The effectiveness of marketing strategies and teclmiques were measured by the total number of transactions. The objective of CRM goes beyond increasing the volume of transaction. According to Sherif (2000) its emphasis is to increase customers profit, income and satisfaction. CRM doesn't only involve a wide set of technological tools but it also involves those company procedures that promote relationship with customers. So CRM on the whole is a wprking strategy and a process point of view rather than just a technical viewpoint and that has become the need of every organization including banks. CRM came into power when banking institutions became more and more competitive. They now realized the value of their customers and this need is pushing banks to seek solutions through technology. Banks arc focusing on managing customer relationship in order to minimize the challenges like global competition for deposits, loans, underwriting, fees, increasing customer demands, shrinking profit margins, and the need to keep up with the new technologies (Malik & Harper, 2009). So to improve the quality and
Abu) a Jouma/ of Business and Management Vol. /, Issue I [100-109], March-2015 www.abujajournalofbusinessandmanagement.org.ng Page 1 00

Customer Relationship Management as a Strategic Marketing Tool in the Nigerian Banking Sector
magnitude of their businesses, companies must design and implement their own CRM programs (Soch & Sandhu, 2008).
Banks have reahzed the importance of CRM and its potenual to help them m acqmring new customers, retain existing ones, and maximize their lifetime value. In order to do this, banks must have an effective CRM implemented. Onut, Erdem and Hosver (2008) described effective CRM as, first the organization must decide what kind of customer information it is looking for and what it intends to do with that information and secondly the CRM system must link up different sources of information inflow in the organization (mail campaigns, websites, bric-and- mmtar stores, call centers, mobile sales force staff, marketing and advertising effmts etc). The focus of the current study is to assess the degree to which CRM is used as a strategic performance tool in the Nigerian banking sector.
1.1 Research Problem In recent years there has been increased focus on the relationship between CRM and organizational performance. Prior studies have generally found a positive relationship between CRM and organizational performance (Shelth & Sisodia, 2002; Panda, 2003; Reicheld, 2004; Coltman, 2007 & Buttle 2009). However there are also studies where such a relationship has not been found (Bose, 2002; Campbell, 2003; Gurumurthy, 2004; Shibu, 20 1 1 ). Not many studies have been done on CRM and organizational perfom1ance of Banks in Nigeria. Banks increasingly find it difficult to handle customer relationship management and organizational performance. Thus there is stiff competition among banks in attracting the customers of one another and Nigerian banks are introducing innovative banking technologies to satisfycustomer's interests. However, the problem is that it is not clear to what extent Banks in Nigeria have used CRM as a strategic tool to enhance their performance. As a result the focus of this study is to access the degree to which CRM is used as a strategic performance tool in the Nigerian banking sector.
1.2 Research Objectives The major objective of this paper is to assess the degree to which the use ofCRM as a strategicmarketing tool influences the performance of the commercial banks in Nigeria. Other objectives of this paper are:
1 . To evaluate the benefits associated with CRM 2. To recommend some strategies for the effective use ofCRM in the Nigerian banking sector
2. Conceptual/Theoretical Frame Work 2.1 What is CRM? There are many definitions ofCRM in the literature. Some have defined it in technological terms and some have described it in relationship perspective. Technologists define CRM as a term that companies used to manage customer relationship by using different methods, technology and e-commerce capabilities. Researchers agree that being an enabler teclmology plays a significant role in CRM but thinking CRM exclusively in technological terms will be wrong because technology is one part of the whole CRM process and CRM is not about solving a technology problem, it is a process that aligns the business around customers needs and thus makes the company customer-centric (Adrian & Fro, 2005). CRM is a management approach that enables organizations to identify, attract, and increase retention of profitable customers by being willing and able to change behaviour toward an individual customer based on what the customer tells the company and what else the company knows about the customer (Gosney&Boehim, 2009, Massey, Montoya & Hokom, (200 1 ), Panda (2003). This will in the final analysis improve company's profitability as it will be better able to retain its customers (Hobby, 200 1 ).
According to kumar and Reinartz (2006) CRM can be seen and discussed at three different levels i .e Functional, Customer facing and Organizational level. At functional level CRM covers the processes that are required to fu Ifill marketing function. Customer -facing level includes set of activities that provide a single- view of the customer across all contact channels. Organizational level also cal led as strategic CRM that believes in the implications of knowledge about customers and their preferences for the entire
Abuja Journal of Business and Management Vol. /, Issue I [100-109], March-2015 www.abujajournalofbusinessandmanagement.org.ng Page 1 0 1
Customer Relationship Management as a Strategic Marketing Tool in the Nigerian Banking Sector
organization. l t provides the most complete picture of the organization. From the literature it can be concluded that the elements that lead to the successful implementation and operation of CRM in an organization are people, processes and technology Gronroose,( 1 990), Khandwalla, ( 1 995), Bose, (2002), Campbell, (2003 ), Morgan and hunt, (2005 ). People are the employees that are responsible for executing day-to-day CRM tasks, processes are the detailed work descriptions on how CRM tasks will be carried out to create value for customers and the organization and technology supports people to execute CRM tasks and automate the processes. So CRM is a cross-functional integration of processes, people, operations and marketing capabilities.
Buttle (2009) identified four types of CRM. These are strategic, operational, analytical and collaborative. Strategic CRM is a core customer-centric businesses strategy that aims at winning and keeping profitable customers. Operational CRM focuses on the automation of customer-facing processes such as selling, marketing and customer service. Analytical CRM focuses on the intelligent mining of customer- related data for strategic or tactical purposes. Collaborative CRM applies technology across organizational boundaries with a view to optimizing company, partner and customer value. This study is based on the strategic and analytical CRM. CRM represents a strategy and a set of tactics that deal with acquiring, retaining and partnering with selective and strategically significant customers by creating superior value for the customers and the organization it-self Morgan and Hunt, (2001 ), Reichheld, (2002), Parvatia & Sheth, (2001 ), Stone & Woodcock, (200 1 ), Adrain & Frow, (2005). Buttle (2001) defines four types of strategically significant customers (SSC) i.e the high life-time value customers; they provide high value to the company through their whole period of connection with the company. Benchmarks are the second group ofSSC; these are the customers that other customers copy. Third group are inspirations, customers who absorb excessively high volume of fixed cost and enable other smaller customers to become profitable. The concept ofSSC stresses on developing an understanding of economic customer value and difference of customer expectations for making marketing decisions.
2.2 Significance ofCRM in the Banking Sector CRM in financial service industry is a cyclical process which starts with definition of customer actions (Panda 2003). CRM is fundamental to building a customer - centric organization. CRM is a key element that allows a bank to develop its customer base and sales capacity. The goal of CRM is to manage all aspects of customer interactions in a manner that enables the organization to maximize profitability from every customer. Panda (2003) observed that customer expectations are difficult to manage but are often the cause of dissonance which results in loss of existing customer base. So understanding of customer expectations with regard to service delivery levels and product quality is essential for establishing a long term symbolic value relationship. From the foregoing, it can be said that the purpose ofCRM is to bring about Customer-Focused Service Gummesson, (2002), Gronroos, (2004), Varki and Colgate, (2005), Uppal, (20 I 0), Information and Communication Technology, Complaints Management (Gronroos, (2004) Ingram (2006), Achumba, (2006), Coltman, (2007), Butttle, 2009) High Quality Service khandwalla, (2005), Eisingerich and Bell, (2006), Timeliness in service delivery, Friendliness of Employees (Reinatz and Kumar, (2003), Gilbert &choi, (2003) Thompson (2004), Ease of opening Account and competitive Charges in order to enhance organization performance as indicated by such variables as Customer Satisfaction Panda,(2003), Kumar and Rajesh, (2009), Customer Retention Panda (2003), Reicheld, (2004), Lambart,(20 1 0), Increase in number of customers (Gronroos,2004) and increased Net Profit (K.handwalla, (2005): Girdar(2009).
The Organizational performance is enhanced because marketing efficiency is achieved due to the cooperative and collaborative processes(Shelth and Sisodia 2002) introduced by CRM which helps in reducing transaction costs and overall development costs for the company. These brings about two important processes of proactive customer business development and building partnering relationships w�th the most important customers (Chitanya,2005) and eventually leads to superior mutual value creation between the organization and the customer. Further, a clear vision ofCRM along with appropriate strategies if applied in banking sectors was found to be beneficial in maintaining the customer service quality, customer satisfaction and customer retention which ultimately leads to the growth of the organization and profitability (Bansal and Sharma, 2008). Kumar & Rajcsh (2009) revels that any bank that wishes to either grow in size of its banking operation or improve its profitability must consider the challenges affecting its customer relationship.
Ahuja Joumal of Business and Management Vol./, issue I [100-109}, March-2015 www.abujajournalofbusinessandmanagement.org.ng Page 1 02
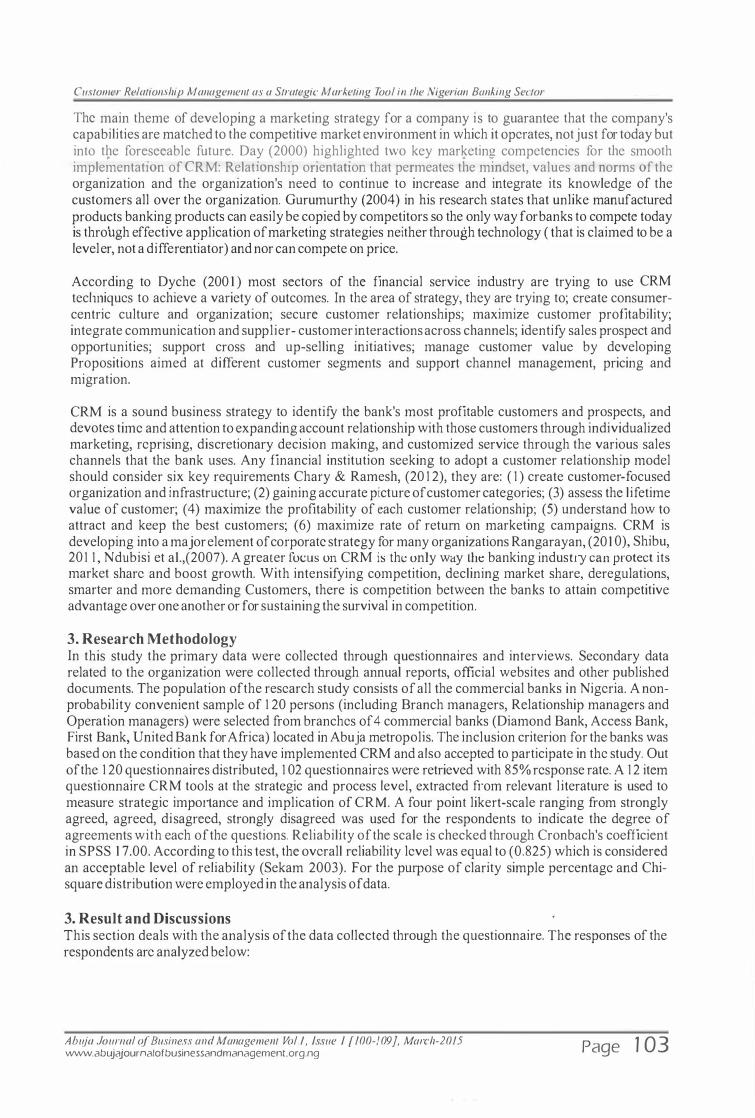
Customer Relationship Management as a Strategic Marketing Tool in the Nigerian Banking Sector
The main theme of developing a marketing strategy for a company is to guarantee that the company's capabilities are matched to the competitive market environment in which it operates, not just for today but into the foreseeable future. Day (2000) highlighted two key marketing competencies for the smooth implementation of CRM: Relatwnsh1p onentahon that permeates the mmdset, values and norms of the organization and the organization's need to continue to increase and integrate its knowledge of the customers all over the organization. Gurumurthy (2004) in his research states that unlike manufactured products banking products can easily be copied by competitors so the only way for banks to compete today is through effective application of marketing strategies neither through technology ( that is claimed to be a leveler, not a differentiator) and nor can compete on price.
According to Dyche (200 1 ) most sectors of the financial service industry are trying to use CRM teclmiques to achieve a variety of outcomes. In the area of strategy, they are trying to; create consumercentric culture and organization; secure customer relationships; maximize customer profitability; integrate communication and supplier- customer interactions across channels; identify sales prospect and opportunities; support cross and up-selling initiatives; manage customer value by developing Propositions aimed at different customer segments and support channel management, pricing and migration.
CRM is a sound business strategy to identify the bank's most profitable customers and prospects, and devotes time and attention to expanding account relationship with those customers through individualized marketing, reprising, discretionary decision making, and customized service through the various sales channels that the bank uses. Any financial institution seeking to adopt a customer relationship model should consider six key requirements Chary & Ramesh, (20 1 2), they are: ( 1 ) create customer-focused organization and infrastructure; (2) gaining accurate picture of customer categories; (3) assess the lifetime value of customer; (4) maximize the profitability of each customer relationship; (5) understand how to attract and keep the best customers; (6) maximize rate of retum on marketing campaigns. CRM is developing into a major element of corporate strategy for many organizations Rangarayan, (20 1 0), Shibu, 20 1 1 , Ndubisi et a1.,(2007). A greater fows on CRM is the only way the banking industry can protect its market share and boost growth. With intensifying competition, declining market share, deregulations, smarter and more demanding Customers, there is competition between the banks to attain competitive advantage over one another or for sustaining the survival in competition.
3. Research Methodology In this study the primary data were collected through questionnaires and interviews. Secondary data related to the organization were collected through annual reports, official websites and other published documents. The population ofthe research study consists of all the commercial banks in Nigeria. A nonprobability convenient sample of 1 20 persons (including Branch managers, Relationship managers and Operation managers) were selected from branches of 4 commercial banks (Diamond Bank, Access Bank, First Bank, United Bank for Africa) located in Abuja metropolis. The inclusion criterion for the banks was based on the condition that they have implemented CRM and also accepted to participate in the study. Out of the 1 20 questionnaires distributed, 1 02 questionnaires were retrieved with 85% response rate. A 1 2 item questionnaire CRM tools at the strategic and process level, extracted from relevant literature is used to measure strategic impottance and implication of CRM. A four point likert-scale ranging from strongly agreed, agreed, disagreed, strongly disagreed was used for the respondents to indicate the degree of agreements with each of the questions. Reliability of the scale is checked through Cronbach's coefficient in SPSS 1 7.00. According to this test, the overall reliability level was equal to (0.825) which is considered an acceptable level of reliability (Sekam 2003). For the purpose of clarity simple percentage and Chisquare distribution were employed in the analysis of data.
3. Result and Discussions This section deals with the analysis of the data collected through the questionnaire. The responses of the respondents are analyzed below:
Ahuja Journal of Business and Management Vol./, Issue I [100-109}, March-2015 www.abujajournalofbusinessandmanagement.org.ng Page 1 03
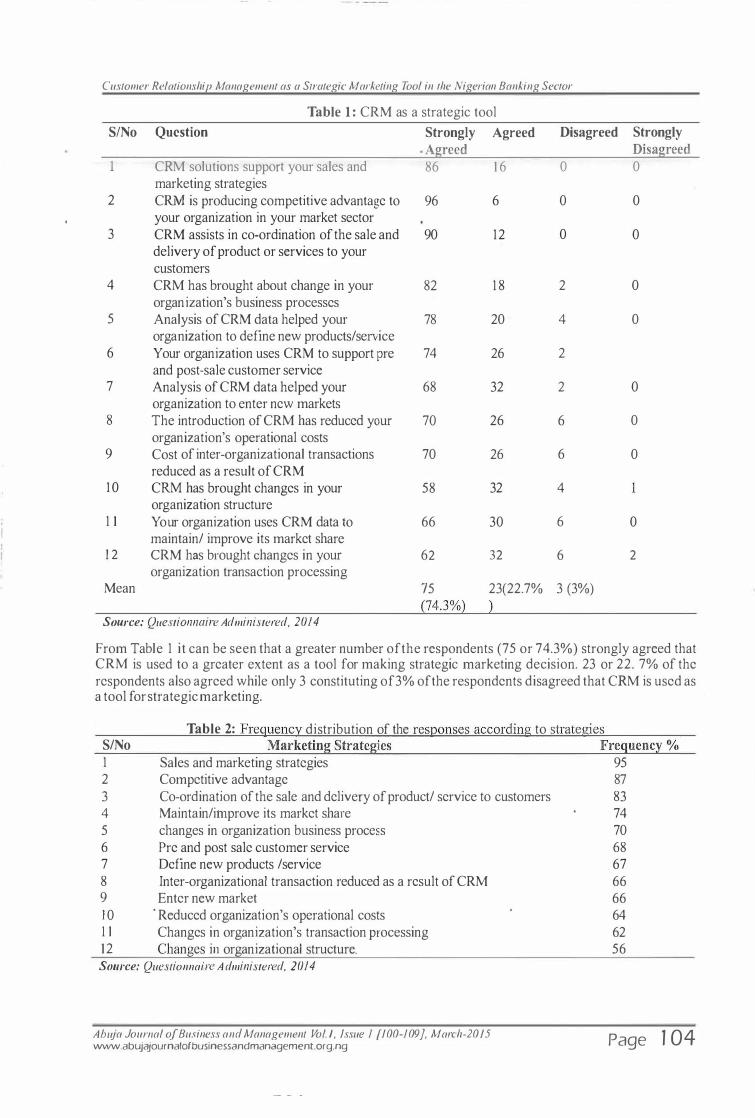
Customer Relationship Management as a Strategic Marketing Tool in the Nigerian Banking Sector
Table 1 : CRM as a strategic tool
S/No Question Strongly Agreed Disagreed Strongly . Agreed Disagreed
CRM solutiOns support your sales and 86 1 6 0 0 marketing strategies
2 CR..t\1 is producing competitive advantage to 96 6 0 0 your organization in your market sector
3 CRM assists in co-ordination of the sale and 90 12 0 0 delivery of product or services to your customers
4 CRM has brought about change in your 82 1 8 2 0 organization's business processes
5 Analysis of CRM data helped your 78 20 4 0 organization to define new products/service
6 Your organization uses CRM to support pre 74 26 2 and post-sale customer service
7 Analysis of CRM data helped your 68 32 2 0 organization to enter new markets
8 The introduction of CRM has reduced your 70 26 6 0 organization's operational costs
9 Cost of inter-organizational transactions 70 26 6 0 reduced as a result of CRM
10 CRM has brought changes in your 58 32 4 organization structure
1 1 Your organization uses CRM data to 66 30 6 0 maintain/ improve its market share
1 2 CRM has brought changes in your 62 32 6 2 organization transaction processing
Mean 75 23(22.7% 3 (3%)
Source: Questionnaire Administered, 2014
From Table 1 it can be seen that a greater number of the respondents (75 or 74.3%) strongly agreed that CRM is used to a greater extent as a tool for making strategic marketing decision. 23 or 22. 7% of the respondents also agreed while only 3 constituting of3% of the respondents disagreed that CRM is used as a tool for strategic marketing.
Table 2: Frequency distribution of the responses according to strategies SINo Marketing Strategies 1 Sales and marketing strategies 2 Competitive advantage 3 Co-ordination of the sale and delivery of product/ service to customers 4 Maintain/improve its market share 5 changes in organization business process 6 Pre and post sale customer service 7 Define new products /service 8 Inter-organizational transaction reduced as a result of CRM 9 Enter new market I 0 · Reduced organization's operational costs I I Changes in organization's transaction processing 12 Changes in organizational structure.
Source: Questionnaire A dministered, 2014
Ahuja Journal of Business and Management Vol. /, Issue I [1 00-1 09], March-20 15 www.abujajournalofbusinessandmanagement.org.ng
Frequency % 95 87 83 74 70 68 67 66 66 64 62 56
Page 1 04

Cuslomer Relalionship Management as a Slra/egic Markeling Tool in !he Nigerian Banking Sec/or
Indicated in table 2 is the frequency distribution of overall marketing strategies responses used for the benefit of the CRM as provided to the banks.These frequencies arc calculated on the basis of their total weight age in !he whole sample of respondents. Organizations adopt CRM '!S strategic marketing tool to gain competitive advantage over their competitors, CRM creates a customer focused organization and infrastructure so as to maximize the profitability of each customer relationship. From table 2, it can be seen that 95% of the respondents believe that CRM is used as sales and marketing strategies in commercial banks. 87% of the respondents strongly agreed that CRM is a source of competitive advantage for the banks. As a strategic tool, 83 % of the respondents strongly agreed that CRM aids decision making on how to co-ordinate sales and deliver products/services to customers.
As shown in table 2, 74% of the respondents confirmed that CRM helps their bank to maintain and improve its market share; 70% ofthe respondents affirmed that the adoption ofCRM brings about changes in organizational business process. The changes in organizational business process lead to improvement in service quality as attested to by 68% of the respondents. The advantages and benefit of adopting CRM as a strategic marketing tool are many. By analyzing CRM data, decisions to enter new markets are also taken. Inter-organizational transactions are also reduced as a result of CRM as claimed by 66% of the respondents. Indeed CRM is developing into a major element of corporate strategy for many banks. A greater focus on CRM is the only way the banking industry can protect its market share and boost growth. 66% of the respondents claimed that CRM facilitates entrance into new market while 64% of the respondents said that CRM helps to reduce organization's operational costs. 62% and 5.6% of the respondents claimed that CRM brings changes in organization's transaction processing and changes in organizational structure respectively. Most impo1tantly it needs to be said that the success of CRM strategy depends upon its ability to understand the needs of the customers and to integrate them with organization's strategy, people, and technology and business process.
4.1 Hypothesis Testing The only hypothesis tested in this study is to access whether the implementation of CRM as a strategic marketing tool has any significant effect on the pcrfo{11ance ofcominercial Banks in Nigeria.
Ho: The implementation ofCRM as a strategic marketing tool has no significant effect on the performance of com mercia! Banks in Nigeria.
Hi: The implementation ofCRM as a strategic marketing tool has a significant effect on the performance of commercial Banks in Nigeria.
Table 3 : Distribution of Respondents by Commercial Bank Showing the Effect of the Implementation of CRM as a Strategic Marketing tool
Name of Bank SA A DA SD TOTAL
UBA 20 5 0 0 25 First Bank 15 4 I 0 20
Diamond Bank 22 7 1 0 30
Access Bank 18 7 1 27 TOTAL 75 23 3 102
Source: Questionnaire Administered, 2014
Note: SA- Strongly agreed, A-Agreed, D- Disagreed, SD- Strongly disagreed Table 3 is the observed Values of the responses of the respondents according to commercial Bank, to obtain the expected frequency we usc the formula:
fe= Row Total x Column Total Grand Total
Abu} a Journal of Business and Managemen/ Vol. 1, Issue I [I 00-1 09], March-20 15 www.abujajournalofbusinessandmanagement.org.ng Page 1 05
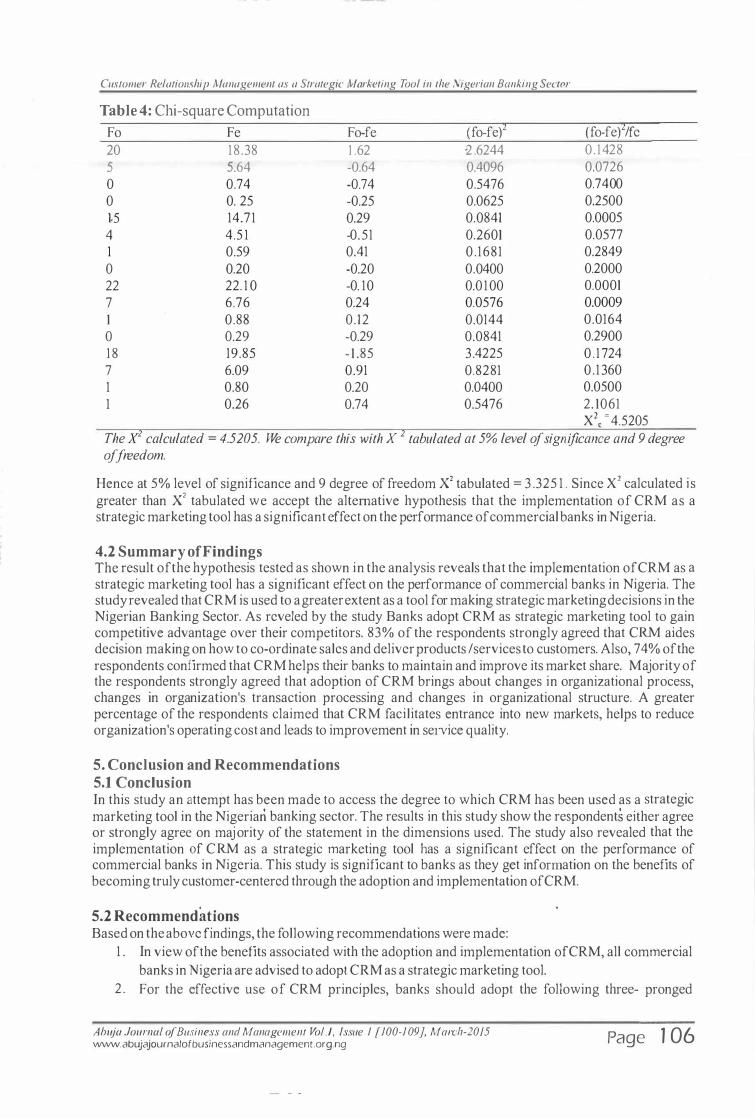
Customer Relationship Management as a Strategic Marketing Tool in the Nigerian Banking Sector
Table 4: Chi-square Computation
Fo 20 5 0 0 1..5 4 1 0 22 7 1 0 18 7 1 1
Fe 18.38 5.64 0.74 0. 25 14.7 1 4.5 1 0.59 0.20 22. 1 0 6.76 0.88 0.29 19.85 6.09 0.80 0.26
Fo-fe 1 .62 -0.64 -0.74 -0.25 0.29 -0.51 0.41 -0.20 -0. 10 0.24 0.12 -0.29 - 1 .85 0.91 0.20 0.74
(fo-fe) ·2 .6244 0.4096 0.5476 0.0625 0.0841 0.2601 0 . 1681 0.0400 0.0 100 0.0576 0.0144 0.0841 3.4225 0.8281 0.0400 0.5476
(fo-fe) /fe 0 . 1428 0.0726 0.7400 0.2500 0.0005 0.0577 0.2849 0.2000 0.0001 0.0009 0.0164 0.2900 0 . 1724 0.1360 0.0500 2. 1061 X2c = 4.5205
The X2 calculated = 4.5205. We compare this with X 2 tabulated at 5% level of significance and 9 degree of freedom.
Hence at 5% level of significance and 9 degree of freedom X2 tabulated = 3 .325 1 . Since X2 calculated is greater than X2 tabulated we accept the alternative hypothesis that the implementation of CRM as a strategic marketing tool has a significant effect on the performance of commercial banks in Nigeria.
4.2 Summary of Findings The result of the hypothesis tested as shown in the analysis reveals that the implementation ofCRM as a strategic marketing tool has a significant effect on the performance of commercial banks in Nigeria. The study revealed that CRM is used to a greater extent as a tool for making strategic marketing decisions in the Nigerian Banking Sector. As reveled by the study Banks adopt CRM as strategic marketing tool to gain competitive advantage over their competitors. 83% of the respondents strongly agreed that CRM aides decision making on how to co-ordinate sales and deliver products /services to customers. Also, 74% of the respondents confirmed that CRM helps their banks to maintain and improve its market share. Majority of the respondents strongly agreed that adoption of CRM brings about changes in organizational process, changes in organization's transaction processing and changes in organizational structure. A greater percentage of the respondents claimed that CRM facilitates entrance into new markets, helps to reduce organization's operating cost and leads to improvement in service quality.
5. Conclusion and Recommendations 5.1 Conclusion In this study an attempt has been made to access the degree to which CRM has been used as a strategic marketing tool in the Nigerian banking sector. The results in this study show the respondents either agree or strongly agree on majority of the statement in the dimensions used. The study also revealed that the implementation of CRM as a strategic marketing tool has a significant effect on the performance of commercial banks in Nigeria. This study is significant to banks as they get infonnation on the benefits of becoming truly customer-centered through the adoption and implementation ofCRM.
5.2 Recommendations Based on the above findings, the following recommendations were made:
1 . In view of the benefits associated with the adoption and implementation ofCRM, all commercial banks in Nigeria are advised to adopt CRM as a strategic marketing tool.
2 . For the effective use of CRM principles, banks should adopt the following three- pronged
Abuja Joumal of Business and Management Vol./, issue I [100-109], March-2015 www.abujajournalofbusinessandmanagement.org.ng Page 1 06
Customer Relationship Manageme/11 as a Strategic Marketing Tool in the Nigerian Banking Sector
approach: First, all CRM efforts should begin with a well-defined strategy. Second, an infrastmcturc must be developed to achieve appropriate objectives. Specifically, the infrastructure ·should align product and sales goal to meet customer needs, according to their
preferences, in the most cost- efficient manner. Third, continuous analytic intelligence should be used to determine and modify customer interaction.
3 . In addition to the above approach, implementing CRM involves colleting ana receiving the most relevant customer data. Relevant customer data can uncover needed information about behavior patterns and attitudes. Once identified, the customer data should be incorporated into the infrastmcturc so that effective marketing plans can be developed and implemented.
4 . Nigerian bank managers should develop business strategies that use CRM to identify the needs and the hurt points of existing customers. This is not to say that they should ignore potential customers, but they should understand the importance of keeping existing customers especially during difficult economic times
5 . Commercial banks should know also who their most valued customers (MVC) are. More resources should be used to market relevant products and services to these MVCs while fewer resources should be expended on unprofitable customers. The goal is to make the right offer to the right customers at the right time, and increase sales with individual customers. This strategy will enable the banks to anticipate greater returns from their campaigns, a reduction in costs, an increase in conversion rates, and more one-to-one communication initiatives (which will gradually reduce the banks previous dependence on mass marketing tactics).
6. Many banks in Nigeria are organized around product-centered and function-centered models rather than a customer - centered model. These studies recommend that all commercial banks in Nigeria should become truly customer-centered, so that they can achieve higher returns on investment, profitability and achieve deeper market penetration that will help in wooing more customers.
References Achumba, I. C. 2006, "The Dynamics ofConsumerBehaviour, " (New Ed.). Lagos: Mac-Williams. Adrian,P., &Frow, P. 2005. "A Strategic Framework for CustomerRelationship Management," Journal of
Marketing, 69, 1 67-176. Bansal, I . & Shanna, R. 2008,"Indian Banking Services: Achievements and Challenges". The ICFAI
University Journal ofservices marketing, Hyderabad. Vi (2), 32-34. Bose, R. 2002, "Customer Relationship Management: Key Components for IT Success ", Industrial
Management and Data Systems, 1 0(2), 80-92. Buttle, F. A. 2009, "Customer Relationship Management: Concepts and Technologies", Elsuer Limited. Buttle, F. A. 200 I . "The CRM Value Chain, " Marketing Business, 52-55. Chary, T. S. & Ramesb, R. 2012 . "Customer Relationship Management in Banking Sector-A Comparative
Study", Journal of Academy of Marketing Science, 41 (3 ), 18-2 4 Campbell, A. 2003, "Creating Customer Knowledge Competence: Managing Customer relationship
Management programs strategically", Industrial Marketing Management, 32,350-365. Chaitanya, K.V. 2005, "Metamorphosis of Marketing Financial Services in India," Journal of Services
Research, 5(Aprii-September), 6-5 Coltman, T. 2007, Can Superior CRM Capabilities Improve Performance in Banking",Journal Of Financial Services Marketing, 12(2), 102-114 Cravens, D.W., & Piercy, N.F.2008. "Strategic Marketing, " (9'" EMcgraw-Hill/Irwin. Day, G.S. 2000, "Managing Market Relationships",Journal oftheAcademy ofMarketing Sciences, 28(1),
22-26.
Abuja Journal of Business and Management Vol./, Issue I [100-/09], March-2015 wvvw.abujajournalofbusinessandmanagement.org.ng Page 1 07
Customer Relationship Management as a Strategic Marketing Tool in the Nigerian Banking Sector
Durkin, M. 2004, "In Search of the Internet Banking Customer." The International Journal of Bank Marketing, 22 (7), 368-406. Eisingeric.h, A.B. , & Bell, S.J.2006, "Relationship Marketing In the F_inancial Services Industry:"The
Importance of Customer Education, Participationand Problem Management for Customer Loyalty", Journal of Financial Services Marketing, 1 0(4), 86-90.
Gosney, J. & Boehm, T. 2000, "Customer relationship Management Essentials ", Indianapolis, in: Prima Publishing.
Gilbert, D.C & Choi, K.C. 2003, "Relationship Marketing Practice' in Relation to Different Bank Ownerships: A StudyofBankMarketing", 2 1 , (3), 1 27- 1 36
Gromoos, C. 2004, "Relationship Approach to Marketing in Service Contexts. The Marketing and Organizational Behaviour Interface", Journal of Business Research, 20(1), 3-15.
Gummesson, E. 2002, "The New marketing: Developing Long-Tenn Interactive Relationships". Long Range planning, 20( 4), 1 0-20
Gurumurthy, N . 2004, "Marketing Bank Products." Indian banks ' Association IBA Bulletin, 24( 4), 23-28 Hobby, J. 2001 , "Looking After the One Who Matters," Accountancy Age, 28, 28-30 Ingram, T.N 2006," Relationship selling: Moving from Rhetoric to Reality, " Journal ofBusiness,
11 (Spring), 5- 10 Karakostas,B., Kardaras, D . , & Papathanassiou, E .2004, "The state of CRM adopted by the Financial
Services in the UK: An empirical investigation", Information& Management, 42, 850-861 Khandwalla, P.N. 2005, "Management Style. " New Delhi: Mc-Graw Hill. Kumar, A.M., &Rajesh,R. 2009, "Whether today's Customers are satisfied?-A Study with banks", Indian
journal a/Marketing, 39(9). Kumar, V, &Reinartz, W.J. 2006. "Customer Relationship Management. " Hobroken, N.J : John Willey &
Sons Incorporation. Lambart, D . M. 2010, "Customer Relationship Management as a Business Process," The Journal of
Business andindustrialMarketing, 25(1), 4. Malik,S.A., & Harper, T.W 2009, "Customer Relationship Management (CRM) in the Banking Sector of
Pakistan: Problems and Challenges, " Business Tnformatinn Management Association, 302-310. Massey, A., Montoya, W.M. & Holcom, K. 200 1 , "Reengineering the Customer Relationship: Leveraging
knowledge Assets at Decision Suppoti Systems. 1 55- 170. Ndubisi, N.O., Wah, C.K., & Ndubusi, G.C. 2007, "Supplier-Customer Relationship Management and
Customer Loyalty: The Banking Industry Perspective", Journal of Enterprise Information Management, 20 (2) 220-232.
Onurt,S., Erdem, I . , &Hosver, B . 2008, "Customer Relationship Manage in Banking Sector and A model Design for Bankingpeiformance Enhancement," Unifying Themes in Complex Systems (IV), 370-378.
Panda, T.K 2003, "Creating Customer Lifetime Value through Effective CRM in Financial Services Industry. " Journal.Q/Service Research, 2(2), 156-1 70.
Parvatiya,A&Sheth, J.N. ·'100 1 , · "Conceptual framework of Customer Relationship Management" In Customer Relationship Management-Emerging Concept, Tools and Applications, Jadish, N, Sheth,A.P. & Shainesh, G (eds). New Delhi, Indian: Tata / Mcgraw- Hill, 3-25
Reinartz, W.J. and kumar, V. 2003, "The Impact of Customer Relationship Characteristics on Profitable Lifetime Duration," Journal of Marketing 67 (1), 77-99.
Rangarajan, F. 2010, "Effective Role of Customer Relationship Management in Banking Sector, " Global Research Review, New Delhi.
Reichheld, F.F & Teal, T. 2004, "The Loyalty Effect: The Hidden Force behind Growth, Profits and Lasting Value," Harvard Business School Press.
Sekaran, U. 2003, "Research Methods for Business: A Skill Building Approach ", (3th edition), New York: John Wiley & Sons Incorporation.
Sheth, J.N, &Sisodia, R.S. 2002, "Improving Marketing Productivity. " In Heilbronn ( eds·.) Encyclopedia ofMarketing in the year 2000. Chicago ILi: American marketing Association NTC publishing.
Sherif, K. 2002, "Assessing the Introduction of Electronic banking in Egypt using The Technology Acceptance Model. " Hershey, PA, USA: Idea Group lnc.
Stone, M. ; & Woodcock, N. 200 1 , "Defining CRM and Assessing its Quality. "In Successful Customer Relationship Marketing, Brain Foss and Merlin Stone ( eds). London: kogan pp3- 15 .
Abu) a Journal o.f Business and Management Vol. 1, Issue 1 [100-109}, March-201 5 www.abujajournalofbusinessandmanagement.org.ng Page 1 08

Customer Relationship Management as a Strategic Marketing Tool in the Nigerian Banking Sector
Shibu, N.S. 201 1 , "Customer Relationship Management and Banking lndustry."Journal of Social Sciences, 36(1 7), 72-79.
Thompson, B. 2004, "Successjjtl CRM: Turning Customer LoyaiZI' into Profitability. " Right n_ow Technologies.
Uppal, R.K. 20 1 0, "Marketing of Bank products- Emerging challenges & New Strategies," International Journal of Management Research, 32-38.
Varki, S. & Colgate, M. 200 1 , "The Role of Price Perceptions In An Integrated Model of Behavior Intentions," Journal a/Service Research, 3(3), 230-234.
'
� :/ \ f.;
. '-......... ' ' \. v " •, A. p, v �- :,:::..:;;--"'
Abuja Journal of Business and Management Vol./, Issue I [100-109}. March-2015 www.abujajournalofbusinessandmanagement.org.ng Page 1 09
The Impact of Electricity on the Growth of Small and Medium Enterprises (SMEs) in Nigeria
Dr. Nuhu Dogara Gado', Ezie Obumneke2 '(Department of Business Administration, Bingham University, Nasarawa State- Nigeria)
1 (.Department of Economics, Bingham University, Nasarawa State- Nigeria)
Abstract: The study undertakes an empirical research to analyze the effects of electricity on the growth of SMEs in Nigeria between 1990 and 2013. Ordinaty Least Square (OLS) multiple regression method was adopted to examine these effects. Unit root test and co integration was carried out on the variables. The study found that erratic power supply or fluctuations in electricity supply led to decline in SMEs growth. There were poor execution of the independent power projects (JPP) by Government and increased generator usage by the SMEs. Electricity supply and electricity consumption were also found to be statistically insignificant at ensuring effective SMEs growth. Amongst the recommendations were that Government should increase investment in power infrastructures and improve on the implementation of power distribution privatization. Keywords: Electricity Supply, Electricity Consumption, Power Investment, Small and Medium scale Enterprises Growth
1.0 Introduction The worldview of Small and Medium Scale Enterprises (SMEs) as an index of technological backwardness or as a sign of industrial backwardness is changing tremendously with time (Udechukwu, 2003). Indeed, in many developed and developing nations of the world, SMEs are now appreciated as necessaty complements to the industrial structure of any modem economy. One of the reasons for the attention on SMEs borders on the perceived wisdom that they could leapfrog the industrial development process. Many developing countries have recorded success from the use ofSMEs in the past two or three decades. In many countries, the dynamic role of SMEs as engine through which the growth and development objectives of developing countries including Nigeria can be achieved has long been recognized as observed in the works of Gibb and Richie (2002); Kayanula and Quatrtey (2005); and Egelen and Stail ( 1997) cited in Adaramola (20 1 2). It is estimated that SMEs employ 22 percent of the adult population in a developing country like Nigeria (Adaramola (2012). In view of the importance and place of SMEs in an economy, it is imperative that they should be given all the needed priority they deserve.
However, the contribution of SMEs to the Nigerian economy is still very small and negligible when compared with countries such as the Asian tigers (Owualah, 1 987 cited inAdaramola, 20 1 2). The SMEs in Nigeria still face a lot of problems ranging from electricity supply to financing that threaten their survival. The government has made a lot of efforts to ensure that the SMEs are given a helping hand to leap- frog their growth so as to complement the modern day industrial structure like other developing nations of the world. Over the years, there have been serious divergent opinions as to what should be an appropriate policy to develop the Nigerian SMEs. In recent times, the government merged the Nigerian Industrial Development Bank (NIDB), Nigerian Bank for Commerce and Industry (NBCI) and Nigerian Economic Reconstruction Fund (NERFUND) to form the Bank oflndustty (BOI); all in the effort to assist SMEs in Nigeria. The government also established the Small and Medium Enterprises Development Agency of Nigeria (SMEDAN) as a coordinating and regulatory agency for the SMEs. The government again went ahead to establish the National Guarantee Scheme for SMEs collateral so as to reduce the risk of financing Adaramola (20 12). In 200 1 , the Small and Medium Enterprises Industry Scheme (SMEs) was set up by the Bankers Committee which was a response to government demand that banks device ways of funding SMEs in Nigeria. Now government has converted all the Community Banks in the country into Micro Finance Banks and strengthened their capital base so as to be able to lend helping hands to the development ofSMEs.
In 20 1 2, the federal Government approved the sum ofN200 billion for operation of the Smal l and Medium Enterprises Credit Guarantee Scheme (SMECGS) fund. To be operational, the eligibility conditions for
Abuja Journal a_[ Business and Managemenl Vol./, Issue 1 [110-123], March-2015 www.abujajournalofbusinessandmanagement.org.ng Page 1 1 0
The impact of Electricity on the Growth of Small and Medium Ente1prises (SMEs) in Nigeria
applying institutions were formulated by the Central Bank of Nigeria (CBN) together with relevant agencies of government Uko, (20 1 2). While the SMECGS and the Micro finance Development Fund (MDF), which arc required to support micro, small and medium enterprise, were establi�hed simultaneously, mterested SMEs may only benefit from these funds if they are vmble and sattsfy the expected eligibility conditions.
In spite of these development policies, the result from this sector of the economy has not been encouraging. Some scholars are of the' view that efforts of the Nigerian Govemment are unidirectional. Apart from financial support, little is being done by government about other environmental supports such as infrastructure and technology. No doubt that in Nigeria and indeed as in many other developing countries, povetty level is still very high. Some scholars have maintained that high rate of poverty can be linked to the investment environments which have not been friendly to the survival and development of SMEs.
One major problem that hinders the development of small scale businesses in Nigeria is the lack of stable electricity. Electricity is a necessary requirement for businesses ranging from the design, manufacturing, to the preservation and distribution of goods and services. According to Ayodele (2004), aside from serving as a pillar of wealth creation in Nigeria, electricity is the nucleus of operations and subsequently the engine of growth for all sectors of the economy. Statistics have shown that, Nigeria has all the available natural resources to provide adequate electricity supply to its domestic demands and even export some.
1 . 1 Objectives ofthe Study 1 . The objectives of this study are to: 2. Examine whether the supply of electricity, government expenditures on electricity and
consumption of electricity impact positively on SMEs growth in Nigeria. 3 . Analyze whether the impacts of electricity supply, govemment expenditures on electricity and
consumption of electricity on SMEs in Nigeria are significant 4. Determine whether supply of electricity, government expenditures on electricity and
consumption of electricity can sustain Nigeria's SMEs growth in the long run.
1 .2 Statement ofHypotheses (Null) Hl: the supply of electricity, government expenditures on electricity and consumption of electricity do not impact positively on the growth ofSMEs in Nigeria.
H2: the supply of electricity, government expenditures on electricity and consumption of electricity do not have as ignificant influence on SMEs growth in Nigeria?
H3: the supply of electricity, government expenditures on electricity and consumption of electricity cannot sustain Nigeria's SMEs growth in the long-run.
2.0 Review ofLiterature 2.1 Concept of SMEs in Nigeria Small and Medium Scale Enterprises (SMEs) development process continues to be in the forefront of policy debates in developing countries. Small and medium scale enterprises have been generally acknowledged as the bedrock of the industrial development of Nigeria and other countries (Audretsch, Verheul, Wennekers & Thurik, 2002; Stokes & Wilson, 2006 and Hulbert, Gilmore & Carson, 20 1 3). The dynamic role of SMEs in developing countries as engines through which the growth and development objectives can be achieved has long been recognized and stated in the literature. The claimed advantages for SMEs are numerous, including the encouragement of entrepreneurship (Ayesha, 2007; Ayozie & Latinwo, 201 0; Safiriyu & Njogo, (20 I 2); the greater likelihood that SMEs will utilize labour intensive technologies Salami, 2003; Muritala et a!, (20 1 2) and thus have an immediate impact on employment generation Henriques & Klock, ( 1 999); Udechukwu, (2003); Adcnuga and Ochu (2004); Ayozie & Latinwo (201 0); Ariyo, (2008); they can usually be established more rapidly and put into operation to
Abuja Journal of Business and Management Vol./, Issue I [110-123}, March-2015 www.abujajournalofbusinessandmanagement.org.ng Page 1 1 1
The Impact of Electricity 011 the Growth of Small and Medium Ente1prises (SMEs) in Nigeria
produce quick returns; SMEs development can encourage the process of both inter- and intra-regional decentralization Adenuga and Ochu (2004); and, they may well become a countervailing force against the economic power oflarger �nterpriscs Salami, (2003). More generally the development o�SMEs is seen as accelerating the achievement of wider economic and socio-economic objectives, including poverty alleviation Udechukwu, (2003); Ayozie & Latinwo, (20 1 0). But in Nigeria, the sub-sector is still faced with a number of constraints with inadequate financial facilities being one of the principal constraints.
According to the United Nations Industrial Development Organization UNIDO (200 1 ); for developing countries, integration into the global economy through economic liberalization, deregulation, and democratization is seen as the paramount way to triumph over poverty and inequality. The importance of this process is the development of a vibrant private sector, in which small and medium enterprises can play a central role. Small and Medium Scale Enterprises occupy a place of pride in virtually every country or state. Because of the significant roles SMEs play in the growth and development of various economies, SMEs have aptly been referred to as "the engine of growth" and "catalysts for socio-economic transformation of any country". The small scale business sector is recognized as an integral component of economic development and a crucial element in the effort to lift countries out of poverty (Wolfenson, 200 1 ). Small scale businesses are driving force for economic growth, job creation, and poverty reduction in developing countries .They have been the means through which accelerated economic growth and rapid industrialization have been achieved (Sauser, 2005; Harris & Gibson, 2006). Fabayo(2009) says SMEs have been recognized as a feeder service to large-scale industries. SMEs represent a veritable vehicle for the achievement of national economic objectives of employment generation and poverty reduction at low investment cost as well as the development of entrepreneurial capabilities including indigenous technology. Other intrinsic benefits of vibrant SMEs include access to the infrastructural facilities occasioned by the existence of such SMEs in their surroundings, the stimulation of economic activities such as suppliers of various items and distributive trades for items produced and or needed by the SMEs. Another benefit is the enhancement of standard ofliving of the employees ofSMEs and their dependants stemming from rural urban migration. Small and medium scale enterprises (SMEs) have been recognized as indispensable components of national development in both developed and developing economies.
Obitayo, (200 1 ) stated that SMEs are noted for their immense contributions to the development processes and as the engine of growth. They are promoted as a critical segment of the manufacturing sub-sector as an effective strategy for tackling unemployment, diversifying output and achieving trade and balance of payment. He further opined that successive Nigerian Govemments had recognized the strategic importance of SMEs since independence. Udechukwu, (2003) argued that a major gap in Nigeria's industrial development process has been the absence of a strong and virile small and medium enterprises sub-sector. The growing concem about unemployment among the youth especially graduates of tertiary institutions and diminishing growth potentials in the economy have further drawn increased attention to the need to ensure the survival and growth ofSMEs. Small scale businesses in Nigeria constitute over 80 percent of all registered companies, occupying positions in agro based and allied industries, rubber -based, leather shoes industries, chemical, electronics, and general merchandising.
2.2 Electricity Demand in Nigeria Development ofthe electricity sector has a key role to play in Nigeria's economic-development process. It has the capacity to serve either as a catalyst or a fetter on the wheels of economic development. A careful study of the pattern of electricity consumption vis-a-vis economic growth across different countries shows an oscillation around an initial cluster characterized by low energy consumption, economic stagnation and poor energy infrastructure. By way of comparison South Africa has 40,000mw for a population of 50million people; Brazil has 1 OO,OOOmw for a population of 1 92 million people; USA has 700,000mw for a population of 308 million while Nigeria with a population of over 1 50 million people only generates 2443mw at peak periods (Ibitoye & Adenikinju, 2007). This translates to very disappointing levels of· electricity consumption per capital, thereby leaving our industries to perform at epileptic levels, goods and services to be sold at prices that automatically adjust due to power outages, to account for the expensive cost of production via generating sets and a populace that is unable to take advantage of the latest advances in technology and appliances (Darling et. al. 2008).
Ahuja Journal of Business and Management Vol.!, Issue I [110-123}, March-2015 www.abujajournalofbusinessandmanagement.org.ng Page 1 1 2
The lmpac/ of Eleclricity on !he Growlh of Small and Medium En1e1prises (SMEs) in Nigeria
For over twenty years prior to 1 999, the power sector did not witness substantial investment in infrastructural development. During that period, new plants were not constructed and the existing ones were not properly maintained, bringing the power sector to a deplorable state. In 200 1 , generation went down from the mstalled capacity of about 5,600MW to an average of about 1 ,750MW, as compared to a load demand of6,000MW. Also, only nineteen out of the seventy nine installed generating units were in operation (Sambo, 2008). As a result of this, Jess than 45% of the Nigerian population had access to electric power in 2003.
As at 2008 electricity generation ranged from 2500MW to 3500MW out of an installed capacity of 5963MW even with the inclusion of3 gas powered independent power projects in the Niger delta region (Bolaji, 2008). As at September 2009, Nigeria's power demand was estimated at 1 5,000mw but peak generation by PHCN was 2,443mw which was less than 17% of the electricity need (Nasir, 2009). In 2010 the power holding company of Nigeria could only supply 4,320mw of electricity while demand was 1 0,500mw, leaving an excess demand of 6 1 8 0mw (Odiaka, 2006). Demand for electricity has grown at a rate of8.2% per annum since 1 984 against GDP growth of about 3 .5% and per-capita generation relative to other countries is extremely low (Garb a, 2002). It was estimated that an additional ! O,OOOMW in capacity is required to meet the cunent demand. The country has not been able to meet the current demand for electricity because the nation's electricity demand continues to grow in response to increasing population, urbanization, improved standard of living and economic development (Sambo, 2008). There is no doubt that expensive and unreliable power remains a major concern to Nigeria's industrial sector and household consumers. Multiple and tmpredictable power cuts which have become a daily occurrence in Nigeria often result in equipment malfunctioning of all the sectors of the economy and make it difficult to produce goods and provide services efficiently. Despite the attempts by some firms to supplement power supply by PHCN, electricity demand by consumers, particularly domestic users, has continued to increase.
2.3 Empirical Studies on Electricity Supply and its Impact on SMEs Growth Power supply is the most important commodity for national development. With electricity energy the SMEs are empowered to create employment in the large -scale and manufacturing complexes. Various researches have been done in the area of examining how electricity supply influences small business operations in an economy. Hossain (20 1 2) in his work empirically examined the dynamic causal relationship between SMEs growth, electricity consumption, expott values and remittance for the panel of three South Asian Association for Regional Cooperation (SAARC) countries i.e. Bangladesh, India and Pakistan using the time series data for the period 1 976- 2009. Using four different panel unit root tests, adopting the Johansen Fisher panel co-integration and Kao tests, Husain's (20 1 2) study interestingly found that all the panel variables are co integrated. The panel Granger F test results support the fact that there is only a bidirectional short-run causal relationship between economic growth and export values but there is no evidence of long-run causal relationship. It was found that the long-run elasticity of economic growth with respect to electricity consumption and remittance are higher than short run elasticity. Thus, this means that over time higher electricity consumption and higher remittance from manpower supply in the panel ofSAARC cow1tries give rise to more economic growth.
The empirical evidence showed that there was a long-run relationship between electricity consumption/supply per capita and SMEs growth for only 9 countries (Benin, Cameroon, Morocco, Zambia, Congo Republic, Gabon, Nigeria, South Africa and Zimbabwe) and Granger causality for only 1 2 countries. For 6 countries (Cameroon, Ghana, Nigeria, Senegal, Zambia and Zimbabwe) there was a positive uni-directional causality running from real GOP per capita to electricity consumption per capita; an opposite causality for 3 countries (Benin, the Democratic Republic of Congo and Tunisia)and bidirectional causality for the remaining 3 countries (Egypt, Gabon and Morocco). What the evidence may suggest is that there may be a number of factors at work that differ significantly across countries that account for the different directions of causality detected in this study. Detecting some of these factors might help in understanding and defining the relationship between electricity consumption and economic growth. The result is subject to varied interpretation as to determining if there is a strong relationship between the variables, especially as electricity consumption accounts for less than 4% of total energy consumption in Africa and only grid-supplied electricity was taken into consideration.
Abu} a Journal of Business and Managemenl Vol. /, Issue I [1 10-123], March-2015 www.abujajournalofbusinessandmanagement.org.ng Page 1 1 3
The Impact of Electricity on the Growth of Small and Medium Ente1prises (SMEs) in Nigeria
Alicro and Ibrahim (20 1 2) investigated the causal relationship between power sector and SMEs growth in Nigeria using time series data of energy consumption; including coal, petroleum, gas and electricity from the period 1 970-2009. Employif!g the Augmented Dickey Fuller unit root tests and Johapscn co integration tests, the study revealed that petroleum, coal and electricity consumption lead to SMEs growth, but without feedback. These studies imply that electricity supply acts as an engine of SMEs growth for various countries, including Nigeria. Thus, it is very important that this sector be given more relevance as a step towards harnessing the inherent potentials as much as possible to encourage economic growth and development.
Some researchers concentrate on the impact of electricity on the growth of the economy as a whole (Hossain, 20 1 2) . Those that consider the impact of electricity on SMEs dwell on the consumption (Ali em and Ibrahim, 20 1 2). Others examine the impact of the entire business environment, electricity being a key variable, and the performance of the manufacturing sector (Iarrossi and Clarke, 20 1 1 ). None of the studies combined the impact of Government expenditure, electricity supply and electricity consumption on the growth ofSMEs in Nigeria. This study addresses this gap.
2.4 Theoretical Framework The following are the various theories that link the development of infrastructure i.e. electricity to the performance ofSMEs and the economy at large. The subsequent analysis of empirical data is to show the practical import ofthe theories and also possibly build on them.
2.4.1 The Big Push Theory The "big push" theory deals with the large comprehensive program needed in the form of high minimum amount of investment to overcome the obstacles to development in an underdeveloped economy and to launch economic development. Rosenstein-Rodan ( 1 943) who propounded this theory linked about three (3) indivisibilitics which are pre-requisite for lunching economic development successfully. Among them is the indivisibility in the production function. He added that indivisibilities of input, output will lead to increasing returns. He regards social overhead capital as the most important instance of indivisibility. The services of social overhead capital comprises of infrastructure such as electricity supply, water supply, road network among others. These services are directly productive and have long gestation period.
2.4.2 The Gerschenksron's Great Spurt Theory Gerschenkron ( 1962) theory states that the great spurt industrialization could take place if5 pre- requisites are fulfilled. Among which he emphasized that there should be provision for material social overhead capitals. Gerchenkron ( 1962) categorized countries into three groups on the basis of the degree of economic backwardness: the advance, the moderately backward, and the very backward. For a great spurt of industrialization, he noted that the advanced nations start their first stage of development with the factory (or private firm) while the extreme backward start with governments. But i t should not be inferred from this that industrialization is dependent upon the creation of these preconditions. In fact, one precondition can be substituted by another precondition; further preconditions can always be created even dming the course of industrialization. Gerschenkron, ( 1 962) supported his view by citing the example of England where capital was a supplement to the early factories in England
.from previously accumulated
wealth or from gradually investing back of profits. Extremely backward countries which could not have these preconditions for industrialization were compensated by the actions ofbanks and governments.
For a great spur in industrialization, Gerschenkron ( 1 962) emphasized the adoption of capital intensive techniques. According to him, in an extremely backward country, there would be a very big technological gap between its techniques of production and those of developed countries. It can, therefore, be industrialized by adopting the most advanced capital-intensive techniques of other countries for two reasons: first, such techniques help the establishmept of import substitution industries, thereby reducing foreign competition. Secondly, backward economies have shortage of skilled labour; they use capital intensive and labour saving techniques. The more backward an economy is, the greater is the degree of capital intensiveness of industrialization. Gerschenkron ( 1962) considered the introduction of capital intensive techniques essential for economic development from historical, borrowed technology as one of the primary factors assuring that high speed development in a backward countJy enables it to enter the stage of industrialization.
Abu} a Journal of Business and Management Vol./, Issue I [110-123], March-2015 www.abujajournalofbusinessandmanagement.org.ng Page 1 1 4
The Impact of Electricity 011 the Growth of Small and Medium Enterprises (SMEs) in Nigeria
2.4.3 The Theory ofUnbalanced Growth This theory as popularized by Hirschman ( 1 958) says that consistent investment should be made in selected sectors rather than simultaneously in all sectprs of the economy. No underdeveloped country possesses capital and other resources in such quantities as to mvest simultaneously in all sectors. Therefore, investment should be made in a few selected sectors of industries for the rapid development of other sectors. Thus the economy gradually moves through the path of unbalanced growth to that of balanced growth. Economists like have expressed their views in favor of unbalanced growth. It is the contention of Hirschman ( 1 958) that deliberately unbalancing the economy according to pre-designed strategies is the best way to achieve economic growth in an underdeveloped country. Investments in strategically selected industries or sectors of the economy will lead to new economic investment opportunities and so pave the way to further economic development.
Hirschman ( 1 958) tried to explain growth and development of nation or economy with social overhead capital which included investment in education, public health, communications, transportations and conventional public utilities like electricity, water, irrigation and drainage schemes among others. He stipulated that a large investment in overhead capital will encomage private investment, and later direct productive activities (DPA) i.e. industrialization. For example, cheap and frequent supply of electricity power will encourage the establishment of small industries. Unless social investment provides cheaper and improved services, private investment in direct productive activities (DPA) will not be encouraged.
As Hirschman puts it, investment in social overhead capital (SOC) is advocated not because of its direct effect on final output, but it permits and in fact invites Direct Productive Activities (DPA).The study thus adopts the big push theory which aims at examining the indivisibility of inputs (Electricity) which will lead to increasing retums ofSMEs.
3.0 Methodology 3.1 Data MeasurementandSources Data used for this study were collected basically from secondary sources such as CBN Statistical Bulletin, National Bureau of Statistics (NBS) and Economic reports from World Bank among others for the years 1 990 - 20 1 3 .In this study, data on electricity supply (ES), federal government expenditure on electricity (GEE) which comprise of capital and recunent expenditures and electricity consumption (EC) were used for analysis.
3.2 Procedure for Data Analysis and Model Specification For the purpose of this research, the ordinary least square (OLS) multiple regression model is used to estimate the variables. This involves estimation of the regression model in order to examine the impact of electricity supply, federal government expenditure on electricity, and electricity consumption on SMEs growth in Nigeria. The econometric regression model is used to test the impact of electricity supply (ES), government capital expenditures (GEE) and electricity consumption (EC) on SMEs growth in Nigeria. The conversion of parameters into logarithm aims at achieving unique parameter estimates that would enable us to interpret the regression coefficients in terms of elasticity and consequently give a slightly better fit. To captme both the long-run and the short-run dynamics of ES, GEE, and EC on SMEs in Nigeria, an enor correction model (ECM), using multivariate co integration teclmiqucs is employed. However, before performing the co integration test, stationary test usingADF test is
' canied out on each of
the variables to avoid spurious regression results. The estimation is conducted using the econometric computer software package, E-views version 7. 0.
3.3 Model Specification The econ9mctric model to consider in this study takes Electricity supply (ES), Government expenditure on electricity (GEE), and Electricity consumption (EC), as the explanatory variables and small and medium scale enterprises growth (SMEG) as dependent variable respectively. These variables are used at constant prices to obtain reliable parameter estimates in the time series regression. Flowing from the propositions explored in the theoretical framework for the successful examination of the impact of ES, GEE and EC on the SMEG, the following models needed to test the set hypotheses are explicitly specified:
Abuja Jouma/ of Business and Management Vol. /, Issue I [I 10-123], March-2015 www.abujajournalofbusinessandmanagement.org.ng Page 1 1 5

The Impact of Electricity on the Growth of Small and Medium En1e1prises (SMEs) in Nigeria
SMEG = f(ES, GEE, EC) - - - -- - -- -- - ---1
Specifying equation ( 1 ) in an exponential regression modeL we have;
SMEG = a ESP'GEEP2 ECP3e �'' - -- - -- - - - - - 2
I n this f01m, the coefficients �1, �2 , �3 • can be directly estimated by applying log-linear regression. techniques via logarithmic transformation; those coefficients are the elasticity's. Taking natural logs of both sides of the equation, we have:
log SMEG = log a + B, log ES + B2 log GEE + B3 logEC + f.l, - - - - - - - - - 3
Suffice it to reiterate that co integration provides the theoretical underpinning for error-correction model. Specifying equation 3 in the mode of enor-correction model, we have:
m II 0 D. logSMEG, = D. loga + L P,D.log ES, - ; + L P2D. 1og GEEt - ; + L P3D. log ECt - 1 + 8 ECM,_; +e, - - - -4
i=l jz] i=l
Where;
a = is the autonomous parameter (or the intercept)
SMEG = Represents the small and medium scale outputs (and its contribution to GDP)
ES = Electricity supply or production is measured at the terminals of all alternator sets in a station. In addition to hydropower, coal, oil, gas, and nuclear power generation, it covers generation and distiibution by geothermal, solar, wind, and tide and wave energy, as well as that from combustible renewable and waste. Production or supply includes the output of electricity plants that are designed to supply electricity only, as well as those of combined heat and power plants.
EC = Electric power consumption which measures the production of power plants and combined heat and power plants less transmission, distribution, and transformation losses and own usc by heat and power plants.
GEE = Represents federal Government (budgetary) Capital and recurrent Expenditures on the power sector.
f.l = represents the stochastic error tcnn.
We then differentiate partially with respect to the log of each variable to obtain elasticity of SMEG and apriorisign expectation of equation ( 4);
ologSMEG =(ologSMEGJ( E� J=�, > 0 -- - - - -- --- --5
alogES', Olog ES, SMEG, ·
81og SMEG = ( a log SMEGJ ( ES,
J= �2 > 0 - - - - - - - - - - - -6
8 log £S, l a logES, SMEG,
OlogSMEG (ologSMEGJ( EC J
� a logE� = ologEc; suia, = } > 0 ---- - -- -- -- -7
81og SMEG = ( 8SMEGJ( ECM, J= 8 < O - - - - - - - - - - - - - - - S
81og ECM, 8ECM, SMEG,
Abu} a Journal of Business and Management Vol./, hsue 1 [110-123], March-2015 www.abujajournalofbusinessandmanagement.org.ng Page 1 1 6
The Impact of Electricity on the Growth of Small and Medium Ente1prises (SMEs) in Nigeria
4. Results and Discussions of Findings 4.1 Pre-Estimation Diagnostics Tests (Unit Root Test) Macroeconomic time series data as presented in Appendix I are generally characterized by stochastic trend which can be removed by differencmg. Unit root test is a test of stationarity or non-stationarity of series data used in the model. This is to find out if the relationship between economic variables is spurious or nonsensical. This test is conducted by adding the lagged values of the dependent variable so that the error t�rm is serially uncorrelated.
Therefore, to examine the existence of stochastic non-stationarity in the series, the research establishes the order of integration of individual time series through the unit root tests. The tests of the stationarity of the variables adopted were Augmented Dickey Fuller (ADF) test. The variables tested are: ES, GEE, EC, and SMEG and presented in table 4. 1 below:
Table 4. 1 : Summary of Unit Root Test Results Order of ADF Test Critical ADF Test
Variable Integration Statistics Statistics
SMEG I ( l ) -4.956069 ( -4.440739)*
ES I ( l ) -4.848829 ( -4.440739)*
GEE I(O) -4.3 1 5 1 83 (-3.6908 1 4)**
EC I( l ) -6.344767 ( -4.440739)* Source: Authors Computation, 2014 (Eview-7. 0)
Note: MacKinnon critical values for the rejection of hypothesis of unit root are in parenthesis in Columns 1 and 2 and the tests include intercept with trend; *significant at 1 %; **significant at 5%; *** significant at I 0; Mackinnon critical values
From table 4. 1 , only one variable GEE was found stationary at level f01m, and is uf an integrated order zero {that is I (0)} . At this order of integration, its ADF test statistics ( -4.3 1 5 1 83) is greater than the critical test statistics (-3.6908 14) ** at 5% significant level. However, the other three variables; SMEG, ES, and EC were found stationary at first difference, and they are integrated. At this order of integration, its ADF test statistics are greater than their critical test statistics at 1 % level of significance respectively. These stationary variables were then used for the log-linear multiple regression analysis.
4.2 Co-integration Test If two or more time series are not stationary, it i s important to test whether there is a linear combination of them, which is stationary. Variables are co integrated if they have a long term or equilibrium relationship between them (Dimitrious& Stephen, 2007). It is a pretest to avoid spurious regression situations. It is possible for a combination of some series to achieve long run equilibrium although they may be individually non-stationary. This phenomenon is referred to as the test for co-integration. The evidence of co integration implies that there is a long run relationship among the variables. Asteriou and Hall (2006) argued that where there are more than two variables in a model, there is a possibility that the emerging co integrating vectors governing the joint evolution of all the series will be more than one. This logic presents the superiority of Johansen Co-integration test over the Engle Granger approach. Thus Johansen Cointegration approach was adopted in this study.
Co integration Test Result and Interpretation Table 4.2 shows the results of the co-integration test, using the Johansen methodology. The results show that trace statistics test rejected the null hypothesis of no co-integration among the variables at the 5 percent level of significance. The trace statistics indicates 2 co integrating equations at the 5% level of significance. The co integration test results are therefore uninformative about the number of co integrating relations among the variables. Max-Eigen test indicates 2 co integration equations at the 5 percent level co-integrating equation.
The conclusion drawn from table 4.2 is that there exists a long-run relationship between our variables:
Abu) a Journal of Business and Management Vol. /, Issue I [110-123], March-2015 www.abujajournalofbusinessandmanagement.org.ng Page 1 1 7
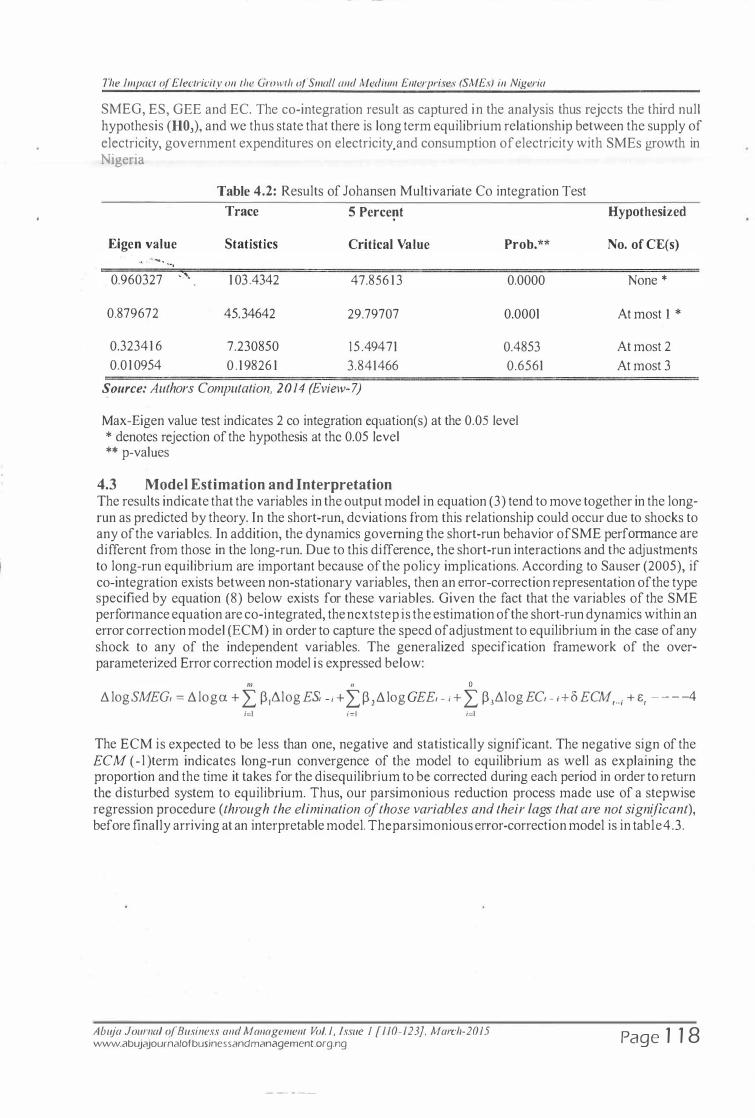
The Impact of Electricity on the Growth of Small and Medium Enterprises (SMEs) in Nigeria
SMEG, ES, GEE and EC. The co-integration result as captured in the analysis thus rejects the third null hypothesis (H03), and we thus state that there is long term equilibrium relationship between the supply of electricity, government expenditures on electricity. and consumption of electricity with SMEs growth in Nigeria
Table 4.2: Results of Johansen Multivariate Co integration Test
Trace 5 Percent
Eigen value Statistics Critical Value Prob.** . . ...... � ...
0.960327 ' '• 1 03 .4342 47.856 1 3 0.0000
0.879672 45.34642 29.79707 0.0001
0.32341 6 7.230850 15 .49471 0.4853 0.0 1 0954 0 . 1 9826 1 3.841466 0.6561
Source: Authors Computation, 2014 (Eview-7)
Max-Eigen value test indicates 2 co integration cquation(s) at the 0.05 level * denotes rejection of the hypothesis at the 0.05 level ** p-values
4.3 Model Estimation and Interpretation
Hypothesized
No. of CE(s)
None *
At most 1 *
At most 2 At most 3
The results indicate that the variables in the output model in equation (3) tend to move together in the longrun as predicted by theory. In the short-run, deviations from this relationship could occur due to shocks to any of the variables. In addition, the dynamics governing the short-run behavior ofSME perf01mance are different from those in the long-run. Due to this difference, the short-run interactions and the adjustments to long-run equilibrium are important because of the policy implications. According to Sauser (2005), if co-integration exists between non-stationary variables, then an en-or-correction representation of the type specified by equation (8) below exists for these variables. Given the fact that the variables of the SME perfonnance equation are co-integrated, the next step is the estimation of the short-run dynamics within an error correction model (ECM) in order to capture the speed of adjustment to equilibrium in the case of any shock to any of the independent variables. The generalized specification framework of the overparameterized Error correction model is expressed below:
m , 0 tJ. logSMEG, = tJ. Ioga + L P1tJ.log ES, - ; + L P2tJ.log GEE, - ; + L P3tJ.log EC, - ; + D ECMI-i + e, - - - -4
i=l i=l ;=)
The ECM is expected to be less than one, negative and statistically significant. The negative sign of the ECM ( - l )term indicates long-run convergence of the model to equilibrium as well as explaining the proportion and the time it takes for the disequilibrium to be conected during each period in order to return the disturbed system to equilibrium. Thus, our parsimonious reduction process made use of a stepwise regression procedure (through the elimination of those variables and their lags that are not significant), before finally arriving at an interpretable model. The parsimonious enor-correction model is in table4.3.
Ahuja Jouma/ of Business and Management Vo/. 1, Issue I [110-123}, March-2015 www.abujajournalofbusinessandmanagement.org.ng Page 1 1 8

The impact of Electricity on the Growth of Small and Medium Enterprises (SMEs) in Nigeria
Table 4.3: Parsimonious Error-Correction Results ofSMEG Dependent Variable : D(SMEG) Method: Least Squares Date: 08/14/14 Time: 1 5 : 2 1 Sample (adjusted): 1 992 2012 Included observations: 2 1 after adjustments
Vari able '
c D(SMEG(-1 )) D(ES)
D(GEE) D(EC) ECM(-1)
R-squared Adjusted R-squared
S.E. of regression Sum squared residual Log likelihood F-statistic
Pro be(F -statistic)
Coefficient Std. Error t-Statistic
-506.5606 0.297046 -2. 1 6E-07 -0.025484 59.46010 -0.403545
0.579762 0.299603 3258.072 1 .27E+08 - 1 93.7885 8.069404 0.023649
1 1 00.599 0.209573 4.52E-07 0.01 1 143 94.39284 0.21 9954
-0.460259 1 .4 1 7388 0.478501 2.286973 0.629922 -2.834678
Mean dependent variable S .D. dependent variance Alkaike info criterion Schwarz criterion Hannan-Quinn criterion. Dmbin-Watson stat
Source: Authors Computation, 2014 (Eview-7. 0)
4.4 Findings
Pr6b.
0.6536 0 . 1 8 1 8 0.6409 0.04 1 2 0.5406 0.04 1 5
1 8 1 4.880 3893.037 1 9 .3 1 3 1 9 1 9 .76084 1 9.41034 1 .788635
By examining the overall fit of the model, it can be observed that the parsimonious model have better fit as indicated by a higher value of the F-statistic 8.069 and it is significant at the 5.0 per cent level. The Fstatistics shows that the model is statistically significant, and as such, we reject the second null hypothesis (H02) and accept the alternative stating that the supply of electricity, government expenditures on electricity and consumption of electricity have a significant influence on SMEs growth in Nigeria. It can be observed from the results that the coefficient of the error correction term ECM (- 1 ) has the expected negative sign, less than unity and it is significant at the 5.0 per cent level. The significance of the error conection mechanism (ECM) suppmts co-integration and suggests the existence oflong-run steady-state of equilibrium with SMEG equation. The absolute value of the coefficient of the enor conection term thus indicates that about 40.35 percent of the disequilibrium in the small scale enterprises model is offset by short run adjustment within a year. In this case, the full adjustment is achieved, and takes twelve months to complete the cycles. Thus, to maintain a long-run equilibrium, it is important to reduce the existing disequilibrium overtime. The R2 of0.5797 indicates that about 57.97 per cent of the variation in SME growth is explained by electricity supply(ES), government expenditure on electricity(GEE) and electricity consumption(EC), while the remaining 42.03 percent is captured by the white noise enor term. The model also indicates that there is no autocorrelation among the variables as indicated by Durbin Watson (DW) statistic of l . 78( or 2.0 approximately). This shows that the estimates are unbiased and can be relied upon for policy decisions ·
4.5 Discussions ofFindings On apriority bases, it was expected that the electricity supply variable should have a direct relationship with SMEs growth in the economy, but based on our result, there exist an indirect relationship. It shows that due to erratic power supply or fluctuations in electricity supply, SMEs growth has been on the decline. Frequent power failures and inability of government to execute independent power projects (IPP) had all negatively influenced SME growth rates. This situation resulted in increased generator usage in the SME production processes that tend to increase the cost of overheads. More so, this slows down the pace of economic growth as a result of disruption of production activities. In other words, the production possibility frontier of the small scale businesses could not shift as far outwards as it would have been with sufficient electricity power. Secondly, social welfare diminishes because oflower output; increase in price
Ahuja Journal of Business and Management Vol. I, issue 1 [1 10-1 23}, March-201 5 www.abujajournalofbusinessandmanagement.org.ng Page 1 1 9
The Impact of Electricity on the Growth of Small and Medium Ente1prises (SMEs) in Nigeria
level emanates from higher production costs and there is reduction in consumption activities based on electricity power supply. At the microeconomic level, we have local producer losses which can be approximated by the downward shift in producers' profit lcycl due to irregular production activities, low capacity utilization and the need for runrung and mamtammg vel) expensive generators. Small scale producers however try to offset these costs through increase in product price to consumers so as to minimize losses. The function thus shows that a 1 . 0 percentage ( 1 .0%) change in electricity supply, results in 2. 1 6 percentage (2. 1 6%) decrease in SMEs growth.
The coefficient estimate of government expenditure on Electricity (GEE) on power sector is statistically significant but negatively signed. This is attributed to conuption and embezzlement of funds meant for power sector development. This equally justifies the negatively signed electricity production capacity in the country. This relationship as revealed in this equation indicates that it is imperative that the federal government ofNigeria hands off the electricity sub-sector of the country by inviting private participation and concentrate on the proper regulation of activities in the power industry such that small and medium scale investors will not be exploited through high tariff and poor power supply of the commodity. The government has started by selling off the distribution companies but needs to go a step further by selling off the generation after renewing the infrastructures through heavy investment.
The positive coefficient of electricity consumption variable agrees with our apriority expectation that the usage of electricity propels the growth of SMEs. This result is in conformity with the works of Adenuga and Ochu (20 13) who noted that no productivity and investment levels will take place without adequate power supply, and as the electricity consumption increases, investments are attracted to small and medium scale industries. In addition, the size of the investment program depends on the projected demand. Underestimation of demand in an environment of relatively high growth often leads to underinvestment and, consequently, an in-built disequilibrium between demand and supply. This situation has been characteristic of Nigeria's power situation. The statistical significance of the electricity consumption relationship captured in the model could have been due to the introduction of independent power project programme and the ongoing privatization of the power sector by the federal government. The function therefore shows that a 1 .0 percentage change in electricity consumption, gives a marginal increase of 54.46 in SME growth which is substantial.
One of the implications of the results is that in spite of increase in government expenditure, electricity supply had negative impact on SMEs growth. This position is supported by the works of Ayodele ( 1 998), Adenikinju (2008), Iarossi & Clarke (20 1 1 ). These all show that in addition to dwindling electricity supply generally on account of deteriorating infrastructures and corruption, supply for residential use had been increasing at the expense of supply for productive industrial use. While high-browse urban centers enjoy relatively better electricity supply, less urban and rural areas where most of the SMEs are located hardly have supplies leaving them with no other option but alternative power sources which are very expensive.
Though electricity consumption has the capacity to impact positively on the growth ofSMEs in Nigeria by up to 54.46% going by the results of our analysis, the limited and erratic supply has had very insignificant impact on SMEs' growth. The fact that the model, when cotTccted for unexplained variation, is significant means that when all the anomalies of investment not reaching its final destination, little electricity generated not getting to· the SMEs and the erratic nature of the supply, amongst other anomalies that characterized the Nigerian economic system, are corrected, the SMES in Nigeria will receive a boost. Reliable electricity power supply remains a Sine qua non for the growth ofthe SMEs in Nigeria.
Nigeria needs to adopt the principle of unbalanced growth towards balanced growth as advocated by Hirshman ( 1 958) by concentrating on the power sector which has the capacity of leapfrogging the growth of other sectors of the economy. Most modern technology use electricity; so for Nigeria to enjoy the advantages of modern teclmology, the electricity sector needs to be fixed as a matter ofurgency. There is the need to plug every leakage in the system by tackling conuption which is endemic. This should then be followed up with massive investment in the power sector to replace all the over-aged infrastructmes. The Private Public Partnership agreement in the power sector should be intensified with every political will and be governed by transparency and rule oflaw.
Ahuja Joumal of Business and Management Vol./, Issue I [110-123}, March-2015 www.abujajournalofbusinessandmanagement.org.ng Page 1 20

Tire Impact of Electricity on the Growth of Small and Medium Enterprises (SMEs) in Nigeria
References Adaramola, A0.2012, Policy Support and Performance of Small and Medium Scale Enterprises
in South� West Nigeria. European Journal of Business and Management Vol. 4, No. 9 Adenikinju, A. 2008, the Efficiency of the Power Sector and its Impact on the Competitiveness of
the Nigerian Economy and Economic Management. Journal of Economic Management, 7 . 1), pp 1-38
Adeniran, A., .. 2009, Does Energy Consumption Cause Economic Growth? Empirical Evidence from Nigeria
Adenuga, A.O, and Ochu, E.R, 20 13, "Electricity Consumption, Exports and Economic Growth: Evidence from Nigeria. Open Research Journal ofEnergy, 1 (J), pp 01-1 7
Aliero, HM. and Ibrahim S.S .20 12, The Relationship between Energy Consumption and Economic Growth in Nigeria: A Causality Analysis, International Journal of Marketing and Technology, Vol.2 Issue 3.
Ariyo, D,2008, "Small firms are the backbone of the Nigerian Economy. Africa Economic Asteriou and Hall 2006, Bounds Testing Approaches to the Analysis of Level Relationships.
Journal of Applied Econometrics, vol. 1 6, pp289-326 Audretch, DBI. Verheul, S. Wennekers& AR TThurik, 2002, Entrepreneurship.Springer, Berlin.
Analysis,Academy ofManagementJournal, Vol. 1, No. 1, pp109-124 Ayesha, JF .2007, Effect ofMultiple Taxation on the Performance of Small and M e d i u m
Scale Business Enterprises. .A Study of West African Ceremics Ajeokuta, Kogi State) Mediterranean Journal of Social Sciences., 4. 6)
Ayodele, AS .2004, Improving and Sustaining Power .Electricity) Supply for Socio-economic Development in Nigerian, NISER, Ibadan
Ayodele, AS . . 1 998, Energy Crisis in Nigeria: The Case of Electricity Energy Market. The Bullion, CentralBankofNigeria . CBN), 22 .4, pp 1 9-24
Ayozie, DO. andLatinwo, H.K. .20 10, Entrepreneurial Development and Small Scale Industry Contribution to Nigerian National Development: A marketing Interface. Information Management and Business Review. 1. 2), pp5 1-68.
Bolaji,A .2008, Electricity consumption and economic growth in Nigeria: Evidence from co integration and co-feature analysis. Journal of Policy Modelling.2009, vo/. 31, pp681-693.
Central Bank Nigeria .20 1 2, Statistical bulletin, Central Bank ofNigeria, vol. 22. 1 ) Darling G, et al. 2008, The causal relationship between electricity consumption and economic
growth in theASEAN countries. EnergyPolicy.2006, vol.34, pp3573-3582. Dimitrios, A and Stephen, GH.2007, Applied Econometrics,· A Modern Approach, Palgrave Macmillian, United States Egelen JG,Lieht and F. Stail, 1 997, "Firm Foundation and the Role of Financial Constraints ",
Small Business Economics, vo1.9, pp. 1 37- 1 50. Fabayo, K. .2009, "A multiple Strategy for Small and Medium Scale Enterprises", International
Finance Corporation Discussion faper, vol. 40, April. Garba,AG, 2002.ldentifying Market, Institutional and Financial Barriers to the implementation
of Renewable Energy Technologies in Nigeria. Proceedings of the International Conference of the Nigerian Association of Energy Economics.pp45-66
Gibb A. and J. Richie, 2002, 'Understanding the process of starting small business', European Small Business Journal, 1 . 1), pp. 12-23
Gerschenkron, A . . 1 962, The Approach to European Industrialization: A Post Script in Economic Backwardness in Historical Perspective .USA: Harvard University Press).
HaiTis, ML. and Gibson, SG. 2006, Developing The Common Problems Of Early Growth of Small Business in Eastern, North Carolina. SAM Advanced Management Journal 2 . 7 1 .2)
A buja Journal of Business and Management Vol. /, Issue I [II 0-123 ], Marclr-2015 www.abujajournalofbusinessandmanagement.org.ng Page 1 2 1
The Impact of Electricity 011 the Growth of Small and Medium Ente1prises (SMEs) in Nigeria
Henriques, M and Klock, H . 1 999, Citizen versus consumer: challenges in the UK green power market. Energy Policy. 200 1 ; 29, pp 4 79-487.
Hirshman, AO. 1 958, The Strategy of Economic Development. New Haven, Conn:Yale U niversity Press. ISBN 0-300-00559-8
Hossain, Md., S . , .20 1 2, . Multivariate Granger Causality between Economic Growth, Electricity Consumption, Exports and Remittance for the Panel ofThree SAARC Countries, Global
. Journal ofManagement and Business Research, 12 .4) Version 1 .0 March 20 1 2 Hulbert, BA. Gilmore and D. Carson. 20 1 3 , Sources of Opportunities Used by Growth Minded
Owner Managers of Small and Medium Sized Enterpreises. Int. Bus. Rev; 22, pp293-303 . Ibitoye.F.I and Adenikinju.A. .2007, Future Demand for Electricity in Nigeria, Applied
Energy84.2007) 492-504. http//:www.elsevier.com/locate/apenergy. Kayanula K, and Quatrtey, 2005. OrganizationalBehaviow: New Delhi: McGraw, Hill, Irwin Iarossi, G. and Clarke, GRG . . 20 1 1 , Nigeria 201 1 : An Assessment oflnvestment Climate, World
Bank, Africa Finance and Private Sector Development .AFTP), June 20 1 1 . Muritala, M et al, 20 1 2, "The Power Sector: The Catalyst for Economic Growth &
Development "Presented by the Hon. Minister Power & Steel and Chairman of the NEPA Technical Committee. At an interactive forum with Mr. President
Nasir,E .2009, Renewable Energy for Rural development: The Nigerian perspective. ISESCO: Science and Technology Vision, Vol. 1, May, 2005.
Obitayo, KM . . 200 1 , Creating an enabling environment for small scale industries. CBN Bullion Vol .25) No 3
Odiaka, KM, .2006, Empirical Analysis of the Causal Relationship Between Electricity Consumption and Economic Growth in Nigeria.British Journal of Economics, Management and Trade. 2013: 3, pp2 77- 295.
Ojo, 0 .2009, "Impact of Micro Finance on Entrepreneurial Development: A case of Nigeria ". Apaper presented at the International Conference on Economic and Administration, Organized by the Faculty of Administration and Business, University of Bucharest, Romania, 14'"- 1 5'" November, 2009.
Owualah, SI. 1 987, "Proving Necessary Economic Infrastructures for Small Businesses, Whose Responsibility?" International Small Business Journal, Vol. 6, No. 1, Autumn, pp. I 0-13.
Pesaran, MI-l., Shin, Y and R Smith . . 200 1 ). Bounds Testing Approaches to the Analysis of Level Relationships. Journal of Applied Econometrics, vol. 16,pp 289-326.
Razzaqi et al .20 1 1 , Rural public acceptance of renewable energy deployment: The case of African economies .Applied Energy. : vol. 1 02, pp 1187-1196
Rosenstein-Rodan, P. . 1 943, The Problem of Industrialization of Eastern and South-Eastern Europe. EconomicJournal, 53,202-211.
Safiriyu, AM. Awolaja, AM. &Bako, Yusuf. A. 2012, "Impact of Small and Medium RosensteinRodan, P . . 1943) The Problem oflndustrialization ofEastem and South-Eastern Europe. Economic Journal, 2-0122, pp53-211.
Safiriyu, AM and Njogo, BQ .20 1 2, Impact of Small and Medium Scale Enterpris�s in the Generation of Employment in Lagos State. Kuwait Chapter of Arabian Journal of Business and Management Review. Vol. 1 no. 11
Salami TW . . 2003, "Investment in Entrepreneurial Ability", Scandinavian Journal of Economics 82. Sambo A . . 2008, Strategic Development in Renewable energies in Nigeria. International
Association for Energy Economics. 3 rd Quarter, pp 15-19 Sauser, WI. Jr . . 2005, Starting Your Own Business? Prepare for Success. SAM Management in
Practice 3 . 1 ), pp 1 - 4 Stokes, D . and Wilson, .2006, Small Business Management and Enterpreneurship.5'"Edn;
Thomson, UK.
Ahuja .lou mal of Business and Management Vol. I, Issue I [I IO-I 231. March-20I 5 www.abujajournalofbusinessandmanagement.org.ng Page 1 22
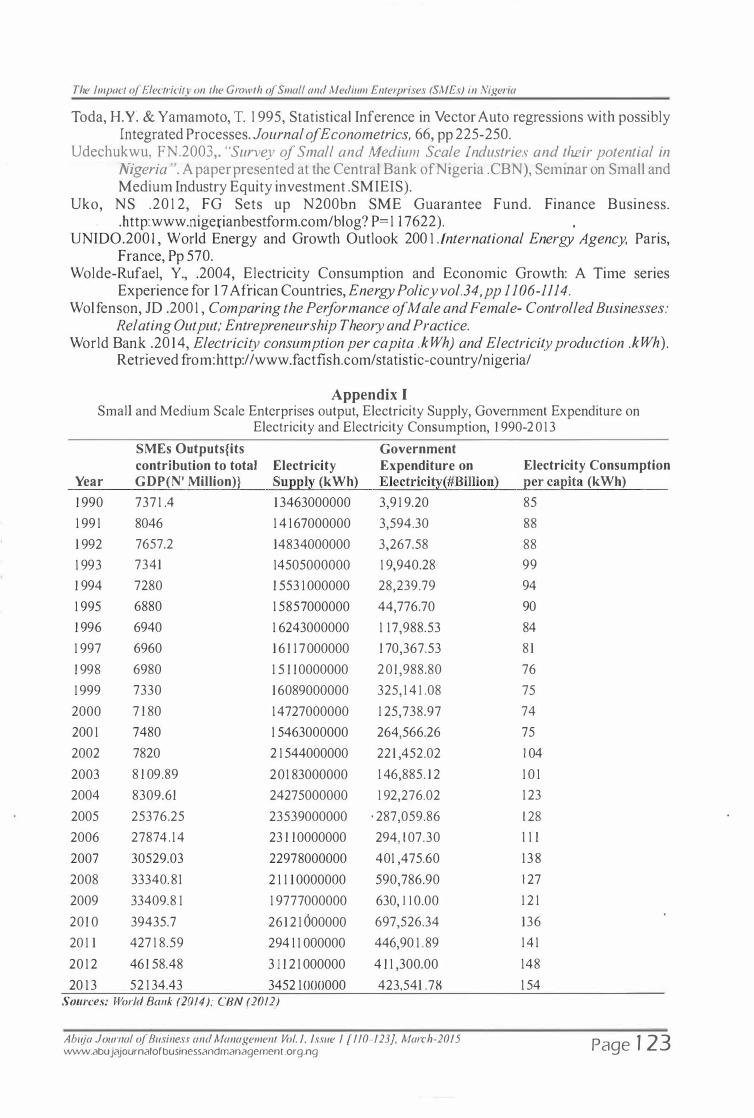
The Impact of Electricity on the Growth of Small and Medium Ente1prises (SMEs) in Nigeria
Toda, H.Y. & Yamamoto, T. 1 995, Statistical Inference in Vector Auto regressions with possibly Integrated Processes. Journal of Econometrics, 66, pp 225-250.
Udechukwu, FN.2003,. "Survey of Small and lvfedium Scale industries and their potential in Nigeria . A paper presented at the Central Bank ofN 1geria . CBN), Semmar on Small and Medium Industry Equity investment .SMIEIS).
Uko, NS .20 1 2, FG Sets up N200bn SME Guarantee Fund. Finance Business . . http:www.nige.r;ianbestform.com/blog? P= 1 1 7622). .
UNIDO .200 1 , World Energy and Growth Outlook 200 l .Jnternational Energy Agency, Paris, France, Pp 570.
Wolde-Rufael, Y., .2004, Electricity Consumption and Economic Growth: A Time series Experience for 1 7 African Countries, Energy Policy vol. 34, pp 1 106-1114.
Wolfenson, JD .200 1 , Comparing the Performance of Male and Female- Controlled Businesses: Relating Output; Entrepreneurship Theory and Practice.
World Bank .20 14, Electricity consumption per capita .kWh) and Electricity production .kWh). Retrieved from:http://www.factfish.com/statistic-country/nigeria/
Appendix I Small and Medium Scale Enterprises output, Electricity Supply, Government Expenditure on
Electricity and Electricity Consumption, 1 990-2 0 1 3
SMEs Outputs{its Government contribution to total Electricity Expenditure on
Year GDP(N' Million)} SUJ!J!l� (kWh) Electricity(#Billion)
1 990 737 1 .4 1 3463000000 3,9 1 9.20
1 99 1 8046 1 4 167000000 3,594.30
1 992 7657.2 14834000000 3,267.58
1 993 7341 14505000000 1 9,940.28
1 994 7280 1 553 1 000000 28,239.79
1 995 6880 1 5857000000 44,776.70
1 996 6940 1 6243000000 1 17,988.53
1 997 6960 1 6 1 1 7000000 1 70,367.53
1 998 6980 1 5 1 10000000 201 ,988.80
1 999 7330 16089000000 325, 1 4 1 .08
2000 7 1 80 14727000000 1 25,738.97
200 1 7480 1 5463000000 264,566.26
2002 7820 2 1 544000000 221 ,452.02
2003 8 1 09.89 201 83000000 1 46,885. 1 2
2004 8309.61 24275000000 1 92,276.02
2005 25376.25 23539000000 . 287,059.86
2006 27874 . 14 23 1 10000000 294, 1 07.30
2007 30529.03 22978000000 401 ,475.60
2008 33340.8 1 2 1 1 1 0000000 590,786.90
2009 33409.8 1 1 9777000000 630, I I 0.00
201 0 39435.7 261 2 1 000000 697,526.34
20 1 1 427 1 8.59 294 1 1 000000 446,90 1 . 89
20 1 2 461 58.48 3 1 1 2 1 000000 4 1 1 ,300.00
20 1 3 52 1 34.43 3452 1000000 423,541 .78 Sources: World Bank (2014); CBN (2012)
Ahuja Journal of Business and Management Vol. I. Issue I [110-123}, March-2015 www.abujajournalofbusinessandmanagement.org.ng
Electricity Consumption l!er caEita (kWh)
85
88
88
99
94
90
84
8 1
76
75
74
75
1 04
1 0 1
1 23
1 28
1 1 1
1 3 8
1 27
1 2 1
136
14 1
148
1 54
Page 1 23
Takaful (Islamic Insurance) In Nigeria: Hopes, Hurdles and Harmonization
Abdul-Maliq, 0. Yekeen', Salaudeen, M. Yinka.2 '(Department of Banking and Finance, University of Abuja, Gwagwalada - Abuja)
2(Department of Accounting, University of Abuja, Gwagwalada - Abuja)
Abstract: This paper investigates the prospects of successful operation of Islamic (Takaful) Insurance in Nigeria especially from the regulatory perspective. Having successfully experimented with Islamic banking, the Nigeria monetaty authorities seem to have followed up with an adequate and in appropriate legal platform for Takaful operation. Adopting a prognostic analytical approach, the paper assembles analyses and synthesizes the factors that will enhance success of Takaful in Nigeria as well as those factors that may imitate against it. The paper observes that while Takaful has a bright prospect in Nigeria, public acceptance will be a challenge except ifTakaful companies can outperform or at least, perform as well as conventional insurance companies. One way of doing this, the paper observes, will be by delivering estate and commercial property, especially the types that are more affordable than are presently available under conventional financing. The researchers opine that the success of Islamic insurance in Nigeria will not only help the spread of Takafid and other Islamic financial institutions in Africa and other emerging economies, it will also help reverse the insinuation that Islamic finance is petro-dollar driven. The paper postulates that a re-enactment in Nigeria of Dubai, Qatar and Bahrain property and other development miracles will be more enduring evidence of the success ofislamic finance in Nigeria than
flashy profitability and return on investment or mere recourse to the philosophical
palatability of Islamic injunctions which many are trying assiduously to abuse. Keywords: Takafid, maumalat, halal, haram, Sukuk, Jaiz.
1. Introduction With the successful take-off oflslamic banking in Nigeria with its flag-ship bank (the Jaiz Bank Nigeria) in 20 12 , and following the work of(Jankara 201 3); it appears that Nigeria bas finally opened its doors to a new window of financial resource flow that has been opening in the world for over fifty years now. On the heel of Jaiz bank in Nigeria is the emergence oflslamic Insurance (Takaful). According to the Institute of Islamic Banking & Insurance, IIBI, (2007), Takaful is essentially a cooperative system for the reimbursement or compensation made to people or organizations who suffer losses out of a fund to which they all agreed to make small regular 'donations' and managed by an operator (the Takaful manager) in compliance with Islamic injunctions.
When the Banks and Other Financial Institutions' Decree (FGN, 1 99 1 ) provided for Islamic (Profit and Loss Sharing) banks in Nigeria, the psychological gap between Nigerian Muslims and Christians on Islamic financial institution was not as large as it was in the early 2000s when Islamic banking was to actually begin operation in Nigeria. This psychological gap evoked lots of verbal tussle and near squabble between Nigerian Muslims and non-Muslims. The rancorous reception meted out to Islamic banking, especially by the non-Muslim public could be attributed to three factors. (i) the misrepresentation, misconception and or misunderstanding oflslamic banking as a purely Islamic or Muslim institution (ii) Lack of awareness by some members ofthe public; including Muslims, as intoned by Bello (2006) that Islamic banking (non-interest banking) has Judio- as well as Christian origin and (iii) the fact that in recent times fundamentalists/Islamists who prefer the forceful propagation of Islamic ethics have frightened people and therefore negated the finer theological and moral aspects oflslam.
With the take-off of Jaiz bank and its successful operations for some years now; having non-Muslim board members, shareholders as well as staff, and as can be deduced from Ashraf (2008), it appears that Nigerians are becoming more at home with the tenets oflslamic finance in general and therefore hopefully Takaful too.
Secondly, notwithstanding the Isla mists' activities, the world, including people in non-Muslim dominated countries arc keying into Islamic finance and accepting the fact that how a few people prefer to propagate
Ab11ja Joumal of Business and Management Vol./, Jss11e I [124-131}, March-2015 www.abujajournalofbusinessandmanagement.org.ng Page 1 24
Takafu/ (Islamic Insurance) In Nigeria: Hopes, Hurdles and Harmonization
Islam should not be confused with what Islam itself stands for. The result is that many developed countries: Britain, USA, Canada, Germany, Luxemburg Switzerland, France, as well as developing ones Malaysia, Pakistan, South Africa. and many others now have interest free banking and other Islamic financial institutions, both de-facto as well as operating window versions It is therefore hoped that Takaful insurance will soon effectively take root in Nigeria where NBF News (20 1 1 ) and Cornerstone Insurance Co. (20 12) repot that at least three insurance companies are already fully involved.
Islamic finance issue became topical in the closing years of the last to the first few years of the new century, especially in 2000-2004. The focus then was simply Islamic banking which as we noted earlier evoked lots ofrancour. Since then, other Islamic financial institutions and instruments like Takaful and Sukuk (bond) have been of interest to both researchers and practitioners. However, only a few researches have been undertaken in these areas. Ashraf (2008), Ibrahim (20 1 1 ) and Ejiofor (20 1 3) are among the few such research works. Although Ibrahim (20 1 1 ) examined the challenges and options of Islamic finance in Nigeria, the work did not look specifically into Takaful. While Islamic financial institutions and instruments seem to have come to stay in Nigeria, it will be inappropriate to take such semblance of acceptance as hope for success. It is therefore necessaty to inquire into the factors that may enhance acceptance and therefore engender success as well as those that may militate against it.
This paper, although somewhat in line with Ashraf (2008) and Ibrahim (20 1 1 ) look specifically at three fundamental issues that are considered germane to the successful operation of Takaful in Nigeria . The research focuses on i), the hopes (prospects), ii); hurdles (challenges) and iii) the approaches (modus operandi) which can engender not only smooth Takaful operations but also make it collectively beneficial to Muslims and non-Muslims alike.
2. Takaful Insurance: Origin, History and Typology. 2.1 Origin and History ofTakaful Insurance. Hussain and Pasha (20 1 1 ) say Takaful is based on the principal of Aqilah, meaning mutual cooperation. This, according to them was not only practiced in the time of the Prophet but was made compulsory later in the second Caliph. In addition, Hussain and Pasha (20 1 1 ) confirm that in the 1 4'h - 1 7th Centuries, under the Sufi Order, the principle of Aqilah was very active in Port cities like Malabar and China when it served more or less like a Marin travel insurance company. Hussain and Pasha (20 1 1 ) , citing Klingmuller ( 1 969) further reveal that although Muhammed Baqit Mufti of Egypt approved the idea oflslamic Insurance as far back as 1 906, it was only in Sudan in 1 979 that the first Islamic Insurance Company, simply known as Islamic Insurance Company Ltd was established. According to them, the company distributed profit of up to 5%, 8% and I 0% in 1 979, 1 980 and 1 98 1 respectively. They also reveal that several other countries, notably Pakistan in 2004 and most of the Gulf Cooperation Council (GCC) countries have since then established Islamic Insurance Companies.
Yusuf (201 2) observes that Aqilah, meariing "blood money", is a somewhat compulsory payment by people to others or the relations of others when they suffer looses especially by death of their loved ones, hence the concept of 'social solidarity'. According to him, this was enshrined in Article 3 ofthe Madinah Constitution. (See: also Fisher and Taylor, 2000). Yusuf (20 1 2) citing Islamic Financial Services report shows that Islamic insurance business is about US$2-3 billion and is expected to grow by $7.4billion till
'20 1 5. They also report that there are at least 80 de-facto-Takaft.tl companies in existence worldwide as well as about 200 others that operate Takaful windows.
Bank Islam Malaysia Berhad (BIMB) ( 1 994) contextualizes Islamic finance as falling under muamalat. Muamalat is God's (Allah's) provisions or rules that govern man in his relation with his fellow men. However, Sharia; the Islamic code of conduct which regulates man's entire conduct, apart from the outrightly forbidden acts (Haram) also incorporates some other components of which Muamalat is one. In muamalat, arc three sub-divisions-haram, mandub (mustahab) and jaiz. Haram, are acts unequivocally prohibited by Allah. These, in man's relationship with his fellow men include interest on money borrowed (Riba/Usurery); garral, (uncertainty) and Maisir (gambling); (sec Bhatty, 20 1 1 ; Al-Salam Bank Bahrain, 20 1 1 ; Vizcaino &Torchia, 20 12 ; Ross, 20 14). In the Noble Quran, 3 : 1 30 and 2:275, the prohibition ofRiba (usurary) and the punishment attributable to it are clearly spelt out. Mandub are acts which Allah frowns
Abuja Journal of Business and Management Vol./, Issue I [I 24-131}. March-2015 www.abujajournalofbusinessandmanagement.org.ng Page 1 25
Takajitl (Islamic Insurance) In Nigeria: Hopes, Hurdles and HarmonizatiOn
at but the commission of which is not punished while J aiz are acts to which Allah is indifferent provided they do not incorporate hararn. It might be proper too to interject, here, that in the Holy Bible also; Exodus; 22:25, Leviticus 25:3�-37 and Luke 6:34-35, God also specifically prohibit (usury) (see also, Bello, 2006; Bombalc. 2007). To this extent therefore, we can conclude that the basic point of departure of Islamic Insurance from conventional Insurance, IS actually m canonical and junstic semantics smce they both have similar origin and intents.
One of the main rea�ons for the resurgence of Islamic finance is "the disenchantment with the value neutral capitalist and socialist financial systems which led not only Muslims but also non-Muslims to look for ethical values in their financial dealings" (UBI, 2007); Memon (2007) corroborates (IIBI, 2007), saying "the inadequacy of the prevailing economic system in promoting real economic wellbeing of the masses is a strong impetus to the rise oflslamic finance/banking". IIBI (2007), in line with (Fisher and Taylor, 2000) and corroborated by Bank Negara Malaysia, (2009) however admits that the increase in financial resources of the Arab countries especially, oil producing Gulf countries contributed to the rise of Islamic finance.
2.2 Islamic and Conventional Insurance: Comparison and Contrast To all intent and purpose, insurance is insurance whetherTakaful or conventional in that each is a financial device/mechanism to assist members of a group from their collective pool of fund if or when they suffer pre-defined losses. To this extent therefore, their points of contrast may be more relevant in this research. From strictly legal point of view, conversional insurance is a simple contract of indemnity, Takaful is a three-in one mechanism- a guarantee, an indemnity and an investment or partnership all in one. The most important difference between conventional and Islamic insurance will be the same basic difference between Islamic and conventional finance as outlined by J amaldeen (20 14 a&b ).
Padfied ( 1 979), describes a guarantee as a contract between two parties, the guarantor (surety) and a creditor, where the guarantor (surety) undertakes - holds himselfliable to a third party [the creditor] - for the debt or wrongful act [tort] of another person; a primary debtor. A guarantee is therefore an auxiliary contract, dependent on a primary contract; that bt:twt:t:n tht: dt:btur who is bt:ing guaranteed and lht: creditor. The contract of guarantee only crystallizes on the default of the primary debtor. A contract of indemnity on the other hand, is a primary and direct contract between two parties; the insured and the insurer, where the insurer, in consideration of periodic regular payments (premiums) by the insured undertakes to indemnify the insured in the event of the occurrence of a specified incident resulting into loss. Therefore, while both contracts of guarantee and indemnity are contingent liabilities, guarantee is contingent only on the action or default of a third party pre-supposing that there is a primary contract. The contract of indemnity on the other hand is contingent on the occurrence or non-occurrence of a specified event and the contract is primary and direct.
Based on Billah, ( 1 998); Omar & Dawood, (2000); Ayuba, (2003), Billah, (2003); Khan, (20 1 1 ) we can discern at least five characteristics which differentiate Takaful Takaful from conventional insurance. Islamic insurance, (Takaful) as we can sec from the discussion this far, is a contract where (a) the insured contributes (donates) to a fund, part of which he may renounce in favour of all others by way of guarantee or suretiship for others (b) expects to be indemnified in the case of specified loss and (c) shares in the profit of the insurer-the Takaful operator who is obliged to invest the fund only on sharia-complaint (ethical, permissible or Halla!) businesses.
Secondly, although Takaful falls under muamalat-action of man vis-a-vis his fellow men, the haram provision extends to it as to all of man's activities. In this regard specifically, the insurer (takaful operator) can invest the Takaful funds only on hallal businesses which exclude production and distribution of alcohol, pornography, pig and its deriv�tives.
Thirdly, the Takaful operator is obliged, under Islamic law- the sharia- not to earn interest (Riba) of any kind from the usc o f the fund; nor to expose the funds to excessive risk or uncertainty; garrall. Final ly, the Takaful operator is obliged to share any profit (or loses) with the insured on a pre-agreed basis. Hence the insured in a Takaful insurance is a guarantor, insured as well as a partner or shareholder in the Takaful business.
Abu} a Journal of Business and Management Vol. /, Issue I [ 124-131 }, March-20 15 www.abujajournalofbusinessandmanagement.org.ng Page 1 26

Takaful (Islamic Insurance) In Nigeria: Hopes, Hurdles and Harmonization
Furthermore, in the view of Hussein & Pasha (20 1 1 ), the concept ofTa-awun -joint guarantee - is a basic principle ofTakaful which implies responsibility sharing or social solidarity "bringing equity to all parties involved" as described by Maysami & Kwpn, ( 1 999), Maysami ct al, ( 1 997). In the words ofMatsawali, e.t al (20 12 ), Takaful i s based on the principle of Tabarru - voluntary contribution. In addition there is an implied understanding of joint venture or partnership in that the takaful manager is obliged to share profit and loss as the case may be, with the contributors who are not just insured but also partners or shareholders, which is not the case in conventional insurance. According to Ahamed (20 13), this is in keeping with the Islamic injunction against 'unlawful appropriation of others' property'. ·
Billah ( 1 998) and Hussein & Pasha (20 1 1 ) submit that central to Takaful is Aquila which implies restoration or indemnity based on one's own contribution (donations) as well as Ta-awum - joint guarantee. In conventional insurance, premiums are determined by the insurer and profit or loss belongs exclusively to the insurer. In takaful contribution (donations) which can be regarded as analogous to premium are determined by the insured and he/she also shares in the profit of the business. Omar and Dawood (2000) posit that Takaful entails risk distribution or risk sharing which one can argue is what conventional insurance equally entails except that while in conventional insurance the contract ends in this risk sharing, in Islamic insurance there are complementary extensions of relationships.
On the investment ofTakaful funds, A yuba (2003) and Kahn (20 1 1 ) confirm that Takaful funds can only be invested in sharia complaint (Halla!) business which excludes interest earning investments (Riba), Pork production and distribution as well as alcohol and pornography. Also prohibited for Takaful investment are maisir-gambling and garrals uncertainty. This is not the case with conventional insurance where the insurer can invest in any business of his choice. It must be noted however that there are also restrictions on investment of funds in conventional insurance, although not on religious bases.
In a nutshell therefore we can summarize the basic differences between conventional insurance and Takaful as follows: (a) Takaful is a contract of indemnity and guarantee (b) it entails a partnership or joint business relation (c) it is hased on Rrotherhood or, solidarity rather than as a pure business undertaken; (Jankara, 20 1 3), (d) profit and loss sharing, (e) prohibition of certain business engagements and (f) voluntary contribution or premium rather than insurer-determined and fixed type of premium as in conventional insurance.
2.3 Models ofTakaful Insurance Jamaldeen (20 14) reveals that there are basically four models oflslamic Insurance: (i) Mudharabah Model (ii) Wakala model (iii) A combination ofi & ii and (iv)Al-WaqfModel.
2.3.1 The Mudharabah Model Mudharabah per se, means sharing profit and losses of a business jointly owned by investors and managers but principally managed by the mudarib; the investment manager. In Mudharabah model of Takaful, which according to Wikipedia free encyclopedia was "used initially" in the far east; policy holders contribute (donate) to the Takaful managers some sums of money at regular intervals and share in the profit and loss there-off after which some people may have benefited by way ofTakaful indemnity. This presupposes that each 'pool of fund' for a specified risk or across time is utilized to indemnify the insured who suffer the prescribed loss within a prescribed period. The remnant there-off is distributed after the time when the risk is expected to have passed.
2.3.2 Wakala Model Bank Ncgara Malaysia, (BNM) (2009), and Wikipedia free encyclopedia, say wakal - meaning representation or wakili - representative is applied to Takaful. Thus, in the Wakala model, agency fees arc received upfront from the contributors and transferred to the wakili's fee account while further contributions are applied for indemnity and other businesses and the shareholders/policy holders will share in the profit or loss if any.
Abu) a Journal of Business and Management Vol. /, Issue I [ 124-13 1 ]. March-20 15 www.abujajournalofbusinessandmanagement.org.ng Page 1 27
Takafit! (islamic Insurance) In Nigeria: Hopes, Hurdles and Harmonization
2.3.3 Hybrid Model ofl & TI This model combines both the mudarabah and wakala characteristics. According to BNM (2009), this model is common in Bahrain., UAE and Middle East. In the hybrid model, each risk class has a set of contribution which is designated for the wak.ili's fee those for indemnifYing contributors and an investment portion managed by the wakili. Thus, the first portion is of the wakala model while the indemnity and investment management are operated in the mudaharabah fashion.
2.3.4 TheAI-WaqfModel This model involves committing an irredeemable portion of members' contributions to the Takaful operation while the balance is administered in indemnifying and other accepted Takaful businesses. This mode according to BNM, (2009), Vizcaino & Torehia, (20 12) is practiced in Pakistan and South Africa.
3.0 Takaful in Nigeria: A Prognostic Analysis According to Ashiake (201 3) , Sanusi; the erstwhile governor of the Central Bank of Nigeria (CBN) maintains that properly structured, Islamic bond (Sukuk) can complement governments' efforts in infrastructure development. Recalling that insurance companies have large reservoirs of funds that can be committed to longer term investments, it goes without saying that Takaful has a potential of deepening the Nigerian bond market. As of now, some conventional insurance companies have delved into Takaful, both as windows as well as de-facto activity. (Cornerstone Insurance Pic (20 1 2). The accumulated funds which cannot be invested in interest earning bonds will lie fallow unless non - interest bonds can be developed in which the huge surplus investment fund can be invested.
NBF News, (20 1 1 ), confirm that Takaful policies are now available in almost all areas known to conventional insurance such as women compensation, Motor Takaful scheme; Osra Plan; (family Takaful), AL-Narr wa sarkhol (Fire & Theft), AL-mansil Takaful (property guard Takaful) and many more. It is also reported that Takaful has even reached reinsmance level called retakaful. NDIC (2014) reports that the CBN has put in place a robust regulatory framework to govem Islamic finance/Banking in Nigeria. These include approval of new model for Islamic Banking in 20 1 0, with N l Obn and N6bn minimum authorized paid up capital for national and regional Islamic banks respectively as well as NDIC's framework for non-interest deposit insmance scheme. The CBN has also instituted corporate governance mles for Islamic finance institutions including that Banks and other Islamic financial and nonfinancial institutions should have intemal compliance mechanism which of course must incorporate Sharia advisory provisions and other Islamic provisions governing commercial and contractual activities as highlighted by Bombale (2007) and Das- Augustine (2014). Given all the above, it can safely be concluded that not only has Islamic banking found its feet in Nigeria, but also that Takaful (Islamic insmance), sukuk (Islamic Bond) etc have taken off in principles.
4.0 Takaful in Nigeria: Hopes, Hurdles and harmonization 4.1 The Hopes With the successful take-off and operation of Jaiz (Islamic) Bank in Nigeria without any noticeable Muslim/Christian divide in shareholding structure, board membership, staffing or customers focus, it is obvious that Nigerians and soon other African countries yet to, will begin to reap the benefits oflslamic finance and provide at least an expansion as well as an .alternative window of banking and finance in Nigeria and elsewhere.
In addition, Abdul-Maliq (20 1 0) observed that Islamic banking has a large potential in Nigeria given that Nigeria is the 7'h largest country in the world (by population); as well as Africa's largest economy, also by population and recently by GOP size. Nigeria is also the third largest country by population with 50% or above Muslim proportion. Magaj i et al (20 1 3}, also observed the growth potentials of Islamic banking [finance] in Nigeria. What is favorable to Islamic banking will naturally help Takaful grow in Nigeria and elsewhere.
While it is proper to reiterate here that, Islamic finance is not for Muslims alone, there is no doubt that a large Islamic adherent population can more easily arrow-head Islamic finance. So, it could be expected
Abu) a Journal of Business and Management Vol./, Issue 1 [124-131}, March-201 5 www.abujajournalofbusinessandmanagement.org.ng Page 1 28
Takaful (Islamic Insurance) In Nigeria: Hopes, Hurdles and Harmonization
that Nigeria's Muslim population of 80 million or more can be a very good start-off force for Islamic finance especially if run in strict compliance with Islamic injunctions and if it is noted to be beneficial to all and sundry in the true spirit oflslam.
4.2 The Hurdles and Expectations: Ejiofor (20 13) cited Mustapha Bintribi; former Managing Director: Jaiz Bank Nigeria as saying "in Nigeria many people told me it [jaiz bank] was not possible. But today, with a modest beginning, it is going to stay and is going to make impact in this economy". The experience of banks in Nigeria; with bank failures and distress syndrome being a recurring decimal in Nigeria (See Nwankwo, 1 980; NDIC, 20 14); the only ways Islamic finance can make a difference are (a) to perform better than the conventional financial institutions (b) be less expensive (c) be more accessible and affordable and (d) more than any other thing else, be visibly transparent, sticking to Halla! business and still remaining profitable.
Jaiz B ank Nigeria at its Annual General Meeting (AGM) 2014, revealed its plan to open about eight (8) new branches across the country. It will do well not to proliferate but to concentrate; to ensure that the next few branches it opens are not only successful but also focused, concentrated and consolidated; because the successes or failures of Jaiz bank and by extension Takaful will be judged not against its flag-ship companies but against other high performing conventional banks and insurance companies in Nigeria and even abroad. The public will find it hard to accept the conceptual and operational differences between conventional and Islamic finance as a ground to justify poor performance of the later. More importantly; asset, especially prope1ty based investment; affordable and available nationwide, may be a faster way of achieving and communicating its success to Nigerians rather than some fanciful financial ratios such as profitability and return on investment. It is opined that Jaiz Bank and Takaful company would have performed outstandingly well if they can deliver 5000 housing units or more in Abuja, Lagos, PortHarcourt and other Nigerian cities in the next 3-5 years at end-users rate 25-30% lower than what conventional banks and mortgage institutions are offering now. Not only that but also to make them available to all comers irrespective of gender, religion or any other bias.
In a similar vein, if Jaiz Bank; in conjunction with Takaful Nigeria could design Islamic bond (Sukuk) that gives one-hundred thousand Nigerians affordable cars every year on non-interest bases, Islamic finance in general and Takaful in particular would have performed to or even beyond Nigerians expectations. The paper does not identify how Dubai (UAE), Bahrain and Qatar are financed but being leading GCC members and frontrunners in Islamic finance, a replication of their experiences and achievement in Nigeiia will not only expand Islamic finance, it will explode it beyond bounds. That is perhaps one hurdle that will slow down Islamic finance in Nigeria if it fails to cross it but will be the foundation of its permanent and superlative success not only in Nigeria but the world over if it can overcome it.
Furthetmore Islamic fmance success in Nigeria will help the image of Islamic Finance in two other important respects. It will prove that Islamic finance is not only petro-dollar driven which one can canvass and is being canvassed with the GCC success. Secondly, as a leading emerging economy with large nonMuslim population and in a growth-bound continent; Africa-success of Islamic banking, Takaful and sukuk in Nigeria will be an example not quite comparable with the experience in other continents for now.
4.3 Harmonization To the extent that the basic aims and objectives of insurance, (conventional or Islamic) are essentially the same, a convenient meeting point can and in fact has already been found. That conventional insurance has already taken root in almost all countries of the world before the re-awakening oflslamic Insurance means that Islamic insurance will have to integrate with conventional insurance at least for the time being rather than try to uproot or replace it. To this extent, most countries embracing Islamic insurance including the GCC countries have taken this approach with varying degrees of tolerance, patience and acceptance. Thus, even in largely and even the few completely Islamic countries where Takaful operates like Malaysia, Sudan, Egypt etc; conventional insurance has not been replaced nor displaced by Islamic insurance. In similar spirit, in many countries of the world today, (80 or more, according to Yusuf, 20 12) there is an atmosphere of welcome and pleasant co-existence of Islamic and conventional insurance; in many cases as full-fledged stand-alone corporate entities or as operating windows within conventional insurance operations.
Abtlja Journal of Business and Management Vol./, Issue I [124-131], March-2015 www.abujajournalofbusinessandmanagement.org.ng Page 1 29
Takaful (Islamic Insurance) In Nigeria: Hopes, Hurdles and Harmonization
5. Summary, Conclusions and Recommendations This paper examines the concept, principles and tenets of Islamic insurance (Takaful); x-rays its introduction in Nigeria as well explorps its potential as an additional and an alternative financing fo.r not only individuals but also for corporate entities as well as governments. Building on works like Ashraf, (2008) Yusuf, (20 1 2), Ejiafor, (20 13 ) this paper observes that Takaful not only has a very bright prospect in Nigeria but also the world over. The paper also observes that the philosophical palatability of Islamic injunction - the Shari a- alone will not suffice for the success oflslamic insurance. Rather, solid proof of benefit-for-the-people will be the most impo1tant evidence of the value and usefulness ofTakaful and any insurance for that matter. After all, Takaful is meant to "dry the tears ofthe people's eyes".
Notwithstanding the genuine and concerted fight the world is waging against Islamists to prevent religion from once again pitching people and nations against each other; that there is a rising anti-Islamic sentiments is a fact that the world can no longer deny. That such religious divide is not based on honest religious foundations is not in question but that has not stopped Martyrs and soldiers-of-fortune swelling to each camp of the divide ignorantly, innocently or otherwise as we have seen in recent times with the several radicalized youths including women and girls from Europe, the Americas and Africa heeding the invitation of AI - Quida, ISIS and other lslamist organizations. The researchers opine, therefore, that conspicuously noticeable successful, profitable and mutually beneficial operations of Islamic insurance and in fact the entire spectrum of Islamic finance will be the best way to return Islam to its true creed peace, and will not only help ease people's financial burdens but also help to bring in a more peaceful and rational approach to spreading the faith.
References Abdul-Maliq, Y.O 20 1 0 "Islamic Banking in Nigeria: Opportunities, Challenges and Acceptability"
Abujajournal ofBankingandFinance. Vol2 . Pp 1 59- 1 74 Al-Salam Bank Bahrain 201 1 , Definitions of mostly used Islamic Finance Term. Al-Salam Bank. Bali sm. Ashraf, M 2008 "Takaful Insurance," Paper presented at the International Micro-finance Conference Held
at Transcorp Hilton -Abuja l O'h - 1 1 •h 2003 . Ayub, M 2003, "An Introduction to Takaful- An A lternate Insurance. Islamic Banking department, state
Bank ofPakistan, Karadi. Bello, A.A.M 2006,Interest-Free Banldng? Yes, Katsina, Ahmadu Bello Publication. Bhatly, A, 201 1 , Takaful Summit 201 1 ; Tokoi Marine Middle East. Billah, MM 1 998, Islamic Insurance: Its Origin and Development: Arab law quarterly,
·vol. l 3 ; pp: 386 -
432 Billah, MM, 2003 "Islamic Insurance (Takaful)'. Ilmiah publishers, Kuala Lumpur Malaysia. BIMB 1 994, "Islamic Banking Practice: From the Practitioner's Perspectives. Kuala Lumpur. BIMB. BNM 2009, Concept Paper Guidelines on Takaful Operational Framework. Kuala -Lumpur BNM. Bombale, Y. 2007 Islamic Law ofCommercial and Industrial Transactions. Lagos. Mall House Press. Cornerstone Insurance Plc 20 1 2," Product and Services - Halal Takaful Nigeria Halal Takaful - General"
Abuja, Cornerstone Insmance Plc. Das Augustine, B, 20 14, "Takaful : Specific Regulation to improve Insurance Penetration". Al-Nisr
Publishing LLC.GulfNews Ejiofor, C, 20 1 3 , "Why Nigeria Needs Islamic Financing: Sanusi" Niaj.com on [email protected]
app. FGN 1 99 1 , Banks and other Financial Institutions Decree. Lagos FGN Fisher, 0, and Taylor, DY, 2000, "Prospect for Evolution ofTakaful in the 2r' Century" Harvard College. Ghifari, MN, 2003, "Concept and Operational Details of Takaful" International Institute of Islamic
Economics (III E) Islamabad Hussein, MM, and Pasha, AT, 201 1 , "Conceptual and Operational Differences between General Takaful
and Conventional Insurance" Australian Journ�l ofBusiness Management Research. I(8): 23-28. Ibrahim, AU, 20 1 1 , "Islamic Finance in Nigeria: Challenges and Options". Paper Presented at the
Graduation Ceremony of the 6'h Daurah on Hadith of the Centre for Memorization of the Hadith of West Africa. Held in Bauchi 26'h July, 20 1 1 .
IIB1 2007, File: IIJ/Islamic Bankingl.htm 7( 4)2007 Jamadeen, F, 201 4,a How is Islamic Finance Different from Conventional Finance? Islamic Finance for
Dummies
Abuja Journal of Business and Management Vol. /, Issue I [124-/ 31], March-2015 www.abujajournalofbusinessandmanagement.org.ng Page 1 30
Takaful (Islamic Insurance) In Nigeria: Hopes, Hurdles and Harmonization
Jamaldeen, F, 20 14,b What is Islamic Finance? N.J. John Wiley & Sons Inc. dummies.com Jankara, IU, 2013, "Regulation ofTakaful Insurance in Nigeria" Paper presented at the Micro-Insurance
Conference Held atTranscorp Hotel: Abuja Nigeri�. Khan, LA, 201 1 "How does Takaful Differ from Insurance" The World Takaful Report @
http://ara.assiaif.org/workingpaper/Takaful. Madugu, U, and Muhammed, G, 20 1 2, "Islamic Banking and Economic Development in Nigeria: The
Instrumentality oflnterest free Banking" Finance and Accounting Research Monitor. 3( 1 ) : 50-63 Magaj i, S, Abubakar, A and Abdul-Majid, A. 2013 , "The Prospect of Islamic Banking System among
Traders in Bauchi Central Market, Bauchi State: Nigeria" AbujaJournal of Banking and Finance. 4(1 ) : 94- 1 02
Matsawali et al 20 12 , "A Study ofTakaful and Conventional Insurance Preference: The case of Brunei" International Journal ofBusiness and Social Science. Special Issue
Maysami, RC and Kwon, WJ 1999, An Analysis of lslamic Takaful Insurance- a cooperative insurance mechanism", Journal of Insurance Regulation; vol 18 , pp: 109- 132 .
Maysami, RC, Goh·iz H and Hedayati A 1 997, Pragmatic Interest-Free Banking: Metamorphosis of the Iranian financial system. Journal of international Banking Law. vol. 12, pp: 92 -108
Memon, NA, 2007, "Islamic Banking: Present and Future Challenges. Journal of Management and Social Sciences: 3(1) 1 - 1 0
Mosses-Ashike, H 20 13 , "Sanusi Advocates Sukuk for Infrastructure Financing", Business Day Newspaper, November 5. NBF News 201 1 , "Islamic Finance in Nigeria: Issues and Challenges" CBN Technical Committee Report
ofthe iFSB. NDIC 2014, "Islamic Finance Nigeria: Challenges and Options". Paper Presented at the Graduation
Ceremony of the 6'h Daurah on Hadith of the Centre for Memorization of the Hadith of West Africa, Bauchi 26'h July, 201 1 .
Nwankwo, GO, 1 980, The Nigerian Financial System. London, Macmillan Publishers Omar, F and Dawood, TY, 2000, "Prospect for Evolution ofTakafid in the 2 1" Century: Origin ofTakaful ".
Harvard University Masachuset USA Padfield, CF, 1 979, Law Made Simple, London; W.H. Allen & Co. Ltd Ross, LM, 20 14, "Working with Islamic Finance" Investopedia U.S . A Division of lAC The Holy Bible
2006, Revised Standard Version The Noble Qur'an: English Translation of the Meaning and Commentary. Medina: Kindom of Saudi
Arabia. Vizcaino, B. 201 2 , Glossary- Islamic Finance Definitions. @ Thomas Reuters. Wikipedia, the free encyclopedia 2014, Takaful.available @ MS. Wikipedia.org.puiki/takaful Yusuf, TO, 2012 , "Prospect of Takaful's (Islamic Insurance) Contribution to the Nigerian Economy"
Journal ofFinance and InvestmentAnalysis(3): 2 1 7-230 Moody's Investment Services (2007)
Abuja Journal o.f Business and Management Vol. 1, Issue 1 [1 24-1 31], March-201 5 www.abujajournalofbusinessandmanagement.org.ng Page 1 3 1
The Role of a Company's Specific Characteristics in Enhancing Business Pe�formance in Nigeria
Musa Adeiza FAROUK', Lawai Bawa Maru MUHAMMAD2 1 (Department of Accounting, Kaduna State University, Kaduna - Nigeria)
1 (Department of Accountancy. Abdu Gusau Polytechnic, Talala Mafara - Nigeria) .
Abstract: the main objective of the study is to investigate the role of company's specific characteristics in enhancing business performance in Nigeria. As part of the adopted methodology, Secondary sources of data were obtained through the annual reports of the selected companies covering the period; 2009 -2013. The population of the study was drawn from the listed companies on the Nigeria Stock Exchange as at December, 2013. Company's Specific Characteristic was proxied with Size, Age, growth and Liquidity, while performance was proxied with Return on Assets (ROA). Ex-post facto research design was adopted for the study, while Multiple Regression Analysis and Descriptive Statistics was used as technique for data analysis. The study found that company characteristics such as size, growth and liquidity have significant impact on Return of Assets(ROA) which subsequently enhances business petj'ormance of Companies in Nigeria, while the relationship between age and ROA was observed to be insignificant suggesting that bureaucratic structure and operational rigidities of some of the older Companies are gradually having a negative impact on their performance. The study concludes that company's size, growth and liquidity have the most significant impact while company's age has the least impact. Some recommendations were made among the major recommendation is the need for companies in the Nigeria Manufacturing Sector to continue to stimulate their growth through improved sales, assets size and proper working capital management through maintenance of optimal /eve/ ofliquidity. Keywords: Company Per
formance, Conglomerate, Company's Specific Characteristics, Nigeria.
1. Introduction Traditionally, business performance indicators such as financial performance, is directly influenced by the concept of profitability; this is because profit is the rallying point of all stakeholders. Owners' desire for wealth maximization through appreciation of market value which is driven by profitability, make them to look at financial perfmmance in the ability to generate enough profit to guarantee stable dividend from their investment. Lenders are interested in financial stability of the company which will secure their funds and guarantee payment of interest. Management reward and compensation is usually the function of profit performance while employees desire job security and stable financial performance to guarantee payment of their wages and benefits in the same way that Government is interested in stable profitability for tax purpose and job creation. The question therefore is what constitutes the key ingredients that stimulate business performance?
Company's characteristics are referred to as those incentive variables that relatively stick at company's level across time. They are variables that affect the company's' decision both internally and externally (Shehu, 2 1 02). The incentive variable ranges from company size, leverage, profitability, liquidity, growth, company age amongst others. In explaining the various factors that are influencing company's performance, many studies have explained that these factors arise from various companyspecific characteristics. Some are company specific while others are industry specific (Capon, Farley & Hoenig, 1 990). Barney, 1 99 1 , Pateraf, 1 993 suggests that the explanation for the existence of more or less profitable company must be found in the internal factors of each company.
To this end, there have been inconclusive findings and divergent views in extant literature as to whether company's characteristics have effect on performance of listed companies in Nigeria. Also, most studies in this area are not new as their findings must have been overtaken by changing trends in the dynamic environment. To the best of our knowledge no research of this nature has been conducted focusing only conglomerate companies in the sector which this study is designed to accomplish.
Abu} a Joumal of Business and Managemenl Vol. I, Issue I [132-141], March-2015 www.abujajournalofbusinessandmanagement.org.ng Page 1 32

The Role of a Company's Specific Characteristics in Enhancing Business Pe1jormance in Nigeria
1 . 1 Objectives of the Study . .. . The main objective of the study is to investigate the influence o� comp
_any_'s specific characteristics on
,t�e��
performance of quoted conglomerates company. The study spcctfic.objecttvcs arc: / , \ �� 1) to investigate the impact of company size on performance of Companies in Nigeria . �:,;� __ \ C 2) to assess the impact of company age on the performance of Companies in Nigeria. //u1 � 1 t_..
3) to determine the impact of company growth on the performance of Companies inN igeria�f � ( "'�-) -.r: 4) to examine the impact ofliquidity on the perfonnance ofCqmpanies in Nigeria. \\:;; \ /1 Q
·•• . .. , '·, .../ \)>. · .� 1 .2 Statement ofHypotheses ··\�,�-�' The following null hypotheses have been developed to test the impact of various Company speci�,::::o-
characteristics on the performance of companies in Nigeria.
Ho ,, Company Size has no significant impact on Performance of Companies in Nigeria Ho1, Company Age has no significant impact on Peiformance of Companies in Nigeria Ho3, Company growth has no significant impact on performance of Companies in Nigeria H o 4, Liquidity has nos ignificant impact on performance ofCompanies in Nigeria
2. Literature Review 2.1 Company Size and performance Literature suggests that firms with larger size excel in perfonnance. Large firms are more likely to exploit economies of scale and enjoy higher negotiation power over their clients and suppliers (Serrasqueiro&Nunes, 2008). In addition, they face less difficulty in getting access to credit investment, have broader pools of qualified human capital, and may achieve greater strategic diversification (Yang & Chen, 2009). Larger firms enjoy the advantage of having spread of business activities which was developed over time; they have business relationships which they built over the years and therefore enjoy a lot of benefits. On the other hand, small firms enjoy certain advantages which counter-balance the handicaps associated with their size (Yang & Chen, 2009).
Empirical evidence lends support to both positive and negative impact of company size on performance which could be attributed to institutional and environmental factors. SeiTasqueiro and Nunes (2008) conducted study on small and medium size enterprises in Portuguese companies and found that company size is related positively to performance (ROA) but the relationship was not statistically significant for large companies. The positive relationship suggests that the positive effects of the greater possibility for success are greater than possible negative effect of increased size. Symeou (2008) also conducted empirical examination on company size - performance relationship by using ROA as a measure of perfonnance. He studied the role of company growth potential as a measure of economy size using data for 54 fitms from an equal number of economies for the period 1 997 - 2007 and found a positive relation between economy size and performance. A similar finding was also arrived at by Pervan, Pervan, and Todoric (20 1 2) using data of listed Croatian firms from 1 430 observations obtained from 2003 - 20 1 0 based on dynamic panel analysis.
2.2 Company age and performance Relationship between company's age and performance is ambiguous. Older companies are credited with a lot of experience and tenacity to excel. It is argued that older companies have more experience, abilities and skills; have enjoyed the benefit of learning through time; they can enjoy superior perfonnance (Majumdar, 1 997; Loderer & Waelchli, 2009).Using the data of 1430 observation on Croatian company's Pervanet al. 20 1 2 suggests positive and statistically significant relationship which indicates that older Croatian companies generate better performance compared to the younger ones because they are associated with experience, abilities and skills. On the other hand, it is argued that bureaucratic structures and rigidities of older companies make them insensitive to changes and such companies can easily be outperformed by younger, more aggressive and flexible companies. Agarwal and G01t (2002) also suggest that old age may make knowledge, abilities and skills obsolete and induce organizational decay. Lodcrer and Waelchli (2009) conducted research on a sample of 1 0,930 companies listed on New York Stock Exchange between; 1 978 to 2004, on company age and performance and the result suggested a significant
Abtlja Journal of Business and Management Vo/. 1, issue 1 [132-141], March-2015 www.abujajournalofbusinessandmanagement.org.ng Page 1 33
The Role of a Company's Specific Characteristics in Enhancing Business Petformance in Nigeria
negative relationship between age and performance (ROA). The conclusion of the study was that companies do best when they are young, roughly 1 5 years after listing or 3 7 years after incorporation, they start undcrperforming. Majumdar (2009) suggests a.ncgative relationship which is significant at 5% between age and profitability which was dcfmcd as ROA. He measured age as number of years then incorporation and profitability as ROA. The study is on a sample of 1020 Indian companies.
2.3 Company Growth and performance The relationship between growth and performance is an important issue but results of studies in this area are conflicting. Cord (2009) observed that growth rates are not persistent and ve1y difficult to predict. Fast growth in one period does not guarantee superior performance in the long run. Studies have suggested possible growth performance indicators to include, assets, market share, employment and sales. Delmar (2003) suggests that company growth is not static in nature and there may be considerable variation in growth over time. He discussed various growth perfmmance measures and suggested that if only one indicator had to be chosen as a measure of company growth, then the preferred measure of growth should be sales. The significance of sales as a driving performance of growth could be supported because of its' unique relationship with firm's products and services. Barkham et al. ( 1 996) point out that sales are also the indicator favored by the entrepreneurs. Some firms can witness rapid growth because of the size of their market. MacMillan and Day ( 1 987) considered that rapid growth could lead to higher profitability and improved performance based on evidence that new firms become more profitable when they enter markets on large scale. This position was supported by Sexton and Kasarda (2000) who found that company's profitability measured by ROA was correlated with growth. Empirical studies indicated that there is no consensus in the relationship between growth and performance among the vaiious studies. Some found a positive relationship while others came up with a negative relationship.
2.4 Company Liquidity and performance Liquidity refers to the degree to which short term debt obligations can be paid from cash, or assets that can be turned into cash. According to Shim and Siegel (2000) accounting liquidity is the company's capacity to liquidate maturing short-term debt (within one year). It shows the ability to convert an asset to cash quickly and reflects the ability to manage working capital effectively and efficiently. A low liquidity level may lead to increasing financial costs and result in the incapacity to pay its obligations (Maness & Zietlow 2005). However, maintaining high liquidity would allow a company to deal with contingencies and to cope with obligations during period of low earnings (Opler& Titman, 1 994, Kim, Mauer& She1man 1 998). In contrast, Hvide and These (200 1 ) suggested that a moderate amount of liquidity may mean proper entrepreneurial performance, but an abundance of Liquidity may do more harm than good. Solvency and liquidity are two concepts that are closely related and reflect upon the actions of company's working capital policy. In managing working capital there is need to strike a balance between risk and return. Working capital management policy should be based on risk-return, detennine the ratio of current assets and current liabilities and then make integrated decision (Fungen, 1 995).Efficient working capital management involves planning and controlling current assets and current liabilities in a manner that eliminates the risk of inability to meet short tenn obligations on one hand and avoid excessive investment in these assets on the other hand (Alshubiri, 20 1 1 ).
2.5 Theoretical Framework There are various theories that have been used in the literature to underpin the works on company's specific characteristics and performance e.g (Majumdar, 2009; Cord, 2009; Shim & Siegel, 2000). These theories are the Stmcturc Conduct Performance theory, Efficiency theory, and Financing theory. But for the purpose of this study, the structure conduct performance theory (Symeou, 2008 & Cord (2009) was used to underpin the study as it explains better, the relationship between the identified company's specific characte1
:istics variables and performance used in the study.
3. Research Methodology The research adopted Ex-post facto research design focusing only on eight (8) listed Conglomerate companies as the population of the study rather than the entire listed companies. This is in view of the fact that conglomerate companies are the fastest growing sub-sector of the Nigerian manufacturing industry and some of the sampled companies are mostly dominated by multinational brands that have strategic
Abu) a Joumal o.f Business and Management Vol. /, issue 1 [1 32-1 41}. March-201 5 www.abujajournalofbusinessandmanagement.org.ng Page 1 34

The Role of a Company's Specific Characteristics in Enhancing Business Pe1jormance in Nigeria
intemational alliances. Seven (7) companies were selected as sample based on the availability of complete information on the variables and their proxies. The study covers the periods; 2009 to 2013 owing to the fact that a lot of reforms which transformed the manufacturing sector have taken place in �igeria within the period Secondary source of data was used which were generated from the audited reports and accounts of the studied Conglomerate companies. Multiple Regression technique and Descriptive Statistics was used to assess the impact of various factors which was computed using Statistical Package for Social Science (SPSS-version 20). The variables selected and their measurements are as follows:
3.1 Variable Measurement
Nature of Variable Proxies Variable Measurement Firm Specific Characteristics
Independent variable Size Log ofTA Years in Operation
Firm performance Dependent Variable
Age Growth Liquidity ROA
Sales/Total Assets (S/TA) Current Asset /Current Liabilities PBT/TA
Source: Generated by the Authors
3.2 Model Specification The model is estimated using a sample of seven companies that are very active in the Conglomerate sector. Companies were chosen based on the availability of complete data covering period 2009 - 20 1 3 . The model is specified based on the variables of the study and considering their relationship.
PERF11=a + jJ,SIZE;,+ fJzAGE;,+ fJPRW;,+ fJ)JQ;,+e Where; PERF = Performance variable (Retum on Assets) jJ,-jJ4 =the coefficient ofthe independent variables SIZE = Company size AGE = Company Age GRW = Company growth LIQ =Liquidity e = Error Term
4.1 Results and Discussions In this section, we present the empirical results and discuss the effects of the independent variables on the dependent variable.
Table 4.1: Descriptive Statistics Showing the Nature of Data
Variables OBS Mean Std Dev. MIN MAX
ROA 35 1 . 7891 12.299913 -31 .00 23.81 Company size 35 6.5285 . 44578 5.36 7.25 Company age 35 45. 4286 15. 70741 12.00 67.00 Company growth 35 76.380 28. 07329 25.53 137.96 Liquidity_ 35 1 .4229 . 70450 .30 3.41
Source: Generated by the Authors Using SPSS (Version 20) Dependent Variable: ROA
Descriptive result on Table 4. 1 shows the mean performance of quoted Conglomerate Companies in Nigeria as 1 .789 1 % with stal)dard deviation of 12 .2999 1 3 . Among the explanatory variab)es, company growth has the highest standard deviation of28.073 and an average of76.38 which explains that the sales figure represents about 76% in relation to the asset size of the company. The minimum of age variable is 1 2 years and maximum of 6 7 years and an average o f 45 years. This confi1ms that most of the listed conglomerate companies in Nigeria are in existence for over 40 years. The mean of Size variable which is measured by the natural log of total assets is 6.5285, standard deviation of0.44578, minimum of5.36 and maximum of7.25 which indicates a disperse level of sizes during the period.
Ahuja Journal of Business and Management Vol. 1, Issue 1 [132-141], March-2015 www.abujajournalofbusinessandmanagement.org.ng Page 1 35
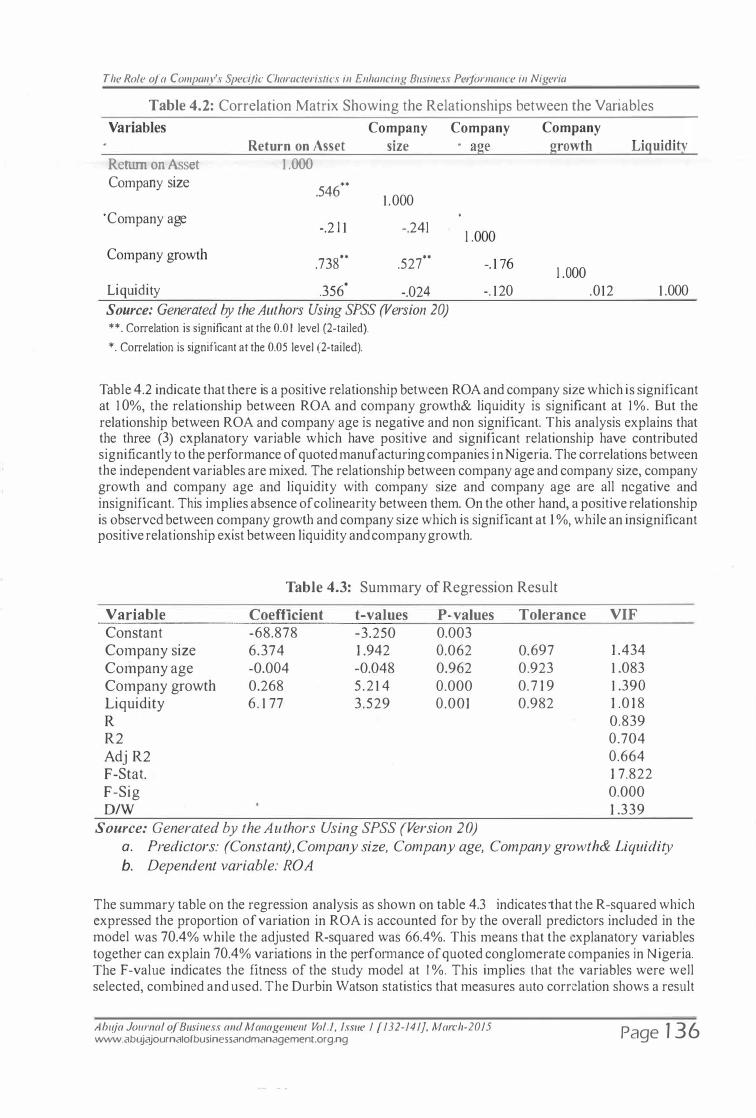
The Role of a Company's Specific Characteristics in Enhancing Business Pelformance in Nigeria
Table 4.2: Correlation Matrix Showing the Relationships between the Variables
Variables Company Company Return on Asset size age
Return on Asset Company size
·Company age
Company growth
1 .000
.546 ••
-.2 1 1
.738**
1 .000
-.241
.527**
Liquidity .356* -.024
Source: Generated by the Authors Using SPSS (Version 20) **. Correlation is significant at the 0.0 I level (2-tailed).
*. Correlation is significant at the 0.05 level (2-tailed).
1 .000
-. 1 76
-. 120
Company growth
1 .000 .012
Liquidity
1 .000
Table 4.2 indicate that there is a positive relationship between ROA and company size which is significant at 1 0%, the relationship between ROA and company growth& liquidity is significant at 1%. But the relationship between ROA and company age is negative and non significant. This analysis explains that the three (3) explanatory variable which have positive and significant relationship have contributed significantly to the performance of quoted manufacturing companies in Nigeria. The correlations between the independent variables are mixed. The relationship between company age and company size, company growth and company age and liquidity with company size and company age are all negative and insignificant. This implies absence of co linearity between them. On the other hand, a positive relationship is observed between company growth and company size which is significant at 1 %, while an insignificant positive relationship exist between liquidity and company growth.
Variable Constant Company size Company age Company growth Liquidity R R2 Adj R2 F-Stat. F-Sig D/W
Table 4.3: Summary of Regression Result
Coefficient -68.878 6.374 -0.004 0.268 6. 1 77
t-values -3.250 1 .942 -0.048 5 .2 1 4 3.529
P-values 0.003 0.062 0.962 0.000 0.001
Tolerance
0.697 0.923 0.7 1 9 0.982
Source: Generated by the Authors Using SPSS (Version 20)
VIF
1 .434 1 .083 1 .390 1 .0 1 8 0.839 0.704 0.664 1 7.822 0.000 1 .339
a. Predictors: (Constant), Company size, Company age, Company growth& Liquidity b. Dependent variable: ROA
The summary table on the regression analysis as shown on table 4.3 indicates that the R-squared which expressed the proportion of variation in ROA is accounted for by the overall predictors included in the model was 70.4% while the adjusted R-squared was 66.4%. This means that the explanatory variables together can explain 70.4% variations in the performance of quoted conglomerate companies in Nigeria. The F-value indicates the fitness of the study model at I %. This implies that the variables were well selected, combined and used. The Durbin Watson statistics that measures auto correlation shows a result
Abuja Journal of Business and Management Vol./, Issue 1 [132-141}, March-2015 www.abujajournalofbusinessandmanagement.org.ng Page 1 36
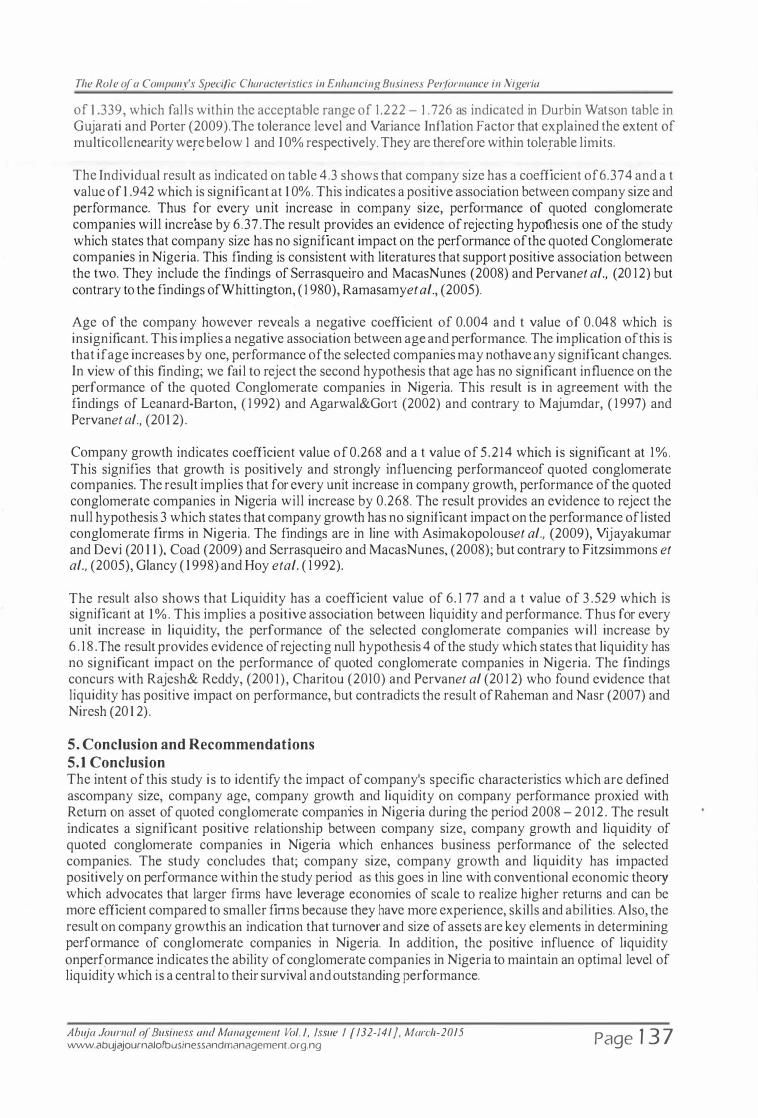
The Role of a Company's Specific Characteristics in Enhancing Business Pe1jormance in Nigeria
of 1 .339, which falls within the acceptable range of 1.222 - I . 726 as indicated in Durbin Watson table in Gujarati and Porter (2009).The tolerance level and Variance Inflation Factor that explained the extent of multicollcncarity were below 1 and I 0% respectively. They are therefore within tolerable limits.
The Individual result as indicated on table 4.3 shows that company size has a coefficient of6.374 and a t value of 1 .942 which is significant at 1 0%. This indicates a positive association between company size and performance. Thus for every unit increase in company size, perf01mancc of quoted conglomerate companies will increase by 6 .3 7 . The result provides an evidence of rejecting hypofhesis one of the study which states that company size has no significant impact on the performance of the quoted Conglomerate companies in Nigeria. This finding is consistent with literatures that support positive association between the two. They include the findings of Serrasqueiro and MacasNunes (2008) and Pervanet a/., (20 12) but contrary to the findings ofWhittington, ( 1 980), Ramasamyet a/., (2005).
Age of the company however reveals a negative coefficient of 0.004 and t value of 0 .048 which is insignificant. This implies a negative association between age and performance. The implication of this is that if age increases by one, performance of the selected companies may nothave any significant changes. In view of this finding; we fail to reject the second hypothesis that age bas no significant influence on the performance of the quoted Conglomerate companies in Nigeria. This result is in agreement with the findings of Leanard-Barton, ( 1 992) and Agarwal&Gott (2002) and contrary to Majumdar, ( 1 997) and Pervanet a/., (201 2) .
Company growth indicates coefficient value of 0.268 and a t value of 5 .214 which is significant at 1%. This signifies that growth is positively and strongly influencing performanceof quoted conglomerate companies. The result implies that for every unit increase in company growth, performance of the quoted conglomerate companies in Nigeria will increase by 0.268. The result provides an evidence to reject the null hypothesis 3 which states that company growth has no significant impact on the perfotmance oflisted conglomerate firms in Nigeria. The findings are in line with Asimakopolouset a/., (2009), Vijayakumar and Devi (20 1 1 ), Coad (2009) and Serrasqueiro and MacasNunes, (2008); but contrary to Fitzsimmons et a/., (2005), Glancy ( 1 998) and Hoy eta/. ( 1 992).
The result also shows that Liquidity has a coefficient value of 6. 1 77 and a t value of 3 .529 which is significant at 1%. This implies a positive association between liquidity and performance. Thus for every unit increase in liquidity, the performance of the selected conglomerate companies will increase by 6 . 1 8 . The result provides evidence of rejecting null hypothesis 4 of the study which states that liquidity has no significant impact on the performance of quoted conglomerate companies in Nigeria. The findings concurs with Rajesh& Reddy, (200 1), Charitou (2010) and Pervanet a/ (20 1 2) who found evidence that liquidity has positive impact on performance, but contradicts the result ofRaheman and Nasr (2007) and Niresh (20 1 2) .
5. Conclusion and Recommendations 5.1 Conclusion The intent of this study is to identify the impact of company's specific characteristics which are defined ascompany size, company age, company growth and liquidity on company performance proxied with Return on asset of quoted conglomerate companies in Nigeria during the period 2008 - 2012 . The result indicates a significant positive relationship between company size, company growth and liquidity of quoted conglomerate companies in Nigeria which enhances business performance of the selected companies. The study concludes that; company size, company growth and liquidity has impacted positively on perf01mance within the study period as this goes in line with conventional economic the01y which advocates that larger firms have leverage economies of scale to realize higher returns and can be more efficient compared to smaller fitms because they have more experience, skills and abilities. Also, the result on company growthis an indication that turnover and size of assets are key elements in determining performance of conglomerate companies in Nigeria. In addition, the positive influence of liquidity on performance indicates the ability of conglomerate companies in Nigeria to maintain an optimal level of liquidity which is a central to their survival and outstanding performance.
Ahuja Joumal of Business and Management Vol. /, Issue I [132-1 41], March-201 5 www.abujajournalofbusinessandmanagement.org.ng Page 1 3 7

The Role of a Company's Specific Characteristics in Enhancing Business Pe1jormance in Nigeria
5.2 Recommendations It is recommended that the management of quoted conglomerate companies should strive hard in expandiog and increasing their assets of the company. Also, this study recommends that manufacturing companies in this sector should continue to stimulate their growth through improved sales. In addition proper working capital management through maintenance of optimal level of liquidity should be encouraged by the companies in order to meet up with day to day running of their business.
5.3 Lim'uations and Suggestions for Further Studies Like any other research, this paper is not without some limitations, the study is only limited to the listed conglomerate companies as against the entire listed companies within the Manufacturing sub-sector. Therefore interested researchers in this area should investigate other companies and sub-sectors of the Nigerian economy. Also there are other companies specific characteristics variables not used in this study. However, interested researcher may use leverage and others to assess how they enhance business performance of companies. In addition the study used return on asset to proxy performance, so other researchers in this area should make use of return on equity, net profit margin or other measurement of performance.
References Agarwal, R and Gort, M 2002, 'Firm product life cycles and firm survival', American Economic review,
vol. 92, pp. 1 84- 1 90 Ahuja, G and Majumdar, SK 2005, 'An assessment of the performance oflndian state owned enterprises', Journal of productivity analysis, Vol. 9, pp. 1 13- 1 32 .
Alshuburi, FN 20 1 1 , "The effect of working capital practices in risk management: evidence from Jordan ", Global Journal of Business Research, Vol. 5, No. 1 , pp.39-54.
Asimakopolous I, SamitasA&Papadogones 2009, "Finn Specifics and Economy wide determinants of Firm Profitability: Greek Evidence" ,Managerial Finance, Vol. 3
Barkham, R, Gudgin, G, Hart, M&Hanvey, E 1 996, "The Determinants of Small Company growth", Athenaeum PRESS, Gateshead. Tyneand Wear, UK. 1 2 .
Barney, J B 1 99 1 , "Firm Resources &Sustained Competitive advantage", Journal of Management, Vol . 1 7, pp.99- 1 20
Capon, N, Farley, JV &Hoenig, S 1 990, "Determinants of financial performance: A meta-analysis", Journal ojManagement Science, Vol.36, pp. l l43-1 159
Chandler, G. N. , and Baucus D. A.,( 1 996),'Gauging Performance in emerging business: Longitudinal evidence and growth pattern analysis',Frontiers of Entrepreneurship Research,pp.49 1 -504.
Chandra, P 200 1 , "Financial Management "7 ( ed'), McGraw-Hill, New York: Charitou, MS 20 10, "The effect of working capital on firms profitability: Empirical Evidence from
emerging market" ,Journal a/Business and Economic Research, Vol.8, No. l 2 Coad, A 2007, "Testing the principle of Growth of the Filter: The relationship between Profits & Firms
Growth, Structural Change and Economic Dynamics, Vol. 1 8. Cowling, M 2004, "The Growth: Profit Nexus". Small Business Economics, Vol. 22, pp. 1 -9 . Delmar, F, Davidson, P & Gattner, WB 2003, "Arriving at the High growth", Journal of Business
Venturing, Vol . l 8, pp. l 89-2 1 6 . Eljelly, AMA 2004,"Liquidity-Profitability Tradeoff: An Empirical Investigation in an Emerging
Market" ,International Journal of Commerce and Management, Vol . l4, No.2,pp.48-6 1 . ·
Fitsimrnons, JR, Steffens, PR& Douglas, EJ 2005, "Growth and Profitability in Small and Medium Sized Australian Firms",AGSE Entrepreneurship Exchange, Melbourne.
Fugen, MA 1 995, "Discussion on the basic theory ofWorking Capital Mangement", Accounting Research Garcia-Teruel, Jand Martinez-Solano, P 2007, "Effects of working capital management on SME
profitability", lnternationa/Journal of Managerial Finance, Vol. 3, No.2 Gomes, FC, Yasin, MM&'Lisboa, GV 2007, 'An Empirical Investigation of
Manufacturing Performance Measures Utilization: The Perspectives ofExecutives and Financial Analysts', International Journal of Productivity and Petformance Management, Vol.56, No.3, pp. 1 87-204
Glancy, K 1 998, "Determinants of Growth and Profitability in Banking", Journal a,[ Money, Credit a n d Banking, No.36
Ahuja Joumal of Business and Management Vol. !, Issue I [132-141}, March-2015 www.abujajournalofbusinessandmanagement.org.ng Page 1 38
The Role of a Company's Specific Characteristics in Enhancing Business Pe1jormance in Nigeria
Gujarati, DNand Porter, DC 2009, "Basic Econometrics"McGraw-Hill, International ( ed') Hoy, F, McDougall, PP, & D'Souza, DE 1 992, "Strategies and environments ofhigh growth finns". Hvide, HK and Moen, J 20071 "Liquidity Constraints and Entrepreneurial Performance", .Unpublished Kim, C, Mauer, DS and Sherman, AE 1998, "The determinants of Corporate Liquidity: Theory and
Evidence",Journal ofFinancial and Quantitative analysis, Vol.33, No.3 Kuratko, DFand Mon·is, MH 2002, "Corporate Entrepreneurship: The Dynamic Strategy for 2 1 "
Century Organizations", In: G.D. Libecap, (Ed.). Issues in Entrepreneuship: Contracts, Corporate Characteristics and Country Differences. Amsterdam: Elsevier Service.
·
Leonard-Barton, D 1 992,"Capabilities and core rigidities", A pradox in managing new product development", Strategic Management Journal, Vol. 1 3 , pp. l l 1 - 1 25.
Loderer, C and Waelchli, U 2009,"Company age& Performance",-unpublished. Macmillan, AC and Day, DL 1 987, "Corporate Ventures into Industrial Markets: Dynamics of aggressive entry",Journal ofBusiness Venturing, Vol. 2, No. I , pp. 29-39. Majumdar, SK 1 997, "The Impact of Size and Age on firm Level performance: some evidence from
India", Review oflndustrial Organization, .Vol. 1 2. McMahon, RGP 200 1 , "Growth and Performance of Manufacturing SMEs: The Influence of
financial management characteristics", International Small Business Journal, Vol . 1 9 , N o . 3 , pp. 1 0-28.
Maness, TS and Zietlow, JT2005, "Short-term Financial Management."OhioSouth- Wes tern/Th omson Learning Matsumoto, K, Shivaswamy, M& Hoban, J 1 995, 'Security Analyst: Views of The Financial Ratios of
Manufacturers and Retailers', Financial Practice & Education Opler, TC and Titman, S 2000, "Finnacial Distress and Corporate Performance",Journal of Fin a n c e " ,
Vol. 49 Owolabi, SA, Obiakor, RT &Okwu, AT 20 1 1 , "Investigating Liquidity-Profitability Relationship in
Business Organizations: A Study of Selected Quoted Companies in Nigeria", British Journal of Economics, Finance and Management Science, Vol. 1 , No.2
Pateraf, M 1 993, "An investigation of Industry and Firm structural characteristics incorporate tum arounds",Journal ofManagementstudies, Vol.28.
Pervan, M, Pervan, I&Todoric, M 2 0 1 2, "Firm Ownership and Performance: Evidence from Croatian Listed Firms", WorldAcademy ofScience and Technology,Vol.6 1
Poensgen, OH and Marx, M 1 985, "Coping with or Profiting from Size", European Journal of Operations Research. Vol. 22 No.2, pp. 1 27- 1 47 Raj esh M R 20 1 1 , "Impact of working capital Management on Firm Profitability", Global Journal of Finance & Management,Vo1.3, No. 1 , pp. l 5 1 - 158 . Raheman,Aand Nasr, M 2007, "Working Capital Management and Profitability: Case of P a k i s t a n i
Finns" ,International Review of Business Research Papers. Vol. 3 , No. 1 Ramasamy, B , Darryl, O&Mathew, CHY 2005, "Company size, Ownership and Performance in the
Malaysian Palm Oil Industry", Asian Academy of Management Journal of Accounting & Finance, Vol. 1 , pp. 8 1 - 1 00.
Rasmusen, B l 987,'Gamesandlnformation: An introduction to Game Theory', Oxford: Cambridge, MA: Blackwell.
SerrasquerroZelia, S and Paulo, MN 2008, "Performance and Size: Empirical evidence from Portuguese SMEs", Small Business Economics, Vol.3 l , No.2·, pp. 1 95-2 1 7.
Sexton, DL and Kasarda, JD 2000, "The state of the art entrepreneurship", Boston: PWS- Kent: pp.341 -349.
Shehu, U.H. (20 1 2) . Firm Characteristics and Financial Reporting Quality of Quoted Manufacturing Fi1ms in Nigeria. An unpublished dissertation submitted to the school of postgraduate studies, Ahmadu Bello University, Zaria.
Shim, JK and Siegel, JG 2000,"Financial Management " 2 ( ed'), Barron's. Sidhu, HS and Bhartia G 1 993, "Factor affecting Profitability in Indian Textile Industry", The Indian
Economic Journal, Vol.4 1 , No.2 Swamidass and Suresh, K 1 998, "Explaining Manufacturing Technology use, Company size and Performance using a Multidimensional view of Technology", Journal of Operational Management, Vol. 1 7
Abuja Journal of Business and Management Vol. I, issue I [132-141}, March-2015 www.abujajournalofbusinessandmanagementorg.ng Page 1 39
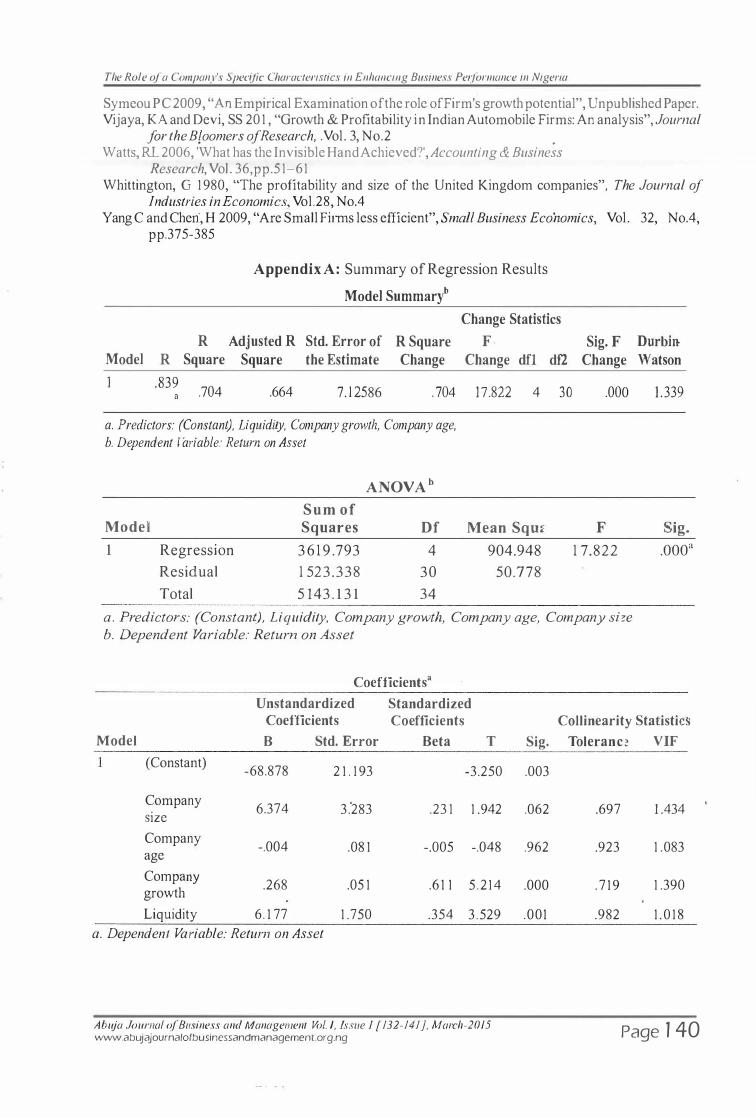
The Role of a Company's Specific Characteristics in Enhancing Business Pet.formance in Nigeria
Symeou PC 2009, "An Empirical Examination of the role afFirm's growth potential", Unpublished Paper. Vijaya, KA and Devi, SS 20 1 , "Growth & Profitability in Indian Automobile Firms: An analysis", Journal
for the B{oomers of Research, . Vol. 3, No.2 . Watts, RL 2006, 'What has the Invisible Hand Achieved?', Accounting & Business
Research, Vol. 36,pp.5 1-61 Whittington, G 1 980, "The profitability and size of the United Kingdom companies", The Journal of
Industries in Economics, Vol.28, No.4 Yang C and Cheri, H 2009, "Are Small Firms less efficient", Small Business Economics, Vol. 32, No.4,
pp.375-385
Appendix A: Summary of Regression Results
Model Summaryb
Change Statistics
R Adjusted R Std. Error of R Square F Sig. F Durbin Model R Square Square the Estimate Change Change dfl df2 Change Watson
.839 .704 .664 7. 1 2586 . 704 17.822 4 30 .000 1 . 339
a. Predictors: (Constant), Liquidity, Company growth, Company age, b. Dependent Variable: Return on Asset
ANOVA b
Sum of Model Squares Df Mean Sqm F Sig. 1 Regression 3 6 1 9 .793 4 904.948 1 7.822 .oooa
Residual 1 523.338 30 50.778
Total 5 143 . 1 3 1 34
a. Predictors: (Constant), Liquidity, Company growth, Company age, Company si?:e b. Dependent Variable: Return on Asset
Coefficientsa
U nstandardized Standardized Coefficients Coefficients
Model B Std. Error Beta T
(Constant) -68.878 2 1 . 1 93 -3.250
Company 6.374 3.'283 .23 1 1 .942 size Company
-.004 age .08 1 -.005 -.048
Company .268 .05 1 .6 1 1 5 . 2 14 growth
Liquidity 6 . 1 77 1 .750 .354 3 .529 a. Dependent Variable: Return on Asset
Ahuja Journal of Business and Management Vol. /, l5sue I [132-141}, March-2015 www.abujajournalofbusinessandmanagement.org.ng
Collinearity Statistic�
Sig. Toleranc� VIF
.003
.062 .697 1 .434
.962 .923 1 .083
.000 . 7 1 9 1 .390
.001 .982 1 . 0 1 8
Page 1 40
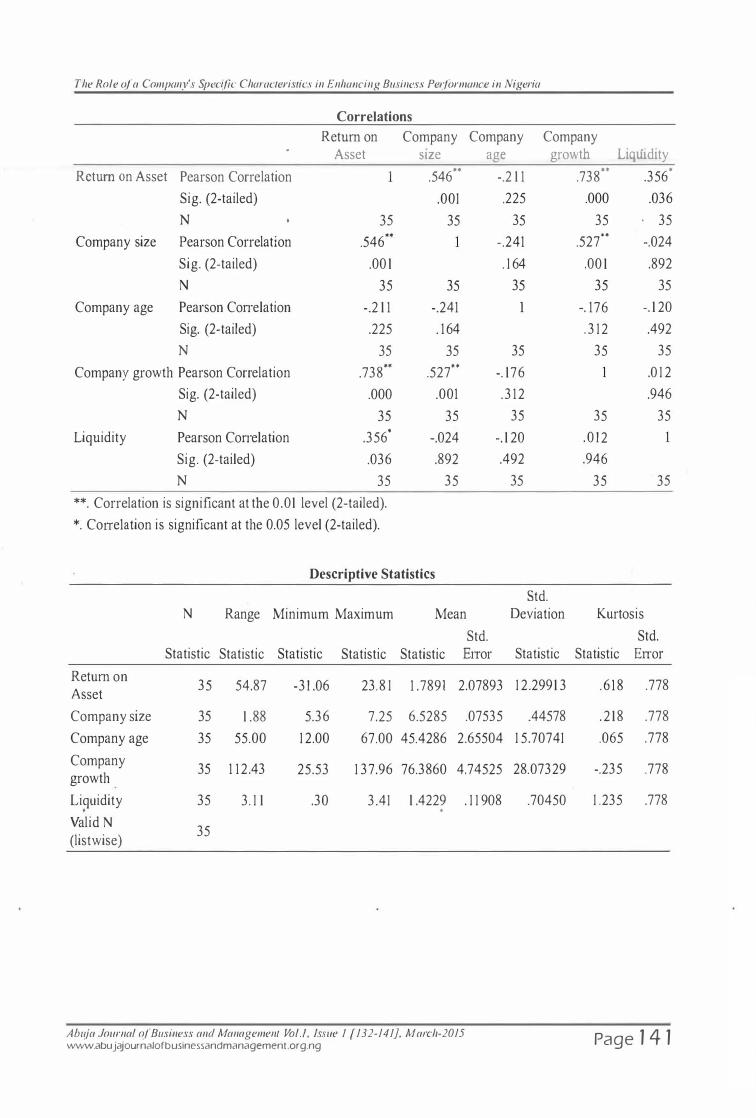
The Role of a Company's Spec(fic Characteristics in Enhancing Business Pe1jormance in Nigeria
Correlations
Return on Company Asset SiZe
Company age
Company growth LiqUidity
Return on Asset Pearson Correlation
Sig. (2-tailed)
N
Company size Pearson Correlation
Sig. (2-tailed)
N
Company age Pearson Con·elation
Sig. (2-tailed)
N
Company growth Pearson Correlation
Sig. (2-tailed)
Liquidity
N
Pearson Con·elation
Sig. (2-tailed)
N
35
.546 ..
.00 1
35
-.2 1 1
.225
35
.738 ..
.000
35
.356*
.036
35
**. Correlation is significant at the 0.01 level (2-tailed).
*. Cone1ation is significant at the 0.05 level (2-tailed).
. 546 •• -.2 1 1
.001 .225
35 35
-.241
. 1 64
35 35
-.241
. 1 64
35 35
.527**
-. 176
.001 .3 12
35 35
-.024 -. 1 20
.892 .492
35 35
Descriptive Statistics
N Range Minimum Maximum Mean
Std. Statistic Statistic Statistic Statistic Statistic EtTor
Return on 35 54.87 -31 .06 23. 8 1 1 . 7891 2.07893
Asset
Company size 35 1 .88 5.36 7.25 6.5285 .07535
Company age 35 55.00 1 2.00 67.00 45.4286 2.65504
Company 35 1 1 2.43 25.53 1 37.96 76.3860 4.74525
growth
Liquidity 35 3. 1 1 .30 3.41 1 .4229 . 1 1 908 .
Valid N 35
(listwise)
Ahuja Journal of Business and Management Vol./, Issue I [132-141), March-2015 www.abujajournalofbusinessandmanagement.org.ng
Std. Deviation
Statistic
1 2.299 1 3
.44578
1 5.70741
28.07329
.70450
.738 ••
.000
35
.527**
.00 1
35
-. 176
. 3 1 2
35
35
. 0 1 2
.946
35
.356 •
.036 . 35
-.024
.892
35
-. 1 20
.492
35
.0 1 2
.946
35
35
Kurtosis
Std. Statistic ElTOl'
. 6 1 8 .778
. 2 1 8 .778
.065 .778
-.235 .778
1 .235 .778
Page 1 4 1
Appraising Corporate Finance Appl�cation in the Nigerian Banking Industry
Ibrahim Fari Okeji Department of Business Administration, University of Abuja, Gwagwalada - Nigeria
Abstract: This study examined the issues involved in appraising corporate finance application in the Nigerian Banking Industry. As part of the methodology, questionnaires, oral interviews and documentary studies were used as research instruments. The study was analyzed using simple percentages, chi-square and ratio analysis. Research findings reveals that a critical appraisal of corporate finance application could have a positive effect in reducing non-performing loans in the Nigerian Banking Industry. The study further revealed that in Nigeria relationship with or connection to bank Chief Executives or Directors is a great determiningfactor in the success of a corporate finance application. We howevet; recommended that credit officers should appreciate the importance of default risk identification and measurement so as to enhance their ability to reduce the number and magnitude of non-performing loans. Keywords: Corporate Finance application, Non-performing Loans, Default Risk, Credit Officers
1. Introduction Many banks in Nigeria have experienced grave problems in recent times which, has in a way threatened the profile and identity of the entire financial system. Generally, the Nigerian banking system has undergone remarkable changes over the years in terms of the number of institutions, ownership structure, as well as depth and breadth of operations. Recent special audits conducted by the Central Bank ofNigeria (CBN) had revealed non-performing loan ratios as high as 40% at five of the initial ten banks that were audited. The CBN quickly replaced the bank's management and announced plans to bolster their balance sheets with N420 billion - as an intervention structured to restore confidence in the banking system and attract foreign and local investors to the sector (EFCC, 2009).
A subsequent special audit conducted on some of the banks considered unhealthy due to non-performing loans running into billions which resulted in the sack of the Chief Executive Officers of Bank PHB, Spring Bank and Equatorial Trust Bank. The CBN intervention was necessitated by the fact that the capital base of these banks had been eroded and thus, needed to act swiftly by coming up with some bail-out policy measures which helps in rescuing the sector and restore investors confidence.
This study examines the issues involved in appraising corporate finance applications. The incidence of bank distress in Nigeria has been phenomenal due to insider abuses, disregard for corporate governance and huge non-performing loans which were the major problems of banks as revealed by the post consolidation audit conducted by the CBN under Charles Soludo. The implication was that the capital bases of these banks had been eroded and this resulted in a loss of confidence in the Nigerian Banking Industry by their customers and the international investors.
The huge non-performing loans which run into billions ofNaira in the books of some of the banks raise the question as to whether such loan applications were properly evaluated. A critical appraisal of such loan applications could have saved some of the banks fr01n the embatTassing situation they found themselves. As a result the focus of this paper is to examine the issues involved in appraising corporate finance application for effective performance. The limitation of the study is that the research focuses only on selected banks and some marketing companies within the FCT and thus, cannot be generalized.
1 .2 Research Objectives . .
The main objective of this study is to examine the techniques for appraising and evaluating corporate finance application. The specific objectives are:
2 . To examine the impact of such techniques on loan repayment 3 . To suggest some guide! i nes for appraising corporate finance application.
Ahuja Jouma/ of Business and Management Vol. /, issue 1 [ 142-152]. March-20 15 www.abujajournalofbusinessandmanagement.org.ng Page 1 42
Appraising Corporate Finance Application in the Nigerian Banking Indust1y
2. Conceptual Issues and Theoretical Framework 2.1 CreditAnalysis When a business firm applies to a bank for a loan, it is usual for the bank to make an appraisal of the risk involved m lending to such a corporatiOn, against the benefits the bank expects to derive from making the Joan. According to Altman ( 1 993) Credit risk assessment has both qualitative and quantitative dimensions. The qualitative dimensions of risk are generally the more difficult to assess, as observed by Archibong ( 1995). The steps in qualitative risk assessmt;nt according to Cornett and Saunders ( 1999) are primarily . gathering information on the borrower's records of financial responsibility, determining his or her true pw-pose for wanting to borrow funds, identifying the risks confronting the borrowers business under futw-e industry and economic conditions and estimating the degree of commitment the bonowers will have regarding payment. Cornett and Saunders ( 1 999) say that the quantitative dimension of credit risk appraisal consists of the analysis ofhistorical financial data and the projection offutw-e financial results to evaluate the bonower's capacity for timely repayment of the loan and, indeed the bonower's ability to financially survive possible industry and economic reverses.
Basic Credit Factors Van Hom ( 1 990) stated that the analysis involved in appraising corporate finance applications can be captured under fow- basic credit factors. The borrowers' characters, use of loan funds, primary source of repayment and secondary sow-ce of repayment
Character Most bankers agree that the paramount factor in a successful loan is the honesty and goodwill of the borrower. Dishonest borrowers do not feel morally committed to repay their loan through misrepresentation. Because loan officers must spread their time over many loan relationships, they do not have time to uncover elaborate scheme to defraud the bank. Archibong ( 1995), while analyzing bank failures in Nigeria asserted that the bank must protect itself from dishonest borrowers by thoroughly investigating the credit background of the borrower. According to Pandey (2006) the borrower's previous credit relationship can be evaluated from customers, suppliers, and past banking relationship. If the borrower has built a record of prompt payment of interest and principal, it is likely that future loans will be similarly served. If the borrower has been routinely late in paying past debts, the reason should be determined. If previous creditors have experienced losses, the loan officer should almost automatically reject the credit.
Use of Loan Funds On the surface, the borrower's need and proposed use of funds usually seem perfectly clear. In many commercial loans, such is frequently not the case as observed by Edmister ( 1 999). More often than not, determining the true need and use for funds requires good analytical skills in accounting and business finance. An understanding of the loans intended use helps the analyst to understand whether the loan request is reasonable and acceptable.
Primary Source of Repayment The analyst accounting and finance skills are crucial in determining the ability of the borrower to repay a loan from cash flow. For seasonal working capital loans, cash flows are. generated by means of orderly liquidation of the seasonal buildup in inventories and receivables. In term loans, cash flows are generated from eamings and non-cash expenses (depreciation, depletion etc) charged against earnings. Theyner ( 1 995) ad vices that the analyst must ascertain the timing and sufficiency of these cash flows and evaluate the risk of cash flow falling short
Secondary Source of Repayment In general, cash flow fi·om business operations is the most dependable source of loan repayment. However, if sufficient cash flows fail to materialize, the bank can prevent a loss if it has secured a secondary source of repayment. According to Van Horne ( 1 990) collateral should always be viewed as a secondary and not a primary source of repayment. Banks hope to avoid foreclosing on collateral because foreclosure entails much time and expense. Collateral value should cover, in addition to the loan amount
Abuja Joumal o.f Business and Management Vo/.1, issue 1 [142-152], March-2015 www.abujajournalofbusinessandmanagement.org.ng Page 1 43
Appraising Corporate Finance Application in the Nigerian Banking lndustt)·
and interest due, the legal costs offoreclosure and interest during foreclosure proceedings. Collateral is the preferTed secondary source of repayment. Other secondary sources are guarantors. However, collection from guarantors often requires expensive litigation and results in considerable ill-wil� between the bank, borrower and guarantor.
Credit Risk To analyze the loan applicant's credit risk according to Fadel and Heintz (2000) the credit officer must understand the customer's character, capacity, collateral, conditions and capital (sometimes referred to as the five Cs of credit). As Gilson (200 1 ) observed, the following questions provide information on the five Cs of credit (appendix A) .
2.2 Cash Flow Analysis Banks require corporate loan applicants to provide cash flow information, which provides the bank with relevant information about the applicant's cash receipts and disbmsements that are compared with the principal and interest payments on the loan. Cash receipt includes any transaction that results in an increase in cash assets (i.e receipt of income, decrease in a non-cash asset, increase in a liability, and increase in equity account). Cash disbmsements include any transaction that results in a decrease in cash assets (i.e cash expenses, increase in non cash asset, and decrease in a liability and decrease in equity). The cash flow statement (or cash-based income statement) reconciles changes in the cash account over some period according to three cash flow activities; operations, investing and financing. (Weston & Brigham, 1 999).
While the historical picture is essential to cash flow analysis, it is only a foundation. To build on it according to Altman ( 1 993), the analyst must look forward and judge whether cash flow will increase or decrease and how fast; foresee future claims on cash flow, judge their urgency and flexibility if supply proves inadequate and assess the likely overall economic climate, specific market conditions which will affect generation of cash flow and supplemental financing.
2.3 Ratio Analysis In addition to cash flow information an applicant requesting specific levels of credit substantiates the business needs by presenting historical audited financial statements and projections of future needs. Altman ( 1 993) maintained that historical financial statement analysis can be very useful in determining whether cash flow and profits projections are plausible in quantifying many of the qualitative issues just discussed and in highlighting the applicant's risks. Calculation of financial ratios is useful when performing financial statement analysis on a corporate applicant. Although stand-alone financial ratios are essential for determining the sizes of the credit facil ity, the analyst may find relative ratios more informative when determining how the applicant's business is changing over time (Theyner, 1 995).
Ratios according to Altman ( 1 995) are particularly informative when they differ either from an industry average (or Banks determined standard of what is appropriate) or from the applicants past history. An optimal value is seldom given for any ratio because no two companies are identical. As observed by Lawrence (200 1 ), a ratio that differs from an industry average or a Bank's determined standard, however, should cause the credit analyst to investigate further. A ratio that shifts radically from accounting period to
· accounting period may reveal a company's weakness, change"in policy or normal business operations. The credit analyst must determine which the case is by obtaining additional information.
Although hundreds of ratios could be calculated from any set of accounting statements, Cornett and Saunders ( 1 999) observed that the following ratios are particularly useful to a credit analyst:
Abtlja Joumal of Business and Management Vol. /, Issue 1 [142-152]. March-201 5 www.abujajournalofbusinessandmanagement.org.ng Page 1 44
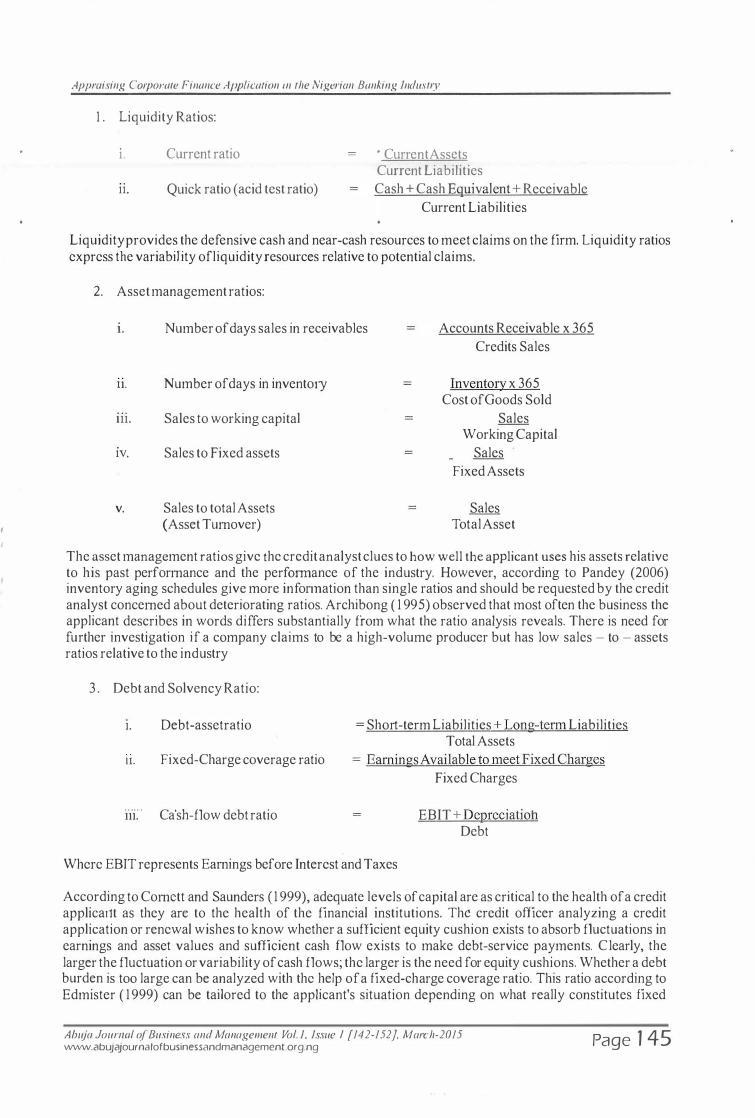
Appraising C01porate Finance Application in the Nigerian Banking Indus /I)'
1 . Liquidity Ratios:
I. Current ratio
II. Quick ratio (acid test ratio)
· CurrentAsscts Current Liabilities Cash + Cash Equivalent + Receivable
Current Liabilities
Liquidity provides the defensive cash and near-cash resources to meet claims on the firm. Liquidity ratios express the variability ofliquidity resomces relative to potential claims.
2. Asset management ratios:
1. Number of days sales in receivables Accounts Receivable x 365 Credits Sales
11.
Ill.
IV.
v.
Number of days in inventoty
Sales to working capital
Sales to Fixed assets
Sales to total Assets (Asset Tumover)
Inventory x 365 Cost ofGoods Sold
Sales Working Capital
Sales Fixed Assets
Sales Total Asset
The asset management ratios give the credit analyst clues to how well the applicant uses his assets relative to his past performance and the perfmmance of the industry. However, according to Pandey (2006) inventory aging schedules give more infonnation than single ratios and should be requested by the credit analyst concemed about deteriorating ratios. Archibong ( 1 995) observed that most often the business the applicant describes in words differs substantially from what the ratio analysis reveals. There is need for further investigation if a company claims to be a high-volume producer but has low sales - to - assets ratios relative to the industty
3 . Debt and Solvency Ratio:
t. Debt-assetratio
n. Fixed-Charge coverage ratio
111. Ca'sb-flow debt ratio
= Short-term Liabilities + Long-term Liabilities Total Assets
= EarningsAvailable to meetFixed Charges Fixed Charges
EBIT + Depreciatioh Debt
Where EBIT represents Earnings before Interest and Taxes
According to Comctt and Saunders ( 1 999), adequate levels of capital are as critical to the health of a credit applical1t as they arc to the health of the financial institutions. The credit officer analyzing a credit application or renewal wishes to know whether a sufficient equity cushion exists to absorb fluctuations in earnings and asset values and sufficient cash flow exists to make debt-service payments. Clearly, the larger the fluctuation or variability of cash flows; the larger is the need for equity cushions. Whether a debt burden is too large can be analyzed with the help of a fixed-charge coverage ratio. This ratio according to Edmister ( 1 999) can be tailored to the applicant's situation depending on what really constitutes fixed
Abu) a Journal of Business and Management Vol. I, Issue I [ 142-152}, March-2015 www.abujajournalofbusinessandmanagement.org.ng Page 1 45
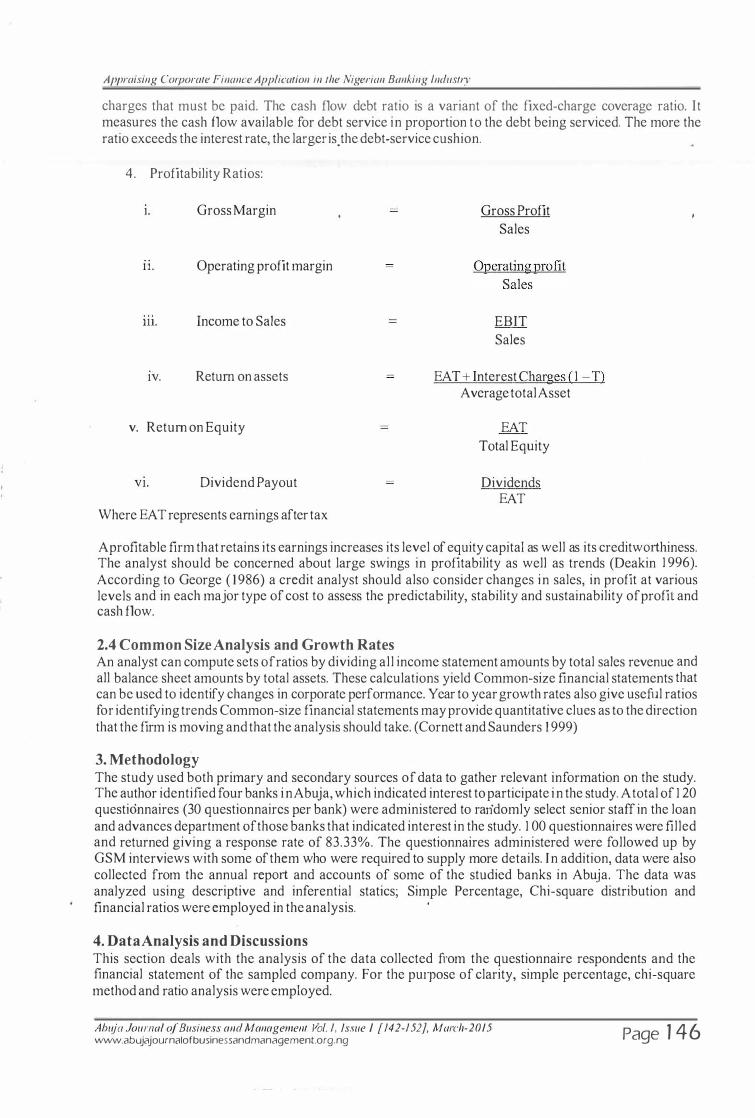
Appraising Cotporate Finance Application in the Nigerian Banking lndust1y
charges that must be paid. The cash flow debt ratio is a variant of the fixed-charge coverage ratio. It measures the cash flow available for debt service in proportion to the debt being serviced. The more the ratio exceeds the interest rate, the larger is.the debt-service cushion.
4. Profitability Ratios:
I. Gross Margin
II. Operating profit margin
Ill. Income to Sales
IV. Return on assets
v. Return on Equity
Vl. Dividend Payout
Where EAT represents earnings after tax
Gross Profit Sales
Operating profit Sales
EBIT Sales
EAT+ Interest Charges ( 1 -T) Average total Asset
EAT Total Equity
Dividends EAT
A profitable firm that retains its earnings increases its level of equity capital as well as its creditwmihiness. The analyst should be concerned about large swings in profitability as well as trends (Deakin 1 996). According to George ( 1986) a credit analyst should also consider changes in sales, in profit at various levels and in each major type of cost to assess the predictability, stability and sustainability of profit and cash flow.
2.4 Common Size Analysis and Growth Rates An analyst can compute sets of ratios by dividing all income statement amounts by total sales revenue and all balance sheet amounts by total assets. These calculations yield Common-size financial statements that can be used to identify changes in corporate performance. Year to year growth rates also give useful ratios for identifying trends Common-size financial statements may provide quantitative clues as to the direction that the firm is moving and that the analysis should take. (Cornett and Saunders 1 999)
3. Methodology The study used both primary and secondary sources of data to gather relevant information on the study. The author identified four banks in Abuja, which indicated interest to participate in the study. A total of 1 20 questionnaires (30 questionnaires per bank) were administered to randomly select senior staff in the loan and advances department of those banks that indicated interest in the study. 1 00 questionnaires were filled and returned giving a response rate of 83.33%. The questionnaires administered were followed up by GSM interviews with some of them who were required to supply more details. In addition, data were also collected from the annual repmi and accounts of some of the studied banks in Abuja. The data was analyzed using descriptive and inferential statics; Simple Percentage, Chi-square distribution and financial ratios were employed in the analysis. ·
4. Data Analysis and Discussions This section deals with the analysis of the data collected from the questionnaire respondents and the financial statement of the sampled company. For the purpose of clarity, simple percentage, chi-square method and ratio analysis were employed.
Abu} a Journal of Business and Management Vo/. 1, Issue I [142-152}, March-2015 www.abujajournalofbusinessandmanagement.org.ng Page 1 46
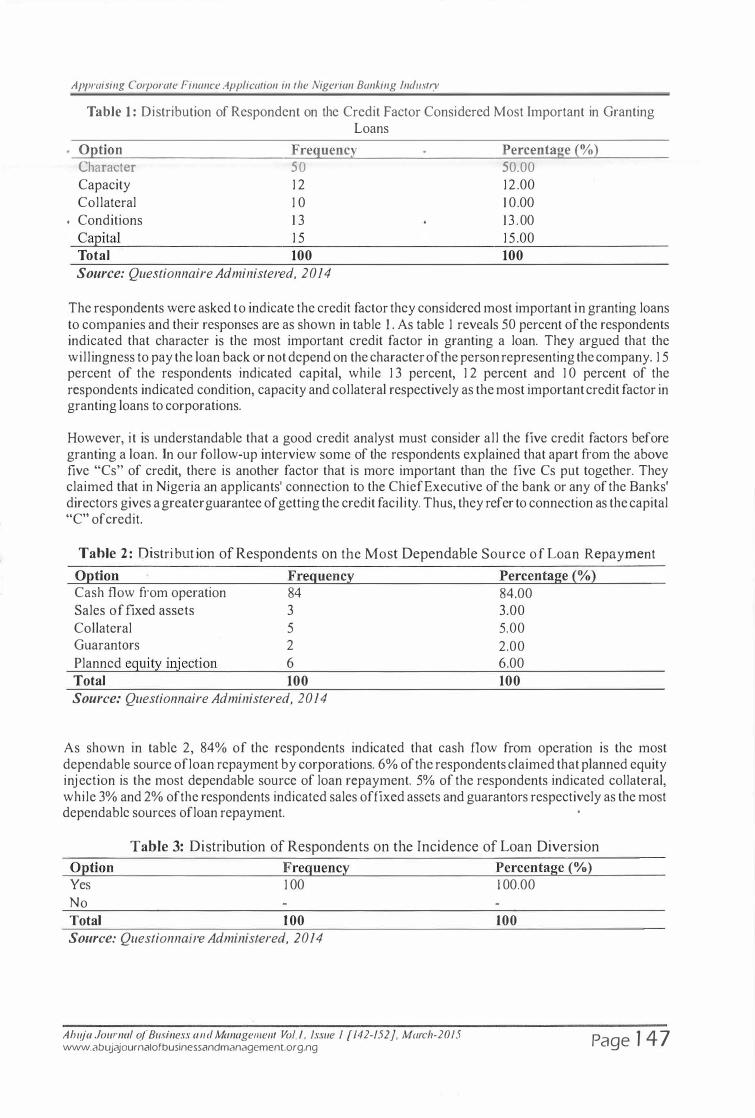
Appraising Corporate Finance Application in the Nigerian Banking /ndust1y
Table 1 : Distribution of Respondent on the Credit Factor Considered Most Important in Granting Loans
Option Frequency Percentage (%) Character 50 50.00 Capacity 1 2 12 .00 Collateral 1 0 1 0.00
• Conditions 1 3 1 3 .00 Capital 1 5 1 5 .00 Total 100 100 Source: Questionnaire Administered, 2014
The respondents were asked to indicate the credit factor they considered most important in granting loans to companies and their responses are as shown in table 1. As table 1 reveals 50 percent of the respondents indicated that character is the most important credit factor in granting a loan. They argued that the willingness to pay the loan back or not depend on the character of the person representing the company. 1 5 percent of the respondents indicated capital, while 1 3 percent, 1 2 percent and 1 0 percent of the respondents indicated condition, capacity and collateral respectively as the most important credit factor in granting loans to corporations.
However, it is understandable that a good credit analyst must consider all the five credit factors before granting a loan. In our follow-up interview some of the respondents explained that apart from the above five "Cs" of credit, there is another factor that is more important than the five Cs put together. They claimed that in Nigeria an applicants' connection to the Chief Executive of the bank or any of the Banks' directors gives a greater guarantee of getting the credit facility. Thus, they refer to connection as the capital "C" of credit.
Tahle 2 : Distribut ion of Respondents on the Most Dependable Source o f Loan Repayment
Option Frequency Percentage (%) Cash flow from operation 84 84.00 Sales affixed assets 3 3.00 Collateral 5 5.00 Guarantors 2 2.00 Planned equity injection 6 6.00 Total 100 100 Source: Questionnaire Administered, 2014
As shown in table 2, 84% of the respondents indicated that cash flow from operation is the most dependable source ofloan repayment by corporations. 6% of the respondents claimed that planned equity injection is the most dependable source of loan repayment. 5% of the respondents indicated collateral, while 3% and 2% of the respondents indicated sales of fixed assets and guarantors respectively as the most dependable sources ofloan repayment.
Table 3: Distribution of Respondents on the Incidence of Loan Diversion Option Yes No Total
Frequency 1 00
1 00 Source: Questionnaire Administered, 2014
Abu) a Journal of Business and Management Vol. / , Issue I [142-152}. March-2015 www.abujajournalofbusinessandmanagement.org.ng
Percentage (%) 1 00.00
100
Page 1 47
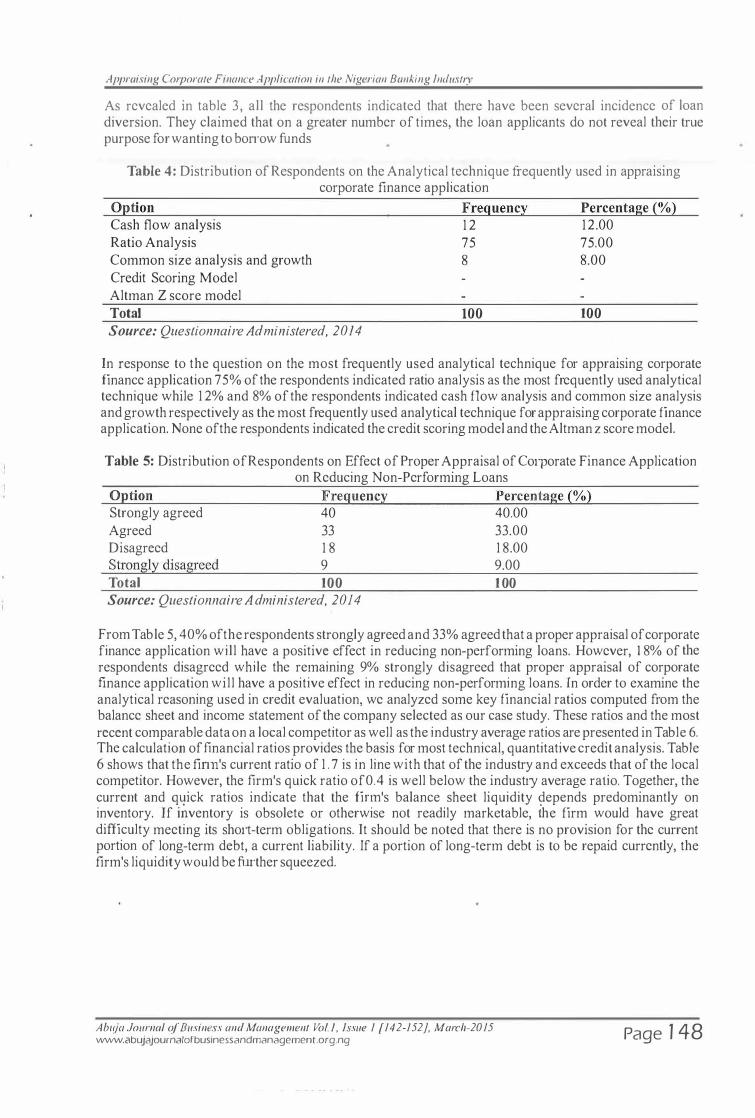
Appraising Corporate Finance Application in the Nigerian Banking Indust1y
As revealed in table 3 , all the respondents indicated that there have been several incidence of loan diversion. They claimed that on a greater number of times, the loan applicants do not reveal their true purpose for wanting to bon-ow funds
Table 4: Distribution of Respondents on the Analytical technique frequently used in appraising corporate finance application
Option Frequency Percentage (%) Cash flow analysis Ratio Analysis Common size analysis and growth Credit Scoring Model Altman Z score model Total Source: Questionnaire Administered, 2014
1 2 75 8
100
1 2.00 75.00 8.00
100
In response to the question on the most frequently used analytical technique for appraising corporate finance application 75% of the respondents indicated ratio analysis as the most frequently used analytical technique while 1 2% and 8% of the respondents indicated cash flow analysis and common size analysis and growth respectively as the most frequently used analytical technique for appraising corporate finance application. None of the respondents indicated the credit scoring model and the Altman z score model.
Table 5: Distribution of Respondents on Effect of Proper Appraisal of Corporate Finance Application on Reducing Non-Performing Loans
Option Strongly agreed Agreed Disagreed Strongly disagreed Total
Frequency Percentage (%) 40 40.00 33 33.00 1 8 1 8.00 9 9.00 100 1 00
Source: Questionnaire Administered, 2014
From Table 5, 40% of the respondents strongly agreed and 33% agreed that a proper appraisal of corporate finance application will have a positive effect in reducing non-performing loans. However, 1 8% of the respondents disagreed while the remaining 9% strongly disagreed that proper appraisal of corporate finance application will have a positive effect in reducing non-performing loans. In order to examine the analytical reasoning used in credit evaluation, we analyzed some key financial ratios computed from the balance sheet and income statement of the company selected as our case study. These ratios and the most recent comparable data on a local competitor as well as the industry average ratios are presented in Table 6. The calculation of financial ratios provides the basis for most technical, quantitative credit analysis. Table 6 shows that the firm's current ratio of 1 . 7 is in line with that of the industry and exceeds that of the local competitor. However, the firm's quick ratio of0.4 is well below the industry average ratio. Together, the current and quick ratios indicate that the finn's balance sheet liquidity depends predominantly on inventory. If mventory is obsolete or otherwise not readily marketable, the firm would have great difficulty meeting its short-term obligations. It should be noted that there is no provision for the current portion of long-term debt, a current liability. If a portion of long-term debt is to be repaid currently, the firm's liquidity would be further squeezed.
Abty·a Joumal of Business and Management Vol. /, Issue I [1 42-152], March-20 15 www.abujajournalofbusinessandmanagement.org.ng Page 1 48
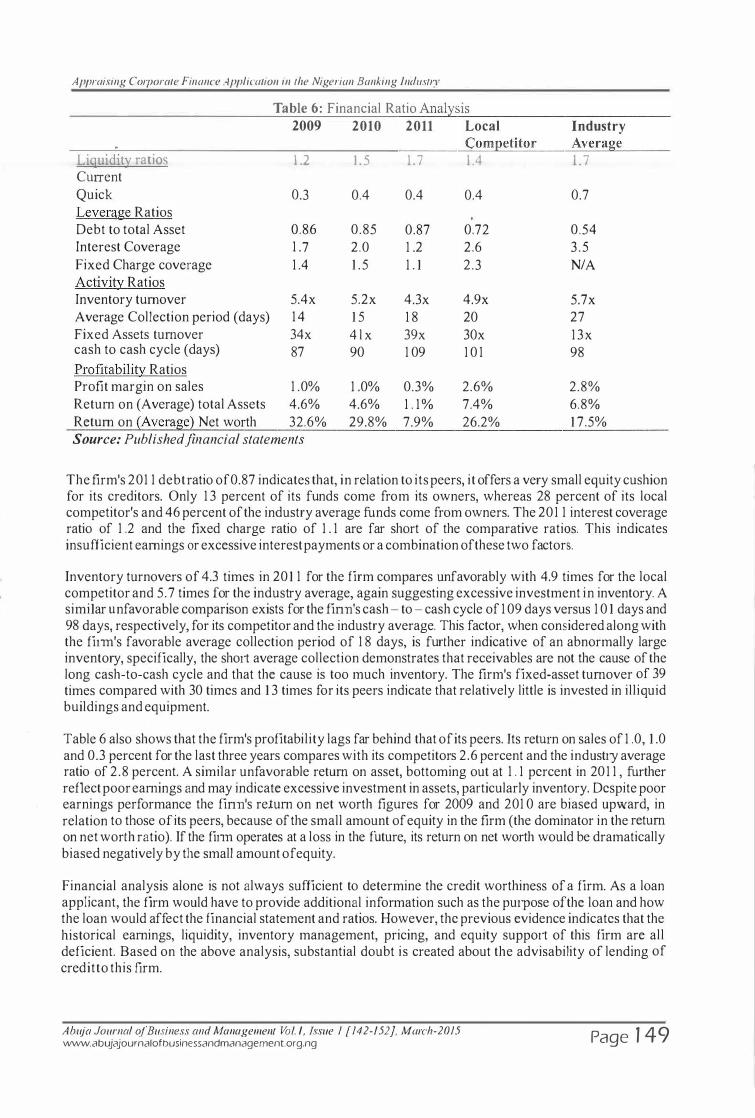
Appraising Corporate Finance Application in the Nigerian Banking Indust1y
Table 6: Financial Ratio Analysis
Liquidity ratios CmTent Quick Leverqge Ratios Debt to total Asset Interest Coverage Fixed Charge coverage Activity Ratios Inventory turnover Average Collection period (days) Fixed Assets turnover cash to cash cycle (days)
Profitability Ratios Profit margin on sales Return on (Average) total Assets Return on (Average) Net worth
2009
1 .2
0.3
0.86 1 .7 1 .4
5.4x 14 34x 87
1 .0% 4.6% 32.6%
Source: Published financial statements
2010 2011 Local Competitor
1 . 5 1 .7 1 .4
0.4 0.4 0.4
0.85 0.87 0.72 2.0 1 .2 2.6 1 . 5 1 . 1 2.3
5.2x 4.3x 4.9x 1 5 1 8 20 4 l x 39x 30x 90 1 09 1 0 1
1 .0% 0.3% 2.6% 4.6% 1 . 1% 7.4% 29.8% 7.9% 26.2%
Industry Average 1 .7
0.7
0.54 3 .5 N/A
5.7x 27 13x 98
2.8% 6.8% 1 7.5%
The firm's 201 1 debt ratio of0.87 indicates that, in relation to its peers, it offers a very small equity cushion for its creditors. Only 1 3 percent of its funds come from its owners, whereas 28 percent of its local competitor's and 46 percent of the industry average funds come from owners. The 201 1 interest coverage ratio of 1 .2 and the fixed charge ratio of 1 . 1 are far short of the comparative ratios. This indicates insufficient earnings or excessive interest payments or a combination of these two factors.
Inventory turnovers of 4.3 times in 201 1 for the firm compares unfavorably with 4.9 times for the local competitor and 5.7 times for the industry average, again suggesting excessive investment in inventory. A simi1ar unfavorable comparison exists for the finn's cash - to - cash cycle of 1 09 days versus 1 0 1 days and 98 days, respectively, for its competitor and the industry average. This factor, when considered along with the fitm's favorable average collection period of 1 8 days, is further indicative of an abnormally large inventory, specifically, the shott average collection demonstrates that receivables are not the cause of the long cash-to-cash cycle and that the cause is too much inventory. The firm's fixed-asset turnover of 39 times compared with 30 times and 1 3 times for its peers indicate that relatively little is invested in illiquid buildings and equipment.
Table 6 also shows that the firm's profitability lags far behind that of its peers. Its retW'n on sales of 1 .0, 1 .0 and 0.3 percent for the last three years compares with its competitors 2.6 percent and the industry average ratio of 2.8 percent. A similar unfavorable return on asset, bottoming out at 1 . 1 percent in 201 1 , further reflect poor earnings and may indicate excessive investment in assets, particularly inventory. Despite poor earnings performance the finn's return on net worth figures for 2009 and 201 0 are biased upward, in relation to those of its peers, because of the small amount of equity in the firm (the dominator in the return on net worth ratio). If the fitm operates at a loss in the future, its return on net worth would be dramatically biased negatively by the small amount of equity.
Financial analysis alone is not always sufficient to determine the credit worthiness of a firm. As a loan applicant, the firm would have to provide additional information such as the purpose ofthe loan and how the loan would affect the financial statement and ratios. However, the previous evidence indicates that the historical earnings, liquidity, inventory management, pricing, and equity support of this firm are all deficient. Based on the above analysis, substantial doubt is created about the advisability of lending of creditto this firm.
Ahuja Journal ()[ Business and Management Vol. /, Issue 1 [142-152}. March-2015 www.abujajournalofbusinessandmanagement.org.ng Page 1 49
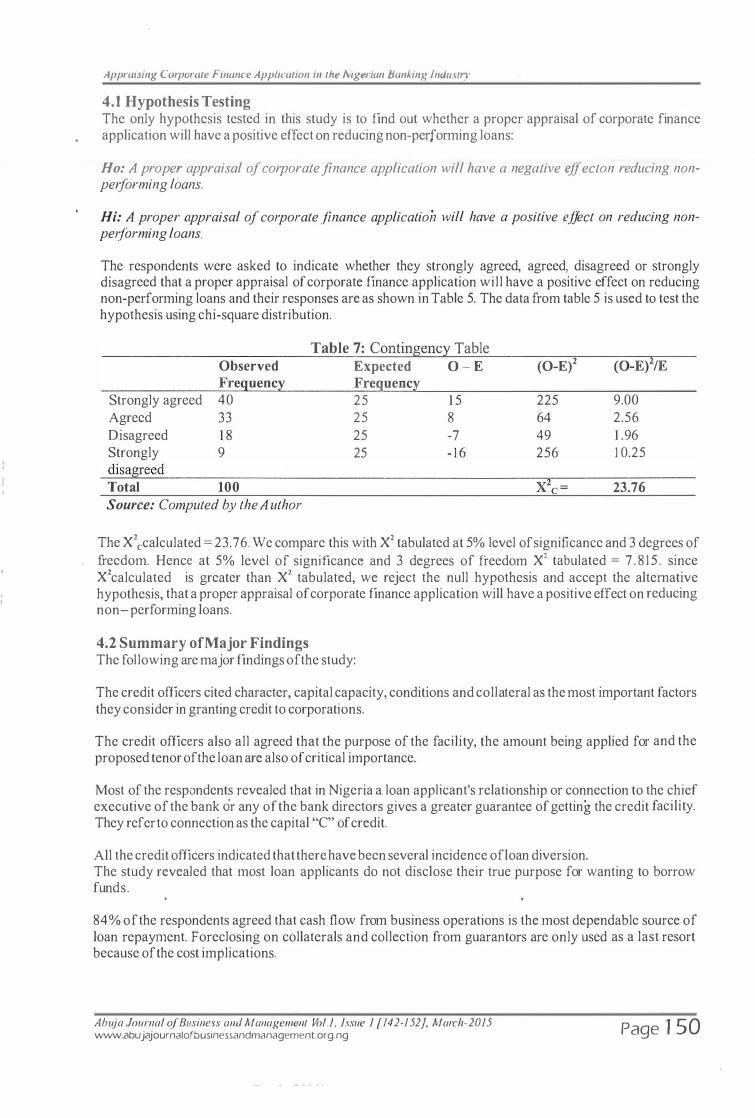
Appraismg Corporate Finance ApplicatiOn m the Nigenan Bankmg Industry
4.1 Hypothesis Testing The only hypothesis tested in this study is to find out whether a proper appraisal of corporate finance application will have a positive effect on reducing non-performing loans:
Ho: A proper appraisal of corporate finance application will have a negative effect on reducing nonperforming loans.
Hi: A proper appraisal of corporate finance applicatioit will have a positive effect on reducing nonperforming loans.
The respondents were asked to indicate whether they strongly agreed, agreed, disagreed or strongly disagreed that a proper appraisal of corporate finance application will have a positive effect on reducing non-performing loans and their responses are as shown in Table 5. The data from table 5 is used to test the hypothesis using chi-square distribution.
Table 7: Contingency Table (O-EitE Observed Expected 0 - E (O-E)2
Frequency Frequency Strongly agreed 40 25 1 5 225 9.00 Agreed 33 25 8 64 2.56 Disagreed 1 8 25 -7 49 1 .96 Strongly 9 25 - 1 6 256 1 0.25 disagreed Total 100 xt -c - 23.76 Source: Computed by the A uthor
The X2ccalculated = 23. 76. We compare this with X2 tabulated at 5% level of significance and 3 degrees of freedom. Hence at 5% level of significance and 3 degrees of freedom X2 tabulated = 7 . 8 1 5 . since X2calculated is greater than X2 tabulated, we reject the null hypothesis and accept the alternative hypothesis, that a proper appraisal of corporate finance application will have a positive effect on reducing non-performing loans.
4.2 Summary ofMajor Findings The following are major findings of the study:
The credit officers cited character, capital capacity, conditions and collateral as the most important factors they consider in granting credit to corporations.
The credit officers also all agreed that the purpose of the facility, the amount being applied for and the proposed tenor of the loan are also of critical importance.
Most of the respondents revealed that in Nigeria a loan applicant's relationship or connection to the chief executive of the bank or any of the bank directors gives a greater guarantee of getting the credit facility. They refer to connection as the capital "C" of credit.
All the credit officers indicated that there have been several incidence ofloan diversion. The study revealed that most loan applicants do not disclose their true purpose for wanting to borrow funds.
84% of the respondents agreed that cash flow from business operations is the most dependable source of loan repayment. Foreclosing on collaterals and collection from guarantors are only used as a last resort because of the cost implications.
Ahuja .Joumal of Business and Management Vol./, Issue I [142-152}, March-2015 www.abujajournalofbusinessandmanagement.org.ng Page I SO

Appratsing C01porate Finance Application in the Nigerian Banldng Industry
Most of the respondents claimed that the conditions precedent in the credit agreement were often not fulfilled.
. .
The study revealed that analysis of trends in selected ratios of a corporation can be used to quantify default risk and enhance the bank management's ability to handle the risk. The study revealed further that a proper appraisal of corporate finance application will have a positive effect on reducing non-performing loans.
1. Conclusion and Recommendations 5.1 Conclusion In this paper, an attempt has been made to examine the issues involved in appraising corporate finance application. A critical appraisal of corporate finance application could have a positive effect in reducing the number and amount of non-performing loans in Nigerian banks. It is necessary for credit officers to use both qualitative and quantitative measures in appraising corporate finance applications. Credits should be monitored throughout the period of the loan to ensure that the borrower is living up to his commitments and to detect deterioration should it occur to protect the bank's interests.
5.2 Recommendations The following recommendations are hereby made:
1 . Credit officers should appreciate the fact that the credit process does not end when the applicant signs the loan agreement. Before allowing take down of a corporate credit, the credit officer must make sure that conditions precedents have been cleared.
2 . Credit officers should appreciate the importance of default risk identification and measurement so as to enhance their ability to reduce the amount of non-performing loans.
3 . It i s important for Bank management to strengthen their credit monitoring unit to monitor credits after take down throughout the loan's life to ensure that the borrower is living up to his commitments and to detect deterioration should it occur to protect the bank's interests.
4. To enable the banks and the creditor identify and quantify default risks, while also quantifying the management's ability to handle such risks, we recommend the use of financial ratios such as the ones used in our analysis. Edward Altman's Multiple Discriminate Analysis model could also be used to great advantage, to avoid giving loans to very weak or failing firms.
5 . Corporate finance applications should be analyzed thoroughly taking into consideration both the qualitative and quantitative factors before loans are granted.
6. The banks management should tty as much as possible to prevent diversion of loans to uses other than the ones for which they were gqmted.
7. The bank must protect itselffrom dishonest borrowers by thoroughly investigating the borrower's previous credit relationship.
8. Credit analysts should be very much concerned with the timing of cash flows in their analysis. Credit analysts should note that amounts and ratios cannot tell them much until they can estimate the quality of the underlying assets and liabilities.
Abu} a Joumal of Business and Management Vol. 1, Issue 1 [ 142-152}. March-2015 www.abujajournalofbusinessandmanagement.org.ng Page l S l
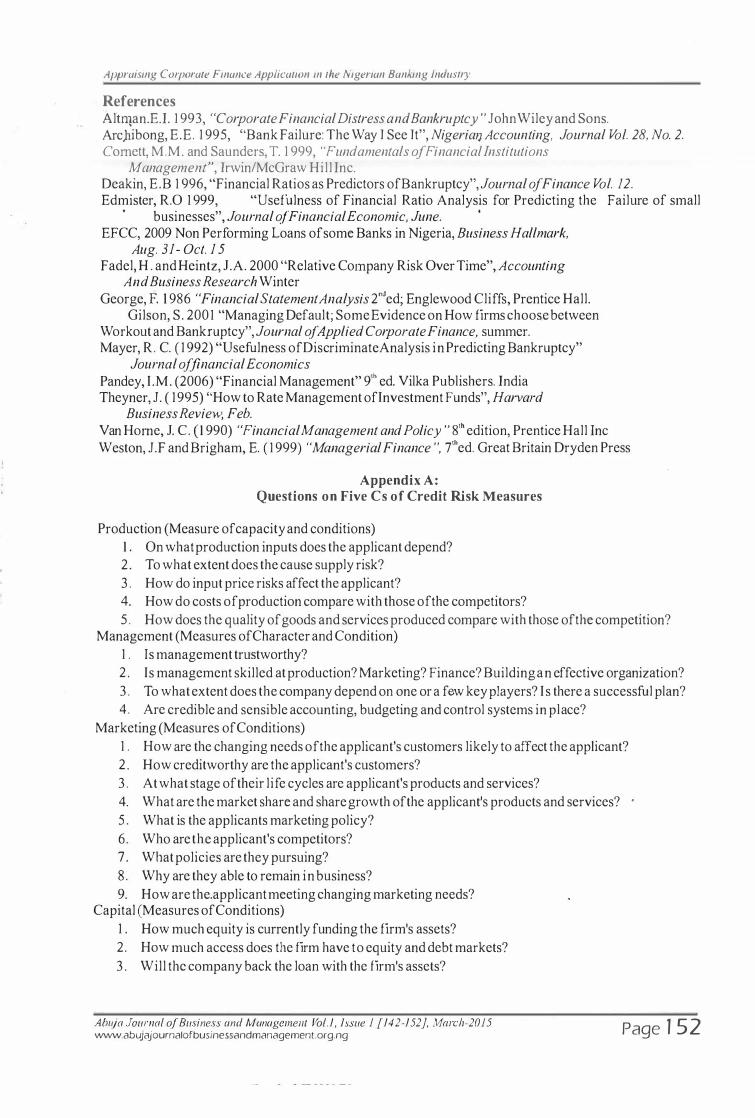
Appraising Corporate Finance Application in the Nigerian Banking Industry
References Altfl!an.E.I. 1 993, "Corporate Financial Distress and Bankruptcy " John Wiley and Sons. Arc)libong, E.E. 1 995, "Bank Failure: The Way I See It", Nigeria!] Accounting, Journal Vol. 28, No. 2. Comett, M.M. and Saunders, T. 1 999, "Fundamentals of Financial Institutions
Management", Irwin/McGraw Hill Inc. Deakin, E.B 1 996, "Financial Ratios as Predictors ofBankruptcy", Journal of Finance Vol. 12. Edmister, R.O 1 999, "Usefulness of Financial Ratio Analysis for Predicting the Failure of small
businesses", Journal of Financial Economic, June. •
EFCC, 2009 Non Performing Loans of some Banks in Nigeria, Business Hallmark, Aug. 31- Oct. 1 5
Fadel, H . and Heintz, J.A. 2000 "Relative Company Risk Over Time", Accounting And Business Research Winter
George, F. 1 986 "Financial Statement Analysis 2"ded; Englewood Cliffs, Prentice Hall. Gilson, S. 2001 "Managing Default; Some Evidence on How firms choose between
Workout and Bankruptcy", Journal of Applied Corporate Finance, summer. Mayer, R. C. ( 1 992) "Usefulness ofDiscriminateAnalysis in Predicting Bankruptcy"
Journal of financial Economics Pandey, I .M. (2006) "Financial Management" 9'11 ed. Vilka Publishers. India Theyner, J. ( 1995) "How to Rate Management oflnvestment Funds", Harvard
Business Review, Feb. Van Home, J. C. ( 1 990) "Financial Management and Policy " 8'h edition, Prentice Hall Inc Weston, J.F and Brigham, E. ( 1 999) "Managerial Finance ", 7'hed. Great Britain Dryden Press
Appendix A: Questions on Five Cs of Credit Risk Measures
Production (Measure of capacity and conditions) 1 . On what production inputs does the applicant depend? 2 . To what extent does the cause supply risk? 3 . How do input price risks affect the applicant? 4. How do costs of production compare with those of the competitors? 5 . How does the quality of goods and services produced compare with those of the competition?
Management (Measures of Character and Condition) 1 . Is management trustworthy? 2 . Is management skilled at production? Marketing? Finance? Building an effective organization? 3 . To what extent does the company depend on one or a few key players? I s there a successful plan? 4. Are credible and sensible accounting, budgeting and control systems in place?
Marketing (Measures of Conditions) 1 . How are the changing needs of the applicant's customers likely to affect the applicant? 2 . How creditworthy are the applicant's customers? 3 . At what stage of their life cycles are applicant's products and services? 4. What are the market share and share growth ofthe applicant's products and services? 5 . What is the applicants marketing policy? 6. Who are the applicant's competitors? 7 . What policies are they pursuing? 8. Why are they able to remain in business? 9. How are the .applicant meeting changing marketing needs?
Capital (Measures of Conditions) 1 . How much equity is currently funding the firm's assets? 2. How much access does the firm have to equity and debt markets? 3 . Will the company back the loan with the firm's assets?
Abu) a Journal of Business and Management Vo/.1, Issue 1 [142-152], March-20 15 www.abujajournalofbusinessandmanagement.org.ng Page 1 52
Influence of Micro - Credit on Asset Accumulation: A Study Q. ·� Selected Lo.cal Government Areas (LGA's) In Bau�hi St�� �0'�
4��\ fjU! �\ .:-_.' Mohammed Sani Isyaka' , Dr. Sule, Magaji2 ·'\ ? H��P.� � ) ,.=--
'(Department of Business Administration, University of Abuja, Gwagwa/ada-Nigeria) � · .:- � :' �· 1 1(Depprtment of Economics, University of Abuja, Gwagwalada-Nigeria) . <{ �'',·-.-/, / //i �------------------------------------------------------------------·�- �� ' / •
Abstract: This study focused on the influence of micro credit on asset accumulation by the borrow if. �"" · employed regression analysis model in the determination of the relationship between the micro credit an "
asset accumulation and found that there is a positive relationshiSp. The asset equation shows that borrowing is a relative function oflendingfacility available to people especially in the local community by micro-finance banks. The study was conducted in Bauchi state covering four local government areas which cover the period of 1998-2013. Questionnaire and personal interviews was used as a means of data collection and analysed through the use of statistical package for social science (SPSS). The study revealed that there is a positive relationship between Credit and Asset, that micro-credit of the micro-
finance banks is a good poverty vaccine which can improve the standard of living of the poor in Bauchi state. The study concluded that increase in credit leads to increase in income, which in turn leads to increase in asset accumulation. It means the higher the level of credit, the higher the level of asset accumulator. The study then recommends that there is need to ensure the spread of banks to each local government headquarters and district headquarters. A general reforms needs to be made on the social responsibility of various community banks and they should be made members of the clearing system. Keywords: Asset Accumulation, Micro Credit, Micro-finance Banks, Influence, Bauchi State
1. Introduction The subject of accessing credit to the poor has constantly secured attention all over the World, and the World wide economic recession has focused attention on the poor as a potent means of revamping the economies of the developing nations in sub-Saharan Africa and Asian countries. Attention is particularly paid on micro credit of financial sector. The efforts by the poor people to promote their welfare through self-employment are ignored by the Nigerian financial sector. This is because traditionally the very poor have not been recognized as credit-worthy since they do not have collateral securities. Thus, using traditional commercial banking methods, lending to the poor is not believed to be cost-effective. However, the increase in demand by poor people to promote their welfare and grow their business through financial sector has been on the high demand recently thus, this have lead to the emergence of several micro-finance banks in the country which has been able to bring modern day banking to the grass root level.
Micro credit policy as a financial policy is capable of increasing the productive capacity of the poor, raising the return to assets, and promoting wage employment World Bank (20 1 0); Zaman ( 1 999); Wydick (20 1 1 ); Udry( 2008) and Pitt and K.handker ( 20 10) . However, there are limited research studies focusing on the influence of micro-credit finance on asset accumulations which the present study is aimed at accomplishing. In .order to ensure access to credit by the poor rural dwellers and to achieve grassroots development a micro finance-community based banking was introduced in 1 990. Micro finance Bank makes use of credit character as the prime principle of lending over collateral securities. The World Bank's World Development Report (20 1 0) conducted extensive studies on micro credit institutions across the World. The study revealed the suitability of these institutions in providing credit for non-corporate business, small farmers, rural producers, trade groups and other micro enterprises across the World. Therefore, the study tried to investigate the influence of micro credit financing on asset accumulator by the b01rowers in Bauchi State. The inability of the borrowers in presenting collateral security has limit their ability to have access to some of this lending facilities offered by most micro-finance banks couple with lack of education which make it difficult for them to read and understand some of the
A buja Journal ojBusiness and Management Vol./, Issue 1 [ 153-160}, March-20 15 www.abujajournalofbusinessandmanagement.org.ng Page 1 53
Influence of Micro - Credit on Asset Accumulation: A Study of Selected Local Government Areas (LGA 's) In Bauchi State
terms given by most banks before they can have access to various lending facility available which the present study tends to proffer answers to. The study will be of immense benefits to policy makers, financial institutions and managers of micro-finance agencies that will enable the people in grass root to have more access to lending facilities which can serve as a good instrument of poverty alleviation.
2. Literature Review Micro-credit means small size of loan mainly for small-scale investment granted by the lender based on trust as opposed to collateral security. Many studies revealed that micro credit policy through financial institutions is capable of increasing the productive capacity of the poor, raising the return to assets, and promoting wage employment World Bank (2010); Zaman ( 1 999); Wydick (20 1 1 ); Udry ( 2008) and Pitt and Khandker ( 20 1 0). Pulley (201 2) also made an extensive study of the strategy for making the poor credit-worthy as a major effort at alleviating poverty in the World. Yaron ( 1 992) reviewed some rural finance institutions in some developing countries. The institutions succeeded in achieving the aims and objectives for which they were established in the environment in which they operated.
The Micro-finance banks have the same basic characteristics as the traditional commercial banks except that the institution and operations are not strictly in line with orthodox banking principles. To achieve credit access to the poor in N igeria the Community bank and the peoples bank were designed to have access to land, credit and technological know-how by the poor (Mabogunje 1 993). Although it has been proved that micro credit is a good instrument of poverty alleviation (Zaman 1 999, Wydick 201 1 , and Udry, 2008), even after the establishment of Micro-finance banks in 1 990 the poverty level has been on the increase in Nigeria in general and in Bauchi State in particular (FOS 1 999). The question is, are Micro-finance banks assisting asset accumulation by the poor? This needs investigation.
Beside the work of Mobogunje ( 1 993), which show that although micro credit does not lead to increase in consumption, it reduces vulnerability. Udry ( 1 990), in an attempt to see how credit serves as insurance in a rural economy had conducted a survey of four villages in Northern Nigeria. The survey consisted of a series of monthly interview, with heads ofhousehold and their wives. The questionnaire was designed to yield a complete picture of each household's assets and debt position on account of its credit, labour, product, asset, and asset- rental transactions over the previous month. He applied a two-stage random sampling procedure, which yielded fifty households in each of the four randomly selected villages near Zaria in Kaduna State. Using chisquare statistical tool of analysis he found that credit transactions play a direct role in pooling risk between households through the use of contracts in which the repayment of debt owed by the borrower depends on the realization of random productive shocks by both the borrower and the lender. His result shows that interest rates are lower and repayment periods longer for debtor households who have experienced aqverse shocks.
2.1 Theoretical Bases for the Study The work is based on the theories ofPulley (20 1 2) ; Zaman ( 1 999); pitt and Khandher (201 0) as highlighted above.
3. Methodology This research was conducted in Bauchi State covering four local government areas of Bauchi, Darazo, Misau, and Katagum with surviving Micro-finance banks. Ten settlements were selected from these local government areas namelyAkuyam, Azare, Bingi/BulamariDarazo, Yelwa, KafinKuka, Bakin Kura, TasharDanasabe and FadamarMada. These local governn1ent areas are selected because agriculture is the main occupation in the area. Local Government Areas in the
Abtu·a Journal of Business and Management Vol. !, Issue I [ 153-160], March-2015 www.abujajournalofbusinessandmanagement.org.ng Page 1 54
lnfluence of Micro - Credit on Asset Accumulation: A Study of Selected Local Govemment Areas (LGA 's) ln Bauchi State
far north of the state are semi-desert and therefore their inhabitants rely mainly on commerce. The sampling technique used was the combination of simple random sampling and stratified sampling. The far North area also has the problem of seasonal migration to the Southern part of the country. As for Southern part of the state, the rocky nature of the area and the availability of mineral resource mean that agriculture and mining are the two key occupations. To determine the influence of any credit on the main occupation agriculture is, therefore, a problem in the Southern part of the state, The study covered the period 1 998 -20 13 . It was during this period that the bank became established and operational in the area. Our choice of Bauchi state is because it is one of the high rate poverty states in Nigeria with 72.3% poverty rate (NBS Bulletin, 201 0).
We also have good knowledge of the area in terms of culture, geography, economy, and politics that will help us in this research. The loan beneficiaries covering these periods were consulted in order to examine the influence of the loans on the borrower's consumption, income, assets etc. The study was carried out by means of primary data. The data was obtained by means of questionnaire from 1 998-20 1 3 . The questionnaire was limited to straight dichotomy questions, which allow for 'Yes' or 'No' answer. However, fill the blank column was provided where necessary to allow the respondent to agree or disagree to a given statement or fill according to what is in his or her mind. This method of questioning was necessary because the level of education of the people in the area is low. However, the primary method of data collection was supplemented with secondary one collected from the bank. These include the size of the loans disbursed, beneficiaries, and location. The data was collected from the eligible credit users and the eligible non-credit users of the bank. The four Micro-finance banks of Azare, Akuyam, Bauchi and Darazo were chosen because these banks are the only Micro-finance banks recognized as viable in Bauchi State as at 1 998.
Our questionnaires were administered to a sample of90 percent representing 3 1 3 respondents of the loan beneficiaries for the major occupation -agriculture in the study areas. This gives us 1 70 in Azare, 50 in Garu, 52 in Darazo and 60 in Akuyam. We applied a stratified random sampling technique through which every borrower was selected. The population was stratified into borrowers for different agricultural practice, from which 90percent sample was selected, 19 percent of the sample size were women because they constituted 1 9 percent of the population size. For each bank 90percentof its borrowers were selected. And 90percent was, believed, a fair representation. We administered a total of332 questionnaires. To estimate the influence of the credit on asset accumulation we have:
Where: A is log of total asset accumulation per adult equivalent. B is log oftotal consumption per adult eql}ivalent. W is a vector of individual household and village characteristics. Y; is P, -=- P,X;+ U , and is a latent (unobserved) continuous variable or the participation equation. A. = is Mill ratio.
Therefore, A = f(AGMI760, AGFI760, ADEQHRS, AGHHH, AGHHHSQ, REHHS,HHHLR, LGLAQO, OTBLI, HHHPR, HHHSS, HHHSX; VILI, VIL2, VIL3,VIL4, VIL5, VIL6, VIL 7, VIL8, VIL9, VTLIO, B M VA, M L O A D U M I , M L OADUM2, MLOAD U M 3 , ULOADUM l , ULOADUM2, ULOADUM3, MEMLEN], MEMLEN2, MEMLEN3, MEMLEN4).
Abu) a Journal of Business and Management Vol. 1, issue 1 [ 153-1 60}, March-201 5 www.abujajournalofbusinessandmanagement.org.ng Page 1 55
Influence of Micro - Credit on Asset Accumulation: A Study of Selected Local Government Areas (LGA 's) In Bauchi State
Variable definition for asset model = Log of total Asset consumption per adult equivalent = Log of quantity ofland owed =Age of the household head in years =Age ofthe household head squared = Number of adult males in the household aged 1 7 - 60 = 1 760 Numberofadultfemales in the household ag�d 1 7-60 = 1 ifhousehold member of other lending institutions, o if not = 1 ifhousehold head is a manual labourer, or if not =Ratio of the number of adult equivalents to household size = Number aged under 1 7 plus those over 60 = Ratio of earners to household size = 1 ifhousehold head is in good health, o if not = 1 if house hold head attended primary school, 0 if not = ifhousehold head attended secondary school, 0 if not
LGASSET LGLAQO AHHH AG 1 -IHHSQ AGM 1 760 AGM 1 760 OTBLI I HHHLR ADEQHSR DEPEND REHHS HHHHT HHHPS HHHSS HHHAS HHHUNI HHHSX BMVA MLOADUMI
= 1 ifhousehold head attended advance Secondary School, 0 if not = 1 ifhousehold head attend University, 0 if not
MLOADUM2
MOLADUM 3
ULOADUM 1
ULOADUM 2
ULOADUM 3
MEMLEN 1 : MEMLEN 2: MEMLEN 3 : MEMLEN 4: VALVIL: DISMKT: N 1 - 1 H98: VIL 1 VIL2 VI3 VIL4 VIL5 VIL6 VIL7 VIL8 VIL9 VILIO
= 1 ifhousehold head is male, 0 if not = 1 ifhousehold head is the bank's member, 0 if not = l ifhousehold has equivalent of 1 00 acres ofland and Has borrowed less than 5000 Naira, 0 if not. = 1 ifhousehold has more than equivalent of 1 00 acres of land and has borrowed Between 5000 to 10,000, 0 if not. = 1 Ifhousehold has more than equivalent of 1 00 acres of land and has Borrowed more than l O,OOO Naira, 0 if not. = 1 Ifhouseholu has less than equivalent of 1 00 acres of land and has Borrowed less than 5000 Naira 0 if not. = 1 is household has less than equivalent of 1 00 acres of land and borrowed between 5000-lO,OOONaira, 0 if not = 1 Ifhousehold has less than equivalent of 1 00 acres of land and has borrowed more than 1 0,000 Naira, 0 if not.
1 If membership length between 1 - 1 2 months, 0 if not. 1 If membership length between 1 2-24 months, 0 if not. 1 If membership length between24-36 months, 0 if not 1 If membership length more than 36 months, 0 if not. 1 If village is inside a valley or embankment, 0 if not. Distance from market in kilometer. Number of eligible households in the village in 1 998.
Akuyam Azare B ingi/Bulamari Darazo Yelwa KafmKuka Bakin Kura TasharDanasab le FadamarMada Sarma
Ahuja Journal of Business and Management Vol. /, Issue I [153-160}, March-2015 www.abujajournalofbusinessandmanagement.org.ng Page 1 56

Influence a./Micro - Credit on Asset Accumulation: A Study of Selected Local Government Areas (LGA 's) In Bauchi State
4. Results and Discussions Table I Presents the credit and asset relationship. Although the dimension of credit and asset is similar to that of credit and savings, there is a sharp change of asset with credit than of savings with credit. Those within the NlO,OOO loan threshold accumulated as much as the average of 6 1 6 1 .43 . The average asset accumulation for those within the N 20,000 loan threshold is as much as N 1 0, 807. 8 1 . The average asset accumulation continued to increase to N2593 9.53 for those on N30, 000 loan thr(:sholds and to N32, 1 52.63 for those on N40, 000 loan th�;eshold. The increase in the average asset accumulation was more tremendous at N50, 000 loan threshold N52968.75 worth of asset) and N60, 000 loan threshold (N66, 1 1 7.24 worth of asset). This means that increase in credit leads to increase in income, which in turn led to increase in asset accumulation. It means that the higher the level of credit, the higher the level of asset accumulation.
Table 1 : Average Asset Accumulation of Credit Users
Observations 70 64 43 1 9 1 6 29 Source: Survey Data, 2014
Credit W Average AssetN 1 0,000 6, 1 6 1 .43
20,000 1 0,807.8 1 30,000 25,939.53 40,000 32, 1 52.63 50,000 52,968.75 60,000 66, 1 1 7,24
Figure 1 gives the graphical presentation of credit and asset relationship. The curve shows that there is a positive relationship between credit and asset. However, the relationship is not linear. To linearise the curve we take the log of assets acwmulation of households from the matrix of poverty model in Table I . The matrix also recorded some other socio-economic and demographic factors that may affect assets accumulation.
Asset # 1 00 70
Curve Asset Curve
60
50
40
30
20
0 10 20 30 40 50 60
Abu) a Journal of Business and Management Vol./, Issue I [153-160}, March-2015 www.abujajournalofbusinessandmanagement.org.ng
Credit #100
Page 1 57
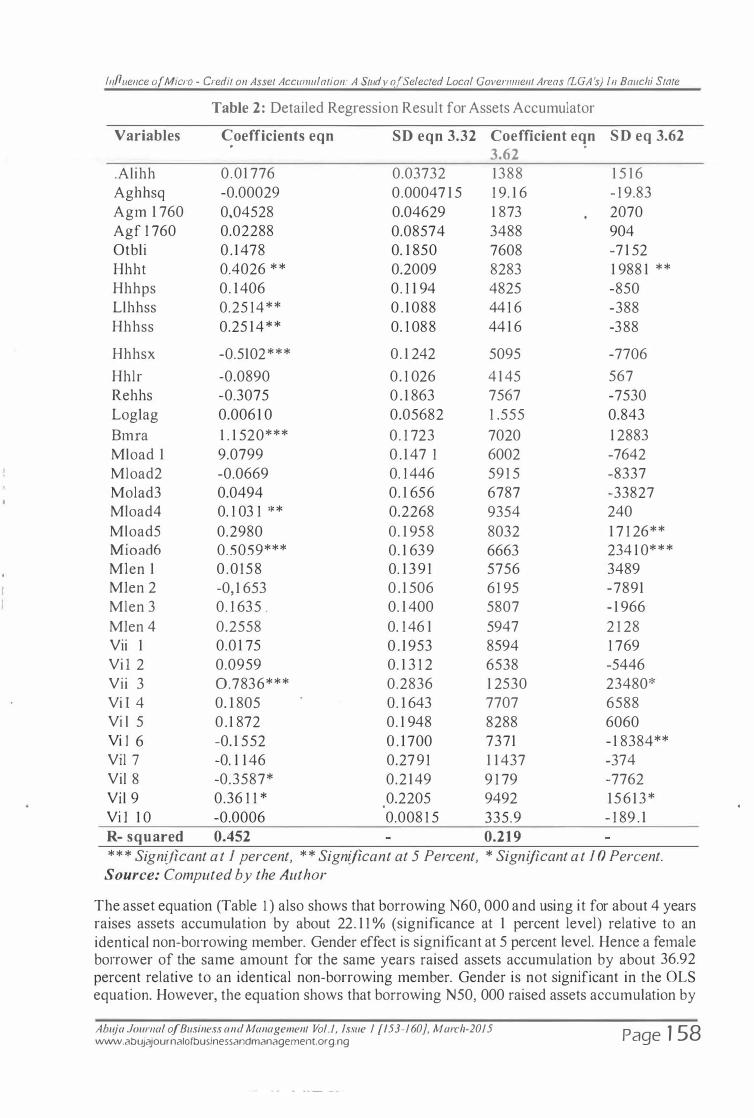
Influence o_f Micro - Credit on Asset Accwnulation: A Study a_( Selected Local Govemment Areas (LGA 's) !n Bauchi State
Table 2: Detailed Regression Result for Assets Accumulator
Variables C:oefficients eqn SD eqn 3.32 Coefficient eqn SD eq 3.62 3.62
.Alihh 0.01 776 0.03732 1388 1 5 1 6 Aghhsq -0.00029 0.00047 1 5 1 9. 1 6 - 1 9.83 Agm 1 760 0,04528 0.04629 1 873 2070 Agf 1 760 0.02288 0.08574 3488 904 Otbli 0 . 1478 0. 1 850 7608 -7 1 52 Hhht 0.4026 * * 0.2009 8283 1 988 1 ** Hhhps 0. 1406 0. 1 1 94 4825 -850 Llhhss 0.25 14** 0 . 1 088 44 1 6 -388 Hhhss 0.25 14** 0. 1 088 44 1 6 -388
Hhhsx -0.5102*** 0. 1 242 5095 -7706
Hhlr -0.0890 0. 1 026 4 1 45 567 Rehhs -0.3075 0 . 1 863 7567 -7530 Log1ag 0.006 1 0 0.05682 1 .555 0.843 Bmra 1 . 1 520*** 0. 1 723 7020 1 2883 Mload 1 9.0799 0 . 147 1 6002 -7642 Mload2 -0.0669 0. 1 446 59 1 5 -8337 Molad3 0.0494 0. 1 656 6787 -33827 Mload4 0. 1 03 1 ** 0.2268 9354 240 Mload5 0.2980 0. 1 95 8 8032 1 7 1 26** Mioad6 0.5059*** 0. 1 639 6663 234 1 0*** Mien 1 0 .0 158 0. 1 3 9 1 5756 3489 Mien 2 -0, 1 653 0 . 1 506 6 1 95 -7891 Mlen 3 0. 1 635 . 0. 1 400 5807 - 1 966 Mien 4 0.2558 0. 1 46 1 5947 2 1 28 Vii 1 0.0 1 75 0 . 1 953 8594 1 769 Vi i 2 0.0959 0. 1 3 1 2 6538 -5446 Vii 3 0.7836*** 0.2836 1 2530 23480* Vi i 4 O. I 805 O. I 643 7707 6588 Vi l 5 0 . 1 872 0. 1 948 8288 6060 Vi i 6 -0. 1 552 O . I700 7371 - 1 8384** Vil 7 -0. 1 1 46 0.279 1 1 1 437 -374 Vil 8 -0.3587* 0.2 149 9 1 79 -7762 Vil 9 0.36 1 1 * 0.2205 9492 1 5 6 1 3 *
.
Vi i 1 0 -0.0006 0.008 1 5 335.9 - 1 89 . 1 R- squared 0.452 0.21 9 * * * Significant a t 1 percent, * * Significant at 5 Percent, * Significant a t 1 0 Percent.
Source: Computed by the Author
The asset equation (Table 1 ) also shows that borrowing N60, 000 and using it for about 4 years raises assets accumulation by about 22. 1 1 % (significance at 1 percent level) relative to an identical non-borTowing member. Gender effect is significant at 5 percent level. Hence a female boJTower of the same amount for the same years raised assets accumulation by about 36.92 percent relative to an identical non-borrowing member. Gender is not significant in the OLS equation. However, the equation shows that borrowing N50, 000 raised assets accumulation by
Ahuja Journal of Business and Management Vol./, Issue 1 [ 153-160}, March-20 15 www.abujajournalofbusinessandmanagement.org.ng Page 1 58
Influence of Micro - Credit 011 Asset Accumulation: A Study of Selected Local Govemment Areas (LGA 's) In Bauchi State
about 8.45 times relative to an identical non-borrowing member (significant at 5 percent level). It also shows that bon·owing N60, 000 raises assets accumulation by about 1 0.22 times (significant at 1 percent level) telative to an identical non-botTowing member. Considet:ing the relative low size of our R -squared in the OLS equation, the result of our equation 3.3 ts more acceptable.
5. Conclusion and Recommendations From our findings we can conclude that micro credit finance banking is a good poverty vaccine, which improved the standard ofliving of the poor. It has a strong influence on asset accumulation. The result confirms the works of many other scholars in the area of micro finance and poverty especially Zaman ( 1 999). It further justified the earlier theories that poverty is a result of selfperpetuating, social, cultural and economic deficiencies, which are beyond the capacity of individuals to remedy through their own efforts (CBN 1 999, and World Bank 200 1 ) . The results also contradict the earlier theories that poor people are lazy and indolent, and have joyfully chosen poverty as a way oflife. Once the poor people are opportune they can set themselves free from poverty. The major contribution of this work to knowledge is the addition to the stock of literature on the influence of micro credit in asset accumulation in Nigeria.
Having seen the influence of Micro-finance banks micro credit on poverty alleviation, the coverage of Micro-finance banks is grossly inadequate for the impact to be felt on the general populace. There is therefore, the need to ensure the spread of the banks to the local government and District headquarters. A general reform needs to be made on the social responsibility of the Micro-finance banks. The responsibility should not be in terms of low cost of borrowing but in terms of having entrepreneurial training as a condition of getting the loans. Credit with education is found effective in poverty alleviation in Ghana and Bangladesh (Zaman 1 999).
The Micro-finance banking system should be a member of the clearing system. The National Board for Micro-finance banks (NBCB) can be empowered to open and equip state offices and be the agent in the clearing system for the Micro-finance banks. The bank suffered from lack of patronage by some communities as a result of the delay in executing some services. The microfinance banking micro credit should be seen as a vaccine for poverty and hence the attention of international institutions, aid bodies, the National Policies on Poverty Eradication and the Local Support Programs should invest in micro-finance banking.
References Central Bank ofNigeria (20 1 3).Nigeria 's Development Prospect: Poverty Assessment and
Alleviation Study, CI3N. Human Development Report (20 I 0). United Nation Human Development Report. UN. Hussain M. ( 1 988). Credit for Alleviation ofPoverty:TheGrameen Bank in Bangladesh.
International Food Policy Research Institute. Mobogunj i A.E. ( 1 993). "New Dimension in�anking: A Focus on Micro-finance banks". The
Nigerians Banker. Jan - March. N aved, R. T. ( 1 994) "Empowerment ofWomen: Listening to the Voices ofWomen". The
Bangladesh Development Studies Vol. XXII, June - Sept. Nos 2 and 3. NBCB, (2000). "Community Banking: 1 0 Years After". National Boardfor Community Banks
Newsletter. Vol. 1 0, No.2. June - Dec. (NBS) National Bureau of Statistic Bul letin Report 20 1 0.
Odej ide, FA. ( 1 997). Breaking the Vicious circle a_[ Poverty among women. Proceedings ofNES Annual Conference. Ibadan.
Pitt, M. and S . Khandker (20 1 0), "The impact of Group-Based credit programs on poor Households in Bangladesh; Does the Gender ofParticipants matter?" Journal ojPolitical Economy, 1 06:5 pp. 958-996.
Ahuja Journal of Business and Management Vol. 1, Issue 1 [1 53-1 60}, March-201 5 www.abujajournalofbusinessandmanagement.org.ng Page 1 59
Influence of Micro - Credit on Asset Accumulation: A Study of Selected Local Government Areas (LGA 's) In Bauchi State
Pulley, R. (20 1 2) "Making the Poor Cresdit Worthy: A Case Study of the Integrated Rural Development Program in India". World Bank Discussion Paper58. .
Richardson, P. (2000), Unorthodox Microfinance: The Seven Doctrine o.fSuccess. Micro Finance Bulletin.F eb.
Udry. C. ( 1 990), "Credit markets in Northern Nigeria: Credit as Insurance in a rural Economy". World Bank
Udry, C. (2008), "Credit markets in Northern Nigeria: Credit as Insurance in a rur.al Economy". World Bank Economic Review.
World Bank (20 1 0). World Development Report: Attacking Poverty. Oxford University Press. Wydick, B . (20 l l ), "Effect ofMicro Enterprise Lending on Child Schooling in Guatemala".
Journal of Economic Development and Cultural Change. Vol.4 7 No. 4. Yaron, J. ( 1 992). Rural Finance in Developing Countries. Policy research Working Paper Series.
No. 875, March. Zaman, H . (20 1 1 ), "Assessing the poverty and vulnerability impact of micro credit in
Bangladesh: A case study ofBRAC". Policy Research Working Paper. 2 1 45 . World Bank Development Research, Washington, D. C, USA.
Abu) a Journal of Business and Management Vol. /, fssue I [153-160], March-2015 www.abujajournalofbusinessandmanagement.org.ng Page 1 60
Assessing the Impact of Micro-finance Banks on Economic Empow�rment of Female Entrepreneurs in Ka�una State
Anietie Charles Dikki Department of Accounting, Faculty of Administration, Ahmadu Bei/o University, Zaria, Nigeria
Abstract: This study assessed the impact of Micro-finance Banks (MFB) on Economic Empowerment of Female Entrepreneurs in Kaduna State. The main objective is to examine the impact ofMFBs services on the economic empowerment of female entrepreneurs in the State. A survey approach was adopted for the study to gather the necessary data, survey was considered appropriate as it is capable of collecting large data required for the study. The collected data was only from primary source; this is in view of the fact that there was no secondary data showing how MFBs have contributed to the empowerment of female entrepreneurs in Nigeria. Sample of 384 female entrepreneurs were drawn from a population of 640. The study was analyzed using descriptive statistics and ordered logit regression tool. The result revealed that micro-finance banks have significant impact on the economic empowerment of female entrepreneurs as the study found that various loan disbursement schemes offered by the banks have contributed significantly to the empowerment of female entrepreneurs in the state. It was therefore, recommended that in order for the women to be empowered, the MFBs should encourage female entrepreneurs on the need to save with the MFBs so as to boost their chances of gettingfurther loans. Keywords: Economic Empowerment, Female Entrepreneurs, Financial Services, Kaduna State, Microfinance Bank
1. Introduction Women are an important part of any society and in many societies constitute more than 50 percent of the population. They are therefore an important sector that should be taken seriously i fthe social, political and economic, development of any nation is to he ensured. Unfortunately however, women folk the world over have been among the most vulnerable, economically, educationally and politically and many have not been empowered. This is probably because of cultural, religious and other societal beliefs and practices. In the last decade or two, the attention of the international community has been focused on the most vulnerable segments of the society like women and children. Some emancipated women have sought to champion the cause of the women folk. Women's access to financial services is critical to their economic empowerment because they are an important part of any society. Unitus (2007) asserts that almost half the world's population, that is three billion people live on less than $2 per day and out of this, 70 percent are women. Women therefore constitute the bulk of those that need microfinance services. Targeting women has p.roved to be v�ry successful, and in Deshpanda's, (200 1 ) view, assisting them generates a multiplier effec(as women would generally spend more of their income on their famil.ies. Therefore, when they are helped, the welfare of the family is also improved. ··
Empirical evidence has shown that women are more secure credit risks than men, and low income entrepreneurs have more solid repayment records than do the clients of banks in the formal financial sector (United Nations Expe1i Group on Women and Finance, 1 995). In the same vein, Cheston and Kuhn (2002) asserted that women business owners have a low rate of business failure and low- income women generally have a low percentage ofloan defaults. They are of the opinion that lower arrears and loan loss rates have a significant positive impact on both the sustainability and efficiency of the microfinance organizations that are working with women.
Even with the seeming economic growth, attention has been drawn to the fact that the chasm between the rich and the poor appears to be widening with women being more vulnerable. This led past govermnents to enunciate programmes and projects that targeted the poor with the aim of reaching out to women Such programmes included the Rural Banking Scheme, the Agricultural Credit Guarantee Scheme (ACGS), National Development Employment (NDE), People Bank of Nigeria (PBN), Community Banks and Family Economic Advancement Programme (FEAP) etc. The objective was to make credit readily available to those who were denied access to credit. Such credit would in turn help to stimulate micro
Ahuja Journal of Business and Management Vol./, Issue I {161-1 71}, March-20/5 www.abujajournalofbusinessandmanagement.org.ng Page 1 6 1

Assessing the Impact o.f Micro-jincmce Banks on Economic Empowerment ofFemale Entrepreneurs in Kaduna State
economic ventures, petty business and small and medium scale industries (SMis) which have been described as the springboard for sustainable development This will enable these sections of the society to be financially independcl)t and in the process of achieving financial independcnc9, they will be economically empowered. With careful attention to a strategic gender approach, micro finance institutiOns have the potential to enable women to become socially, politically and personally empowered, while gaining and sustaining economic empowetment through financial selfsustainability.
The method of operation of conventional banking has imposed a market niche that must be explored if majority of the populace are to be bankable. The players of this banking system are large enterprises which are judged to be credit wotthy. These players exclude those who are assessed to be un-bankable such as the small entreprenems and farmers especially women who lack collateral, steady employment and a verifiable credit history and therefore unable to gain access to traditional financial credit facility. Due to this, the need to channel financial resources to the productive sectors still remained a major challenge to the government and the monetaty authorities and therefore sequel to the pronouncement of consolidation exercise by the CBN in 2004 and the emergence ofmegabanks, a policy ofmicrofinance bank (MFB) was introduced in 2005 to provide a platform for the under-banked segment of the economy that may not be able to meet the stringent requirements of conventional banks. By December, 2007, govemment had given licenses to 107 microfinance banks and con vetted 600 out of 761 Community banks to Microfinance banks, giving the total number ofmicrofinance banks as 707 in the country (Soludo, 2008).
In Nigeria, for instance, micro entrepreneurs are the normal customers of the micro-finance institution and a large number of this group are women who carry out different business. Majority of such persons do not have access to financial products and also lack place to keep their income safely. This has served in so many instances as a hindrance for the expansion of their business beyond the barest means of survival. A small capital injection into the business could produce a significant growth that can lead to increase in the level of economic activity and affect positively their empowerment. In Kaduna state for instance, effort has been made by successive govemrnent to empower women through the MFBs. The effort ranges from facilitating easy access to MFis loans to training them on business skills and record keeping in order to ease the process of dealing with MFis in the state. However little seems to be known about the extent to which the state government's effort and intervention have affected the economic empowerment of the businesses of the women entreprenems. At the same time the research findings are different from previous studies like Iheduru (2002), who attempted to study the impact of three "microfinance" programmes on women empowerment. However, two out ofthc three institutions studied; Peoples Bank ofNigeria (PBN) and Family Economic Advancement Program (FEAP) were not MFis. In addition, the study focused on Micro finance institution and its impact on women development prior to the launching of the MPRSF in 2005. Also the study ofBabajide (20 1 1) who did an extensive work on micro and small enterprises in South-West Nigeria and discovered that non-financial services of micro finance scheme had impacted significantly on business performance. The study however did not look at the extent to which financial services as a whole impact on entrepreneur's empowerment, specifically women in the Northern part of the country.
It i s against this back drop that a study of the impact of MFB services on the economic empowerment of female entrepreneurs in Kaduna state becomes imperative. The main objective of the study is to investigate the impact of MFB services on the economic empowerment of female entrepreneurs in Kaduna state. However, the services ofMFBs in this study are delimited mainly to the financial services.
1.2 Statement of Hypothesis In line with the above stated objective, the following null hypothesis is hereby formulated.
H01: MFB services have no significant impact on the economic empowerment offemale entrepreneurs in ·
Kaduna state.
Abuja Journal of Business and Manclgement Vo/. 1, Issue I [161-171], March-2015 www.abujajournalofbusinessandmanagement.org.ng Page 1 62
Assessing the Impact of Micro-finance Banks on Economic Empowerment of Female Entrepreneurs in Kaduna State
2. Literature Review 2.1 Concept ofMicro-finance and MFB On his part, Yunus.(2003) described microfinance as a financial system that relics on the traditional skills and entrepreneurial instmcts of the active poor people, mostly women, usmg small loans (usually less than US$200), other financial services, and support from local organizations called microfinance institutions (MFis) to start, establish, sustain, or expand very small, self-supporting businesses. A MFB has been defined by CBN (20 12) as the frame work for the delivery of financial services on sustainable basis to the Micro, Small and Medium Enterprises (MSMEs).
•
The development of modem MFBs in Nigeria started with the Development Finance experience complemented by the microcredit schemes such as the rural banking scheme, the Nigerian Agricultural and Co-operative Bank Limited (NACB) the National Directorate of Employment (NDE), the Nigerian Agricultural Insurance Corporation (NAIC), the Peoples Bank ofNigeria (PBN), the Community Banks (CBs), the family Economic Advancement Program (FEAP) among others (CBN, 2005). Although modest successes were recorded especially in agricultural and rural financing and small scale enterprise credit, there were some constraints that hindered the effectiveness of Development Finance Institutions and the impact on the po01· varies (Ojo, 2003).
At the same time, several NGOs took root in the country but their outreach also was limited due mainly to unsustainable sources of funds (CBN, 2005 and CBN,20 12). The need for a regulated micro finance bank in the country therefore came about as a result of the sub-optimal performance of the community banks, development finance institutions, micro finance institutions and the problem of outreach, experienced by previous finance institutions leading to a l)uge gap in the provision of financial services to a large number of active but poor and low income groups (CBN, 2005). In addition, the report states that the formal financial system provides services to about 35% of the population, while the remaining 65% are excluded from access to financial services. These are the 65% that arc being served by the informal financial sector through NGOs, money lenders, friends, relatives and credit unions. The desire to regulate their activities and bring them under the supervision of the CBN in order to meet the financial requirements of the Micro, Small and Medium Enterprises (MSMEs) were the reasons that led to the establishment ofmicrofinance banks in Nigeria.
2.1 .1 Concept of Female Entrepreneur Entrepreneurship is basically a male dominated area. The entrepreneur is not only seen as a man but the business is treated as an entity separate from the family, this is not the way women see their businesses. This is the cultural context in which the entrepreneur is seen and the legitimate reason for the study of women entreprenemship. Female entrepreneurship is a subset of entrepreneurship and because of the uniqueness of women involves specifically focusing on women founders, their ventures and their entrepreneurial behaviors. According to Moore and Buttner ( 1997), until the beginning of the 1980's almost nothing was known about ferr{�lle entrepreneurs and the studies on entrepreneurs were almost entirely on men, scientific course on female entrepreneurship actually began to gain ground in the 80's. This emerged as a result of the attention by the developed countries on the relationship between women and the economy. The increase in women entrepreneurs during the 1 990's was brought about by the dramatic increase in female employment since the second world war, the interest of institutional actors political, economic and research now show in demographic change, the globalization of the economy and the demand by women for access to higher managerial positions as a consequence of their advancement in education and training (Bruni, Gherardi and Poggio, 2004). Therefore, aimed with the assumption that the enterprise is a rational economic activity and with equal opportunities for its gender citizenship, coupled with the widespread presence of small and medium enterprises and the fact that many now own or run small firms and even start new ones, the female entrepreneur now emerged.
2.1.2 Concept ofEmpowerment Empowerment is a non-economic benefit of associated with any traditional or new investment and productive activities such as microfinance (Zeller et al, 1 997). This type of non-economic benefit can be analyzed with the help of qualitative indicators such an individual's control over resources, involvement in household and community decision-making and participation in community activities and social network
Abuja Journal of Business and Management Vol. I, Issue 1 [161-1 71). March-2015 www.abujajournalofbusinessandmanagement.org.ng Page 1 63
Assessing the Impact of Micro-finance Banks on Economic Empowerment of Female Entrepreneurs in Kaduna Stale
and electoral participation (Goetz and Sen Gupta, 1 996; Schuler and Hashemi, 1994; Hashemi et a1, 1 995). Emphasizing the different ways of empowering women in order for them to be relevant in the economy, Ade1aja (2Q05) suggested microfinance as one of the best ways to el)lpowcr women for enhanced economic status. The global objective of the general microcredit campaign is that of bringing local financial services for self-employment to I 00 million impoverished families, especially women by 2005 (Microcredit Summit.org). The year 2005 was also declared the "intemational year ofmicrocredit" by the United Nations.
2.2 Empirical Studies In a study conducted by Yawc (2002), it was discovered that microfinance contributed to women's economic empowerment in form of access to assets as well as control of assets. It also contributed to improved and expanded businesses and income, improved family welfare, reduced domestic violence, involvement in household and community decision making. In rural Kenya, a study was under taken by Loice and Razia (201 3) on the effect of microfinance intervention on empowerment of women entrepreneurs. The study used a causal survey research design and questionnaire on 80 members of a MFis in the study area. With the use of linear multiple regression, the result showed microfinance interventions of credit and trainings to have a significant positive relationship with empowerment, while savings had no significant effect. The study was localized in one area and that is rural Kenya also the sample size used was small and from only one MFI which makes generalization difficult.
In Nigeria, studies on the relationship between microfinance and empowerment were also under taken. In 2002 Ihcduru (2002), studied the effect of micro finance institutions on women empowerment. With the use of descriptive statistics, she found that microfinance affects empowerment positively. However, in view of time passage of more than a whole decade, replication of that study for Nigeria has become necessary. The study at the same time was limited as the result was not subject to sophisticated statistical teclmiques in order to separate the effects of micro finance from other factors.
Of more recent, Akande (2012) did a performance analysis of MFBs in Oyo state in Nigeria. Using qucstion�aires and descriptive statistics of tables, frequencies, percentages and chi square the study found no significant performance due to high interest rate and short repayment periods. The study was however weak in its use of only descriptive statistics and at the same time the study had a poor states' coverage as it was tilted towards one state in Nigeria. Still in Nigeria, Awojobi (2014) using descriptive statistics conducted a study on the impact of microcredit on women empowerment. Findings from the study showed significant improvement in the household well-being, income and employment and women's empowerment as a result of participating in microfinance program. The study was weak in its small sample size offmty localized in Lagos state as well as in its weak methodology. No strong statistical tool was used even in testing the hypothesis.
The major limitation or problems of past studies was that none of these studies was specifically addressing women and even that oflheduru (2002) that addressed women was prior to the launching of the MFPRSF that is before the MFB took off in Nigeria. At the same time the researches done in Nigeria has been limited as no work has been specifically carried out in Kaduna state to determine the extent to which the MFBs have impacted on the female entrepreneur empowe1ment.
2.3. Theoretical Bases for the Study This theory is anchored on the resource base entrepreneur theory, specifically on the financial and human capital theories of Aldrich ( 1 999); Becker ( 1 975) and Shane and Vankataraman (2000). The theoretical bases of the study lie in the fact that that there is a mediating relationship between opportunity for finance and women entrepreneur empowerment (Ekpe, Mat and Razak (20 1 0). Accordingly, women entrepreneur who have opportunity for microfinance are able to generate entrepreneurial activities and subsequently become economically empowered. The business environment provides opportunities for entrepreneurial activities and the ability to exploit such opportunities leads to the demand for microfinance in tem1s of resource acquisition. At the same time, the acquisition ofmicrofinance which is a resource, along with the knowledge gained from education and experience could also lead to opportunity for entrepreneurial activity thereby leading to economic empowerment.
Abuja Joumal of Business and Management Vol./, issue I [161-17 1], March-2015 www.abujajournalofbusinessandmanagement.org.ng Page 1 64
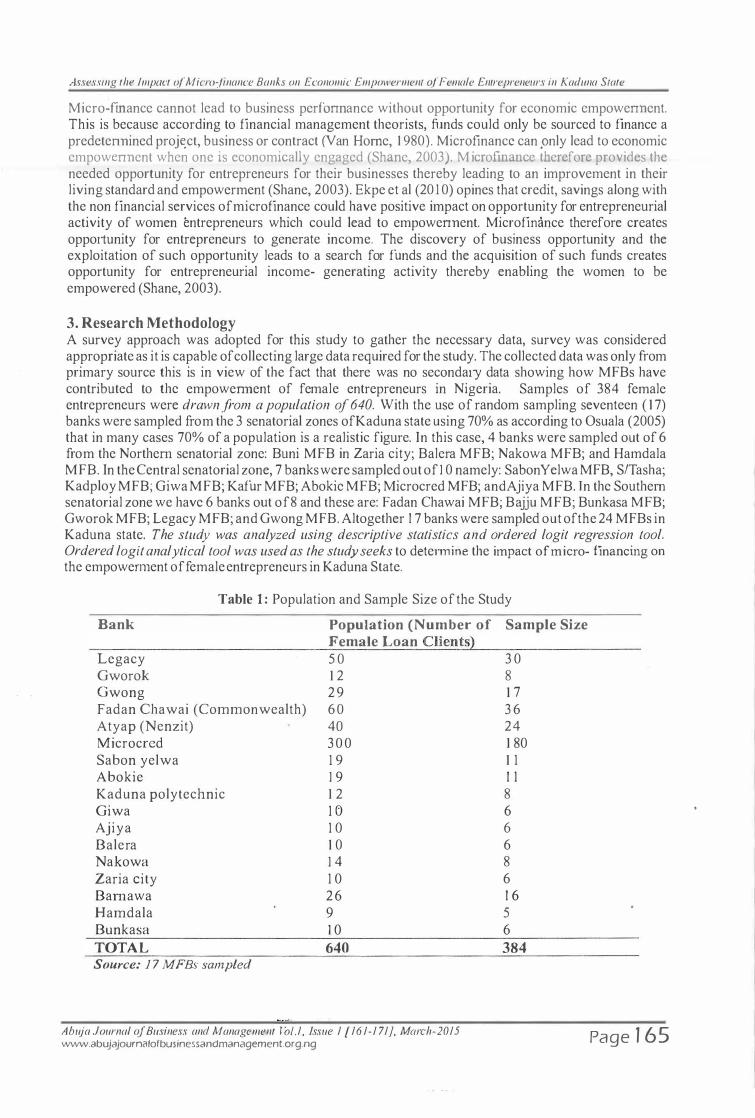
Assessing the Impact of Micro-finance Banks on Economic Empowerment of Female Entrepreneurs in Kaduna State
Micro-finance cannot lead to business perfonnance without opportunity for economic empowennent. This is because according to financial management theorists, funds could only be sourced to finance a predetennined proj�ct, business or contract (Van Home, 1 980). Microfinancc can _only lead to economic empowcnnent when one is economically engaged (Shane, 2003). Microfinance therefore provides the needed opportunity for entrepreneurs for their businesses thereby leading to an improvement in their living standard and empowerment (Shane, 2003). Ekpe et al (20 1 0) opines that credit, savings along with the non financial services ofmicrofinance could have positive impact on opportunity for entrepreneurial activity of women entrepreneurs which could lead to empowennent. Microfimince therefore creates opportunity for entrepreneurs to generate income. The discovery of business opportunity and the exploitation of such opportunity leads to a search for funds and the acquisition of such funds creates opportunity for entrepreneurial income- generating activity thereby enabling the women to be empowered (Shane, 2003).
3. Research Methodology A survey approach was adopted for this study to gather the necessary data, survey was considered appropriate as it is capable of collecting large data required for the study. The collected data was only from primary source this is in view of the fact that there was no secondary data showing how MFBs have contributed to the empowennent of female entrepreneurs in Nigeria. Samples of 384 female entrepreneurs were drawn from a population of 640. With the use of random sampling seventeen ( 1 7) banks were sampled from the 3 senatorial zones ofKaduna state using 70% as according to Osuala (2005) that in many cases 70% of a population is a realistic figure. In this case, 4 banks were sampled out of 6 from the Northern senatorial zone: Buni MFB in Zaria city; Baiera MFB; Nakowa MFB; and Hamdala MFB. In the Central senatorial zone, 7 banks were sampled out of 1 0 namely: Sabon Yelwa MFB, S/Tasha; Kadploy MFB; Giwa MFB; Kafur MFB; Abokic MFB; Microcred MFB; andAjiya MFB. In the Southern senatorial zone we have 6 banks out of8 and these are: Fadan Chawai MFB; Bajju MFB; Bunkasa MFB; Gworok MFB; Legacy MFB; and Gwong MFB. Altogether 1 7 banks were sampled out of the 24 MFBs in Kaduna state. The study was analyzed using descriptive statistics and ordered logit regression tool. Ordered logit analytical tool was used as the study seeks to determine the impact of micro- financing on the empowerment offemale entrepreneurs in Kaduna State.
Table 1 : Population and Sample Size of the Study
Bank Population (Number of Female Loan Clients)
Legacy 5 0 Gworok 1 2 Gwong 29 Fadan Chawai (Commonwealth) 60 Atyap (Nenzit) 40 Microcred 3 0 0 Sabon yelwa 1 9 Abokie 1 9 Kaduna polytechnic 1 2 Giwa 1 0 Ajiya 1 0 Baler a 1 0 Nakowa 1 4 Zaria city 1 0 Barnawa 26 Hamdala 9 Bunkasa 1 0 TOTA L 640
Source: 1 7 MFBs sampled
Ahuja Journal of Business and Management Vo/.1, issue 1 [161-1 71], March-2015 www.abujajournalofbusinessandmanagement.org.ng
Sample Size
3 0 8 1 7 3 6 24 1 80 1 1 1 1 8 6 6 6 8 6 1 6 5 6 384
Page 1 65
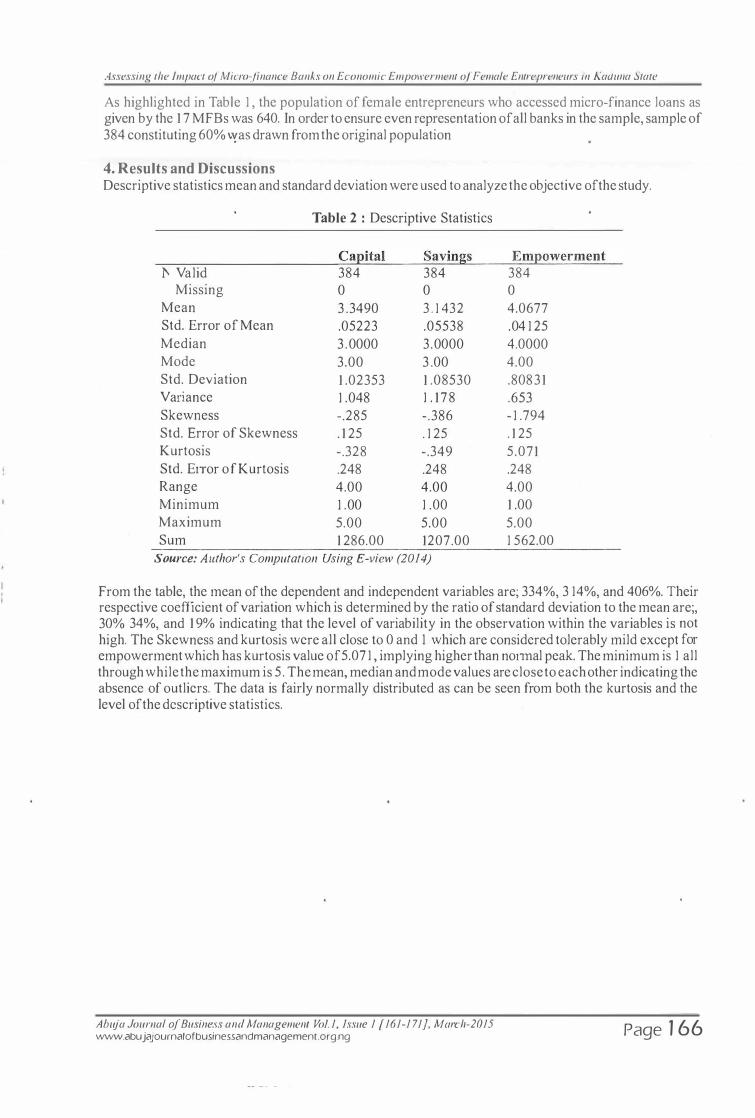
Assessing the Impact of Micro-finance Banks on Economic Empowerment of Female Entrepreneurs m Kaduna State
As highlighted in Table 1 , the population of female entrepreneurs who accessed micro-finance loans as given by the 1 7 MFBs was 640. In order to ensure even representation ofall banks in the sample, sample of 384 constituting 60% V(aS drawn from the original population
4. Results and Discussions Descriptive statistics mean and standard deviation were used to analyze the objective of the study.
Table 2 : Descriptive Statistics
Capital Savings Empowerment 1'- Valid 384 384 384
Missing 0 0 0 Mean 3 .3490 3 . 1 432 4.0677 Std. Error of Mean .05223 .05538 .04 1 25 Median 3 .0000 3.0000 4.0000 Mode 3.00 3 .00 4.00 Std. Deviation 1 .02353 1 .08530 .8083 1 Variance 1 .048 1 . 178 .653 Skewness -.285 -.386 - 1 .794 Std. Error of Skewness . 1 25 . 1 25 . 1 25 Kurtosis -.328 -.349 5.071 Std. Error of Kurtosis .248 .248 .248 Range 4.00 4.00 4.00 Minimum 1 .00 1 .00 1 .00 Maximum 5.00 5.00 5.00 Sum 1 286.00 1207.00 1 562.00
Source: Author's Computation Using £-view (2014)
From the table, the mean of the dependent and independent variables are; 334%, 3 14%, and 406%. Their respective coefficient of variation which is determined by the ratio of standard deviation to the mean are;, 30% 34%, and 1 9% indicating that the level of variability in the observation within the variables is not high. The Skewness and kurtosis were all close to 0 and 1 which are considered tolerably mild except for empowerment which has kurtosis value of5.07 1 , implying higher than notmal peak. The minimum is 1 all through while the maximum is 5 . The mean, median and mode values are close to each other indicating the absence of outliers. The data is fairly normally distributed as can be seen from both the kurtosis and the level of the descriptive statistics.
Ahuja Joumal of Business and Management Vo/. 1, Issue 1 [161-171}, March-2015 www.abujajournalofbusinessandmanagement.org.ng Page 1 66
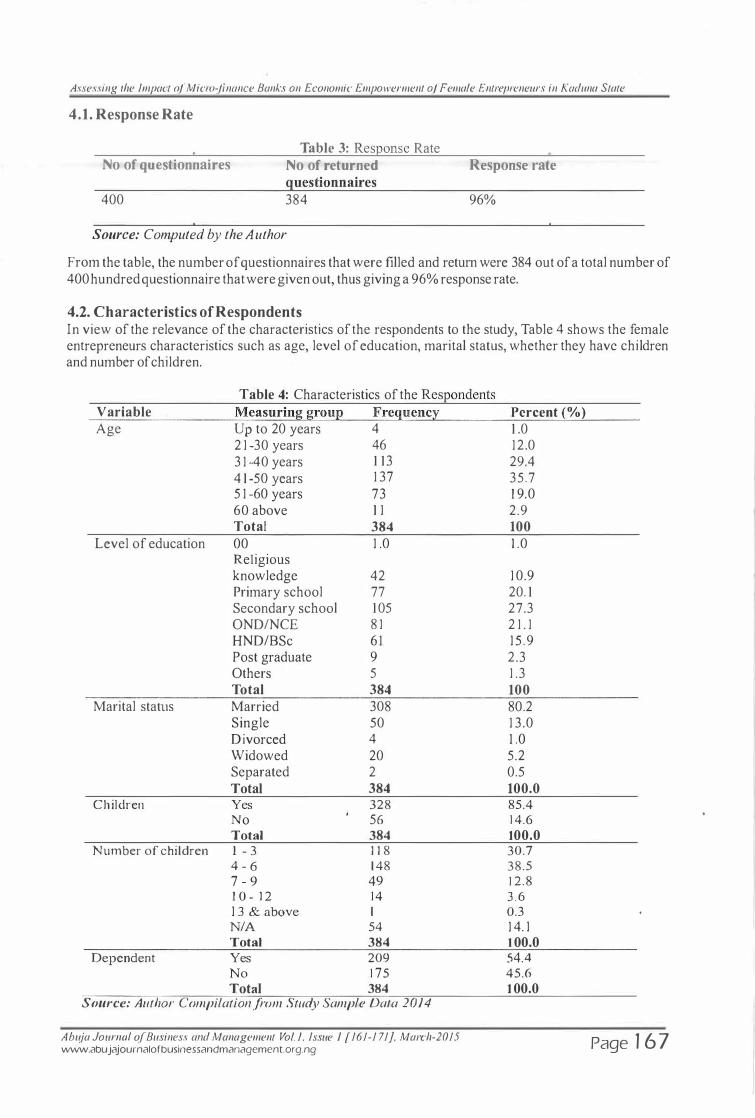
Assessing the Impact of Micro-finance Banks on Economic Empowerment of Female Entrepreneurs in Kaduna State
4.1. Response Rate
No of questionnaires
400
Table 3: Response Rate No of returned questionnaires 384
Source: Computed by the Author
Response rate
96%
From the table, the number of questionnaires that were filled and return were 384 out of a total number of 400 hundred questionnaire that were given out, thus giving a 96% response rate.
4.2. Characteristics of Respondents In view of the relevance of the characteristics of the respondents to the study, Table 4 shows the female entrepreneurs characteristics such as age, level of education, marital status, whether they have children and number of children.
Variable Age
Level of education
Marital status
Ch ildren
Number of children
Dependent
Table 4: Characteristics of the Respondents Measuring group Frequency Up to 20 years 4 2 1 -30 years 46 3 1 -40 years 1 13 4 1 -50 years 1 37 5 1 -60 years 73 60 above 1 1 Total 384 00 1 .0 Religious knowledge 42 Primary school 77 Secondary school 1 05 OND/NCE 8 1 HND/BSc 6 1 Post graduate 9 Others 5 Total 384 Married 308 Single 50 Divorced 4 Widowed 20 Separated 2 Total 384 Yes 328 No 56 Total 384 1 - 3 1 1 8 4 - 6 1 48 7 - 9 49 1 0 - 1 2 1 4 1 3 & above 1 N/A 54 Total 384 Yes 209 No 1 75 Total 384
Source: Author Compilation from Study Sample Data 2014
Ahuja Journal of Business and Management Vol. /, Issue I [161-1 71], March-2015 www.abujajournalofbusinessandmanagement.org.ng
Percent (%) 1 .0 1 2.0 29.4 35 .7 1 9.0 2.9 100 1 .0
1 0.9 20. 1 27.3 2 1 . 1 1 5 . 9 2.3 1 .3 100 80.2 1 3 .0 1 .0 5.2 0.5 100.0 85.4 1 4.6 100.0 30.7 38.5 1 2.8 3 . 6 0.3 1 4. 1 1 00.0 54.4 45.6 1 00.0
Page 1 6 7

Assessing the Impact of Micro-finance Banks on Economic Empowerment of Female Entrepreneurs in Kaduna State
Table 4 shows that 4 ( 1 %) of the respondents were up to 20 years, 46 ( 12%) were between 2 1 -30 years, 1 13 (29.4%) were between 3 1 -40 years, 137 (35.7%) were between 4 1 -50 years, 73 ( 1 9%) were between 5 1 -60 years while 1 1 (2.9%} were between 60 and above. This confirms the study by Ba�ajide (20 1 1 ) that majority of the respondents fall within the economic active age group, \Vhich is between the ages of3 1 -60 years which represent 84% of the total respondents. Accordingly it means that 84% of the economic active age group is employed by the MSME and the more reason why the sector should be given adequate attention so that the sectorcan contribute maximally to GDP.
From the table, majority of the respondents are literate 324 (84%). They therefore have adequate knowledge judging from their educational qualification to answer the questions. At the same time formal education affects their ability to manage their enterprises (Masakure, 2008). The table further revealed that 308 (80.2%) are manied implying that majority of the respondents are responsible women with families they cater for 328(85.4%) despite the fact that they are entrepreneurs.
4.3 Test ofHypothesis In line with the objectives of the study, the study was conducted to test the following hypothesis that MFB has no significant impact on the economic empowerment of female entrepreneurs. This hypothesis was tested with the use of quantitative primary data and multiple regression analysis, specifically ordered logit. Ordered logit as the name implies was used because of the dependent variable that is of a Iikert scale in nature. The result is shown in Table 5 .
Table 5: Ordered Logit Result between Microfinance and Empowerment
Coefficient Std. Error z-Statistic Prob.
CAPITAL 0 .3 16880 0. 1 1 7691 2.692475 0.0071 AMOUNTSAVED 0.273033 0. 1 1 1 870 2.440624 0.0147
- - - -
Dependent; control resources
Coefficient Std. Error z-Statistic Pro b.
CAPITAL 0.357400 0 . 1 30703 2.734453 0.0062 AMOUNTSAVED 0.30 1 885 0 . 1 2424 1 2.429842 0.0 1 5 1
- - -
Dependent variable;family decision
Coefficient Std. Error z-Statistic Pro b.
CAPITAL 0.266088 0. 1 20576 2.206800 0.0273 AMOUNTSAVED -0.036368 0. 1 1 7961 -0.308307 0.7578
Dependent variable; participation community
Coefficient Std. Error z-Statistic Pro b.
CAPITAL 0.32860 0 . 1 24487 2.639629 0.0083
AMOUNTSAVED 0.00 1475 0. 1 2 1 348 0.01 2 1 55 0.9903 - - - -
Dependent variable; interaction in the community
Table 5above shows the ordered logit result between micro finance represented as capital that is the capital borrowed from the MFB which is the same thing as loan and amount saved, that is the amount saved in the MFB. This is then the independent variable while the dependent variable are the various indices of empowerment which are the ability to control resources, participate in family decisions, participate in the community, interact in the community and (Goetz and Sen Gupta, 1 996; Schuler and Hashemi, 1 994'; Hashemi et al, 1 995). From the result, there is a significant positive relationship between micro finance and all the empowerment indicators. This we can see from the p value that is less 5% and the z statistics that is greater than 2 in all except predictor variable amount saved in participation in conununity and interaction in the corrununity (dependent variable).
Ab1lja Journal of Business and Management Vol. /, !.ss1.1e I [161-1 71}, March-2015 www.abujajournalofbusinessandmanagement.org.ng Page 1 68
Assessing the Impact ofMicrojinance Banks on Economic Empowerment of Female Entrepreneurs in Kaduna State
4.4 Major Findings The significant positive relationship confirms the work ofMatovu (2006). The significance is more from capital (loan) than frotn the amount saved, indicating a strong positive relationship bl(tween bank loan and empowerment. This confirms the work of Simeyo, Martin, N yamao, Ojera, & Odondo,(20 1 1 ), though in their case bank loan was positively related with performance. Also it confirms the work ofLoice and Razia (20 1 3 ) in which case savings had no significant effect while in this study, it only has a significant effect with two of the empowennent indicators, control of resources and family decisions. At the same time although there is a significant relationship between microfinance and empowerment, the contribution is less than expected as can be seen from the coefficient. This confirms the work of Mayoux (2006) that the contribution of micro finance to women empowerment is generally less than expected.
5. Conclusion and Recommendations 5.1 Conclusion From the above major findings, we can conclude that microfinance has been able to impact on female entrepreneurs' economic empowerment more in its ability to enable them control resource such as financial, land property and so forth and also in their involvement in family decision making. In the area of participation and interaction in community, the loan they acquired from the bank indicated as capital has also played a key role in this area but the contribution from savings in the bank has been poor.
5.2 Recommendations The study is hereby making the following recommendations: 1 . Since microfinance has been seen to be able to impact on female entrepreneur economic
empowerment thereby enabling them to control resources and be involved in family decision making and even participate in the community, the government should see to it that a lot of publicity is given to MFB thereby creating more awareness of the products and services of microfinance.
2 . The contribution of loan to female entrepreneurs economic empowerment was high, therefore MFBs should extend the loan period to match varying borrowing powers of clients so as to enable them have adequate time to invest the loan and use the returns for repayment.
3 . In order for the women to be empowered, the MFBs should encourage the female entrepreneurs on the need to save with the MFBs so as to boost their chance of getting further loans.
5.3 Suggestions for Further Studies So many interesting areas of research are suggested for further studies :
1 . Further r�search could be conducted by the use of secondary sources of data as this study relied only on primary date.
2. It is also possible to look at the influence of demographic factors on the economic empowerment offemale entrepreneurs.
3 . The instrument of this study was cross sectional with the use of perceptual measures. A similar study can be done using longitudinal survey.
Reference Adelaja, MA 2005, " Women 's Empowerment Strategy in Nigeria: How feasible for Sustainable Development", A Paper Presented at the Inauguration Programme ofYEPW at
Airport Hostel lkeja, 27'h August. .Akande, 00 201 2, "Performance analysis ofMFBs on women entrepreneurs in Oyo state, Nigeria",
Research Journal in Organizational Psychology and Educational Studies 1 (3) pp l 68- J73 . Aldrich, HE 1 999, "Organisations Evolving" Sage Publications Awojobi, ON 201 4, "Empowering women through microfinance? Evidence from Nigeria", Australian
Journal of Business and Management Research vo/4. No 1 pp1 7-26Apri. l Babajide, A 201 1 Effect of Micro financing on Micro and Small Enterprises in South-West Nigeria. An
Unpublished Ph.D Dissertation. Banking and finance, dept of banking and finance Covenant Univ. Lagos state. Nigeria.
Ahuja Journal of Business and Management Voi.J, Issue I [161-1 71}, March-2015 www.abujajournalofbusinessandmanagement.org.ng Page 1 67
Assessing the Impact of Micro-finance Banks on Economic Empowerment of Female Entrepreneurs in Kaduna State
Becker 1 975, 'Human Capital", Chicago IL:Chicago University Press. Bruni, A, Gheradi, S & Poggio, B 2004, "Entrepreneur-mentality, gender and the study of women
entrepreneurs" iq Journal of Organizational Change Management. 1 7(3), pp �56-268. C.B.N. 2005, Report from rnicrofrnance policy and programme development committee; January. C. B . N. 201 2, Revised regulatory and supervisory guidelines for Microfinance Banks (MFBs) in
Nigeria Draft 1 8'h December. Cheston, S & Kulm, L 2002, 'Empowering women through microfinance", Draft paper. Sponsored
by the Women's Opportunity Fund and its funding partners . Published by UNfFEM USA. Des panda, R 2001 "Increasing Access and Benefit for Women Practices and Innovation Among MFis ", survey results. N. York UNCDP. Ekpe, I, Mat, NB & Razak, RC 20 I 0, "The effect of micro finance factors on women entrepreneurs'
performance in Nigeria, a conceptual framework", Internetional Journal of Business and Social Science val No2 November
Goetz, AM & Gupta, R Sen G 1996, "Who takes the credit? Gender, power and control over loan programs in rural Bangladesh", World Development 24 No. lpp45-63.
Hashemi, SR, Schuler, SS & Riley, AP 1 995, "Rural credit programs and women's empowerment in Bangladesh" World Development 24 No.4. pp635-653.
Iheduru, NG 2002, " Women Entrepreneurship and Development,· The Gendering of Micro finance in Nigeria", A paper presented at the 6'" International Interdisciplinary Congress on Women held on 2 1 -26 July. Makerere University, Kampala- Uganda.
Loice, M & Razia, C 20 1 3 , "Microfinance interventions and empowetment of women entrepreneurs rural constituencies in Kenya", Research Journal of Finance and Accounting vo/4 No. 9.
Masakure, 0 Cranfield, J & Henson, S 2008, "The financial performance of non-farm microenterprises in Ghana", World Development, 36(12),pp 2733-2762. Matovu, D 2006, Microfinance and Poverty Alleviation Uganda- A Case Study of Uganda Finance Trust, School of Global Studies, Unpublished master thesis Africa and International development corporation Uganda. Mayoux, L 2006, "Women 's empowerment or feminization of debts? Towards a new agenda for Africa", IMF Discussion paper for a one world action conterence CUK Dept of lntormational Development, London. Moore, D & Buttner, H 1 997, "Women entrepreneurs, Moving Beyond the Glass Ceiling", Sage, Thousand Oaks. Ojo, JAT 2003, 'Partnership and strategic alliance effective SME developments. Small and Medium Enterprises Development and SMIEIS: Effective implementation strategies" CIBN press Ltd, Lagos pp l 85-2 1 2. Osuala, EC 2005, "Introduction to Research Methodology " Africana-First Publishers Ltd, Onitsha, Nigeria. Schuler, SR & Hashemi, SM 1 994, 'Credit programs, women's empowerment, and contraceptive use in rural Bangladesh", Studies in Family Planning 25 (2): pp65-76. Shane, SA & Venkataraman, S 2000, 'The promise of entrepreneurship as a field of research' Acedemy of Management Review Simeyo, 0 Matiin, L Nyamao, N Ojera, P & Odondo, A 201 1 , "Effect of provision of micro finance on the performance of micro enterprises: A study of youth micro enterfricaprises under Kenya rural enterprise program (K-REP), Kisii county, Kenya", African Journal of Business Management, val. 5 (20), pp8290-8300, 16 September. Soludo, CC 2008, 'Framework for public private partnership In micro financing in Nigeria', A key note address by the governor of the Central Bank of Nigeria at the International Microfinance Conference and Annual Microfinance/Entrepreneurship Awards, Ahuja, Nigeria, January 1 7- 1 8. United Nations Expeti Group on Women and Finance 1 995, Transforming financial systems New York: Women World Banking. UNITUS, Innovative Solutions to Global Povetiy 2007, Poverty and microfinance. Yawe, A 2002, "Engendering microfinance services: Beyond access, case of Ceewa Uganda ", A Paper Presented at a Workshop on women's empowetment or feminisation of debt? Towards a ne agenda in
Abuja Journal of Business and Management Vol. !, Tssue I [161-1 71], March-2015 www.abujajournalofbusinessandmanagement.org.ng Page 1 70
Assessing the Impact of Micro-finance Banks on Economic Empowerment of Female Entrepreneurs in Kadrma State
African rnicrofinance. Carlton House Terrace, London. Yunus, M 2003, Banker to the poor: micro-lending and the battle against world poverty, New York. Public Affairs. . .
Zeller, M. Gertrud. S Joachin, V & Franz, H 1997, "Rural finance for food secur.ty for the poor", Food Policy Review 4, International Food Policy Research Institute, Washington D.C .U.S.A.
Abu} a Joumal of Business and Management Vol. I, Issue I {161-171], Marc/r-2015 www.abujajournalofbusinessandmanagement.org.ng Page 1 7 1