Spatial–Temporal Patterns and Driving Factors of Rapid ...
15
sustainability Article Spatial–Temporal Patterns and Driving Factors of Rapid Urban Land Development in Provincial China: A Case Study of Jiangsu Qingke Yang 1,2,3 ID , Xuejun Duan 1,3, * and Lei Wang 1,3 1 Nanjing Institute of Geography and Limnology, Chinese Academy of Sciences, Nanjing 210008, China; [email protected] (Q.Y.); [email protected] (L.W.) 2 College of Resources and Environment, University of Chinese Academy of Sciences, Beijing 100049, China 3 Key Laboratory of Watershed Geographic Sciences, Chinese Academy of Sciences, Nanjing 210008, China * Correspondence: [email protected]; Tel.: +86-25-8688-2007; Fax: +86-25-5771-4759 Received: 18 October 2017; Accepted: 15 December 2017; Published: 19 December 2017 Abstract: Since its economic reform and opening-up, China has undergone unprecedented urbanization, where massive areas of rural land have been converted into urban use. Urban land development plays an important role in dynamic urban economic development. This study aims to contribute to the understanding of urban land development and its mechanisms in China. We conceptualized the mechanism of urban land development from multiple perspectives based on a case study in Jiangsu Province. We employed the methods of global and local spatial auto-correlation detection and spatial lag model to analyze the provincial land use conveyance and survey data from 2004 to 2008 and 2009 to 2012 to understand the dynamics of urban land development. The results show that urban land development varies significantly across different time periods, spatial scales, and regions in Jiangsu. Higher absolute urban land development mainly occurred in Sunan, expanding to Subei and Suzhong, while faster development occurred mainly in Subei, where the initial bases were lower but had strong economic growth potential. The regression analysis shows that market activities and administrative levels had played a more critical role in driving urban land development, which suggests that rapid urban land development has institutional and market foundations. Urban land development was not only a consequence of economic development but also a strategy of local governments to stimulate and govern the urban economy. This study enriches the literature on urban dynamics by providing an institutional understanding of rapid urban land development in a transitional economy. Keywords: urban land development; driving factors; land market; local government; Jiangsu Province 1. Introduction The launch of economic reforms in China in the late 1970s has given rise to unprecedented urbanization. The urbanized population increased from 17.9% to 54.8% between 1978 and 2014 [1], meaning that almost 10 million people had moved to cities each year. In the process of urbanization [2], the flow of rural migrants, land use change, rural industrialization, the roles of state power, and globalization have been the focus of many studies [3–6]. Significant attention has been placed on rapid urban land expansion owing to a large area of cultivated land having been occupied, threatening the country’s food security [7]. With the help of geographic information systems and remote sensing techniques, existing literature has advanced the understanding of the patterns, mechanisms, and effects of urban growth and land use expansion in China [8,9]. Urban land expansion in China has resulted from Sustainability 2017, 9, 2371; doi:10.3390/su9122371 www.mdpi.com/journal/sustainability
-
Upload
khangminh22 -
Category
Documents
-
view
4 -
download
0
Transcript of Spatial–Temporal Patterns and Driving Factors of Rapid ...

sustainability
Article
Spatial–Temporal Patterns and Driving Factors ofRapid Urban Land Development in Provincial China:A Case Study of Jiangsu
Qingke Yang 1,2,3 ID , Xuejun Duan 1,3,* and Lei Wang 1,3
1 Nanjing Institute of Geography and Limnology, Chinese Academy of Sciences, Nanjing 210008, China;[email protected] (Q.Y.); [email protected] (L.W.)
2 College of Resources and Environment, University of Chinese Academy of Sciences, Beijing 100049, China3 Key Laboratory of Watershed Geographic Sciences, Chinese Academy of Sciences, Nanjing 210008, China* Correspondence: [email protected]; Tel.: +86-25-8688-2007; Fax: +86-25-5771-4759
Received: 18 October 2017; Accepted: 15 December 2017; Published: 19 December 2017
Abstract: Since its economic reform and opening-up, China has undergone unprecedentedurbanization, where massive areas of rural land have been converted into urban use. Urban landdevelopment plays an important role in dynamic urban economic development. This study aimsto contribute to the understanding of urban land development and its mechanisms in China. Weconceptualized the mechanism of urban land development from multiple perspectives based on acase study in Jiangsu Province. We employed the methods of global and local spatial auto-correlationdetection and spatial lag model to analyze the provincial land use conveyance and survey datafrom 2004 to 2008 and 2009 to 2012 to understand the dynamics of urban land development.The results show that urban land development varies significantly across different time periods,spatial scales, and regions in Jiangsu. Higher absolute urban land development mainly occurredin Sunan, expanding to Subei and Suzhong, while faster development occurred mainly in Subei,where the initial bases were lower but had strong economic growth potential. The regression analysisshows that market activities and administrative levels had played a more critical role in driving urbanland development, which suggests that rapid urban land development has institutional and marketfoundations. Urban land development was not only a consequence of economic development butalso a strategy of local governments to stimulate and govern the urban economy. This study enrichesthe literature on urban dynamics by providing an institutional understanding of rapid urban landdevelopment in a transitional economy.
Keywords: urban land development; driving factors; land market; local government;Jiangsu Province
1. Introduction
The launch of economic reforms in China in the late 1970s has given rise to unprecedentedurbanization. The urbanized population increased from 17.9% to 54.8% between 1978 and 2014 [1],meaning that almost 10 million people had moved to cities each year. In the process of urbanization [2],the flow of rural migrants, land use change, rural industrialization, the roles of state power,and globalization have been the focus of many studies [3–6]. Significant attention has been placed onrapid urban land expansion owing to a large area of cultivated land having been occupied, threateningthe country’s food security [7].
With the help of geographic information systems and remote sensing techniques, existingliterature has advanced the understanding of the patterns, mechanisms, and effects of urbangrowth and land use expansion in China [8,9]. Urban land expansion in China has resulted from
Sustainability 2017, 9, 2371; doi:10.3390/su9122371 www.mdpi.com/journal/sustainability
Sustainability 2017, 9, 2371 2 of 15
industrialization, land commodification, and infrastructure development in the context of rapideconomic growth [1,10,11]. Furthermore, physical factors such as geology, geomorphology, elevation,and slope restrict urban land development [12] and changes in social and economic conditions playa decisive role in land use change and urban land growth [13,14]. Other location-specific factorshave been considered, including industrial restructuring [15], foreign direct investment (FDI) [16],and traditional culture [17]. Liu et al. showed that urban land development in China was largelydriven by demographic changes, economic growth, foreign investment, and changes in land usepolicies and regulations [18]. Recently, Jiang et al. reported on the relative importance of urban landrent, urban wages, FDI in urban land development and loss of agricultural land in China [19].
However, the perspective gained from econometric analysis focusing on land demand doesnot provide a complete picture [20]. Local governments also play an important role in urban landdevelopment by controlling land supply [21–23]. Related failures of land use regulation and landgovernance have been extensively discussed [24]. Land supply is manipulated by local governmentsto attract investment and expand local revenue [24–26]. Urban land development is a result of seekingprofit by multiple stakeholders in the land development process, including officials, developers,and land occupiers [20,22]. Several case studies provide the “big picture” of institutional factorsdriving urban land development in China. The process was conceptualized as government-engineeredand land-centered urbanization [27]. Recent studies have focused on the political economy of urbandevelopment in China, especially within the framework of neo-liberalization, to investigate themotivation behind land commodification [28]. Some studies paid particular attention to the roles ofdifferent levels of government in the process of urban land development.
In the context of China’s socio-economic transition, the dynamics of urban land developmentare sophisticated and vary both territorially and temporarily. Therefore, there is a need for moreconceptual and empirical studies to fully consider the interweaved factors of land market mechanisms,land finance, and land use policies [29,30]. Subsequently, we establish a conceptual framework withfull consideration of land demand and supply, as well as factors such as spatial spill-over effects andthe natural environment using spatial econometric modeling to scrutinize the patterns of urban landdevelopment and its mechanism in provincial China.
The outline of this work is as follows: the next section conceptualizes the mechanism of urbanland development in China, followed by a description of the research methodology. The fourth andfifth sections discuss the changing spatial patterns and the mechanism of urban land development inJiangsu Province. Conclusions are presented in the last section.
2. Understanding the Dynamics of Urban Land Development in China
2.1. Land Demand Factors
China has been experiencing urbanization and industrialization at an unprecedented rateover the last three decades. In order to adapt to economic globalization, China reshuffled itsresource distribution from a centrally planned economy to market regulations and market-orientedeconomy. More specifically, the state relaxed its budget control over the economy, investment, prices,and state-owned enterprises. Marketization further intensified in the early 2000s as China joinedthe World Trade Organization regarded as one of the most important aspects of China’s economicreform [30]. Along with deepening reforms and opening-up, the Chinese economy has gradually beenintegrated into the global production network. FDI played a critical role in accelerating urban andregional economic development.
Marketization and the subsequent economic globalization significantly boosted China’surbanization and industrialization that increased the demand for land development. Meanwhile, urbangovernments have been competing to improve local infrastructures, highway transport networks,high-speed rails, and airports, as well as to establish various industrial parks and tax-free zones toattract FDI and global resources. Moreover, many new towns and large residential areas have been

Sustainability 2017, 9, 2371 3 of 15
developed to accommodate the growing urbanized population. Subsequently, the establishment anddevelopment of the land market in the early 2000s promoted urban land development dramatically.Marketization of land use catered to land user demands from foreign investors and local businesses [31].Therefore, we used marketization and globalization indicators to represent the land demand factors ofurban land development (Figure 1).
Sustainability 2017, 9, 2371 3 of 15
establishment and development of the land market in the early 2000s promoted urban land development dramatically. Marketization of land use catered to land user demands from foreign investors and local businesses [31]. Therefore, we used marketization and globalization indicators to represent the land demand factors of urban land development (Figure 1).
Figure 1. Conceptual framework for understanding urban land development in urban China.
2.2. Land Supply Factors
Along with the rapid economic growth since the late 1970s, the Chinese governance structure has been decentralized significantly, which has transformed the central-local relations and the priorities of local governments [32]. Alongside economic decentralization, financial decentralization was accomplished by the tax-sharing system implemented in 1994, after which there was a so-called “mismatch” in the financial system, as local governments collected a 40–60% of the tax base, while taking spending 50–70% expenditure in China [26]. Nonetheless, under the cadre promotion system, the political system remains highly centralized. The government at the higher level assigns economic targets to lower-level governments, and local chief officials are promoted mainly based on their economic performance. Consequently, local officials are responsible for and have interests in promoting urban economic development by building local infrastructure, encouraging local businesses, and attracting foreign investment.
Land commodification, along with land and housing reforms in the late 1990s, extended dramatically in urban China. The property sector has become the engine of economic growth and revenue capturing. Various “growth coalitions” were formed by local chief officials and land developers [33]. Moreover, local governments fiercely compete for resources and investments by setting up preferential policies of taxation and land prices, which further complicate urban land development [34]. However, land, as a key input for industrial and commercial development, is yet to be fully marketized in China [35]. Under the current land administration system, local governments can claim agricultural land from rural collectives at low prices to lease to the developers in the land market at either low prices to attract industrial projects or high prices to develop commercial properties [27,32,35]. Subsequently, local governments monopolized land supply and used it as an instrument for developing industrial projects or revenue capturing. Therefore, we used financial expenditure pressure and urban competition to represent the land supply factors of urban land development (Figure 1) in our case study.
Figure 1. Conceptual framework for understanding urban land development in urban China.
2.2. Land Supply Factors
Along with the rapid economic growth since the late 1970s, the Chinese governance structure hasbeen decentralized significantly, which has transformed the central-local relations and the prioritiesof local governments [32]. Alongside economic decentralization, financial decentralization wasaccomplished by the tax-sharing system implemented in 1994, after which there was a so-called“mismatch” in the financial system, as local governments collected a 40–60% of the tax base, whiletaking spending 50–70% expenditure in China [26]. Nonetheless, under the cadre promotion system,the political system remains highly centralized. The government at the higher level assigns economictargets to lower-level governments, and local chief officials are promoted mainly based on theireconomic performance. Consequently, local officials are responsible for and have interests inpromoting urban economic development by building local infrastructure, encouraging local businesses,and attracting foreign investment.
Land commodification, along with land and housing reforms in the late 1990s, extendeddramatically in urban China. The property sector has become the engine of economic growthand revenue capturing. Various “growth coalitions” were formed by local chief officials and landdevelopers [33]. Moreover, local governments fiercely compete for resources and investments bysetting up preferential policies of taxation and land prices, which further complicate urban landdevelopment [34]. However, land, as a key input for industrial and commercial development, is yet tobe fully marketized in China [35]. Under the current land administration system, local governmentscan claim agricultural land from rural collectives at low prices to lease to the developers in theland market at either low prices to attract industrial projects or high prices to develop commercialproperties [27,32,35]. Subsequently, local governments monopolized land supply and used it as aninstrument for developing industrial projects or revenue capturing. Therefore, we used financial

Sustainability 2017, 9, 2371 4 of 15
expenditure pressure and urban competition to represent the land supply factors of urban landdevelopment (Figure 1) in our case study.
2.3. Spill-Over Factors
Urban land development is manifested by the demand of urban socio-economic development,and the scale of the urban economy would generate spill-over effects from urban land development.The speed and intensity of urban land expansion are greatly affected by the foundation and levelof urban and regional economic development [36]. With the development of the urban economy,the improvement of residents’ income level, and continuously changing social conditions, peoplewould require improved living standards, environment, and transportation. Hence, there would be anincreased demand for entertainment facilities and amenities, resulting in continual restructuring andexpansion of urban land development [37]. Particularly, in the process of industrialization, variousproduction factors are driven by agglomeration and scale economies, and they gradually concentratein urban areas and other favorable geographic locations. Larger economic sectors and production scalefurther enhance the agglomeration effects of large cities, followed by the continuous expansion ofconstruction land and urban space [38].
Meanwhile, along with the economic expansion, urban governments are eager to promote therelocation of industries from city centers to peripheral areas to prepare for the developing serviceeconomy; this is a strategy for upgrading the industrial structure while reducing the secondaryindustry and promoting the tertiary. Nonetheless, increased land prices in central city areas haveforced relatively low value-added sectors to move to city peripheries, where land rent is affordableand transport facilities are in good condition. Consequently, factory workers and a series of supportservice facilities also move to the suburbs, resulting in urban land development gradually spreadingto the periphery of cities [39].
2.4. Natural Factors
Cities and towns are usually proclaimed in superior natural geographic environments.The formation, direction, and scale of land development are therefore closely related to naturalgeographic factors. An intertwined series of natural factors including geography, geology, topography,geomorphology, and resources constitute the material basis for urban development. Furthermore, thecharacteristics of the physical-geographical environment directly reveal the potential and cost of urbanland development. With the progress of science and technology, engineering abilities have overcomemany natural limitations, which have led to urban land development over a short period of time,largely driven by social and economic factors. Nonetheless, the natural geographic environment isstill considered a factor in urban land expansion. Natural foundation and background conditionsare important as both promoters and restrictors of urban land expansion [40]. Urban land expansionis affected by the underlying surface which has topographical constraints in the process of cities’formation and development. Hence, cities’ topography and geomorphology have a profound influenceon urban form and spatial structure [41]. Zhang Li regarded terrain conditions as an important naturalfactor that influences urban land expansion in China [42]. In this study, we composed a comprehensiveindex reflecting the availability of land resources and the suitability of land development to analyzethe role of natural factors in urban land development (Figure 1).
3. Study Area and Data Collection
Since its reform and opening-up, China has undergone rapid economic growth and urbanization.The dynamics of urban and regional development together with the transitional institutions resultedin various challenges to land governance, which has drawn the attention of the scientific community.Jiangsu Province is the ideal location to study urban land development in provincial China for thefollowing reasons. Located in the Lower Yangtze River Delta, Jiangsu is one of China’s most developedprovinces with the fastest economic growth and highest marketization level. However, Jiangsu has

Sustainability 2017, 9, 2371 5 of 15
also recently encountered problems of environmental degradation and unbalanced development,which are of concern to the general public, researchers, and government officials. Moreover, Jiangsuhas an unequal political culture in that local officials have an entrepreneurial outlook for developingurban and regional economies [43–45]. In 2015, Jiangsu covered an area of 102,600 km2, with apopulation of 79.76 million. Its gross domestic product (GDP) per capita reached $14,114, belongingto the high-income economy group according to the World Bank criteria. Only accounting for 1.06%of land area, the province has attracted 20% of China’s FDI. Along with its rapid economic growth,the province has been experiencing dramatic land use restructuring due to industrialization andurbanization. According to the differences in natural characteristics and the economic developmentlevel, Jiangsu Province is divided into three sub-regions. The southern area (Sunan) includes Nanjing(provincial capital), Zhenjiang, Changzhou, Wuxi, and Suzhou; the middle area (Suzhong) includesNantong, Taizhou, and Yangzhou; the northern area (Subei) includes Xuzhou, Lianyungang, Suqian,Huai’an, and Yancheng (Figure 2). There is a large regional disparity among the sub-regions, in whichSunan has traditionally been the most developed one followed by Suzhong and Subei.
Sustainability 2017, 9, 2371 5 of 15
covered an area of 102,600 km2, with a population of 79.76 million. Its gross domestic product (GDP) per capita reached $14,114, belonging to the high-income economy group according to the World Bank criteria. Only accounting for 1.06% of land area, the province has attracted 20% of China’s FDI. Along with its rapid economic growth, the province has been experiencing dramatic land use restructuring due to industrialization and urbanization. According to the differences in natural characteristics and the economic development level, Jiangsu Province is divided into three sub-regions. The southern area (Sunan) includes Nanjing (provincial capital), Zhenjiang, Changzhou, Wuxi, and Suzhou; the middle area (Suzhong) includes Nantong, Taizhou, and Yangzhou; the northern area (Subei) includes Xuzhou, Lianyungang, Suqian, Huai’an, and Yancheng (Figure 2). There is a large regional disparity among the sub-regions, in which Sunan has traditionally been the most developed one followed by Suzhong and Subei.
Figure 2. Location of Jiangsu Province, with its three sub-regions, in China.
Data used in studying urban land development usually come from two sources in China [46]. The first source is remote sensing data such as Landsat TM/ETM satellite images. The interpreted data can explicitly deliver spatial information of urban expansion. However, the data cannot provide detailed land use/land cover changes between different land use types because of their low resolution. The second source is land utilization conveyance data compiled by the Chinese Ministry of Land and Resources (MLR). The MLR updates the data set annually and records the details of the changes in land use types at the county level. The land use types are classified into three major categories, namely agricultural land, construction land, and unused land, each of which has several sub-categories. For example, construction land includes urban and township settlements, rural settlements, industrial/mining sites, transportation land, and land for water conservation facilities. In this study, we used land utilization conveyance data to study urban land development in Jiangsu Province. Urban/township settlements and industrial/transportation land introduced here were regarded as urban land. This is because the data not only offer greater detail regarding changes in land use types but also are statistically consistent with socio-economic data from the statistics department, which is helpful for our quantitative analysis of the urban land development mechanisms.
Figure 2. Location of Jiangsu Province, with its three sub-regions, in China.
Data used in studying urban land development usually come from two sources in China [46].The first source is remote sensing data such as Landsat TM/ETM satellite images. The interpreteddata can explicitly deliver spatial information of urban expansion. However, the data cannotprovide detailed land use/land cover changes between different land use types because of theirlow resolution. The second source is land utilization conveyance data compiled by the ChineseMinistry of Land and Resources (MLR). The MLR updates the data set annually and records thedetails of the changes in land use types at the county level. The land use types are classified into threemajor categories, namely agricultural land, construction land, and unused land, each of which hasseveral sub-categories. For example, construction land includes urban and township settlements, ruralsettlements, industrial/mining sites, transportation land, and land for water conservation facilities.

Sustainability 2017, 9, 2371 6 of 15
In this study, we used land utilization conveyance data to study urban land development in JiangsuProvince. Urban/township settlements and industrial/transportation land introduced here wereregarded as urban land. This is because the data not only offer greater detail regarding changes in landuse types but also are statistically consistent with socio-economic data from the statistics department,which is helpful for our quantitative analysis of the urban land development mechanisms.
In 2004, further land market reforms were implemented and the land exchange and reservationcenter were established under the MLR to secure land market development. Therefore, land leasing,which had been conducted using an administrative approach in the past, had to be conducted throughmarket approaches such as auctioning and bidding. The reform has deeply impacted the patternof land development in urban China. For this reason, we selected 2004–2012 as the study periodand use the construction land for urban development. The second national land use survey in 2008slightly changed its classification system of land use types, which resulted in statistical gaps. Therefore,we divided the study period into two sub-periods, 2004–2008 and 2009–2012. We further collectedsocio-economic data on labor, capital, industries, and FDI, amongst others, from Jiangsu StatisticalYearbooks (2005–2013) [47] for modeling the driving factors of urban land development in this province.Social and economic data used in this study, such as GDP, FDI, foreign trade, the output value of threeindustries, and employed population, come from Jiangsu Statistical Yearbook and Statistics Bulletin ofthe National Economic and Social Development.
4. Changing Patterns of Urban Land Development in Jiangsu Province
To explore the general pattern of urban land development in Jiangsu Province, we first analyzedthe average change in land use from 2004 to 2012. At the provincial level from 2004 to 2008, urbanland increased by 9430 ha with an average annual growth rate of 4.53% (Table 1). The rapid increase inurban land reflected the simultaneous rapid economic growth and urbanization in Jiangsu. From 2009to 2012, urban land increased by 23,350 ha per year, with a slightly lower annual growth rate of 3.92%.At the municipal level, there were significant spatial variations in urban land development betweenthe two study periods. In general, the rate of urban land development in Sunan was higher than thatin both Suzhong and Subei. However, although Subei lagged behind Suzhong economically, its urbanland development was higher than that of Suzhong in both study periods.
Table 1. The increasing areas and percentages of urban land development in Jiangsu Province (unit:1000 ha).
Prefecture Cities2004–2008 2009–2012
Total (Annual) Percentage Percentage Increase
Jiangsu 9.43 (4.53%) 23.35 (3.92%)
Sunan 6.02 (5.35%) 13.16 (4.02%)Nanjing 0.18 (0.67%) 3.22 (4.62%)
Wuxi 0.43 (1.99%) 1.12 (1.92%)Suzhou 2.03 (5.67%) 5.25 (4.24%)
Changzhou 3.01 (3.93%) 2.01 (4.38%)Zhenjiang 0.37 (3.48%) 1.56 (5.18%)
Suzhong 0.94 (2.78%) 3.49 (3.51%)Nantong 0.33 (2.5%) 1.05 (2.74%)Taizhou 0.25 (3.52%) 1.31 (4.64%)
Yangzhou 0.36 (2.66%) 1.13 (3.44%)
Subei 2.47 (4.02%) 6.7 (3.97%)Xuzhou 0.31 (1.58%) 1.55 (3.27%)
Lianyungang 0.38 (3.84%) 1.01 (3.14%)Huai’an 0.94 (5.93%) 1.73 (3.92%)
Yancheng 0.43 (2.58%) 1.23 (3.51%)Suqian 0.41 (6.01%) 1.19 (4.75%)

Sustainability 2017, 9, 2371 7 of 15
Figure 3 shows the patterns of urban land development at a finer scale, at the county-level,in Jiangsu Province, in both study periods. Several general patterns could be observed: (1) The higherrate of urban land development mainly concentrated in the city centers of Nanjing, Suzhou, Wuxi,and other economically developed cities, while cities and counties with lower economic developmenthad a lower rate of urban land development. (2) Fast expansion rates were mainly distributed in thecounties and municipal districts located in Suqian and Yancheng prefectures of Subei, where the initialbases were relatively low but have had greater economic potential in recent years.Sustainability 2017, 9, 2371 7 of 15
Figure 3. Patterns of changing urban land development in Jiangsu Province over the two study periods.
5. Urban Land Development Restructuring: Spatial Auto-Correlation Analysis
In order to find the spatial characteristics of changing urban land development in Jiangsu Province, spatial auto-correlation analysis was performed. The annual rate of urban land development at the county level was used to detect the degree of spatial clustering. The Getis–Ord General G(d) and Getis–Ord *( )
iG d indices were used to analyze spatial auto-correlations and
hotspots of urban land development [44]. The G(d) index is a global statistical tool that was used to detect the overall pattern and trends
of spatial clustering of urban land development over the study region and is calculated as follows:
= ( ) ( )ij i j i j
G d w d x x x x (1)
The G-statistic ( *
iG ) indicates whether the county-level units’ urban land development with high
or low values tended to cluster in a specific area. The method is also known as the hot spots analysis, used to assess the emergence of urban land development clusters within the spatial context of neighboring features and to compare local values with global values. *
iG is calculated as follows:
= * *
,( ) ( )
i i j j jj jG d w d x x (2)
where j ≠ I, and the subscripts refer to the N sub-regions of an area; xj represents an observation for sub-region j; and * ( )
ijw d is a symmetric binary (0 or 1) spatial weight matrix, with 1 representing
each unit that is within distance d of a given case i. Inclusion of d in the definition of the statistic is not essential, but it highlights the fact that the technique can be used to search for clusters at different spatial distances by varying the d values. If the change in the urban land development of a city and of its neighboring cities is high, then city is located within a hotspot. The local sum of total land use change of a city and its neighboring cities is compared to the sum of all cities. A Z-score ( *
iZ ) was
used to test whether there was a significant difference between the local sum and expected land use change of a random distribution. The Z-score was transformed as follows:
− =
* *
*
1* 2
( ) ( ( ))( )
( ( ))
i i
i
i
G d E G dZ G d
Var G d
(3)
where E(.) and Var(.) denote the expected value and variance of the statistic *
iG , respectively.
The observed values of G for urban land change were 3.32 × 10⁻² and 3.02 × 10⁻² in two study periods, 2004–2008 and 2009–2012, respectively (Table 2). Both were significant at p < 0.01, confirming
Figure 3. Patterns of changing urban land development in Jiangsu Province over the two study periods.
5. Urban Land Development Restructuring: Spatial Auto-Correlation Analysis
In order to find the spatial characteristics of changing urban land development in Jiangsu Province,spatial auto-correlation analysis was performed. The annual rate of urban land development at thecounty level was used to detect the degree of spatial clustering. The Getis–Ord General G(d) andGetis–Ord G∗i (d) indices were used to analyze spatial auto-correlations and hotspots of urban landdevelopment [44].
The G(d) index is a global statistical tool that was used to detect the overall pattern and trends ofspatial clustering of urban land development over the study region and is calculated as follows:
G(d) = ∑ wij(d)xixj/∑ ∑ xixj (1)
The G-statistic (G∗i ) indicates whether the county-level units’ urban land development withhigh or low values tended to cluster in a specific area. The method is also known as the hot spotsanalysis, used to assess the emergence of urban land development clusters within the spatial contextof neighboring features and to compare local values with global values. G∗i is calculated as follows:
G∗i (d) = ∑j
w∗i,j(d)xj/∑j
xj (2)
where j 6= I, and the subscripts refer to the N sub-regions of an area; xj represents an observation forsub-region j; and w∗ij(d) is a symmetric binary (0 or 1) spatial weight matrix, with 1 representing eachunit that is within distance d of a given case i. Inclusion of d in the definition of the statistic is notessential, but it highlights the fact that the technique can be used to search for clusters at differentspatial distances by varying the d values. If the change in the urban land development of a city andof its neighboring cities is high, then city is located within a hotspot. The local sum of total land usechange of a city and its neighboring cities is compared to the sum of all cities. A Z-score (Z∗i ) was used

Sustainability 2017, 9, 2371 8 of 15
to test whether there was a significant difference between the local sum and expected land use changeof a random distribution. The Z-score was transformed as follows:
Z[G∗i (d)] =[G∗i (d)− E(G∗i (d))
][Var(G∗i (d))
] 12
(3)
where E(.) and Var(.) denote the expected value and variance of the statistic G∗i , respectively.The observed values of G for urban land change were 3.32 × 10⁻² and 3.02 × 10⁻² in two study
periods, 2004–2008 and 2009–2012, respectively (Table 2). Both were significant at p < 0.01, confirmingthat urban land development in Jiangsu exhibits significant spatial dependence. Z[G(d)] also showedthat land expansion over the two study periods had positive spatial auto-correlations across Jiangsu.However, the Z-score decreased from 28.93 to 21.76, indicating the decreasing trend of spatial clusteringin urban land development in Jiangsu.
Table 2. The Global Getis–Ord G value of urban land expansion in Jiangsu Province during the twostudy periods.
Change Rate2004–2008 2009–2012
General G Z-Score p-Value General G Z-Score p-Value
Urban land 3.32 × 10⁻² 28.93 0.000 3.02 × 10⁻² 21.76 0.000
The distribution of the hot spot analysis of Z[G∗i (d)] is depicted in Figure 4. The value was dividedinto four groups by a natural break, from hottest to coldest. The findings show that the hotspots ofurban land development are found in core counties in Sunan and Huai’an county in Subei. In general,urban land development in counties along the coast and in Suzhong tends to cluster in low urban landdevelopment area, which suggests an uneven pattern of urban land development across the province.However, the pattern changed significantly in the second time period (2009–2012) as more hot spotswere detected. Hot spots of urban land development not only emerged in the developed south butalso appeared in the less developed north. The results suggest that there was massive urban landdevelopment in the region. The spatial cluster of urban land development partly demonstrated theinterregional competition in economic development and the imperatives of political promotion.
Sustainability 2017, 9, 2371 8 of 15
that urban land development in Jiangsu exhibits significant spatial dependence. Z[G(d)] also showed that land expansion over the two study periods had positive spatial auto-correlations across Jiangsu. However, the Z-score decreased from 28.93 to 21.76, indicating the decreasing trend of spatial clustering in urban land development in Jiangsu.
Table 2. The Global Getis–Ord G value of urban land expansion in Jiangsu Province during the two study periods.
Change Rate 2004–2008 2009–2012
General G Z-Score p-Value General G Z-Score p-Value Urban land 3.32 × 10⁻² 28.93 0.000 3.02 × 10⁻² 21.76 0.000
The distribution of the hot spot analysis of Z[ *( )i
G d ] is depicted in Figure 4. The value was divided into four groups by a natural break, from hottest to coldest. The findings show that the hotspots of urban land development are found in core counties in Sunan and Huai’an county in Subei. In general, urban land development in counties along the coast and in Suzhong tends to cluster in low urban land development area, which suggests an uneven pattern of urban land development across the province. However, the pattern changed significantly in the second time period (2009–2012) as more hot spots were detected. Hot spots of urban land development not only emerged in the developed south but also appeared in the less developed north. The results suggest that there was massive urban land development in the region. The spatial cluster of urban land development partly demonstrated the interregional competition in economic development and the imperatives of political promotion.
Interregional competition in Subei may be not as intensive as that in the south because of its poor marketization and low degree of economic development. Moreover, as developed regions, the county-level cities in Sunan expanded more rapidly and reduced the opportunity for urban land development in the surrounding cities. The speed of urban land development was slower in the counties and municipal districts in Subei and Suzhong, respectively. They tend to cluster around the “cold spots” resulting from geographic constraints and relatively poor foundation, leading to the slower pace of urban land development (Figure 4).
Figure 4. Hotspot analysis using the Getis–Ord Gi values for the change rate of land area per year in Jiangsu Province during the two study periods.
6. Driving Factors of Urban Land Development: Market Mechanisms and Local Government Initiatives
6.1. Model Specifications and Selection of Variables
The spatial Getis–Ord *
iG statistic shows that there was a significant spatial correlation of urban
land development in Jiangsu Province in the two study periods. Therefore, we employed the spatial
Figure 4. Hotspot analysis using the Getis–Ord Gi values for the change rate of land area per year inJiangsu Province during the two study periods.
Interregional competition in Subei may be not as intensive as that in the south because of itspoor marketization and low degree of economic development. Moreover, as developed regions,the county-level cities in Sunan expanded more rapidly and reduced the opportunity for urban land

Sustainability 2017, 9, 2371 9 of 15
development in the surrounding cities. The speed of urban land development was slower in thecounties and municipal districts in Subei and Suzhong, respectively. They tend to cluster aroundthe “cold spots” resulting from geographic constraints and relatively poor foundation, leading to theslower pace of urban land development (Figure 4).
6. Driving Factors of Urban Land Development: Market Mechanisms and LocalGovernment Initiatives
6.1. Model Specifications and Selection of Variables
The spatial Getis–Ord G∗i statistic shows that there was a significant spatial correlation of urbanland development in Jiangsu Province in the two study periods. Therefore, we employed the spatiallag model (SLM) to identify the determinants of urban land development by controlling these spatialeffects. The SLM was defined as follows:
y = ρWy + Xβ + ε (4)
where y is the change in urban land development at the county level in 2004–2008 and 2009–2012,in Jiangsu; W is the n × n spatial weight matrix, reflecting the spatial trends of the variable; Wy is thefirst-order lag space dependent variable; ρ is the coefficient of spatial lag term; X is the exogenousvariables observed value; β is the variable regression coefficient; and ε is the error term. We usedOpenGeoda software version (Spatial Analysis Laboratory Department of Geography University ofILLinois, Urbana-Champaign Urbana, Champaign, IL, USA) to generate the weight matrix with afirst-order Rook contiguity. The independent variable matrix is the logarithm of the influence factorsand calculated as follows:
X =
(ln MTL, ln MC, ln FDI, ln LIT, ln GC, ln LF
ln PGDP, ln IAIS, ln SLD, ln RL, ln SLR
)(5)
A series of exploratory variables were used to conceptualize urban land development as a resultof the INTERACTION of factors from land demand, land supply, spill-over effects, and the naturalenvironment (Table 3).
Since the early 1980s, under the market-oriented reform, China’s economic development has beenhighly reliant on increasing market development, private sectors, and FDI (foreign direct investment).Therefore, the land demand has expanded significantly, calling for increasing urban land development.Therefore, labor marketization (the proportion of employment in the non-state sector), productionmarketization (the proportion of output value in non-state-owned enterprises), FDI, and internationaltrade development were selected to reflect the demand for residential land, industrial land, andinfrastructure by migrants and enterprises flooding into urban areas.
Furthermore, the land supply plays a significant role in urban land development considering thepolitical-economic context of land supply in China. The fiscal and political decentralization greatlyinfluenced land development politics. Local governments have monopolized the rights to transformland for urban land use from rural collectives, after which the land becomes collateral to mobilizebanking loans and serves as a means of capital accumulation. Local governments further rely on landsales to earn land conveyance fees to compensate for insufficient tax revenues and alleviate financialpressure. Furthermore, cities compete through land supply policies to attract FDI and inward privateinvestment to boost economic growth. Subsequently, we used administrative levels and financialconstraints to represent land supply factors in urban land development.

Sustainability 2017, 9, 2371 10 of 15
Table 3. Definitions of dependent and independent variables used in this study.
Categories Variables Abbreviation Definition and Measurement Expected Sign
Independent variable Change of urban land URL Measured by the absolute change of urban land area
Land demand factors
Labor marketization MTL Measured by the ratio of employment in the non-state sector +
Production marketization MC Measured by the ratio of output value innon-state-owned industries +
Strength of foreigndirect investment FDI Measured by the ratio of realized FDI to GDP in a particular
time interval +
Level of international trade LIT Measured by the ratio of total amount of output value ofimport and export to GDP in a particular time interval +
Land supply factors
Power of local governments GC
Calculated by the average economic development (GDPcorrected by the consumer price index), which is weighted bythe administrative level (county-level city = 1.2; county = 1;municipal district = 0.8)
+
Financial constraints LF Calculated by the proportion of tax revenue to the generalbudget expenditure +
Spill-over factorsGDP per capital PGDP Represented as the level of regional economic development +
Index of industrialstructure advancement IAIS Represented as the development of the industrial structure
from a low to high level +
Natural factors
Suitability of land development SLDMeasured by equal weighting summation of the indices ofnatural disaster risk, ecological importance, waterenvironmental capacity, and abundance
+
Land location RL Measured by local factors of accessibility (e.g., distance toShanghai) and level of regional development +
The scarcity of land resources SLRRepresented as the per capita arable land that can be used asthe measured index, and the higher the value, the lower theresistance to land development
−
Note: The positive effect is marked as + and the reverse effect is marked as −.
Sustainability 2017, 9, 2371 11 of 15
The spill-over effect of urban land development is mainly reflected in the following aspects: Highliving standards and wages are major factors attracting migrants to urban areas in China. Alongwith more than three decades of rapid economic development, industrial infrastructure upgrades(i.e., reducing secondary industries, promoting tertiary industries, and vacating the cage for newbird) are the priorities for local governments. Therefore, some production and processing enterpriseshave moved to the outskirts and less developed parts of the cities where land prices are lower andregulations are fewer. In this study, we used GDP per capita and industrial structure to represent thespill-over effects of urban land development that have positive relations.
Lastly, natural factors are the foundation of urban land development, even though humans havethe capacity to overcome various geographic constraints for land development. In this study, weused the following variables: suitability of land development, land location (the degree of economicsuitability of land to be developed), and scarcity of land resources to represent the natural factors ofurban land development.
6.2. Results of the Regression Analysis
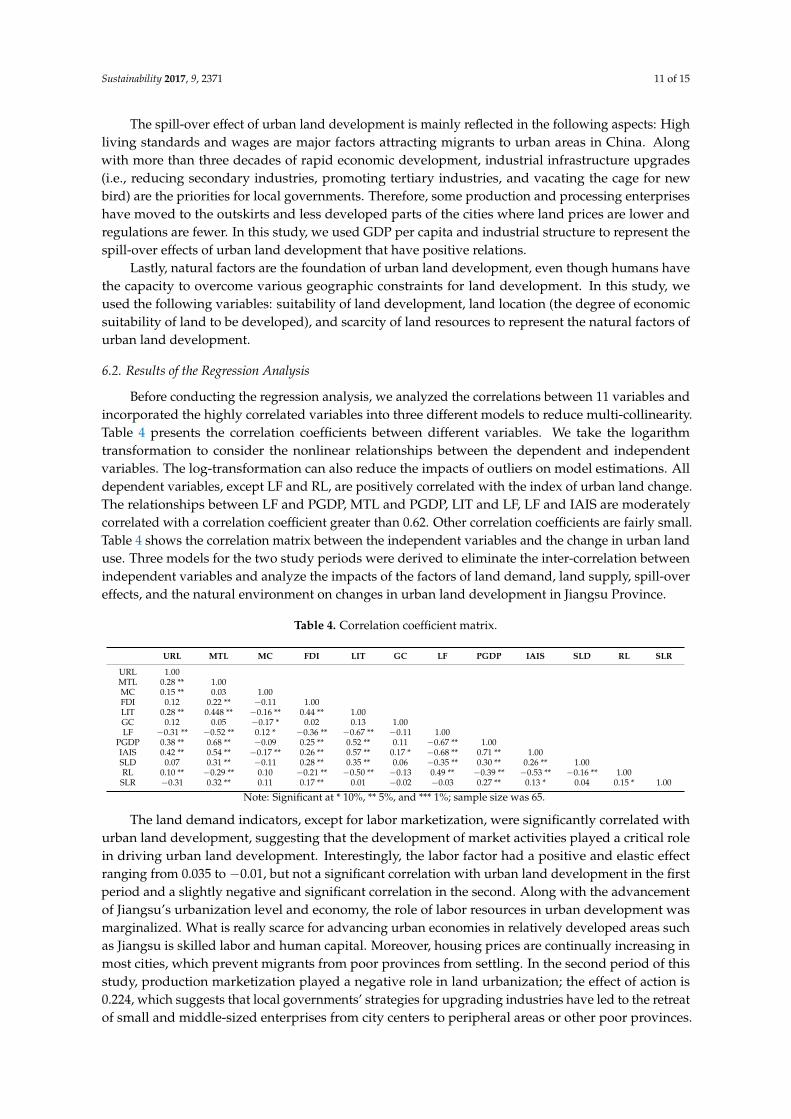
Before conducting the regression analysis, we analyzed the correlations between 11 variables andincorporated the highly correlated variables into three different models to reduce multi-collinearity.Table 4 presents the correlation coefficients between different variables. We take the logarithmtransformation to consider the nonlinear relationships between the dependent and independentvariables. The log-transformation can also reduce the impacts of outliers on model estimations. Alldependent variables, except LF and RL, are positively correlated with the index of urban land change.The relationships between LF and PGDP, MTL and PGDP, LIT and LF, LF and IAIS are moderatelycorrelated with a correlation coefficient greater than 0.62. Other correlation coefficients are fairly small.Table 4 shows the correlation matrix between the independent variables and the change in urban landuse. Three models for the two study periods were derived to eliminate the inter-correlation betweenindependent variables and analyze the impacts of the factors of land demand, land supply, spill-overeffects, and the natural environment on changes in urban land development in Jiangsu Province.
Table 4. Correlation coefficient matrix.
URL MTL MC FDI LIT GC LF PGDP IAIS SLD RL SLR
URL 1.00MTL 0.28 ** 1.00MC 0.15 ** 0.03 1.00FDI 0.12 0.22 ** −0.11 1.00LIT 0.28 ** 0.448 ** −0.16 ** 0.44 ** 1.00GC 0.12 0.05 −0.17 * 0.02 0.13 1.00LF −0.31 ** −0.52 ** 0.12 * −0.36 ** −0.67 ** −0.11 1.00
PGDP 0.38 ** 0.68 ** −0.09 0.25 ** 0.52 ** 0.11 −0.67 ** 1.00IAIS 0.42 ** 0.54 ** −0.17 ** 0.26 ** 0.57 ** 0.17 * −0.68 ** 0.71 ** 1.00SLD 0.07 0.31 ** −0.11 0.28 ** 0.35 ** 0.06 −0.35 ** 0.30 ** 0.26 ** 1.00RL 0.10 ** −0.29 ** 0.10 −0.21 ** −0.50 ** −0.13 0.49 ** −0.39 ** −0.53 ** −0.16 ** 1.00
SLR −0.31 0.32 ** 0.11 0.17 ** 0.01 −0.02 −0.03 0.27 ** 0.13 * 0.04 0.15 * 1.00
Note: Significant at * 10%, ** 5%, and *** 1%; sample size was 65.
The land demand indicators, except for labor marketization, were significantly correlated withurban land development, suggesting that the development of market activities played a critical rolein driving urban land development. Interestingly, the labor factor had a positive and elastic effectranging from 0.035 to −0.01, but not a significant correlation with urban land development in the firstperiod and a slightly negative and significant correlation in the second. Along with the advancementof Jiangsu’s urbanization level and economy, the role of labor resources in urban development wasmarginalized. What is really scarce for advancing urban economies in relatively developed areas suchas Jiangsu is skilled labor and human capital. Moreover, housing prices are continually increasing inmost cities, which prevent migrants from poor provinces from settling. In the second period of thisstudy, production marketization played a negative role in land urbanization; the effect of action is0.224, which suggests that local governments’ strategies for upgrading industries have led to the retreatof small and middle-sized enterprises from city centers to peripheral areas or other poor provinces.

Sustainability 2017, 9, 2371 12 of 15
In general, international trade consistently contributed to urban land development in Jiangsu Provincein two study periods because Jiangsu is characterized as an export-oriented economy in China. Indeed,globalization has supplied Jiangsu with a large market and foreign firms, especially transnationalcorporations. Globalized cities may experience a higher rate of urban land development to buildindustrial parks and high-grade residential areas [10].
Regarding the land supply factors, administrative levels of local governments played a significantrole in urban land development in Jiangsu Province. The Chinese land management system is a hybridbetween centralization and decentralization. Although the location of supply is controlled by the lowerlevels of the government, the extent of land supply is controlled by a top-down land quota system.The quota allocation corresponds to the administrative level, suggesting that higher administrativelevel cities control the land quota of lower levels. Moreover, higher-level cities are usually big cities,which may also affect the results. The effect strength is more than 0.4 in two periods. Because ofdata limitations, we used indirect factors to represent the motivations of urban governments for landrevenue. The factor of financial constraint was positively, but not significantly, correlated with urbanland development in both study periods, suggesting that revenue capture was not a major factor inurban governments’ promotion of urban land development in Jiangsu. It also echoes the literaturein that, compared to revenue capture, economic growth is more important in local officials’ termsof office.
In the 21st century, the development of urban economy in Jiangsu Province has been accompaniedby the adjustment and upgrading of industrial structures. As a result of continuously rising land pricesin the city center and the government’s industrial policies, low-end industries were forced to move tosuburbs and less developed cities with relatively lower land rent and labor costs. Correspondingly,employment and a series of ancillary service facilities were also transferred. Selected indicators ofspill-over effects were correlated with urban land development in two periods (Table 5). Alongwith the advancement of urban economy, urban populations demand higher living standards, betterenvironment and larger number of recreational facilities and amenities that further promote urbanland development.
Table 5. Regression analysis results from the spatial lag model for the rate of change for urban land inJiangsu Province in the two study periods.
Variable2004–2008 2009–2012
Model 1 Model 2 Model 3 Model 1 Model 2 Model 3
W_URL 0.176 0.209 * 0.122 0.15 * −0.031 0.041CONSTANT 0.074 0.056 −0.036 0.188 −0.072 0.07
MTL 0.035 0.028 0.032 −0.01 −0.041 * −0.015MC 0.009 0.07 * 0.069 * −0.224 *** −0.04 −0.097 *FDI 0.115 * 0.099 * 0.012 −0.054LIT 0.322 ** 0.277 * 0.277 ** 0.361 ***GC 0.411 *** 0.24 * 0.583 *** 0.564 ***LF −0.096 0.002 0.184 0.046
PGDP 0.022 * 0.258 ** −0.042 0.272 ***IAIS 0.065 0.318 * 0.359 *** 0.021SLD 0.004 0.011 −0.062 0.001 *RL 0.095 * 0.031 * −0.011 0.073 **
SLR −0.03 * −0.12 **R2 0.53 0.33 0.32 0.55 0.66 0.69
LOG L 63.31 45.89 45.46 51.23 60.76 63.25LR Test 1.63 * 1.909 * 1.568 * 1.379 * 1.783 * 48.052 ***
AIC −96.63 −73.79 −70.92 −82.46 −103.52 −106.5SC −74.88 −54.23 −49.18 −60.72 −83.95 −84.76
Note: Significant at * 10%, ** 5%, and *** 1%; sample size was 65.
Location had a positive and significant correlation with urban land development, whereas thescarcity of land resources was negatively correlated with urban land development. This was because ofthe expansion of urban land located on the outskirts of urban areas with high-quality cultivated land.The central government has established strict regulations to protect farmland, which has a significantimpact on local urban land development. However, the suitability of land development only had apositive and significant correlation with urban land development in the second study period, which

Sustainability 2017, 9, 2371 13 of 15
further highlights the land resource scarcity. In general, natural factors played important roles in urbanland development in Jiangsu Province, which confirms our assumptions.
7. Conclusions
Urban land development has accompanied China’s rapid economic development since its reformand opening-up in the early 1980s. This study built a ground-specific conceptual framework tounderstand the dynamics of urban development in China and analyze the spatio-temporal patterns andits driving factors in the process of China’s economic transition. The empirical study was conducted ina developed province, Jiangsu. Based on the official land use conveyance data from 2004 to 2012, weexplored the patterns of urban land development at different spatial scales and argued that urban landdevelopment in Jiangsu Province was driven by the interaction of four factors: land demand, landsupply, spill-over effects, and the natural environment. The analysis and the case study captured themain characteristics of urban land development in the context of economic transition in developedprovincial China.
From 2004 to 2008, urban land increased by 9430 ha, with an average annual growth rate of 4.53%,while from 2009 to 2012 urban land increased by 23,350 ha per year, with a slightly lower annualgrowth rate of 3.92%. The rapid increase of urban land reflected the dynamics of the urban economyand urbanization in Jiangsu. Significant spatial variations in urban land development were observedat the county level. Higher urban land development was also observed mainly in the sub-region ofSunan, expanding to Subei and Suzhong, while more rapid changes in urban land development weremainly distributed in the counties and cities located in Subei, where the initial bases were lower buthave had greater economic potential in recent years.
Among the land demand indicators, except for labor marketization, production marketization,FDI, and international trade were significantly correlated with urban land development in both studyperiods in Jiangsu Province. This suggests that the development of market activities played a criticalrole in driving urban land development. With regards to the land supply factors, administrative levelsof local government played a significant role in urban land development in Jiangsu because of thehierarchal nature of the land supply system in China. Selected indicators for spill-over effects werecorrelated with urban land development in the two periods. In general, the natural factors playedimportant roles in urban land development, confirming our assumptions. The results therefore showthat the conceptual framework built in this research could adequately explain urban land developmentin Jiangsu Province. The regression analysis further implied that rapid urban land development hasinstitutional and market foundations and it was not only a consequence of economic development butalso regarded as a strategy to develop the urban economy.
Land is considered one of the most important factors in the literature of urban growth. In themarket economy, land development is mainly regarded as a consequence of the expansion of economicactivities. Our analysis suggests that land development in China is much more complex owing to thecountry’s distinctive land ownership and land management system. Particularly, under the verticalcontrol of land supply management, it favors the cities with rapid economic growth, while the othercities seek alternative channels to support project development, which may result in a much morecomplicated landscape of urban land development in contemporary China. By highlighting theseinstitutional factors, this study contributes to the understanding of urban land development as a resultof both market-oriented development and governance strategies of levels of government. However,because of fierce urban competition, land supply and land price are usually used as tools to attractinvestment and over-supply and informal land development are serious concerns for sustainabledevelopment in the long term. Therefore, land use efficiency and land use policies should be reviewedto counteract the land-centered urbanization in China.
Acknowledgments: This research is supported by Science and Technology Service Network Initiative ofChinese Academy of Sciences (KFJ-STS-ZDTP-011) and Natural Science Foundation of Jiangsu Province, China
Sustainability 2017, 9, 2371 14 of 15
(BK20161088). We would also like to thank Zhifeng Jin for his help on data acquisition and insightful suggestionson revising the draft version and two anonymous reviewers for their constructive comments and suggestions.
Author Contributions: Qingke Yang contributed to data processing and analysis; Xuejun Duan designed theresearch and provided guidance on manuscript writing; Qingke Yang and Lei Wang wrote the manuscript. Allauthors read and approved the final manuscript.
Conflicts of Interest: The authors declare no conflict of interest.
References
1. Bai, X.M.; Shi, P.J.; Liu, Y.S. Realizing China’s urban dream. Nature 2014, 509, 158–160. [CrossRef] [PubMed]2. Chan, K.W. Crossing the 50 Percent Population Rubicon: Can China Urbanize to Prosperity? Eurasian Geogr. Econ.
2012, 53, 63–86. [CrossRef]3. Ma, L.J.C. Urban transformation in China, 1949–2000: A review and research agenda. Environ. Plan. A 2002,
34, 1545–1569. [CrossRef]4. Shen, J.F.; Wong, K.Y.; Feng, Z.Q. State-sponsored and spontaneous urbanization in the Pearl River Delta of
south China, 1980–1998. Urban Geogr. 2002, 23, 674–694. [CrossRef]5. Zhou, Y.X.; Ma, L.J.C. China’s urbanization levels: Reconstructing a baseline from the fifth population census.
China Q. 2003, 173, 176–196.6. Pannell, C.W. China’s continuing urban transition. Environ. Plan. A 2002, 34, 1571–1589. [CrossRef]7. Parker, R.A. Patterns of Federal Urban Spending Central Cities and their Suburbs, 1983–1992. Urban Aff. Rev.
1995, 31, 184–205. [CrossRef]8. Luo, J.; Wei, Y.H.D. Modeling spatial variations of urban growth patterns in Chinese cities: The case of
Nanjing. Landsc. Urban Plan. 2009, 91, 51–64. [CrossRef]9. Shu, B.; Zhang, H.; Li, Y.; Qu, Y.; Chen, L. Spatiotemporal variation analysis of driving forces of urban land
spatial expansion using logistic regression: A case study of port towns in Taicang City, China. Habitat Int.2014, 43, 181–190. [CrossRef]
10. He, C.; Huang, Z.; Wang, R. Land use change and economic growth in urban China: A structural equationanalysis. Urban Stud. 2014, 51, 2880–2898. [CrossRef]
11. Liao, F.H.F.; Wei, Y.H.D. Modeling determinants of urban growth in Dongguan, China: A spatial logisticapproach. Stoch. Environ. Res. Risk Assess. 2014, 28, 801–816. [CrossRef]
12. Verburg, P.H.; van de Steeg, J.; Veldkamp, A.; Willemen, L. From land cover change to land functiondynamics: A major challenge to improve land characterization. J. Environ. Manag. 2009, 90, 1327–1335.[CrossRef] [PubMed]
13. Song, K.; Liu, D.; Wang, Z.; Zhang, B.; Jin, C.; Li, F.; Liu, H. Land Use Change in Sanjiang Plain and ItsDriving Forces Analysis since 1954. Acta Geogr. Sin. 2008, 63, 93–104.
14. Liu, T.; Cao, G. Progress in Urban Land Expansion and Its Driving Forces. Prog. Geogr. 2010, 29, 927–934.15. Kong, X.; Zhang, F.; Li, Y.; Jiang, Y.; Yan, G.; Xu, Y. Interactive Relationship between Land Use Change and
Industrial Change. Resour. Sci. 2005, 27, 59–64.16. Shi, P.J.; Chen, J.; Pan, Y.Z. Land use Change Mechanism in Shenzhen City. Acta Geogr. Sin. 2000, 55, 151–160.17. Bai, W.; Zhang, Y. Role of traditional cultural factors in land use changes in the Qinghai-Tibet Plateau.
Resour. Sci. 2002, 24, 11–15.18. Liu, S.Y.; Jiang, X.S. Financial Risks of Land Financing by Local Governments—Case Study of a Developed
Area in East China. China Land Sci. 2005, 19, 3–9.19. Jiang, L.; Deng, X.; Seto, K.C. Multi-level modeling of urban expansion and cultivated land conversion for
urban hotspot counties in China. Landsc. Urban Plan. 2012, 108, 131–139. [CrossRef]20. Yew, C.P. Explaining Land Use Change in a Guangdong County: The Supply Side of the Story. China Q. 2011,
207, 626–648.21. Cartier, C. ‘Zone Fever’, the Arable Land Debate, and Real Estate Speculation: China’s evolving land use
regime and its geographical contradictions. J. Contemp. China 2001, 10, 445–469. [CrossRef]22. Han, S.S. Urban expansion in contemporary China: What can we learn from a small town? Land Use Policy
2010, 27, 780–787. [CrossRef]23. Yang, D.Y.-R.; Wang, H.-K. Dilemmas of local governance under the development zone fever in China:
A case study of the Suzhou region. Urban Stud. 2008, 45, 1037–1054. [CrossRef]

Sustainability 2017, 9, 2371 15 of 15
24. Lin, G.C.S.; Ho, S.P.S. The state, land system, and land development processes in contemporary China.Ann. Assoc. Am. Geogr. 2005, 95, 411–436. [CrossRef]
25. Liu, J. Spatio-Temporal Patterns and Driving Forces of Urban Land Expansion in China during the EconomicReform Era. AMBIO J. Hum. Environ. 2005, 34, 450–455. [CrossRef]
26. Tao, R.; Su, F.; Liu, M.; Cao, G. Land Leasing and Local Public Finance in China’s Regional Development:Evidence from Prefecture-level Cities. Urban Stud. 2010, 47, 2217–2236.
27. He, C.; Zhou, Y.; Huang, Z. Fiscal decentralization, political centralization, and urban land development inChina. Urban Geogr. 2015, 37, 436–457. [CrossRef]
28. Lin, G.C.S. Reproducing spaces of chinese urbanisation: New city-based and land-centred urbantransformation. Urban Stud. 2007, 44, 1827–1855. [CrossRef]
29. Gao, J.; Wei, Y.D.; Chen, W.; Yenneti, K. Urban Land Expansion and Structural Change in the Yangtze RiverDelta, China. Sustainability 2015, 7, 10281–10307. [CrossRef]
30. Huang, Z.; Wei, Y.D.; He, C.; Li, H. Urban land expansion under economic transition in China: A multi-levelmodeling analysis. Habitat Int. 2015, 47, 69–82. [CrossRef]
31. Zhu, J.M. A transitional institution for the emerging land market in urban China. Urban Stud. 2005, 42,1369–1390. [CrossRef]
32. Wu, W. Urban Infrastructure Financing and Economic Performance in China. Urban Geogr. 2010, 31, 648–667.[CrossRef]
33. Zhu, J. Local developmental state and order in China’s urban development during transition. Int. J. UrbanReg. Res. 2004, 28, 424–447. [CrossRef]
34. Li, H.B.; Zhou, L.A. Political turnover and economic performance: The incentive role of personnel control inChina. J. Public Econ. 2005, 89, 1743–1762. [CrossRef]
35. Lin, G.C.S.; Yi, F. Urbanization of Capital or Capitalization on Urban Land? Land Development and LocalPublic Finance in Urbanizing China. Urban Geogr. 2011, 32, 50–79. [CrossRef]
36. Jia, P.; Yang, G. An Analysis of Driving Forces of Urban Land Expansion—A Case Study of Hubei Province.Res. Soil Water Conserv. 2006, 13, 182–185.
37. Gu, C.L.; Yu, T.F.; Li, W.M. China’s Urbanization: Structure, Process, Mechanism; Science Press: Beijing, China,2009; pp. 543–550.
38. Deng, X.; Huang, J.; Rozelle, S.; Uchida, E. Growth, population and industrialization, and urban landexpansion of China. J. Urban Econ. 2008, 63, 96–115. [CrossRef]
39. Chen, J.; Chang, K.-T.; Karacsonyi, D.; Zhang, X. Comparing urban land expansion and its driving factors inShenzhen and Dongguan, China. Habitat Int. 2014, 43, 61–71. [CrossRef]
40. Yang, R.N.; Zhang, X.L. A Study on the Impetus Mechanism and Models of Urban Spatial Expansion.Areal Res. Dev. 1997, 16, 1–4.
41. Ding, X.Z.; Liu, S.Z. The Geomorphological Factors of Influence on Urban Distribution and Construction inChina. J. Southwest Teach. Univ. 1990, 15, 453–461.
42. Li, Z.; Lei, J.; Li, X.; Gao, C. The Features and Influencing Factors of Urban Expansion in China during1997–2007. Prog. Geogr. 2011, 30, 607–614.
43. Oi, J.C. Rural China Takes off: Institutional Foundations of Economic Reform; Springer: Berlin, Germany, 1999;pp. 1215–1217.
44. Wang, L.; Wong, C.; Duan, X. Urban growth and spatial restructuring patterns: The case of Yangtze RiverDelta Region, China. Environ. Plan. B 2016, 43, 515–539. [CrossRef]
45. Wei, Y.D.; Fan, C.C. Regional Inequality in China: A Case Study of Jiangsu Province. Prof. Geogr. 2000, 52,455–469. [CrossRef]
46. Gao, J.; Wei, Y.D.; Chen, W.; Chen, J. Economic transition and urban land expansion in Provincial China.Habitat Int. 2014, 44, 461–473. [CrossRef]
47. Bureau of Statistics of Jiangsu Province. Jiangsu Statistical Yearbook (2005–2013); China Statistics Press: Beijing,China, 2013.
© 2017 by the authors. Licensee MDPI, Basel, Switzerland. This article is an open accessarticle distributed under the terms and conditions of the Creative Commons Attribution(CC BY) license (http://creativecommons.org/licenses/by/4.0/).