Synthetic Aperture Sonar Micronavigation Using An Active ...
Upload
univ-montp2Category
view
4download
0
Variations in fracture aperture above normal faults: a numerical
investigation in 2-D elastic multilayers
Ghislain de Joussineau *, Jean-Pierre Petit
Laboratoire de Dynamique de la Lithosphere (UMR 5573), c.c. 060, Universite Montpellier II,
Place Eugene Bataillon, 34095 Montpellier, cedex 5, France
Received 2 April 2005; received in revised form 30 January 2006; accepted 31 January 2006
Available online 20 March 2006
Abstract
This work is a 2D numerical contribution to the problem of fault and fracture interaction in layered rocks, focusing on fracture aperture.
We investigate the influence of an underlying normal fault on the aperture of open fractures in bonded multilayers submitted to vertical shortening
and horizontal lengthening. The tests are carried out using the finite element code Franc 2D under plane strain conditions. It is first shown that the
presence of a straight normal fault affects the aperture of the above fractures. The fractures located in two very local areas near the upper tip of the
fault, one in the hanging wall and one in the footwall, tend to open, whereas the neighboring fractures tend to close. The increases in aperture are
systematically greater in the footwall than in the hanging wall. Furthermore, the two areas with increased fracture aperture move towards the
footwall when the dip of the fault increases. Second, the case of more complex underlying faults with restraining/releasing bends is studied. These
models have similar results to those observed in the case of the straight underlying fault, with two areas of increased fracture aperture. The
increases in fracture aperture are comparable with the case of the straight fault in the hanging wall, but are larger in the footwall. The contrasting
behaviors of fractures described in the experiments are interpreted as a consequence of changes in the stress field in the central fractured layer
caused by the presence of the underlying fault. They may provide a guide to explain fluid flow in fault tip areas. Finally, the case of fracture
corridors (swarms of closely spaced fractures) is addressed. It is shown that, whatever the characteristics of the underlying fault, the total aperture
of a corridor formed by three equally spaced fractures is equal to 1.41–1.69 times the aperture of a single fracture located at the same place in the
fractured layer. This strongly suggests that these structures may act as preferential geological drains, with important consequences in terms of fluid
flow.
q 2006 Elsevier Ltd. All rights reserved.
Keywords: Elastic multilayer; Fracture aperture; Fracture corridor; Fluid flow; Fault tip; Franc 2D
1. Introduction
Faults and small (bed limited, i.e. layer-bound) fractures are
very common geological structures coexisting in layered rocks
in subsurface conditions. They may be linked physically to
each other, for example when fractures develop as mode I
branches in the extensional quadrant at the tips of sheared
faults (Petit and Barquins, 1988). Slight displacements along
faults can also have an important influence on the aperture of
small and pervasive background fractures located at the fault
proximity by modifying the local elastic stress field. These
0191-8141/$ - see front matter q 2006 Elsevier Ltd. All rights reserved.
doi:10.1016/j.jsg.2006.01.011
* Corresponding author. Now at: Department of Geological and Environ-
mental Sciences, Stanford University, Stanford CA 94305, USA. Tel.:C1 650
723 4788; fax: C1 650 725 0979.
E-mail address: [email protected] (G. de Joussineau).
fracture apertures are of practical importance as they directly
control flow, as shown by Fig. 1. In this field example of an
exhumed palaeo oil reservoir in Abruzzo (Central Italy), the
fractures and rock pores located in the brecciated hanging wall
of a normal fault are open and exhibit oil flow, whereas
fractures and pores in the footwall are closed to fluid
circulation. This outcrop highlights the crucial impact of the
deformation and stress around faults on flow through
neighboring fractures. But while the role of fractures as
geological conduits has been recognized and widely studied
during the two past decades (Oda, 1986; Pyrak-Nolte et al.,
1988; Cacas et al., 1990; Nordqvist et al., 1992; Gringarten,
1996; Bai and Pollard, 2001), and faulting has been recognized
to influence fluid flow in rocks (Antonellini and Aydin, 1994;
Aydin, 2000; Eichhulb et al., 2004), to our knowledge no work
focusing specifically on the mechanical and flow capacity
response of fractures due to the presence of an unconnected
underlying normal fault has been published. Thus, several
fundamental questions remain:
Journal of Structural Geology 28 (2006) 669–681
www.elsevier.com/locate/jsg
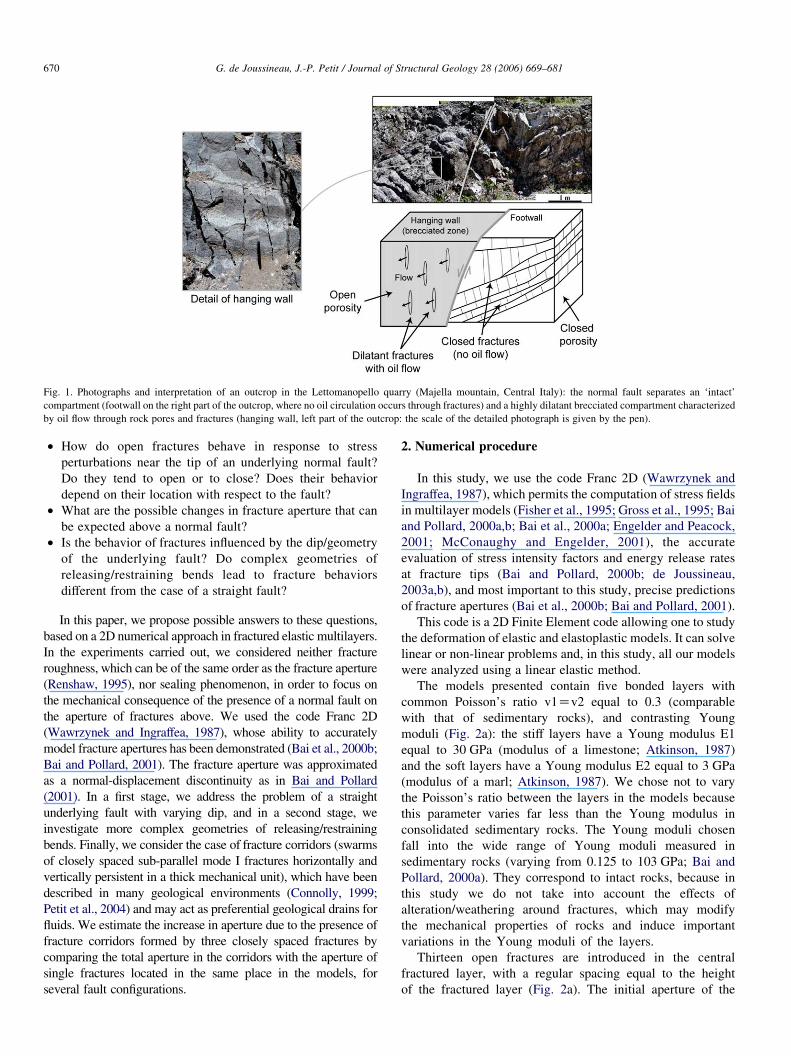
Fig. 1. Photographs and interpretation of an outcrop in the Lettomanopello quarry (Majella mountain, Central Italy): the normal fault separates an ‘intact’
compartment (footwall on the right part of the outcrop, where no oil circulation occurs through fractures) and a highly dilatant brecciated compartment characterized
by oil flow through rock pores and fractures (hanging wall, left part of the outcrop: the scale of the detailed photograph is given by the pen).
G. de Joussineau, J.-P. Petit / Journal of Structural Geology 28 (2006) 669–681670
† How do open fractures behave in response to stress
perturbations near the tip of an underlying normal fault?
Do they tend to open or to close? Does their behavior
depend on their location with respect to the fault?
† What are the possible changes in fracture aperture that can
be expected above a normal fault?
† Is the behavior of fractures influenced by the dip/geometry
of the underlying fault? Do complex geometries of
releasing/restraining bends lead to fracture behaviors
different from the case of a straight fault?
In this paper, we propose possible answers to these questions,
based on a 2D numerical approach in fractured elastic multilayers.
In the experiments carried out, we considered neither fracture
roughness, which can be of the same order as the fracture aperture
(Renshaw, 1995), nor sealing phenomenon, in order to focus on
the mechanical consequence of the presence of a normal fault on
the aperture of fractures above. We used the code Franc 2D
(Wawrzynek and Ingraffea, 1987), whose ability to accurately
model fracture apertures has been demonstrated (Bai et al., 2000b;
Bai and Pollard, 2001). The fracture aperture was approximated
as a normal-displacement discontinuity as in Bai and Pollard
(2001). In a first stage, we address the problem of a straight
underlying fault with varying dip, and in a second stage, we
investigate more complex geometries of releasing/restraining
bends. Finally, we consider the case of fracture corridors (swarms
of closely spaced sub-parallel mode I fractures horizontally and
vertically persistent in a thick mechanical unit), which have been
described in many geological environments (Connolly, 1999;
Petit et al., 2004) and may act as preferential geological drains for
fluids. We estimate the increase in aperture due to the presence of
fracture corridors formed by three closely spaced fractures by
comparing the total aperture in the corridors with the aperture of
single fractures located in the same place in the models, for
several fault configurations.
2. Numerical procedure
In this study, we use the code Franc 2D (Wawrzynek and
Ingraffea, 1987), which permits the computation of stress fields
in multilayer models (Fisher et al., 1995; Gross et al., 1995; Bai
and Pollard, 2000a,b; Bai et al., 2000a; Engelder and Peacock,
2001; McConaughy and Engelder, 2001), the accurate
evaluation of stress intensity factors and energy release rates
at fracture tips (Bai and Pollard, 2000b; de Joussineau,
2003a,b), and most important to this study, precise predictions
of fracture apertures (Bai et al., 2000b; Bai and Pollard, 2001).
This code is a 2D Finite Element code allowing one to study
the deformation of elastic and elastoplastic models. It can solve
linear or non-linear problems and, in this study, all our models
were analyzed using a linear elastic method.
The models presented contain five bonded layers with
common Poisson’s ratio v1Zv2 equal to 0.3 (comparable
with that of sedimentary rocks), and contrasting Young
moduli (Fig. 2a): the stiff layers have a Young modulus E1
equal to 30 GPa (modulus of a limestone; Atkinson, 1987)
and the soft layers have a Young modulus E2 equal to 3 GPa
(modulus of a marl; Atkinson, 1987). We chose not to vary
the Poisson’s ratio between the layers in the models because
this parameter varies far less than the Young modulus in
consolidated sedimentary rocks. The Young moduli chosen
fall into the wide range of Young moduli measured in
sedimentary rocks (varying from 0.125 to 103 GPa; Bai and
Pollard, 2000a). They correspond to intact rocks, because in
this study we do not take into account the effects of
alteration/weathering around fractures, which may modify
the mechanical properties of rocks and induce important
variations in the Young moduli of the layers.
Thirteen open fractures are introduced in the central
fractured layer, with a regular spacing equal to the height
of the fractured layer (Fig. 2a). The initial aperture of the
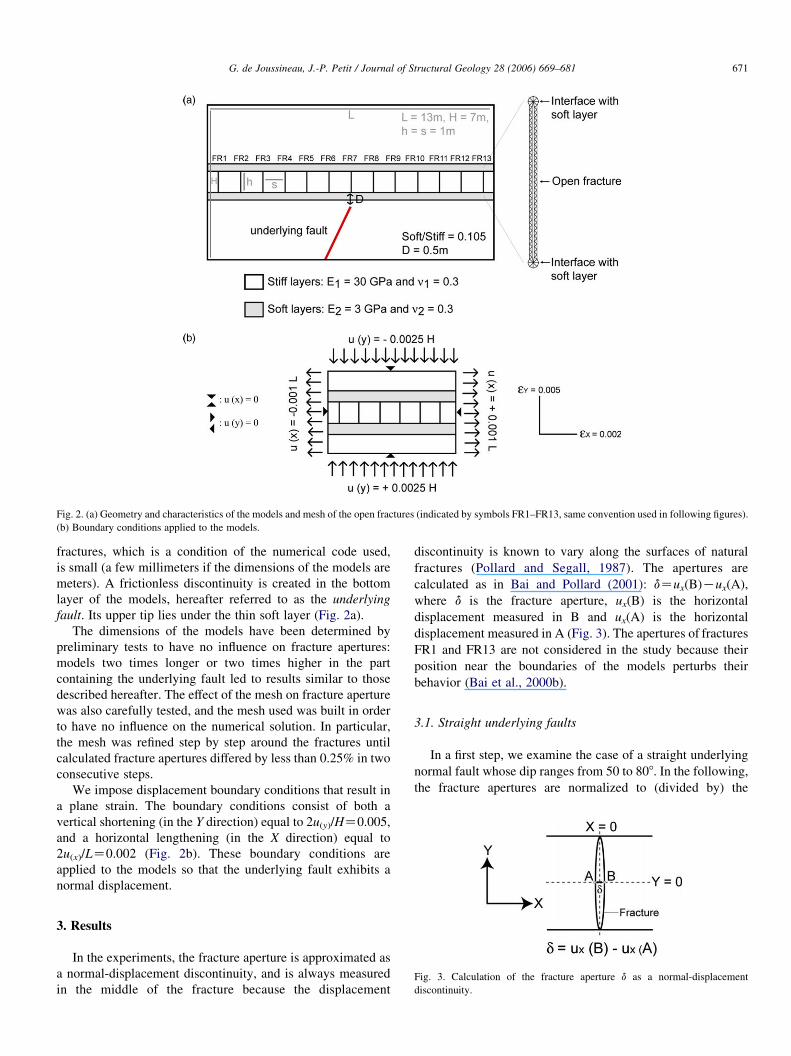
Fig. 2. (a) Geometry and characteristics of the models and mesh of the open fractures (indicated by symbols FR1–FR13, same convention used in following figures).
(b) Boundary conditions applied to the models.
G. de Joussineau, J.-P. Petit / Journal of Structural Geology 28 (2006) 669–681 671
fractures, which is a condition of the numerical code used,
is small (a few millimeters if the dimensions of the models are
meters). A frictionless discontinuity is created in the bottom
layer of the models, hereafter referred to as the underlying
fault. Its upper tip lies under the thin soft layer (Fig. 2a).
The dimensions of the models have been determined by
preliminary tests to have no influence on fracture apertures:
models two times longer or two times higher in the part
containing the underlying fault led to results similar to those
described hereafter. The effect of the mesh on fracture aperture
was also carefully tested, and the mesh used was built in order
to have no influence on the numerical solution. In particular,
the mesh was refined step by step around the fractures until
calculated fracture apertures differed by less than 0.25% in two
consecutive steps.
We impose displacement boundary conditions that result in
a plane strain. The boundary conditions consist of both a
vertical shortening (in the Y direction) equal to 2u(y)/HZ0.005,
and a horizontal lengthening (in the X direction) equal to
2u(x)/LZ0.002 (Fig. 2b). These boundary conditions are
applied to the models so that the underlying fault exhibits a
normal displacement.
Fig. 3. Calculation of the fracture aperture d as a normal-displacement
discontinuity.
3. Results
In the experiments, the fracture aperture is approximated as
a normal-displacement discontinuity, and is always measured
in the middle of the fracture because the displacement
discontinuity is known to vary along the surfaces of natural
fractures (Pollard and Segall, 1987). The apertures are
calculated as in Bai and Pollard (2001): dZux(B)Kux(A),
where d is the fracture aperture, ux(B) is the horizontal
displacement measured in B and ux(A) is the horizontal
displacement measured in A (Fig. 3). The apertures of fractures
FR1 and FR13 are not considered in the study because their
position near the boundaries of the models perturbs their
behavior (Bai et al., 2000b).
3.1. Straight underlying faults
In a first step, we examine the case of a straight underlying
normal fault whose dip ranges from 50 to 808. In the following,
the fracture apertures are normalized to (divided by) the
G. de Joussineau, J.-P. Petit / Journal of Structural Geology 28 (2006) 669–681672
apertures of the same fractures calculated in a case with no
underlying fault: normalized apertures greater than 1 indicate
that the presence of the fault leads to an increase in fracture
aperture and conversely, normalized apertures smaller than 1
indicate a decrease in aperture.
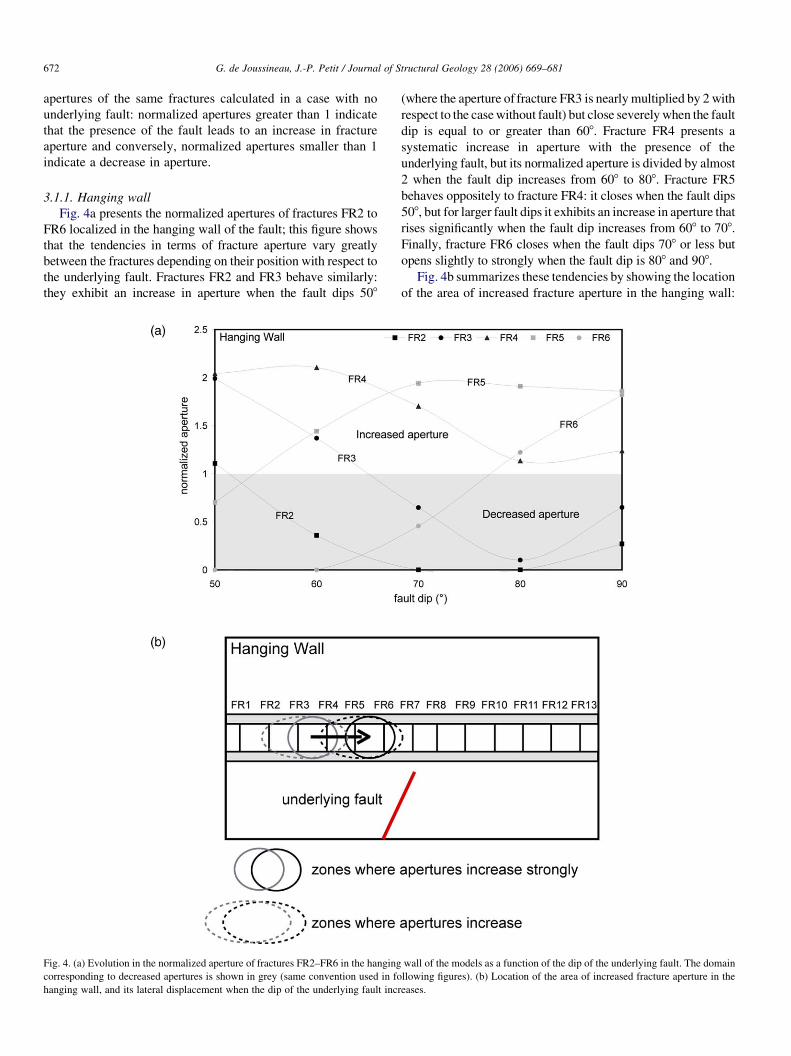
3.1.1. Hanging wall
Fig. 4a presents the normalized apertures of fractures FR2 to
FR6 localized in the hanging wall of the fault; this figure shows
that the tendencies in terms of fracture aperture vary greatly
between the fractures depending on their position with respect to
the underlying fault. Fractures FR2 and FR3 behave similarly:
they exhibit an increase in aperture when the fault dips 508
Fig. 4. (a) Evolution in the normalized aperture of fractures FR2–FR6 in the hanging
corresponding to decreased apertures is shown in grey (same convention used in fo
hanging wall, and its lateral displacement when the dip of the underlying fault incr
(where the aperture of fracture FR3 is nearly multiplied by 2 with
respect to the casewithout fault) but close severelywhen the fault
dip is equal to or greater than 608. Fracture FR4 presents a
systematic increase in aperture with the presence of the
underlying fault, but its normalized aperture is divided by almost
2 when the fault dip increases from 608 to 808. Fracture FR5
behaves oppositely to fracture FR4: it closes when the fault dips
508, but for larger fault dips it exhibits an increase in aperture that
rises significantly when the fault dip increases from 608 to 708.
Finally, fracture FR6 closes when the fault dips 708 or less but
opens slightly to strongly when the fault dip is 808 and 908.
Fig. 4b summarizes these tendencies by showing the location
of the area of increased fracture aperture in the hanging wall:
wall of the models as a function of the dip of the underlying fault. The domain
llowing figures). (b) Location of the area of increased fracture aperture in the
eases.
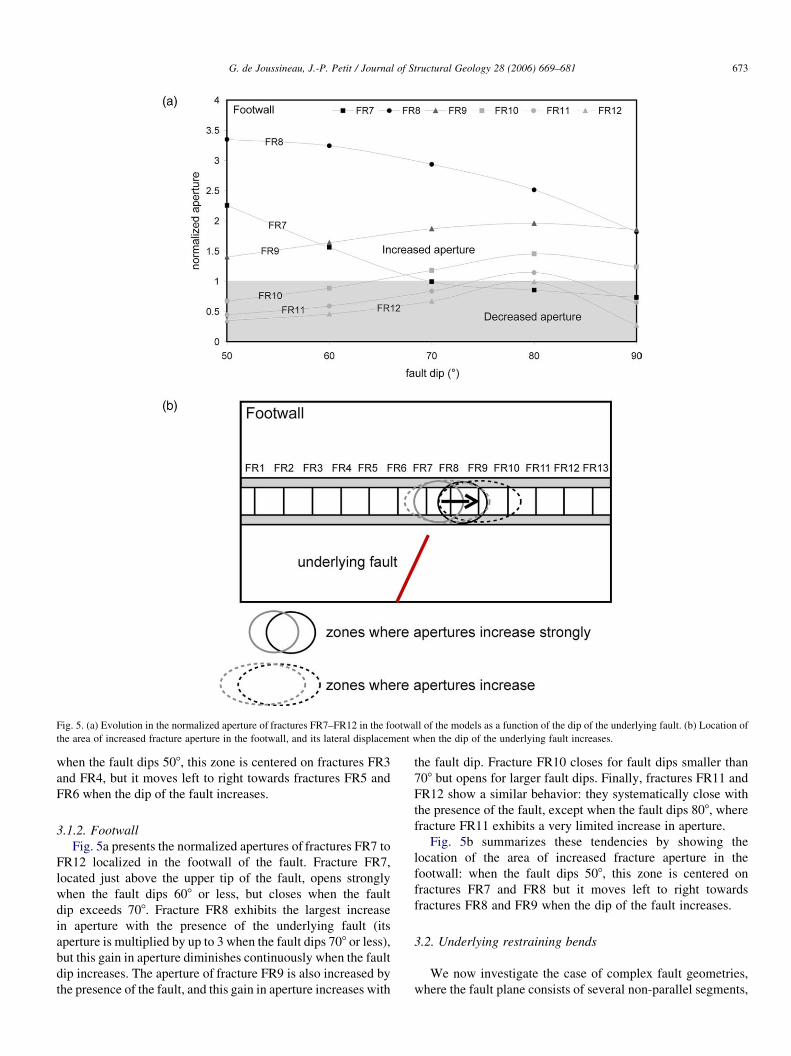
Fig. 5. (a) Evolution in the normalized aperture of fractures FR7–FR12 in the footwall of the models as a function of the dip of the underlying fault. (b) Location of
the area of increased fracture aperture in the footwall, and its lateral displacement when the dip of the underlying fault increases.
G. de Joussineau, J.-P. Petit / Journal of Structural Geology 28 (2006) 669–681 673
when the fault dips 508, this zone is centered on fractures FR3
and FR4, but it moves left to right towards fractures FR5 and
FR6 when the dip of the fault increases.
3.1.2. Footwall
Fig. 5a presents the normalized apertures of fractures FR7 to
FR12 localized in the footwall of the fault. Fracture FR7,
located just above the upper tip of the fault, opens strongly
when the fault dips 608 or less, but closes when the fault
dip exceeds 708. Fracture FR8 exhibits the largest increase
in aperture with the presence of the underlying fault (its
aperture is multiplied by up to 3 when the fault dips 708 or less),
but this gain in aperture diminishes continuously when the fault
dip increases. The aperture of fracture FR9 is also increased by
the presence of the fault, and this gain in aperture increases with
the fault dip. Fracture FR10 closes for fault dips smaller than
708 but opens for larger fault dips. Finally, fractures FR11 and
FR12 show a similar behavior: they systematically close with
the presence of the fault, except when the fault dips 808, where
fracture FR11 exhibits a very limited increase in aperture.
Fig. 5b summarizes these tendencies by showing the
location of the area of increased fracture aperture in the
footwall: when the fault dips 508, this zone is centered on
fractures FR7 and FR8 but it moves left to right towards
fractures FR8 and FR9 when the dip of the fault increases.
3.2. Underlying restraining bends
We now investigate the case of complex fault geometries,
where the fault plane consists of several non-parallel segments,
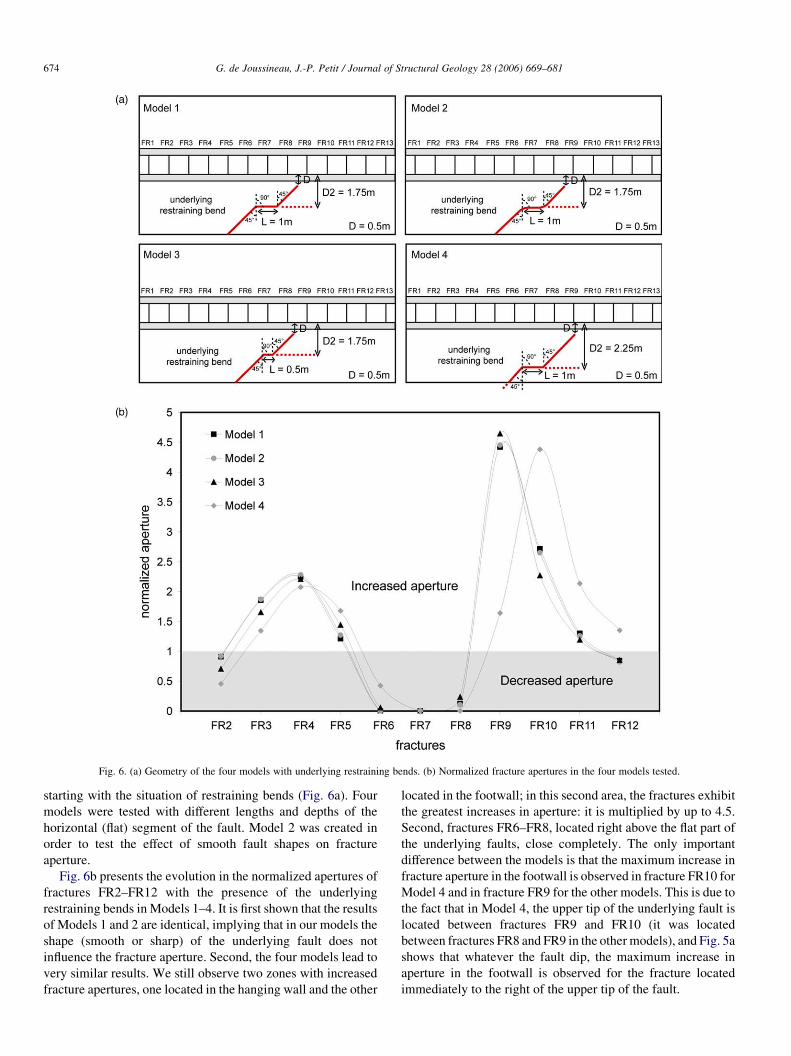
Fig. 6. (a) Geometry of the four models with underlying restraining bends. (b) Normalized fracture apertures in the four models tested.
G. de Joussineau, J.-P. Petit / Journal of Structural Geology 28 (2006) 669–681674
starting with the situation of restraining bends (Fig. 6a). Four
models were tested with different lengths and depths of the
horizontal (flat) segment of the fault. Model 2 was created in
order to test the effect of smooth fault shapes on fracture
aperture.
Fig. 6b presents the evolution in the normalized apertures of
fractures FR2–FR12 with the presence of the underlying
restraining bends in Models 1–4. It is first shown that the results
of Models 1 and 2 are identical, implying that in our models the
shape (smooth or sharp) of the underlying fault does not
influence the fracture aperture. Second, the four models lead to
very similar results. We still observe two zones with increased
fracture apertures, one located in the hanging wall and the other
located in the footwall; in this second area, the fractures exhibit
the greatest increases in aperture: it is multiplied by up to 4.5.
Second, fractures FR6–FR8, located right above the flat part of
the underlying faults, close completely. The only important
difference between the models is that the maximum increase in
fracture aperture in the footwall is observed in fracture FR10 for
Model 4 and in fracture FR9 for the other models. This is due to
the fact that in Model 4, the upper tip of the underlying fault is
located between fractures FR9 and FR10 (it was located
between fractures FR8 and FR9 in the othermodels), and Fig. 5a
shows that whatever the fault dip, the maximum increase in
aperture in the footwall is observed for the fracture located
immediately to the right of the upper tip of the fault.
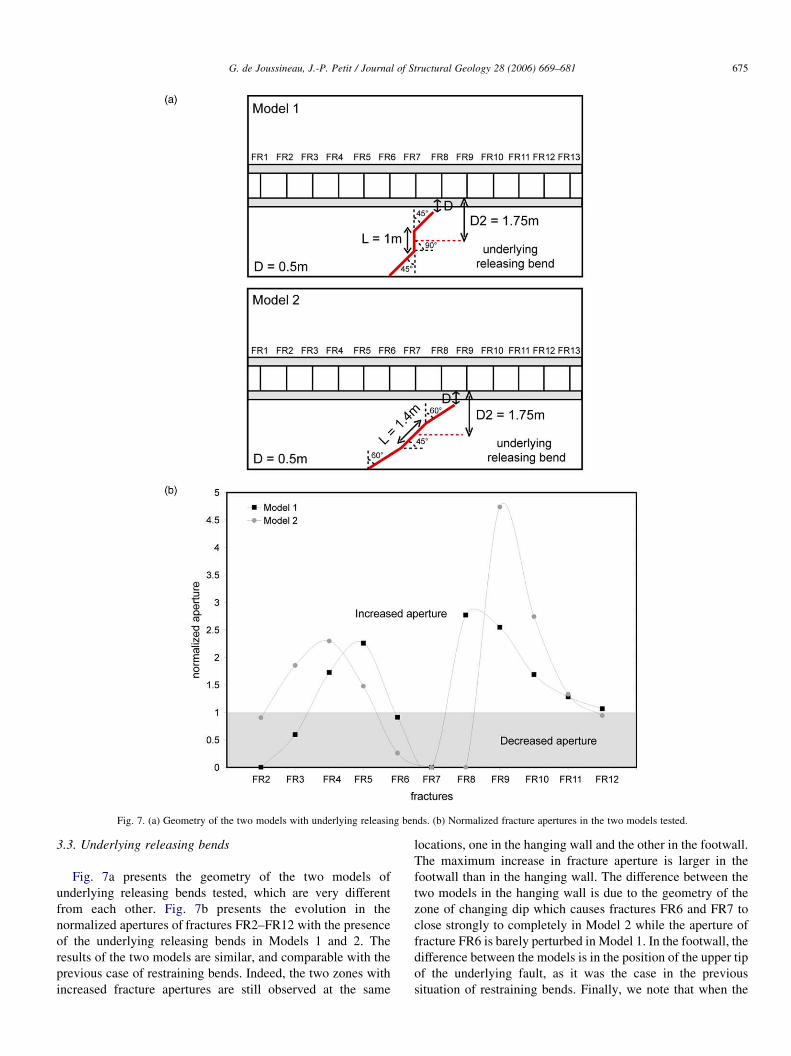
Fig. 7. (a) Geometry of the two models with underlying releasing bends. (b) Normalized fracture apertures in the two models tested.
G. de Joussineau, J.-P. Petit / Journal of Structural Geology 28 (2006) 669–681 675
3.3. Underlying releasing bends
Fig. 7a presents the geometry of the two models of
underlying releasing bends tested, which are very different
from each other. Fig. 7b presents the evolution in the
normalized apertures of fractures FR2–FR12 with the presence
of the underlying releasing bends in Models 1 and 2. The
results of the two models are similar, and comparable with the
previous case of restraining bends. Indeed, the two zones with
increased fracture apertures are still observed at the same
locations, one in the hanging wall and the other in the footwall.
The maximum increase in fracture aperture is larger in the
footwall than in the hanging wall. The difference between the
two models in the hanging wall is due to the geometry of the
zone of changing dip which causes fractures FR6 and FR7 to
close strongly to completely in Model 2 while the aperture of
fracture FR6 is barely perturbed in Model 1. In the footwall, the
difference between the models is in the position of the upper tip
of the underlying fault, as it was the case in the previous
situation of restraining bends. Finally, we note that when the
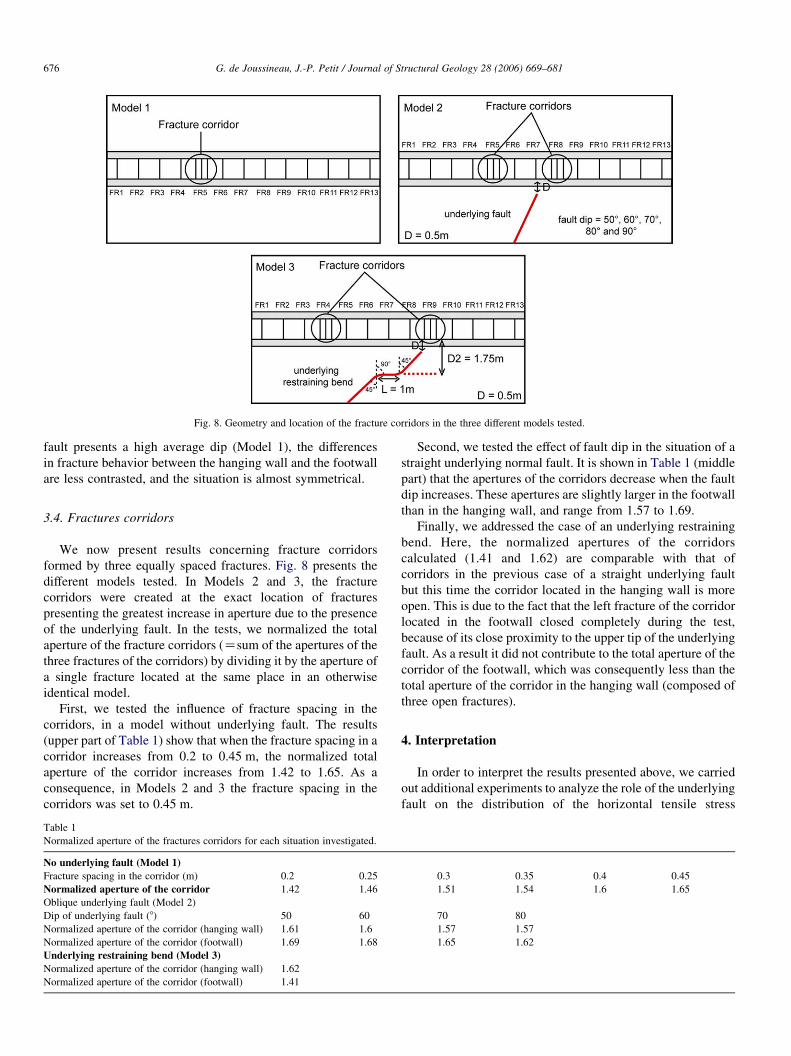
Fig. 8. Geometry and location of the fracture corridors in the three different models tested.
G. de Joussineau, J.-P. Petit / Journal of Structural Geology 28 (2006) 669–681676
fault presents a high average dip (Model 1), the differences
in fracture behavior between the hanging wall and the footwall
are less contrasted, and the situation is almost symmetrical.
3.4. Fractures corridors
We now present results concerning fracture corridors
formed by three equally spaced fractures. Fig. 8 presents the
different models tested. In Models 2 and 3, the fracture
corridors were created at the exact location of fractures
presenting the greatest increase in aperture due to the presence
of the underlying fault. In the tests, we normalized the total
aperture of the fracture corridors (Zsum of the apertures of the
three fractures of the corridors) by dividing it by the aperture of
a single fracture located at the same place in an otherwise
identical model.
First, we tested the influence of fracture spacing in the
corridors, in a model without underlying fault. The results
(upper part of Table 1) show that when the fracture spacing in a
corridor increases from 0.2 to 0.45 m, the normalized total
aperture of the corridor increases from 1.42 to 1.65. As a
consequence, in Models 2 and 3 the fracture spacing in the
corridors was set to 0.45 m.
Table 1
Normalized aperture of the fractures corridors for each situation investigated.
No underlying fault (Model 1)
Fracture spacing in the corridor (m) 0.2 0.25
Normalized aperture of the corridor 1.42 1.46
Oblique underlying fault (Model 2)
Dip of underlying fault (8) 50 60
Normalized aperture of the corridor (hanging wall) 1.61 1.6
Normalized aperture of the corridor (footwall) 1.69 1.68
Underlying restraining bend (Model 3)
Normalized aperture of the corridor (hanging wall) 1.62
Normalized aperture of the corridor (footwall) 1.41
Second, we tested the effect of fault dip in the situation of a
straight underlying normal fault. It is shown in Table 1 (middle
part) that the apertures of the corridors decrease when the fault
dip increases. These apertures are slightly larger in the footwall
than in the hanging wall, and range from 1.57 to 1.69.
Finally, we addressed the case of an underlying restraining
bend. Here, the normalized apertures of the corridors
calculated (1.41 and 1.62) are comparable with that of
corridors in the previous case of a straight underlying fault
but this time the corridor located in the hanging wall is more
open. This is due to the fact that the left fracture of the corridor
located in the footwall closed completely during the test,
because of its close proximity to the upper tip of the underlying
fault. As a result it did not contribute to the total aperture of the
corridor of the footwall, which was consequently less than the
total aperture of the corridor in the hanging wall (composed of
three open fractures).
4. Interpretation
In order to interpret the results presented above, we carried
out additional experiments to analyze the role of the underlying
fault on the distribution of the horizontal tensile stress
0.3 0.35 0.4 0.45
1.51 1.54 1.6 1.65
70 80
1.57 1.57
1.65 1.62
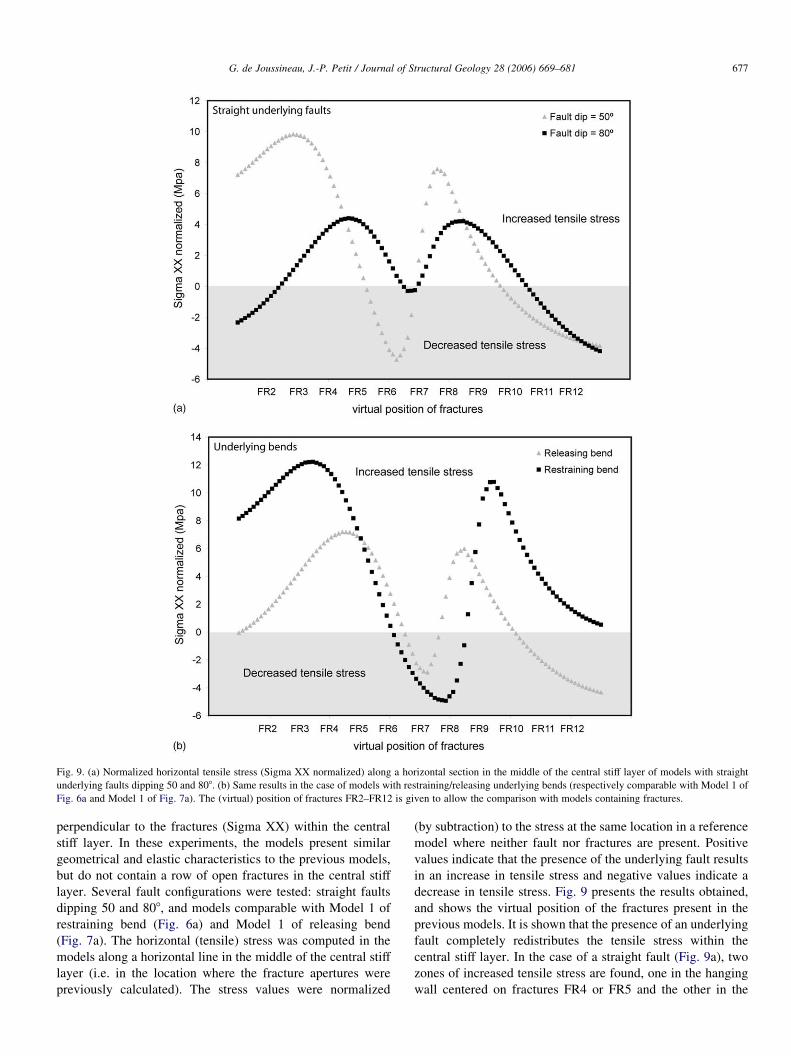
Fig. 9. (a) Normalized horizontal tensile stress (Sigma XX normalized) along a horizontal section in the middle of the central stiff layer of models with straight
underlying faults dipping 50 and 808. (b) Same results in the case of models with restraining/releasing underlying bends (respectively comparable with Model 1 of
Fig. 6a and Model 1 of Fig. 7a). The (virtual) position of fractures FR2–FR12 is given to allow the comparison with models containing fractures.
G. de Joussineau, J.-P. Petit / Journal of Structural Geology 28 (2006) 669–681 677
perpendicular to the fractures (Sigma XX) within the central
stiff layer. In these experiments, the models present similar
geometrical and elastic characteristics to the previous models,
but do not contain a row of open fractures in the central stiff
layer. Several fault configurations were tested: straight faults
dipping 50 and 808, and models comparable with Model 1 of
restraining bend (Fig. 6a) and Model 1 of releasing bend
(Fig. 7a). The horizontal (tensile) stress was computed in the
models along a horizontal line in the middle of the central stiff
layer (i.e. in the location where the fracture apertures were
previously calculated). The stress values were normalized
(by subtraction) to the stress at the same location in a reference
model where neither fault nor fractures are present. Positive
values indicate that the presence of the underlying fault results
in an increase in tensile stress and negative values indicate a
decrease in tensile stress. Fig. 9 presents the results obtained,
and shows the virtual position of the fractures present in the
previous models. It is shown that the presence of an underlying
fault completely redistributes the tensile stress within the
central stiff layer. In the case of a straight fault (Fig. 9a), two
zones of increased tensile stress are found, one in the hanging
wall centered on fractures FR4 or FR5 and the other in the
G. de Joussineau, J.-P. Petit / Journal of Structural Geology 28 (2006) 669–681678
footwall centered on fractures FR8 or FR9. An increasing dip
of the fault results in a lateral displacement of these areas
towards the footwall, explaining the tendencies shown by Figs.
4a and 5a. The areas where the tensile stress is increased by the
presence of the underlying fault almost exactly superimpose
with the areas where the fracture aperture increases in the
models containing the fractures. Specifically, Fig. 9a predicts
an increase in fracture aperture at the location of fractures
FR2–FR5 and FR8–FR10 and a decrease in fracture aperture at
the location of fractures FR6 and FR7 (following the fault dip),
which almost exactly fits with the results presented by Figs. 4a
and 5a. The main difference between the models with and
without fractures is that the increases in tensile stress are the
largest in the hanging wall in Fig. 9a, whereas the increases in
aperture are the largest in the footwall in Figs. 4a and 5a. This
difference is due to the fact that the local stress field controlling
fracture aperture is not only perturbed by the underlying fault,
but also by the fractures themselves, which are absent in the
last models studied. However, the results above clearly suggest
that the contrasting fracture apertures in the models are mainly
related to the modification of the stress field in the central stiff
layer due to the presence of the underlying fault.
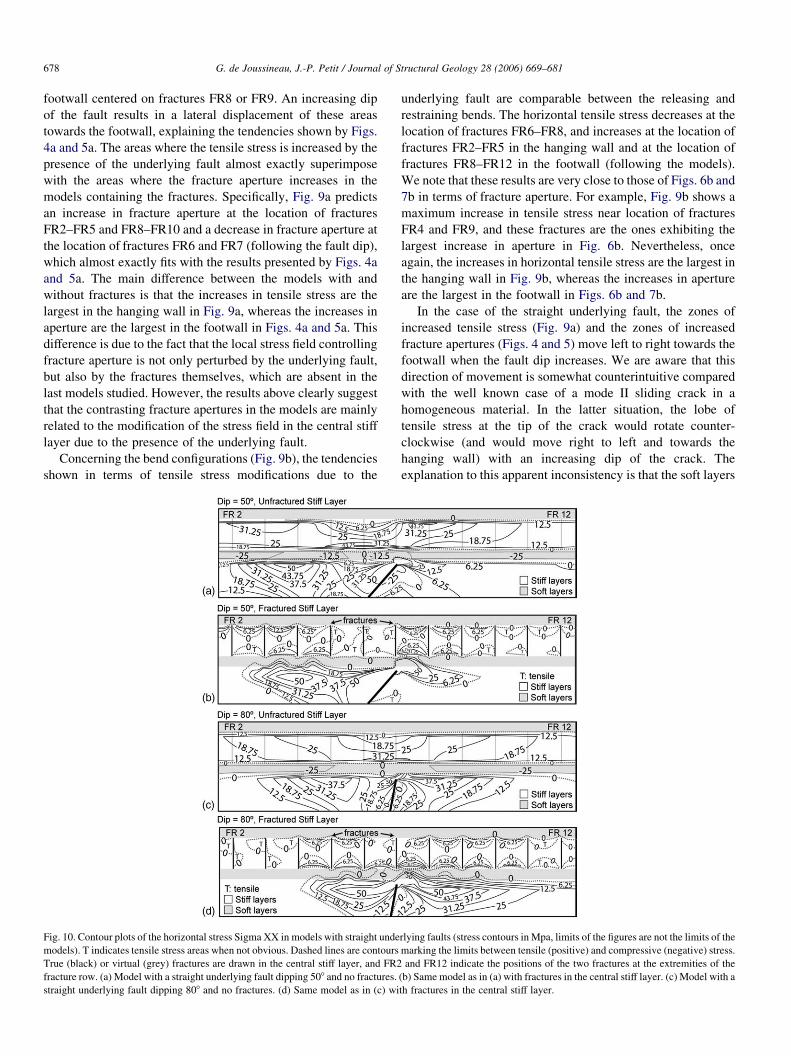
Concerning the bend configurations (Fig. 9b), the tendencies
shown in terms of tensile stress modifications due to the
Fig. 10. Contour plots of the horizontal stress Sigma XX in models with straight unde
models). T indicates tensile stress areas when not obvious. Dashed lines are contours
True (black) or virtual (grey) fractures are drawn in the central stiff layer, and FR2
fracture row. (a) Model with a straight underlying fault dipping 508 and no fractures.
straight underlying fault dipping 808 and no fractures. (d) Same model as in (c) wi
underlying fault are comparable between the releasing and
restraining bends. The horizontal tensile stress decreases at the
location of fractures FR6–FR8, and increases at the location of
fractures FR2–FR5 in the hanging wall and at the location of
fractures FR8–FR12 in the footwall (following the models).
We note that these results are very close to those of Figs. 6b and
7b in terms of fracture aperture. For example, Fig. 9b shows a
maximum increase in tensile stress near location of fractures
FR4 and FR9, and these fractures are the ones exhibiting the
largest increase in aperture in Fig. 6b. Nevertheless, once
again, the increases in horizontal tensile stress are the largest in
the hanging wall in Fig. 9b, whereas the increases in aperture
are the largest in the footwall in Figs. 6b and 7b.
In the case of the straight underlying fault, the zones of
increased tensile stress (Fig. 9a) and the zones of increased
fracture apertures (Figs. 4 and 5) move left to right towards the
footwall when the fault dip increases. We are aware that this
direction of movement is somewhat counterintuitive compared
with the well known case of a mode II sliding crack in a
homogeneous material. In the latter situation, the lobe of
tensile stress at the tip of the crack would rotate counter-
clockwise (and would move right to left and towards the
hanging wall) with an increasing dip of the crack. The
explanation to this apparent inconsistency is that the soft layers
rlying faults (stress contours in Mpa, limits of the figures are not the limits of the
marking the limits between tensile (positive) and compressive (negative) stress.
and FR12 indicate the positions of the two fractures at the extremities of the
(b) Same model as in (a) with fractures in the central stiff layer. (c) Model with a
th fractures in the central stiff layer.
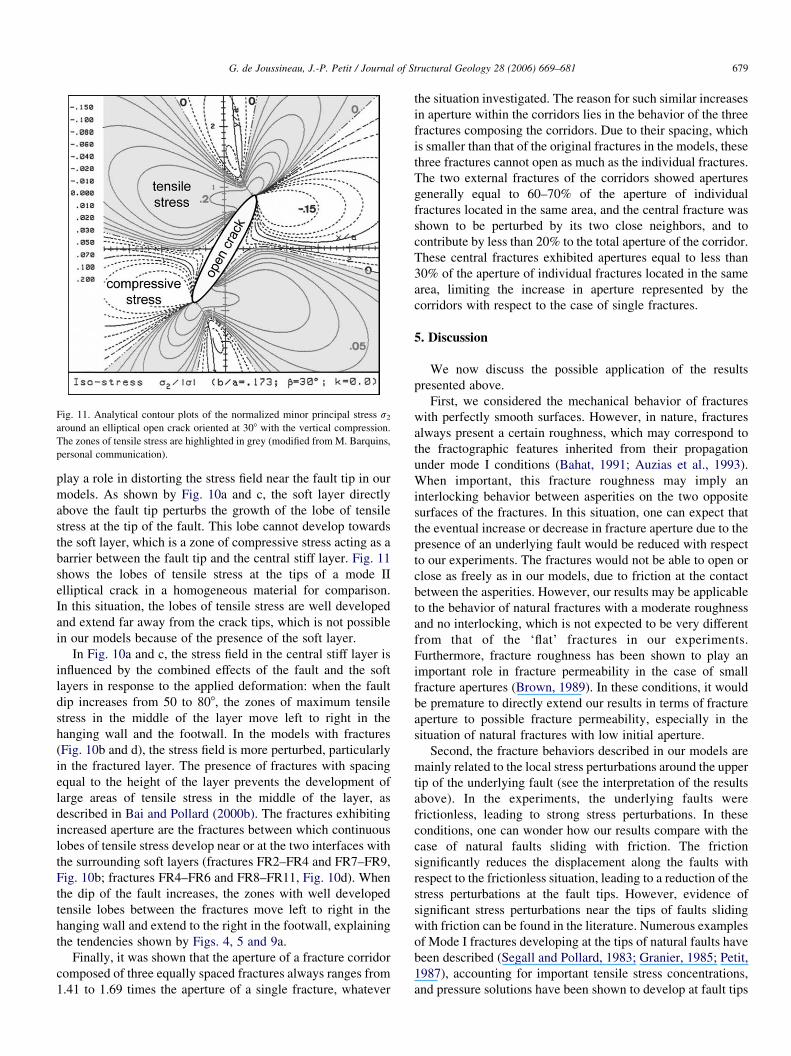
Fig. 11. Analytical contour plots of the normalized minor principal stress s2around an elliptical open crack oriented at 308 with the vertical compression.
The zones of tensile stress are highlighted in grey (modified from M. Barquins,
personal communication).
G. de Joussineau, J.-P. Petit / Journal of Structural Geology 28 (2006) 669–681 679
play a role in distorting the stress field near the fault tip in our
models. As shown by Fig. 10a and c, the soft layer directly
above the fault tip perturbs the growth of the lobe of tensile
stress at the tip of the fault. This lobe cannot develop towards
the soft layer, which is a zone of compressive stress acting as a
barrier between the fault tip and the central stiff layer. Fig. 11
shows the lobes of tensile stress at the tips of a mode II
elliptical crack in a homogeneous material for comparison.
In this situation, the lobes of tensile stress are well developed
and extend far away from the crack tips, which is not possible
in our models because of the presence of the soft layer.
In Fig. 10a and c, the stress field in the central stiff layer is
influenced by the combined effects of the fault and the soft
layers in response to the applied deformation: when the fault
dip increases from 50 to 808, the zones of maximum tensile
stress in the middle of the layer move left to right in the
hanging wall and the footwall. In the models with fractures
(Fig. 10b and d), the stress field is more perturbed, particularly
in the fractured layer. The presence of fractures with spacing
equal to the height of the layer prevents the development of
large areas of tensile stress in the middle of the layer, as
described in Bai and Pollard (2000b). The fractures exhibiting
increased aperture are the fractures between which continuous
lobes of tensile stress develop near or at the two interfaces with
the surrounding soft layers (fractures FR2–FR4 and FR7–FR9,
Fig. 10b; fractures FR4–FR6 and FR8–FR11, Fig. 10d). When
the dip of the fault increases, the zones with well developed
tensile lobes between the fractures move left to right in the
hanging wall and extend to the right in the footwall, explaining
the tendencies shown by Figs. 4, 5 and 9a.
Finally, it was shown that the aperture of a fracture corridor
composed of three equally spaced fractures always ranges from
1.41 to 1.69 times the aperture of a single fracture, whatever
the situation investigated. The reason for such similar increases
in aperture within the corridors lies in the behavior of the three
fractures composing the corridors. Due to their spacing, which
is smaller than that of the original fractures in the models, these
three fractures cannot open as much as the individual fractures.
The two external fractures of the corridors showed apertures
generally equal to 60–70% of the aperture of individual
fractures located in the same area, and the central fracture was
shown to be perturbed by its two close neighbors, and to
contribute by less than 20% to the total aperture of the corridor.
These central fractures exhibited apertures equal to less than
30% of the aperture of individual fractures located in the same
area, limiting the increase in aperture represented by the
corridors with respect to the case of single fractures.
5. Discussion
We now discuss the possible application of the results
presented above.
First, we considered the mechanical behavior of fractures
with perfectly smooth surfaces. However, in nature, fractures
always present a certain roughness, which may correspond to
the fractographic features inherited from their propagation
under mode I conditions (Bahat, 1991; Auzias et al., 1993).
When important, this fracture roughness may imply an
interlocking behavior between asperities on the two opposite
surfaces of the fractures. In this situation, one can expect that
the eventual increase or decrease in fracture aperture due to the
presence of an underlying fault would be reduced with respect
to our experiments. The fractures would not be able to open or
close as freely as in our models, due to friction at the contact
between the asperities. However, our results may be applicable
to the behavior of natural fractures with a moderate roughness
and no interlocking, which is not expected to be very different
from that of the ‘flat’ fractures in our experiments.
Furthermore, fracture roughness has been shown to play an
important role in fracture permeability in the case of small
fracture apertures (Brown, 1989). In these conditions, it would
be premature to directly extend our results in terms of fracture
aperture to possible fracture permeability, especially in the
situation of natural fractures with low initial aperture.
Second, the fracture behaviors described in our models are
mainly related to the local stress perturbations around the upper
tip of the underlying fault (see the interpretation of the results
above). In the experiments, the underlying faults were
frictionless, leading to strong stress perturbations. In these
conditions, one can wonder how our results compare with the
case of natural faults sliding with friction. The friction
significantly reduces the displacement along the faults with
respect to the frictionless situation, leading to a reduction of the
stress perturbations at the fault tips. However, evidence of
significant stress perturbations near the tips of faults sliding
with friction can be found in the literature. Numerous examples
of Mode I fractures developing at the tips of natural faults have
been described (Segall and Pollard, 1983; Granier, 1985; Petit,
1987), accounting for important tensile stress concentrations,
and pressure solutions have been shown to develop at fault tips
G. de Joussineau, J.-P. Petit / Journal of Structural Geology 28 (2006) 669–681680
due to significant compressive stress concentrations (Rispoli,
1981; Petit and Mattauer, 1995). Therefore, the fracture
behaviors (opening/closing) described in this study may still
apply in the case of natural fractures located above a fault
sliding with friction, even if a reduced stress perturbation at the
fault tips would lead to less distinct fracture behaviors.
Nevertheless, in nature, friction may be reduced by the
presence of clay-rich core zones, or by abnormal fluid pressure.
Third, while we considered changes in the 2D (cross-
section) geometry of the faults in our models, natural faults
also display changes in their along-strike geometry. The along-
strike segmentation of faults may have an important influence
on the behavior of the fractures in the overlying layers. As
discussed in a previous section, the opening/closing tendencies
shown by the fractures in our models are mainly related to
stress perturbations at the tips of the underlying faults. In these
conditions, we expect the zones of increased/decreased fracture
aperture to be found at the same locations all along (above) a
given fault segment in the along-strike direction, because the
stress perturbations are not expected to vary greatly along a
continuous segment. However, in the relay zones between
consecutive fault segments, the stress perturbations are
dramatically increased due to the interaction of several fault
tips. These intense stress perturbations would probably result in
extreme fracture behaviors when compared with the situation
in our models. In fault relay zones, we would expect fractures
to either completely close or demonstrate very large apertures
depending on their location with respect to the segment tips.
Furthermore, fault relay zones are densely fractured, which
may facilitate the circulation of fluids towards the overlying
layers and thus increase the volume of fluids drained by the
open fractures above units.
Even if we are aware of the potential limitations of this
work, the distinct tendencies in terms of fracture aperture that
we described provide a satisfying explanation to localized flow
through a joint set in a well-defined layer as shown in Bruel
et al. (1999). These authors observed very localized water flow
through a few bed-limited adjacent joints at depth in an
uranium mine in the Lodeve Permian Basin (Southern France),
with the neighboring joints (with identical aspect) being dry.
The presence of an unconnected and non-observable fault,
redistributing the local elastic stress field in layers apparently
unaffected by deformation and enhancing fracture apertures
very locally, may be responsible for such discontinuous flow in
a systematic joint set.
Finally, the increase in aperture due to the presence of
fracture corridors in the models strongly suggests their possible
role as preferential geological drains. These corridors,
commonly observed in many geological contexts and some-
times composed of many tens of fractures, may act as high
permeability conduits in oil and gas reservoirs.
6. Conclusions
This work is a 2D numerical contribution to the problem of
fault and fracture interaction in rocks, focusing on the
modification in fracture aperture induced by the presence of
an underlying unconnected normal fault. First, it is shown that
the presence of an underlying fault strongly affects the aperture
of the fractures above, leading to much contrasted situations.
The fractures situated near the tip of the fault in two very local
areas, one in the hanging wall and the other in the footwall,
exhibit increased aperture, whereas the neighboring fractures
tend to close. The increases in aperture are systematically
greater in the footwall than in the hanging wall, and the zones
with increased fracture aperture move towards the footwall
when the fault dip increases. Second, the fracture behaviors
described in the case of a straight underlying fault are still
observed in the case of underlying restraining/releasing bends.
Nevertheless, if the gains in fracture aperture are comparable
with the case of the straight fault in the hanging wall, they
increase strongly in the footwall. The particular distribution of
areas where the fracture aperture is enhanced, which can be
superimposed to the areas where the horizontal tensile stress is
increased by the presence of the underlying fault, may have an
application to the observed heterogeneous fluid flow through
joint sets.
Finally, the case of fracture corridors is addressed. It is
shown that, whatever the characteristics of the underlying fault,
the total aperture of a corridor of three fractures is equal to
1.41–1.69 times the aperture of a single fracture located at the
same place in the fractured layer. This strongly suggests their
possible role as preferential geological drains, with hydro-
dynamical consequences on fluid flow in oil and gas reservoirs.
Acknowledgements
This work is part of Ghislain de Joussineau’s PhD thesis,
funded by the French Research Ministry. We acknowledge the
thoughtful reviews by David Healy, Terry Engelder and
Jonathan Imber. We warmly thank Joseph Gonzales for a
revision of the English of the manuscript. Finally, we are
grateful to the Cornell Fracture Group for free use of Franc 2D
and technical help.
References
Antonellini, M., Aydin, A., 1994. Effect of faulting on fluid flow in porous
sandstones: petrophysical properties. American Association of Petroleum
Geologists Bulletin 78, 355–377.
Atkinson, B.K., 1987. Fracture Mechanics of Rocks. Academic Press, London.
Auzias, V., Rives, T., Petit, J.P., 1993. Signification des cotes (rib marks) dans
la cinetique de propagation des diaclases: modele analogique dans le
polymethacrylate de methyle (PMMA). Comptes Rendus de l’Academie
des Sciences de Paris serie II 317, 705–712.
Aydin, A., 2000. Fractures, faults, and hydrocarbon entrapment, migration and
flow. Marine and Petroleum Geology 17, 797–814.
Bahat, D., 1991. Tectono-fractography. Springer-Verlag, Berlin.
Bai, T., Pollard, D.D., 2000a. Fracture spacing in layered rocks: a new
explanation based on the stress transition. Journal of Structural Geology 22,
43–57.
Bai, T., Pollard, D.D., 2000b. Closely spaced fractures in layered rocks:
initiation mechanism and propagation kinematics. Journal of Structural
Geology 22, 1409–1425.
Bai, T., Pollard, D.D., Gao, H., 2000a. Explanation for fracture spacing in
layered materials. Nature 403, 753–756.
G. de Joussineau, J.-P. Petit / Journal of Structural Geology 28 (2006) 669–681 681
Bai, T., Pollard, D.D., Gross, M., 2000b. Mechanical prediction of fracture
aperture in layered rocks. Journal of Geophysical Research 105, 707–721.
Bai, T., Pollard, D.D., 2001. Getting more for less: the unusual efficiency of
fluid flow in fractures. Geophysical Research Letters 28, 65–68.
Brown, S.R., 1989. Transport of fluid and electric current through a single
fracture. Journal of Geophysical Research 94, 9429–9438.
Bruel, T., Petit, J.P., Massonnat, G., Guerin, R., Nolf, J.L., 1999. Relation entre
ecoulements et fractures ouvertes dans un systeme aquifere compartimente
par des failles et mise en evidence d’une double porosite de fractures.
Bulletin de la Societe Geologique de France 170-3, 401–412.
Cacas, M.C., Ledoux, E., de Marsily, G., Tillie, B., 1990. Modeling fracture
flow with a stochastic discrete fracture network; calibration and validation.
Water Resources Research 26, 479–489.
Connolly, P., 1999. The Fracture Corridor Project, Part 1. Technical Report. Elf
Aquitaine-Shell International Exploration & Production B.V..
de Joussineau, G., 2003. Contribution a l’etude du comportement sous
contrainte des failles et des fractures de mode I: terrain, et modelisations
analogiques et numeriques. PhD Thesis, Universite Montpellier II.
de Joussineau, G., 2003b. 2D Numerical Investigation of the Mechanics of
Jointing Within Layered Rocks: Towards the Origin of Fracture Corridors.
Technicol Report. Shell International Exploration & Production.
Eichhulb, P., Taylor, W.L., Pollard, D.D., Aydin, A., 2004. Paleo-fluid flow and
deformation in the Aztec Sandstone at the Valley of Fire, Nevada—
evidence for the coupling of hydrogeologic, diagenetic and tectonic
processes. Geological Society of America Bulletin 116, 1120–1136.
Engelder, T., Peacock, D.C.P., 2001. Joint development normal to regional
compression during flexural-flow folding: the Lilstock buttress anticline,
Somerset, England. Journal of Structural Geology 23, 259–277.
Fisher, M.P., Gross, M.R., Engelder, T., Greenfield, R.J., 1995. Finite-element
analysis of the stress distribution around a pressurized crack in a layered
elastic medium: implications for the spacing of fluid-driven joints in bedded
sedimentary rocks. Tectonophysics 247, 49–64.
Granier, T., 1985. Origin, damping, and pattern of development of faults in
granite. Tectonics 4, 721–737.
Gringarten, E., 1996. 3-D geometric description of fractured reservoirs.
Mathematical Geology 28, 881–893.
Gross,M.R., Fisher,M.P., Engelder, T.,Greenfield,R.J., 1995. Factors controlling
joint spacing in interbedded sedimentary rocks: integrating numerical models
with field observations from the Monterey Formation, USA. In: Ameen, M.S.
(Ed.), Fracture Topography as a Tool in Fracture Mechanics and Stress
Analysis Geological Society Special Publications 92, pp. 215–233.
McConaughy, D.T., Engelder, T., 2001. Joint initiation in bedded clastic rocks.
Journal of Structural Geology 23, 203–221.
Nordqvist, A.W., Tsang, Y.W., Tsang, C.F., Dverstorp, B., Andersson, J., 1992.
A variable aperture fracture network model for flow and transport in
fractured rocks. Water Resources Research 28, 1703–1713.
Oda, M., 1986. An equivalent continuum model for coupled stress and fluid
flow analysis in jointed rock masses. Water Resources Research 22,
1845–1856.
Petit, J.P., 1987. Criteria for the sense of movement on fault surfaces in brittle
rocks. Journal of Structural Geology 9, 597–608.
Petit, J.P., Barquins, M., 1988. Can natural faults propagate under mode II
conditions? Tectonics 7, 1243–1256.
Petit, J.P., Mattauer, M., 1995. Paleostress superimposition deduced from
mesoscale structures in limestone: the Matelles exposure, Languedoc,
France. Journal of Structural Geology 2, 245–256.
Petit, J.P., Bazalgette, L., Chemenda, A., Connolly, P., Jorand, C., de
Joussineau, G., 2004. Fracture corridors. Fractured Reservoirs Conference,
The Geological Society of London, November 16–17, London.
Pollard, D.D., Segall, P., 1987. Theoretical displacements and stresses near
fractures in rock: with applications to faults, joints, veins, dikes, and
solution surfaces. In: Atkinson, B.K. (Ed.), Fracture Mechanics of Rocks.
Academic Press, London, pp. 277–349.
Pyrak-Nolte, L.J., Cook, N.G.W., Nolte, D.D., 1988. Fluid percolation through
single fractures. Geophysical Research Letters 15, 1247–1250.
Renshaw, C.E., 1995. On the relationship between mechanical and hydraulic
apertures in rough-walled fractures. Journal of Geophysical Research 100,
24629–24636.
Rispoli, R., 1981. Stress field about strike-slip faults inferred from stylolites
and tension gashes. Tectonophysics 75, 29–36.
Segall, P., Pollard, D.D., 1983. Nucleation and growth of strike-slip faults in
granite. Journal of Geophysical Research 88, 555–568.
Wawrzynek, P.A., Ingraffea, A.R., 1987. Interactive finite element analysis of
fracture processes: an integrated approach. Theoretical and Applied
Fracture Mechanics 8, 137–150.
Copyright © 2022 FDOKUMEN