Valuation and Value Drivers for US Based Airlines, an ... - CORE
31
University of Tennessee, Knoxville Trace: Tennessee Research and Creative Exchange University of Tennessee Honors esis Projects University of Tennessee Honors Program 5-2017 Valuation and Value Drivers for US Based Airlines, an Analysis of an Industry Ryan Caveney [email protected] Follow this and additional works at: hps://trace.tennessee.edu/utk_chanhonoproj Part of the Corporate Finance Commons is Dissertation/esis is brought to you for free and open access by the University of Tennessee Honors Program at Trace: Tennessee Research and Creative Exchange. It has been accepted for inclusion in University of Tennessee Honors esis Projects by an authorized administrator of Trace: Tennessee Research and Creative Exchange. For more information, please contact [email protected]. Recommended Citation Caveney, Ryan, "Valuation and Value Drivers for US Based Airlines, an Analysis of an Industry" (2017). University of Tennessee Honors esis Projects. hps://trace.tennessee.edu/utk_chanhonoproj/2095 CORE Metadata, citation and similar papers at core.ac.uk Provided by University of Tennessee, Knoxville: Trace
-
Upload
khangminh22 -
Category
Documents
-
view
1 -
download
0
Transcript of Valuation and Value Drivers for US Based Airlines, an ... - CORE

University of Tennessee, KnoxvilleTrace: Tennessee Research and Creative
Exchange
University of Tennessee Honors Thesis Projects University of Tennessee Honors Program
5-2017
Valuation and Value Drivers for US Based Airlines,an Analysis of an IndustryRyan [email protected]
Follow this and additional works at: https://trace.tennessee.edu/utk_chanhonoproj
Part of the Corporate Finance Commons
This Dissertation/Thesis is brought to you for free and open access by the University of Tennessee Honors Program at Trace: Tennessee Research andCreative Exchange. It has been accepted for inclusion in University of Tennessee Honors Thesis Projects by an authorized administrator of Trace:Tennessee Research and Creative Exchange. For more information, please contact [email protected].
Recommended CitationCaveney, Ryan, "Valuation and Value Drivers for US Based Airlines, an Analysis of an Industry" (2017). University of Tennessee HonorsThesis Projects.https://trace.tennessee.edu/utk_chanhonoproj/2095
CORE Metadata, citation and similar papers at core.ac.uk
Provided by University of Tennessee, Knoxville: Trace
1
University of Tennessee
Chancellors Honors Program
Undergraduate Thesis
Valuation and Value Drivers for US Based Airlines, an Analysis
of an Industry
Ryan Caveney
Advisor: Dr. Phillip Daves
May 8, 2017
2
Introduction
The purpose of this paper is to analyze the US airline industry
and provide an understanding of the industry itself, how
companies in the industry are valued, and what the market
assumes for their future potential.
Background
In a 1996 article titled “A Review of History, Structure, and
Competition in the U.S. Airline Industry”, Gerald Cook describes
the evolution of the airline industry from its origin after World
War II through its maturity in the 1970s and through a fierce,
competitive renascence after the Civil Aeronautics Board
stopped regulating the industry and handed it over to the forces
of the free market. Before 1978, US airlines were regulated by
the CAB against “unfair or destructive competitive practices”
who controlled everything from prices, routes, and entrants and
exits to the industry. Ultimately, in attempts to grab market
share, airlines began competing where they could by “increasing
flight frequency, lowering seating density, and adding ever more
extravagant in-flight service” which lead to poor performance,
low load factors, and a push to deregulate the industry. With
this move, airlines were finally able to compete on prices and
operational efficiencies leading to many innovations including
the hub and spoke route systems. The deregulation also led to
many new entrants into the market, hoping to compete against
established carriers. Economic difficulties in the 1980s resulted
in consolidations and bankruptcies, placing nearly 80% of air
passengers in the 8 largest airlines. Since then, industry
knowledge and technological advances have led to more
efficient pricing and ticketing policies, among other things. The
paper concludes with a new market trend of the time, low cost
carriers, about to shape the future of the industry.
Literature Review
“The Effect of Operation Performance and Focus on
Profitability: A Longitudinal Study of the U.S. Airline Industry” is
a study published in 2007 by Nikos Tsikriktsis that examines the
effects of operational performance as well as the effects of
quality of service on profitability for US airlines. Tsikriktsis
used two operational indicators, the load factor to measure
flight utilization and a fleet factor to measure the utilization of
aircraft, as well as two quality indicators, late arrivals and lost
3
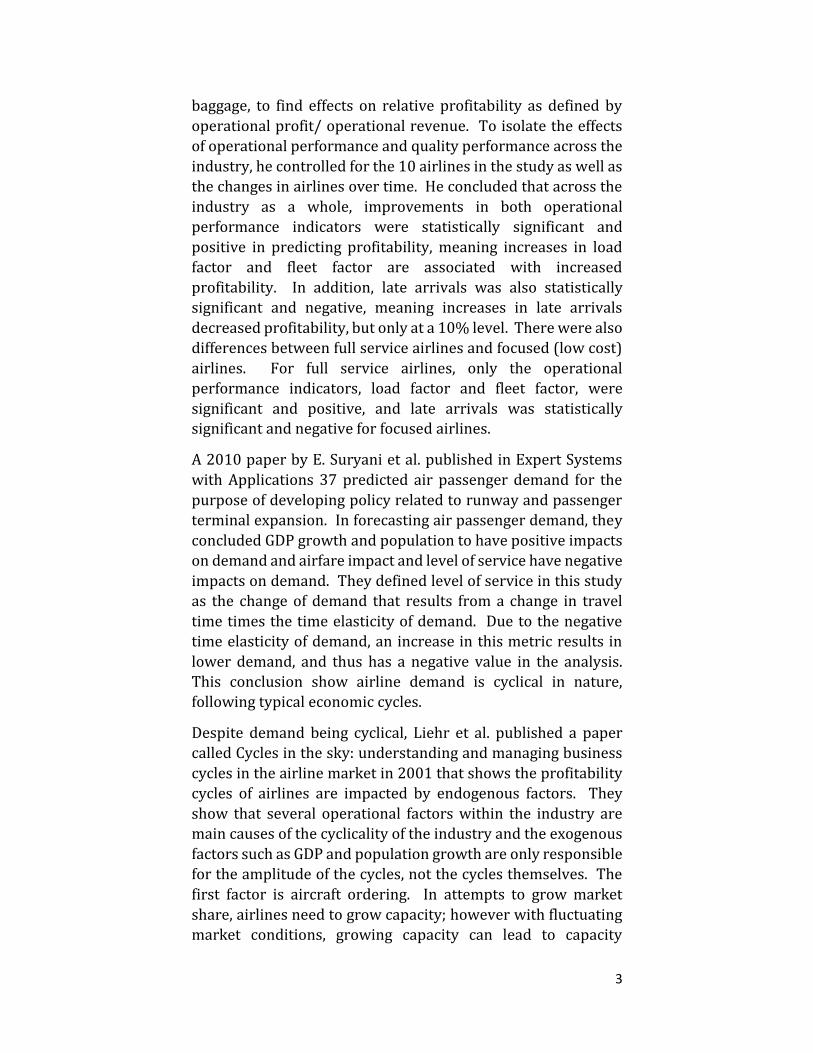
baggage, to find effects on relative profitability as defined by
operational profit/ operational revenue. To isolate the effects
of operational performance and quality performance across the
industry, he controlled for the 10 airlines in the study as well as
the changes in airlines over time. He concluded that across the
industry as a whole, improvements in both operational
performance indicators were statistically significant and
positive in predicting profitability, meaning increases in load
factor and fleet factor are associated with increased
profitability. In addition, late arrivals was also statistically
significant and negative, meaning increases in late arrivals
decreased profitability, but only at a 10% level. There were also
differences between full service airlines and focused (low cost)
airlines. For full service airlines, only the operational
performance indicators, load factor and fleet factor, were
significant and positive, and late arrivals was statistically significant and negative for focused airlines.
A 2010 paper by E. Suryani et al. published in Expert Systems
with Applications 37 predicted air passenger demand for the
purpose of developing policy related to runway and passenger
terminal expansion. In forecasting air passenger demand, they
concluded GDP growth and population to have positive impacts
on demand and airfare impact and level of service have negative
impacts on demand. They defined level of service in this study
as the change of demand that results from a change in travel
time times the time elasticity of demand. Due to the negative
time elasticity of demand, an increase in this metric results in
lower demand, and thus has a negative value in the analysis.
This conclusion show airline demand is cyclical in nature,
following typical economic cycles.
Despite demand being cyclical, Liehr et al. published a paper
called Cycles in the sky: understanding and managing business
cycles in the airline market in 2001 that shows the profitability
cycles of airlines are impacted by endogenous factors. They
show that several operational factors within the industry are
main causes of the cyclicality of the industry and the exogenous
factors such as GDP and population growth are only responsible
for the amplitude of the cycles, not the cycles themselves. The
first factor is aircraft ordering. In attempts to grow market
share, airlines need to grow capacity; however with fluctuating
market conditions, growing capacity can lead to capacity
4
surpluses and thus lower margins. To manage this cycle, the
authors suggest that “counter-cycle ordering yields several
advantages for a single carrier…” and that “the objective is to
ensure a quasi-continuous inflow and outflow of aircrafts,
regardless of fluctuations in the market. This includes leasing
over-capacities to other airlines”. In addition to aircraft
ordering to manage the business cycle, the authors show that
shifting capacities from areas of low demand to areas of high
demand help to manage over-capacity. In conclusion, this paper
shows that the business cycles observed in the airlines industry
are caused by improper managing of demand and successful
airlines can manage operational activities to smooth out
cyclicality in profits.
S.Y. Abed et al. published a study in 2001 that was conducted to
forecast air traffic demand in Saudi Arabia to advise regulatory
agencies and airlines predict demand. Over the period of 1971
to 1994, they considered 16 independent variables as
determinates of demand. They concluded that the best model to
predict demand included population size and total
expenditures, a figure very highly correlated with GDP that
represents total expenditures, government and private,
including investment expenditures.
5
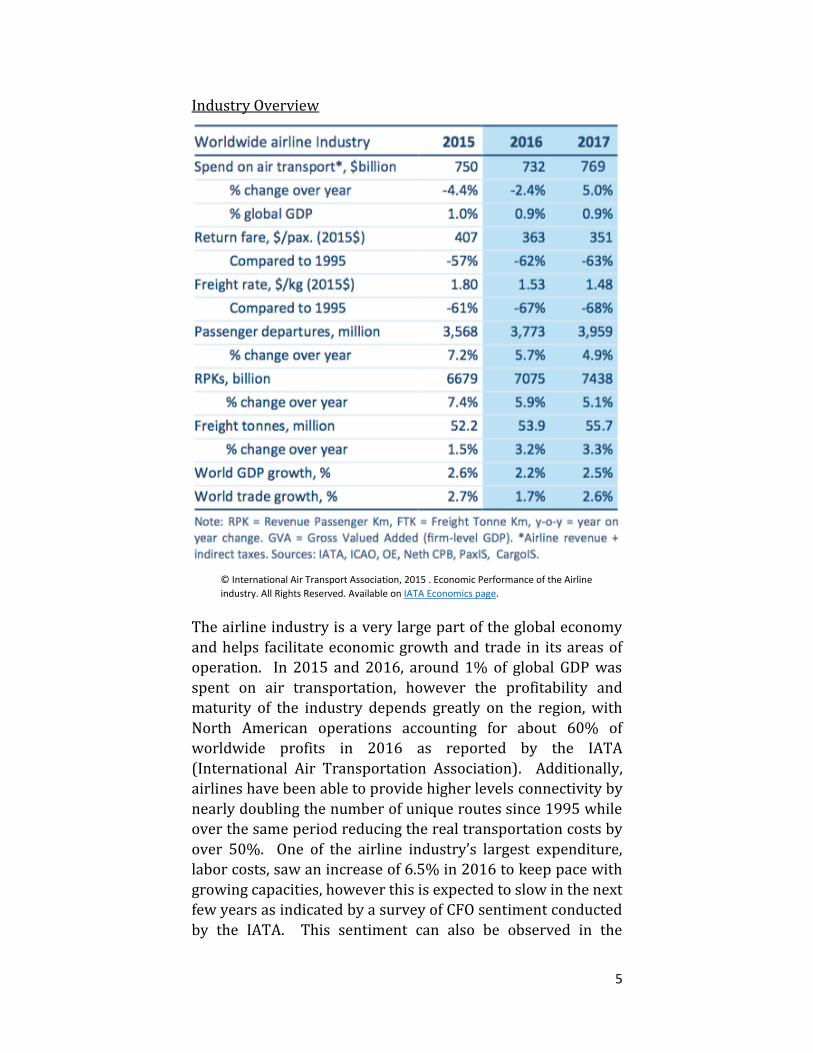
Industry Overview
The airline industry is a very large part of the global economy
and helps facilitate economic growth and trade in its areas of
operation. In 2015 and 2016, around 1% of global GDP was
spent on air transportation, however the profitability and
maturity of the industry depends greatly on the region, with
North American operations accounting for about 60% of
worldwide profits in 2016 as reported by the IATA
(International Air Transportation Association). Additionally,
airlines have been able to provide higher levels connectivity by
nearly doubling the number of unique routes since 1995 while
over the same period reducing the real transportation costs by
over 50%. One of the airline industry’s largest expenditure,
labor costs, saw an increase of 6.5% in 2016 to keep pace with
growing capacities, however this is expected to slow in the next
few years as indicated by a survey of CFO sentiment conducted
by the IATA. This sentiment can also be observed in the
© International Air Transport Association, 2015 . Economic Performance of the Airline
industry. All Rights Reserved. Available on IATA Economics page.
6
ordering of new aircraft as they outpaced demand growth with
fleet capacity growth in 2016, but this trend is expected to reverse in 2017.
The airline industry faces several large risks, including
terrorism, effects of potential crashes, employee relations,
heavy regulation by the FAA and DOT, foreign exchange
fluctuations, weather, and overall economic risk. While these
types are risks are found in many other industries, the airlines
are especially susceptible to these. For example, after the
terrorist attacks of 9/11, the industry saw an initial shock
decline of 37.8% in demand and a lasting effect of 7.4%
according to a 2005 paper by Harumi Itoa and Darin Lee.
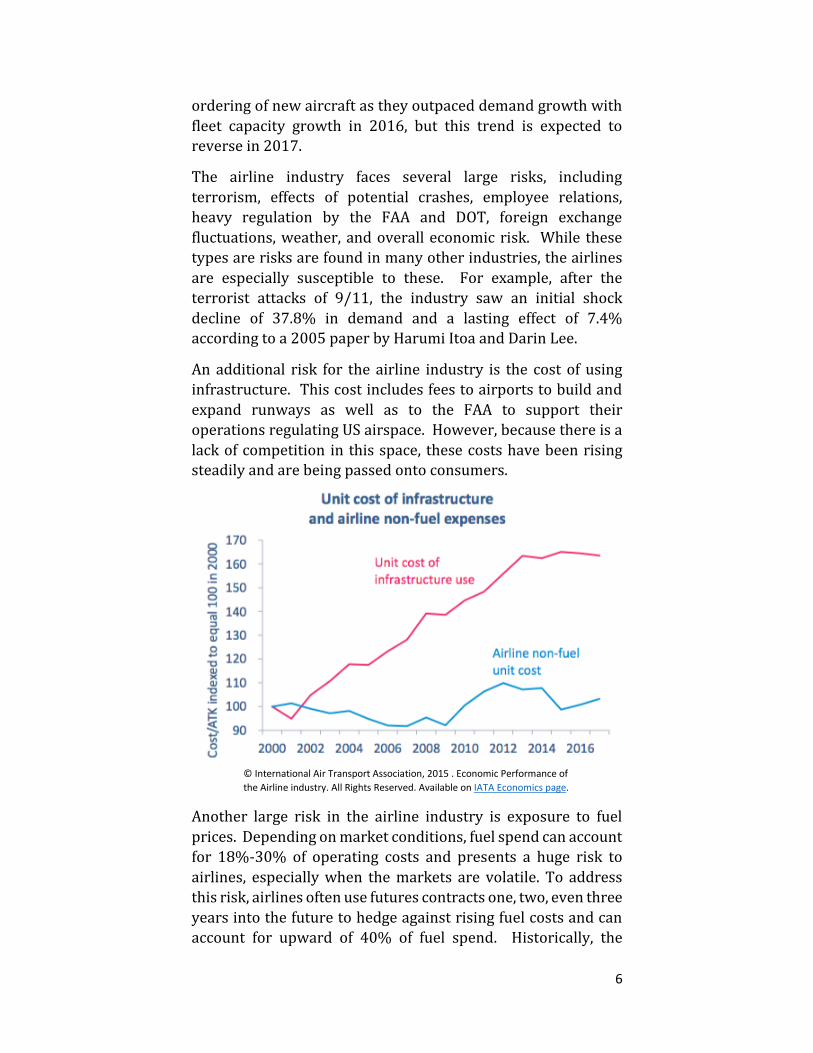
An additional risk for the airline industry is the cost of using
infrastructure. This cost includes fees to airports to build and
expand runways as well as to the FAA to support their
operations regulating US airspace. However, because there is a
lack of competition in this space, these costs have been rising steadily and are being passed onto consumers.
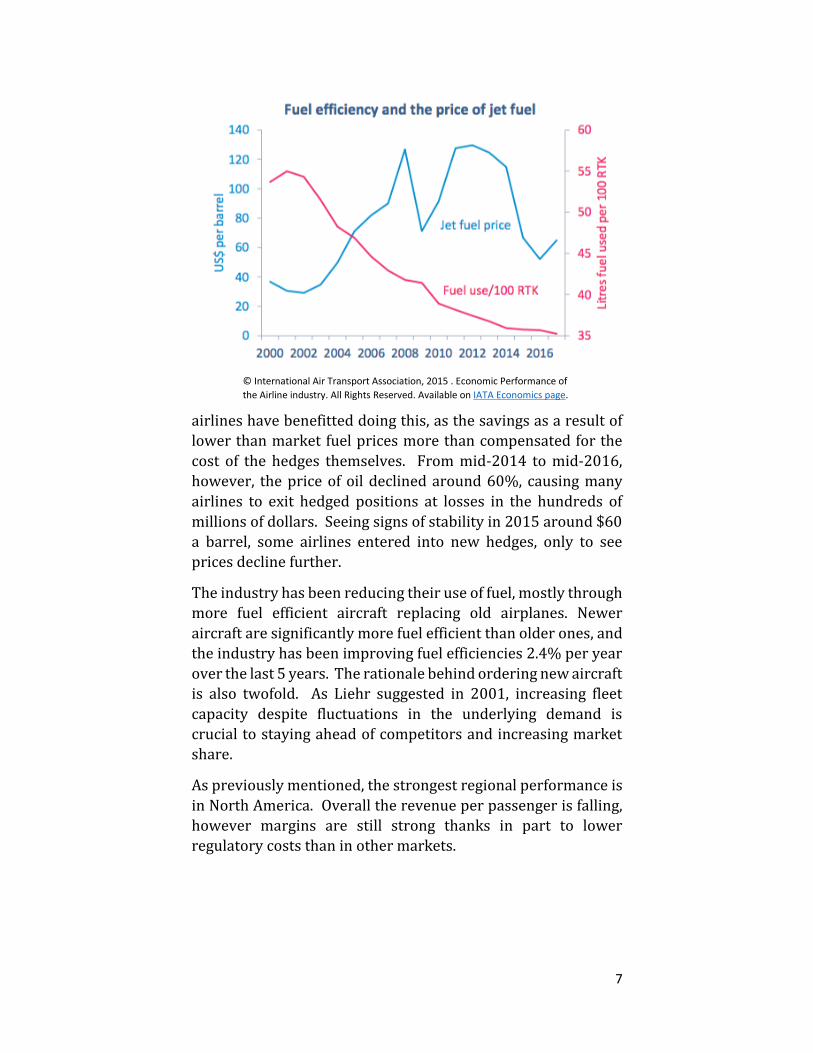
Another large risk in the airline industry is exposure to fuel
prices. Depending on market conditions, fuel spend can account
for 18%-30% of operating costs and presents a huge risk to
airlines, especially when the markets are volatile. To address
this risk, airlines often use futures contracts one, two, even three
years into the future to hedge against rising fuel costs and can
account for upward of 40% of fuel spend. Historically, the
© International Air Transport Association, 2015 . Economic Performance of
the Airline industry. All Rights Reserved. Available on IATA Economics page.
7
airlines have benefitted doing this, as the savings as a result of
lower than market fuel prices more than compensated for the
cost of the hedges themselves. From mid-2014 to mid-2016,
however, the price of oil declined around 60%, causing many
airlines to exit hedged positions at losses in the hundreds of
millions of dollars. Seeing signs of stability in 2015 around $60
a barrel, some airlines entered into new hedges, only to see
prices decline further.
The industry has been reducing their use of fuel, mostly through
more fuel efficient aircraft replacing old airplanes. Newer
aircraft are significantly more fuel efficient than older ones, and
the industry has been improving fuel efficiencies 2.4% per year
over the last 5 years. The rationale behind ordering new aircraft
is also twofold. As Liehr suggested in 2001, increasing fleet
capacity despite fluctuations in the underlying demand is
crucial to staying ahead of competitors and increasing market
share.
As previously mentioned, the strongest regional performance is
in North America. Overall the revenue per passenger is falling,
however margins are still strong thanks in part to lower
regulatory costs than in other markets.
© International Air Transport Association, 2015 . Economic Performance of
the Airline industry. All Rights Reserved. Available on IATA Economics page.
8
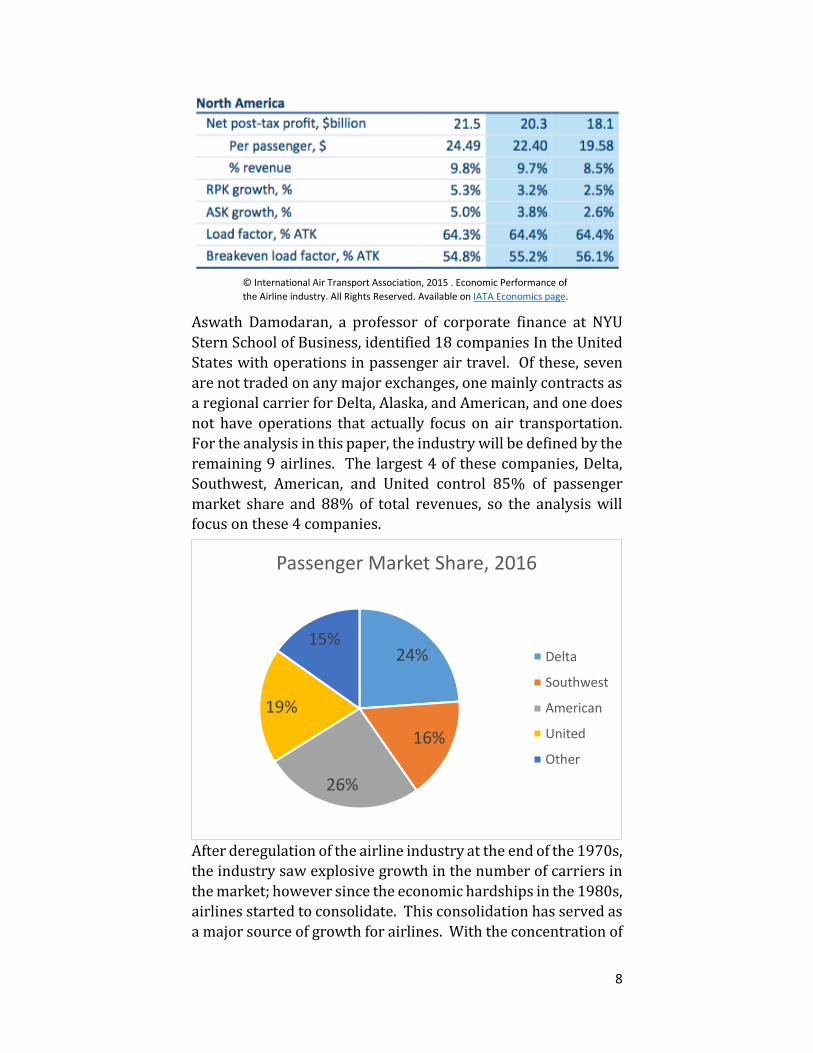
Aswath Damodaran, a professor of corporate finance at NYU
Stern School of Business, identified 18 companies In the United
States with operations in passenger air travel. Of these, seven
are not traded on any major exchanges, one mainly contracts as
a regional carrier for Delta, Alaska, and American, and one does
not have operations that actually focus on air transportation.
For the analysis in this paper, the industry will be defined by the
remaining 9 airlines. The largest 4 of these companies, Delta,
Southwest, American, and United control 85% of passenger
market share and 88% of total revenues, so the analysis will focus on these 4 companies.
After deregulation of the airline industry at the end of the 1970s,
the industry saw explosive growth in the number of carriers in
the market; however since the economic hardships in the 1980s,
airlines started to consolidate. This consolidation has served as
a major source of growth for airlines. With the concentration of
24%
16%
26%
19%
15%
Passenger Market Share, 2016
Delta
Southwest
American
United
Other
© International Air Transport Association, 2015 . Economic Performance of
the Airline industry. All Rights Reserved. Available on IATA Economics page.
9
passengers and revenues skewed toward a small number of
firms in the domestic market, it is uncertain if future
consolidations will be a reliable source of domestic growth for
the large airlines.
To understand how these companies are valued in light of the
effectiveness of their operational and financial performance, I
will compare valuation methods within each company and
across the industry. I will use valuation multiples in addition to
a discounted cash flow model, taking into account operational
metrics and company initiatives, to arrive at these values. The
two multiples I will use are Enterprise Value/EBITDA and
Enterprise Value/EBIT. These two metrics value companies
based on their operating profitability before taking into account
the capital structures and differ with the effects of depreciation
and amortization.
Assumptions common for all DCF models:
• Given the studies by S.Y. Abed et al. and E. Suryani et al.,
the long term growth rates for determining the terminal
values are based on estimated long term GDP growth
rates. The expected domestic growth rate as reported by
tradingeconomics.com in 2020 is 2.6% and international
GDP growth estimates are higher, at 3.6% in 2018 as
reported by the International Monetary Fund’s World
Economic Outlook report in January 2017. A
combination of the domestic and international estimates
are used for each company in proportion to their
domestic/foreign exposure.
• The EIA projects Brent Crude oil prices to rise into the
upper $50s by 2018 whereas tradingeconomics.com
projects in the lower $50s in 2018 with a decline into the
low $40s using only ARIMA models. Given ARIMA
models weaknesses for projecting more than a few
periods into the future and level of economic input used
by the EIA, I anticipate rising jet fuel prices closer in line
with EIA projections meaning jet fuel spot prices 10%-
15% higher than current levels.
• Without additional knowledge, I will project other levels
at their 3 year average or 2106 levels, whichever is appropriate.
10
For the analysis, I created a discounted cash flow model to value
the companies. A discounted cash flow model derives the value
by projecting revenues, expenses, capital expenditures, net
working capital and other items into the future in order to
calculate free cash flows and discount them at the company’s
weighted average cost of capital. I will walk through the
assumptions I made for Delta, and the same process extends to
all 4 airlines.
The items that are needed to project free cash flows are the
operating revenues and expenses, current assets, current
liabilities, capital expenditures, and debt. Revenue accounts are
projected using growth rates, depreciation and amortization is
projected as a percent of capital expenditures, taxes are
calculated as a percent of EBIT, accounts receivable are
projected as days sales outstanding, and other accounts are projected as a percent of sales.
• Given Delta’s new antitrust immunized joint ventures in
Europe, their existing antitrust immunized agreements
in Asia, new joint ventures with Aeromexico and Korean
Air, I expect Delta to grow passenger revenues at 2.5% in
2017, 3.5% in 2018-2019, and slow to 3% in 2020 and
2021. Given the assumptions above and the fact they
receive about 30% of their revenues internationally, a
long term growth rate of 2.9% is assumed for the
constant growth beyond 2021.
• Salaries are Delta’s single largest expense, representing
25% of sales in 2016. Delta re-negotiated contracts with
labor unions who represent around 80% of their
employees and resulted in large raises for their
employees. Because of this, I project salaries to remain
at 25% of sales, over the 22% average for the past 3
years.
• Fuel expenditures are at a low as a percent of sales,
declining from 29% in 2014 to 13% in 2016. With the
sentiment that fuel prices will begin to rise in the future,
I expect their fuel costs to rise 15% in 2019 and remain
at those levels.
• I project net working capital levels as well as capital
expenditure levels to remain at current levels, as the
company did not highlight any specific initiatives that
would change them. Currently, they are not accelerating
11
the retirement of old aircraft and will continue to replace
them at similar rates.
After projecting the relevant accounts, operating income is
calculated. Taxes are then subtracted to arrive at net operating
profit after taxes or NOPAT. Depreciation and amortization are
then added back, as they are non-cash expenses that lower
taxable income but do not represent a cash outflow. Finally,
capital expenditures and change in net working capital are
added back to calculate unlevered free cash flows. These cash
flows represent the cash generated by the company after
accounting for the operations of the business, capital
expenditures and working capital required to maintain the
business, and before any interest payments on debt. This means
it is a representation of the cash generated for distribution to
debt and equity investors and is important for investors to determine possible return on their investment.
In order to find the value of the enterprise, I discount the free
cash flows at the company’s weighted average cost of capital. I
assume that Delta is going to continue operating forever, but
need to calculate a terminal value to their FCFs in order to
actually discount these future cash flows. For this, I use a
constant growth rate that projects the value of all future cash
flows based on the last year of projections in my model, 2021.
By adding the NPV of the FCFs to the NPV of the terminal value,
I arrive at the enterprise value, or the total value of the firm. To
find the equity value, I subtract total debt and add cash, then
divide by the number of shares outstanding to arrive at the price
per share. Because of the sensitivity of the DCF model to
assumptions made in projecting free cash flow, a sensitivity
analysis is created to test the effects of different long term
growth rates and WACCs. This provides a range of values one could reasonably expect given the assumptions made.
I then compare this value to the value found using a multiples
approach. EV/EBIT and EV/EDITDA provide a market based
approach to value companies and are useful for comparing the
value of companies over a range of multiples rather than just the
industry average. EV/EBITDA serves as a standard valuation
free of the effects of capital structure, taxes, and depreciation
whereas EV/EBIT takes into account depreciation. Airlines
have large capital expenditures, so accounting for the effects of
that by using EV/EBIT together with EV/EBITDA should

12
provide a better valuation. For the airlines, I calculated the
average EV/EBITDA ratio to be 5.40 with a standard deviation
of 0.74 and the average EV/EBIT ratio to be 7.28 with a standard
deviation of 0.99, creating the ranges I will use to value them.
The results of these valuations can be seen in the football field
charts in the analysis section.
13
Ticker: DAL
Year: 2016
Company Description: Market Cap 12-30-16
36,223
Market Share 2016
Passengers:
24%
Revenues:
25%
Major Threats:
Load Factor
84.6
Operating Profit per ASM
Major Advantages: 0.43
Growth Cash Flows
DAL Industry Average DAL Industry Average
Sales Growth -2.6% 2.2% Capex/Sales 8.6% 12.6%
Net Income Growth -3.4% 2.4% FCF Margin 9.6% 7.5%
Efficiency Ratios Valuation
DAL Industry Average DAL Industry Average
Days Sales Outstanding 18.8 11.56 P/E Ratio 9.25 11.05
Days Inventory 18.18 15.16 Price to Book 2.93 3.83
Payables Period 60.85 31.25 Price to Sales 0.93 1.30
Divd Yield 1.06 0.64
Profitability 2016 Liquidity Ratios
DAL Industry Average DAL Industry Average
EBITDA Margin 22% 24% Current Ratio 0.49 0.87
Operating Margin 18% 18% Quick Ratio 0.35 0.73
ROA 8.38 8.95 Financial Leverage 4.17 4.52
ROE 37.80 35.01 Debt/Equity 0.5 1.34
ROIC 22.54 17.28
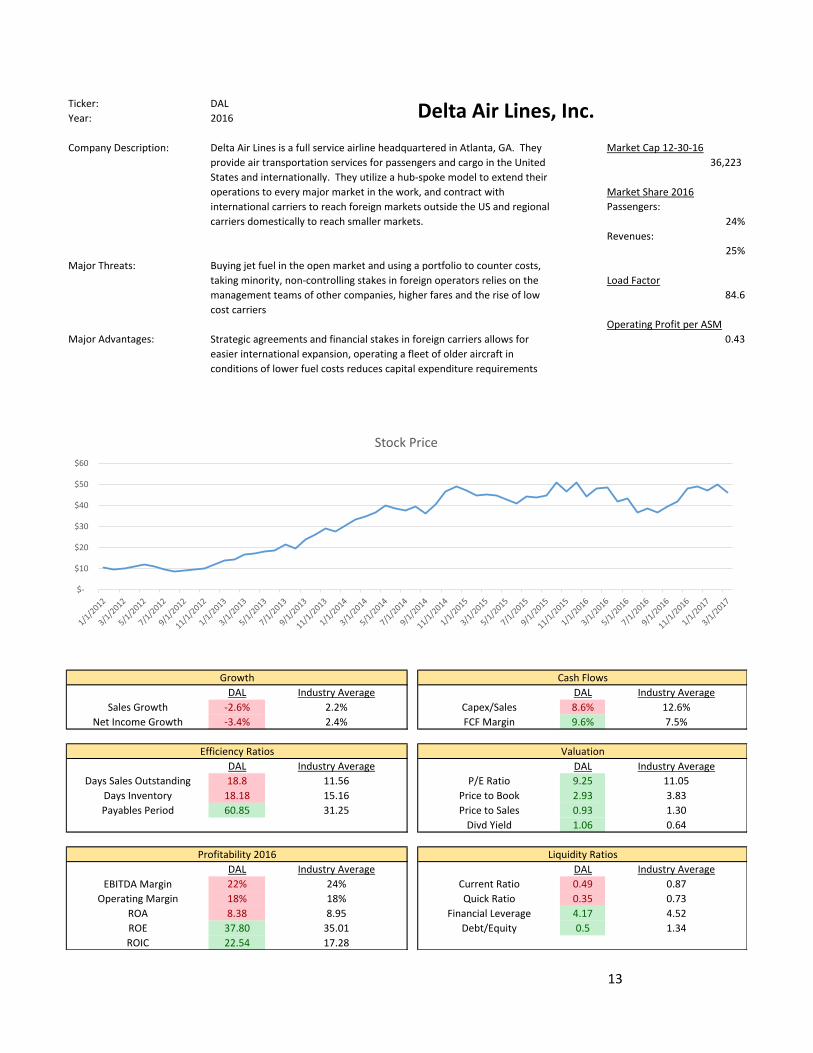
Delta Air Lines, Inc.
Delta Air Lines is a full service airline headquartered in Atlanta, GA. They
provide air transportation services for passengers and cargo in the United
States and internationally. They utilize a hub-spoke model to extend their
operations to every major market in the work, and contract with
international carriers to reach foreign markets outside the US and regional
carriers domestically to reach smaller markets.
Buying jet fuel in the open market and using a portfolio to counter costs,
taking minority, non-controlling stakes in foreign operators relies on the
management teams of other companies, higher fares and the rise of low
cost carriers
Strategic agreements and financial stakes in foreign carriers allows for
easier international expansion, operating a fleet of older aircraft in
conditions of lower fuel costs reduces capital expenditure requirements
$-
$10
$20
$30
$40
$50
$60
Stock Price
14
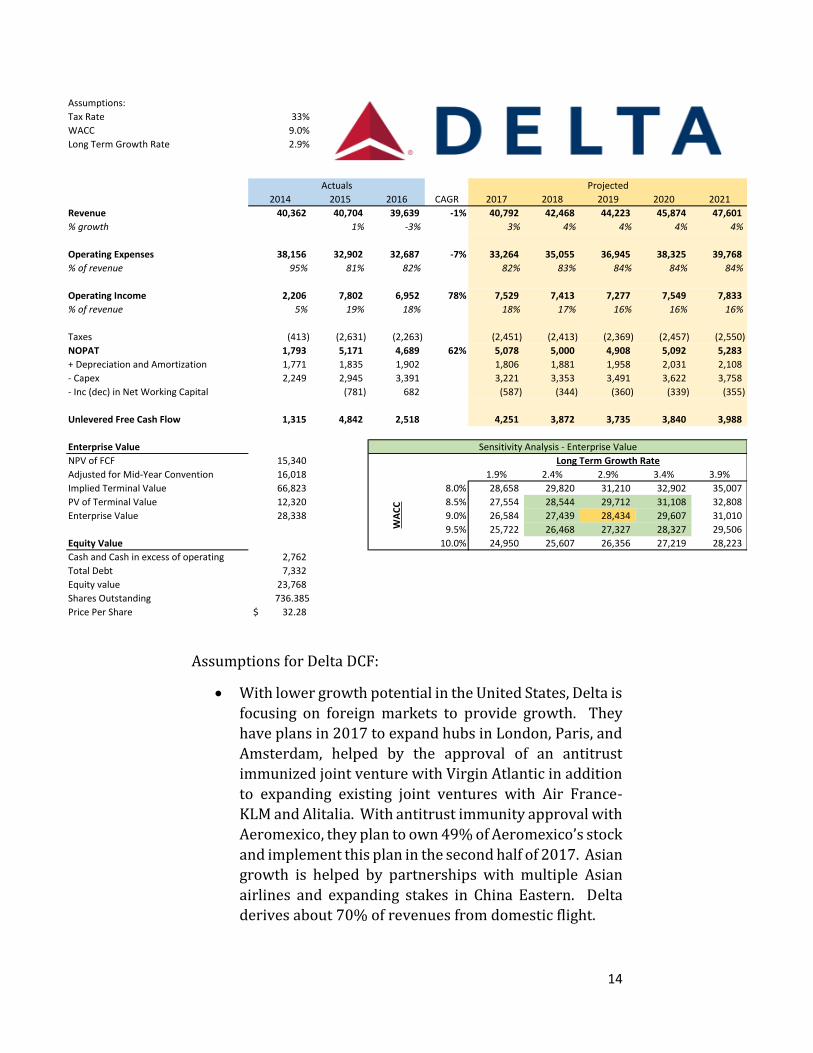
Assumptions for Delta DCF:
• With lower growth potential in the United States, Delta is
focusing on foreign markets to provide growth. They
have plans in 2017 to expand hubs in London, Paris, and
Amsterdam, helped by the approval of an antitrust
immunized joint venture with Virgin Atlantic in addition
to expanding existing joint ventures with Air France-
KLM and Alitalia. With antitrust immunity approval with
Aeromexico, they plan to own 49% of Aeromexico’s stock
and implement this plan in the second half of 2017. Asian
growth is helped by partnerships with multiple Asian
airlines and expanding stakes in China Eastern. Delta
derives about 70% of revenues from domestic flight.
Assumptions:
Tax Rate 33%
WACC 9.0%
Long Term Growth Rate 2.9%
2014 2015 2016 CAGR 2017 2018 2019 2020 2021
Revenue 40,362 40,704 39,639 -1% 40,792 42,468 44,223 45,874 47,601
% growth 1% -3% 3% 4% 4% 4% 4%
Operating Expenses 38,156 32,902 32,687 -7% 33,264 35,055 36,945 38,325 39,768
% of revenue 95% 81% 82% 82% 83% 84% 84% 84%
Operating Income 2,206 7,802 6,952 78% 7,529 7,413 7,277 7,549 7,833
% of revenue 5% 19% 18% 18% 17% 16% 16% 16%
Taxes (413) (2,631) (2,263) (2,451) (2,413) (2,369) (2,457) (2,550)
NOPAT 1,793 5,171 4,689 62% 5,078 5,000 4,908 5,092 5,283
+ Depreciation and Amortization 1,771 1,835 1,902 1,806 1,881 1,958 2,031 2,108
- Capex 2,249 2,945 3,391 3,221 3,353 3,491 3,622 3,758
- Inc (dec) in Net Working Capital (781) 682 (587) (344) (360) (339) (355)
Unlevered Free Cash Flow 1,315 4,842 2,518 4,251 3,872 3,735 3,840 3,988
Enterprise Value Sensitivity Analysis - Enterprise Value
NPV of FCF 15,340 Long Term Growth Rate
Adjusted for Mid-Year Convention 16,018 28,338 1.9% 2.4% 2.9% 3.4% 3.9%
Implied Terminal Value 66,823 8.0% 28,658 29,820 31,210 32,902 35,007
PV of Terminal Value 12,320 8.5% 27,554 28,544 29,712 31,108 32,808
Enterprise Value 28,338 9.0% 26,584 27,439 28,434 29,607 31,010
9.5% 25,722 26,468 27,327 28,327 29,506
Equity Value 10.0% 24,950 25,607 26,356 27,219 28,223
Cash and Cash in excess of operating 2,762
Total Debt 7,332
Equity value 23,768
Shares Outstanding 736.385
Price Per Share 32.28$
Actuals Projected
WA
CC
15
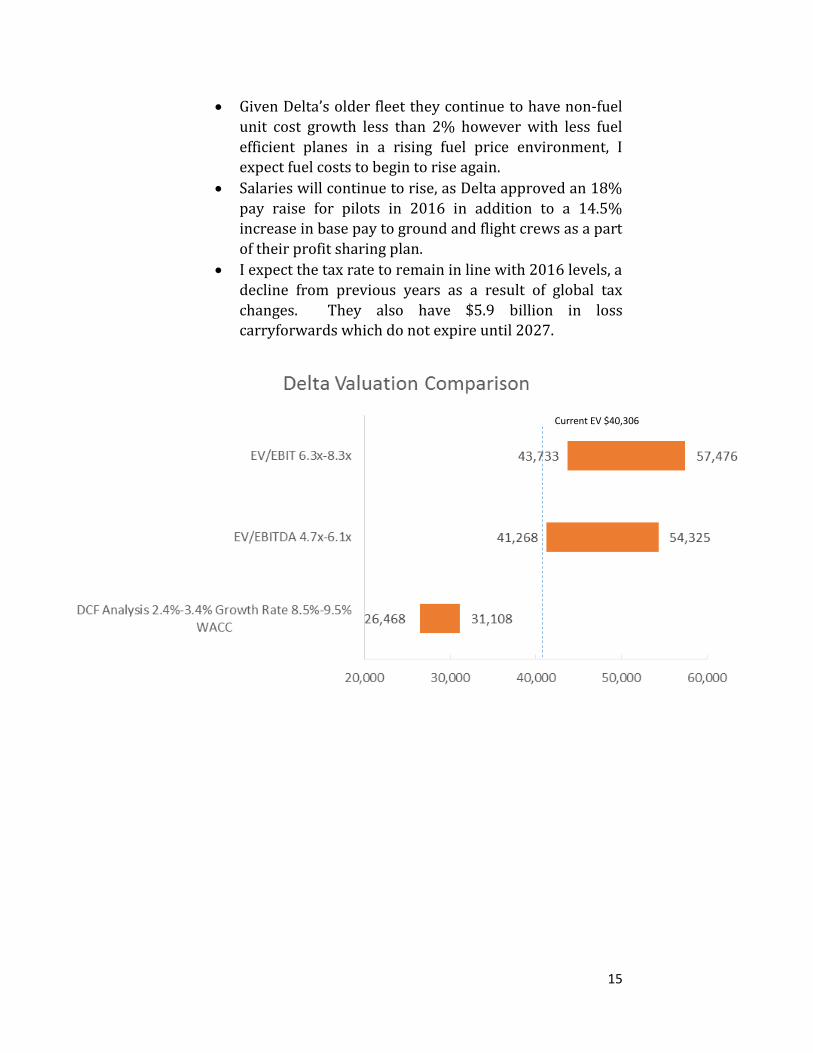
• Given Delta’s older fleet they continue to have non-fuel
unit cost growth less than 2% however with less fuel
efficient planes in a rising fuel price environment, I
expect fuel costs to begin to rise again.
• Salaries will continue to rise, as Delta approved an 18%
pay raise for pilots in 2016 in addition to a 14.5%
increase in base pay to ground and flight crews as a part
of their profit sharing plan.
• I expect the tax rate to remain in line with 2016 levels, a
decline from previous years as a result of global tax
changes. They also have $5.9 billion in loss
carryforwards which do not expire until 2027.
Current EV $40,306
16
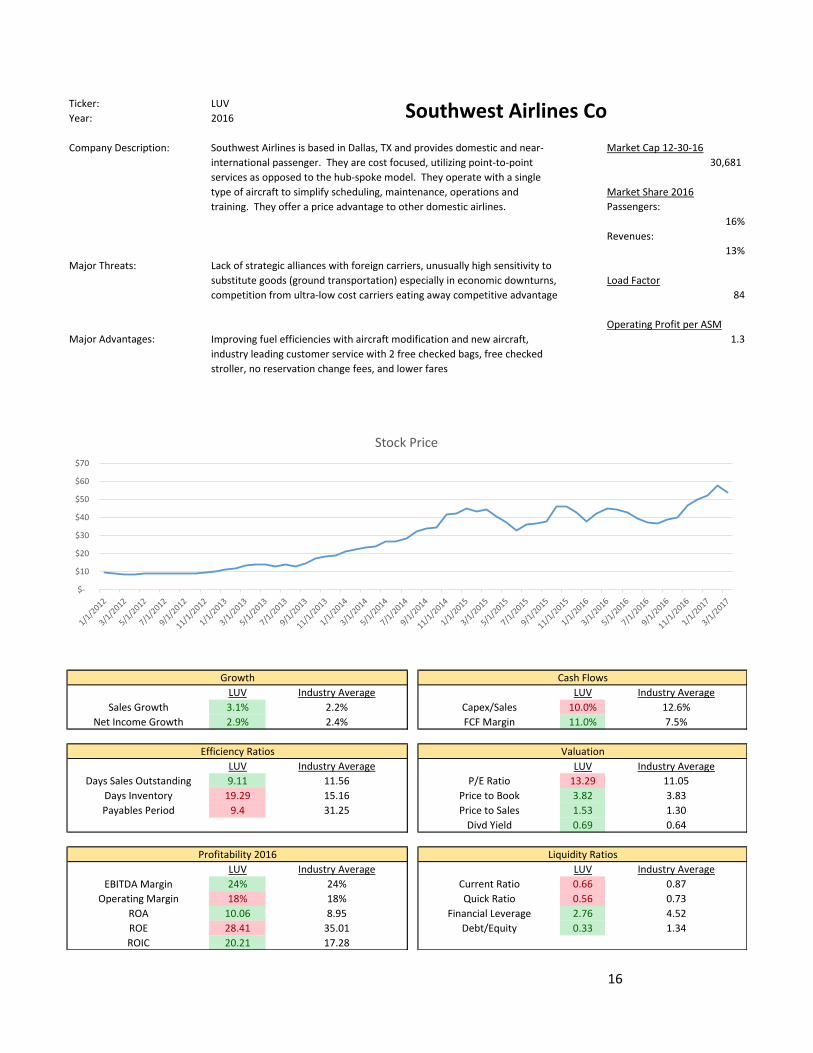
Ticker: LUV
Year: 2016
Company Description: Market Cap 12-30-16
30,681
Market Share 2016
Passengers:
16%
Revenues:
13%
Major Threats:
Load Factor
84
Operating Profit per ASM
Major Advantages: 1.3
Growth Cash Flows
LUV Industry Average LUV Industry Average
Sales Growth 3.1% 2.2% Capex/Sales 10.0% 12.6%
Net Income Growth 2.9% 2.4% FCF Margin 11.0% 7.5%
Efficiency Ratios Valuation
LUV Industry Average LUV Industry Average
Days Sales Outstanding 9.11 11.56 P/E Ratio 13.29 11.05
Days Inventory 19.29 15.16 Price to Book 3.82 3.83
Payables Period 9.4 31.25 Price to Sales 1.53 1.30
Divd Yield 0.69 0.64
Profitability 2016 Liquidity Ratios
LUV Industry Average LUV Industry Average
EBITDA Margin 24% 24% Current Ratio 0.66 0.87
Operating Margin 18% 18% Quick Ratio 0.56 0.73
ROA 10.06 8.95 Financial Leverage 2.76 4.52
ROE 28.41 35.01 Debt/Equity 0.33 1.34
ROIC 20.21 17.28
Southwest Airlines Co
Southwest Airlines is based in Dallas, TX and provides domestic and near-
international passenger. They are cost focused, utilizing point-to-point
services as opposed to the hub-spoke model. They operate with a single
type of aircraft to simplify scheduling, maintenance, operations and
training. They offer a price advantage to other domestic airlines.
Lack of strategic alliances with foreign carriers, unusually high sensitivity to
substitute goods (ground transportation) especially in economic downturns,
competition from ultra-low cost carriers eating away competitive advantage
Improving fuel efficiencies with aircraft modification and new aircraft,
industry leading customer service with 2 free checked bags, free checked
stroller, no reservation change fees, and lower fares
$-
$10
$20
$30
$40
$50
$60
$70
Stock Price
17
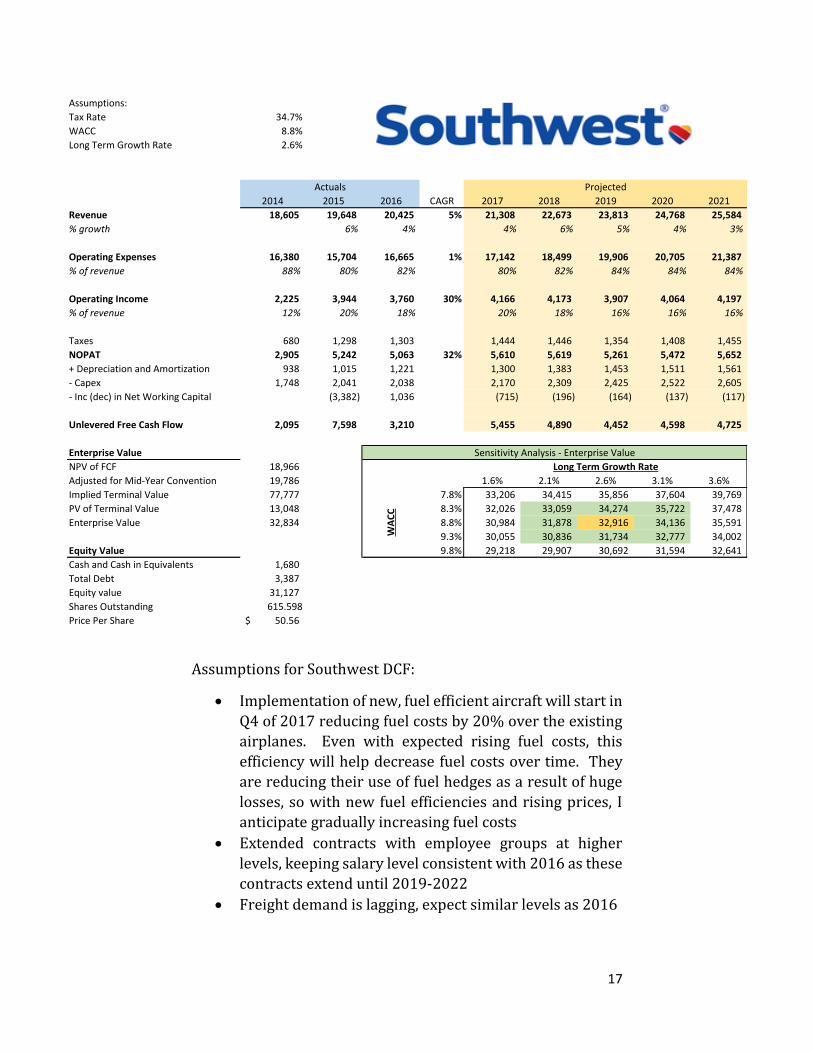
Assumptions for Southwest DCF:
• Implementation of new, fuel efficient aircraft will start in
Q4 of 2017 reducing fuel costs by 20% over the existing
airplanes. Even with expected rising fuel costs, this
efficiency will help decrease fuel costs over time. They
are reducing their use of fuel hedges as a result of huge
losses, so with new fuel efficiencies and rising prices, I
anticipate gradually increasing fuel costs
• Extended contracts with employee groups at higher
levels, keeping salary level consistent with 2016 as these
contracts extend until 2019-2022
• Freight demand is lagging, expect similar levels as 2016
Assumptions:
Tax Rate 34.7%
WACC 8.8%
Long Term Growth Rate 2.6%
2014 2015 2016 CAGR 2017 2018 2019 2020 2021
Revenue 18,605 19,648 20,425 5% 21,308 22,673 23,813 24,768 25,584
% growth 6% 4% 4% 6% 5% 4% 3%
Operating Expenses 16,380 15,704 16,665 1% 17,142 18,499 19,906 20,705 21,387
% of revenue 88% 80% 82% 80% 82% 84% 84% 84%
Operating Income 2,225 3,944 3,760 30% 4,166 4,173 3,907 4,064 4,197
% of revenue 12% 20% 18% 20% 18% 16% 16% 16%
Taxes 680 1,298 1,303 1,444 1,446 1,354 1,408 1,455
NOPAT 2,905 5,242 5,063 32% 5,610 5,619 5,261 5,472 5,652
+ Depreciation and Amortization 938 1,015 1,221 1,300 1,383 1,453 1,511 1,561
- Capex 1,748 2,041 2,038 2,170 2,309 2,425 2,522 2,605
- Inc (dec) in Net Working Capital (3,382) 1,036 (715) (196) (164) (137) (117)
Unlevered Free Cash Flow 2,095 7,598 3,210 5,455 4,890 4,452 4,598 4,725
Enterprise Value Sensitivity Analysis - Enterprise Value
NPV of FCF 18,966 Long Term Growth Rate
Adjusted for Mid-Year Convention 19,786 32,834 1.6% 2.1% 2.6% 3.1% 3.6%
Implied Terminal Value 77,777 7.8% 33,206 34,415 35,856 37,604 39,769
PV of Terminal Value 13,048 8.3% 32,026 33,059 34,274 35,722 37,478
Enterprise Value 32,834 8.8% 30,984 31,878 32,916 34,136 35,591
9.3% 30,055 30,836 31,734 32,777 34,002
Equity Value 9.8% 29,218 29,907 30,692 31,594 32,641
Cash and Cash in Equivalents 1,680
Total Debt 3,387
Equity value 31,127
Shares Outstanding 615.598
Price Per Share 50.56$
Actuals Projected
WA
CC
18
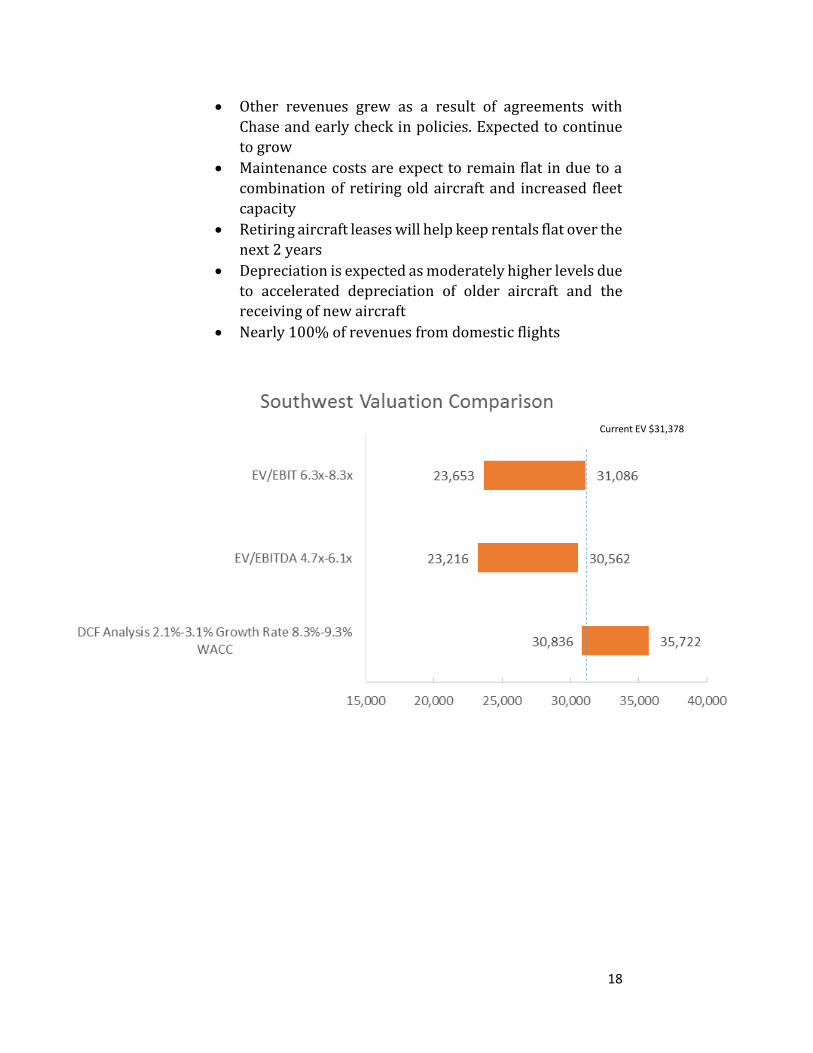
• Other revenues grew as a result of agreements with
Chase and early check in policies. Expected to continue
to grow
• Maintenance costs are expect to remain flat in due to a
combination of retiring old aircraft and increased fleet
capacity
• Retiring aircraft leases will help keep rentals flat over the
next 2 years
• Depreciation is expected as moderately higher levels due
to accelerated depreciation of older aircraft and the
receiving of new aircraft
• Nearly 100% of revenues from domestic flights
Current EV $31,378
19
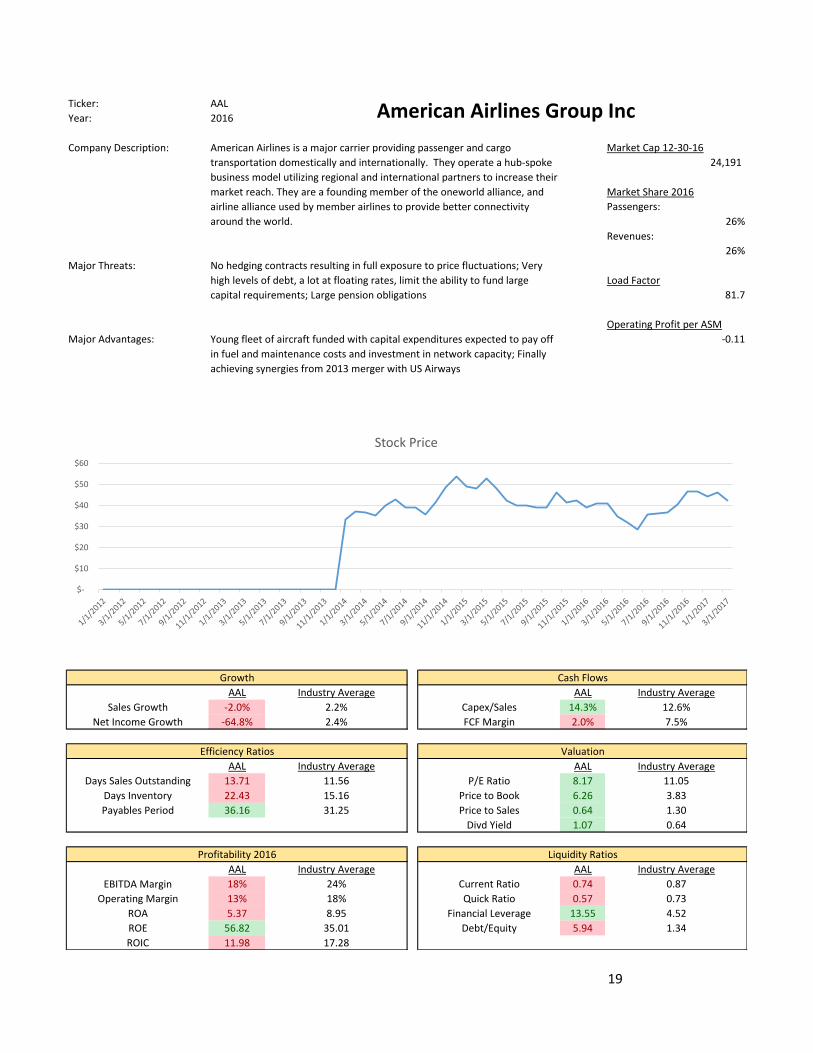
Ticker: AAL
Year: 2016
Company Description: Market Cap 12-30-16
24,191
Market Share 2016
Passengers:
26%
Revenues:
26%
Major Threats:
Load Factor
81.7
Operating Profit per ASM
Major Advantages: -0.11
Growth Cash Flows
AAL Industry Average AAL Industry Average
Sales Growth -2.0% 2.2% Capex/Sales 14.3% 12.6%
Net Income Growth -64.8% 2.4% FCF Margin 2.0% 7.5%
Efficiency Ratios Valuation
AAL Industry Average AAL Industry Average
Days Sales Outstanding 13.71 11.56 P/E Ratio 8.17 11.05
Days Inventory 22.43 15.16 Price to Book 6.26 3.83
Payables Period 36.16 31.25 Price to Sales 0.64 1.30
Divd Yield 1.07 0.64
Profitability 2016 Liquidity Ratios
AAL Industry Average AAL Industry Average
EBITDA Margin 18% 24% Current Ratio 0.74 0.87
Operating Margin 13% 18% Quick Ratio 0.57 0.73
ROA 5.37 8.95 Financial Leverage 13.55 4.52
ROE 56.82 35.01 Debt/Equity 5.94 1.34
ROIC 11.98 17.28
American Airlines Group Inc
American Airlines is a major carrier providing passenger and cargo
transportation domestically and internationally. They operate a hub-spoke
business model utilizing regional and international partners to increase their
market reach. They are a founding member of the oneworld alliance, and
airline alliance used by member airlines to provide better connectivity
around the world.
No hedging contracts resulting in full exposure to price fluctuations; Very
high levels of debt, a lot at floating rates, limit the ability to fund large
capital requirements; Large pension obligations
Young fleet of aircraft funded with capital expenditures expected to pay off
in fuel and maintenance costs and investment in network capacity; Finally
achieving synergies from 2013 merger with US Airways
$-
$10
$20
$30
$40
$50
$60
Stock Price
20
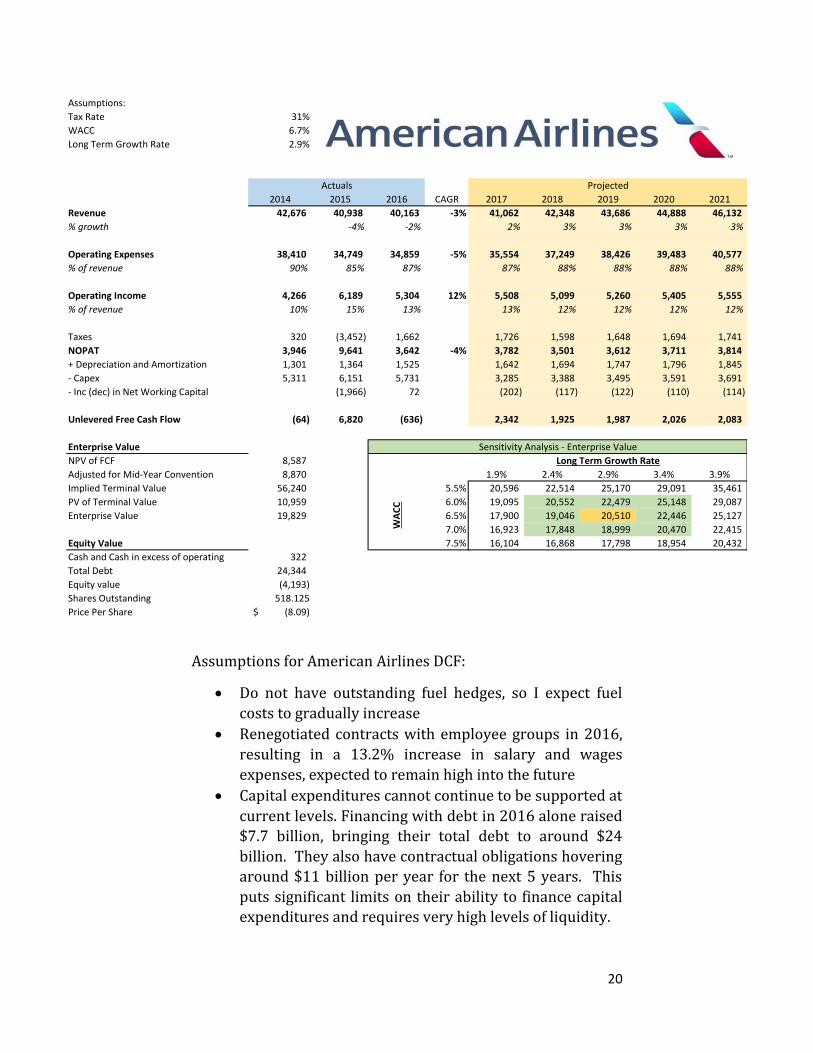
Assumptions for American Airlines DCF:
• Do not have outstanding fuel hedges, so I expect fuel
costs to gradually increase
• Renegotiated contracts with employee groups in 2016,
resulting in a 13.2% increase in salary and wages
expenses, expected to remain high into the future
• Capital expenditures cannot continue to be supported at
current levels. Financing with debt in 2016 alone raised
$7.7 billion, bringing their total debt to around $24
billion. They also have contractual obligations hovering
around $11 billion per year for the next 5 years. This
puts significant limits on their ability to finance capital
expenditures and requires very high levels of liquidity.
Assumptions:
Tax Rate 31%
WACC 6.7%
Long Term Growth Rate 2.9%
2014 2015 2016 CAGR 2017 2018 2019 2020 2021
Revenue 42,676 40,938 40,163 -3% 41,062 42,348 43,686 44,888 46,132
% growth -4% -2% 2% 3% 3% 3% 3%
Operating Expenses 38,410 34,749 34,859 -5% 35,554 37,249 38,426 39,483 40,577
% of revenue 90% 85% 87% 87% 88% 88% 88% 88%
Operating Income 4,266 6,189 5,304 12% 5,508 5,099 5,260 5,405 5,555
% of revenue 10% 15% 13% 13% 12% 12% 12% 12%
Taxes 320 (3,452) 1,662 1,726 1,598 1,648 1,694 1,741
NOPAT 3,946 9,641 3,642 -4% 3,782 3,501 3,612 3,711 3,814
+ Depreciation and Amortization 1,301 1,364 1,525 1,642 1,694 1,747 1,796 1,845
- Capex 5,311 6,151 5,731 3,285 3,388 3,495 3,591 3,691
- Inc (dec) in Net Working Capital (1,966) 72 (202) (117) (122) (110) (114)
Unlevered Free Cash Flow (64) 6,820 (636) 2,342 1,925 1,987 2,026 2,083
Enterprise Value Sensitivity Analysis - Enterprise Value
NPV of FCF 8,587 Long Term Growth Rate
Adjusted for Mid-Year Convention 8,870 19,829 1.9% 2.4% 2.9% 3.4% 3.9%
Implied Terminal Value 56,240 5.5% 20,596 22,514 25,170 29,091 35,461
PV of Terminal Value 10,959 6.0% 19,095 20,552 22,479 25,148 29,087
Enterprise Value 19,829 6.5% 17,900 19,046 20,510 22,446 25,127
7.0% 16,923 17,848 18,999 20,470 22,415
Equity Value 7.5% 16,104 16,868 17,798 18,954 20,432
Cash and Cash in excess of operating 322
Total Debt 24,344
Equity value (4,193)
Shares Outstanding 518.125
Price Per Share (8.09)$
Actuals Projected
WA
CC
21
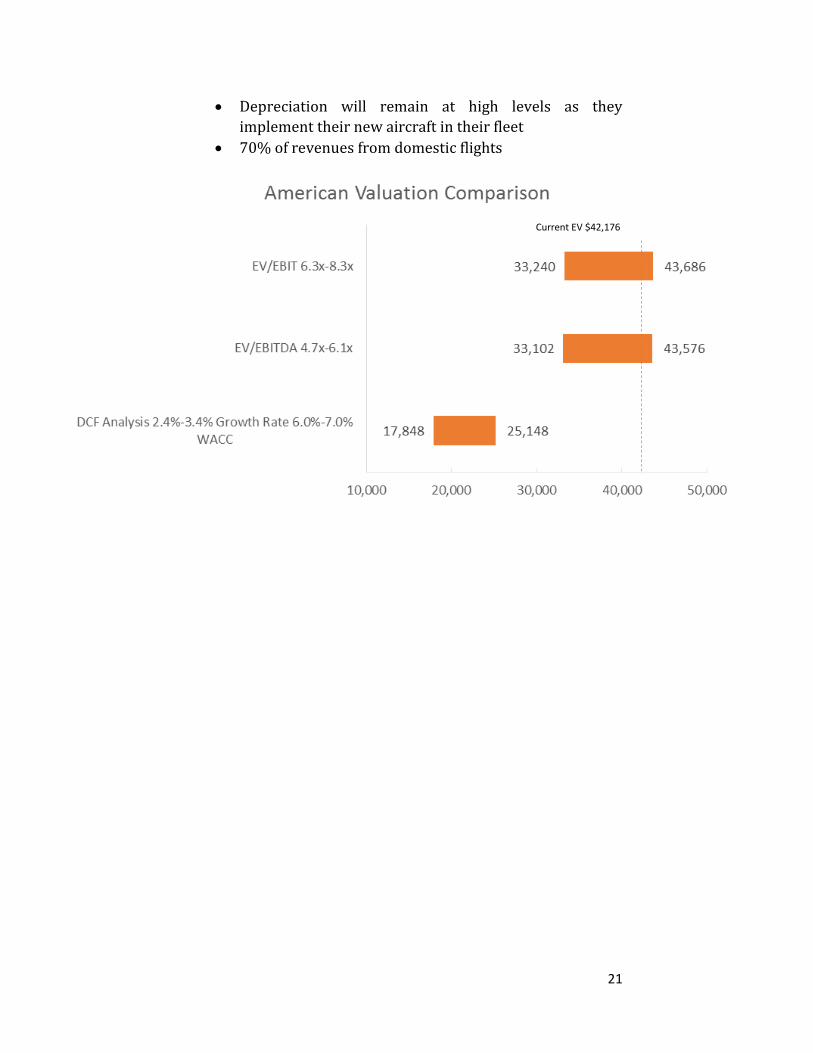
• Depreciation will remain at high levels as they
implement their new aircraft in their fleet
• 70% of revenues from domestic flights
Current EV $42,176

22
Ticker: UAL
Year: 2016
Company Description: Market Cap 12-30-16
23,124
Market Share 2016
Passengers:
19%
Revenues:
24%
Major Threats:
Load Factor
82.9
Operating Profit per ASM
Major Advantages: -0.3
Growth Cash Flows
UAL Industry Average UAL Industry Average
Sales Growth -3.5% 2.2% Capex/Sales 8.8% 12.6%
Net Income Growth -69.2% 2.4% FCF Margin 6.3% 7.5%
Efficiency Ratios Valuation
UAL Industry Average UAL Industry Average
Days Sales Outstanding 11.64 11.56 P/E Ratio 8.55 11.05
Days Inventory 23.33 15.16 Price to Book 2.65 3.83
Payables Period 58.03 31.25 Price to Sales 0.66 1.30
Divd Yield 0.00 0.64
Profitability 2016 Liquidity Ratios
UAL Industry Average UAL Industry Average
EBITDA Margin 17% 24% Current Ratio 0.59 0.87
Operating Margin 12% 18% Quick Ratio 0.46 0.73
ROA 5.59 8.95 Financial Leverage 4.64 4.52
ROE 25.68 35.01 Debt/Equity 1.24 1.34
ROIC 12.48 17.28
United Continental Holdings, Inc.
United Continental Holdings is a holding company based in Chicago, IL.
They operate United Airlines in addition to regional connections under the
name of United Express using a hub-spoke model. In 2016, 60% of their
revenues were from domestic flights. As a member of Star Alliance, they
are a part of the largest airline alliance in the world, servicing 1300 airports
in 190 countries.
Not currently hedging fuel prices; Commitments to purchase new aircraft
and parts total $23.6 billion; Large debt obligations require large cash
holdings and risks liquidity in the event of an economic downturn
Negotiated with all 11 labor groups, extending terms 2019-2022 making it
easier to predict labor costs; Newer aircraft and modernization of fleet will
help reduce fuel and maintenance costs
$-
$10
$20
$30
$40
$50
$60
$70
$80
Stock Price
23
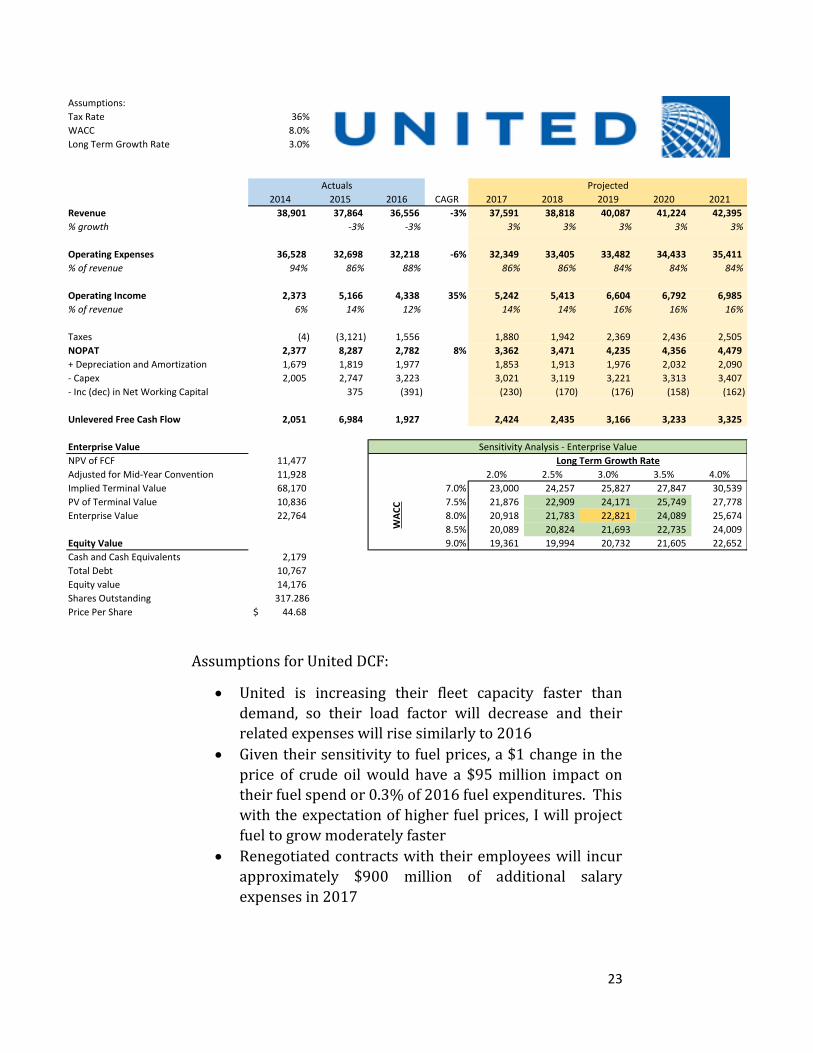
Assumptions for United DCF:
• United is increasing their fleet capacity faster than
demand, so their load factor will decrease and their
related expenses will rise similarly to 2016
• Given their sensitivity to fuel prices, a $1 change in the
price of crude oil would have a $95 million impact on
their fuel spend or 0.3% of 2016 fuel expenditures. This
with the expectation of higher fuel prices, I will project
fuel to grow moderately faster
• Renegotiated contracts with their employees will incur
approximately $900 million of additional salary
expenses in 2017
Assumptions:
Tax Rate 36%
WACC 8.0%
Long Term Growth Rate 3.0%
2014 2015 2016 CAGR 2017 2018 2019 2020 2021
Revenue 38,901 37,864 36,556 -3% 37,591 38,818 40,087 41,224 42,395
% growth -3% -3% 3% 3% 3% 3% 3%
Operating Expenses 36,528 32,698 32,218 -6% 32,349 33,405 33,482 34,433 35,411
% of revenue 94% 86% 88% 86% 86% 84% 84% 84%
Operating Income 2,373 5,166 4,338 35% 5,242 5,413 6,604 6,792 6,985
% of revenue 6% 14% 12% 14% 14% 16% 16% 16%
Taxes (4) (3,121) 1,556 1,880 1,942 2,369 2,436 2,505
NOPAT 2,377 8,287 2,782 8% 3,362 3,471 4,235 4,356 4,479
+ Depreciation and Amortization 1,679 1,819 1,977 1,853 1,913 1,976 2,032 2,090
- Capex 2,005 2,747 3,223 3,021 3,119 3,221 3,313 3,407
- Inc (dec) in Net Working Capital 375 (391) (230) (170) (176) (158) (162)
Unlevered Free Cash Flow 2,051 6,984 1,927 2,424 2,435 3,166 3,233 3,325
Enterprise Value Sensitivity Analysis - Enterprise Value
NPV of FCF 11,477 Long Term Growth Rate
Adjusted for Mid-Year Convention 11,928 22,764 2.0% 2.5% 3.0% 3.5% 4.0%
Implied Terminal Value 68,170 7.0% 23,000 24,257 25,827 27,847 30,539
PV of Terminal Value 10,836 7.5% 21,876 22,909 24,171 25,749 27,778
Enterprise Value 22,764 8.0% 20,918 21,783 22,821 24,089 25,674
8.5% 20,089 20,824 21,693 22,735 24,009
Equity Value 9.0% 19,361 19,994 20,732 21,605 22,652
Cash and Cash Equivalents 2,179
Total Debt 10,767
Equity value 14,176
Shares Outstanding 317.286
Price Per Share 44.68$
Actuals Projected
WA
CC
24
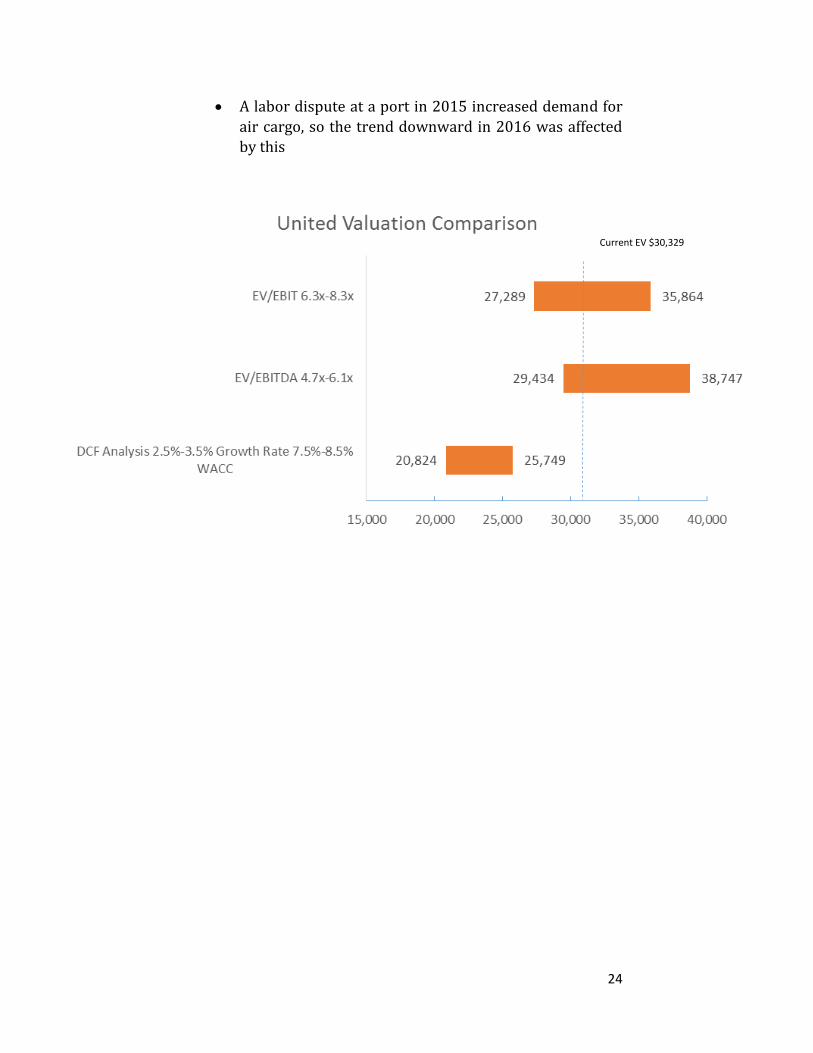
• A labor dispute at a port in 2015 increased demand for
air cargo, so the trend downward in 2016 was affected
by this
Current EV $30,329
25
Analysis of Results
As clearly seen in the football field charts comparing the
different valuation methods, there is a lot of variability in the
valuations provided by the different methods. Part of this
variability stems from the nature of the airline industry itself,
and the rest can be attributable to the operations of the
individual companies.
Capital Structure - The airline industry requires constant, large
capital expenditures to stay ahead of competition in areas of fuel
efficiency, seats per plane, fleet capacity etc. and as a result,
leaves less free cash flows for distribution to shareholders or to
invest in the business. This means a lot of these costs are funded
through the issuance of debt which can severely limit an
airline’s ability to continue to borrow while also needing to
maintain large levels of liquidity, reducing potential return for
investors. This is seen in American Airlines, as they currently
have almost 50% of their capital structure financed with debt
and about $8.8 billion in availability liquidity. In addition, just
to service this debt fully, they have about $28 billion of
outstanding contractual obligations. All of this puts enormous
pressure on airlines to properly balance increasing capacity,
maximizing load factors, and improving margins to attract
investors.
Major Risks - One factor that is hurting airlines’ financial
performance is the labor unions. Across all of the major airlines,
about 80% of the employees are represented by unions, and in
2016, most unions renegotiated contracts that provided double
digit percent increases in salaries, and in the case of Delta, an
18% increase for their pilots. The Railway Labor Act gives
airline employees the right to collectively bargain, so it is not
legal for airlines to forcibly break up unions that exist, but these
increases in salaries are unsustainable and cause almost a
billion dollar increase in expenses per year in the case of United.
Because of this, I have projected salaries as a percent of sales to
increase, causing margins to get tighter.
Another cost driver for airlines is fuel. Airlines are inherently
dependent on buying fuel but recently have been exposed to
fluctuations in fuel prices. With oil prices stabilizing and
expecting to rise moderately in the future, airlines need to
reevaluate their policies around fuel hedging and adopt policies
26
to help smooth out the effects. In recent years, fuel hedging has
cost hundreds of millions of dollars in losses due to falling fuel
prices, but stopping fuel hedging programs is shortsighted. As a
result, I have also projected fuel expenditures to increase as a percent of sales, further reducing margins of these airlines.
Value Driver - The main driver of value in a DCF model is sales
growth. These airlines operate in a very competitive and
mature environment, meaning domestic growth beyond overall
economic growth occurs by capturing market share from
competitors. This is the primary strategy for Southwest, as they
have very limited international exposure and have to
distinguish themselves to do this. The other airlines are looking
to international markets and joint ventures to drive top line
revenue growth. Given the risks the airlines laid out for these
ventures and the declining revenues of the past few years, I did
not anticipate this foreign growth to drive growth at rates that
support their current market values.
Market Comparison - It is apparent the market is more
optimistic about the outlook for airlines then I have been.
Except for Southwest, the value I found for the other three
airlines using a DCF model undershot the value found in the
market substantially. In order for the value of the DCF to
increase, either revenue growth needs to increase, margins
need to increase, or capital expenditures need to decrease. In
the case of Delta, the market valuation can be achieved using a
long term growth rate of 6%, an increase in operating margin by
reducing fuel and salary spend to 3 year lows, or by decreasing
capital expenditures by 50%. I cannot support any of these
assumptions as the market conditions simply do not exist to
support that level of growth, the cost reductions, or the
decreased investment in new equipment.
Two things the market is pricing into Delta’s and other’s stock is
increased ROIC provided by increasing dividends and share
repurchase programs. Because of these programs, ROIC was
higher than WACC in 2014 for the first time since the 1980s.
ROIC is expected to slowly decline over the next few years as
share repurchase programs are scaled back, however this
return of capital to investors may explain the higher prices seen
in the market.
27
Additional Valuation Methods – In order to get a more complete
sense of the markets’ expectations of airlines, Enterprise
Value/EBITDA and EV/EBIT are used as valuation multiples.
The major difference here is that EV/EBIT takes into account the
depreciation whereas EV/EBITDA does not. This is more
important when comparing companies across industries where
the capital expenditures and in turn depreciation are very
different. In comparing companies within an industry, one
should expect these metrics to provide similar estimates.
Overall, these metrics serve as proxies for operating cash flows
which is good for airlines, as their main source of liquidity is
operating cash flows. A major concern using these metrics is the
effect that items after EBIT play, mainly taxes. This is less of a
concern here, as these airlines operate in similar tax
environments, however foreign exposure should be taken into
consideration.
In my analysis, the valuation of these airlines needs to
incorporate aspects from all the DCF model, the EV/EBIT, and
EV/EBITDA ratios. The enterprise value ratios here serve as a
good long term indicator of where an airline should be valued
based on current and historical industry norms. The DCF model
adds in the complexities of the operations and initiatives of the
individual companies to better value the capabilities of the
firms. Due to slow overall growth and a shift in corporate policy
toward increasing dividends, I see the value of airlines in the
future is their ability to maintain and grow dividends while
capturing international growth. This cannot occur without a
constant focus on controlling costs, especially related to fuel and salary expenses.
Conclusion
The United States airline industry serves as a great example of
the forces of the free market, the effects of government
intervention, and the operation of a capital intensive industry.
The deregulation of the industry, which according to supporters
of government control would ruin the industry and drive prices
so high the industry would no longer serve in the best public
interest, provides a great before and after effect that makes a
strong case for the free market. The number of locations
serviced by airlines is at an all-time high, the price of an average
trip is at an all-time low, and service standards continue to
improve as customers come to expect more for what they pay.
28
Despite all this, investors have been wary of investing in airlines
as the risks associated with the operations of an airline have not
historically been matched with appropriate levels of return. In
2014 airlines finally broke through and provided an ROIC above
their WACC thus attracting investors and driving value. As seen
in the analysis, the industry is burdened with heavy capital
expenditures which reduce the valuation provided by a
discounted cash flow model. To match the value provided by
these models to the valuation seen in the markets, revenue
growth would reach levels that are not possible (around 6%),
margins would need to increase beyond what is possible (by
decreasing fuel and salary expenses), or capital expenditures
would need to be severally reduced (a 50% reduction) which
would be detrimental in the long run operations of the business.
EV/EBITDA and EV/EBIT are additional tools used to value
airlines based on historic industry averages. These ratios
provided estimates that more closely matched current market
values, however they do not take into account the additional
information provided by projecting individual line items like in
a DCF. For these reasons, Delta, American, and United are
overvalued as they do not have strong growth outlooks to
support their current valuations. The operating model of
Southwest should allow for additional market share in the US,
supporting a higher valuation in the face of slower growth.
Other further research that would help develop a better
understanding of the valuation of airlines would include non-
standard metrics. One such metric would be cash from
operations – capex – borrowing. This metric should show the
generation of cash from the core operations of the business
including effects of financing and reinvestment in assets.
Finally, another distinction that could be made is separating the
industry by classification of full-service airline or low cost
airline. With the differing operational strategies employed by
these differing airlines, their valuations should have factors
unique to the class that could make for more accurate valuations.
29
Works Cited
Cook, G. N. (1996). A Review of History, Structure, and
Competition in the U.S. Airline Industry. Journal of
Aviation/Aerospace Education & Research, 7(1).
Retrieved from http://commons.erau.edu/jaaer/vol7/iss1/1
Tsikriktsis, N. (2007). The Effect of Operation Performance
and Focus on Profitability: A Longitudinal Study of the
U.S. Airline Industry. Manufacturing & Service
Operations Management. Retrieved from
https://www.researchgate.net/publication/220391436
_The_Effect_of_Operation_Performance_and_Focus_on_P
rofitability_A_Longitudinal_Study_of_the_US_Airline_Industry
Erma Suryania, Shuo-Yan Choua, Chih-Hsien Chenb (2010) Air
passenger demand forecasting and passenger terminal
capacity expansion: A system dynamics framework.
Expert Systems with Applications, Volume 37, Issue 3,
15 March 2010, Pages 2324–2339, Retrieved from
http://www.sciencedirect.com/science/article/pii/S09
57417409007076?np=y&npKey=d3eb95be668018ee8
dd682406de5d6ddb43c5c4a4b5c20ea130498d0ad2ca5da
Liehr, M. et al. (2001). Cycles in the sky: understanding and
managing business cycles in the airline market. System
Dynamics Review, Volume 17, Number 4, Retrieved
from
http://onlinelibrary.wiley.com/doi/10.1002/sdr.226/epdf
Seraj, Y. A., Abdullah, O. B., & Sajjad, M. J. (2001). An
econometric analysis of international air travel demand
in Saudi Arabia. Journal of Air Transport Management,
7, 143–148.
https://www.researchgate.net/publication/222830860
_An_econometric_analysis_of_international_air_travel_demand_in_Saudi_Arabia
Harumi Itoa, Darin Lee (2005). Assessing the impact of the
September 11 terrorist attacks on US airline demand.
Journal of Economics and Business, Volume 57, Issue 1
30
January-February 2005, Pages 75-95,
http://www.sciencedirect.com/science/article/pii/S01
48619504000700?np=y&npKey=3de26ec54a411d625e
bf28daa2f387de6b5396ac14dffa9b6c7d158e4ce5367a
Air Travel Demand. IATA Economics Briefing No 9 (2008)
www.iata.org/publications/economic-
briefings/air_travel_demand.pdf
“Airline hedges fuel rally in later dated oil prices”
http://www.cnbc.com/2016/04/06/airline-hedges-
fuel-rally-in-later-dated-oil-prices.html
Damodaran Online: http://pages.stern.nyu.edu/~adamodar/
http://ir.delta.com/stock-and-financial/sec-filings/
http://investors.southwest.com/financials/sec-filings
http://phx.corporate-ir.net/phoenix.zhtml?c=117098&p=irol-
sec&secCat01.2_rs=1&secCat01.2_rc=10&seccat01.1_rs
=21&seccat01.1_rc=10&control_selectgroup=Annual%20Filings
http://ir.united.com/financial-performance/sec-filings
http://www.tradingeconomics.com/forecast/gdp-annual-growth-rate
https://www.eia.gov/outlooks/steo/report/prices.cfm
http://www.tradingeconomics.com/commodity/brent-crude-oil/forecast
World Economic Outlook (WEO) Update, A Shifting Global
Economic Landscape January 2017
https://www.imf.org/external/pubs/ft/weo/2017/upd
ate/01/