Valorization of vinasse as broth for biological hydrogen and ...
116
HAL Id: tel-00914329 https://tel.archives-ouvertes.fr/tel-00914329 Submitted on 5 Dec 2013 HAL is a multi-disciplinary open access archive for the deposit and dissemination of sci- entific research documents, whether they are pub- lished or not. The documents may come from teaching and research institutions in France or abroad, or from public or private research centers. L’archive ouverte pluridisciplinaire HAL, est destinée au dépôt et à la diffusion de documents scientifiques de niveau recherche, publiés ou non, émanant des établissements d’enseignement et de recherche français ou étrangers, des laboratoires publics ou privés. Valorization of vinasse as broth for biological hydrogen and volatile fatty acids production by means of anaerobic bacteria Eduardo Bittencourt Sydney To cite this version: Eduardo Bittencourt Sydney. Valorization of vinasse as broth for biological hydrogen and volatile fatty acids production by means of anaerobic bacteria. Other. Université Blaise Pascal - Clermont-Ferrand II, 2013. English. NNT : 2013CLF22373. tel-00914329
-
Upload
khangminh22 -
Category
Documents
-
view
1 -
download
0
Transcript of Valorization of vinasse as broth for biological hydrogen and ...

HAL Id: tel-00914329https://tel.archives-ouvertes.fr/tel-00914329
Submitted on 5 Dec 2013
HAL is a multi-disciplinary open accessarchive for the deposit and dissemination of sci-entific research documents, whether they are pub-lished or not. The documents may come fromteaching and research institutions in France orabroad, or from public or private research centers.
L’archive ouverte pluridisciplinaire HAL, estdestinée au dépôt et à la diffusion de documentsscientifiques de niveau recherche, publiés ou non,émanant des établissements d’enseignement et derecherche français ou étrangers, des laboratoirespublics ou privés.
Valorization of vinasse as broth for biological hydrogenand volatile fatty acids production by means of
anaerobic bacteriaEduardo Bittencourt Sydney
To cite this version:Eduardo Bittencourt Sydney. Valorization of vinasse as broth for biological hydrogen and volatile fattyacids production by means of anaerobic bacteria. Other. Université Blaise Pascal - Clermont-FerrandII, 2013. English. �NNT : 2013CLF22373�. �tel-00914329�

1
UNIVERSITE BLAISE PASCAL UNIVERSIDADE FEDERAL DO PARANÁ UNIVERSITE D'AUVERGNE N° d'ordre : D.U : 2373
ECOLE DOCTORALE
SCIENCES DE LA VIE, SANTE, AGRONOMIE, ENVIRONNEMENT N° d'ordre: 613
UNIVERSIDADE FEDERAL DO PARANÁ BIOPROCESS ENGINEERING AND BIOTECHNOLOGY DIVISION
THESIS
Presented by
Eduardo Bittencourt SYDNEY
For the fulfilment of the degree of Doctor of Philosophy
in Process Engineering
VALORIZATION OF VINASSE AS BROTH FOR BIOLOGICAL HYDROGEN AND VOLATILE FATTY ACIDS PRODUCTION BY MEANS OF ANAEROBIC
BACTERIA
M. Soccol Carlos Ricardo, Professeur, Universidade Federal do Paraná Directeur de thèse M. Larroche Christian, Professeur, Université Blaise Pascal, Directeur de thèse M. de Oliveira José Vladimir, Universidade federal de Santa Catarina, Rapporteur et examinateur
M. Bergel Alain, Université de Toulouse, Rapporteur et examinateur
Institut Pascal, UMR CNRS 6602, Axe GePEB – Université Blaise Pascal Laboratory of Bioprocess Engineering – Universidade Federal do Paraná

2
Acknowledgements
I am very grateful to my Brazilian supervisor Prof Carlos Ricardo Soccol for
every professional opportunity given to me during these last 5 years that I had the
pleasure to work alongside.
I would like to thanks my French advisor, Prof Larroche, for the opportunity for
this collaboration work. I’d also like to express my gratitude for the hospitality during
my stay at LGCB.
I take the opportunity to thank Regis Nouaille, now owner of the biotech
enterprise AFYREN, who was my mentor in this topic and became a very good
friend.
I am thankful to thank my wife, Alessandra, a very special person for whom I
have an immeasurable love.
Special thanks to my parents and my brother, who always gave me support
and unconditional love. I don’t think there is a way to express all the love I have for
you.
Thanks to Prof. Dr. Adenise L. Woiciechowski, Prof. Dr. Julio Cesar Carvalho,
Prof. Dr. Luciana P. S. Vandenberghe, Prof. Dr. Michele Rigon Spier, Prof. Dr.
Adriane P. Medeiros, and Prof. Letti for their help. I take the opportunity also to thank
everyone from the LGCB for the friendship and hospitality.
I would also like to thank Ouro Fino Agronegócio, especially Dolivar Coraucci,
Ricardo Asmmann, Carlos Dalmas and Guilherme Moraes. Thanks to all my lab
colleagues from LGCB and LPB.
Thanks CAPES and Fundação Araucária for the financial support.

3
Summary Abstract ....................................................................................................................................... 12
CHAPTER 1
1. Introduction ........................................................................................................................ 15
2 Hydrogen and Volatile Fatty Acids (VFA) Production .......................................................... 16
2.1 Hydrogen Production Processes .................................................................................. 16
2.2 Biotechnological Biohydrogen Production .................................................................. 17
2.2.1 Photo-‐fermentations ........................................................................................... 19
2.2.2 Dark Anaerobic Biohydrogen Production ............................................................ 19
2.2.3 Two phase ........................................................................................................... 20
3 Dark Fermentation Metabolism of Biohydrogen producers ............................................... 20
4 Organic Acids Microbial Production .................................................................................... 25
CHAPTER 2
1 Introduction ........................................................................................................................ 28
1.1 Substrates for Biohydrogen Production ...................................................................... 28
1.1 Sugarcane Vinasse ....................................................................................................... 30
2 Material and Methods ........................................................................................................ 35
2.1 Anaerobic Medium Preparation .................................................................................. 35
2.2 Microorganisms ........................................................................................................... 36
2.3 Biogas Production and Composition Analysis ............................................................. 37
2.4 Ion Chromatography (IC) ............................................................................................. 38
2.5 High Performance Liquid Chromatography (HPLC) ..................................................... 38
2.6 Nuclear Magnetic Resonance ...................................................................................... 39
2.7 Proteins and Aminoacids Quantification ..................................................................... 39
3 Results and Discussion ........................................................................................................ 39

4
3.1 Vinasse Analysis .......................................................................................................... 39
3.2 Effect of carbon source in biohydrogen and VFAs production .................................... 41
4. Conclusion ........................................................................................................................... 46
CHAPTER 3
1 Introduction ........................................................................................................................ 49
2 Material and Methods ........................................................................................................ 51
2.1 Microorganisms ........................................................................................................... 51
2.2 Medium Composition and Culture Conditions ............................................................ 52
2.3 Culture media and Medium Analysis .......................................................................... 53
2.4 High Performance Liquid Chromatography (HPLC) and Ethanol quantification. ......... 53
2.5 Gas Analysis ................................................................................................................. 54
3 Results and Discussion ........................................................................................................ 55
3.1 Vinasse composition .................................................................................................... 55
3.2 Strains metabolism analysis ........................................................................................ 56
3.2.1 ATCC 8260 ........................................................................................................... 57
3.2.2 ATCC 27021 ......................................................................................................... 58
3.2.3 C6 ......................................................................................................................... 58
3.2.4 VINA ..................................................................................................................... 59
3.2.5 LPB AH1 ............................................................................................................ 61
3.2.6 LPB AH2 ............................................................................................................ 62
3.2.7 LPB AH4 ............................................................................................................ 63
3.2.8 LPB AH5 ............................................................................................................ 64
3.2.9 LPB AH6 ............................................................................................................... 65
3.2.10 LPB AH7 ............................................................................................................... 66
3.3 Conclusions ................................................................................................................. 67
CHAPTER 4
1 Introduction ........................................................................................................................ 70

5
2 Material and Methods ........................................................................................................ 72
2.1 Medium Composition and Culture Conditions ............................................................ 72
2.2 High Performance Liquid Chromatography (HPLC) ..................................................... 73
2.3 Gas Measurement and Analysis .................................................................................. 73
2.4 Strains .......................................................................................................................... 73
2.5 Optimization and data analysis ................................................................................... 74
3 Results and Discussion ........................................................................................................ 75
3.1 Consortium LPB AH1 cultivated in vinasse medium supplemented with sugarcane juice. 75
3.2 Consortium LPB AH2 cultivated in vinasse medium supplemented with sugarcane molasses. ................................................................................................................................. 79
4 Conclusions ......................................................................................................................... 82
CHAPTER 5
1 Introduction ........................................................................................................................ 85
2 Material and methods ......................................................................................................... 86
2.1 Culture Conditions and Strains .................................................................................... 86
2.2 Vinasse ........................................................................................................................ 88
2.3 High Performance Liquid Chromatography (HPLC) ..................................................... 88
2.4 Gas Measurement and analysis ................................................................................... 88
2.5 Other Analysis ............................................................................................................. 89
3 Results ................................................................................................................................. 90
3.1 Biohydrogen and VFAs production in bioreactor scale by the consortium LPB AH1 .. 90
3.1.1 Metabolic analysis ............................................................................................... 92
3.1.2 Hydrogen production potential analysis ............................................................. 93
3.2 Biohydrogen and VFAs production in bioreactor scale by the consortium LPB AH2 .. 94
3.2.1 Metabolic analysis ............................................................................................... 96
3.2.2 Hydrogen production potential analysis ............................................................. 97
4. Conclusion ........................................................................................................................... 98

6
General Conclusion .................................................................................................................. 100
Future works ............................................................................................................................ 102
Bibliographic References .......................................................................................................... 103
Publications in the Field ........................................................................................................... 114

7
List of Figures Figure 1 -‐ A schematic pathway for conversion of renewable to hydrogen via fermentation (53). .. 21
Figure 2 -‐ Metabolic pathway of the production of acids and solvents from glucose in Clostridium acetobutylicum. From Jones and Woods (50). ................................................................................... 22
Figure 3 – Depuration LPB AH2on where vinasse is stored at Usina Catanduva (Catanduva, São Paulo, Brazil). At the day this picture was taken, the flow of vinasse was 350m³.h-‐1. ....................... 31
Figure 4 -‐ Channels for the distribution of vinasse along the field at Usina Catanduva (Catanduva, São Paulo, Brazil. It can also be seen a pump used for vinasse aspersion. ........................................ 32
Figure 5 -‐ Coated channel at Usina Catanduva (Catanduva, São Paulo, Brazil) folowing the new legislation. .......................................................................................................................................... 33
Figure 6 -‐ Technique of producing an anaerobic medium. Boiling under anoxic environment is one important step. .................................................................................................................................. 36
Figure 7 -‐ Biogas quantification using a 60ml syringe. ...................................................................... 37
Figure 8 – The use of a graduated syringe in the quantification of the gas produced during fermentation ...................................................................................................................................... 54
Figure 9 – Graphical 3-‐D and contour displays of the achieved results for optimization of gas production by LPB AH1 consortium cultivated in vinasse medium supplemented with sugarcane juice. ................................................................................................................................................... 77
Figure 10 -‐ Graphical 3-‐D and contour displays of the achieved results for optimization of gas production by LPB AH2 consortium cultivated in vinasse medium supplemented with sugarcane molasses. ............................................................................................................................................ 80
Figure 11 – 2L Bioreactor used in scaled up production of biohydrogen and VFAs by the consortium LPB AH2 (cultivated in vinasse medium supplemented with sugarcane molasses) and LPB AH1 (cultivated in vinasse medium supplemented with sugarcane juice). ............................................... 87
Figure 12 – The system of gas measurement (foreground) adapted to the bioreactor (background).89
Figure 13 -‐ Curves of biomass and VFAs production during the cultivation of the consortium LPB AH1 in vinasse medium supplemented with sugarcane juice. ........................................................... 90
Figure 14 -‐ Biogas production, substrate consumption and pH variation during fermentation of vinasse supplemented with sugarcane juice by the consortium LPB AH1. ........................................ 91
Figure 15 -‐ Representation of the destination of the substrate in terms of VFAs, biomass and CO2 production and cellular maintanance. ............................................................................................... 93
Figure 16 -‐ Biogas production, substrate consumption and pH variation during fermentation of vinasse supplemented with sugarcane molasses by the consortium LPB AH2. ................................. 95

8
Figure 17 -‐ Curves of biomass and VFAs production during the cultivation of the consortium LPB AH1 in vinasse medium supplemented with sugarcane molasses. .................................................... 95
Figure 18 -‐ Representation of the destination of the substrate in terms of VFAs, biomass and CO2 production and cellular maintanance. ............................................................................................... 97

9
List of Tables Table 1 – Most common hydrogen production processes. ................................................................ 17
Table 2 -‐ Overview of biological hydrogen production processes (2). ............................................... 18
Table 3 – Some examples of yields of biohydrogen production achieved using agroindustrial residues as carbon sources. ............................................................................................................... 29
Table 4 -‐ Physico-‐Chemical characterizations of Vinasse (media of 64 samples from 28 ethanol industries from São Paulo – Brazil) (54). ............................................................................................ 34
Table 5 – Mineral composition determined by Ion Chromatography. Those considered following the studies of Neto and Nakahodo, 1995 (54), are signaled with a (*). ............................................. 40
Table 6 – VFAs composition of vinasse by HPLC and RMN analysis. .................................................. 40
Table 7 – Hydrogen production by 5 strains grown in vinasse medium supplemented with different carbon sources. Results represent an average of 20 generation measurements. ............................. 42
Table 8 – VFAs produced (in g/L) by different strains and the consortium VINA in vinasse based medium. ............................................................................................................................................. 44
Table 9 – Hydrogen production by 5 strains grown in Natural Vinasse Media (NVM) supplemented with different carbon sources avoiding hydrogen accumulation. Results represent an average of 20 generation measurements. ................................................................................................................ 44
Table 10 – VFAs concentrations (g/L) at the 4th day of fermentation in vinasse based medium. ..... 45
Table 11 – VFAs concentration (g/L) at the 7th day of fermentation in vinasse based medium. ...... 45
Table 12 – Butyrate/acetate ratio, gas produced and hydrogen content in the gas phase in the experiments carried with each strain. Butyrate/Acetate ratio was considered based on VFAs analysis of the 7th day of fermentation. ............................................................................................. 46
Table 13 – Yields of biohydrogen production of microorganisms grown in pure carbon sources. .... 50
Table 14 -‐ Some yields achieved by using consortia for in fermentation of different substrates. ..... 51
Table 15 – Origin of the samples collected with potential for methane/biohydrogen production. .. 52
Table 16 – Complete composition of the vinasse used during the experiments was carried by BioAgri Laboratory. ............................................................................................................................ 55
Table 17 – Metabolic products of the cultivation of ATCC 8260 in vinasse medium containing different carbon sources. Results include cultivation allowing and avoiding H2 partial pressure. VFAs concentration is shown in g.L-‐1. Results are the average of 5 analyses. ............................................ 57
Table 18 -‐ Metabolic products of the cultivation of the strain C6 in vinasse medium containing different carbon sources. Results include cultivation allowing and avoiding H2 partial pressure. VFAs concentration is shown in g.L-‐1. Results are the average of 5 analyses. ............................................ 58

10
Table 19 -‐ Metabolic products of the cultivation of the consortium VINA in vinasse medium containing different carbon sources. Results include cultivation allowing and avoiding H2 partial pressure. VFAs concentration is shown in g.L-‐1. Results are the average of 5 analyses. .................... 59
Table 20 -‐ Metabolic products of the cultivation of the consortium LPB AH3 in vinasse medium containing different carbon sources. Results include cultivation allowing and avoiding H2 partial pressure. VFAs concentration is shown in g.L-‐1. Results are the average of 5 analyses. .................... 61
Table 21 -‐ Metabolic products of the cultivation of the consortium LPB AH1 in vinasse medium containing different carbon sources. Results include cultivation allowing and avoiding H2 partial pressure. VFAs concentration is shown in g.L-‐1. Results are the average of 5 analyses. .................... 62
Table 22 -‐ Metabolic products of the cultivation of the consortium LPB AH2 in vinasse medium containing different carbon sources. Results include cultivation allowing and avoiding H2 partial pressure. VFAs concentration is shown in g.L-‐1. Results are the average of 5 analyses. .................... 63
Table 23 -‐ Metabolic products of the cultivation of the consortium LPB AH4 in vinasse medium containing different carbon sources. Results include cultivation allowing and avoiding H2 partial pressure. VFAs concentration is shown in g.L-‐1. Results are the average of 5 analyses. .................... 64
Table 24 -‐ Metabolic products of the cultivation of the consortium LPB AH5 in vinasse medium containing different carbon sources. Results include cultivation allowing and avoiding H2 partial pressure. VFAs concentration is shown in g.L-‐1. Results are the average of 5 analyses. .................... 65
Table 25 -‐ Metabolic products of the cultivation of the consortium LPB AH6 in vinasse medium containing different carbon sources. Results include cultivation allowing and avoiding H2 partial pressure. VFAs concentration is shown in g.L-‐1. Results are the average of 5 analyses. .................... 66
Table 26 -‐ Metabolic products of the cultivation of the consortium LPB AH7 in vinasse medium containing different carbon sources. Results include cultivation allowing and avoiding H2 partial pressure. VFAs concentration is shown in g.L-‐1. Results are the average of 5 analyses. .................... 66
Table 27 – Statistical plan used for the optimization of conditions for biohydrogen and VFAs production by the chosen consortia. ................................................................................................. 75
Table 28 – Values of pH and carbon source assigned to each level of the optimization plan. .......... 75
Table 29 – Gas production achieved by cultivating the consortium LPB AH1 under conditions according to the statistical model used for optimization. .................................................................. 76
Table 30 -‐ The equation of the full quadratic model that fit best to the results achieved in this optimization is presented. Coefficient values, standard errors, 95% interval of confidence and T student are also shown. ..................................................................................................................... 77
Table 31 – The ANOVA analysis showed low content of residuals and indicates that the full quadratic equation proposed is valid. ................................................................................................ 78
11
Table 32 – Volatile fatty acids production of the consortium LPB AH1 during optimization. Substrate, succinic, lactic, formic, acetic, propionic and butyric acids are showed in g.L-‐1. .............. 79
Table 33 – Gas production achieved by cultivating the consortium LPB AH1 under conditions according to the statistical model used for optimization. .................................................................. 80
Table 34 -‐ – The equation of the full quadratic model that fit best to the results achieved in this optimization is presented. Coefficient values, standard errors, 95% interval of confidence and T student are also shown. ..................................................................................................................... 81
Table 35 – The ANOVA analysis showed low content of residuals and indicates that the full quadratic equation proposed is valid. ................................................................................................ 81
Table 36 – Volatile fatty acids production of the consortium LPB AH2 during optimization. The concentration of the carbon source, succinic, lactic, formic, acetic, propionic and butyric acids are showed in g.L-‐1. .................................................................................................................................. 82
Table 35 – Composition of the biogas produced during the fermentation by the consortium LPB AH1. .................................................................................................................................................... 92
Table 36 – Composition of the biogas produced during the fermentation by the consortium LPB AH2. .................................................................................................................................................... 96

12
Abstract Vinasse is the liquid waste removed from the base of sugarcane ethanol
distillation columns at a ratio of 12-15 liters per liter of alcohol, resulting in an
estimated production of approx. 350 billion liters in 2012/2013 in Brazil. Vinasse has
a low pH and high chemical oxygen demand, which can cause land desertification
when indiscriminately used as fertilizer. Also, underground water contamination is
being observed in some regions. We evaluated the potential of vinasse as nutrient
source for biohydrogen and volatile fatty acids production by means of anaerobic
consortia. Two different vinasse-based media were proposed, using sugarcane juice
or molasses as carbon source, and were compared to fermentation in a sucrose-
supplemented medium. Pure cultures (4) and consortia (7) were cultured in the
propose media and evaluated for volatile fatty acids (VFAs) and biohydrogen
production. The consortium LPBAH1, originated from faeces of fruit bat, was
selected for fermentation of vinasse supplemented with sugarcane juice and resulted
in a higher H2 yield of 7.14molH2/molsucrose and hydrogen content in biogas of approx.
31% after process optimization. Similarly, the optimized process using the
consortium LPBAH2, originated from a lake of a dairy farm, resulted in 3.66
molH2/molsucrose and 32.7% hydrogen content in biogas. The proposed process is of
great importance for giving a more rational destination to vinasse and expanding
Brazilian energy matrix, reducing the dependence of fossil fuels.
Keywords: biohydrogen, molasses, sugarcane, vinasse, volatile fatty acids,
bioenergy

13
Résumé
La vinasse est le déchet liquide retiré de la base de colonnes de distillation de
l'éthanol de canne à sucre à hauteur de 12 à 15 litres par litre d'alcool, ce qui
entraîne une production estimée à environ 350 milliards de litres en 2012/2013 au
Brésil. La vinasse a un pH faible et une forte demande chimique en oxygène, ce qui
peut provoquer la désertification des terres, si elle est utilisée en excès comme
amendement. En outre, une contamination des eaux souterraines liée aux
épandages est observée dans certaines régions. L'aptitude de la vinasse à jouer le
rôle de source d'éléments nutritifs pour la production de biohydrogène et d'acides
gras volatils par des consortia microbiens anaérobies a été évaluée. Deux différents
milieux à base de vinasse ont été proposés, un avec l’addition de jus de canne à
sucre et l’autre avec l’addition de la mélasse comme source de carbone, et ont été
comparés à un milieu supplémenté en saccharose. Des cultures bactériennes pures
(4) et des consortia microbiens (7) ont été cultivées dans les milieux proposés et la
production des acides gras volatils (AGV) et de biohydrogène ont été evalués. Le
consortium LPBAH1, originaire d’un lac d’une ferme laitière et sélectionné pour la
fermentation de la vinasse avec du jus de canne à sucre, conduit à un rendement en
H2 de 7,14molH2/molsucrose et à une teneur en hydrogène dans le biogaz d'env. 31%
après optimisation. Par ailleurs, le processus optimisé en utilisant le consortium
LPBAH2, originaire de fèces de chauves-souris frugivores, permet d'obtenir 3,66
molH2/molsucrose et 32,7% d'hydrogène dans le biogaz. Le processus proposé est
d'une grande importance pour donner une destination plus rationnelle de la vinasse
et d'élargir le bouquet énergétique brésilien en réduisant sa dépendance des
combustibles fossiles.
Mots-clés: vinasse, biohydrogène, mélasse, canne à sucre, acides gras volatiles,
bioenergie

14
CHAPTER 1
An Introduction to the
metabolism of Biohydrogen and
Volatile Fatty acids of anaerobic
bacteria

15
1. Introduction
Almost 100% of our (increasing) energetic demand is supplied by carbon-
containing fossil sources such as oil, coal and natural gas. The environmental
concerns involving the use of such sources of energy are related to the increase in
atmospheric carbon concentration, which is the main cause of global warming and
climate change.
A reduction of CO2 emissions by more than 50% is recommended by the
Intergovernmental Panel on Climate Change (IPCC) in order to stabilize the CO2
level in the atmosphere at 550 parts per million volume (ppmv) to curb negative
climate effects. In this context the scientific community is doing great efforts to
develop renewable cost-effective sources of energy.
The Framework Convention on Climate Change, sign in Rio de Janeiro in
1992, made global warming a major focus and development of technologies for
reducing/absorbing greenhouse gases (GhG) gained importance. Rubin et al (1992)
divided the greenhouse gases emissions reductions alternatives into three groups:
conservation, direct mitigation and indirect mitigation. Conservation measures
reduced electricity consumption and thus GhG emissions, direct mitigation
techniques capture and remove CO2 emitted by specific emissions sources, and
indirect mitigation involve offsetting actions in which GhG producers support
reductions in GhG emission.
The gradual introduction of fuels with an increasingly lower carbon content per
unit of energy (wood à coal à oil à natural gas) results in a continuous
decarbonisation of the global fuel mix, the main objective of the international
agreement cited before. This chain of lower carbon content fuel ends in Hydrogen.
Hydrogen has a higher gravimetric energy density than any other known fuel and is
compatible with electrochemical and combustion processes for energy conversion
without producing the carbon-based emissions that contribute to environmental
pollution and climate change (36).

16
2 Hydrogen and Volatile Fatty Acids (VFA) Production Anaerobic acidogenesis is known as the first step in the anaerobic digestion of
soluble organic materials to methane and CO2, during which hydrogen is produced.
Because many kinds of bacteria are involved in this process several kinds of organic
acids and alcohols can be produced (70), representing around 55% of the carbon
destination (56).
2.1 Hydrogen Production Processes
Hydrogen does not exist alone in nature. Natural gas contains hydrogen
(about 95% of natural gas is methane, CH4), as does biomass (cellulose), water and
hydrocarbons. The carbon-hydrogen and oxygen-hydrogen bonds present in these
substances, however, have low energy. On the other hand hydrogen-hydrogen
bonds contain much more energy. Methods for producing high-energy content
hydrogen-hydrogen bonds includes a diverse array of primary energy sources such
as wind, solar, geothermal, nuclear and hydropower, can be used to extract
hydrogen from water or other feedstock. This diversity of options enables hydrogen
production almost anywhere in the world.
At present, hydrogen is mainly produced from fossil fuels, either by thermal
and chemical methods (Table 1). About 40% is produced from natural gas, 30% from
heavy oils and naphtha, 18% from coal, and 4% from electrolysis and about 1% is
produced from biomass (51). Nearly 50 million tons of hydrogen is traded annually
worldwide with a growth rate of nearly 10% per year (58).

17
Table 1 – Most common hydrogen production processes.
Method Process Feedstock
Thermal
Steam reformation Natural gas
Thermochemical water splitting Water
Gasification Coal, biomass
Pyrolisis Biomass
Electrochemical Electrolysis Water
Photoelectrochemical Water
Biological
Photobiological Water and algae
Anerobic digestion Biomass
Fermentative microrganisms Biomass
2.2 Biotechnological Biohydrogen Production
Hydrogen obtained from physicochemical methods usually cannot be
regarded as an alternative pollution free energy source. Regarding a sustainable
energy production the biological production of hydrogen represents a particularly
pollution free and energy-saving process, since it is possible to use industrial wastes.
As a consequence it has received special attention by the scientific community
during the last years. Between the years 2000 and 2006 only 391 articles were
published regarding the biological production of hydrogen, while between 2006 and
2012 these numbers were approx. 6 times greater. Only at the first two months of
2013, more than 150 articles in this field were published.
Several processes are currently under development, ranging from biomass
fermentations to photobiological processes. Table 2 gives a more detailed overview

18
of biological hydrogen production processes that are being explored in fundamental
and applied research.
Table 2 -‐ Overview of biological hydrogen production processes (2).
The advantages of the fermentative hydrogen production are the broad
spectrum of applicable substrates as well as high hydrogen production yields (3).
The possibility of coupling the energetic hydrogen production from biomass with the
simultaneous treatment of waste materials is an addition crucial advantage. Both
biohydrogen production and methane from anaerobic digestion are CO2-neutral
since the carbon released by their combustion is derived, directly or indirectly, from
recently fixed atmospheric CO2 (2). Moreover, the emitted carbon associated with
hydrogen produced by microbial fermentation is released during the fermentation
rather than during its utilization, thus potentially allowing easy capture of CO2. Large
scale production will allow recovery of the CO2 for use in microalgae cultures,
greenhouses, storage in chemical form (e.g. as carbonates) or in underground
reservoirs. In this scenario, biological hydrogen production could even be a carbon
negative technology (61). In fuel cells, hydrogen can be converted to electricity very
efficiently, producing only water as a waste product, thus drastically reducing CO2,
NOx, particulate and other emissions that accompany the use of fossil fuels.
As shown in table 2, biohydrogen may be produced biotechnologically by
photo-fermentations, two phase fermentations and dark fermentations. In these

19
cases a specific environment needs to be created in which hydrogen producing
bacteria flourish and others perish (38). Each approach has distinct advantages and
disadvantages with challenging technical barriers to practical application.
The processes for the production of biohydrogen differ primarily concerning
the involved microorganisms, the substrates and the light dependence.
2.2.1 Photo-‐fermentations
Towards the end of the 1930s it was discovered that under certain conditions
unicellular green algae are able to produce hydrogen (4, 5) due to the presence of a
specific enzyme called hydrogenase. Since then hydrogenases and indeed H2
production have been found to be ubiquitous throughout the prokaryotic and
eukaryotic kingdoms.
Physiological studies of cyanobacteria have identified many producing strains,
such as Spirulina platensis (122), Anabaena cylindrica (123), Cycas revoluta (124)
and others. One of the greatest drawbacks of this technology, besides dependence
of light (which influences in bioreactors development, difficulties in large scale
production, among others) is that hydrogen production by cyanobacteria occurs in
such a limiting environment that that cell death is a natural consequence.
Despite that, it can be used as a coupled process to dark anaerobic process.
2.2.2 Dark Anaerobic Biohydrogen Production
Dark hydrogen production is a ubiquitous phenomenon under anoxic or
anaerobic conditions. Anaerobic fermentative bacteria produce hydrogen without
photo energy, and so the cost of hydrogen production is 340 times lower than the
photosynthetic process (6).
A wide variety of bacteria use the reduction of protons to hydrogen to dispose
of reducing equivalents which result from primary metabolism. This oxidation
generates electrons which need to be disposed of for maintaining electrical
neutrality. In aerobic environments, oxygen is reduced and water is the product. In
anaerobic or anoxic environments, other compounds need to act as electron
acceptor, e.g. protons, which are reduced to molecular hydrogen (H2). The capacity

20
to reduce other electron acceptors than oxygen requires the presence of a specific
enzyme system in the micro-organisms: hydrogenases.
2.2.3 Two phase
The idea of two- and multi-stage systems is that the overall conversion
process of the waste stream to biogas is mediated by a sequence of biochemical
reactions which do not necessarily share the same optimal environmental conditions
(52). The principle involves separation of digestion, hydrolysis and acidogenesis
from the acetogenesis and methanogenesis phases.
There are three major advantages to a two-phase design. In a two-phase
system, acid formation is promoted during the acid phase. Therefore the methane
phase is constantly receiving acids to encourage maintenance of high populations of
these methanogen microorganisms. The second advantage is that biomass
production, acidogens and methanogens, can be maintained each at their optimal
growth conditions. The third advantage is higher methane content in the
methanogenic phase reactor (52).
3 Dark Fermentation Metabolism of Biohydrogen
producers
Dark hydrogen fermentation is a ubiquitous phenomenon under anoxic or
anaerobic conditions (i.e., no oxygen present as an electron acceptor). The
advantages of dark fermentation over other processes are: (i) better process
economy for lower energy requirements, (ii) process simplicity, (iii) higher rates of
hydrogen production, and (iv) utilization of low-value waste as raw materials (49).
Figure 1 illustrates the biochemical pathway for conversion of renewable biomass in
to hydrogen via fermentation.

21
Figure 1 -‐ A schematic pathway for conversion of renewable to hydrogen via fermentation (53).
Dark Fermentation is an incomplete oxidation. The profile of the fermentation
products is closely related to biohydrogen yields. In respect to fermentation products,
family Clostridiaceae members include pH-neutral solvent producers, mixed acid,
homoacidogenic and alcohol producers (butyric, acetic and/or lactic acids, ethanol,
propanol or butanol. Among the wide range of by-products of diverse microbial
metabolism, the two pathways producing hydrogen from carbohydrates are
associated with acetate and butyrate. The theoretical yield of H2 per mole of glucose
associated to the production of acetate and butyrate is described in the following
reactions:
C6H12O6 + 2H2O à 2CH3COO- + 2CO2 + 4H2 ΔG’0 = -206 kJ.mol-1
C6H12O6 + 4H2O à 2CH3CH2CH2COO- + 2CO2 + 2H2 ΔG’0 = -264 kJ.mol-1
A maximum of 4 moles of H2 per mole of glucose can be produced concurrently with
the production of energy (206 kJ per mole of glucose) and acetate, which is sufficient
to support microbial growth. The thermodynamical explanation for this limitation is
based on the substrate level, since phosphorylation must produce whole numbers of
ATP and the yield of ATP from glucose must be at least 1 mol/mol for the cell to
survive (11). However, microbial fermentation typically generates more than 1 mol

22
ATP and less than 4 mol H2/mol hexose, quantities that vary according to the
metabolic system and conditions. Figure 2 is a general representation of the
metabolic pathways associated to dark fermentation.
Figure 2 -‐ Metabolic pathway of the production of acids and solvents from glucose in Clostridium
acetobutylicum. From Jones and Woods (50).
The production of hydrogen occurs due to the cleavage of hexoses to
pyruvate through Embden-Meyerhof pathway, with the formation 2 mol of reduced
nicotinamide adenine dinucleotide (NADH). Part of the electrons generated during

23
the oxidation of glucose is involved in the production of butyrate and ethanol, while
the rest is recycled to produce NAD and hydrogen, maintaining the electrical
neutrality.
Three enzymes compete for pyruvate: pyruvate:ferredoxin oxidoreductase
(PFOR), pyruvate:formate lyase (PFL) and the fermentative lactate dehydrogenase
(LDH). The nature of the fermentation depends to a large extent on these enzyme
activities (55). Pyruvate is predominantly cleaved by PFOR to form acetil-CoA, CO2
and reduced ferredoxin (FdH2). Both PFOR and Fd are iron-sulfur proteins which
contains 4Fe-4S clusters. The released H2 yield is dependent upon the fate of
pyruvate, which differs among species due to varying activities of PFL, PFOR and
LDH (12).
This reduced ferredoxin is able to transfer electrons to an iron-containing
hydrogenase which permits the use of protons as a final electron acceptor, resulting
in the production of molecular hydrogen (50). This assures the production of two
moles of hydrogen per mole of glucose consumed. The overall reaction of the
processes can be described as follows:
Pyruvate + CoA + 2Fd(ox) → Acetyl-CoA + 2Fd(red) + CO2
2H+ + Fd(red) → H2 + Fd(ox)
There are two main types of hydrogenases which are phylogenetically distinct
and contain different active sites where the relevant chemistry occurs; Ni–Fe
hydrogenases and [FeFe] hydrogenases. In general, NiFe hydrogenases are poised
to catalyze hydrogen oxidation and [FeFe] hydrogenases are extremely active in
proton reduction. In Clostridia, hydrogen evolution is catalyzed by a soluble [FeFe]
hydrogenase.
The remainder of the hydrogen in the hexose is conserved in the byproduct
acetate and butyrate, and under non-ideal circumstances, more reduced products
like ethanol, lactate or alanine. These reduced products are produced to satisfy
metabolic needs. Acetate allows ATP synthesis, and the reduced products permit the
reoxidation of NADH (which is necessary for continuing glycolysis) (65).
Under abnormal conditions (inhibition of hydrogenase, depletion of iron, for
example), lactate can be produced from pyruvate. This pathway only appears to

24
operate as a less efficient alternative to allow energy generation and the oxidation of
NADH to continue when the mechanisms for the disposal of protons and electrons
by the generation of molecular hydrogen is blocked.
Acetyl-CoA produced by the phosphoroclastic cleavage is the central
intermediate, leading to both acid and solvent production (figure 1). The generation
of hydrogen by fermentative bacteria also accompanies the formation of organic
acids as metabolic products. Highest release of hydrogen is observed when more
oxidized products are produced (acetate and butyrate), which occurs during the
initial growth phase (acidogenic phase). Acid accumulation causes a sharp drop of
culture pH leading to a subsequent inhibition of bacterial hydrogen production; it is
thus required a way to reduce acid production or to neutralize protons outside of the
cells, (53). Inhibition of biohydrogen production can also be caused, and in practice
is the main barrier to achieve high yields, by high H2 partial pressure. According to
the model developed by Ruzicka (1996) (72), as the concentration of dissolved H2
increases in the liquid phase, the transfer of electrons from glucose to H2 becomes
increasingly unfavorable.
During acid-producing metabolism there is a rapid flow of electrons derived
both from the phosphoroclastic cleavage of pyruvate and from NADH to ferredoxin
(50). Since NADH has a higher potential than H2, the dehydrogenation of triose
phosphate to produce 2 mols of H2 can occur only when the partial pressure of H2 is
lower than 6x10⁻⁴ atm, while the production of H2 via the oxidation of pyruvate and
ferredoxin can generate another 2 mols of H2 at higher H2 pressure up to 0.3 atm
(71). Thus, in order to obtain H2 yields greater than 2 molH2/molglucose the production
of H2 via triose phosphate dehydrogenation and NADH must be achieved. Since two
moles of NADH are produced during glycolysis, up to a maximum of two additional
molecules of H2 could potentially be generated by NADH pathway.
The formation of relatively reduced organic molecules (e.g. acetate, butyrate)
can inhibit H2 production if these metabolites are allowed to accumulate (12). These
reduced end-products contain additional H atoms that are not liberated as gas (48).
This is the reason why practical production of hydrogen is lower than the theoretic
maximum. For example, the H2 yield from C. butyricum could in theory reach 4 mol
H2/mol hexose although a detailed metabolic analysis of C. butyricum gives a

25
calculation of a maximum of 3.26 mol H2/mol hexose and practical yields obtained
using clostridia rarely exceed 2 mol H2/mol hexose (12).
4 Organic Acids Microbial Production Low-molecular-mass carboxylic acids are important intermediates and
metabolites in biological processes. Known as volatile fatty acids (VFAs) these
homologues and corresponding structural isomers include acetic, propionic, iso- and
n-butyric and iso- and n-valeric acid. The presence of VFAs in a sample matrix is
often indicative of bacterial activity.
Organic acids are some of the end products of anaerobic metabolism to
produce biohydrogen, especially C2 and C4 acids. Generally they are not recovered,
but used in sequential processes as substrate for microbial methane or solvent
production.
If recovered from the broth, organic acids can be produced and sold as
commodity chemicals or further processed into higher value chemicals, biofuels, or
bio-products. Among the acids produced during biohydrogen production are acetic,
butyric, succinic, lactic, formic and propionic acids. Usually, in biohydrogen
processes it is observed a preferential production of acetic and butyric acids.
Considering the economic issues associated to biohydrogen production systems, the
recovery or reuse of such VFAs are of great interest, since H2 production is high.
Butyric acid has many uses in different industries, and currently there is a
great interest in using it as a precursor to biofuels, more specifically biobutanol.
Butyric acid has also applications in the production of low-molecular-weight esters
which have pleasant aromas (perfume industry) or tastes (food flavoring), in animal
feed and in the production of Cellulose Acetate Butyrate (a biopolymer used in high
impact plastics).
Acetic acid is an important feedstock for many chemicals such as vinyl
acetate monomer (for polymers), cellulose acetate, acetic acid esters and acetic
anhydride. Lactic acid is largely used as preservative in food industry (soft drinks,
essence, extracts, fruit juices), as well as propionic acid. Succinic acid is used as
building blocks for chemicals, such as polymers, while formic acid is largely used in

26
leather industry (prevention of mold), in agriculture (silage preservation) and in
animal feed.

27
CHAPTER 2
Preliminary studies on
biohydrogen production in
vinasse-based media by
anaerobic bacteria

28
1 Introduction
1.1 Substrates for Biohydrogen Production
Currently, the cost of H2 generated from biological processes is very high.
Intensive research on biohydrogen is underway, and in the last few years several
novel approaches have been proposed and studied in order to surpass economical
drawbacks that prevent its industrial production (61). Environmental concerns and
evolving legislations on international scale, and considerations about increasing
energy prices, request more participation of net energy producing waste treatment
processes for sustainable pollution control (37). Since the carbon dioxide produced
during the fermentation is derived, directly or indirectly, from recently fixed
atmospheric CO2, the net CO2 charge in dark fermentation processes using
agroindustrial wastes is zero.
In respect to the range of potential substrates which can be utilized by the
broad range of hydrogen producing bacteria it can be stated that, at present, it is
vast and open for further exploration. The major problem in developing large scale
technologies using such wastes is their availability and coverage. In this terms,
domestic and industrial waste waters are good examples, since they will be
produced wherever there is industrial and human activity. The energy accumulated
in wastes can be harvested and converted to hydrogen through dark fermentation.
The energy, now accumulated in hydrogen molecules, can be then converted to
electricity or heat or be stored for further use.
Recently, complex carbon sources, such as molasses (114), food wastes (45),
dairy wastewater (115), mushroom waste (116), rice slurry (116), cheese wey (117),
lignocellulosic materials, glycerol waste (118), vegetable waste (119) and many
others were proved to be susceptible for dark fermentation (Table 3). The more
carbohydrate the wastewater/biomass contains, more suitable it is for biohydrogen
production. Most of times pre-treatment of the complex-carbohydrate source (usually
thermal treatment) is necessary to generate high production rates, otherwise
biohydrogen production is limited by the microorganism(s) hydrolytic activity.

29
Table 3 – Some examples of yields of biohydrogen production achieved using agroindustrial residues as carbon sources.
Microorganism Y(H2/S) (mol.mol-1) Carbon source Reference
Caldicellulosiruptor
saccharolyticus 2.3 bagasse 108
Clostridium butyricum 0.76 Rice straw
hydrolisate 109
Clostridium butyricum 0.75
Sugarcane
bagasse
hydrolisate
110
Clostridium thermocellum 1.47 Delignified
wood fibers 111
Ruminococcus albus 2.59 Sorghum
residues 112
Thermoanaerobacterium
thermosaccharolyticum 2.4
Corn stover
hydrolisate 113
Because of the complex nature of the substrates frequently used and the
often no identification of mixed microbial cultures it is difficult to compare one study
with another (61). The highest H2 yields have been achieved using Clostridia, enteric
bacteria and hyperthermophiles. The strict anaerobic Clostridia are said to produce
hydrogen in higher yields than facultative anaerobes. Extreme thermophiles
achieved yields of approximately 83-100% of the maximal theoretical value of 4
mol/mol (38), but usually grow to low biomass concentrations (resulting in low
production rates). The proper choice of microorganism(s) and substrate is crucial in
the development of a feasible biohydrogen and VFAs production technology.
The use of mixed cultures in the production of hydrogen is an alternative that
is being actively studied by the scientific community. High yields of 2,6 molH2.mol-
1glucose (125) and productivities of up to 150 mmolesH2.L-1.h-1 were described (126).
The main advantages related to mixed culture fermentations are the considerable
low susceptibility to contamination and less toxicity to oxygen, which favor process
handling. Moreover, when complex substrates are used the presence of different
microorganisms generally improves substrate degradation and consequently

30
hydrogen production. On the other side, issues associated to process stability are
noted (modifications on the process or variation on the composition of the substrate
may lead to changes in the microbial community.
1.1 Sugarcane Vinasse
In Brazil, ethanol is produced through a classic fermentation process, in which
yeasts transform sugarcane juice, molasses, or a molasses-juice mixture into
ethanol. This is a biological process that can be represented by the stoichiometric
equation of Gay Lussac:
C12H22O11+ H2O à C6H12O6 + C6H12O6 (a)
C6H12O6 à 2CH3CH2OH + 2CO2 + 23,5 kcal (b)
At the end of the fermentation, practically 100% of the sugar (sucrose) present
in the culture media is consumed by the yeast (usually a Saccharomyces), resulting
in a liquid called wine. The wine has a concentration of ethanol (% in volume)
between 6 and 10°GL, which is recovered by distillation in the top part of distillation
columns, where the present volatile substances are separated based on their
different boiling points.
Vinasse is removed from the base of the distillation columns. It is nothing
more than the fermented broth free of ethanol. It contains some organic solids in
suspension as well as minerals, residual sugar and some volatile compounds.
Considering the ethanol concentration in the wine, vinasse is generated in an
average proportion of 12 to 15 liters for each liter of alcohol produced. According to
Monteiro (33), the physicochemical characteristics of vinasse are: pH 3.8-5.0; Total
solids (g/l) 21.0-85.0; Soluble solids (g/l) 4.0-31.0; Non-soluble solids (g/l) 3.0-13.0;
C.O.D. (mg/l) 15,000-27,000; Water (%) 89-96; Organic matter in total solids (%) 70;
Nitrogen (g/l) 1.0-3.5; Phosphorus (g/l) 0.4-4.0; Potassium (g/l) 9.0-13.0; Magnesium
(g/l) 0.8-1.5; but this varies considerably and should be analyzed case by case.
Because of its production rate and its chemical characteristics vinasse constitutes
the largest pollution source of the Brazilian ethanol industry.

31
Currently, the destination given to vinasse is its aspersion over sugarcane
plantations. Vinasse is usually stored in depuration lagoons (Figure 3) prior use.
Channels are built through sugarcane plantations where vinasse drains and a motor
pump truck is responsible to sprinkle the liquid (Figure 4). Its application as fertilizer
has some advantages, especially in terms of productivity, but the amount used might
be well determined. There is a maximum rate of vinasse application in the field,
based on soil composition (but in practice soil characterization is not carried and
inspection by environmental organizations is very difficult to be handled).
Figure 3 – Depuration LPB AH2on where vinasse is stored at Usina Catanduva (Catanduva, São Paulo, Brazil). At
the day this picture was taken, the flow of vinasse was 350m³.h-‐1.

32
Figure 4 -‐ Channels for the distribution of vinasse along the field at Usina Catanduva (Catanduva, São Paulo,
Brazil. It can also be seen a pump used for vinasse aspersion.
.
When used in excess, productivity reduction, late maturation and low sucrose
content are commonly observed (120). When vinasse is produced in excess and
cannot be used as fertilizer, which is very common, industries throw it in areas called
“sacrifice zones”. In this area the soil becomes very salty and acid causing
desertification and rendering it unusable for any other purpose. In long-term these
characteristics are also noted in productive land, causing productivity decrease, late
maturing and decrease in sucrose content (120). In 1986 40% of the vinasse
produced in Brazil was not used as fertilizer and was thrown in sacrifice zones (121).
Unfortunately no updated data collection is available (informal conversations with the
environmental manager of an industry in São Paulo indicates that this number is
approx. 25%).
Seiju Hassuda (34) identified infiltration problems due to vinasse aspersion in
Bauru Aquifer (SP-Brazil), the most important aquifer in Brazil. This problem is not
only related to the sacrifice zones, since it can be seen in the Figure 4 that no
protection is given to avoid vinasse infiltration in the soil. New government
regulations are now forcing the industries to coat the channels (Figure 5), but
inspection is very limited. Mellissa et al (35) stated vinasse can promote changes of
soil physical properties in two different ways: (i) improving aggregation, consequently

33
raising the capacity of infiltration of water in the soil, thus causing ions leaching and
contamination of the groundwater; and (ii) promoting the dispersion of soil particles,
reducing the rate of infiltration and increasing the runoff, resulting in possible
contamination of surface water.
Figure 5 -‐ Coated channel at Usina Catanduva (Catanduva, São Paulo, Brazil) folowing the new legislation.
In this context, it is of great importance to give a more rational destination to
vinasse or at least reduce its toxicity.
During the last decades, ethanol production has increased very rapidly. Brazil
is, nowadays, the second higher ethanol producer in the world. Recent international
incentive and demand for biofuels production influenced Brazilian ethanol industries,
increasing production. Thus, the problem of vinasse disposal will worsen. Indeed, its
continuous discharge onto land can endanger the chemical and physical structure of
the soil, reduce yields and lead to serious groundwater pollution problems.
Usina Sao Martino (Sao Paulo – Brazil) installed a pilot plant for the
biodigestion of vinasse, obtaining biogas, which is used to burn as fuel in the boilers
of the plant. The technology has reached a reasonable degree of maturity due to the
successive experiments, but some uncertainties decelerated its scale up (42). In the
year 2012 a 612 MWh biogas plant was installed at Companhia Alcoolquímica
Nacional (Vitória do Santo Antão, Pernambuco, Brazil) for the processing of 20% of
the vinasse produced daily.
Regarding the composition depicted in Table 4, vinasse is an interesting
substrate for microorganism growth because it presents a great amount of
micronutrients. Iron, magnesium, phosphorus and nitrogen content are interesting for

34
the development of biohydrogen production. The fact that some successful cases of
methane production are described also reinforced the possibility of hydrogen
production.
Table 4 -‐ Physico-‐Chemical characterizations of Vinasse (media of 64 samples from 28 ethanol industries from São Paulo – Brazil) (54).
Parameter Unity Medium Value
pH 4,15
Brix ºB 18,65
DBO5 mg/L O2 16494,76
DQO mg/L O2 28450,00
Calcium mg/L CaO 515,25
Chloride mg/L Cl 1218,91
Cooper mg/L CuO 1,20
Iron mg/L Fe2O3 25,17
Phosphorus mg/L P2O4 60,41
Magnesium mg/L MgO 225,64
Manganese mg/L MnO 4,82
Nitrogen mg/L N 356,63
Ammonia Nitrogen mg/L N 10,94
Potassium mg/L K2O 2034,89
Sodium mg/L Na 51,55
Sulfate mg/L SO4 1537,66
Sulfite mg/L SO4 35,90
Zinc mg/L ZnO 1,70
Ethanol- CG mL/L 0,88
Glycerol mL/L 5,89
Because low amounts of fermentable carbon are present in its composition,
vinasse might be enriched with a carbohydrate source to allow the production of
great quantities of hydrogen. Some cheap fermentable carbon sources are available
in Brazil, especially in the ethanol industries, where vinasse is generated: sugarcane

35
molasses and sugarcane juice. Molasses arises from sugar production, after the
sugarcane juice concentration and centrifugation. Usually it is used in yeast
fermentation for ethanol production, together with sugarcane juice.
Considering the usage of molasses or sugarcane juice as carbon sources
they do not burdens on the cost of the medium for biohydrogen production. At this
point, promotion and maintenance of anaerobic environment are the processes that
will probably impact most significantly the price of the final product. If purified,
biohydrogen can be used in chemical industry or in fuel cells for the production of
electricity. Otherwise, the hydrogen-rich biogas can be used for heat generation
through direct combustion or in boilers.
Preliminary studies on the evaluation of using vinasse as culture medium for
biohydrogen and VFAs production by anaerobic bacteria were carried at the
Laboratoire de Gènie Chimique et Biochimique (LGCB) at the Université Blaise
Pascal - Clermont-Ferrand, France, and are described in this chapter.
2 Material and Methods
2.1 Anaerobic Medium Preparation The procedures for promoting an anaerobic culture were based on the
technique developed by Ralph S. Wolfe during the mid-1970s, which is generically
referred to as “the Balch technique”.
The removal of oxygen and lowering the redox potential of culture media by
the addition of a reducing agent are the two crucial parts of the technique. The
removal of oxygen was achieved by boiling the medium under an anoxic ambient
(CO2 atmosphere) (Figure 6). The CO2 was scrubbed free of oxygen in a heavy-
walled copper tube packed with copper turnings and heated to 150–200ºC in a tube
furnace.

36
Figure 6 -‐ Technique of producing an anaerobic medium. Boiling under anoxic environment is one important
step.
Bicarbonate was added at the temperature of 85ºC and Cysteine-HCl at 65ºC
as reducing agents to lower the redox potential of medium. To assure oxygen
removal Resazurin was used as indicator. After naturally cooling to room
temperature the medium was distributed into 15ml Hungate tubes under pure CO2
atmosphere and autoclaved.
The experiments were carried out in 15 ml Hungate tubes, with working
volume of 6 ml, sealed with autoclavable Bakelite lids with rubber stopper and
incubated in a shaker at 37ºC and 30 rpm.
Fermentation medium was constituted by pure vinasse supplemented with
10g/L of one of the following carbon sources: glycerol, sucrose and glucose. The
cultures were maintained at these conditions for 1 week and then inoculated in a
new medium. Each new culture will be called “generation”.
2.2 Microorganisms Two known Clostridium strains, C. saccharoperbutylacetonicum and C.
beijerinckii purchased from ATCC (ATCC #27021 and #8260, respectively), two
isolated Clostridium strains (C2 and C6) and one natural vinasse consortium (VINA)
were used.

37
The two ATCC strains are potential hydrogen and VFAs producers able to use
sucrose as carbon source. The isolated Clostridium strains, C2 and C6, were chosen
based in hydrogen and VFAs production among other isolated strains from the
Laboratory Génie Chimique et Biochimique (LGCB). C6 is capable of using sucrose
as carbon source, while C2 can only growth in glucose medium. The vinasse natural
consortium, VINA, was obtained directly by incubating anaerobic pure vinasse
supplemented with sucrose.
2.3 Biogas Production and Composition Analysis
Biogas production in Hungate tubes cultures was periodically measured using
60 mL plastic syringes (Figure 7). Gas production was measured and analyzed twice
in a week or daily, according to the experiment. Those cultures degassed daily were
considered free of H2 partial pressure. Hydrogen total production and production rate
was calculated based on the volume of medium, gas composition and intervals of
analysis.
Figure 7 -‐ Biogas quantification using a 60ml syringe.
The biogas sampled from the headspace was analyzed using a MicroGC
Agilent 300A with 2 channels for gas analysis. Hydrogen (H2), oxygen (O2), nitrogen
(N2) and methane (CH4) was measured through a MoleSieve 5A (10mx0.32mm)
column operated at 100ºC, at injector temperature of 95 °C, using argon as the

38
carrier gas at 30ψ. Carbon dioxide (CO2), hydrogen sulfite (H2S), air and water vapor
(H2O(v)) were measured in a PLOT U (8mx0.32mm) column operated at 70ºC, at
injector temperature of 70 °C, using hydrogen as carrier gas at 15ψ. Each column
was connected to a separated TCD for detection.
2.4 Ion Chromatography (IC)
Ion chromatography (761 Compact IC 817 Bioscan chromatograph) was used
for the determination of vinasse mineral composition. For cations analysis a Metrohm
METROSEP C3 250/4.0 (250 mL x 4.0 mmID) column was used. Analytical
conditions were: 3.5 mM HNO3, 1.0 mL/min, 40ºC, 20 µL sample volume, 11.2 MPa.
A standard chromatogram was prepared with the following cations: Ca, Mg, K, Na,
Zn, NH4 and Fe. Anions analyses were made in a Metrosept A Supp 5 250/4.0
column (250 mL x 4.0mmID). Analytical conditions were: 3,2mM Na2CO3 + 1mM
NaHCO3, 1.0 mL/min, 40ºC, 20 µL sample volume, 10.2 MPa. A standard
chromatogram was prepared with the following anions: F, Br, NO3, PO4, SO4 and Cl.
All reagents used were analytical grade (Sigma–Aldrich).
2.5 High Performance Liquid Chromatography (HPLC)
Organic components were determined through High Performance Liquid
Chromatography (HPLC). Before injection the samples (2 ml) was treated with 0.25
ml of BaOH (0.3M) and 0.25 ml of ZnSO4 (5%), centrifuged for 10 min at 104xg and
filtered (Milipore 0,2µm), to avoid column obstruction by suspended solids.
The HPLC equipment used was an Agilent 1100, equipped with 2 ion
exclusion columns (Phenomenex Rezex ROA 300 x 7.8 nm) placed in series in a
50ºC oven. A 2mM sulfuric acid in ultrapure water solution (Millipore, MilliQ plus) was
used for elution at 0.7 ml flux (pomp HP 1100 series, Agilent Technologies). The
chromatograph is equipped with an automatic injector (Agilent Rhéodyne). Detection
was done through a refractive index detector (HP 1100 series) and the signals
integrated (HP 1100 series). The acquisition is done by the HPChem program
(Agilent Technologies). The compounds quantified by this method are cellobiose,

39
glucose, fructose, succinate, lactate, formate, acetate, propionate, isobutyrate,
butyrate, isovalerate and valerate.
2.6 Nuclear Magnetic Resonance
Measurements of NMR spectra were performed at 27 °C on a 300 or 500 MHz
Avance Bruker spectrometer equipped with 5mm TXI 1H, 13C, 15N probe with inverse
detection.
Samples were centrifuged (10000 rpm, 10min) and to 540 µl of supernatant,
60 µl of a solution TSPD4 (2,08 ml TSPD4 10mM + 7,92ml D2O - used as internal
reference for chemical shift and quantification).
2.7 Proteins and Aminoacids Quantification
Proteins were quantified by the method of Bradford. The Dye stock was
prepared by dissolving 100 mg of Coomassie Blue G in 50 ml of methanol, followed
by the addition of 100 ml of 85% H3PO4 and dilution to 200 ml with distilled water.
Due to the natural color of vinasse, the methodology was adapted. The procedure
was made by adding 1 ml of dye stock to 4 ml of sample. The absorbance was read
at 595 nm. A standard curve was made using vinasse instead of water by adding
known quantities of BSA to each sample, in order to minimize the effect of vinasse’s
color on the results. The amount of protein in vinasse was determined based on the
equation obtained by the linearized curve.
3 Results and Discussion
3.1 Vinasse Analysis
The mineral composition of vinasse was analyzed by ion chromatography and
is presented in Table 5. The ions that could not be determined were considered
based on the analysis made by Neto and Nakahodo in 1995 (54). The organic
composition of vinasse was determined by HPLC and RMN (Table 6).

40
Table 5 – Mineral composition determined by Ion Chromatography. Those considered following the studies of Neto and Nakahodo, 1995 (54), are signaled with a (*).
Mineral mg/L
Ca 515,25
Cl 1218,91
P 120,82
Mg 244,71
N 356,63
K 1750,9
Na 51,55
SO4 1537,66
NNH3* 10,94
Cu* 1,2
Fe* 25,17
Mn* 4,82
SO3* 35,9
Zn* 1,7
Table 6 – VFAs composition of vinasse by HPLC and RMN analysis.
VFA mg/L Ethanol 0 Butyrate 1300
Propionate 1100 Acetate 700 Lactate 200
Proteins were quantified by the method of Bradford and resulted in
approximately 670 mg/L. Aminoacids quantified by the ninhydrin method resulted in
470 mg/L. Since no carbohydrate was detected, it was expected the necessity to
supplement vinasse medium with an organic source of carbon for feasible
biohydrogen production.
As expected, vinasse analysis indicated that it is a rich residue, containing a
great variety of mineral compounds. This is interesting for bacterial growth and also

41
in promoting hydrogen production (especially iron). The presence of some VFAs is
not ideal but they are present in low amounts and might not be a problem for
biohydrogen production.
3.2 Effect of carbon source in biohydrogen and VFAs production
Since vinasse analysis indicated absence of sugars, different carbon sources
were added to vinasse. The choice of the carbon source to be added is of great
economic importance to the process. The use of pure carbon sources in these
preliminary experiments was carried in order to evaluate the metabolism and the
potential of each strain prior to the use of complex substrates.
The following substrates were evaluated in these preliminary experiments:
(i) Sucrose: sucrose is present in high concentrations in sugarcane
molasses, a residue from industrial sugar production, and also in sugarcane juice,
which is extracted for both alcohol and sugar production. Because of its availability
sucrose (or alternative sources of sucrose) is probably the most interesting carbon
source to be used.
(ii) Glycerol: glycerol is another interesting carbon source because it is
produced in great amounts in biodiesel industries, which are largely increasing in the
last years. The fate of the glycerol generated in biodiesel industries is object of great
concern due to the enormous amounts produced, making it an interesting substrate
for the process proposed in this work.
(iii) Glucose was also tested to serve as model as it is the most easily
assimilated source of carbon by the majority of microorganisms. It can be obtained
from complex substrates through hydrolysis.
3.2.1.1 Hydrogen production in vinasse medium supplemented
with pure carbon sources
During 20 generations the gas produced during fermentation was measured
and analyzed twice a week (4th and 7th days of fermentation). Results of average
hydrogen production rate (in mL.L-1.day-1) and average total production (in mLH2.L-1)
of each strain are showed in Table 7.
42
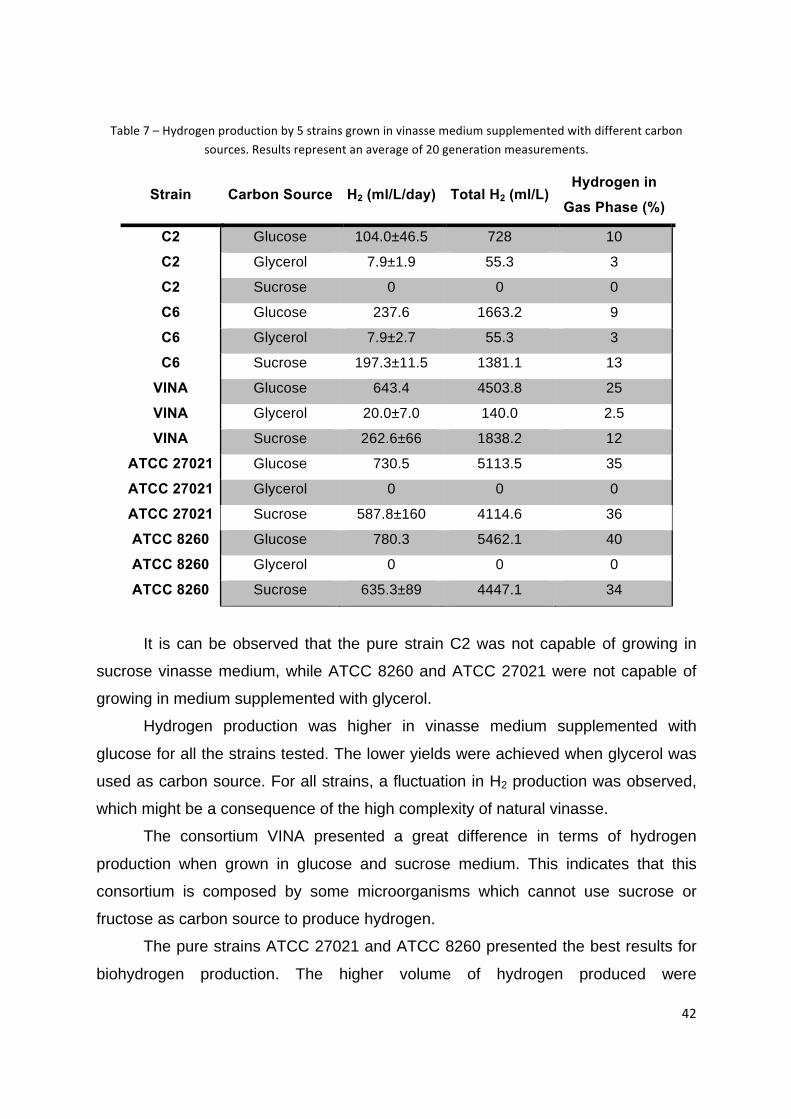
Table 7 – Hydrogen production by 5 strains grown in vinasse medium supplemented with different carbon
sources. Results represent an average of 20 generation measurements.
Strain Carbon Source H2 (ml/L/day) Total H2 (ml/L) Hydrogen in
Gas Phase (%)
C2 Glucose 104.0±46.5 728 10
C2 Glycerol 7.9±1.9 55.3 3
C2 Sucrose 0 0 0
C6 Glucose 237.6 1663.2 9
C6 Glycerol 7.9±2.7 55.3 3
C6 Sucrose 197.3±11.5 1381.1 13
VINA Glucose 643.4 4503.8 25
VINA Glycerol 20.0±7.0 140.0 2.5
VINA Sucrose 262.6±66 1838.2 12
ATCC 27021 Glucose 730.5 5113.5 35
ATCC 27021 Glycerol 0 0 0
ATCC 27021 Sucrose 587.8±160 4114.6 36
ATCC 8260 Glucose 780.3 5462.1 40
ATCC 8260 Glycerol 0 0 0
ATCC 8260 Sucrose 635.3±89 4447.1 34
It is can be observed that the pure strain C2 was not capable of growing in
sucrose vinasse medium, while ATCC 8260 and ATCC 27021 were not capable of
growing in medium supplemented with glycerol.
Hydrogen production was higher in vinasse medium supplemented with
glucose for all the strains tested. The lower yields were achieved when glycerol was
used as carbon source. For all strains, a fluctuation in H2 production was observed,
which might be a consequence of the high complexity of natural vinasse.
The consortium VINA presented a great difference in terms of hydrogen
production when grown in glucose and sucrose medium. This indicates that this
consortium is composed by some microorganisms which cannot use sucrose or
fructose as carbon source to produce hydrogen.
The pure strains ATCC 27021 and ATCC 8260 presented the best results for
biohydrogen production. The higher volume of hydrogen produced were

43
accompanied by higher hydrogen concentration on the gas phase, which is also
important for future gas purification processes.
In those media supplemented with sucrose, H2 production was considerable
high and not much lower than when glucose was used, except for VINA consortium.
An interesting point that might be considered is the availability of cheap sucrose
sources in Brazilian Ethanol Industries (molasses and sugarcane juice). For these
reasons sucrose was chosen as the carbon source for the following experiments.
3.2.1.2 Liquid phase analysis of cultures carried in vinasse medium
with sucrose as carbon source
In the 7th day of the cultures carried in sucrose supplemented vinasse medium
samples were withdrawed and analyzed. Results of HPLC and RMN analysis of the
fermented broth are presented in Table 8.
Acetate and butyrate were the main VFA products by VINA, C2 and C6.
These strains also produced ethanol and propionate. ATCC 27021 and ATCC 8260
presented acetate, butyrate and propionate as main products. Lactate was also
produced in significant amount, suggesting that the metabolism of Acetyl Co-A (and
consequently H2 and VFAs) was blocked. Valerate and isobutyrate were found in
trace concentrations and are not showed. The presence of more reduced products,
such as ethanol, is an evidence of a metabolic shift caused by hydrogen partial
pressure caused by non-continuous gas measurements.
.

44
Table 9 – VFAs produced (in g/L) by different strains and the consortium VINA in vinasse based
medium.
Strain Acetate Formate Butyrate Ethanol Propionate Lactate
ATCC 27021
1.79±0.25 0 3.53±0.14 0 1.42±0.0 0.79±0.09
ATCC 8260
1.64±0,11 0 4.28±0.21 0 1.39±0.05 0.59±0.0
VINA 1.7±0.2 0.6±0.2 2.3±0.31 1.8 0.9±0.0 0.25±0.05
C2 1.3±0.0 0.15±0.05 1.6±0.09 2.4 1.4±0.3 0.1
C6 1.4±0.2 0.5±0.3 1.3±0.11 2.6±0.11 1.0±0.1 0.2±0.15
3.2.1.3 Metabolism effect when minimizing H2 partial pressure
Knowing that hydrogen partial pressure is central in hydrogen production an
experiment was carried withdrawing (and analyzing) daily the gas produced
during fermentation. Results are showed in Table 10.
Table 10 – Hydrogen production by 5 strains grown in Natural Vinasse Media (NVM) supplemented with different carbon sources avoiding hydrogen accumulation. Results represent an average of 20 generation
measurements.
Strain Carbon Source H2 (ml/L/day) Total H2 (ml/L) Hydrogen in
Gas Phase (%)
C2 Glucose 100.0 700.0 7
C6 Sucrose 202.8 1419.6 10
VINA Sucrose 403.9 2827.3 13.4
ATCC 27021 Sucrose 2526.3 17684.1 33
ATCC 8260 Sucrose 1895.8 13270.6 24
A great increase of hydrogen production was observed for both ATCC strains
and for the consortium VINA in comparison with the experiments described in the
previous section (Table 7).

45
Since gas production was greatly increased by minimizing H2 partial pressure,
analysis of the liquid phase was also carried. The VFAs analysis at the 4th day of
cultivation is showed in Table 11. At this point no sugars were detected in
cultivations of C6, C2 and VINA, while in cultivations of ATCC 27021 and ATCC
8260 3.5g/L and 0.37g/L, respectively, were detected. The negative concentrations
found for propionate and lactate indicates the consumption of these metabolites in
comparison to the non-fermented medium.
Table 11 – VFAs concentrations (g/L) at the 4th day of fermentation in vinasse based medium.
Strain Acetate Formate Butyrate Ethanol Propionate Lactate Succinate
ATCC 27021
0.90 0 2.49 0 -0.38 -0.37 0.16
ATCC 8260
0.98 0 3.13 0.08 -1.10 -0.37 0.16
VINA 1.05 0.4 0.41 2.60 -0.70 -0.37 0
C2 0.82 0.32 0.49 2.00 -0.38 -0.37 0
C6 0.98 0.4 0.17 2.64 -0.70 0 0.08
Another VFAs analysis was carried in the last day of culture (7th day), when
the substrate was completely consumed in all cultures. Results are showed in Table
12.
Table 12 – VFAs concentration (g/L) at the 7th day of fermentation in vinasse based medium.
Strain Acetate Formate Butyrate Ethanol Propionate Lactate Succinate
ATCC
27021 1.14 0 3.61 0 -1.10 -0.37 0.16
ATCC 8260
1.94 0.08 2.55 0.16 -1.10 -0.37 0.24
VINA 0.98 0.40 0.41 2.48 -0.70 -0.37 0
C2 0.98 0.4 0.17 2.60 -0.70 0 0.08
C6 1.14 0.48 0.25 2.88 -0.62 -0.13 0

46
Strains ATCC 27021 and ATCC 8260 produced acetate and butyrate as main
VFAs, while C2, C6 and the consortium VINA produced mostly acetate and ethanol.
All strains presented the capacity of consuming lactate and propionate under the
conditions tested.
Comparing the VFAs production in 4th and 7th day it can be observed a
considerable increase in butyrate concentration in ATCC 27021 and in C2 (although
butyrate concentration in C2 is low) and in acetate for ATCC 8260. The other VFAs
didn’t show considerable variation, which is compatible with the presence of sugar in
4th day and with the consumption of propionate between the 4th and 7th day.
It is also interesting to note the effect of the H2 partial pressure in VFAs
production by comparing tables 8 and 11. When H2 partial pressure was minimized it
was observed an enhanced production of more oxidized products.
Based on VFAs and gas analysis it was noted that high butyrate/acetate ratio
is related to higher hydrogen content in the gas phase (Table 13). At the same time
there is a relation between the amount of gas produced and the hydrogen
concentration in the gaseous phase.
Table 13 – Butyrate/acetate ratio, gas produced and hydrogen content in the gas phase in the experiments carried with each strain. Butyrate/Acetate ratio was considered based on VFAs analysis of the 7th day of
fermentation.
C2 C6 VINA ATCC 8260 ATCC 27021
Butyrate/Acetate 0,17 0,22 0,42 1,31 3,17
H2 (%) 7 10 13,4 24 33
Gas (Lgas/Lmedium) 10 14,19 21,10 55,29 53,59
4. Conclusion Vinasse has proved to be an interesting base medium for biohydrogen and
VFAs production by anaerobic bacteria. Higher yields were achieved when
glucose was used as substrate, closely followed by the yields achieved in
sucrose vinasse medium. Due to process economics (higher availability and no

47
need of processing) sucrose was chosen as the substrate for VFAs biohydrogen
production in vinasse based medium.

48
CHAPTER 3
Metabolic analysis of potential
strains and consortia for the
production of biohydrogen and
VFAs in vinasse medium

49
1 Introduction The anaerobic degradation of organic matter by heterotrophic microorganisms
can liberate H2 at high rates, depending on the particular organisms and conditions.
Hydrogen producing microorganisms can be divided in four groups: strict anaerobes
(I), facultative aerobes (II), aerobes (III), co- and mixed cultures (IV) (2). The first
group is the most studied, and the most important microorganisms are Clostridia,
Rumen bacteria, thermophiles and methanogens. Known facultative anaerobes
include Enterobacter, E. coli and Citrobacter and known aerobes are Alcaligenes
and Bacillus.
Most studies described in the literature use glucose and sucrose as carbon
sources for biohydrogen production via dark fermentation (
Table 14). The search for endogenous microorganisms in the development of
bioprocess technologies is of great importance due to their increased adaptation to
specific conditions. It is believed that for future applications of biohydrogen
processes the use of mixed cultures from industrial wastes might have more
advantages because they are less susceptible to contamination by H2-consuming
bacteria and are more sensitive to process variations.
Other advantages of making use of a diverse microbial community when
(agro)industrial wastes are used as substrate are: (i) development of a food web
where specific groups of organisms maintain low concentration of critical
intermediate products and promote flux of carbon and electrons from the feedstock
material to the desired end product by reducing direct inhibition of microbial activity
by metabolic intermediates (121); (ii) higher adaptation to substrate variation, which
is an intrinsic characteristic of (agro)industrial wastewaters, due to the presence of
alternative metabolic pathways.
Microflora from various sources has been used as inoculum for hydrogen
production (see some examples in

50
Table 15). Digester sludge from the treatment of urban wastewater, livestock waste,
anaerobic sludge effluent and soil are common sources of inoculum. To avoid
methane producers, heating (75-121oC for 15-120min) or chemical (2-
bromoethanesulfonate) treatments are frequently used. Table 14 – Yields of biohydrogen production of microorganisms grown in pure carbon sources.
Microorganism Y(H2/S)
(mol.mol-1)
Carbon
source Reference
Clostridium acetobutylicum 1.39 glucose 93
Clostidium beijericnkii 1.86 glucose 94
Clostidium beijericnkii 4.20 sucrose 95
Clostidium butyricum 1.35 sucrose 96
Clostidium
saccharoperbutylacetonicum 1.72 glucose 97
Clostridium sp. 3.24 lactose 98
Clostridium beijericnkii 3.9 cellobiose 95
Clostridium butyricum 0.72 xylose 99
Enterobacter aerogenes 1.89 sucrose 100
Enterobacter aerogenes 0.83 lactose 100
Enterobacter aerogenes 0.39 fructose 101
Escherichia coli 1.95 glucose 102
Klebsiella oxytoca 1.5 sucrose 103
Ruminococcus albus 2.11 glucose 104
Ruminococcus albus 1.44 arabinose 105
Thermoanaerobacterium
thermosaccharolyticum 7.44 lactose 106
Thermoanaerobium
thermosaccharolyticum 2.42 glucose 107

51
Table 15 -‐ Some yields achieved by using consortia for in fermentation of different substrates.
Culture Y(H2/S) (mol.mol-1) Carbon source Reference
Anaerobic Digester 2.18 Glucose 87
Rice Rhizosphere microflora 2.3 Apple pomace
wastes 88
Activated and Digested
sludge 1.16 Glucose 89
Digested wastewater sludge 6.12 Sucrose 90
Methanogenic granules 1.2 Glucose 91
Anaerobic mixed culture 5.15 Sugar-beet pulp 92
Since the choice of the microorganism is of great importance, this chapter
reports the search and evaluation of potential strains and consortia from the Brazilian
environment for the production of biohydrogen and VFAs. Samples were taken from
environments capable of supporting anaerobic forms of life. The metabolic behavior
of each strain/consortium was evaluated in vinasse medium supplemented with
cheap sources of sucrose (sugarcane juice and sugarcane molasses) and under the
presence/absence of hydrogen partial pressure.
2 Material and Methods
2.1 Microorganisms
Besides the strains ATCC 8260, ATCC 27021, C2, C6 and the consortium
VINA used in the experiments described in the previous chapter, 9 samples of
Brazilian environments with proper conditions for the development of methane
producers (and consequently, hydrogen producers) were collected. The name of the
strains and origin are described in Table 16.

52
Table 16 – Origin of the samples collected with potential for methane/biohydrogen production.
Name Origin
LPB AH1 Faeces from fruit bat (unknow species)
LPB AH2 Lake of a dairy farm
LPB AH3 Soil used for Sugarcane cultivation
LPB AH4 Domestic sewage
LPB AH5 Swine faeces
LPB AH6 Mangrove from Matinhos-Paraná
LPB AH7 Cow feaces
LPB AH7 Puddle in a cave at São Paulo
2.2 Medium Composition and Culture Conditions
The experiments were carried out in 15 ml Hungate tubes, with working
volume of 6 ml, sealed with autoclavable Bakelite lids with rubber stopper and
incubated in a shaker at 37ºC and 30 rpm. The cultures were maintained at these
conditions for 1 week and then inoculated in a new medium. 1 ml of culture was,
then, inoculated in 5 ml of medium. Each new culture will be called “generation”.
Anaerobic environment and medium was carried according to the Balch
technique. Bicarbonate was added at 85ºC and Cysteine-HCl at 65ºC as reducing
agents to lower the redox potential of medium. Otherwise stated, medium pH was
adjusted to 6.8 with 1N KOH.
Anaerobic media containing vinasse and different sucrose sources were used:
i) Sucrose + vinasse, ii) Sugarcane molasses + vinasse and iii) Sugarcane juice +
vinasse. Carbon source concentration in the media was fixed in 10g/L. Sugarcane
molasses addition to reach 10g/L was based on obrix while sugarcane juice sugar
content was quantified by the phenol sulphuric method. All strains and consortia
were cultivated in this media during 15 generations before analysis.

53
2.3 Culture media and Medium Analysis
Because the vinasse used at the preliminary studies (presented in chapter 2)
was concentrated and then reconstituted prior to use, a new fresh vinasse was used
in media preparation. This decision was based on the unknown effects of
concentration in vinasse composition and the necessity to carry the experiments
(described in chapters 3, 4 and 5) with the same vinasse.
The new vinasse was a courtesy of Usina Moreno (located in Planalto-SP)
and was collected from the first storage tank situated after the distillation unit. The
industrial process carried at Usina Moreno involves the use of the excess molasses
from sugar production together with sugarcane juice to produce ethanol.
Vinasse composition was determined by BioAgri Laboratories (registration
number 278887/2011-0) and is presented in Table 16.
Experiments were also carried in a synthetic medium, known as Clostridium
acetobutylicum medium (CAB), largely used in cultivation of Clostridia. CAB medium
contains, per liter: 4.0 g yeast extract, 1.0 g tryptone, 1.5 g K2HPO4, 0.5 g
asparagine, 1 ml of 0.2%(v/v) resazurin, 0.1 g MgSO4.7H2O, 0.1 g MnSO4.H2O, 15
mh FeSO4.7H2O, 0.1 g NaCl, 10 g sucrose. pH was adjusted to 7,0 with KOH.
Fermentations were compared to a not fermented medium. The results
present in tables are difference between the fermented medium and the not
fermented medium (negative results means consumption of the respective VFA).
2.4 High Performance Liquid Chromatography (HPLC) and Ethanol
quantification.
Organic components were determined through High Performance Liquid
Chromatography (HPLC). Before injection the samples (2 ml) were centrifuged and
filtered (Milipore 0,2µm).
The HPLC equipment was an Shimadzu Liquid Chromatograph equipped with
a Aminex® HPX-87H 300 x 7,8mm (Bio-Rad) column and a refractive index detector
(RID-10A). The column was kept at 60oC and a 5mM H2SO4 at 0,6 ml/min was used
as mobile phase. The compounds quantified by this method are glucose, fructose,

54
succinate, lactate, formate, acetate, propionate and butyrate. All chemicals used
were of analytical grade.
Because the retention time of butyrate and ethanol are very similar, it was
impossible to differentiate them by HPLC. The method used for determining ethanol
content was based on the oxidation of ethanol to acetic acid by reaction with
potassium dichromate in an acidic medium. The solution acquires a green color
proportional to the ethanol concentration in the sample, enabling the reading on the
spectrophotometer at 600 nm. The standard solution of potassium dichromate (1 L)
consisted of the following components: 500 ml of distilled H2O, 325 mL concentrated
H2SO4 and 33.678 g of potassium dichromate.
2.5 Gas Analysis
Gas was collected by inserting a graduated syringe through the flange-type
butyl rubber septum (Figure 8). Cultures degassed daily were considered free of H2
partial pressure, different from those degassed twice a week (4th and 7th days).
Figure 8 – The use of a graduated syringe in the quantification of the gas produced during fermentation

55
The gas from some generations (those that were analyzed for VFAs) had the
produced gas purified for hydrogen content estimation. Purification was carried by an
adaptation of a widely used technique that involves the pulverization of the biogas a
column containing a 10% NaOH solution. This system was used because carbon
dioxide and H2S reacts instantly reacts with NaOH, but hydrogen do not. The tower
used was made of glass and was filled 50% of its volume with different sized glass
beads in order to increase gas contact time with the basic solution. Gas was injected
at approximately 2 ml/s through a porous stone. Hydrogen content was estimated by
dividing the volume obtained after and before purification.
3 Results and Discussion
3.1 Vinasse composition
The vinasse used in these experiments was analyzed for its composition and is
presented in Table 16.
It can be noticed the presence of important ions for the production of
biohydrogen, such as iron, manganese, magnesium and phosphorus. Moreover, the
low content of nitrogen indicates that microbial growth will be greatly limited unless it
is added to the medium.
Regarding this, total nitrogen content in the medium supplemented with
molasses and sugarcane juice was determined by the Kjeldahl method. In molasses
supplemented medium, nitrogen content was approx. 73 mg/L while in sugarcane it
was approx. 27mg/L.

56
Table 17 – Complete composition of the vinasse used during the experiments was carried by BioAgri Laboratory.
Parameter mg/L
Iron 41,8
Manganese 3,7
Lead <0,1
Cadmium <0,1
Mercury <0,00035
Arsenium <0,1
pH 4,52
Nitrate <10
Total Nitrogen (Kjeldahl) 2,15
Sodium 20,1
Calcium 791
Potassium 2386
Magnesium 203
Sulphate 1700
Total Phosphorus 104,9
DBO 8358
DQO 29600
3.2 Strains metabolism analysis
Metabolic behavior in terms of VFAs and hydrogen production of each
strain/consortia is depicted in this section. Due to the complexity of the metabolism
of hydrogen producers and the use consortia a metabolic analysis is very intricate.
Moreover, the synergetic effects of hydrogen partial pressure and carbon source on
hydrogen producer metabolisms further increase this complexity.

57
3.2.1 ATCC 8260
According to the described methods, VFAs and gas production analysis were
carried and the results are shown in Table 18. It can be noticed a great difference in
the profile of VFAs when a complex substrate was used in comparison with pure
sucrose. Moreover, different sources of carbon resulted in different profile of VFAs.
The negative concentrations found indicates the consumption of these metabolites in
comparison to the non-fermented medium.
Table 18 – Metabolic products of the cultivation of ATCC 8260 in vinasse medium containing different carbon sources. Results include cultivation allowing and avoiding H2 partial pressure. VFAs concentration is shown in
g.L-‐1. Results are the average of 5 analyses.
With H2 partial pressure
Strain Carbon source Succinic Lactic Formic Acetic Propionic Butyric Ethanol
Hydrogen (L/L)
ATCC 8260
CAB 0 8,070 0 0.089 0 0.230 0 <0,40
Juice 0 0 0 1,196 0,074 4,485 0 1,35±0,33
Molasses 0 0 0 0,352 0,241 3,982 0 0,73±0,17
Sucrose 0,285 0 2,695 0,14 -0,707 3,211 0 1,84±0,34
Without H2 partial pressure
Strain Carbon source Succinic Lactic Formic Acetic Propionic Butyric Ethanol
Hydrogen (L/L)
ATCC 8260 Juice 0 0,299 0 3,446 0,624 7,594 0 1,70±0,3
Molasses 0 0 0 -‐1,032 0,988 4,242 0 1,04±0,12 Sucrose 0 0 0 1,263 -‐0,41 5,798 0 2,77±0,21
It can be noticed that ATCC8260 is mainly an acetate-butyrate producer,
except when cultured in the synthetic CAB medium. In medium containing sucrose
and avoiding H2 pressure, only these two VFAs were produced, while in CAB
medium high amounts of lactic acid was produced. Sucrose was the carbon source
that gave best hydrogen and VFAs yields.
In terms of hydrogen production, cultivation of ATCC 8260 in artificial medium
resulted in very low amounts when compared to vinasse-based medium.
Considerable improvement in H2 production was noticed on fermentations avoiding
H2 pressure, which was expected.

58
3.2.2 ATCC 27021
The strain ATCC 27021 presented the best results for biohydrogen production
in the preliminary experiments (Chapter 2). A great effort was made in order to keep
that productivity but the strain showed to be very sensible and hard to work with (at
frequent time intervals the culture showed no gas production). This was also noted
by partners that started working with this strain at Blaise Pascal University. Because
this would result in difficulties at manipulation in industrial scale, this strain was no
longer used.
3.2.3 C6
Volatile fatty acids and hydrogen production by this strain is showed in Table
19. This strain is a potential ethanol producer, which was also observed in the
experiments described in Chapter 2.
Table 19 -‐ Metabolic products of the cultivation of the strain C6 in vinasse medium containing different carbon sources. Results include cultivation allowing and avoiding H2 partial pressure. VFAs concentration is shown in
g.L-‐1. Results are the average of 5 analyses.
With H2 partial pressure
Strain Carbon source Succinic Lactic Formic Acetic Propionic Butyric Ethanol Hydrogen (L/L)
C6
CAB 0 7,932 0 0 0 0 0 0,48±0,08
Juice 0 0 0 2,677 0,172 3,612 2,71 0,99±0,32
Molasses 0 0 0,172 1,231 0,065 2,895 1,77 0,95±0,23 Sucrose 0,716 0 0,906 -‐0,292 -‐0,146 4,895 1,07 1,36±0,22
Without H2 partial pressure
Strain Carbon source Succinic Lactic Formic Acetic Propionic Butyric Ethanol Hydrogen (L/L)
C6 Juice 0 0 0,335 2,375 0,513 6,557 2,21 1,83±0,55
Molasses 0 0 0,816 -‐1,052 -‐0,3875 3,099 0,32 1,99±0,45 Sucrose 0,129 0 0,466 -‐0,274 -‐0,392 5,448 1,11 1,68±0,23
High hydrogen production was achieved using molasses as carbon source and
avoiding hydrogen partial pressure, situation which resulted in lower ethanol
production. When sugarcane juice was used as carbon source a great amount of

59
butyric acid was produced, but the presence of other VFAs would result in laborious
purification process.
As observed for ATCC 8260, large amounts of lactic acid were produced when
CAB medium was used. Accompanied by this, very low amounts of hydrogen were
produced.
3.2.4 VINA
The metabolic analysis (Table 20) of the consortium VINA showed a great
proportional effect of hydrogen partial pressure in ethanol production. Because this
consortium was originated from the vinasse itself, the ethanol production observed
was expected.
The use of molasses and sugarcane juice also caused changes in metabolism,
probably due to variations in the consortium composition caused by the different
composition of such complex substrates. Pure sucrose was the best carbon source
for hydrogen production, followed by molasses.
It is interesting to note that when the synthetic medium was used, again a
completely different profile of VFAs was noted. At the same time, and as observed in
the previous strains and consortia, lower amount of hydrogen and great amounts of
lactic acid was produced when compared to vinasse-based medium.

60
Table 20 -‐ Metabolic products of the cultivation of the consortium VINA in vinasse medium
containing different carbon sources. Results include cultivation allowing and avoiding H2 partial
pressure. VFAs concentration is shown in g.L-‐1. Results are the average of 5 analyses.
With H2 partial pressure
Strain Carbon source Succinic Lactic Formic Acetic Propionic Butyric Ethanol Hydrogen (L/L)
VINA
CAB 0,352 7,724 1,371 0 0 0 0 <0,40 Juice 0 0 0,058 2,803 0,123 2,999 3,19 0,78±0,32
Molasses 0 0 1,793 1,932 0,508 2,908 1,99 1,13±0,31 Sucrose 1,428 0 0,507 -‐0,801 -‐0,288 3,821 2,04 1,66±0,35
Without H2 partial pressure
Strain Carbon source Succinic Lactic Formic Acetic Propionic Butyric Ethanol Hydrogen (L/L)
VINA Juice 0 1,837 0 -‐1,144 3,135 1,729 2,99 0,51±0,18
Molasses 0 0 0 0,95 -‐0,1125 1,324 0,52 1,84±0,26 Sucrose 0,499 0 0,671 3,219 -‐0,208 1,75 2,33 2,58±0,41
When cultured in vinasse medium the consortium LPB AH3 presented a very
high production of butyric acid for all substrates tested. Sucrose was the best carbon
source for hydrogen production in vinasse medium, with yields slight higher than
those of sugarcane juice (Table 21).
The use of molasses resulted in very low hydrogen yield but high amount of
butyric acid. The highest amount of butyric acid (10 g.L-1) among all strains
evaluated was produced by this consortium (in sugarcane juice supplemented
medium).

61
Table 21 -‐ Metabolic products of the cultivation of the consortium LPB AH3 in vinasse medium containing different carbon sources. Results include cultivation allowing and avoiding H2 partial pressure. VFAs
concentration is shown in g.L-‐1. Results are the average of 5 analyses.
With H2 partial pressure
Strain Carbon source Succinic Lactic Formic Acetic Propionic Butyric Ethanol Hydrogen (L/L)
LPB AH3
CAB 0,105 0 0,627 2,150 0 1,5105 0.3450 0,58±0,06 Juice 0 0 0 2,167 0,627 6,073 1,78 0,83±0,26
Molasses 0 0 0 -‐1,046 0,267 4,127 1,06 <0,40 Sucrose 0 0 0 3,113 0,576 5,238 0,99 1,37±0,18
Without H2 partial pressure
Strain Carbon source Succinic Lactic Formic Acetic Propionic Butyric Ethanol Hydrogen (L/L)
LPB AH3
Juice 0 0 0 -‐1,236 1,243 10,088 2,21 1,04±0,14
Molasses 0 0 0 0,917 1,3435 7,13 1,09 0,60±0,19 Sucrose 0 0 0 3,069 0,798 7,896 1,02 1,63±0,10
Because the amount of metabolites produced is greater than the available
substrate for fermentation, we can conclude that this consortium is capable of using
other components from vinasse, sugarcane juice and molasses as carbon source.
3.2.5 LPB AH1
The consortium LPB AH1 presented a high capacity to produce biohydrogen in
vinasse medium, especially when sucrose or sugarcane juice was used as carbon
source (Table 21). When CAB medium was used, about half of the biohydrogen
production achieved in vinasse medium supplemented with sugarcane juice and
sucrose was achieved.
From Table 22 it can be noticed that in vinasse medium supplemented with
sugarcane juice the effect of H2 partial pressure in H2 production was minimum. This
is very interesting considering industrial application because facilitates process
handling. On the other hand, the profile of VFAs under and avoiding H2 pressure was
very different, resulting in propionic acid accumulation in the first condition. The
effect of the synthetic medium in the consortia development can also be noticed by
the production of formic acid instead of propionate.

62
Table 22 -‐ Metabolic products of the cultivation of the consortium LPB AH1 in vinasse medium containing different carbon sources. Results include cultivation allowing and avoiding H2 partial pressure. VFAs
concentration is shown in g.L-‐1. Results are the average of 5 analyses.
With H2 partial pressure
Strain Carbon source Succinic Lactic Formic Acetic Propionic Butyric Ethanol Hydrogen
(L/L)
LPB AH1
CAB 0.14 0 0.285 1.324 0 1.216 0 0,83±0,1
Juice 0 0 0 0,599 1,321 6,793 0 2,03±0,31
Molasses 0 0 0,067 1,157 0,118 4,322 0,2 1,15±0,24 Sucrose 0 0 0,163 -‐0,581 -‐0,2 6,995 0 2,08±0,19
Without H2 partial pressure
Strain Carbon source Succinic Lactic Formic Acetic Propionic Butyric Ethanol Hydrogen
(L/L)
LPB AH1 Juice 0 0 0,185 3,525 0,408 7,642 0 2,25±0,29
Molasses 0,05 0 0 -‐2,085 -‐0,4025 4,421 0 1,97±0,26
Sucrose 0 0 1,393 1,049 -‐0,451 4,824 0 2,94±0,31
3.2.6 LPB AH2
Metabolic analysis of the consortium LPB AH2 showed a great potential for
biohydrogen production in molasses and sugarcane juice supplemented media
(Table 23). The use of molasses as carbon source together with the maintenance of
a low H2 partial pressure environment resulted in the exclusive production of butyrate
as VFA.
Higher H2 production was observed in fermentations carried under reduced H2
pressure, except in sucrose supplemented medium where no statistical difference
was noted, which is interesting because facilitates the management of the process in
an industrial scale.

63
Table 23 -‐ Metabolic products of the cultivation of the consortium LPB AH2 in vinasse medium containing different carbon sources. Results include cultivation allowing and avoiding H2 partial pressure. VFAs
concentration is shown in g.L-‐1. Results are the average of 5 analyses.
With H2 partial pressure
Strain Carbon source Succinic Lactic Formic Acetic Propionic Butyric Ethanol Hydrogen
(L/L)
LPB AH2
CAB 0 0 0,06 2,12 0 1,028 0 0,99±0,08
Juice 0 4,197 0 2,956 0,311 6,313 0 1,74±0,42
Molasses 0 0 0 3,783 0,383 6,396 0 1,45±0,29 Sucrose 1,17 0 0,876 1,333 -‐0,398 7,044 0 2,29±0,42
Without H2 partial pressure
Strain Carbon source Succinic Lactic Formic Acetic Propionic Butyric Ethanol Hydrogen
(L/L)
LPB AH2 Juice 0 0 0 -‐2,62 0,478 8,000 0 2,16±0,35
Molasses 0 0 0 -‐1,793 -‐0,1355 6,067 0 2,17±0,25
Sucrose 2,749 0 0,518 4,709 -‐0,72 6,809 0 2,37±0,20
3.2.7 LPB AH4
The VFAs profile generated by the fermentation of vinasse based medium with
the consortium LPB AH4 is presented in Table 24. It can be noticed that a mix of
acetic, propionic, butyric and ethanol (and formic acid in sucrose supplemented
medium) was produced. It is interesting to observe that in synthetic CAB medium
lactate was produced, which was not noted in vinasse-based medium.
In terms of hydrogen production, we can note that vinasse medium resulted in
higher yields, which is consistent with the theory depicted in Chapter 1 (more
reduced products results in less hydrogen yield).

64
Table 24 -‐ Metabolic products of the cultivation of the consortium LPB AH4 in vinasse medium containing different carbon sources. Results include cultivation allowing and avoiding H2 partial pressure. VFAs
concentration is shown in g.L-‐1. Results are the average of 5 analyses.
With H2 partial pressure
Strain Carbon source Succinic Lactic Formic Acetic Propionic Butyric Ethanol Hydrogen
(L/L)
LPB AH4
CAB 0,4395 8,76 0 0 0 1,0612 0,487 0,55±0,1
Juice 0 0 0 1,574 0,045 2,649 1,612 0,81±0,20
Molasses 0 0 0 0,671 1,173 2,248 0,83 0,82±0,26 Sucrose 0 0 0,639 -‐0,439 -‐0,53 2,59 0,99 1,25±0,26
Without H2 partial pressure
Strain Carbon source Succinic Lactic Formic Acetic Propionic Butyric Ethanol Hydrogen
(L/L)
LPB AH4 Juice 0 0 0 1,06 1,269 4,466 1,1 0,93±0,28
Molasses 0 0 1,505 1,394 -‐0,2125 2,138 0,88 1,07±0,23
Sucrose 0,649 0 0,564 -‐0,052 0,042 6,317 0,41 1,34±0,30
3.2.8 LPB AH5
The consortium LPB AH5 didn’t presented capacity to use molasses and
sugarcane juice as carbon sources for growth. Because sucrose was consumed both
in synthetic (CAB) and vinasse media it is possible that some constituent(s) of
molasses and juice is (are) toxic to this consortium. Even in sucrose based media
the amount of VFAs and hydrogen produced was too low.

65
Table 25 -‐ Metabolic products of the cultivation of the consortium LPB AH5 in vinasse medium containing different carbon sources. Results include cultivation allowing and avoiding H2 partial pressure. VFAs
concentration is shown in g.L-‐1. Results are the average of 5 analyses.
With H2 partial pressure
Strain Carbon source Succinic Lactic Formic Acetic Propionic Butyric Ethanol Hydrogen (L/L)
LPB AH5
CAB 0 0,083 0,573 0,451 0 0,677 0 <0,40
Juice 0 0 0 0 0 0 0 0
Molasses 0 0 0 0 0 0 0 0 Sucrose 0 0 0,088 2,058 2,125 0,658 1,43 0,52±0,05
Without H2 partial pressure
Strain Carbon source Succinic Lactic Formic Acetic Propionic Butyric Ethanol Hydrogen (L/L)
LPB AH5 Juice 0 0 0 0 0 0 0 0
Molasses 0,363 0 0 -‐0,659 0,287 0,02 0 <0,40
Sucrose 0 0 0 3,192 2,579 1,469 0,54 0,54±0,10
*not possible to determine (above limit of detection of the method used)
3.2.9 LPB AH6
When cultivated in the media supplemented with sucrose, the consortium LPB
AH6 presented a high hydrogen production. In vinasse based medium this condition
was achieved since a low H2 pressure was kept.
The consortium LPB AH6 was the only consortium to presented adaptation to
molasses but no adaptation to sugarcane juice, which was not expected because
molasses is usually more toxic to some microorganisms.

66
Table 26 -‐ Metabolic products of the cultivation of the consortium LPB AH6 in vinasse medium containing different carbon sources. Results include cultivation allowing and avoiding H2 partial pressure. VFAs
concentration is shown in g.L-‐1. Results are the average of 5 analyses.
With H2 partial pressure
Strain Carbon source Succinic Lactic Formic Acetic Propionic Butyric Ethanol Hydrogen (L/L)
LPB AH6
CAB 0 9,591 0,99 0 0 0 0 0,61±0,08
Juice 0 0 0 0 0 0 0 0
Molasses 0 0 0,26 1,363 1,041 2,57 1,05 1,15±0,32
Sucrose 1,006 0 0,606 0,662 -‐0,53 2,717 0,76 1,47±0,35
Without H2 partial pressure
Strain Carbon source Succinic Lactic Formic Acetic Propionic Butyric Ethanol Hydrogen (L/L)
LPB AH6
Juice 0 0 0 0 0 0 0 0
Molasses 0 0 0 -‐2,103 2,2065 2,004 0,88 1,58±0,27
Sucrose 1,321 0 0,604 0,301 0,797 3,291 0,82 2,31±0,38
3.2.10 LPB AH7
The consortium LPB AH7 showed a behavior similar to the observed for the
consortium LPB AH5: hydrogen and VFAs production was observed only in those
media where pure sucrose was used as carbon source.
Table 27 -‐ Metabolic products of the cultivation of the consortium LPB AH7 in vinasse medium containing different carbon sources. Results include cultivation allowing and avoiding H2 partial pressure. VFAs
concentration is shown in g.L-‐1. Results are the average of 5 analyses.
With H2 partial pressure
Strain Carbon source Succinic Lactic Formic Acetic Propionic Butyric Ethanol Hydrogen (L/L)
LPB AH7
CAB 0 9,030 0 0 0 0 0 0,62±0,11
Juice 0 0 0 0 0 0 0 0
Molasses 0 0 0 0 0 0 0 0
Sucrose 0 0 0 3,169 3,756 2,054 0 0,37±0,10
Without H2 partial pressure
Strain Carbon source Succinic Lactic Formic Acetic Propionic Butyric Ethanol Hydrogen (L/L)
LPB AH7
Juice 0 0 0 0 0 0 0 0
Molasses 0 0 0 0 0 0 0 0
Sucrose 1,321 0 0,823 0 2,954 0,185 0 0,51±0,08

67
3.3 Conclusions
Because our objective was to develop an economic feasible process of
biohydrogen production with the possibility to take advantage of the VFAs produced,
the selection of strains was carried considering the capacity to produce biohydrogen
in vinasse medium supplemented with complex carbon sources (molasses and
sugarcane juice) and the profile of VFAs produced.
The consortium LPB AH2 presented the highest H2 production capacity in
vinasse medium with molasses (2.17 LH2/Lmedium). At this condition, only butyrate was
produced, at considerable amount (6.1 g.L-1), which is interesting and facilitates its
recovery.
In terms of butyric acid production, the consortium LPB AH3 achieved the
highest value (10 g.L-1), but because of considerable amounts of propionate and
ethanol production, the H2 productivity was low in comparison to others.
In sugarcane juice supplemented medium the consortium LPB AH1 presented
the best results. Hydrogen production reached 2.25 LH2/Lmedium, accompanied by
considerable amounts of acetate and butyrate production (3.5 and 7.6 g.L-1,
respectively), which is relevant in coupling to methane or solvent production.
Two consortia presented considerable ethanol production: C6 and VINA, both
in sugarcane supplemented medium and in environment with high H2 partial
pressure. The first one achieved a production of 2.71 g.L-1 while the other reached
3.19 g.L-1. This is approx. 40% of the ethanol that is produced by yeast fermentation
through traditional fermentation. Ethanol associated to hydrogen production in
vinasse medium may be interesting due to the possibility of this ethanol recuperation
be facilitated since it is quite possible that the bioH2 facilities are installed coupled to
the ethanol plant (more specifically the distillation unit). On the other hand this
technology competes with traditional ethanol production due to use of sugarcane
juice as substrate and can probably be considered if someday greater restrictions for
vinasse disposal are imposed.
It might be also considered the possibility to produce large amounts of lactic
acid using the synthetic CAB medium (further studies should be carried on this
theme). At the same time, those consortia that produced lactic acid in the synthetic
medium but didn’t on vinasse medium indicates that changes in process conditions

68
(in vinasse composition, for example) can result in the generation of undesirable
products instead of hydrogen.
Based on these observations, the consortium LPB AH2 was chosen for
biohydrogen and VFAs production in vinasse medium supplemented with molasses
and LPB AH1 in vinasse medium with sugarcane juice.

69
CHAPTER 4
Optimization of culture
conditions of the consortia LPB
AH2 and LPB AH1 cultivated in
vinasse-based medium for
biohydrogen and VFAs
production under anaerobic
conditions.

70
1 Introduction Based on the metabolic analysis of each strain/consortia described in chapter
3, 2 strains were selected as potential biohydrogen and VFAs producers: LPB AH2
and LPB AH1. Before process scaling up an optimization step was carried in order to
achieve highest biohydrogen production.
Many factors that fall under the topic of bioprocess parameters have been
studied including type of organism/organisms, pH, substrate loading (OLR – organic
loading rate), type of reactor/growth conditions (batch, sequencing batch,
continuous; CSTR, UASB, etc.), type of substrate (pure carbohydrate, various waste
streams), media composition, ions availability, etc. Several approaches that can be
considered to increase hydrogen yields in the dark fermentation will be discussed in
this chapter.
The yield of hydrogen during dark fermentation is severely affected by
the partial pressure of the product. At high H2 partial pressures a metabolic shift to
production of more reduced products, like lactate or ethanol occurs, decreasing the
yield of H2. The formation of relatively reduced organic molecules is an integral part
of all dark fermentations and some of these molecules (e.g. acetate) can inhibit H2
production if allowed to accumulate (12). Metabolic engineering of hydrogen
producing microorganisms to minimize production of other more reduced products by
blocking their biosynthetic pathways is an alternative to provide higher H2 yields (13,
14, 15). Gas sparging has also been found to be a useful technique to reduce
hydrogen partial pressure in the liquid phase for enhancement of its yield (32) but
results in difficulties in hydrogen purification.
In terms of carbon source, only acids are produced when carbon source is
limited in the medium (75). Unlike carbon-limited cultures, solvents are produced by
cultures grown in phosphate- or sulfate-limited media. pH is also an important factor,
as high fermentation rates lead to strong acidification due to the production of
organic acids. This can affect both product distribution and biomass production.
Higher hydrogen yields will most probably be achieved by limiting cell growth through
nutrient limitations, thereby enhancing catabolic processes but high cell densities are
needed to maximize hydrogen production rates.

71
The balance of the medium to reach this optimal point is crucial in process
development. The determination of the composition of complex media for industrial
applications plays, thus, an important role in development and maintenance of an
industrial H2 process. Yu et al (57b) reported, for example, that the production of
acetate was inhibited by Zn and Cu; but production of propionate and hydrogen was
favored at low concentrations of Zn (up to 80 mg l-1) and Cu (up to 40 mg l-1). Other
studies indicate that nitrogen, phosphorous and iron are the most important essential
nutrients for hydrogen gas production (59). Magnesium ion is also an important
cofactor that activates almost 10 enzymes including hexokinase,
phosphofructokinase and phosphoglycerate kinase during glycolysis process (66).
Hawkes et al (67) reviewed the media composition for hydrogen production.
They found that apart from N and P source, only K, Mg and Fe are common in all
recipes in analyzed. A 20-fold variation in the amount of Fe added with respect to
hexose concentration was also observed. One or more workers did not add one or
more of the elements Ni, Ca, B, Mo, Zn, Co, Cu, Mn or I. Hydrogen production
described in the literature showed large variation and most of the time no relation is
established with inorganic nutrients consumption. More information on minimum
amounts of these nutrients for continuous operation is needed.
The use of hyper-thermophiles and extreme temperatures in hydrogen
production represents some gains in terms of hydrogen yields, since at increased
temperatures hydrogen production becomes more exergonic (17). Therefore,
extreme- and hyper-thermophiles show a better resistance to high hydrogen partial
pressures (18). Another advantage of fermentations at extreme temperatures is that
the process is less sensitive to contaminations by hydrogen consumers. The major
problems are (i) to achieve an economical relation between the energy used in order
to heat and maintain the reactor at high temperatures and the H2 production, and (ii)
that extreme thermophiles anaerobic bacteria usually grow to low densities resulting
in low production rates.
In this chapter, the optimization of culture parameters was conducted
considering the fact that biohydrogen technology faces economical drawbacks. It
was described that some micronutrients play an important role in biohydrogen
production and could had been considered. But since the main goal is to develop an

72
economic and simple-to-handle process, the smaller the changes made in medium
composition, the better for process economics. In this context only pH and the
carbon/nitrogen ratio were optimized.
pH and carbon are probably the most important factors to be regulated in
anaerobic digestion processes. They play a critical role in governing the metabolic
pathways of microbial H2 production [77] and the composition of the microbial
community.
Process optimization was carried by using the Response Surface Methodology
(RSM), a widely used technique to model processes in which the response of
interest (in this case, biohydrogen production) is influenced by several variables (pH
and C/N). Because fist-order models won’t be enough, a central composite design
(CCD) was chosen in order to estimate with more accuracy the mathematical
behavior of biohydrogen production.
2 Material and Methods
2.1 Medium Composition and Culture Conditions
The experiments were carried out in 15 ml Hungate tubes, with working
volume of 6 ml, sealed with autoclavable Bakelite lids with rubber stoppers and
incubated in a shaker at 37ºC and 30 rpm. The cultures were maintained at these
conditions for 1 week and then inoculated in a new medium. 1 ml of culture was,
then, inoculated in 5 ml of medium. Each new culture will be called “generation”.
Medium pH was adjusted with 1N KOH. Anaerobic environment and medium
was carried according to the Balch technique. Bicarbonate was added at 85ºC and
Cysteine-HCl at 65ºC as reducing agents to lower the redox potential of medium.
Biohydrogen and VFAs production by the consortium LPB AH2 was carried
using vinasse medium supplemented with sugarcane molasses, while the
consortium LPB AH1 was cultivated in vinasse medium supplemented with
sugarcane juice. Vinasse, molasses and sugarcane juice used in these experiments
were the same used in the previous chapter.

73
2.2 High Performance Liquid Chromatography (HPLC)
Organic components were determined through High Performance Liquid
Chromatography (HPLC). Before injection the samples (2 ml) were centrifuged for 10
min at 104 g and filtered (Milipore 0.2µm).
The HPLC equipment was an Shimadzu Liquid Chromatograph equipped with
a Aminex® HPX-87H 300 x 7,8mm (Bio-Rad) column and a refractive index detector
(RID-10A). The column was kept at 60oC and a 5mM H2SO4 at 0.6 ml/min was used
as mobile phase. The compounds quantified by this method are glucose, fructose,
succinate, lactate, formate, acetate, propionate and butyrate. All chemicals used
were of analytical grade. Ethanol quantification was carried as described in chapter
3.
2.3 Gas Measurement and Analysis
Before analysis, 7 successive cultivations were made in order to achieve a
balanced microbial community (resulting in a theoretical stability of the process).
Hydrogen partial pressure was minimized by daily degassing. Total gas production
(Lgas/Lmedium) was considered as the sum of the gas produced and quantified daily
divided by the volume of medium.
Gas analysis was carried twice a week, more precisely in the 4th and 7th day of
culture. Gas was collected by inserting a graduated syringe through the flange-type
butyl rubber septum. The gas collected in the 4th day was purified for hydrogen
content estimation, as follows.
Since it was noted in chapter 2 that there is a direct relation between gas
production and hydrogen content in the gas phase, the optimal conditions was
considered as the one that resulted in higher (bio)gas production.
2.4 Strains
The strains used in this experiments were those selected based on the results
of chapter 3. The consortium LPB AH2 was chosen for biohydrogen and VFAs
production in vinasse medium supplemented with molasses, while the consortium

74
LPB AH1 was chosen for biohydrogen and VFAs production in vinasse medium
supplemented with sugarcane juice.
2.5 Optimization and data analysis
Optimization was carried using a statistical tool called “Essential Experimental
Design”, version 2.213. An inscribed central composite design with 2 factors at 3
levels and 3 center points was used for each strain. The response used for
optimization was total gas produced (in Lgas/Lmedium) since it was noted in chapter 2
that there is a direct relation between gas production and hydrogen content in the
gas phase. The statistical plan is showed in Table 28. Table 30 shows the values
assigned to each level.

75
Table 29 – Statistical plan used for the optimization of conditions for biohydrogen and VFAs production by the chosen consortia.
Exp # Carbon Source (g/L) pH
1 -1 -1 2 0 0 3 1 -1 4 -1 1 5 1 1 6 0 0 7 0 -1,414 8 0 1,414 9 -1,414 0
10 0 0 11 1,414 0
Table 30 – Values of pH and carbon source assigned to each level of the optimization plan.
Carbon Source (g/L) Level -1,414 -1 0 1 1,414 Value 7,93 10 15 20 22,07
pH
Level -1,414 -1 0 1 1,414 Value 4,88 5,5 7 8,5 9,12
3 Results and Discussion
3.1 Consortium LPB AH1 cultivated in vinasse medium supplemented
with sugarcane juice.
The experimental results for gas production by the consortium LPB AH1 are
presented in Table 31. The effect of pH and carbon source concentration on
hydrogen production are represented in the 3-D and Contour plots presented in
Figure 9. A maximum production of biogas of respectively 8,29Lgas/Lmedium occured at
pH 7,0 and 12g/L carbon source.

RE�
�
� � � o� � TS � m� � � 2� DU: � 7� 3°: e� � � N°� P� � � � t � � 7o3°P� 3°e � 3N� � � : e2: U3°7r � � � � � � S � 7e� � U� � : e� °3°: e2� � � � : U� °e � 3: � 3N� �23� 3°23°� � o� r : � � o� 72� � � 1: U� : D3°r °b� 3°: eu�
Exp # Carbon Source (g/L) pH Gas (L/Lmedium) 1 -1 -1 7,38 2 0 0 8,25 3 1 -1 2,04 4 -1 1 7,46 5 1 1 3,00 6 0 0 8,29 7 0 -1,414 2,88 8 0 1,414 2,89 9 -1,414 0 6,33
10 0 0 8,27 11 1,414 0 2,25
�
�

77
Figure 9 – Graphical 3-‐D and contour displays of the achieved results for optimization of gas production by LPB AH1 consortium cultivated in vinasse medium supplemented with sugarcane juice.
The best mathematical model that fit satisfactory to the results is a full quadratic
model (Table 32), presenting a R² higher than 0,91. This means that it is possible to
predict hydrogen production by the consortium LPB AH1 grown in terms of pH and
substrate concentration.
Low coefficient of variation approx. 20% and standard error (1,095) were
observed, which was impressive since higher variation was expected because of the
complex composition of the medium (sugarcane juice and vinasse). VIF value under
5 indicates the inexistence of multicollinearity among the regressors (Table 30).
Table 32 -‐ The equation of the full quadratic model that fit best to the results achieved in this optimization is presented. Coefficient values, standard errors, 95% interval of confidence and T student are also shown.
Gás_(ml) = b0 + b1*Fonte de Carbono (g/L) + b2*pH*pH + b3*Fonte de Carbono (g/L)*Fonte de Carbono (g/L) + b4*Fonte de Carbono (g/L)*pH +
b5*pH
P value Std Error -95% 95% t Stat VIF
b0 8,270 4,65041E-05 0,632 6,645 9,894 13,09
b1 -1,946 0,00400 0,387 -2,941 -0,952 -5,029 1,000
b2 -2,347 0,00379 0,461 -3,531 -1,163 -5,095 1,095
b3 -1,644 0,01606 0,461 -2,829 -0,460 -3,569 1,095
b4 0,220 0,704 0,547 -1,187 1,627 0,402 1,000
b5 0,132 0,747 0,387 -0,863 1,127 0,341 1,000
The Durbin-Watson statistic test was carried but was inconclusive for the
detection of autocorrelation in the residuals (dL<d<dU; 0.758<1.094<1.604; interval
of confidence = 95%). A first order autocorrelation (Pearson’s r) value of 0.358 was
observed and indicates a weak positive autocorrelation between residuals. This is
important because high positive autocorrelation means biased estimated coefficients
in the mathematical model and suggests that other variables should be included.
The ANOVA analysis presented in Table 33 showed a low percentage of
residuals, indicating that the predicted responses are close to the obtained ones.

78
The F test confirms that the model is valid in a confidence interval of 99%
(Fsignif<confidence interval).
Table 33 – The ANOVA analysis showed low content of residuals and indicates that the full quadratic equation proposed is valid.
ANOVA Source SS SS% MS F F Signif df
Regression 67,36 92 13,47 11,24 0,00946 5 Residual 5,991 8 1,198
5
LOF Error 5,990 8 (100) 1,997 4991,4544 0,000200 3 Pure Error 0,000800 0 (0) 0,000400
2
Total 73,35 100
10
Table 32 presents the VFAs produced in each condition of optimization. It can
be observed that conditions where low quantities of biogas was produced was
related with high amounts of lactic acid production, excepted the one of pH 7 and
7,93 g.L-1 substrate, in which low amount of gas is probably related to low content of
fermentable carbon. It was also noticed that conditions of high pH and/or high carbon
source concentration favored the development of lactic acid bacteria; in these
conditions formic acid was also produced.

79
Table 34 – Volatile fatty acids production of the consortium LPB AH1 during optimization. Substrate, succinic, lactic, formic, acetic, propionic and butyric acids are showed in g.L-‐1.
pH Substrate Succinic Lactic Formic Acetic Propionic Butyric Gas (L/Lmedium)
4,88 15,00 0,000 7,994 3,175 0,969 -‐0,576 1,331 2,88
5,5 10,00 0,000 0,000 0,000 2,430 0,046 6,123 7,38
5,5 20,00 0,000 8,323 3,218 0,772 -‐0,371 2,321 2,04
7 7,93 0,000 0,000 0,000 1,995 -‐0,187 5,150 2,88
7 15,00 0,000 0,000 0,000 2,280 0,146 7,638 8,27
7 22,07 0,000 9,257 3,564 0,952 -‐0,009 2,589 2,25
8,5 20,00 0,000 12,998 4,946 1,050 -‐0,456 1,916 3,00
8,5 10,00 0,000 0,615 0,000 0,000 -‐0,218 6,728 7,46
9,12 15,00 0,000 10,737 4,146 1,343 -‐0,150 2,874 2,89
3.2 Consortium LPB AH2 cultivated in vinasse medium supplemented
with sugarcane molasses.
The experimental results for gas production by the consortium LPB AH2 are
presented in Table 35. The lowest production observed was 1,83 Lgas/Lmedium when
the consortia was cultivated at the lowest pH, while the highest (7,67 Lgas/Lmedium) was
achieved at the central point (pH 7,0 and 15g.L-1 substrate). Figure 10 presents the
effects of the conditions on biohydrogen production.

I c �
�
� � � o� � TH� m� � � 2� DU: � 7� 3°: e� � � N°� P� � � � t � � 7o3°P� 3°e � 3N� � � : e2: U3°7r � � � � � � S � 7e� � U� � : e� °3°: e2� � � � : U� °e � 3: � 3N� �23� 3°23°� � o� r : � � o� 72� � � 1: U� : D3°r °b� 3°: eu�
Exp # Carbon Source (g/L) pH Gas (Lgas/Lmedium) 1 -1 -1 5,88 2 0 0 7,61 3 1 -1 3,88 4 -1 1 5,92 5 1 1 6,33 6 0 0 7,56 7 0 -1,414 1,83 8 0 1,414 3,72 9 -1,414 0 5,67
10 0 0 7,67 11 1,414 0 6,44
�
�
� ° 7U� � Sc � i � � U� DN°� � o� Ti � � � e� � � : e3: 7U� � °2Do� t 2� : 1� 3N� � � � N°� P� � � U� 27o32� 1: U� : D3°r °b� 3°: e� : 1� � 2�
DU: � 7� 3°: e� � t � � � � � � C� � : e2: U3°7r � � 7o3°P� 3� � � °e� P°e� 22� � r � � °7r � 27DDo� r � e3� � � s °3N� 27 � U� � e� �
r : o� 22� 2u�

81
The best mathematical model that fit satisfactory to the profile of the results
achieved is a full quadratic model (Table 36) with R² of approx. 0,90. It means that it
is possible to predict hydrogen production by the consortium LPB AH2 grown in
vinasse medium supplemented with sugarcane molasses.
Table 36 – The equation of the full quadratic model that fit best to the results achieved in this optimization is presented. Coefficient values, standard errors, 95% interval of confidence and T student are also shown.
Gas_(ml) = b0 + b1*pH*pH + b2*pH + b3*substrate (g/L)*substrate (g/L) + b4*substrate (g/L)*pH + b5*substrate (g/L)
P value Std Error -95% 95% t Stat VIF
b0 7,615 1,58788E-05 0,467 6,413 8,816 16,29 b1 -2,148 0,00148 0,341 -3,024 -1,273 -6,306 1,095 b2 0,645 0,07381 0,286 -0,09032 1,381 2,255 1,000 b3 -0,508 0,196 0,341 -1,384 0,368 -1,491 1,095 b4 0,603 0,197 0,405 -0,438 1,643 1,489 1,000
b5 -0,06266 0,835 0,286 -0,798 0,673 -0,219 1,000
As observed for the LPB AH1 consortium, a low coefficient of variation and a
low standard error were achieved (14% and 0,809, respectively). The Durbin-Watson
statistic test was again inconclusive for the detection of autocorrelation in the
residuals (dL<d<dU; 0,758<1,057<1,604; interval of confidence = 95%). A first order
autocorrelation (Pearson’s r) value of 0,347 was observed and indicates a weak
positive autocorrelation between residuals.
The ANOVA analysis presented in Table 37 showed a low percentage of
residuals. The F test showed that the model is valid in a confidence higher than 98%.
Table 37 – The ANOVA analysis showed low content of residuals and indicates that the full quadratic equation proposed is valid.
ANOVA Source SS SS% MS F F Signif df
Regression 30,96 90 6,193 9,452 0,01384 5 Residual 3,276 10 0,655
5
LOF Error 3,270 10 (100) 1,090 360,3381 0,00277 3 Pure Error 0,00605 0 (0) 0,00303
2
Total 34,24 100 10

82
In terms of VFAs production (Table 38), it can be observed that in extreme
conditions of pH and carbon source lactate production was observed, especially in
high pH (above 8,5). It was possible to note that in fermentations that lactic acid was
produced in great quantity low amount of gas was released. In most fermentations
only butyric acid was observed, which is in accordance to results achieved in chapter
3.
Table 38 – Volatile fatty acids production of the consortium LPB AH2 during optimization. The concentration of the carbon source, succinic, lactic, formic, acetic, propionic and butyric acids are showed in g.L-‐1.
pH Carbon Source Succinic Lactic Formic Acetic Propionic Butyric Gas (L/Lmedium)
4,88 15 0,000 2,017 0,000 -0,493 1,390 6,794 2,88
5,5 10,00 0,000 0,000 0,000 -0,450 -0,877 1,850 7,38
5,5 20 0,000 0,000 0,000 -0,643 -0,755 3,675 2,04
7 7,93 0,000 0,364 0,000 0,092 -0,756 1,538 6,33
7 15,00 0,000 0,000 0,000 -0,846 -0,293 6,065 7,61
7 22,07 0,000 5,817 0,000 -0,655 -0,628 4,296 2,25
8,5 20 0,000 8,095 0,000 -0,948 -0,696 3,403 3,00
8,5 10,00 0,000 0,368 0,000 0,659 0,514 6,289 7,46
9,12 15,00 0,000 7,936 0,000 -0,012 -0,558 0,836 2,89
4 Conclusions The optimization of the conditions of culture resulted in higher biohydrogen
production close to the central points for both consortia. In terms of pH it was
expected since the experiments described in chapters 3 and 4 were conducted at pH
7,0. Anyway it was not observed flourishing of hydrogen-producers resistant to
extreme pHs. The methodology chosen and the design proposed can predict through
a mathematical model how biohydrogen is produced in relation to pH and carbon
source concentration.
It was not expected that such a uniform behavior could be achieved. Because
the consortia are composed by more than one microorganism its adaptation to
different conditions is facilitated, which is confirmed considering that hydrogen

83
production was observed even at very low or high pHs. It would be of great value if a
considerable biohydrogen production was achieved in low pH because vinasse’s
natural pH is usually close to 5.

84
CHAPTER 5
Scaling up: bioreactor cultivation
of consortia under optimized
conditions for biohydrogen and
VFAs production in vinasse-
based medium

85
1 Introduction
Dark fermentative biohydrogen processes is found to be most often performed
in closed vessels. Closed batch mode is generally used as the first step to examine
physical factors (type of substrate, carbon content, temperature, gas pressure)
affecting the process (78) as a first step in process development. Generally H2
production and growth kinetics are successfully investigated through this technique.
Regarding industrial application (large scale operations), biohydrogen
processes are expected to work in continuous mode in most cases. CSTR
(continuous stirred tank reactor) is the most commonly studied, where the hydraulic
retention time (HTR) is the parameters of greatest influence. They are also preferred
in terms of ease of operation. The concentrations of volatile fatty acids in the digester
are proportional to the organic loading rate (OLR) and to HRT.
A variety of organic load rates (OLR) have been tested and although the results
are highly variable given the different substrates used. It is obvious that high
substrate concentrations are to be preferred from an operational standpoint since
they potentially lead to high volumetric production rates. The effect of OLR, at least
in mixed cultures, on hydrogen yields is somewhat contradictory with no easy
explanation for the disparity in the results. In pure culture fermentations hydrogen
yields are favored at low carbon concentrations whereas hydrogen productivity is
favored at high carbon concentrations. Recent studies with mixed cultures also
generally support this idea, although the relationship seems more complex (61). Kim
et al. (68) reported that short HRT would favor hydrogen production as methanogens require
more than approx. 3 days HRT before they were washed out from a CSTR reactor.
Low HTR generally results in low operation costs and is used to eliminate
methane producers. On the other hand the efficiency of the process is reduced
(biomass growth and hydrogen production is limited, especially in CSTR) and it is
observed loss of fermentable sugar in the wastewater. The optimal HTR for each
process must be evaluated because it changes according to substrate and inoculum.
Generally CSTR generates higher H2 productivity but with lower yields when
compared to batch mode.
To overcome the low biomass production (and consequently low hydrogen
productivity) in continuous operating reactors, the use of immobilized cells or

I E�
�
methods to allow formation of granules or flocs is being considered. Examples are
the use of fixed-bed (79) and membrane reactors (80).
In batch reactors the highest yield described was achieved using the
thermophile Caldicellulosiruptor owenensis (4.0 molH2/molglucose) (82) while non-
thermophile strains can reach up to 3,10 molH2/molglucose (83). The highest evolution
rate of 35 mmol L-1 h-1 was described in a culture of Enterobacter cloacae II BT-08
grown in sucrose-rich synthetic medium in batch mode (YH2/S = 6,0) (84), less than
half the amount achieved with the same strain cultured in continuous mode (77
mmol L-1 h-1) (YH2/S not described) (85).
This chapter describes the scaling up of the proposed biohydrogen process
using vinasse as medium and the optimized conditions as described in previous
chapter to a bench reactor operated in batch mode. The objective is to evaluate the
metabolism of both consortia selected to obtain valuable information for a future
development of continuous operation. An economical discussion is also carried
based on the results achieved.
�
' � � S� E� � � � N� � U � S� I � R�
cnu � d� yd1� � � � � � y� � H� � � � � � y1� � � H�
The experiments were carried out in a 2L bioreactor, with working volume of
1,5L, adapted for anaerobic cultivation (Figure 11). Batch fermentations were
maintained at 37ºC and without agitation during 5 days.

87
Figure 11 – 2L Bioreactor used in scaled up production of biohydrogen and VFAs by the consortium LPB AH2 (cultivated in vinasse medium supplemented with sugarcane molasses) and LPB AH1 (cultivated in vinasse
medium supplemented with sugarcane juice).
Medium pH was adjusted with 1N KOH. Anaerobic environment and medium
was carried according to the Balch technique. The reactor was autoclaved and a
anaerobic environment was created by CO2 injection in the headspace. Bicarbonate
was added when the medium temperature reached 85ºC and Cysteine-HCl at 65ºC
as reducing agents to lower the redox potential of medium. The bioreactor was then
kept overnight under CO2 environment prior inoculation.
Carbon source concentration and pH were set according to the results
achieved in the previous chapter. Biohydrogen and VFAs production by the
consortium LPB AH2 was carried in vinasse medium supplemented with 15g/L
sugarcane molasses (based on obrix), while cultivation of the consortium LPB AH1
was carried in vinasse medium supplemented with 12 g/L sugarcane juice (based on obrix). The initial pH for each strain was 7.0.
Inoculum production was carried through serial inoculations. A 6 mL daily
degassed culture was inoculated in 50 ml new medium. After 5 days of culture and
daily degassing, this culture was used as inoculum for a 300ml culture, which was
then inoculated in the bioreactor.

88
2.2 Vinasse
The vinasse used in bioreactor scale was the same used in the previous
chapter. Its composition is presented in Table 16, chapter 3.
2.3 High Performance Liquid Chromatography (HPLC)
Organic components were determined through High Performance Liquid
Chromatography (HPLC). Samples were withdrawed daily, centrifuged for 10 min at
104 g and filtered (Milipore 0,2µm) before injection.
The HPLC equipment was a Shimadzu Liquid Chromatograph equipped with
a Aminex® HPX-87H 300 x 7,8mm (Bio-Rad) column and a refractive index detector
(RID-10A). The column was kept at 60oC and a 5mM H2SO4 at 0.6 ml/min was used
as mobile phase. The compounds quantified by this method are glucose, fructose,
succinate, lactate, formate, acetate, propionate and butyrate. All chemical used were
of analytical grade.
2.4 Gas Measurement and analysis
Gas measurement was carried using an inverted beaker (Figure 12)
connected by a rubber hose to the bioreactor gas exit. Gas production was
considered equal to the volume of displaced water.

89
Figure 12 – The system of gas measurement (foreground) adapted to the bioreactor (background).
At the end of the fermentation, 40ml of the accumulated gas was sampled and
analyzed. Gas analysis was carried at the Institute for Technology Development
(Instituto de Tecnologia para o Desenvolvimento – LACTEC) in a Thermo Gas
Chromatographer equipped with the following analytical columns: Petrocol DH150
(50mx0,25mm), DC 200 (1,8m) and Porapak-N (2,0m x 1/8’’), which were placed in
by-pass series flow path of gas chromatograph system. The columns were
connected to a TCD detector (block temperature: 120°C, transducer temperature:
120°C, filament temperature: 190°C). This system allowed the measurement of
oxygen (O2), nitrogen (N2), carbon dioxide (CO2) and methane (CH4). Hydrogen (H2)
content was then considered as the amount to reach 100%.
2.5 Other Analysis
Biomass was quantified daily by centrifuging 10ml samples at 16500g and
drying at 60oC until constant weight. Total carbohydrate was quantified daily by the
Phenol-Sulfuric method. pH was monitored daily in a digital pHmeter.

5c �
�
G � � RT SR��
t nu � � � g� 1 � � � � � � � � � � � H� 21 � d� y� � � � � � � � 1� � � y 1� H� � � � � � g� y� � �
� � H 1y� d� � � � � � � u�Biohydrogen and VFAs fermentation process using the consortium LPB AH1
was carried using vinasse and sugarcane juice as medium at the conditions
described in Material and Methods. Initial sugar content in the fermentation medium
was equal to 11.48g.L-1, being completely exhausted by the end of fermentation.
Biomass production was equal to 0.25g.L-1.
The VFAs and biomass production profile during the 5 days of fermentation
are showed in Figure 13, while gas production, carbohydrate consumption and pH
variation is showed in Figures 13 and 14.
�� ° 7U� � ST� i � � 7UP� 2� : 1� � °: r � 22� � e� � � � � 2� DU: � 7� 3°: e� � 7U°e � 3N� � � 7o3°P� 3°: e� : 1� 3N� � � : e2: U3°7r � � � � � � S � °e� P°e� 22� �
r � � °7r � 27DDo� r � e3� � � s °3N� 27 � U� � e� � d7°� � u��

5S�
�
�� ° 7U� � SA� i � � °: � 2� DU: � 7� 3°: eh� 27� 23U� 3� � � : e27r D3°: e� � e� � D � P� U°� 3°: e� � 7U°e � 1� Ur � e3� 3°: e� : 1� P°e� 22� �
27DDo� r � e3� � � s °3N� 27 � U� � e� � d7°� � � � t � 3N� � � : e2: U3°7r � � � � � � Su��
It was noticed a high production of VFAs, mainly butyrate and lactate, on the
first 24 hours, which was accompanied by a high rate of sugar and propionic acid
consumption, pH decrease and biogas production. More than 60% of the gas that
has been produced until the end of fermentation was produced in this first 24hours
time interval.
On the second day of fermentation, it was noticed the consumption of the
carbon source and some of the VFAs produced in the first day (lactic, acetic and
formic acids) resulting in propionic acid, gas and biomass production. This might be
a consequence of flourishing of different microorganism(s) (apparently propionic
bacteria) from those present in the first 24 hours of fermentation.
Because no considerable differences in VFAs profile was noticed after the
second day of fermentation, we can state that the consumption of such VFAs was
directed towards hydrogen and biomass production (which is confirmed by
comparing Figures 10 and 11).
These results indicate that a continuous fermentation process for biohydrogen
and butyric acid by the consortia LPB AH1 can be carried with a hydraulic retention
time of 48 hours (since butyric acid is a desired product). In this process very low
concentration of lactic, acetic and propionic acid would be found and more than 90%
of the carbohydrate would be consumed. This proposed reduction of fermentation
time for a continuous process was carried by Zhang et al. (2006) (81) and resulted in

92
a reduction of the diversity of microbial community associated with an elimination of
propionate production without affecting the existence of dominant pure cultures.
On the other hand, conducting fermentation during only 24 hours will result in
higher H2 yield and productivity but a mixture of VFAs that will demand a more
laborious downstream prior purification, if this pure specific acid(s) is (are) desired.
3.1.1 Metabolic analysis According to the results presented in figures 13 and 14, a µmax of 0,15 d-1
was achieved. The substrate consumption rate in the first 48 hours was equal to 4,07
g.L-1.d-1. Approximately 2,2% of the substrate was used in biomass production (YX/S),
while almost 39% was used for butyrate production (44,6% considering every acid
produced – YVFAs/S). This means that 53,2% of the consumed substrate was probably
used in CO2 production (YCO2/S) and cellular maintenance (Ym/S).
At the end of the fermentation, 8,08Lgas/Lmedium was produced, an amount very
close to the one predicted during optimization in chapter 4 (8,85 Lgas/Lmedium). The
biogas composition is presented in Table 39. The presence of very low quantities of
oxygen indicates insignificant contamination of the gas before analysis and shows
that an anaerobic condition for cultivation was successfully achieved. Table 39 – Composition of the biogas produced during the fermentation by the consortium LPB AH1.
Biogas components Content (%)
Nitrogen 2,13
Carbon dioxide 66,2
Oxygen 0,62
Methane 0,00
Hydrogen* 31,05
*Hydrogen content was estimated by the amount to reach 100%
Considering the carbon dioxide percentage on the biogas and considering that
it is behaving as an ideal gas, we can estimate the amount of substrate used in CO2
as follows:
If P.V=n.R.T where P=1atm, V=(66,25%*8,08Lgas/Lmedium), R= 0,082057
atm.L.mol-1.K-1 and T (K)=37oC+273,15oC, the value for nCO2 is 0,21 mol/L (9,25

5T�
�
gCO2/L). If all the 53,2% of the cited consumed substrate was destined for CO2
production, the amount of the carbon dioxide produced should be:
CO2 = 0,532*11,48gsubstrate/L*1,54gCO2/gsucrose = 9,41gCO2/L
which means that approx. 98% of the 53,2% consumed substrate was
destined for CO2 production. The conclusion is, finally, that YCO2/S = 52% while Ym/S
is approx. 1,0%. A general representation of the destination of the substrate
consumed by the consortium LPB AH1 is showed in Figure 15.
�� ° 7U� � SH� i � � � DU� 2� e3� 3°: e� : 1� 3N� � � � 23°e� 3°: e� : 1� 3N� � 27� 23U� 3� � °e� 3� Ur 2� : 1� � � � 2h� � °: r � 22� � e� � � � C� DU: � 7� 3°: e�
� e� � � � oo7o� U� r � °e3� e� e� � u�
GAÁA' B� EI � � N� VEI � T� S� I N� VI S� NS� � � � N� BR� R�The maximum productivity of hydrogen was achieved considering the first 24
hours of fermentation, reaching 61,5 mlH2.L-1.h-1 (which means 2,75 mmolH2.L-1.h-1).
This productivity can be considered low, since it is quietly normal to find
productivities of 5-20 mmolH2.L-1.h-1 in the literature.
On the other hand, a yield of 7,14 molH2.molsucrose-1 was achieved, which is as
high as 89,25% of the theoretical maximum yield. This is very high and is achieved
more frequently using thermophiles.
This opposite behavior of achieving high molH2.molCsource-1 and low
productivities is well described in the literature. In order to achieve high conversion
rates, generally long times are needed, which consequently results in low
productivity. As example, a very high productivity of 50mmol.L-1.h-1 was achieved but
with yields as low as 0,09molH2.molglucose-1 by culturing Bacteroides fragilis in glucose

94
rich medium (86). Probably higher productivities (with lower conversion rate) could
be achieved if hourly analysis were carried during the exponential H2 production
phase.
Considering the hydrogen content in the biogas, the inferior and superior
calorific powers (ICP and SCP) were calculated and estimated as 9050 kcal.kg-1 and
10730 kcal.kg-1, respectively. In comparison to a methane rich biogas (65% CH4 –
ICP = 7735 kcal.kg-1 and 8612 kcal.kg-1), the calorific power presented by the
hydrogen rich biogas is superior (17% higher).
At this point, a reflexion might be carried in terms of the feasibility of usage of
hydrogen-rich biogas as heat source instead of methane-rich biogas. The difference
in terms of calorific power is considerable and indicates that hydrogen-rich biogas is
better, but the complexity of the technology to produce it is greatly superior to the
one to produce methane. This suggests that to became feasible, considering that
hydrogen content in the biogas could not be greatly increased, the proposed
technology might consider the purification of hydrogen (adding value to the final
product).
3.2 Biohydrogen and VFAs production in bioreactor scale by the
consortium LPB AH2
Biohydrogen and VFAs fermentation process using the consortium LPB AH2
was carried using vinasse and sugarcane juice as medium, according to the results
achieved in previous chapters. Carbohydrate concentration at the beginning of the
fermentation was quantified as 13.42 g/L and the initial pH was 7,0.
Almost 50% of the carbon source was consumed in the first 24 hours and was
exhausted in the last day of fermentation (Figure 16). Biomass production was equal
to 0.65g/L and final pH was 5.15.

5H�
�
�� ° 7U� � SE� i � � °: � 2� DU: � 7� 3°: eh� 27� 23U� 3� � � : e27r D3°: e� � e� � D � P� U°� 3°: e� � 7U°e � 1� Ur � e3� 3°: e� : 1� P°e� 22� �
27DDo� r � e3� � � s °3N� 27 � U� � e� � r : o� 22� 2� � t � 3N� � � : e2: U3°7r � � � � � � Cu��
�� ° 7U� � SR� i � � 7UP� 2� : 1� � °: r � 22� � e� � � � � 2� DU: � 7� 3°: e� � 7U°e � 3N� � � 7o3°P� 3°: e� : 1� 3N� � � : e2: U3°7r � � � � � � S � °e� P°e� 22� �
r � � °7r � 27DDo� r � e3� � � s °3N� 27 � U� � e� � r : o� 22� 2u��
The HPLC analysis of the samples withdrawed daily showed a complex
behavior of VFAs production (Figure 17). In the first 24 hours butyric, acetic and
lactic acids were produced in large amounts, while low quantities of formic and
propionic acid were identified. This was accompanied by great carbohydrate uptake
(6.21g.L-1), a great biogas production (58% of the gas that would be produced by the
end of the fermentation) and a pH drop to 5.9. In the second day of fermentation, the
VFAs were consumed and gas production lowered, which is possibly an effect of

96
consortia composition variation. During the third day of fermentation little changes
was noticed, but after that butyric, acetic and low amounts of propionic acids were
observed together with carbohydrate consumption. Biomass production was greatly
increased in this time interval (4th-6th day of fermentation) and gas production rate
was kept relatively constant.
3.2.1 Metabolic analysis According to the results presented in figures 16 and 17, a µmax of 0.375 d-1
was achieved. The maximum substrate consumption rate (first 24 hours) was equal
to 6.21 g.L-1.d-1 (YX/S). About 4.9% of the substrate was used in biomass production
(YX/S), while almost 41.5% was used for VFAs production (YVFAs/S). This means that
53.6% of the consumed substrate was probably used in CO2 production (YCO2/S) and
cellular maintenance (Ym/S).
In comparison to the optimization prediction of gas production in chapter 4
(7.76 Lgas/Lmedium), 6.41Lgas/Lmedium was produced at the end of the fermentation in
the bioreactor. This difference illustrate the expected variation of biogas (and
consequently biohydrogen) production caused by the use of complex medium and a
consortium of microorganisms.
The biogas composition is presented in Table 40. The presence of very low
quantities of oxygen indicates an insignificant contamination of the gas before
analysis and shows that an anaerobic condition for cultivation was successfully
achieved. Table 40 – Composition of the biogas produced during the fermentation by the consortium LPB AH2.
Biogas components Content (%) Nitrogen 3.93
Carbon dioxide 62.4 Oxygen 0.97 Methane 0.00
Hydrogen* 32.7 *Hydrogen content was estimated by the amount to reach 100%
The mass balance to determine YCO2/S and Ym/s was carried as described in
section 3.2.1. If P.V=n.R.T where P=1atm, V=(62.4%*6.41Lgas/Lmedium), R= 0.082057
atm.L.mol-1.K-1 and T (K)=37oC+273.15oC, the value for nCO2 is 0.157 mol/L (6.91

5R�
�
gCO2/L). If all the 53.6% of the cited consumed substrate was destined for CO2
production, the amount of the carbon dioxide produced should be:
CO2 = 0.532*13.42gsubstrate/L*1.54gCO2/gsucrose = 10.99gCO2/L
which means that approx. 82% of the 53.6% consumed substrate was
destined for CO2 production. The conclusion is, finally, that YCO2/S = 43.9% while Ym/S
is approx. 9.7%. A general representation of the destination of the substrate
consumed by the consortium LPB AH1 is showed in Figure 18.
�� ° 7U� � SI � i � � � DU� 2� e3� 3°: e� : 1� 3N� � � � 23°e� 3°: e� : 1� 3N� � 27� 23U� 3� � °e� 3� Ur 2� : 1� � � � 2h� � °: r � 22� � e� � � � C� DU: � 7� 3°: e�
� e� � � � oo7o� U� r � °e3� e� e� � u��
GA' A' B� EI � � N� VEI � T� S� I N� VI S� NS� � � � N� BR� R�The maximum productivity of hydrogen was achieved considering the first 24
hours of fermentation, reaching 55.07 mlH2.L-1.h-1 (which means 2.46 mmolH2.L-1.h-1)
with a yield of 3.25 molH2.molsucrose-1 (41% of the theoretical maximum yield). The
highest yield was achieved considering 2 days of fermentation (3.66 molH2.molsucrose-
1), but the productivity was as low as 35.2 mlH2.L-1.h-1.
Considering the hydrogen content in the biogas, the inferior and superior
calorific powers (ICP and SCP) were calculated and estimated as 9483 kcal.kg-1 and
11248 kcal.kg-1, respectively. In comparison to a methane rich biogas (65% CH4 –
ICP = 7735 kcal.kg-1 and 8612 kcal.kg-1), the calorific power presented by the
hydrogen rich biogas is superior (22.6% higher).
�

98
4. Conclusion
According to the results achieved in the experimentations described in this
chapter showed the feasibility to produce hydrogen in the conditions described in a
rector scale. The metabolic analysis by daily analysis of biogas production and VFAs
provided important information to the development of a continuous process, which is
more feasible to the proposed technology.
Through material and energy balance it was possible to estimate how the
energy of the substrate is distributed during the fermentation. Moreover, growth
indicators were calculated are of great value in further development of this process.
Considering the possibility of associating this technology to a biogas or
solvent production process (for biogas production, VFAs works as substrates), it is
important to note that there is a production of considerable amounts of VFAs. The
process developed with the consortium LPB AH1 has potential for butanol production
since butyrate concentration in the broth is much higher than other VFAs.
In terms of how the hydrogen produced can be used, a deep analysis might
be carried. The first point is that the proposed technology depends on sugarcane
molasses or juice, which are used in ethanol production. In order to be considered
promising (and to be transferred to the industry) the proposed technology should
provide substantial economic gains. Thus, 3 scenarios of usage of hydrogen by the
ethanol industry are proposed:
i) Use in direct heat generation: Ethanol industries use sugarcane bagasse in
boilers to produce heat. Sugarcane bagasse (with 20% water) PCS is 3641
kcal/kg, almost 3 times lower than the biogas generated by using vinasse
supplemented with sugarcane juice.
A ethanol plant that produced 1000 m³ of ethanol/day uses approx. 12000
tons of sugarcane, resulting in approx. 1800tons of sugarcane bagasse, which
are capable to generate 6,55*109 kcal. In this scenario, the increase in the
energy generated by using biogas as a complementary source of energy will
be insignificant (hydrogen-rich biogas can produce up to 8,5*106 kcal/day
considering the production rate and biogas composition achieved using LPB
AH1 consortium) .

99
This suggests that at the current level of development the use of hydrogen for
direct heat production is unfeasible.
ii) Use in fuel cells: Ethanol industries generally produce more energy than they
use, selling the surplus electricity to local electric companies. Anyway,
hydrogen could be used to enhance this energy production.
Considering a 1,2 kW proton exchange membrane fuel cell that uses
hydrogen with purity of 99.99%, at a consumption rate of 18.5 L/min (31), 20
m³ of vinasse based medium was needed to produce enough hydrogen to
operate when considering fermentation of vinasse and molasses with the
consortium LPB AH2 at the conditions described in this chapter. When
considering the use of the consortium LPB AH1 (vinasse supplemented with
sugarcane juice) the volume needed is of approx. 19 m³.
Considering the realistic daily production of 1000m³ ethanol by an ethanol
plant, which means the daily generation of 12 thousand m³ of vinasse, approx.
720kW of energy could be produced. The average price of the KWh in 2012 in
Brazil was R$0,333 (U$0,17), which means that monthly approx. U$3600 in
energy could be produced using hydrogen in fuel cell, which is very low.
iii) Purification of hydrogen: the price of pure analytic hydrogen is approx. U$
56,50/m³ (White Martins, Brazil). By the proposed technology, fermenting 1 m³
of vinasse generates daily approx. 1,5 m³ of pure hydrogen (rate achieved
using LPB AH1 consortium). Considering an ethanol plant generating 12000
m³ of vinasse, approx. U$ 1 million dollar/day can be obtained by selling pure
H2.

100
General Conclusion The scientific advances for the reuse of industrial wastewaters for the
production of compounds promote the recovery of the energy and nutrients that were
lost in wastewater treatments. But in most cases the compounds produced from this
feedstock are not feasible to be used in food/feed or as pharmaceuticals, making
biofuels production an important alternative.
Among the biofuels feasible to be produced through biological methods (oils,
biodiesel, CH4, H2) hydrogen is the one with higher energy density and is told to be
the fuel of the future. Its production through fermentation of agroindustrial wastes
(liquids and solids) issues zero extra carbon to the atmosphere, being considered
thus an eco-friendly source of energy. Moreover, the flexibility of hydrogen as a final
product (use in direct combustion for heat production, to produce electricity and/or in
chemical industries) is another big advantage.
In present, fermentation technologies to produce hydrogen are in a basic
level of development and face economical drawbacks, but are gaining importance in
the last years (more than 20 thousand papers were published in the last 10 years).
Considerable advances in this topic will probably be achieved soon. It is unanimous
that the use of agroindustrial residues (solid and liquid) is the main alternative to
overcome this economic dilemma. In this context, it is important to consider that the
feedstock might be produced in large amounts. If it presents great potential but is
generated in small quantities, its use for biohydrogen production is unworthy.
In Brazil, vinasse is the industrial liquid residue produced in most quantity: in
2013/2014 it is expected to be produced almost 26 billion liters of ethanol, which
means approx. 550 billion liters of vinasse. Despite presenting benefits when used
as fertilizer, the issues that are being observed as consequence of its disposal will
certainly result in increasing government (environment) restrictions to protect the
environment. Furthermore most ethanol industries generate vinasse in excess and
gives not rational destination to it.
The production of biohydrogen from vinasse is interesting because of the
possibility to use it as source of energy within the industry in an integrated process.
In this work a process for the production of biohydrogen fermenting vinasse with
anaerobic bacteria was developed. The study covered the search and screening of

101
microorganisms, and also the optimization and production in bioreactor scale,
presenting interesting results. This work represents an important first step of the
development of a process to be used industrially.

102
Future works The present work opens the possibility of innumerous studies to be carried in
the field. Exploration of new microorganisms should be carried constant since the
biodiversity seems to be an inexhaustible source of improvement. The
characterization of the consortia might give valuable information and should be
carried.
Since the bioreactor experiments were carried only in batch mode, it is of
great interest to carry fermentations in continuous and feed-batch mode. By
controlling the hydraulic retention time in continuous fermentations it will be probably
possible to select those microorganisms with higher hydrogen productivity. Different
fermenters should also be tested: membrane reactors, UASB (upflow anaerobic
sludge blanket), and others.
The effluent of the hydrogen fermentation can be evaluated for the production
of methane in a coupled process. It can also be evaluated for its potential as fertilizer
for sugarcane, which would be of great interest.

103
Bibliographic References (1) United Nations Framework Convention on Climate Change: http://www.unfccc.int
(2) Reith J H (2001) Report of the Workshop Biological Hydrogen Production,
October 4, Utrecht, The Netherlands (In Dutch). ECN-C--02-085.
(3) Nandi, R, Sengupta, S (1998) Microbial production of hydrogen: an overview.
Critical Reviews in Microbiology. 24 (1), 61-84.
(4) Gaffron H (1939) Reduction of CO2 with H2 in green plants. Nature. 143, 204–
205.
(5) Gaffron H (1942) Reduction of carbon dioxide coupled with the oxyhydrogen
reaction in algae. J Gen Physiol. 26, 241–267
(6) Morimoto M (2002) Why is the anaerobic fermentation in the production of the
biohydrogen attractive?. The Proceedings of Conversion of Biomass into Bioenergy.
Organized by New energy and Industrial Technology Development Organization
(NEPO), Japan and Malaysian Palm oil Board (MPOP).
(7) Solomon B O, Zeng A-P, Biebl H, Schlieker H, Posten C, Deckwer WD (1995)
Comparison of the energetic efficiencies of hydrogen and oxychemicals formation in
Klebsiella pneumonia and Clostridium butyricum during anaerobic growth on
glycerol. J Biotechnol. 39, 107-117.
(8) Kengen S W M, Stams A J M, Vos W M de (1996) Sugar metabolism of
hyperthermophiles. FEMS Microbiol Rev. 18, 119-137.
(9) Janssen P H, Morgan H W (1992) Heterotrophic sulfur reduction by Thermotoga
sp. strain FjSS3.B1. FEMS Microbiol Lett. 96, 213-218.
(10) Kengen S W M, Stams A J M (1994) Formation of L-alanine as a reduced
endproduct in carbohydrate fermentation by the hyperthermophilic archaeon
Pyrococcus furiosus. Arch Microbiol 161, 168-175.
(11) Thauer R (1977) Limitation of microbial H2-formation via fermentation. In:
Schlegel HG, Barnea J (eds) Microbial energy conversion. Pergamon, Oxford, pp
201–204.
(12) Redwood M D, Beedle M P, Macaskie L E (2009) Integrating dark and light bio-
hydrogen production strategies: towards the hydrogen economy. Rev Environ Sci
Biotechnol. vol 8, p.149–185.
104
(13) Rachman M A, Furutani Y, Nakashimada Y, Kakizono T, Nishio N (1997)
Enhanced hydrogen production in altered mixed acid fermentation of glucose by
Enterobacter aerogenes. J Ferment Bioeng 83, 358-363.
(14) Kumar N, Das D (2000) Enhancement of hydrogen production by Enterobacter
cloacae IIT-BT 08. Process Biochem 35, 589-593.
(15) Kumar N, Ghosh A, Das D (2001) Redirection of biochemical pathways for the
enhancement of H2 production by Enterobacter cloacae. Biotechnol Lett 23, 537-
541.
(16) Claassen P A M, van Lier J B, Lopez Contreras A M, van Niel E W J, Sijtsma L,
Stams A J M, de Vries S S, Weusthuis R A (1999) Utilisation of biomass for the
supply of energy carriers. Appl Microbiol Biotechnol 52, 741-755.
(17) Conrad R, Wetter B (1990) Influence of temperature on energetics of hydrogen
metabolism in homoacetogenic, methanogenic, and other anaerobic bacteria. Arch
Microbiol 155, 94-98.
(18) van Niel E W J, Claassen P A M, Stams A J M (2003) Substrate and product
inhibition of hydrogen production by the extreme thermophile, Caldicellulosiruptor
saccharolyticus. Biotechnol Bioeng 81, 255-262.
(19) Andel J G van, Zoutberg G R, Crabbendam P M, Breure A M (1985) Glucose
fermentation by Clostridium butyricum grown under a self-generated gas atmosphere
in chemostat culture. Appl Microbiol Biotechnol 23, 21-26.
(20) Heyndrickx M, Vansteenbeeck A, Vos P de, Ley L de (1986) Hydrogen gas
production from continuous fermentation of glucose in a minimal medium with
Clostridium butyricum LMG 1213tl. Syst Appl Microbiol 8, 239-244.
(21) Heyndrickx M, Vos P de, Ley L de (1990) H2 production from chemostat
fermentation of glucose by Clostridium butyricum and Clostridium pasterianum in
ammonium- and phosphate limitation. Biotechnol Lett 12, 731-736.
(22) Taguchi F, Mizukami N, Saito-Taki T, Hasegawa K (1995) Hydrogen production
from continuous fermentation of xylose during growth of Clostridium sp. strain no. 2.
Can J Microbiol 41, 536 – 540.
(23) Kataoka N, Miya A, Kiriyama K (1997) Studies on hydrogen production by
continuous culture system of hydrogen producing anaerobic bacteria. Water Science
Technol 36, 41-47.

105
(24) Yokoi H, Tokushige T, Hirose J, Hayashi S, Takasaki Y (1998) H2 production
from starch by a mixed culture of Clostridium butyricum and Enterobacter
aerogenes. Biotechnol Lett 20, 143 – 147.
(25) Yokoi H, Saitsu A, Uchida H, Hirose J, Hayashi S, Takasaki Y (2001) Microbial
hydrogen production form sweet potato starch residue. J Bioscience Bioengineering
91, 58 – 63.
(26) Ueno Y, Kawai T, Sato S, Otsuka S, Morimoto M (1995) Biological production of
hydrogen from cellulose by natural anaerobic microflora. J Ferment Bioeng 79, 395-
397.
(27) Ueno Y, Otsuka S, Morimoto M (1996) Hydrogen production from industrial
wastewater by anaerobic microflora in chemostat culture. J Ferment Bioeng 82, 194
– 197.
(28) Tanisho S, Suzuki Y, Wakao N (1987) Fermentative hydrogen evolution by
Enterobacter aerogenes strain E.82005. Int J Hydrogen Energy 12, 623-627.
(29) Tanisho S, Wakao S, Kosako Y (1983) Biological hydrogen production by
Enterobacter aerogenes. J Chem Eng Japan 16, 529-530.
(30) Kumar N, Das D (2000) Enhancement of hydrogen production by Enterobacter
cloacae IIT-BT 08. Process Biochem 35, 589-593.
(31) Gencoglu M T, Ural Z (2009). Design of a PEM fuel cell system for residential
application. International Journal of Hydrogen Energy. 34(12), 5242-5248.
(32) Nguyen T A, Han S J, Kim J P, Kim M S, Sim S J (2010) Hydrogen production
of the hyperthermophilic eubacterium, Thermotoga neapolitana under N2 sparging
condition. Bioresour Technol. 10, S38–S41.
(33) Monteiro C E (1975). Brazilian experience with the disposal of wastewater from
the cane and alcohol industry. Process Biochemistry: Vol. 10, no. 9. New York:
Elsevier, p. 33.
(34) Hassuda S (1989) Impactos da infiltração da vinhaça de cana no aqüífero
Bauru. São Paulo. Teses de mestrado. IGC – Instituto de Geociências.
(35) da Silva M A S, Griebeler N P, Borges L C (2007) Uso de vinhaca e impactos
nas propriedades do solo e lençol freático. Revista Brasileira de Engenharia Agricola
e Ambiental. 11 (1), 108–114.

106
(36) Cuetos M J, Gomez X, Escapa A, Morian A (2007) Evaluation and simultaneous
optimization of bio-hydrogen production using 32 factorial design and the desirability
function. Journal of Power Sources. 169, 131–139.
(37) Calli B, Boënne W, Vanbroekhoven K (2006) Bio-Hydrogen Potential of Easily
Biodegradable Substrate Through Dark Fermentation. WHEC 16, Lyon France.
(38) Bio-methane & Bio-hydrogen (2003) Edited by J.H. Reith, R.H. Wijffels and H.
Barten. Dutch Biological Hydrogen Foundation.
(39) Gosh S et al (1999) Pilot-scale gasification of MSW by high-rate and twophase
anaerobic digestion. in International symposium on Anaerobic Digestion of Solid
Waste. Barcelona: Association Water Quality.
(40) Zeeman G and Sanders W (2001) Potential of anaerobic digestion of complex
waste(water). Water Science and Technology. 44(8), 115-122.
(41) Miron Y, Zeeman G, van Lier J B, Lettinga G (2000) The role of sludge
retention time in the hydrolysis and acidification of lipids, carbohydrates and proteins
during digestion of primary sludge in CSTR systems. Water resources. 34 (5), 1705-
1713.
(42) http://www.biodieselbr.com/energia/biogas/vinhaca-biogas.htm. Accessed on
March 19th, 2009.
(43) Reith J H (2001) Report of the Workshop Biological Hydrogen Production,
October 4, Utrecht, The Netherlands (In Dutch). ECN-C--02-085.
(44) Cammack R, Frey M and Robson R (2001). Hydrogen as a fuel: learning from
Nature. Taylor and Francis, London.
(45) Agrawal P, Hema R, Kumar S M (2007) Experimental investigation on bioogical
hydrogen production using different biomass. Jurnal Teknologi, 47(F) Keluaran
Khas, Dis. 13–24.
(46) Matsumoto M and Nishimura Y (2007) Hydrogen production by fermentation
using acid acetic and lactic acid. Journal of Bioscience and Bioengineering. 103 (3),
236-241.
(47) Zurawski D, Meyer M, Stegmann R (2005). Fermentative production of
biohydrogen from biowaste using digested sewage sludge as inocullum.
Proceedings Sardinia. 10º International Waste Management and Landfill
Symposium. S. Margherita di Pula, Cagliari, Italy.

107
(48) Levin D B, Pitt L, Love M (2004) Biohydrogen production: prospects and
limitations to practical application. International Journal of Hydrogen Energy. 29, 173
– 185.
(49) Kim J K, Nhat L, Chun Y M, Kim S W (2008) Hydrogen Production Conditions
from Food Waste by Dark Fermentation with Clostridium beijerinckii KCTC 1785.
Biotechnology and Bioprocess Engineering. 13, 499-504.
(50) Jones D T and Woods D R (1986) Acetone-Butanol Fermentation Revisited.
Microbiological Reviews. 50 (4), 484-524.
(51) Das D, Khanna N, Verzigloru T N (2008) Recent development in biological
hydrogen production processes. Chemical Industry & Chemical Engineering
Quarterly. 14 (2), 57–67.
(52) Thompson R S (2008) Hydrogen Production by Anaerobic Fermentation Using
Agricultural and Food Processing Wastes Utilizing a Two-Stage Digestion System.
Master thesis, Utah State University.
(53) Nath K and Das D (2004) Improvement of fermentative hydrogen production:
various approaches. Appl Microbiol Biotechnol. 65, 520–529.
(54) Neto E A and Nakahodo T (1995) Relatório da Copersucar, Projeto nº
95000278, Piracicaba, Brasil, 26p.
(55) Gheshlaghi R, Scharer J M, Moo-Young M, Chou C P (2009) Metabolic
pathways of clostridia for producing butanol. Biotechnology Advances. 27, 764–781.
(56) Horiuchi J I, Shimizu T, Tada K, Kanno T, Kobayashi M (2002) Selective
production of organic acids in anaerobic acid reactor by pH control. Bioresource
Technology. 82, 209–213.
(57b) Yu H Q, Fang H H (2001) Inhibition on Acidogenesis of Dairy Wastewater by
Zinc and Copper. Environmental Technology. vol 22, n12, pp. 1459-1465.
(58) Winter CJ. Into the hydrogen energy economy-milestones. (2005) Int J
Hydrogen Energy. 30, 681–5.
(59) Oztekin R, Kapdan I K, Kargi F, Argun H (2008) Optimization of media
composition for hydrogen gas production from hydrolyzed wheat starch by dark
fermentation. International Journal of Hydrogen energy. 33, 4083 – 4090. (60) Cruwys J A, Dinsdale R M, Hawkes F R, Hawkes D L (2002) Development of a
static headspace gas chromatographic procedure for the routine analysis of volatile
fatty acids in wastewaters. Journal of Chromatography A. 945, 195–209.

108
(61) Hallenbeck P C (2009) Fermentative hydrogen production: Principles, progress,
and prognosis. International Journal of Hydrogen Energy. 34, 7379 – 7389.
(62) Martin Dworkin, Stanley Falkow, Eugene Rosenberg, Karl-Heinz Schleifer, Erko
Stackebrandt (2006) The Prokaryotes A Handbook on the Biology of Bacteria.
Springer Science+Business Media, LLC. Third Edition. Volume 4: Bacteria:
Firmicutes, Cyanobacteria.
(63) Collins M D, Lawson P A, Willems A, Cordoba J J, Fernandes-Garayzabal J,
Garcia P, Cai J, Hippe H and Farrow J A (1994) The phylogeny of the genus
Clostridium: Proposal of five new genera and eleven new species combinations. Int.
J. Syst. Bacteriol. 44, 812–826.
(64) Wang B, Wan W, Wang J (2008) Inhibitory effect of ethanol, acetic acid,
propionic acid and butyric acid on fermentative hydrogen production. International
Journal of Hydrogen Energy. 33, 7013 – 7019.
(65) Hallenbeck P C and Ghosh D (2009) Advances in fermentative biohydrogen
production: the way forward? Trends in Biotechnology. 27 (5), 287-297.
(66) Chong M-L, Sabaratnam V, Shirai Y, Hassan M A (2009) Review: Biohydrogen
production from biomass and industrial wastes by dark fermentation. International
Journal of Hydrogen Energy. 34, 3277 – 3287.
(67) Hawkes F R, Hussy I, Kyazze G, Dinsdale R, Hawkes D L (2007) Continuous
dark fermentative hydrogen production by mesophilic microflora: Principles and
progress. International Journal of Hydrogen Energy. 32, 172 – 184.
(68) Thauer R K, Jungerman K, Decker K (1977) Energy conservation in
chemotrophic anaerobic bacteria. Bacteriol. Rev. 41, 100–180.
(69) Murat Kassap (2002) Nitrogen metabolism and solvent production in Clostridium
beijerinckii NRRL B593. Doctoral Thesis. Faculty of the Virginia Polytechnic Institute
and State University. 221p.
(70) Cohen A, Breure A M, van Andel J G, van Deursen A (1979) Anaerobic
digestion of glucose with separated acid production and methane formation. Wat
Res. 13, 571– 580.
(71) Angenent L T , Karim K, Al-Dahhan M H, Wrenn B A, Domiguez-Espinosa, R
(2004) Production of bioenergy and biochemicals from industrial and agricultural
wastewater. Trends Biotechnol. 22 (9), 477–485.

109
(72) Ruzicka M (1996) The effect of hydrogen on acidogenic glucose cleavage.
Water Res. 30 (10), 2447–2451.
(73) Crabbenbaum P M, Neijssel O M, Tempest D W (1985) Metabolic and energetic
aspects of the growth of Clostridium butyricum on glucose in chemostat culture.
Arch. Microbiol. 142, 375–382.
(74) van Ginkel S W, Logan B (2005) Increased biological hydrogen production with
reduced organic loading. Water Research. 39, 3819–3826.
(75) Murat Gassap. Nitrogen Metabolism and Solvent Production in Clostridium
beijerinckii NRLL B593. Thesis. Blacksburg, EUA. July, 2002. 221 p.
(76) Adam Prazmowski. Untersuchungen über die Entwickelungsgeschichte und
Fermentwirkung einiger Bacterien-Arten. Thesis. University of Leipzig, Germany.
1880.
(77) Won S G, Lau A K (2011) Effects of key operational parameters on biohydrogen
production via anaerobic fermentation in a sequencing batch reactor, Bioresource
Technology, 102, 6876– 6883.
(78) Rittmann S, Herwig C (2012) A comprehensive and quantitative review of dark
fermentative biohydrogen production. Microbial Cell Factories, 11, 115;
(79) Chang J-S, Lee K-S, Lin P-J (2002) BioHydrogen Production with fixed-bed
bioreactors. Int J Hydrogen Energy. 27,1167–74.
(80) Lee D-Y, Li Y-Y, Noike T (2009) Continuous H2 production by anaerobic mixed
microflora in membrane bioreactor. Bioresource Technology. 100, 690–695
(81) Zhang H S, Bruns M A, Logan B E (2006) Biological hydrogen production
by Clostridium acetobutylicum in an unsaturated flow reactor Water Res. 40, 728–
734
(82) Zeidan A A, van Niel E W J (2010) A quantitative analysis of hydrogen
production efficiency of the extreme thermophile Caldicellulosiruptor owensensis
OL. Int J Hydrogen Energ. 35, 1128–1137.
(83) Alshiyab H, Kalil M S, Hamid A A, Yusoff W M W (2008) Effect of salts addition
on hydrogen production by C. acetobutylicum. Pak J Biol Sci. 11, 2193–2200.
(84) Kumar N, Das D (2000) Enhancement of hydrogen production by Enterobacter
cloacae IIT-BT 08.Process Biochem. 35, 589–593.

SSc �
�
(85) Kumar N, Das D (2001) Continuous hydrogen production by immobilized
Enterobacter cloacae IIT-BT 08 using lignocellulosic materials as solid
matrices. Enzyme Microb Technol. 29, 280–287.
(86) Chen M, Wolin MJ (1981) Influence of heme and vitamin B12 on growth and
fermentations of Bacteroides species. J Bacteriol. 145, 466-471.
(87) Doi T, Matsumoto H, Abe J, Morita S (2009) Feasibility study on the application
of rhizosphere microflora of rice for the biohydrogen production from wasted bread.
Int. J. Hydrogen Energy. 34(4), 1735- 1743.
(88) Ewan B C R, Allen R W K (2008) A figure of merit assessment of the routes to
hydrogen. Int. J. Hydrogen Energy. 30 (8), 809–819
(89) Hu B, Chen S L (2007) Pretreatment of methanogenic granules for immobilized
hydrogen fermentation. Int. J. Hydrogen Energy. 32, 3266–3273.
(90) Liu G, Shen J (2004) Effects of culture medium and medium conditions on
hydrogen production from starch using anaerobic bacteria. J. Biosci. Bioeng. 98,
251-256.
(91) Liu C Z, Cheng X Y (2010) Improved hydrogen production via thermophilic
fermentation of corn stover by microwave assisted acid pretreatment. Int. J.
Hydrogen Energy. 35, 8945-8952.
(92) Mu Y, Yu H Q, Wang Y (2006) The role of pH in the fermentative H2 production
from an acidogenic granule-based reactor. Chemosphere. 64, 350 –358.
(93) Kim B H, Bellows P, Datta R, Zeikus J G (1984) Control of carbon and electron
flow in Clostridium acetobutylicum fermentations: utilization of carbon monoxide to
inhibit hydrogen production and to enhance butanol yields. Appl Environ Microb. 48,
764–770.
(94) Zhao X, Xing D, Fu N, Liu B, Ren N (2011) Hydrogen production by the newly
isolated Clostridium beijerinckii RZF-1108. Bioresource Technol. 102:8432–8436.
(95) Pan C-M, Fan Y-T, Zhao P, Hou H-W (2008) Fermentative hydrogen production
by the newly isolated Clostridium beijerinckii Fanp3. Int J Hydrogen Energ. 33,
5383–5391.
(96) Lo Y-C, Chen W-M, Hung C-H, Chen S-D, Chang J-S (2008) Dark H2
fermentation from sucrose and xylose using H2-producing indigenous bacteria:
Feasibility and kinetic studies. Water Res. 42, 827–842.

111
(97) Ferchichi M, Crabbe E, Hintz W, Gil G-H, Almadidy A (2005) Influence of
Culture Parameters on Biological Hydrogen Production by Clostridium
saccharoperbutylacetonicum ATCC 27021. World J Microb Biot. 21, 855–862.
(98) Ho K-L, Chen Y-Y, Lee D-J (2010) Biohydrogen production from cellobiose in
phenol and cresol-containing medium using Clostridium sp. R1. Int J Hydrogen
Energ. 35, 10239–10244.
(99) Lo Y-C, Chen W-M, Hung C-H, Chen S-D, Chang J-S (2008) Dark H2
fermentation from sucrose and xylose using H2-producing indigenous bacteria:
Feasibility and kinetic studies. Water Res. 42, 827–842.
(100) Yokoi H, Ohkawara T, Hirose J, Hayashi S, Takasaki Y (1995) Characteristics
of hydrogen production by aciduric Enterobacter aerogenes strain HO-39. J Ferment
Bioeng. 80, 571–574.
(101) Nakashimada Y, Rachman MA, Kakizono T, Nishio N (2002) Hydrogen
production of Enterobacter aerogenes altered by extracellular and intracellular redox
states. Int J Hydrogen Energ. 27, 1399–1405.
(102) Bisaillon A, Turcot J, Hallenbeck P C (2006) The effect of nutrient limitation on
hydrogen production by batch cultures of Escherichia coli. Int J Hydrogen Energ. 31,
1504–1508.
(103) Minnan L, Jinli H, Xiaobin W, Huijuan X, Jinzao C, Chuannan L, Fengzhang Z,
Liangshu X (2005) Isolation and characterization of a high H2-producing strain
Klebsiella oxytoca HP1 from a hot spring. Res Microbiol. 156, 76–81.
(104) Antonopoulou G, Ntaikou I, Gavala H N, Skiadas I V, Angelopoulos K,
Lyberatos G (2007) Biohydrogen production from sweet sorghum biomass using
mixed acidogenic cultures and pure cultures of Ruminococcus albus. Global NEST
J. 9, 144–151.
(105) Ntaikou I, Gavala H N, Kornaros M, Lyberatos G (2008) Hydrogen production
from sugars and sweet sorghum biomass using Ruminococcus albus. Int J Hydrogen
Energ. 33, 1153–1163.
(106) Talabardon M, Schwitzguebel J P, Peringer P (1999) Anaerobic thermophilic
fermentation for acetic acid production from milk permeate. J Biotechnol. 76, 83–92.
(107) Ren N, Cao G, Wang A, Lee D-J, Guo W, Zhu Y (2008) Dark fermentation of
xylose and glucose mix using isolated Thermoanaerobacterium
thermosaccharolyticum W16. Int J Hydrogen Energ. 33, 6124–6132.

112
(108) Ivanova G, Rakhely G, Kovacs K L (2009) Thermophilic biohydrogen
production from energy plants by Caldicellulosiruptor saccharolyticus and
comparison with related studies. Int J Hydrogen Energ. 34, 3659–3670.
(109) Lo Y-C, Lu W-C, Chen C-Y, Chang J-S (2010) Dark fermentative hydrogen
production from enzymatic hydrolysate of xylan and pretreated rice straw by
Clostridium butyricum CGS5. Bioresource Technol. 101, 5885–5891.
(110) Pattra S, Sangyoka S, Boonmee M, Reungsang A (2008) Bio-hydrogen
production from the fermentation of sugarcane bagasse hydrolysate by Clostridium
butyricum. Int J Hydrogen Energ. 33, 5256–5265.
(111) Levin D B, Islam R, Cicek N, Sparling R (2006) Hydrogen production by
Clostridium thermocellum 27405 from cellulosic biomass substrates. Int J Hydrogen
Energ. 31, 1496–1503.
(112) Antonopoulou G, Ntaikou I, Gavala H N, Skiadas I V, Angelopoulos K,
Lyberatos G (2007) Biohydrogen production from sweet sorghum biomass using
mixed acidogenic cultures and pure cultures of Ruminococcus albus. Global NEST
J. 9, 144–151.
(113) Ren N, Cao G, Wang A, Lee D-J, Guo W, Zhu Y (2008) Dark fermentation of
xylose and glucose mix using isolated Thermoanaerobacterium
thermosaccharolyticum W16. Int J Hydrogen Energ. 33, 6124–6132.
(114) Ren N, Li J, Li B, Wang Y, Liu S (2006) Biohydrogen production from
molasses by anaerobic fermentation with a pilot-scale bioreactor system.
International Journal of Hydrogen Energy. 31, 2147 – 2157;
(115) S. Venkata Mohan, V. Lalit Babu, P.N. Sarma (2007) Anaerobic biohydrogen
production from dairy wastewater treatment in sequencing batch reactor (AnSBR):
Effect of organic loading rate. Enzyme and Microbial Technology. 41, 506–515;
(116) Chyi-How Lay, I-Yuan Sung, Gopalakrishnan Kumar, Chen-Yeon Chu,
Chin-Chao Chen, Chiu-Yue Lin (2012) Optimizing biohydrogen production from
mushroom cultivation waste using anaerobic mixed cultures. International journal of
HydrogenEnergy. 37, 16473-16478;
(117) Herbert H.P. Fang, Chenlin Li, Tong Zhang (2006) Acidophilic biohydrogen
production from rice slurry. International Journal of Hydrogen Energy. 31, 683 – 692.

SST�
�
(117) Ferchichi M, Crabbe E, Gil G-H, Hintz W, Almadidy A (2005) Influence of initial
pH on hydrogen production from cheese whey. Journal of Biotechnology. 120, 402–
409;
(118) Ito T, Nakashimadda Y, Senba K, Matsui T, Nishio N (2005) Hydrogen and
ethanol production from glycerol-containing waste discharged after biodiesel
manufacturing process. J. Biosci. Bioeng. 100, 260-265;
(119) Mohan S V, Mohanakrishna G, Goud R K, Sarma P N (2009) Acidogenic
fermentation of vegetable based market waste to harness biohydrogen with
simultaneous stabilization. Bioresource Technology. 100, 3061–3068;
(120) Cláudio Plaza Pinto (1999) Tecnologia da Digestão Anaeróbia da Vinhaça e
Desenvolvimento Sustentável. Master Thesis. Universidade Estadual de Campinas.
Campinas, Brazil. 147 pages.
(121) Angenent L T and Wrenn B A (2008) Optimizing mixed-culture bioprocesses to
convert wastes into biofuels (chapter 15, pp. 179-194). In: Bioenergy. Eds.: Wall J.
D., Harwood, C. S. and Demain, A. ASM Press, Washington, DC.
(122) Aoyama K, Uemura I, Miyake J, Asada Y (1997) Fermentative Metabolism to
Produce Hydrogen Gas and Organic Compounds in a Cyanobacterium, Spirulina
platensis. J Fermentation and Bioengineering. 83, 17-20.
(123) Jeffries TW, Timourien H, Ward RL (1978) Hydrogen production by Anabaena
cylindrica: Effect of varying ammonium and ferric ions, pH and light.
App Env Microbiol. 35, 704-710.
(124) Margheri M C, Tredici M R, Allotta G, Vagnoli L (1990) Heterotrophic
metabolism and regulation of uptake hydrogenase activity in symbiotic
cyanobacteria. InDevelopments in plant and soil sciences – biological nitrogen
fixation. Edited by Polsinelli M, Materassi R, Vincenzini M. Dordrecht: Kluwer
Academic Publisher, 481-486.
(125) Yokoi H, Tokushige T, Hirose J, Hayashi S, Takasaki Y (1998) H2 production
from starch by a mixed culture of Clostridium butyricum and Enterobacter
aerogenes. Biotechnol. Lett. 20, 143-147.
(126) Latrille E, Trably E, Larroche C (2011) Production de biohydrogène : voie
fermentaire sombre in Bioprocédés dans les domaines de l'énergie et de
l'environnement, Edited by Boundrat J, Guezennec J, Monsan P. Editions T.I..
�

114
Publications
• Patent: Soccol, C.R.; Sydney, E. B.; Larroche C. "Processo para Produção
de Hidrogênio e Ácidos Graxos Voláteis", PI1005215-1, 2010;
• Sydney, E.B. ; da Silva, T.E. ; Tokarski, A. ; Novak, A.C. ; de Carvalho, J.C. ;
Woiciecohwski, A.L. ; Larroche, C. ; Soccol, C.R. . Screening of microalgae
with potential for biodiesel production and nutrient removal from treated
domestic sewage. Applied Energy, v. 88, p. 3291-3294, 2011.
• Angelis, S. ; Novak, A. C. ; Sydney, E. B. ; Carvalho, J. C. ; Pandey, A. ;
Noseda, M. D. ; Tholozan, J. L. ; Lorquin, J. ; Soccol, C. R. . Co-Culture of
Microalgae, Cyanobacteria, and Macromycetes for Exopolysaccharides
Production: Process Preliminary Optimization and Partial Characterization.
Applied Biochemistry and Biotechnology, v. 167, p. 1092, 2012.
• Patent: Soccol, C.R.; Novak, A.C. ; SOCCOL, A. T. ; SYDNEY, E. B. ; de
ANGELIS, S. “Processo para produção de exopolissacarídeos, biomassa e
extratos antioxidantes”, BR 1020120046318, 2012.
• Sarma, S. J.; Brar, S. K.; Sydney, E. B.; Le Bihan, Y.; Buelna, G.; Soccol, C.
R. Microbial hydrogen production by bioconversion of crude glycerol: A
review. International Journal of Hydrogen Energy, v. 37, p. 6473-6490, 2012.
• Dos Santos, J. D.; Lopes da Silva, A. L.; Da Luz Costa, J.; Scheidt, G. N.;
Novak, A. C.; Sydney, E. B. ; Soccol, C. R. Development of a vinasse
nutritive solution for hydroponics. Journal of Environmental Management, v.
114, p. 8-12, 2013.
• Book Chapter: Eduardo Bittencourt Sydney, Alessandra Cristine Novak,
Julio Cesar de Carvalho, Carlos Ricardo Soccol. Respirometric Balance and
Carbon Fixation of Industrially Important Algae. Biofuels from Algae, 1st
Edition. Elsevier. 2013.
• Book Chapter: Carlos José Dalmas Neto, Eduardo Bittencourt Sydney,
Ricardo Assmann, DolivarCoraucci Neto,Carlos Ricardo Soccol. Production of

115
Biofuels from Algal Biomass by Fast Pyrolysis. Biofuels from Algae, 1st
Edition. Elsevier. 2013.