Valorization Potentials of Rapeseed Meal in a Biorefinery ...
19
molecules Article Valorization Potentials of Rapeseed Meal in a Biorefinery Perspective: Focus on Nutritional and Bioactive Components Gabriella Di Lena 1, * , Jose Sanchez del Pulgar 1 , Massimo Lucarini 1 , Alessandra Durazzo 1 , Petra Ondrejí ˇ cková 2 , Florin Oancea 3 , Rodica-Mihaela Frincu 3 , Altero Aguzzi 1 , Stefano Ferrari Nicoli 1 , Irene Casini 1 , Paolo Gabrielli 1 , Roberto Caproni 1 , Igor ˇ Cerve ˇ n 4 and Ginevra Lombardi-Boccia 1 Citation: Di Lena, G.; Sanchez del Pulgar, J.; Lucarini, M.; Durazzo, A.; Ondrejíˇ cková, P.; Oancea, F.; Frincu, R.-M.; Aguzzi, A.; Ferrari Nicoli, S.; Casini, I.; et al. Valorization Potentials of Rapeseed Meal in a Biorefinery Perspective: Focus on Nutritional and Bioactive Components. Molecules 2021, 26, 6787. https://doi.org/ 10.3390/molecules26226787 Academic Editor: Rafal M. Lukasik Received: 14 October 2021 Accepted: 7 November 2021 Published: 10 November 2021 Publisher’s Note: MDPI stays neutral with regard to jurisdictional claims in published maps and institutional affil- iations. Copyright: © 2021 by the authors. Licensee MDPI, Basel, Switzerland. This article is an open access article distributed under the terms and conditions of the Creative Commons Attribution (CC BY) license (https:// creativecommons.org/licenses/by/ 4.0/). 1 CREA Research Centre for Food and Nutrition, Via Ardeatina 546, 00178 Rome, Italy; [email protected] (J.S.d.P.); [email protected] (M.L.); [email protected] (A.D.); [email protected] (A.A.); [email protected] (S.F.N.); [email protected] (I.C.); [email protected] (P.G.); [email protected] (R.C.); [email protected] (G.L.-B.) 2 ENVIRAL a.s., Trnavská Cesta, 920 41 Leopoldov, Slovakia; [email protected] 3 National Institute for Research and Development in Chemistry and Petrochemistry—ICECHIM, 060021 Bucharest, Romania; fl[email protected] (F.O.); [email protected] (R.-M.F.) 4 Pol’noservis a.s., Trnavská Cesta, 920 41 Leopoldov, Slovakia; [email protected] * Correspondence: [email protected]; Tel.: +39-06-51494501 Abstract: Rapeseed meal (RSM), a by-product of oilseed extraction connected to the agri-food and biofuel sectors, is currently used as animal feed and for other low-value purposes. With a biorefinery approach, RSM could be valorized as a source of bio-based molecules for high-value applications. This study provides a chemical characterization of RSM in the perspective of its valorization. A qualitative study of main functional groups by fourier transform infrared (FTIR) spectroscopy was integrated with a chemical characterization of macronutrients, minerals by inductively coupled plasma optical emission spectrometry (ICP-OES), phenolic acids and lipid components by high performance liquid chromatography-tandem mass spectrometry (HPLC-MS/MS), HPLC-diode- array detector (HPLC-DAD) and gas chromatography-mass spectrometry/flame ionization detector (GC-MS/FID). The study, conducted on different lots of RSM collected over a one-year period from an oil pressing factory serving a biofuel biorefinery, highlighted a constant quality over time of RSM, characterized by high protein (31–34%), fiber (33–40%) and mineral (5.5–6.8%) contents. Polyphenol extracts showed a significant antioxidant activity and a prevalence of sinapic acid, accounting for more than 85% of total phenolic acids (395–437 mg kg -1 RSM). Results highlight the potentialities of RSM for further valorization strategies that may lead to the creation of new cross-sector interconnections and bio-based value chains with improvement of the economics and sustainability of the bioeconomy sectors involved. Keywords: rapeseed meal; agri-food by-products; valorization; biorefinery; chemical characterization; nutrients; phenolic compounds; bioactive compounds; antioxidant activity 1. Introduction Rapeseed is the second most cultivated oilseed crop worldwide after soybean, with a production accounting for 68 million tons in 2020, providing a global volume of nearly 28 million metric tons of rapeseed oil worldwide [1]. In Europe, rapeseed is the dominant oilseed crop and its production accounts for almost 25% of the global production, with France, Germany and Poland as the top producing countries. The rapeseed market in Europe is mainly driven by the demand for rapeseed oil, which is mostly used by the food and feed industries and, to a lesser extent, by the biodiesel industry sector [2]. In Europe, rapeseed is the main feedstock for biodiesel production, a sector highly dependent on biofuel policies and regulations aiming at the diversification of energy Molecules 2021, 26, 6787. https://doi.org/10.3390/molecules26226787 https://www.mdpi.com/journal/molecules
-
Upload
khangminh22 -
Category
Documents
-
view
2 -
download
0
Transcript of Valorization Potentials of Rapeseed Meal in a Biorefinery ...
molecules
Article
Valorization Potentials of Rapeseed Meal in a BiorefineryPerspective: Focus on Nutritional and Bioactive Components
Gabriella Di Lena 1,* , Jose Sanchez del Pulgar 1, Massimo Lucarini 1, Alessandra Durazzo 1 ,Petra Ondrejícková 2, Florin Oancea 3 , Rodica-Mihaela Frincu 3 , Altero Aguzzi 1, Stefano Ferrari Nicoli 1,Irene Casini 1, Paolo Gabrielli 1, Roberto Caproni 1, Igor Cerven 4 and Ginevra Lombardi-Boccia 1
�����������������
Citation: Di Lena, G.; Sanchez del
Pulgar, J.; Lucarini, M.; Durazzo, A.;
Ondrejícková, P.; Oancea, F.; Frincu,
R.-M.; Aguzzi, A.; Ferrari Nicoli, S.;
Casini, I.; et al. Valorization Potentials
of Rapeseed Meal in a Biorefinery
Perspective: Focus on Nutritional and
Bioactive Components. Molecules
2021, 26, 6787. https://doi.org/
10.3390/molecules26226787
Academic Editor: Rafał M. Łukasik
Received: 14 October 2021
Accepted: 7 November 2021
Published: 10 November 2021
Publisher’s Note: MDPI stays neutral
with regard to jurisdictional claims in
published maps and institutional affil-
iations.
Copyright: © 2021 by the authors.
Licensee MDPI, Basel, Switzerland.
This article is an open access article
distributed under the terms and
conditions of the Creative Commons
Attribution (CC BY) license (https://
creativecommons.org/licenses/by/
4.0/).
1 CREA Research Centre for Food and Nutrition, Via Ardeatina 546, 00178 Rome, Italy;[email protected] (J.S.d.P.); [email protected] (M.L.); [email protected] (A.D.);[email protected] (A.A.); [email protected] (S.F.N.); [email protected] (I.C.);[email protected] (P.G.); [email protected] (R.C.); [email protected] (G.L.-B.)
2 ENVIRAL a.s., Trnavská Cesta, 920 41 Leopoldov, Slovakia; [email protected] National Institute for Research and Development in Chemistry and Petrochemistry—ICECHIM,
060021 Bucharest, Romania; [email protected] (F.O.); [email protected] (R.-M.F.)4 Pol’noservis a.s., Trnavská Cesta, 920 41 Leopoldov, Slovakia; [email protected]* Correspondence: [email protected]; Tel.: +39-06-51494501
Abstract: Rapeseed meal (RSM), a by-product of oilseed extraction connected to the agri-food andbiofuel sectors, is currently used as animal feed and for other low-value purposes. With a biorefineryapproach, RSM could be valorized as a source of bio-based molecules for high-value applications.This study provides a chemical characterization of RSM in the perspective of its valorization. Aqualitative study of main functional groups by fourier transform infrared (FTIR) spectroscopy wasintegrated with a chemical characterization of macronutrients, minerals by inductively coupledplasma optical emission spectrometry (ICP-OES), phenolic acids and lipid components by highperformance liquid chromatography-tandem mass spectrometry (HPLC-MS/MS), HPLC-diode-array detector (HPLC-DAD) and gas chromatography-mass spectrometry/flame ionization detector(GC-MS/FID). The study, conducted on different lots of RSM collected over a one-year periodfrom an oil pressing factory serving a biofuel biorefinery, highlighted a constant quality over timeof RSM, characterized by high protein (31–34%), fiber (33–40%) and mineral (5.5–6.8%) contents.Polyphenol extracts showed a significant antioxidant activity and a prevalence of sinapic acid,accounting for more than 85% of total phenolic acids (395–437 mg kg−1 RSM). Results highlightthe potentialities of RSM for further valorization strategies that may lead to the creation of newcross-sector interconnections and bio-based value chains with improvement of the economics andsustainability of the bioeconomy sectors involved.
Keywords: rapeseed meal; agri-food by-products; valorization; biorefinery; chemical characterization;nutrients; phenolic compounds; bioactive compounds; antioxidant activity
1. Introduction
Rapeseed is the second most cultivated oilseed crop worldwide after soybean, witha production accounting for 68 million tons in 2020, providing a global volume of nearly28 million metric tons of rapeseed oil worldwide [1]. In Europe, rapeseed is the dominantoilseed crop and its production accounts for almost 25% of the global production, withFrance, Germany and Poland as the top producing countries.
The rapeseed market in Europe is mainly driven by the demand for rapeseed oil, whichis mostly used by the food and feed industries and, to a lesser extent, by the biodieselindustry sector [2].
In Europe, rapeseed is the main feedstock for biodiesel production, a sector highlydependent on biofuel policies and regulations aiming at the diversification of energy
Molecules 2021, 26, 6787. https://doi.org/10.3390/molecules26226787 https://www.mdpi.com/journal/molecules
Molecules 2021, 26, 6787 2 of 19
supplies, the increment of competitivity and sustainability of biofuels and the reduction ofgreenhouse gas emissions [3–5]. Furthermore, the European strategy for the promotionof protein crops encourages the production of protein-rich plants, including rapeseed, toreduce dependence on imported vegetable proteins (mainly soy from third countries) andaccelerate the transition to more sustainable agri-food and farming systems [6].
The growth of rapeseed oil production coincides with a proportional production ofa significant co-stream in the form of press cake or meal. This co-product, resulting aftersubsequent oil extractions from rapeseeds after the pressing process, is produced in largequantities worldwide (40 million tons/year) and in the EU (12.5 million tons in 2020), [7].
With the depletion of natural resources, increment of greenhouse gas emissions andgrowing awareness of the need for sustainable development and valorization of agro-industrial by-products and wastes, the transformation of biomass into valuable materialsand energy is a global emerging concern [8,9].
Currently used as a protein complement in animal feed mixtures and sometimes asfertilizer or as combustible source, rapeseed meal should be valorized for higher end-uses,being an excellent source of nutritionally valuable and bioactive molecules. Rapeseedmeal contains proteins with a well-balanced amino acid composition [10]; it may thereforerepresent a good alternative protein source to meet the growing global demand for proteinexpected in the next decades.
However, despite its great nutritional potential, the use of rapeseed meal in the foodand feed sectors is limited by the presence of antinutritional factors. While the developmentof canola varieties, with low glucosinolate and erucic acid contents, have partially solvedthese problems, the high content of phenolic compounds and the presence of phytates andfiber affect nutrient bioavailability and sensory and functional properties. In particular, oneissue related to rapeseed is the antinutritional effect of polyphenols [11,12]. These moleculesdeserve not to be discarded, but valorized because of their strong antioxidant, antimicrobialand health-promoting properties [13]. One strategy to recover several components co-existing in rapeseed meal and to preserve their native properties may be the application ofseparation technologies.
With a biorefinery approach, rapeseed meal could be exploited as an excellent sourceof valuable nutrients and bioactive compounds to develop innovative bio-based productsfor the pharmaceutical, nutraceutical, cosmetic, food and feed sectors.
Since the production of rapeseed in the EU reached 16.2 million tons in 2020 [7]and is expected to grow in the coming decades, the full valorization of rapeseed mealthrough integrated biorefining represents a real breakthrough for the biofuel and agri-foodmarkets. One issue related to the valorization of rapeseed meal through the biorefineryis the variability of its composition due to various cultivars, soil, and climatic conditions.The knowledge regarding this variability is still scarce, especially for the rapeseed sourcedfrom central and eastern Europe, and needs further investigation.
In this paper we report the results of a study focused on the assessment of compo-nents of nutritional, cosmeceutical and nutraceutical interest (macronutrients, minerals,phenolic acids and lipid components) in rapeseed meal obtained over a 1-year period byan oil processing plant serving a biofuel biorefinery. Moreover, the qualitative study ofmain functional groups of components in rapeseed meal by fourier transform infrared(FTIR) spectroscopy and the assessment of the antioxidant activity of extracts were car-ried out. The aim of this study is to give a comprehensive picture of the potentials, in abiorefinery perspective, of a side-stream of interest to two key-players in the bioeconomy,the biofuel and the agri-food sectors, as a source of bio-based molecules for high-valuemarket products.
2. Results and Discussion2.1. Qualitative Analysis of Main Functional Groups: The Fourier Transform Infrared-AttenuatedTotal Reflection (FTIR-ATR) Approach
Different studies have successfully used FTIR for characterizing waste and biomass [14–18].On the other hand, FTIR-ATR could be considered as an innovative, green and rapid
Molecules 2021, 26, 6787 3 of 19
methodology, having the advantages to require a minimum or no sample preparation andalso allowing a rapid characterization of samples.
FTIR spectroscopy can be defined as a “fingerprint analytical technique” for thestructural identification of compounds considering that no two chemical structures willhave the same FTIR spectrum [19]. FTIR provides a characteristic signature of chemicalor biochemical substances present in the sample by featuring their molecular vibrations(stretching, bending, and torsions of the chemical bonds) in specific infrared regions.
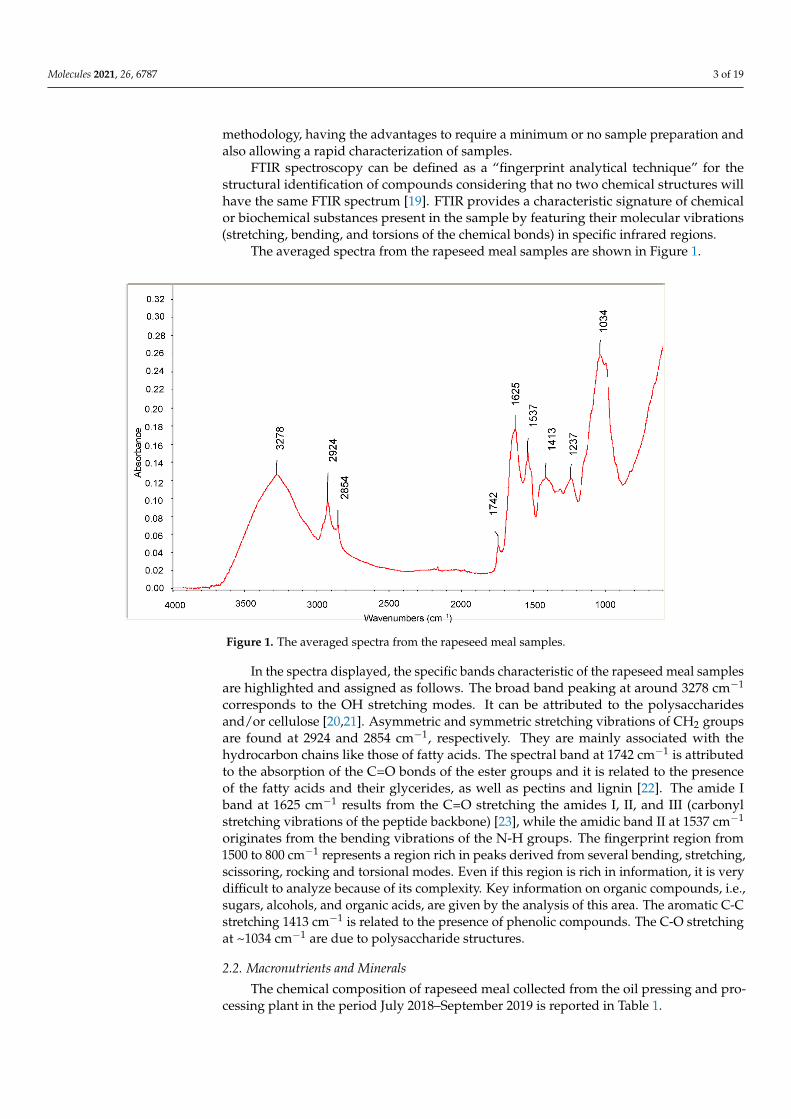
The averaged spectra from the rapeseed meal samples are shown in Figure 1.
Molecules 2021, 26, x FOR PEER REVIEW 3 of 21
2. Results and Discussion 2.1. Qualitative Analysis of Main Functional Groups: The Fourier Transform Infrared-Attenuated Total Reflection (FTIR-ATR) Approach
Different studies have successfully used FTIR for characterizing waste and biomass [14–18]. On the other hand, FTIR-ATR could be considered as an innovative, green and rapid methodology, having the advantages to require a minimum or no sample prepara-tion and also allowing a rapid characterization of samples.
FTIR spectroscopy can be defined as a “fingerprint analytical technique” for the structural identification of compounds considering that no two chemical structures will have the same FTIR spectrum [19]. FTIR provides a characteristic signature of chemical or biochemical substances present in the sample by featuring their molecular vibrations (stretching, bending, and torsions of the chemical bonds) in specific infrared regions.
The averaged spectra from the rapeseed meal samples are shown in Figure 1.
Figure 1. The averaged spectra from the rapeseed meal samples.
In the spectra displayed, the specific bands characteristic of the rapeseed meal sam-ples are highlighted and assigned as follows. The broad band peaking at around 3278 cm−1 corresponds to the OH stretching modes. It can be attributed to the polysaccharides and/or cellulose [20,21]. Asymmetric and symmetric stretching vibrations of CH2 groups are found at 2924 and 2854 cm−1, respectively. They are mainly associated with the hydro-carbon chains like those of fatty acids. The spectral band at 1742 cm−1 is attributed to the absorption of the C=O bonds of the ester groups and it is related to the presence of the fatty acids and their glycerides, as well as pectins and lignin [22]. The amide I band at 1625 cm−1 results from the C=O stretching the amides I, II, and III (carbonyl stretching vibra-tions of the peptide backbone) [23], while the amidic band II at 1537 cm−1 originates from the bending vibrations of the N-H groups. The fingerprint region from 1500 to 800 cm−1 represents a region rich in peaks derived from several bending, stretching, scissoring, rocking and torsional modes. Even if this region is rich in information, it is very difficult to analyze because of its complexity. Key information on organic compounds, i.e., sugars, alcohols, and organic acids, are given by the analysis of this area. The aromatic C-C stretching 1413 cm−1 is related to the presence of phenolic compounds. The C-O stretching at ~1034 cm−1 are due to polysaccharide structures.
Figure 1. The averaged spectra from the rapeseed meal samples.
In the spectra displayed, the specific bands characteristic of the rapeseed meal samplesare highlighted and assigned as follows. The broad band peaking at around 3278 cm−1
corresponds to the OH stretching modes. It can be attributed to the polysaccharidesand/or cellulose [20,21]. Asymmetric and symmetric stretching vibrations of CH2 groupsare found at 2924 and 2854 cm−1, respectively. They are mainly associated with thehydrocarbon chains like those of fatty acids. The spectral band at 1742 cm−1 is attributedto the absorption of the C=O bonds of the ester groups and it is related to the presenceof the fatty acids and their glycerides, as well as pectins and lignin [22]. The amide Iband at 1625 cm−1 results from the C=O stretching the amides I, II, and III (carbonylstretching vibrations of the peptide backbone) [23], while the amidic band II at 1537 cm−1
originates from the bending vibrations of the N-H groups. The fingerprint region from1500 to 800 cm−1 represents a region rich in peaks derived from several bending, stretching,scissoring, rocking and torsional modes. Even if this region is rich in information, it is verydifficult to analyze because of its complexity. Key information on organic compounds, i.e.,sugars, alcohols, and organic acids, are given by the analysis of this area. The aromatic C-Cstretching 1413 cm−1 is related to the presence of phenolic compounds. The C-O stretchingat ~1034 cm−1 are due to polysaccharide structures.
2.2. Macronutrients and Minerals
The chemical composition of rapeseed meal collected from the oil pressing and pro-cessing plant in the period July 2018–September 2019 is reported in Table 1.
Molecules 2021, 26, 6787 4 of 19
Table 1. Chemical composition of rapeseed meal samples. Mean, standard deviation and range of values obtained fromdifferent lots collected between July 2018 and September 2019 (n = 10) *.
Lot 1 Lot 2 Lot 3 Lot 4 Lot 5 Lot 6 Lot 7 Lot 8 Lot 9 Lot 10 Mean sd Min Max
pH - 6.17 5.84 6.16 6.39 6.07 6.24 6.10 6.02 6.06 6.12 0.15 5.84 6.39g kg−1
Dry matter 871.60 874.47 876.97 893.50 866.53 880.23 873.43 866.87 874.50 872.90 875.10 7.68 866.53 893.50Water content 128.40 125.53 123.03 106.50 133.47 119.77 126.57 133.13 125.50 127.10 124.90 7.68 106.50 133.47
Total N 50.93 52.57 54.27 54.07 51.27 51.83 53.77 48.90 48.50 49.88 51.60 2.09 48.50 54.27Crude protein 318.40 328.55 339.13 337.95 320.27 324.09 336.02 305.43 302.98 311.76 322.46 13.11 302.98 339.13Nonprotein N 3.18 3.77 5.54 5.54 3.68 4.94 4.18 3.83 5.01 4.21 4.39 0.82 3.18 5.54
Ash 68.00 56.83 54.83 58.07 58.33 57.60 55.00 56.43 62.63 64.30 59.20 4.34 54.83 68.00Crude Fat 31.90 25.27 14.23 17.33 33.33 18.36 14.13 17.17 19.73 21.97 21.34 6.82 14.13 33.33
Total dietary fiber 371.93 400.77 368.30 368.50 337.30 340.00 334.90 362.35 342.50 a 315.00 b 354.16 24.69 315.00 400.77Carbohydrates 81.37 62.64 97.53 111.01 118.22 139.42 133.64 122.84 145.25 158.52 117.04 29.77 62.64 158.52
* data for each lot represent mean of triplicate measurements. Details on the origin of rapeseed meal and on lot sampling are providedin Section 3 and in Table S1. a Lot 9: Soluble fiber 43.5 ± 6.4 g kg−1, Insoluble fiber: 299.0 ± 9.9 g kg−1. Total dietary fiber = 12.7%soluble, 87.3% insoluble. b Lot 10: Soluble fiber 41.0 ± 9.9 g kg−1, Insoluble fiber: 274.0 ± 7.1 g kg−1. Total dietary fiber = 13.0% soluble,87.0% insoluble.
Quality checks routinely accomplished on a daily basis at the oil-pressing factory wasconfirmed by analyses at CREA. Rapeseed meal was characterized by high fiber (33–40%)and protein (31–34%) contents. Carbohydrates (6–13%) and ashes (5.5–6.8%) were presentat lower levels along with very low residual amounts of lipids (1.4–3.3%). Quantificationof soluble and insoluble dietary fiber fractions indicated a prevalence of insoluble fiber(87%), mainly consisting of cellulose and lignin, over soluble fiber (13%), composed ofhemicellulose and pectins. The protein value, a parameter routinely monitored at thefactory because of its importance in the subsequent feed application, was quite constantand in compliance with the values required for livestock feed mixtures.
The composition of the different lots of rapeseed meal examined over the specifiedperiod of time showed a low variability, indicating a comparable quality of the feedstockover time and standardized industrial processing conditions during the pressing processand subsequent oil extraction and drying. The slight compositional variations detected,connected to different pedo-climatic conditions, specific harvest time, storage conditionsand duration within the year, are an important requisite in a biorefinery perspective, since aconstant chemical composition of the feedstock helps a standardization of downstream processes.
The high protein content in rapeseed, together with its balanced amino acid compo-sition and high quantities of essential amino acids, particularly sulphur-containing ones,make rapeseed a promising source of sustainable proteins, providing ingredients for novelfood products [24,25]. The two major storage proteins, cruciferins and napins, are reportedto account altogether for 80–90% of the total protein content of rapeseed and have differentphysico-chemical and functional properties [26].
Canola proteins are also considered an attractive source of bioactive peptides as theymay be converted through enzymatic hydrolysis into several different peptide fractionswith anti-hypertensive and antioxidant properties, bile-acid binding capacity and anti-thrombotic activity [27–30]. In addition, native canola proteins and their hydrolysatesare characterized by interesting functional properties, especially water-binding, foamingand gel-forming capacities, that render them a candidate ingredient in different foodformulations in replacement of animal proteins [25].
Based on its high fiber content and with respect to the physiological importance offiber in the human diet, rapeseed meal could be considered a feasible, low-cost source ofthis functional ingredient for the food industry. Nevertheless, for rapeseed meal as wellas other oilseed cakes, the recovery of fiber fractions as value-added ingredients for thefood industry is still an undeveloped field [31]. However, as the market of bakery andbreakfast products is under constant search for innovative ingredients, a possible directapplication of rapeseed meal as a functional food ingredient by virtue of its composition isbeing considered [32,33].
The mineral and trace element profile of rapeseed meal showed high amounts ofpotassium, phosphorus, calcium, magnesium and low amounts of sodium (Table 2), in linewith common vegetable feedstocks. Among trace elements, of particular interest is the iron
Molecules 2021, 26, 6787 5 of 19
content, which ranged from 69.23 to 106.61 mg kg−1 dry basis, as well as the zinc content,which was in the range of 49.20–57.13 mg kg−1 dry basis. These high values comparedto cereal flours (i.e., white, plain, soft wheat flour: Fe 1.94 mg 100 g−1 edible portion, Zn0.7 mg 100 g−1 edible portion; wholemeal wheat flour: Fe 2.47 mg 100 g−1 edible portion,Zn 1.9 mg 100 g−1 edible portion [34]) suggest rapeseed meal as a potential functionalingredient in blend flours.
Table 2. Mineral and trace element contents of rapeseed meal samples. Mean, standard deviation, and range of valuesobtained from different lots collected between July 2018 and September 2019 (n = 10) *.
Lot 1 Lot 2 Lot 3 Lot 4 Lot 5 Lot 6 Lot 7 Lot 8 Lot 9 Lot 10 Mean sd Min Max
g kg−1
K 10.57 10.44 11.12 10.87 10.14 11.45 9.84 10.01 11.45 13.28 10.92 1.01 9.84 13.28P 8.98 9.05 8.29 8.82 8.89 8.36 8.22 8.19 8.68 9.43 8.69 0.42 8.19 9.43
Ca 6.08 6.24 5.75 6.80 6.51 6.62 6.24 6.74 7.33 6.82 6.51 0.45 5.75 7.33Mg 3.64 4.12 4.03 4.69 4.38 4.49 4.28 4.17 3.50 3.86 4.11 0.37 3.50 4.69Na 1.15 1.15 0.15 0.03 1.03 0.14 0.05 0.04 0.09 0.06 0.39 0.50 0.03 1.15
mg kg−1
Fe 88.40 101.35 78.10 106.61 89.14 86.59 95.35 78.19 69.23 72.91 86.59 12.19 69.23 106.61Zn 52.76 52.71 55.48 53.68 49.40 49.20 55.57 49.85 49.36 57.13 52.52 2.95 49.20 57.13Mn 52.69 62.26 52.99 60.99 56.96 56.93 54.70 54.68 37.77 45.68 53.56 7.22 37.77 62.26Cu 3.77 5.33 4.31 3.25 3.62 3.42 4.00 3.89 3.26 4.83 3.97 0.68 3.25 5.33
* Values are reported on a dry mass basis, as received from the processing plant (11–13% moisture). Data for each lot represent the mean ofquadruplicate measurements. Details on the origin of rapeseed meal and on lot sampling are provided in Section 3 and in Table S1.
One limiting factor to the performance of rapeseed/canola proteins according toliterature is the presence of phytates (in particular myo-inositol hexaphosphate, IP6, andpentaphosphates, IP5) that can strongly bind minerals like calcium, zinc, iron and cop-per, reducing their bioavailability. On the other hand, processing can reduce IP6 + IP5content and the consequent presence of inositol mono-and di-phosphates (IP and IP2)can lead to an increased mineral dialysability [35]. Recently, beneficial properties suchas anticancer, antioxidative and anticalcification activities were also reported for IP6 andlower phosphorylated inositol phosphates, [26,36,37].
2.3. Polyphenols
The average concentration of phenolic acids in rapeseed meal, as obtained afteranalyses of the different lots collected at the rapeseed processing plant from July 2018 toJune 2019, is reported in Table 3.
Table 3. Concentration of phenolic acids in rapeseed meal samples and sum of all detected phenolic compounds (mg kg−1
product). Mean, standard deviation, and range of values obtained from different lots collected between July 2018 andJuly 2019 (n = 8) *.
Lot 1 Lot 2 Lot 3 Lot 5 Lot 6 Lot 7 Lot 8 Lot 9 Mean sd Min Max
mg kg−1
Gallic acid 1.41 1.44 1.60 1.43 1.62 1.59 1.78 1.63 1.56 0.13 1.41 1.78Protocatechuic acid 13.25 15.10 14.66 14.12 16.02 13.42 15.23 15.14 14.62 0.96 13.25 16.02
4-Hydroxybenzoic acid 13.59 12.77 14.62 14.60 13.99 13.56 14.19 12.83 13.77 0.72 12.77 14.62Vanillic acid 3.44 2.79 3.97 3.31 3.30 3.28 3.69 3.16 3.37 0.35 2.79 3.97
Chlorogenic acid 1.96 2.17 2.08 1.90 2.07 2.08 1.98 2.02 2.03 0.09 1.90 2.17Neochlorogenic acid 3.03 3.08 2.98 3.02 3.00 2.99 2.83 2.90 2.98 0.08 2.83 3.08
Caffeic acid 2.55 2.66 2.69 2.40 3.00 2.68 2.57 2.89 2.68 0.19 2.40 3.00Syringic acid 2.31 1.64 2.76 2.41 2.68 2.37 3.12 2.41 2.46 0.43 1.64 3.12
Cryptochlorogenic acid 2.08 2.21 2.32 2.12 0.79 0.69 0.57 0.67 1.43 0.81 0.57 2.32p-Coumaric acid 2.44 2.27 2.51 2.07 2.46 2.18 1.57 1.75 2.16 0.34 1.57 2.51
Ferulic acid 10.82 10.36 11.36 10.72 11.43 10.34 10.03 11.27 10.79 0.53 10.03 11.43Sinapic acid 378.68 348.03 348.89 356.81 348.68 339.20 366.73 370.11 357.14 13.46 339.20 378.68
Cinnamic acid 0.95 1.09 0.94 1.2 1.08 1.01 0.83 1.03 1.02 0.11 0.83 1.20Σ phenolic acids 436.51 405.62 411.38 416.12 410.11 395.38 425.11 427.81 416.01 13.27 395.38 436.51
* Values are reported on a dry mass basis, as received from the processing plant (11–13% moisture). Data for each lot represent the mean oftriplicate measurements. Details on the origin of rapeseed meal and on lot sampling are provided in Section 3 and in Table S1.
Molecules 2021, 26, 6787 6 of 19
The sum of the concentration of all detected phenolic compounds accounted forabout 400 mg per kg of rapeseed meal (range of values detected in the different lots395–437 mg kg−1). The most abundant phenolic compound of rapeseed meal was sinapicacid, which represented more than 85% of all quantified phenolic compounds (meanvalue 357 ± 13 mg kg−1, range 339–379 mg kg−1). Protocatechuic, 4-hydroxybenzoic andferulic acids (mean values 14.6, 13.8 and 10.8 mg kg−1, respectively) accounted togetherfor almost 10% of the total phenolic acids in rapeseed meal. The values detected in thedifferent examined lots showed a low variability, indicating a stable quality of rapeseedand standardized conditions at the seed processing plant.
These results are in line with values present in literature, where hydroxycinnamic acidderivatives are reported to be the most abundant bioactive compounds in rapeseed, withsinapine, a bound form of sinapic acid with anticancer, neuroprotective, antioxidant andhepatoprotective properties, as the prominent one [38]. Sinapic acid is reported to accountfor 70–85% of total free phenolic acids in rapeseed meal and up to 99% of phenolic acidsoccurring as esters and glucosides [39,40].
The high presence of phenolics in rapeseed meal (about 5 times higher than in its majorcompetitor, soybean meal), limit protein digestibility and bioavailability when used inanimal feeds. The presence of phenolic compounds, impacting the colour, taste and flavour,is also one of the limiting factors to the use of rapeseed protein and their derivatives infeed/food industry, if not appropriately removed [24]. Therefore, suitable technologicalprocesses need to be applied in order to reduce phenolics presence in extracts and effectivelyseparate proteins from phenolics.
On the other side, rapeseed meal may be viewed as a sustainable source of antioxi-dants. Pohl et al. [41] showed antioxidant/radical scavenging properties of rapeseed mealextracts and synergistic effects of the many compounds of phenolic nature present therein.Yates et al. [38] demonstrated the value added by rapeseed meal as a source of sinapine, abioactive molecule with antioxidant and pharmacological properties that may be extractedand used to develop nutraceutical, food or pharma products. In particular, as acetylcholineesterase inhibitor, sinapine has the focus of attention in the study of natural substancesuseful in the treatment of neurodegenerative diseases [42].
Therefore, rapeseed protein fractionation and phenolics recovery is a possible ap-proach pursuing the double goal of feed/food performance improvement and valorizationof phenols as antioxidant ingredients for various applications in high-value markets.
2.4. Lipid Fraction Profile: Fatty Acids and Unsaponifiables
In spite of the oil extraction process applied upstream, a small but variable amountof fat (1.4–3.3%) was still present in rapeseed meal collected in this study. The qualitativeprofile of residual fat in rapeseed meal has been analyzed.
The fatty acid profile of the lipid extract obtained from the different lots of rapeseedmeal analyzed is reported in Table 4. The profile was that of rapeseed oil, with oleicacid as the major fatty acid (51–57% of total fatty acids), followed by linoleic (28–29%of total fatty acids), palmitic (9–11% of total fatty acids) and α-linolenic (4–5%) acids.Erucic acid (C 22:1 n-9), a fatty acid of toxicological concern present in rapeseed, was notdetected in any of the rapeseed meal samples, as the meal originated from low-erucic acidrapeseed cultivars.
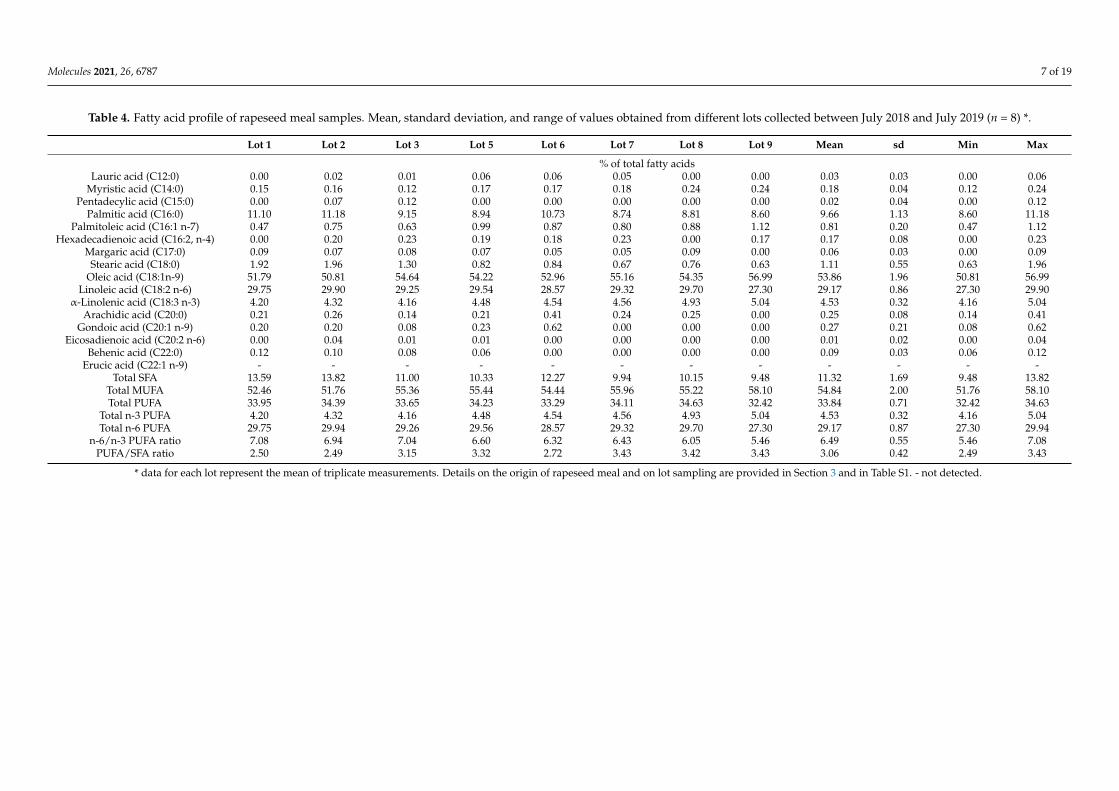
Molecules 2021, 26, 6787 7 of 19
Table 4. Fatty acid profile of rapeseed meal samples. Mean, standard deviation, and range of values obtained from different lots collected between July 2018 and July 2019 (n = 8) *.
Lot 1 Lot 2 Lot 3 Lot 5 Lot 6 Lot 7 Lot 8 Lot 9 Mean sd Min Max
% of total fatty acidsLauric acid (C12:0) 0.00 0.02 0.01 0.06 0.06 0.05 0.00 0.00 0.03 0.03 0.00 0.06
Myristic acid (C14:0) 0.15 0.16 0.12 0.17 0.17 0.18 0.24 0.24 0.18 0.04 0.12 0.24Pentadecylic acid (C15:0) 0.00 0.07 0.12 0.00 0.00 0.00 0.00 0.00 0.02 0.04 0.00 0.12
Palmitic acid (C16:0) 11.10 11.18 9.15 8.94 10.73 8.74 8.81 8.60 9.66 1.13 8.60 11.18Palmitoleic acid (C16:1 n-7) 0.47 0.75 0.63 0.99 0.87 0.80 0.88 1.12 0.81 0.20 0.47 1.12
Hexadecadienoic acid (C16:2, n-4) 0.00 0.20 0.23 0.19 0.18 0.23 0.00 0.17 0.17 0.08 0.00 0.23Margaric acid (C17:0) 0.09 0.07 0.08 0.07 0.05 0.05 0.09 0.00 0.06 0.03 0.00 0.09
Stearic acid (C18:0) 1.92 1.96 1.30 0.82 0.84 0.67 0.76 0.63 1.11 0.55 0.63 1.96Oleic acid (C18:1n-9) 51.79 50.81 54.64 54.22 52.96 55.16 54.35 56.99 53.86 1.96 50.81 56.99
Linoleic acid (C18:2 n-6) 29.75 29.90 29.25 29.54 28.57 29.32 29.70 27.30 29.17 0.86 27.30 29.90α-Linolenic acid (C18:3 n-3) 4.20 4.32 4.16 4.48 4.54 4.56 4.93 5.04 4.53 0.32 4.16 5.04
Arachidic acid (C20:0) 0.21 0.26 0.14 0.21 0.41 0.24 0.25 0.00 0.25 0.08 0.14 0.41Gondoic acid (C20:1 n-9) 0.20 0.20 0.08 0.23 0.62 0.00 0.00 0.00 0.27 0.21 0.08 0.62
Eicosadienoic acid (C20:2 n-6) 0.00 0.04 0.01 0.01 0.00 0.00 0.00 0.00 0.01 0.02 0.00 0.04Behenic acid (C22:0) 0.12 0.10 0.08 0.06 0.00 0.00 0.00 0.00 0.09 0.03 0.06 0.12
Erucic acid (C22:1 n-9) - - - - - - - - - - - -Total SFA 13.59 13.82 11.00 10.33 12.27 9.94 10.15 9.48 11.32 1.69 9.48 13.82
Total MUFA 52.46 51.76 55.36 55.44 54.44 55.96 55.22 58.10 54.84 2.00 51.76 58.10Total PUFA 33.95 34.39 33.65 34.23 33.29 34.11 34.63 32.42 33.84 0.71 32.42 34.63
Total n-3 PUFA 4.20 4.32 4.16 4.48 4.54 4.56 4.93 5.04 4.53 0.32 4.16 5.04Total n-6 PUFA 29.75 29.94 29.26 29.56 28.57 29.32 29.70 27.30 29.17 0.87 27.30 29.94
n-6/n-3 PUFA ratio 7.08 6.94 7.04 6.60 6.32 6.43 6.05 5.46 6.49 0.55 5.46 7.08PUFA/SFA ratio 2.50 2.49 3.15 3.32 2.72 3.43 3.42 3.43 3.06 0.42 2.49 3.43
* data for each lot represent the mean of triplicate measurements. Details on the origin of rapeseed meal and on lot sampling are provided in Section 3 and in Table S1. - not detected.
Molecules 2021, 26, 6787 8 of 19
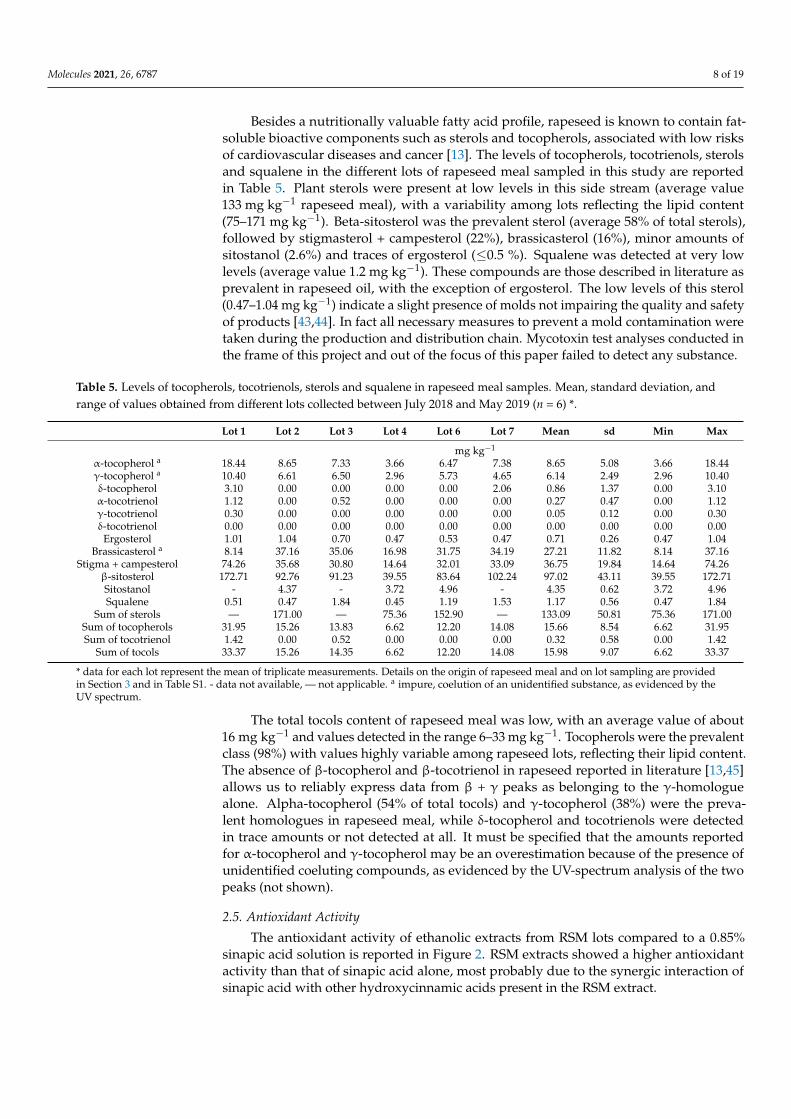
Besides a nutritionally valuable fatty acid profile, rapeseed is known to contain fat-soluble bioactive components such as sterols and tocopherols, associated with low risksof cardiovascular diseases and cancer [13]. The levels of tocopherols, tocotrienols, sterolsand squalene in the different lots of rapeseed meal sampled in this study are reportedin Table 5. Plant sterols were present at low levels in this side stream (average value133 mg kg−1 rapeseed meal), with a variability among lots reflecting the lipid content(75–171 mg kg−1). Beta-sitosterol was the prevalent sterol (average 58% of total sterols),followed by stigmasterol + campesterol (22%), brassicasterol (16%), minor amounts ofsitostanol (2.6%) and traces of ergosterol (≤0.5 %). Squalene was detected at very lowlevels (average value 1.2 mg kg−1). These compounds are those described in literature asprevalent in rapeseed oil, with the exception of ergosterol. The low levels of this sterol(0.47–1.04 mg kg−1) indicate a slight presence of molds not impairing the quality and safetyof products [43,44]. In fact all necessary measures to prevent a mold contamination weretaken during the production and distribution chain. Mycotoxin test analyses conducted inthe frame of this project and out of the focus of this paper failed to detect any substance.
Table 5. Levels of tocopherols, tocotrienols, sterols and squalene in rapeseed meal samples. Mean, standard deviation, andrange of values obtained from different lots collected between July 2018 and May 2019 (n = 6) *.
Lot 1 Lot 2 Lot 3 Lot 4 Lot 6 Lot 7 Mean sd Min Max
mg kg−1
α-tocopherol a 18.44 8.65 7.33 3.66 6.47 7.38 8.65 5.08 3.66 18.44γ-tocopherol a 10.40 6.61 6.50 2.96 5.73 4.65 6.14 2.49 2.96 10.40δ-tocopherol 3.10 0.00 0.00 0.00 0.00 2.06 0.86 1.37 0.00 3.10α-tocotrienol 1.12 0.00 0.52 0.00 0.00 0.00 0.27 0.47 0.00 1.12γ-tocotrienol 0.30 0.00 0.00 0.00 0.00 0.00 0.05 0.12 0.00 0.30δ-tocotrienol 0.00 0.00 0.00 0.00 0.00 0.00 0.00 0.00 0.00 0.00
Ergosterol 1.01 1.04 0.70 0.47 0.53 0.47 0.71 0.26 0.47 1.04Brassicasterol a 8.14 37.16 35.06 16.98 31.75 34.19 27.21 11.82 8.14 37.16
Stigma + campesterol 74.26 35.68 30.80 14.64 32.01 33.09 36.75 19.84 14.64 74.26β-sitosterol 172.71 92.76 91.23 39.55 83.64 102.24 97.02 43.11 39.55 172.71Sitostanol - 4.37 - 3.72 4.96 - 4.35 0.62 3.72 4.96Squalene 0.51 0.47 1.84 0.45 1.19 1.53 1.17 0.56 0.47 1.84
Sum of sterols — 171.00 — 75.36 152.90 — 133.09 50.81 75.36 171.00Sum of tocopherols 31.95 15.26 13.83 6.62 12.20 14.08 15.66 8.54 6.62 31.95Sum of tocotrienol 1.42 0.00 0.52 0.00 0.00 0.00 0.32 0.58 0.00 1.42
Sum of tocols 33.37 15.26 14.35 6.62 12.20 14.08 15.98 9.07 6.62 33.37
* data for each lot represent the mean of triplicate measurements. Details on the origin of rapeseed meal and on lot sampling are providedin Section 3 and in Table S1. - data not available, — not applicable. a impure, coelution of an unidentified substance, as evidenced by theUV spectrum.
The total tocols content of rapeseed meal was low, with an average value of about16 mg kg−1 and values detected in the range 6–33 mg kg−1. Tocopherols were the prevalentclass (98%) with values highly variable among rapeseed lots, reflecting their lipid content.The absence of β-tocopherol and β-tocotrienol in rapeseed reported in literature [13,45]allows us to reliably express data from β + γ peaks as belonging to the γ-homologuealone. Alpha-tocopherol (54% of total tocols) and γ-tocopherol (38%) were the preva-lent homologues in rapeseed meal, while δ-tocopherol and tocotrienols were detectedin trace amounts or not detected at all. It must be specified that the amounts reportedfor α-tocopherol and γ-tocopherol may be an overestimation because of the presence ofunidentified coeluting compounds, as evidenced by the UV-spectrum analysis of the twopeaks (not shown).
2.5. Antioxidant Activity
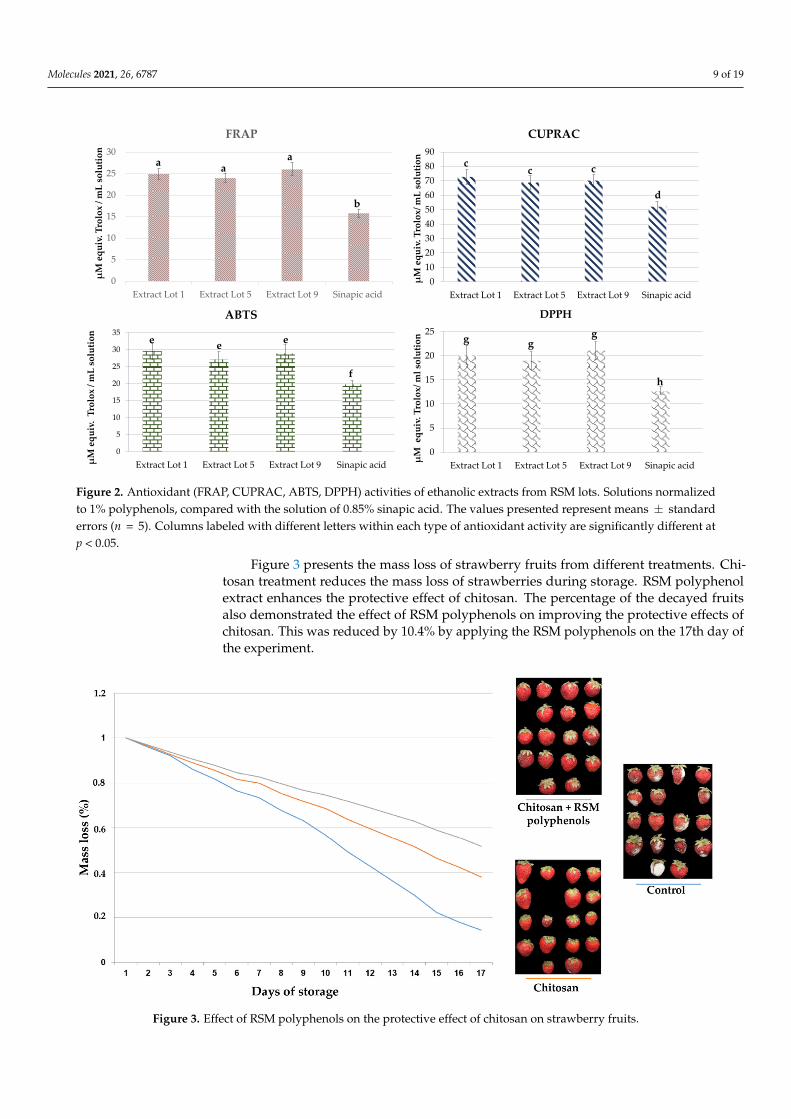
The antioxidant activity of ethanolic extracts from RSM lots compared to a 0.85%sinapic acid solution is reported in Figure 2. RSM extracts showed a higher antioxidantactivity than that of sinapic acid alone, most probably due to the synergic interaction ofsinapic acid with other hydroxycinnamic acids present in the RSM extract.
Molecules 2021, 26, 6787 9 of 19Molecules 2021, 26, x FOR PEER REVIEW 10 of 21
Figure 2. Antioxidant (FRAP, CUPRAC, ABTS, DPPH) activities of ethanolic extracts from RSM lots. Solutions normalized to 1% polyphenols, compared with the solution of 0.85% sinapic acid. The values presented represent means ± standard errors (n = 5). Columns labeled with different letters within each type of antioxidant activity are significantly different at p < 0.05.
Figure 3. Effect of RSM polyphenols on the protective effect of chitosan on strawberry fruits.
0
5
10
15
20
25
30
Extract Lot 1 Extract Lot 5 Extract Lot 9 Sinapic acid
µM
equ
iv. T
rolo
x / m
L so
lutio
n
FRAP
0102030405060708090
Extract Lot 1 Extract Lot 5 Extract Lot 9 Sinapic acid
µM e
quiv
. Tro
lox/
mL
solu
tion
CUPRAC
0
5
10
15
20
25
30
35
Extract Lot 1 Extract Lot 5 Extract Lot 9 Sinapic acidµMeq
uiv.
Trol
ox /
mL
solu
tion
ABTS
e e
f
0
5
10
15
20
25
Extract Lot 1 Extract Lot 5 Extract Lot 9 Sinapic acidµM
equ
iv. T
rolo
x/ m
l sol
utio
n
DPPH
g gg
h
a aa
b
cc c
d
e
Figure 2. Antioxidant (FRAP, CUPRAC, ABTS, DPPH) activities of ethanolic extracts from RSM lots. Solutions normalizedto 1% polyphenols, compared with the solution of 0.85% sinapic acid. The values presented represent means ± standarderrors (n = 5). Columns labeled with different letters within each type of antioxidant activity are significantly different atp < 0.05.
Figure 3 presents the mass loss of strawberry fruits from different treatments. Chi-tosan treatment reduces the mass loss of strawberries during storage. RSM polyphenolextract enhances the protective effect of chitosan. The percentage of the decayed fruitsalso demonstrated the effect of RSM polyphenols on improving the protective effects ofchitosan. This was reduced by 10.4% by applying the RSM polyphenols on the 17th day ofthe experiment.
Molecules 2021, 26, x FOR PEER REVIEW 10 of 21
Figure 2. Antioxidant (FRAP, CUPRAC, ABTS, DPPH) activities of ethanolic extracts from RSM lots. Solutions normalized to 1% polyphenols, compared with the solution of 0.85% sinapic acid. The values presented represent means ± standard errors (n = 5). Columns labeled with different letters within each type of antioxidant activity are significantly different at p < 0.05.
Figure 3. Effect of RSM polyphenols on the protective effect of chitosan on strawberry fruits.
0
5
10
15
20
25
30
Extract Lot 1 Extract Lot 5 Extract Lot 9 Sinapic acid
µM
equ
iv. T
rolo
x / m
L so
lutio
n
FRAP
0102030405060708090
Extract Lot 1 Extract Lot 5 Extract Lot 9 Sinapic acidµM
equ
iv. T
rolo
x/ m
L so
lutio
n
CUPRAC
0
5
10
15
20
25
30
35
Extract Lot 1 Extract Lot 5 Extract Lot 9 Sinapic acidµMeq
uiv.
Trol
ox /
mL
solu
tion
ABTS
e e
f
0
5
10
15
20
25
Extract Lot 1 Extract Lot 5 Extract Lot 9 Sinapic acidµM
equ
iv. T
rolo
x/ m
l sol
utio
nDPPH
g gg
h
a aa
b
cc c
d
e
Figure 3. Effect of RSM polyphenols on the protective effect of chitosan on strawberry fruits.
Molecules 2021, 26, 6787 10 of 19
A similar enhancing effect on the protective effect of chitosan on strawberry fruits wasrecently reported for the polyphenols extracted from apple peel [46].
Our assay demonstrated that RSM-extracted polyphenols are primarily from phenolicacids/hydroxycinnamic acids class. These compounds have significant antioxidant activity.Such antioxidant activity could be valorized in various applications—e.g., for cosmeceuti-cals [47] or nutraceuticals/dietary supplements [48]. The cosmeceutical applications resultfrom the antioxidant activity and anti-tyrosinase, anti-collagenase, anti-hyaluronidase,photoprotective, anti-inflammatory, and antimicrobial activity [47,49]. The UV-filtering andanti-radical properties of sinapate derivatives suggest an interesting potential applicationof sinapic acid in sunscreen formulations, replacing currently-used synthetic UV-filteringagents, shown to have a negative impact on the environment and human health [50]. Thispotential high-value application of sinapic acid opens new perspectives to the marketsegment of environmentally-friendly cosmetic products. The nutraceutical applications arenot related only to the antioxidant activity. Other hydroxycinnamic bioactivities, such asanti-inflammatory [51], anti-diabetic [52], anti-hypertensive [53], neuroprotective [54], andprebiotics [55] activities are of interest for nutraceuticals / dietary supplements. Despitetheir proven biological activities, in general, phenolic acids / hydroxycinnamic acids areunderutilized by the health and well-being industries. A limited number of patents relatedto hydroxycinnamic and hydroxycinnamic derivatives applications on these domains werefilled so far [56,57]. The correlation with the valorization of RSM protein should boost theapplications of RSM polyphenols/hydroxycinnamic acids.
In an integrated biorefinery model of RSM, an initial extraction of polyphenols, fol-lowed by their valorization as antioxidants, benefits further biorefining processes relatedto protein extraction by reducing the adverse effects of polyphenols on the technologicaland nutritional properties of rapeseed proteins [12].
3. Materials and Methods3.1. Rapeseed Origin
Non-genetically modified rapeseed (Brassica napus L. var. Napus) was the core feed-stock of the meal investigated in this study. Rapeseed was grown during the 2017/2018crop season in central and east European regions, namely Slovakia, Poland, Hungary,Czech Republic, Romania and Ukraine. The seed quality met the STN 462300-1 and 2 andthe Codex Alimentarius requirement of the Slovak Republic, Government Regulation no.439/2006 and the requirements set out in the list of permitted varieties.
3.2. Rapeseed Meal Production and Quality Check at the Factory
Rapeseed meal was the side product of an oil-pressing factory (Pol’noservis a.s.,Leopoldov, Slovakia) serving an adjacent biofuel biorefinery. The meal was a loose-solid,free-flowing material without sintered pieces over 10 cm meeting the legal requirementsof the Slovak Government Regulation no. 438/2006, Act 271/2005 Coll., the EuropeanParliament and Council Regulation (EC) no. 767/2009 and the Commission Regulation no.68/2013 of the Fodders Catalogue.
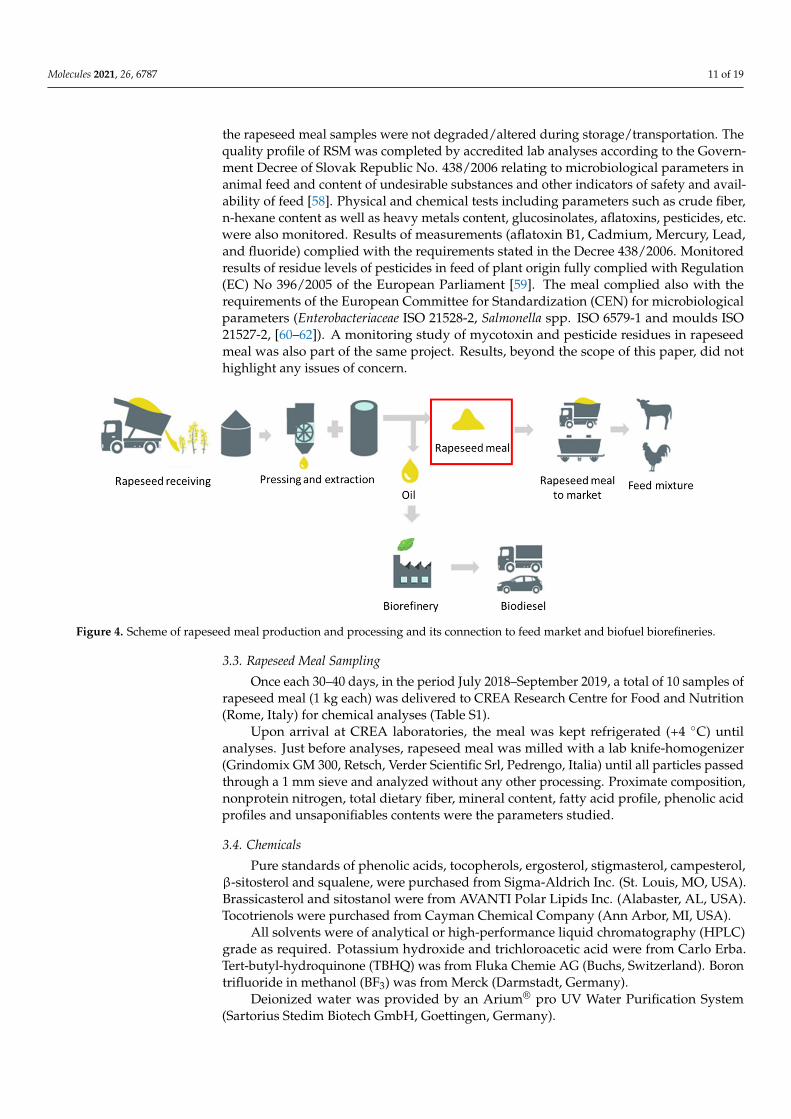
Rapeseed meal samples were collected as a by-product from the crude oil productionafter the oil pressing and subsequent hexane extraction process (Figure 4). The meal wasallowed to cool down, put into clean plastic containers and kept in a dry place, at roomtemperature, avoiding heat and light sources.
Samples were immediately taken to the laboratory for in-house daily routine analyseswithout any further treatment and analyzed within the same day of sampling. Water,dry matter, crude fat, crude protein and ash contents were determined according to themethodologies set out by the Decree of the Ministry of Agriculture of Slovak Republic1497/4/1997-100, and checked for compliance with the internal and external limits prior todelivery for its feed purpose. This is connected to the defined conditions of rapeseed mealprocessing after each extraction step. All analyzed data were compared with those obtainedat the CREA Research Centre for Food and Nutrition (Table 1) and served as a check that
Molecules 2021, 26, 6787 11 of 19
the rapeseed meal samples were not degraded/altered during storage/transportation. Thequality profile of RSM was completed by accredited lab analyses according to the Govern-ment Decree of Slovak Republic No. 438/2006 relating to microbiological parameters inanimal feed and content of undesirable substances and other indicators of safety and avail-ability of feed [58]. Physical and chemical tests including parameters such as crude fiber,n-hexane content as well as heavy metals content, glucosinolates, aflatoxins, pesticides, etc.were also monitored. Results of measurements (aflatoxin B1, Cadmium, Mercury, Lead,and fluoride) complied with the requirements stated in the Decree 438/2006. Monitoredresults of residue levels of pesticides in feed of plant origin fully complied with Regulation(EC) No 396/2005 of the European Parliament [59]. The meal complied also with therequirements of the European Committee for Standardization (CEN) for microbiologicalparameters (Enterobacteriaceae ISO 21528-2, Salmonella spp. ISO 6579-1 and moulds ISO21527-2, [60–62]). A monitoring study of mycotoxin and pesticide residues in rapeseedmeal was also part of the same project. Results, beyond the scope of this paper, did nothighlight any issues of concern.
Molecules 2021, 26, x FOR PEER REVIEW 12 of 21
Figure 4. Scheme of rapeseed meal production and processing and its connection to feed market and biofuel biorefineries.
Samples were immediately taken to the laboratory for in-house daily routine analyses without any further treatment and analyzed within the same day of sampling. Water, dry matter, crude fat, crude protein and ash contents were determined according to the meth-odologies set out by the Decree of the Ministry of Agriculture of Slovak Republic 1497/4/1997-100, and checked for compliance with the internal and external limits prior to delivery for its feed purpose. This is connected to the defined conditions of rapeseed meal processing after each extraction step. All analyzed data were compared with those ob-tained at the CREA Research Centre for Food and Nutrition (Table 1) and served as a check that the rapeseed meal samples were not degraded/altered during storage/trans-portation. The quality profile of RSM was completed by accredited lab analyses according to the Government Decree of Slovak Republic No. 438/2006 relating to microbiological parameters in animal feed and content of undesirable substances and other indicators of safety and availability of feed [58]. Physical and chemical tests including parameters such as crude fiber, n-hexane content as well as heavy metals content, glucosinolates, aflatox-ins, pesticides, etc. were also monitored. Results of measurements (aflatoxin B1, Cad-mium, Mercury, Lead, and fluoride) complied with the requirements stated in the Decree 438/2006. Monitored results of residue levels of pesticides in feed of plant origin fully complied with Regulation (EC) No 396/2005 of the European Parliament [59]. The meal complied also with the requirements of the European Committee for Standardization (CEN) for microbiological parameters (Enterobacteriaceae ISO 21528-2, Salmonella spp. ISO 6579-1 and moulds ISO 21527-2, [60–62]). A monitoring study of mycotoxin and pesticide residues in rapeseed meal was also part of the same project. Results, beyond the scope of this paper, did not highlight any issues of concern.
3.3. Rapeseed Meal Sampling Once each 30–40 days, in the period July 2018–September 2019, a total of 10 samples
of rapeseed meal (1 kg each) was delivered to CREA Research Centre for Food and Nutri-tion (Rome, Italy) for chemical analyses (Table S1).
Upon arrival at CREA laboratories, the meal was kept refrigerated (+4 °C) until anal-yses. Just before analyses, rapeseed meal was milled with a lab knife-homogenizer (Grin-domix GM 300, Retsch, Verder Scientific Srl, Pedrengo, Italia) until all particles passed through a 1 mm sieve and analyzed without any other processing. Proximate composi-tion, nonprotein nitrogen, total dietary fiber, mineral content, fatty acid profile, phenolic acid profiles and unsaponifiables contents were the parameters studied.
Figure 4. Scheme of rapeseed meal production and processing and its connection to feed market and biofuel biorefineries.
3.3. Rapeseed Meal Sampling
Once each 30–40 days, in the period July 2018–September 2019, a total of 10 samples ofrapeseed meal (1 kg each) was delivered to CREA Research Centre for Food and Nutrition(Rome, Italy) for chemical analyses (Table S1).
Upon arrival at CREA laboratories, the meal was kept refrigerated (+4 ◦C) untilanalyses. Just before analyses, rapeseed meal was milled with a lab knife-homogenizer(Grindomix GM 300, Retsch, Verder Scientific Srl, Pedrengo, Italia) until all particles passedthrough a 1 mm sieve and analyzed without any other processing. Proximate composition,nonprotein nitrogen, total dietary fiber, mineral content, fatty acid profile, phenolic acidprofiles and unsaponifiables contents were the parameters studied.
3.4. Chemicals
Pure standards of phenolic acids, tocopherols, ergosterol, stigmasterol, campesterol,β-sitosterol and squalene, were purchased from Sigma-Aldrich Inc. (St. Louis, MO, USA).Brassicasterol and sitostanol were from AVANTI Polar Lipids Inc. (Alabaster, AL, USA).Tocotrienols were purchased from Cayman Chemical Company (Ann Arbor, MI, USA).
All solvents were of analytical or high-performance liquid chromatography (HPLC)grade as required. Potassium hydroxide and trichloroacetic acid were from Carlo Erba.Tert-butyl-hydroquinone (TBHQ) was from Fluka Chemie AG (Buchs, Switzerland). Borontrifluoride in methanol (BF3) was from Merck (Darmstadt, Germany).
Deionized water was provided by an Arium® pro UV Water Purification System(Sartorius Stedim Biotech GmbH, Goettingen, Germany).
Molecules 2021, 26, 6787 12 of 19
The reagents used for antioxidant activity determinations were purchased from Sigma-Aldrich (Merck Group, Darmstadt, Germany). The optical density was determined by amulti-mode plate reader (CLARIOstar Plus, BMG Labtech, Ortenberg, Germany).
3.5. Analytical Methods3.5.1. FTIR-ATR Analysis
The FTIR spectra were recorded on a Nicolet iS20 FT-IR spectrometer equipped with adiamond crystal cell for ATR operation (Thermo-Fisher Scientific, Waltam, MA, USA). Theacquisition of spectra was carried out by 32 scans per sample or background in the rangeof 4000–650 cm−1 at a nominal resolution of 4 cm−1
The spectrum of air was used as background. The analysis was carried out at roomtemperature. For each measurement a lyophilized sample was placed onto the surfaceof the ATR crystal. Before acquiring a spectrum, the ATR crystal was cleaned with wetcellulose tissue and dried by means of a flow of nitrogen gas. The cleaned crystal waschecked spectrally in order to ensure that no residue was retained from the previous sample.The spectrum of each sample was collected 10 times to check the reproducibility and makea statistical analysis.
The FTIR spectra were analyzed with respect to the spectral band positions for identi-fication of the signatures of the main functional groups. An assignment of the main bandswas carried out by analyzing the acquired spectra and by comparing them with thosepresent in scientific literature.
3.5.2. Macronutrients and Minerals
Moisture, crude protein, crude fat and ash contents were determined following themethods of the Association of Official Analytical Chemists [63]. The crude protein contentwas evaluated by the Kjeldahl procedure, using 6.25 as a nitrogen-to-protein conversionfactor. Nonprotein nitrogen (NPN) was determined by the Kjeldahl method after proteinprecipitation with 10% (w/v) trichloroacetic acid and filtration. The crude fat content wasdetermined by Soxhlet extraction. The ash content was determined gravimetrically afterincineration in a muffle furnace at 550 ◦C. Total dietary fiber and soluble and insoluble fiberfractions were determined according to Prosky et al. [64]. Carbohydrates were calculatedby difference. All macronutrients analyses were performed in triplicate.
Macro-minerals and trace elements (Ca, Mg, Na, K, P, Fe, Zn, Cu, Mn) were quantifiedby inductively coupled plasma optical emission spectrometry (Optima 8000™ ICP-OES,Perkin-Elmer, Waltham, MA, USA) after liquid ashing in a microwave digestion system(1200 Mega, Milestone srl, Sorisole, Italy). Mineral analyses were performed in quadruplicate.
3.5.3. Phenolic Compounds
Polyphenols were extracted from crude rapeseed meal following the procedure de-scribed by Pacifico et al. [65] with few modifications. Briefly, 200 mg of sample wasweighted in a 2 mL Eppendorf tube. An amount of 1.5 mL of extraction solution (methanol/water/acetic acid, 80:19.5: 0.5, v/v/v) was added to the sample, vortexed for 30 s andshaken at 1000 rpm for 30 min at 4 ◦C (Thermomixer Cryo Comfort, Eppendorf AG, Ham-burg, Germany). The samples were then centrifuged at 10,000× g for 10 min at 4 ◦C.Supernatant was collected in 5 mL volumetric flasks. This procedure was repeated 3 moretimes with 1 mL of extraction solution. The extract was brought to volume with extractionsolution, filtered through 0.22 µm syringe filter and injected in the LC-MS/MS system. Theextractions and analyses were conducted on three replicates per sample.
Phenolic acids were quantified on an Agilent 1200 LC coupled to an Agilent 6410triple quadrupole mass analyzer equipped with an ESI operated in negative mode. Gastemperature was 350 ◦C, at a flow of 11 L min−1. The nebulizer pressure was set at 15 psi,while the capillary voltage was 4000 V. Detection was conducted on dynamic MultipleReaction Monitoring (dMRM) mode with the compound specific parameters displayedin Table S2. Separation was performed on a 100 mm × 1 mm Ascentis C18 column
Molecules 2021, 26, 6787 13 of 19
(3 µm particle size) (Supelco, Bellefonte, PA, USA) maintained at 30 ◦C. Mobile phase was0.05% acetic acid in water (A) and 0.05% acetic acid in acetonitrile (B). Elution of phenolicacids was performed on gradient mode: starting at 2% B, 11.5 min 25% B, 20 min 27% B,21 min 30% B, 25 min 30% B, 27 min 2% B, 35 min 2% B, post run time 20 min. Flow was100 µL min−1 and injection volume was 1 µL. Quantification was performed according to acalibration curve constructed by injecting standard solutions of phenolic acids in the samechromatographic conditions, in a concentration range from 25 to 2000 ng mL−1. The loweror upper points of the curve were removed according to the concentration of each phenolicacid in the sample before quantification.
3.5.4. Total Lipids and Fatty Acids
Total lipids were extracted from rapeseed meal (about 20 g) using Ultra-Turrax T25(Kanke & Kunkel, IKA-Labortechnik) set at 8000 rpm, with methanol, chloroform andwater to keep the final proportion among the three solvents to 2:2:1.8 (v/v/v), in accordancewith the method of Bligh and Dyer [66]. Fatty acids in the extract were methylated usingboron trifluoride in methanol (BF3) as the esterification reagent [67]. In brief, about 25 mgof lipids were mixed with 2 mL BF3-methanol 12% w/w and heated in a water bath at 60 ◦Cfor 5 min. After cooling, 1 mL water and 1 mL hexane were added, then centrifuged andthe upper hexane layer was transferred to a GC vial. Chromatographic separations of fattyacids were achieved on a Mega-wax column (30 m × 0.32 mm inner diameter, 0.25 µm filmthickness). The esterified fatty acids were identified by means of gas-chromatography-massspectrometry (GC-MS) and quantified by GC-Flame Ionization Detector (FID) (GC 7890ASeries coupled with Mass Detector 5975C, Agilent Technologies Santa Clara, CA, USA).Fatty acids were identified by the comparison of retention times with known authenticstandards and using the NIST08 Mass Spectral Library (National Institute of Standardsand Technology, Gaithersburg, MD, USA). FAME Mix C4-C24 (Supelco, Bellofonte, PA,USA) was analyzed as a control of the accuracy of the analyses. Analyses were performedin triplicate. Data are reported as percent of total fatty acids.
3.5.5. Unsaponifiable Lipid Fraction
Lipid extracts were also analyzed for tocopherols, tocotrienols, plant sterols and squa-lene contents. Analytes were quantified by High Performance Liquid Chromatography(HPLC) after saponification in ethanolic potassium hydroxide (10% w/v) using a 1100 SeriesAgilent HPLC System (Agilent Technologies, Santa Clara, CA, USA) equipped with a qua-ternary pump, solvent degasser, column thermostat and photodiode-array detector (DAD).Separation occurred on an Ultrasphere C-18 column (25 cm × 4.6 mm inner diameter, 5 m,Beckman, Palo Alto, CA, USA) coupled with a C18 guard column (15 cm × 4.6 mm, 5 µm).Chromatographic conditions were as described previously [8]. To improve the identifica-tion of compounds, rapeseed meal extracts were also analysed with an LC-MS/MS system(Agilent 1200 quaternary pump) coupled to a 6410 series triple quadrupole. The ion sourcewas an APCI operated in positive mode. Chromatographic separation was carried outon an ACME C18-120A, 100 mm × 2.1 mm column, with 3 µm particle size. Separationconditions and ionization parameters were as previously described [8]. The concentrationof sitostanol in the samples (Lot 2, 4 and 6) was measured by LC-MS/MS with the triplequadrupole analyzer operated in the MRM mode, the precursor ion 399.7 (corresponding tothe molecular weight with the loss of a water molecule and an H+ gain) and the followingproduct ions: 95.1 for quantification, 135.1, 109.1 and 81.1 for identification. In all cases thecollision energy was 29 V, with the exception of transition 399.1→ 81.1, where it was setat 45 V. Quantification was performed by interpolation on a calibration curve constructedwith pure sitostanol standard analyzed in the same conditions, in the range of 0.04 to1.0 µg mL−1.
Molecules 2021, 26, 6787 14 of 19
3.5.6. Antioxidant Activity
The antioxidant activity of the polyphenols extracted from rapeseed meal was deter-mined by several chemical methods (FRAP, ABTS, DDPH, CUPRAC) and by a bioassaybased on enhancing edible polymer film effects on strawberry shelf life. The antioxidantactivity assays were done using a solution resulted from RSM extraction in 50% ethanol.The extraction was done in ratio 1 g RSM to 20 mL ethanol solution, for 4 h at room temper-ature, under agitation (50 rpm). The 50% ethanolic extract solutions were normalized at 1%polyphenols, according to the Folin-Ciocâlteu method for polyphenols determination [68],using sinapic acid as a standard. The standard for antioxidant assays was a solution of0.85% sinapic acid in 50% ethanol. The antioxidant assays were done for the ethanolicextracts from three RSM lots: Lot 1, Lot 5, and Lot 9.
The FRAP method, measuring the antioxidants’ ability to reduce a transparent tripiridiltriazine-Fe3+ (Fe(III)-TPTZ) complex to a blue-colored tritridiltriazine-Fe2+ (Fe(II)-TPTZ)complex, was accomplished according to Benzie and Strain [69]. Results were expressed asequivalent to µM Trolox per mL sample.
The antioxidant method of reducing cupric ion (CUPRAC) was carried out accordingto a method adapted from Meng et al. [70]. Briefly, 10 µL of sample/standard solutions ofdifferent concentrations, 30 µL CuS04 (5 mM), neocuproin 30 µL (3.75 mM) and 280 µL ofdistilled water were mixed, reaching a final volume of 350 µL. After 30 min, the opticaldensity was read at λ = 450 nm in a multi-mode plate reader. The standard solutions startedfrom a stock solution of 10 mM Trolox and were used for calibration curve concentrations:0–2 mM. The results were expressed as equivalent to µM Trolox per mL sample.
Scavenging the ABTS radical cation was also used to determine the antioxidant activityof RSM polyphenols extracts [71]. Trolox was used as a standard antioxidant substance,the calibration curve being made in the concentration range 0–40 µM, starting from a stocksolution of Trolox 1 mM. The results were expressed as µM Trolox equivalent per mLsample. The ABTS•+ scavenging capacity of the RSM polyphenolic extract and Trolox werecalculated according to the following Formula (1):
ABTS Scavenging activity = ODcontrol −ODsample/ODcontrol (1)
where ODcontrol is the optical density of ABTS radical in ethanol; ODsample is the absorbanceof ABTS radical solution mixed with RSM polyphenol extract, sinapic acid ethanol solution,or Trolox standard.
The measurement of antioxidant activity of RSM polyphenols extracts was also doneby scavenging the DPPH• radical [72]. The reaction mixture consisted of a 100 µL sam-ple/standard and 100 µL of 0,3 mM DPPH radical solution in ethanol. The reading of theabsorbents was carried out at λ = 517 nm after 30 min of reaction using a UV-VIS multi-mode plate reader. Trolox was used as a standard substance, the calibration curve beingmade in the concentration range of 0.15 mM–0.0125 mM, starting from a stock solutionof Trolox 1 mM. The results were expressed as µM Trolox per mL sample. The DPPH•
scavenging capacity of the RSM polyphenolic extract and Trolox were calculated accordingto the following Formula (2):
DPPH• Scavenging activity = ODcontrol −ODsample/ODcontrol (2)
where ODcontrol is the optical density of DPPH• radical in ethanol; ODsample is the absorbanceof ABTS radical solution mixed with RSM polyphenol extract, sinapic acid ethanolicsolution, or Trolox standard.
The strawberry shelf-life bioassay was developed based on the proven effects ofpolyphenols antioxidants on the efficiency of polymer coatings in prolonging strawberries’shelf life [73]. The surface of the strawberry fruits (Fragaria × ananassa, cv. Alba) wasdisinfected by immersion in a sodium hypochlorite 1% solution for 2 min, followed byrepeated rinsing with sterile water and slow drying. Chitosan solution was prepared bydissolving fungal chitosan into the acetic acid solution. The fungal chitosan was isolated
Molecules 2021, 26, 6787 15 of 19
from Ganoderma lucidum [74], and the average molecular weight and degree of deacetylationwere 209 kDa and 86%, respectively. The strawberries were coated with 1% chitosansolution and 1% chitosan with 1% polyphenols RSM extract. The coating was done bydipping for 30 s in the chitosan solution and chitosan with RSM polyphenols, respectively.The coating conditions applied were selected after preliminary studies indicating these asthe best ones. The treated strawberry fruits were drained in a tray with holes and driedfor 2 h at ambient temperature. The treated strawberries and the untreated strawberries(control) were stored in polypropylene plastic trays, at 20◦C and 35–40% RH for 17 d totest the effect of the combined treatment on the storage at room conditions in stressfulconditions for treated strawberry fruit.
The following parameters were monitored during the storage period: mass loss (%)and percentage of the decayed strawberry fruits. Mass loss was calculated according to thefollowing Equation (3):
Mass loss = Mi −Mo/Mi (3)
where Mi is the initial mass of the strawberry and Mo is the mass determined in each dayfrom the experiment. The percentage of decayed fruits was defined as the percentage ratioof decayed fruits (visually inspected) per total number of fruits included in the experiment.
3.5.7. Quality Assurance
For sterols, tocols and squalene determination, the concentrations of stock solutionsof pure standards were determined spectrophotometrically using their specific absorptioncoefficients. For each analyte, external linear calibration curves of analytical standards, witha minimum of five concentration levels, were constructed. Within the calibration ranges,the DAD response for each analyte was linear and the correlation coefficient exceeded 0.998.Repeatability was estimated by calculating the coefficient of variation (CV) after repeatedruns of a standard solution containing each compound at the level found in samples. Thepurity of the peaks was checked by matching the UV/Vis spectra of each peak with thatof the related standard molecule. For validation of the method and quality control oftocopherol data, the standard reference material NIST 3278 (Tocopherols in edible oils) wasanalyzed. For validation of the method and quality control of minerals and trace elementsdata, two Certified Reference Materials, cabbage (IAEA-359, International Atomic EnergyAgency Reference Materials Group) and haricots vert (BCR 383, Community Bureau ofReference, Brussels) were analyzed. All analyses were performed at least in triplicate.
3.5.8. Data Treatment
For each parameter, analyses of individual lots of rapeseed meal were performedat least in triplicate. Data for single lots were reported as mean, standard deviation andrange of values detected during the experimental period. Analysis of variance (One-WayANOVA) and Multiple-Range LSD test were applied to find out significant differences(p ≤ 0.05), if any, among the antioxidant activity of RSM phenol extracts and sinapicacid standard solution (Statgraphics®, Statistical Graphic System by Statistical GraphicCorporation, Version 5 Plus, Manugistics™ Inc., Rockville, MD, USA).
4. Conclusions
This study highlights the potentialities of rapeseed meal as a candidate feedstock forfurther valorization via subsequent biorefining processes. The characterization of bioactivecomponents profile together with the qualitative analysis by mid infrared spectroscopycan represent a useful database to validate and make the FTIR technique a reliable tool forquality monitoring of active principles in rapeseed meal.
Although safety aspects are out of the focus of this paper, they were considered inthe frame of this study, since a constant monitoring of safety parameters throughout theproduction and distribution chain, as well as at a biorefinery level, is of primary importanceto exclude the presence of contaminants in a biomass intended to be used for final feed-food-cosmetic applications.
Molecules 2021, 26, 6787 16 of 19
The results of this study indicate proteins and phenolics as the components withhigh valorization potential for further biorefining of this oilseed extraction co-productconnected to the agri-food and biofuel sectors. Integrated biorefinery systems couldopen new perspectives to the utilization of rapeseed meal, traditionally used as animalfeed. The variability is relatively low for proteins and polyphenols in analyzed rapeseedmeal samples. Therefore, a biorefinery industrial process for recovery of proteins andpolyphenols could be easily standardized. At the same time, the creation of new bio-basedvalue-chains and establishment of new cross-sector interconnections could improve theeconomics and sustainability of all bioeconomy sectors involved in oilseed management.
Apart from the advantages connected to their sustainable origin, rapeseed proteinsand derivatives have potentialities in the food and nutraceutical sectors as substitutes ofconventional proteins in products targeted to vegans or consumers allergic to milk/eggproteins or intolerant to gluten. On the other side, polyphenols, and particularly sinapicacid, have a high potential for valorization in nutraceuticals and cosmetic products, forexample as ingredient in environmentally friendly sunscreen products. Overall, proteinsand phenolics from rapeseed meal have the potential of platform molecules suitablefor various applications in high-value markets (food, cosmetics, nutraceutics), urged byinnovation and sustainability needs in a context of declining resources.
An efficient separation of proteins from the other components, in order to haveingredients with the highest functional and sensory properties, is one of the main technicalchallenges for a full valorization of this side stream. In the frame of a zero-waste circulareconomy approach, the implementation of feasible and effective cascade processes torecover proteins and phenolics separately and the assessment of related techno-economicaland sustainability evaluations represent the next steps of this project.
Supplementary Materials: The following are available online. Table S1: Sampling date at Pol’noservis’splants of the different rapeseed meal lots analyzed in this study, Table S2: Ionization and detectionparameters of phenolic compounds.
Author Contributions: Conceptualization, G.D.L., M.L., A.D., P.O., F.O., R.-M.F. and G.L.-B.; writing—original draft preparation, G.D.L. and J.S.d.P.; writing—review and editing, G.D.L., J.S.d.P., M.L.,A.D., G.L.-B., P.O. and F.O.; investigation, J.S.d.P., M.L., A.D., A.A., S.F.N., I.C., P.G., R.C. and I.C.;Supervision, G.D.L., P.O., F.O. and G.L.-B. Data curation and visualization G.D.L., J.S.d.P., P.O., M.L.,A.D. and R.-M.F.; Validation, G.D.L., J.S.d.P., M.L., A.D., P.O., F.O. and R.-M.F. All authors have readand agreed to the published version of the manuscript.
Funding: This study has been carried out in the frame of the EXCornsEED project. This projecthas received funding from the Bio Based Industries Joint Undertaking (JU) under grant agreementNo 792054. The JU receives support from the European Union’s Horizon 2020 research and innovationprogramme and the Bio Based Industries Consortium.
Institutional Review Board Statement: Not applicable.
Informed Consent Statement: Not applicable.
Data Availability Statement: The data presented in this study are available in the article and insupplementary material.
Acknowledgments: Special thanks to Ioana-Alexandra Bala and Luminita Dimitriu from ICECHIMfor their lab work on antioxidant activity.
Conflicts of Interest: The authors declare no conflict of interest.
Molecules 2021, 26, 6787 17 of 19
References1. Production Volume of Rapeseed Oil Worldwide from 2012/13 to 2020/21. Available online: https://www.statista.com/statistics/
613487/rapeseed-oil-production-volume-worldwide (accessed on 31 August 2021).2. Future Market Insights (2018) Rapeseed Oil Market: Industrial Applications of Rapeseed Oil in Biodiesel Production to Compete
with Its Use in Food Processing: Global Industry Analysis (2013–2017) & Opportunity Assessment (2018–2027). Available online:https://www.futuremarketinsights.com/reports/rapeseed-oil-market (accessed on 25 June 2021).
3. European Commission. Directive 2009/28/EC of the European Parliament and of the Council of 23 April 2009 on the promotionof the use of energy from renewable sources and amending and subsequently repealing Directives 2001/77/EC and 2003/30/EC.Off. J. Eur. Union 2009, 2009, 5.
4. European Commission. Directive 2009/30/EC of The European Parliament and of the Council of 23 April 2009 AmendingDirective 98/70/EC as Regards the Specification of Petrol, Diesel and Gas-Oil and Introducing a Mechanism to Monitor andReduce Greenhouse Gas Emissions and Amending Council Directive 1999/32/EC as Regards the Specification of Fuel Usedby Inland Waterway Vessels and Repealing Directive 93/12/EEC, 2009. Off. J. Eur. Union 2009, L144/88. Available online:https://eur-lex.europa.eu/LexUriServ/LexUriServ.do?uri=OJ:L:2009:140:0088:0113:EN:PDF (accessed on 5 November 2021).
5. European Commission. Directive (EU) 2015/1513 of the European Parliament and of the Council of 9 September 2015 AmendingDirective 98/70/EC Relating to the Quality of Petrol and Diesel Fuels and Amending Directive 2009/28/EC on the Promotion ofthe Use of Energy from Renewable Sources. Off. J. Eur. Union 2015, L239/1. Available online: https://eur-lex.europa.eu/legal-content/EN/TXT/?uri=celex%3A32015L1513 (accessed on 5 November 2021).
6. European Parliament. Report on a European Strategy for the Promotion of Protein Crops–Encouraging the Production of Proteinand Leguminous Plants in the European Agriculture Sector (2017/2116(INI)). Committee on Agriculture and Rural Development,European Parliament. Available online: https://www.europarl.europa.eu/doceo/document/TA-8-2018-0095_EN.html (accessedon 16 April 2021).
7. USDA United States Department of Agriculture. Foreign Agricultural Service, Oilseeds and Products Annual, EU OilseedsReport Annual 2020, Global Agricultural Information Network, Vienna 15 April 2021. Report Number: E42021-0036. Availableonline: https://www.fas.usda.gov/data/european-union-oilseeds-and-products-annual-1 (accessed on 18 June 2021).
8. Di Lena, G.; del Pulgar, J.S.; Lombardi Boccia, G.; Casini, I.; Ferrari Nicoli, S. Corn Bioethanol Side Streams: A Potential SustainableSource of Fat-Soluble Bioactive Molecules for High-Value Applications. Foods 2020, 9, 1788. [CrossRef] [PubMed]
9. Di Lena, G.; Ondrejícková, P.; del Pulgar, J.S.; Cyprichová, V.; Ježovic, T.; Lucarini, M.; Lombardi Boccia, G.; Nicoli, S.F.; Gabrielli,P.; Aguzzi, A.; et al. Towards a valorization of corn bioethanol side streams: Chemical characterization of post fermentation cornoil and thin stillage. Molecules 2020, 25, 3549. [CrossRef]
10. Arrutia, F.; Binner, E.; Williams, P.; Waldron, K.W. Oilseeds beyond oil: Press cakes and meals supplying global proteinrequirements. Trends Food Sci. Technol. 2020, 100, 88–102. [CrossRef]
11. Mattila, P.H.; Pihlava, J.-M.; Hellström, J.; Nurmi, M.; Eurola, M.; Mäkinen, S.; Jalava, T.; Pihlanto, A. Contents of phytochemicalsand antinutritional factors in commercial protein-rich plant products. Food Qual. Saf. 2018, 2, 213–219. [CrossRef]
12. Jia, W.; Rodriguez-Alonso, E.; Bianeis, M.; Keppler, J.K.; van der Goot, A.J. Assessing functional properties of rapeseed proteinconcentrate versus isolate for food applications. Innov. Food Sci. Emerg. Technol. 2021, 68, 102636. [CrossRef]
13. Szydłowska-Czerniak, A. Rapeseed and its products–sources of bioactive compounds: A review of their characteristics andanalysis. Crit. Rev. Food Sci. Nutr. 2013, 53, 307–330. [CrossRef]
14. Du, Y.; Jiang, X.; Lv, G.; Li, X.; Chi, Y.; Yan, J.; Liu, X.; Buekens, A. TG-pyrolysis and FTIR analysis of chocolate and biomass waste.J. Therm. Anal. Calorim. 2014, 117, 343–353. [CrossRef]
15. Sajdak, M.; Kotyczka-Moranska, M. Development and validation of a fast method based on infrared spectroscopy for biocharquality assessment. Biom. Bioenerg. 2018, 112, 99–109. [CrossRef]
16. Durango Padilla, E.R.; Nakashima, G.T.; Santiago Hansted, A.L.; Ricardo Oliveira Santos, L.R.; de Barros, J.L.; Cressoni De Conti,A.; Yamaji, F.B. Thermogravimetric and Ftir Analyzes Of Corn Cob Pyrolysis. Quim. Nova 2019, 42, 566–569. [CrossRef]
17. Lucarini, M.; Durazzo, A.; Romani, A.; Campo, M.; Lombardi-Boccia, G.; Cecchini, F. Bio-Based Compounds from Grape Seeds: ABiorefinery Approach. Molecules 2018, 23, 1888. [CrossRef]
18. Hssaini, L.; Razouk, R.; Charafi, J.; Houmanat, K.; Hanine, H. Fig seeds: Combined approach of lipochemical assessment usinggas chromatography and FTIR-ATR spectroscopy using chemometrics. Vibrat. Spectrosc. 2021, 114, 103251. [CrossRef]
19. Smith, B.C. Infrared Spectra Interpretation. A Systematic Approach, 1st ed.; CRC Press LLC: Boca Raton, FL, USA, 1999.20. Hishikawa, Y.; Inoue, S.; Magoshi, J.; Kondo, T. Novel tool for characterization of noncrystalline regions in cellulose: A
FTIR deuteration monitoring and generalized two-dimensional correlation spectroscopy. Biomacromolecules 2005, 6, 2468–2473.[CrossRef]
21. Yang, Y.P.; Zhang, Y.; Lang, Y.X.; Yu, M.H. Structural ATR-IR analysis of cellulose fibers prepared from a NaOH complex aqueoussolution. IOP Conf. Ser. Mater. Sci. Eng. 2017, 213, 012039. [CrossRef]
22. Garside, P.; Wyeth, P. Identification of Cellulosic Fibres by FTIR Spectroscopy—Thread and Single Fibre Analysis by AttenuatedTotal Reflectance. Stud. Conserv. 2003, 48, 269–275. [CrossRef]
23. Wang, L.P.; Shen, Q.R.; Yu, G.H.; Ran, W.; Xu, Y.C. Fate of biopolymers during rapeseed meal and wheat bran composting asstudied by two-dimensional correlation spectroscopy in combination with multiple fluorescence labeling techniques. Biores.Technol. 2012, 105, 88–94. [CrossRef] [PubMed]
Molecules 2021, 26, 6787 18 of 19
24. Campbell, L.; Rempel, C.B.; Wanasundara, J.P.D. Canola/rapeseed protein: Future opportunities and directions—Workshopproceedings of IRC 2015. Plants 2016, 5, 17. [CrossRef]
25. Chmielewska, A.; Kozłowska, M.; Rachwał, D.; Wnukowski, P.; Amarowicz, R.; Nebesny, E.; Rosicka-Kaczmarek, J.Canola/rapeseed protein–nutritional value, functionality and food application: A review. Crit. Rev. Food Sci. Nutr. 2020.[CrossRef]
26. Aider, M.; Barbana, C. Canola proteins: Composition, extraction, functional properties, bioactivity, applications as a foodingredient and allergenicity-A practical and critical review. Trends Food Sci. Technol. 2011, 22, 21–39. [CrossRef]
27. Yoshie-Stark, Y.; Wada, Y.; Wäsche, A. Chemical composition, functional properties, and bioactivities of rapeseed protein isolates.Food Chem. 2008, 107, 32–39. [CrossRef]
28. Zhang, S.B.; Wang, Z.; Xu, S.Y. Antioxidant and antithrombotic activities of rapeseed peptides. JAOCS 2008, 85, 521–527.[CrossRef]
29. Dai, C.; Zhang, W.; He, R.; Xiong, F.; Ma, H. Protein breakdown and release of antioxidant peptides during simulated gastroin-testinal digestion and the absorption by everted intestinal sac of rapeseed proteins. LWT 2017, 86, 424–429. [CrossRef]
30. Wang, Y.; Li, Y.; Ruan, S.; Lu, F.; Tian, W.; Ma, H. Antihypertensive effect of rapeseed peptides and their potential in improvingthe effectiveness of captopril. J. Sci. Food Agric. 2021, 101, 3049–3055. [CrossRef] [PubMed]
31. Nevara, G.A.; Muhammad, S.K.S.; Zawawi, N.; Mustapha, N.A.; Karim, R. Dietary Fiber: Fractionation, Characterization andPotential Sources from Defatted Oilseeds. Foods 2021, 10, 754. [CrossRef] [PubMed]
32. Ancuta, P.; Sonia, A. Oil press-cakes and meals valorization through circular economy approaches: A review. Appl. Sci. 2020,10, 7432. [CrossRef]
33. Ermosh, L.G.; Prisuhina, N.V.; Koch, D.A.; Eremina, E.V. The use of oilseed cake for supplementation of bakery products. IOPConf. Series Earth Environ. Sci. 2021, 677, 022090. [CrossRef]
34. McCance & Widdowson’s The Composition of Foods Integrated Dataset (CoFID) 2021 [United Kingdom]. Available online:https://www.gov.uk/government/publications/composition-of-foods-integrated-dataset-cofid (accessed on 2 November 2021).
35. Lombardi-Boccia, G.; Schlemmer, U.; Cappelloni, M.; Di Lullo, G. The inhibitory effect of albumin extracts from white beans(Phaseolus vulgaris L.) on in vitro iron and zinc dialysability: Role of phytic acid. Food Chem. 1998, 63, 1–7. [CrossRef]
36. Vucenik, I. Anticancer properties of inositol hexaphosphate and inositol: An overview. J. Nutrit. Sci. Vitaminol. 2019, 65, S18–S22.[CrossRef]
37. Feizollahi, E.; Mirmahdi, R.S.; Zoghi, A.; Zijlstra, R.T.; Roopesh, M.S.; Vasanthan, T. Review of the beneficial and anti-nutritionalqualities of phytic acid, and procedures for removing it from food products. Food Res. Int. 2021, 143, 110284. [CrossRef] [PubMed]
38. Yates, K.; Pohl, F.; Busch, M.; Mozer, A.; Watters, L.; Shiryaev, A.; Kong Thoo Lin, P. Determination of sinapine in rapeseedpomace extract: Its antioxidant and acetylcholinesterase inhibition properties. Food Chem. 2019, 276, 768–775. [CrossRef]
39. Naczk, M.; Amarowicz, R.; Sullivan, A.; Shahidi, F. Current research developments on polyphenolics of rapeseed/canola: Areview. Food Chem. 1998, 62, 489–502. [CrossRef]
40. Thiyam, U.; Kuhlmann, A.; Stöckmann, H.; Schwarz, K. Prospects of rapeseed oil by-products with respect to antioxidativepotential. Comp. Rendus Chim. 2004, 7, 611–616. [CrossRef]
41. Pohl, F.; Goua, M.; Bermano, G.; Russell, W.R.; Scobbie, L.; Maciel, P.; Kong Thoo Lin, P. Revalorisation of rapeseed pomaceextracts: An in vitro study into its anti-oxidant and DNA protective properties. Food Chem. 2018, 239, 323–332. [CrossRef][PubMed]
42. Pohl, F.; Teixeira-Castro, A.; Costa, M.D.; Lindsay, V.; Fiúza-Fernandes, J.; Goua, M.; Bermano, G.; Russell, W.; Maciel, P.; Lin,P.K.T. Gst-4-dependent suppression of neurodegeneration in c. Elegans models of parkinson’s and machado-joseph disease byrapeseed pomace extract supplementation. Front. Neurosci. 2019, 13, 1091. [CrossRef]
43. Ng, H.E.; Raj, S.S.A.; Wong, S.H.; Tey, D.; Tan, H.M. Estimation of fungal growth using the ergosterol assay: A rapid tool inassessing the microbiological status of grains and feeds. Lett. Appl. Microbiol. 2008, 46, 113–118. [CrossRef]
44. Witaszak, N.; Stepien, Ł.; Bocianowski, J.; Waskiewicz, A. Fusarium species and mycotoxins contaminating veterinary diets fordogs and cats. Microorganisms 2019, 7, 26. [CrossRef]
45. Schwartz, H.; Ollilainen, V.; Piironen, V.; Lampi, A.-M. Tocopherol, tocotrienol and plant sterol contents of vegetable oils andindustrial fats. J. Food Comp. Anal. 2008, 21, 152–161. [CrossRef]
46. Riaz, A.; Aadil, R.M.; Amoussa, A.M.O.; Bashari, M.; Abid, M.; Hashim, M.M. Application of chitosan-based apple peelpolyphenols edible coating on the preservation of strawberry (Fragaria ananassa cv Hongyan) fruit. J. Food Proc. Pres. 2021,45, e15018. [CrossRef]
47. Taofiq, O.; González-Paramás, A.M.; Barreiro, M.F.; Ferreira, I.C.F.R. Hydroxycinnamic Acids and Their Derivatives: Cosmeceuti-cal Significance, Challenges and Future Perspectives, a Review. Molecules 2017, 22, 281. [CrossRef]
48. Silva, E.D.; Batista, R. Ferulic Acid and Naturally Occurring Compounds Bearing a Feruloyl Moiety: A Review on Their Structures,Occurrence, and Potential Health Benefits. Compr. Rev. Food Sci. Food Saf. 2017, 16, 580–616. [CrossRef] [PubMed]
49. Neelam; Khatkar, A.; Sharma, K.K. Phenylpropanoids and its derivatives: Biological activities and its role in food, pharmaceuticaland cosmetic industries. CRC Cr. Rev. Food Sci. 2020, 60, 2655–2675. [CrossRef] [PubMed]
50. Peyrot, C.; Mention, M.M.; Brunissen, F.; Allais, F. Sinapic acid esters: Octinoxate substitutes combining suitable uv protectionand antioxidant activity. Antioxidants 2020, 9, 782. [CrossRef]
Molecules 2021, 26, 6787 19 of 19
51. Ghosh, S.; Basak, P.; Dutta, S.; Chowdhury, S.; Sil, P.C. New insights into the ameliorative effects of ferulic acid in pathophysiolog-ical conditions. Food Chem. Toxicol. 2017, 103, 41–55. [CrossRef] [PubMed]
52. Vinayagam, R.; Jayachandran, M.; Xu, B. Anti-diabetic effects of simple phenolic acids: A comprehensive review. PhytotherapyRes. 2016, 30, 184–199. [CrossRef]
53. Alam, M.A. Anti-hypertensive Effect of Cereal Antioxidant Ferulic Acid and Its Mechanism of Action. Front. Nutr. 2019, 6, 121.[CrossRef]
54. Szwajgier, D.; Borowiec, K.; Pustelniak, K. The neuroprotective effects of phenolic acids: Molecular mechanism of action. Nutrients2017, 9, 477. [CrossRef] [PubMed]
55. Coman, V.; Vodnar, D.C. Hydroxycinnamic acids and human health: Recent advances. J. Sci. Food Agric. 2020, 100, 483–499.[CrossRef]
56. Chaudhary, A.; Jaswal, V.S.; Choudhary, S.; Sonika, S.A.; Beniwal, V.; Tuli, H.S.; Sharma, S. Ferulic Acid: A Promising TherapeuticPhytochemical and Recent Patents Advances. Recent Pat. Inflamm. Allerg. Drug Discov. 2019, 13, 115–123. [CrossRef]
57. Cunha, F.V.M.; Coelho, A.G.; Azevedo, P.S.d.S.; da Silva, A.A.; Oliveira, F.d.A.; Nunes, L.C.C. Systematic review and technologicalprospection: Ethyl ferulate, a phenylpropanoid with antioxidant and neuroprotective actions. Expert Opin. Ther. Pat. 2019, 29,73–83. [CrossRef]
58. Government Decree of Slovak Republic Regulation 438/2006—Government Ordinance on undesired Substances in Animal Feedand on Other Indicators of Safety and Usefulness of Animal Feed. Available online: https://www.slov-lex.sk/static/pdf/2006/2006c161.pdf (accessed on 1 July 2006).
59. European Commission. Regulation (EC) No 396/2005 of the European Parliament and of the Council of 23 February 2005 onMaximum Residue Levels of Pesticides in or on Food and Feed of Plant and Animal Origin and Amending Council Directive91/414/EEC. Off. J. Eur. Union 2005, L70/1. Available online: https://eur-lex.europa.eu/legal-content/EN/TXT/?uri=celex%3A32005R0396 (accessed on 5 November 2021).
60. ISO 21528-2:2004 Microbiology of Food and Animal Feeding Stuffs—Horizontal Methods for the Detection and Enumeration ofEnterobacteriaceae—Part 2: Colony-Count Method. Available online: https://www.iso.org/standard/34566.html (accessed on5 November 2021).
61. ISO 6579-1:2017 Microbiology of the Food Chain—Horizontal Method for the Detection, Enumeration and Serotyping ofSalmonella—Part 1: Detection of Salmonella spp. Available online: https://www.iso.org/standard/76671.html (accessed on 5November 2021).
62. ISO 21527-2: 2008 Microbiology of Food and Animal Feeding Stuffs—Horizontal Method for the Enumeration of Yeasts andMoulds—Part 2: Colony Count Technique in Products with Water Activity Less Than or Equal to 0.95. Available online:https://www.iso.org/standard/38276.html (accessed on 5 November 2021).
63. Association of Official Analytical Chemists. Official Methods of Analysis, 19th ed.; Association of Official Analytical Chemists:Arlington, VA, USA, 2012.
64. Prosky, L.; Asp, N.G.; Schweizer, T.F.; DeVries, J.W.; Furda, I. Determination of insoluble, soluble, and total dietary fiber in foodsand food products: Interlaboratory study. J. AOAC 1988, 71, 1017–1023. [CrossRef]
65. Pacifico, D.; Musmesci, S.; Sanchez del Pulgar, J.; Onofri, C.; Parisi, B.; Sasso, R.; Mandolino, G.; Lombardi-Boccia, G. Caffeic Acidand α-Chaconine Influence the Resistance of Potato Tuber to Phthorimaea operculella (Lepidoptera: Gelechiidae). Amer. J. PotatoRes. 2019, 4, 403–4013. [CrossRef]
66. Bligh, E.G.; Dyer, W.J. A rapid method of total lipid extraction and purification. Canad. J. Biochem. Physiol. 1959, 37, 911–917.[CrossRef]
67. Metcalfe, L.D.; Schmitz, A.A. The rapid preparation of fatty acid esters for gas chromatographic analysis. Analytical Chem. 1961,33, 363–364. [CrossRef]
68. Singleton, V.L.; Orthofer, R.; Lamuela-Raventós, R.M. Analysis of total phenols and other oxidation substrates and antioxidantsby means of Folin-Ciocalteu reagent. In Methods in Enzymology; Academic Press: London, UK, 1999; Volume 299, pp. 152–178.
69. Benzie, I.F.F.; Strain, J.J. [2] Ferric reducing/antioxidant power assay: Direct measure of total antioxidant activity of biologicalfluids and modified version for simultaneous measurement of total antioxidant power and ascorbic acid concentration. MethodsEnzymol. 1999, 299, 15–27.
70. Meng, J.; Fang, Y.; Zhang, A.; Chen, S.; Xu, T.; Ren, Z.; Han, G.; Liu, J.; Li, H.; Zhang, Z. Phenolic content and antioxidant capacityof Chinese raisins produced in Xinjiang Province. Food Res. Int. 2011, 44, 2830–2836. [CrossRef]
71. Proestos, C.; Lytoudi, K.; Mavromelanidou, O.K.; Zoumpoulakis, P.; Sinanoglou, V.J. Antioxidant capacity of selected plantextracts and their essential oils. Antioxidants 2013, 2, 11–22. [CrossRef]
72. Dudonné, S.; Vitrac, X.; Coutière, P.; Woillez, M.; Mérillon, J.-M. Comparative Study of Antioxidant Properties and Total PhenolicContent of 30 Plant Extracts of Industrial Interest Using DPPH, ABTS, FRAP, SOD, and ORAC Assays. J. Agr. Food Chem. 2009, 57,1768–1774. [CrossRef] [PubMed]
73. Lan, W.; Zhang, R.; Ahmed, S.; Qin, W.; Liu, Y. Effects of various antimicrobial polyvinyl alcohol/tea polyphenol composite filmson the shelf life of packaged strawberries. LWT Food Sci. Technol. 2019, 113, 108297. [CrossRef]
74. Savin, S.; Craciunescu, O.; Oancea, A.; Ilie, D.; Ciucan, T.; Antohi, L.S.; Toma, A.; Nicolescu, A.; Deleanu, C.; Oancea, F.Antioxidant, Cytotoxic and Antimicrobial Activity of Chitosan Preparations Extracted from Ganoderma Lucidum Mushroom.Chem. Biod. 2020, 17, e2000175. [CrossRef]