Quantitative trait analysis of seed yield and other complex traits in hybrid spring rapeseed (...
13
Theor Appl Genet (2006) 113:597–609 DOI 10.1007/s00122-006-0324-0 123 ORIGINAL PAPER Quantitative trait analysis of seed yield and other complex traits in hybrid spring rapeseed (Brassica napus L.): 2. IdentiWcation of alleles from unadapted germplasm Joshua A. Udall · Pablo A. Quijada · Bart Lambert · Thomas C. Osborn Received: 10 November 2005 / Accepted: 13 May 2006 / Published online: 10 June 2006 © Springer-Verlag 2006 Abstract Unadapted germplasm may contain alleles that could improve hybrid cultivars of spring oilseed Brassica napus. Quantitative trait loci (QTL) mapping was used to identify potentially useful alleles from two unadapted germplasm sources, a Chinese winter culti- var and a re-synthesized B. napus, that increase seed yield when introgressed into a B. napus spring hybrid combination. Two populations of 160 doubled haploid (DH) lines were created from crosses between the unadapted germplasm source and a genetically engi- neered male-fertility restorer line (P1804). A geneti- cally engineered male-sterile tester line was used to create hybrids with each DH line (testcrosses). The two DH line populations were evaluated in two envi- ronments and the two testcross populations were eval- uated in three or four environments for seed yield and other agronomic traits. Several genomic regions were found in the two testcross populations which contained QTL for seed yield. The map positions of QTL for days to Xowering and resistance to a bacterial leaf blight dis- ease coincided with QTL for seed yield and other agro- nomic traits, suggesting the occurrence of pleiotropic or linked eVects. For two hybrid seed yield QTL, the favorable alleles increasing seed yield originated from the unadapted parents, and one of these QTL was detected in multiple environments and in both popula- tions. In this QTL region, a chromosome rearrange- ment was identiWed in P1804, which may have aVected seed yield. Introduction Although germplasm that is unadapted to a particular environment is inferior to adapted germplasm, it may contain superior alleles at some loci that could improve speciWc traits when introgressed into the adapted germ- plasm. In oilseed Brassica napus, unadapted germplasm has been used to improve seed yield of spring hybrid combinations. Introgression of alleles from a French winter cultivar into a parent of a spring hybrid substan- tially increased seed yields over open-pollinated culti- vars, commercial hybrids, and experimental spring £ spring hybrids (Butruille et al. 1999a). QTL analysis was used to investigate the eVects of introgressing winter alleles from the German winter cultivar Ceres into the spring backgrounds of the cultivar Marnoo (Australian) and the cultivar Westar (Canadian; Butruille et al. Communicated by S. J. Knapp Electronic Supplementary Material Supplementary material is available to authorised users in the online version of this article at http://dx.doi.org/10.1007/s00122-006-0324-0. J. A. Udall · P. A. Quijada · T. C. Osborn (&) Plant Breeding and Plant Genetics Program, and Department of Agronomy, University of Wisconsin, Madison, WI 53706, USA e-mail: [email protected] B. Lambert Bayer BioScience, Nazarethse Steenweg 77, 9800 Astene, Belgium Present address: J. A. Udall Department of Evolution, Ecology and Organismal Biology, Iowa State University, Ames, IA 50011, USA Present address: T. C. Osborn Seminis Vegetable Seeds, 37437 State Highway 16, Woodland, CA 95695, USA
-
Upload
independent -
Category
Documents
-
view
3 -
download
0
Transcript of Quantitative trait analysis of seed yield and other complex traits in hybrid spring rapeseed (...
Theor Appl Genet (2006) 113:597–609
DOI 10.1007/s00122-006-0324-0ORIGINAL PAPER
Quantitative trait analysis of seed yield and other complex traits in hybrid spring rapeseed (Brassica napus L.): 2. IdentiWcationof alleles from unadapted germplasm
Joshua A. Udall · Pablo A. Quijada · Bart Lambert · Thomas C. Osborn
Received: 10 November 2005 / Accepted: 13 May 2006 / Published online: 10 June 2006© Springer-Verlag 2006
Abstract Unadapted germplasm may contain allelesthat could improve hybrid cultivars of spring oilseedBrassica napus. Quantitative trait loci (QTL) mappingwas used to identify potentially useful alleles from twounadapted germplasm sources, a Chinese winter culti-var and a re-synthesized B. napus, that increase seedyield when introgressed into a B. napus spring hybridcombination. Two populations of 160 doubled haploid(DH) lines were created from crosses between theunadapted germplasm source and a genetically engi-neered male-fertility restorer line (P1804). A geneti-cally engineered male-sterile tester line was used tocreate hybrids with each DH line (testcrosses). The
two DH line populations were evaluated in two envi-ronments and the two testcross populations were eval-uated in three or four environments for seed yield andother agronomic traits. Several genomic regions werefound in the two testcross populations which containedQTL for seed yield. The map positions of QTL for daysto Xowering and resistance to a bacterial leaf blight dis-ease coincided with QTL for seed yield and other agro-nomic traits, suggesting the occurrence of pleiotropicor linked eVects. For two hybrid seed yield QTL, thefavorable alleles increasing seed yield originated fromthe unadapted parents, and one of these QTL wasdetected in multiple environments and in both popula-tions. In this QTL region, a chromosome rearrange-ment was identiWed in P1804, which may have aVectedseed yield.
Introduction
Although germplasm that is unadapted to a particularenvironment is inferior to adapted germplasm, it maycontain superior alleles at some loci that could improvespeciWc traits when introgressed into the adapted germ-plasm. In oilseed Brassica napus, unadapted germplasmhas been used to improve seed yield of spring hybridcombinations. Introgression of alleles from a Frenchwinter cultivar into a parent of a spring hybrid substan-tially increased seed yields over open-pollinated culti-vars, commercial hybrids, and experimental spring £spring hybrids (Butruille et al. 1999a). QTL analysis wasused to investigate the eVects of introgressing winteralleles from the German winter cultivar Ceres into thespring backgrounds of the cultivar Marnoo (Australian)and the cultivar Westar (Canadian; Butruille et al.
Communicated by S. J. Knapp
Electronic Supplementary Material Supplementary material is available to authorised users in the online version of this article at http://dx.doi.org/10.1007/s00122-006-0324-0.
J. A. Udall · P. A. Quijada · T. C. Osborn (&)Plant Breeding and Plant Genetics Program, and Department of Agronomy, University of Wisconsin, Madison, WI 53706, USAe-mail: [email protected]
B. LambertBayer BioScience, Nazarethse Steenweg 77,9800 Astene, Belgium
Present address: J. A. UdallDepartment of Evolution, Ecology and Organismal Biology, Iowa State University, Ames, IA 50011, USA
Present address: T. C. OsbornSeminis Vegetable Seeds, 37437 State Highway 16, Woodland, CA 95695, USA
123
598 Theor Appl Genet (2006) 113:597–609
1999b). This introgression revealed two QTL (HSY3 onN3 and HSY14 on N14) for which winter allelesincreased seed yield of hybrids. Recently, Quijada et al.(2004a) conWrmed the favorable eVects of the winterallele at HSY3 in spring Australian and Europeangenetic backgrounds. Additional QTL studies of Frenchwinter germplasms have identiWed genomic regions con-taining alleles from unadapted germplasm that improveseed yields of Canadian £ European spring canola test-crosses (Quijada et al. 2004b; 2006).
In addition to European winter germplasm, otherunadapted B. napus germplasm, such as Asian wintertypes, also may contain favorable alleles, which improveseed yield of spring hybrids. Asian winter germplasmis intermediate to spring and European winter germ-plasm in growth habit and responsiveness to vernaliza-tion, and it is also distinct based on molecular markers(Diers et al. 1994; Becker et al. 1995). Lefort-Busonet al. (1987) observed a correlation between geneticdistance and heterosis in European and Asian winterlines. Asian winter germplasm has not been evaluateddirectly for heterotic eVects with spring germplasmbecause the hybrids have greatly delayed maturity.However, alleles from Asian germplasm that are intro-gressed into spring hybrids could improve seed yields,as suggested by our previous phenotypic analysis(Udall et al. 2004).
The extant diploid progenitors of the allotetraploidB. napus, B. rapa (A genome) and B. oleracea (Cgenome), also represent germplasm sources which maycontain novel alleles for increased seed yield in springhybrid B. napus. Both diploid Brassica species containmore genetic diversity than B. napus, probably becausethe natural allopolyploidization event(s) caused agenetic bottleneck (Song et al. 1993). One method ofallele introgression from the diploids to B. napusemploys inter-speciWc hybridization of B. rapa andB.oleracea and subsequent chromosome doubling ofthe F1 amphihaploid to create resynthsized B. napuslines. Because B. rapa is also bred and cultivated as anoilseed crop, some of its alleles may directly improvequantitative traits of oilseed B. napus. ResynthesizedB.napus has been previously introgressed into cultivatedB. napus germplasm with the primary objective of intro-ducing speciWc traits, such as seed color (Chen et al.1988), photoperiod insensitivity (Akbar 1989), clubrootresistance (Bradshaw et al. 1997; Manzanares-Dauleuxet al. 2000), and silique shattering resistance (Prakashand Chopra 1990; Morgan et al. 1998). Kräling (1987)investigated the use of resynthesized B. napus toimprove seed yield of winter hybrids and reported someseed yield improvement of cultivar £ resynthesized andcultivar £ (cultivar £ resynthesized) winter hybrids. We
also reported positive eVects on seed yield from intro-gression of alleles from resynthesized B. napus into aspring hybrid combination (Udall et al. 2004).
In this study, we use QTL analysis to identify allelesfrom two unadapted sources of germplasm that aVectseed yield and other traits when introgressed into aspring hybrid combination. We used two segregatingpopulations of doubled haploid (DH) lines indepen-dently developed by crossing a Canadian spring line toan Asian winter line and to a resynthsized B. napusline. These populations were previously evaluated asDH lines and testcrosses in several environments, andin this study genetic linkage maps are used to identifyQTL for seed yield and other important agronomictraits.
Materials and methods
Plant materials
The hybrid combination, P124 £ P1804, was selectedas a Canadian £ European heterotic combination inwhich to evaluate the eVects of introgressing allelesfrom a Chinese winter cultivar and a resynthesizedB. napus line. The female, P124, segregates for male-sterility due to the barnase transgene (Mariani et al.1990) and was a parent of commercial hybrids ownedby Bayer CropScience. P1804 contains the barstartransgene (Mariani et al. 1992), which restores male-fertility (Rf), and sister lines of P1804 have been usedas male parents in commercial hybrid cultivars releasedby Bayer CropScience.
The Chinese cultivar Hua-dbl2 and a resynthesizedB. napus line, TO1141, were selected as unadaptedgermplasm sources. Hua-dbl2, a open-pollinated win-ter cultivar with a facultative vernalization require-ment for Xowering, was kindly provided by Dr. JinlingMeng, Huazhong Agricultural University, China.RV289 was a single plant selected from Hua-dbl2.TO1141 was a single plant created by crossing oilseedB. rapa cv. Reward as a female with rapid cyclingB. oleracea TO1000 as a male and chromosome dou-bling with colchicine.
Two populations of DH lines (HUA DH and SYNDH) were developed by microspore culture from theF1 crosses RV289 £ P1804 and TO1141 £ P1804,respectively (for more details, see Udall et al. 2004).One hundred and seventy DH lines of each populationwere selected to contain the Rf gene by selecting forthe presence of the linked herbicide resistance gene.Testcross seed was produced using the HUA and SYNDH lines as males and P124 as the female tester line
123
Theor Appl Genet (2006) 113:597–609 599
(HUA and SYN testcross populations) by Bayer Crop-Science in Weld cages in Canada during the summer of1998 and in Australia during the summer of 1999–2000(see Udall et al. 2004 for more details on the develop-ment of these materials).
Field trials and trait measurements
The DH lines were evaluated at the Arlington Agricul-tural Research Station in Wisconsin (WI), USA duringthe summers of 1999, 2000, and 2001. Because of seedproduction problems in 1998, 148 DH lines of theHUA population were evaluated in 1999 and 2000 and160 DH lines of the SYN population were evaluated in2000 and 2001. The experimental design was a random-ized complete block design (RCBD) with two replica-tions. In 1999, the plots were seven rows wide, with0.15 m between rows and 4.9 m long, and were nottrimmed before swathing. In 2000 and 2001, the plotswere 6.1 m long and were trimmed to 4.9 m long2 weeks before swathing. Seeds were planted duringthe last 3 days of April each year.
The HUA and SYN testcrosses were evaluated dur-ing the summers of 1999, 2000, and 2001 at the sameWI locations as the inbreds and at Saskatoon, Sas-katchewan (SK), Canada during 1999 and 2000. Weevaluated 155 and 157 HUA testcrosses in 1999 and2000, respectively; and 154 and 133 SYN testcrosseswere evaluated in 2000 and 2001, respectively. Theexperimental design at both locations was an RCBDwith two replications. In WI, planting dates and plotsizes were the same as for the inbred experiments con-ducted during the same years. In the Weld trials con-ducted in SK, the plots were Wve rows wide, with0.19 m between rows and 6 m long, and plots were nottrimmed before swathing. Seeds were planted in SK onMay 28 in 1999 and on May 20 in 2000. Both DH lineand testcross evaluations included the parental lines(Hua-dbl2 or TO1141 and P1804), tester (P124) andsome commercial cultivars used as checks (for moredetails, see Udall et al. 2004).
Several traits were measured for each plot, includingdays to Xowering (dtf), plant height (ph), lodging (ld),seed yield (sy), test weight (tw), and seed weight (sw). Abacterial leaf blight (blb) disease caused by Pseudomonassyringae was evaluated only for the DH lines, since thetestcrosses were resistant presumably due to a dominantresistance allele(s) in the tester. The data collectionmethods were reported previously (Udall et al. 2004).Additional data on seed and silique characteristics weremeasured on the SYN DH populations for this study andwere not previously reported. Seed oil content (oil) andtotal glucosinolates (gls) were measured for DH lines of
the WI1999 HUA population by David Syme, BayerCropScience, Canada, as described by Toroser et al.(1995). Silique characteristics, including ease of shatter-ing (sh), pod length (ln), and beak length (bk) were mea-sured for the WI2001 SYN population. Between 14 and21 days after swathing the WI2001 Weld, three branchescontaining ten or more siliques were collected from eachreplication of each DH line. These siliques were storedand their ease of shattering was assessed in an environ-mentally controlled chamber at 25°C and 25% humidity.Six to ten siliques were cut (20 total) from each of thethree branches and placed in a round plastic container(radius = 9 cm) with Wve steel ball-bearings. The con-tainer was attached to a shaking platform (5 Hz) and thenumber of broken siliques was counted every 20 or 30 suntil there were no unbroken siliques remaining. Siliquelength and beak length was measured from the remain-ing septa. The better Wt of two regression models (linearor log) for the shattering time course was chosen for eachsample and the number of seconds for one-half of the sil-iques to rupture was estimated from the regression line.
Data analysis
Statistical analyses were conducted using the MIXEDprocedure of SAS (Littell et al. 1996), where the source‘Entry’ included the DH lines or their testcrosses. Par-ents of the DH lines or parents of the testcrosses wereexcluded from the analysis. In each experiment, envi-ronment was considered as a Wxed eVect and genotypes(DH lines or testcrosses), genotype by environment(GE) interaction and replicates within environmentwere treated as random eVects. The variance compo-nents were used to estimate the narrow-sense heritabil-ity (h2) on a mean basis for each trait as described byHallauer and Miranda (1988). Exact 95% conWdenceintervals (CIs) of h2 were calculated according toKnapp et al. (1985). Genetic correlations (rg) amongtraits in each experiment were estimated as describedby Mode and Robinson (1959). The covariance esti-mates were calculated using the SAS GLM procedurewith the ‘Manova’ statement (SAS Institute 2000). ThesigniWcance of each genetic correlation was determinedusing a t test of the correlation coeYcient (Edwards1976) with a signiWcance level corrected according tothe Bonferroni–Holm sequential method (Rice 1989).
Molecular markers and linkage map
Genomic DNA was isolated from lyophilized leaf tis-sues collected from twelve 3-week-old plants of theparents and the DH lines of each population using theCTAB procedure described by Kidwell and Osborn
123
600 Theor Appl Genet (2006) 113:597–609
(1992). The procedures used for restriction enzymedigestion, gel electrophoresis, Southern blotting, proberadiolabeling and membrane hybridization are describedelsewhere by Ferreira et al. (1994). The majority ofthe DNA clones used as probes were the same onesused in previous studies (Teutonico and Osborn 1994;Ferreira et al. 1994; Thormann et al. 1996; Kole et al.1997; Butruille et al. 1999b); however, probe nomen-clature of Parkin et al. (1995) and Sharpe et al. (1995)was used due to its greater simplicity and ease of cross-referencing studies (Udall et al. 2005). Additionalprobe information is available at http://www.osbornlab.agronomy.wisc.edu/research.html. In addition, fourhomologues of FLOWERING LOCUS C (FLC), cor-responding to BrFLC1, BrFLC2, BrFLC3, andBrFLC5 from B. rapa (Schranz et al. 2002), andFLOWERING LOCUS T (FT) (Kardailsky et al. 1999)were also used as probes.
The HUA DH map had 243 marker loci at an aver-age marker density of 7.3 cM along a 1,460 cM geneticmap. The SYN DH map had 312 marker loci at anaverage density of 6.0 cM along a 1,668 cM geneticmap. Each map had 19 linkage groups which probablycorresponded to the individual chromosomes ofB. napus (n = 19). These linkage maps are described inmore detail elsewhere (Udall et al. 2005). The linkagegroups were named N1–N10 (homologous to the Agenome of B. rapa) and N11–N19 (homologous to theC genome of B. oleracea), according to the conventionestablished by Parkin et al. 1995. A homoeologousreciprocal transposition (HRT) including N7 and N16and several homoeologous non-reciprocal transposi-tions (HNRTs) were segregating in each of the HUAand SYN mapping populations (Udall et al. 2005).
QTL analysis
The QTL cartographer suite of computer programswas used to identify signiWcant QTL by compositeinterval mapping (CIM) using a maximum likelihoodapproach (Basten et al. 2002). CIM was used to scanthe genetic map and estimate the likelihood of a QTLand its corresponding eVects at every 2 cM while usingsigniWcant cofactors (loci) to adjust the phenotypiceVects associated with other positions in the geneticmap. Two to Wfteen cofactors for each trait were ini-tially selected by SRmapqtl using a forward-backwardregression algorithm (cofactor included for P < 0.01;cofactor dropped for P > 0.05). Cofactors within 10 cMon either side of the QTL test site were not included inthe Zmapqtl QTL model (model 6) to avoid the inclu-sion of putative tail eVects in the model of the testedchromosome position. By convention, the likelihood of
the presence of a QTL at each 2 cM interval reportedhere is expressed as a LOD score (Liu 1997). On eachside of the QTL peak, 1 and 2 LOD CIs were extractedfrom the Zmapqtl output. Jzmapqtl was used to esti-mate QTL £ environment interaction. CIM experi-ment-wise LOD threshold levels were determined foreach trait by 1,000 permutations which shuZed thephenotypes (adjusted means) with the genotypes(markers; Doerge and Churchill 1996). Each permuta-tion included putative cofactor selection for eachmodel by SRmapqtl using a Perl script to iterate andparse the output of the DOS-based suite of programs.The extreme LR value from each permutation wassaved and used to generate a distribution of extremeLRs to which empirical data were then compared.Empirical LR values equal to or exceeding the 5%highest LR values in the distribution of extremepermutation values were considered signiWcant atP < 0.05.
Results
Quantitative genetic variation
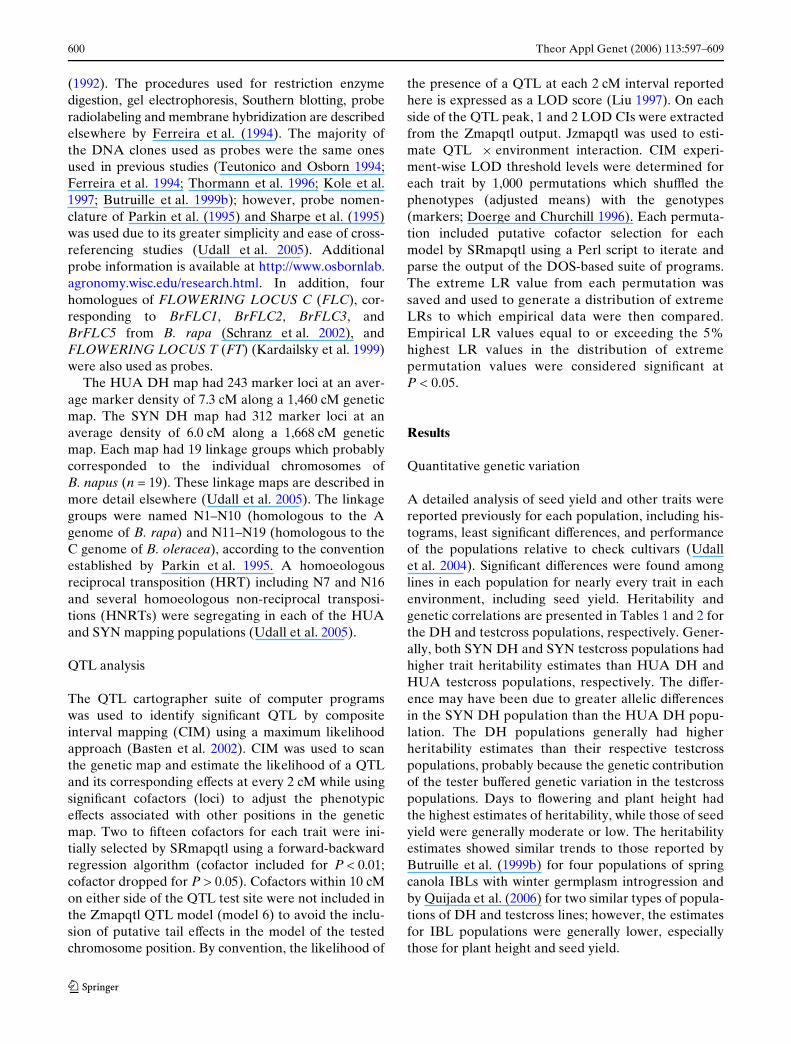
A detailed analysis of seed yield and other traits werereported previously for each population, including his-tograms, least signiWcant diVerences, and performanceof the populations relative to check cultivars (Udallet al. 2004). SigniWcant diVerences were found amonglines in each population for nearly every trait in eachenvironment, including seed yield. Heritability andgenetic correlations are presented in Tables 1 and 2 forthe DH and testcross populations, respectively. Gener-ally, both SYN DH and SYN testcross populations hadhigher trait heritability estimates than HUA DH andHUA testcross populations, respectively. The diVer-ence may have been due to greater allelic diVerencesin the SYN DH population than the HUA DH popu-lation. The DH populations generally had higherheritability estimates than their respective testcrosspopulations, probably because the genetic contributionof the tester buVered genetic variation in the testcrosspopulations. Days to Xowering and plant height hadthe highest estimates of heritability, while those of seedyield were generally moderate or low. The heritabilityestimates showed similar trends to those reported byButruille et al. (1999b) for four populations of springcanola IBLs with winter germplasm introgression andby Quijada et al. (2006) for two similar types of popula-tions of DH and testcross lines; however, the estimatesfor IBL populations were generally lower, especiallythose for plant height and seed yield.
123
Theor Appl Genet (2006) 113:597–609 601
The genetic correlations between days to Xoweringand several other traits were highly signiWcant in eachpopulation (Tables 1, 2). For example, days to Xower-ing and plant height were positively correlated whileboth of these traits were negatively correlated withlodging. Days to Xowering and plant height were notconsistently correlated with seed yield. For example,days to Xowering was negatively correlated with seedyield in the HUA DH population, yet plant height waspositively correlated with seed yield in the SYN DHpopulation. Other traits were also correlated with seedyield. In the DH populations, for example, seed yieldwas negatively correlated with bacterial leaf blight levels
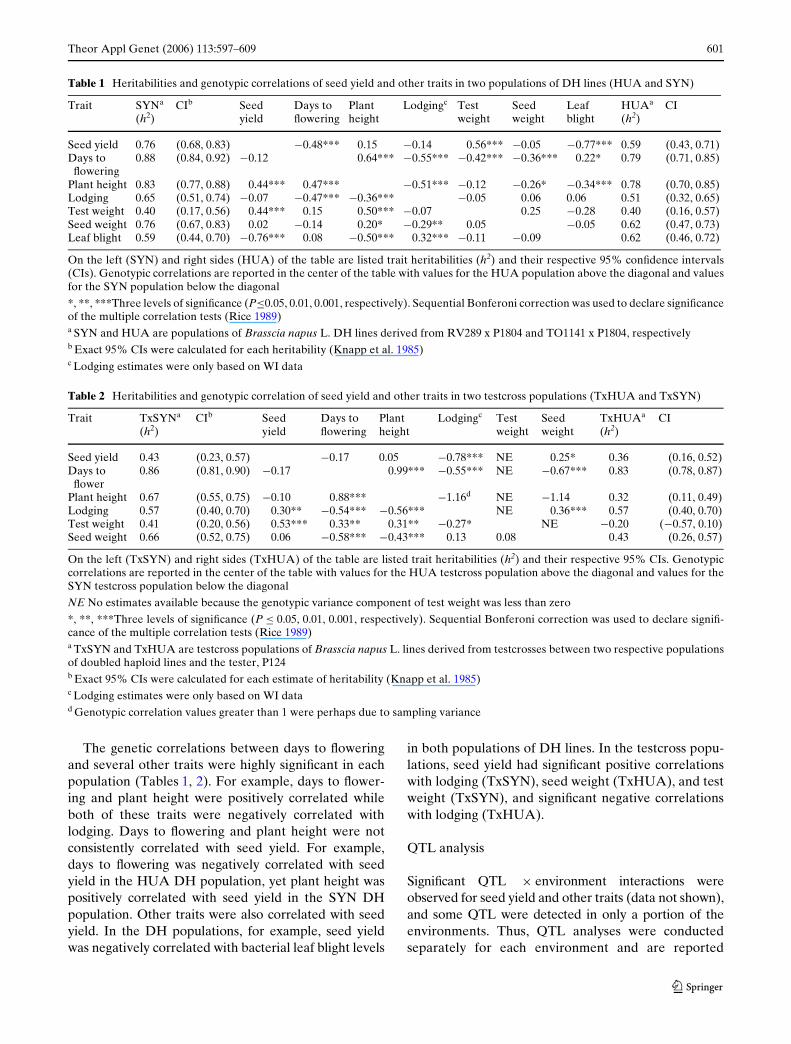
in both populations of DH lines. In the testcross popu-lations, seed yield had signiWcant positive correlationswith lodging (TxSYN), seed weight (TxHUA), and testweight (TxSYN), and signiWcant negative correlationswith lodging (TxHUA).
QTL analysis
SigniWcant QTL £ environment interactions wereobserved for seed yield and other traits (data not shown),and some QTL were detected in only a portion of theenvironments. Thus, QTL analyses were conductedseparately for each environment and are reported
Table 1 Heritabilities and genotypic correlations of seed yield and other traits in two populations of DH lines (HUA and SYN)
On the left (SYN) and right sides (HUA) of the table are listed trait heritabilities (h2) and their respective 95% conWdence intervals(CIs). Genotypic correlations are reported in the center of the table with values for the HUA population above the diagonal and valuesfor the SYN population below the diagonal
*, **, ***Three levels of signiWcance (P·0.05, 0.01, 0.001, respectively). Sequential Bonferoni correction was used to declare signiWcanceof the multiple correlation tests (Rice 1989)a SYN and HUA are populations of Brasscia napus L. DH lines derived from RV289 x P1804 and TO1141 x P1804, respectivelyb Exact 95% CIs were calculated for each heritability (Knapp et al. 1985)c Lodging estimates were only based on WI data
Trait SYNa (h2)
CIb Seedyield
Days to Xowering
Plantheight
Lodgingc Test weight
Seed weight
Leaf blight
HUAa (h2)
CI
Seed yield 0.76 (0.68, 0.83) ¡0.48*** 0.15 ¡0.14 0.56*** ¡0.05 ¡0.77*** 0.59 (0.43, 0.71)Days to Xowering
0.88 (0.84, 0.92) ¡0.12 0.64*** ¡0.55*** ¡0.42*** ¡0.36*** 0.22* 0.79 (0.71, 0.85)
Plant height 0.83 (0.77, 0.88) 0.44*** 0.47*** ¡0.51*** ¡0.12 ¡0.26* ¡0.34*** 0.78 (0.70, 0.85)Lodging 0.65 (0.51, 0.74) ¡0.07 ¡0.47*** ¡0.36*** ¡0.05 0.06 0.06 0.51 (0.32, 0.65)Test weight 0.40 (0.17, 0.56) 0.44*** 0.15 0.50*** ¡0.07 0.25 ¡0.28 0.40 (0.16, 0.57)Seed weight 0.76 (0.67, 0.83) 0.02 ¡0.14 0.20* ¡0.29** 0.05 ¡0.05 0.62 (0.47, 0.73)Leaf blight 0.59 (0.44, 0.70) ¡0.76*** 0.08 ¡0.50*** 0.32*** ¡0.11 ¡0.09 0.62 (0.46, 0.72)
Table 2 Heritabilities and genotypic correlation of seed yield and other traits in two testcross populations (TxHUA and TxSYN)
On the left (TxSYN) and right sides (TxHUA) of the table are listed trait heritabilities (h2) and their respective 95% CIs. Genotypiccorrelations are reported in the center of the table with values for the HUA testcross population above the diagonal and values for theSYN testcross population below the diagonal
NE No estimates available because the genotypic variance component of test weight was less than zero
*, **, ***Three levels of signiWcance (P · 0.05, 0.01, 0.001, respectively). Sequential Bonferoni correction was used to declare signiW-cance of the multiple correlation tests (Rice 1989)a TxSYN and TxHUA are testcross populations of Brasscia napus L. lines derived from testcrosses between two respective populationsof doubled haploid lines and the tester, P124b Exact 95% CIs were calculated for each estimate of heritability (Knapp et al. 1985)c Lodging estimates were only based on WI datad Genotypic correlation values greater than 1 were perhaps due to sampling variance
Trait TxSYNa (h2)
CIb Seedyield
Days toXowering
Plant height
Lodgingc Test weight
Seed weight
TxHUAa
(h2)CI
Seed yield 0.43 (0.23, 0.57) ¡0.17 0.05 ¡0.78*** NE 0.25* 0.36 (0.16, 0.52)Days to Xower
0.86 (0.81, 0.90) ¡0.17 0.99*** ¡0.55*** NE ¡0.67*** 0.83 (0.78, 0.87)
Plant height 0.67 (0.55, 0.75) ¡0.10 0.88*** ¡1.16d NE ¡1.14 0.32 (0.11, 0.49)Lodging 0.57 (0.40, 0.70) 0.30** ¡0.54*** ¡0.56*** NE 0.36*** 0.57 (0.40, 0.70)Test weight 0.41 (0.20, 0.56) 0.53*** 0.33** 0.31** ¡0.27* NE ¡0.20 (¡0.57, 0.10)Seed weight 0.66 (0.52, 0.75) 0.06 ¡0.58*** ¡0.43*** 0.13 0.08 0.43 (0.26, 0.57)
123
602 Theor Appl Genet (2006) 113:597–609
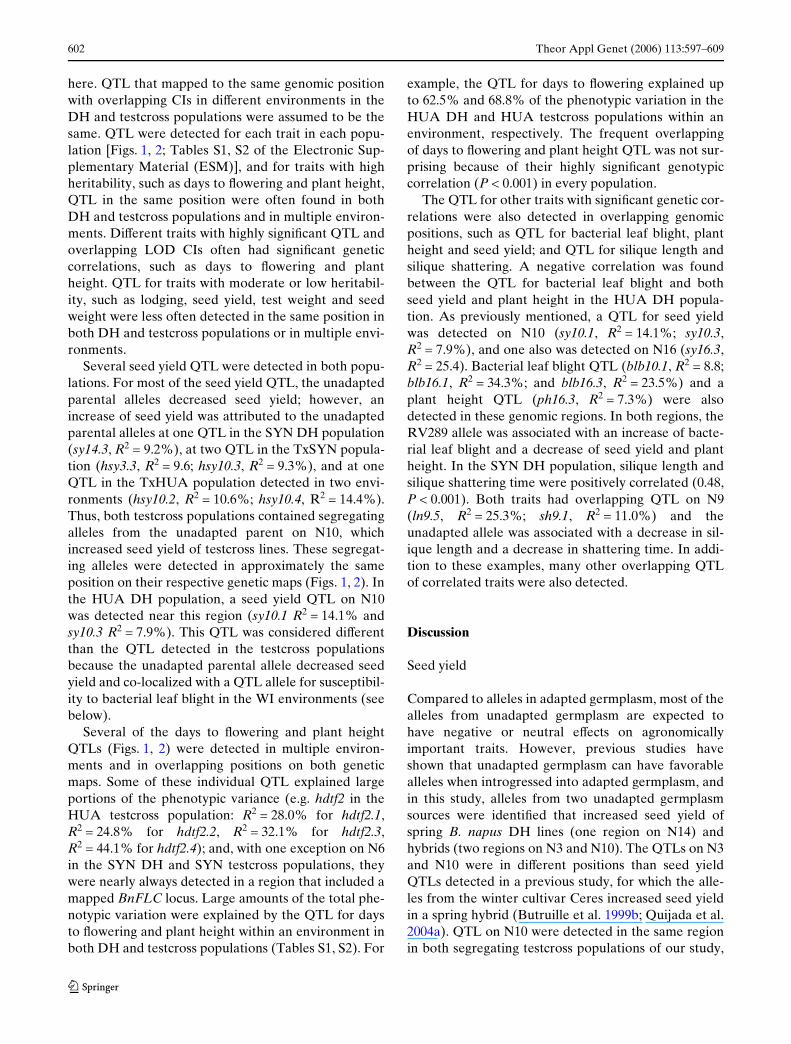
here. QTL that mapped to the same genomic positionwith overlapping CIs in diVerent environments in theDH and testcross populations were assumed to be thesame. QTL were detected for each trait in each popu-lation [Figs. 1, 2; Tables S1, S2 of the Electronic Sup-plementary Material (ESM)], and for traits with highheritability, such as days to Xowering and plant height,QTL in the same position were often found in bothDH and testcross populations and in multiple environ-ments. DiVerent traits with highly signiWcant QTL andoverlapping LOD CIs often had signiWcant geneticcorrelations, such as days to Xowering and plantheight. QTL for traits with moderate or low heritabil-ity, such as lodging, seed yield, test weight and seedweight were less often detected in the same position inboth DH and testcross populations or in multiple envi-ronments.
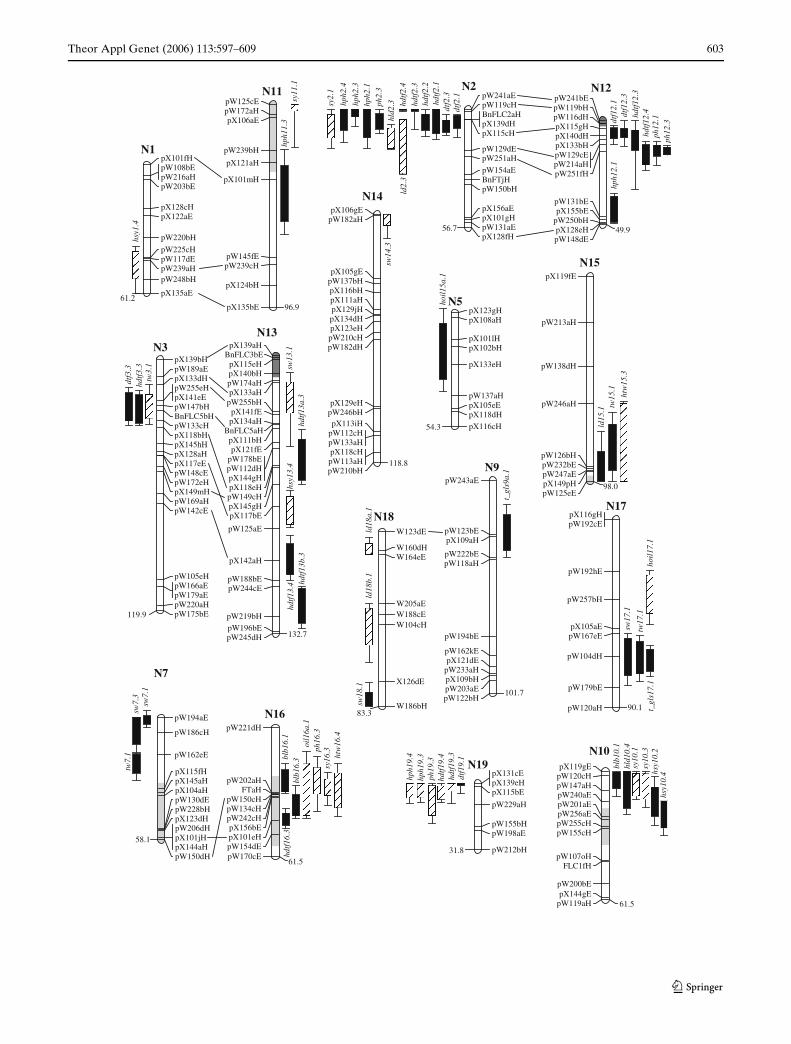
Several seed yield QTL were detected in both popu-lations. For most of the seed yield QTL, the unadaptedparental alleles decreased seed yield; however, anincrease of seed yield was attributed to the unadaptedparental alleles at one QTL in the SYN DH population(sy14.3, R2 = 9.2%), at two QTL in the TxSYN popula-tion (hsy3.3, R2 = 9.6; hsy10.3, R2 = 9.3%), and at oneQTL in the TxHUA population detected in two envi-ronments (hsy10.2, R2 = 10.6%; hsy10.4, R2 = 14.4%).Thus, both testcross populations contained segregatingalleles from the unadapted parent on N10, whichincreased seed yield of testcross lines. These segregat-ing alleles were detected in approximately the sameposition on their respective genetic maps (Figs. 1, 2). Inthe HUA DH population, a seed yield QTL on N10was detected near this region (sy10.1 R2 = 14.1% andsy10.3 R2 = 7.9%). This QTL was considered diVerentthan the QTL detected in the testcross populationsbecause the unadapted parental allele decreased seedyield and co-localized with a QTL allele for susceptibil-ity to bacterial leaf blight in the WI environments (seebelow).
Several of the days to Xowering and plant heightQTLs (Figs. 1, 2) were detected in multiple environ-ments and in overlapping positions on both geneticmaps. Some of these individual QTL explained largeportions of the phenotypic variance (e.g. hdtf2 in theHUA testcross population: R2 = 28.0% for hdtf2.1,R2 = 24.8% for hdtf2.2, R2 = 32.1% for hdtf2.3,R2 = 44.1% for hdtf2.4); and, with one exception on N6in the SYN DH and SYN testcross populations, theywere nearly always detected in a region that included amapped BnFLC locus. Large amounts of the total phe-notypic variation were explained by the QTL for daysto Xowering and plant height within an environment inboth DH and testcross populations (Tables S1, S2). For
example, the QTL for days to Xowering explained upto 62.5% and 68.8% of the phenotypic variation in theHUA DH and HUA testcross populations within anenvironment, respectively. The frequent overlappingof days to Xowering and plant height QTL was not sur-prising because of their highly signiWcant genotypiccorrelation (P < 0.001) in every population.
The QTL for other traits with signiWcant genetic cor-relations were also detected in overlapping genomicpositions, such as QTL for bacterial leaf blight, plantheight and seed yield; and QTL for silique length andsilique shattering. A negative correlation was foundbetween the QTL for bacterial leaf blight and bothseed yield and plant height in the HUA DH popula-tion. As previously mentioned, a QTL for seed yieldwas detected on N10 (sy10.1, R2 = 14.1%; sy10.3,R2 = 7.9%), and one also was detected on N16 (sy16.3,R2 = 25.4). Bacterial leaf blight QTL (blb10.1, R2 = 8.8;blb16.1, R2 = 34.3%; and blb16.3, R2 = 23.5%) and aplant height QTL (ph16.3, R2 = 7.3%) were alsodetected in these genomic regions. In both regions, theRV289 allele was associated with an increase of bacte-rial leaf blight and a decrease of seed yield and plantheight. In the SYN DH population, silique length andsilique shattering time were positively correlated (0.48,P < 0.001). Both traits had overlapping QTL on N9(ln9.5, R2 = 25.3%; sh9.1, R2 = 11.0%) and theunadapted allele was associated with a decrease in sil-ique length and a decrease in shattering time. In addi-tion to these examples, many other overlapping QTLof correlated traits were also detected.
Discussion
Seed yield
Compared to alleles in adapted germplasm, most of thealleles from unadapted germplasm are expected tohave negative or neutral eVects on agronomicallyimportant traits. However, previous studies haveshown that unadapted germplasm can have favorablealleles when introgressed into adapted germplasm, andin this study, alleles from two unadapted germplasmsources were identiWed that increased seed yield ofspring B. napus DH lines (one region on N14) andhybrids (two regions on N3 and N10). The QTLs on N3and N10 were in diVerent positions than seed yieldQTLs detected in a previous study, for which the alle-les from the winter cultivar Ceres increased seed yieldin a spring hybrid (Butruille et al. 1999b; Quijada et al.2004a). QTL on N10 were detected in the same regionin both segregating testcross populations of our study,
123
Theor Appl Genet (2006) 113:597–609 603
pW125cEpW172aHpX106aE
pW239bH
pX121aH
pX101mH
pW145fEpW239cH
pX124bH
pX135bE
hph1
1.3
sy11
.1
N11pW241bEpW119bHpW116dHpX115gHpX140dHpX133bHpW129cEpW214aHpW251fH
pW131bEpX155bE
pW250bHpX128eHpW148dE
N12
pX139aHBnFLC3bE
pX115eHpX140bHpW174aHpX133aH
pW255bHpX141fEpX134aH
BnFLC5aHpX111bHpX121fE
pW178bEpW112dHpX144gHpX118eHpW149cHpX145gHpX117bE
pW125aE
pX142aH
pW188bEpW244cE
pW219bH
pW196bEpW245dH
hdtf
13a.
3hd
tf13
b.3
hdtf
13.4
sw13
.1hs
y13.
4
N13
pX106gEpW182aH
pX105gEpW137bHpX116bHpX111aHpX129jHpX134dHpX123eHpW210cHpW182dH
pX129eHpW246bHpX113iH
pW112cHpW133aHpX118cHpW113aHpW210bH
sw14
.3
N14
pX119fE
pW213aH
pW138dH
pW246aH
pW126bHpW232bEpW247aEpX149pHpW125eE
ld15
.1tw
15.1
htw
15.3
N15
pW221dH
pW202aHFTaH
pW150cHpW134cHpW242cHpX156bEpX101eHpW154dEpW170cE
blb1
6.1
blb1
6.3
oil1
6a.1
ph16
.3sy
16.3
hdtf
16.3
htw
16.4
N16
pX101fHpW108bEpW216aHpW203bE
pX128cHpX122aE
pW220bH
pW225cHpW117dEpW239aHpW248bH
pX135aE61.2
96.9
hsy1
.4
N1
49.9
pW241aEpW119cHBnFLC2aHpX139dHpX115cH
pW129dEpW251aH
pW154aEBnFTjHpW150bH
pX156aEpX101gHpW131aEpX128fH
56.7
dtf2
.1dt
f2.3
hdtf
2.1
hdtf
2.2
hdtf
2.3
hdtf
2.4
ld2.
3
hld2
.3ph2.
3
hph2
.1hp
h2.3
hph2
.4
sy2.
1 N2
pX139bHpW189aEpX133dHpW255eHpX141eEpW147bHBnFLC5bHpW133cHpX118bHpX145hHpX128aHpX117eEpW148cEpW172eHpX149mHpW169aHpW142cE
pW105eHpW166aEpW179aEpW220aHpW175bE119.9
132.7
dtf3
.3hd
tf3.
3tw
3.1
N3
pX116gHpW192cE
pW192hE
pW257bH
pX105aEpW167eE
pW104dH
pW179bE
pW120aH
sw17
.1
tw17
.1t_
gls1
7.1
hoil
17.1
N17
dtf1
2.1
dtf1
2.3
hdtf
12.3
hdtf
12.4
ph12
.1ph
12.3
hph1
2.1
pX123gHpX108aH
pX101lHpX102bH
pX133eH
pW137aHpX105eEpX118dH
pX116cH54.3
hoil
15a.
1
N5
pW194aE
pW186cH
pW162eE
pX115fHpX145aHpX104aHpW130dEpW228bHpX123dHpW206dHpX101jHpX144aHpW150dH
58.1
sw7.
1sw
7.3
tw7.
1
N7
pW243aE
pW123bEpX109aH
pW222bEpW118aH
pW194bE
pW162kEpX121dE
pW233aHpX109bHpW203aEpW122bH
101.7
t_gl
s9a.
1N9
W123dE
W160dHW164eE
W205aEW188cEW104cH
X126dE
W186bH83.3
ld18
a.1
ld18
b.1
sw18
.1
N18
pX119gEpW120cHpW147aHpW240aEpW201aEpW256aEpW255cHpW155cH
pW107oHFLC1fH
pW200bEpX144gE
pW119aH 61.5
blb1
0.1
hld1
0.4
sy10
.1sy
10.3
hsy1
0.2
hsy1
0.4
N10
pX131cEpX139eHpX115bE
pW229aH
pW155bHpW198aE
pW212bH31.8
dtf1
9.1
hdtf
19.3
hdtf
19.4
ph19
.3hp
h19.
3hp
h19.
4
N19
118.8
98.0
90.1
61.5
123
604 Theor Appl Genet (2006) 113:597–609
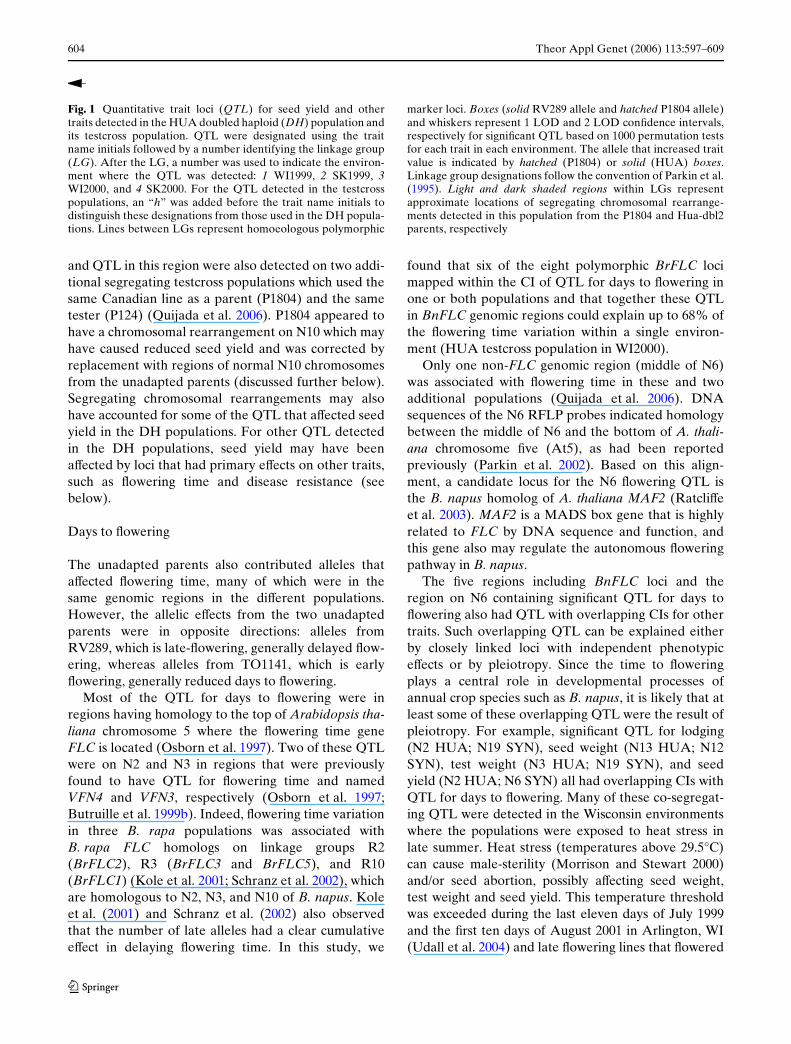
and QTL in this region were also detected on two addi-tional segregating testcross populations which used thesame Canadian line as a parent (P1804) and the sametester (P124) (Quijada et al. 2006). P1804 appeared tohave a chromosomal rearrangement on N10 which mayhave caused reduced seed yield and was corrected byreplacement with regions of normal N10 chromosomesfrom the unadapted parents (discussed further below).Segregating chromosomal rearrangements may alsohave accounted for some of the QTL that aVected seedyield in the DH populations. For other QTL detectedin the DH populations, seed yield may have beenaVected by loci that had primary eVects on other traits,such as Xowering time and disease resistance (seebelow).
Days to Xowering
The unadapted parents also contributed alleles thataVected Xowering time, many of which were in thesame genomic regions in the diVerent populations.However, the allelic eVects from the two unadaptedparents were in opposite directions: alleles fromRV289, which is late-Xowering, generally delayed Xow-ering, whereas alleles from TO1141, which is earlyXowering, generally reduced days to Xowering.
Most of the QTL for days to Xowering were inregions having homology to the top of Arabidopsis tha-liana chromosome 5 where the Xowering time geneFLC is located (Osborn et al. 1997). Two of these QTLwere on N2 and N3 in regions that were previouslyfound to have QTL for Xowering time and namedVFN4 and VFN3, respectively (Osborn et al. 1997;Butruille et al. 1999b). Indeed, Xowering time variationin three B. rapa populations was associated withB. rapa FLC homologs on linkage groups R2(BrFLC2), R3 (BrFLC3 and BrFLC5), and R10(BrFLC1) (Kole et al. 2001; Schranz et al. 2002), whichare homologous to N2, N3, and N10 of B. napus. Koleet al. (2001) and Schranz et al. (2002) also observedthat the number of late alleles had a clear cumulativeeVect in delaying Xowering time. In this study, we
found that six of the eight polymorphic BrFLC locimapped within the CI of QTL for days to Xowering inone or both populations and that together these QTLin BnFLC genomic regions could explain up to 68% ofthe Xowering time variation within a single environ-ment (HUA testcross population in WI2000).
Only one non-FLC genomic region (middle of N6)was associated with Xowering time in these and twoadditional populations (Quijada et al. 2006). DNAsequences of the N6 RFLP probes indicated homologybetween the middle of N6 and the bottom of A. thali-ana chromosome Wve (At5), as had been reportedpreviously (Parkin et al. 2002). Based on this align-ment, a candidate locus for the N6 Xowering QTL isthe B. napus homolog of A. thaliana MAF2 (RatcliVeet al. 2003). MAF2 is a MADS box gene that is highlyrelated to FLC by DNA sequence and function, andthis gene also may regulate the autonomous Xoweringpathway in B. napus.
The Wve regions including BnFLC loci and theregion on N6 containing signiWcant QTL for days toXowering also had QTL with overlapping CIs for othertraits. Such overlapping QTL can be explained eitherby closely linked loci with independent phenotypiceVects or by pleiotropy. Since the time to Xoweringplays a central role in developmental processes ofannual crop species such as B. napus, it is likely that atleast some of these overlapping QTL were the result ofpleiotropy. For example, signiWcant QTL for lodging(N2 HUA; N19 SYN), seed weight (N13 HUA; N12SYN), test weight (N3 HUA; N19 SYN), and seedyield (N2 HUA; N6 SYN) all had overlapping CIs withQTL for days to Xowering. Many of these co-segregat-ing QTL were detected in the Wisconsin environmentswhere the populations were exposed to heat stress inlate summer. Heat stress (temperatures above 29.5°C)can cause male-sterility (Morrison and Stewart 2000)and/or seed abortion, possibly aVecting seed weight,test weight and seed yield. This temperature thresholdwas exceeded during the last eleven days of July 1999and the Wrst ten days of August 2001 in Arlington, WI(Udall et al. 2004) and late Xowering lines that Xowered
Fig. 1 Quantitative trait loci (QTL) for seed yield and othertraits detected in the HUA doubled haploid (DH) population andits testcross population. QTL were designated using the traitname initials followed by a number identifying the linkage group(LG). After the LG, a number was used to indicate the environ-ment where the QTL was detected: 1 WI1999, 2 SK1999, 3WI2000, and 4 SK2000. For the QTL detected in the testcrosspopulations, an “h” was added before the trait name initials todistinguish these designations from those used in the DH popula-tions. Lines between LGs represent homoeologous polymorphic
marker loci. Boxes (solid RV289 allele and hatched P1804 allele)and whiskers represent 1 LOD and 2 LOD conWdence intervals,respectively for signiWcant QTL based on 1000 permutation testsfor each trait in each environment. The allele that increased traitvalue is indicated by hatched (P1804) or solid (HUA) boxes.Linkage group designations follow the convention of Parkin et al.(1995). Light and dark shaded regions within LGs representapproximate locations of segregating chromosomal rearrange-ments detected in this population from the P1804 and Hua-dbl2parents, respectively
123
Theor Appl Genet (2006) 113:597–609 605
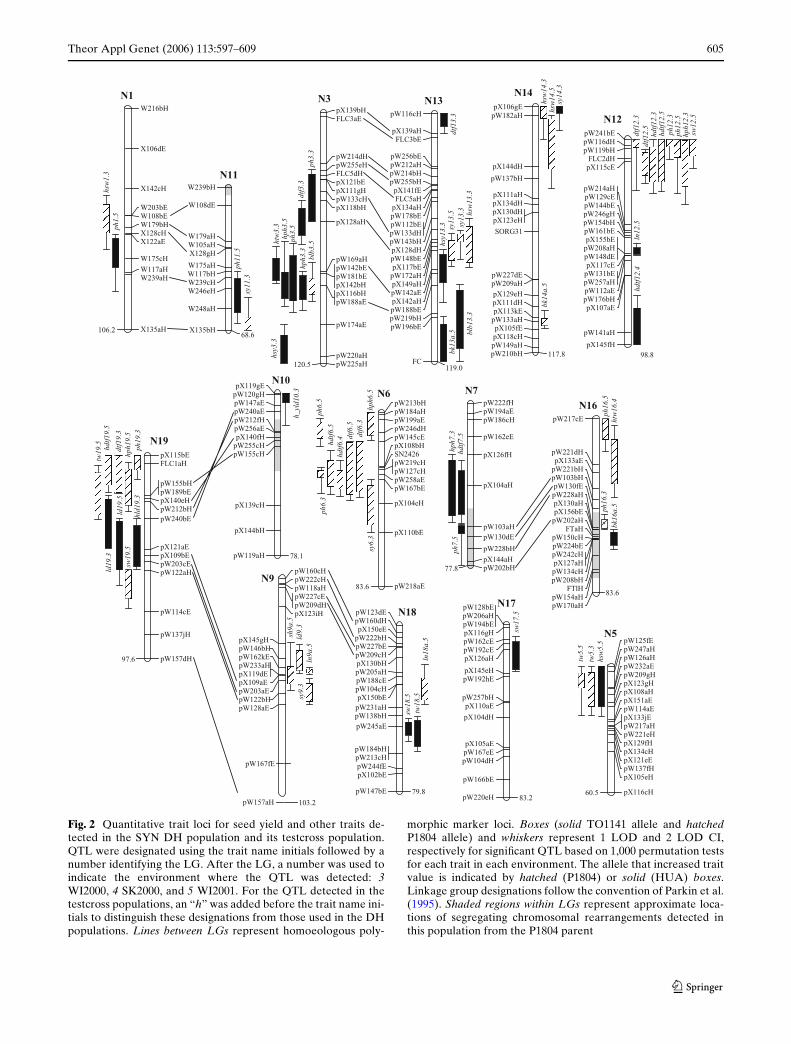
Fig. 2 Quantitative trait loci for seed yield and other traits de-tected in the SYN DH population and its testcross population.QTL were designated using the trait name initials followed by anumber identifying the LG. After the LG, a number was used toindicate the environment where the QTL was detected: 3WI2000, 4 SK2000, and 5 WI2001. For the QTL detected in thetestcross populations, an “h” was added before the trait name ini-tials to distinguish these designations from those used in the DHpopulations. Lines between LGs represent homoeologous poly-
morphic marker loci. Boxes (solid TO1141 allele and hatchedP1804 allele) and whiskers represent 1 LOD and 2 LOD CI,respectively for signiWcant QTL based on 1,000 permutation testsfor each trait in each environment. The allele that increased traitvalue is indicated by hatched (P1804) or solid (HUA) boxes.Linkage group designations follow the convention of Parkin et al.(1995). Shaded regions within LGs represent approximate loca-tions of segregating chromosomal rearrangements detected inthis population from the P1804 parent
W216bH
X106dE
X142cH
W203bEW108bEW179bHX128cHX122aE
W175cH
W117aHW239aH
X135aH106.2
ph1.
5hs
w1.
3N1
pX139bHFLC3aE
pW214dHpW255eHFLC5dHpX121bEpX111gHpW133cHpX118bH
pX128aH
pW169aHpW142bEpW181bEpX142bHpX116bHpW188aE
pW174aE
pW220aHpW225aH120.5
blb3
.5dt
f3.3
ph3.
3
ph3.
5hp
h3.3
hph3
.5ht
w3.
3hs
y3.3
N3
pW125fEpW247aHpW126aHpW232aEpW209gHpX123gHpX108aHpX151aEpW114aEpX133jEpW217aHpW221eHpX129fHpX134cHpX121eEpW137fHpX105eH
pX116cH60.5
hsw
5.5
tw5.
3
tw5.
5
N5
pW213bHpW184aHpW199aEpW246dHpW145cEpX108bHSN2426pW219cHpW127cHpW258aEpW167bE
pX104eH
pX110bE
pW218aE83.6
dtf6
.3dt
f6.5
hdtf6
.4hdtf6
.5ph
6.3
ph6.
5
hph6
.5sy
6.3
N6pW222fHpW194aEpW186cH
pW162eE
pX126fH
pX104aH
pW103aHpW130dE
pW228bH
pX144aHpW202bH77.8
hdtf7
.5ph
7.5
hph7
.3
N7
pW160cHpW222cHpW118aHpW227cEpW209dHpX123iH
pX145gHpW146bHpW162kEpW233aHpX119dEpX109aEpW203aEpW122bHpW128aE
pW167fE
pW157aH 103.2
ln9a
.5
sh9a
.5ld
9.3
sy9.
3
N9
pX119gEpW120gHpW147aEpW240aEpW212fHpW256aEpX140fH
pW255cHpW155cH
pX139cH
pX144bH
pW119aH 78.1
h_yl
d10.
3
N10
W239bH
W108dE
W179aHW105aHX128gH
W175aHW117bHW239cHW246eH
W248aH
X135bH68.6
ph11
.5sy
11.3
N11
pW241bEpW116dHpW119bH
FLC2dHpX115cE
pW214aHpW129cEpW144bEpW246gHpW154bHpW161bEpX155bE
pW208aHpW148dEpX117cE
pW131bEpW257aHpW112aEpW176bHpX107aE
pW141aH
pX145fH98.8
hdtf1
2.4
ln12
.5dt
f12.
3dt
f12.
5hd
tf12.
3hd
tf12.
5ph
12.3
ph12
.5hp
h12.
3sw
12.5N12
pW116cH
pX139aHFLC3bE
pW256bEpW212aHpW214bHpW255bH
pX141fEFLC5aH
pX134aHpW178bEpW112bEpW133dHpW143bHpX128dHpW148bEpX117bE
pW172aHpX149aHpW142aEpX142aHpW188bEpW219bHpW196bE
FC119.0
blb1
3.3
bk13
a.5
dtf1
3.3
hsw
13.3
sy13
.3sy
13.5
hsy1
3.3
N13pX106gE
pW182aH
pX144dH
pW137bH
pX111aHpX134dHpX130dHpX123eH
SORG31
pW227dEpW209aHpX129eHpX111dHpX113kE
pW133aHpX105fEpX118cHpW149aHpW210bH 117.8
hsw
14.3
hsw
14.5
sy14
.3
bk14
a.5
N14
pW217cE
pW221dHpX133aE
pW221bHpW103bHpW130fEpW228aHpX130aHpX156bE
pW202aHFTaH
pW150cHpW224bEpW242cHpX127aHpW134cHpW208bH
FTlHpW154aHpW170aH
83.6
ph16
.3ph
16.5
bk16
a.5
htw
16.4N16
pW128bEpW206aHpW194bEpX116gHpW162cEpW192cEpX126aH
pX145eHpW192hE
pW257bHpX110aE
pX104dH
pX105aEpW167eEpW104dH
pW166bE
pW220eH 83.2
sw17
.5
N17pW123dEpW160dHpX150eE
pW222bHpW227bEpW209cHpX130bHpW205aHpW188cEpW104cHpX150bE
pW231aHpW138bHpW245aE
pW184bHpW213cHpW244fEpX102bE
pW147bE 79.8
sw18
.5tw
18.5
ln18
a.5
N18
pX115bEFLC1aH
pW155bHpW189bEpX140eHpW212bHpW240bE
pX121aEpX109bEpW203cEpW122aH
pW114cE
pW137jH
pW157dH97.6
dtf1
9.3
hdtf1
9.5
ld19
.3
ld19
.5
hld1
9.3
ph19
.3hp
h19.
5sw
19.5
tw19
.5 N19
123
606 Theor Appl Genet (2006) 113:597–609
during or close to these times may have had reducedseed yield due to the eVects of heat on fertility.
Silique characters
Although the resynthesized and P1804 parents hadsimilar levels of shattering resistance, this traitappeared to segregate in the SYN population inWI2000 and it was measured in WI2001. A QTL for sil-ique shattering (sh9.5) was detected on N9 (Table S1),and the allele(s) from TO1141 decreased the numberof seconds required for the siliques to rupture (i.e.,increased ease of shattering). This region from TO1141also reduced silique length (ln9.5 in Table S1); andthus, the increased ease of shattering may have been apleiotropic eVect of an allele that reduced siliquelength. TO1141 alleles in this region also had a nega-tive eVect on seed yield in one environment (sy9.3 inTable S1).
Bacterial leaf blight
Bacterial leaf blight occurred only in the Wisconsinenvironments and only aVected the DH populations.QTL for this disease were found in both DH popula-tions. In the SYN population, two QTL for bacterialleaf blight disease were detected in homoeologousregions of N3 and N13. Homologs of A. thaliana bacte-rial disease resistance gene (RPM1) were previouslyreported in these regions in other B. napus lines, butthey were determined to be non-functional (Grantet al. 1998; Sillito et al. 2000). In this study, two homo-eologous loci on N3 and N13 appeared to have playeda role in disease response, although the eVects ofunadapted alleles were in opposite directions (less dis-ease with the TO1141 allele than the P1804 allele onN3; more disease with the TO1141 allele than theP1804 allele on N13). As was the case with days toXowering, QTL for other traits had overlapping CIswith those for bacterial leaf blight. In the SYN popula-tions, for example, plant height and test weight QTLhad overlapping CIs with bacterial leaf blight QTL,and lines with the TO1141 allele at blb3.5 generallyhad less symptoms of the bacterial disease, greaterplant height, and greater test weights than lines withthe alternative allele (P1804).
DiVerent QTL for bacterial leaf blight were detectedin the HUA DH population (blb10 and blb16). Theblb10 QTL had a relatively small eVect and overlappedwith a seed yield QTL (sy10). DH lines with the RV289allele in this region generally had more disease and lessseed yield. Thus, the sy10 QTL for DH seed yield mayhave been due to the eVects of a RV289 allele conferring
disease susceptibility, and was probably diVerent thanthe N10 QTL for seed yield detected in the testcrosspopulation (see below). QTL for bacterial leaf blightand seed yield were also detected in the same genomicregion on N10 in two other DH mapping populationsgrown in the same Wisconsin environments with simi-lar interpretations (Quijada et al. 2006). The QTL forbacterial leaf blight with the largest eVects weredetected on N16 (blb16.1 R2 = 34.3%, and blb16.3R2 = 23.5%) in the same position as QTL for plantheight (ph16.3), seed yield (sy16.3), and test weight. Asearch for candidate genes of these QTL in the regionof the A. thaliana genome with homology to N16 didnot reveal any likely candidates. As suggested above,clustering of these QTL may have been due to thepleiotropic eVects of a segregating allele for suscepti-bility from RV289. Alternatively, the clustering ofQTL on N16 (in both populations) could have beendue to the segregation of a chromosomal rearrange-ment found in the parent P1804 (see below; Udall et al.2005). Clusters of QTL, for bacterial leaf blight, days toXowering, and seed yield also were found within chro-mosomal rearrangements in other mapping popula-tions (Quijada et al. 2006).
EVects of chromosomal rearrangements
The presence of chromosomal rearrangements werepreviously reported for the two populations used inthis study (Figs. 1, 2; Udall et al. 2005), and for addi-tional mapping populations developed from geneticallydiverse parents (Udall et al. 2005; Sharpe et al. 1995;Parkin et al. 1995). Nearly all of the observed rear-rangements can be explained by infrequent recombina-tion between pairs of homoeologous chromosomesresulting in homoeologous reciprocal (HRT) andhomoeologous non-reciprocal transpositions (HNRT)between the two sub-genomes of B. napus. Udall et al.(2005) provided a more detailed explanation of HRTand HNRT than described here, including method ofdetection. Homoeologous recombination events thatoccurred during F1 meiosis (i.e., de novo) resulted intranspositions only in the derived line. However, diVer-ent transpositions existed in the natural B. napus linesused as mapping parents (i.e., P1804 and RV289),which segregated in the mapping populations, and insome cases phenotypic eVects co-segregated with therearrangements.
Two parents of these experimental populations,P1804 and RV289, contained chromosomal transposi-tions which segregated among the DH lines, includingHNRTs on N12.N2(T) and N13.N3(T) in RV289 andon N11.N1(T), N12.N2(T), N15.N5(T) and N10.N19(T)
123
Theor Appl Genet (2006) 113:597–609 607
in P1804, and an HRT on N7.N16(T) and N16.N7(T) inP1804 (Figs. 1, 2; Udall et al. 2005). Clusters of QTL forvarious traits were found in or near the N10.N19(T),N12.N2(T), N15.N5(T), and N16.N7(T) HNRTs in theHUA map and the N16.N7(T) HRT in the SYN map.While pleiotropic eVects of single genes is one possibleexplanation for QTL clustering (see above), large allelicdiVerences of several linked loci between the normalchromosome (e.g. N2, B. rapa homolog) and the chro-mosomal transposition [e.g. N2.N12(T), B oleraceahomolog] could also account for these quantitativediVerences among segregating DH or their testcrossprogenies.
Several seed yield QTL were associated with chro-mosomal rearrangements. The QTL detected onN16.N7(T) in the HUA DH population mapped inapproximately the same position as QTL in two otherDH and testcross populations (Quijada et al. 2006). Aseed yield eVect was also associated with segregation ofa N7–N16 HRT in four other mapping populations(Osborn et al. 2003). These authors observed reducedseed yield in lines with the non-parental conWgurationsof the HRT (equivalent to lines with an HNRT), andthey suggested this was due to an increase in interge-nomic homozygosity. In our study, the HUA popula-tion was Wxed for the N7.N16 (T) chromosome fromP1804 due to selection for herbicide resistance genenear or in the rearrangement. Lines with the unrear-ranged N16 from RV289 had lower seed yield, perhapsdue to increased intergenomic homozygosity from thepresence of N7.N16 (T) and N16.
For the seed yield QTL on N10, alleles from theunadapted parents increased seed yield in the HUA andSYN testcross populations, and in the testcross popula-tions reported by Quijada et al. (2006). All four of thesepopulations shared a common parent, P1804, which hada HNRT on N10 [a segment of N19 (B. oleracea homo-log) on the B. rapa homolog N10] and the testcross lineswere all produced using a common tester P124, whosechromosomal conWguration is undetermined. The N10chromosomes from RV289 and TO1141 were normal;thus, the higher testcross seed yields associated withN10 allele(s) from these unadapted parents may havebeen due to the eVects of normal chromosomal regionson increasing intergenomic heterozygosity. The fact thatalleles in this region from the unadapted parentsdecreased seed yield in the DH populations could bedue to the impact of linkage drag from alleles for dis-ease susceptibility located in this same genomic region.The eVect of this linkage drag appears to be covered upin the testcross populations due to a resistance allele inthe tester, allowing us to see the positive eVect of thisregion from the unadapted germplasms.
Additional studies are needed to validate the eVectsof these QTL alleles in this genetic background, and todetermine their eVects in other genetic backgrounds.These studies might also resolve questions of linkagevs. pleiotropy, and they could provide additional infor-mation on the relationship of the QTL to chromosomalrearrangements. Similar types of studies with othergermplasm might provide evidence that chromosomalrearrangements have broad eVects on allelic diversityin oilseed B. napus. The results could be used toimprove hybrids by selecting for recombination eventsthat correct deleterious rearrangements.
Acknowledgements We thank researchers at Bayer Crop-Science for their assistance, particularly Tom Schuler, StewartBrandt, and Hieronim Polewicz for seed production and Weld tri-als, and Debbie Doell for microspore culture and plantlet devel-opment. We also thank Robert Vogelzang for his technicalassistance. JAU was funded in part by UW Pioneer Plant Breed-ing Fellowship 1999–2000 and PAQ was funded by a scholarshipfrom Consejo de Desarrollo CientíWco y Humanístico, Universi-dad Central de Venezuela, Government of Venezuela. Addi-tional funding was provided by North Central BiotechnicalInitiative and USDA-NRI grant # 98–353006–6286 to T.C.O.
References
Akbar MA (1989) Resynthesis of Brassica napus aiming for im-proved earliness and carried out by diVerent approaches.Hereditas 111:239–246
Basten CJ, Weir BS, Zeng ZB (2002) QTL cartographer, version1.16. Department of Statistics. North Carolina State Univer-sity, Raleigh
Becker HC, Engqvist GM, Karlsson B (1995) Comparison ofrapeseed cultivars and resynthesized lines based on allozymeand RFLP markers. Theor Appl Genet 91:62–67
Bernacchi D, Tanksley S (1998) Advanced backcross QTL analy-sis of tomato. I. IdentiWcation of QTLs for traits of agro-nomic importance from Lycopersicon hirsutum. Theor ApplGenet 97:381–397
Bouchez A, Hospital F, Causse M, Gallais A, Charcosset A(2002) Marker-assisted introgression of favorable alleles atquantitative trait loci between maize elite lines. Genetics162:1945–1959
Bradshaw JE, Gemmell DJ, Wilson RN (1997) Transfer of resis-tance to clubroot (Plasmodiophora brassicae) to swedes(Brassica napus L var napobrassica Peterm) from B. rapa.Ann Appl Biol 130:337–348
Brondani C, Rangel PHN, Brondani RPV, Ferreira ME (2002)QTL mapping and introgression of yield-related traits fromOryza glumaepatula to cultivated rice (Oryza sativa) usingmicrosatellite markers. Theor Appl Genet 104:1192–1203
Butruille DV, Guries RP, Osborn TC (1999a) Increasing yield ofspring oilseed rape hybrids through introgression of wintergermplasm. Crop Sci 39:1491–1496
Butruille DV, Guries RP, Osborn TC (1999b) Linkage analysis ofmolecular markers and quantitative trait loci in populationsof inbred backcross lines of Brassica napus L. Genetics153:949–964
Chen BY, Heneen WK, Jönsson R (1988) Resynthesis ofBrassica napus L. through interspeciWc hybridization
123
608 Theor Appl Genet (2006) 113:597–609
between B. alboglabra Bailey and B. campestris L. withspecial emphasis on seed colour. Plant Breed 101:52–59
Concibido VC, La Vallee B, Mclaird P, Pineda N, Meyer J, Hum-mel L, Yang J, Wu K, Delannay X (2003) Introgression of aquantitative trait locus for yield from Glycine soja into com-mercial soybean cultivars. Theor Appl Genet 106:575–582
Diers BW, Osborn TC (1994) Genetic diversity of oilseed Bras-sica napus germplasm based on restriction fragment lengthpolymorphisms. Theor Appl Genet 88:662–668
Doerge RW, Churchill GA (1996) Permutation tests for multipleloci aVecting a quantitative character. Genetics 142:285–294
Edwards AL (1976) An introduction to linear regression and cor-relation. WH Freeman and Company, San Francisco
Eshed Y, Zamir D (1995) An introgression line population ofLycopersicon pennellii in the cultivated tomato enables theidentiWcation and Wne mapping of yield-associated QTL.Genetics 141:1147–1162
Ferreira ME, Williams PH, Osborn TC (1994) RFLP mapping ofBrassica napus using F1–derived doubled haploid lines. The-or Appl Genet 89:615–621
Frary A, Fulton TM, Zamir D, Tanksley SD (2004) Advancedbackcross QTL analysis of a Lycopersicon esculentum x L.pennellii cross and identiWcation of possible orthologs in theSolanaceae. Theor Appl Genet 108:485–496
Grant M, McDowell J, Sharpe A, De Torres Zabala M, LydiateD, Dangle J (1998) Independent deletions of a pathogen-resistance gene in Brassica and Arabidopsis. Proc Natl AcadSci USA 95:15843–15848
Hallauer AR, Miranda JB (1988) Quantitative genetics in maizebreeding. 2nd edn. Iowa State University Press, Ames
Kardailsky I, Shukla B, Ahn JH, Dagenais N, Christensen SK,Nguyen JT, Chory J, Harrison M, Weigel D (1999) Activa-tion tagging of the Xoral inducer FT. Science 286:1962–1965
Kidwell KK, Osborn TC (1992) Simple plant DNA isolation pro-cedures In: Beckman J, Osborn TC (eds) Plant genomes:methods for genetic and physical mapping. Kluwer, Dordr-echt, pp 1–13
Knapp SJ, Stroup WW, Ross WW (1985) Exact conWdence inter-vals for heritability on a progeny mean basis. Crop Sci25:192–194
Kole C, Kole P, Vogelzang R, Osborn TC (1997) Genetic linkagemap of a Brassica rapa recombinant population. J Hered88:553–557
Kole C, Quijada P, Michaels SD, Amasino R, Osborn TC (2001)Evidence for homology of Xowering-time genes VFR2 fromBrassica rapa and FLC from Arabidopsis thaliana. TheorAppl Genet 102:425–430
Kräling K (1987) Utilization of genetic variability of resynthe-sized rapeseed. Plant Breed 99:209–217
Lefort-Buson M, Guillot-Lemoine B, Dattee Y (1987) Heterosisand genetic distance in rapeseed (Brassica napus L.): crossesbetween European and Asiatic selfed lines. Genome 29:413–418
Littell RC, Milliken GA, Stroup WW, WolWnger RD (1996) SASsystem for mixed models. SAS Inst., Cary
Liu B (1997) Statistical genomics linkage, mapping and QTLanalysis. CRC Press, Boca Raton
Manzanares-Dauleux MJ, Delourme R, Baron F, Thomas G(2000) Mapping of one major gene and of QTLs involved inresistance to clubroot in Brassica napus. Theor Appl Genet101:885–891
Mariani C, De Beuckeler M, Truettner J, Leemans J, GoldbergRB (1990) Induction of male sterility in plants by a chimaericribonuclease gene. Science 347:737–741
Mariani C, Gossele V, De Beuckeler M, De Block M, GolbergRB, De Greef W, Leemans J (1992) A chimaeric ribonuclease
inhibitor gene restores fertility to male sterile plants. Nature357:384–387
Mode CJ, Robinson HF (1959) Pleiotropism and the genetic var-iance and covariance. Biometrics 15:518–537
Moncada P, Martinez C, Borrero J, Chatel M, Gauch Jr. H, Gui-maraes E, Tohme J, McCouch S (2001) Quantitative traitloci for yield and yield components in an Oryza sativa x Ory-za ruWpogon BC2F2 population evaluated in a upland envi-ronment. Theor Appl Genet 102:41–52
Morgan CL, Bruce DN, Child R, Ladbrooke ZL, Arthur AE(1998) Genetic variation for pod shatter resistance amonglines of oilseed rape developed from synthetic B. napus.Field Crops Res 58:153–165
Morrison MJ, Stewart DW (2002) Heat stress during Xowering insummer Brassica. Crop Sci 42:797–803
Osborn TC, Kole C, Parkin IAP, Kuiper M, Lydiate DJ, Trick M(1997) Comparison of Xowering time genes in Brassica rapa,B napus, and Arabidopsis thaliana. Genetics 146:1123–1129
Osborn TC, Butruille DV, Sharpe AG, Pickering KJ, Parkin IAP,Parker JS, Lydiate DJ (2003) Detection and eVects of a ho-moeologous reciprocal transposition in Brassica napus.Genetics 165:1569–1577
Parkin IAP, Sharpe AG, Keith DJ, Lydiate DJ (1995) IdentiWca-tion of the A and C genomes of amphidiploid Brassica napus(oilseed rape). Genome 38:1122–1131
Parkin IAP, Lydiate DJ, Trick M (2002) Assessing the level ofcollinearity between Arabidopsis thaliana and Brassica na-pus for A. thaliana chromosome 5. Genome 45:1–11
Pillen K, Zacharias A, Leon J (2003) Advanced backcross QTLanalysis in barley (Hordeum vulgare L.). Theor Appl Genet107:340–352
Prakash S, Chopra VL (1990) Reconstruction of allopolyploidBrassicas through non-homologous recombination: intro-gression of resistance to pod shatter in B. napus. Genet ResCamb 56:1–2
Quijada P, Mauriera I, Osborn TC (2004a) ConWrmation of QTLcontrolling seed yield in spring canola (Brassica napus) hy-brids. Mol Breed 13:193–200
Quijada PA, Udall JA, Polewicz H, Osborn TC (2004b) Pheno-typic eVects of introgressing French winter germplasm intohybrid spring canola (Brassica napus L.). Crop Sci 44:1982–1989
Quijada PA, Udall JA, Lambert B, Osborn TC (2006) IdentiWca-tion of genomic regions from winter germplasm that aVectseed yield and other complex traits in hybrid spring rapeseed(Brassica napus L.). Theor Appl Genet (in press)
Rice W (1989) Analyzing tables of statistical tests. Evolution43:223–225
RatcliVe O, Kumimoto RW, Wong BJ, Riechmann JL (2003)Analysis of the Arabidopsis MADS AFFECTING FLOW-ERING gene family: MAF2 prevents vernalization by shortperiods of cold. Plant Cell 15:1159–1169
SAS Institute (2000) SAS/STAT® User’s guide, version 8. SASInst, Cary
Scarth R, Rimmer SR, McVetty PBE (1992) Reward summer tur-nip rape. Can J Plant Sci 72:839–840
Schranz ME, Quijada P, Sung SB, Lukens L, Amasino R, OsbornTC (2002) Characterization and eVects of the replicatedXowering time gene FLC in Brassica rapa. Genetics162:1457–1468
Sharpe AG, Parkin IAP, Keith DJ, Lydiate DJ (1995) Frequentnonreciprocal translocations in the amphidiploid genome ofoilseed rape (Brassica napus). Genome 38:1112–1121
Sillito D, Parkin IAP, Mayerhofer R, Good AG (2000) Arabidopsisthaliana: A source of candidate disease–resistance genes forBrassica napus. Genome 43:452–460
123
Theor Appl Genet (2006) 113:597–609 609
Song K, Osborn TC, Williams PH (1993) Development of syn-thetic Brassica amphidiploids by reciprocal hybridizationand comparison to natural amphidiploids. Theor Appl Gen-et 89:885–894
Tanksley SD, Grandillo S, Fulton T, Zamir D, Eshed Y, Petiard V,Lopez J, Beck-Baum T (1996) Advanced backcross QTL anal-ysis in a cross between an elite processing line of tomato and itswild relative L. pimpinellifolium. Theor Appl Genet 92:213–224
Teutonico RA, Osborn TC (1994) Mapping of RFLP and qualita-tive trait loci in Brassica rapa and comparison to the linkagemaps of Brassica napus, Brassica oleracea, and Arabidopsisthaliana. Theor Appl Genet 89:885–894
Thormann CE, Romero J, Mantet J, Osborn TC (1996) Mappingloci controlling the concentrations of erucic and linolenic ac-ids in seed oil of Brassica napus L. Theor Appl Genet93:282–286
Toroser D, Thormann CE, Osborn TC, Mithen R (1995) RFLPmapping of quantitative trait loci controlling seed aliphatic–glucosinolate content in oilseed rape (Brassica napus L.).Theor Appl Genet 91:802–808
Udall JA, Quijada PA, Polewicz H, Vogelzang R, Osborn TC(2004) Phenotypic eVects of introgressing Chinese winterand resynthesized Brassica napus L. germplasm into hybridspring canola. Crop Sci 44:1990–1996
Udall JA, Quijada PA, Osborn TC (2005) Detection of chromo-somal rearrangements derived from homoeologous recombi-nation in four mapping populations of Brassica napus L.Genetics 169:967 –979
van Ooijen JW, Voorrips RE (2001) JoinMap® Version 3.0, Soft-ware for the calculation of genetic linkage maps. Plant Re-search International, Wageningen, The Netherlands
Xiao J, Li J, Grandillo S, Sang-Nag A, Yuan L, Tanksley S, Mc-Couch S (1998) IdentiWcation of trait-improving quantitativetrait loci alleles from a wild rice relative, Oryza ruWpogon.Genetics 150:899–909
Yuanhui H, Xiufang C (1989) The signiWcance and application ofmultiple resistance (tolerance) of a new variety-Zhongyou821 of oilseed rape. Chin oilseed crops 3:1–5
123